UNITED STATES
SECURITIES AND EXCHANGE COMMISSION
Washington, D.C. 20549
FORM N-CSR
CERTIFIED SHAREHOLDER REPORT OF REGISTERED
MANAGEMENT INVESTMENT COMPANIES
Investment Company Act file number: 811-22542
SSGA ACTIVE TRUST
(Exact name of registrant as specified in charter)
One Iron Street, Boston, Massachusetts 02210
(Address of principal executive offices) (zip code)
Sean O’Malley, Esq.
Senior Vice President and Deputy General Counsel
c/o SSGA Funds Management, Inc.
One Iron Street
Boston, Massachusetts 02210
(Name and address of agent for service)
Copy to:
W. John McGuire, Esq.
Morgan, Lewis & Bockius LLP
1111 Pennsylvania Avenue, NW
Washington, DC 20004
Registrant’s telephone number, including area code: (617) 664-1465
Date of fiscal year end: June 30
Date of reporting period: June 30, 2021
Item 1. Reports to Shareholders.
(a) The Reports to Shareholders are attached herewith.
| SPDR SSGA Multi-Asset Real Return ETF |
| SPDR SSGA Income Allocation ETF |
| SPDR SSGA Global Allocation ETF |
| SPDR SSGA Ultra Short Term Bond ETF |
| SPDR Nuveen Municipal Bond ETF |

|
|
1 |
| Management’s Discussion of Fund Performance, Performance Summaries & Portfolio Statistics (Unaudited) | |
|
|
2 |
|
|
5 |
|
|
8 |
|
|
11 |
| Schedules of Investments | |
|
|
15 |
|
|
17 |
|
|
19 |
|
|
21 |
|
|
27 |
|
|
32 |
|
|
38 |
|
|
43 |
|
|
52 |
|
|
54 |
| Cumulative Total Return | Average Annual Total Return | ||||||||||
| Net
Asset Value |
Market
Value |
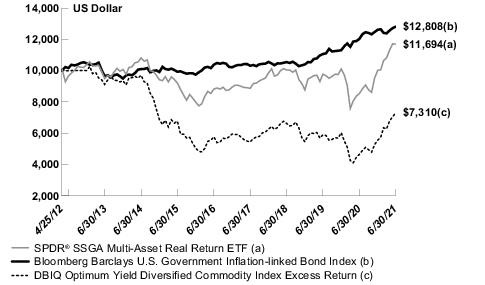
Bloomberg Barclays U.S. Government Inflation-linked Bond Index | DBIQ Optimum Yield Diversified Commodity Index Excess Return | Net
Asset Value |
Market
Value |
Bloomberg Barclays U.S. Government Inflation-linked Bond Index | DBIQ Optimum Yield Diversified Commodity Index Excess Return | ||||
| ONE YEAR | 37.12% | 37.12% | 6.51% | 57.54% | 37.12% | 37.12% | 6.51% | 57.54% | |||
| FIVE YEARS | 32.63% | 32.69% | 23.38% | 27.40% | 5.81% | 5.82% | 4.29% | 4.96% | |||
| SINCE INCEPTION(1) | 16.94% | 16.97% | 28.08% | (26.90)% | 1.72% | 1.72% | 2.73% | (3.36)% | |||
| (1) | For the period April 25, 2012 to June 30, 2021. Since shares of the Fund did not trade in the secondary market until the day after the Fund’s inception, for the period from inception to the first day of secondary market trading in shares of the Fund (4/25/12, 4/26/12, respectively), the NAV of the Fund is used as a proxy for the secondary market trading price to calculate market returns. |
(Based on Net Asset Value)
| Description | % of Net Assets | ||
| Invesco Optimum Yield Diversified Commodity Strategy No. K-1 ETF | 25.1% | ||
| SPDR S&P Global Natural Resources ETF | 24.6 | ||
| SPDR S&P Global Infrastructure ETF | 21.8 | ||
| SPDR Bloomberg Barclays 1-10 Year TIPS ETF | 8.5 | ||
| SPDR Dow Jones REIT ETF | 4.0 | ||
| TOTAL | 84.0% |
| % of Net Assets | |||
| Natural Resources | 28.4% | ||
| Commodities | 25.1 | ||
| International Equity | 23.8 | ||
| Inflation Linked | 8.5 | ||
| Real Estate | 6.0 | ||
| Domestic Equity | 3.9 | ||
| International Fixed Income | 3.8 | ||
| Short Term Investments | 10.0 | ||
| Liabilities in Excess of Other Assets | (9.5) | ||
| TOTAL | 100.0% |
| Cumulative Total Return | Average Annual Total Return | ||||||||||
| Net
Asset Value |
Market
Value |
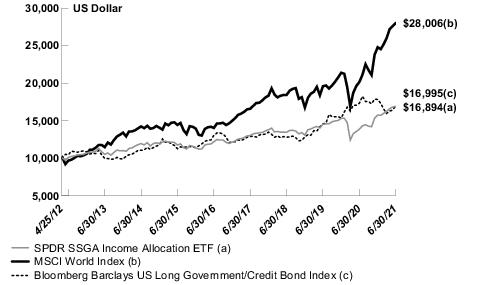
MSCI World Index | Bloomberg Barclays US Long Government /Credit Bond Index | Net
Asset Value |
Market
Value |
MSCI World Index | Bloomberg Barclays US Long Government /Credit Bond Index | ||||
| ONE YEAR | 21.90% | 21.92% | 39.04% | (1.86)% | 21.90% | 21.92% | 39.04% | (1.86)% | |||
| FIVE YEARS | 38.56% | 38.55% | 99.64% | 30.38% | 6.74% | 6.74% | 14.83% | 5.45% | |||
| SINCE INCEPTION(1) | 68.94% | 68.95% | 180.06% | 69.95% | 5.88% | 5.88% | 11.87% | 5.95% | |||
| (1) | For the period April 25, 2012 to June 30, 2021. Since shares of the Fund did not trade in the secondary market until the day after the Fund’s inception, for the period from inception to the first day of secondary market trading in shares of the Fund (4/25/12, 4/26/12, respectively), the NAV of the Fund is used as a proxy for the secondary market trading price to calculate market returns. |
(Based on Net Asset Value)
| Description | % of Net Assets | ||
| SPDR Blackstone Senior Loan ETF | 20.3% | ||
| SPDR Portfolio S&P 500 High Dividend ETF | 15.4 | ||
| SPDR Bloomberg Barclays Emerging Markets Local Bond ETF | 9.9 | ||
| SPDR S&P International Dividend ETF | 8.8 | ||
| SPDR Portfolio Long Term Corporate Bond ETF | 7.9 | ||
| TOTAL | 62.3% |
| % of Net Assets | |||
| Domestic Fixed Income | 47.8% | ||
| Domestic Equity | 28.5 | ||
| International Equity | 13.7 | ||
| International Fixed Income | 9.9 | ||
| Short Term Investments | 8.2 | ||
| Liabilities in Excess of Other Assets | (8.1) | ||
| TOTAL | 100.0% |
| Cumulative Total Return | Average Annual Total Return | ||||||||||
| Net
Asset Value |
Market
Value |
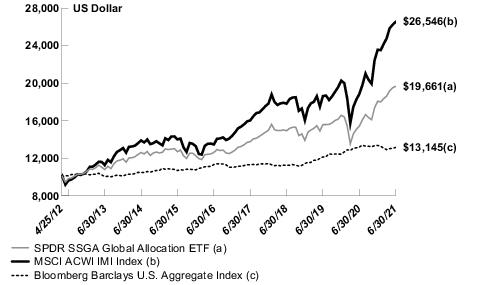
MSCI ACWI IMI Index | Bloomberg Barclays U.S. Aggregate Bond Index | Net
Asset Value |
Market
Value |
MSCI ACWI IMI Index | Bloomberg Barclays U.S. Aggregate Bond Index | ||||
| ONE YEAR | 27.51% | 27.39% | 40.94% | (0.33)% | 27.51% | 27.39% | 40.94% | (0.33)% | |||
| FIVE YEARS | 55.95% | 55.91% | 97.21% | 16.08% | 9.29% | 9.29% | 14.55% | 3.03% | |||
| SINCE INCEPTION(1) | 96.61% | 96.66% | 165.46% | 31.45% | 7.64% | 7.64% | 11.22% | 3.02% | |||
| (1) | For the period April 25, 2012 to June 30, 2021. Since shares of the Fund did not trade in the secondary market until the day after the Fund’s inception, for the period from inception to the first day of secondary market trading in shares of the Fund (4/25/12, 4/26/12, respectively), the NAV of the Fund is used as a proxy for the secondary market trading price to calculate market returns. |
(Based on Net Asset Value)
| Description | % of Net Assets | ||
| SPDR S&P 500 ETF Trust | 21.5% | ||
| SPDR Portfolio Developed World ex-US ETF | 15.1 | ||
| SPDR Portfolio Emerging Markets ETF | 7.0 | ||
| SPDR Portfolio Intermediate Term Corporate Bond ETF | 6.1 | ||
| SPDR Portfolio Long Term Corporate Bond ETF | 5.2 | ||
| TOTAL | 54.9% |
| % of Net Assets | |||
| Domestic Equity | 34.4% | ||
| International Equity | 29.9 | ||
| Domestic Fixed Income | 21.0 | ||
| Inflation Linked | 5.1 | ||
| Commodities | 4.9 | ||
| Real Estate | 1.9 | ||
| International Fixed Income | 1.0 | ||
| Short Term Investments | 16.8 | ||
| Liabilities in Excess of Other Assets | (15.0) | ||
| TOTAL | 100.0% |
| Cumulative Total Return | Average Annual Total Return | ||||||
| Net
Asset Value |
Market
Value |
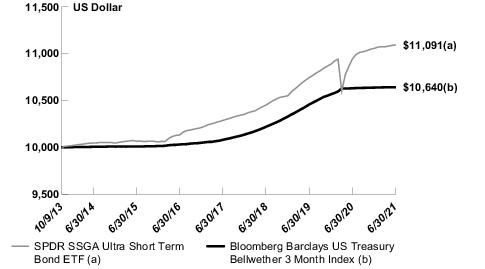
Bloomberg Barclays US Treasury Bellwether 3 Month Index | Net
Asset Value |
Market
Value |
Bloomberg Barclays US Treasury Bellwether 3 Month Index | ||
| ONE YEAR | 1.34% | 1.20% | 0.09% | 1.34% | 1.20% | 0.09% | |
| FIVE YEARS | 9.47% | 9.51% | 6.07% | 1.83% | 1.83% | 1.19% | |
| SINCE INCEPTION(1) | 10.91% | 10.94% | 6.40% | 1.35% | 1.35% | 0.81% | |
| (1) | For the period October 9, 2013 to June 30, 2021. Since shares of the Fund did not trade in the secondary market until one day after the Fund’s inception, for the period from inception to the first day of secondary market trading in shares of the Fund (10/9/13, 10/10/13, respectively), the NAV of the Fund is used as a proxy for the secondary market trading price to calculate market returns. |
(Based on Net Asset Value)
| Description | % of Net Assets | ||
| Nissan
Master Owner Trust Receivables ABS 0.63% 2/15/2024 |
2.8% | ||
| U.S.
Treasury Bill 0.05% 7/13/2021 |
2.7 | ||
| BX
Commercial Mortgage Trust 0.74% 3/15/2037 |
2.3 | ||
| CenterPoint
Energy Resources Corp. 0.63% 3/2/2023 |
2.0 | ||
| Golden
Credit Card Trust ABS 0.59% 7/15/2024 |
1.9 | ||
| TOTAL | 11.7% |
| % of Net Assets | |||
| Corporate Bonds & Notes | 63.3% | ||
| Asset-Backed Securities | 10.1 | ||
| Mortgage-Backed Securities | 4.4 | ||
| Commercial Mortgage Backed Securities | 3.5 | ||
| U.S. Treasury Obligations | 2.7 | ||
| Short-Term Investment | 15.6 | ||
| Other Assets in Excess of Liabilities | 0.4 | ||
| TOTAL | 100.0% |
| Description | % of Net Assets | ||
| New
York, State Dormitory Authority Revenue, State Supported Debt 1.54% 3/15/2027 |
3.3% | ||
| Washington,
State General Obligation 5.00% 2/1/2037 |
2.9 | ||
| Energy
Northwest Revenue 5.00% 7/1/2033 |
2.9 | ||
| Los
Angeles Unified School District, General Obligation 5.00% 7/1/2029 |
2.9 | ||
| State
of Florida Revenue 5.00% 6/1/2029 |
2.9 | ||
| TOTAL | 14.9% |
| % of Net Assets | |||
| Municipal Bonds & Notes | 99.3% | ||
| Short-Term Investment | 3.0 | ||
| Liabilities in Excess of Other Assets | (2.3) | ||
| TOTAL | 100.0% |
| Description | Level
1 – Quoted Prices |
Level
2 – Other Significant Observable Inputs |
Level
3 – Significant Unobservable Inputs |
Total | ||||
| ASSETS: | ||||||||
| INVESTMENTS: | ||||||||
|
Mutual Funds and Exchange Traded
Products |
$129,687,694 | $— | $— | $129,687,694 | ||||
|
Short-Term
Investments |
13,027,853 | — | — | 13,027,853 | ||||
|
TOTAL
INVESTMENTS |
$142,715,547 | $— | $— | $142,715,547 |
| Number
of Shares Held at 6/30/20 |
Value
at 6/30/20 |
Cost
of Purchases |
Proceeds
from Shares Sold |
Realized
Gain (Loss) |
Change
in Unrealized Appreciation/ Depreciation |
Number
of Shares Held at 6/30/21 |
Value
at 6/30/21 |
Dividend
Income | |||||||||
|
SPDR Bloomberg Barclays 1-10 Year TIPS
ETF |
— | $ — | $ 11,400,024 | $ 389,136 | $ 685 | $ 81,935 | 524,888 | $ 11,093,508 | $ 96,059 | ||||||||
|
SPDR Dow Jones International Real Estate
ETF |
124,317 | 3,582,816 | 2,960,408 | 4,631,779 | (822,679) | 1,484,058 | 70,066 | 2,572,824 | 87,280 | ||||||||
|
SPDR Dow Jones REIT
ETF |
38,078 | 2,971,226 | 3,864,327 | 2,569,370 | (202,829) | 1,171,181 | 49,905 | 5,234,535 | 124,521 | ||||||||
|
SPDR FTSE International Government Inflation-Protected Bond
ETF |
80,439 | 4,223,048 | 4,806,881 | 4,399,543 | (8,031) | 308,780 | 87,385 | 4,931,135 | 100,674 | ||||||||
|
SPDR Portfolio TIPS
ETF |
313,232 | 9,440,812 | 2,669,389 | 12,227,003 | 556,464 | (439,662) | — | — | 120,632 | ||||||||
|
SPDR S&P Global Infrastructure
ETF |
129,115 | 5,650,072 | 23,626,525 | 1,995,413 | 46,774 | 1,010,951 | 542,787 | 28,338,909 | 335,128 | ||||||||
|
SPDR S&P Global Natural Resources
ETF |
309,534 | 11,431,091 | 20,007,718 | 4,120,392 | (26,750) | 4,778,792 | 605,103 | 32,070,459 | 606,096 | ||||||||
|
SPDR S&P Metals & Mining
ETF |
50,635 | 1,072,956 | 3,683,933 | 1,514,569 | 87,146 | 1,573,087 | 113,854 | 4,902,553 | 27,626 | ||||||||
|
State Street Institutional U.S. Government Money Market Fund, Class G
Shares |
228,808 | 228,808 | 3,542,629 | 3,165,127 | — | — | 606,310 | 606,310 | 87 | ||||||||
|
State Street Navigator Securities Lending Portfolio
II |
10,616,056 | 10,616,056 | 273,730,171 | 271,924,684 | — | — | 12,421,543 | 12,421,543 | 102,252 | ||||||||
|
The Energy Select Sector SPDR
Fund |
36,394 | 1,377,513 | 3,919,172 | 1,129,297 | (405,896) | 1,381,854 | 95,477 | 5,143,346 | 122,366 | ||||||||
|
Total |
$50,594,398 | $ 354,211,177 | $308,066,313 | $ (775,116) | $11,350,976 | $107,315,122 | $1,722,721 |
| Description | Level
1 – Quoted Prices |
Level
2 – Other Significant Observable Inputs |
Level
3 – Significant Unobservable Inputs |
Total | ||||
| ASSETS: | ||||||||
| INVESTMENTS: | ||||||||
|
Mutual Funds and Exchange Traded
Products |
$124,938,471 | $— | $— | $124,938,471 | ||||
|
Short-Term
Investments |
10,199,204 | — | — | 10,199,204 | ||||
|
TOTAL
INVESTMENTS |
$135,137,675 | $— | $— | $135,137,675 |
| Number
of Shares Held at 6/30/20 |
Value
at 6/30/20 |
Cost
of Purchases |
Proceeds
from Shares Sold |
Realized
Gain (Loss) |
Change
in Unrealized Appreciation/ Depreciation |
Number
of Shares Held at 6/30/21 |
Value
at 6/30/21 |
Dividend
Income | |||||||||
|
SPDR Blackstone Senior Loan
ETF |
301,443 | $ 13,076,597 | $ 26,118,609 | $ 14,706,468 | $ (4,266) | $ 942,486 | 549,297 | $ 25,426,958 | $ 756,038 | ||||||||
|
SPDR Bloomberg Barclays Convertible Securities
ETF |
110,491 | 6,684,706 | 4,224,800 | 6,393,918 | 1,597,418 | 508,223 | 76,343 | 6,621,229 | 149,123 | ||||||||
|
SPDR Bloomberg Barclays Emerging Markets Local Bond
ETF |
496,684 | 13,018,088 | 9,029,386 | 9,931,869 | 88,641 | 170,465 | 468,207 | 12,374,711 | 413,753 | ||||||||
|
SPDR Bloomberg Barclays High Yield Bond
ETF |
151,472 | 15,322,908 | 12,220,763 | 19,660,531 | 80,376 | 995,805 | 81,478 | 8,959,321 | 620,032 | ||||||||
|
SPDR Portfolio Europe
ETF |
120,535 | 3,787,511 | 3,958,174 | 8,535,989 | 573,348 | 216,956 | — | — | 41,949 | ||||||||
|
SPDR Portfolio Intermediate Term Corporate Bond
ETF |
254,744 | 9,305,798 | 5,967,065 | 15,409,302 | 354,397 | (217,958) | — | — | 97,326 | ||||||||
|
SPDR Portfolio Long Term Corporate Bond
ETF |
258,039 | 8,179,836 | 13,317,795 | 11,857,073 | 519,336 | (277,172) | 310,973 | 9,882,722 | 228,287 | ||||||||
|
SPDR Portfolio Long Term Treasury
ETF |
230,530 | 10,814,162 | 10,216,315 | 11,800,457 | 1,232,557 | (1,531,576) | 216,247 | 8,931,001 | 90,947 | ||||||||
|
SPDR Portfolio S&P 500 High Dividend
ETF |
579,022 | 16,125,763 | 20,788,369 | 24,970,922 | 1,125,071 | 6,184,060 | 480,228 | 19,252,341 | 1,098,576 | ||||||||
|
SPDR Portfolio TIPS
ETF |
112,242 | 3,382,974 | 69,840 | 3,523,572 | 233,124 | (162,366) | — | — | 12,157 | ||||||||
|
SPDR S&P Global Infrastructure
ETF |
137,414 | 6,013,237 | 4,108,579 | 4,928,162 | 44,316 | 908,818 | 117,732 | 6,146,788 | 146,360 | ||||||||
|
SPDR S&P International Dividend
ETF |
148,835 | 4,930,904 | 15,070,323 | 10,313,900 | (26,551) | 1,368,426 | 279,929 | 11,029,202 | 305,441 | ||||||||
|
SPDR Wells Fargo Preferred Stock
ETF |
155,828 | 6,521,402 | 7,864,939 | 5,782,142 | (14,027) | 332,672 | 201,783 | 8,922,844 | 346,058 | ||||||||
|
State Street Institutional U.S. Government Money Market Fund, Class G
Shares |
161,736 | 161,736 | 10,381,223 | 10,457,822 | — | — | 85,137 | 85,137 | 286 | ||||||||
|
State Street Navigator Securities Lending Portfolio
II |
21,343,138 | 21,343,138 | 407,501,265 | 418,730,336 | — | — | 10,114,067 | 10,114,067 | 195,598 | ||||||||
|
Total |
$138,668,760 | $550,837,445 | $577,002,463 | $5,803,740 | $ 9,438,839 | $127,746,321 | $4,501,931 |
| Description | Level
1 – Quoted Prices |
Level
2 – Other Significant Observable Inputs |
Level
3 – Significant Unobservable Inputs |
Total | ||||
| ASSETS: | ||||||||
| INVESTMENTS: | ||||||||
|
Mutual Funds and Exchange Traded
Products |
$277,659,613 | $— | $— | $277,659,613 | ||||
|
Short-Term
Investments |
47,542,254 | — | — | 47,542,254 | ||||
|
TOTAL
INVESTMENTS |
$325,201,867 | $— | $— | $325,201,867 |
| Number
of Shares Held at 6/30/20 |
Value
at 6/30/20 |
Cost
of Purchases |
Proceeds
from Shares Sold |
Realized
Gain (Loss) |
Change
in Unrealized Appreciation/ Depreciation |
Number
of Shares Held at 6/30/21 |
Value
at 6/30/21 |
Dividend
Income | |||||||||
|
SPDR Bloomberg Barclays Emerging Markets Local Bond
ETF |
91,620 | $ 2,401,360 | $ 756,952 | $ 395,295 | $ 1,631 | $ 35,637 | 105,951 | $ 2,800,285 | $ 92,804 | ||||||||
|
SPDR Bloomberg Barclays High Yield Bond
ETF |
257,809 | 26,079,959 | 21,788,619 | 38,248,827 | 273,698 | 1,612,655 | 104,639 | 11,506,104 | 1,206,513 | ||||||||
|
SPDR Bloomberg Barclays International Corporate Bond
ETF |
143,333 | 4,818,870 | 22,283 | 5,175,114 | 155,509 | 178,452 | — | — | 6,871 | ||||||||
|
SPDR Dow Jones International Real Estate
ETF |
153,639 | 4,427,876 | 2,815,446 | 4,843,760 | (898,691) | 1,227,755 | 74,309 | 2,728,626 | 51,173 | ||||||||
|
SPDR Dow Jones REIT
ETF |
— | — | 2,894,928 | 675,600 | 64,054 | 484,980 | 26,393 | 2,768,362 | 79,126 | ||||||||
|
SPDR Portfolio Aggregate Bond
ETF |
— | — | 22,098,387 | 14,826,057 | (108,640) | 10,831 | 239,071 | 7,174,521 | 33,929 | ||||||||
|
SPDR Portfolio Developed World ex-US
ETF |
1,424,858 | 39,354,578 | 21,466,444 | 30,756,283 | 2,019,604 | 10,522,524 | 1,158,110 | 42,606,867 | 1,060,432 | ||||||||
|
SPDR Portfolio Emerging Markets
ETF |
501,104 | 16,766,940 | 5,952,420 | 8,445,160 | 237,216 | 5,304,107 | 435,506 | 19,815,523 | 372,550 | ||||||||
|
SPDR Portfolio Europe
ETF |
— | — | 17,506,108 | 6,599,027 | 222,654 | (178,720) | 261,673 | 10,951,015 | 135,829 | ||||||||
|
SPDR Portfolio Intermediate Term Corporate Bond
ETF |
1,018,040 | 37,189,001 | 17,799,012 | 38,200,595 | 1,465,695 | (1,087,202) | 467,736 | 17,165,911 | 408,734 | ||||||||
|
SPDR Portfolio Long Term Corporate Bond
ETF |
158,470 | 5,023,499 | 19,787,409 | 10,056,638 | 150,312 | (246,851) | 461,225 | 14,657,731 | 284,051 | ||||||||
|
SPDR Portfolio Long Term Treasury
ETF |
— | — | 8,536,234 | 131,821 | 1,482 | 389,229 | 212,957 | 8,795,124 | 12,854 | ||||||||
|
SPDR Portfolio Small Cap
ETF |
— | — | 15,487,798 | 5,769,702 | 463,807 | 3,671,192 | 315,273 | 13,853,095 | 122,635 | ||||||||
|
SPDR Portfolio TIPS
ETF |
414,567 | 12,495,049 | 3,810,963 | 2,362,325 | 168,383 | 250,134 | 461,214 | 14,362,204 | 356,835 | ||||||||
|
SPDR S&P 500 ETF
Trust |
151,960 | 46,858,385 | 40,439,761 | 45,561,662 | 6,212,312 | 12,833,584 | 141,995 | 60,782,380 | 911,798 | ||||||||
|
SPDR S&P Emerging Markets SmallCap
ETF |
59,550 | 2,431,426 | 393,854 | 995,740 | 86,662 | 977,673 | 47,193 | 2,893,875 | 61,150 | ||||||||
|
SPDR S&P International Small Cap
ETF |
252,679 | 6,910,771 | 1,054,853 | 2,333,839 | 137,040 | 2,515,626 | 214,290 | 8,284,451 | 143,643 | ||||||||
|
SPDR S&P MidCap 400 ETF
Trust |
13,834 | 4,488,995 | 1,156,921 | 2,230,186 | 446,344 | 1,731,021 | 11,391 | 5,593,095 | 57,836 | ||||||||
|
State Street Institutional U.S. Government Money Market Fund, Class G
Shares |
4,054,699 | 4,054,699 | 22,678,684 | 21,852,238 | — | — | 4,881,145 | 4,881,145 | 3,124 | ||||||||
|
State Street Navigator Securities Lending Portfolio
II |
61,808,691 | 61,808,691 | 1,549,071,332 | 1,568,218,914 | — | — | 42,661,109 | 42,661,109 | 330,190 | ||||||||
|
The Communication Services Select Sector SPDR
Fund |
— | — | 16,158,027 | 16,735,859 | 577,832 | — | — | — | 4,062 | ||||||||
|
The Consumer Discretionary Select Sector SPDR
Fund |
— | — | 12,872,291 | 13,601,962 | 729,671 | — | — | — | 14,821 | ||||||||
|
The Consumer Staples Select Sector SPDR
Fund |
— | — | 5,419,158 | 5,895,872 | 476,714 | — | — | — | 71,722 | ||||||||
|
The Energy Select Sector SPDR
Fund |
— | — | 8,967,424 | 6,102,690 | (11,516) | (108,003) | 50,960 | 2,745,215 | 79,103 | ||||||||
|
The Financial Select Sector SPDR
Fund |
183,714 | 4,251,142 | 5,503,751 | 10,279,803 | (492,708) | 1,017,618 | — | — | 23,596 | ||||||||
|
The Health Care Select Sector SPDR
Fund |
47,216 | 4,724,905 | 7,170 | 4,747,238 | (173,440) | 188,603 | — | — | — | ||||||||
|
The Industrial Select Sector SPDR
Fund |
— | — | 5,369,706 | 2,645,596 | 106,278 | (44,596) | 27,205 | 2,785,792 | 18,436 | ||||||||
|
The Materials Select Sector SPDR
Fund |
— | — | 8,315,824 | 2,700,230 | 82,515 | (299,149) | 65,593 | 5,398,960 | 35,558 | ||||||||
|
The Technology Select Sector SPDR
Fund |
48,236 | 5,040,180 | 6,378,567 | 6,870,230 | 1,366,215 | 188,351 | 41,332 | 6,103,083 | 32,913 | ||||||||
|
Total |
$289,126,326 | $1,844,510,326 | $1,877,258,263 | $13,760,633 | $41,175,451 | $311,314,473 | $6,012,288 |
| Description | Level
1 – Quoted Prices |
Level
2 – Other Significant Observable Inputs |
Level
3 – Significant Unobservable Inputs |
Total | ||||
| ASSETS: | ||||||||
| INVESTMENTS: | ||||||||
|
Corporate Bonds &
Notes |
$ — | $254,806,969 | $— | $254,806,969 | ||||
|
Asset-Backed
Securities |
— | 40,875,597 | — | 40,875,597 | ||||
|
U.S. Treasury
Obligations |
— | 10,999,844 | — | 10,999,844 | ||||
|
Mortgage-Backed
Securities |
— | 17,583,847 | — | 17,583,847 | ||||
|
Commercial Mortgage Backed
Securities |
— | 14,197,100 | — | 14,197,100 | ||||
|
Short-Term
Investment |
62,702,468 | — | — | 62,702,468 | ||||
|
TOTAL
INVESTMENTS |
$62,702,468 | $338,463,357 | $— | $401,165,825 |
| Number
of Shares Held at 6/30/20 |
Value
at 6/30/20 |
Cost
of Purchases |
Proceeds
from Shares Sold |
Realized
Gain (Loss) |
Change
in Unrealized Appreciation/ Depreciation |
Number
of Shares Held at 6/30/21 |
Value
at 6/30/21 |
Dividend
Income | |||||||||
|
State Street Institutional U.S. Government Money Market Fund, Class G
Shares |
11,722,245 | $11,722,245 | $225,450,511 | $174,470,288 | $— | $— | 62,702,468 | $62,702,468 | $17,835 |
| Description | Level
1 – Quoted Prices |
Level
2 – Other Significant Observable Inputs |
Level
3 – Significant Unobservable Inputs |
Total | ||||
| ASSETS: | ||||||||
| INVESTMENTS: | ||||||||
|
Municipal Bonds &
Notes |
$ — | $44,831,451 | $— | $44,831,451 | ||||
|
Short-Term
Investment |
1,374,817 | — | — | 1,374,817 | ||||
|
TOTAL
INVESTMENTS |
$1,374,817 | $44,831,451 | $— | $46,206,268 |
| Number
of Shares Held at 2/3/2021* |
Value
at 2/3/2021* |
Cost
of Purchases |
Proceeds
from Shares Sold |
Realized
Gain (Loss) |
Change
in Unrealized Appreciation/ Depreciation |
Number
of Shares Held at 6/30/21 |
Value
at 6/30/21 |
Dividend
Income | |||||||||
|
State Street Institutional U.S. Government Money Market Fund, Class G
Shares |
— | $— | $52,848,299 | $51,473,482 | $— | $— | 1,374,817 | $1,374,817 | $631 |
| * | Commencement of operations. |
| SPDR SSGA Multi-Asset Real Return ETF | SPDR SSGA Income Allocation ETF | SPDR SSGA Global Allocation ETF | |||
| ASSETS | |||||
|
Investments in unaffiliated issuers, at
value* |
$ 35,400,425 | $ 7,391,354 | $ 13,887,394 | ||
|
Investments in affiliated issuers, at
value |
107,315,122 | 127,746,321 | 311,314,473 | ||
|
Total
Investments |
142,715,547 | 135,137,675 | 325,201,867 | ||
|
Receivable for fund shares
sold |
34,187 | — | — | ||
|
Dividends receivable — unaffiliated
issuers |
— | — | 209,019 | ||
|
Dividends receivable — affiliated
issuers |
16 | 9 | 110 | ||
|
Interest receivable — unaffiliated
issuers |
— | — | — | ||
|
Securities lending income receivable — unaffiliated
issuers |
27,298 | 8,423 | 184 | ||
|
Securities lending income receivable — affiliated issuers
|
12,973 | 19,171 | 42,871 | ||
|
TOTAL ASSETS
|
142,790,021 | 135,165,278 | 325,454,051 | ||
| LIABILITIES | |||||
|
Payable upon return of securities
loaned |
12,421,543 | 10,114,067 | 42,661,109 | ||
|
Payable for investments
purchased |
— | — | — | ||
|
Payable for fund shares
repurchased |
— | — | 55,580 | ||
|
Advisory fee
payable |
10,127 | 12,579 | 47,503 | ||
|
Trustees’ fees and expenses
payable |
64 | 92 | 181 | ||
|
TOTAL LIABILITIES
|
12,431,734 | 10,126,738 | 42,764,373 | ||
|
NET ASSETS
|
$130,358,287 | $125,038,540 | $282,689,678 | ||
| NET ASSETS CONSIST OF: | |||||
|
Paid-in
Capital |
$164,484,016 | $132,066,876 | $232,423,743 | ||
|
Total distributable earnings
(loss) |
(34,125,729) | (7,028,336) | 50,265,935 | ||
|
NET ASSETS
|
$130,358,287 | $125,038,540 | $282,689,678 | ||
| NET ASSET VALUE PER SHARE | |||||
|
Net asset value per
share |
$ 28.52 | $ 35.62 | $ 46.04 | ||
|
Shares outstanding (unlimited amount authorized, no par
value) |
4,570,000 | 3,510,000 | 6,140,000 | ||
| COST OF INVESTMENTS: | |||||
|
Investments in unaffiliated
issuers |
$ 31,417,122 | $ 6,899,774 | $ 12,405,298 | ||
|
Investments in affiliated
issuers |
102,765,626 | 124,658,621 | 262,655,352 | ||
|
Total cost of
investments |
$134,182,748 | $131,558,395 | $275,060,650 | ||
|
* Includes investments in securities on loan, at
value |
$ 18,674,023 | $ 21,491,633 | $ 48,247,191 |
| SPDR SSGA Ultra Short Term Bond ETF | SPDR Nuveen Municipal Bond ETF | |
| $338,463,357 | $44,831,451 | |
| 62,702,468 | 1,374,817 | |
| 401,165,825 | 46,206,268 | |
| 1,011,567 | — | |
| — | — | |
| 1,134 | 59 | |
| 488,616 | 407,947 | |
| — | — | |
| — | — | |
| 402,667,142 | 46,614,274 | |
| — | — | |
| — | 1,435,249 | |
| — | — | |
| 63,557 | 14,862 | |
| 122 | — | |
| 63,679 | 1,450,111 | |
| $402,603,463 | $45,164,163 | |
| $402,100,832 | $44,949,896 | |
| 502,631 | 214,267 | |
| $402,603,463 | $45,164,163 | |
| $ 40.46 | $ 30.11 | |
| 9,950,000 | 1,500,000 | |
| $337,607,097 | $44,821,241 | |
| 62,702,468 | 1,374,817 | |
| $400,309,565 | $46,196,058 | |
| $ — | $ — |
| SPDR SSGA Multi-Asset Real Return ETF | SPDR SSGA Income Allocation ETF | SPDR SSGA Global Allocation ETF | |||
| INVESTMENT INCOME | |||||
|
Interest income — unaffiliated
issuers |
$ — | $ — | $ — | ||
|
Dividend income — unaffiliated
issuers |
20,163 | 208,499 | 1,943 | ||
|
Dividend income — affiliated
issuers |
1,620,469 | 4,306,333 | 5,682,098 | ||
|
Unaffiliated securities lending
income |
81,755 | 80,920 | 59,564 | ||
|
Affiliated securities lending
income |
102,252 | 195,598 | 330,190 | ||
|
TOTAL INVESTMENT INCOME
(LOSS) |
1,824,639 | 4,791,350 | 6,073,795 | ||
| EXPENSES | |||||
|
Advisory
fee |
55,778 | 177,566 | 435,891 | ||
|
Trustees’ fees and expenses
|
1,138 | 1,918 | 3,831 | ||
|
Miscellaneous
expenses |
1 | 1 | 3 | ||
|
TOTAL
EXPENSES |
56,917 | 179,485 | 439,725 | ||
|
NET INVESTMENT INCOME
(LOSS) |
$ 1,767,722 | $ 4,611,865 | $ 5,634,070 | ||
| REALIZED AND UNREALIZED GAIN (LOSS) | |||||
| Net realized gain (loss) on: | |||||
|
Investments — unaffiliated
issuers |
(998,515) | (1,683,189) | 2,026,144 | ||
|
Investments — affiliated
issuers |
(1,085,680) | 89,770 | 7,809,110 | ||
|
In-kind redemptions — unaffiliated
issuers |
(67,492) | 1,103,587 | 354,363 | ||
|
In-kind redemptions — affiliated
issuers |
310,564 | 5,713,970 | 5,951,523 | ||
|
Net realized gain
(loss) |
(1,841,123) | 5,224,138 | 16,141,140 | ||
| Net change in unrealized appreciation/depreciation on: | |||||
|
Investments — unaffiliated
issuers |
8,582,231 | 3,237,387 | (700,333) | ||
|
Investments — affiliated
issuers |
11,350,976 | 9,438,839 | 41,175,450 | ||
|
Net change in unrealized
appreciation/depreciation |
19,933,207 | 12,676,226 | 40,475,117 | ||
|
NET REALIZED AND UNREALIZED GAIN
(LOSS) |
18,092,084 | 17,900,364 | 56,616,257 | ||
|
NET INCREASE (DECREASE) IN NET ASSETS FROM
OPERATIONS |
$19,859,806 | $22,512,229 | $62,250,327 |
| SPDR SSGA Ultra Short Term Bond ETF | SPDR Nuveen Municipal Bond ETF(a) | |
| $2,822,942 | 156,039 | |
| — | — | |
| 17,835 | 631 | |
| — | — | |
| — | — | |
| 2,840,777 | 156,670 | |
| 650,007 | 64,580 | |
| 4,422 | 116 | |
| 2 | — | |
| 654,431 | 64,696 | |
| $2,186,346 | $ 91,974 | |
| 478,164 | 252,383 | |
| — | — | |
| — | — | |
| — | — | |
| 478,164 | 252,383 | |
| 1,451,941 | 10,210 | |
| — | — | |
| 1,451,941 | 10,210 | |
| 1,930,105 | 262,593 | |
| $ 4,116,451 | $354,567 |
| (a) | For the period February 03, 2021 (commencement of operations) through June 30, 2021. |
| SPDR SSGA Multi-Asset Real Return ETF | SPDR SSGA Income Allocation ETF | ||||||
| Year
Ended 6/30/21 |
Year
Ended 6/30/20 |
Year
Ended 6/30/21 |
Year
Ended 6/30/20 | ||||
| INCREASE (DECREASE) IN NET ASSETS FROM OPERATIONS: | |||||||
|
Net investment income
(loss) |
$ 1,767,722 | $ 2,892,612 | $ 4,611,865 | $ 5,476,550 | |||
|
Net realized gain
(loss) |
(1,841,123) | (8,254,262) | 5,224,138 | (7,106,570) | |||
|
Net change in unrealized
appreciation/depreciation |
19,933,207 | (8,998,515) | 12,676,226 | (10,551,272) | |||
|
Net increase (decrease) in net assets resulting from
operations |
19,859,806 | (14,360,165) | 22,512,229 | (12,181,292) | |||
|
Net equalization credits and
charges |
54,735 | (81,758) | 149,449 | 115,750 | |||
|
Distributions to
shareholders |
(1,750,442) | (2,878,161) | (4,629,430) | (5,787,114) | |||
| FROM BENEFICIAL INTEREST TRANSACTIONS: | |||||||
|
Proceeds from shares
sold |
67,513,380 | 7,725,150 | 73,221,393 | 115,985,875 | |||
|
Cost of shares
redeemed |
(9,014,313) | (49,528,810) | (92,104,724) | (76,591,192) | |||
|
Net income
equalization |
(54,735) | 81,758 | (149,449) | (115,750) | |||
|
Other
Capital |
— | — | — | — | |||
|
Net increase (decrease) in net assets from beneficial interest transactions
|
58,444,332 | (41,721,902) | (19,032,780) | 39,278,933 | |||
|
Net increase (decrease) in net assets during the
period |
76,608,431 | (59,041,986) | (1,000,532) | 21,426,277 | |||
|
Net assets at beginning of
period |
53,749,856 | 112,791,842 | 126,039,072 | 104,612,795 | |||
|
NET ASSETS AT END OF
PERIOD |
$130,358,287 | $ 53,749,856 | $125,038,540 | $126,039,072 | |||
| SHARES OF BENEFICIAL INTEREST: | |||||||
|
Shares
sold |
2,420,000 | 340,000 | 2,120,000 | 3,590,000 | |||
|
Shares
redeemed |
(380,000) | (2,290,000) | (2,760,000) | (2,580,000) | |||
|
Net increase (decrease) from share
transactions |
2,040,000 | (1,950,000) | (640,000) | 1,010,000 | |||
| SPDR SSGA Global Allocation ETF | SPDR SSGA Ultra Short Term Bond ETF | SPDR Nuveen Municipal Bond ETF | ||||||
| Year
Ended 6/30/21 |
Year
Ended 6/30/20 |
Year
Ended 6/30/21 |
Year
Ended 6/30/20 |
For
the Period 2/3/21*- 6/30/21 | ||||
| $ 5,634,070 | $ 7,213,512 | $ 2,186,346 | $ 4,704,035 | $ 91,974 | ||||
| 16,141,140 | (3,729,837) | 478,164 | (390,164) | 252,383 | ||||
| 40,475,117 | (8,480,933) | 1,451,941 | (896,263) | 10,210 | ||||
| 62,250,327 | (4,997,258) | 4,116,451 | 3,417,608 | 354,567 | ||||
| (16,635) | 19,354 | 31,941 | 135,058 | 2,273 | ||||
| (5,588,244) | (7,327,692) | (2,605,083) | (4,951,989) | (140,300) | ||||
| 23,982,836 | 22,973,653 | 130,443,856 | 167,508,423 | 44,904,991 | ||||
| (35,804,943) | (28,488,708) | (28,304,057) | (34,951,266) | — | ||||
| 16,635 | (19,354) | (31,941) | (135,058) | (2,273) | ||||
| — | 2,474 | 44,894 | 165,286 | 44,905 | ||||
| (11,805,472) | (5,531,935) | 102,152,752 | 132,587,385 | 44,947,623 | ||||
| 44,839,976 | (17,837,531) | 103,696,061 | 131,188,062 | 45,164,163 | ||||
| 237,849,702 | 255,687,233 | 298,907,402 | 167,719,340 | — | ||||
| $282,689,678 | $237,849,702 | $402,603,463 | $298,907,402 | $45,164,163 | ||||
| 550,000 | 600,000 | 3,225,000 | 4,150,000 | 1,500,000 | ||||
| (860,000) | (820,000) | (700,000) | (875,000) | — | ||||
| (310,000) | (220,000) | 2,525,000 | 3,275,000 | 1,500,000 | ||||
| * | Commencement of operations. |
| SPDR SSGA Multi-Asset Real Return ETF | |||||||||
| Year
Ended 6/30/21 |
Year
Ended 6/30/20 |
Year
Ended 6/30/19 |
Year
Ended 6/30/18(a) |
Year
Ended 6/30/17(a) | |||||
|
Net asset value, beginning of
period |
$ 21.25 | $ 25.18 | $ 26.62 | $ 23.97 | $ 24.38 | ||||
| Income (loss) from investment operations: | |||||||||
|
Net investment income (loss)
(b) |
0.65 | 0.78 | 0.69 | 0.53 | 0.56 | ||||
|
Net realized and unrealized gain (loss)
(c) |
7.15 | (3.89) | (1.43) | 2.64 | (0.44) | ||||
|
Total from investment
operations |
7.80 | (3.11) | (0.74) | 3.17 | 0.12 | ||||
|
Net equalization credits and charges
(b) |
0.02 | (0.02) | 0.00(d) | (0.00)(d) | 0.01 | ||||
| Distributions to shareholders from: | |||||||||
|
Net investment
income |
(0.55) | (0.80) | (0.70) | (0.52) | (0.54) | ||||
|
Net asset value, end of
period |
$ 28.52 | $ 21.25 | $ 25.18 | $ 26.62 | $ 23.97 | ||||
|
Total return
(e) |
37.12% | (12.71)% | (2.71)% | 13.26% | 0.56% | ||||
| Ratios and Supplemental Data: | |||||||||
|
Net assets, end of period (in
000s) |
$130,358 | $53,750 | $112,792 | $143,742 | $115,075 | ||||
| Ratios to average net assets: | |||||||||
|
Total expenses
(f) |
0.08% | 0.08% | 0.12% | 0.22% | 0.22% | ||||
|
Net investment income
(loss) |
2.56% | 3.30% | 2.76% | 2.04% | 2.28% | ||||
|
Portfolio turnover
rate |
49% | 30% | 28% | 44% | 46%(g) | ||||
| (a) | The per share amounts and percentages include the Fund’s proportionate share of income and expenses of the Portfolio prior to discontinuance of the master feeder structure. |
| (b) | Per share numbers have been calculated using average shares outstanding, which more appropriately presents the per share data for the year. |
| (c) | Amounts shown in this caption for a share outstanding may not accord with the change in aggregate gains and losses in securities for the fiscal period because of the timing of sales and repurchases of Fund shares in relation to fluctuating market values for the Fund. |
| (d) | Amount is less than $0.005 per share. |
| (e) | Total return is calculated assuming a purchase of shares at net asset value on the first day and a sale at net asset value on the last day of each period reported. Distributions are assumed, for the purpose of this calculation, to be reinvested at net asset value per share on the respective payment dates of each distribution. Total returns for periods of less than one year are not annualized. Broker commission charges are not included in this calculation. |
| (f) | Does not include expenses of the Underlying Funds in which the Fund invests. |
| (g) | Portfolio turnover is from the Fund's Portfolio prior to discontinuance of master-feeder structure. |
| SPDR SSGA Income Allocation ETF | |||||||||
| Year
Ended 6/30/21 |
Year
Ended 6/30/20 |
Year
Ended 6/30/19 |
Year
Ended 6/30/18(a) |
Year
Ended 6/30/17(a) | |||||
|
Net asset value, beginning of
period |
$ 30.37 | $ 33.32 | $ 32.42 | $ 32.33 | $ 31.23 | ||||
| Income (loss) from investment operations: | |||||||||
|
Net investment income (loss)
(b) |
1.35 | 1.43 | 1.53 | 1.02 | 1.10 | ||||
|
Net realized and unrealized gain (loss)
(c) |
5.18 | (2.95) | 0.91 | 0.09 | 0.98 | ||||
|
Total from investment
operations |
6.53 | (1.52) | 2.44 | 1.11 | 2.08 | ||||
|
Net equalization credits and charges
(b) |
0.04 | 0.03 | 0.03 | (0.01) | (0.01) | ||||
|
Other capital
(b) |
— | — | 0.00(d) | — | — | ||||
| Distributions to shareholders from: | |||||||||
|
Net investment
income |
(1.32) | (1.46) | (1.57) | (1.01) | (0.97) | ||||
|
Net asset value, end of
period |
$ 35.62 | $ 30.37 | $ 33.32 | $ 32.42 | $ 32.33 | ||||
|
Total return
(e) |
21.90% | (4.56)% | 7.93% | 3.34% | 6.78% | ||||
| Ratios and Supplemental Data: | |||||||||
|
Net assets, end of period (in
000s) |
$125,039 | $126,039 | $104,613 | $92,389 | $95,376 | ||||
| Ratios to average net assets: | |||||||||
|
Total expenses
(f) |
0.16% | 0.18% | 0.18% | 0.39% | 0.37% | ||||
|
Net investment income
(loss) |
4.02% | 4.41% | 4.71% | 3.07% | 3.49% | ||||
|
Portfolio turnover
rate |
60% | 38% | 71% | 29% | 47%(g) | ||||
| (a) | The per share amounts and percentages include the Fund’s proportionate share of income and expenses of the Portfolio prior to discontinuance of the master feeder structure. |
| (b) | Per share numbers have been calculated using average shares outstanding, which more appropriately presents the per share data for the year. |
| (c) | Amounts shown in this caption for a share outstanding may not accord with the change in aggregate gains and losses in securities for the fiscal period because of the timing of sales and repurchases of Fund shares in relation to fluctuating market values for the Fund. |
| (d) | Amount is less than $0.005 per share. |
| (e) | Total return is calculated assuming a purchase of shares at net asset value on the first day and a sale at net asset value on the last day of each period reported. Distributions are assumed, for the purpose of this calculation, to be reinvested at net asset value per share on the respective payment dates of each distribution. Total returns for periods of less than one year are not annualized. Broker commission charges are not included in this calculation. |
| (f) | Does not include expenses of the Underlying Funds in which the Fund invests. |
| (g) | Portfolio turnover is from the Fund's Portfolio prior to discontinuance of master-feeder structure. |
| SPDR SSGA Global Allocation ETF | |||||||||
| Year
Ended 6/30/21 |
Year
Ended 6/30/20 |
Year
Ended 6/30/19 |
Year
Ended 6/30/18(a) |
Year
Ended 6/30/17(a) | |||||
|
Net asset value, beginning of
period |
$ 36.88 | $ 38.33 | $ 37.72 | $ 35.52 | $ 33.35 | ||||
| Income (loss) from investment operations: | |||||||||
|
Net investment income (loss)
(b) |
0.91 | 1.07 | 1.03 | 0.81 | 0.99 | ||||
|
Net realized and unrealized gain (loss)
(c) |
9.16 | (1.44) | 0.57 | 2.18 | 2.03 | ||||
|
Total from investment
operations |
10.07 | (0.37) | 1.60 | 2.99 | 3.02 | ||||
|
Net equalization credits and charges
(b) |
(0.00)(d) | 0.00(d) | 0.01 | 0.01 | 0.00(d) | ||||
|
Other capital
(b) |
— | 0.00(d) | — | — | — | ||||
| Distributions to shareholders from: | |||||||||
|
Net investment
income |
(0.91) | (1.08) | (1.00) | (0.80) | (0.85) | ||||
|
Total
distributions |
(0.91) | (1.08) | (1.00) | (0.80) | (0.85) | ||||
|
Net asset value, end of
period |
$ 46.04 | $ 36.88 | $ 38.33 | $ 37.72 | $ 35.52 | ||||
|
Total return
(e) |
27.51% | (1.00)% | 4.37% | 8.46% | 9.14% | ||||
| Ratios and Supplemental Data: | |||||||||
|
Net assets, end of period (in
000s) |
$282,690 | $237,850 | $255,687 | $248,929 | $207,780 | ||||
| Ratios to average net assets: | |||||||||
|
Total expenses
(f) |
0.17% | 0.09% | 0.15% | 0.20% | 0.20% | ||||
|
Net
expenses |
0.17% | 0.09% | 0.15% | 0.09% | 0.01% | ||||
|
Net investment income
(loss) |
2.16% | 2.84% | 2.76% | 2.14% | 2.91% | ||||
|
Portfolio turnover
rate |
110% | 94% | 71% | 43% | 90%(g) | ||||
| (a) | The per share amounts and percentages include the Fund’s proportionate share of income and expenses of the Portfolio prior to discontinuance of the master feeder structure. |
| (b) | Per share numbers have been calculated using average shares outstanding, which more appropriately presents the per share data for the year. |
| (c) | Amounts shown in this caption for a share outstanding may not accord with the change in aggregate gains and losses in securities for the fiscal period because of the timing of sales and repurchases of Fund shares in relation to fluctuating market values for the Fund. |
| (d) | Amount is less than $0.005 per share. |
| (e) | Total return is calculated assuming a purchase of shares at net asset value on the first day and a sale at net asset value on the last day of each period reported. Distributions are assumed, for the purpose of this calculation, to be reinvested at net asset value per share on the respective payment dates of each distribution. Total returns for periods of less than one year are not annualized. Broker commission charges are not included in this calculation. |
| (f) | Does not include expenses of the Underlying Funds in which the Fund invests. |
| (g) | Portfolio turnover is from the Fund's Portfolio prior to discontinuance of master-feeder structure. |
| SPDR SSGA Ultra Short Term Bond ETF | |||||||||
| Year
Ended 6/30/21 |
Year
Ended 6/30/20 |
Year
Ended 6/30/19 |
Year
Ended 6/30/18(a) |
Year
Ended 6/30/17(a) | |||||
|
Net asset value, beginning of
period |
$ 40.26 | $ 40.41 | $ 40.27 | $ 40.26 | $ 40.06 | ||||
| Income (loss) from investment operations: | |||||||||
|
Net investment income (loss)
(b) |
0.27 | 0.81 | 1.02 | 0.68 | 0.44 | ||||
|
Net realized and unrealized gain (loss)
(c) |
0.25 | (0.11) | 0.04 | (0.14) | 0.13 | ||||
|
Total from investment
operations |
0.52 | 0.70 | 1.06 | 0.54 | 0.57 | ||||
|
Net equalization credits and charges
(b) |
0.00(d) | 0.02 | 0.03 | 0.04 | (0.00)(d) | ||||
|
Other capital
(b) |
0.01 | 0.03 | 0.02 | 0.06 | 0.05 | ||||
| Distributions to shareholders from: | |||||||||
|
Net investment
income |
(0.33) | (0.90) | (0.97) | (0.63) | (0.42) | ||||
|
Total
distributions |
(0.33) | (0.90) | (0.97) | (0.63) | (0.42) | ||||
|
Net asset value, end of
period |
$ 40.46 | $ 40.26 | $ 40.41 | $ 40.27 | $ 40.26 | ||||
|
Total return
(e) |
1.34% | 1.86% | 2.79% | 1.60% | 1.53% | ||||
| Ratios and Supplemental Data: | |||||||||
|
Net assets, end of period (in
000s) |
$402,603 | $298,907 | $167,719 | $50,344 | $18,117 | ||||
| Ratios to average net assets: | |||||||||
|
Total
expenses |
0.20% | 0.20% | 0.20% | 0.20% | 0.20% | ||||
|
Net investment income
(loss) |
0.67% | 2.02% | 2.54% | 1.70% | 1.09% | ||||
|
Portfolio turnover
rate |
76% | 71% | 100% | 76% | 83%(f) | ||||
| (a) | The per share amounts and percentages include the Fund’s proportionate share of income and expenses of the Portfolio prior to discontinuance of the master feeder structure. |
| (b) | Per share numbers have been calculated using average shares outstanding, which more appropriately presents the per share data for the year. |
| (c) | Amounts shown in this caption for a share outstanding may not accord with the change in aggregate gains and losses in securities for the fiscal period because of the timing of sales and repurchases of Fund shares in relation to fluctuating market values for the Fund. |
| (d) | Amount is less than $0.005 per share. |
| (e) | Total return is calculated assuming a purchase of shares at net asset value on the first day and a sale at net asset value on the last day of each period reported. Distributions are assumed, for the purpose of this calculation, to be reinvested at net asset value per share on the respective payment dates of each distribution. Total returns for periods of less than one year are not annualized. Broker commission charges are not included in this calculation. |
| (f) | Portfolio turnover is from the Fund's Portfolio prior to discontinuance of master-feeder structure. |
| SPDR Nuveen Municipal Bond ETF | |
| For
the Period 2/3/21*- 6/30/21 | |
|
Net asset value, beginning of
period |
$ 30.00 |
| Income (loss) from investment operations: | |
|
Net investment income (loss)
(a) |
0.07 |
|
Net realized and unrealized gain (loss)
(b) |
0.11 |
|
Total from investment
operations |
0.18 |
|
Net equalization credits and charges
(a) |
0.00(c) |
|
Other capital
(a) |
0.03 |
| Distributions to shareholders from: | |
|
Net investment
income |
(0.10) |
|
Net asset value, end of
period |
$ 30.11 |
|
Total return
(d) |
0.69% |
| Ratios and Supplemental Data: | |
|
Net assets, end of period (in
000s) |
$45,164 |
| Ratios to average net assets: | |
|
Total
expenses |
0.40%(e) |
|
Net investment income
(loss) |
0.57%(e) |
|
Portfolio turnover rate
(f) |
51%(g) |
| * | Commencement of operations. |
| (a) | Per share numbers have been calculated using average shares outstanding, which more appropriately presents the per share data for the year. |
| (b) | Amounts shown in this caption for a share outstanding may not accord with the change in aggregate gains and losses in securities for the fiscal period because of the timing of sales and repurchases of Fund shares in relation to fluctuating market values for the Fund. |
| (c) | Amount is less than $0.005 per share. |
| (d) | Total return is calculated assuming a purchase of shares at net asset value on the first day and a sale at net asset value on the last day of each period reported. Distributions are assumed, for the purpose of this calculation, to be reinvested at net asset value per share on the respective payment dates of each distribution. Total returns for periods of less than one year are not annualized. Broker commission charges are not included in this calculation. |
| (e) | Annualized. |
| (f) | Portfolio turnover rate excludes securities received or delivered from in-kind processing of creations or redemptions. |
| (g) | Not annualized. |
| SPDR SSGA Multi-Asset Real Return ETF |
| SPDR SSGA Income Allocation ETF |
| SPDR SSGA Global Allocation ETF |
| SPDR SSGA Ultra Short Term Bond ETF |
| SPDR Nuveen Municipal Bond ETF |
| Annual Rate* | |
|
SPDR SSGA Multi-Asset Real Return
ETF |
0.50% |
|
SPDR SSGA Income Allocation
ETF |
0.50 |
|
SPDR SSGA Global Allocation
ETF |
0.35 |
|
SPDR SSGA Ultra Short Term Bond
ETF |
0.20 |
|
SPDR Nuveen Municipal Bond
ETF |
0.40 |
| * | The Advisory fee is reduced for SPDR SSGA Multi-Asset Real Return ETF, SPDR SSGA Income Allocation ETF and SPDR SSGA Global Allocation ETF by the acquired fund fees and expenses. For the year ended June 30, 2021, the net annualized advisory fee was 0.08%, 0.16%, and 0.17% for the SPDR SSGA Multi-Asset Real Return ETF, SPDR SSGA Income Allocation ETF, SPDR SSGA Global Allocation ETF, respectively. |
| Purchases | Sales | ||
|
SPDR SSGA Multi-Asset Real Return
ETF |
$ 34,711,664 | $ 33,972,513 | |
|
SPDR SSGA Income Allocation
ETF |
68,848,997 | 69,024,626 | |
|
SPDR SSGA Global Allocation
ETF |
278,398,480 | 279,743,158 | |
|
SPDR SSGA Ultra Short Term Bond
ETF |
278,615,616 | 214,483,192 | |
|
SPDR Nuveen Municipal Bond
ETF |
65,421,380 | 20,620,345 |
| In-kind
Contributions |
In-kind
Redemptions |
In-kind
Net Realized Gains/(Losses) | |||
|
SPDR SSGA Multi-Asset Real Return
ETF |
$66,162,829 | $ 8,833,376 | $ 243,072 | ||
|
SPDR SSGA Income Allocation
ETF |
70,730,721 | 89,126,566 | 6,817,557 | ||
|
SPDR SSGA Global Allocation
ETF |
22,134,357 | 33,256,043 | 6,305,886 |
| Ordinary
Income |
Tax
Exempt Income |
Long-Term
Capital Gains |
Total | ||||
|
SPDR SSGA Multi-Asset Real Return
ETF |
$1,750,442 | $ — | $— | $1,750,442 | |||
|
SPDR SSGA Income Allocation
ETF |
4,629,430 | — | — | 4,629,430 | |||
|
SPDR SSGA Global Allocation
ETF |
5,588,244 | — | — | 5,588,244 | |||
|
SPDR SSGA Ultra Short Term Bond
ETF |
2,605,083 | — | — | 2,605,083 | |||
|
SPDR Nuveen Municipal Bond
ETF |
3,922 | 136,378 | — | 140,300 |
| Ordinary
Income |
Long-Term
Capital Gains |
Total | |||
|
SPDR SSGA Multi-Asset Real Return
ETF |
$ 2,878,161 | $ — | $ 2,878,161 | ||
|
SPDR SSGA Income Allocation ETF
|
5,787,114 | — | 5,787,114 | ||
|
SPDR SSGA Global Allocation ETF
|
7,327,692 | — | 7,327,692 | ||
|
SPDR SSGA Ultra Short Term Bond
ETF |
4,951,989 | — | 4,951,989 |
| Undistributed
Ordinary Income |
Undistributed
Tax Exempt Income |
Capital
Loss Carryforwards |
Undistributed
Long-Term Capital Gains |
Net
Unrealized Gains (Losses) |
Total | ||||||
|
SPDR SSGA Multi-Asset Real Return
ETF |
$ 5,007 | $ — | $(42,274,980) | $ — | $ 8,144,244 | $(34,125,729) | |||||
|
SPDR SSGA Income Allocation
ETF |
— | — | (10,432,789) | — | 3,404,453 | (7,028,336) | |||||
|
SPDR SSGA Global Allocation
ETF |
32,107 | — | — | 1,513,610 | 48,720,218 | 50,265,935 | |||||
|
SPDR SSGA Ultra Short Term Bond
ETF |
— | — | (300,137) | — | 802,768 | 502,631 | |||||
|
SPDR Nuveen Municipal Bond
ETF |
231,630 | 43,145 | — | — | (60,508) | 214,267 |
| Non-Expiring
Short Term |
Non-Expiring
Long Term | ||
|
SPDR SSGA Multi-Asset Real Return
ETF |
$11,267,651 | $31,007,329 | |
|
SPDR SSGA Income Allocation
ETF |
6,609,405 | 3,823,384 | |
|
SPDR SSGA Ultra Short Term Bond
ETF |
— | 300,137 |
| Tax
Cost |
Gross
Unrealized Appreciation |
Gross
Unrealized Depreciation |
Net
Unrealized Appreciation (Depreciation) | ||||
|
SPDR SSGA Multi-Asset Real Return
ETF |
$134,571,303 | $ 8,144,244 | $ — | $ 8,144,244 | |||
|
SPDR SSGA Income Allocation
ETF |
131,733,222 | 3,739,684 | 335,231 | 3,404,453 | |||
|
SPDR SSGA Global Allocation
ETF |
276,481,649 | 49,845,640 | 1,125,422 | 48,720,218 | |||
|
SPDR SSGA Ultra Short Term Bond
ETF |
400,363,057 | 876,983 | 74,215 | 802,768 | |||
|
SPDR Nuveen Municipal Bond
ETF |
46,266,776 | 143,889 | 204,397 | (60,508) |
| Fund | Market
Value of Securities on Loan |
Cash
Collateral Received |
Non-Cash
Collateral Received* |
Total
Collateral Received | ||||
|
SPDR SSGA Multi-Asset Real Return
ETF |
$ 18,674,023 | $ 12,421,543 | $ 6,581,098 | $ 19,002,641 | ||||
|
SPDR SSGA Income Allocation ETF
|
21,491,633 | 10,114,067 | 11,885,682 | 21,999,749 |
| Fund | Market
Value of Securities on Loan |
Cash
Collateral Received |
Non-Cash
Collateral Received* |
Total
Collateral Received | ||||
|
SPDR SSGA Global Allocation ETF
|
$48,247,191 | $42,661,109 | $ 6,740,579 | $49,401,688 |
| * | The non-cash collateral includes U.S. Treasuries and U.S. Government Agency securities. |
| Remaining
Contractual Maturity of the Agreements as of June 30, 2021 | ||||||||||||||
| Fund | Securities
Lending Transactions |
Overnight
and Continuous |
<30 Days | Between
30 & 90 Days |
>90 Days | Total
Borrowings |
Gross
Amount of Recognized Liabilities for Securities Lending Transactions | |||||||
|
SPDR SSGA Multi-Asset Real Return
ETF |
Mutual Funds and Exchange Traded Products | $12,421,543 | $— | $— | $— | $12,421,543 | $12,421,543 | |||||||
|
SPDR SSGA Income Allocation
ETF |
Mutual Funds and Exchange Traded Products | 10,114,067 | — | — | — | 10,114,067 | 10,114,067 | |||||||
|
SPDR SSGA Global Allocation
ETF |
Mutual Funds and Exchange Traded Products | 42,661,109 | — | — | — | 42,661,109 | 42,661,109 | |||||||
| Individual Fund constituting the SSGA Active Trust | Statement of operations | Statement of changes in net assets | Financial highlights |
| SPDR
SSGA Multi-Asset Real Return ETF SPDR SSGA Income Allocation ETF SPDR SSGA Global Allocation ETF SPDR SSGA Ultra Short Term Bond ETF |
For the year ended June 30, 2021 | For each of the two years in the period ended June 30, 2021 | For each of the five years in the period ended June 30, 2021 |
| SPDR Nuveen Municipal Bond ETF | For
the period from February 3, 2021 (commencement of operations) to June 30, 2021 | ||

August 30, 2021
| Actual | Hypothetical
(assuming a 5% return before expenses) | ||||||||
| Annualized
Expense Ratio |
Ending
Account Value |
Expenses
Paid During Period(a) |
Ending
Account Value |
Expenses
Paid During Period(a) | |||||
|
SPDR SSGA Multi-Asset Real Return
ETF |
0.08% | $1,167.90 | $0.43 | $1,024.40 | $0.40 | ||||
|
SPDR SSGA Income Allocation
ETF |
0.14 | 1,072.10 | 0.72 | 1,024.10 | 0.70 | ||||
|
SPDR SSGA Global Allocation
ETF |
0.20 | 1,088.30 | 1.04 | 1,023.80 | 1.00 | ||||
|
SPDR SSGA Ultra Short Term Bond
ETF |
0.20 | 1,003.20 | 0.99 | 1,023.80 | 1.00 | ||||
|
SPDR Nuveen Municipal Bond
ETF |
0.40(b) | 1,006.90 | 1.62 | 1,018.50 | 1.63 | ||||
| (a) | Expenses are equal to the Fund's annualized net expense ratio multiplied by the average account value of the period, multiplied by 181, then divided by 365. |
| (b) | Actual period is from commencement of operations on 02/03/2021. |
| Amount | |
|
SPDR SSGA Global Allocation
ETF |
$1,523,983 |
| Percentage | |
|
SPDR Nuveen Municipal Bond
ETF |
97.20% |
| Name,
Address and Year of Birth |
Position(s)
with Funds |
Term
of Office and Length of Time Served |
Principal
Occupation(s) During Past 5 Years |
Number
of Portfolios in Fund Complex Overseen by Trustee† |
Other
Directorships Held by Trustee During the Past 5 Years | |||||
| Trustees | ||||||||||
| Independent Trustees | ||||||||||
| DWIGHT
D. CHURCHILL c/o SSGA Active Trust One Iron Street Boston, MA 02210 1953 |
Independent
Trustee, Audit Committee Chair |
Term:
Unlimited Served: since March 2011 |
Self-employed
consultant since 2010; CEO and President, CFA Institute (June 2014 - January 2015). |
126 | Affiliated Managers Group, Inc. (Chairman, Director and Audit Committee Chair). | |||||
| CLARE
S. RICHER c/o SSGA Active Trust One Iron Street Boston, MA 02210 1958 |
Independent
Trustee |
Term:
Unlimited Served: since July 2018 |
Retired.
Chief Financial Officer, Putnam Investments LLC (December 2008 - May 2017). |
126 | Principal
Financial Group (Director); Bain Capital Specialty Finance (Director); Putnam Acquisition Financing Inc. (Director); Putnam Acquisition Financing LLC (Director); Putnam GP Inc. (Director); Putnam Investor Services, Inc. (Director); University of Notre Dame (Trustee). | |||||
| SANDRA
G. SPONEM c/o SSGA Active Trust One Iron Street Boston, MA 02210 1958 |
Independent
Trustee |
Term:
Unlimited Served: since July 2018 |
Retired.
Chief Financial Officer, M.A. Mortenson Companies, Inc. (February 2007- April 2017). |
126 | Rydex
Series Funds (Trustee); Rydex Dynamic Funds (Trustee); Rydex Variable Trust (Trustee); Guggenheim Funds Trust (Trustee); Guggenheim Variable Funds Trust (Trustee); Guggenheim Strategy Funds Trust (Trustee); Transparent Value Trust (Trustee); Fiduciary/Claymore Energy Infrastructure Fund (Trustee); Guggenheim Taxable Municipal Managed Duration Trust (Trustee); Guggenheim Strategic Opportunities Fund (Trustee); Guggenheim Enhanced, Equity Income Fund (Trustee); Guggenheim Credit Allocation Fund (Trustee); Guggenheim Energy & Income Fund (Trustee). | |||||
| CARL
G. VERBONCOEUR c/o SSGA Active Trust One Iron Street Boston, MA 02210 1952 |
Independent
Trustee, Trustee Committee Chair |
Term:
Unlimited Served: since March 2011 |
Self-employed
consultant since 2009. |
126 | The
Motley Fool Funds Trust (Trustee). |
| Name,
Address and Year of Birth |
Position(s)
with Funds |
Term
of Office and Length of Time Served |
Principal
Occupation(s) During Past 5 Years |
Number
of Portfolios in Fund Complex Overseen by Trustee† |
Other
Directorships Held by Trustee During the Past 5 Years | |||||
| Interested Trustee | ||||||||||
| JAMES
E. ROSS* c/o SSGA Active Trust One Iron Street Boston, MA 02210 1965 |
Interested
Trustee |
Term:
Unlimited Served as Trustee: since March 2011 |
Non-Executive
Chairman, Fusion Acquisition Corp. (June 2020 - Present); Retired Chairman and Director, SSGA Funds Management, Inc. (2005 - March 2020); Retired Executive Vice President, State Street Global Advisors (2012 - March 2020); Retired Chief Executive Officer and Manager, State Street Global Advisors Funds Distributors, LLC (May 2017 - March 2020); Director, State Street Global Markets, LLC (2013 - April 2017); President, SSGA Funds Management, Inc. (2005 - 2012); Principal, State Street Global Advisors (2000 - 2005). |
137 | SSGA SPDR
ETFs Europe I plc (Director) (November 2016 - March 2020); SSGA SPDR ETFs Europe II plc (Director) (November 2016 - March 2020); State Street Navigator Securities Lending Trust (July 2016 - March 2020); SSGA Funds (January 2014 - March 2020); State Street Institutional Investment Trust (February 2007 - March 2020); State Street Master Funds (February 2007 - March 2020); Elfun Funds (July 2016 - December 2018). | |||||
| † For the purpose of determining the number of portfolios overseen by the Trustees, “Fund Complex” comprises registered investment companies for which SSGA Funds Management, Inc. serves as investment adviser. | ||||||||||
| * Mr. Ross is an Interested Trustee because of his former position with the Adviser and ownership interest in an affiliate of the Adviser. | ||||||||||
| Name,
Address and Year of Birth |
Position(s)
with Funds |
Term
of Office and Length of Time Served |
Principal Occupation(s) During the Past 5 Years | |||
| Officers | ||||||
| ELLEN
M. NEEDHAM SSGA Funds Management, Inc. One Iron Street Boston, MA 02210 1967 |
President | Term:
Unlimited Served: since October 2012 |
Chairman, SSGA Funds Management, Inc. (March 2020 - present)*; President and Director, SSGA Funds Management, Inc. (2001 - present)*; Senior Managing Director, State Street Global Advisors (1992 - present)*; Manager, State Street Global Advisors Funds Distributors, LLC (May 2017 - present). | |||
| BRUCE
S. ROSENBERG SSGA Funds Management, Inc. One Iron Street Boston, MA 02210 1961 |
Treasurer | Term:
Unlimited Served: since February 2016 |
Managing Director, State Street Global Advisors and SSGA Funds Management, Inc. (July 2015 - present); Director, Credit Suisse (April 2008 - July 2015). | |||
| ANN
M. CARPENTER SSGA Funds Management, Inc. One Iron Street Boston, MA 02210 1966 |
Vice
President; Deputy Treasurer |
Term:
Unlimited Served: since August 2012 (with respect to Vice President); Unlimited Served: since February 2016 (with respect to Deputy Treasurer) |
Chief Operating Officer, SSGA Funds Management, Inc. (April 2005 - Present)*; Managing Director, State Street Global Advisors (April 2005 - present).* | |||
| MICHAEL
P. RILEY SSGA Funds Management, Inc. One Iron Street Boston, MA 02210 1969 |
Vice
President |
Term:
Unlimited Served: since March 2011 |
Managing Director, State Street Global Advisors (2005 - present).* | |||
| SEAN
O’MALLEY SSGA Funds Management, Inc. One Iron Street Boston, MA 02210 1969 |
Chief
Legal Officer |
Term:
Unlimited Served: since August 2019 |
Senior Vice President and Deputy General Counsel, State Street Global Advisors (November 2013 -present). | |||
| DAVID
URMAN SSGA Funds Management, Inc. One Iron Street Boston, MA 02210 1985 |
Assistant
Secretary |
Term:
Unlimited Served: since August 2019 |
Vice President and Senior Counsel, State Street Global Advisors (April 2019 - present); Vice President and Counsel, State Street Global Advisors (August 2015 - April 2019); Associate, Ropes & Gray LLP (November 2012 - August 2015). | |||
| DAVID
BARR SSGA Funds Management, Inc. One Iron Street Boston, MA 02210 1974 |
Assistant
Secretary |
Term:
Unlimited Served: since November 2020 |
Vice President and Senior Counsel, State Street Global Advisors (October 2019 - present); Vice President and Counsel, Eaton Vance Corp. (2010 - 2019). | |||
| CHAD
C. HALLETT SSGA Funds Management, Inc. One Iron Street Boston, MA 02210 1969 |
Deputy
Treasurer |
Term:
Unlimited Served: since February 2016 |
Vice President, State Street Global Advisors and SSGA Funds Management, Inc. (November 2014 - present); Vice President, State Street Bank and Trust Company (2001 - November 2014).* | |||
| DARLENE
ANDERSON-VASQUEZ SSGA Funds Management, Inc. One Iron Street Boston, MA 02210 1968 |
Deputy
Treasurer |
Term:
Unlimited Served: since November 2016 |
Managing Director, State Street Global Advisors and SSGA Funds Management, Inc. (May 2016 - present); Senior Vice President, John Hancock Investments (September 2007 - May 2016). |
| Name,
Address and Year of Birth |
Position(s)
with Funds |
Term
of Office and Length of Time Served |
Principal Occupation(s) During the Past 5 Years | |||
| ARTHUR
A. JENSEN SSGA Funds Management, Inc. 1600 Summer Street Stamford, CT 06905 1966 |
Deputy
Treasurer |
Term:
Unlimited Served: Since August 2017 |
Vice President, State Street Global Advisors and SSGA Funds Management, Inc. (July 2016 - present); Mutual Funds Controller of GE Asset Management Incorporated (April 2011 - July 2016). | |||
| DAVID
LANCASTER SSGA Funds Management, Inc. One Iron Street Boston, MA 02210 1971 |
Assistant
Treasurer |
Term:
Unlimited Served: since November 2020 |
Vice President, State Street Global Advisors and SSGA Funds Management, Inc. (July 2017 - present); Assistant Vice President, State Street Bank and Trust Company (November 2011 - July 2017). | |||
| BRIAN
HARRIS SSGA Funds Management, Inc. One Iron Street Boston, MA 02210 1973 |
Chief
Compliance Officer; Anti-Money Laundering Officer; Code of Ethics Compliance Officer |
Term:
Unlimited Served: since November 2013 |
Managing Director, State Street Global Advisors and SSGA Funds Management, Inc. (June 2013 - present)*; Senior Vice President and Global Head of Investment Compliance, BofA Global Capital Management (2010 - 2013); Director of Compliance, AARP Financial Inc. (2008 - 2010). | |||
| * Served in various capacities and/or with various affiliated entities during noted time period. | ||||||
| The Statement of Additional Information (SAI) includes additional information about the Funds' trustees and is available, without charge, upon request and by calling 1-866-787-2257. | ||||||
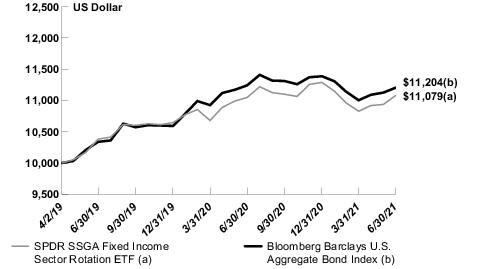
| SPDR SSGA Fixed Income Sector Rotation ETF |
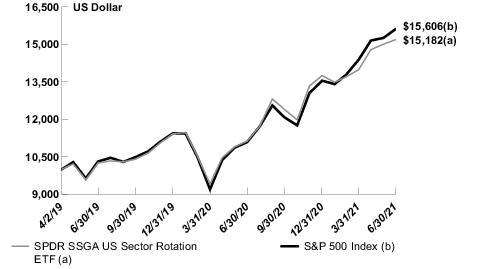
| SPDR SSGA US Sector Rotation ETF |

|
|
1 |
| Management’s Discussion of Fund Performance, Performance Summaries & Portfolio Statistics (Unaudited) | |
|
|
2 |
|
|
5 |
| Schedules of Investments | |
|
|
8 |
|
|
10 |
|
|
12 |
|
|
15 |
|
|
17 |
|
|
28 |
|
|
30 |
| Cumulative Total Return | Average Annual Total Return | ||||||
| Net
Asset Value |
Market
Value |
Bloomberg Barclays U.S. Aggregate Bond Index | Net
Asset Value |
Market
Value |
Bloomberg Barclays U.S. Aggregate Bond Index | ||
| ONE YEAR | 0.29% | 0.31% | (0.33)% | 0.29% | 0.31% | (0.33)% | |
| SINCE INCEPTION(1) | 10.79% | 10.76% | 12.04% | 4.67% | 4.66% | 5.20% | |
| (1) | For the period April 2, 2019 to June 30, 2021. Since shares of the Fund did not trade in the secondary market until one day after the Fund’s inception, for the period from inception to the first day of secondary market trading in shares of the Fund (4/2/19, 4/3/19, respectively), the NAV of the Fund is used as a proxy for the secondary market trading price to calculate market returns. |
(Based on Net Asset Value)
| Description | % of Net Assets | ||
| SPDR Portfolio Mortgage Backed Bond ETF | 30.3% | ||
| SPDR Portfolio Long Term Corporate Bond ETF | 24.3 | ||
| SPDR Portfolio Intermediate Term Corporate Bond ETF | 22.5 | ||
| SPDR Portfolio Intermediate Term Treasury ETF | 11.4 | ||
| SPDR Portfolio Long Term Treasury ETF | 7.0 | ||
| TOTAL | 95.5% |
| % of Net Assets | |||
| Domestic Fixed Income | 99.9% | ||
| Short Term Investments | 29.8 | ||
| Liabilities in Excess of Other Assets | (29.7) | ||
| TOTAL | 100.0% |
| Cumulative Total Return | Average Annual Total Return | ||||||
| Net
Asset Value |
Market
Value |
S&P 500 Index | Net
Asset Value |
Market
Value |
S&P 500 Index | ||
| ONE YEAR | 36.48% | 36.31% | 40.79% | 36.48% | 36.31% | 40.79% | |
| SINCE INCEPTION(1) | 51.82% | 51.84% | 56.06% | 20.45% | 20.46% | 21.94% | |
| (1) | For the period April 2, 2019 to June 30, 2021. Since shares of the Fund did not trade in the secondary market until one day after the Fund’s inception, for the period from inception to the first day of secondary market trading in shares of the Fund (4/2/19, 4/3/19, respectively), the NAV of the Fund is used as a proxy for the secondary market trading price to calculate market returns. |
(Based on Net Asset Value)
| Description | % of Net Assets | ||
| The Technology Select Sector SPDR Fund | 41.7% | ||
| The Materials Select Sector SPDR Fund | 16.6 | ||
| The Industrial Select Sector SPDR Fund | 16.1 | ||
| The Financial Select Sector SPDR Fund | 12.6 | ||
| The Communication Services Select Sector SPDR Fund | 7.0 | ||
| TOTAL | 94.0% |
| % of Net Assets | |||
| Domestic Equity | 99.8% | ||
| Short Term Investments | 28.6 | ||
| Liabilities in Excess of Other Assets | (28.4) | ||
| TOTAL | 100.0% |
| Security Description | Shares | Value | ||||
| MUTUAL FUNDS AND EXCHANGE TRADED PRODUCTS — 99.9% | ||||||
| DOMESTIC FIXED INCOME — 99.9% | ||||||
|
SPDR Bloomberg Barclays 1-3 Month T-Bill ETF
(a)(b) |
39,726 | $ 3,633,737 | ||||
|
SPDR Portfolio Intermediate Term Corporate Bond ETF
(a)(b) |
508,248 | 18,652,702 | ||||
|
SPDR Portfolio Intermediate Term Treasury ETF
(a) |
292,929 | 9,485,041 | ||||
|
SPDR Portfolio Long Term Corporate Bond ETF
(a)(b) |
634,102 | 20,151,762 | ||||
|
SPDR Portfolio Long Term Treasury ETF
(a) |
139,338 | 5,754,659 | ||||
|
SPDR Portfolio Mortgage Backed Bond ETF
(a)(b) |
973,311 | 25,169,822 | ||||
|
TOTAL MUTUAL FUNDS AND EXCHANGE TRADED PRODUCTS (Cost
$82,670,441) |
82,847,723 | |||||
| SHORT-TERM INVESTMENTS — 29.8% | ||||||
|
State Street Institutional U.S. Government Money Market Fund, Class G Shares 0.03%
(c)(d) |
136,849 | 136,849 | ||||
|
State Street Navigator Securities Lending Portfolio II
(e)(f) |
24,628,973 | 24,628,973 | ||||
|
TOTAL SHORT-TERM INVESTMENTS (Cost
$24,765,822) |
$ 24,765,822 | |||||
|
TOTAL INVESTMENTS—129.7% (Cost
$107,436,263) |
107,613,545 | |||||
|
LIABILITIES IN EXCESS OF OTHER
ASSETS—(29.7)% |
(24,639,701) | |||||
|
NET
ASSETS—100.0% |
$ 82,973,844 | |||||
| The Fund invests in other funds and financial statements of underlying funds can be found at www.sec.gov. | |
| (a) | Affiliated fund managed by SSGA Funds Management, Inc. Amounts related to these transactions during the period ended June 30, 2021 are shown in the Affiliate Table below. |
| (b) | All or a portion of the shares of the security are on loan at June 30, 2021. |
| (c) | The Fund invested in certain money market funds managed by SSGA Funds Management, Inc. Amounts related to these transactions during the period ended June 30, 2021 are shown in the Affiliate Table below. |
| (d) | The rate shown is the annualized seven-day yield at June 30, 2021. |
| (e) | The Fund invested in an affiliated entity. Amounts related to these transactions during the period ended June 30, 2021 are shown in the Affiliate Table below. |
| (f) | Investment of cash collateral for securities loaned. |
| Description | Level
1 – Quoted Prices |
Level
2 – Other Significant Observable Inputs |
Level
3 – Significant Unobservable Inputs |
Total | ||||
| ASSETS: | ||||||||
| INVESTMENTS: | ||||||||
|
Mutual Funds and Exchange Traded
Products |
$ 82,847,723 | $— | $— | $ 82,847,723 | ||||
|
Short-Term
Investments |
24,765,822 | — | — | 24,765,822 | ||||
|
TOTAL
INVESTMENTS |
$107,613,545 | $— | $— | $107,613,545 |
| Number
of Shares Held at 6/30/20 |
Value
at 6/30/20 |
Cost
of Purchases |
Proceeds
from Shares Sold |
Realized
Gain (Loss) |
Change
in Unrealized Appreciation/ Depreciation |
Number
of Shares Held at 6/30/21 |
Value
at 6/30/21 |
Dividend
Income | |||||||||
|
SPDR Bloomberg Barclays 1-3 Month T-Bill
ETF |
— | $ — | $ 9,741,170 | $ 6,103,656 | $ (2,842) | $ (935) | 39,726 | $ 3,633,737 | $ — | ||||||||
|
SPDR Bloomberg Barclays High Yield Bond
ETF |
43,696 | 4,420,287 | 2,706,432 | 7,324,826 | 298,320 | (100,213) | — | — | 104,963 | ||||||||
|
SPDR Portfolio Intermediate Term Corporate Bond
ETF |
362,090 | 13,227,148 | 19,283,435 | 14,010,513 | 261,114 | (108,482) | 508,248 | 18,652,702 | 219,640 | ||||||||
|
SPDR Portfolio Intermediate Term Treasury
ETF |
239,904 | 7,969,611 | 12,226,097 | 10,462,221 | 138,940 | (387,386) | 292,929 | 9,485,041 | 35,705 | ||||||||
|
SPDR Portfolio Long Term Corporate Bond
ETF |
151,623 | 4,806,450 | 27,332,547 | 11,512,564 | (381,262) | (93,409) | 634,102 | 20,151,762 | 415,748 | ||||||||
|
SPDR Portfolio Long Term Treasury
ETF |
— | — | 10,332,144 | 4,596,683 | (159,847) | 179,045 | 139,338 | 5,754,659 | 10,398 | ||||||||
|
SPDR Portfolio Mortgage Backed Bond
ETF |
578,818 | 15,506,534 | 21,360,024 | 11,053,427 | (36,370) | (606,939) | 973,311 | 25,169,822 | 514,167 | ||||||||
|
State Street Institutional U.S. Government Money Market Fund, Class G
Shares |
1,091,555 | 1,091,555 | 1,738,586 | 2,693,292 | — | — | 136,849 | 136,849 | 377 | ||||||||
|
State Street Navigator Securities Lending Portfolio
II |
9,882,034 | 9,882,034 | 494,143,581 | 479,396,642 | — | — | 24,628,973 | 24,628,973 | 91,988 | ||||||||
|
Total |
$56,903,619 | $598,864,016 | $547,153,824 | $ 118,053 | $(1,118,319) | $107,613,545 | $1,392,986 |
| Security Description | Shares | Value | ||||
| MUTUAL FUNDS AND EXCHANGE TRADED PRODUCTS — 99.8% | ||||||
| DOMESTIC EQUITY — 99.8% | ||||||
|
The Communication Services Select Sector SPDR Fund
(a)(b) |
150,287 | $ 12,168,738 | ||||
|
The Consumer Staples Select Sector SPDR Fund
(a) |
67,445 | 4,719,127 | ||||
|
The Energy Select Sector SPDR Fund
(a) |
100,084 | 5,391,525 | ||||
|
The Financial Select Sector SPDR Fund
(a) |
599,399 | 21,991,949 | ||||
|
The Industrial Select Sector SPDR Fund
(a)(b) |
274,818 | 28,141,363 | ||||
|
The Materials Select Sector SPDR Fund
(a)(b) |
351,629 | 28,942,583 | ||||
|
The Technology Select Sector SPDR Fund
(a) |
492,231 | 72,682,830 | ||||
|
TOTAL MUTUAL FUNDS AND EXCHANGE TRADED PRODUCTS (Cost
$162,854,192) |
174,038,115 | |||||
| SHORT-TERM INVESTMENTS — 28.6% | ||||||
|
State Street Institutional U.S. Government Money Market Fund, Class G Shares 0.03%
(c)(d) |
422,278 | 422,278 | ||||
|
State Street Navigator Securities Lending Portfolio II
(e)(f) |
49,478,804 | 49,478,804 | ||||
|
TOTAL SHORT-TERM INVESTMENTS (Cost
$49,901,082) |
$ 49,901,082 | |||||
|
TOTAL INVESTMENTS—128.4% (Cost
$212,755,274) |
223,939,197 | |||||
|
LIABILITIES IN EXCESS OF OTHER
ASSETS—(28.4)% |
(49,543,582) | |||||
|
NET
ASSETS—100.0% |
$ 174,395,615 | |||||
| The Fund invests in other funds and financial statements of underlying funds can be found at www.sec.gov. | |
| (a) | Affiliated fund managed by SSGA Funds Management, Inc. Amounts related to these transactions during the period ended June 30, 2021 are shown in the Affiliate Table below. |
| (b) | All or a portion of the shares of the security are on loan at June 30, 2021. |
| (c) | The Fund invested in certain money market funds managed by SSGA Funds Management, Inc. Amounts related to these transactions during the period ended June 30, 2021 are shown in the Affiliate Table below. |
| (d) | The rate shown is the annualized seven-day yield at June 30, 2021. |
| (e) | The Fund invested in an affiliated entity. Amounts related to these transactions during the period ended June 30, 2021 are shown in the Affiliate Table below. |
| (f) | Investment of cash collateral for securities loaned. |
| Description | Level
1 – Quoted Prices |
Level
2 – Other Significant Observable Inputs |
Level
3 – Significant Unobservable Inputs |
Total | ||||
| ASSETS: | ||||||||
| INVESTMENTS: | ||||||||
|
Mutual Funds and Exchange Traded
Products |
$ 174,038,115 | $— | $— | $ 174,038,115 | ||||
|
Short-Term
Investments |
49,901,082 | — | — | 49,901,082 | ||||
|
TOTAL
INVESTMENTS |
$223,939,197 | $— | $— | $223,939,197 |
| Number
of Shares Held at 6/30/20 |
Value
at 6/30/20 |
Cost
of Purchases |
Proceeds
from Shares Sold |
Realized
Gain (Loss) |
Change
in Unrealized Appreciation/ Depreciation |
Number
of Shares Held at 6/30/21 |
Value
at 6/30/21 |
Dividend
Income | |||||||||
|
State Street Institutional U.S. Government Money Market Fund, Class G
Shares |
11,345 | $ 11,345 | $ 3,046,762 | $ 2,635,829 | $ — | $ — | 422,278 | $ 422,278 | $ 137 | ||||||||
|
State Street Navigator Securities Lending Portfolio
II |
4,445,869 | 4,445,869 | 785,734,715 | 740,701,780 | — | — | 49,478,804 | 49,478,804 | 25,211 | ||||||||
|
The Communication Services Select Sector SPDR Fund
|
164,031 | 8,864,235 | 67,203,985 | 68,723,881 | 3,706,001 | 1,118,398 | 150,287 | 12,168,738 | 109,364 | ||||||||
|
The Consumer Discretionary Select Sector SPDR
Fund |
— | — | 55,475,990 | 58,528,345 | 3,052,355 | — | — | — | 79,889 | ||||||||
|
The Consumer Staples Select Sector SPDR
Fund |
29,312 | 1,718,856 | 36,226,229 | 34,245,499 | 1,093,058 | (73,517) | 67,445 | 4,719,127 | 308,461 | ||||||||
|
The Energy Select Sector SPDR
Fund |
48,903 | 1,850,978 | 11,822,211 | 8,278,910 | 161,675 | (164,429) | 100,084 | 5,391,525 | 80,818 | ||||||||
|
The Financial Select Sector SPDR
Fund |
476,814 | 11,033,476 | 38,269,748 | 30,345,553 | 82,330 | 2,951,948 | 599,399 | 21,991,949 | 180,249 | ||||||||
|
The Health Care Select Sector SPDR
Fund |
174,726 | 17,484,831 | 21,873,013 | 40,229,961 | 1,660,385 | (788,268) | — | — | — | ||||||||
|
The Industrial Select Sector SPDR
Fund |
— | — | 48,539,135 | 22,979,724 | 2,679,806 | (97,854) | 274,818 | 28,141,363 | 130,621 | ||||||||
|
The Materials Select Sector SPDR
Fund |
— | — | 44,741,547 | 16,739,561 | 1,111,795 | (171,198) | 351,629 | 28,942,583 | 240,457 | ||||||||
|
The Technology Select Sector SPDR
Fund |
249,472 | 26,067,329 | 84,344,217 | 50,289,156 | 7,553,789 | 5,006,651 | 492,231 | 72,682,830 | 330,110 | ||||||||
|
The Utilities Select Sector SPDR
Fund |
28,492 | 1,607,804 | 39,080 | 1,670,440 | 17,223 | 6,333 | — | — | — | ||||||||
|
Total |
$73,084,723 | $1,197,316,632 | $1,075,368,639 | $21,118,417 | $7,788,064 | $223,939,197 | $1,485,317 |
| SPDR SSGA Fixed Income Sector Rotation ETF | SPDR SSGA US Sector Rotation ETF | ||
| ASSETS | |||
|
Investments in affiliated issuers, at
value* |
$107,613,545 | $223,939,197 | |
|
Receivable for fund shares
sold |
54 | — | |
|
Dividends receivable — affiliated
issuers |
3 | 6 | |
|
Securities lending income receivable — unaffiliated
issuers |
384 | 411 | |
|
Securities lending income receivable — affiliated
issuers |
6,726 | 5,109 | |
|
Receivable from
Adviser |
10,409 | 17,727 | |
|
TOTAL ASSETS
|
107,631,121 | 223,962,450 | |
| LIABILITIES | |||
|
Payable upon return of securities
loaned |
24,628,973 | 49,478,804 | |
|
Payable for fund shares
repurchased |
— | 19 | |
|
Advisory fee
payable |
28,295 | 88,012 | |
|
Trustees’ fees and expenses
payable |
9 | — | |
|
TOTAL LIABILITIES
|
24,657,277 | 49,566,835 | |
|
NET ASSETS
|
$ 82,973,844 | $174,395,615 | |
| NET ASSETS CONSIST OF: | |||
|
Paid-in
Capital |
$ 83,406,646 | $158,155,243 | |
|
Total distributable earnings
(loss) |
(432,802) | 16,240,372 | |
|
NET ASSETS
|
$ 82,973,844 | $174,395,615 | |
| NET ASSET VALUE PER SHARE | |||
|
Net asset value per
share |
$ 31.31 | $ 44.38 | |
|
Shares outstanding (unlimited amount authorized, no par
value) |
2,650,000 | 3,930,000 | |
| COST OF INVESTMENTS: | |||
|
Investments in affiliated
issuers |
$107,436,263 | $212,755,274 | |
|
* Includes investments in securities on loan, at
value |
$ 26,667,803 | $ 60,264,358 |
| SPDR SSGA Fixed Income Sector Rotation ETF | SPDR SSGA US Sector Rotation ETF | ||
| INVESTMENT INCOME | |||
|
Dividend income — affiliated
issuers |
$ 1,300,998 | $ 1,460,106 | |
|
Unaffiliated securities lending
income |
21,396 | 14,373 | |
|
Affiliated securities lending
income |
91,988 | 25,211 | |
|
TOTAL INVESTMENT INCOME
(LOSS) |
1,414,382 | 1,499,690 | |
| EXPENSES | |||
|
Advisory
fee |
232,271 | 548,060 | |
|
Trustees’ fees and
expenses |
1,012 | 1,427 | |
|
Miscellaneous
expenses |
113 | — | |
|
TOTAL
EXPENSES |
233,396 | 549,487 | |
|
NET INVESTMENT INCOME
(LOSS) |
$ 1,180,986 | $ 950,203 | |
| REALIZED AND UNREALIZED GAIN (LOSS) | |||
| Net realized gain (loss) on: | |||
|
Investments — affiliated
issuers |
(483,189) | 10,488,293 | |
|
In-kind redemptions — affiliated
issuers |
601,242 | 10,630,124 | |
|
Net realized gain
(loss) |
118,053 | 21,118,417 | |
| Net change in unrealized appreciation/depreciation on: | |||
|
Investments — affiliated
issuers |
(1,118,319) | 7,788,064 | |
|
NET REALIZED AND UNREALIZED GAIN
(LOSS) |
(1,000,266) | 28,906,481 | |
|
NET INCREASE (DECREASE) IN NET ASSETS FROM
OPERATIONS |
$ 180,720 | $29,856,684 |
| SPDR SSGA Fixed Income Sector Rotation ETF | SPDR SSGA US Sector Rotation ETF | ||||||
| Year
Ended 6/30/21 |
Year
Ended 6/30/20 |
Year
Ended 6/30/21 |
Year
Ended 6/30/20 | ||||
| INCREASE (DECREASE) IN NET ASSETS FROM OPERATIONS: | |||||||
|
Net investment income
(loss) |
$ 1,180,986 | $ 668,251 | $ 950,203 | $ 664,440 | |||
|
Net realized gain
(loss) |
118,053 | (73,337) | 21,118,417 | (1,166,789) | |||
|
Net change in unrealized
appreciation/depreciation |
(1,118,319) | 985,859 | 7,788,064 | 3,040,370 | |||
|
Net increase (decrease) in net assets resulting from
operations |
180,720 | 1,580,773 | 29,856,684 | 2,538,021 | |||
|
Net equalization credits and
charges |
(305,734) | (143,677) | (102,983) | 34,502 | |||
|
Distributions to
shareholders |
(1,399,502) | (785,178) | (1,087,675) | (704,061) | |||
| FROM BENEFICIAL INTEREST TRANSACTIONS: | |||||||
|
Proceeds from shares
sold |
55,227,077 | 37,162,072 | 131,380,293 | 62,332,050 | |||
|
Cost of shares
redeemed |
(18,048,847) | (1,820,074) | (54,370,975) | (9,684,741) | |||
|
Net income
equalization |
305,734 | 143,677 | 102,983 | (34,502) | |||
|
Net increase (decrease) in net assets from beneficial interest
transactions |
37,483,964 | 35,485,675 | 77,112,301 | 52,612,807 | |||
|
Net increase (decrease) in net assets during the
period |
35,959,448 | 36,137,593 | 105,778,327 | 54,481,269 | |||
|
Net assets at beginning of
period |
47,014,396 | 10,876,803 | 68,617,288 | 14,136,019 | |||
|
NET ASSETS AT END OF
PERIOD |
$ 82,973,844 | $47,014,396 | $174,395,615 | $68,617,288 | |||
| SHARES OF BENEFICIAL INTEREST: | |||||||
|
Shares
sold |
1,750,000 | 1,180,000 | 3,220,000 | 1,940,000 | |||
|
Shares
redeemed |
(570,000) | (60,000) | (1,380,000) | (310,000) | |||
|
Net increase (decrease) from share
transactions |
1,180,000 | 1,120,000 | 1,840,000 | 1,630,000 | |||
| SPDR SSGA Fixed Income Sector Rotation ETF | |||||
| Year
Ended 6/30/21 |
Year
Ended 6/30/20 |
For
the Period 4/3/2019*- 6/30/19 | |||
|
Net asset value, beginning of
period |
$ 31.98 | $ 31.08 | $ 30.10 | ||
| Income (loss) from investment operations: | |||||
|
Net investment income (loss)
(a) |
0.63 | 0.81 | 0.15 | ||
|
Net realized and unrealized gain (loss)
(b) |
(0.37) | 1.31 | 0.99 | ||
|
Total from investment
operations |
0.26 | 2.12 | 1.14 | ||
|
Net equalization credits and charges
(a) |
(0.16) | (0.17) | 0.00(c) | ||
| Distributions to shareholders from: | |||||
|
Net investment
income |
(0.77) | (1.05) | (0.16) | ||
|
Net asset value, end of
period |
$ 31.31 | $ 31.98 | $ 31.08 | ||
|
Total return
(d) |
0.29% | 6.42% | 3.81% | ||
| Ratios and Supplemental Data: | |||||
|
Net assets, end of period (in
000s) |
$82,974 | $47,014 | $10,877 | ||
| Ratios to average net assets: | |||||
|
Total expenses
(e) |
0.39% | 0.31% | 0.31%(f) | ||
|
Net investment income
(loss) |
1.99% | 2.57% | 1.98%(f) | ||
|
Portfolio turnover rate
(g) |
79% | 150% | 32%(h) | ||
| * | Commencement of operations. |
| (a) | Per share numbers have been calculated using average shares outstanding, which more appropriately presents the per share data for the period. |
| (b) | Amounts shown in this caption for a share outstanding may not accord with the change in aggregate gains and losses in securities for the fiscal period because of the timing of sales and repurchases of Fund shares in relation to fluctuating market values for the Fund. |
| (c) | Amount is less than $0.005 per share. |
| (d) | Total return is calculated assuming a purchase of shares at net asset value on the first day and a sale at net asset value on the last day of each period reported. Distributions are assumed, for the purpose of this calculation, to be reinvested at net asset value per share on the respective payment dates of each distribution. Total returns for periods of less than one year are not annualized. Broker commission charges are not included in this calculation. |
| (e) | Does not include expenses of the Underlying Funds in which the Fund invests. |
| (f) | Annualized. |
| (g) | Portfolio turnover rate excludes securities received or delivered from in-kind processing of creations or redemptions. |
| (h) | Not annualized. |
| SPDR SSGA US Sector Rotation ETF | |||||
| Year
Ended 6/30/21 |
Year
Ended 6/30/20 |
For
the Period 4/3/2019*- 6/30/19 | |||
|
Net asset value, beginning of
period |
$ 32.83 | $ 30.73 | $ 30.09 | ||
| Income (loss) from investment operations: | |||||
|
Net investment income (loss)
(a) |
0.36 | 0.57 | 0.23 | ||
|
Net realized and unrealized gain (loss)
(b) |
11.62 | 1.98 | 0.55 | ||
|
Total from investment
operations |
11.98 | 2.55 | 0.78 | ||
|
Net equalization credits and charges
(a) |
(0.04) | 0.03 | (0.03) | ||
| Distributions to shareholders from: | |||||
|
Net investment
income |
(0.39) | (0.48) | (0.11) | ||
|
Net asset value, end of
period |
$ 44.38 | $ 32.83 | $ 30.73 | ||
|
Total return
(c) |
36.48% | 8.52% | 2.50% | ||
| Ratios and Supplemental Data: | |||||
|
Net assets, end of period (in
000s) |
$174,396 | $68,617 | $14,136 | ||
| Ratios to average net assets: | |||||
|
Total expenses
(d) |
0.52% | 0.49% | 0.49%(e) | ||
|
Net investment income
(loss) |
0.89% | 1.79% | 3.12%(e) | ||
|
Portfolio turnover rate
(f) |
263% | 154% | 39%(g) | ||
| * | Commencement of operations. |
| (a) | Per share numbers have been calculated using average shares outstanding, which more appropriately presents the per share data for the period. |
| (b) | Amounts shown in this caption for a share outstanding may not accord with the change in aggregate gains and losses in securities for the fiscal period because of the timing of sales and repurchases of Fund shares in relation to fluctuating market values for the Fund. |
| (c) | Total return is calculated assuming a purchase of Units at net asset value per Unit on the first day and a sale at net asset value per Unit on the last day of each period reported. Distributions are assumed, for the purposes of this calculation, to be reinvested at the net asset value per Unit on the respective payment dates of the Trust. Broker commission charges are not included in this calculation. |
| (d) | Does not include expenses of the Underlying Funds in which the Fund invests. |
| (e) | Annualized. |
| (f) | Portfolio turnover rate excludes securities received or delivered from in-kind processing of creations or redemptions. |
| (g) | Not annualized. |
| SPDR SSGA Fixed Income Sector Rotation ETF |
| SPDR SSGA US Sector Rotation ETF |
| Annual Rate | |
|
SPDR SSGA Fixed Income Sector Rotation
ETF |
0.50% |
|
SPDR SSGA US Sector Rotation
ETF |
0.70 |
| Purchases | Sales | ||
|
SPDR SSGA Fixed Income Sector Rotation
ETF |
$ 47,759,866 | $ 47,016,793 | |
|
SPDR SSGA US Sector Rotation
ETF |
281,257,845 | 281,588,516 |
| In-kind
Contributions |
In-kind
Redemptions |
In-kind
Net Realized Gains/(Losses) | |||
|
SPDR SSGA Fixed Income Sector Rotation
ETF |
$ 55,221,982 | $18,047,095 | $ 601,242 | ||
|
SPDR SSGA US Sector Rotation
ETF |
127,277,309 | 50,442,513 | 10,630,124 |
| Ordinary
Income |
Long-Term
Capital Gains |
Total | |||
|
SPDR SSGA Fixed Income Sector Rotation
ETF |
$1,399,502 | $— | $1,399,502 | ||
|
SPDR SSGA US Sector Rotation
ETF |
1,087,675 | — | 1,087,675 |
| Ordinary
Income |
Long-Term
Capital Gains |
Total | |||
|
SPDR SSGA Fixed Income Sector Rotation
ETF |
$ 785,178 | $ — | $ 785,178 | ||
|
SPDR SSGA US Sector Rotation
ETF |
704,061 | — | 704,061 |
| Undistributed
Ordinary Income |
Capital
Loss Carryforwards |
Undistributed
Long-Term Capital Gains |
Net
Unrealized Gains (Losses) |
Qualified
Late-Year Losses |
Total | ||||||
|
SPDR SSGA Fixed Income Sector Rotation
ETF |
$ — | $— | $— | $ 137,022 | $(569,824) | $ (432,802) | |||||
|
SPDR SSGA US Sector Rotation
ETF |
5,107,960 | — | — | 11,132,412 | — | 16,240,372 |
| Tax
Cost |
Gross
Unrealized Appreciation |
Gross
Unrealized Depreciation |
Net
Unrealized Appreciation (Depreciation) | ||||
|
SPDR SSGA Fixed Income Sector Rotation
ETF |
$107,476,523 | $ 494,205 | $357,183 | $ 137,022 | |||
|
SPDR SSGA US Sector Rotation
ETF |
212,806,785 | 11,643,327 | 510,915 | 11,132,412 |
| Fund | Market
Value of Securities on Loan |
Cash
Collateral Received |
Non-Cash
Collateral Received* |
Total
Collateral Received | ||||
|
SPDR SSGA Fixed Income Sector Rotation
ETF |
$ 26,667,803 | $ 24,628,973 | $ 2,650,278 | $ 27,279,251 | ||||
|
SPDR SSGA US Sector Rotation
ETF |
60,264,358 | 49,478,804 | 11,771,444 | 61,250,248 |
| * | The non-cash collateral includes U.S. Treasuries and U.S. Government Agency securities. |
| Remaining
Contractual Maturity of the Agreements as of June 30, 2021 | ||||||||||||||
| Fund | Securities
Lending Transactions |
Overnight
and Continuous |
<30 Days | Between
30 & 90 Days |
>90 Days | Total
Borrowings |
Gross
Amount of Recognized Liabilities for Securities Lending Transactions | |||||||
|
SPDR SSGA Fixed Income Sector Rotation
ETF |
Mutual Funds and Exchange Traded Products | $24,628,973 | $— | $— | $— | $24,628,973 | $24,628,973 | |||||||
|
SPDR SSGA US Sector Rotation
ETF |
Mutual Funds and Exchange Traded Products | 49,478,804 | — | — | — | 49,478,804 | 49,478,804 | |||||||

August 30, 2021
| SPDR SSGA Fixed Income Sector Rotation ETF | SPDR SSGA US Sector Rotation ETF | ||
|
Annualized Expense
Ratio |
0.38% | 0.52% | |
| Actual: | |||
|
Ending Account
Value |
$ 981.50 | $1,104.70 | |
|
Expenses Paid During
Period |
1.87 | 2.71 | |
| Hypothetical (assuming a 5% return before expenses): | |||
|
Ending Account
Value |
1,022.90 | 1,022.20 | |
|
Expenses Paid During
Period(a) |
1.91 | 2.61 |
| (a) | Expenses are equal to the Fund's annualized net expense ratio multiplied by the average account value of the period, multiplied by 181, then divided by 365. |
| Amount | |
|
SPDR SSGA Fixed Income Sector Rotation
ETF |
$ 142 |
|
SPDR SSGA US Sector Rotation
ETF |
360,780 |
| Name,
Address and Year of Birth |
Position(s)
with Funds |
Term
of Office and Length of Time Served |
Principal
Occupation(s) During Past 5 Years |
Number
of Portfolios in Fund Complex Overseen by Trustee† |
Other
Directorships Held by Trustee During the Past 5 Years | |||||
| Trustees | ||||||||||
| Independent Trustees | ||||||||||
| DWIGHT
D. CHURCHILL c/o SSGA Active Trust One Iron Street Boston, MA 02210 1953 |
Independent
Trustee, Audit Committee Chair |
Term:
Unlimited Served: since March 2011 |
Self-employed
consultant since 2010; CEO and President, CFA Institute (June 2014 - January 2015). |
126 | Affiliated Managers Group, Inc. (Chairman, Director and Audit Committee Chair). | |||||
| CLARE
S. RICHER c/o SSGA Active Trust One Iron Street Boston, MA 02210 1958 |
Independent
Trustee |
Term:
Unlimited Served: since July 2018 |
Retired.
Chief Financial Officer, Putnam Investments LLC (December 2008 - May 2017). |
126 | Principal
Financial Group (Director); Bain Capital Specialty Finance (Director); Putnam Acquisition Financing Inc. (Director); Putnam Acquisition Financing LLC (Director); Putnam GP Inc. (Director); Putnam Investor Services, Inc. (Director); University of Notre Dame (Trustee). |
| Name,
Address and Year of Birth |
Position(s)
with Funds |
Term
of Office and Length of Time Served |
Principal
Occupation(s) During Past 5 Years |
Number
of Portfolios in Fund Complex Overseen by Trustee† |
Other
Directorships Held by Trustee During the Past 5 Years | |||||
| SANDRA
G. SPONEM c/o SSGA Active Trust One Iron Street Boston, MA 02210 1958 |
Independent
Trustee |
Term:
Unlimited Served: since July 2018 |
Retired.
Chief Financial Officer, M.A. Mortenson Companies, Inc. (February 2007- April 2017). |
126 | Rydex
Series Funds (Trustee); Rydex Dynamic Funds (Trustee); Rydex Variable Trust (Trustee); Guggenheim Funds Trust (Trustee); Guggenheim Variable Funds Trust (Trustee); Guggenheim Strategy Funds Trust (Trustee); Transparent Value Trust (Trustee); Fiduciary/Claymore Energy Infrastructure Fund (Trustee); Guggenheim Taxable Municipal Managed Duration Trust (Trustee); Guggenheim Strategic Opportunities Fund (Trustee); Guggenheim Enhanced, Equity Income Fund (Trustee); Guggenheim Credit Allocation Fund (Trustee); Guggenheim Energy & Income Fund (Trustee). | |||||
| CARL
G. VERBONCOEUR c/o SSGA Active Trust One Iron Street Boston, MA 02210 1952 |
Independent
Trustee, Trustee Committee Chair |
Term:
Unlimited Served: since March 2011 |
Self-employed
consultant since 2009. |
126 | The
Motley Fool Funds Trust (Trustee). |
| Name,
Address and Year of Birth |
Position(s)
with Funds |
Term
of Office and Length of Time Served |
Principal
Occupation(s) During Past 5 Years |
Number
of Portfolios in Fund Complex Overseen by Trustee† |
Other
Directorships Held by Trustee During the Past 5 Years | |||||
| Interested Trustee | ||||||||||
| JAMES
E. ROSS* c/o SSGA Active Trust One Iron Street Boston, MA 02210 1965 |
Interested
Trustee |
Term:
Unlimited Served as Trustee: since March 2011 |
Non-Executive
Chairman, Fusion Acquisition Corp. (June 2020 - Present); Retired Chairman and Director, SSGA Funds Management, Inc. (2005 - March 2020); Retired Executive Vice President, State Street Global Advisors (2012 - March 2020); Retired Chief Executive Officer and Manager, State Street Global Advisors Funds Distributors, LLC (May 2017 - March 2020); Director, State Street Global Markets, LLC (2013 - April 2017); President, SSGA Funds Management, Inc. (2005 - 2012); Principal, State Street Global Advisors (2000 - 2005). |
137 | SSGA SPDR
ETFs Europe I plc (Director) (November 2016 - March 2020); SSGA SPDR ETFs Europe II plc (Director) (November 2016 - March 2020); State Street Navigator Securities Lending Trust (July 2016 - March 2020); SSGA Funds (January 2014 - March 2020); State Street Institutional Investment Trust (February 2007 - March 2020); State Street Master Funds (February 2007 - March 2020); Elfun Funds (July 2016 - December 2018). | |||||
| † For the purpose of determining the number of portfolios overseen by the Trustees, “Fund Complex” comprises registered investment companies for which SSGA Funds Management, Inc. serves as investment adviser. | ||||||||||
| * Mr. Ross is an Interested Trustee because of his former position with the Adviser and ownership interest in an affiliate of the Adviser. | ||||||||||
| Name,
Address and Year of Birth |
Position(s)
with Funds |
Term
of Office and Length of Time Served |
Principal Occupation(s) During the Past 5 Years | |||
| Officers | ||||||
| ELLEN
M. NEEDHAM SSGA Funds Management, Inc. One Iron Street Boston, MA 02210 1967 |
President | Term:
Unlimited Served: since October 2012 |
Chairman, SSGA Funds Management, Inc. (March 2020 - present)*; President and Director, SSGA Funds Management, Inc. (2001 - present)*; Senior Managing Director, State Street Global Advisors (1992 - present)*; Manager, State Street Global Advisors Funds Distributors, LLC (May 2017 - present). | |||
| BRUCE
S. ROSENBERG SSGA Funds Management, Inc. One Iron Street Boston, MA 02210 1961 |
Treasurer | Term:
Unlimited Served: since February 2016 |
Managing Director, State Street Global Advisors and SSGA Funds Management, Inc. (July 2015 - present); Director, Credit Suisse (April 2008 - July 2015). | |||
| ANN
M. CARPENTER SSGA Funds Management, Inc. One Iron Street Boston, MA 02210 1966 |
Vice
President; Deputy Treasurer |
Term:
Unlimited Served: since August 2012 (with respect to Vice President); Unlimited Served: since February 2016 (with respect to Deputy Treasurer) |
Chief Operating Officer, SSGA Funds Management, Inc. (April 2005 - Present)*; Managing Director, State Street Global Advisors (April 2005 - present).* | |||
| MICHAEL
P. RILEY SSGA Funds Management, Inc. One Iron Street Boston, MA 02210 1969 |
Vice
President |
Term:
Unlimited Served: since March 2011 |
Managing Director, State Street Global Advisors (2005 - present).* | |||
| SEAN
O’MALLEY SSGA Funds Management, Inc. One Iron Street Boston, MA 02210 1969 |
Chief
Legal Officer |
Term:
Unlimited Served: since August 2019 |
Senior Vice President and Deputy General Counsel, State Street Global Advisors (November 2013 -present). | |||
| DAVID
URMAN SSGA Funds Management, Inc. One Iron Street Boston, MA 02210 1985 |
Assistant
Secretary |
Term:
Unlimited Served: since August 2019 |
Vice President and Senior Counsel, State Street Global Advisors (April 2019 - present); Vice President and Counsel, State Street Global Advisors (August 2015 - April 2019); Associate, Ropes & Gray LLP (November 2012 - August 2015). |
| Name,
Address and Year of Birth |
Position(s)
with Funds |
Term
of Office and Length of Time Served |
Principal Occupation(s) During the Past 5 Years | |||
| DAVID
BARR SSGA Funds Management, Inc. One Iron Street Boston, MA 02210 1974 |
Assistant
Secretary |
Term:
Unlimited Served: since November 2020 |
Vice President and Senior Counsel, State Street Global Advisors (October 2019 - present); Vice President and Counsel, Eaton Vance Corp. (2010 - 2019). | |||
| CHAD
C. HALLETT SSGA Funds Management, Inc. One Iron Street Boston, MA 02210 1969 |
Deputy
Treasurer |
Term:
Unlimited Served: since February 2016 |
Vice President, State Street Global Advisors and SSGA Funds Management, Inc. (November 2014 - present); Vice President, State Street Bank and Trust Company (2001 - November 2014).* | |||
| DARLENE
ANDERSON-VASQUEZ SSGA Funds Management, Inc. One Iron Street Boston, MA 02210 1968 |
Deputy
Treasurer |
Term:
Unlimited Served: since November 2016 |
Managing Director, State Street Global Advisors and SSGA Funds Management, Inc. (May 2016 - present); Senior Vice President, John Hancock Investments (September 2007 - May 2016). | |||
| ARTHUR
A. JENSEN SSGA Funds Management, Inc. 1600 Summer Street Stamford, CT 06905 1966 |
Deputy
Treasurer |
Term:
Unlimited Served: Since August 2017 |
Vice President, State Street Global Advisors and SSGA Funds Management, Inc. (July 2016 - present); Mutual Funds Controller of GE Asset Management Incorporated (April 2011 - July 2016). | |||
| DAVID
LANCASTER SSGA Funds Management, Inc. One Iron Street Boston, MA 02210 1971 |
Assistant
Treasurer |
Term:
Unlimited Served: since November 2020 |
Vice President, State Street Global Advisors and SSGA Funds Management, Inc. (July 2017 - present); Assistant Vice President, State Street Bank and Trust Company (November 2011 - July 2017). | |||
| BRIAN
HARRIS SSGA Funds Management, Inc. One Iron Street Boston, MA 02210 1973 |
Chief
Compliance Officer; Anti-Money Laundering Officer; Code of Ethics Compliance Officer |
Term:
Unlimited Served: since November 2013 |
Managing Director, State Street Global Advisors and SSGA Funds Management, Inc. (June 2013 - present)*; Senior Vice President and Global Head of Investment Compliance, BofA Global Capital Management (2010 - 2013); Director of Compliance, AARP Financial Inc. (2008 - 2010). | |||
| * Served in various capacities and/or with various affiliated entities during noted time period. | ||||||
| The Statement of Additional Information (SAI) includes additional information about the Funds' trustees and is available, without charge, upon request and by calling 1-866-787-2257. | ||||||
| SPDR DoubleLine Emerging Markets Fixed Income ETF |
| SPDR DoubleLine Short Duration Total Return Tactical ETF |
| SPDR DoubleLine Total Return Tactical ETF |

|
|
1 |
| Management's Discussion of Fund Performance, Performance Summaries and Portfolio Statistics (Unaudited) | |
|
|
2 |
|
|
5 |
|
|
8 |
| Schedules of Investments | |
|
|
12 |
|
|
22 |
|
|
50 |
|
|
123 |
|
|
130 |
|
|
133 |
|
|
147 |
|
|
149 |
| • | Emerging market sovereign and corporate external bonds posted positive performance in the 12-month period ended June 30, 2021 against a backdrop of a nascent global economic recovery supported by significant fiscal and monetary policy responses by governments and central banks in developed and emerging markets to the severe shock to global growth and commodity prices induced by the COVID-19 pandemic outbreak. |
| • | The JPMorgan CEMBI Broad Diversified Index’s positive return in the 12-month period was driven by significant spread performance, with the spread over U.S Treasuries narrowing by 143 bps to 296 bps, and offsetting the impact of higher Treasury yields. |
| • | All regions across the corporate index posted positive returns. Africa was the best performing region, while Asia had the least positive return. |
| • | The U.S. Treasury curve steepened over the 12-month period. 2 year UST yields rose 10 bps over the 12-month period to end at 0.25%, while 10 year U.S. Treasury yields rose 81 bps over the 12-month period to end at 1.47%. |
| Cumulative Total Return | Average Annual Total Return | ||||||
| Net
Asset Value |
Market
Value |
JP Morgan Corporate Emerging Markets Bond Index Broad Diversified | Net
Asset Value |
Market
Value |
JP Morgan Corporate Emerging Markets Bond Index Broad Diversified | ||
| ONE YEAR | 7.09% | 7.06% | 8.67% | 7.09% | 7.06% | 8.67% | |
| FIVE YEARS | 25.94% | 27.07% | 32.52% | 4.72% | 4.91% | 5.79% | |
| SINCE INCEPTION(1) | 30.41% | 30.46% | 36.48% | 5.22% | 5.23% | 6.15% | |
| (1) | For the period April 13, 2016 to June 30, 2021. |
(Based on Net Asset Value)
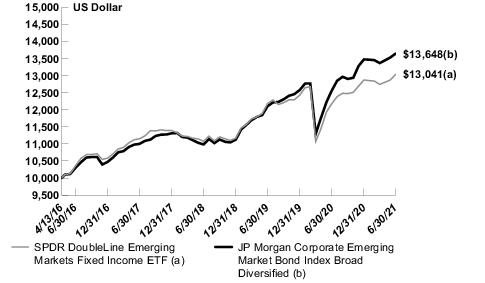
| Description | % of Net Assets | ||
| Panama
Government International Bond 3.87% 7/23/2060 |
2.2% | ||
| Chile
Electricity PEC SpA Zero Coupon, 1/25/2028 |
1.9 | ||
| Saudi
Government International Bond 3.45% 2/2/2061 |
1.9 | ||
| Galaxy
Pipeline Assets Bidco, Ltd. 2.16% 3/31/2034 |
1.8 | ||
| Minejesa
Capital B.V. 5.63% 8/10/2037 |
1.8 | ||
| TOTAL | 9.6% |
| % of Net Assets | |||
| Corporate Bonds & Notes | 66.4% | ||
| Foreign Government Obligations | 31.5 | ||
| Short-Term Investment | 2.1 | ||
| Liabilities in Excess of Other Assets | (0.0) * | ||
| TOTAL | 100.0% |
| * | Amount shown represents less than 0.05% of net assets. |
| Cumulative Total Return | Average Annual Total Return | ||||||
| Net
Asset Value |
Market
Value |
Bloomberg Barclays U.S. Aggregate 1-3 Year Index | Net
Asset Value |
Market
Value |
Bloomberg Barclays U.S. Aggregate 1-3 Year Index | ||
| ONE YEAR | 1.70% | 1.79% | 0.36% | 1.70% | 1.79% | 0.36% | |
| FIVE YEARS | 10.23% | 10.07% | 9.50% | 1.97% | 1.94% | 1.83% | |
| SINCE INCEPTION(1) | 11.38% | 11.52% | 10.19% | 2.09% | 2.11% | 1.88% | |
| (1) | For the period April 13, 2016 to June 30, 2021. |
(Based on Net Asset Value)
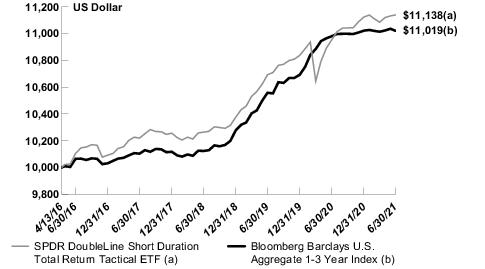
| Description | % of Net Assets | ||
| U.S.
Treasury Note 2.75% 9/15/2021 |
5.7% | ||
| Federal
Home Loan Mortgage Corp. 1.50% 3/1/2036 |
4.9 | ||
| U.S.
Treasury Bill 0.07% 3/24/2022 |
3.7 | ||
| U.S.
Treasury Note 1.63% 4/30/2023 |
3.4 | ||
| U.S.
Treasury Bill 0.07% 8/5/2021 |
3.4 | ||
| TOTAL | 21.1% |
| % of Net Assets | |||
| Corporate Bonds & Notes | 27.1% | ||
| U.S. Government Agency Obligations | 25.4 | ||
| U.S. Treasury Obligations | 21.0 | ||
| Asset-Backed Securities | 11.2 | ||
| Mortgage-Backed Securities | 6.4 | ||
| Foreign Government Obligations | 1.6 | ||
| Commercial Mortgage Backed Securities | 1.2 | ||
| Short-Term Investment | 9.1 | ||
| Liabilities in Excess of Other Assets | (3.0) | ||
| TOTAL | 100.0% |
| Cumulative Total Return | Average Annual Total Return | ||||||
| Net
Asset Value |
Market
Value |
Bloomberg Barclays U.S. Aggregate Bond Index | Net
Asset Value |
Market
Value |
Bloomberg Barclays U.S. Aggregate Bond Index | ||
| ONE YEAR | 0.81% | 0.48% | (0.33)% | 0.81% | 0.48% | (0.33)% | |
| FIVE YEARS | 13.63% | 13.42% | 16.08% | 2.59% | 2.55% | 3.03% | |
| SINCE INCEPTION(1) | 17.81% | 17.72% | 21.93% | 2.61% | 2.60% | 3.17% | |
| (1) | For the period February 23, 2015 to June 30, 2021. |
(Based on Net Asset Value)
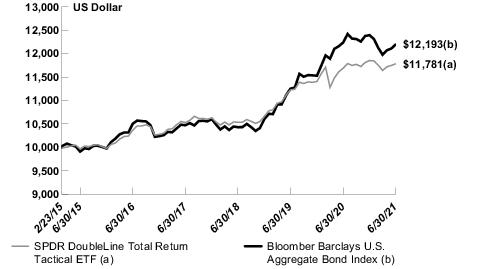
| Description | % of Net Assets | ||
| Treasury
Notes 0.25% 6/15/2024 |
3.6% | ||
| Treasury
Notes 0.13% 1/15/2024 |
3.5 | ||
| Treasury
Notes 2.25% 11/15/2025 |
2.8 | ||
| Treasury
Notes 0.38% 11/30/2025 |
2.3 | ||
| Treasury
Notes 1.25% 6/30/2028 |
2.0 | ||
| TOTAL | 14.2% |
| % of Net Assets | |||
| U.S. Government Agency Obligations | 35.2% | ||
| U.S. Treasury Obligations | 24.6 | ||
| Mortgage-Backed Securities | 8.0 | ||
| Asset-Backed Securities | 6.2 | ||
| Commercial Mortgage Backed Securities | 4.9 | ||
| Foreign Government Obligations | 1.7 | ||
| Banks | 2.4 | ||
| Electric | 1.3 | ||
| Oil & Gas | 0.9 | ||
| Telecommunications | 0.9 | ||
| Software | 0.9 | ||
| Pipelines | 0.9 | ||
| Diversified Financial Services | 0.7 | ||
| Health Care Services | 0.7 | ||
| Insurance | 0.7 | ||
| Pharmaceuticals | 0.6 | ||
| Food | 0.6 | ||
| Retail | 0.5 | ||
| Real Estate Investment Trusts | 0.5 | ||
| Internet | 0.4 | ||
| Transportation | 0.4 | ||
| Media | 0.3 | ||
| Commercial Services | 0.3 | ||
| Chemicals | 0.3 | ||
| Entertainment | 0.3 | ||
| Packaging & Containers | 0.3 | ||
| Computers | 0.3 | ||
| Auto Manufacturers | 0.2 | ||
| Lodging | 0.2 | ||
| Mining | 0.2 | ||
| Aerospace & Defense | 0.2 | ||
| Miscellaneous Manufacturer | 0.2 | ||
| Electronics | 0.2 | ||
| Beverages | 0.2 |
| % of Net Assets | |||
| Building Materials | 0.2% | ||
| Biotechnology | 0.2 | ||
| IT Services | 0.2 | ||
| Agriculture | 0.2 | ||
| Oil & Gas Services | 0.2 | ||
| Energy-Alternate Sources | 0.1 | ||
| Iron/Steel | 0.1 | ||
| Leisure Time | 0.1 | ||
| Airlines | 0.1 | ||
| Machinery-Diversified | 0.1 | ||
| Household Products & Wares | 0.1 | ||
| Advertising | 0.1 | ||
| Forest Products & Paper | 0.1 | ||
| Semiconductors | 0.1 | ||
| Water | 0.1 | ||
| Auto Parts & Equipment | 0.0* | ||
| Environmental Control | 0.0* | ||
| Health Care Products | 0.0* | ||
| Distribution & Wholesale | 0.0* | ||
| Home Builders | 0.0* | ||
| Investment Company Security | 0.0* | ||
| Coal | 0.0* | ||
| Construction Materials | 0.0* | ||
| Real Estate | 0.0* | ||
| Home Furnishings | 0.0* | ||
| Metal Fabricate & Hardware | 0.0* | ||
| Engineering & Construction | 0.0* | ||
| Cosmetics/Personal Care | 0.0* | ||
| Apparel | 0.0* | ||
| Food Service | 0.0* | ||
| Housewares | 0.0* | ||
| Household Products | 0.0* | ||
| Trucking & Leasing | 0.0* | ||
| Toys/Games/Hobbies | 0.0* | ||
| Gas | 0.0* | ||
| Machinery, Construction & Mining | 0.0* | ||
| Hand & Machine Tools | 0.0* | ||
| Short-Term Investment | 2.0 | ||
| Liabilities in Excess of Other Assets | (0.2) | ||
| TOTAL | 100.0% |
| * | Amount shown represents less than 0.05% of net assets. |
| Security Description | Principal
Amount |
Value | ||||
| CORPORATE BONDS & NOTES — 66.4% | ||||||
| ARGENTINA — 0.7% | ||||||
|
Banco Macro SA Series REGS, USD 5 Year Swap Rate + 5.46%, 6.75%, 11/4/2026
(a) |
$ 550,000 | $ 457,556 | ||||
|
Pampa Energia SA Series REGS, 7.50%,
1/24/2027 |
450,000 | 405,662 | ||||
| 863,218 | ||||||
| BRAZIL — 4.3% | ||||||
| Banco do Estado do Rio Grande do Sul SA: | ||||||
|
5 year CMT + 4.93%, 5.38%, 1/28/2031
(a)(b) |
200,000 | 204,534 | ||||
|
Series REGS, 5 year CMT + 4.93%, 5.38%, 1/28/2031
(a) |
200,000 | 204,534 | ||||
|
Braskem Netherlands Finance BV 5 year CMT + 8.22%, 8.50%, 1/23/2081
(a)(b) |
600,000 | 700,326 | ||||
|
CSN Islands XII Corp. Series REGS, 7.00%,
9/23/2021 |
700,000 | 705,894 | ||||
|
Itau Unibanco Holding SA Series REGS, 5 year CMT + 3.22%, 4.63%, 2/27/2025
(a) |
1,000,000 | 962,610 | ||||
| Petrobras Global Finance B.V.: | ||||||
|
5.50%,
6/10/2051 |
1,100,000 | 1,100,165 | ||||
|
6.75%,
6/3/2050 |
1,000,000 | 1,167,500 | ||||
|
Suzano Austria GmbH 3.13%, 1/15/2032
(c) |
250,000 | 247,397 | ||||
| 5,292,960 | ||||||
| CAYMAN ISLANDS — 2.7% | ||||||
|
Banco Nacional de Costa Rica Series REGS, 5 year CMT + 3.00%, 3.80%,
8/11/2026 |
1,500,000 | 1,502,325 | ||||
|
CK Hutchison Capital Securities 17, Ltd. Series REGS, 5 Year CMT + 2.07%, 4.00%, 5/12/2022
(a) |
1,837,000 | 1,873,281 | ||||
| 3,375,606 | ||||||
| CHILE — 4.7% | ||||||
|
Antofagasta PLC Series REGS, 2.38%,
10/14/2030 |
400,000 | 385,708 | ||||
|
CAP SA 3.90%, 4/27/2031
(b) |
600,000 | 600,168 | ||||
|
Chile Electricity PEC SpA Zero Coupon, 1/25/2028
(b) |
2,900,000 | 2,349,754 | ||||
|
Empresa Electrica Angamos SA Series REGS, 4.88%,
5/25/2029 |
139,100 | 139,795 | ||||
|
Empresa Electrica Cochrane SpA Series REGS, 5.50%,
5/14/2027 |
1,533,240 | 1,588,130 | ||||
|
Empresa Electrica Guacolda SA Series REGS, 4.56%,
4/30/2025 |
400,000 | 285,412 | ||||
|
Engie Energia Chile SA 3.40%,
1/28/2030 |
200,000 | 205,226 | ||||
|
VTR Finance NV Series REGS, 6.38%,
7/15/2028 |
200,000 | 212,962 | ||||
| 5,767,155 | ||||||
| CHINA — 2.9% | ||||||
|
Baidu, Inc. 3.43%,
4/7/2030 |
200,000 | 216,942 | ||||
| Security Description | Principal
Amount |
Value | |||
|
JD.com, Inc. 3.38%,
1/14/2030 |
$ 1,400,000 | $ 1,495,326 | |||
|
State Grid Overseas Investment 2013, Ltd. Series REGS, 3.13%,
5/22/2023 |
200,000 | 208,664 | |||
|
State Grid Overseas Investment 2016, Ltd. Series EMTN, 1.00%,
8/5/2025 |
700,000 | 691,515 | |||
|
Tencent Holdings, Ltd. 2.39%, 6/3/2030
(b) |
1,000,000 | 996,450 | |||
| 3,608,897 | |||||
| COLOMBIA — 2.8% | |||||
|
AI Candelaria Spain SLU 5.75%, 6/15/2033
(b) |
500,000 | 514,845 | |||
|
Banco Davivienda SA 10 Year CMT + 5.08%, 6.65%, 4/22/2031
(a)(b) |
400,000 | 419,204 | |||
| Empresas Publicas de Medellin ESP: | |||||
|
Series REGS, 4.25%,
7/18/2029 |
1,500,000 | 1,495,215 | |||
|
Series REGS, 4.38%,
2/15/2031 |
500,000 | 495,050 | |||
|
Gran Tierra Energy International Holdings, Ltd. Series REGS, 6.25%,
2/15/2025 |
600,000 | 532,740 | |||
| 3,457,054 | |||||
| GUATEMALA — 0.2% | |||||
|
Investment Energy Resources, Ltd. 6.25%, 4/26/2029
(b) |
200,000 | 216,382 | |||
| INDIA — 4.1% | |||||
|
Adani International Container Terminal Pvt, Ltd. 3.00%, 2/16/2031
(b) |
400,000 | 386,944 | |||
|
Adani International Container Terminal Pvt., Ltd. Series REGS, 3.00%,
2/16/2031 |
200,000 | 193,045 | |||
| Adani Ports & Special Economic Zone, Ltd.: | |||||
|
3.10%,
2/2/2031 |
1,000,000 | 953,180 | |||
|
Series REGS, 3.38%,
7/24/2024 |
600,000 | 624,384 | |||
|
Series REGS, 4.38%,
7/3/2029 |
700,000 | 731,108 | |||
|
JSW Hydro Energy, Ltd. 4.13%, 5/18/2031
(b) |
300,000 | 303,900 | |||
|
Network i2i, Ltd. 5 Year CMT + 4.28%, 5.65%, 1/15/2025
(a)(b) |
200,000 | 213,536 | |||
|
ONGC Videsh Vankorneft Pte, Ltd. 3.75%,
7/27/2026 |
600,000 | 639,386 | |||
|
Reliance Industries, Ltd. Series REGS, 5.40%,
2/14/2022 |
500,000 | 513,830 | |||
|
Ultratech Cement, Ltd. 2.80%,
2/16/2031 |
200,000 | 193,520 | |||
|
Vedanta Resources, Ltd. Series REGS, 6.13%,
8/9/2024 |
400,000 | 335,440 | |||
| 5,088,273 | |||||
| INDONESIA — 3.7% | |||||
| Minejesa Capital B.V.: | |||||
|
Series REGS, 4.63%,
8/10/2030 |
800,000 | 847,736 | |||
|
Series REGS, 5.63%,
8/10/2037 |
2,000,000 | 2,169,020 |
| Security Description | Principal
Amount |
Value | |||
|
Perusahaan Listrik Negara PT Series REGS, 5.50%,
11/22/2021 |
$ 1,500,000 | $ 1,526,235 | |||
| 4,542,991 | |||||
| JAMAICA — 0.1% | |||||
| Digicel Group Holdings, Ltd.: | |||||
|
7.00%, 10/1/2169
(b) |
64,616 | 49,923 | |||
|
8.00%, 4/1/2025
(b) |
43,544 | 36,928 | |||
| 86,851 | |||||
| KUWAIT — 0.6% | |||||
| MEGlobal Canada ULC: | |||||
|
5.00%, 5/18/2025
(b) |
200,000 | 224,194 | |||
|
5.88%, 5/18/2030
(b) |
400,000 | 493,220 | |||
| 717,414 | |||||
| MALAYSIA — 3.9% | |||||
|
CIMB Bank Bhd 3.26%,
3/15/2022 |
400,000 | 406,388 | |||
|
Malayan Banking Bhd USD 5 Year Swap Rate + 2.54%, 3.91%, 10/29/2026
(a) |
1,000,000 | 1,007,360 | |||
| Petronas Capital, Ltd.: | |||||
|
2.48%, 1/28/2032
(b) |
400,000 | 402,128 | |||
|
Series REGS, 3.50%,
3/18/2025 |
600,000 | 649,782 | |||
|
3.50%, 4/21/2030
(b) |
200,000 | 218,758 | |||
|
TNB Global Ventures Capital Bhd Series EMTN, 3.24%,
10/19/2026 |
2,000,000 | 2,138,140 | |||
| 4,822,556 | |||||
| MEXICO — 1.7% | |||||
| Banco Mercantil del Norte SA: | |||||
|
Series REGS, 10 Year CMT + 5.35%, 7.63%,
10/6/2169 |
200,000 | 226,644 | |||
|
Series REGS, 10 Year CMT + 5.47%, 7.50%, 6/27/2029
(a) |
800,000 | 904,688 | |||
|
Credito Real SAB de CV Series REGS, 5 Year CMT + 7.03%, 9.13%, 11/29/2022
(a) |
200,000 | 141,222 | |||
|
Mexarrend SAPI de CV 10.25%, 7/24/2024
(b) |
300,000 | 281,865 | |||
|
Unifin Financiera SAB de CV Series REGS, 5 Year CMT + 6.31%, 8.88%, 1/29/2025
(a) |
800,000 | 597,808 | |||
| 2,152,227 | |||||
| PANAMA — 7.0% | |||||
| AES Panama Generation Holdings SRL: | |||||
|
4.38%, 5/31/2030
(b) |
400,000 | 418,772 | |||
|
Series REGS, 4.38%,
5/31/2030 |
1,100,000 | 1,151,623 | |||
|
Banco General SA 10 Year CMT + 3.67%, 5.25%, 5/7/2031
(a)(b) |
800,000 | 830,960 |
| Security Description | Principal
Amount |
Value | |||
|
Banco Latinoamericano de Comercio Exterior SA 2.38%, 9/14/2025
(b) |
$ 200,000 | $ 205,038 | |||
|
Banco Nacional de Panama 2.50%, 8/11/2030
(b) |
300,000 | 290,328 | |||
|
Banistmo SA Series REGS, 3.65%,
9/19/2022 |
1,900,000 | 1,939,045 | |||
|
Global Bank Corp. Series REGS, 4.50%,
10/20/2021 |
400,000 | 402,780 | |||
|
Multibank, Inc. Series REGS, 4.38%,
11/9/2022 |
1,650,000 | 1,687,983 | |||
|
UEP Penonome II SA 6.50%, 10/1/2038
(b) |
1,676,150 | 1,718,573 | |||
| 8,645,102 | |||||
| PARAGUAY — 0.3% | |||||
|
Banco Continental SAECA 2.75%, 12/10/2025
(b) |
350,000 | 344,376 | |||
| PERU — 5.3% | |||||
|
Banco BBVA Peru SA 5 year CMT + 2.75%, 5.25%, 9/22/2029
(a) |
200,000 | 210,300 | |||
| Banco de Credito del Peru: | |||||
|
5 year CMT + 3.00%, 3.13%, 7/1/2030
(a) |
400,000 | 397,824 | |||
|
5 year CMT + 3.00%, 3.13%, 7/1/2030
(a)(b) |
250,000 | 248,640 | |||
|
Banco Internacional del Peru SAA Interbank Series REGS, 3 Month USD LIBOR + 5.76%, 6.63%,
3/19/2029 |
898,000 | 957,070 | |||
|
Banco Internacional del Peru SAA Interbank Series REGS, 1 year CMT + 3.71%, 4.00%, 7/8/2030
(a) |
700,000 | 690,844 | |||
|
Fenix Power Peru SA Series REGS, 4.32%,
9/20/2027 |
947,941 | 964,170 | |||
|
Hunt Oil Co. of Peru LLC Sucursal Del Peru Series REGS, 6.38%,
6/1/2028 |
1,100,000 | 1,159,521 | |||
|
Inkia Energy, Ltd. 5.88%,
11/9/2027 |
200,000 | 207,340 | |||
|
Nexa Resources SA Series REGS, 5.38%,
5/4/2027 |
400,000 | 429,712 | |||
|
Orazul Energy Egenor SCA 5.63%,
4/28/2027 |
400,000 | 412,800 | |||
|
Peru LNG S.r.l. Series REGS, 5.38%,
3/22/2030 |
1,000,000 | 861,310 | |||
| 6,539,531 | |||||
| QATAR — 0.2% | |||||
|
Ooredoo International Finance, Ltd. Series REGS, 3.25%,
2/21/2023 |
200,000 | 208,504 | |||
| SAUDI ARABIA — 0.3% | |||||
|
SA Global Sukuk, Ltd. 2.69%, 6/17/2031
(b) |
400,000 | 404,652 | |||
| SINGAPORE — 11.2% | |||||
| DBS Group Holdings, Ltd.: | |||||
|
Series GMTN, USD 5 Year Swap Rate + 2.39%, 3.60%, 9/7/2021
(a) |
1,300,000 | 1,303,250 | |||
|
USD 5 Year Swap Rate + 2.39%, 3.60%, 9/7/2021
(a) |
300,000 | 301,083 | |||
|
Series GMTN, 5 year CMT + 1.10%, 1.82%, 3/10/2031
(a) |
700,000 | 697,676 |
| Security Description | Principal
Amount |
Value | |||
|
5 year CMT + 1.91%, 3.30%, 2/27/2025
(a) |
$ 200,000 | $ 205,816 | |||
|
LLPL Capital Pte, Ltd. 6.88%, 2/4/2039
(b) |
364,800 | 424,740 | |||
| Oversea-Chinese Banking Corp., Ltd.: | |||||
|
5 year CMT + 1.58%, 1.83%, 9/10/2030
(a)(b) |
500,000 | 499,640 | |||
|
Series REGS, 5 year CMT + 1.58%, 1.83%, 9/10/2030
(a) |
1,700,000 | 1,698,776 | |||
| PSA Treasury Pte, Ltd.: | |||||
|
Series GMTN, 2.13%,
9/5/2029 |
2,000,000 | 2,038,620 | |||
|
2.25%,
4/30/2030 |
800,000 | 821,105 | |||
|
SingTel Group Treasury Pte, Ltd. 1.88%,
6/10/2030 |
1,500,000 | 1,484,859 | |||
| Temasek Financial I, Ltd.: | |||||
|
1.00%, 10/6/2030
(b) |
2,100,000 | 1,969,359 | |||
|
Series REGS, 1.00%,
10/6/2030 |
250,000 | 234,448 | |||
| United Overseas Bank, Ltd.: | |||||
|
Series EMTN, USD 5 Year Swap Rate + 1.79%, 3.88%, 10/19/2023
(a) |
600,000 | 625,050 | |||
|
Series EMTN, USD 5 Year Swap Rate + 2.24%, 3.50%, 9/16/2026
(a) |
200,000 | 200,940 | |||
|
5 year CMT + 1.52%, 1.75%, 3/16/2031
(a) |
800,000 | 794,816 | |||
|
Series EMTN, USD 5 Year Swap Rate + 1.65%, 2.88%, 3/8/2027
(a) |
600,000 | 607,188 | |||
| 13,907,366 | |||||
| SOUTH KOREA — 5.3% | |||||
| Korea East-West Power Co., Ltd.: | |||||
|
1.75%, 5/6/2025
(b) |
200,000 | 204,196 | |||
|
Series REGS, 1.75%,
5/6/2025 |
1,100,000 | 1,123,078 | |||
|
Korea Southern Power Co., Ltd. 0.75%, 1/27/2026
(b) |
1,000,000 | 975,600 | |||
|
KT Corp. Series REGS, 2.50%,
7/18/2026 |
800,000 | 839,184 | |||
|
LG Chem, Ltd. 2.38%, 7/7/2031
(b)(c) |
200,000 | 199,372 | |||
|
NongHyup Bank 1.25%, 7/20/2025
(b) |
600,000 | 600,618 | |||
| POSCO: | |||||
|
Series REGS, 2.38%,
11/12/2022 |
400,000 | 408,824 | |||
|
Series REGS, 2.38%,
1/17/2023 |
600,000 | 614,298 | |||
|
Series REGS, 2.75%,
7/15/2024 |
400,000 | 420,392 | |||
|
Shinhan Financial Group Co., Ltd. 5 year CMT + 2.06%, 2.88%, 5/12/2026
(a)(b) |
550,000 | 547,228 | |||
|
Woori Bank Series REGS, 5 year CMT + 2.66%, 4.25%, 10/4/2024
(a) |
600,000 | 623,016 | |||
| 6,555,806 | |||||
| THAILAND — 1.0% | |||||
|
Bangkok Bank PCL 5.00%,
12/31/2051 |
400,000 | 422,744 |
| Security Description | Principal
Amount |
Value | ||||
|
Kasikornbank PCL Series EMTN, 5 year CMT + 4.94%, 5.28%, 10/14/2025
(a) |
$ 600,000 | $ 634,800 | ||||
|
PTTEP Treasury Center Co., Ltd. 2.59%, 6/10/2027
(b) |
200,000 | 207,402 | ||||
| 1,264,946 | ||||||
| UNITED ARAB EMIRATES — 2.2% | ||||||
| Galaxy Pipeline Assets Bidco, Ltd.: | ||||||
|
2.16%, 3/31/2034
(b) |
2,300,000 | 2,261,337 | ||||
|
Series REGS, 2.63%,
3/31/2036 |
500,000 | 490,461 | ||||
| 2,751,798 | ||||||
| UNITED STATES — 1.2% | ||||||
|
JBS Finance Luxembourg S.a.r.l 3.63%, 1/15/2032
(b) |
1,500,000 | 1,497,435 | ||||
|
TOTAL CORPORATE BONDS & NOTES (Cost
$81,027,571) |
82,111,100 | |||||
| FOREIGN GOVERNMENT OBLIGATIONS — 31.5% | ||||||
| BRAZIL — 1.3% | ||||||
|
Brazil Government International Bond 3.75%,
9/12/2031 |
300,000 | 297,498 | ||||
| Brazilian Government International Bond: | ||||||
|
5.00%,
1/27/2045 |
300,000 | 303,861 | ||||
|
5.63%,
2/21/2047 |
900,000 | 982,260 | ||||
| 1,583,619 | ||||||
| CHILE — 1.8% | ||||||
| Chile Government International Bond: | ||||||
|
3.10%,
1/22/2061 |
1,500,000 | 1,435,890 | ||||
|
3.50%,
1/25/2050 |
700,000 | 735,259 | ||||
| 2,171,149 | ||||||
| COLOMBIA — 3.3% | ||||||
| Colombia Government International Bond: | ||||||
|
2.63%,
3/15/2023 |
1,000,000 | 1,022,500 | ||||
|
3.13%,
4/15/2031 |
500,000 | 489,205 | ||||
|
3.25%,
4/22/2032 |
1,000,000 | 978,480 | ||||
|
4.13%,
5/15/2051 |
950,000 | 900,144 | ||||
|
5.00%,
6/15/2045 |
700,000 | 743,785 | ||||
| 4,134,114 | ||||||
| DOMINICAN REPUBLIC — 1.6% | ||||||
|
Dominican Republic International Bond Series 144A, 4.88%, 9/23/2032
(b) |
1,900,000 | 1,963,308 | ||||
| Security Description | Principal
Amount |
Value | |||
| INDONESIA — 3.2% | |||||
| Indonesia Government International Bond: | |||||
|
3.70%,
10/30/2049 |
$ 1,600,000 | $ 1,677,568 | |||
|
4.35%,
1/11/2048 |
500,000 | 567,510 | |||
| Perusahaan Penerbit SBSN Indonesia III: | |||||
|
Series 144A, 2.55%, 6/9/2031
(b) |
600,000 | 602,622 | |||
|
Series REGS, 3.80%,
6/23/2050 |
1,100,000 | 1,150,094 | |||
| 3,997,794 | |||||
| MALAYSIA — 2.4% | |||||
|
Malaysia Sovereign Sukuk Bhd Series REGS, 3.04%,
4/22/2025 |
800,000 | 857,024 | |||
|
Malaysia Sukuk Global Bhd Series REGS, 3.18%,
4/27/2026 |
250,000 | 272,690 | |||
|
Malaysia Wakala Sukuk Bhd 2.07%, 4/28/2031
(b) |
250,000 | 252,482 | |||
|
Malaysia Wakala Sukuk Bhd. 3.08%, 4/28/2051
(b) |
1,500,000 | 1,566,360 | |||
| 2,948,556 | |||||
| MEXICO — 3.8% | |||||
| Mexico Government International Bond: | |||||
|
3.77%,
5/24/2061 |
1,700,000 | 1,584,077 | |||
|
4.28%,
8/14/2041 |
1,600,000 | 1,681,488 | |||
|
4.50%,
1/31/2050 |
500,000 | 532,050 | |||
|
4.60%,
2/10/2048 |
800,000 | 859,728 | |||
| 4,657,343 | |||||
| PANAMA — 3.4% | |||||
| Panama Government International Bond: | |||||
|
2.25%,
9/29/2032 |
300,000 | 287,946 | |||
|
3.87%,
7/23/2060 |
2,600,000 | 2,655,874 | |||
|
4.00%,
9/22/2024 |
600,000 | 654,030 | |||
|
4.30%,
4/29/2053 |
600,000 | 665,172 | |||
| 4,263,022 | |||||
| PERU — 1.8% | |||||
| Peruvian Government International Bond: | |||||
|
3.30%,
3/11/2041 |
1,350,000 | 1,365,025 | |||
|
3.55%,
3/10/2051 |
850,000 | 883,133 | |||
| 2,248,158 | |||||
| PHILIPPINES — 2.9% | |||||
| Philippine Government International Bond: | |||||
|
2.46%,
5/5/2030 |
400,000 | 416,512 | |||
|
2.65%,
12/10/2045 |
900,000 | 833,607 | |||
|
3.70%,
3/1/2041 |
1,200,000 | 1,295,232 |
| Security Description | Principal
Amount |
Value | |||
|
3.70%,
2/2/2042 |
$ 1,000,000 | $ 1,079,280 | |||
| 3,624,631 | |||||
| QATAR — 0.3% | |||||
|
Qatar Government International Bond Series REGS, 3.38%,
3/14/2024 |
300,000 | 321,750 | |||
| SAUDI ARABIA — 3.2% | |||||
| Saudi Government International Bond: | |||||
|
Series REGS, 2.88%,
3/4/2023 |
500,000 | 518,600 | |||
|
Series 144A, 2.90%, 10/22/2025
(b) |
850,000 | 910,078 | |||
|
Series REGS, 3.45%,
2/2/2061 |
2,350,000 | 2,344,548 | |||
|
Series REGS, 3.75%,
1/21/2055 |
200,000 | 211,101 | |||
| 3,984,327 | |||||
| SOUTH KOREA — 0.8% | |||||
|
Korea Development Bank 1.00%,
9/9/2026 |
200,000 | 198,714 | |||
| Korea Electric Power Corp.: | |||||
|
Series 144A, 1.13%, 6/15/2025
(b) |
400,000 | 398,868 | |||
|
Series REGS, 1.13%,
6/15/2025 |
200,000 | 199,434 | |||
|
Korea Hydro & Nuclear Power Co., Ltd. Series 144A, 1.25%, 4/27/2026
(b) |
200,000 | 199,058 | |||
| 996,074 | |||||
| UNITED ARAB EMIRATES — 1.7% | |||||
| Abu Dhabi Government International Bond: | |||||
|
Series 144A, 3.13%, 4/16/2030
(b) |
400,000 | 434,756 | |||
|
Series REGS, 3.13%,
9/30/2049 |
1,400,000 | 1,426,460 | |||
|
Series REGS, 3.88%,
4/16/2050 |
200,000 | 230,250 | |||
| 2,091,466 | |||||
|
TOTAL FOREIGN GOVERNMENT OBLIGATIONS (Cost
$37,879,902) |
38,985,311 |
| Security Description | Shares | Value | ||||
| SHORT-TERM INVESTMENT — 2.1% | ||||||
|
State Street Institutional U.S. Government Money Market Fund, Class G Shares 0.03% (d) (e) (Cost
$2,549,386) |
2,549,386 | $ 2,549,386 | ||||
|
TOTAL INVESTMENTS — 100.0% (Cost
$121,456,859) |
123,645,797 | |||||
|
LIABILITIES IN EXCESS OF OTHER ASSETS — (0.0)%
(f) |
(2,699) | |||||
|
NET ASSETS — 100.0%
|
$ 123,643,098 | |||||
| (a) | Variable Rate Security - Interest rate shown is rate in effect at June 30, 2021. For securities based on a published reference rate and spread, the reference rate and spread are indicated in the description above. |
| (b) | Securities purchased pursuant to Rule 144A of the Securities Act of 1933, as amended. These securities, which represent 23.3% of net assets as of June 30, 2021, are considered liquid and may be resold in transactions exempt from registration, normally to qualified institutional buyers. |
| (c) | When-issued security. |
| (d) | The Fund invested in certain money market funds managed by SSGA Funds Management, Inc. Amounts related to these transactions during the period ended June 30, 2021 are shown in the Affiliate Table below. |
| (e) | The rate shown is the annualized seven-day yield at June 30, 2021. |
| (f) | Amount is less than 0.05% of net assets. |
| CMT | Constant Maturity Treasury |
| EMTN | Euro Medium Term Note |
| GMTN | Global Medium Term Note |
| LIBOR | London Interbank Offered Rate |
| Description | Level
1 – Quoted Prices |
Level
2 – Other Significant Observable Inputs |
Level
3 – Significant Unobservable Inputs |
Total | ||||
| ASSETS: | ||||||||
| INVESTMENTS: | ||||||||
|
Corporate Bonds &
Notes |
$ — | $ 82,111,100 | $— | $ 82,111,100 | ||||
|
Foreign Government
Obligations |
— | 38,985,311 | — | 38,985,311 | ||||
|
Short-Term
Investment |
2,549,386 | — | — | 2,549,386 | ||||
|
TOTAL
INVESTMENTS |
$2,549,386 | $121,096,411 | $— | $123,645,797 |
| % of Net Assets | ||
| Foreign Government Obligations | 31.5% | |
| Banks | 19.5 | |
| Electric | 15.1 | |
| Oil & Gas | 5.5 | |
| Pipelines | 3.3 | |
| Energy-Alternate Sources | 3.2 | |
| Transportation | 2.4 | |
| Diversified Financial Services | 2.4 | |
| Telecommunications | 2.4 | |
| Commercial Services | 2.2 | |
| Iron/Steel | 2.2 | |
| Internet | 2.2 | |
| Holding Companies-Diversified | 1.5 | |
| Chemicals | 1.4 | |
| Food | 1.2 | |
| Mining | 1.1 | |
| Forest Products & Paper | 0.2 | |
| Investment Company Security | 0.2 | |
| Media | 0.2 | |
| Multi-National | 0.2 | |
| Short-Term Investment | 2.1 | |
| Liabilities in Excess of Other Assets | (0.0) | |
| TOTAL | 100.0% |
| Number
of Shares Held at 6/30/20 |
Value
at 6/30/20 |
Cost
of Purchases |
Proceeds
from Shares Sold |
Realized
Gain (Loss) |
Change
in Unrealized Appreciation/ Depreciation |
Number
of Shares Held at 6/30/21 |
Value
at 6/30/21 |
Dividend
Income | |||||||||
|
State Street Institutional U.S. Government Money Market Fund, Class G
Shares |
780,408 | $780,408 | $70,498,769 | $68,729,791 | $— | $— | 2,549,386 | $2,549,386 | $1,064 |
| Security Description | Principal
Amount |
Value | ||||
| CORPORATE BONDS & NOTES — 27.1% | ||||||
| ADVERTISING — 0.0% (a) | ||||||
|
Clear Channel Outdoor Holdings, Inc. 7.50%, 6/1/2029
(b) |
$ 40,000 | $ 41,435 | ||||
| AEROSPACE & DEFENSE — 0.4% | ||||||
|
Boeing Co. 4.51%,
5/1/2023 |
490,000 | 522,266 | ||||
| TransDigm, Inc.: | ||||||
|
4.88%, 5/1/2029
(b) |
30,000 | 30,315 | ||||
|
5.50%,
11/15/2027 |
40,000 | 41,708 | ||||
|
6.25%, 3/15/2026
(b) |
65,000 | 68,563 | ||||
|
8.00%, 12/15/2025
(b) |
10,000 | 10,803 | ||||
|
Triumph Group, Inc. 7.75%,
8/15/2025 |
25,000 | 25,731 | ||||
| 699,386 | ||||||
| AGRICULTURE — 0.3% | ||||||
|
BAT International Finance PLC 1.67%,
3/25/2026 |
515,000 | 515,639 | ||||
| AIRLINES — 0.5% | ||||||
|
American Airlines, Inc./AAdvantage Loyalty IP, Ltd. 5.75%, 4/20/2029
(b) |
175,000 | 189,248 | ||||
|
Southwest Airlines Co. 4.75%,
5/4/2023 |
470,000 | 504,442 | ||||
|
United Airlines, Inc. 4.63%, 4/15/2029
(b) |
40,000 | 41,432 | ||||
| 735,122 | ||||||
| AUTO MANUFACTURERS — 0.6% | ||||||
|
General Motors Financial Co., Inc. 5.25%,
3/1/2026 |
450,000 | 519,885 | ||||
|
Hyundai Capital America 2.85%, 11/1/2022
(b) |
485,000 | 498,692 | ||||
| 1,018,577 | ||||||
| AUTO PARTS & EQUIPMENT — 0.1% | ||||||
|
Clarios Global L.P./Clarios US Finance Co. 6.25%, 5/15/2026
(b) |
45,000 | 47,928 | ||||
|
Goodyear Tire & Rubber Co. 5.25%, 7/15/2031
(b) |
60,000 | 62,562 | ||||
| 110,490 | ||||||
| Security Description | Principal
Amount |
Value | ||||
| BANKS — 5.2% | ||||||
|
Banco Bilbao Vizcaya Argentaria Colombia SA Series REGS, 4.88%,
4/21/2025 |
$ 200,000 | $ 209,424 | ||||
|
Banco Continental SAECA 2.75%, 12/10/2025
(b) |
150,000 | 147,590 | ||||
|
Banco de Credito del Peru 5 year CMT + 3.00%, 3.13%, 7/1/2030
(c) |
100,000 | 99,456 | ||||
|
Banco de Reservas de la Republica Dominicana Series REGS, 7.00%,
2/1/2023 |
150,000 | 157,401 | ||||
|
Bancolombia SA 5 Year CMT + 2.94%, 4.63%, 12/18/2029
(c) |
200,000 | 203,424 | ||||
| Bank of America Corp.: | ||||||
|
SOFR + 0.69%, 0.72%, 4/22/2025
(c) |
200,000 | 201,166 | ||||
|
Series MTN, 3 Month USD LIBOR + 0.79%, 0.92%, 3/5/2024
(c) |
385,000 | 388,384 | ||||
|
Bank of Nova Scotia 0.55%,
9/15/2023 |
160,000 | 160,368 | ||||
|
BBVA Bancomer SA Series REGS, 5 Year CMT + 3.00%, 5.35%, 11/12/2029
(c) |
200,000 | 211,722 | ||||
|
BDO Unibank, Inc. Series EMTN, 2.63%,
10/24/2021 |
200,000 | 201,000 | ||||
|
Canadian Imperial Bank of Commerce 0.45%,
6/22/2023 |
300,000 | 299,961 | ||||
|
CIMB Bank Bhd 3.26%,
3/15/2022 |
200,000 | 203,194 | ||||
|
Citigroup, Inc. 3 Month USD LIBOR + 1.02%, 1.16%, 6/1/2024
(c) |
555,000 | 562,298 | ||||
|
DBS Group Holdings, Ltd. USD 5 Year Swap Rate + 2.39%, 3.60%, 9/7/2021
(c) |
200,000 | 200,722 | ||||
|
Goldman Sachs Group, Inc. 3.50%,
4/1/2025 |
525,000 | 569,394 | ||||
|
Itau Unibanco Holding SA 5 year CMT + 3.45%, 3.88%, 4/15/2031
(c) |
200,000 | 198,850 | ||||
| JPMorgan Chase & Co.: | ||||||
|
3.90%,
7/15/2025 |
65,000 | 71,882 | ||||
|
3 Month USD LIBOR + 0.70%, 3.21%, 4/1/2023
(c) |
485,000 | 495,229 | ||||
|
Macquarie Bank, Ltd. 2.10%, 10/17/2022
(b) |
350,000 | 357,924 | ||||
|
Macquarie Group, Ltd. 3 Month USD LIBOR + 1.33%, 4.15%, 3/27/2024
(b)
(c) |
195,000 | 206,454 | ||||
|
Malayan Banking Bhd USD 5 Year Swap Rate + 2.54%, 3.91%, 10/29/2026
(c) |
200,000 | 201,734 | ||||
| Security Description | Principal
Amount |
Value | ||||
|
Morgan Stanley Series MTN, SOFR + 0.46%, 0.53%, 1/25/2024
(c) |
$ 565,000 | $ 564,819 | ||||
|
NongHyup Bank 1.25%, 7/20/2025
(b) |
200,000 | 200,206 | ||||
|
Oversea-Chinese Banking Corp., Ltd. Series REGS, 4.25%,
6/19/2024 |
200,000 | 218,088 | ||||
|
Royal Bank of Canada SOFR + 0.53%, 0.55%, 1/20/2026
(c) |
565,000 | 565,938 | ||||
|
Scotiabank Peru SAA Series REGS, 3 Month USD LIBOR + 3.86%, 4.50%, 12/13/2027
(c) |
50,000 | 51,166 | ||||
|
Truist Financial Corp. SOFR + 0.40%, 0.45%, 6/9/2025
(c) |
565,000 | 565,452 | ||||
|
United Overseas Bank, Ltd. Series EMTN, USD 5 Year Swap Rate + 1.65%, 2.88%, 3/8/2027
(c) |
200,000 | 202,350 | ||||
|
Wells Fargo & Co. Series MTN, SOFR + 1.60%, 1.65%, 6/2/2024
(c) |
560,000 | 572,057 | ||||
| 8,287,653 | ||||||
| BEVERAGES — 0.5% | ||||||
|
Central American Bottling Corp. 5.75%,
1/31/2027 |
200,000 | 208,592 | ||||
|
Keurig Dr Pepper, Inc. 0.75%,
3/15/2024 |
500,000 | 500,480 | ||||
|
Primo Water Holdings, Inc. 4.38%, 4/30/2029
(b) |
90,000 | 90,018 | ||||
|
Triton Water Holdings, Inc. 6.25%, 4/1/2029
(b) |
35,000 | 35,243 | ||||
| 834,333 | ||||||
| BIOTECHNOLOGY — 0.2% | ||||||
|
Royalty Pharma PLC 0.75%, 9/2/2023
(b) |
250,000 | 250,747 | ||||
| BUILDING MATERIALS — 0.5% | ||||||
|
Builders FirstSource, Inc. 6.75%, 6/1/2027
(b) |
58,000 | 62,264 | ||||
|
Carrier Global Corp. 2.24%,
2/15/2025 |
490,000 | 509,786 | ||||
|
Griffon Corp. 5.75%,
3/1/2028 |
35,000 | 37,159 | ||||
| Security Description | Principal
Amount |
Value | ||||
|
Martin Marietta Materials, Inc. 0.65%, 7/15/2023
(d) |
$ 150,000 | $ 150,288 | ||||
| 759,497 | ||||||
| CHEMICALS — 0.5% | ||||||
|
CVR Partners L.P./CVR Nitrogen Finance Corp. 6.13%, 6/15/2028
(b) |
25,000 | 25,620 | ||||
|
DuPont de Nemours, Inc. 4.49%,
11/15/2025 |
455,000 | 517,271 | ||||
|
LG Chem, Ltd. Series REGS, 3.25%,
10/15/2024 |
200,000 | 214,810 | ||||
|
SCIH Salt Holdings, Inc. 6.63%, 5/1/2029
(b) |
15,000 | 15,036 | ||||
| 772,737 | ||||||
| COAL — 0.1% | ||||||
|
Peabody Energy Corp. 8.50%, 12/31/2024
(b) |
13,000 | 9,773 | ||||
|
SunCoke Energy Partners L.P./SunCoke Energy Partners Finance Corp. 7.50%, 6/15/2025
(b) |
50,000 | 51,922 | ||||
|
SunCoke Energy, Inc. 4.88%, 6/30/2029
(b) |
50,000 | 49,994 | ||||
| 111,689 | ||||||
| COMMERCIAL SERVICES — 0.5% | ||||||
| Allied Universal Holdco LLC/Allied Universal Finance Corp.: | ||||||
|
6.63%, 7/15/2026
(b) |
35,000 | 37,111 | ||||
|
9.75%, 7/15/2027
(b) |
65,000 | 71,601 | ||||
|
Garda World Security Corp. 6.00%, 6/1/2029
(b) |
65,000 | 64,459 | ||||
|
HPHT Finance 19, Ltd. 2.88%,
11/5/2024 |
200,000 | 209,376 | ||||
|
Metis Merger Sub LLC 6.50%, 5/15/2029
(b) |
40,000 | 39,383 | ||||
|
MPH Acquisition Holdings LLC 5.75%, 11/1/2028
(b) |
65,000 | 65,306 | ||||
|
NESCO Holdings II, Inc. 5.50%, 4/15/2029
(b) |
10,000 | 10,435 | ||||
|
PSA Treasury Pte, Ltd. Class GMTN, 2.50%,
4/12/2026 |
200,000 | 210,834 | ||||
| Security Description | Principal
Amount |
Value | ||||
|
Verscend Escrow Corp. 9.75%, 8/15/2026
(b) |
$ 50,000 | $ 52,738 | ||||
| 761,243 | ||||||
| COSMETICS/PERSONAL CARE — 0.0% (a) | ||||||
|
Coty, Inc. 5.00%, 4/15/2026
(b) |
40,000 | 40,580 | ||||
| DISTRIBUTION & WHOLESALE — 0.0% (a) | ||||||
|
Performance Food Group, Inc. 5.50%, 10/15/2027
(b) |
45,000 | 47,353 | ||||
| DIVERSIFIED FINANCIAL SERVICES — 0.8% | ||||||
|
Avolon Holdings Funding, Ltd. 3.63%, 5/1/2022
(b) |
495,000 | 506,355 | ||||
| Capital One Financial Corp.: | ||||||
|
3.20%,
1/30/2023 |
380,000 | 395,793 | ||||
|
3.90%,
1/29/2024 |
160,000 | 172,645 | ||||
|
Global Aircraft Leasing Co., Ltd. 6.50%, 9/15/2024
(b) |
53,690 | 53,846 | ||||
|
Nationstar Mortgage Holdings, Inc. 5.50%, 8/15/2028
(b) |
40,000 | 40,317 | ||||
|
Navient Corp. 5.00%,
3/15/2027 |
25,000 | 25,924 | ||||
|
NFP Corp. 6.88%, 8/15/2028
(b) |
35,000 | 36,980 | ||||
|
OneMain Finance Corp. 6.63%,
1/15/2028 |
40,000 | 46,033 | ||||
|
PennyMac Financial Services, Inc. 4.25%, 2/15/2029
(b) |
70,000 | 67,446 | ||||
| 1,345,339 | ||||||
| ELECTRIC — 2.8% | ||||||
| Calpine Corp.: | ||||||
|
4.63%, 2/1/2029
(b) |
30,000 | 29,639 | ||||
|
5.13%, 3/15/2028
(b) |
40,000 | 40,665 | ||||
|
Chile Electricity PEC SpA Zero Coupon, 1/25/2028
(b) |
200,000 | 162,052 | ||||
| DTE Energy Co.: | ||||||
|
2.25%,
11/1/2022 |
60,000 | 61,420 | ||||
|
Series C, 2.53%,
10/1/2024 |
230,000 | 241,631 | ||||
|
Series F, 1.05%,
6/1/2025 |
185,000 | 184,698 | ||||
| Security Description | Principal
Amount |
Value | ||||
|
Empresa Electrica Angamos SA Series REGS, 4.88%,
5/25/2029 |
$ 139,100 | $ 139,796 | ||||
|
Empresa Electrica Guacolda SA Series REGS, 4.56%,
4/30/2025 |
200,000 | 142,706 | ||||
|
Empresa Generadora de Electricidad Itabo SA 7.95%,
5/11/2026 |
54,000 | 54,408 | ||||
|
Enel Generacion Chile SA 4.25%,
4/15/2024 |
200,000 | 214,038 | ||||
|
Fenix Power Peru SA Series REGS, 4.32%,
9/20/2027 |
172,353 | 175,304 | ||||
|
Korea East-West Power Co., Ltd. 1.75%, 5/6/2025
(b) |
200,000 | 204,196 | ||||
|
Minejesa Capital B.V. Series REGS, 4.63%,
8/10/2030 |
200,000 | 211,934 | ||||
|
NextEra Energy Capital Holdings, Inc. 0.65%,
3/1/2023 |
430,000 | 431,488 | ||||
|
NRG Energy, Inc. 3.63%, 2/15/2031
(b) |
80,000 | 78,566 | ||||
|
Orazul Energy Egenor SCA 5.63%,
4/28/2027 |
200,000 | 206,400 | ||||
|
Pacific Gas & Electric Co. 1.75%,
6/16/2022 |
500,000 | 499,885 | ||||
|
PG&E Corp. 5.00%,
7/1/2028 |
25,000 | 25,299 | ||||
|
Pike Corp. 5.50%, 9/1/2028
(b) |
45,000 | 46,783 | ||||
|
PSEG Power LLC 3.85%,
6/1/2023 |
535,000 | 567,656 | ||||
|
Southern California Edison Co. SOFR + 0.83%, 0.88%, 4/1/2024
(c) |
565,000 | 567,096 | ||||
|
State Grid Overseas Investment 2016, Ltd. Series EMTN, 1.00%,
8/5/2025 |
200,000 | 197,576 | ||||
| 4,483,236 | ||||||
| ELECTRICAL COMPONENTS & EQUIPMENT — 0.0% (a) | ||||||
|
Energizer Holdings, Inc. 4.75%, 6/15/2028
(b) |
60,000 | 61,679 | ||||
| ENTERTAINMENT — 0.4% | ||||||
|
Bally's Corp. 6.75%, 6/1/2027
(b) |
70,000 | 74,640 | ||||
|
Boyne USA, Inc. 4.75%, 5/15/2029
(b) |
110,000 | 113,935 | ||||
| Security Description | Principal
Amount |
Value | ||||
|
Caesars Entertainment, Inc. 6.25%, 7/1/2025
(b) |
$ 55,000 | $ 58,340 | ||||
|
Cedar Fair L.P. 5.25%,
7/15/2029 |
40,000 | 41,234 | ||||
|
Lions Gate Capital Holdings LLC 5.50%, 4/15/2029
(b) |
45,000 | 47,472 | ||||
| Live Nation Entertainment, Inc.: | ||||||
|
4.75%, 10/15/2027
(b) |
65,000 | 67,355 | ||||
|
6.50%, 5/15/2027
(b) |
50,000 | 55,488 | ||||
|
Midwest Gaming Borrower LLC/Midwest Gaming Finance Corp. 4.88%, 5/1/2029
(b) |
95,000 | 95,162 | ||||
|
Scientific Games International, Inc. 7.25%, 11/15/2029
(b) |
40,000 | 45,119 | ||||
| 598,745 | ||||||
| ENVIRONMENTAL CONTROL — 0.4% | ||||||
|
GFL Environmental, Inc. 4.00%, 8/1/2028
(b) |
80,000 | 79,063 | ||||
| Madison IAQ LLC: | ||||||
|
4.13%, 6/30/2028
(b) |
45,000 | 45,442 | ||||
|
5.88%, 6/30/2029
(b) |
40,000 | 40,702 | ||||
|
Republic Services, Inc. 2.50%,
8/15/2024 |
485,000 | 509,449 | ||||
| 674,656 | ||||||
| FOOD — 0.6% | ||||||
|
B&G Foods, Inc. 5.25%,
9/15/2027 |
20,000 | 20,839 | ||||
|
Conagra Brands, Inc. 4.30%,
5/1/2024 |
467,000 | 512,439 | ||||
|
Grupo Bimbo SAB de CV Series REGS, 4.50%,
1/25/2022 |
100,000 | 102,237 | ||||
| Kraft Heinz Foods Co.: | ||||||
|
5.00%,
7/15/2035 |
20,000 | 24,481 | ||||
|
5.20%,
7/15/2045 |
60,000 | 74,559 | ||||
|
Pilgrim's Pride Corp. 5.88%, 9/30/2027
(b) |
45,000 | 47,994 | ||||
|
Post Holdings, Inc. 4.63%, 4/15/2030
(b) |
50,000 | 50,886 | ||||
|
United Natural Foods, Inc. 6.75%, 10/15/2028
(b) |
40,000 | 43,024 | ||||
| Security Description | Principal
Amount |
Value | ||||
|
US Foods, Inc. 6.25%, 4/15/2025
(b) |
$ 10,000 | $ 10,610 | ||||
| 887,069 | ||||||
| GAS — 0.3% | ||||||
|
Atmos Energy Corp. 0.63%,
3/9/2023 |
225,000 | 225,061 | ||||
|
ENN Energy Holdings, Ltd. 3.25%,
7/24/2022 |
200,000 | 204,144 | ||||
| 429,205 | ||||||
| HEALTH CARE PRODUCTS — 0.0% (a) | ||||||
|
Ortho-Clinical Diagnostics, Inc./Ortho-Clinical Diagnostics SA 7.25%, 2/1/2028
(b) |
42,000 | 45,922 | ||||
| HEALTH CARE SERVICES — 1.2% | ||||||
| Anthem, Inc.: | ||||||
|
3.30%,
1/15/2023 |
280,000 | 292,141 | ||||
|
3.50%,
8/15/2024 |
255,000 | 274,553 | ||||
| Centene Corp.: | ||||||
|
2.50%,
3/1/2031 |
55,000 | 54,296 | ||||
|
3.00%,
10/15/2030 |
30,000 | 30,832 | ||||
| CHS/Community Health Systems, Inc.: | ||||||
|
6.00%, 1/15/2029
(b) |
55,000 | 58,869 | ||||
|
6.88%, 4/15/2029
(b) |
40,000 | 42,004 | ||||
|
HCA, Inc. 5.00%,
3/15/2024 |
465,000 | 513,950 | ||||
| Legacy LifePoint Health LLC: | ||||||
|
4.38%, 2/15/2027
(b) |
40,000 | 40,487 | ||||
|
6.75%, 4/15/2025
(b) |
30,000 | 31,954 | ||||
|
Radiology Partners, Inc. 9.25%, 2/1/2028
(b) |
45,000 | 49,872 | ||||
|
RP Escrow Issuer LLC 5.25%, 12/15/2025
(b) |
55,000 | 57,450 | ||||
|
Select Medical Corp. 6.25%, 8/15/2026
(b) |
120,000 | 127,830 | ||||
| Tenet Healthcare Corp.: | ||||||
|
5.13%, 11/1/2027
(b) |
60,000 | 62,876 | ||||
|
6.13%, 10/1/2028
(b) |
70,000 | 74,484 | ||||
|
UnitedHealth Group, Inc. 0.55%,
5/15/2024 |
295,000 | 294,782 | ||||
| 2,006,380 | ||||||
| Security Description | Principal
Amount |
Value | ||||
| HOME BUILDERS — 0.0% (a) | ||||||
|
Mattamy Group Corp. 4.63%, 3/1/2030
(b) |
$ 55,000 | $ 56,288 | ||||
| HOME FURNISHINGS — 0.1% | ||||||
|
Tempur Sealy International, Inc. 4.00%, 4/15/2029
(b) |
35,000 | 35,593 | ||||
|
WASH Multifamily Acquisition, Inc. 5.75%, 4/15/2026
(b) |
50,000 | 52,214 | ||||
| 87,807 | ||||||
| HOUSEHOLD PRODUCTS & WARES — 0.1% | ||||||
| Kronos Acquisition Holdings, Inc./KIK Custom Products, Inc.: | ||||||
|
5.00%, 12/31/2026
(b) |
55,000 | 56,089 | ||||
|
7.00%, 12/31/2027
(b) |
35,000 | 35,116 | ||||
| 91,205 | ||||||
| INSURANCE — 1.2% | ||||||
|
Acrisure LLC/Acrisure Finance, Inc. 4.25%, 2/15/2029
(b) |
70,000 | 69,097 | ||||
|
Alliant Holdings Intermediate LLC/Alliant Holdings Co-Issuer 6.75%, 10/15/2027
(b) |
35,000 | 36,800 | ||||
|
Athene Global Funding SOFR + 0.70%, 0.74%, 5/24/2024
(b)
(c) |
565,000 | 570,012 | ||||
|
Brighthouse Financial Global Funding 0.60%, 6/28/2023
(b) |
210,000 | 210,011 | ||||
|
Grupo de Inversiones Suramericana SA 5.50%,
4/29/2026 |
200,000 | 216,040 | ||||
|
GTCR AP Finance, Inc. 8.00%, 5/15/2027
(b) |
40,000 | 42,746 | ||||
|
Marsh & McLennan Cos., Inc. 3.88%,
3/15/2024 |
525,000 | 569,541 | ||||
|
Prudential Financial, Inc. Series MTN, 3.50%,
5/15/2024 |
265,000 | 286,915 | ||||
| 2,001,162 | ||||||
| INTERNET — 0.6% | ||||||
|
Baidu, Inc. 3.08%,
4/7/2025 |
200,000 | 211,798 | ||||
|
eBay, Inc. 2.75%,
1/30/2023 |
500,000 | 517,835 | ||||
|
Endure Digital, Inc. 6.00%, 2/15/2029
(b) |
55,000 | 54,456 | ||||
| Security Description | Principal
Amount |
Value | ||||
|
Tencent Holdings, Ltd. 1.81%, 1/26/2026
(b) |
$ 200,000 | $ 203,336 | ||||
|
Uber Technologies, Inc. 7.50%, 9/15/2027
(b) |
35,000 | 38,457 | ||||
| 1,025,882 | ||||||
| INVESTMENT COMPANY SECURITY — 0.2% | ||||||
|
Icahn Enterprises L.P./Icahn Enterprises Finance Corp. 5.25%,
5/15/2027 |
35,000 | 36,229 | ||||
|
Temasek Financial I, Ltd. Series REGS, 2.38%,
1/23/2023 |
250,000 | 257,480 | ||||
| 293,709 | ||||||
| IRON/STEEL — 0.1% | ||||||
|
POSCO Series REGS, 2.38%,
11/12/2022 |
200,000 | 204,412 | ||||
| LEISURE TIME — 0.2% | ||||||
|
Carnival Corp. 5.75%, 3/1/2027
(b) |
125,000 | 131,490 | ||||
| Viking Cruises, Ltd.: | ||||||
|
5.88%, 9/15/2027
(b) |
95,000 | 93,852 | ||||
|
13.00%, 5/15/2025
(b) |
20,000 | 23,521 | ||||
| 248,863 | ||||||
| LODGING — 0.1% | ||||||
|
Boyd Gaming Corp. 4.75%, 6/15/2031
(b) |
80,000 | 83,171 | ||||
|
MGM Resorts International 6.75%,
5/1/2025 |
70,000 | 74,950 | ||||
| 158,121 | ||||||
| MEDIA — 0.3% | ||||||
|
CCO Holdings LLC/CCO Holdings Capital Corp. 4.75%, 3/1/2030
(b) |
45,000 | 47,551 | ||||
|
Cengage Learning, Inc. 9.50%, 6/15/2024
(b) |
45,000 | 46,092 | ||||
|
Diamond Sports Group LLC/Diamond Sports Finance Co. 5.38%, 8/15/2026
(b) |
25,000 | 16,198 | ||||
| DISH DBS Corp.: | ||||||
|
5.13%, 6/1/2029
(b) |
40,000 | 39,534 | ||||
|
5.88%,
11/15/2024 |
40,000 | 42,956 | ||||
|
GCI LLC 4.75%, 10/15/2028
(b) |
50,000 | 51,238 | ||||
| Security Description | Principal
Amount |
Value | ||||
|
iHeartCommunications, Inc. 8.38%,
5/1/2027 |
$ 10,000 | $ 10,728 | ||||
|
Nexstar Broadcasting, Inc. 5.63%, 7/15/2027
(b) |
25,000 | 26,585 | ||||
|
Radiate Holdco LLC/Radiate Finance, Inc. 4.50%, 9/15/2026
(b) |
35,000 | 36,219 | ||||
|
Scripps Escrow II, Inc. 3.88%, 1/15/2029
(b) |
20,000 | 19,842 | ||||
|
Scripps Escrow, Inc. 5.88%, 7/15/2027
(b) |
55,000 | 56,949 | ||||
|
Univision Communications, Inc. 4.50%, 5/1/2029
(b) |
40,000 | 40,301 | ||||
| 434,193 | ||||||
| MINING — 0.2% | ||||||
|
Arconic Corp. 6.13%, 2/15/2028
(b) |
80,000 | 85,788 | ||||
| Glencore Funding LLC: | ||||||
|
4.00%, 4/16/2025
(b) |
40,000 | 43,681 | ||||
|
4.13%, 5/30/2023
(b) |
135,000 | 143,586 | ||||
|
4.13%, 3/12/2024
(b) |
65,000 | 70,091 | ||||
|
Novelis Corp. 4.75%, 1/30/2030
(b) |
20,000 | 20,994 | ||||
| 364,140 | ||||||
| MISCELLANEOUS MANUFACTURER — 0.0% (a) | ||||||
|
Bombardier, Inc. 6.00%, 10/15/2022
(b) |
45,000 | 45,067 | ||||
| OIL & GAS — 2.0% | ||||||
| Apache Corp.: | ||||||
|
4.38%,
10/15/2028 |
30,000 | 31,950 | ||||
|
4.63%,
11/15/2025 |
20,000 | 21,551 | ||||
|
Canacol Energy, Ltd. Series REGS, 7.25%,
5/3/2025 |
200,000 | 212,758 | ||||
|
Chesapeake Energy Corp. 5.88%, 2/1/2029
(b) |
55,000 | 59,479 | ||||
|
CNX Resources Corp. 6.00%, 1/15/2029
(b) |
35,000 | 37,838 | ||||
|
Ecopetrol SA 5.88%,
9/18/2023 |
150,000 | 162,462 | ||||
|
EQT Corp. 8.50%,
2/1/2030 |
30,000 | 39,035 | ||||
| Security Description | Principal
Amount |
Value | ||||
| Hilcorp Energy I L.P./Hilcorp Finance Co.: | ||||||
|
5.75%, 2/1/2029
(b) |
$ 25,000 | $ 26,062 | ||||
|
6.25%, 11/1/2028
(b) |
40,000 | 42,504 | ||||
|
Indigo Natural Resources LLC 5.38%, 2/1/2029
(b) |
40,000 | 41,945 | ||||
| MEG Energy Corp.: | ||||||
|
5.88%, 2/1/2029
(b) |
10,000 | 10,506 | ||||
|
7.13%, 2/1/2027
(b) |
55,000 | 58,693 | ||||
| Occidental Petroleum Corp.: | ||||||
|
6.13%,
1/1/2031 |
45,000 | 52,913 | ||||
|
6.45%,
9/15/2036 |
25,000 | 29,875 | ||||
|
6.63%,
9/1/2030 |
35,000 | 42,100 | ||||
|
8.00%,
7/15/2025 |
25,000 | 29,984 | ||||
|
ONGC Videsh, Ltd. 3.75%,
5/7/2023 |
250,000 | 260,718 | ||||
|
Ovintiv, Inc. 7.38%,
11/1/2031 |
30,000 | 39,928 | ||||
|
Parkland Corp. 4.50%, 10/1/2029
(b) |
50,000 | 50,776 | ||||
|
Pertamina Persero PT 1.40%,
2/9/2026 |
200,000 | 195,926 | ||||
|
Petrobras Global Finance B.V. 4.38%,
5/20/2023 |
200,000 | 211,888 | ||||
|
Petronas Capital, Ltd. 3.13%,
3/18/2022 |
200,000 | 203,614 | ||||
|
Pioneer Natural Resources Co. 0.55%,
5/15/2023 |
500,000 | 500,320 | ||||
|
SA Global Sukuk, Ltd. 1.60%, 6/17/2026
(b) |
200,000 | 199,470 | ||||
| Sunoco L.P./Sunoco Finance Corp.: | ||||||
|
4.50%, 5/15/2029
(b) |
20,000 | 20,411 | ||||
|
6.00%,
4/15/2027 |
70,000 | 73,434 | ||||
|
Transocean Poseidon, Ltd. 6.88%, 2/1/2027
(b) |
75,000 | 75,374 | ||||
|
Transocean, Inc. 11.50%, 1/30/2027
(b) |
15,000 | 16,032 | ||||
|
Valero Energy Corp. 1.20%,
3/15/2024 |
500,000 | 504,045 | ||||
| 3,251,591 | ||||||
| OIL & GAS SERVICES — 0.4% | ||||||
|
Schlumberger Holdings Corp. 3.75%, 5/1/2024
(b) |
460,000 | 494,859 | ||||
| Security Description | Principal
Amount |
Value | ||||
|
USA Compression Partners L.P./USA Compression Finance Corp. 6.88%,
9/1/2027 |
$ 80,000 | $ 85,475 | ||||
| 580,334 | ||||||
| PACKAGING & CONTAINERS — 0.1% | ||||||
|
Berry Global, Inc. 5.63%, 7/15/2027
(b) |
65,000 | 68,719 | ||||
|
Silgan Holdings, Inc. 4.13%,
2/1/2028 |
65,000 | 67,449 | ||||
| 136,168 | ||||||
| PHARMACEUTICALS — 0.7% | ||||||
|
AbbVie, Inc. 2.30%,
11/21/2022 |
485,000 | 497,833 | ||||
| AstraZeneca PLC: | ||||||
|
2.38%,
6/12/2022 |
55,000 | 56,017 | ||||
|
3.50%,
8/17/2023 |
419,000 | 445,049 | ||||
|
Bausch Health Cos., Inc. 6.25%, 2/15/2029
(b) |
65,000 | 64,279 | ||||
|
Endo Luxembourg Finance Co. I Sarl/Endo US, Inc. 6.13%, 4/1/2029
(b) |
30,000 | 29,406 | ||||
| 1,092,584 | ||||||
| PIPELINES — 0.5% | ||||||
|
Antero Midstream Partners L.P./Antero Midstream Finance Corp. 5.75%, 3/1/2027
(b) |
22,000 | 22,883 | ||||
|
EQM Midstream Partners L.P. 4.75%, 1/15/2031
(b) |
75,000 | 77,283 | ||||
|
Galaxy Pipeline Assets Bidco, Ltd. 1.75%,
9/30/2027 |
200,000 | 201,993 | ||||
|
Hess Midstream Operations L.P. 5.13%, 6/15/2028
(b) |
55,000 | 57,684 | ||||
|
NGL Energy Operating LLC/NGL Energy Finance Corp. 7.50%, 2/1/2026
(b) |
75,000 | 78,758 | ||||
|
NuStar Logistics L.P. 6.38%,
10/1/2030 |
45,000 | 49,710 | ||||
|
Targa Resources Partners L.P./Targa Resources Partners Finance Corp. 5.50%,
3/1/2030 |
55,000 | 60,463 | ||||
|
Transportadora de Gas del Peru SA Series REGS, 4.25%,
4/30/2028 |
200,000 | 214,684 | ||||
| Security Description | Principal
Amount |
Value | ||||
|
Western Midstream Operating L.P. 4.35%,
2/1/2025 |
$ 40,000 | $ 42,263 | ||||
| 805,721 | ||||||
| REAL ESTATE — 0.0% (a) | ||||||
| Realogy Group LLC/Realogy Co-Issuer Corp.: | ||||||
|
5.75%, 1/15/2029
(b) |
35,000 | 36,592 | ||||
|
7.63%, 6/15/2025
(b) |
30,000 | 32,548 | ||||
| 69,140 | ||||||
| REAL ESTATE INVESTMENT TRUSTS — 0.8% | ||||||
|
Iron Mountain, Inc. REIT, 4.50%, 2/15/2031
(b) |
30,000 | 30,387 | ||||
|
MGM Growth Properties Operating Partnership L.P./MGP Finance Co-Issuer, Inc. REIT, 5.75%,
2/1/2027 |
50,000 | 55,806 | ||||
|
Park Intermediate Holdings LLC/PK Domestic Property LLC/PK Finance Co-Issuer 4.88%, 5/15/2029
(b) |
40,000 | 41,410 | ||||
|
Uniti Group L.P./Uniti Group Finance, Inc./CSL Capital LLC 6.50%, 2/15/2029
(b) |
35,000 | 35,165 | ||||
|
Welltower, Inc. REIT, 3.63%,
3/15/2024 |
530,000 | 569,167 | ||||
|
WP Carey, Inc. 4.25%,
10/1/2026 |
505,000 | 567,691 | ||||
| 1,299,626 | ||||||
| RETAIL — 0.6% | ||||||
|
Ambience Merger Sub, Inc. 7.13%, 7/15/2029
(b)
(d) |
25,000 | 25,226 | ||||
| Asbury Automotive Group, Inc.: | ||||||
|
4.50%,
3/1/2028 |
5,000 | 5,172 | ||||
|
4.75%,
3/1/2030 |
5,000 | 5,227 | ||||
| Dollar Tree, Inc.: | ||||||
|
3.70%,
5/15/2023 |
360,000 | 380,318 | ||||
|
4.00%,
5/15/2025 |
155,000 | 171,063 | ||||
|
Ferrellgas L.P./Ferrellgas Finance Corp. 5.38%, 4/1/2026
(b) |
30,000 | 29,745 | ||||
|
Golden Nugget, Inc. 6.75%, 10/15/2024
(b) |
60,000 | 60,436 | ||||
|
IRB Holding Corp. 6.75%, 2/15/2026
(b) |
50,000 | 51,789 | ||||
|
SRS Distribution, Inc. 4.63%, 7/1/2028
(b) |
55,000 | 56,261 | ||||
| Security Description | Principal
Amount |
Value | ||||
|
Staples, Inc. 7.50%, 4/15/2026
(b) |
$ 35,000 | $ 36,264 | ||||
|
Suburban Propane Partners L.P./Suburban Energy Finance Corp. 5.00%, 6/1/2031
(b) |
55,000 | 56,254 | ||||
|
Superior Plus L.P./Superior General Partner, Inc. 4.50%, 3/15/2029
(b) |
70,000 | 72,088 | ||||
|
Victoria's Secret & Co. 4.63%,
7/15/2029 |
25,000 | 25,023 | ||||
| 974,866 | ||||||
| SEMICONDUCTORS — 0.7% | ||||||
|
Microchip Technology, Inc. 0.97%, 2/15/2024
(b) |
515,000 | 514,902 | ||||
|
NVIDIA Corp. 0.58%,
6/14/2024 |
545,000 | 545,283 | ||||
| 1,060,185 | ||||||
| SOFTWARE — 0.1% | ||||||
|
Clarivate Science Holdings Corp. 4.88%, 6/30/2029
(b) |
45,000 | 46,175 | ||||
|
Open Text Corp. 3.88%, 2/15/2028
(b) |
70,000 | 71,129 | ||||
| 117,304 | ||||||
| TELECOMMUNICATIONS — 1.6% | ||||||
|
AT&T, Inc. 4.45%,
4/1/2024 |
525,000 | 573,646 | ||||
|
Avaya, Inc. 6.13%, 9/15/2028
(b) |
40,000 | 42,813 | ||||
| Frontier Communications Holdings LLC: | ||||||
|
5.00%, 5/1/2028
(b) |
30,000 | 31,031 | ||||
|
5.88%, 10/15/2027
(b) |
15,000 | 16,078 | ||||
|
6.75%, 5/1/2029
(b) |
15,000 | 15,959 | ||||
|
GTT Communications, Inc. 7.88%, 12/31/2024
(b) |
30,000 | 3,102 | ||||
|
KT Corp. 1.00%,
9/1/2025 |
250,000 | 247,420 | ||||
| Lumen Technologies, Inc.: | ||||||
|
4.00%, 2/15/2027
(b) |
40,000 | 40,801 | ||||
|
5.13%, 12/15/2026
(b) |
45,000 | 46,754 | ||||
|
Millicom International Cellular SA Series REGS, 5.13%,
1/15/2028 |
180,000 | 188,415 | ||||
| Security Description | Principal
Amount |
Value | ||||
|
Sable International Finance, Ltd. 5.75%,
9/7/2027 |
$ 200,000 | $ 210,174 | ||||
|
SingTel Group Treasury Pte, Ltd. Class EMTN, 3.25%,
6/30/2025 |
200,000 | 214,485 | ||||
| T-Mobile USA, Inc.: | ||||||
|
2.88%,
2/15/2031 |
15,000 | 14,876 | ||||
|
3.38%,
4/15/2029 |
20,000 | 20,681 | ||||
|
3.38%, 4/15/2029
(b) |
10,000 | 10,332 | ||||
|
Verizon Communications, Inc. 3 Month USD LIBOR + 1.10%, 1.26%, 5/15/2025
(c) |
550,000 | 566,846 | ||||
|
VTR Comunicaciones SpA 5.13%,
1/15/2028 |
200,000 | 209,224 | ||||
| Zayo Group Holdings,Inc.: | ||||||
|
4.00%, 3/1/2027
(b) |
45,000 | 44,704 | ||||
|
6.13%, 3/1/2028
(b) |
15,000 | 15,316 | ||||
| 2,512,657 | ||||||
| TRANSPORTATION — 0.2% | ||||||
|
Kenan Advantage Group, Inc. 7.88%, 7/31/2023
(b) |
10,000 | 10,008 | ||||
| Union Pacific Corp.: | ||||||
|
3.15%,
3/1/2024 |
260,000 | 277,394 | ||||
|
3.75%,
3/15/2024 |
60,000 | 64,513 | ||||
| 351,915 | ||||||
| TRUCKING & LEASING — 0.4% | ||||||
|
Avolon Holdings Funding, Ltd. 5.13%, 10/1/2023
(b) |
60,000 | 64,867 | ||||
|
Penske Truck Leasing Co. L.P./PTL Finance Corp. 2.70%, 11/1/2024
(b) |
485,000 | 510,521 | ||||
| 575,388 | ||||||
|
TOTAL CORPORATE BONDS & NOTES (Cost
$42,834,788) |
43,357,040 | |||||
| ASSET-BACKED SECURITIES — 11.2% | ||||||
| AUTOMOBILE — 0.9% | ||||||
|
CPS Auto Receivables Trust Series 2021-A, Class D, 1.16%, 12/15/2026
(b) |
600,000 | 596,673 | ||||
|
Exeter Automobile Receivables Trust Series 2021-1A, Class C, 0.74%,
1/15/2026 |
500,000 | 499,603 | ||||
| Security Description | Principal
Amount |
Value | |||
|
Hertz Vehicle Financing LLC Series 2021-1A, Class B, 1.56%, 12/26/2025
(b) |
$ 350,000 | $ 350,919 | |||
| 1,447,195 | |||||
| OTHER ABS — 10.1% | |||||
| Affirm Asset Securitization Trust: | |||||
|
Series 2020-A, Class A, 2.10%, 2/18/2025
(b) |
750,000 | 754,644 | |||
|
Series 2020-A, Class B, 3.54%, 2/18/2025
(b) |
750,000 | 761,909 | |||
|
Ajax Mortgage Loan Trust Series 2018-E, Class A, 4.38%, 6/25/2058
(b)
(c) |
410,458 | 413,401 | |||
|
Arbor Realty Collateralized Loan Obligation 2020-FL1, Ltd. Series 2020-FL1, Class AS, 1 Month USD LIBOR + 1.400%, 1.52%, 2/15/2035
(b)
(c) |
131,000 | 130,995 | |||
|
Arbor Realty Commercial Real Estate Notes 2018-FL1, Ltd. Series 2018-FL1, Class A, 1 Month USD LIBOR + 1.15%, 1.22%, 6/15/2028
(b)
(c) |
71,000 | 71,022 | |||
|
Arbor Realty Commercial Real Estate Notes 2019-FL1, Ltd. Series 2019-FL1, Class B, 1 Month USD LIBOR + 1.700%, 1.77%, 5/15/2037
(b)
(c) |
138,000 | 138,000 | |||
|
Bain Capital Credit CLO Series 2019-1A, Class AR, 3 Month USD LIBOR + 1.13%, 1.32%, 4/19/2034
(b)
(c) |
500,000 | 499,874 | |||
|
Bain Capital Credit CLO, Ltd. Series 2020-3A, Class A, 3 Month USD LIBOR + 1.38%, 1.55%, 10/23/2032
(b)
(c) |
1,250,000 | 1,250,375 | |||
|
BDS, Ltd. Series 2019-FL4, Class A, 1 Month USD LIBOR + 1.10%, 1.18%, 8/15/2036
(b)
(c) |
100,000 | 99,939 | |||
| BSPRT Issuer, Ltd.: | |||||
|
Series 2019-FL5, Class A, 1 Month USD LIBOR + 1.15%, 1.22%, 5/15/2029
(b)
(c) |
401,000 | 400,755 | |||
|
Series 2021-FL6, Class A, 1 Month USD LIBOR + 1.100%, 1.17%, 3/15/2036
(b)
(c) |
138,000 | 137,914 | |||
|
Carlyle US CLO, Ltd Series 2021-1A, Class A1, 3 Month USD LIBOR + 1.140%, 1.33%, 4/15/2034
(b)
(c) |
1,000,000 | 999,735 | |||
|
CarVal CLO IV, Ltd. Series 2021-1A, Class A1A, 3 Month USD LIBOR + 1.18%, Zero Coupon%, 7/20/2034
(b) (c)
(d) |
500,000 | 500,000 | |||
| CHCP, Ltd.: | |||||
|
Series 2021-FL1, Class A, 1 Month USD LIBOR + 1.050%, 1.17%, 2/15/2038
(b)
(c) |
100,000 | 100,063 | |||
|
Series 2021-FL1, Class AS, 1 Month USD LIBOR + 1.300%, 1.42%, 2/15/2038
(b)
(c) |
100,000 | 100,094 |
| Security Description | Principal
Amount |
Value | |||
|
CLNC, Ltd. Series 2019-FL1, Class AS, 1 Month USD LIBOR + 1.55%, 1.67%, 8/20/2035
(b)
(c) |
$ 131,000 | $ 130,838 | |||
|
FS RIALTO Series 2021-FL2, Class A, 1 Month USD LIBOR + 1.22%, 1.29%, 4/16/2028
(b)
(c) |
150,000 | 150,047 | |||
|
FS Rialto 2019-FL1 Series 2019-FL1, Class A, 1 Month USD LIBOR + 1.20%, 1.27%, 12/16/2036
(b)
(c) |
161,000 | 160,475 | |||
|
Galaxy XXVII CLO, Ltd. Series 2018-27A, Class A, 3 Month USD LIBOR + 1.02%, 1.18%, 5/16/2031
(b)
(c) |
500,000 | 499,150 | |||
|
HalseyPoint CLO 3, Ltd. Series 2020-3A, Class A1A, 3 Month USD LIBOR + 1.45%, 1.64%, 11/30/2032
(b)
(c) |
900,000 | 904,230 | |||
|
Jamestown CLO XV, Ltd. Series 2020-15A, Class A, 3 Month USD LIBOR + 1.340%, 1.52%, 4/15/2033
(b)
(c) |
500,000 | 499,950 | |||
|
LoanCore 2018-CRE1 Issuer, Ltd. Series 2018-CRE1, Class A, 1 Month USD LIBOR + 1.13%, 1.20%, 5/15/2028
(b)
(c) |
34,617 | 34,565 | |||
|
LoanCore 2019-CRE2 Issuer, Ltd. Series 2019-CRE2, Class AS, 1 Month USD LIBOR + 1.50%, 1.57%, 5/15/2036
(b)
(c) |
100,000 | 99,876 | |||
|
Loanpal Solar Loan, Ltd. Series 2021-1GS, Class A, 2.29%, 1/20/2048
(b) |
440,255 | 441,085 | |||
|
Marathon CRE, Ltd. Series 2018-FL1, Class A, 1 Month USD LIBOR + 1.15%, 1.23%, 6/15/2028
(b)
(c) |
28,997 | 28,997 | |||
| Marlette Funding Trust: | |||||
|
Series 2019-4A, Class A, 2.39%, 12/17/2029
(b) |
105,877 | 106,367 | |||
|
Series 2019-2A, Class A, 3.13%, 7/16/2029
(b) |
40,557 | 40,684 | |||
|
Series 2021-1A, Class C, 1.41%, 6/16/2031
(b) |
650,000 | 649,177 | |||
|
MF1 Multifamily Housing Mortgage Loan Trust Series 2021-FL6, Class A, 1 Month USD LIBOR + 1.10%, 1.20%, 7/16/2036
(b)
(c) |
150,000 | 150,091 | |||
|
NLY Commercial Mortgage Trust Series 2019-FL2, Class AS, 1 Month USD LIBOR + 1.60%, 1.67%, 2/15/2036
(b)
(c) |
120,000 | 119,928 | |||
|
Northwoods Capital XVI, Ltd. Series 2017-16A, Class A, 3 Month USD LIBOR + 1.27%, 1.43%, 11/15/2030
(b)
(c) |
1,000,626 | 999,725 | |||
|
Pagaya AI Debt Selection Trust Series 2021-1, Class A, 1.18%, 11/15/2027
(b) |
395,374 | 396,223 |
| Security Description | Principal
Amount |
Value | |||
|
Sapphire Aviation Finance II, Ltd. Series 2020-1A, Class A, 3.23%, 3/15/2040
(b) |
$ 433,078 | $ 430,652 | |||
|
Shackleton CLO, Ltd. Series 2013-3A, Class AR, 3 Month USD LIBOR + 1.120%, 1.30%, 7/15/2030
(b)
(c) |
497,278 | 495,886 | |||
|
Sound Point CLO Series 2020-1A, 1.00%, 7/20/2034
(b)
(c) |
1,000,000 | 1,000,000 | |||
|
STWD, Ltd. Series 2019-FL1, Class AS, 1 Month USD LIBOR + 1.40%, 1.52%, 7/15/2038
(b)
(c) |
100,000 | 100,000 | |||
|
THL Credit Wind River CLO, Ltd. Series 2013-2A, Class AR, 3 Month USD LIBOR + 1.230%, 1.42%, 10/18/2030
(b)
(c) |
484,924 | 484,391 | |||
|
TRTX Issuer, Ltd. Series 2019-FL3, Class A, 1 Month USD LIBOR + 1.15%, 1.27%, 10/15/2034
(b)
(c) |
200,000 | 200,000 | |||
|
Upstart Securitization Trust Series 2021-1, Class A, 0.87%, 3/20/2031
(b) |
618,580 | 619,787 | |||
|
Vibrant ClO VIII, Ltd. Series 2018-8A, Class A1A, 3 Month USD LIBOR + 1.140%, 1.33%, 1/20/2031
(b)
(c) |
500,000 | 498,300 | |||
|
Washington Mutural Asset-Backed Certificates WMABS Trust Series 2006-HE5, Class 2A2, 1 Month USD LIBOR + 0.18%, 0.27%, 10/25/2036
(c) |
310,044 | 155,928 | |||
|
Wind River CLO, Ltd. Series 2014-1A, Class ARR, 3 Month USD LIBOR + 1.05%, 1.24%, 7/18/2031
(b)
(c) |
497,951 | 497,104 | |||
| 16,252,176 | |||||
| STUDENT LOAN ABS — 0.2% | |||||
|
Commonbond Student Loan Trust Series 2018-BGS, Class B, 3.99%, 9/25/2045
(b) |
222,332 | 226,874 | |||
|
Laurel Road Prime Student Loan Trust Series 2019-A, Class A1FX, 2.34%, 10/25/2048
(b) |
77,071 | 77,961 | |||
| 304,835 | |||||
|
TOTAL ASSET-BACKED SECURITIES (Cost
$17,998,200) |
18,004,206 | ||||
| FOREIGN GOVERNMENT OBLIGATIONS — 1.6% | |||||
| BRAZIL — 0.2% | |||||
|
Brazil Government International Bond 2.88%,
6/6/2025 |
250,000 | 257,525 |
| Security Description | Principal
Amount |
Value | |||
| COLOMBIA — 0.1% | |||||
|
Colombia Government International Bond 4.50%,
1/28/2026 |
$ 200,000 | $ 218,388 | |||
| INDONESIA — 0.1% | |||||
|
Perusahaan Penerbit SBSN Indonesia III Series REGS, 2.30%,
6/23/2025 |
200,000 | 207,742 | |||
| MALAYSIA — 0.2% | |||||
|
Wakala Global Sukuk Bhd Series REGS, 4.65%,
7/6/2021 |
250,000 | 250,000 | |||
| PANAMA — 0.2% | |||||
|
Panama Government International Bond 3.75%,
3/16/2025 |
250,000 | 272,102 | |||
| PERU — 0.0% (a) | |||||
|
Peruvian Government International Bond 2.39%,
1/23/2026 |
50,000 | 51,608 | |||
| SAUDI ARABIA — 0.2% | |||||
|
Saudi Government International Bond Series REGS, 2.88%,
3/4/2023 |
350,000 | 363,020 | |||
| SOUTH KOREA — 0.3% | |||||
|
Korea Development Bank 1.25%,
6/3/2025 |
200,000 | 201,684 | |||
|
Korea Electric Power Corp. Series REGS, 1.13%,
6/15/2025 |
200,000 | 199,434 | |||
| 401,118 | |||||
| THAILAND — 0.2% | |||||
|
Export Import Bank of Thailand Series EMTN, 3 Month USD LIBOR + 0.85%, 1.00%, 5/23/2024
(c) |
250,000 | 251,315 | |||
| UNITED ARAB EMIRATES — 0.1% | |||||
|
Abu Dhabi Government International Bond Series 144A, 2.50%, 4/16/2025
(b) |
200,000 | 212,542 | |||
|
TOTAL FOREIGN GOVERNMENT OBLIGATIONS (Cost
$2,468,871) |
2,485,360 |
| Security Description | Principal
Amount |
Value | |||
| U.S. GOVERNMENT AGENCY OBLIGATIONS — 25.4% | |||||
| Federal Home Loan Mortgage Corp.: | |||||
|
1.50%
2/1/2036 |
$ 7,668,758 | $ 7,765,598 | |||
|
1.50%,
3/1/2036 |
7,762,447 | 7,858,954 | |||
|
2.00%,
3/1/2036 |
1,696,360 | 1,750,713 | |||
|
2.00%,
5/1/2036 |
2,934,961 | 3,041,916 | |||
|
2.00%,
11/1/2040 |
2,423,733 | 2,472,703 | |||
|
2.00%,
5/1/2041 |
1,488,414 | 1,520,001 | |||
|
3.50%,
9/1/2032 |
371,760 | 397,850 | |||
|
Series 4211, Class AP, 1.60%,
3/15/2043 |
1,227,732 | 1,257,777 | |||
|
Series 4461, Class BA, CMO, 2.00%,
12/15/2043 |
859,081 | 881,907 | |||
|
Series 4030, Class AN, CMO, REMIC, 1.75%,
4/15/2027 |
769,181 | 782,793 | |||
|
Series 4060, Class QA, CMO, REMIC, 1.50%,
9/15/2026 |
190,854 | 192,235 | |||
|
Series 4484, Class CD, CMO, REMIC, 1.75%,
7/15/2030 |
122,083 | 124,972 | |||
|
Series 4582, Class HA, CMO, REMIC, 3.00%,
9/15/2045 |
319,118 | 332,424 | |||
|
Series K722, Class X1, IO, 1.44%, 3/25/2023
(c) |
435,233 | 7,271 | |||
| Federal National Mortgage Association: | |||||
|
1.50%,
2/1/2036 |
1,921,063 | 1,945,312 | |||
|
1.50%,
3/1/2036 |
485,118 | 491,148 | |||
|
1.50%,
5/1/2036 |
1,233,935 | 1,251,589 | |||
|
2.00%,
1/1/2036 |
948,489 | 982,452 | |||
|
2.00%,
2/1/2036 |
1,434,998 | 1,480,518 | |||
|
2.50%,
1/1/2032 |
1,401,006 | 1,469,393 | |||
|
3.00%,
11/1/2033 |
1,049,530 | 1,114,099 | |||
|
3.00%,
11/1/2036 |
248,101 | 261,800 | |||
|
12 Month USD LIBOR + 1.66%, 2.64%, 5/1/2044
(c) |
131,881 | 136,811 | |||
|
Series 2010-141, Class FB, CMO, REMIC, 1 Month USD LIBOR + 0.47%, 0.56%, 12/25/2040
(c) |
209,559 | 211,656 | |||
|
Series 2012-32, Class DA, CMO, REMIC, 2.00%,
11/25/2026 |
895,355 | 911,034 | |||
|
Series 2015-59, Class A, CMO, REMIC, 3.00%,
6/25/2041 |
11,070 | 11,070 | |||
|
Series 2016-8, Class FA, CMO, REMIC, 1 Month USD LIBOR + 0.45%, 0.54%, 3/25/2046
(c) |
363,489 | 366,096 | |||
|
Series 2017-13, Class ML, CMO, REMIC, 3.00%,
8/25/2041 |
2,601 | 2,601 | |||
|
Series 2018-27, Class FJ, CMO, REMIC, 1 Month USD LIBOR + 0.30%, 0.39%, 12/25/2047
(c) |
287,973 | 288,429 | |||
|
Series 2018-45, Class FA, CMO, REMIC, 1 Month USD LIBOR + 0.30%, 0.39%, 6/25/2048
(c) |
327,774 | 328,347 | |||
|
Series 2020-M49, Class 1A1, VRN, 1.30%, 11/25/2030
(c) |
1,094,635 | 1,092,824 | |||
|
TOTAL U.S. GOVERNMENT AGENCY OBLIGATIONS (Cost
$40,840,794) |
40,732,293 |
| Security Description | Principal
Amount |
Value | |||
| U.S. TREASURY OBLIGATIONS — 21.0% | |||||
| U.S. Treasury Bill: | |||||
|
0.07%,
8/5/2021 |
$ 5,400,000 | $ 5,399,754 | |||
|
0.07%,
2/24/2022 |
3,000,000 | 2,998,909 | |||
|
0.07%,
3/24/2022 |
6,000,000 | 5,997,872 | |||
| U.S. Treasury Note: | |||||
|
1.63%,
4/30/2023 |
5,340,000 | 5,476,212 | |||
|
2.25%,
12/31/2023 |
4,420,000 | 4,628,914 | |||
|
2.75%,
9/15/2021 |
9,100,000 | 9,150,121 | |||
|
TOTAL U.S. TREASURY OBLIGATIONS (Cost
$33,252,837) |
33,651,782 | ||||
| MORTGAGE-BACKED SECURITIES — 6.4% | |||||
|
Alternative Loan Trust Series 2006-41CB, Class 1A3, CMO, 6.00%,
1/25/2037 |
288,025 | 221,624 | |||
| Atrium Hotel Portfolio Trust: | |||||
|
Series 2017-ATRM, Class E, 1 Month USD LIBOR + 3.05%, 3.12%, 12/15/2036
(b)
(c) |
36,000 | 34,629 | |||
|
Series 2018-ATRM, Class A, 1 Month USD LIBOR + 0.95%, 1.02%, 6/15/2035
(b)
(c) |
100,000 | 100,066 | |||
|
Bancorp Commercial Mortgage Trust Series 2019-CRE5, Class A, 1 Month USD LIBOR + 1.00%, 1.07%, 3/15/2036
(b)
(c) |
12,119 | 12,119 | |||
| BANK: | |||||
|
Series 2017-BNK6, Class XA, IO, 0.95%, 7/15/2060
(c) |
1,091,410 | 40,262 | |||
|
Series 2020-BN26, Class XA, IO, VRN, 1.35%, 3/15/2063
(c) |
1,317,401 | 113,098 | |||
| BBCMS Mortgage Trust: | |||||
|
Series 2017-DELC, Class B, 1 Month USD LIBOR + 1.03%, 1.10%, 8/15/2036
(b)
(c) |
124,000 | 124,062 | |||
|
Series 2017-DELC, Class C, 1 Month USD LIBOR + 1.20%, 1.27%, 8/15/2036
(b)
(c) |
17,000 | 17,009 | |||
|
Series 2017-DELC, Class E, 1 Month USD LIBOR + 2.50%, 2.57%, 8/15/2036
(b)
(c) |
38,000 | 37,909 | |||
|
Series 2017-DELC, Class F, 1 Month USD LIBOR + 3.50%, 3.57%, 8/15/2036
(b)
(c) |
38,000 | 37,636 | |||
|
Series 2018-TALL, Class A, 1 Month USD LIBOR + 0.72%, 0.79%, 3/15/2037
(b)
(c) |
101,000 | 100,443 | |||
|
BBCMS Trust Series 2018-BXH, Class A, 1 Month USD LIBOR + 1.00%, 1.07%, 10/15/2037
(b)
(c) |
12,519 | 12,504 | |||
|
BENCHMARK Mortgage Trust Series 2018-B1, Class XA, IO, 0.65%, 1/15/2051
(c) |
2,240,780 | 60,287 |
| Security Description | Principal
Amount |
Value | |||
|
BHMS Series 2018-ATLS, Class A, 1 Month USD LIBOR + 1.25%, 1.32%, 7/15/2035
(b)
(c) |
$ 75,000 | $ 75,070 | |||
| BHP Trust: | |||||
|
Series 2019-BXHP, Class A, 1 Month USD LIBOR + 0.98%, 1.05%, 8/15/2036
(b)
(c) |
64,025 | 64,072 | |||
|
Series 2019-BXHP, Class C, 1 Month USD LIBOR + 1.52%, 1.60%, 8/15/2036
(b)
(c) |
70,000 | 70,022 | |||
|
Braemar Hotels & Resorts Trust Series 2018-PRME, Class A, 1 Month USD LIBOR + 0.82%, 0.89%, 6/15/2035
(b)
(c) |
115,000 | 114,436 | |||
| BX Trust: | |||||
|
Series 2018-BILT, Class A, 1 Month USD LIBOR + 0.80%, 0.87%, 5/15/2030
(b)
(c) |
115,000 | 115,144 | |||
|
Series 2018-EXCL, Class A, 1 Month USD LIBOR + 1.09%, 1.16%, 9/15/2037
(b)
(c) |
12,426 | 12,280 | |||
| Cantor Commercial Real Estate: | |||||
|
Series 2019-CF1, Class 65A, 4.41%, 5/15/2052
(b)
(c) |
163,000 | 169,709 | |||
|
Series 2019-CF1, Class 65B, 4.14%, 5/15/2052
(b)
(c) |
163,000 | 164,248 | |||
|
CF Trust Series 2019-MF1, Class A, 1 Month USD LIBOR + 1.05%, 2.05%, 8/21/2032
(b)
(c) |
100,000 | 99,770 | |||
| Citigroup Commercial Mortgage Trust: | |||||
|
Series 2018-TBR, Class D, 1 Month USD LIBOR + 1.80%, 1.87%, 12/15/2036
(b)
(c) |
95,000 | 94,228 | |||
|
Series 2019-PRM, Class D, 4.35%, 5/10/2036
(b) |
261,000 | 276,659 | |||
|
Series 2016-GC37, Class XA, IO, 1.85%, 4/10/2049
(c) |
433,872 | 28,186 | |||
| COMM Mortgage Trust: | |||||
|
Series 2014-FL5, Class D, 1 Month USD LIBOR + 4.00%, 4.07%, 10/15/2031
(b)
(c) |
100,000 | 95,418 | |||
|
Series 2018-HCLV, Class A, 1 Month USD LIBOR + 1.00%, 1.07%, 9/15/2033
(b)
(c) |
70,000 | 69,732 | |||
|
Series 2015-CR25, Class XA, IO, 0.97%, 8/10/2048
(c) |
1,175,667 | 34,270 | |||
| Credit Suisse Mortgage Capital Certificates: | |||||
|
Series 2017-CHOP, Class D, 1 Month USD LIBOR + 1.90%, 2.22%, 7/15/2032
(b)
(c) |
29,000 | 28,490 | |||
|
Series 2019-ICE4, Class A, 1 Month USD LIBOR + 0.98%, 1.05%, 5/15/2036
(b)
(c) |
102,000 | 102,154 | |||
| CSAIL Commercial Mortgage Trust: | |||||
|
Series 2017-C8, Class XA, IO, 1.37%, 6/15/2050
(c) |
336,444 | 14,181 | |||
|
Series 2017-CX10, Class XA, IO, 0.85%, 11/15/2050
(c) |
985,638 | 34,846 | |||
|
Series 2017-CX9, Class XA, IO, 1.00%, 9/15/2050
(c) |
1,817,004 | 43,426 | |||
| CSMC Mortgage Backed Trust: | |||||
|
Series 2020-FACT, Class C, 1 Month USD LIBOR + 2.60%, 2.67%, 10/15/2037
(b)
(c) |
200,000 | 202,000 | |||
|
Series 2020-RPL3, Class A1, CMO, 2.69%, 3/25/2060
(b)
(c) |
1,170,087 | 1,185,161 |
| Security Description | Principal
Amount |
Value | |||
|
Great Wolf Trust Series 2019-WOLF, Class E, 1 Month USD LIBOR + 2.73%, 2.81%, 12/15/2036
(b)
(c) |
$ 125,000 | $ 122,648 | |||
| GS Mortgage Securities Trust: | |||||
|
Series 2012-ALOH, Class A, 3.55%, 4/10/2034
(b) |
129,000 | 130,489 | |||
|
Series 2018-TWR, Class A, 1 Month USD LIBOR + 0.90%, 0.97%, 7/15/2031
(b)
(c) |
100,000 | 99,706 | |||
|
Series 2018-TWR, Class D, 1 Month USD LIBOR + 1.60%, 1.67%, 7/15/2031
(b)
(c) |
100,000 | 98,612 | |||
|
Series 2017-GS7, Class XA, IO, 1.26%, 8/10/2050
(c) |
387,873 | 19,985 | |||
| JP Morgan Chase Commercial Mortgage Securities Trust: | |||||
|
Series 2018-LAQ, Class A, 1 Month USD LIBOR + 1.00%, 1.07%, 6/15/2032
(b)
(c) |
37,835 | 37,869 | |||
|
Series 2019-MFP, Class A, 1 Month USD LIBOR + 0.96% , 1.03%, 7/15/2036
(b)
(c) |
107,000 | 106,987 | |||
|
Series 2016-JP4, Class XA, IO, 0.81%, 12/15/2049
(c) |
1,539,733 | 38,103 | |||
| JPMBB Commercial Mortgage Securities Trust: | |||||
|
Series 2019-COR5, Class XA, IO, VRN, 1.65%, 6/13/2052
(c) |
1,122,162 | 99,688 | |||
|
Series 2014-C25, Class B, VRN, 4.35%, 11/15/2047
(c) |
150,000 | 161,249 | |||
|
LoanCore 2019-CRE3 Issuer, Ltd. Series 2019-CRE3, Class AS, 1 Month USD LIBOR + 1.37%, 1.44%, 4/15/2034
(b)
(c) |
117,900 | 117,753 | |||
|
MF1 2019-FL2, Ltd. Series 2019-FL2, Class A, 1 Month USD LIBOR + 1.13%, 1.26%, 12/25/2034
(b)
(c) |
42,841 | 42,841 | |||
|
MF1 2020-FL3, Ltd. Series 2020-FL3, Class A, 1 Month USD LIBOR + 2.05%, 2.17%, 7/15/2035
(b)
(c) |
146,955 | 148,331 | |||
| Morgan Stanley Bank of America Merrill Lynch Trust: | |||||
|
Series 2014-C15, Class XA, IO, 1.10%, 4/15/2047
(c) |
749,057 | 14,692 | |||
|
Series 2014-C19, Class LNCX, IO, 0.76%, 12/15/2046
(b)
(c) |
1,176,612 | 22,557 | |||
| Morgan Stanley Capital I Trust: | |||||
|
Series 2018-SUN, Class A, 1 Month USD LIBOR + 0.90%, 0.97%, 7/15/2035
(b)
(c) |
74,000 | 74,095 | |||
|
Series 2019-PLND, Class B, 1 Month USD LIBOR + 1.30%, 1.37%, 5/15/2036
(b)
(c) |
163,000 | 160,035 | |||
|
Series 2019-PLND, Class D, 1 Month USD LIBOR + 1.75%, 1.82%, 5/15/2036
(b)
(c) |
127,000 | 121,760 | |||
|
Series 2016-UB12, Class XA, IO, 0.85%, 12/15/2049
(c) |
1,531,883 | 42,009 | |||
|
Morgan Stanley Captial I Trust Series 2021-L6, 2.13%,
6/15/2054 |
151,000 | 155,526 | |||
|
Motel 6 Trust Series 2017-MTL6, Class D, 1 Month USD LIBOR + 2.15%, 2.22%, 8/15/2034
(b)
(c) |
31,116 | 31,177 | |||
|
MSCG Trust Series 2018-SELF, Class A, 1 Month USD LIBOR + 0.90%, 0.97%, 10/15/2037
(b)
(c) |
79,000 | 79,058 |
| Security Description | Principal
Amount |
Value | |||
| Natixis Commercial Mortgage Securities Trust: | |||||
|
Series 2018-850T, Class C, 1 Month USD LIBOR + 1.15%, 1.23%, 7/15/2033
(b)
(c) |
$ 100,000 | $ 98,754 | |||
|
Series 2018-850T, Class D, 1 Month USD LIBOR + 1.45%, 1.53%, 7/15/2033
(b)
(c) |
100,000 | 96,727 | |||
|
Series 2018-FL1, Class A, 1 Month USD LIBOR + 0.95%, 1.02%, 6/15/2035
(b)
(c) |
92,420 | 91,263 | |||
| PFP, Ltd.: | |||||
|
Series 2019-5, Class A, 1 Month USD LIBOR + 0.97%, 1.04%, 4/14/2036
(b)
(c) |
36,171 | 36,148 | |||
|
Series 2019-6, Class A, 1 Month USD LIBOR + 1.05%, 1.12%, 4/14/2037
(b)
(c) |
68,728 | 68,685 | |||
|
ReadyCap Commercial Mortgage Trust Series 2019-FL3, Class A, 1 Month USD LIBOR + 1.00%, 1.09%, 3/25/2034
(b)
(c) |
53,242 | 53,263 | |||
|
Shelter Growth CRE Issuer, Ltd. Series 2019-FL2, Class B, 1 Month USD LIBOR + 2.30%, 1.87%, 5/15/2036
(b)
(c) |
85,000 | 84,358 | |||
|
Toorak Mortgage Corp., Ltd. Series 2020-1, Class A1, 2.73%, 3/25/2023
(b)
(e) |
1,000,000 | 1,005,244 | |||
| UBS Commercial Mortgage Trust: | |||||
|
Series 2018-NYCH, Class D, 1 Month USD LIBOR + 2.10%, 2.17%, 2/15/2032
(b)
(c) |
261,000 | 260,415 | |||
|
Series 2017-C1, Class XA, IO, 1.68%, 6/15/2050
(c) |
718,730 | 48,617 | |||
|
Velocity Commercial Capital Loan Trust Series 2018-2, Class A, 4.05%, 10/26/2048
(b)
(c) |
502,205 | 521,572 | |||
|
Volt Xcix LLC Series 2021-NPL8, Class A1, 2.12%, 4/25/2051
(b)
(e) |
1,451,240 | 1,454,686 | |||
|
Washington Mutual Mortgage Pass-Through Certificates WMALT Series 2005-8, Class 2CB3, CMO, 1 Month USD LIBOR + 0.41%, 0.50%, 10/25/2035
(c) |
420,901 | 388,448 | |||
|
Wells Fargo Commercial Mortgage Trust Series 2019-C51, Class XA, IO, VRN, 1.51%, 6/15/2052
(c) |
1,000,068 | 78,166 | |||
|
WFRBS Commercial Mortgage Trust Series 2013-C18, Class XA, IO, 0.95%, 12/15/2046
(c) |
813,178 | 13,481 | |||
|
TOTAL MORTGAGE-BACKED SECURITIES (Cost
$10,716,636) |
10,230,147 | ||||
| COMMERCIAL MORTGAGE BACKED SECURITIES — 1.2% | |||||
|
Arbor Multifamily Mortgage Securities Trust 2021-MF2 Series 2021-MF2, Class A2, 2.02%, 6/15/2054
(b) |
139,000 | 142,072 | |||
|
Bancorp Commercial Mortgage Trust Series 2019-CRE5, Class B, 1 Month USD LIBOR + 1.500%, 1.57%, 3/15/2036
(b)
(c) |
150,000 | 149,910 |
| Security Description | Principal
Amount |
Value | |||
|
BX Trust Series 2021-VIEW, Class A, 1 Month USD LIBOR + 1.28%, 1.43%, 6/15/2023
(b)
(c) |
$ 138,000 | $ 138,178 | |||
| BXMT, Ltd.: | |||||
|
Series 2020-FL2, Class A, 1 Month USD LIBOR + 0.90%, 1.02%, 2/15/2038
(b)
(c) |
138,000 | 137,871 | |||
|
Series 2021-FL4, Class A, 1 Month USD LIBOR + 1.05%, 1.12%, 5/15/2038
(b)
(c) |
138,000 | 138,000 | |||
|
DBGS Mortgage Trust Series 2018-5BP, Class D, 1 Month USD LIBOR + 1.35%, 1.57%, 6/15/2033
(b)
(c) |
136,000 | 135,461 | |||
|
Extended Stay America Trust Series 2021-ESH, Class A, 1 Month USD LIBOR + 1.08%, 1.16%, 7/15/2038
(b) (c)
(d) |
150,000 | 150,295 | |||
|
GPMT, Ltd. Series 2021-FL3, Class A, 1 Month USD LIBOR + 1.25%, 1.33%, 7/16/2035
(b)
(c) |
100,000 | 100,065 | |||
| MF1 Multifamily Housing Mortgage Loan Trust: | |||||
|
Series 2021-FL5, Class A, 1 Month USD LIBOR + 0.85%, 0.97%, 7/15/2036
(b)
(c) |
138,000 | 137,871 | |||
|
Series 2021-FL5, Class AS, 1 Month USD LIBOR + 1.20%, 1.32%, 7/15/2036
(b)
(c) |
138,000 | 137,871 | |||
|
MHC Commercial Mortgage Trust Series 2021-MHC, Class A, 1 Month USD LIBOR + 0.80%, 0.87%, 4/15/2038
(b)
(c) |
150,000 | 150,119 | |||
|
Tharaldson Hotel Portfolio Trust Series 2018-THL, Class B, 1 Month USD LIBOR + 1.25%, 1.33%, 11/11/2034
(b)
(c) |
110,171 | 110,201 | |||
|
TTAN 2021-MHC Series 2021-MHC, Class A, 1 Month USD LIBOR + 0.85%, 0.92%, 3/15/2038
(b)
(c) |
138,000 | 138,158 | |||
| Wells Fargo Commercial Mortgage Trust: | |||||
|
Series 2021-SAVE, Class A, 1 Month USD LIBOR + 1.150%, 1.22%, 2/15/2040
(b)
(c) |
90,902 | 91,297 | |||
|
Series 2021-SAVE, Class B, 1 Month USD LIBOR + 1.450%, 1.52%, 2/15/2040
(b)
(c) |
90,902 | 91,190 | |||
|
TOTAL COMMERCIAL MORTGAGE BACKED SECURITIES (Cost
$1,946,527) |
1,948,559 |
| Shares | |||
| SHORT-TERM INVESTMENT — 9.1% | |||
|
State Street Institutional U.S. Government Money Market Fund, Class G Shares 0.03% (f) (g) (Cost
$14,576,244) |
14,576,244 | 14,576,244 | |
|
TOTAL INVESTMENTS — 103.0% (Cost
$164,634,897) |
164,985,631 | ||
|
LIABILITIES IN EXCESS OF OTHER ASSETS — (3.0)%
|
(4,746,957) | ||
|
NET ASSETS —
100.0% |
$ 160,238,674 | ||
| (a) | Amount is less than 0.05% of net assets. |
| (b) | Securities purchased pursuant to Rule 144A of the Securities Act of 1933, as amended. These securities, which represent 24.9% of net assets as of June 30, 2021, are considered liquid and may be resold in transactions exempt from registration, normally to qualified institutional buyers. |
| (c) | Variable Rate Security - Interest rate shown is rate in effect at June 30, 2021. For securities based on a published reference rate and spread, the reference rate and spread are indicated in the description above. |
| (d) | When-issued security. |
| (e) | Step-up bond - Coupon rate increases in increments to maturity. Rate shown as of June 30, 2021. Maturity date shown is the final maturity. |
| (f) | The Fund invested in certain money market funds managed by SSGA Funds Management, Inc. Amounts related to these transactions during the period ended June 30, 2021 are shown in the Affiliate Table below. |
| (g) | The rate shown is the annualized seven-day yield at June 30, 2021. |
| ABS | Asset-Backed Security |
| CLO | Collateralized Loan Obligation |
| CMO | Collateralized Mortgage Obligation |
| CMT | Constant Maturity Treasury |
| EMTN | Euro Medium Term Note |
| GMTN | Global Medium Term Note |
| IO | Interest Only |
| LIBOR | London Interbank Offered Rate |
| MTN | Medium Term Note |
| REIT | Real Estate Investment Trust |
| REMIC | Real Estate Mortgage Investment Conduit |
| SOFR | Secured Overnight Financing Rate |
| VRN | Variable Rate Note |
| Description | Level
1 – Quoted Prices |
Level
2 – Other Significant Observable Inputs |
Level
3 – Significant Unobservable Inputs |
Total | ||||
| ASSETS: | ||||||||
| INVESTMENTS: | ||||||||
|
Corporate Bonds &
Notes |
$ — | $ 43,357,040 | $— | $ 43,357,040 | ||||
|
Asset-Backed
Securities |
— | 18,004,206 | — | 18,004,206 | ||||
|
Foreign Government
Obligations |
— | 2,485,360 | — | 2,485,360 | ||||
|
U.S. Government Agency
Obligations |
— | 40,732,293 | — | 40,732,293 | ||||
|
U.S. Treasury
Obligations |
— | 33,651,782 | — | 33,651,782 | ||||
|
Mortgage-Backed
Securities |
— | 10,230,147 | — | 10,230,147 | ||||
|
Commercial Mortgage Backed
Securities |
— | 1,948,559 | — | 1,948,559 | ||||
|
Short-Term
Investment |
14,576,244 | — | — | 14,576,244 | ||||
|
TOTAL
INVESTMENTS |
$14,576,244 | $150,409,387 | $— | $164,985,631 |
| Number
of Shares Held at 6/30/20 |
Value
at 6/30/20 |
Cost
of Purchases |
Proceeds
from Shares Sold |
Realized
Gain (Loss) |
Change
in Unrealized Appreciation/ Depreciation |
Number
of Shares Held at 6/30/21 |
Value
at 6/30/21 |
Dividend
Income | |||||||||
|
State Street Institutional U.S. Government Money Market Fund, Class G
Shares |
3,357,926 | $3,357,926 | $76,451,191 | $65,232,873 | $— | $— | 14,576,244 | $14,576,244 | $3,418 |
| Security Description | Principal
Amount |
Value | |||
| CORPORATE BONDS & NOTES — 14.5% | |||||
| ARGENTINA — 0.1% | |||||
|
AES Argentina Generacion SA Series REGS, 7.75%,
2/2/2024 |
$ 500,000 | $ 425,520 | |||
| Banco Macro SA: | |||||
|
USD 5 Year Swap Rate + 5.46%, 6.75%, 11/4/2026
(a)
(b) |
450,000 | 374,364 | |||
|
Series REGS, USD 5 Year Swap Rate + 5.46%, 6.75%, 11/4/2026
(b) |
1,150,000 | 956,708 | |||
| Pampa Energia SA: | |||||
|
Series REGS, 7.50%,
1/24/2027 |
2,000,000 | 1,802,940 | |||
|
Series REGS, 9.13%,
4/15/2029 |
150,000 | 136,815 | |||
| 3,696,347 | |||||
| AUSTRALIA — 0.2% | |||||
|
Glencore Funding LLC 1.63%, 4/27/2026
(a) |
1,900,000 | 1,905,738 | |||
| Macquarie Group, Ltd.: | |||||
|
3 Month USD LIBOR + 1.33%, 4.15%, 3/27/2024
(a)
(b) |
1,810,000 | 1,916,319 | |||
|
SOFR + 0.91%, 1.63%, 9/23/2027
(a)
(b) |
1,915,000 | 1,906,019 | |||
| 5,728,076 | |||||
| BELGIUM — 0.1% | |||||
|
Anheuser-Busch InBev Worldwide, Inc. 5.55%,
1/23/2049 |
1,405,000 | 1,931,819 | |||
| BRAZIL — 0.4% | |||||
|
Banco BTG Pactual SA 5 Year CMT + 5.26%, 7.75%, 2/15/2029
(a)
(b) |
400,000 | 436,636 | |||
|
Banco do Brasil SA Series REGS, 10 Year CMT + 4.40%, 6.25%, 4/15/2024
(b) |
200,000 | 204,408 | |||
|
Banco do Estado do Rio Grande do Sul SA Series REGS, VRN, 5 year CMT + 4.93%, 5.38%, 1/28/2031
(b) |
700,000 | 715,869 | |||
|
Braskem Netherlands Finance BV VRN, 5 year CMT + 8.22%, 8.50%, 1/23/2081
(a)
(b) |
800,000 | 933,768 | |||
|
Cosan Overseas, Ltd. 8.25%,
8/5/2021 |
4,314,000 | 4,421,850 |
| Security Description | Principal
Amount |
Value | |||
|
CSN Islands XII Corp. Series REGS, 7.00%,
9/23/2021 |
$ 1,750,000 | $ 1,764,735 | |||
| Itau Unibanco Holding SA: | |||||
|
VRN, 5 Year CMT + 3.22%, 4.63%, 2/27/2025
(a)
(b) |
200,000 | 192,522 | |||
|
Series REGS, VRN, 5 year CMT + 3.22%, 4.63%, 2/27/2025
(b) |
200,000 | 192,522 | |||
|
Minerva Luxembourg SA 4.38%, 3/18/2031
(a) |
1,200,000 | 1,192,920 | |||
| Petrobras Global Finance B.V.: | |||||
|
5.50%,
6/10/2051 |
300,000 | 300,045 | |||
|
6.75%,
6/3/2050 |
2,600,000 | 3,035,500 | |||
|
Suzano Austria GmbH 3.13%, 1/15/2032
(c) |
350,000 | 346,356 | |||
| 13,737,131 | |||||
| CANADA — 0.5% | |||||
| Bank of Nova Scotia: | |||||
|
1.63%,
5/1/2023 |
1,485,000 | 1,518,116 | |||
|
3.40%,
2/11/2024 |
400,000 | 428,356 | |||
| Bombardier, Inc.: | |||||
|
6.00%, 10/15/2022
(a) |
300,000 | 300,444 | |||
|
7.88%, 4/15/2027
(a) |
350,000 | 362,824 | |||
|
Canadian Natural Resources, Ltd. 2.95%,
1/15/2023 |
1,945,000 | 2,015,214 | |||
| Garda World Security Corp.: | |||||
|
4.63%, 2/15/2027
(a) |
615,000 | 617,386 | |||
|
6.00%, 6/1/2029
(a) |
480,000 | 476,002 | |||
| GFL Environmental, Inc.: | |||||
|
3.75%, 8/1/2025
(a) |
275,000 | 282,516 | |||
|
4.00%, 8/1/2028
(a) |
585,000 | 578,144 | |||
|
Intelligent Packaging, Ltd. Finco, Inc./Intelligent Packaging, Ltd. Co-Issuer LLC 6.00%, 9/15/2028
(a) |
225,000 | 234,740 | |||
| Kronos Acquisition Holdings, Inc./KIK Custom Products, Inc.: | |||||
|
5.00%, 12/31/2026
(a) |
975,000 | 994,315 | |||
|
7.00%, 12/31/2027
(a) |
525,000 | 526,738 | |||
|
Mattamy Group Corp. 4.63%, 3/1/2030
(a) |
395,000 | 404,247 | |||
| MEG Energy Corp.: | |||||
|
5.88%, 2/1/2029
(a) |
95,000 | 99,811 | |||
|
7.13%, 2/1/2027
(a) |
460,000 | 490,889 |
| Security Description | Principal
Amount |
Value | |||
|
Parkland Corp. 4.50%, 10/1/2029
(a) |
$ 435,000 | $ 441,751 | |||
|
Primo Water Holdings, Inc. 4.38%, 4/30/2029
(a) |
475,000 | 475,095 | |||
|
Royal Bank of Canada Series GMTN, 2.55%,
7/16/2024 |
4,135,000 | 4,362,921 | |||
|
Superior Plus L.P./Superior General Partner, Inc. 4.50%, 3/15/2029
(a) |
615,000 | 633,345 | |||
| Telesat Canada/Telesat LLC: | |||||
|
4.88%, 6/1/2027
(a) |
255,000 | 246,911 | |||
|
6.50%, 10/15/2027
(a) |
260,000 | 247,728 | |||
|
Tervita Corp. 11.00%, 12/1/2025
(a) |
395,000 | 441,966 | |||
|
Titan Acquisition, Ltd./Titan Co-Borrower LLC 7.75%, 4/15/2026
(a) |
155,000 | 160,702 | |||
| 16,340,161 | |||||
| CAYMAN ISLANDS — 0.0% (d) | |||||
|
Global Aircraft Leasing Co., Ltd. PIK, 6.50%, 9/15/2024
(a) |
563,752 | 565,387 | |||
| CHILE — 0.3% | |||||
| AES Gener SA: | |||||
|
5 Year CMT + 4.92%, 6.35%, 10/7/2079
(a)
(b) |
200,000 | 213,486 | |||
|
USD 5 Year Swap Rate + 4.64%, 7.13%, 3/26/2079
(a)
(b) |
400,000 | 428,992 | |||
|
Series REGS, USD 5 Year Swap Rate + 4.64%, 7.13%, 3/26/2079
(b) |
1,600,000 | 1,715,968 | |||
|
Antofagasta PLC Series REGS, 2.38%,
10/14/2030 |
600,000 | 578,562 | |||
|
CAP SA 3.90%, 4/27/2031
(a) |
600,000 | 600,168 | |||
|
Chile Electricity PEC SpA Zero Coupon%, 1/25/2028
(a) |
1,200,000 | 972,312 | |||
|
Empresa Electrica Angamos SA Series REGS, 4.88%,
5/25/2029 |
1,391,000 | 1,397,955 | |||
|
Empresa Electrica Cochrane SpA Series REGS, 5.50%,
5/14/2027 |
894,390 | 926,409 | |||
|
Empresa Electrica Guacolda SA Series REGS, 4.56%,
4/30/2025 |
1,900,000 | 1,355,707 |
| Security Description | Principal
Amount |
Value | |||
|
VTR Finance NV Series REGS, 6.38%,
7/15/2028 |
$ 200,000 | $ 212,962 | |||
| 8,402,521 | |||||
| CHINA — 0.2% | |||||
|
Baidu, Inc. 3.43%,
4/7/2030 |
200,000 | 216,942 | |||
|
ENN Energy Holdings, Ltd. 3.25%,
7/24/2022 |
200,000 | 204,144 | |||
|
JD.com, Inc. 3.38%,
1/14/2030 |
1,800,000 | 1,922,562 | |||
|
State Grid Overseas Investment 2013, Ltd. Series REGS, 3.13%,
5/22/2023 |
500,000 | 521,660 | |||
|
State Grid Overseas Investment 2016, Ltd. Series EMTN, 1.00%,
8/5/2025 |
200,000 | 197,576 | |||
|
Tencent Holdings, Ltd. 2.39%, 6/3/2030
(a) |
2,100,000 | 2,092,545 | |||
| 5,155,429 | |||||
| COLOMBIA — 0.2% | |||||
|
AI Candelaria Spain SLU 5.75%, 6/15/2033
(a) |
900,000 | 926,721 | |||
|
Banco Davivienda SA VRN, 10 Year CMT + 5.08%, 6.65%, 4/22/2031
(a)
(b) |
600,000 | 628,806 | |||
| Empresas Publicas de Medellin ESP: | |||||
|
Series REGS, 4.25%,
7/18/2029 |
1,100,000 | 1,096,491 | |||
|
Series REGS, 4.38%,
2/15/2031 |
800,000 | 792,080 | |||
|
Gran Tierra Energy International Holdings, Ltd. Series REGS, 6.25%,
2/15/2025 |
2,600,000 | 2,308,540 | |||
|
Grupo Aval, Ltd. 4.38%, 2/4/2030
(a) |
300,000 | 296,373 | |||
| 6,049,011 | |||||
| DOMINICAN REPUBLIC — 0.1% | |||||
|
Banco de Reservas de la Republica Dominicana Series REGS, 7.00%,
2/1/2023 |
1,900,000 | 1,993,746 | |||
|
Empresa Generadora de Electricidad Itabo SA 7.95%, 5/11/2026
(a) |
918,000 | 924,940 | |||
| 2,918,686 |
| Security Description | Principal
Amount |
Value | |||
| FRANCE — 0.1% | |||||
| Altice France SA: | |||||
|
5.13%, 7/15/2029
(a) |
$ 680,000 | $ 687,773 | |||
|
7.38%, 5/1/2026
(a) |
321,000 | 333,692 | |||
|
TotalEnergies Capital International SA 3.39%,
6/29/2060 |
1,975,000 | 2,085,442 | |||
| 3,106,907 | |||||
| GERMANY — 0.0% (d) | |||||
|
TK Elevator US Newco, Inc. 5.25%, 7/15/2027
(a) |
700,000 | 737,387 | |||
| GUATEMALA — 0.0% (d) | |||||
|
Investment Energy Resources, Ltd. 6.25%, 4/26/2029
(a) |
250,000 | 270,477 | |||
| INDIA — 0.3% | |||||
|
Adani International Container Terminal Pvt., Ltd. Series REGS, 3.00%,
2/16/2031 |
300,000 | 289,567 | |||
|
Adani Ports & Special Economic Zone, Ltd. Series REGS, 4.38%,
7/3/2029 |
400,000 | 417,776 | |||
|
JSW Hydro Energy, Ltd. 4.13%, 5/18/2031
(a) |
400,000 | 405,200 | |||
|
Network i2i, Ltd. 5 Year CMT + 4.28%, 5.65%, 1/15/2025
(a)
(b) |
900,000 | 960,912 | |||
|
ONGC Videsh Vankorneft Pte, Ltd. 3.75%,
7/27/2026 |
2,200,000 | 2,344,415 | |||
|
UPL Corp., Ltd. 4.50%,
3/8/2028 |
1,300,000 | 1,393,288 | |||
|
Vedanta Resources Finance II PLC 9.25%, 4/23/2026
(a) |
1,400,000 | 1,231,832 | |||
|
Vedanta Resources, Ltd. Series REGS, 6.13%,
8/9/2024 |
2,400,000 | 2,012,640 | |||
| 9,055,630 | |||||
| INDONESIA — 0.1% | |||||
|
Medco Bell Pte, Ltd. 6.38%, 1/30/2027
(a) |
600,000 | 619,548 | |||
| Minejesa Capital B.V.: | |||||
|
Series REGS, 4.63%,
8/10/2030 |
1,200,000 | 1,271,604 |
| Security Description | Principal
Amount |
Value | |||
|
Series REGS, 5.63%,
8/10/2037 |
$ 2,200,000 | $ 2,385,922 | |||
| 4,277,074 | |||||
| IRELAND — 0.1% | |||||
| Avolon Holdings Funding, Ltd.: | |||||
|
2.13%, 2/21/2026
(a) |
1,065,000 | 1,055,703 | |||
|
3.25%, 2/15/2027
(a) |
850,000 | 877,098 | |||
| 1,932,801 | |||||
| JAMAICA — 0.0% (d) | |||||
| Digicel Group Holdings, Ltd.: | |||||
|
PIK, 7.00%, 10/1/2169
(a) |
611,353 | 472,332 | |||
|
PIK, 8.00%, 4/1/2025
(a) |
835,317 | 708,407 | |||
| 1,180,739 | |||||
| JAPAN — 0.1% | |||||
|
Mitsubishi UFJ Financial Group, Inc. 3 Month USD LIBOR + 0.74%, 0.87%, 3/2/2023
(b) |
1,845,000 | 1,860,480 | |||
| KUWAIT — 0.0% (d) | |||||
|
MEGlobal Canada ULC 5.00%, 5/18/2025
(a) |
500,000 | 560,485 | |||
| LUXEMBOURG — 0.0% (d) | |||||
|
Altice Financing SA 5.00%, 1/15/2028
(a) |
240,000 | 236,181 | |||
|
Altice France Holding SA 6.00%, 2/15/2028
(a) |
430,000 | 427,433 | |||
|
ARD Finance SA PIK, 6.50%, 6/30/2027
(a) |
200,000 | 209,856 | |||
| 873,470 | |||||
| MALAYSIA — 0.1% | |||||
|
Malayan Banking Bhd USD 5 Year Swap Rate + 2.54%, 3.91%, 10/29/2026
(b) |
2,500,000 | 2,518,400 | |||
| Petronas Capital, Ltd.: | |||||
|
2.48%, 1/28/2032
(a) |
200,000 | 201,064 | |||
|
3.50%, 4/21/2030
(a) |
400,000 | 437,516 | |||
| 3,156,980 |
| Security Description | Principal
Amount |
Value | |||
| MEXICO — 0.3% | |||||
| Banco Mercantil del Norte SA: | |||||
|
10 year CMT + 5.47%, 7.50%, 6/27/2029
(a)
(b) |
$ 1,600,000 | $ 1,809,376 | |||
|
Series REGS, 10 Year CMT + 5.35%, 7.63%, 10/6/2169
(b) |
800,000 | 906,576 | |||
|
BBVA Bancomer SA Series REGS, 5 Year CMT + 2.65%, 5.13%, 1/18/2033
(b) |
1,600,000 | 1,669,904 | |||
| Credito Real SAB de CV: | |||||
|
9.50%, 2/7/2026
(a) |
600,000 | 561,894 | |||
|
Series REGS, 5 Year CMT + 7.03%, 9.13%, 11/29/2022
(b) |
1,500,000 | 1,059,165 | |||
|
Grupo Idesa SA de CV PIK, 10.13%, 5/22/2026
(a) |
1,509,859 | 862,311 | |||
|
Mexarrend SAPI de CV 10.25%, 7/24/2024
(a) |
1,182,000 | 1,110,548 | |||
|
Unifin Financiera SAB de CV Series REGS, 5 Year CMT + 6.31%, 8.88%, 1/29/2025
(b) |
3,700,000 | 2,764,862 | |||
| 10,744,636 | |||||
| NETHERLANDS — 0.0% (d) | |||||
|
Nouryon Holding B.V. 8.00%, 10/1/2026
(a) |
150,000 | 159,000 | |||
| PANAMA — 0.2% | |||||
| AES Panama Generation Holdings SRL: | |||||
|
4.38%, 5/31/2030
(a) |
300,000 | 314,079 | |||
|
Series REGS, 4.38%,
5/31/2030 |
600,000 | 628,158 | |||
|
Banco General SA VRN, 10 Year CMT + 3.67%, 5.25%, 5/7/2031
(a)
(b) |
1,000,000 | 1,038,700 | |||
|
Banco Nacional de Panama 2.50%, 8/11/2030
(a) |
300,000 | 290,328 | |||
|
Global Bank Corp. 3 Month USD LIBOR + 3.30%, 5.25%, 4/16/2029
(a)
(b) |
1,400,000 | 1,473,290 | |||
| UEP Penonome II SA: | |||||
|
6.50%, 10/1/2038
(a) |
838,075 | 859,287 | |||
|
Series REGS, 6.50%,
10/1/2038 |
394,388 | 404,370 | |||
| 5,008,212 |
| Security Description | Principal
Amount |
Value | |||
| PERU — 0.2% | |||||
| Banco de Credito del Peru: | |||||
|
VRN, 5 year CMT + 3.00%, 3.13%, 7/1/2030
(a)
(b) |
$ 700,000 | $ 696,192 | |||
|
5 year CMT + 3.00%, 3.13%, 7/1/2030
(b) |
300,000 | 298,368 | |||
|
Banco Internacional del Peru SAA Interbank Series REGS, VRN, 1 year CMT + 3.71%, 4.00%, 7/8/2030
(b) |
1,200,000 | 1,184,304 | |||
|
Fenix Power Peru SA Series REGS, 4.32%,
9/20/2027 |
344,706 | 350,607 | |||
|
Hunt Oil Co. of Peru LLC Sucursal Del Peru Series REGS, 6.38%,
6/1/2028 |
1,100,000 | 1,159,521 | |||
|
Nexa Resources SA Series REGS, 5.38%,
5/4/2027 |
400,000 | 429,712 | |||
|
Orazul Energy Egenor SCA 5.63%,
4/28/2027 |
200,000 | 206,400 | |||
|
Peru LNG S.r.l. Series REGS, 5.38%,
3/22/2030 |
1,900,000 | 1,636,489 | |||
|
Scotiabank Peru SAA Series REGS, 3 Month USD LIBOR + 3.86%, 4.50%, 12/13/2027
(b) |
200,000 | 204,664 | |||
| 6,166,257 | |||||
| PHILIPPINES — 0.1% | |||||
|
BDO Unibank, Inc. Series EMTN, 2.95%,
3/6/2023 |
3,000,000 | 3,098,400 | |||
| QATAR — 0.0% (d) | |||||
| Ooredoo International Finance, Ltd.: | |||||
|
Series REGS, 3.25%,
2/21/2023 |
300,000 | 312,756 | |||
|
Series REGS, 3.75%,
6/22/2026 |
200,000 | 220,606 | |||
| 533,362 | |||||
| SAUDI ARABIA — 0.0% (d) | |||||
|
SA Global Sukuk, Ltd. 2.69%, 6/17/2031
(a) |
600,000 | 606,978 | |||
| SINGAPORE — 0.4% | |||||
|
Avation Capital SA PIK, 8.25%, 10/31/2026
(a) |
260,000 | 214,224 |
| Security Description | Principal
Amount |
Value | |||
| DBS Group Holdings, Ltd.: | |||||
|
Series GMTN, USD 5 Year Swap Rate + 2.39%, 3.60%, 9/7/2021
(b) |
$ 3,000,000 | $ 3,007,500 | |||
|
Series GMTN, VRN, 5 year CMT + 1.10%, 1.82%, 3/10/2031
(b) |
400,000 | 398,672 | |||
|
Series REGS, VRN, USD 5 year ICE Swap Rate + 1.59%, 4.52%, 12/11/2028
(b) |
500,000 | 539,395 | |||
| Oversea-Chinese Banking Corp., Ltd.: | |||||
|
VRN, 5 year CMT + 1.58%, 1.83%, 9/10/2030
(a)
(b) |
700,000 | 699,496 | |||
|
Series REGS, VRN, 5 year CMT + 1.58%, 1.83%, 9/10/2030
(b) |
900,000 | 899,352 | |||
|
PSA Treasury Pte, Ltd. Series GMTN, 2.13%,
9/5/2029 |
1,100,000 | 1,121,241 | |||
| Temasek Financial I, Ltd.: | |||||
|
1.00%, 10/6/2030
(a) |
2,900,000 | 2,719,591 | |||
|
Series REGS, 1.00%,
10/6/2030 |
250,000 | 234,448 | |||
| United Overseas Bank, Ltd.: | |||||
|
Series EMTN, USD 5 Year Swap Rate + 1.79%, 3.88%, 10/19/2023
(b) |
400,000 | 416,700 | |||
|
Series EMTN, USD 5 Year Swap Rate + 2.24%, 3.50%, 9/16/2026
(b) |
2,000,000 | 2,009,400 | |||
| 12,260,019 | |||||
| SOUTH KOREA — 0.2% | |||||
| Korea East-West Power Co., Ltd.: | |||||
|
1.75%, 5/6/2025
(a) |
300,000 | 306,294 | |||
|
Series REGS, 1.75%,
5/6/2025 |
1,800,000 | 1,837,764 | |||
| KT Corp.: | |||||
|
1.00%,
9/1/2025 |
200,000 | 197,936 | |||
|
Series REGS, 2.50%,
7/18/2026 |
1,000,000 | 1,048,980 | |||
|
LG Chem, Ltd. 2.38%, 7/7/2031
(a)
(c) |
250,000 | 249,215 | |||
|
NongHyup Bank 1.25%, 7/20/2025
(a) |
1,000,000 | 1,001,030 | |||
| POSCO: | |||||
|
Series REGS, 2.38%,
1/17/2023 |
700,000 | 716,681 | |||
|
Series REGS, 2.75%,
7/15/2024 |
800,000 | 840,784 |
| Security Description | Principal
Amount |
Value | |||
|
Shinhan Financial Group Co., Ltd. VRN, 5 year CMT + 2.06%, 2.88%, 5/12/2026
(a)
(b) |
$ 900,000 | $ 895,464 | |||
|
Woori Bank Series REGS, VRN, 5 year CMT + 2.66%, 4.25%, 10/4/2024
(b) |
1,000,000 | 1,038,360 | |||
| 8,132,508 | |||||
| THAILAND — 0.1% | |||||
|
Bangkok Bank PCL VRN, 5.00%,
12/31/2051 |
900,000 | 951,174 | |||
|
Kasikornbank PCL Series EMTN, VRN, 5 year CMT + 4.94%, 5.28%, 10/14/2025
(b) |
700,000 | 740,600 | |||
|
PTTEP Treasury Center Co., Ltd. 2.59%, 6/10/2027
(a) |
200,000 | 207,402 | |||
| 1,899,176 | |||||
| UNITED ARAB EMIRATES — 0.1% | |||||
| Galaxy Pipeline Assets Bidco, Ltd.: | |||||
|
2.16%, 3/31/2034
(a) |
2,200,000 | 2,163,018 | |||
|
Series REGS, 2.63%,
3/31/2036 |
1,000,000 | 980,921 | |||
| 3,143,939 | |||||
| UNITED KINGDOM — 0.1% | |||||
|
BAT Capital Corp. 2.73%,
3/25/2031 |
1,970,000 | 1,940,391 | |||
|
CK Hutchison International 20, Ltd. 2.50%, 5/8/2030
(a) |
1,000,000 | 1,023,090 | |||
|
eG Global Finance PLC 8.50%, 10/30/2025
(a) |
615,000 | 649,827 | |||
|
Virgin Media Finance PLC 5.00%, 7/15/2030
(a) |
605,000 | 609,931 | |||
| 4,223,239 | |||||
| UNITED STATES — 9.9% | |||||
|
AbbVie, Inc. 3.85%,
6/15/2024 |
1,820,000 | 1,973,353 | |||
|
Academy, Ltd. 6.00%, 11/15/2027
(a) |
385,000 | 411,973 | |||
|
Acrisure LLC/Acrisure Finance, Inc. 4.25%, 2/15/2029
(a) |
445,000 | 439,259 | |||
|
Activision Blizzard, Inc. 2.50%,
9/15/2050 |
2,140,000 | 1,923,582 | |||
|
Acuris Finance Us, Inc./Acuris Finance SARL 5.00%, 5/1/2028
(a) |
675,000 | 673,488 |
| Security Description | Principal
Amount |
Value | |||
|
Advanced Drainage Systems, Inc. 5.00%, 9/30/2027
(a) |
$ 370,000 | $ 386,413 | |||
|
AEP Texas, Inc. Series H, 3.45%,
1/15/2050 |
1,280,000 | 1,327,475 | |||
|
Aethon United BR L.P./Aethon United Finance Corp. 8.25%, 2/15/2026
(a) |
305,000 | 330,349 | |||
|
Air Lease Corp. 3.25%,
3/1/2025 |
1,965,000 | 2,093,825 | |||
|
Air Methods Corp. 8.00%, 5/15/2025
(a) |
358,000 | 338,317 | |||
|
Alexandria Real Estate Equities, Inc. 1.88%,
2/1/2033 |
2,535,000 | 2,399,301 | |||
|
Alliant Holdings Intermediate LLC/Alliant Holdings Co-Issuer 6.75%, 10/15/2027
(a) |
390,000 | 410,058 | |||
| Allied Universal Holdco LLC/Allied Universal Finance Corp.: | |||||
|
6.63%, 7/15/2026
(a) |
355,000 | 376,414 | |||
|
9.75%, 7/15/2027
(a) |
680,000 | 749,054 | |||
|
Allison Transmission, Inc. 3.75%, 1/30/2031
(a) |
360,000 | 353,246 | |||
| Ambience Merger Sub, Inc.: | |||||
|
4.88%, 7/15/2028
(a)
(c) |
115,000 | 115,288 | |||
|
7.13%, 7/15/2029
(a)
(c) |
245,000 | 247,212 | |||
|
American Airlines, Inc./AAdvantage Loyalty IP, Ltd. 5.75%, 4/20/2029
(a) |
645,000 | 697,516 | |||
|
American Axle & Manufacturing, Inc. 6.25%,
3/15/2026 |
325,000 | 335,166 | |||
|
Amgen, Inc. 2.45%,
2/21/2030 |
1,795,000 | 1,850,465 | |||
|
Antero Midstream Partners L.P./Antero Midstream Finance Corp. 5.75%, 3/1/2027
(a) |
300,000 | 312,036 | |||
|
Antero Resources Corp. 5.38%, 3/1/2030
(a) |
330,000 | 336,765 | |||
|
Anthem, Inc. 3.30%,
1/15/2023 |
1,862,000 | 1,942,736 | |||
| Apache Corp.: | |||||
|
4.38%,
10/15/2028 |
355,000 | 378,079 | |||
|
4.63%,
11/15/2025 |
200,000 | 215,514 | |||
|
APi Group DE, Inc. 4.13%, 7/15/2029
(a) |
390,000 | 388,147 | |||
|
Apple, Inc. 1.25%,
8/20/2030 |
4,005,000 | 3,840,435 |
| Security Description | Principal
Amount |
Value | |||
|
Arches Buyer, Inc. 4.25%, 6/1/2028
(a) |
$ 130,000 | $ 129,249 | |||
|
Arconic Corp. 6.13%, 2/15/2028
(a) |
860,000 | 922,221 | |||
|
Ardagh Metal Packaging Finance USA LLC/Ardagh Metal Packaging Finance PLC 4.00%, 9/1/2029
(a) |
835,000 | 828,704 | |||
|
Ardagh Packaging Finance PLC/Ardagh Holdings USA, Inc. 5.25%, 8/15/2027
(a) |
300,000 | 306,207 | |||
|
Arrow Electronics, Inc. 3.88%,
1/12/2028 |
1,667,000 | 1,867,257 | |||
| Asbury Automotive Group, Inc.: | |||||
|
4.50%,
3/1/2028 |
1,182,000 | 1,222,720 | |||
|
4.75%,
3/1/2030 |
357,000 | 373,204 | |||
|
Ascend Learning LLC 6.88%, 8/1/2025
(a) |
1,030,000 | 1,049,049 | |||
| AssuredPartners, Inc.: | |||||
|
5.63%, 1/15/2029
(a) |
60,000 | 60,122 | |||
|
7.00%, 8/15/2025
(a) |
952,000 | 971,944 | |||
| AT&T, Inc.: | |||||
|
2.25%,
2/1/2032 |
1,935,000 | 1,901,892 | |||
|
2.75%,
6/1/2031 |
475,000 | 493,805 | |||
|
3.30%,
2/1/2052 |
950,000 | 925,281 | |||
|
Athene Holding, Ltd. 3.95%,
5/25/2051 |
1,755,000 | 1,878,885 | |||
|
Atkore, Inc. 4.25%, 6/1/2031
(a) |
325,000 | 329,209 | |||
|
Austin BidCo, Inc. 7.13%, 12/15/2028
(a) |
155,000 | 158,749 | |||
|
Avantor Funding, Inc. 4.63%, 7/15/2028
(a) |
720,000 | 759,859 | |||
|
Avaya, Inc. 6.13%, 9/15/2028
(a) |
755,000 | 808,099 | |||
|
Axalta Coating Systems LLC/Axalta Coating Systems Dutch Holding B B.V. 4.75%, 6/15/2027
(a) |
655,000 | 686,702 | |||
|
B&G Foods, Inc. 5.25%,
9/15/2027 |
240,000 | 250,063 | |||
|
Bally's Corp. 6.75%, 6/1/2027
(a) |
740,000 | 789,055 | |||
|
Banff Merger Sub, Inc. 9.75%, 9/1/2026
(a) |
150,000 | 158,124 |
| Security Description | Principal
Amount |
Value | |||
|
Bank of America Corp. Series MTN, SOFR + 1.53%, 1.90%, 7/23/2031
(b) |
$ 2,960,000 | $ 2,872,177 | |||
| Bausch Health Cos., Inc.: | |||||
|
4.88%, 6/1/2028
(a) |
420,000 | 429,517 | |||
|
5.25%, 1/30/2030
(a) |
390,000 | 363,862 | |||
|
6.25%, 2/15/2029
(a) |
300,000 | 296,673 | |||
|
7.00%, 1/15/2028
(a) |
535,000 | 552,387 | |||
|
Beacon Roofing Supply, Inc. 4.13%, 5/15/2029
(a) |
170,000 | 169,179 | |||
|
Becton Dickinson and Co. 2.89%,
6/6/2022 |
2,874,000 | 2,936,711 | |||
|
Berry Global, Inc. 0.95%, 2/15/2024
(a) |
1,920,000 | 1,923,955 | |||
|
Blue Racer Midstream LLC/Blue Racer Finance Corp. 7.63%, 12/15/2025
(a) |
235,000 | 254,583 | |||
|
Boeing Co. 2.95%,
2/1/2030 |
2,035,000 | 2,083,820 | |||
|
Boston Properties L.P. 3.65%,
2/1/2026 |
2,740,000 | 3,020,275 | |||
|
Boxer Parent Co., Inc. 7.13%, 10/2/2025
(a) |
35,000 | 37,460 | |||
|
Boyd Gaming Corp. 4.75%, 6/15/2031
(a) |
570,000 | 592,595 | |||
|
Boyne USA, Inc. 4.75%, 5/15/2029
(a) |
700,000 | 725,039 | |||
|
Brighthouse Financial Global Funding 1.00%, 4/12/2024
(a) |
765,000 | 766,408 | |||
|
Broadcom, Inc. 3.42%, 4/15/2033
(a) |
1,869,000 | 1,970,636 | |||
|
Brown & Brown, Inc. 2.38%,
3/15/2031 |
1,390,000 | 1,389,708 | |||
| Builders FirstSource, Inc.: | |||||
|
5.00%, 3/1/2030
(a) |
400,000 | 420,008 | |||
|
6.75%, 6/1/2027
(a) |
165,000 | 177,129 | |||
|
Bunge, Ltd. Finance Corp. 2.75%,
5/14/2031 |
1,905,000 | 1,926,850 | |||
| Cablevision Lightpath LLC: | |||||
|
3.88%, 9/15/2027
(a) |
300,000 | 297,858 | |||
|
5.63%, 9/15/2028
(a) |
200,000 | 204,000 | |||
|
Caesars Entertainment, Inc. 6.25%, 7/1/2025
(a) |
440,000 | 466,717 | |||
| Calpine Corp.: | |||||
|
4.50%, 2/15/2028
(a) |
265,000 | 270,239 |
| Security Description | Principal
Amount |
Value | |||
|
4.63%, 2/1/2029
(a) |
$ 205,000 | $ 202,534 | |||
|
5.13%, 3/15/2028
(a) |
165,000 | 167,744 | |||
|
Camelot Finance SA 4.50%, 11/1/2026
(a) |
125,000 | 130,701 | |||
|
Carlson Travel, Inc. 6.75%, 12/15/2025
(a) |
215,000 | 197,662 | |||
| Carnival Corp.: | |||||
|
5.75%, 3/1/2027
(a) |
385,000 | 404,989 | |||
|
11.50%, 4/1/2023
(a) |
165,000 | 186,310 | |||
|
Carrier Global Corp. 3.58%,
4/5/2050 |
880,000 | 934,094 | |||
|
Carvana Co. 5.63%, 10/1/2025
(a) |
165,000 | 171,544 | |||
|
Castle US Holding Corp. 9.50%, 2/15/2028
(a) |
585,000 | 611,073 | |||
|
Catalent Pharma Solutions, Inc. 5.00%, 7/15/2027
(a) |
470,000 | 491,305 | |||
| CCO Holdings LLC/CCO Holdings Capital Corp.: | |||||
|
4.50%, 8/15/2030
(a) |
370,000 | 385,951 | |||
|
4.75%, 3/1/2030
(a) |
755,000 | 797,793 | |||
|
5.00%, 2/1/2028
(a) |
195,000 | 204,606 | |||
|
Cedar Fair L.P. 5.25%,
7/15/2029 |
430,000 | 443,261 | |||
|
Cengage Learning, Inc. 9.50%, 6/15/2024
(a) |
495,000 | 507,014 | |||
| Centene Corp.: | |||||
|
2.50%,
3/1/2031 |
2,320,000 | 2,290,327 | |||
|
3.00%,
10/15/2030 |
210,000 | 215,823 | |||
|
4.25%,
12/15/2027 |
460,000 | 485,268 | |||
|
Century Communities, Inc. 6.75%,
6/1/2027 |
360,000 | 381,874 | |||
|
Charles River Laboratories International, Inc. 4.25%, 5/1/2028
(a) |
370,000 | 383,165 | |||
|
Charter Communications Operating LLC/Charter Communications Operating Capital 2.30%,
2/1/2032 |
2,540,000 | 2,446,350 | |||
|
Chesapeake Energy Corp. 5.88%, 2/1/2029
(a) |
415,000 | 448,793 | |||
| CHS/Community Health Systems, Inc.: | |||||
|
4.75%, 2/15/2031
(a) |
410,000 | 411,480 | |||
|
6.00%, 1/15/2029
(a) |
455,000 | 487,009 | |||
|
6.88%, 4/15/2029
(a) |
325,000 | 341,279 |
| Security Description | Principal
Amount |
Value | |||
| Cigna Corp.: | |||||
|
4.90%,
12/15/2048 |
$ 1,445,000 | $ 1,867,662 | |||
|
3 Month USD LIBOR + 0.89%, 1.07%, 7/15/2023
(b) |
1,665,000 | 1,686,612 | |||
|
Citigroup, Inc. 3 Month USD LIBOR + 1.39%, 3.67%, 7/24/2028
(b) |
3,385,000 | 3,738,631 | |||
| Clarios Global L.P./Clarios US Finance Co.: | |||||
|
6.25%, 5/15/2026
(a) |
396,000 | 421,768 | |||
|
8.50%, 5/15/2027
(a) |
225,000 | 245,266 | |||
|
Clarivate Science Holdings Corp. 4.88%, 6/30/2029
(a) |
245,000 | 251,395 | |||
| Clean Harbors, Inc.: | |||||
|
4.88%, 7/15/2027
(a) |
460,000 | 482,793 | |||
|
5.13%, 7/15/2029
(a) |
145,000 | 157,688 | |||
| Clear Channel Outdoor Holdings, Inc.: | |||||
|
7.50%, 6/1/2029
(a) |
245,000 | 253,788 | |||
|
7.75%, 4/15/2028
(a) |
80,000 | 83,796 | |||
|
Clearway Energy Operating LLC 4.75%, 3/15/2028
(a) |
375,000 | 393,420 | |||
|
CNX Midstream Partners L.P./CNX Midstream Finance Corp. 6.50%, 3/15/2026
(a) |
510,000 | 533,236 | |||
|
CNX Resources Corp. 6.00%, 1/15/2029
(a) |
200,000 | 216,216 | |||
|
Comcast Corp. 4.70%,
10/15/2048 |
1,455,000 | 1,886,364 | |||
|
CommScope Technologies LLC 5.00%, 3/15/2027
(a) |
230,000 | 235,228 | |||
|
Consolidated Communications, Inc. 5.00%, 10/1/2028
(a) |
405,000 | 410,455 | |||
| Constellation Brands, Inc.: | |||||
|
2.88%,
5/1/2030 |
375,000 | 393,844 | |||
|
3.15%,
8/1/2029 |
1,380,000 | 1,483,348 | |||
|
Constellation Merger Sub, Inc. 8.50%, 9/15/2025
(a) |
170,000 | 167,875 | |||
|
Cornerstone Building Brands, Inc. 6.13%, 1/15/2029
(a) |
440,000 | 472,692 | |||
| Coty, Inc.: | |||||
|
5.00%, 4/15/2026
(a) |
410,000 | 415,941 | |||
|
6.50%, 4/15/2026
(a) |
245,000 | 248,072 | |||
|
CQP Holdco L.P./BIP-V Chinook Holdco LLC 5.50%, 6/15/2031
(a) |
1,015,000 | 1,057,488 | |||
|
CRC Escrow Issuer LLC/CRC Finco, Inc. 5.25%, 10/15/2025
(a) |
505,000 | 511,499 |
| Security Description | Principal
Amount |
Value | |||
|
Credit Acceptance Corp. 6.63%,
3/15/2026 |
$ 590,000 | $ 623,353 | |||
|
Crown Castle International Corp. 4.30%,
2/15/2029 |
1,605,000 | 1,847,515 | |||
| CSC Holdings LLC: | |||||
|
4.63%, 12/1/2030
(a) |
800,000 | 784,680 | |||
|
5.75%, 1/15/2030
(a) |
810,000 | 842,651 | |||
|
CSI Compressco L.P./CSI Compressco Finance, Inc. 7.50%, 4/1/2025
(a) |
660,000 | 669,022 | |||
|
CSX Corp. 3.35%,
9/15/2049 |
1,935,000 | 2,049,958 | |||
|
CVR Partners L.P./CVR Nitrogen Finance Corp. 6.13%, 6/15/2028
(a) |
245,000 | 251,074 | |||
|
Dana Financing Luxembourg Sarl 5.75%, 4/15/2025
(a) |
325,000 | 335,302 | |||
| Dana, Inc.: | |||||
|
4.25%,
9/1/2030 |
95,000 | 97,703 | |||
|
5.38%,
11/15/2027 |
125,000 | 132,979 | |||
|
5.63%,
6/15/2028 |
300,000 | 324,114 | |||
|
DaVita, Inc. 4.63%, 6/1/2030
(a) |
320,000 | 329,274 | |||
|
Dealer Tire LLC/DT Issuer LLC 8.00%, 2/1/2028
(a) |
295,000 | 317,824 | |||
|
Dell International LLC/EMC Corp. 6.02%,
6/15/2026 |
1,645,000 | 1,972,931 | |||
|
Diamond Sports Group LLC/Diamond Sports Finance Co. 5.38%, 8/15/2026
(a) |
385,000 | 249,457 | |||
|
Discover Financial Services 4.10%,
2/9/2027 |
1,635,000 | 1,832,181 | |||
| DISH DBS Corp.: | |||||
|
5.13%, 6/1/2029
(a) |
415,000 | 410,165 | |||
|
5.88%,
11/15/2024 |
380,000 | 408,086 | |||
|
Dollar General Corp. 3.50%,
4/3/2030 |
1,780,000 | 1,957,662 | |||
|
Dollar Tree, Inc. 4.00%,
5/15/2025 |
1,753,000 | 1,934,663 | |||
|
Duke Energy Corp. 2.65%,
9/1/2026 |
2,725,000 | 2,882,369 | |||
| Dun & Bradstreet Corp.: | |||||
|
6.88%, 8/15/2026
(a) |
171,000 | 181,320 | |||
|
10.25%, 2/15/2027
(a) |
268,000 | 295,658 | |||
|
DuPont de Nemours, Inc. 5.42%,
11/15/2048 |
700,000 | 972,111 |
| Security Description | Principal
Amount |
Value | |||
|
Embarq Corp. 8.00%,
6/1/2036 |
$ 370,000 | $ 419,399 | |||
|
Emergent BioSolutions, Inc. 3.88%, 8/15/2028
(a) |
420,000 | 411,709 | |||
|
Enable Midstream Partners L.P. 5.00%,
5/15/2044 |
890,000 | 968,676 | |||
| Encompass Health Corp.: | |||||
|
4.50%,
2/1/2028 |
185,000 | 191,938 | |||
|
4.63%,
4/1/2031 |
455,000 | 487,323 | |||
|
4.75%,
2/1/2030 |
60,000 | 63,824 | |||
|
Endeavor Energy Resources L.P./EER Finance, Inc. 6.63%, 7/15/2025
(a) |
240,000 | 257,184 | |||
|
Endo Luxembourg Finance Co. I Sarl/Endo US, Inc. 6.13%, 4/1/2029
(a) |
350,000 | 343,066 | |||
|
Endure Digital, Inc. 6.00%, 2/15/2029
(a) |
490,000 | 485,159 | |||
|
Energy Transfer L.P. 4.75%,
1/15/2026 |
955,000 | 1,075,072 | |||
|
Enterprise Products Operating LLC 3.75%,
2/15/2025 |
1,805,000 | 1,967,793 | |||
|
Envision Helthcare Corp. 8.75%, 10/15/2026
(a) |
225,000 | 156,902 | |||
| EQM Midstream Partners L.P.: | |||||
|
4.75%, 1/15/2031
(a) |
395,000 | 407,024 | |||
|
6.50%, 7/1/2027
(a) |
135,000 | 150,501 | |||
|
EQT Corp. 8.50%,
2/1/2030 |
370,000 | 481,425 | |||
|
ESH Hospitality, Inc. REIT, 5.25%, 5/1/2025
(a) |
515,000 | 524,615 | |||
|
Essential Utilities, Inc. 3.35%,
4/15/2050 |
1,885,000 | 1,948,939 | |||
|
Everi Holdings, Inc. 5.00%,
7/15/2029 |
230,000 | 235,741 | |||
|
Expedia Group, Inc. 3.80%,
2/15/2028 |
2,315,000 | 2,521,915 | |||
|
Exterran Energy Solutions L.P./EES Finance Corp. 8.13%,
5/1/2025 |
190,000 | 169,073 | |||
|
Exxon Mobil Corp. 2.99%,
3/19/2025 |
1,260,000 | 1,351,930 | |||
|
FedEx Corp. 4.75%,
11/15/2045 |
815,000 | 1,015,832 | |||
|
Ferrellgas L.P./Ferrellgas Finance Corp. 5.38%, 4/1/2026
(a) |
330,000 | 327,192 |
| Security Description | Principal
Amount |
Value | |||
|
Flex Acquisition Co., Inc. 6.88%, 1/15/2025
(a) |
$ 635,000 | $ 646,919 | |||
| Ford Motor Co.: | |||||
|
7.45%,
7/16/2031 |
430,000 | 566,284 | |||
|
9.00%,
4/22/2025 |
175,000 | 215,646 | |||
| Ford Motor Credit Co. LLC: | |||||
|
3.63%,
6/17/2031 |
545,000 | 555,273 | |||
|
Series GMTN, 4.39%,
1/8/2026 |
600,000 | 647,640 | |||
|
Fortress Transportation and Infrastructure Investors LLC 5.50%, 5/1/2028
(a) |
250,000 | 260,413 | |||
| Frontier Communications Holdings LLC: | |||||
|
5.00%, 5/1/2028
(a) |
250,000 | 258,590 | |||
|
5.88%, 10/15/2027
(a) |
125,000 | 133,980 | |||
|
6.75%, 5/1/2029
(a) |
150,000 | 159,590 | |||
|
Full House Resorts, Inc. 8.25%, 2/15/2028
(a) |
165,000 | 179,838 | |||
|
Gates Global LLC/Gates Corp. 6.25%, 1/15/2026
(a) |
405,000 | 424,703 | |||
|
GCI LLC 4.75%, 10/15/2028
(a) |
360,000 | 368,914 | |||
| General Electric Co.: | |||||
|
Series GMTN, 6.88%,
1/10/2039 |
540,000 | 810,416 | |||
|
Series MTN, 5.88%,
1/14/2038 |
850,000 | 1,157,623 | |||
| General Motors Financial Co., Inc.: | |||||
|
3.95%,
4/13/2024 |
125,000 | 134,675 | |||
|
3 Month USD LIBOR + 0.99%, 1.18%, 1/5/2023
(b) |
3,236,000 | 3,264,024 | |||
|
Georgia-Pacific LLC 3.60%, 3/1/2025
(a) |
1,543,000 | 1,678,059 | |||
|
Golden Entertainment, Inc. 7.63%, 4/15/2026
(a) |
315,000 | 335,314 | |||
| Golden Nugget, Inc.: | |||||
|
6.75%, 10/15/2024
(a) |
740,000 | 745,372 | |||
|
8.75%, 10/1/2025
(a) |
150,000 | 158,207 | |||
|
Goldman Sachs Group, Inc. Series ., 3 Month USD LIBOR + 1.17%, 1.33%, 5/15/2026
(b) |
3,790,000 | 3,884,750 | |||
|
Goodyear Tire & Rubber Co. 5.25%, 7/15/2031
(a) |
405,000 | 422,289 |
| Security Description | Principal
Amount |
Value | |||
|
GrafTech Finance, Inc. 4.63%, 12/15/2028
(a) |
$ 195,000 | $ 200,546 | |||
|
Gray Television, Inc. 7.00%, 5/15/2027
(a) |
575,000 | 624,249 | |||
|
Griffon Corp. 5.75%,
3/1/2028 |
960,000 | 1,019,213 | |||
|
Group 1 Automotive, Inc. 4.00%, 8/15/2028
(a) |
130,000 | 132,249 | |||
|
GrubHub Holdings, Inc. 5.50%, 7/1/2027
(a) |
225,000 | 237,179 | |||
|
GTT Communications, Inc. 7.88%, 12/31/2024
(a) |
310,000 | 32,054 | |||
|
Guardian Life Global Funding 1.25%, 5/13/2026
(a) |
1,910,000 | 1,906,180 | |||
|
Halliburton Co. 2.92%,
3/1/2030 |
977,000 | 1,015,494 | |||
| HCA, Inc.: | |||||
|
4.13%,
6/15/2029 |
870,000 | 981,082 | |||
|
5.38%,
9/1/2026 |
965,000 | 1,111,024 | |||
| Hess Midstream Operations L.P.: | |||||
|
5.13%, 6/15/2028
(a) |
365,000 | 382,816 | |||
|
5.63%, 2/15/2026
(a) |
455,000 | 474,269 | |||
|
Hexion, Inc. 7.88%, 7/15/2027
(a) |
300,000 | 323,580 | |||
|
H-Food Holdings LLC/Hearthside Finance Co., Inc. 8.50%, 6/1/2026
(a) |
450,000 | 470,533 | |||
|
Hightower Holding LLC 6.75%, 4/15/2029
(a) |
315,000 | 321,291 | |||
| Hilcorp Energy I L.P./Hilcorp Finance Co.: | |||||
|
5.75%, 2/1/2029
(a) |
170,000 | 177,223 | |||
|
6.25%, 11/1/2028
(a) |
540,000 | 573,809 | |||
|
Hillman Group, Inc. 6.38%, 7/15/2022
(a) |
295,000 | 295,286 | |||
| Hilton Domestic Operating Co., Inc.: | |||||
|
5.38%, 5/1/2025
(a) |
25,000 | 26,331 | |||
|
5.75%, 5/1/2028
(a) |
25,000 | 27,048 | |||
|
Home Depot, Inc. 3.90%,
6/15/2047 |
1,590,000 | 1,887,950 | |||
|
Horizon Pharma USA, Inc. 5.50%, 8/1/2027
(a) |
730,000 | 774,946 | |||
|
Hyundai Capital America 3.00%, 2/10/2027
(a) |
1,920,000 | 2,032,531 |
| Security Description | Principal
Amount |
Value | |||
|
IAA, Inc. 5.50%, 6/15/2027
(a) |
$ 570,000 | $ 598,169 | |||
| Icahn Enterprises L.P./Icahn Enterprises Finance Corp.: | |||||
|
5.25%,
5/15/2027 |
385,000 | 398,521 | |||
|
6.25%,
5/15/2026 |
715,000 | 758,515 | |||
| iHeartCommunications, Inc.: | |||||
|
5.25%, 8/15/2027
(a) |
300,000 | 314,016 | |||
|
8.38%,
5/1/2027 |
75,000 | 80,462 | |||
|
Illuminate Buyer LLC/Illuminate Holdings IV, Inc. 9.00%, 7/1/2028
(a) |
345,000 | 385,127 | |||
|
Indigo Natural Resources LLC 5.38%, 2/1/2029
(a) |
410,000 | 429,934 | |||
|
Installed Building Products, Inc. 5.75%, 2/1/2028
(a) |
435,000 | 457,868 | |||
|
IRB Holding Corp. 6.75%, 2/15/2026
(a) |
575,000 | 595,573 | |||
| Iron Mountain, Inc.: | |||||
|
4.88%, 9/15/2029
(a) |
185,000 | 191,131 | |||
|
REIT, 4.50%, 2/15/2031
(a) |
260,000 | 263,357 | |||
|
iStar, Inc. 4.75%,
10/1/2024 |
305,000 | 321,909 | |||
|
Jazz Securities DAC 4.38%, 1/15/2029
(a) |
290,000 | 300,884 | |||
|
JBS Finance Luxembourg S.a.r.l 3.63%, 1/15/2032
(a) |
200,000 | 199,658 | |||
| JBS USA LUX SA/JBS USA Food Co./JBS USA Finance, Inc.: | |||||
|
3.75%, 12/1/2031
(a) |
215,000 | 219,405 | |||
|
5.50%, 1/15/2030
(a) |
190,000 | 210,991 | |||
|
Jeld-Wen, Inc. 4.63%, 12/15/2025
(a) |
610,000 | 623,688 | |||
|
JPMorgan Chase & Co. SOFR + 1.25%, 2.58%, 4/22/2032
(b) |
3,305,000 | 3,395,524 | |||
|
KAR Auction Services, Inc. 5.13%, 6/1/2025
(a) |
480,000 | 492,446 | |||
|
Kenan Advantage Group, Inc. 7.88%, 7/31/2023
(a) |
85,000 | 85,070 | |||
| Kraft Heinz Foods Co.: | |||||
|
5.00%,
7/15/2035 |
430,000 | 526,337 | |||
|
5.20%,
7/15/2045 |
1,195,000 | 1,484,967 | |||
|
Kraton Polymers LLC/Kraton Polymers Capital Corp. 4.25%, 12/15/2025
(a) |
800,000 | 815,912 |
| Security Description | Principal
Amount |
Value | |||
|
Kratos Defense & Security Solutions, Inc. 6.50%, 11/30/2025
(a) |
$ 475,000 | $ 498,080 | |||
|
LBM Acquisition LLC 6.25%, 1/15/2029
(a) |
485,000 | 488,676 | |||
| LD Holdings Group LLC: | |||||
|
6.13%, 4/1/2028
(a) |
60,000 | 59,917 | |||
|
6.50%, 11/1/2025
(a) |
230,000 | 235,141 | |||
|
Leeward Renewable Energy Operations LLC 4.25%, 7/1/2029
(a)
(c) |
425,000 | 431,821 | |||
|
Legacy LifePoint Health LLC 4.38%, 2/15/2027
(a) |
410,000 | 414,990 | |||
|
Legends Hospitality Holding Co. LLC/Legends Hospitality Co-Issuer, Inc. 5.00%, 2/1/2026
(a) |
340,000 | 354,409 | |||
| Level 3 Financing, Inc.: | |||||
|
3.75%, 7/15/2029
(a) |
180,000 | 175,041 | |||
|
4.25%, 7/1/2028
(a) |
300,000 | 304,422 | |||
|
4.63%, 9/15/2027
(a) |
460,000 | 477,301 | |||
|
Lifepoint Health, Inc. 5.38%, 1/15/2029
(a) |
285,000 | 277,430 | |||
|
Ligado Networks LLC PIK, 15.50%, 11/1/2023
(a) |
351,306 | 346,609 | |||
|
Lions Gate Capital Holdings LLC 5.50%, 4/15/2029
(a) |
450,000 | 474,723 | |||
| Live Nation Entertainment, Inc.: | |||||
|
5.63%, 3/15/2026
(a) |
960,000 | 1,001,117 | |||
|
6.50%, 5/15/2027
(a) |
185,000 | 205,306 | |||
|
LogMeIn, Inc. 5.50%, 9/1/2027
(a) |
175,000 | 181,419 | |||
|
LSF9 Atlantis Holdings LLC/Victra Finance Corp. 7.75%, 2/15/2026
(a) |
375,000 | 388,129 | |||
| Lumen Technologies, Inc.: | |||||
|
4.00%, 2/15/2027
(a) |
355,000 | 362,111 | |||
|
5.13%, 12/15/2026
(a) |
390,000 | 405,202 | |||
|
M/I Homes, Inc. 4.95%,
2/1/2028 |
365,000 | 381,418 | |||
| Madison IAQ LLC: | |||||
|
4.13%, 6/30/2028
(a) |
340,000 | 343,342 | |||
|
5.88%, 6/30/2029
(a) |
330,000 | 335,795 | |||
|
Magic Mergeco, Inc. 7.88%, 5/1/2029
(a) |
185,000 | 190,622 | |||
|
Marriott International, Inc. Series HH, 2.85%,
4/15/2031 |
1,910,000 | 1,940,980 |
| Security Description | Principal
Amount |
Value | |||
|
Marriott Ownership Resorts, Inc./ILG LLC 6.50%,
9/15/2026 |
$ 620,000 | $ 645,098 | |||
|
Masonite International Corp. 5.75%, 9/15/2026
(a) |
490,000 | 507,762 | |||
|
Massachusetts Mutual Life Insurance Co. 3.38%, 4/15/2050
(a) |
1,885,000 | 1,968,015 | |||
| Match Group Holdings II LLC: | |||||
|
4.63%, 6/1/2028
(a) |
165,000 | 171,404 | |||
|
5.00%, 12/15/2027
(a) |
775,000 | 814,540 | |||
|
Metis Merger Sub LLC 6.50%, 5/15/2029
(a) |
375,000 | 369,217 | |||
|
MGM Growth Properties Operating Partnership L.P./MGP Finance Co-Issuer, Inc. REIT, 5.75%,
2/1/2027 |
735,000 | 820,356 | |||
| MGM Resorts International: | |||||
|
5.75%,
6/15/2025 |
453,000 | 499,541 | |||
|
6.75%,
5/1/2025 |
420,000 | 449,698 | |||
|
Midwest Gaming Borrower LLC/Midwest Gaming Finance Corp. 4.88%, 5/1/2029
(a) |
685,000 | 686,171 | |||
|
ModivCare, Inc. 5.88%, 11/15/2025
(a) |
260,000 | 278,192 | |||
|
Monongahela Power Co. 5.40%, 12/15/2043
(a) |
675,000 | 883,224 | |||
|
Morgan Stanley 3 Month USD LIBOR + 0.85%, 3.74%, 4/24/2024
(b) |
3,710,000 | 3,922,880 | |||
|
Moss Creek Resources Holdings, Inc. 7.50%, 1/15/2026
(a) |
345,000 | 321,871 | |||
|
MPH Acquisition Holdings LLC 5.75%, 11/1/2028
(a) |
650,000 | 653,061 | |||
|
MPLX L.P. 1.75%,
3/1/2026 |
1,015,000 | 1,026,541 | |||
|
Murphy Oil USA, Inc. 4.75%,
9/15/2029 |
285,000 | 299,837 | |||
|
Nabors Industries, Ltd. 7.25%, 1/15/2026
(a) |
305,000 | 298,967 | |||
| Nationstar Mortgage Holdings, Inc.: | |||||
|
5.50%, 8/15/2028
(a) |
410,000 | 413,251 | |||
|
6.00%, 1/15/2027
(a) |
65,000 | 67,443 | |||
| Navient Corp.: | |||||
|
5.00%,
3/15/2027 |
285,000 | 295,534 | |||
|
6.50%,
6/15/2022 |
895,000 | 933,261 |
| Security Description | Principal
Amount |
Value | |||
| NCL Corp., Ltd.: | |||||
|
3.63%, 12/15/2024
(a) |
$ 585,000 | $ 564,630 | |||
|
5.88%, 3/15/2026
(a) |
395,000 | 413,770 | |||
|
NESCO Holdings II, Inc. 5.50%, 4/15/2029
(a) |
115,000 | 120,006 | |||
|
NetApp, Inc. 1.88%,
6/22/2025 |
965,000 | 992,840 | |||
| Netflix, Inc.: | |||||
|
5.38%, 11/15/2029
(a) |
240,000 | 291,559 | |||
|
5.88%,
2/15/2025 |
410,000 | 473,575 | |||
|
Nexstar Broadcasting, Inc. 5.63%, 7/15/2027
(a) |
310,000 | 329,651 | |||
|
NextEra Energy Capital Holdings, Inc. 2.75%,
5/1/2025 |
1,975,000 | 2,098,536 | |||
| NFP Corp.: | |||||
|
4.88%, 8/15/2028
(a) |
280,000 | 284,595 | |||
|
6.88%, 8/15/2028
(a) |
360,000 | 380,362 | |||
|
NGL Energy Operating LLC/NGL Energy Finance Corp. 7.50%, 2/1/2026
(a) |
655,000 | 687,822 | |||
|
NGL Energy Partners L.P./NGL Energy Finance Corp. 7.50%,
4/15/2026 |
395,000 | 360,414 | |||
|
Novelis Corp. 4.75%, 1/30/2030
(a) |
235,000 | 246,680 | |||
|
NRG Energy, Inc. 3.63%, 2/15/2031
(a) |
545,000 | 535,228 | |||
|
NuStar Logistics L.P. 6.00%,
6/1/2026 |
510,000 | 554,870 | |||
|
Nuveen Finance LLC 4.13%, 11/1/2024
(a) |
3,045,000 | 3,358,178 | |||
|
Oasis Petroleum, Inc. 6.38%, 6/1/2026
(a) |
375,000 | 390,682 | |||
| Occidental Petroleum Corp.: | |||||
|
3.50%,
8/15/2029 |
685,000 | 687,493 | |||
|
6.13%,
1/1/2031 |
540,000 | 634,959 | |||
|
6.45%,
9/15/2036 |
220,000 | 262,896 | |||
|
6.60%,
3/15/2046 |
215,000 | 255,328 | |||
|
6.63%,
9/1/2030 |
650,000 | 781,859 | |||
|
8.00%,
7/15/2025 |
255,000 | 305,832 | |||
|
Omnicom Group, Inc. 2.45%,
4/30/2030 |
1,770,000 | 1,797,771 | |||
| OneMain Finance Corp.: | |||||
|
5.38%,
11/15/2029 |
250,000 | 272,358 |
| Security Description | Principal
Amount |
Value | |||
|
6.63%,
1/15/2028 |
$ 125,000 | $ 143,854 | |||
|
7.13%,
3/15/2026 |
324,000 | 377,544 | |||
|
Oracle Corp. 3.60%,
4/1/2050 |
1,980,000 | 2,034,371 | |||
|
Organon & Co./Organon Foreign Debt Co-Issuer BV 5.13%, 4/30/2031
(a) |
570,000 | 587,157 | |||
| Ortho-Clinical Diagnostics, Inc./Ortho-Clinical Diagnostics SA: | |||||
|
7.25%, 2/1/2028
(a) |
351,000 | 383,776 | |||
|
7.38%, 6/1/2025
(a) |
39,000 | 41,859 | |||
|
Ovintiv, Inc. 7.38%,
11/1/2031 |
385,000 | 512,412 | |||
| Pacific Gas & Electric Co.: | |||||
|
1.37%,
3/10/2023 |
1,080,000 | 1,080,108 | |||
|
2.50%,
2/1/2031 |
980,000 | 919,495 | |||
|
Par Petroleum LLC/Petroleum Finance Corp. 7.75%, 12/15/2025
(a) |
705,000 | 711,951 | |||
|
Park Intermediate Holdings LLC/PK Domestic Property LLC/PK Finance Co-Issuer 4.88%, 5/15/2029
(a) |
290,000 | 300,223 | |||
|
PBF Holding Co. LLC/PBF Finance Corp. Series WI, 6.00%,
2/15/2028 |
185,000 | 122,807 | |||
|
Peabody Energy Corp. PIK, 8.50%, 12/31/2024
(a) |
168,000 | 126,297 | |||
| Penn National Gaming, Inc.: | |||||
|
4.13%, 7/1/2029
(a)
(c) |
310,000 | 309,650 | |||
|
5.63%, 1/15/2027
(a) |
620,000 | 644,180 | |||
| PennyMac Financial Services, Inc.: | |||||
|
4.25%, 2/15/2029
(a) |
245,000 | 236,062 | |||
|
5.38%, 10/15/2025
(a) |
465,000 | 489,422 | |||
|
Penske Truck Leasing Co. L.P./PTL Finance Corp. 4.20%, 4/1/2027
(a) |
880,000 | 988,891 | |||
|
Performance Food Group, Inc. 5.50%, 10/15/2027
(a) |
575,000 | 605,067 | |||
| PetSmart, Inc./PetSmart Finance Corp.: | |||||
|
4.75%, 2/15/2028
(a) |
825,000 | 856,713 | |||
|
7.75%, 2/15/2029
(a) |
500,000 | 551,480 | |||
|
PG&E Corp. 5.00%,
7/1/2028 |
560,000 | 566,698 | |||
|
PIC AU Holdings LLC/PIC AU Holdings Corp. 10.00%, 12/31/2024
(a) |
188,000 | 187,250 | |||
|
Pike Corp. 5.50%, 9/1/2028
(a) |
385,000 | 400,254 |
| Security Description | Principal
Amount |
Value | |||
|
Pilgrim's Pride Corp. 5.88%, 9/30/2027
(a) |
$ 440,000 | $ 469,273 | |||
|
Pioneer Natural Resources Co. 1.13%,
1/15/2026 |
1,180,000 | 1,168,212 | |||
| Post Holdings, Inc.: | |||||
|
4.63%, 4/15/2030
(a) |
530,000 | 539,397 | |||
|
5.50%, 12/15/2029
(a) |
140,000 | 149,839 | |||
|
Prime Security Services Borrower LLC/Prime Finance, Inc. 6.25%, 1/15/2028
(a) |
330,000 | 351,668 | |||
|
Rackspace Technology Global, Inc. 5.38%, 12/1/2028
(a) |
35,000 | 35,919 | |||
| Radiate Holdco LLC/Radiate Finance, Inc.: | |||||
|
4.50%, 9/15/2026
(a) |
300,000 | 310,449 | |||
|
6.50%, 9/15/2028
(a) |
115,000 | 120,791 | |||
|
Radiology Partners, Inc. 9.25%, 2/1/2028
(a) |
440,000 | 487,639 | |||
|
Rattler Midstream L.P. 5.63%, 7/15/2025
(a) |
295,000 | 309,977 | |||
|
Real Hero Merger Sub 2, Inc. 6.25%, 2/1/2029
(a) |
165,000 | 171,130 | |||
| Realogy Group LLC/Realogy Co-Issuer Corp.: | |||||
|
5.75%, 1/15/2029
(a) |
295,000 | 308,420 | |||
|
7.63%, 6/15/2025
(a) |
285,000 | 309,205 | |||
|
Rent-A-Center, Inc. 6.38%, 2/15/2029
(a) |
330,000 | 353,760 | |||
|
Resideo Funding, Inc. 6.13%, 11/1/2026
(a) |
390,000 | 411,352 | |||
|
Roper Technologies, Inc. 4.20%,
9/15/2028 |
1,505,000 | 1,731,668 | |||
|
Royalty Pharma PLC 3.30%, 9/2/2040
(a) |
2,015,000 | 2,025,800 | |||
|
RP Escrow Issuer LLC 5.25%, 12/15/2025
(a) |
870,000 | 908,750 | |||
|
Sabine Pass Liquefaction LLC 5.00%,
3/15/2027 |
1,485,000 | 1,714,774 | |||
|
Sabre GLBL, Inc. 9.25%, 4/15/2025
(a) |
210,000 | 249,669 | |||
|
Santander Holdings USA, Inc. 3.40%,
1/18/2023 |
1,970,000 | 2,050,179 | |||
|
Schweitzer-Mauduit International, Inc. 6.88%, 10/1/2026
(a) |
475,000 | 502,830 | |||
| Scientific Games International, Inc.: | |||||
|
5.00%, 10/15/2025
(a) |
580,000 | 598,734 |
| Security Description | Principal
Amount |
Value | |||
|
8.25%, 3/15/2026
(a) |
$ 225,000 | $ 241,623 | |||
|
SCIH Salt Holdings, Inc. 6.63%, 5/1/2029
(a) |
145,000 | 145,351 | |||
|
Scotts Miracle-Gro Co. 4.50%,
10/15/2029 |
440,000 | 457,741 | |||
|
Scripps Escrow II, Inc. 3.88%, 1/15/2029
(a) |
140,000 | 138,894 | |||
|
Scripps Escrow, Inc. 5.88%, 7/15/2027
(a) |
280,000 | 289,920 | |||
|
Seagate HDD Cayman 3.38%, 7/15/2031
(a) |
195,000 | 188,791 | |||
|
SEG Holding LLC/SEG Finance Corp. 5.63%, 10/15/2028
(a) |
605,000 | 635,220 | |||
|
Select Medical Corp. 6.25%, 8/15/2026
(a) |
860,000 | 916,115 | |||
|
Silgan Holdings, Inc. 4.13%,
2/1/2028 |
570,000 | 591,478 | |||
| Sirius XM Radio, Inc.: | |||||
|
4.13%, 7/1/2030
(a) |
510,000 | 515,947 | |||
|
5.50%, 7/1/2029
(a) |
340,000 | 370,427 | |||
|
Six Flags Entertainment Corp. 4.88%, 7/31/2024
(a) |
710,000 | 716,922 | |||
|
Six Flags Theme Parks, Inc. 7.00%, 7/1/2025
(a) |
235,000 | 253,260 | |||
|
Smithfield Foods, Inc. 4.25%, 2/1/2027
(a) |
1,620,000 | 1,768,910 | |||
|
Southern Co. Series A, 3.70%,
4/30/2030 |
1,705,000 | 1,882,115 | |||
| Spectrum Brands, Inc.: | |||||
|
3.88%, 3/15/2031
(a) |
410,000 | 402,768 | |||
|
5.00%, 10/1/2029
(a) |
370,000 | 394,017 | |||
|
Sprint Capital Corp. 6.88%,
11/15/2028 |
1,270,000 | 1,629,346 | |||
|
Sprint Corp. 7.13%,
6/15/2024 |
1,355,000 | 1,566,041 | |||
| SRS Distribution, Inc.: | |||||
|
4.63%, 7/1/2028
(a) |
315,000 | 322,220 | |||
|
6.13%, 7/1/2029
(a) |
495,000 | 510,602 | |||
| Staples, Inc.: | |||||
|
7.50%, 4/15/2026
(a) |
315,000 | 326,375 | |||
|
10.75%, 4/15/2027
(a) |
150,000 | 152,997 |
| Security Description | Principal
Amount |
Value | |||
|
Suburban Propane Partners L.P./Suburban Energy Finance Corp. 5.00%, 6/1/2031
(a) |
$ 325,000 | $ 332,413 | |||
|
SunCoke Energy Partners L.P./SunCoke Energy Partners Finance Corp. 7.50%, 6/15/2025
(a) |
815,000 | 846,329 | |||
|
SunCoke Energy, Inc. 4.88%, 6/30/2029
(a) |
510,000 | 509,944 | |||
| Sunoco L.P./Sunoco Finance Corp.: | |||||
|
4.50%, 5/15/2029
(a) |
150,000 | 153,084 | |||
|
6.00%,
4/15/2027 |
300,000 | 314,718 | |||
|
5.50%,
2/15/2026 |
570,000 | 587,334 | |||
| Sysco Corp.: | |||||
|
3.25%,
7/15/2027 |
885,000 | 959,650 | |||
|
3.30%,
2/15/2050 |
960,000 | 963,427 | |||
| Targa Resources Partners L.P./Targa Resources Partners Finance Corp.: | |||||
|
4.88%, 2/1/2031
(a) |
650,000 | 703,462 | |||
|
6.50%,
7/15/2027 |
200,000 | 217,602 | |||
|
Tempo Acquisition LLC/Tempo Acquisition Finance Corp. 6.75%, 6/1/2025
(a) |
855,000 | 869,432 | |||
|
Tempur Sealy International, Inc. 4.00%, 4/15/2029
(a) |
250,000 | 254,238 | |||
| Tenet Healthcare Corp.: | |||||
|
4.25%, 6/1/2029
(a) |
580,000 | 588,021 | |||
|
5.13%, 11/1/2027
(a) |
230,000 | 241,024 | |||
|
6.13%, 10/1/2028
(a) |
695,000 | 739,522 | |||
|
6.25%, 2/1/2027
(a) |
610,000 | 637,426 | |||
|
Tenneco, Inc. 5.13%, 4/15/2029
(a) |
405,000 | 416,632 | |||
|
Terrier Media Buyer, Inc. 8.88%, 12/15/2027
(a) |
155,000 | 167,383 | |||
|
Textron, Inc. 2.45%,
3/15/2031 |
2,910,000 | 2,924,928 | |||
| T-Mobile USA, Inc.: | |||||
|
2.25%,
2/15/2026 |
2,820,000 | 2,844,590 | |||
|
2.88%,
2/15/2031 |
185,000 | 183,472 | |||
|
3.38%, 4/15/2029
(a) |
375,000 | 387,621 | |||
|
TMS International Corp. 6.25%, 4/15/2029
(a) |
220,000 | 231,031 | |||
|
Townsquare Media, Inc. 6.88%, 2/1/2026
(a) |
150,000 | 160,442 |
| Security Description | Principal
Amount |
Value | |||
| TransDigm, Inc.: | |||||
|
4.88%, 5/1/2029
(a) |
$ 350,000 | $ 353,671 | |||
|
5.50%,
11/15/2027 |
360,000 | 375,372 | |||
|
6.25%, 3/15/2026
(a) |
675,000 | 711,997 | |||
|
8.00%, 12/15/2025
(a) |
90,000 | 97,225 | |||
|
Transocean Poseidon, Ltd. 6.88%, 2/1/2027
(a) |
585,000 | 587,913 | |||
|
Transocean Proteus, Ltd. 6.25%, 12/1/2024
(a) |
275,000 | 277,637 | |||
|
Transocean, Inc. 11.50%, 1/30/2027
(a) |
141,000 | 150,701 | |||
|
Trident Merger Sub, Inc. 6.63%, 11/1/2025
(a) |
410,000 | 421,373 | |||
|
Triton Water Holdings, Inc. 6.25%, 4/1/2029
(a) |
385,000 | 387,668 | |||
| Triumph Group, Inc.: | |||||
|
6.25%, 9/15/2024
(a) |
160,000 | 162,458 | |||
|
7.75%,
8/15/2025 |
282,000 | 290,251 | |||
|
Tronox, Inc. 4.63%, 3/15/2029
(a) |
100,000 | 101,119 | |||
| Uber Technologies, Inc.: | |||||
|
7.50%, 9/15/2027
(a) |
210,000 | 230,742 | |||
|
8.00%, 11/1/2026
(a) |
385,000 | 414,934 | |||
| United Airlines, Inc.: | |||||
|
4.38%, 4/15/2026
(a) |
145,000 | 150,108 | |||
|
4.63%, 4/15/2029
(a) |
490,000 | 507,542 | |||
|
United Natural Foods, Inc. 6.75%, 10/15/2028
(a) |
455,000 | 489,398 | |||
| United Rentals North America, Inc.: | |||||
|
3.88%,
2/15/2031 |
65,000 | 66,175 | |||
|
4.00%,
7/15/2030 |
360,000 | 370,487 | |||
|
5.25%,
1/15/2030 |
40,000 | 43,823 | |||
|
Uniti Group L.P./Uniti Group Finance, Inc./CSL Capital LLC 6.50%, 2/15/2029
(a) |
325,000 | 326,528 | |||
| Univision Communications, Inc.: | |||||
|
4.50%, 5/1/2029
(a) |
325,000 | 327,444 | |||
|
6.63%, 6/1/2027
(a) |
355,000 | 384,653 | |||
| US Foods, Inc.: | |||||
|
4.75%, 2/15/2029
(a) |
340,000 | 346,783 | |||
|
6.25%, 4/15/2025
(a) |
35,000 | 37,135 |
| Security Description | Principal
Amount |
Value | |||
|
USA Compression Partners L.P./USA Compression Finance Corp. 6.88%,
9/1/2027 |
$ 895,000 | $ 956,254 | |||
|
Valero Energy Corp. 2.85%,
4/15/2025 |
1,260,000 | 1,335,991 | |||
|
Verizon Communications, Inc. 1.75%,
1/20/2031 |
3,165,000 | 3,033,083 | |||
|
Verscend Escrow Corp. 9.75%, 8/15/2026
(a) |
760,000 | 801,610 | |||
|
ViaSat, Inc. 6.50%, 7/15/2028
(a) |
440,000 | 469,229 | |||
|
Viatris, Inc. 1.65%, 6/22/2025
(a) |
540,000 | 547,139 | |||
|
VICI Properties L.P./VICI Note Co., Inc. REIT, 3.75%, 2/15/2027
(a) |
70,000 | 71,484 | |||
|
Victoria's Secret & Co. 4.63%,
7/15/2029 |
230,000 | 230,214 | |||
| Viking Cruises, Ltd.: | |||||
|
5.88%, 9/15/2027
(a) |
955,000 | 943,464 | |||
|
13.00%, 5/15/2025
(a) |
125,000 | 147,005 | |||
|
Viper Energy Partners L.P. 5.38%, 11/1/2027
(a) |
365,000 | 382,038 | |||
|
Vizient, Inc. 6.25%, 5/15/2027
(a) |
380,000 | 401,314 | |||
|
Vontier Corp. 1.80%, 4/1/2026
(a) |
2,135,000 | 2,128,083 | |||
|
Vornado Realty L.P. 2.15%,
6/1/2026 |
705,000 | 715,145 | |||
|
WASH Multifamily Acquisition, Inc. 5.75%, 4/15/2026
(a) |
555,000 | 579,575 | |||
|
Waste Pro USA, Inc. 5.50%, 2/15/2026
(a) |
375,000 | 387,277 | |||
|
Weatherford International, Ltd. 11.00%, 12/1/2024
(a) |
14,000 | 14,546 | |||
|
Wells Fargo & Co. Series MTN, 3 Month USD LIBOR + 1.31%, 3.58%, 5/22/2028
(b) |
1,745,000 | 1,921,228 | |||
|
Welltower, Inc. 2.05%,
1/15/2029 |
1,905,000 | 1,907,724 | |||
| Western Midstream Operating L.P.: | |||||
|
4.35%,
2/1/2025 |
380,000 | 401,497 | |||
|
5.30%,
2/1/2030 |
395,000 | 443,589 | |||
|
WeWork Cos., Inc. 7.88%, 5/1/2025
(a) |
170,000 | 177,596 |
| Security Description | Principal
Amount |
Value | |||
|
Wheel Pros, Inc. 6.50%, 5/15/2029
(a) |
$ 245,000 | $ 247,756 | |||
|
William Carter Co. 5.63%, 3/15/2027
(a) |
485,000 | 510,099 | |||
|
Williams Cos., Inc. 3.75%,
6/15/2027 |
990,000 | 1,099,197 | |||
|
Wolverine Escrow LLC 9.00%, 11/15/2026
(a) |
287,000 | 279,831 | |||
|
WR Grace & Co-Conn 4.88%, 6/15/2027
(a) |
675,000 | 715,432 | |||
|
WRKCo, Inc. 3.75%,
3/15/2025 |
1,785,000 | 1,949,666 | |||
|
Wyndham Hotels & Resorts, Inc. 4.38%, 8/15/2028
(a) |
380,000 | 395,128 | |||
| XHR L.P.: | |||||
|
4.88%, 6/1/2029
(a) |
425,000 | 438,812 | |||
|
6.38%, 8/15/2025
(a) |
265,000 | 282,024 | |||
| Yum! Brands, Inc.: | |||||
|
4.75%, 1/15/2030
(a) |
375,000 | 405,739 | |||
|
7.75%, 4/1/2025
(a) |
170,000 | 185,285 | |||
| Zayo Group Holdings,Inc.: | |||||
|
4.00%, 3/1/2027
(a) |
455,000 | 452,006 | |||
|
6.13%, 3/1/2028
(a) |
215,000 | 219,532 | |||
| 315,634,077 | |||||
|
TOTAL CORPORATE BONDS & NOTES (Cost
$447,857,009) |
463,146,801 | ||||
| ASSET-BACKED SECURITIES — 6.2% | |||||
|
Aaset Trust Series 2019-2, Class A, 3.38%, 10/16/2039
(a) |
1,725,578 | 1,687,074 | |||
|
AccessLex Institute Series 2004-2, Class A3, 3 Month USD LIBOR + 0.19%, 0.37%, 10/25/2024
(b) |
775,221 | 764,272 | |||
|
ACE Securities Corp. Home Equity Loan Trust Series 2007-WM2, Class A2C, ABS, 1 Month USD LIBOR + 0.280%, 0.37%, 2/25/2037
(b) |
3,195,836 | 1,778,520 | |||
|
Aegis Asset Backed Securities Trust Series 2006-1, Class A2, 1 Month USD LIBOR + 0.17%, 0.26%, 1/25/2037
(b) |
23,063,346 | 19,911,583 | |||
| AMSR Trust: | |||||
|
Series 2021-SFR2, Class E1, ABS, 2.48, 8/17/2026
(a)
(c) |
3,000,000 | 2,999,445 |
| Security Description | Principal
Amount |
Value | |||
|
Series 2021-SFR2, Class F1, ABS, 3.28, 8/17/2026
(a)
(c) |
$ 3,000,000 | $ 2,998,819 | |||
|
Series 2021-SFR2, Class F2, ABS, 3.67, 8/17/2026
(a)
(c) |
2,000,000 | 1,999,158 | |||
|
Arbor Realty Commercial Real Estate Notes 2019-FL1, Ltd. Series 2019-FL1, Class C, ABS, 1 Month USD LIBOR + 2.100%, 2.17%, 5/15/2037
(a)
(b) |
2,942,000 | 2,941,082 | |||
|
Argent Securities Trust Series 2006-M1, Class A2B, ABS, 1 Month USD LIBOR + 0.090%, 0.27%, 7/25/2036
(b) |
19,346,253 | 7,755,926 | |||
|
Bain Capital Credit CLO 2016-2, Ltd. Series 2016-2A, Class DRR, ABS, 3 Month USD LIBOR + 3.85%, 4.03%, 1/15/2029
(a)
(b) |
1,000,000 | 992,700 | |||
|
Bain Capital Credit CLO 2020-2, Ltd. Series 2020-2A, Class B1, ABS, 3 Month USD LIBOR + 2.50%, 2.69%, 7/21/2031
(a)
(b) |
1,000,000 | 998,000 | |||
|
Bain Capital Credit CLO, Ltd. Series 2020-5A, Class D, ABS, 3 Month USD LIBOR + 3.55%, 3.82%, 1/20/2032
(a)
(b) |
2,500,000 | 2,466,843 | |||
|
Blackbird Capital Aircraft Series 2021-1A, Class B, ABS, 3.45%, 7/15/2046
(a)
(c) |
5,000,000 | 5,037,605 | |||
|
BNC Mortgage Loan Trust Series 2006-1, Class A1, ABS, 1 Month USD LIBOR + 0.36%, 0.45%, 10/25/2036
(b) |
16,141,739 | 13,064,039 | |||
|
Canyon Capital CLO 2017-1, Ltd. Series 2017-1A, Class D, ABS, 3 Month USD LIBOR + 3.60%, 3.78%, 7/15/2030
(a)
(b) |
1,000,000 | 995,400 | |||
|
Canyon Capital CLO, Ltd. Series 2021-1A, Class D, ABS, 3 Month USD LIBOR + 3.10%, 3.29%, 4/15/2034
(a)
(b) |
2,000,000 | 1,996,982 | |||
|
CARLYLE US CLO 2021-1, Ltd. Series 2021-1A, Class D, ABS, 3 Month USD LIBOR + 6.00%, 6.19%, 4/15/2034
(a)
(b) |
1,000,000 | 990,223 | |||
|
Catamaran CLO 2016-1, Ltd. Series 2016-1A, Class CR, ABS, 3 Month USD LIBOR + 3.75%, 3.94%, 1/18/2029
(a)
(b) |
2,000,000 | 1,987,512 | |||
|
CIFC Funding 2017-I, Ltd. Series 2017-1A, Class D, ABS, 3 Month USD LIBOR + 3.50%, 3.69%, 4/23/2029
(a)
(b) |
1,000,000 | 990,400 | |||
|
CIFC Funding 2021-I, Ltd. Series 2021-1A, Class E, ABS, 3 Month USD LIBOR + 6.00%, 6.14%, 4/25/2033
(a)
(b) |
500,000 | 494,953 |
| Security Description | Principal
Amount |
Value | |||
|
CIFC Funding, Ltd. Series 2013-1A, Class CR, ABS, 3 Month USD LIBOR + 3.55%, 3.73%, 7/16/2030
(a)
(b) |
$ 1,000,000 | $ 985,000 | |||
|
CLNC, Ltd. Series 2019-FL1, Class A, 1 Month USD LIBOR + 1.25%, 1.37%, 8/20/2035
(a)
(b) |
2,050,000 | 2,048,846 | |||
|
Dryden 33 Senior Loan Fund Series 2014-33A, Class DR3, ABS, 3 Month USD LIBOR + 3.65%, 3.83%, 4/15/2029
(a)
(b) |
2,000,000 | 2,006,114 | |||
|
Dryden 68 CLO, Ltd. Series 2019-68A, Class D, ABS, 3 Month USD LIBOR + 3.40%, 3.58%, 7/15/2032
(a)
(b) |
1,500,000 | 1,466,100 | |||
|
Elmwood CLO VIII, Ltd. Series 2021-1A, Class D1, ABS, 3 Month USD LIBOR + 3.00%, 3.12%, 1/20/2034
(a)
(b) |
1,500,000 | 1,497,726 | |||
| Exeter Automobile Receivables Trust 2021-1: | |||||
|
Series 2021-1A, Class D, ABS, 1.08,
11/16/2026 |
1,000,000 | 999,533 | |||
|
Series 2021-1A, Class E, ABS, 2.21, 2/15/2028
(a) |
1,500,000 | 1,488,794 | |||
|
First Franklin Mortgage Loan Trust Series 2007-FF2, Class A1, ABS, 1 Month USD LIBOR + 0.14%, 0.23%, 3/25/2037
(b) |
10,923,870 | 7,082,183 | |||
| FirstKey Homes Trust: | |||||
|
Series 2020-SFR2, Class D, ABS, 1.97, 10/19/2037
(a) |
2,000,000 | 1,990,059 | |||
|
Series 2020-SFR2, Class E, 2.67, 10/19/2037
(a) |
2,000,000 | 2,033,194 | |||
|
FREED ABS Trust 2021-2 Series 2021-2, Class C, ABS, 1.94%, 6/19/2028
(a) |
4,750,000 | 4,825,481 | |||
|
FS RIALTO Series 2021-FL2, Class A, ABS, 1 Month USD LIBOR + 1.22%, 1.29%, 4/16/2028
(a)
(b) |
2,000,000 | 2,000,622 | |||
|
GAIA Aviation, Ltd. Series 2019-1, Class A, 3.97%, 12/15/2044
(a)
(e) |
1,367,344 | 1,362,604 | |||
|
Galaxy XVIII CLO, Ltd. Series 2018-28A, Class D, ABS, 3 Month USD LIBOR + 3.00%, 3.18%, 7/15/2031
(a)
(b) |
2,100,000 | 2,060,310 | |||
|
GSAA Home Equity Trust Series 2007-10, Class A2A, 6.50%,
11/25/2037 |
2,135,116 | 1,287,362 | |||
|
Hardee's Funding LLC Series 2018-1A, Class A23, ABS, 5.71%, 6/20/2048
(a) |
1,653,250 | 1,854,665 |
| Security Description | Principal
Amount |
Value | |||
|
Hayfin Kingsland X, Ltd. Series 2019-1A, Class B1R, ABS, 3 Month USD LIBOR + 1.850%, 2.03%, 4/28/2031
(a)
(b) |
$ 2,000,000 | $ 1,998,990 | |||
|
Helios Issuer LLC Series 2021-A, Class A, ABS, 1.80%, 2/20/2048
(a) |
1,437,522 | 1,420,177 | |||
|
JOL Air, Ltd. Series 2019-1, Class A, 3.97%, 4/15/2044
(a) |
2,560,265 | 2,555,668 | |||
|
LoanCore 2019-CRE2 Issuer, Ltd. Series 2019-CRE2, Class AS, 1 Month USD LIBOR + 1.50%, 1.57%, 5/15/2036
(a)
(b) |
3,382,000 | 3,377,789 | |||
|
Madison Park Funding XI, Ltd. Series 2013-11A, Class DR, ABS, 3 Month USD LIBOR + 3.25%, 3.42%, 7/23/2029
(a)
(b) |
1,000,000 | 987,900 | |||
|
Madison Park Funding XLVIII, Ltd. Series 2021-48A, Class D, ABS, 3 Month USD LIBOR + 3.00%, 3.14%, 4/19/2033
(a)
(b) |
1,000,000 | 996,656 | |||
|
Magnetite CLO, Ltd. 1.00%,
7/15/2034 |
500,000 | 500,000 | |||
|
Magnetite Xxix, Ltd. Series 2021-29A, Class E, ABS, 3 Month USD LIBOR + 5.75%, 5.85%, 1/15/2034
(a)
(b) |
500,000 | 498,732 | |||
|
Marlette Funding Trust Series 2019-2A, Class A, 3.13%, 7/16/2029
(a) |
162,228 | 162,738 | |||
|
Mosaic Solar Loan Trust 2018-1 Series 2018-1A, Class C, ABS, PO, 0.00%, 6/22/2043
(a) |
619,973 | 588,236 | |||
| MVW 2021-1W LLC: | |||||
|
Series 2021-1WA, Class C, ABS, 1.94, 1/22/2041
(a) |
1,469,880 | 1,476,825 | |||
|
Series 2021-1WA, Class D, ABS, 3.17, 1/22/2041
(a) |
2,449,800 | 2,443,073 | |||
|
Neuberger Berman Loan Advisers Clo 40, Ltd. Series 2021-40A, Class D, ABS, 3 Month USD LIBOR + 2.75%, 2.94%, 4/16/2033
(a)
(b) |
1,500,000 | 1,497,734 | |||
|
Octagon Investment Parteners, Ltd. Series 2019-4A, Class D, ABS, LIBOR + 3.75%, 3.92%, 5/12/2031
(a)
(b) |
4,000,000 | 3,971,600 | |||
|
Octagon Investment Partners 27, Ltd. Series 2016-1A, Class DR, ABS, 3 Month USD LIBOR + 2.95%, 3.13%, 7/15/2030
(a)
(b) |
500,000 | 493,500 | |||
|
Octagon Investment Partners 30, Ltd. Series 2017-1A, Class CR, ABS, 3 Month USD LIBOR + 3.30%, 3.49%, 3/17/2030
(a)
(b) |
1,000,000 | 1,007,900 |
| Security Description | Principal
Amount |
Value | |||
|
Octagon Investment Partners 31 LLC Series 2017-1A, Class DR, ABS, 3 Month USD LIBOR + 3.40%, 3.59%, 7/20/2030
(a)
(b) |
$ 1,000,000 | $ 1,003,762 | |||
|
Octagon Investment Partners 49, Ltd. Series 2020-5A, Class D, ABS, 1 Month USD LIBOR + 3.40%, 3.61%, 1/15/2033
(a)
(b) |
2,500,000 | 2,496,198 | |||
|
PMT Issuer Trust - FMSR Series 2021-FT1, Class A, ABS, 1 Month USD LIBOR + 3.00%, 3.09%, 3/25/2026
(a)
(b) |
1,300,000 | 1,303,782 | |||
|
Pretium Mortgage Credit Partners I LLC Series 2020-NPL3, Class A1, ABS, 3.10%, 6/27/2060
(a)
(e) |
5,489,974 | 5,543,516 | |||
|
Renaissance Home Equity Loan Trust Series 2006-2, Class AF4, ABS, 6.12%, 8/25/2036
(e) |
8,876,162 | 5,213,748 | |||
|
Sapphire Aviation Finance II, Ltd. Series 2020-1A, Class A, 3.23%, 3/15/2040
(a) |
1,299,234 | 1,291,957 | |||
|
Shenton Aircraft Investment I, Ltd. Series 2015-1A, Class A, ABS, 4.75%, 10/15/2042
(a) |
2,467,945 | 2,369,567 | |||
|
SOFI Alternative Trust 2021-A Series 2021-A, Class PT1, ABS, VRN, 1.48%, 3/15/2047
(a)
(b) |
8,343,489 | 8,246,563 | |||
|
Sofi Alternative Trust 2021-B Series 2021-B, Class PT1, ABS, VRN, 1.76%, 2/15/2047
(a)
(b) |
5,408,661 | 5,432,233 | |||
|
Sound Point Clo XII, Ltd. Series 2016-2A, Class DR, ABS, 3 Month USD LIBOR + 3.85%, 4.04%, 10/20/2028
(a)
(b) |
1,000,000 | 994,900 | |||
|
Sound Point Clo XIV, Ltd. Series 2016-3A, Class DR, ABS, 3 Month USD LIBOR + 3.65%, 3.82%, 1/23/2029
(a)
(b) |
1,000,000 | 1,002,162 | |||
|
Sound Point CLO XXIII Series 2019-2A, Class ER, 6.62%, 7/15/2034
(a)
(b) |
1,000,000 | 977,500 | |||
|
Sound Point CLO XXVIII, Ltd. Series 2020-3A, Class D, ABS, 1 Month USD LIBOR + 3.65%, 3.90%, 1/25/2032
(a)
(b) |
4,000,000 | 4,032,088 | |||
|
Sound Point CLO, Ltd. 1.00%,
7/20/2034 |
500,000 | 500,000 | |||
|
START Ireland Series 2019-1, Class A, 4.09%, 3/15/2044
(a) |
604,610 | 610,624 | |||
|
Structured Asset Securities Corp. Mortgage Loan Trust Series 2006-BC4, Class A4, 1 Month USD LIBOR + 0.17%, 0.43%, 12/25/2036
(b) |
1,307,505 | 1,287,628 |
| Security Description | Principal
Amount |
Value | |||
| TIF Funding II LLC: | |||||
|
Series 2021-1A, Class A, ABS, 1.65, 2/20/2046
(a) |
$ 4,838,542 | $ 4,757,374 | |||
|
Series 2021-1A, Class B, ABS, 2.54, 2/20/2046
(a) |
1,935,417 | 1,884,014 | |||
|
TPG Real Estate Finance Issuer, Ltd. Series 2021-FL4, Class A, ABS, 1 Month USD LIBOR + 1.20%, 1.28%, 3/15/2038
(a)
(b) |
200,000 | 200,187 | |||
|
TRTX Issuer, Ltd. Series 2019-FL3, Class AS, 1 Month USD LIBOR + 1.45%, 1.57%, 10/15/2034
(a)
(b) |
3,527,000 | 3,525,900 | |||
|
Upstart Pass-Through Trust Series 2021-ST3 Series 2021-ST3, Class A, ABS, 2.00%, 5/20/2027
(a) |
4,761,868 | 4,766,181 | |||
|
Upstart Securitization Trust 2020-1 Series 2020-1, Class C, ABS, 4.90%, 4/22/2030
(a) |
2,000,000 | 2,074,574 | |||
|
US Auto Funding 2019-1 LLC Series 2019-1A, Class D, ABS, 8.06%, 11/15/2025
(a) |
2,750,000 | 2,870,209 | |||
|
Venture 39 CLO, Ltd. Series 2020-39A, Class D, ABS, 3 Month USD LIBOR + 4.25%, 4.43%, 4/15/2033
(a)
(b) |
1,750,000 | 1,747,900 | |||
|
Voya CLO 2017-3, Ltd. Series 2017-3A, Class CR, ABS, 3 Month USD LIBOR + 3.15%, 3.34%, 4/20/2034
(a)
(b) |
1,000,000 | 998,489 | |||
|
TOTAL ASSET-BACKED SECURITIES (Cost
$196,659,770) |
196,947,703 | ||||
| FOREIGN GOVERNMENT OBLIGATIONS — 1.7% | |||||
| BRAZIL — 0.1% | |||||
|
Brazil Government International Bond 3.75%,
9/12/2031 |
1,500,000 | 1,487,490 | |||
|
Brazilian Government International Bond 5.63%,
2/21/2047 |
1,200,000 | 1,309,680 | |||
| 2,797,170 | |||||
| CHILE — 0.1% | |||||
| Chile Government International Bond: | |||||
|
3.10%,
1/22/2061 |
2,500,000 | 2,393,150 | |||
|
3.50%,
1/25/2050 |
1,300,000 | 1,365,481 | |||
| 3,758,631 |
| Security Description | Principal
Amount |
Value | |||
| COLOMBIA — 0.2% | |||||
| Colombia Government International Bond: | |||||
|
3.13%,
4/15/2031 |
$ 1,200,000 | $ 1,174,092 | |||
|
3.25%,
4/22/2032 |
1,300,000 | 1,272,024 | |||
|
4.13%,
5/15/2051 |
1,700,000 | 1,610,784 | |||
|
5.00%,
6/15/2045 |
900,000 | 956,295 | |||
| 5,013,195 | |||||
| DOMINICAN REPUBLIC — 0.1% | |||||
|
Dominican Republic International Bond Series REGS, 5.88%,
1/30/2060 |
3,300,000 | 3,297,360 | |||
| INDONESIA — 0.2% | |||||
| Indonesia Government International Bond: | |||||
|
3.70%,
10/30/2049 |
1,900,000 | 1,992,112 | |||
|
4.35%,
1/11/2048 |
1,100,000 | 1,248,522 | |||
| Perusahaan Penerbit SBSN Indonesia III: | |||||
|
Series 144A, 2.55%, 6/9/2031
(a) |
1,100,000 | 1,104,807 | |||
|
Series REGS, 3.80%,
6/23/2050 |
1,000,000 | 1,045,540 | |||
| 5,390,981 | |||||
| MALAYSIA — 0.1% | |||||
|
Malaysia Wakala Sukuk Bhd. 3.08%, 4/28/2051
(a) |
3,000,000 | 3,132,720 | |||
| MEXICO — 0.2% | |||||
| Mexico Government International Bond: | |||||
|
3.77%,
5/24/2061 |
2,200,000 | 2,049,982 | |||
|
4.28%,
8/14/2041 |
2,100,000 | 2,206,953 | |||
|
4.50%,
1/31/2050 |
1,100,000 | 1,170,510 | |||
|
4.60%,
2/10/2048 |
1,500,000 | 1,611,990 | |||
| 7,039,435 | |||||
| PANAMA — 0.1% | |||||
| Panama Government International Bond: | |||||
|
3.87%,
7/23/2060 |
2,600,000 | 2,655,874 | |||
|
4.30%,
4/29/2053 |
1,300,000 | 1,441,206 | |||
| 4,097,080 |
| Security Description | Principal
Amount |
Value | |||
| PERU — 0.2% | |||||
| Peruvian Government International Bond: | |||||
|
2.78%,
1/23/2031 |
$ 1,400,000 | $ 1,424,780 | |||
|
3.30%,
3/11/2041 |
1,300,000 | 1,314,469 | |||
|
3.55%,
3/10/2051 |
1,450,000 | 1,506,521 | |||
| 4,245,770 | |||||
| PHILIPPINES — 0.2% | |||||
| Philippine Government International Bond: | |||||
|
1.65%,
6/10/2031 |
1,450,000 | 1,399,525 | |||
|
2.46%,
5/5/2030 |
800,000 | 833,024 | |||
|
2.65%,
12/10/2045 |
600,000 | 555,738 | |||
|
2.95%,
5/5/2045 |
600,000 | 579,726 | |||
|
3.70%,
3/1/2041 |
1,100,000 | 1,187,296 | |||
|
3.70%,
2/2/2042 |
1,700,000 | 1,834,776 | |||
| 6,390,085 | |||||
| QATAR — 0.0% (d) | |||||
|
Qatar Government International Bond Series REGS, 3.38%,
3/14/2024 |
300,000 | 321,750 | |||
| SAUDI ARABIA — 0.1% | |||||
| Saudi Government International Bond: | |||||
|
Series REGS, 2.88%,
3/4/2023 |
400,000 | 414,880 | |||
|
Series REGS, 3.45%,
2/2/2061 |
3,100,000 | 3,092,808 | |||
|
Series REGS, 3.75%,
1/21/2055 |
200,000 | 211,101 | |||
| 3,718,789 | |||||
| SOUTH KOREA — 0.0% (d) | |||||
|
Korea Electric Power Corp. Series 144A, 1.13%, 6/15/2025
(a) |
700,000 | 698,019 | |||
|
Korea Hydro & Nuclear Power Co., Ltd. Series 144A, 1.25%, 4/27/2026
(a) |
200,000 | 199,058 | |||
| 897,077 | |||||
| THAILAND — 0.0% (d) | |||||
|
Export Import Bank of Thailand Series EMTN, 3 Month USD LIBOR + 0.90%, 1.06%, 11/20/2023
(b) |
420,000 | 422,537 |
| Security Description | Principal
Amount |
Value | |||
| UNITED ARAB EMIRATES — 0.1% | |||||
| Abu Dhabi Government International Bond: | |||||
|
Series 144A, 3.13%, 4/16/2030
(a) |
$ 700,000 | $ 760,823 | |||
|
Series REGS, 3.13%,
9/30/2049 |
2,150,000 | 2,190,635 | |||
|
Series REGS, 3.88%,
4/16/2050 |
500,000 | 575,625 | |||
| 3,527,083 | |||||
|
TOTAL FOREIGN GOVERNMENT OBLIGATIONS (Cost
$52,494,263) |
54,049,663 |
| Shares | |||
| COMMON STOCKS — 0.0% (d) | |||
| UNITED STATES — 0.0% (d) | |||
|
Foresight Energy
(f)
(g) |
572 | 11,504 | |
|
Tapstone Energy Holdings
(f)
(g) |
5,920 | — | |
| 11,504 | |||
|
TOTAL COMMON STOCKS (Cost
$1,913) |
11,504 |
| Principal
Amount |
|||
| SENIOR FLOATING RATE LOANS — 3.1% | |||
| ADVERTISING SERVICES — 0.0% (d) | |||
|
Terrier Media Buyer, Inc. Senior Secured 2021 Term Loan, 1 Month USD LIBOR + 3.50%, 3.61%, 12/17/2026
(b) |
458,048 | 456,266 | |
| AEROSPACE & DEFENSE — 0.1% | |||
| Dynasty Acquisition Co., Inc.: | |||
|
Senior Secured 2020 CAD Term Loan B2, 3 Month USD LIBOR + 3.50%, 3.65%, 4/6/2026
(b) |
256,129 | 249,886 | |
|
Senior Secured 2020 Term Loan B1, 3 Month USD LIBOR + 3.50%, 3.65%, 4/6/2026
(b) |
476,400 | 464,788 | |
|
TransDigm, Inc. Senior Secured 2020 Term Loan E, 1 Month USD LIBOR + 2.25%, 2.35%, 5/30/2025
(b) |
1,120,534 | 1,106,029 | |
| 1,820,703 |
| Security Description | Principal
Amount |
Value | |||
| AIR FREIGHT & LOGISTICS — 0.0% (d) | |||||
|
Kenan Advantage Group, Inc. Senior Secured 2021 Term Loan B1, 1 Month USD LIBOR + 3.75%, 4.50%, 3/24/2026
(b) |
$ 274,211 | $ 275,304 | |||
| AIRLINES — 0.1% | |||||
|
AAdvantage Loyalty IP Ltd. Senior Secured 2021 Term Loan, 3 Month USD LIBOR + 4.75%, 5.50%, 4/20/2028
(b) |
310,000 | 323,583 | |||
| American Airlines, Inc.: | |||||
|
Senior Secured 2017 1st Lien Term Loan, 1 Month USD LIBOR + 1.75%, 1.85%, 1/29/2027
(b) |
217,800 | 208,717 | |||
|
Senior Secured 2017 Incremental Term Loan, 1 Month USD LIBOR + 2.00%, 2.07%, 12/15/2023
(b) |
105,000 | 102,678 | |||
|
Senior Secured Repriced TL B due 2023, 1 Month USD LIBOR + 2.00%, 2.10%, 4/28/2023
(b) |
103,906 | 101,594 | |||
|
Mileage Plus Holdings LLC Senior Secured 2020 Term Loan B, 3 Month USD LIBOR + 5.25%, 6.25%, 6/21/2027
(b) |
505,000 | 540,006 | |||
|
SkyMiles IP Ltd. Senior Secured 2020 Skymiles Term Loan B, 3 Month USD LIBOR + 3.75%, 4.75%, 10/20/2027
(b) |
215,000 | 227,376 | |||
|
United Airlines, Inc. Senior Secured 2021 Term Loan B, 3 Month USD LIBOR + 3.75%, 4.50%, 4/21/2028
(b) |
215,000 | 218,121 | |||
| 1,722,075 | |||||
| AUTO COMPONENTS — 0.0% (d) | |||||
|
Autokiniton US Holdings, Inc. Senior Secured 2021 Term Loan B, 3 Month USD LIBOR + 4.50%, 5.00%, 4/6/2028
(b) |
140,000 | 141,269 | |||
|
Clarios Global LP Senior Secured 2021 USD Term Loan B, 1 Month USD LIBOR + 3.25%, 3.35%, 4/30/2026
(b) |
568,227 | 564,145 | |||
|
Truck Hero, Inc. Senior Secured 2021 Term Loan B, 1 Month USD LIBOR + 3.75%, 4.50%, 1/31/2028
(b) |
149,625 | 149,840 | |||
|
Wheel Pros, LLC Senior Secured 2021 Term Loan, 1 Month USD LIBOR + 4.50%, 5.25%, 5/11/2028
(b) |
135,000 | 135,543 | |||
| 990,797 | |||||
| BEVERAGES — 0.0% (d) | |||||
|
Triton Water Holdings, Inc Senior Secured Term Loan, 3 Month USD LIBOR + 3.50%, 4.00%, 3/31/2028
(b) |
550,000 | 550,077 | |||
| BROADCAST SERV/PROGRAM — 0.0% (d) | |||||
|
E.W. Scripps Company (The) Senior Secured 2019 Term Loan B2, 1 Month USD LIBOR + 2.56%, 3.31%, 5/1/2026
(b) |
455,352 | 454,498 |
| Security Description | Principal
Amount |
Value | |||
| BUILDING PRODUCTS — 0.0% (d) | |||||
|
CP Atlas Buyer, Inc. Senior Secured 2021 Term Loan B, 1 Month USD LIBOR + 3.75%, 4.25%, 11/23/2027
(b) |
$ 503,738 | $ 503,186 | |||
|
Quikrete Holdings, Inc. Senior Secured 2021 Term Loan B1, 3.00%, 5/12/2028
(h) |
125,000 | 124,141 | |||
|
Tamko Building Products, LLC Senior Secured Term Loan B, 3 Month USD LIBOR + 3.00%, 3.19%, 6/1/2026
(b) |
179,544 | 179,433 | |||
| 806,760 | |||||
| CASINO SERVICES — 0.0% (d) | |||||
|
Stars Group Holdings B.V. (The) Senior Secured 2018 USD Incremental Term Loan, 3 Month USD LIBOR + 3.50%, 3.65%, 7/10/2025
(b) |
317,853 | 318,509 | |||
| CHEMICALS — 0.1% | |||||
|
Atotech B.V. Senior Secured 2021 USD Term Loan B, 3 Month USD LIBOR + 2.50%, 3.00%, 3/18/2028
(b) |
65,000 | 64,743 | |||
|
Avantor Funding, Inc. Senior Secured USD Term Loan B3, 1 Month USD LIBOR + 2.00%, 3.00%, 11/21/2024
(b) |
84,114 | 84,307 | |||
|
Diamond (BC) B.V. Senior Secured USD Term Loan, 2 Month USD LIBOR + 3.00%, 3.19%, 9/6/2024
(b) |
577,538 | 575,309 | |||
|
Illuminate Buyer, LLC Senior Secured 2021 Term Loan, 1 Month USD LIBOR + 3.50%, 3.60%, 6/30/2027
(b) |
396,843 | 395,000 | |||
|
Messer Industries GmbH Senior Secured 2018 USD Term Loan, 3 Month USD LIBOR + 2.50%, 2.65%, 3/1/2026
(b) |
127,788 | 127,085 | |||
|
Polar US Borrower, LLC Senior Secured 2018 1st Lien Term Loan, 1 Month USD LIBOR + 4.75%, 4.83%, 10/15/2025
(b) |
277,715 | 279,104 | |||
|
PQ Corporation Senior Secured 2021 Term Loan B, Chemicals, Plastics and Rubber, 2.75%, 5/26/2028
(h) |
100,000 | 100,042 | |||
|
SCIH Salt Holdings, Inc. Senior Secured 2021 Incremental Term Loan B, 3 Month USD LIBOR + 4.00%, 4.75%, 3/16/2027
(b) |
200,000 | 200,646 | |||
|
Solenis Holdings LLC Senior Secured 2018 1st Lien Term Loan, 3 Month USD LIBOR + 4.00%, 4.14%, 6/26/2025
(b) |
626,464 | 627,134 | |||
|
Starfruit Finco B.V Senior Secured 2018 USD Term Loan B, 1 Month USD LIBOR + 2.75%, 2.84%, 10/1/2025
(b) |
560,249 | 556,865 | |||
|
Vantage Specialty Chemicals, Inc. Senior Secured 2017 1st Lien Term Loan, 3 Month USD LIBOR + 3.50%, 4.50%, 10/28/2024
(b) |
213,397 | 208,574 | |||
| 3,218,809 |
| Security Description | Principal
Amount |
Value | |||
| COMMERCIAL SERVICES — 0.2% | |||||
|
Allied Universal Holdco LLC Senior Secured 2021 USD Incremental Term Loan B, 1 Month USD LIBOR + 3.75%, 4.25%, 5/12/2028
(b) |
$ 1,217,188 | $ 1,222,099 | |||
|
EAB Global, Inc. Senior Secured 2021 Term Loan, 6/28/2028
(h) |
415,000 | 415,000 | |||
|
IRI Holdings, Inc. Senior Secured 2018 1st Lien Term Loan, 1 Month USD LIBOR + 4.25%, 4.35%, 12/1/2025
(b) |
385,063 | 385,385 | |||
|
Mavis Tire Express Services Corp. Senior Secured 2021 Term Loan B, 3 Month USD LIBOR + 4.00%, 4.75%, 5/4/2028
(b) |
600,000 | 602,667 | |||
|
Spin Holdco, Inc. Senior Secured 2021 Term Loan, 3 Month USD LIBOR + 4.00%, 4.75%, 3/1/2028
(b) |
445,000 | 446,252 | |||
|
Verscend Holding Corp. Senior Secured 2021 Term Loan B, 1 Month USD LIBOR + 4.00%, 4.10%, 8/27/2025
(b) |
1,244,365 | 1,249,256 | |||
|
Wand NewCo 3, Inc. Senior Secured 2020 Term Loan, 1 Month USD LIBOR + 3.00%, 3.10%, 2/5/2026
(b) |
597,992 | 591,692 | |||
| 4,912,351 | |||||
| COMMERCIAL SERVICES & SUPPLIES — 0.1% | |||||
|
ADMI Corp. Senior Secured 2021 Incremental Term Loan B3, 12 Month USD LIBOR + 0.00%, 1.00%,
12/23/2027 |
170,000 | 170,001 | |||
| Asurion LLC: | |||||
|
Senior Secured 2018 Term Loan B6, 1 Month USD LIBOR + 3.00%, 5.35%, 11/3/2023
(b) |
400,323 | 398,698 | |||
|
Senior Secured 2020 Term Loan B8, 1 Month USD LIBOR + 3.25%, 3.35%, 12/23/2026
(b) |
313,425 | 310,242 | |||
|
Senior Secured 2021 2nd Lien Term Loan B3, 1 Month USD LIBOR + 5.25%, 5.35%, 1/31/2028
(b) |
70,000 | 70,656 | |||
|
Senior Secured 2021 Term Loan B9, 1 Month USD LIBOR + 3.25%, 3.35%, 7/31/2027
(b) |
274,312 | 271,512 | |||
|
Emerald TopCo, Inc. Senior Secured Term Loan, 3 Month USD LIBOR + 3.50%, 3.69%, 7/24/2026
(b) |
270,601 | 269,417 | |||
|
Garda World Security Corporation Senior Secured 2021 Term Loan B, 1 Month USD LIBOR + 4.25%, 4.35%, 10/30/2026
(b) |
625,000 | 628,794 | |||
|
Packaging Coordinators Midco, Inc. Senior Secured 2020 1st Lien Term Loan, 3 Month USD LIBOR + 3.50%, 4.25%, 11/30/2027
(b) |
154,613 | 154,960 | |||
|
Packers Holdings, LLC Senior Secured 2021 Term Loan, 6 Month USD LIBOR + 3.25%, 4.00%, 3/9/2028
(b) |
280,000 | 278,893 | |||
| 2,553,173 |
| Security Description | Principal
Amount |
Value | |||
| COMMUNICATIONS EQUIPMENT — 0.0% (d) | |||||
| Avaya, Inc.: | |||||
|
Senior Secured 2020 Term Loan B, 1 Month USD LIBOR + 4.25%, 4.32%, 12/15/2027
(b) |
$ 292,230 | $ 293,478 | |||
|
Senior Secured 2021 Term Loan B2, 1 Month USD LIBOR + 4.00%, 4.07%, 12/15/2027
(b) |
360,000 | 361,350 | |||
|
Riverbed Technology, Inc. Senior Secured 2020 Term Loan B, 3 Month USD LIBOR + 6.00%, 7.00%, 12/31/2025
(b) |
253,725 | 241,673 | |||
| 896,501 | |||||
| COMPUTER SERVICES — 0.0% (d) | |||||
|
Redstone Buyer LLC Senior Secured 2021 Term Loan, 3 Month USD LIBOR + 4.75%, 5.50%, 4/27/2028
(b) |
244,361 | 244,260 | |||
| CONSTRUCTION & ENGINEERING — 0.0% (d) | |||||
|
Aegion Corporation Senior Secured Term Loan, 3 Month USD LIBOR + 4.75%, 5.50%, 5/17/2028
(b) |
100,000 | 101,250 | |||
|
Brand Energy & Infrastructure Services, Inc. Senior Secured 2017 Term Loan, 3 Month USD LIBOR + 4.25%, 5.25%, 6/21/2024
(b) |
399,417 | 393,488 | |||
|
Brown Group Holding, LLC Senior Secured Term Loan B, 3 Month USD LIBOR + 2.75%, 3.25%, 6/7/2028
(b) |
55,000 | 54,780 | |||
| DG Investment Intermediate Holdings 2, Inc.: | |||||
|
Senior Secured 2021 2nd Lien Term Loan, 1 Month USD LIBOR + 6.75%, 7.50%, 3/30/2029
(b) |
60,000 | 60,112 | |||
|
Senior Secured 2021 Delayed Draw Term Loan, 1 Month USD LIBOR + 3.75%, 4.50%, 3/31/2028
(b) |
87,515 | 87,989 | |||
|
Senior Secured 2021 Term Loan, 1 Month USD LIBOR + 3.75%, 4.50%, 3/31/2028
(b) |
549,848 | 552,829 | |||
|
Pike Corporation Senior Secured 2021 Incremental Term Loan B, 1 Month USD LIBOR + 3.00%, 3.11%, 1/21/2028
(b) |
115,069 | 115,005 | |||
| 1,365,453 | |||||
| CONSTRUCTION MATERIALS — 0.0% (d) | |||||
|
Forterra Finance, LLC Senior Secured 2017 Term Loan B, 1 Month USD LIBOR + 3.00%, 4.00%, 10/25/2023
(b) |
96,866 | 97,006 | |||
|
Traverse Midstream Partners LLC Senior Secured 2017 Term Loan, 1 Month USD LIBOR + 5.50%, 6.50%, 9/27/2024
(b) |
290,000 | 291,814 | |||
| 388,820 |
| Security Description | Principal
Amount |
Value | |||
| CONSUMER FINANCE — 0.0% (d) | |||||
|
Amentum Government Services Holdings LLC Senior Secured Term Loan B, 1 Month USD LIBOR + 3.50%, 3.60%, 1/29/2027
(b) |
$ 297,796 | $ 297,833 | |||
| CONTAINERS & PACKAGING — 0.1% | |||||
|
Charter NEX US, Inc. Senior Secured 2021 Term Loan, 1 Month USD LIBOR + 3.75%, 4.50%,
12/1/2027 |
304,238 | 305,331 | |||
|
Graham Packaging Company, Inc. Senior Secured 2021 Term Loan, 1 Month USD LIBOR + 3.00%, 3.75%, 8/4/2027
(b) |
625,416 | 625,594 | |||
|
Klockner-Pentaplast of America, Inc. Senior Secured 2021 Term Loan B, 3 Month USD LIBOR + 4.75%, 5.25%, 2/12/2026
(b) |
468,825 | 472,341 | |||
|
Reynolds Group Holdings, Inc. Senior Secured USD 2017 Term Loan, 1 Month USD LIBOR + 2.75%, 2.85%, 2/5/2023
(b) |
148,652 | 148,489 | |||
| TricorBraun Holdings, Inc.: | |||||
|
Senior Secured 2021 Delayed Draw Term Loan, 3 Month USD LIBOR + 3.25%, 3.75%, 3/3/2028
(b) |
1,836 | 1,825 | |||
|
Senior Secured 2021 Term Loan, 3 Month USD LIBOR + 3.25%, 3.75%, 3/3/2028
(b) |
244,912 | 243,444 | |||
|
Trident TPI Holdings, Inc. Senior Secured 2017 USD Term Loan B1, 3 Month USD LIBOR + 3.00%, 4.00%, 10/17/2024
(b) |
501,105 | 500,061 | |||
| 2,297,085 | |||||
| DIVERSIFIED CONSUMER SERVICES — 0.1% | |||||
|
Ascend Learning LLC Senior Secured 2017 Term Loan B, 1 Month USD LIBOR + 3.00%, 4.00%, 7/12/2024
(b) |
1,216,048 | 1,216,680 | |||
|
Mister Car Wash Holdings, Inc. Senior Secured 2019 Term Loan B, 1 Month USD LIBOR + 3.00%, 3.10%, 5/14/2026
(b) |
342,057 | 341,281 | |||
| 1,557,961 | |||||
| DIVERSIFIED FINANCIAL SERVICES — 0.1% | |||||
|
Deerfield Dakota Holding, LLC Senior Secured 2020 USD Term Loan B, 1 Month USD LIBOR + 3.75%, 4.75%, 4/9/2027
(b) |
901,086 | 906,556 | |||
| Edelman Financial Center, LLC: | |||||
|
Senior Secured 2018 2nd Lien Term Loan, 1 Month USD LIBOR + 6.75%, 6.85%, 7/20/2026
(b) |
295,000 | 297,243 | |||
|
Senior Secured 2021 Term Loan B, 1 Month USD LIBOR + 3.75%, 4.50%, 4/7/2028
(b) |
561,000 | 562,324 |
| Security Description | Principal
Amount |
Value | |||
|
HighTower Holdings LLC Senior Secured 2021 Term Loan B, 3 Month USD LIBOR + 4.00%, 4.75%, 4/30/2028
(b) |
$ 268,000 | $ 268,949 | |||
|
Zebra Buyer LLC Senior Secured Term Loan B, 3.25%, 4/21/2028
(h) |
275,000 | 276,375 | |||
| 2,311,447 | |||||
| DIVERSIFIED TELECOMMUNICATION SERVICES — 0.1% | |||||
| Intelsat Jackson Holdings S.A.: | |||||
|
Senior Secured 2017 Term Loan B3, 1 Month USD LIBOR + 4.75%, 8.00%, 11/27/2023
(b) |
1,237,174 | 1,259,858 | |||
|
Senior Secured 2020 DIP Term Loan, 3 Month USD LIBOR + 5.50%, 6.50%, 7/13/2022
(b) |
186,027 | 187,655 | |||
|
Telesat Canada Senior Secured Term Loan B5, 1 Month USD LIBOR + 2.75%, 2.86%, 12/7/2026
(b) |
178,999 | 168,669 | |||
| 1,616,182 | |||||
| ELECTRIC-INTEGRATED — 0.0% (d) | |||||
|
ExGen Renewables IV, LLC Senior Secured 2020 Term Loan, 3 Month USD LIBOR + 2.50%, 3.50%, 12/15/2027
(b) |
210,162 | 210,469 | |||
| ELECTRONIC EQUIPMENT, INSTRUMENTS & COMPONENTS — 0.0% (d) | |||||
|
Ingram Micro Inc. Senior Secured 2021 Term Loan B, 3.50%, 6/30/2028
(h) |
490,000 | 491,455 | |||
|
Mirion Technologies, Inc. Senior Secured 2019 Term Loan B, 3 Month USD LIBOR + 4.00%, 4.15%, 3/6/2026
(b) |
69,645 | 69,808 | |||
| 561,263 | |||||
| ENERGY EQUIPMENT & SERVICES — 0.0% (d) | |||||
|
Carnival Corporation Senior Secured USD Term Loan B, 1 Month USD LIBOR + 3.00%, 3.75%, 6/30/2025
(b) |
143,913 | 147,661 | |||
|
Granite Holdings US Acquisition Co. Senior Secured 2021 Term Loan B, 3 Month USD LIBOR + 4.00%, 4.15%, 9/30/2026
(b) |
362,241 | 364,052 | |||
|
WIN Waste Innovations Holdings, Inc. Senior Secured 2021 Term Loan B, 3 Month USD LIBOR + 2.75%, 3.25%, 3/24/2028
(b) |
430,000 | 429,910 | |||
| 941,623 | |||||
| ENTERTAINMENT — 0.1% | |||||
|
NASCAR Holdings, Inc Senior Secured Term Loan B, 1 Month USD LIBOR + 2.75%, 2.85%, 10/19/2026
(b) |
283,506 | 282,549 |
| Security Description | Principal
Amount |
Value | |||
|
UFC Holdings, LLC Senior Secured 2021 Term Loan B, 6 Month USD LIBOR + 3.00%, 3.75%, 4/29/2026
(b) |
$ 1,290,478 | $ 1,290,478 | |||
| 1,573,027 | |||||
| FINANCIAL SERVICES — 0.0% (d) | |||||
|
Greystone Select Financial LLC Senior Secured Term Loan B, 5.75%,
6/16/2028 |
90,000 | 90,450 | |||
| FOOD & BEVERAGE — 0.0% (d) | |||||
|
Caesars Resort Collection, LLC Senior Secured 2020 Term Loan B1, 1 Month USD LIBOR + 4.50%, 4.60%, 7/21/2025
(b) |
471,438 | 473,500 | |||
|
UTZ Quality Foods, LLC Senior Secured 2021 Term Loan B, 1 Month USD LIBOR + 3.00%, 3.10%, 1/20/2028
(b) |
29,925 | 29,944 | |||
| 503,444 | |||||
| FOOD & STAPLES RETAILING — 0.0% (d) | |||||
|
United Natural Foods, Inc. Senior Secured Term Loan B, 1 Month USD LIBOR + 3.50%, 3.60%, 10/22/2025
(b) |
115,332 | 115,566 | |||
| FOOD-MISC/DIVERSIFIED — 0.0% (d) | |||||
|
H Food Holdings LLC Senior Secured 2018 Term Loan B, 1 Month USD LIBOR + 3.69%, 3.79%, 5/23/2025
(b) |
586,079 | 583,287 | |||
| HEALTH CARE EQUIPMENT & SUPPLIES — 0.1% | |||||
|
Avantor Funding, Inc. Senior Secured 2020 Incremental Term Loan B4, 1 Month USD LIBOR + 2.25%, 3.25%, 11/8/2027
(b) |
203,975 | 204,293 | |||
|
Gainwell Acquisition Corp. Senior Secured Term Loan B, 3 Month USD LIBOR + 4.00%, 4.75%, 10/1/2027
(b) |
1,472,550 | 1,479,913 | |||
|
Zelis Healthcare Corporation Senior Secured 2021 Term Loan, 1 Month USD LIBOR + 3.50%, 3.59%, 9/30/2026
(b) |
585,030 | 584,118 | |||
| 2,268,324 | |||||
| HEALTH CARE PROVIDERS & SERVICES — 0.1% | |||||
|
Air Methods Corporation Senior Secured 2017 Term Loan B, 3 Month USD LIBOR + 3.50%, 4.50%, 4/22/2024
(b) |
393,846 | 388,990 | |||
| Aveanna Healthcare, LLC: | |||||
|
Senior Secured 2021 Delayed Draw Term Loan, 3.75%, 6/30/2028
(h) |
39,623 | 39,474 | |||
|
Senior Secured 2021 Term Loan B, 3.75%, 6/30/2028
(h) |
170,377 | 169,738 | |||
|
CHG Healthcare Services, Inc. Senior Secured 2017 1st Lien Term Loan B, 3 Month USD LIBOR + 3.00%, 4.00%, 6/7/2023
(b) |
681,103 | 681,246 |
| Security Description | Principal
Amount |
Value | |||
|
Endo Luxembourg Finance Company I S.a r.l. Senior Secured 2021 Term Loan, 3 Month USD LIBOR + 5.00%, 5.75%, 3/27/2028
(b) |
$ 279,300 | $ 270,311 | |||
|
Envision Healthcare Corporation Senior Secured 2018 1st Lien Term Loan, 1 Month USD LIBOR + 3.75%, 3.85%, 10/10/2025
(b) |
403,969 | 347,161 | |||
|
Global Medical Response, Inc. Senior Secured 2020 Term Loan B, 3 Month USD LIBOR + 4.75%, 5.75%, 10/2/2025
(b) |
348,250 | 350,209 | |||
|
Heartland Dental, LLC , 4.07%,
4/30/2025 |
135,000 | 134,937 | |||
|
Horizon Therapeutics USA, Inc. Senior Secured 2021 Term Loan B, 3/15/2028
(b)
(h) |
259,350 | 258,053 | |||
| ICON Luxembourg S.A.R.L.: | |||||
|
Senior Secured 1st Lien Term Loan B, 7/3/2028
(h) |
48,867 | 49,000 | |||
|
Senior Secured Term Loan B, 7/3/2028
(h) |
196,133 | 196,670 | |||
|
MED ParentCo LP Senior Secured 1st Lien Term Loan, 1 Month USD LIBOR + 4.25%, 4.35%, 8/31/2026
(b) |
189,518 | 189,970 | |||
|
MPH Acquisition Holdings LLC Senior Secured 2016 Term Loan B, 3 Month USD LIBOR + 2.75%, 3.75%, 6/7/2023
(b) |
613,325 | 612,316 | |||
|
Ortho-Clinical Diagnostics SA Senior Secured 2018 Term Loan B, 1 Month USD LIBOR + 3.00%, 3.09%, 6/30/2025
(b) |
149,848 | 149,902 | |||
|
RegionalCare Hospital Partners Holdings, Inc. Senior Secured 2018 Term Loan B, 1 Month USD LIBOR + 3.75%, 3.85%, 11/16/2025
(b) |
318,096 | 317,730 | |||
|
Team Health Holdings, Inc. Senior Secured 1st Lien Term Loan, 1 Month USD LIBOR + 2.75%, 3.75%, 2/6/2024
(b) |
172,301 | 167,849 | |||
| 4,323,556 | |||||
| HOME FURNISHINGS — 0.0% (d) | |||||
| AI Aqua Merger Sub, Inc.: | |||||
|
Senior Secured 2021 1st Lien Delayed Draw Term Loan, 6/16/2028
(h) |
15,556 | 15,614 | |||
|
Senior Secured 2021 1st Lien Term Loan B, 6/16/2028
(h) |
124,444 | 124,911 | |||
|
Tecta America Corp. Senior Secured 2021 Term Loan, 3 Month USD LIBOR + 4.25%, 5.00%, 4/1/2028
(b) |
195,000 | 195,609 | |||
| 336,134 |
| Security Description | Principal
Amount |
Value | |||
| HOTELS, RESTAURANTS & LEISURE — 0.2% | |||||
|
Alterra Mountain Company Senior Secured Term Loan B1, 1 Month USD LIBOR + 2.75%, 2.85%, 7/31/2024
(b) |
$ 984,526 | $ 974,681 | |||
|
Caesars Resort Collection, LLC Senior Secured 2017 1st Lien Term Loan B, 1 Month USD LIBOR + 2.75%, 2.85%, 12/23/2024
(b) |
1,119,695 | 1,111,448 | |||
|
ClubCorp Holdings, Inc. Senior Secured 2017 Term Loan B, 3 Month USD LIBOR + 2.75%, 2.90%, 9/18/2024
(b) |
326,835 | 314,745 | |||
|
Golden Nugget, Inc. Senior Secured 2017 Incremental Term Loan B, 2 Month USD LIBOR + 2.50%, 3.25%, 10/4/2023
(b) |
395,425 | 392,991 | |||
|
Peraton Corp. Senior Secured Term Loan B, 1 Month USD LIBOR + 3.75%, 4.50%, 2/1/2028
(b) |
513,712 | 516,102 | |||
|
Playa Resorts Holding B.V. Senior Secured 2017 Term Loan B, 1 Month USD LIBOR + 2.75%, 3.75%, 4/29/2024
(b) |
150,328 | 144,738 | |||
| Travelport Finance (Luxembourg) S.a.r.l.: | |||||
|
Senior Secured 2019 Term Loan, 3 Month USD LIBOR + 5.00%, 5.15%, 5/29/2026
(b) |
92,185 | 84,493 | |||
|
Senior Secured 2020 Super Priority Term Loan, 3 Month USD LIBOR + 1.50%, 2.50%, 2/28/2025
(b) |
253,176 | 266,197 | |||
|
Vertical U.S. Newco, Inc. Senior Secured USD Term Loan B, 6 Month USD LIBOR + 4.25%, 4.48%, 7/30/2027
(b) |
1,616,885 | 1,621,267 | |||
| 5,426,662 | |||||
| HOUSEHOLD PRODUCTS — 0.0% (d) | |||||
|
Conair Holdings, LLC Senior Secured Term Loan B, 3 Month USD LIBOR + 3.75%, 4.25%, 5/17/2028
(b) |
185,000 | 185,624 | |||
| TGP Holdings III, LLC: | |||||
|
Senior Secured 2021 Delayed Draw Term Loan, 6/29/2028
(h) |
11,161 | 11,203 | |||
|
Senior Secured 2021 Term Loan, 6/29/2028
(h) |
113,839 | 114,266 | |||
| 311,093 | |||||
| INDEPENDENT POWER PRODUCERS & ENERGY TRADERS — 0.0% (d) | |||||
|
Calpine Corporation Senior Secured 2019 Term Loan B10, 1 Month USD LIBOR + 2.00%, 2.10%, 8/12/2026
(b) |
78,600 | 77,659 | |||
| INSURANCE — 0.1% | |||||
|
Acrisure, LLC Senior Secured 2020 Term Loan B, 3 Month USD LIBOR + 3.50%, 3.60%, 2/15/2027
(b) |
833,309 | 825,584 | |||
|
Alliant Holdings Intermediate, LLC Senior Secured 2020 Term Loan B3, 1 Month USD LIBOR + 3.25%, 3.35%, 10/8/2027
(b)
(h) |
95,000 | 95,283 |
| Security Description | Principal
Amount |
Value | |||
|
AmWINS Group, Inc. Senior Secured 2021 Term Loan B, 1 Month USD LIBOR + 2.25%, 3.00%, 2/19/2028
(b) |
$ 29,850 | $ 29,698 | |||
|
AssuredPartners, Inc. Senior Secured 2020 Term Loan B, 1 Month USD LIBOR + 3.50%, 3.60%, 2/12/2027
(b) |
1,211,681 | 1,206,889 | |||
|
OneDigital Borrower LLC Senior Secured 2020 Term Loan, 3 Month USD LIBOR + 4.50%, 5.25%, 11/16/2027
(b) |
581,250 | 584,400 | |||
|
Sedgwick Claims Management Services, Inc. Senior Secured 2018 Term Loan B, 1 Month USD LIBOR + 3.25%, 3.35%, 12/31/2025
(b) |
832,545 | 824,636 | |||
| 3,566,490 | |||||
| INTERACTIVE MEDIA & SERVICES — 0.0% (d) | |||||
|
GTT Communications, Inc. Senior Secured 2018 USD Term Loan B, 3 Month USD LIBOR + 2.75%, 2.90%, 5/31/2025
(b) |
124,967 | 99,478 | |||
|
Ivanti Software, Inc. Senior Secured 2020 Term Loan B, 3 Month USD LIBOR + 4.75%, 5.75%, 12/1/2027
(b) |
264,338 | 265,127 | |||
|
Rentpath, Inc. Senior Secured 2021 Stub Current Face Term Loan, 12 Month USD LIBOR + 0.00%, 4/1/2028
(b)
(h) |
31,497 | 4,567 | |||
| 369,172 | |||||
| INTERNET & CATALOG RETAIL — 0.1% | |||||
|
Endure Digital Inc. Senior Secured Term Loan, 3 Month USD LIBOR + 3.50%, 4.25%, 2/10/2028
(b) |
600,000 | 598,248 | |||
|
Harbor Freight Tools USA, Inc. Senior Secured 2020 Term Loan B, 1 Month USD LIBOR + 3.00%, 3.75%, 10/19/2027
(b) |
402,975 | 403,557 | |||
|
PUG LLC Senior Secured USD Term Loan, 1 Month USD LIBOR + 3.50%, 3.60%, 2/12/2027
(b) |
316,800 | 310,466 | |||
|
Uber Technologies, Inc. Senior Secured 2021 1st Lien Term Loan B, 1 Month USD LIBOR + 3.50%, 3.60%, 4/4/2025
(b) |
507,385 | 508,110 | |||
| 1,820,381 | |||||
| INTERNET & TELECOM — 0.0% (d) | |||||
|
Cablevision Lightpath LLC Senior Secured Term Loan B, 1 Month USD LIBOR + 3.25%, 3.75%, 11/30/2027
(b) |
393,025 | 393,713 | |||
|
CNT Holdings I Corp. Senior Secured 2020 Term Loan, 3 Month USD LIBOR + 3.75%, 4.50%, 11/8/2027
(b) |
219,450 | 219,810 | |||
| 613,523 |
| Security Description | Principal
Amount |
Value | |||
| IT SERVICES — 0.1% | |||||
|
Blackhawk Network Holdings, Inc Senior Secured 2018 1st Lien Term Loan, 1 Month USD LIBOR + 3.00%, 3.10%, 6/15/2025
(b) |
$ 697,677 | $ 690,798 | |||
|
CoreLogic, Inc. Senior Secured Term Loan, 6/2/2028
(b)
(h) |
225,000 | 224,691 | |||
|
Flexential Intermediate Corporation Senior Secured 2017 1st Lien Term Loan, 3 Month USD LIBOR + 3.50%, 3.65%, 8/1/2024
(b) |
318,973 | 294,025 | |||
|
VS Buyer, LLC Senior Secured Term Loan B, 1 Month USD LIBOR + 3.00%, 3.10%, 2/28/2027
(b) |
1,022,063 | 1,020,468 | |||
| 2,229,982 | |||||
| LIFE SCIENCES TOOLS & SERVICES — 0.0% (d) | |||||
|
eResearchTechnology, Inc. Senior Secured 2020 1st Lien Term Loan, 1 Month USD LIBOR + 4.50%, 5.50%, 2/4/2027
(b) |
29,924 | 30,098 | |||
|
Parexel International Corporation Senior Secured Term Loan B, 1 Month USD LIBOR + 2.75%, 2.85%, 9/27/2024
(b) |
597,713 | 595,145 | |||
| 625,243 | |||||
| MACHINERY — 0.1% | |||||
|
Alliance Laundry Systems LLC Senior Secured Term Loan B, 3 Month USD LIBOR + 3.50%, 4.25%, 10/8/2027
(b) |
118,114 | 118,410 | |||
|
American Trailer World Corp. Senior Secured Term Loan B, 1 Month USD LIBOR + 3.75%, 4.50%, 3/3/2028
(b) |
235,000 | 234,964 | |||
|
Columbus McKinnon Corporation Senior Secured 2021 Term Loan B, 3 Month USD LIBOR + 2.75%, 3.25%, 5/14/2028
(b) |
35,000 | 35,044 | |||
|
Filtration Group Corporation Senior Secured 2018 1st Lien Term Loan, 1 Month USD LIBOR + 3.00%, 3.10%, 3/29/2025
(b) |
394,613 | 391,941 | |||
|
Hayward Industries, Inc. Senior Secured 2021 Term Loan, 1 Month USD LIBOR + 2.75%, 3.25%, 5/12/2028
(b) |
380,000 | 379,466 | |||
| Hillman Group Inc. (The): | |||||
|
Senior Secured 2021 Delayed Draw Term Loan, 2/24/2028
(h) |
28,692 | 28,666 | |||
|
Senior Secured 2021 Term Loan B1, 2/24/2028
(h) |
141,308 | 141,179 | |||
|
Madison IAQ LLC Senior Secured Term Loan, 3 Month USD LIBOR + 3.25%, 3.75%,
6/21/2028 |
245,000 | 245,421 | |||
|
Titan Acquisition Limited Senior Secured 2018 Term Loan B, 3 Month USD LIBOR + 3.00%, 3.17%, 3/28/2025
(b) |
287,694 | 283,302 | |||
| 1,858,393 |
| Security Description | Principal
Amount |
Value | |||
| MACHINERY-CONSTRUCTION & MINING — 0.0% (d) | |||||
|
Clear Channel Outdoor Holdings, Inc. Senior Secured Term Loan B, 3 Month USD LIBOR + 3.50%, 3.69%, 8/21/2026
(b) |
$ 152,651 | $ 149,216 | |||
| MEDIA — 0.1% | |||||
|
Diamond Sports Group, LLC Senior Secured Term Loan, 1 Month USD LIBOR + 3.25%, 3.36%, 8/24/2026
(b) |
174,114 | 106,210 | |||
|
Radiate Holdco, LLC Senior Secured 2020 Term Loan, 1 Month USD LIBOR + 3.50%, 4.25%, 9/25/2026
(b) |
1,054,700 | 1,056,989 | |||
|
Sinclair Television Group Inc. Senior Secured Term Loan B2B, 1 Month USD LIBOR + 2.50%, 2.61%, 9/30/2026
(b) |
275,100 | 271,791 | |||
| 1,434,990 | |||||
| METALS & MINING — 0.0% (d) | |||||
|
Tiger Acquisition, LLC Senior Secured 2021 Term Loan, 3 Month USD LIBOR + 3.25%, 3.75%, 6/1/2028
(b) |
195,000 | 194,818 | |||
|
U.S. Silica Company Senior Secured 2018 Term Loan B, 1 Month USD LIBOR + 4.00%, 5.00%, 5/1/2025
(b) |
184,041 | 176,450 | |||
| 371,268 | |||||
| MISCELLANEOUS MANUFACTUR — 0.0% (d) | |||||
|
Gemini HDPE LLC Senior Secured 2020 Term Loan B, 3 Month USD LIBOR + 3.00%, 3.50%, 12/31/2027
(b) |
345,440 | 345,441 | |||
|
Groupe Solmax Inc. Senior Secured Term Loan, 6/28/2028
(h) |
95,000 | 94,881 | |||
| 440,322 | |||||
| MRI/MEDICAL DIAG IMAGING — 0.0% (d) | |||||
|
Radiology Partners, Inc Senior Secured 2018 1st Lien Term Loan B, 1 Month USD LIBOR + 4.25%, 4.35%, 7/9/2025
(b) |
618,810 | 619,413 | |||
| OIL REFINING & MARKETING — 0.0% (d) | |||||
|
Gulf Finance, LLC Senior Secured Term Loan B, 1 Month USD LIBOR + 5.25%, 6.25%, 8/25/2023
(b) |
220,539 | 187,813 | |||
| OIL, GAS & CONSUMABLE FUELS — 0.0% (d) | |||||
|
EG America LLC Senior Secured 2018 USD Term Loan, 3 Month USD LIBOR + 4.00%, 4.15%, 2/7/2025
(b) |
178,038 | 177,085 | |||
|
EG Group Limited Senior Secured 2021 Term Loan, 3 Month USD LIBOR + 4.25%, 4.75%, 3/31/2026
(b) |
155,000 | 155,315 |
| Security Description | Principal
Amount |
Value | |||
|
Pacific Gas & Electric Company Senior Secured 2020 Term Loan, 3 Month USD LIBOR + 3.00%, 3.50%, 6/23/2025
(b) |
$ 598,950 | $ 591,933 | |||
|
Waterbridge Midstream Operating LLC Senior Secured Term Loan B, 6 Month USD LIBOR + 5.75%, 6.75%, 6/22/2026
(b) |
169,570 | 163,029 | |||
| 1,087,362 | |||||
| PERSONAL PRODUCTS — 0.0% (d) | |||||
|
Kronos Acquisition Holdings, Inc. Senior Secured 2021 Term Loan B, 3 Month USD LIBOR + 3.75%, 4.25%, 12/22/2026
(b) |
447,925 | 445,358 | |||
| PHARMACEUTICALS — 0.1% | |||||
|
Bausch Health Companies Inc. Senior Secured 2018 Term Loan B, 1 Month USD LIBOR + 3.00%, 3.10%, 6/2/2025
(b) |
149,044 | 148,570 | |||
|
HC Group Holdings II, Inc. Senior Secured Term Loan B, 1 Month USD LIBOR + 3.75%, 3.85%, 8/6/2026
(b) |
89,545 | 89,714 | |||
|
Jazz Financing Lux S.a.r.l. Senior Secured USD Term Loan, 1 Month USD LIBOR + 3.50%, 4.00%, 4/21/2028
(b) |
590,000 | 592,534 | |||
|
Organon & Co Senior Secured USD Term Loan, 3 Month USD LIBOR + 3.00%, 3.50%, 6/2/2028
(b) |
590,000 | 591,354 | |||
|
Pathway Vet Alliance LLC Senior Secured 2021 Term Loan, 1 Month USD LIBOR + 3.75%, 3.85%, 3/31/2027
(b) |
593,713 | 593,092 | |||
|
PetVet Care Centers, LLC Senior Secured 2021 Term Loan B3, 1 Month USD LIBOR + 3.50%, 4.25%, 2/14/2025
(b) |
14,924 | 14,987 | |||
| 2,030,251 | |||||
| PIPELINES — 0.1% | |||||
|
CQP Holdco LP Senior Secured 2021 Term Loan B, 3 Month USD LIBOR + 3.75%, 4.25%, 6/5/2028
(b) |
650,000 | 648,213 | |||
|
DT Midstream, Inc Senior Secured Term Loan B, 6/26/2028
(h) |
170,000 | 170,501 | |||
|
Oryx Midstream Holdings LLC Senior Secured Term Loan B, 1 Month USD LIBOR + 4.00%, 4.10%, 5/22/2026
(b) |
694,649 | 691,238 | |||
| 1,509,952 | |||||
| PROFESSIONAL SERVICES — 0.0% (d) | |||||
|
Dun & Bradstreet Corporation (The) Senior Secured Term Loan, 1 Month USD LIBOR + 3.25%, 3.35%, 2/6/2026
(b) |
1,373,797 | 1,368,858 |
| Security Description | Principal
Amount |
Value | |||
| PUBLISHING-BOOKS — 0.0% (d) | |||||
|
Getty Images, Inc. Senior Secured 2019 USD Term Loan B, 1 Month USD LIBOR + 4.50%, 4.63%, 2/19/2026
(b) |
$ 238,670 | $ 238,820 | |||
| REAL ESTATE INVESTMENT TRUSTS (REITS) — 0.1% | |||||
|
VICI Properties 1 LLC Senior Secured Replacement Term Loan B, 1 Month USD LIBOR + 1.75%, 1.84%, 12/20/2024
(b) |
1,423,068 | 1,413,128 | |||
| REAL ESTATE MANAGEMENT & DEVELOPMENT — 0.0% (d) | |||||
|
Bright Bidco B.V. Senior Secured 2018 Term Loan B, 3 Month USD LIBOR + 3.50%, 4.50%, 6/30/2024
(b) |
355,623 | 298,834 | |||
| RETAIL-BUILDING PRODUCTS — 0.0% (d) | |||||
|
Kodiak Building Partners, Inc. Senior Secured Term Loan B, 3 Month USD LIBOR + 3.25%, 4.00%, 3/12/2028
(b) |
139,650 | 139,650 | |||
| LBM Acquisition LLC: | |||||
|
Senior Secured Delayed Draw Term Loan, 12/17/2027
(b)
(h) |
30,909 | 30,732 | |||
|
Senior Secured Term Loan B, 3 Month USD LIBOR + 3.75%, 4.50%, 12/17/2027
(b) |
208,115 | 206,922 | |||
|
Park River Holdings Inc Senior Secured Term Loan, 3 Month USD LIBOR + 3.25%, 4.00%, 12/28/2027
(b) |
295,000 | 293,894 | |||
| 671,198 | |||||
| RETAIL-RESTAURANTS — 0.0% (d) | |||||
|
IRB Holding Corp Senior Secured 2020 Fourth Amendment Incremental Term Loan, 3 Month USD LIBOR + 3.25%, 4.25%, 12/15/2027
(b) |
278,600 | 278,928 | |||
|
Whatabrands LLC Senior Secured 2020 Term Loan B, 1 Month USD LIBOR + 2.75%, 2.83%, 7/31/2026
(b) |
283,598 | 282,711 | |||
| 561,639 | |||||
| ROAD & RAIL — 0.0% (d) | |||||
|
PODS, LLC Senior Secured 2021 Term Loan B, 1 Month USD LIBOR + 3.00%, 3.75%, 3/31/2028
(b) |
573,563 | 573,043 | |||
| SEMICONDUCTOR EQUIPMENT — 0.0% (d) | |||||
|
Tech Data Corporation Senior Secured ABL Term Loan, 1 Month USD LIBOR + 3.50%, 3.60%, 6/30/2025
(b) |
838,663 | 841,057 |
| Security Description | Principal
Amount |
Value | |||
| SEMICONDUCTORS & SEMICONDUCTOR EQUIPMENT — 0.0% (d) | |||||
|
Ultra Clean Holdings, Inc. Senior Secured 2021 Term Loan B, 1 Month USD LIBOR + 3.75%, 3.85%, 8/27/2025
(b) |
$ 157,398 | $ 157,922 | |||
| SOFTWARE — 0.6% | |||||
|
Applied Systems, Inc. Senior Secured 2017 1st Lien Term Loan, 1 Month USD LIBOR + 3.25%, 3.75%, 9/19/2024
(b) |
281,712 | 281,467 | |||
|
Artera Services, LLC Senior Secured Incremental Term Loan, 3/6/2025
(h) |
205,000 | 204,552 | |||
|
Athenahealth, Inc. Senior Secured 2021 Term Loan B1, 3 Month USD LIBOR + 4.25%, 4.41%, 2/11/2026
(b) |
361,883 | 363,354 | |||
|
Atlas Purchaser, Inc. Senior Secured 2021 Term Loan, 3 Month USD LIBOR + 5.25%, 6.00%, 5/8/2028
(b) |
300,000 | 295,812 | |||
|
Banff Merger Sub, Inc. Senior Secured 2021 USD Term Loan, 1 Month USD LIBOR + 3.75%, 3.85%, 10/2/2025
(b) |
265,325 | 264,139 | |||
|
Camelot U.S. Acquisition 1 Co. Senior Secured Term Loan B, 1 Month USD LIBOR + 3.00%, 3.10%, 10/30/2026
(b) |
1,226,325 | 1,222,646 | |||
|
Castle US Holding Corporation Senior Secured USD Term Loan B, 3 Month USD LIBOR + 3.75%, 3.90%, 1/29/2027
(b) |
1,266,667 | 1,253,506 | |||
| Cengage Learning, Inc.: | |||||
|
Senior Secured 2016 Term Loan B, 1 Month USD LIBOR + 4.25%, 5.25%, 6/7/2023
(b) |
536,375 | 537,909 | |||
|
Senior Secured 2021 Term Loan B, 6/29/2026
(h) |
440,000 | 441,102 | |||
|
CommerceHub, Inc. Senior Secured 2020 Term Loan B, 3 Month USD LIBOR + 4.00%, 4.75%, 12/29/2027
(b) |
139,300 | 139,822 | |||
|
Constant Contact Inc Senior Secured Term Loan, 3 Month USD LIBOR + 4.00%, 4.75%, 2/10/2028
(b) |
398,059 | 397,561 | |||
|
DCert Buyer, Inc. Senior Secured 2019 Term Loan B, 1 Month USD LIBOR + 4.00%, 4.10%, 10/16/2026
(b) |
94,521 | 94,758 | |||
| Finastra USA, Inc.: | |||||
|
Senior Secured USD 1st Lien Term Loan, 6 Month USD LIBOR + 3.50%, 4.50%, 6/13/2024
(b) |
514,849 | 507,595 | |||
|
Senior Secured USD 2nd Lien Term Loan, 6 Month USD LIBOR + 7.25%, 8.25%, 6/13/2025
(b) |
105,000 | 106,346 | |||
|
First Advantage Holdings, LLC Senior Secured 2021 Term Loan B, 1 Month USD LIBOR + 2.75%, 2.85%, 1/31/2027
(b) |
275,666 | 274,762 | |||
|
Flexera Software LLC Senior Secured 2021 Term Loan B, 3 Month USD LIBOR + 3.75%, 4.50%, 3/3/2028
(b) |
536,841 | 538,663 |
| Security Description | Principal
Amount |
Value | |||
|
Grab Holdings, Inc. Senior Secured Term Loan B, 6 Month USD LIBOR + 4.50%, 5.50%, 1/29/2026
(b) |
$ 304,237 | $ 309,562 | |||
|
Greeneden U.S. Holdings II, LLC Senior Secured 2020 USD Term Loan B4, 1 Month USD LIBOR + 4.00%, 4.75%, 12/1/2027
(b) |
1,223,951 | 1,228,326 | |||
|
Helios Software Holdings, Inc. Senior Secured 2021 USD Term Loan B, 6 Month USD LIBOR + 3.75%, 3.92%, 3/11/2028
(b) |
513,714 | 514,598 | |||
| Hyland Software, Inc.: | |||||
|
Senior Secured 2018 1st Lien Term Loan, 1 Month USD LIBOR + 3.50%, 4.25%, 7/1/2024
(b) |
1,216,433 | 1,220,107 | |||
|
Senior Secured 2021 2nd Lien Term Loan, 1 Month USD LIBOR + 6.25%, 7.00%, 7/7/2025
(b) |
45,000 | 45,356 | |||
|
I-Logic Technologies Bidco, Ltd. Senior Secured 2021 USD Term Loan B, 3 Month USD LIBOR + 4.00%, 4.50%, 2/16/2028
(b) |
162,500 | 163,255 | |||
|
Informatica LLC, Senior Secured 2020 USD Term Loan B, 1 Month USD LIBOR + 3.25%, 3.35%, 2/25/2027
(b) |
202,438 | 201,517 | |||
|
ION Trading Finance Limited Senior Secured 2021 USD Term Loan, 3 Month USD LIBOR + 4.75%, 4.92%, 4/1/2028
(b) |
590,000 | 593,319 | |||
|
LogMeIn, Inc. Senior Secured Term Loan B, 1 Month USD LIBOR + 4.75%, 4.83%, 8/31/2027
(b) |
701,475 | 701,201 | |||
|
Mitchell International, Inc. Senior Secured 2017 1st Lien Term Loan, 1 Month USD LIBOR + 3.25%, 3.35%, 11/29/2024
(b) |
1,067,535 | 1,059,198 | |||
|
PointClickCare Technologies, Inc. Senior Secured Term Loan B, 6 Month USD LIBOR + 3.00%, 3.75%, 12/29/2027
(b) |
145,000 | 145,091 | |||
|
Polaris Newco LLC Senior Secured USD Term Loan B, 6 Month USD LIBOR + 4.00%, 4.50%, 6/2/2028
(b) |
590,000 | 592,472 | |||
|
Project Alpha Intermediate Holding, Inc. Senior Secured 2021 Term Loan B, 1 Month USD LIBOR + 4.00%, 4.11%, 4/26/2024
(b) |
709,052 | 710,949 | |||
|
Proofpoint, Inc. Senior Secured 1st Lien Term Loan, 6/9/2028
(h) |
340,000 | 338,514 | |||
|
Renaissance Holding Corp. Senior Secured 2018 2nd Lien Term Loan, 7.00%, 5/29/2026
(b)
(h) |
150,000 | 150,488 | |||
|
Sabre GLBL, Inc. Senior Secured 2020 Term Loan B, 1 Month USD LIBOR + 4.00%, 4.75%, 12/17/2027
(b) |
134,325 | 135,388 | |||
|
Severin Acquisition, LLC Senior Secured 2018 Term Loan B, 1 Month USD LIBOR + 3.25%, 3.33%, 8/1/2025
(b) |
597,080 | 594,626 |
| Security Description | Principal
Amount |
Value | |||
|
Sophia, L.P. Senior Secured 2020 1st Lien Term Loan, 3 Month USD LIBOR + 3.75%, 4.50%, 10/7/2027
(b) |
$ 592,025 | $ 593,259 | |||
|
Surf Holdings, LLC Senior Secured USD Term Loan, 3 Month USD LIBOR + 3.50%, 3.63%, 3/5/2027
(b) |
1,029,603 | 1,024,136 | |||
|
Tempo Acquisition LLC Senior Secured 2020 Extended Term Loan, 1 Month USD LIBOR + 3.25%, 3.75%, 11/2/2026
(b) |
1,075,125 | 1,077,813 | |||
|
Tibco Software Inc. Senior Secured 2020 Term Loan B3, 1 Month USD LIBOR + 3.75%, 3.86%, 6/30/2026
(b) |
1,029,315 | 1,028,028 | |||
| Ultimate Software Group, Inc. (The): | |||||
|
Senior Secured 2020 2nd Lien Incremental Term Loan, 3 Month USD LIBOR + 6.75%, 7.50%, 5/3/2027
(b) |
95,000 | 96,940 | |||
|
Senior Secured 2021 Incremental Term Loan, 3 Month USD LIBOR + 3.25%, 4.00%, 5/4/2026
(b) |
590,961 | 592,412 | |||
|
Virtusa Corporation Senior Secured Term Loan B, 1 Month USD LIBOR + 4.25%, 5.00%, 2/11/2028
(b) |
69,825 | 70,218 | |||
| 20,110,767 | |||||
| SPECIALTY RETAIL — 0.1% | |||||
|
At Home Group, Inc. Senior Secured Term Loan B, 7/30/2028
(h) |
160,000 | 160,400 | |||
|
Great Outdoors Group, LLC Senior Secured 2021 Term Loan B, 6 Month USD LIBOR + 4.25%, 5.00%, 3/6/2028
(b) |
462,675 | 464,917 | |||
|
Jo-Ann Stores, Inc. Senior Secured 2021 Term Loan B, 6/30/2028
(h) |
140,000 | 139,650 | |||
|
K-Mac Holdings Corp Senior Secured 2021 Term Loan, 6/23/2028
(h) |
85,000 | 85,292 | |||
|
Michaels Companies, Inc. Senior Secured 2021 Term Loan B, 3 Month USD LIBOR + 4.25%, 5.00%, 4/15/2028
(b) |
195,000 | 196,053 | |||
|
Petco Animal Supplies, Inc. Senior Secured 2021 Term Loan B, 3 Month USD LIBOR + 3.25%, 4.00%, 3/3/2028
(b) |
583,538 | 583,018 | |||
|
PetSmart, Inc. Senior Secured 2021 Term Loan B, 3 Month USD LIBOR + 3.75%, 4.50%, 2/12/2028
(b) |
300,000 | 300,600 | |||
|
Rent-A-Center, Inc. Senior Secured 2021 Term Loan B, 1 Month USD LIBOR + 4.00%, 4.75%, 2/17/2028
(b) |
169,575 | 169,999 | |||
|
SRS Distribution Inc. Senior Secured 2021 Term Loan B, 1 Month USD LIBOR + 3.75%, 4.25%, 6/2/2028
(b) |
270,000 | 270,169 | |||
|
Staples, Inc. Senior Secured 7 Year Term Loan, 3 Month USD LIBOR + 5.00%, 5.18%, 4/16/2026
(b) |
210,000 | 205,013 | |||
|
Victoria's Secret & Co. Senior Secured Term Loan B, 6/30/2028
(h) |
210,000 | 207,900 | |||
| 2,783,011 |
| Security Description | Principal
Amount |
Value | |||
| STEEL-PRODUCERS — 0.0% (d) | |||||
|
Phoenix Services International, LLC Senior Secured Term Loan, 3/1/2025
(b)
(h) |
$ 399,304 | $ 399,242 | |||
| TELECOM SERVICES — 0.0% (d) | |||||
|
Connect Finco Sarl Senior Secured 2021 Term Loan B, 1 Month USD LIBOR + 3.50%, 4.50%, 12/11/2026
(b) |
143,188 | 143,546 | |||
| TELECOMMUNICATION EQUIP — 0.1% | |||||
|
Altice France S.A. Senior Secured 2018 Term Loan B13, 3 Month USD LIBOR + 4.00%, 4.15%, 8/14/2026
(b) |
755,316 | 755,275 | |||
|
Cologix, Inc. Senior Secured 2021 Term Loan B, 1 Month USD LIBOR + 3.75%, 4.50%, 5/1/2028
(b) |
490,000 | 492,653 | |||
|
Delta TopCo, Inc. Senior Secured 2020 Term Loan B, 3 Month USD LIBOR + 3.75%, 4.50%, 12/1/2027
(b) |
275,000 | 275,975 | |||
|
GOGO Intermediate Holdings LLC Senior Secured Term Loan B, 3 Month USD LIBOR + 3.75%, 4.50%, 4/30/2028
(b) |
310,000 | 309,922 | |||
|
MLN US HoldCo LLC Senior Secured 2018 1st Lien Term Loan, 1 Month USD LIBOR + 4.50%, 4.59%, 11/30/2025
(b) |
105,039 | 96,676 | |||
| 1,930,501 | |||||
| TRADING COMPANIES & DISTRIBUTORS — 0.0% (d) | |||||
|
Foundation Building Materials Holding Company LLC Senior Secured 2021 Term Loan, 3 Month USD LIBOR + 3.25%, 3.75%, 2/3/2028
(b) |
300,000 | 298,344 | |||
| TRANSPORT-AIR FREIGHT — 0.0% (d) | |||||
|
Kestrel Bidco, Inc. Senior Secured Term Loan B, 6 Month USD LIBOR + 3.00%, 4.00%, 12/11/2026
(b) |
557,752 | 547,643 | |||
|
TOTAL SENIOR FLOATING RATE LOANS (Cost
$97,633,510) |
98,074,103 | ||||
| U.S. GOVERNMENT AGENCY OBLIGATIONS — 35.2% | |||||
| Federal Home Loan Mortgage Corp.: | |||||
|
2.50%,
4/1/2033 |
1,917,929 | 2,010,010 | |||
|
2.50%,
9/1/2050 |
17,738,480 | 18,420,311 | |||
|
3.00%,
11/1/2042 |
8,668,741 | 9,196,905 | |||
|
3.00%,
12/1/2042 |
6,305,069 | 6,631,312 | |||
|
3.00%,
1/1/2045 |
1,083,746 | 1,148,288 | |||
|
3.00%,
2/1/2045 |
739,146 | 779,900 |
| Security Description | Principal
Amount |
Value | |||
|
3.00%,
3/1/2045 |
$ 736,973 | $ 777,607 | |||
|
3.00%,
4/1/2045 |
19,991,458 | 21,157,166 | |||
|
3.00%,
5/1/2045 |
2,868,284 | 3,026,432 | |||
|
3.00%,
8/1/2045 |
8,335,442 | 8,795,030 | |||
|
3.00%,
7/1/2047 |
2,910,739 | 3,061,349 | |||
|
3.00%,
5/1/2051 |
19,719,120 | 20,680,203 | |||
|
3.00%,
6/1/2051 |
24,933,555 | 26,169,126 | |||
|
3.50%,
2/1/2045 |
1,281,223 | 1,371,695 | |||
|
3.50%,
4/1/2045 |
17,589,878 | 18,982,347 | |||
|
3.50%,
6/1/2045 |
8,463,643 | 9,154,942 | |||
|
3.50%,
10/1/2045 |
9,032,438 | 9,770,162 | |||
|
3.50%,
2/1/2046 |
5,295,139 | 5,629,267 | |||
|
4.00%,
4/1/2047 |
14,853,521 | 15,894,667 | |||
|
4.00%,
7/1/2047 |
3,910,426 | 4,184,422 | |||
|
4.00%,
10/1/2047 |
8,375,627 | 8,962,490 | |||
|
4.50%,
6/1/2044 |
1,284,879 | 1,419,029 | |||
|
Series 326, Class 300, CMO, 3.00%,
3/15/2044 |
16,636,121 | 17,588,716 | |||
|
Series 358, Class 300, CMO, 3.00%,
10/15/2047 |
19,830,814 | 20,880,077 | |||
|
Series 3852, Class NS, CMO, IO, REMIC, 6.00% - 1 Month USD LIBOR 5.93%, 5/15/2041
(b) |
5,645,236 | 763,825 | |||
|
Series 3889, Class VZ, CMO, REMIC, 4.00%,
7/15/2041 |
4,224,360 | 4,527,054 | |||
|
Series 3935, Class SJ, CMO, IO, REMIC, 6.65% - 1 Month USD LIBOR 6.58%, 5/15/2041
(b) |
965,809 | 105,302 | |||
|
Series 4120, Class KA, CMO, REMIC, 1.75%,
10/15/2032 |
8,805,580 | 9,060,743 | |||
|
Series 4165, Class ZT, CMO, REMIC, 3.00%,
2/15/2043 |
7,255,227 | 7,445,985 | |||
|
Series 4364, Class ZX, CMO, REMIC, 4.00%,
7/15/2044 |
31,689,805 | 35,177,932 | |||
|
Series 4434, Class LZ, CMO, REMIC, 3.00%,
2/15/2045 |
3,626,889 | 3,853,443 | |||
|
Series 4444, Class CZ, CMO, REMIC, 3.00%,
2/15/2045 |
13,298,592 | 14,126,330 | |||
|
Series 4447, Class A, CMO, REMIC, 3.00%,
6/15/2041 |
416,143 | 421,133 | |||
|
Series 4447, Class Z, CMO, REMIC, 3.00%,
3/15/2045 |
4,389,378 | 4,667,402 |
| Security Description | Principal
Amount |
Value | |||
|
Series 4471, Class BA, CMO, REMIC, 3.00%,
12/15/2041 |
$ 1,808,127 | $ 1,862,673 | |||
|
Series 4471, Class GA, CMO, REMIC, 3.00%,
2/15/2044 |
5,298,930 | 5,528,786 | |||
|
Series 4474, Class ZX, CMO, REMIC, 4.00%,
4/15/2045 |
13,195,235 | 14,690,127 | |||
|
Series 4481, Class B, CMO, REMIC, 3.00%,
12/15/2042 |
2,123,445 | 2,202,625 | |||
|
Series 4483, Class CA, CMO, REMIC, 3.00%,
6/15/2044 |
5,564,179 | 5,801,086 | |||
|
Series 4484, Class CD, CMO, REMIC, 1.75%,
7/15/2030 |
5,331,483 | 5,457,668 | |||
|
Series 4492, Class GZ, CMO, REMIC, 3.50%,
7/15/2045 |
9,344,084 | 9,935,929 | |||
|
Series 4499, Class AB, CMO, REMIC, 3.00%,
6/15/2042 |
3,882,696 | 3,997,177 | |||
|
Series 4504, Class CA, CMO, REMIC, 3.00%,
4/15/2044 |
5,492,597 | 5,721,562 | |||
|
Series 4533, Class AB, CMO, REMIC, 3.00%,
6/15/2044 |
4,582,001 | 4,765,539 | |||
|
Series 4543, Class HG, CMO, REMIC, 2.70%,
4/15/2044 |
8,315,309 | 8,605,879 | |||
|
Series 4582, Class HA, CMO, REMIC, 3.00%,
9/15/2045 |
6,382,359 | 6,648,487 | |||
|
Series 4702, Class ZL, CMO, 3.00%,
7/15/2047 |
13,944,007 | 15,117,178 | |||
|
Series 4750, Class PA, 3.00%,
7/15/2046 |
6,907,646 | 7,166,947 | |||
|
Series 4792, Class A, CMO, REMIC, 3.00%,
5/15/2048 |
5,705,459 | 5,971,045 | |||
|
Series 4951, Class EA, CMO, 2.50%,
9/15/2044 |
6,812,393 | 7,072,397 | |||
| Federal National Mortgage Association: | |||||
|
1.41%,
12/1/2030 |
10,000,000 | 9,885,543 | |||
|
2.00%,
2/1/2036 |
1,913,331 | 1,974,024 | |||
|
2.00%,
5/1/2036 |
55,162,899 | 57,275,492 | |||
|
2.00%,
5/1/2041 |
39,684,456 | 40,521,706 | |||
|
2.00%,
5/1/2051 |
29,786,886 | 30,152,362 | |||
|
2.22%,
12/1/2029 |
5,400,000 | 5,706,907 | |||
|
2.44%,
1/1/2032 |
16,600,000 | 17,817,038 | |||
|
2.50%,
10/1/2040 |
23,811,018 | 24,905,724 | |||
|
2.50%,
9/1/2046 |
2,745,450 | 2,828,090 | |||
|
2.50%,
2/1/2047 |
6,879,137 | 7,148,300 |
| Security Description | Principal
Amount |
Value | |||
|
2.50%,
11/1/2050 |
$ 18,996,158 | $ 19,825,858 | |||
|
2.50%,
2/1/2051 |
13,463,119 | 13,983,628 | |||
|
2.50%,
4/1/2051 |
4,620,109 | 4,807,912 | |||
|
2.50%,
5/1/2051 |
42,920,195 | 44,600,747 | |||
|
12 Month USD LIBOR + 1.66% 2.64%, 5/1/2044
(b) |
7,033,651 | 7,296,578 | |||
|
2.69%,
8/1/2030 |
23,794,445 | 25,819,379 | |||
|
2.80%,
11/1/2039 |
10,034,000 | 11,085,215 | |||
|
3.00%,
5/1/2035 |
4,574,680 | 4,838,571 | |||
|
3.00%,
10/1/2041 |
13,125,948 | 13,805,579 | |||
|
3.00%,
3/1/2043 |
3,196,747 | 3,396,690 | |||
|
3.00%,
7/1/2043 |
3,381,570 | 3,533,954 | |||
|
3.00%,
1/1/2045 |
152,288 | 159,003 | |||
|
3.00%,
3/1/2045 |
1,004,520 | 1,059,375 | |||
|
3.00%,
4/1/2045 |
2,303,676 | 2,398,720 | |||
|
3.00%,
7/1/2045 |
18,326,079 | 19,472,297 | |||
|
3.00%,
10/1/2046 |
3,534,072 | 3,717,058 | |||
|
3.00%,
2/1/2047 |
12,360,855 | 13,000,871 | |||
|
3.00%,
11/1/2048 |
7,648,648 | 8,044,678 | |||
|
3.00%,
10/1/2049 |
4,761,857 | 5,014,254 | |||
|
3.00%,
4/1/2053 |
13,540,870 | 14,558,292 | |||
|
3.50%,
9/1/2034 |
1,274,262 | 1,364,662 | |||
|
3.50%,
12/1/2034 |
1,122,937 | 1,202,602 | |||
|
3.50%,
2/1/2035 |
726,618 | 778,167 | |||
|
3.50%,
1/1/2045 |
7,953,785 | 8,598,853 | |||
|
3.50%,
2/1/2045 |
2,360,938 | 2,526,428 | |||
|
3.50%,
6/1/2045 |
8,507,113 | 9,198,172 | |||
|
3.88%,
10/1/2030 |
11,560,000 | 13,543,220 | |||
|
4.50%,
3/1/2044 |
1,183,579 | 1,306,329 | |||
|
4.50%,
6/1/2044 |
488,262 | 538,899 | |||
|
4.50%,
7/1/2044 |
496,429 | 547,913 | |||
|
4.50%,
2/1/2045 |
724,514 | 799,654 | |||
|
Series 2010-109, Class N, CMO, REMIC, 3.00%,
10/25/2040 |
1,637,853 | 1,742,956 | |||
|
Series 2011-51, Class CI, CMO, IO, REMIC, 6.00% - 1 Month USD LIBOR 5.91%, 6/25/2041
(b) |
3,480,631 | 604,195 | |||
|
Series 2012-127, Class PA, CMO, REMIC, 2.75%,
11/25/2042 |
2,103,081 | 2,218,995 | |||
|
Series 2012-151, Class SB, CMO, REMIC, 6.00% - 1 Month USD LIBOR 5.86%, 1/25/2043
(b) |
135,265 | 136,651 |
| Security Description | Principal
Amount |
Value | |||
|
Series 2013-114, Class HZ, CMO, REMIC, 3.00%,
11/25/2038 |
$ 17,957,584 | $ 19,159,513 | |||
|
Series 2013-18, Class CD, CMO, REMIC, 1.50%,
10/25/2027 |
2,511,537 | 2,534,830 | |||
|
Series 2013-30, Class PS, CMO, REMIC, 6.00% - 1 Month USD LIBOR 5.86%, 4/25/2043
(b) |
825,677 | 840,599 | |||
|
Series 2014-21, Class GZ, CMO, REMIC, 3.00%,
4/25/2044 |
5,653,452 | 5,908,766 | |||
|
Series 2014-39, Class ZA, CMO, REMIC, 3.00%,
7/25/2044 |
7,207,011 | 7,498,621 | |||
|
Series 2015-42, Class CA, CMO, REMIC, 3.00%,
3/25/2044 |
3,440,900 | 3,582,801 | |||
|
Series 2015-9, Class HA, CMO, REMIC, 3.00%,
1/25/2045 |
6,401,347 | 6,818,262 | |||
|
Series 2015-95, Class AP, CMO, REMIC, 3.00%,
8/25/2042 |
1,830,377 | 1,845,721 | |||
|
Series 2016-21, Class BZ, CMO, REMIC, 3.00%,
4/25/2046 |
5,069,065 | 5,383,068 | |||
|
Series 2016-32, Class LA, CMO, REMIC, 3.00%,
10/25/2044 |
6,298,884 | 6,520,826 | |||
|
Series 2016-72, Class PA, CMO, REMIC, 3.00%,
7/25/2046 |
6,323,931 | 6,597,799 | |||
|
Series 2016-81, Class PA, CMO, REMIC, 3.00%,
2/25/2044 |
6,083,790 | 6,249,360 | |||
|
Series 2016-9, Class A, CMO, REMIC, 3.00%,
9/25/2043 |
2,009,106 | 2,042,331 | |||
|
Series 2016-92, Class A, CMO, REMIC, 3.00%,
4/25/2042 |
9,898,852 | 10,145,465 | |||
|
Series 2017-18, Class A, CMO, REMIC, 3.00%,
8/25/2042 |
1,457,299 | 1,459,039 | |||
|
Series 2017-32, Class CA, CMO, REMIC, 3.00%,
10/25/2042 |
1,513,550 | 1,515,358 | |||
|
Series 2017-87, Class BA, CMO, REMIC, 3.00%,
12/25/2042 |
9,755,879 | 9,885,197 | |||
|
Series 2018-M10, Class A1, 3.48%, 7/25/2028
(b) |
11,937,272 | 12,954,652 | |||
|
Series 2020-47, Class GL, CMO, 2.00%,
5/25/2046 |
10,000,000 | 10,301,314 | |||
|
Series 2021-29, Class BA, CMO, 1.25%,
5/25/2041 |
14,591,343 | 14,616,669 | |||
|
Series 2021-35, Class EH, CMO, 2.00%,
2/25/2037 |
24,177,643 | 24,874,180 |
| Security Description | Principal
Amount |
Value | |||
| Government National Mortgage Association: | |||||
|
2.50%,
3/20/2051 |
$ 11,336,191 | $ 11,807,725 | |||
|
Series 2013-169, Class SE, CMO, IO, REMIC, 6.05% - 1 Month USD LIBOR 5.98%, 11/16/2043
(b) |
1,265,179 | 214,141 | |||
|
Series 2013-34, Class PL, CMO, REMIC, 3.00%,
3/20/2042 |
3,569,655 | 3,665,639 | |||
|
Series 2014-43, Class PS, CMO, IO, REMIC, 6.18% - 1 Month USD LIBOR 6.09%, 7/20/2042
(b) |
3,124,162 | 283,925 | |||
|
Series 2020-116, Class HS, CMO, IO, 1 Month USD LIBOR + 6.20% 6.11%, 8/20/2050
(b) |
12,526,786 | 2,233,652 | |||
|
Series 2020-173, Class SY, CMO, IO, 1 Month USD LIBOR + 6.30% 6.21%, 11/20/2050
(b) |
34,764,957 | 8,736,477 | |||
|
Series 2020-173, Class TI, CMO, IO, 2.00%,
11/20/2050 |
40,503,116 | 5,409,713 | |||
|
Series 2020-176, Class SL, CMO, IO, 1 Month USD LIBOR + 5.00% 4.91%, 11/20/2050
(b) |
10,940,515 | 2,060,605 | |||
|
Series 2020-185, Class SE, CMO, IO, 1 Month USD LIBOR + 6.30% 6.21%, 12/20/2050
(b) |
43,624,018 | 9,615,377 | |||
|
Series 2021-40, Class IO, IO, VRN, 0.84%, 2/16/2063
(b) |
79,649,364 | 6,244,149 | |||
|
Series 2021-60, Class IO, IO, VRN, 0.84%, 5/16/2063
(b) |
61,825,730 | 4,877,564 | |||
|
Series 2021-80, Class IO, IO, VRN, 0.91%, 12/16/2062
(b) |
92,624,734 | 7,768,843 | |||
|
Series 2021-85, Class IO, IO, VRN, 0.71%, 3/16/2063
(b) |
107,802,283 | 8,008,990 | |||
|
TOTAL U.S. GOVERNMENT AGENCY OBLIGATIONS (Cost
$1,098,955,029) |
1,121,788,419 | ||||
| U.S. TREASURY OBLIGATIONS — 24.6% | |||||
|
Treasury Bonds 1.88%,
2/15/2051 |
44,000,000 | 41,985,625 | |||
| Treasury Notes: | |||||
|
0.13%,
1/15/2024 |
111,200,000 | 110,539,750 | |||
|
0.25%,
6/15/2024 |
117,200,000 | 116,494,969 | |||
|
0.38%,
11/30/2025 |
73,200,000 | 71,884,688 | |||
|
0.50%,
6/30/2027 |
63,500,000 | 61,431,289 | |||
|
0.63%,
5/15/2030 |
36,200,000 | 33,841,344 |
| Security Description | Principal
Amount |
Value | |||
|
0.88%,
6/30/2026 |
$ 65,000,000 | $ 64,979,688 | |||
|
1.25%,
6/30/2028 |
65,000,000 | 65,111,719 | |||
|
1.63%,
5/15/2031 |
64,000,000 | 65,000,000 | |||
|
1.63%,
5/15/2026 |
21,500,000 | 22,286,094 | |||
|
2.13%,
7/31/2024 |
42,100,000 | 44,224,734 | |||
|
2.25%,
11/15/2025 |
83,600,000 | 88,949,094 | |||
|
TOTAL U.S. TREASURY OBLIGATIONS (Cost
$778,244,015) |
786,728,994 | ||||
| MORTGAGE-BACKED SECURITIES — 8.0% | |||||
| Alternative Loan Trust: | |||||
|
Series 2005-79CB, Class A4, CMO, 5.50%,
1/25/2036 |
4,208,884 | 3,479,789 | |||
|
Series 2006-24CB, Class A9, CMO, 6.00%,
8/25/2036 |
3,040,369 | 2,353,506 | |||
|
Series 2006-43CB, Class 1A12, CMO, 5.75%,
2/25/2037 |
2,736,373 | 2,025,818 | |||
|
Alternative Loan Trust 2005-21CB Series 2005-21CB, Class A3, CMO, 5.25%,
6/25/2035 |
2,273,240 | 2,170,305 | |||
| Banc of America Funding Trust: | |||||
|
Series 2006-8T2, Class A4, CMO, 5.83%, 10/25/2036
(e) |
2,573,875 | 2,603,124 | |||
|
Series 2007-5, Class CA1, CMO, 6.00%,
7/25/2037 |
4,193,557 | 3,714,656 | |||
|
BANK Series 2017-BNK6, Class XA, IO, 0.95%, 7/15/2060
(b) |
53,157,301 | 1,960,954 | |||
| BBCMS Mortgage Trust: | |||||
|
Series 2017-DELC, Class B, 1 Month USD LIBOR + 1.03% 1.10%, 8/15/2036
(a)
(b) |
2,449,000 | 2,450,225 | |||
|
Series 2017-DELC, Class C, 1 Month USD LIBOR + 1.20% 1.27%, 8/15/2036
(a)
(b) |
863,000 | 863,442 | |||
|
Series 2017-DELC, Class D, 1 Month USD LIBOR + 1.70% 1.77%, 8/15/2036
(a)
(b) |
983,000 | 983,326 | |||
|
Series 2017-DELC, Class E, 1 Month USD LIBOR + 2.50% 2.57%, 8/15/2036
(a)
(b) |
1,982,000 | 1,977,246 | |||
|
Series 2017-DELC, Class F, 1 Month USD LIBOR + 3.50% 3.57%, 8/15/2036
(a)
(b) |
1,974,000 | 1,955,073 | |||
|
BBCMS Trust Series 2018-BXH, Class A, 1 Month USD LIBOR + 1.00%, 1.07%, 10/15/2037
(a)
(b) |
205,725 | 205,484 | |||
|
BCAP LLC Trust Series 2010-RR4, Class 3212, CMO, 6.46%, 1/26/2037
(a)
(b) |
7,798,430 | 7,039,460 | |||
|
BRAVO Residential Funding Trust 2021-A Series 2021-A, Class A1, CMO, 1.99%, 4/25/2031
(a)
(e) |
9,517,916 | 9,519,781 |
| Security Description | Principal
Amount |
Value | |||
|
BX Trust Series 2018-EXCL, Class A, 1 Month USD LIBOR + 1.09%, 1.16%, 9/15/2037
(a)
(b) |
$ 204,195 | $ 201,809 | |||
|
ChaseFlex Trust Series 2007-3 Series 2007-3, Class 1A2, CMO, 1 Month USD LIBOR + 0.46%, 0.55%, 7/25/2037
(b) |
8,566,912 | 2,242,269 | |||
| CHL Mortgage PassThrough Trust: | |||||
|
Series 2005-J2, Class 3A14, CMO, 5.50%,
8/25/2035 |
753,175 | 648,771 | |||
|
Series 2007-12, Class A9, CMO, 5.75%,
8/25/2037 |
2,851,334 | 2,222,003 | |||
|
CHL Mortgage Pass-Through Trust 2007-HYB1 Series 2007-HYB1, Class 2A1, CMO, 2.83%, 3/25/2037
(b) |
1,364,761 | 1,277,344 | |||
|
CHT COSMO Mortgage Trust Series 2017-CSMO, Class E, 1 Month USD LIBOR + 3.00%, 3.07%, 11/15/2036
(a)
(b) |
1,333,000 | 1,336,630 | |||
| Citigroup Mortgage Loan Trust: | |||||
|
Series 2007-AR4, Class 1A1A, CMO, 3.19%, 3/25/2037
(b) |
2,035,316 | 1,977,106 | |||
|
Series 2007-AR5, Class 1A2A, CMO, 3.10%, 4/25/2037
(b) |
985,337 | 882,645 | |||
|
Series 2021-JL1, Class A, 2.75%, 2/27/2062
(a)
(b) |
1,759,231 | 1,746,887 | |||
|
CitiMortgage Alternative Loan Trust Series 2007-A1, Class 1A7, CMO, 6.00%,
1/25/2037 |
4,784,074 | 4,485,078 | |||
|
COMM Mortgage Trust Series 2018-HCLV, Class A, 1 Month USD LIBOR + 1.00%, 1.07%, 9/15/2033
(a)
(b) |
347,000 | 345,670 | |||
|
CSAIL Commercial Mortgage Trust Series 2017-CX10, Class XA, IO, 0.85%, 11/15/2050
(b) |
64,263,576 | 2,271,945 | |||
|
CSMC MortgageBacked Trust Series 2006-7, Class 7A7, CMO, 6.00%,
8/25/2036 |
1,577,013 | 1,689,938 | |||
| CSMC Trust: | |||||
|
Series 2017-MOON, Class E, 3.30%, 7/10/2034
(a)
(b) |
3,181,000 | 3,180,904 | |||
|
Series 2019-RPL8, Class A2, CMO, 4.06%, 10/25/2058
(a)
(e) |
20,313,550 | 20,357,643 | |||
|
Series 2020-RPL2, Class A12, CMO, 3.44%, 2/25/2060
(a)
(b) |
11,511,985 | 11,633,994 | |||
| FMC GMSR Issuer Trust: | |||||
|
Series 2019-GT2, Class A, CMO, VRN, 4.23%, 9/25/2024
(a)
(b) |
3,100,000 | 3,095,006 | |||
|
Series 2020-GT1, Class A, CMO, VRN, 4.45%, 1/25/2026
(a)
(b) |
3,000,000 | 3,014,058 | |||
|
FWD Securitization Trust Series 2019-INV1, Class A3, 3.11%, 6/25/2049
(a)
(b) |
1,358,655 | 1,366,836 | |||
|
Government National Mortgage Association 0.92%,
8/16/2063 |
92,194,000 | 7,945,012 |
| Security Description | Principal
Amount |
Value | |||
|
Great Wolf Trust Series 2019-WOLF, Class E, 1 Month USD LIBOR + 2.73%, 2.81%, 12/15/2036
(a)
(b) |
$ 100,000 | $ 98,118 | |||
| GS Mortgage Securities Trust: | |||||
|
Series 2017-GS7, Class XA, IO, 1.26%, 8/10/2050
(b) |
40,270,890 | 2,074,997 | |||
|
Series 2018-TWR, Class A, 1 Month USD LIBOR + 0.90% 0.97%, 7/15/2031
(a)
(b) |
650,000 | 648,092 | |||
|
Series 2018-TWR, Class D, 1 Month USD LIBOR + 1.60% 1.67%, 7/15/2031
(a)
(b) |
650,000 | 640,980 | |||
|
Series 2018-TWR, Class E, 1 Month USD LIBOR + 2.10% 2.17%, 7/15/2031
(a)
(b) |
650,000 | 626,114 | |||
|
Series 2018-TWR, Class F, 1 Month USD LIBOR + 2.80% 2.87%, 7/15/2031
(a)
(b) |
650,000 | 613,301 | |||
|
Series 2018-TWR, Class G, 1 Month USD LIBOR + 3.92% 4.00%, 7/15/2031
(a)
(b) |
650,000 | 570,415 | |||
|
Series 2019-SOHO, Class E, 1 Month USD LIBOR + 1.87% 1.95%, 6/15/2036
(a)
(b) |
3,411,000 | 3,351,307 | |||
|
GSR Mortgage Loan Trust Series 2006-OA1, Class 1A1, CMO, 1 Month USD LIBOR + 0.22%, 0.53%, 8/25/2046
(b) |
14,909,246 | 4,604,137 | |||
|
Headlands Residential Series 2019-RPL1, Class NOTE, 3.97%, 6/25/2024
(a)
(e) |
4,100,000 | 4,115,748 | |||
|
IndyMac IMJA Mortgage Loan Trust 2007-A4 Series 2007-A4, Class A1, CMO, 6.25%,
2/25/2038 |
22,054,684 | 10,323,589 | |||
|
JP Morgan Chase Commercial Mortgage Securities Trust Series 2018-LAQ, Class A, 1 Month USD LIBOR + 1.00%, 1.07%, 6/15/2032
(a)
(b) |
1,243,623 | 1,244,744 | |||
|
Morgan Stanley Capital I Trust Series 2016-UB12, Class XA, IO, 0.85%, 12/15/2049
(b) |
54,206,526 | 1,486,508 | |||
|
Morgan Stanley Resecuritization Trust Series 2014-R7, Class B2, CMO, 3.73%, 1/26/2051
(a)
(b) |
9,155,936 | 9,252,135 | |||
|
Morgan Stanley Residential Mortgage Loan Trust Series 2020-RPL1, Class A1, CMO, VRN, 2.69%, 10/25/2060
(a)
(b) |
1,156,777 | 1,163,509 | |||
|
New Residential Mortgage Loan Trust Series 2020-RPL2, Class A1, CMO, VRN, 3.58%, 8/25/2025
(a)
(b) |
733,261 | 746,887 | |||
| NRPL Trust: | |||||
|
Series 2018-2A, Class A1, CMO, 4.25%, 7/25/2067
(a)
(e) |
3,577,664 | 3,587,424 | |||
|
Series 2019-3A, Class A1, CMO, 3.00%, 7/25/2059
(a)
(e) |
4,454,989 | 4,478,837 | |||
|
PMT Credit Risk Transfer Trust Series 2019-2R, Class A, 1 Month USD LIBOR + 2.75%, 2.85%, 5/27/2023
(a)
(b) |
2,351,934 | 2,329,132 |
| Security Description | Principal
Amount |
Value | |||
|
PMT Credit Risk Transfer Trust 2021-1R Series 2021-1R, Class A, 1 Month USD LIBOR + 2.90%, 3.01%, 2/27/2024
(a)
(b) |
$ 1,666,537 | $ 1,681,803 | |||
|
PRPM LLC Series 2020-6, Class A1, CMO, 2.36%, 11/25/2025
(a)
(e) |
14,831,893 | 14,867,283 | |||
| Seasoned Credit Risk Transfer Trust: | |||||
|
Series 2019-4, Class MV, 3.00%,
2/25/2059 |
16,793,663 | 17,921,199 | |||
|
Series 2020-2, Class MT, CMO, 2.00%,
11/25/2059 |
8,514,465 | 8,648,297 | |||
|
Seasoned Credit Risk Transfer Trust Series 2020-3, Class MT, CMO, 2.00%,
5/25/2060 |
13,619,505 | 13,777,771 | |||
|
Structured Adjustable Rate Mortgage Loan Trust Series 2006-8, Class 4A3, CMO, 3.53%, 9/25/2036
(b) |
474,461 | 465,906 | |||
|
Structured Asset Mortgage Investments II Trust Series 2004-AR3, Class M, CMO, 1 Month USD LIBOR + 0.68%, 0.77%, 7/19/2034
(b) |
1,563,546 | 1,521,507 | |||
|
UBS Commercial Mortgage Trust Series 2017-C1, Class XA, IO, 1.68%, 6/15/2050
(b) |
20,530,808 | 1,388,767 | |||
|
Vericrest Opportunity Loan Transferee Series 2021-NPL7, Class A1, 2.12%, 4/25/2051
(a)
(e) |
2,098,610 | 2,099,412 | |||
|
VOLT XCIV LLC Series 2021-NPL3, Class A1, CMO, 2.24%, 2/27/2051
(a)
(e) |
3,325,579 | 3,328,846 | |||
|
Volt Xcix LLC Series 2021-NPL8, Class A1, 2.12%, 4/25/2051
(a)
(e) |
6,829,366 | 6,845,581 | |||
|
VOLT XCVI LLC Series 2021-NPL5, Class A1, CMO, 2.12%, 3/27/2051
(a)
(e) |
2,042,466 | 2,043,548 | |||
|
Washington Mutual Mortgage Pass-Through Certificates WMALT Series 2007-HY1 Trust Series 2007-HY1, Class A3A, CMO, 1 Month USD LIBOR + 0.230%, 0.32%, 2/25/2037
(b) |
5,804,834 | 4,924,928 | |||
| Washington Mutual Mortgage PassThrough Certificates WMALT Trust: | |||||
|
Series 2005-8, Class 2CB1, CMO, 5.50%,
10/25/2035 |
996,831 | 996,831 | |||
|
Series 2006-5, Class 3A2, CMO, 6.00%, 7/25/2036
(e) |
2,741,913 | 879,823 | |||
|
Series 2007-2, Class 1A3, CMO, 6.00%,
4/25/2037 |
4,712,509 | 4,453,406 | |||
|
Wells Fargo Mortgage Backed Securities Trust Series 2007-AR4, Class A1, CMO, 2.98%, 8/25/2037
(b) |
1,465,921 | 1,433,886 | |||
|
TOTAL MORTGAGE-BACKED SECURITIES (Cost
$261,799,676) |
254,458,505 |
| Security Description | Principal
Amount |
Value | |||
| COMMERCIAL MORTGAGE BACKED SECURITIES — 4.9% | |||||
|
ACRE Commercial Mortgage, Ltd. Series 2021-FL4, Class B, 1 Month USD LIBOR + 1.40%, 1.48%, 12/18/2037
(a)
(b) |
$ 3,000,000 | $ 2,985,102 | |||
|
BANK Series 2017-BNK4, Class XA, IO, 1.55%, 5/15/2050
(b) |
29,444,217 | 1,694,688 | |||
|
BBCMS Mortgage Trust Series 2017-DELC, Class A, 1 Month USD LIBOR + 0.85%, 0.92%, 8/15/2036
(a)
(b) |
2,552,000 | 2,553,966 | |||
|
Benchmark 2021-B24 Mortgage Trust Series 2021-B24, Class XA, IO, VRN, 1.27%, 3/15/2054
(b) |
3,391,846 | 294,078 | |||
| Benchmark Mortgage Trust: | |||||
|
Series 2018-B2, Class C, VRN, 4.35%, 2/15/2051
(b) |
2,545,000 | 2,812,701 | |||
|
Series 2020-B19, Class XA, IO, VRN, 1.89%, 9/15/2053
(b) |
20,054,094 | 2,220,925 | |||
| BX Trust: | |||||
|
Series 2017-APPL, Class E, 1 Month USD LIBOR + 3.15% 3.22%, 7/15/2034
(a)
(b) |
1,007,434 | 1,008,882 | |||
|
Series 2017-SLCT, Class D, 1 Month USD LIBOR + 2.05% 2.12%, 7/15/2034
(a)
(b) |
565,436 | 566,913 | |||
|
Series 2017-SLCT, Class E, 1 Month USD LIBOR + 3.15% 3.22%, 7/15/2034
(a)
(b) |
1,805,400 | 1,810,659 | |||
|
Series 2019-OC11, Class E, 4.08%, 12/9/2041
(a)
(b) |
3,830,000 | 4,012,200 | |||
|
CD Mortgage Trust Series 2017-CD4, Class XA, IO, 1.44%, 5/10/2050
(b) |
16,481,835 | 868,609 | |||
| CFCRE Commercial Mortgage Trust: | |||||
|
Series 2016-C3, Class XA, IO, 1.15%, 1/10/2048
(b) |
23,642,790 | 911,261 | |||
|
Series 2016-C4, Class XA, IO, 1.80%, 5/10/2058
(b) |
10,981,585 | 695,786 | |||
|
Series 2017-C8, Class XA, IO, 1.76%, 6/15/2050
(b) |
26,779,477 | 1,709,265 | |||
| Citigroup Commercial Mortgage Trust: | |||||
|
Series 2015-GC27, Class C, VRN, 4.57%, 2/10/2048
(b) |
2,541,000 | 2,698,222 | |||
|
Series 2015-GC27, Class D, 4.57%, 2/10/2048
(a)
(b) |
423,700 | 421,364 | |||
|
Series 2015-GC31, Class C, 4.19%, 6/10/2048
(b) |
1,500,000 | 1,577,892 | |||
|
Series 2015-GC33, Class C, 4.73%, 9/10/2058
(b) |
1,500,000 | 1,490,170 | |||
|
Series 2016-GC36, Class XA, IO, 1.38%, 2/10/2049
(b) |
20,204,835 | 951,764 | |||
|
Series 2020-555, Class E, 3.62%, 12/10/2041
(a)
(b) |
2,047,000 | 1,923,501 | |||
| COMM Mortgage Trust: | |||||
|
Series 2013-CR12, Class XA, IO, 1.28%, 10/10/2046
(b) |
26,589,771 | 584,602 |
| Security Description | Principal
Amount |
Value | |||
|
Series 2015-CR22, Class XA, IO, 1.02%, 3/10/2048
(b) |
$ 8,736,553 | $ 214,372 | |||
|
Series 2015-CR26, Class B, 4.62%, 10/10/2048
(b) |
1,600,000 | 1,764,441 | |||
|
Series 2015-CR26, Class XA, IO, 1.07%, 10/10/2048
(b) |
20,264,981 | 656,180 | |||
|
Series 2015-DC1, Class C, VRN, 4.45%, 2/10/2048
(b) |
644,000 | 664,233 | |||
|
Series 2015-DC1, Class XA, IO, 1.16%, 2/10/2048
(b) |
7,431,623 | 196,204 | |||
|
Series 2015-LC21, Class C, 4.48%, 7/10/2048
(b) |
968,000 | 1,027,554 | |||
|
Series 2016-CR28, Class C, 4.79%, 2/10/2049
(b) |
2,011,000 | 2,207,772 | |||
|
Series 2016-DC2, Class XA, IO, 1.12%, 2/10/2049
(b) |
16,119,184 | 592,435 | |||
|
Series 2017-PANW, Class D, 4.34%, 10/10/2029
(a)
(b) |
1,388,000 | 1,472,404 | |||
|
Series 2017-PANW, Class E, 4.13%, 10/10/2029
(a)
(b) |
2,316,000 | 2,342,580 | |||
|
CSAIL 2019-C17 Commercial Mortgage Trust Series 2019-C17, Class XA, IO, VRN, 1.51%, 9/15/2052
(b) |
30,248,231 | 2,561,535 | |||
| CSAIL Commercial Mortgage Trust: | |||||
|
Series 2015-C2, Class AS, 3.85%, 6/15/2057
(b) |
900,000 | 960,290 | |||
|
Series 2015-C4, Class XA, IO, 0.97%, 11/15/2048
(b) |
32,722,570 | 1,005,118 | |||
|
CSMC 2017-TIME Series 2017-TIME, Class A, 3.65%, 11/13/2039
(a) |
2,977,000 | 3,081,614 | |||
|
CSMC 2020-NET Series 2020-NET, Class A, 2.26%, 8/15/2037
(a) |
2,440,000 | 2,518,975 | |||
|
CSMC Trust Series 2017-MOON, Class D, 3.30%, 7/10/2034
(a)
(b) |
2,263,000 | 2,283,550 | |||
|
DBUBS Mortgage Trust Series 2017-BRBK, Class E, VRN, 3.65%, 10/10/2034
(a)
(b) |
463,000 | 475,769 | |||
|
DBWF Mortgage Trust Series 2018-GLKS, Class A, 1 Month USD LIBOR + 1.03%, 1.12%, 12/19/2030
(a)
(b) |
2,552,000 | 2,555,689 | |||
| DOLP Trust 2021-NYC: | |||||
|
Series 2021-NYC, Class D, VRN, 3.70%, 5/10/2041
(a)
(b) |
1,000,000 | 1,021,710 | |||
|
Series 2021-NYC, Class E, VRN, 3.70%, 5/10/2041
(a)
(b) |
1,000,000 | 997,048 | |||
|
Grace Trust Series 2020-GRCE, Class D, VRN, 2.77%, 12/10/2040
(a)
(b) |
2,487,000 | 2,463,679 | |||
|
Great Wolf Trust Series 2019-WOLF, Class F, 1 Month USD LIBOR + 3.13%, 3.20%, 12/15/2036
(a)
(b) |
100,000 | 98,287 | |||
|
GS Mortgage Securities Corp. II Series 2013-GC10, Class XA, IO, 1.63%, 2/10/2046
(b) |
11,722,235 | 206,785 |
| Security Description | Principal
Amount |
Value | |||
| GS Mortgage Securities Trust: | |||||
|
Series 2014-GC24, Class XA, IO, 0.85%, 9/10/2047
(b) |
$ 26,799,649 | $ 520,077 | |||
|
Series 2015-GC32, Class XA, IO, 0.88%, 7/10/2048
(b) |
22,973,766 | 591,125 | |||
|
Series 2015-GC34, Class XA, IO, 1.38%, 10/10/2048
(b) |
15,545,304 | 670,826 | |||
|
Series 2015-GS1, Class XA, IO, 0.91%, 11/10/2048
(b) |
25,746,196 | 748,694 | |||
|
Series 2016-GS3, Class XA, IO, 1.34%, 10/10/2049
(b) |
24,919,944 | 1,326,303 | |||
|
Series 2019-GC38, Class XA, IO, 1.12%, 2/10/2052
(b) |
40,495,313 | 2,513,618 | |||
|
HPLY Trust Series 2019-HIT, Class F, 1 Month USD LIBOR + 3.15%, 3.22%, 11/15/2036
(a)
(b) |
2,766,018 | 2,714,499 | |||
| IMT Trust: | |||||
|
Series 2017-APTS, Class BFL, 1 Month USD LIBOR + 0.95% 1.02%, 6/15/2034
(a)
(b) |
1,509,617 | 1,506,517 | |||
|
Series 2017-APTS, Class CFL, 1 Month USD LIBOR + 1.10% 1.17%, 6/15/2034
(a)
(b) |
1,509,617 | 1,507,231 | |||
|
JP Morgan Chase Commercial Mortgage Securities Corp. Series 2017-FL10, Class D, 1 Month USD LIBOR + 1.90%, 1.97%, 6/15/2032
(a)
(b) |
126,758 | 126,506 | |||
| JP Morgan Chase Commercial Mortgage Securities Trust: | |||||
|
Series 2011-C5, Class B, VRN, 5.61%, 8/15/2046
(a)
(b) |
648,000 | 648,798 | |||
|
Series 2012-C8, Class B, 3.98%, 10/15/2045
(a)
(b) |
1,775,000 | 1,814,308 | |||
|
Series 2014-C20, Class B, 4.40%, 7/15/2047
(b) |
3,000,000 | 3,230,097 | |||
|
Series 2015-JP1, Class XA, IO, 1.07%, 1/15/2049
(b) |
16,800,919 | 568,658 | |||
|
Series 2016-JP3, Class B, VRN, 3.40%, 8/15/2049
(b) |
2,899,000 | 3,055,480 | |||
| JPMBB Commercial Mortgage Securities Trust: | |||||
|
Series 2014-C21, Class B, VRN, 4.34%, 8/15/2047
(b) |
1,055,000 | 1,124,404 | |||
|
Series 2014-C25, Class XA, IO, 0.99%, 11/15/2047
(b) |
4,966,148 | 121,705 | |||
|
Series 2014-C26, Class C, 4.52%, 1/15/2048
(b) |
1,500,000 | 1,582,019 | |||
|
Series 2015-C28, Class XA, IO, 1.11%, 10/15/2048
(b) |
8,847,714 | 244,845 | |||
|
Series 2015-C30, Class XA, IO, 0.65%, 7/15/2048
(b) |
25,619,663 | 455,625 | |||
|
Series 2015-C32, Class C, 4.80%, 11/15/2048
(b) |
1,132,000 | 950,249 | |||
|
Series 2015-C33, Class C, 4.77%, 12/15/2048
(b) |
1,739,000 | 1,859,430 | |||
|
JPMDB Commercial Mortgage Securities Trust Series 2016-C2, Class XA, IO, 1.71%, 6/15/2049
(b) |
17,726,355 | 915,899 |
| Security Description | Principal
Amount |
Value | |||
|
LSTAR Commercial Mortgage Trust Series 2017-5, Class X, IO, 1.14%, 3/10/2050
(a)
(b) |
$ 43,500,389 | $ 1,214,461 | |||
| Manhattan West 2020-1MW Mortgage Trust: | |||||
|
Series 2020-1MW, Class C, VRN, 2.41%, 9/10/2039
(a)
(b) |
2,462,000 | 2,489,674 | |||
|
Series 2020-1MW, Class D, VRN, 2.41%, 9/10/2039
(a)
(b) |
2,462,000 | 2,444,281 | |||
| Morgan Stanley Bank of America Merrill Lynch Trust: | |||||
|
Series 2013-C12, Class XA, IO, 0.74%, 10/15/2046
(b) |
12,388,562 | 129,679 | |||
|
Series 2013-C7, Class XA, IO, 1.46%, 2/15/2046
(b) |
12,944,583 | 184,150 | |||
|
Series 2015-C20, Class C, 4.61%, 2/15/2048
(b) |
500,000 | 529,883 | |||
|
Series 2015-C27, Class C, 4.66%, 12/15/2047
(b) |
1,219,000 | 1,236,674 | |||
|
Series 2015-C27, Class D, 3.24%, 12/15/2047
(a)
(b) |
1,750,000 | 1,568,398 | |||
|
Series 2016-C28, Class XA, IO, 1.35%, 1/15/2049
(b) |
20,408,039 | 828,532 | |||
|
Series 2016-C30, Class XA, IO, 1.52%, 9/15/2049
(b) |
18,055,025 | 1,000,651 | |||
|
Series 2016-C31, Class C, 4.43%, 11/15/2049
(b) |
3,358,000 | 3,466,905 | |||
| Morgan Stanley Capital I Trust: | |||||
|
Series 2015-UBS8, Class XA, IO, 1.03%, 12/15/2048
(b) |
24,277,625 | 786,938 | |||
|
Series 2019-H7, Class C, 4.13%,
7/15/2052 |
2,930,000 | 3,209,581 | |||
|
Series 2019-L3, Class XA, IO, 0.76%, 11/15/2052
(b) |
55,942,484 | 2,668,818 | |||
|
Series 2020-HR8, Class XA, IO, VRN, 1.97%, 7/15/2053
(b) |
21,455,246 | 2,841,388 | |||
|
Series 2020-L4, Class XA, IO, VRN, 1.20%, 2/15/2053
(b) |
33,105,762 | 2,562,089 | |||
|
One New York Plaza Trust 2020-1NYP Series 2020-1NYP, Class C, 1 Month USD LIBOR + 2.20%, 2.27%, 1/15/2026
(a)
(b) |
1,599,000 | 1,616,701 | |||
|
SG Commercial Mortgage Securities Trust Series 2016-C5, Class B, 3.93%,
10/10/2048 |
450,000 | 479,865 | |||
| SLG Office Trust 2021-OVA: | |||||
|
Series 2021-OVA, Class E, 2.85%, 7/15/2041
(a) |
1,989,000 | 1,946,895 | |||
|
Series 2021-OVA, Class F, 2.85%, 7/15/2041
(a) |
1,989,000 | 1,852,475 | |||
|
UBS Commercial Mortgage Trust Series 2017-C4, Class XA, IO, 1.19%, 10/15/2050
(b) |
23,935,146 | 1,245,084 | |||
|
Velocity Commercial Capital Loan Trust Series 2020-1, Class M3, VRN, 3.19%, 2/25/2050
(a)
(b) |
3,132,177 | 3,135,950 |
| Security Description | Principal
Amount |
Value | |||
|
Waterfall Commercial Mortgage Trust Series 2015-SBC5, Class A, 4.10%, 9/14/2022
(a)
(b) |
$ 3,140,906 | $ 3,194,593 | |||
| Wells Fargo Commercial Mortgage Trust: | |||||
|
Series 2014-LC16, Class D, 3.94%, 8/15/2050
(a) |
277,000 | 63,578 | |||
|
Series 2015-C26, Class XA, IO, 1.35%, 2/15/2048
(b) |
7,550,860 | 280,949 | |||
|
Series 2015-C28, Class C, 4.23%, 5/15/2048
(b) |
1,500,000 | 1,588,398 | |||
|
Series 2015-LC20, Class XA, IO, 1.45%, 4/15/2050
(b) |
6,802,398 | 219,700 | |||
|
Series 2015-NXS1, Class XA, IO, 1.23%, 5/15/2048
(b) |
7,341,221 | 236,031 | |||
|
Series 2015-NXS2, Class XA, IO, 0.80%, 7/15/2058
(b) |
23,232,994 | 526,873 | |||
|
Series 2015-P2, Class XA, IO, 1.07%, 12/15/2048
(b) |
16,669,697 | 616,491 | |||
|
Series 2016-C33, Class XA, IO, 1.78%, 3/15/2059
(b) |
11,814,980 | 741,895 | |||
|
Series 2016-C35, Class B, 3.44%,
7/15/2048 |
3,000,000 | 3,195,104 | |||
|
Series 2016-LC24, Class C, VRN, 4.60%, 10/15/2049
(b) |
1,900,000 | 2,021,719 | |||
|
Series 2017-C38, Class XA, IO, 1.16%, 7/15/2050
(b) |
37,145,799 | 1,747,063 | |||
|
Series 2017-RC1, Class XA, IO, 1.65%, 1/15/2060
(b) |
24,239,811 | 1,365,024 | |||
|
Series 2019-C50, Class XA, IO, 1.58%, 5/15/2052
(b) |
29,673,122 | 2,416,433 | |||
|
Series 2020-C57, Class XA, IO, VRN, 2.23%, 8/15/2053
(b) |
16,232,862 | 2,431,213 | |||
|
Series 2020-C58, Class XA, IO, VRN, 2.01%, 7/15/2053
(b) |
20,149,845 | 2,739,580 | |||
|
Wells Fargo Commercial Mortgage Trust 2016-BNK1 Series 2016-BNK1, Class XB, IO, VRN, 1.47%, 8/15/2049
(b) |
19,849,000 | 1,246,356 | |||
| WFRBS Commercial Mortgage Trust: | |||||
|
Series 2014-C19, Class XA, IO, 1.18%, 3/15/2047
(b) |
8,523,265 | 165,993 | |||
|
Series 2014-C21, Class XA, IO, 1.18%, 8/15/2047
(b) |
14,746,711 | 369,409 | |||
|
TOTAL COMMERCIAL MORTGAGE BACKED SECURITIES (Cost
$188,444,629) |
156,563,161 |
| Security Description | Shares | Value | |||
| SHORT-TERM INVESTMENT — 2.0% | |||||
|
State Street Institutional U.S. Government Money Market Fund, Class G Shares 0.03% (i) (j) (Cost
$63,404,943) |
63,404,943 | $ 63,404,943 | |||
|
TOTAL INVESTMENTS — 100.2% (Cost
$3,185,494,757) |
3,195,173,796 | ||||
|
LIABILITIES IN EXCESS OF OTHER ASSETS — (0.2)%
|
(6,502,785) | ||||
|
NET ASSETS — 100.0%
|
$ 3,188,671,011 |
| (a) | Securities purchased pursuant to Rule 144A of the Securities Act of 1933, as amended. These securities, which represent 16.8% of net assets as of June 30, 2021, are considered liquid and may be resold in transactions exempt from registration, normally to qualified institutional buyers. |
| (b) | Variable Rate Security - Interest rate shown is rate in effect at June 30, 2021. For securities based on a published reference rate and spread, the reference rate and spread are indicated in the description above. |
| (c) | When-issued security. |
| (d) | Amount is less than 0.05% of net assets. |
| (e) | Step-up bond - Coupon rate increases in increments to maturity. Rate shown as of June 30, 2021. Maturity date shown is the final maturity. |
| (f) | Fair valued as determined in good faith by the Trust's Oversight Committee in accordance with policy and procedures approved by the Board of Trustees. Security value is determined based on Level 3 inputs. As of June 30, 2021, total aggregate fair value of the security is $11,504, representing less than 0.05% of the Fund's net assets. |
| (g) | Non-income producing security. |
| (h) | Position is unsettled. Contract rate was not determined at June 30, 2021 and does not take effect until settlement date. Maturity date is not finalized until settlement date. |
| (i) | The Fund invested in certain money market funds managed by SSGA Funds Management, Inc. Amounts related to these transactions during the period ended June 30, 2021 are shown in the Affiliate Table below. |
| (j) | The rate shown is the annualized seven-day yield at June 30, 2021. |
| ABS | Asset-Backed Security |
| CLO | Collateralized Loan Obligation |
| CMO | Collateralized Mortgage Obligation |
| CMT | Constant Maturity Treasury |
| EMTN | Euro Medium Term Note |
| GMTN | Global Medium Term Note |
| IO | Interest Only |
| LIBOR | London Interbank Offered Rate |
| LP | Limited Partnership |
| PIK | Payment in Kind |
| PO | Principal Only |
| REIT | Real Estate Investment Trust |
| REMIC | Real Estate Mortgage Investment Conduit |
| SOFR | Secured Overnight Financing Rate |
| VRN | Variable Rate Note |
| Borrower | Unfunded
Loan Commitment ($) |
Value ($) | Unrealized
Appreciation/(Depreciation) ($) | |||
| OneDigital Borrower LLC | 18,750 | 18,852 | 102 | |||
| Constant Contact Inc | 106,941 | 106,808 | (133) | |||
| Redstone Buyer LLC | 95,639 | 95,599 | (40) | |||
| HighTower Holdings LLC | 67,000 | 67,237 | 237 | |||
| DG Investment Intermediate Holdings 2, Inc. | 27,636 | 27,786 | 150 | |||
| LBM Acquisition LLC | 15,455 | 15,366 | (89) | |||
| TricorBraun Holdings, Inc. | 53,252 | 52,932 | (319) | |||
| $384,673 | $384,580 | $(92) |
| Description | Level
1 – Quoted Prices |
Level
2 – Other Significant Observable Inputs |
Level
3 – Significant Unobservable Inputs |
Total | ||||
| ASSETS: | ||||||||
| INVESTMENTS: | ||||||||
|
Corporate Bonds &
Notes |
$ — | $ 463,146,801 | $ — | $ 463,146,801 | ||||
|
Asset-Backed
Securities |
— | 196,947,703 | — | 196,947,703 | ||||
|
Foreign Government
Obligations |
— | 54,049,663 | — | 54,049,663 | ||||
|
U.S. Government Agency
Obligations |
— | 1,121,788,419 | — | 1,121,788,419 | ||||
|
U.S. Treasury
Obligations |
— | 786,728,994 | — | 786,728,994 | ||||
|
Mortgage-Backed
Securities |
— | 254,458,505 | — | 254,458,505 | ||||
|
Commercial Mortgage Backed
Securities |
— | 156,563,161 | — | 156,563,161 | ||||
|
Common
Stocks |
— | — | 11,504 | 11,504 | ||||
|
Senior Floating Rate
Loans |
— | 98,074,103 | — | 98,074,103 | ||||
|
Short-Term
Investment |
63,404,943 | — | — | 63,404,943 | ||||
|
TOTAL
INVESTMENTS |
$63,404,943 | $3,131,757,349 | $11,504 | $3,195,173,796 | ||||
| LIABILITIES: | ||||||||
| OTHER FINANCIAL INSTRUMENTS: | ||||||||
|
Unfunded
Loans(a) |
— | (92) | — | (92) | ||||
|
TOTAL OTHER FINANCIAL
INSTRUMENTS: |
$ — | $ (92) | $ — | $ (92) |
| (a) | Unfunded loan commitments are valued at unrealized appreciation (depreciation). |
| Number
of Shares Held at 6/30/20 |
Value
at 6/30/20 |
Cost
of Purchases |
Proceeds
from Shares Sold |
Realized
Gain (Loss) |
Change
in Unrealized Appreciation/ Depreciation |
Number
of Shares Held at 6/30/21 |
Value
at 6/30/21 |
Dividend
Income | |||||||||
|
State Street Institutional U.S. Government Money Market Fund, Class G
Shares |
67,857,504 | $67,857,504 | $1,442,895,649 | $1,447,348,210 | $— | $— | 63,404,943 | $63,404,943 | $35,793 | ||||||||
| SPDR DoubleLine Emerging Markets Fixed Income ETF | SPDR DoubleLine Short Duration Total Return Tactical ETF | ||
| ASSETS | |||
|
Investments in unaffiliated issuers, at
value |
$ 121,096,411 | $150,409,387 | |
|
Investments in affiliated issuers, at
value |
2,549,386 | 14,576,244 | |
|
Total
Investments |
123,645,797 | 164,985,631 | |
|
Cash |
998,649 | 7,203 | |
|
Receivable for investments
sold |
905,979 | 10,038 | |
|
Dividends receivable — affiliated
issuers |
132 | 145 | |
|
Interest receivable — unaffiliated
issuers |
1,144,062 | 559,355 | |
|
TOTAL ASSETS
|
126,694,619 | 165,562,372 | |
| LIABILITIES | |||
|
Payable for investments
purchased |
2,985,834 | 5,268,290 | |
|
Advisory fee
payable |
65,644 | 55,313 | |
|
Trustees’ fees and expenses
payable |
43 | 95 | |
|
TOTAL LIABILITIES
|
3,051,521 | 5,323,698 | |
|
NET ASSETS
|
$123,643,098 | $160,238,674 | |
| NET ASSETS CONSIST OF: | |||
|
Paid-in
Capital |
$120,243,001 | $159,444,982 | |
|
Total distributable earnings
(loss) |
3,400,097 | 793,692 | |
|
NET ASSETS
|
$123,643,098 | $160,238,674 | |
| NET ASSET VALUE PER SHARE | |||
|
Net asset value per
share |
$ 50.99 | $ 49.69 | |
|
Shares outstanding (unlimited amount authorized, no par
value) |
2,425,000 | 3,225,000 | |
| COST OF INVESTMENTS: | |||
|
Investments in unaffiliated
issuers |
$ 118,907,473 | $150,058,653 | |
|
Investments in affiliated
issuers |
2,549,386 | 14,576,244 | |
|
Total cost of
investments |
$121,456,859 | $164,634,897 |
| SPDR DoubleLine Total Return Tactical ETF | |
| ASSETS | |
|
Investments in unaffiliated issuers, at
value |
$3,131,768,853 |
|
Investments in affiliated issuers, at
value |
63,404,943 |
|
Total
Investments |
3,195,173,796 |
|
Cash |
1,404,184 |
|
Receivable for investments
sold |
192,002,450 |
|
Dividends receivable — affiliated
issuers |
1,089 |
|
Interest receivable — unaffiliated
issuers |
13,480,302 |
|
TOTAL ASSETS
|
3,402,061,821 |
| LIABILITIES | |
|
Payable for investments
purchased |
211,937,336 |
|
Unrealized depreciation on unfunded loan
commitments |
92 |
|
Advisory fee
payable |
1,444,389 |
|
Trustees’ fees and expenses
payable |
2,493 |
|
Accrued expenses and other
liabilities |
6,500 |
|
TOTAL LIABILITIES
|
213,390,810 |
|
NET ASSETS
|
$ 3,188,671,011 |
| NET ASSETS CONSIST OF: | |
|
Paid-in
Capital |
$3,275,337,799 |
|
Total distributable earnings
(loss) |
(86,666,788) |
|
NET ASSETS
|
$ 3,188,671,011 |
| NET ASSET VALUE PER SHARE | |
|
Net asset value per
share |
$ 48.46 |
|
Shares outstanding (unlimited amount authorized, no par
value) |
65,800,000 |
| COST OF INVESTMENTS: | |
|
Investments in unaffiliated
issuers |
$3,122,089,814 |
|
Investments in affiliated
issuers |
63,404,943 |
|
Total cost of
investments |
$3,185,494,757 |
| SPDR DoubleLine Emerging Markets Fixed Income ETF | SPDR DoubleLine Short Duration Total Return Tactical ETF | ||
| INVESTMENT INCOME | |||
|
Interest income — unaffiliated
issuers |
$3,399,567 | $2,638,846 | |
|
Dividend income — affiliated
issuers |
1,064 | 3,418 | |
|
Foreign taxes
withheld |
(5,746) | (98) | |
|
TOTAL INVESTMENT INCOME
(LOSS) |
3,394,885 | 2,642,166 | |
| EXPENSES | |||
|
Advisory
fee |
677,417 | 710,070 | |
|
Trustees’ fees and
expenses |
3,270 | 4,032 | |
|
TOTAL
EXPENSES |
680,687 | 714,102 | |
|
Expenses waived/reimbursed by the
Adviser |
(64,946) | (53,010) | |
|
NET
EXPENSES |
615,741 | 661,092 | |
|
NET INVESTMENT INCOME
(LOSS) |
$2,779,144 | $1,981,074 | |
| REALIZED AND UNREALIZED GAIN (LOSS) | |||
| Net realized gain (loss) on: | |||
|
Investments — unaffiliated
issuers |
3,516,700 | 752,709 | |
| Net change in unrealized appreciation/depreciation on: | |||
|
Investments — unaffiliated
issuers |
158,117 | (316,578) | |
|
NET REALIZED AND UNREALIZED GAIN
(LOSS) |
3,674,817 | 436,131 | |
|
NET INCREASE (DECREASE) IN NET ASSETS FROM
OPERATIONS |
$6,453,961 | $2,417,205 |
| SPDR DoubleLine Total Return Tactical ETF | |
| INVESTMENT INCOME | |
|
Interest income — unaffiliated
issuers |
$ 89,174,220 |
|
Dividend income — affiliated
issuers |
35,793 |
|
Foreign taxes
withheld |
(572) |
|
TOTAL INVESTMENT INCOME
(LOSS) |
89,209,441 |
| EXPENSES | |
|
Advisory
fee |
20,074,065 |
|
Trustees’ fees and
expenses |
44,294 |
|
Miscellaneous
expenses |
1,785 |
|
TOTAL
EXPENSES |
20,120,144 |
|
Expenses waived/reimbursed by the
Adviser |
(2,355,432) |
|
NET
EXPENSES |
17,764,712 |
|
NET INVESTMENT INCOME
(LOSS) |
$ 71,444,729 |
| REALIZED AND UNREALIZED GAIN (LOSS) | |
| Net realized gain (loss) on: | |
|
Investments — unaffiliated
issuers |
10,798,424 |
| Net change in unrealized appreciation/depreciation on: | |
|
Investments — unaffiliated
issuers |
(57,170,580) |
|
Unfunded loan
commitments |
(1,749) |
|
Net change in unrealized
appreciation/depreciation |
(57,172,329) |
|
NET REALIZED AND UNREALIZED GAIN
(LOSS) |
(46,373,905) |
|
NET INCREASE (DECREASE) IN NET ASSETS FROM
OPERATIONS |
$ 25,070,824 |
| SPDR
DoubleLine Emerging Markets Fixed Income ETF | |||
| Year
Ended 6/30/21 |
Year
Ended 6/30/20 | ||
| INCREASE (DECREASE) IN NET ASSETS FROM OPERATIONS: | |||
|
Net investment income
(loss) |
$ 2,779,144 | $ 2,932,451 | |
|
Net realized gain
(loss) |
3,516,700 | (2,205,780) | |
|
Net change in unrealized
appreciation/depreciation |
158,117 | 401,488 | |
|
Net increase (decrease) in net assets resulting from
operations |
6,453,961 | 1,128,159 | |
|
Net equalization credits and
charges |
62,106 | 68,814 | |
|
Distributions to
shareholders |
(2,854,562) | (2,929,647) | |
| FROM BENEFICIAL INTEREST TRANSACTIONS: | |||
|
Proceeds from shares
sold |
40,389,997 | 49,043,585 | |
|
Cost of shares
redeemed |
(15,014,743) | (17,996,911) | |
|
Net income
equalization |
(62,106) | (68,814) | |
|
Other
Capital |
174,347 | 198,648 | |
|
Net increase (decrease) in net assets from beneficial interest
transactions |
25,487,495 | 31,176,508 | |
|
Net increase (decrease) in net assets during the
period |
29,149,000 | 29,443,834 | |
|
Net assets at beginning of
period |
94,494,098 | 65,050,264 | |
|
NET ASSETS AT END OF
PERIOD |
$123,643,098 | $ 94,494,098 | |
| SHARES OF BENEFICIAL INTEREST: | |||
|
Shares
sold |
800,000 | 1,025,000 | |
|
Shares
redeemed |
(300,000) | (375,000) | |
|
Net increase (decrease) from share
transactions |
500,000 | 650,000 | |
| SPDR
DoubleLine Short Duration Total Return Tactical ETF | |||
| Year
Ended 6/30/21 |
Year
Ended 6/30/20 | ||
| INCREASE (DECREASE) IN NET ASSETS FROM OPERATIONS: | |||
|
Net investment income
(loss) |
$ 1,981,074 | $ 2,924,940 | |
|
Net realized gain
(loss) |
752,709 | (18,615) | |
|
Net change in unrealized
appreciation/depreciation |
(316,578) | 125,822 | |
|
Net increase (decrease) in net assets resulting from
operations |
2,417,205 | 3,032,147 | |
|
Net equalization credits and
charges |
14,932 | 11,473 | |
|
Distributions to
shareholders |
(2,110,916) | (3,062,675) | |
| FROM BENEFICIAL INTEREST TRANSACTIONS: | |||
|
Proceeds from shares
sold |
17,383,837 | 33,417,005 | |
|
Cost of shares
redeemed |
— | (12,303,910) | |
|
Net income
equalization |
(14,932) | (11,473) | |
|
Other
Capital |
29,809 | 92,112 | |
|
Net increase (decrease) in net assets from beneficial interest
transactions |
17,398,714 | 21,193,734 | |
|
Net increase (decrease) in net assets during the
period |
17,719,935 | 21,174,679 | |
|
Net assets at beginning of
period |
142,518,739 | 121,344,060 | |
|
NET ASSETS AT END OF
PERIOD |
$160,238,674 | $142,518,739 | |
| SHARES OF BENEFICIAL INTEREST: | |||
|
Shares
sold |
350,000 | 675,000 | |
|
Shares
redeemed |
— | (250,000) | |
|
Net increase (decrease) from share
transactions |
350,000 | 425,000 | |
| SPDR DoubleLine Total Return Tactical ETF | |||
| Year
Ended 6/30/21 |
Year
Ended 6/30/20 | ||
| INCREASE (DECREASE) IN NET ASSETS FROM OPERATIONS: | |||
|
Net investment income
(loss) |
$ 71,444,729 | $ 92,024,939 | |
|
Net realized gain
(loss) |
10,798,424 | (16,611,611) | |
|
Net change in unrealized
appreciation/depreciation |
(57,172,329) | 52,694,095 | |
|
Net increase (decrease) in net assets resulting from
operations |
25,070,824 | 128,107,423 | |
|
Net equalization credits and
charges |
18,500 | (152,877) | |
|
Distributions to
shareholders |
(87,675,778) | (104,243,448) | |
| FROM BENEFICIAL INTEREST TRANSACTIONS: | |||
|
Proceeds from shares
sold |
105,856,538 | 242,342,927 | |
|
Cost of shares
redeemed |
(46,179,065) | (413,569,469) | |
|
Net income
equalization |
(18,500) | 152,877 | |
|
Other
Capital |
317,321 | 1,723,362 | |
|
Net increase (decrease) in net assets from beneficial interest
transactions |
59,976,294 | (169,350,303) | |
|
Contribution from Affiliate (Note
4) |
39,028 | — | |
|
Net increase (decrease) in net assets during the
period |
(2,571,132) | (145,639,205) | |
|
Net assets at beginning of
period |
3,191,242,143 | 3,336,881,348 | |
|
NET ASSETS AT END OF
PERIOD |
$ 3,188,671,011 | $3,191,242,143 | |
| SHARES OF BENEFICIAL INTEREST: | |||
|
Shares
sold |
2,150,000 | 4,950,000 | |
|
Shares
redeemed |
(950,000) | (8,500,000) | |
|
Net increase (decrease) from share
transactions |
1,200,000 | (3,550,000) | |
| SPDR DoubleLine Emerging Markets Fixed Income ETF | |||||||||
| Year
Ended 6/30/21 |
Year
Ended 6/30/20 |
Year
Ended 6/30/19 |
Year
Ended 6/30/18 |
Year
Ended 6/30/17 | |||||
|
Net asset value, beginning of
period |
$ 49.09 | $ 51.02 | $ 48.25 | $ 50.45 | $ 51.52 | ||||
| Income (loss) from investment operations: | |||||||||
|
Net investment income (loss)
(a) |
1.48 | 1.87 | 1.98 | 1.31 | 1.77 | ||||
|
Net realized and unrealized gain
(loss) |
1.83 | (2.06) | 2.60 | (1.74) | 1.91 | ||||
|
Total from investment
operations |
3.31 | (0.19) | 4.58 | (0.43) | 3.68 | ||||
|
Net equalization credits and charges
(a) |
0.03 | 0.04 | 0.03 | 0.04 | 0.01 | ||||
|
Other capital
(a) |
0.09 | 0.13 | 0.08 | 0.10 | 0.05 | ||||
| Distributions to shareholders from: | |||||||||
|
Net investment
income |
(1.53) | (1.91) | (1.92) | (1.36) | (1.81) | ||||
|
Net realized
gains |
— | — | — | (0.55) | (3.00) | ||||
|
Total
distributions |
(1.53) | (1.91) | (1.92) | (1.91) | (4.81) | ||||
|
Net asset value, end of
period |
$ 50.99 | $ 49.09 | $ 51.02 | $ 48.25 | $ 50.45 | ||||
|
Total return
(b) |
7.09% | (0.04)% | 9.99% | (0.65)% | 7.67% | ||||
| Ratios and Supplemental Data: | |||||||||
|
Net assets, end of period (in
000s) |
$123,643 | $94,494 | $65,050 | $48,253 | $27,748 | ||||
| Ratios to average net assets: | |||||||||
|
Total
expenses |
0.72% | 0.75% | 0.75% | 0.76% | 0.75% | ||||
|
Net
expenses |
0.65% | 0.65% | 0.65% | 0.65% | 0.65% | ||||
|
Net investment income
(loss) |
2.95% | 3.77% | 4.06% | 2.64% | 3.46% | ||||
|
Portfolio turnover rate
(c) |
77% | 54% | 37% | 55% | 141% | ||||
| (a) | Per share numbers have been calculated using average shares outstanding, which more appropriately presents the per share data for the year. |
| (b) | Total return is calculated assuming a purchase of shares at net asset value on the first day and a sale at net asset value on the last day of each period reported. Distributions are assumed, for the purpose of this calculation, to be reinvested at net asset value per share on the respective payment dates of each distribution. Total returns for periods of less than one year are not annualized. Broker commission charges are not included in this calculation. |
| (c) | Portfolio turnover rate excludes securities received or delivered from in-kind processing of creations or redemptions. |
| SPDR DoubleLine Short Duration Total Return Tactical ETF | |||||||||
| Year
Ended 6/30/21 |
Year
Ended 6/30/20 |
Year
Ended 6/30/19 |
Year
Ended 6/30/18 |
Year
Ended 6/30/17 | |||||
|
Net asset value, beginning of
period |
$ 49.57 | $ 49.53 | $ 48.81 | $ 49.61 | $ 50.40 | ||||
| Income (loss) from investment operations: | |||||||||
|
Net investment income (loss)
(a) |
0.68 | 1.08 | 1.30 | 1.02 | 1.04 | ||||
|
Net realized and unrealized gain
(loss) |
0.14 | 0.07 | 0.62 | (0.99) | (0.53) | ||||
|
Total from investment
operations |
0.82 | 1.15 | 1.92 | 0.03 | 0.51 | ||||
|
Net equalization credits and charges
(a) |
0.01 | 0.00(b) | 0.03 | 0.05 | 0.00(b) | ||||
|
Other capital
(a) |
0.01 | 0.03 | 0.06 | 0.12 | 0.06 | ||||
| Distributions to shareholders from: | |||||||||
|
Net investment
income |
(0.72) | (1.14) | (1.29) | (1.00) | (1.13) | ||||
|
Net realized
gains |
— | — | — | — | (0.23) | ||||
|
Total
distributions |
(0.72) | (1.14) | (1.29) | (1.00) | (1.36) | ||||
|
Net asset value, end of
period |
$ 49.69 | $ 49.57 | $ 49.53 | $ 48.81 | $ 49.61 | ||||
|
Total return
(c) |
1.70% | 2.43% | 4.18% | 0.43% | 1.14% | ||||
| Ratios and Supplemental Data: | |||||||||
|
Net assets, end of period (in
000s) |
$160,239 | $142,519 | $121,344 | $82,984 | $34,725 | ||||
| Ratios to average net assets: | |||||||||
|
Total
expenses |
0.49% | 0.50% | 0.50% | 0.50% | 0.50% | ||||
|
Net
expenses |
0.45% | 0.45% | 0.45% | 0.45% | 0.45% | ||||
|
Net investment income
(loss) |
1.36% | 2.18% | 2.65% | 2.07% | 2.10% | ||||
|
Portfolio turnover rate
(d) |
58% | 43% | 62% | 50% | 123% | ||||
| (a) | Per share numbers have been calculated using average shares outstanding, which more appropriately presents the per share data for the year. |
| (b) | Amount is less than $0.005 per share. |
| (c) | Total return is calculated assuming a purchase of shares at net asset value on the first day and a sale at net asset value on the last day of each period reported. Distributions are assumed, for the purpose of this calculation, to be reinvested at net asset value per share on the respective payment dates of each distribution. Total returns for periods of less than one year are not annualized. Broker commission charges are not included in this calculation. |
| (d) | Portfolio turnover rate excludes securities received or delivered from in-kind processing of creations or redemptions. |
| SPDR DoubleLine Total Return Tactical ETF | |||||||||
| Year
Ended 6/30/21 |
Year
Ended 6/30/20 |
Year
Ended 6/30/19 |
Year
Ended 6/30/18(a) |
Year
Ended 6/30/17(a) | |||||
|
Net asset value, beginning of
period |
$ 49.40 | $ 48.96 | $ 47.60 | $ 49.03 | $ 49.87 | ||||
| Income (loss) from investment operations: | |||||||||
|
Net investment income (loss)
(b) |
1.09 | 1.37 | 1.56 | 1.34 | 1.33 | ||||
|
Net realized and unrealized gain (loss)
(c) |
(0.70) | 0.59 | 1.44 | (1.34) | (0.66) | ||||
|
Total from investment
operations |
0.39 | 1.96 | 3.00 | 0.00 | 0.67 | ||||
|
Net equalization credits and charges
(b) |
0.00(d) | (0.00)(d) | 0.00(d) | 0.00(d) | 0.01 | ||||
|
Contribution from Affiliate (Note
4) |
0.00(d) | — | — | — | — | ||||
|
Other capital
(b) |
0.00 | 0.03 | 0.04 | 0.02 | 0.04 | ||||
| Distributions to shareholders from: | |||||||||
|
Net investment
income |
(1.33) | (1.55) | (1.68) | (1.45) | (1.48) | ||||
|
Net realized
gains |
— | — | — | — | (0.08) | ||||
|
Total
distributions |
(1.33) | (1.55) | (1.68) | (1.45) | (1.56) | ||||
|
Net asset value, end of
period |
$ 48.46 | $ 49.40 | $ 48.96 | $ 47.60 | $ 49.03 | ||||
|
Total return
(e) |
0.81%(f) | 4.13% | 6.53% | 0.04% | 1.55% | ||||
| Ratios and Supplemental Data: | |||||||||
|
Net assets, end of period (in
000s) |
$3,188,671 | $3,191,242 | $3,336,881 | $3,182,239 | $3,353,801 | ||||
| Ratios to average net assets: | |||||||||
|
Total
expenses |
0.62% | 0.65% | 0.65% | 0.65% | 0.66% | ||||
|
Net
expenses |
0.55% | 0.55% | 0.55% | 0.55% | 0.55% | ||||
|
Net investment income
(loss) |
2.22% | 2.80% | 3.27% | 2.78% | 2.70% | ||||
|
Portfolio turnover
rate |
82%(g) | 25%(g) | 47%(g) | 34%(h) | 72%(h) | ||||
| (a) | The per share amounts and percentages include the Fund’s proportionate share of income and expenses of the Portfolio prior to discontinuance of the master feeder structure. |
| (b) | Per share numbers have been calculated using average shares outstanding, which more appropriately presents the per share data for the year. |
| (c) | Amounts shown in this caption for a share outstanding may not accord with the change in aggregate gains and losses in securities for the fiscal period because of the timing of sales and repurchases of Fund shares in relation to fluctuating market values for the Fund. |
| (d) | Amount is less than $0.005 per share. |
| (e) | Total return is calculated assuming a purchase of shares at net asset value on the first day and a sale at net asset value on the last day of each period reported. Distributions are assumed, for the purpose of this calculation, to be reinvested at net asset value per share on the respective payment dates of each distribution. Total returns for periods of less than one year are not annualized. Broker commission charges are not included in this calculation. |
| (f) | If an affiliate had not made a contribution during the year ended ended June 30, 2021, the total return would have remained 0.81%. |
| (g) | Portfolio turnover rate excludes securities received or delivered from in-kind processing of creations or redemptions. |
| (h) | Portfolio turnover is from the Fund's Portfolio prior to discontinuance of master-feeder structure. |
| SPDR DoubleLine Emerging Markets Fixed Income ETF |
| SPDR DoubleLine Short Duration Total Return Tactical ETF |
| SPDR DoubleLine Total Return Tactical ETF |
| SPDR DoubleLine Emerging Markets Fixed Income ETF |
| SPDR DoubleLine Short Duration Total Return Tactical ETF |
| SPDR DoubleLine Total Return Tactical ETF |
| Annual Rate | |
|
SPDR DoubleLine Emerging Markets Fixed Income
ETF |
0.65% (a) |
|
SPDR DoubleLine Short Duration Total Return Tactical
ETF |
0.45 (b) |
|
SPDR DoubleLine Total Return Tactical
ETF |
0.55 (c) |
| (a) | Effective March 24, 2021, the Adviser agreed to reduce the SPDR DoubleLine Emerging Markets Fixed Income ETF's management fee from 0.75% to 0.65% of the Fund’s average daily net assets. |
| (b) | Effective March 24, 2021, the Adviser agreed to reduce the SPDR DoubleLine Short Duration Total Return Tactical ETF's management fee from 0.50% to 0.45% of the Fund’s average daily net assets. |
| (c) | Effective March 24, 2021, the Adviser agreed to reduce the SPDR DoubleLine Total Return Tactical ETF's management fee from 0.65% to 0.55% of the Fund’s average daily net assets. |
| U.S. Government Obligations | Other Securities | ||||||
| Purchases | Sales | Purchases | Sales | ||||
|
SPDR DoubleLine Emerging Markets Fixed Income
ETF |
$ — | $ — | $100,645,958 | $ 69,707,062 | |||
|
SPDR DoubleLine Short Duration Total Return Tactical
ETF |
42,198,402 | 37,680,429 | 66,545,000 | 33,384,633 | |||
|
SPDR DoubleLine Total Return Tactical
ETF |
2,617,963,890 | 1,990,848,136 | 709,468,763 | 498,242,581 | |||
| Ordinary
Income |
Long-Term
Capital Gains |
Total | |||
|
SPDR DoubleLine Emerging Markets Fixed Income
ETF |
$ 2,854,562 | $— | $ 2,854,562 | ||
|
SPDR DoubleLine Short Duration Total Return Tactical
ETF |
2,110,916 | — | 2,110,916 | ||
|
SPDR DoubleLine Total Return Tactical
ETF |
87,675,778 | — | 87,675,778 |
| Ordinary
Income |
Long-Term
Capital Gains |
Total | |||
|
SPDR DoubleLine Emerging Markets Fixed Income
ETF |
$ 2,929,647 | $ — | $ 2,929,647 | ||
|
SPDR DoubleLine Short Duration Total Return Tactical
ETF |
3,062,675 | — | 3,062,675 | ||
|
SPDR DoubleLine Total Return Tactical
ETF |
104,243,448 | — | 104,243,448 |
| Undistributed
Ordinary Income |
Capital
Loss Carryforwards |
Undistributed
Long-Term Capital Gains |
Net
Unrealized Gains (Losses) |
Total | |||||
|
SPDR DoubleLine Emerging Markets Fixed Income
ETF |
$1,217,957 | $ — | $ — | $2,182,140 | $ 3,400,097 | ||||
|
SPDR DoubleLine Short Duration Total Return Tactical
ETF |
367,213 | — | 84,082 | 342,397 | 793,692 | ||||
|
SPDR DoubleLine Total Return Tactical
ETF |
9,385,187 | (104,657,163) | — | 8,605,188 | (86,666,788) |
| Non-Expiring
Short Term |
Non-Expiring
Long Term | ||
|
SPDR DoubleLine Total Return Tactical
ETF |
$50,672,099 | $53,985,064 |
| Tax
Cost |
Gross
Unrealized Appreciation |
Gross
Unrealized Depreciation |
Net
Unrealized Appreciation (Depreciation) | ||||
|
SPDR DoubleLine Emerging Markets Fixed Income
ETF |
$ 121,463,657 | $ 3,172,324 | $ 990,184 | $2,182,140 | |||
|
SPDR DoubleLine Short Duration Total Return Tactical
ETF |
164,643,234 | 1,417,212 | 1,074,815 | 342,397 | |||
|
SPDR DoubleLine Total Return Tactical
ETF |
3,186,568,515 | 71,361,030 | 62,755,749 | 8,605,281 |

August 30, 2021
| SPDR DoubleLine Emerging Markets Fixed Income ETF | SPDR DoubleLine Short Duration Total Return Tactical ETF | SPDR DoubleLine Total Return Tactical ETF | |||
|
Annualized Expense
Ratio |
0.65% | 0.45% | 0.55% | ||
| Actual: | |||||
|
Ending Account
Value |
$1,013.00 | $1,001.30 | $ 994.00 | ||
|
Expenses Paid During
Period(a) |
3.24 | 2.23 | 2.72 | ||
| Hypothetical (assuming a 5% return before expenses): | |||||
|
Ending Account
Value |
1,021.60 | 1,022.60 | 1,022.10 | ||
|
Expenses Paid During
Period(a) |
3.26 | 2.26 | 2.76 |
| (a) | Expenses are equal to the Fund's annualized net expense ratio multiplied by the average account value of the period, multiplied by 181, then divided by 365. |
| Name,
Address and Year of Birth |
Position(s)
with Funds |
Term
of Office and Length of Time Served |
Principal
Occupation(s) During Past 5 Years |
Number
of Portfolios in Fund Complex Overseen by Trustee† |
Other
Directorships Held by Trustee During the Past 5 Years | |||||
| Trustees | ||||||||||
| Independent Trustees | ||||||||||
| DWIGHT
D. CHURCHILL c/o SSGA Active Trust One Iron Street Boston, MA 02210 1953 |
Independent
Trustee, Audit Committee Chair |
Term:
Unlimited Served: since March 2011 |
Self-employed
consultant since 2010; CEO and President, CFA Institute (June 2014 - January 2015). |
126 | Affiliated Managers Group, Inc. (Chairman, Director and Audit Committee Chair). | |||||
| CLARE
S. RICHER c/o SSGA Active Trust One Iron Street Boston, MA 02210 1958 |
Independent
Trustee |
Term:
Unlimited Served: since July 2018 |
Retired.
Chief Financial Officer, Putnam Investments LLC (December 2008 - May 2017). |
126 | Principal
Financial Group (Director); Bain Capital Specialty Finance (Director); Putnam Acquisition Financing Inc. (Director); Putnam Acquisition Financing LLC (Director); Putnam GP Inc. (Director); Putnam Investor Services, Inc. (Director); University of Notre Dame (Trustee). |
| Name,
Address and Year of Birth |
Position(s)
with Funds |
Term
of Office and Length of Time Served |
Principal
Occupation(s) During Past 5 Years |
Number
of Portfolios in Fund Complex Overseen by Trustee† |
Other
Directorships Held by Trustee During the Past 5 Years | |||||
| SANDRA
G. SPONEM c/o SSGA Active Trust One Iron Street Boston, MA 02210 1958 |
Independent
Trustee |
Term:
Unlimited Served: since July 2018 |
Retired.
Chief Financial Officer, M.A. Mortenson Companies, Inc. (February 2007- April 2017). |
126 | Rydex
Series Funds (Trustee); Rydex Dynamic Funds (Trustee); Rydex Variable Trust (Trustee); Guggenheim Funds Trust (Trustee); Guggenheim Variable Funds Trust (Trustee); Guggenheim Strategy Funds Trust (Trustee); Transparent Value Trust (Trustee); Fiduciary/Claymore Energy Infrastructure Fund (Trustee); Guggenheim Taxable Municipal Managed Duration Trust (Trustee); Guggenheim Strategic Opportunities Fund (Trustee); Guggenheim Enhanced, Equity Income Fund (Trustee); Guggenheim Credit Allocation Fund (Trustee); Guggenheim Energy & Income Fund (Trustee). | |||||
| CARL
G. VERBONCOEUR c/o SSGA Active Trust One Iron Street Boston, MA 02210 1952 |
Independent
Trustee, Trustee Committee Chair |
Term:
Unlimited Served: since March 2011 |
Self-employed
consultant since 2009. |
126 | The
Motley Fool Funds Trust (Trustee). |
| Name,
Address and Year of Birth |
Position(s)
with Funds |
Term
of Office and Length of Time Served |
Principal
Occupation(s) During Past 5 Years |
Number
of Portfolios in Fund Complex Overseen by Trustee† |
Other
Directorships Held by Trustee During the Past 5 Years | |||||
| Interested Trustee | ||||||||||
| JAMES
E. ROSS* c/o SSGA Active Trust One Iron Street Boston, MA 02210 1965 |
Interested
Trustee |
Term:
Unlimited Served as Trustee: since March 2011 |
Non-Executive
Chairman, Fusion Acquisition Corp. (June 2020 - Present); Retired Chairman and Director, SSGA Funds Management, Inc. (2005 - March 2020); Retired Executive Vice President, State Street Global Advisors (2012 - March 2020); Retired Chief Executive Officer and Manager, State Street Global Advisors Funds Distributors, LLC (May 2017 - March 2020); Director, State Street Global Markets, LLC (2013 - April 2017); President, SSGA Funds Management, Inc. (2005 - 2012); Principal, State Street Global Advisors (2000 - 2005). |
137 | SSGA SPDR
ETFs Europe I plc (Director) (November 2016 - March 2020); SSGA SPDR ETFs Europe II plc (Director) (November 2016 - March 2020); State Street Navigator Securities Lending Trust (July 2016 - March 2020); SSGA Funds (January 2014 - March 2020); State Street Institutional Investment Trust (February 2007 - March 2020); State Street Master Funds (February 2007 - March 2020); Elfun Funds (July 2016 - December 2018). | |||||
| † For the purpose of determining the number of portfolios overseen by the Trustees, “Fund Complex” comprises registered investment companies for which SSGA Funds Management, Inc. serves as investment adviser. | ||||||||||
| * Mr. Ross is an Interested Trustee because of his former position with the Adviser and ownership interest in an affiliate of the Adviser. | ||||||||||
| Name,
Address and Year of Birth |
Position(s)
with Funds |
Term
of Office and Length of Time Served |
Principal Occupation(s) During the Past 5 Years | |||
| Officers | ||||||
| ELLEN
M. NEEDHAM SSGA Funds Management, Inc. One Iron Street Boston, MA 02210 1967 |
President | Term:
Unlimited Served: since October 2012 |
Chairman, SSGA Funds Management, Inc. (March 2020 - present)*; President and Director, SSGA Funds Management, Inc. (2001 - present)*; Senior Managing Director, State Street Global Advisors (1992 - present)*; Manager, State Street Global Advisors Funds Distributors, LLC (May 2017 - present). | |||
| BRUCE
S. ROSENBERG SSGA Funds Management, Inc. One Iron Street Boston, MA 02210 1961 |
Treasurer | Term:
Unlimited Served: since February 2016 |
Managing Director, State Street Global Advisors and SSGA Funds Management, Inc. (July 2015 - present); Director, Credit Suisse (April 2008 - July 2015). | |||
| ANN
M. CARPENTER SSGA Funds Management, Inc. One Iron Street Boston, MA 02210 1966 |
Vice
President; Deputy Treasurer |
Term:
Unlimited Served: since August 2012 (with respect to Vice President); Unlimited Served: since February 2016 (with respect to Deputy Treasurer) |
Chief Operating Officer, SSGA Funds Management, Inc. (April 2005 - Present)*; Managing Director, State Street Global Advisors (April 2005 - present).* | |||
| MICHAEL
P. RILEY SSGA Funds Management, Inc. One Iron Street Boston, MA 02210 1969 |
Vice
President |
Term:
Unlimited Served: since March 2011 |
Managing Director, State Street Global Advisors (2005 - present).* | |||
| SEAN
O’MALLEY SSGA Funds Management, Inc. One Iron Street Boston, MA 02210 1969 |
Chief
Legal Officer |
Term:
Unlimited Served: since August 2019 |
Senior Vice President and Deputy General Counsel, State Street Global Advisors (November 2013 -present). | |||
| DAVID
URMAN SSGA Funds Management, Inc. One Iron Street Boston, MA 02210 1985 |
Assistant
Secretary |
Term:
Unlimited Served: since August 2019 |
Vice President and Senior Counsel, State Street Global Advisors (April 2019 - present); Vice President and Counsel, State Street Global Advisors (August 2015 - April 2019); Associate, Ropes & Gray LLP (November 2012 - August 2015). |
| Name,
Address and Year of Birth |
Position(s)
with Funds |
Term
of Office and Length of Time Served |
Principal Occupation(s) During the Past 5 Years | |||
| DAVID
BARR SSGA Funds Management, Inc. One Iron Street Boston, MA 02210 1974 |
Assistant
Secretary |
Term:
Unlimited Served: since November 2020 |
Vice President and Senior Counsel, State Street Global Advisors (October 2019 - present); Vice President and Counsel, Eaton Vance Corp. (2010 - 2019). | |||
| CHAD
C. HALLETT SSGA Funds Management, Inc. One Iron Street Boston, MA 02210 1969 |
Deputy
Treasurer |
Term:
Unlimited Served: since February 2016 |
Vice President, State Street Global Advisors and SSGA Funds Management, Inc. (November 2014 - present); Vice President, State Street Bank and Trust Company (2001 - November 2014).* | |||
| DARLENE
ANDERSON-VASQUEZ SSGA Funds Management, Inc. One Iron Street Boston, MA 02210 1968 |
Deputy
Treasurer |
Term:
Unlimited Served: since November 2016 |
Managing Director, State Street Global Advisors and SSGA Funds Management, Inc. (May 2016 - present); Senior Vice President, John Hancock Investments (September 2007 - May 2016). | |||
| ARTHUR
A. JENSEN SSGA Funds Management, Inc. 1600 Summer Street Stamford, CT 06905 1966 |
Deputy
Treasurer |
Term:
Unlimited Served: Since August 2017 |
Vice President, State Street Global Advisors and SSGA Funds Management, Inc. (July 2016 - present); Mutual Funds Controller of GE Asset Management Incorporated (April 2011 - July 2016). | |||
| DAVID
LANCASTER SSGA Funds Management, Inc. One Iron Street Boston, MA 02210 1971 |
Assistant
Treasurer |
Term:
Unlimited Served: since November 2020 |
Vice President, State Street Global Advisors and SSGA Funds Management, Inc. (July 2017 - present); Assistant Vice President, State Street Bank and Trust Company (November 2011 - July 2017). | |||
| BRIAN
HARRIS SSGA Funds Management, Inc. One Iron Street Boston, MA 02210 1973 |
Chief
Compliance Officer; Anti-Money Laundering Officer; Code of Ethics Compliance Officer |
Term:
Unlimited Served: since November 2013 |
Managing Director, State Street Global Advisors and SSGA Funds Management, Inc. (June 2013 - present)*; Senior Vice President and Global Head of Investment Compliance, BofA Global Capital Management (2010 - 2013); Director of Compliance, AARP Financial Inc. (2008 - 2010). | |||
| * Served in various capacities and/or with various affiliated entities during noted time period. | ||||||
| The Statement of Additional Information (SAI) includes additional information about the Funds' trustees and is available, without charge, upon request and by calling 1-866-787-2257. | ||||||
| SPDR Blackstone Senior Loan ETF (Formerly, SPDR Blackstone / GSO Senior Loan ETF) |

TABLE OF CONTENTS
|
|
1 |
|
|
2 |
|
|
6 |
|
|
32 |
|
|
35 |
|
|
36 |
|
|
47 |
|
|
49 |
| Cumulative Total Return | Average Annual Total Return | ||||||
| Net
Asset Value |
Market
Value |
Markit iBoxx USD Liquid Leveraged Loan Index | Net
Asset Value |
Market
Value |
Markit iBoxx USD Liquid Leveraged Loan Index | ||
| ONE YEAR(1) | 11.97% | 12.00% | 8.85% | 11.97% | 12.00% | 8.85% | |
| FIVE YEARS(1) | 25.43% | 25.22% | 18.63% | 4.64% | 4.60% | 3.48% | |
| SINCE INCEPTION(1) (2) | 31.09% | 31.04% | 25.18% | 3.34% | 3.33% | 2.76% | |
| (1) | The One Year, Five Year and Since Inception Cumulative Total Returns for the Fund’s secondary benchmark, S&P/LSTA U.S. Leveraged Loan 100 Index, were 9.37%, 25.62% and 33.59%, respectively. The One Year, Five Year and Since Inception Average Annual Total Returns for the Fund’s secondary benchmark, S&P/LSTA U.S. Leveraged Loan 100 Index, were 9.37%, 4.67% and 3.58%, respectively. |
| (2) | For the period April 3, 2013 to June 30, 2021. |
(Based on Net Asset Value)
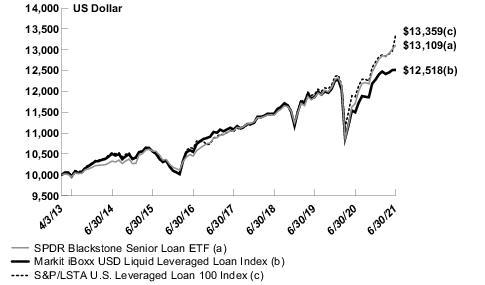
| Description | % of Net Assets | ||
| Change
Healthcare Holdings LLC. Senior Secured 2017 Term Loan B 3.50% 3/1/2024 |
2.1% | ||
| Crown
Finance US, Inc. Senior Secured 2018 USD Term Loan 3.50% 2/28/2025 |
1.8 | ||
| Alphabet
Holding Company, Inc. Senior Secured 2017 1st Lien Term Loan 3.60% 9/26/2024 |
1.8 | ||
| United
Airlines, Inc. Senior Secured 2021 Term Loan B 4.50% 4/21/2028 |
1.7 | ||
| AMC
Entertainment Holdings, Inc. Senior Secured 2019 Term Loan B 3.09% 4/22/2026 |
1.7 | ||
| TOTAL | 9.1% |
| % of Net Assets | |||
| Software | 16.1% | ||
| Health Care Providers & Services | 11.3 | ||
| Entertainment | 5.2 | ||
| Hotels, Restaurants & Leisure | 5.1 | ||
| Diversified Financial Services | 4.7 | ||
| Specialty Retail | 4.3 | ||
| Airlines | 4.1 | ||
| Commercial Services & Supplies | 3.9 | ||
| Media | 3.7 | ||
| Internet & Catalog Retail | 2.7 | ||
| Commercial Services | 2.4 | ||
| Health Care Technology | 2.1 | ||
| Oil, Gas & Consumable Fuels | 2.0 | ||
| Retail-Building Products | 1.8 | ||
| IT Services | 1.5 | ||
| Chemicals | 1.4 | ||
| Health Care Equipment & Supplies | 1.2 | ||
| Pharmaceuticals | 1.2 | ||
| Telecommunication Equip | 1.2 | ||
| Containers & Packaging | 1.1 | ||
| Retail-Restaurants | 1.1 | ||
| Computer Services | 1.0 | ||
| Real Estate Management & Development | 1.0 | ||
| Transport-Services | 0.9 | ||
| Interactive Media & Services | 0.9 | ||
| Cosmetics & Toiletries | 0.9 | ||
| Industrial Conglomerates | 0.9 | ||
| Professional Services | 0.8 |
| % of Net Assets | |||
| MRI/Medical Diag Imaging | 0.8% | ||
| Pipelines | 0.8 | ||
| Construction & Engineering | 0.7 | ||
| Diversified Consumer Services | 0.7 | ||
| Aerospace & Defense | 0.7 | ||
| Leisure&Rec/Games | 0.7 | ||
| Machinery | 0.6 | ||
| Hand/Machine Tools and Related Products | 0.6 | ||
| Transport-Air Freight | 0.6 | ||
| Consumer Products-Misc | 0.6 | ||
| Air Freight & Logistics | 0.6 | ||
| Home Furnishings | 0.6 | ||
| Environmentally Friendly | 0.5 | ||
| Miscellaneous Manufactur | 0.5 | ||
| Building Products | 0.5 | ||
| Communications Software | 0.5 | ||
| Household Products | 0.4 | ||
| Beverages | 0.4 | ||
| Trading Companies & Distributors | 0.4 | ||
| Retail-Petroleum Product | 0.4 | ||
| Electrical Equipment | 0.3 | ||
| Insurance | 0.3 | ||
| Computers | 0.3 | ||
| Capital Markets | 0.3 | ||
| Food-Misc/Diversified | 0.3 | ||
| Life Sciences Tools & Services | 0.2 | ||
| Food Products | 0.2 | ||
| Steel-Producers | 0.1 | ||
| Financial Services | 0.1 | ||
| Diversified Telecommunication Services | 0.1 | ||
| Leisure Equipment & Products | 0.1 | ||
| Containers-Paper/Plastic | 0.1 | ||
| Auto Components | 0.1 | ||
| Textiles, Apparel & Luxury Goods | 0.1 | ||
| Food & Beverage | 0.1 | ||
| Electronic Equipment, Instruments & Components | 0.0 * | ||
| Construction Materials | 0.0 * | ||
| Multiline Retail | 0.0 * | ||
| Advertising Services | 0.0 * | ||
| Machinery-Construction & Mining | 0.0 * | ||
| Short-Term Investment | 17.8 | ||
| Liabilities in Excess of Other Assets | (16.6) | ||
| TOTAL | 100.0% | ||
| * | Amount shown represents less than 0.05% of net assets. |
| Security Description | Principal
Amount |
Value | |||
| SENIOR FLOATING RATE LOANS — 91.5% (a) | |||||
| ADVERTISING SERVICES — 0.0% (b) | |||||
|
Red Ventures LLC Senior Secured 2020 Term Loan B2, 1 Month USD LIBOR + 2.50%, 2.60%,
11/8/2024 |
$ 2,367,308 | $ 2,341,990 | |||
| AEROSPACE & DEFENSE — 0.5% | |||||
| Dynasty Acquisition Co., Inc.: | |||||
|
Senior Secured 2020 CAD Term Loan B2, 3 Month USD LIBOR + 3.50%, 3.65%,
4/6/2026 |
12,244,530 | 11,946,069 | |||
|
Senior Secured 2020 Term Loan B1, 3 Month USD LIBOR + 3.50%, 3.65%,
4/6/2026 |
22,774,823 | 22,219,687 | |||
| 34,165,756 | |||||
| AIR FREIGHT & LOGISTICS — 0.6% | |||||
|
Kenan Advantage Group, Inc. Senior Secured 2021 Term Loan B1, 1 Month USD LIBOR + 3.75%, 4.50%,
3/24/2026 |
34,899,045 | 35,038,118 | |||
| AIRLINES — 3.6% | |||||
|
AAdvantage Loyalty IP Ltd. Senior Secured 2021 Term Loan, 3 Month USD LIBOR + 4.75%, 5.50%,
4/20/2028 |
61,469,098 | 64,162,367 | |||
|
American Airlines, Inc. Senior Secured 2018 Term Loan B, 1 Month USD LIBOR + 1.75%, 1.85%,
6/27/2025 |
57,324,899 | 55,103,845 | |||
|
United Airlines, Inc. Senior Secured 2021 Term Loan B, 3 Month USD LIBOR + 3.75%, 4.50%,
4/21/2028 |
108,410,487 | 109,984,065 | |||
| 229,250,277 | |||||
| AUTO COMPONENTS — 0.1% | |||||
|
Wheel Pros, LLC Senior Secured 2021 Term Loan, 1 Month USD LIBOR + 4.50%, 5.25%,
5/11/2028 |
3,118,812 | 3,131,350 | |||
| BEVERAGES — 0.4% | |||||
|
Arterra Wines Canada, Inc. Senior Secured 2020 Term Loan, 3 Month USD LIBOR + 3.50%, 4.25%,
11/24/2027 |
2,920,109 | 2,930,154 |
| Security Description | Principal
Amount |
Value | |||
|
Triton Water Holdings, Inc Senior Secured Term Loan, 3 Month USD LIBOR + 3.50%, 4.00%,
3/31/2028 |
$ 21,885,517 | $ 21,888,581 | |||
| 24,818,735 | |||||
| BUILDING PRODUCTS — 0.5% | |||||
|
CP Atlas Buyer, Inc. Senior Secured 2021 Term Loan B, 1 Month USD LIBOR + 3.75%, 4.25%,
11/23/2027 |
28,830,101 | 28,798,532 | |||
| CAPITAL MARKETS — 0.3% | |||||
| AqGen Ascensus, Inc.: | |||||
|
Senior Secured 2020 Term Loan, 1 Month USD LIBOR + 4.00%, 5.00%,
12/13/2026 |
15,705,477 | 15,754,634 | |||
|
Senior Secured 2021 2nd Lien Term Loan, 5/4/2029
(c) |
4,518,072 | 4,495,482 | |||
|
Victory Capital Holdings, Inc. Senior Secured 2021 Term Loan B, 3 Month USD LIBOR + 2.25%, 2.44%,
7/1/2026 |
26,464 | 26,452 | |||
| 20,276,568 | |||||
| CHEMICALS — 1.4% | |||||
|
Ascend Performance Materials Operations LLC Senior Secured 2021 Term Loan B, 3 Month USD LIBOR + 4.75%, 5.50%,
8/27/2026 |
6,580,922 | 6,685,493 | |||
|
Composite Resins Holding B.V. Senior Secured 2018 Term Loan B, 3 Month USD LIBOR + 4.25%, 5.25%,
8/1/2025 |
6,763,008 | 6,805,277 | |||
|
New Arclin U.S. Holding Corp. Senior Secured 2021 Term Loan B, 1 Month USD LIBOR + 4.00%, 5.00%,
2/28/2026 |
2,392,543 | 2,408,250 | |||
|
NIC Acquisition Corp. Senior Secured Term Loan, 3 Month USD LIBOR + 3.75%, 3.92%,
12/29/2027 |
4,488,750 | 4,486,663 | |||
|
SCIH Salt Holdings, Inc. Senior Secured 2021 Incremental Term Loan B, 3 Month USD LIBOR + 4.00%, 4.75%,
3/16/2027 |
55,804,616 | 55,984,865 | |||
|
Vantage Specialty Chemicals, Inc. Senior Secured 2017 1st Lien Term Loan, 3 Month USD LIBOR + 3.50%, 4.50%,
10/28/2024 |
9,808,847 | 9,587,167 | |||
| 85,957,715 |
| Security Description | Principal
Amount |
Value | |||
| COMMERCIAL SERVICES — 2.1% | |||||
|
Allied Universal Holdco LLC Senior Secured 2021 USD Incremental Term Loan B, 1 Month USD LIBOR + 3.75%, 4.25%,
5/12/2028 |
$ 41,265,333 | $ 41,431,839 | |||
|
APX Group, Inc. Senior Secured 2020 Term Loan, 3 Month USD LIBOR + 4.00%, 7.25%,
12/31/2025 |
12,377,313 | 12,431,464 | |||
|
LegalZoom.com, Inc. Senior Secured 2018 1st Lien Term Loan, 1 Month USD LIBOR + 4.50%, 4.60%,
11/21/2024 |
4,602,443 | 4,603,870 | |||
|
Spin Holdco, Inc. Senior Secured 2021 Term Loan, 3 Month USD LIBOR + 4.00%, 4.75%,
3/1/2028 |
48,667,277 | 48,804,275 | |||
|
Verscend Holding Corp. Senior Secured 2021 Term Loan B, 1 Month USD LIBOR + 4.00%, 4.10%,
8/27/2025 |
24,687,830 | 24,784,853 | |||
| 132,056,301 | |||||
| COMMERCIAL SERVICES & SUPPLIES — 3.9% | |||||
| Asurion LLC: | |||||
|
Senior Secured 2018 Term Loan B6, 1 Month USD LIBOR + 3.00%, 5.35%,
11/3/2023 |
19,104,194 | 19,026,631 | |||
|
Senior Secured 2021 2nd Lien Term Loan B3, 1 Month USD LIBOR + 5.25%, 5.35%,
1/31/2028 |
74,899,316 | 75,601,498 | |||
|
Cast and Crew Payroll LLC Senior Secured 2019 1st Lien Term Loan, 1 Month USD LIBOR + 3.75%, 3.85%,
2/9/2026 |
27,053,401 | 26,943,564 | |||
|
Emerald TopCo, Inc. Senior Secured Term Loan, 3 Month USD LIBOR + 3.50%, 3.69%,
7/24/2026 |
164,581 | 163,861 | |||
|
EnergySolutions LLC Senior Secured 2018 Term Loan B, 3 Month USD LIBOR + 3.75%, 4.75%,
5/9/2025 |
90,587 | 90,204 | |||
|
Garda World Security Corporation Senior Secured 2021 Term Loan B, 1 Month USD LIBOR + 4.25%, 4.35%,
10/30/2026 |
16,237,709 | 16,336,272 | |||
|
Guidehouse LLP Senior Secured 2018 Term Loan, 1 Month USD LIBOR + 4.00%, 4.10%,
5/1/2025 |
5,985,000 | 6,006,367 | |||
|
Learning Care Group, Inc. Senior Secured 2018 1st Lien Term Loan, 3 Month USD LIBOR + 3.25%, 4.25%,
3/13/2025 |
40,935,453 | 40,327,152 |
| Security Description | Principal
Amount |
Value | |||
|
SSH Group Holdings, Inc. Senior Secured 2018 1st Lien Term Loan, 3 Month USD LIBOR + 4.25%, 4.40%,
7/30/2025 |
$ 14,218,520 | $ 13,747,531 | |||
|
USS Ultimate Holdings, Inc. Senior Secured 1st Lien Term Loan, 1 Month USD LIBOR + 3.75%, 4.75%,
8/25/2024 |
5,745,584 | 5,768,481 | |||
|
West Corp. Senior Secured 2017 Term Loan, 3 Month USD LIBOR + 4.00%, 5.00%,
10/10/2024 |
42,415,100 | 41,573,796 | |||
| 245,585,357 | |||||
| COMPUTER SERVICES — 1.0% | |||||
|
ConvergeOne Holdings, Inc. Senior Secured 2019 Term Loan, 1 Month USD LIBOR + 5.00%, 5.10%,
1/4/2026 |
19,041,352 | 18,872,551 | |||
|
Genuine Financial Holdings LLC Senior Secured 2018 1st Lien Term Loan, 3 Month USD LIBOR + 3.75%, 3.85%,
7/11/2025 |
40,498,503 | 39,844,047 | |||
|
Tempo Acquisition LLC Senior Secured Non-Extended Term Loan, 5/1/2024
(c) |
2,543,290 | 2,542,234 | |||
| 61,258,832 | |||||
| COMPUTERS — 0.2% | |||||
|
Brave Parent Holdings, Inc. Senior Secured 1st Lien Term Loan, 1 Month USD LIBOR + 4.00%, 4.10%,
4/18/2025 |
3,530,627 | 3,530,627 | |||
|
Imprivata, Inc. Senior Secured Term Loan, 3 Month USD LIBOR + 3.50%, 4.00%,
12/1/2027 |
8,769,616 | 8,796,364 | |||
|
Park Place Technologies LLC Senior Secured 2020 Term Loan, 1 Month USD LIBOR + 5.00%, 6.00%,
11/10/2027 |
3,027,080 | 3,041,458 | |||
| 15,368,449 | |||||
| CONSTRUCTION & ENGINEERING — 0.7% | |||||
|
Aegion Corporation Senior Secured Term Loan, 3 Month USD LIBOR + 4.75%, 5.50%,
5/17/2028 |
13,117,513 | 13,281,482 | |||
|
Brand Energy & Infrastructure Services, Inc. Senior Secured 2017 Term Loan, 3 Month USD LIBOR + 4.25%, 5.25%,
6/21/2024 |
21,600,400 | 21,279,742 | |||
| DG Investment Intermediate Holdings 2, Inc.: | |||||
|
Senior Secured 2021 Delayed Draw Term Loan, 1 Month USD LIBOR + 3.75%, 4.50%,
3/31/2028 |
779,367 | 783,591 |
| Security Description | Principal
Amount |
Value | |||
|
Senior Secured 2021 Term Loan, 1 Month USD LIBOR + 3.75%, 4.50%,
3/31/2028 |
$ 4,896,683 | $ 4,923,223 | |||
|
Tutor Perini Corp. Senior Secured Term Loan B, 3 Month USD LIBOR + 4.50%, 5.75%,
8/13/2027 |
983,567 | 996,683 | |||
| 41,264,721 | |||||
| CONSTRUCTION MATERIALS — 0.0% (b) | |||||
|
Quikrete Holdings, Inc. Senior Secured 2016 1st Lien Term Loan, 2/1/2027
(c) |
2,000,000 | 1,985,910 | |||
| CONSUMER PRODUCTS-MISC — 0.6% | |||||
|
Drive Chassis HoldCo, LLC Senior Secured 2019 2nd Lien Term Loan, 3 Month USD LIBOR + 7.00%, 7.19%,
4/10/2026 |
29,503,958 | 30,032,521 | |||
|
MI Windows and Doors LLC Senior Secured 2020 Term Loan, 1 Month USD LIBOR + 3.75%, 4.50%,
12/18/2027 |
10,504,912 | 10,534,484 | |||
| 40,567,005 | |||||
| CONTAINERS & PACKAGING — 1.1% | |||||
|
BWAY Holding Company Senior Secured 2017 Term Loan B, 1 Month USD LIBOR + 3.25%, 3.35%,
4/3/2024 |
42,366,346 | 41,423,060 | |||
|
Charter NEX US, Inc. Senior Secured 2021 Term Loan, 1 Month USD LIBOR + 3.75%, 4.50%,
12/1/2027 |
9,043,645 | 9,076,157 | |||
|
Proampac PG Borrower LLC Senior Secured 2020 Term Loan, 3 Month USD LIBOR + 3.75%, 4.50%,
11/3/2025 |
3,864,406 | 3,867,787 | |||
| TricorBraun Holdings, Inc.: | |||||
|
Senior Secured 2021 Delayed Draw Term Loan, 3 Month USD LIBOR + 3.25%, 3.75%,
3/3/2028 |
617,842 | 614,138 | |||
|
Senior Secured 2021 Term Loan, 3 Month USD LIBOR + 3.25%, 3.75%,
3/3/2028 |
4,719,724 | 4,691,429 | |||
|
Trident TPI Holdings, Inc. Senior Secured 2017 USD Term Loan B1, 3 Month USD LIBOR + 3.00%, 4.00%,
10/17/2024 |
7,879,750 | 7,863,320 | |||
| 67,535,891 | |||||
| CONTAINERS-PAPER/PLASTIC — 0.1% | |||||
|
Flex Acquisition Company, Inc. Senior Secured 2021 Term Loan, 3 Month USD LIBOR + 3.50%, 4.00%,
2/23/2028 |
5,325,160 | 5,308,519 |
| Security Description | Principal
Amount |
Value | |||
| COSMETICS & TOILETRIES — 0.9% | |||||
|
Sunshine Luxembourg VII SARL Senior Secured 2021 Term Loan B3, 3 Month USD LIBOR + 3.75%, 4.50%,
10/1/2026 |
$ 57,607,963 | $ 57,892,258 | |||
| DIVERSIFIED CONSUMER SERVICES — 0.7% | |||||
|
Cambium Learning Group, Inc. Senior Secured Term Loan B, 3 Month USD LIBOR + 4.50%, 5.25%,
12/18/2025 |
36,992,004 | 37,246,324 | |||
|
St. George's University Scholastic Services Senior Secured 2021 Term Loan B, 6/29/2028
(c) |
6,323,362 | 6,315,457 | |||
| 43,561,781 | |||||
| DIVERSIFIED FINANCIAL SERVICES — 4.5% | |||||
|
Advisor Group, Inc. Senior Secured 2021 Term Loan, 1 Month USD LIBOR + 4.50%, 4.60%,
7/31/2026 |
61,899,921 | 62,110,691 | |||
| Atlas CC Acquisition Corp: | |||||
|
Senior Secured Term Loan B, 3 Month USD LIBOR + 4.25%, 5.00%,
4/28/2028 |
7,945,392 | 7,980,153 | |||
|
Senior Secured Term Loan C, 3 Month USD LIBOR + 4.25%, 6.00%,
4/28/2028 |
1,616,012 | 1,623,082 | |||
|
Deerfield Dakota Holding, LLC Senior Secured 2020 USD Term Loan B, 1 Month USD LIBOR + 3.75%, 4.75%,
4/9/2027 |
67,683,411 | 68,094,249 | |||
| Edelman Financial Center, LLC: | |||||
|
Senior Secured 2018 2nd Lien Term Loan, 1 Month USD LIBOR + 6.75%, 6.85%,
7/20/2026 |
7,009,231 | 7,062,536 | |||
|
Senior Secured 2021 Term Loan B, 1 Month USD LIBOR + 3.75%, 4.50%,
4/7/2028 |
45,774,574 | 45,882,601 | |||
|
IG Investment Holdings LLC Senior Secured 2018 1st Lien Term Loan, 3 Month USD LIBOR + 4.00%, 4.75%,
5/23/2025 |
18,646,976 | 18,711,681 | |||
|
Minotaur Acquisition, Inc. Senior Secured Term Loan B, 1 Month USD LIBOR + 5.00%, 4.85%,
3/27/2026 |
24,967,922 | 24,993,889 | |||
|
S&S Holdings LLC Senior Secured Term Loan, 3 Month USD LIBOR + 5.00%, 5.50%,
3/11/2028 |
9,975,000 | 9,925,125 | |||
|
William Morris Endeavor Entertainment LLC Senior Secured 2018 1st Lien Term Loan, 1 Month USD LIBOR + 2.75%, 2.86%,
5/18/2025 |
37,477,118 | 36,879,920 | |||
| 283,263,927 |
| Security Description | Principal
Amount |
Value | |||
| DIVERSIFIED TELECOMMUNICATION SERVICES — 0.1% | |||||
|
Altice France S.A. Senior Secured USD Term Loan B12, 3 Month USD LIBOR + 3.69%, 3.87%,
1/31/2026 |
$ 5,000,000 | $ 4,969,375 | |||
|
CenturyLink, Inc. Senior Secured 2020 Term Loan B, 3/15/2027
(c) |
1,266 | 1,250 | |||
|
Telesat Canada Senior Secured Term Loan B5, 1 Month USD LIBOR + 2.75%, 2.86%,
12/7/2026 |
2,000,000 | 1,884,580 | |||
| 6,855,205 | |||||
| ELECTRICAL EQUIPMENT — 0.3% | |||||
|
DiversiTech Holdings, Inc. Senior Secured 2021 Term Loan, 3 Month USD LIBOR + 3.25%, 4.25%,
12/2/2024 |
11,300,820 | 11,325,512 | |||
|
EXC Holdings III Corp. Senior Secured USD 2017 1st Lien Term Loan, 3 Month USD LIBOR + 3.50%, 4.50%,
12/2/2024 |
6,500,407 | 6,510,158 | |||
| 17,835,670 | |||||
| ELECTRONIC EQUIPMENT, INSTRUMENTS & COMPONENTS — 0.0% (b) | |||||
|
CPI International, Inc. Senior Secured 2017 1st Lien Term Loan, 1 Month USD LIBOR + 3.50%, 4.50%,
7/26/2024 |
2,769,831 | 2,770,523 | |||
| ENTERTAINMENT — 4.4% | |||||
|
AMC Entertainment Holdings, Inc. Senior Secured 2019 Term Loan B, 1 Month USD LIBOR + 3.00%, 3.09%,
4/22/2026 |
115,222,017 | 108,560,456 | |||
| Crown Finance US, Inc.: | |||||
|
Senior Secured 2018 USD Term Loan, 6 Month USD LIBOR + 2.50%, 3.50%,
2/28/2025 |
129,002,117 | 114,012,716 | |||
|
Senior Secured 2019 Incremental Term Loan, 6 Month USD LIBOR + 2.75%, 3.75%,
9/30/2026 |
43,967,882 | 38,423,752 | |||
|
Motion Finco S.a.r.l. Senior Secured Delayed Draw Term Loan B2, 3 Month USD LIBOR + 3.25%, 3.40%,
11/12/2026 |
8,101,251 | 7,863,277 | |||
|
SMG U.S. Midco 2, Inc. Senior Secured 2020 Term Loan, 3 Month USD LIBOR + 2.50%, 2.69%,
1/23/2025 |
7,947,129 | 7,713,682 | |||
| 276,573,883 |
| Security Description | Principal
Amount |
Value | |||
| ENVIRONMENTALLY FRIENDLY — 0.5% | |||||
|
Robertshaw U.S. Holding Corp. Senior Secured 2018 1st Lien Term Loan, 1 Month USD LIBOR + 3.50%, 4.50%,
2/28/2025 |
$ 32,237,894 | $ 31,230,460 | |||
| FINANCIAL SERVICES — 0.1% | |||||
|
AI Alpine AT Bidco GmbH Senior Secured 2018 USD Term Loan B, 3 Month USD LIBOR + 3.00%, 3.20%,
10/31/2025 |
3,949,818 | 3,848,603 | |||
| FOOD PRODUCTS — 0.2% | |||||
|
Chobani LLC Senior Secured 2020 Term Loan B, 1 Month USD LIBOR + 3.50%, 4.50%,
10/20/2027 |
13,933,686 | 13,990,326 | |||
| FOOD-MISC/DIVERSIFIED — 0.3% | |||||
|
1 Month USD LIBOR + 4.00%, 4.50%,
4/30/2028 |
20,000,000 | 20,009,400 | |||
| HAND/MACHINE TOOLS AND RELATED PRODUCTS — 0.6% | |||||
|
Apex Tool Group LLC Senior Secured 2019 Term Loan B, 1 Month USD LIBOR + 5.25%, 6.50%,
8/1/2024 |
37,146,675 | 37,350,424 | |||
| HEALTH CARE EQUIPMENT & SUPPLIES — 1.2% | |||||
| Carestream Health, Inc.: | |||||
|
Senior Secured 2020 Extended 2nd Lien PIK Term Loan, 3 Month USD LIBOR + 8.00%, 8.00%,
8/8/2023 |
19,156,318 | 18,813,132 | |||
|
Senior Secured 2020 Extended Term Loan, 3 Month USD LIBOR + 4.50%, 5.50%,
5/8/2023 |
5,061,921 | 5,080,903 | |||
|
Gainwell Acquisition Corp. Senior Secured Term Loan B, 3 Month USD LIBOR + 4.00%, 4.75%,
10/1/2027 |
49,603,323 | 49,851,340 | |||
| 73,745,375 | |||||
| HEALTH CARE PROVIDERS & SERVICES — 10.5% | |||||
|
Alphabet Holding Company, Inc. Senior Secured 2017 1st Lien Term Loan, 1 Month USD LIBOR + 3.50%, 3.60%,
9/26/2024 |
111,889,215 | 111,893,131 | |||
|
Auris Luxembourg III S.a.r.l. Senior Secured 2019 USD Term Loan B2, 1 Month USD LIBOR + 3.75%, 3.85%,
2/27/2026 |
3,668,809 | 3,635,240 |
| Security Description | Principal
Amount |
Value | |||
|
Cambrex Corp. Senior Secured 2021 Term Loan, 1 Month USD LIBOR + 3.50%, 4.25%,
12/4/2026 |
$ 8,941,003 | $ 8,974,576 | |||
|
CHG Healthcare Services, Inc. Senior Secured 2017 1st Lien Term Loan B, 3 Month USD LIBOR + 3.00%, 4.00%,
6/7/2023 |
6,593,340 | 6,594,725 | |||
| Covenant Surgical Partners, Inc.: | |||||
|
Senior Secured 2019 Delayed Draw Term Loan, 1 Month USD LIBOR + 3.00%, 4.00%,
7/1/2026 |
505,237 | 502,079 | |||
|
Senior Secured 2019 Term Loan, 1 Month USD LIBOR + 4.00%, 4.08%,
7/1/2026 |
2,482,305 | 2,466,791 | |||
|
Envision Healthcare Corporation Senior Secured 2018 1st Lien Term Loan, 1 Month USD LIBOR + 3.75%, 3.85%,
10/10/2025 |
112,408,945 | 96,601,437 | |||
|
ExamWorks Group, Inc. Senior Secured 2017 Term Loan, 1 Month USD LIBOR + 3.25%, 4.25%,
7/27/2023 |
33,419,572 | 33,490,087 | |||
| Global Medical Response, Inc.: | |||||
|
Senior Secured 2017 Term Loan B2, 6 Month USD LIBOR + 4.25%, 5.25%,
3/14/2025 |
40,107,798 | 40,265,221 | |||
|
Senior Secured 2020 Term Loan B, 3 Month USD LIBOR + 4.75%, 5.75%,
10/2/2025 |
35,463,945 | 35,663,430 | |||
|
Horizon Therapeutics USA, Inc. Senior Secured 2021 Term Loan B, 3/15/2028
(c) |
1,995,000 | 1,985,025 | |||
| ICON Luxembourg S.A.R.L.: | |||||
|
Senior Secured 1st Lien Term Loan B, 7/3/2028
(c) |
220,169 | 220,771 | |||
|
Senior Secured Term Loan B, 7/3/2028
(c) |
883,677 | 886,094 | |||
| National Mentor Holdings, Inc.: | |||||
|
Senior Secured 2021 Delayed Draw Term Loan, 3 Month USD LIBOR + 0.50%, 3.75%,
3/2/2028 |
571,551 | 573,177 | |||
|
Senior Secured 2021 Term Loan, 3 Month USD LIBOR + 3.75%, 4.50%,
2/18/2028 |
39,774,980 | 39,888,140 | |||
|
Senior Secured 2021 Term Loan C, 3 Month USD LIBOR + 3.75%, 4.75%,
3/2/2028 |
1,252,716 | 1,256,280 | |||
|
NMSC Holdings, Inc. Senior Secured 1st Lien Term Loan, 1 Month USD LIBOR + 5.00%, 6.00%,
4/19/2023 |
12,471,288 | 12,463,556 | |||
|
1 Month USD LIBOR + 2.25%, 2.75%,
1/13/2028 |
2,358,968 | 2,359,157 | |||
|
RegionalCare Hospital Partners Holdings, Inc. Senior Secured 2018 Term Loan B, 1 Month USD LIBOR + 3.75%, 3.85%,
11/16/2025 |
6,131,272 | 6,124,221 |
| Security Description | Principal
Amount |
Value | |||
|
Surgery Center Holdings, Inc. Senior Secured 2021 Term Loan, 1 Month USD LIBOR + 3.75%, 4.50%,
8/31/2026 |
$ 96,619,580 | $ 97,140,359 | |||
|
Team Health Holdings, Inc. Senior Secured 1st Lien Term Loan, 1 Month USD LIBOR + 2.75%, 3.75%,
2/6/2024 |
93,565,907 | 91,148,632 | |||
|
U.S. Anesthesia Partners, Inc. Senior Secured 2017 Term Loan, 6 Month USD LIBOR + 3.00%, 4.00%,
6/23/2024 |
45,694,587 | 45,440,982 | |||
|
Unified Physician Management LLC Senior Secured 2020 Term Loan, 1 Month USD LIBOR + 4.25%, 5.00%,
12/16/2027 |
20,771,499 | 20,836,410 | |||
| 660,409,521 | |||||
| HEALTH CARE TECHNOLOGY — 2.1% | |||||
|
Change Healthcare Holdings LLC. Senior Secured 2017 Term Loan B, 1 Month USD LIBOR + 2.50%, 3.50%,
3/1/2024 |
130,823,628 | 130,830,824 | |||
| HOME FURNISHINGS — 0.5% | |||||
| AI Aqua Merger Sub, Inc.: | |||||
|
Senior Secured 2021 1st Lien Delayed Draw Term Loan, 6/16/2028
(c) |
3,737,524 | 3,751,540 | |||
|
Senior Secured 2021 1st Lien Term Loan B, 6/16/2028
(c) |
29,900,193 | 30,012,319 | |||
| 33,763,859 | |||||
| HOTELS, RESTAURANTS & LEISURE — 5.1% | |||||
|
Alterra Mountain Company Senior Secured 2020 Term Loan B, 1 Month USD LIBOR + 4.50%, 5.50%,
8/1/2026 |
9,560,406 | 9,596,306 | |||
|
Golden Nugget, Inc. Senior Secured 2017 Incremental Term Loan B, 2 Month USD LIBOR + 2.50%, 3.25%,
10/4/2023 |
74,960,840 | 74,499,456 | |||
|
Motion Finco S.a.r.l. Senior Secured USD Term Loan B1, 3 Month USD LIBOR + 3.25%, 3.40%,
11/12/2026 |
60,806,015 | 59,019,838 | |||
|
Peraton Corp. Senior Secured Term Loan B, 1 Month USD LIBOR + 3.75%, 4.50%,
2/1/2028 |
37,242,952 | 37,416,131 | |||
|
Recess Holdings, Inc. Senior Secured 2017 1st Lien Term Loan, 6 Month USD LIBOR + 3.75%, 4.75%,
9/30/2024 |
20,312,926 | 20,246,909 | |||
|
Travel Leaders Group LLC Senior Secured 2018 Term Loan B, 1/25/2024
(c) |
13,167,105 | 12,711,194 |
| Security Description | Principal
Amount |
Value | |||
| Travelport Finance (Luxembourg) S.a.r.l.: | |||||
|
Senior Secured 2020 Super Priority Term Loan, 3 Month USD LIBOR + 1.50%, 2.50%,
2/28/2025 |
$ 44,661,621 | $ 46,958,569 | |||
|
Senior Secured 2021 Consented Term Loan,
5/29/2026 |
67,165,298 | 61,005,192 | |||
| 321,453,595 | |||||
| HOUSEHOLD PRODUCTS — 0.4% | |||||
|
Champ Acquisition Corp. Senior Secured Term Loan, 3 Month USD LIBOR + 5.50%, 5.70%,
12/19/2025 |
26,205,122 | 26,363,532 | |||
| INDUSTRIAL CONGLOMERATES — 0.8% | |||||
|
Anvil International, LLC Senior Secured 2019 1st Lien Term Loan, 5/28/2026
(c) |
15,150,719 | 15,131,781 | |||
| Fluid-Flow Products, Inc.: | |||||
|
Senior Secured Delayed Draw Term Loan, 3 Month USD LIBOR + 1.875%, 1.88%,
3/31/2028 |
78,933 | 79,118 | |||
|
Senior Secured Term Loan, 3 Month USD LIBOR + 3.75%, 4.25%,
3/31/2028 |
16,867,240 | 16,906,794 | |||
|
Magenta Buyer LLC Senior Secured 2021 USD 2nd Lien Term Loan, 5/3/2029
(c) |
17,916,667 | 17,782,292 | |||
| 49,899,985 | |||||
| INSURANCE — 0.2% | |||||
|
Acrisure, LLC Senior Secured 2020 Term Loan B, 3 Month USD LIBOR + 3.50%, 3.60%,
2/15/2027 |
3,777,104 | 3,742,090 | |||
|
Alliant Holdings Intermediate, LLC Senior Secured 2020 Term Loan B3, 1 Month USD LIBOR + 3.25%, 3.35%,
10/8/2027 |
11,311,611 | 11,345,376 | |||
|
OneDigital Borrower LLC Senior Secured 2020 Term Loan, 3 Month USD LIBOR + 4.50%, 5.25%,
11/16/2027 |
537,765 | 540,680 | |||
| 15,628,146 | |||||
| INTERACTIVE MEDIA & SERVICES — 0.9% | |||||
| Ivanti Software, Inc.: | |||||
|
Senior Secured 2020 Term Loan B, 3 Month USD LIBOR + 4.75%, 5.75%,
12/1/2027 |
53,999,741 | 54,160,930 | |||
|
Senior Secured 2021 Add On Term Loan B, 3 Month USD LIBOR + 4.00%, 4.75%,
12/1/2027 |
3,344,674 | 3,334,925 | |||
| 57,495,855 |
| Security Description | Principal
Amount |
Value | |||
| INTERNET & CATALOG RETAIL — 2.3% | |||||
|
Endure Digital Inc. Senior Secured Term Loan, 3 Month USD LIBOR + 3.50%, 4.25%,
2/10/2028 |
$ 84,413,125 | $ 84,166,639 | |||
|
Shutterfly, Inc. Senior Secured 2019 Term Loan B, 3 Month USD LIBOR + 6.00%, 7.00%,
9/25/2026 |
1,009,316 | 1,013,191 | |||
|
White Cap Buyer LLC Senior Secured Term Loan B, 3 Month USD LIBOR + 4.00%, 4.50%,
10/19/2027 |
61,678,554 | 61,864,207 | |||
| 147,044,037 | |||||
| IT SERVICES — 1.5% | |||||
|
Access CIG LLC Senior Secured 2018 1st Lien Term Loan, 1 Month USD LIBOR + 3.75%, 3.84%,
2/27/2025 |
11,912,488 | 11,856,262 | |||
|
Ahead Data Blue, LLC Senior Secured 2021 Term Loan B, 2 Month USD LIBOR + 3.75%, 4.50%,
10/18/2027 |
32,947,014 | 33,052,444 | |||
|
CoreLogic, Inc. Senior Secured Term Loan, 6/2/2028
(c) |
41,800,000 | 41,742,525 | |||
|
TierPoint LLC Senior Secured 2021 Term Loan, 1 Month USD LIBOR + 3.75%, 4.50%,
5/5/2026 |
9,906,080 | 9,916,679 | |||
| 96,567,910 | |||||
| LEISURE EQUIPMENT & PRODUCTS — 0.1% | |||||
|
Cinemark USA, Inc. Senior Secured 2018 Term Loan B, 1 Month USD LIBOR + 1.75%, 1.86%,
3/31/2025 |
6,321,847 | 6,157,858 | |||
| LEISURE&REC/GAMES — 0.7% | |||||
|
AP Gaming I LLC Senior Secured 2018 Incremental Term Loan, 3 Month USD LIBOR + 3.50%, 4.50%,
2/15/2024 |
44,427,587 | 44,103,710 | |||
| LIFE SCIENCES TOOLS & SERVICES — 0.2% | |||||
|
Albany Molecular Research, Inc. Senior Secured 2017 1st Lien Term Loan, 3 Month USD LIBOR + 3.25%, 4.25%,
8/30/2024 |
4,163,429 | 4,174,587 | |||
|
eResearchTechnology, Inc. Senior Secured 2020 1st Lien Term Loan, 1 Month USD LIBOR + 4.50%, 5.50%,
2/4/2027 |
11,293,830 | 11,359,165 | |||
| 15,533,752 |
| Security Description | Principal
Amount |
Value | |||
| MACHINERY — 0.6% | |||||
|
American Trailer World Corp. Senior Secured Term Loan B, 1 Month USD LIBOR + 3.75%, 4.50%,
3/3/2028 |
$ 5,376,344 | $ 5,375,511 | |||
|
Blount International, Inc. Senior Secured 2018 Term Loan B, 1 Month USD LIBOR + 3.75%, 4.75%,
4/12/2023 |
7,409,461 | 7,441,877 | |||
|
Hillman Group, Inc. Senior Secured 2018 Term Loan B, 1 Month USD LIBOR + 4.00%, 4.10%,
5/31/2025 |
24,564,523 | 24,559,364 | |||
|
Madison IAQ LLC Senior Secured Term Loan, 3 Month USD LIBOR + 3.25%, 3.75%,
6/21/2028 |
654,811 | 655,938 | |||
| 38,032,690 | |||||
| MACHINERY-CONSTRUCTION & MINING — 0.0% (b) | |||||
|
Brookfield WEC Holdings, Inc. Senior Secured 2021 Term Loan, 8/1/2025
(c) |
5,013 | 4,960 | |||
| MEDIA — 2.5% | |||||
|
Go Daddy Operating Co. LLC Senior Secured 2021 Term Loan B4, 8/10/2027
(c) |
3,703 | 3,685 | |||
|
iHeartCommunications, Inc. Senior Secured 2020 Term Loan, 1 Month USD LIBOR + 3.00%, 3.10%,
5/1/2026 |
2,027,438 | 2,012,658 | |||
| MH Sub I LLC: | |||||
|
Senior Secured 2017 1st Lien Term Loan, 1 Month USD LIBOR + 3.50%, 3.60%,
9/13/2024 |
3,389 | 3,380 | |||
|
Senior Secured 2020 Incremental Term Loan, 1 Month USD LIBOR + 3.75%, 4.75%,
9/13/2024 |
28,829,574 | 28,928,748 | |||
|
Senior Secured 2021 2nd Lien Term Loan, 1 Month USD LIBOR + 6.25%, 6.35%,
2/12/2029 |
15,253,579 | 15,515,789 | |||
|
ProQuest LLC Senior Secured 2019 Term Loan, 10/23/2026
(c) |
4,028,640 | 4,028,841 | |||
|
Radiate Holdco, LLC Senior Secured 2020 Term Loan, 1 Month USD LIBOR + 3.50%, 4.25%,
9/25/2026 |
60,090,511 | 60,220,907 | |||
|
Recorded Books, Inc. Senior Secured 2021 Term Loan, 1 Month USD LIBOR + 4.00%, 4.08%,
8/29/2025 |
14,177,542 | 14,212,986 | |||
|
Univision Communications Inc. Senior Secured 2021 First Lien Term Loan B, 3/15/2026
(c) |
9,233,368 | 9,265,084 |
| Security Description | Principal
Amount |
Value | |||
|
Univision Communications, Inc. Senior Secured Term Loan C5, 1 Month USD LIBOR + 2.75%, 3.75%,
3/15/2024 |
$ 322,086 | $ 322,188 | |||
|
Vertical US Newco Inc Senior Secured Term Loan B, 7/29/2027
(c) |
2,386,935 | 2,393,570 | |||
|
WideOpenWest Finance LLC Senior Secured 2017 Term Loan B, 1 Month USD LIBOR + 3.25%, 4.25%,
8/18/2023 |
17,821,077 | 17,824,819 | |||
| 154,732,655 | |||||
| MISCELLANEOUS MANUFACTUR — 0.5% | |||||
| LTI Holdings, Inc.: | |||||
|
Senior Secured 2018 2nd Lien Term Loan, 1 Month USD LIBOR + 6.75%, 6.85%,
9/6/2026 |
1,928,424 | 1,928,434 | |||
|
Senior Secured 2018 Add On 1st Lien Term Loan, 1 Month USD LIBOR + 3.50%, 3.60%,
9/6/2025 |
26,890,053 | 26,569,523 | |||
| 28,497,957 | |||||
| MRI/MEDICAL DIAG IMAGING — 0.8% | |||||
|
Radiology Partners, Inc Senior Secured 2018 1st Lien Term Loan B, 1 Month USD LIBOR + 4.25%, 4.35%,
7/9/2025 |
50,078,605 | 50,127,432 | |||
| MULTILINE RETAIL — 0.0% (b) | |||||
| AI Aqua Merger Sub, Inc.: | |||||
|
Senior Secured 2017 1st Lien Term Loan B, 12/13/2023
(c) |
13,512 | 13,538 | |||
|
Senior Secured 2017 Incremental Term Loan, 1 Month USD LIBOR + 3.25%, 4.25%,
12/13/2023 |
2,244,171 | 2,246,976 | |||
| 2,260,514 | |||||
| OIL, GAS & CONSUMABLE FUELS — 2.0% | |||||
|
BCP Raptor LLC Senior Secured Term Loan B, 1 Month USD LIBOR + 4.25%, 5.25%,
6/24/2024 |
75,351,055 | 74,775,373 | |||
|
EG America LLC Senior Secured 2018 USD Term Loan, 3 Month USD LIBOR + 4.00%, 4.15%,
2/7/2025 |
26,717,507 | 26,574,435 | |||
| EG Group Limited: | |||||
|
Senior Secured 2018 USD Term Loan B, 2/7/2025
(c) |
2,992,268 | 2,976,244 | |||
|
Senior Secured 2021 Term Loan, 3 Month USD LIBOR + 4.25%, 4.75%,
3/31/2026 |
3,634,752 | 3,642,131 |
| Security Description | Principal
Amount |
Value | |||
|
Lucid Energy Group II LLC Senior Secured 2018 1st Lien Term Loan, 1 Month USD LIBOR + 3.00%, 4.00%,
2/17/2025 |
$ 20,318,776 | $ 20,169,940 | |||
| 128,138,123 | |||||
| PHARMACEUTICALS — 1.1% | |||||
|
Amneal Pharmaceuticals LLC Senior Secured 2018 Term Loan B, 1 Month USD LIBOR + 3.50%, 3.63%,
5/4/2025 |
42,153,667 | 41,468,669 | |||
|
Arbor Pharmaceuticals, Inc. Senior Secured Term Loan B, 6 Month USD LIBOR + 5.00%, 6.00%,
7/5/2023 |
11,045,987 | 11,006,553 | |||
|
Padagis LLC Senior Secured Term Loan B, 7/6/2028
(c) |
14,266,304 | 14,177,140 | |||
|
PetVet Care Centers, LLC Senior Secured 2021 Term Loan B3, 1 Month USD LIBOR + 3.50%, 4.25%,
2/14/2025 |
5,397,788 | 5,420,675 | |||
| 72,073,037 | |||||
| PIPELINES — 0.8% | |||||
|
Oryx Midstream Holdings LLC Senior Secured Term Loan B, 1 Month USD LIBOR + 4.00%, 4.10%,
5/22/2026 |
47,378,657 | 47,146,027 | |||
| PROFESSIONAL SERVICES — 0.8% | |||||
|
GlobalLogic Holdings, Inc. Senior Secured 2020 Incremental Term Loan B2, 1 Month USD LIBOR + 3.75%, 4.50%,
9/14/2027 |
3,214,054 | 3,223,600 | |||
|
KUEHG Corp. Senior Secured 2018 Incremental Term Loan, 3 Month USD LIBOR + 3.75%, 4.75%,
2/21/2025 |
47,647,887 | 47,010,120 | |||
| 50,233,720 | |||||
| REAL ESTATE MANAGEMENT & DEVELOPMENT — 1.0% | |||||
|
Bright Bidco B.V. Senior Secured 2018 Term Loan B, 3 Month USD LIBOR + 3.50%, 4.50%,
6/30/2024 |
72,234,719 | 60,699,557 | |||
| RETAIL-BUILDING PRODUCTS — 1.7% | |||||
| LBM Acquisition LLC: | |||||
|
Senior Secured 2021 Incremental Delayed Draw Term Loan B2, 12/17/2027
(c) |
5,696,970 | 5,657,803 | |||
|
Senior Secured 2021 Incremental Term Loan B2, 12/17/2027
(c) |
6,803,030 | 6,756,260 |
| Security Description | Principal
Amount |
Value | |||
|
Senior Secured Delayed Draw Term Loan, 12/17/2027
(c) |
$ 15,074,242 | $ 14,987,867 | |||
|
Senior Secured Term Loan B, 3 Month USD LIBOR + 3.75%, 4.50%,
12/17/2027 |
67,664,007 | 67,276,292 | |||
|
Park River Holdings Inc Senior Secured Term Loan, 3 Month USD LIBOR + 3.25%, 4.00%,
12/28/2027 |
9,952,992 | 9,915,668 | |||
| 104,593,890 | |||||
| RETAIL-RESTAURANTS — 1.1% | |||||
|
CT Technologies Intermediate Holdings, Inc. Senior Secured 2021 Term Loan B, 12/16/2025
(c) |
25,876,705 | 25,966,755 | |||
|
IRB Holding Corp Senior Secured 2020 Fourth Amendment Incremental Term Loan, 3 Month USD LIBOR + 3.25%, 4.25%,
12/15/2027 |
32,058,177 | 32,095,846 | |||
|
Tacala LLC Senior Secured 1st Lien Term Loan, 1 Month USD LIBOR + 3.75%, 4.50%,
2/5/2027 |
13,594,504 | 13,621,081 | |||
| 71,683,682 | |||||
| SOFTWARE — 16.0% | |||||
|
Applied Systems, Inc. Senior Secured 2021 2nd Lien Term Loan, 3 Month USD LIBOR + 5.50%, 6.25%,
9/19/2025 |
3,758,500 | 3,821,455 | |||
|
Apttus Corporation Senior Secured 2021 Term Loan, 3 Month USD LIBOR + 4.25%, 5.00%,
5/8/2028 |
7,682,927 | 7,738,628 | |||
|
Athenahealth, Inc. Senior Secured 2021 Term Loan B1, 3 Month USD LIBOR + 4.25%, 4.41%,
2/11/2026 |
51,319,569 | 51,528,183 | |||
|
Banff Merger Sub, Inc. Senior Secured 2021 USD Term Loan, 1 Month USD LIBOR + 3.75%, 3.85%,
10/2/2025 |
30,246,241 | 30,111,040 | |||
|
CCC Information Services, Inc. Senior Secured 2017 1st Lien Term Loan, 1 Month USD LIBOR + 3.00%, 4.00%,
4/29/2024 |
40,132,516 | 40,176,260 | |||
|
Cengage Learning, Inc. Senior Secured 2021 Term Loan B, 6/29/2026
(c) |
63,253,012 | 63,411,461 | |||
| DCert Buyer, Inc.: | |||||
|
Senior Secured 2019 Term Loan B, 1 Month USD LIBOR + 4.00%, 4.10%,
10/16/2026 |
17,714,244 | 17,758,530 | |||
|
Senior Secured 2021 2nd Lien Term Loan, 1 Month USD LIBOR + 7.00%, 7.10%,
2/16/2029 |
30,245,434 | 30,598,398 |
| Security Description | Principal
Amount |
Value | |||
|
ECI Macola Max Holdings LLC Senior Secured 2020 Term Loan, 3 Month USD LIBOR + 3.75%, 4.50%,
11/9/2027 |
$ 12,422,953 | $ 12,466,434 | |||
|
Ensono, LP Senior Secured 2021 Term Loan, 1 Month USD LIBOR + 4.00%, 4.75%,
5/19/2028 |
28,571,429 | 28,675,571 | |||
| Epicor Software Corporation: | |||||
|
Senior Secured 2020 2nd Lien Term Loan, 1 Month USD LIBOR + 7.75%, 8.75%,
7/31/2028 |
3,632,899 | 3,763,465 | |||
|
Senior Secured 2020 Term Loan, 1 Month USD LIBOR + 3.25%, 4.00%,
7/30/2027 |
6,769,344 | 6,769,987 | |||
|
Finastra USA, Inc. Senior Secured USD 1st Lien Term Loan, 6 Month USD LIBOR + 3.50%, 4.50%,
6/13/2024 |
109,604,617 | 108,060,288 | |||
|
Flexera Software LLC Senior Secured 2021 Term Loan B, 3 Month USD LIBOR + 3.75%, 4.50%,
3/3/2028 |
18,386,661 | 18,449,083 | |||
|
Gigamon, Inc. Senior Secured 1st Lien Term Loan, 3 Month USD LIBOR + 3.75%, 4.50%,
12/27/2024 |
1,554,574 | 1,560,404 | |||
|
Greeneden U.S. Holdings II, LLC Senior Secured 2020 USD Term Loan B4, 1 Month USD LIBOR + 4.00%, 4.75%,
12/1/2027 |
42,174,042 | 42,324,814 | |||
|
Help/Systems Holdings, Inc Senior Secured 2021 Term Loan, 4.50%,
11/19/2026 |
64,852,746 | 65,072,597 | |||
|
Hyland Software, Inc. Senior Secured 2018 1st Lien Term Loan, 1 Month USD LIBOR + 3.50%, 4.25%,
7/1/2024 |
22,619,047 | 22,687,357 | |||
|
Idera, Inc. Senior Secured 2021 Term Loan, 3 Month USD LIBOR + 3.75%, 4.50%,
3/2/2028 |
21,073,321 | 21,115,046 | |||
|
I-Logic Technologies Bidco, Ltd. Senior Secured 2021 USD Term Loan B, 3 Month USD LIBOR + 4.00%, 4.50%,
2/16/2028 |
3,627,232 | 3,644,081 | |||
| Imperva, Inc.: | |||||
|
Senior Secured 1st Lien Term Loan, 3 Month USD LIBOR + 4.00%, 5.00%,
1/12/2026 |
15,824,578 | 15,900,061 | |||
|
Senior Secured 2nd Lien Term Loan, 3 Month USD LIBOR + 7.75%, 8.75%,
1/10/2027 |
2,312,693 | 2,323,297 | |||
|
Informatica LLC Senior Secured 2020 USD 2nd Lien Term Loan, 3 Month USD LIBOR + 7.12%, 7.13%,
2/25/2025 |
587,888 | 602,217 |
| Security Description | Principal
Amount |
Value | |||
|
ION Trading Finance Limited Senior Secured 2021 USD Term Loan, 3 Month USD LIBOR + 4.75%, 4.92%,
4/1/2028 |
$ 10,866,089 | $ 10,927,211 | |||
|
MA FinanceCo. LLC Senior Secured 2020 USD Term Loan B, 3 Month USD LIBOR + 4.25%, 5.25%,
6/5/2025 |
5,182,658 | 5,259,336 | |||
| Mitchell International, Inc.: | |||||
|
Senior Secured 2017 2nd Lien Term Loan, 1 Month USD LIBOR + 7.25%, 7.35%,
12/1/2025 |
4,297,287 | 4,308,030 | |||
|
Senior Secured 2020 Add-On Term Loan, 1 Month USD LIBOR + 4.25%, 4.75%,
11/29/2024 |
24,995,465 | 25,147,187 | |||
|
Navicure, Inc. Senior Secured 2019 Term Loan B, 10/22/2026
(c) |
2,992,424 | 3,001,776 | |||
|
Polaris Newco LLC Senior Secured USD Term Loan B, 6 Month USD LIBOR + 4.00%, 4.50%,
6/2/2028 |
29,586,961 | 29,710,930 | |||
|
Project Alpha Intermediate Holding, Inc. Senior Secured 2021 Term Loan B, 1 Month USD LIBOR + 4.00%, 4.11%,
4/26/2024 |
4,926,861 | 4,940,040 | |||
|
Project Angel Holdings LLC Senior Secured 2018 1st Lien Term Loan, 1 Month USD LIBOR + 4.00%, 4.75%,
5/30/2025 |
4,080,598 | 4,082,516 | |||
|
Project Boost Purchaser, LLC Senior Secured 2021 Incremental Term Loan, 5/30/2026
(c) |
6,382,979 | 6,383,011 | |||
| Project Leopard Holdings, Inc.: | |||||
|
Senior Secured 2018 Term Loan, 3 Month USD LIBOR + 4.75%, 5.75%,
7/5/2024 |
2,251,727 | 2,263,267 | |||
|
Senior Secured 2019 Term Loan, 3 Month USD LIBOR + 4.75%, 5.75%,
7/7/2024 |
28,056,742 | 28,196,746 | |||
|
Project Ruby Ultimate Parent Corp. Senior Secured 2021 Term Loan, 1 Month USD LIBOR + 3.25%, 4.00%,
3/3/2028 |
7,632,014 | 7,618,887 | |||
|
Proofpoint, Inc. Senior Secured 1st Lien Term Loan, 6/9/2028
(c) |
7,147,788 | 7,116,553 | |||
| Quest Software US Holdings, Inc.: | |||||
|
Senior Secured 2018 1st Lien Term Loan, 3 Month USD LIBOR + 4.25%, 4.44%,
5/16/2025 |
13,418,065 | 13,430,141 | |||
|
Senior Secured 2018 2nd Lien Term Loan, 3 Month USD LIBOR + 8.25%, 8.44%,
5/18/2026 |
6,386,053 | 6,387,650 | |||
| Rocket Software, Inc.: | |||||
|
Senior Secured 2018 Term Loan, 1 Month USD LIBOR + 4.25%, 4.35%,
11/28/2025 |
9,596,206 | 9,436,525 |
| Security Description | Principal
Amount |
Value | |||
|
Senior Secured 2021 USD Incremental Term Loan B, 11/28/2025
(c) |
$ 12,500,000 | $ 12,295,312 | |||
|
Sabre GLBL, Inc. Senior Secured 2020 Term Loan B, 1 Month USD LIBOR + 4.00%, 4.75%,
12/17/2027 |
2,696,477 | 2,717,820 | |||
|
SolarWinds Holdings, Inc. Senior Secured 2018 Term Loan B, 2/5/2024
(c) |
1,994,832 | 1,963,144 | |||
|
Sophia, L.P. Senior Secured 2020 1st Lien Term Loan, 3 Month USD LIBOR + 3.75%, 4.50%,
10/7/2027 |
18,343,069 | 18,381,314 | |||
|
Syncsort Incorporated Senior Secured 2021 1st Lien Term Loan, 3 Month USD LIBOR + 4.25%, 5.00%,
4/24/2028 |
68,275,744 | 68,309,882 | |||
| Ultimate Software Group, Inc. (The): | |||||
|
Senior Secured 2020 2nd Lien Incremental Term Loan, 3 Month USD LIBOR + 6.75%, 7.50%,
5/3/2027 |
20,872,742 | 21,298,859 | |||
|
Senior Secured 2021 Incremental Term Loan, 3 Month USD LIBOR + 3.25%, 4.00%,
5/4/2026 |
3,000,000 | 3,007,365 | |||
|
Veritas US, Inc. Senior Secured 2021 USD Term Loan B, 3 Month USD LIBOR + 5.00%, 6.00%,
9/1/2025 |
57,898,191 | 58,346,902 | |||
|
Virgin Pulse, Inc. Senior Secured 2021 Term Loan, 3 Month USD LIBOR + 4.00%, 4.75%,
3/30/2028 |
11,510,638 | 11,546,609 | |||
|
Virtusa Corporation Senior Secured Term Loan B, 1 Month USD LIBOR + 4.25%, 5.00%,
2/11/2028 |
26,984,253 | 27,136,039 | |||
|
Weld North Education LLC Senior Secured 2020 Term Loan B, 1 Month USD LIBOR + 4.00%, 4.75%,
12/21/2027 |
15,849,557 | 15,889,181 | |||
| 1,007,660,890 | |||||
| SPECIALTY RETAIL — 4.0% | |||||
|
At Home Group, Inc. Senior Secured Term Loan B, 7/30/2028
(c) |
4,687,500 | 4,699,219 | |||
|
K-Mac Holdings Corp Senior Secured 2021 Term Loan, 6/23/2028
(c) |
6,021,390 | 6,042,104 | |||
|
Michaels Companies, Inc. Senior Secured 2021 Term Loan B, 3 Month USD LIBOR + 4.25%, 5.00%,
4/15/2028 |
101,746,457 | 102,295,888 | |||
|
Petco Animal Supplies, Inc. Senior Secured 2021 Term Loan B, 3 Month USD LIBOR + 3.25%, 4.00%,
3/3/2028 |
6,896,136 | 6,889,998 |
| Security Description | Principal
Amount |
Value | |||
|
PetSmart, Inc. Senior Secured 2021 Term Loan B, 3 Month USD LIBOR + 3.75%, 4.50%,
2/12/2028 |
$ 79,116,322 | $ 79,274,554 | |||
|
SRS Distribution Inc. Senior Secured 2021 Term Loan B, 1 Month USD LIBOR + 3.75%, 4.25%,
6/2/2028 |
49,441,500 | 49,472,401 | |||
| 248,674,164 | |||||
| STEEL-PRODUCERS — 0.1% | |||||
|
Phoenix Services International, LLC Senior Secured Term Loan, 3/1/2025
(c) |
5,208,341 | 5,207,534 | |||
| TELECOMMUNICATION EQUIP — 0.6% | |||||
|
Altice France S.A. Senior Secured 2018 Term Loan B13, 3 Month USD LIBOR + 4.00%, 4.15%,
8/14/2026 |
11,663,118 | 11,662,477 | |||
|
Colorado Buyer, Inc. Senior Secured Term Loan B, 6 Month USD LIBOR + 3.00%, 4.00%,
5/1/2024 |
13,022,527 | 12,707,577 | |||
|
Delta TopCo, Inc. Senior Secured 2020 Term Loan B, 3 Month USD LIBOR + 3.75%, 4.50%,
12/1/2027 |
16,094,340 | 16,151,394 | |||
| 40,521,448 | |||||
| TEXTILES, APPAREL & LUXURY GOODS — 0.1% | |||||
|
Varsity Brands, Inc. Senior Secured 2017 Term Loan B, 12/15/2024
(c) |
6,483,221 | 6,348,824 | |||
| TRADING COMPANIES & DISTRIBUTORS — 0.1% | |||||
|
Foundation Building Materials Holding Company LLC Senior Secured 2021 Term Loan, 3 Month USD LIBOR + 3.25%, 3.75%,
2/3/2028 |
3,500,000 | 3,480,680 | |||
| TRANSPORT-AIR FREIGHT — 0.6% | |||||
|
Kestrel Bidco, Inc. Senior Secured Term Loan B, 6 Month USD LIBOR + 3.00%, 4.00%,
12/11/2026 |
38,179,328 | 37,487,328 |
| Security Description | Principal
Amount |
Value | |||
| TRANSPORT-SERVICES — 0.9% | |||||
|
Gruden Acquisition, Inc. Senior Secured 2017 Term Loan, 3 Month USD LIBOR + 4.50%, 7.75%,
8/18/2022 |
$ 54,322,378 | $ 54,390,282 | |||
|
TOTAL SENIOR FLOATING RATE LOANS (Cost
$5,680,614,445) |
5,760,885,839 |
| Shares | |||
| WARRANTS — 0.0% (b) | |||
| HEALTH CARE EQUIPMENT & SUPPLIES — 0.0% (b) | |||
|
Carestream Health Holdings (expiring 12/31/49) (d) (e) (Cost
$0) |
372 | 1,469,525 | |
|
TOTAL WARRANTS (Cost
$0) |
1,469,525 |
| Principal
Amount |
|||
| CORPORATE BONDS & NOTES — 7.3% | |||
| AEROSPACE & DEFENSE — 0.2% | |||
| TransDigm, Inc.: | |||
|
4.63%, 1/15/2029
(f) |
2,740,000 | 2,748,439 | |
|
5.50%,
11/15/2027 |
3,000,000 | 3,128,100 | |
|
6.25%, 3/15/2026
(f) |
7,424,000 | 7,830,910 | |
| 13,707,449 | |||
| AIRLINES — 0.5% | |||
|
American Airlines, Inc./AAdvantage Loyalty IP, Ltd. 5.50%, 4/20/2026
(f) |
24,000,000 | 25,479,360 | |
| United Airlines, Inc.: | |||
|
4.38%, 4/15/2026
(f) |
3,003,000 | 3,108,796 | |
|
4.63%, 4/15/2029
(f) |
4,803,000 | 4,974,947 | |
| 33,563,103 | |||
| COMMERCIAL SERVICES — 1.1% | |||
| Allied Universal Holdco LLC/Allied Universal Finance Corp.: | |||
|
6.00%, 6/1/2029
(f) |
2,817,000 | 2,854,269 | |
|
6.63%, 7/15/2026
(f) |
811,000 | 859,919 | |
|
Avis Budget Car Rental LLC/Avis Budget Finance, Inc. 5.38%, 3/1/2029
(f) |
2,000,000 | 2,082,540 | |
|
Prime Security Services Borrower LLC/Prime Finance, Inc. 6.25%, 1/15/2028
(f) |
13,235,000 | 14,104,010 |
| Security Description | Principal
Amount |
Value | |||
|
Team Health Holdings, Inc. 6.38%, 2/1/2025
(f) |
$ 51,600,000 | $ 49,117,008 | |||
| 69,017,746 | |||||
| COMPUTERS — 0.1% | |||||
|
Diebold Nixdorf, Inc. 9.38%, 7/15/2025
(f) |
3,488,000 | 3,864,041 | |||
| DIVERSIFIED FINANCIAL SERVICES — 0.2% | |||||
|
AG Issuer LLC 6.25%, 3/1/2028
(f) |
3,827,000 | 4,029,372 | |||
|
NFP Corp. 6.88%, 8/15/2028
(f) |
10,484,000 | 11,076,975 | |||
| 15,106,347 | |||||
| ELECTRIC — 0.0% (b) | |||||
|
Calpine Corp. 5.00%, 2/1/2031
(f) |
1,450,000 | 1,442,184 | |||
| ENTERTAINMENT — 0.8% | |||||
|
AMC Entertainment Holdings, Inc. PIK 12.00%, 6/15/2026
(f) |
43,920,178 | 44,960,647 | |||
|
Cinemark USA, Inc. 5.88%, 3/15/2026
(f) |
1,974,000 | 2,070,509 | |||
| 47,031,156 | |||||
| FOOD — 0.1% | |||||
|
Albertsons Cos., Inc./Safeway, Inc./New Albertsons L.P./Albertsons LLC 5.88%, 2/15/2028
(f) |
6,609,000 | 7,120,669 | |||
| HOME FURNISHINGS — 0.1% | |||||
|
WASH Multifamily Acquisition, Inc. 5.75%, 4/15/2026
(f) |
4,400,000 | 4,594,832 | |||
| INSURANCE — 0.1% | |||||
|
AssuredPartners, Inc. 5.63%, 1/15/2029
(f) |
2,632,000 | 2,637,369 | |||
|
HUB International, Ltd. 7.00%, 5/1/2026
(f) |
5,000,000 | 5,184,300 | |||
| 7,821,669 |
| Security Description | Principal
Amount |
Value | |||
| INTERNET — 0.9% | |||||
|
Endure Digital, Inc. 6.00%, 2/15/2029
(f) |
$ 21,000,000 | $ 20,792,520 | |||
|
Photo Holdings Merger Sub, Inc. 8.50%, 10/1/2026
(f) |
29,421,000 | 32,280,427 | |||
| 53,072,947 | |||||
| MEDIA — 0.8% | |||||
|
Altice Financing SA 5.00%, 1/15/2028
(f) |
2,039,000 | 2,006,560 | |||
|
Audacy Capital Corp. 6.75%, 3/31/2029
(f) |
2,500,000 | 2,598,425 | |||
| DISH DBS Corp.: | |||||
|
5.13%, 6/1/2029
(f) |
9,533,000 | 9,421,941 | |||
|
7.38%,
7/1/2028 |
6,500,000 | 6,996,275 | |||
|
iHeartCommunications, Inc. 5.25%, 8/15/2027
(f) |
7,417,000 | 7,763,522 | |||
|
LCPR Senior Secured Financing DAC 6.75%, 10/15/2027
(f) |
5,357,000 | 5,772,221 | |||
|
Univision Communications, Inc. 6.63%, 6/1/2027
(f) |
15,548,000 | 16,846,724 | |||
| 51,405,668 | |||||
| PACKAGING & CONTAINERS — 0.1% | |||||
|
Ardagh Packaging Finance PLC/Ardagh Holdings USA, Inc. 5.25%, 8/15/2027
(f) |
2,963,000 | 3,025,490 | |||
|
Intelligent Packaging, Ltd. Finco, Inc./Intelligent Packaging, Ltd. Co-Issuer LLC 6.00%, 9/15/2028
(f) |
1,442,000 | 1,504,424 | |||
| 4,529,914 | |||||
| PHARMACEUTICALS — 0.1% | |||||
|
Bausch Health Cos., Inc. 5.25%, 2/15/2031
(f) |
3,200,000 | 2,986,464 | |||
|
Par Pharmaceutical, Inc. 7.50%, 4/1/2027
(f) |
5,200,000 | 5,317,728 | |||
| 8,304,192 | |||||
| REAL ESTATE — 0.0% (b) | |||||
|
Realogy Group LLC/Realogy Co-Issuer Corp. 5.75%, 1/15/2029
(f) |
2,016,000 | 2,107,708 |
| Security Description | Principal
Amount |
Value | |||
| RETAIL — 1.1% | |||||
|
eG Global Finance PLC 6.75%, 2/7/2025
(f) |
$ 25,937,000 | $ 26,800,702 | |||
|
Foundation Building Materials, Inc. 6.00%, 3/1/2029
(f) |
15,692,000 | 15,552,027 | |||
|
LBM Acquisition LLC 6.25%, 1/15/2029
(f) |
5,000,000 | 5,037,900 | |||
|
PetSmart, Inc./PetSmart Finance Corp. 7.75%, 2/15/2029
(f) |
10,248,000 | 11,303,134 | |||
|
SRS Distribution, Inc. 6.13%, 7/1/2029
(f) |
8,095,000 | 8,350,155 | |||
| 67,043,918 | |||||
| SOFTWARE — 0.4% | |||||
|
Boxer Parent Co., Inc. 7.13%, 10/2/2025
(f) |
2,059,000 | 2,203,727 | |||
|
Change Healthcare Holdings LLC/Change Healthcare Finance, Inc. 5.75%, 3/1/2025
(f) |
5,000,000 | 5,079,550 | |||
|
Veritas US, Inc./Veritas Bermuda, Ltd. 7.50%, 9/1/2025
(f) |
19,444,000 | 20,239,843 | |||
| 27,523,120 | |||||
| TELECOMMUNICATIONS — 0.7% | |||||
|
Altice France Holding SA 6.00%, 2/15/2028
(f) |
6,598,000 | 6,558,610 | |||
|
Altice France SA 5.50%, 1/15/2028
(f) |
5,000,000 | 5,175,000 | |||
|
CommScope Technologies LLC 6.00%, 6/15/2025
(f) |
10,000,000 | 10,215,400 | |||
|
CommScope, Inc. 7.13%, 7/1/2028
(f) |
2,325,000 | 2,524,904 | |||
|
Plantronics, Inc. 4.75%, 3/1/2029
(f) |
14,346,000 | 14,228,793 | |||
|
Telesat Canada/Telesat LLC 5.63%, 12/6/2026
(f) |
2,043,000 | 2,049,906 | |||
| 40,752,613 | |||||
|
TOTAL CORPORATE BONDS & NOTES (Cost
$442,845,404) |
458,009,276 |
| Security Description | Shares | Value | |||
| SHORT-TERM INVESTMENT — 17.8% | |||||
|
State Street Institutional U.S. Government Money Market Fund, Class G Shares 0.03% (g) (h) (Cost
$1,121,627,625) |
1,121,627,625 | $ 1,121,627,625 | |||
|
TOTAL INVESTMENTS — 116.6% (Cost
$7,245,087,474) |
7,341,992,265 | ||||
|
LIABILITIES IN EXCESS OF OTHER ASSETS —
(16.6)% |
(1,047,796,055) | ||||
|
NET ASSETS —
100.0% |
$ 6,294,196,210 |
| (a) | The rate shown represents the rate at June 30, 2021. |
| (b) | Amount is less than 0.05% of net assets. |
| (c) | Position is unsettled. Contract rate was not determined at June 30, 2021 and does not take effect until settlement date. Maturity date is not finalized until settlement date. |
| (d) | Fair valued as determined in good faith by the Trust's Oversight Committee in accordance with policy and procedures approved by the Board of Trustees. Security value is determined based on Level 3 inputs. As of June 30, 2021, total aggregate fair value of the security is $1,469,525, representing less than 0.05% of the Fund's net assets. |
| (e) | Non-income producing security. |
| (f) | Securities purchased pursuant to Rule 144A of the Securities Act of 1933, as amended. These securities, which represent 7.1% of net assets as of June 30, 2021, are considered liquid and may be resold in transactions exempt from registration, normally to qualified institutional buyers. |
| (g) | The Fund invested in certain money market funds managed by SSGA Funds Management, Inc. Amounts related to these transactions during the period ended June 30, 2021 are shown in the Affiliate Table below. |
| (h) | The rate shown is the annualized seven-day yield at June 30, 2021. |
| LIBOR | London Interbank Offered Rate |
| LP | Limited Partnership |
| PIK | Payment in Kind |
| Borrower | Unfunded
Loan Commitment ($) |
Value ($) | Unrealized
Appreciation/(Depreciation) ($) | |||
| OneDigital Borrower LLC | 17,391 | 17,485 | 94 | |||
| DG Investment Intermediate Holdings 2, Inc. | 246,116 | 247,450 | 1,334 |
| Borrower | Unfunded
Loan Commitment ($) |
Value ($) | Unrealized
Appreciation/(Depreciation) ($) | |||
| TricorBraun Holdings, Inc. | 443,764 | 441,104 | (2,660) | |||
| Fluid-Flow Products, Inc. | 3,133,874 | 3,141,223 | 7,349 | |||
| National Mentor Holdings, Inc. | 1,274,952 | 1,278,579 | 3,627 | |||
| $5,116,097 | $5,125,841 | $9,744 |
| Description | Level
1 – Quoted Prices |
Level
2 – Other Significant Observable Inputs |
Level
3 – Significant Unobservable Inputs |
Total | ||||
| ASSETS: | ||||||||
| INVESTMENTS: | ||||||||
|
Corporate Bonds &
Notes |
$ — | $ 458,009,276 | $ — | $ 458,009,276 | ||||
|
Senior Floating Rate
Loans |
— | 5,760,885,839 | — | 5,760,885,839 | ||||
|
Warrants |
— | — | 1,469,525 | 1,469,525 | ||||
|
Short-Term
Investment |
1,121,627,625 | — | — | 1,121,627,625 | ||||
|
TOTAL
INVESTMENTS |
$1,121,627,625 | $ 6,218,895,115 | $1,469,525 | $7,341,992,265 | ||||
| LIABILITIES: | ||||||||
| OTHER FINANCIAL INSTRUMENTS: | ||||||||
|
Unfunded
Loans(a) |
— | 9,744 | — | 9,744 | ||||
|
TOTAL OTHER FINANCIAL
INSTRUMENTS: |
$ — | $ 9,744 | $ — | $ 9,744 |
| (a) | Unfunded loan commitments are valued at unrealized appreciation (depreciation). |
| Number
of Shares Held at 6/30/20 |
Value
at 6/30/20 |
Cost
of Purchases |
Proceeds
from Shares Sold |
Realized
Gain (Loss) |
Change
in Unrealized Appreciation/ Depreciation |
Number
of Shares Held at 6/30/21 |
Value
at 6/30/21 |
Dividend
Income | |||||||||
|
State Street Institutional U.S. Government Money Market Fund, Class G
Shares |
120,384,183 | $120,384,183 | $3,283,828,588 | $2,282,585,146 | $— | $— | 1,121,627,625 | $1,121,627,625 | $215,394 | ||||||||
| SPDR Blackstone Senior Loan ETF | |
| ASSETS | |
|
Investments in unaffiliated issuers, at
value |
$6,220,364,640 |
|
Investments in affiliated issuers, at
value |
1,121,627,625 |
|
Total
Investments |
7,341,992,265 |
|
Cash |
21,303,276 |
|
Receivable for investments
sold |
996,891,168 |
|
Receivable for fund shares
sold |
60,187,511 |
|
Dividends receivable — affiliated
issuers |
21,322 |
|
Interest receivable — unaffiliated
issuers |
14,638,778 |
|
Unrealized appreciation on unfunded loan
commitments |
9,744 |
|
Receivable from
affiliate |
79,391 |
|
TOTAL ASSETS
|
8,435,123,455 |
| LIABILITIES | |
|
Payable for investments
purchased |
2,135,231,278 |
|
Payable for fund shares
repurchased |
2,314,553 |
|
Advisory fee
payable |
3,375,475 |
|
Trustees’ fees and expenses
payable |
5,939 |
|
TOTAL LIABILITIES
|
2,140,927,245 |
|
NET ASSETS
|
$6,294,196,210 |
| NET ASSETS CONSIST OF: | |
|
Paid-in
Capital |
$6,420,943,099 |
|
Total distributable earnings
(loss) |
(126,746,889) |
|
NET ASSETS
|
$6,294,196,210 |
| NET ASSET VALUE PER SHARE | |
|
Net asset value per
share |
$ 46.30 |
|
Shares outstanding (unlimited amount authorized, no par
value) |
135,950,000 |
| COST OF INVESTMENTS: | |
|
Investments in unaffiliated
issuers |
$6,123,459,849 |
|
Investments in affiliated
issuers |
1,121,627,625 |
|
Total cost of
investments |
$7,245,087,474 |
| SPDR Blackstone Senior Loan ETF | |
| INVESTMENT INCOME | |
|
Interest income — unaffiliated
issuers |
$146,857,540 |
|
Dividend income — affiliated
issuers |
215,394 |
|
TOTAL INVESTMENT
INCOME |
147,072,934 |
| EXPENSES | |
|
Advisory
fee |
20,442,991 |
|
Trustees’ fees and
expenses |
27,279 |
|
Miscellaneous
expenses |
27 |
|
TOTAL
EXPENSES |
20,470,297 |
|
NET INVESTMENT INCOME
(LOSS) |
$126,602,637 |
| REALIZED AND UNREALIZED GAIN (LOSS) | |
| Net realized gain (loss) on: | |
|
Investments — unaffiliated
issuers |
8,848,268 |
| Net change in unrealized appreciation/depreciation on: | |
|
Investments — unaffiliated
issuers |
136,239,003 |
|
Unfunded loan
commitments |
9,744 |
|
Net change in unrealized
appreciation/depreciation |
136,248,747 |
|
NET REALIZED AND UNREALIZED GAIN
(LOSS) |
145,097,015 |
|
NET INCREASE (DECREASE) IN NET ASSETS FROM
OPERATIONS |
$271,699,652 |
| SPDR Blackstone Senior Loan ETF | |||
| Year
Ended 6/30/21 |
Year
Ended 6/30/20 | ||
| INCREASE (DECREASE) IN NET ASSETS FROM OPERATIONS: | |||
|
Net investment income
(loss) |
$ 126,602,637 | $ 104,518,445 | |
|
Net realized gain
(loss) |
8,848,268 | (111,952,043) | |
|
Net change in unrealized
appreciation/depreciation |
136,248,747 | (23,905,945) | |
|
Net increase (decrease) in net assets resulting from
operations |
271,699,652 | (31,339,543) | |
|
Net equalization credits and
charges |
3,900,949 | (1,610,641) | |
|
Distributions to
shareholders |
(123,950,000) | (106,659,500) | |
| FROM BENEFICIAL INTEREST TRANSACTIONS: | |||
|
Proceeds from shares
sold |
4,849,884,181 | 1,236,697,606 | |
|
Cost of shares
redeemed |
(138,069,393) | (1,898,029,896) | |
|
Net income
equalization |
(3,900,949) | 1,610,641 | |
|
Other
Capital |
1,457,881 | 9,447,256 | |
|
Net increase (decrease) in net assets from beneficial interest
transactions |
4,709,371,720 | (650,274,393) | |
|
Contribution from Affiliate (Note
4) |
79,391 | 578,465 | |
|
Net increase (decrease) in net assets during the
period |
4,861,101,712 | (789,305,612) | |
|
Net assets at beginning of
period |
1,433,094,498 | 2,222,400,110 | |
|
NET ASSETS AT END OF
PERIOD |
$6,294,196,210 | $ 1,433,094,498 | |
| SHARES OF BENEFICIAL INTEREST: | |||
|
Shares
sold |
105,950,000 | 27,700,000 | |
|
Shares
redeemed |
(3,050,000) | (42,700,000) | |
|
Net increase (decrease) from share
transactions |
102,900,000 | (15,000,000) | |
| SPDR Blackstone Senior Loan ETF | |||||||||
| Year
Ended 6/30/21 |
Year
Ended 6/30/20(a) |
Year
Ended 6/30/19(a) |
Year
Ended 6/30/18(a) |
Year
Ended 6/30/17(a) | |||||
|
Net asset value, beginning of
period |
$ 43.36 | $ 46.25 | $ 47.04 | $ 47.41 | $ 46.64 | ||||
| Income (loss) from investment operations: | |||||||||
|
Net investment income (loss)
(b) |
1.98 | 2.34 | 2.48 | 2.04 | 1.85 | ||||
|
Net realized and unrealized gain (loss)
(c) |
3.02 | (3.06) | (0.86) | (0.50) | 0.73 | ||||
|
Total from investment
operations |
5.00 | (0.72) | 1.62 | 1.54 | 2.58 | ||||
|
Net equalization credits and charges
(b) |
0.06 | (0.04) | (0.03) | 0.04 | 0.05 | ||||
|
Contribution from Affiliate (Note
4) |
0.00(d) | 0.01 | — | — | — | ||||
|
Other capital
(b) |
0.02 | 0.21 | 0.09 | 0.02 | 0.02 | ||||
| Distributions to shareholders from: | |||||||||
|
Net investment
income |
(2.14) | (2.35) | (2.47) | (1.97) | (1.88) | ||||
|
Net asset value, end of
period |
$ 46.30 | $ 43.36 | $ 46.25 | $ 47.04 | $ 47.41 | ||||
|
Total return
(e) |
11.97%(f) | (1.23)%(f) | 3.68% | 3.43% | 5.77% | ||||
| Ratios and Supplemental Data: | |||||||||
|
Net assets, end of period (in
000s) |
$6,294,196 | $1,433,094 | $2,222,400 | $3,189,624 | $1,820,505 | ||||
| Ratios to average net assets: | |||||||||
|
Total
expenses |
0.70% | 0.70% | 0.70% | 0.70% | 0.70% | ||||
|
Net investment income
(loss) |
4.31% | 5.17% | 5.33% | 4.30% | 3.91% | ||||
|
Portfolio turnover
rate |
176% | 195%(g) | 124%(g) | 90%(g) | 68%(g) | ||||
| (a) | The per share amounts and percentages include the Fund’s proportionate share of income and expenses of the Portfolio prior to discontinuance of the master feeder structure. |
| (b) | Per share numbers have been calculated using average shares outstanding, which more appropriately presents the per share data for the year. |
| (c) | Amounts shown in this caption for a share outstanding may not accord with the change in aggregate gains and losses in securities for the fiscal period because of the timing of sales and repurchases of Fund shares in relation to fluctuating market values for the Fund. |
| (d) | Amount is less than $0.005 per share. |
| (e) | Total return is calculated assuming a purchase of shares at net asset value on the first day and a sale at net asset value on the last day of each period reported. Distributions are assumed, for the purpose of this calculation, to be reinvested at net asset value per share on the respective payment dates of each distribution. Total returns for periods of less than one year are not annualized. Broker commission charges are not included in this calculation. |
| (f) | If an affiliate had not made a contribution during the years ended ended June 30, 2021 and June 30, 2020, the total return would have remained 11.97% and (1.23)%, respectively. |
| (g) | Portfolio turnover rate is from the the affiliated Portfolio prior to the discontinuance of the master feeder structure. |
| Annual Rate | |
|
SPDR Blackstone Senior Loan
ETF |
0.70% |
| Purchases | Sales | ||
|
SPDR Blackstone Senior Loan
ETF |
$9,846,058,378 | $5,192,611,407 |
| Ordinary
Income |
Long-Term
Capital Gains |
Total | |||
|
SPDR Blackstone Senior Loan
ETF |
$123,950,000 | $— | $123,950,000 |
| Ordinary
Income |
Long-Term
Capital Gains |
Total | |||
|
SPDR Blackstone Senior Loan ETF
|
$ 106,659,500 | $ — | $ 106,659,500 |
| Undistributed
Ordinary Income |
Capital
Loss Carryforwards |
Undistributed
Long-Term Capital Gains |
Net
Unrealized Gains (Losses) |
Total | |||||
|
SPDR Blackstone Senior Loan
ETF |
$8,613,673 | $(218,323,522) | $— | $82,962,960 | $(126,746,889) |
| Non-Expiring
Short Term |
Non-Expiring
Long Term | ||
|
SPDR Blackstone Senior Loan
ETF |
$104,590,183 | $113,733,339 |
| Tax
Cost |
Gross
Unrealized Appreciation |
Gross
Unrealized Depreciation |
Net
Unrealized Appreciation (Depreciation) | ||||
|
SPDR Blackstone Senior Loan
ETF |
$7,259,039,049 | $86,885,257 | $3,932,041 | $82,953,216 |

August 30, 2021
| SPDR Blackstone Senior Loan ETF | |
|
Annualized Expense
Ratio |
0.70% |
| Actual: | |
|
Ending Account
Value |
$1,038.40 |
|
Expenses Paid During
Period(a) |
3.54 |
| Hypothetical (assuming a 5% return before expenses): | |
|
Ending Account
Value |
1,021.30 |
|
Expenses Paid During
Period(a) |
3.51 |
| (a) | Expenses are equal to the Fund's annualized net expense ratio multiplied by the average account value of the period, multiplied by 181, then divided by 365. |
| Name,
Address and Year of Birth |
Position(s)
with Funds |
Term
of Office and Length of Time Served |
Principal
Occupation(s) During Past 5 Years |
Number
of Portfolios in Fund Complex Overseen by Trustee† |
Other
Directorships Held by Trustee During the Past 5 Years | |||||
| Trustees | ||||||||||
| Independent Trustees | ||||||||||
| DWIGHT
D. CHURCHILL c/o SSGA Active Trust One Iron Street Boston, MA 02210 1953 |
Independent
Trustee, Audit Committee Chair |
Term:
Unlimited Served: since March 2011 |
Self-employed
consultant since 2010; CEO and President, CFA Institute (June 2014 - January 2015). |
126 | Affiliated Managers Group, Inc. (Chairman, Director and Audit Committee Chair). | |||||
| CLARE
S. RICHER c/o SSGA Active Trust One Iron Street Boston, MA 02210 1958 |
Independent
Trustee |
Term:
Unlimited Served: since July 2018 |
Retired.
Chief Financial Officer, Putnam Investments LLC (December 2008 - May 2017). |
126 | Principal
Financial Group (Director); Bain Capital Specialty Finance (Director); Putnam Acquisition Financing Inc. (Director); Putnam Acquisition Financing LLC (Director); Putnam GP Inc. (Director); Putnam Investor Services, Inc. (Director); University of Notre Dame (Trustee). |
| Name,
Address and Year of Birth |
Position(s)
with Funds |
Term
of Office and Length of Time Served |
Principal
Occupation(s) During Past 5 Years |
Number
of Portfolios in Fund Complex Overseen by Trustee† |
Other
Directorships Held by Trustee During the Past 5 Years | |||||
| SANDRA
G. SPONEM c/o SSGA Active Trust One Iron Street Boston, MA 02210 1958 |
Independent
Trustee |
Term:
Unlimited Served: since July 2018 |
Retired.
Chief Financial Officer, M.A. Mortenson Companies, Inc. (February 2007- April 2017). |
126 | Rydex
Series Funds (Trustee); Rydex Dynamic Funds (Trustee); Rydex Variable Trust (Trustee); Guggenheim Funds Trust (Trustee); Guggenheim Variable Funds Trust (Trustee); Guggenheim Strategy Funds Trust (Trustee); Transparent Value Trust (Trustee); Fiduciary/Claymore Energy Infrastructure Fund (Trustee); Guggenheim Taxable Municipal Managed Duration Trust (Trustee); Guggenheim Strategic Opportunities Fund (Trustee); Guggenheim Enhanced, Equity Income Fund (Trustee); Guggenheim Credit Allocation Fund (Trustee); Guggenheim Energy & Income Fund (Trustee). | |||||
| CARL
G. VERBONCOEUR c/o SSGA Active Trust One Iron Street Boston, MA 02210 1952 |
Independent
Trustee, Trustee Committee Chair |
Term:
Unlimited Served: since March 2011 |
Self-employed
consultant since 2009. |
126 | The
Motley Fool Funds Trust (Trustee). |
| Name,
Address and Year of Birth |
Position(s)
with Funds |
Term
of Office and Length of Time Served |
Principal
Occupation(s) During Past 5 Years |
Number
of Portfolios in Fund Complex Overseen by Trustee† |
Other
Directorships Held by Trustee During the Past 5 Years | |||||
| Interested Trustee | ||||||||||
| JAMES
E. ROSS* c/o SSGA Active Trust One Iron Street Boston, MA 02210 1965 |
Interested
Trustee |
Term:
Unlimited Served as Trustee: since March 2011 |
Non-Executive
Chairman, Fusion Acquisition Corp. (June 2020 - Present); Retired Chairman and Director, SSGA Funds Management, Inc. (2005 - March 2020); Retired Executive Vice President, State Street Global Advisors (2012 - March 2020); Retired Chief Executive Officer and Manager, State Street Global Advisors Funds Distributors, LLC (May 2017 - March 2020); Director, State Street Global Markets, LLC (2013 - April 2017); President, SSGA Funds Management, Inc. (2005 - 2012); Principal, State Street Global Advisors (2000 - 2005). |
137 | SSGA SPDR
ETFs Europe I plc (Director) (November 2016 - March 2020); SSGA SPDR ETFs Europe II plc (Director) (November 2016 - March 2020); State Street Navigator Securities Lending Trust (July 2016 - March 2020); SSGA Funds (January 2014 - March 2020); State Street Institutional Investment Trust (February 2007 - March 2020); State Street Master Funds (February 2007 - March 2020); Elfun Funds (July 2016 - December 2018). | |||||
| † For the purpose of determining the number of portfolios overseen by the Trustees, “Fund Complex” comprises registered investment companies for which SSGA Funds Management, Inc. serves as investment adviser. | ||||||||||
| * Mr. Ross is an Interested Trustee because of his former position with the Adviser and ownership interest in an affiliate of the Adviser. | ||||||||||
| Name,
Address and Year of Birth |
Position(s)
with Funds |
Term
of Office and Length of Time Served |
Principal Occupation(s) During the Past 5 Years | |||
| Officers | ||||||
| ELLEN
M. NEEDHAM SSGA Funds Management, Inc. One Iron Street Boston, MA 02210 1967 |
President | Term:
Unlimited Served: since October 2012 |
Chairman, SSGA Funds Management, Inc. (March 2020 - present)*; President and Director, SSGA Funds Management, Inc. (2001 - present)*; Senior Managing Director, State Street Global Advisors (1992 - present)*; Manager, State Street Global Advisors Funds Distributors, LLC (May 2017 - present). | |||
| BRUCE
S. ROSENBERG SSGA Funds Management, Inc. One Iron Street Boston, MA 02210 1961 |
Treasurer | Term:
Unlimited Served: since February 2016 |
Managing Director, State Street Global Advisors and SSGA Funds Management, Inc. (July 2015 - present); Director, Credit Suisse (April 2008 - July 2015). | |||
| ANN
M. CARPENTER SSGA Funds Management, Inc. One Iron Street Boston, MA 02210 1966 |
Vice
President; Deputy Treasurer |
Term:
Unlimited Served: since August 2012 (with respect to Vice President); Unlimited Served: since February 2016 (with respect to Deputy Treasurer) |
Chief Operating Officer, SSGA Funds Management, Inc. (April 2005 - Present)*; Managing Director, State Street Global Advisors (April 2005 - present).* | |||
| MICHAEL
P. RILEY SSGA Funds Management, Inc. One Iron Street Boston, MA 02210 1969 |
Vice
President |
Term:
Unlimited Served: since March 2011 |
Managing Director, State Street Global Advisors (2005 - present).* | |||
| SEAN
O’MALLEY SSGA Funds Management, Inc. One Iron Street Boston, MA 02210 1969 |
Chief
Legal Officer |
Term:
Unlimited Served: since August 2019 |
Senior Vice President and Deputy General Counsel, State Street Global Advisors (November 2013 -present). | |||
| DAVID
URMAN SSGA Funds Management, Inc. One Iron Street Boston, MA 02210 1985 |
Assistant
Secretary |
Term:
Unlimited Served: since August 2019 |
Vice President and Senior Counsel, State Street Global Advisors (April 2019 - present); Vice President and Counsel, State Street Global Advisors (August 2015 - April 2019); Associate, Ropes & Gray LLP (November 2012 - August 2015). |
| Name,
Address and Year of Birth |
Position(s)
with Funds |
Term
of Office and Length of Time Served |
Principal Occupation(s) During the Past 5 Years | |||
| DAVID
BARR SSGA Funds Management, Inc. One Iron Street Boston, MA 02210 1974 |
Assistant
Secretary |
Term:
Unlimited Served: since November 2020 |
Vice President and Senior Counsel, State Street Global Advisors (October 2019 - present); Vice President and Counsel, Eaton Vance Corp. (2010 - 2019). | |||
| CHAD
C. HALLETT SSGA Funds Management, Inc. One Iron Street Boston, MA 02210 1969 |
Deputy
Treasurer |
Term:
Unlimited Served: since February 2016 |
Vice President, State Street Global Advisors and SSGA Funds Management, Inc. (November 2014 - present); Vice President, State Street Bank and Trust Company (2001 - November 2014).* | |||
| DARLENE
ANDERSON-VASQUEZ SSGA Funds Management, Inc. One Iron Street Boston, MA 02210 1968 |
Deputy
Treasurer |
Term:
Unlimited Served: since November 2016 |
Managing Director, State Street Global Advisors and SSGA Funds Management, Inc. (May 2016 - present); Senior Vice President, John Hancock Investments (September 2007 - May 2016). | |||
| ARTHUR
A. JENSEN SSGA Funds Management, Inc. 1600 Summer Street Stamford, CT 06905 1966 |
Deputy
Treasurer |
Term:
Unlimited Served: Since August 2017 |
Vice President, State Street Global Advisors and SSGA Funds Management, Inc. (July 2016 - present); Mutual Funds Controller of GE Asset Management Incorporated (April 2011 - July 2016). | |||
| DAVID
LANCASTER SSGA Funds Management, Inc. One Iron Street Boston, MA 02210 1971 |
Assistant
Treasurer |
Term:
Unlimited Served: since November 2020 |
Vice President, State Street Global Advisors and SSGA Funds Management, Inc. (July 2017 - present); Assistant Vice President, State Street Bank and Trust Company (November 2011 - July 2017). | |||
| BRIAN
HARRIS SSGA Funds Management, Inc. One Iron Street Boston, MA 02210 1973 |
Chief
Compliance Officer; Anti-Money Laundering Officer; Code of Ethics Compliance Officer |
Term:
Unlimited Served: since November 2013 |
Managing Director, State Street Global Advisors and SSGA Funds Management, Inc. (June 2013 - present)*; Senior Vice President and Global Head of Investment Compliance, BofA Global Capital Management (2010 - 2013); Director of Compliance, AARP Financial Inc. (2008 - 2010). | |||
| * Served in various capacities and/or with various affiliated entities during noted time period. | ||||||
| The Statement of Additional Information (SAI) includes additional information about the Funds' trustees and is available, without charge, upon request and by calling 1-866-787-2257. | ||||||
(b) Not applicable.
Item 2. Code of Ethics.
As of the end of the period covered by this report, the registrant has adopted a code of ethics that applies to the registrant’s principal executive officer, principal financial officer, principal accounting officer or controller, or persons performing similar functions, regardless of whether these individuals are employed by the registrant or a third party (the “Code of Ethics”). During the period covered by this report, no substantive amendments were made to the Code of Ethics. During the period covered by this report, the registrant did not grant any waivers, including any implicit waivers, from any provision of the Code of Ethics.
The Code of Ethics is attached hereto as Exhibit 13(a)(1).
Item 3. Audit Committee Financial Expert.
(a)(1) The Board of Trustees of the registrant has determined that the registrant has four Board members serving on the Audit Committee that possess the attributes identified in Instructions 2(b) of Item 3 to Form N-CSR to qualify as an “audit committee financial expert.”
(2) Dwight Churchill, Clare Richer, Sandra Sponem and Carl Verboncoeur are the registrant’s audit committee financial experts. The Board also determined that each of the foregoing persons are not “interested person(s)” of the registrant as that term is defined in Section 2(a)(19) of the Investment Company Act of 1940, as amended (the “1940 Act”).
Item 4. Principal Accountant Fees and Services.
(a) Audit Fees.
For the fiscal years ending June 30, 2021 and June 30, 2020, the aggregate audit fees billed for professional services rendered by the principal accountant were $265,133 and $273,506, respectively. Audit fees include the performance of the annual audits and routine regulatory filings (one for each SEC registrant).
(b) Audit-Related Fees.
For the fiscal years ending June 30, 2021 and June 30, 2020, the principal accountant did not bill the registrant any fees for assurances and related services that are reasonably related to the performance of the audit of the registrant’s financial statements and are not reported under paragraph (a) of this Item.
(c) Tax Fees.
For the fiscal years ending June 30, 2021 and June 30, 2020, the aggregate tax fees billed for professional services rendered by the principal accountant were $29,725 and $138,894, respectively. Tax fees represent services related to the review of year-end distribution requirements, as well as the review and signing as preparer of all federal, state and excise income tax returns for the series of the registrant.
(d) All Other Fees.
There were no other fees billed by the principal accountant for the fiscal years ending June 30, 2021 and June 30, 2020.
(e)(1) Audit Committee Pre-Approval Policies and Procedures.
The registrant’s Audit Committee Charter states the following with respect to pre-approval procedures:
Before the independent auditors are engaged by the Trust to render audit, audit-related or permissible non-audit services, either:
| (a) | The Audit Committee shall pre-approve all audit, audit-related and permissible non-audit services provided to the Trust. The Audit Committee may delegate to one or more of its members the authority to grant pre-approvals. Any decision of any member to whom authority is delegated under this section shall be presented to the full Audit Committee at its next regularly scheduled meeting; |
| or |
| (b) | The engagement to render the audit, audit-related or permissible non-audit service is entered into pursuant to pre-approval policies and procedures established by the Audit Committee. Any such policies and procedures must (1) be detailed as to the particular service and (2) not involve any delegation of the Audit Committee’s responsibilities to the investment adviser. The Audit Committee must be informed of each service entered into pursuant to the policies and procedures. A copy of any such policies and procedures shall be attached as an exhibit to the Audit Committee Charter. |
| (c) | Pre-Approval for a service provided to the Trust other than audit or audit-related services is not required if: (1) the aggregate amount of all such permissible non-audit services provided to the Trust constitutes not more than five percent (5%) of the total amount of revenues paid by the Trust to the independent auditors during the fiscal year in which the permissible non-audit services are provided; (2) such services were not recognized by the Trust at the time of the engagement to be permissible non-audit services; and (3) such services are promptly brought to the attention of the Audit Committee and are approved by the Audit Committee or by one or more members of the Audit Committee to whom authority to grant such approvals has been delegated by the Audit Committee prior to the completion of the audit. |
| (d) | The Audit Committee shall pre-approve any permissible non-audit services proposed to be provided by the independent auditors to (a) the investment adviser and (b) any entity controlling, controlled by, or under common control with the investment adviser that provides ongoing services to the Trust, if the independent auditors’ engagement with the investment adviser or any such control persons relates directly to the operations and financial reporting of the Trust. It shall be the responsibility of the independent auditors to notify the Audit Committee of any permissible non-audit services that need to be pre-approved. |
Notwithstanding the above, Pre-Approval for any permissible non-audit services under this Sub-section is not required if: (1) the aggregate amount of all such permissible non-audit services constitutes not more than five percent (5%) of the total amount of revenues paid to the independent auditors by the Trust and any other entity that has its services approved under this Section (i.e., the investment adviser or any control person) during the fiscal year in which the permissible non-audit services are provided; (2) such services were not recognized by the Trust at the time of the engagement to be permissible non-audit services; and (3) such services are promptly
brought to the attention of the Audit Committee and are approved by the Audit Committee or by one or more members of the Audit Committee to whom authority to grant such approvals has been delegated by the Audit Committee prior to the completion of the audit.
(e)(2) Percentage of Services.
One hundred percent of the services described in each of paragraphs (b) through (d) of this Item were approved by the registrant’s Audit Committee pursuant to paragraph (c)(7)(i)(C) of Rule 2-01 of Regulation S-X.
(f) Not applicable.
(g) The aggregate non-audit fees billed for by the registrant’s accountant for services rendered to the registrant, and rendered to the registrant’s investment adviser (not including any sub-adviser whose role is primarily portfolio management and is subcontracted with or overseen by another investment adviser), and any entity controlling, controlled by, or under common control with the adviser were as follows:
| FY 2021 (in millions) |
FY 2020 (in millions) |
|||||||
| Non audit services billed to: |
||||||||
| Registrant: |
See Item 4 | (c) | See Item 4 | (c) | ||||
| Investment Adviser: |
— | — | ||||||
| Other entities in the Investment Company Complex (1)(2): |
||||||||
| Audit Related Fees |
$ | 18.4 | $ | 15.2 | ||||
| Tax Fees |
$ | 4.4 | $ | 5.8 | ||||
| All Other Fees |
$ | 14.5 | $ | 14.2 | ||||
| (1) | Information is for the calendar years 2021 and 2020, respectively. |
| (2) | Services under the caption Audit-Related Fees consisted principally of reports on the processing of transactions by servicing organizations, audits of employee benefit plan, non-statutory audits and due diligence procedures. Services under the caption Tax Fees consisted principally of expatriate, compliance and corporate tax advisory services. Services under the caption All Other Fees primarily related to statutory and financial statement audits and the requirement to opine on the design and operating effectiveness of internal control over financial reporting. |
(h) The registrant’s principal accountant notified the registrant’s Audit Committee of all non-audit services that were rendered by the principal accountant to the Adviser and any entity controlling, controlled by, or under common control with the Adviser that provides services to the registrant, which services were not required to be pre-approved pursuant to paragraph (c)(7)(ii) of Rule 2-01 of Regulation S-X, allowing the registrant’s Audit Committee to consider whether such services were compatible with maintaining the principal accountant’s independence.
Item 5. Audit Committees of Listed Registrants.
The registrant has an audit committee which was established by the Board of Trustees of the Trust in accordance with Section 3(a)(58)(A) of the Securities Exchange Act of 1934, as amended. The members of the registrant’s Audit Committee are Dwight Churchill, Clare Richer, Sandra Sponem and Carl Verboncoeur.
Item 6. Investments.
| (a) | Schedules of Investments are included as part of the report to shareholders filed under Item 1 of this Form N-CSR. |
| (b) | Not applicable to the registrant. |
Item 7. Disclosure of Proxy Voting Policies and Procedures for Closed-End Management Investment Companies.
Not applicable to the registrant.
Item 8. Portfolio Managers of Closed-End Management Investment Companies.
Not applicable to the registrant.
Item 9. Purchases of Equity Securities by Closed-End Management Investment Company and Affiliated Purchasers.
Not applicable to the registrant.
Item 10. Submission of Matters to a Vote of Security Holders.
The registrant has not adopted any material changes to the procedures by which shareholders may recommend nominees to the registrant’s Board.
Item 11. Controls and Procedures.
(a) Within 90 days of the filing date of this Form N-CSR, Ellen M. Needham, the registrant’s President and Principal Executive Officer, and Bruce S. Rosenberg, the registrant’s Treasurer and Principal Financial Officer, reviewed the registrant’s disclosure controls and procedures (as defined in Rule 30a-3(c) under the 1940 Act) and evaluated their effectiveness. Based on their review, Ms. Needham and Mr. Rosenberg determined that the disclosure controls and procedures adequately ensure that information required to be disclosed by the registrant in its periodic reports is recorded, processed, summarized and reported within the time periods required by the U.S. Securities and Exchange Commission.
(b) There were no changes in the registrant’s internal control over financial reporting (as defined in Rule 30a-3(d) under the 1940 Act) that occurred during the period covered by this report that have materially affected, or are reasonably likely to materially affect, the registrant’s internal control over financial reporting.
Item 12. Disclosure of Securities Lending Activities for Closed-End Management Investment Companies.
(a) Not applicable to the registrant.
(b) Not applicable to the registrant.
Item 13. Exhibits.
| (a)(1) |
| (a)(2) |
| (a)(3) | Not applicable to the registrant. |
| (a)(4) | Not applicable. |
| (b) |
ii
SIGNATURES
Pursuant to the requirements of the Securities Exchange Act of 1934, as amended, and the Investment Company Act of 1940, as amended, the registrant has duly caused this report to be signed on its behalf by the undersigned, thereunto duly authorized.
| SSGA Active Trust | ||
| By: | /s/ Ellen M. Needham | |
| Ellen M. Needham | ||
| President and Principal Executive Officer | ||
Date: September 8, 2021
Pursuant to the requirements of the Securities Exchange Act of 1934, as amended, and the Investment Company Act of 1940, as amended, this report has been signed below by the following persons on behalf of the registrant and in the capacities and on the dates indicated.
| By: | /s/ Ellen M. Needham | |
| Ellen M. Needham | ||
| President and Principal Executive Officer | ||
Date: September 8, 2021
| By: | /s/ Bruce S. Rosenberg | |
| Bruce S. Rosenberg | ||
| Treasurer and Principal Financial Officer | ||
Date: September 8, 2021