UNITED STATES
SECURITIES AND EXCHANGE COMMISSION
Washington, D.C. 20549
FORM N-CSR
CERTIFIED SHAREHOLDER REPORT OF REGISTERED
MANAGEMENT INVESTMENT COMPANIES
Investment Company Act file number: 811-22535
ARES DYNAMIC CREDIT ALLOCATION FUND, INC.
(Exact name of registrant as specified in charter)
2000 AVENUE OF THE STARS
12TH FLOOR
LOS ANGELES, CALIFORNIA 90067
(Address of principal executive offices)(Zip code)
| (Name and Address of Agent for Service) | Copy to: | |
| Ian Fitzgerald 2000 Avenue of the Stars, 12th Floor Los Angeles, California 90067 |
P. Jay Spinola, Esq. Willkie Farr & Gallagher LLP 787 Seventh Avenue New York, New York 10019 |
Registrant’s telephone number, including area code: (310) 201-4100
Date of fiscal year end: December 31
Date of reporting period: June 30, 2020
Item 1. Report to Stockholders.


Ares Dynamic Credit Allocation Fund, Inc.
(NYSE: ARDC)
Semi-Annual Report
June 30, 2020
Beginning on January 1, 2021, as permitted by regulations adopted by the Securities and Exchange Commission, paper copies of the Fund's annual and semi-annual shareholder reports will no longer be sent by mail, unless you specifically request paper copies of the reports from the Fund or from your financial intermediary, such as a broker-dealer or bank. Instead, the reports will be made available on a website, and you will be notified by mail each time a report is posted and provided with a website link to access the report. If you already elected to receive shareholder reports electronically, you will not be affected by this change and you need not take any action. You may elect to receive shareholder reports and other communications from the Fund or your financial intermediary electronically at any time by (i) calling 877-855-3434 toll-free or by sending an e-mail request to Ares Dynamic Credit Allocation Fund, Inc. Investor Relations Department at ARDCInvestorRelations@aresmgmt.com, if you invest directly with the Fund, or (ii) contacting your financial intermediary (such as a broker-dealer or bank), if you invest through your financial intermediary. You may elect to receive all future reports in paper free of charge. You can inform the Fund or your financial intermediary that you wish to continue receiving paper copies of your shareholder reports by (i) calling 877-855-3434 toll-free or by sending an e-mail request to Ares Dynamic Credit Allocation Fund, Inc. Investor Relations Department at ARDCInvestorRelations@aresmgmt.com, if you invest directly with the Fund, or (ii) contacting your financial intermediary. Your election to receive reports in paper will apply to all funds held in your account, if you invest through your financial intermediary, or all funds held with the fund complex if you invest directly with the Fund.
Ares Dynamic Credit Allocation Fund, Inc.
Contents
|
Letter to Shareholders |
1 |
||||||
|
Fund Profile & Financial Data |
4 |
||||||
|
Schedule of Investments |
5 |
||||||
|
Statement of Assets and Liabilities |
14 |
||||||
|
Statement of Operations |
15 |
||||||
|
Statements of Changes in Net Assets |
16 |
||||||
|
Statement of Cash Flows |
17 |
||||||
|
Financial Highlights |
18 |
||||||
|
Notes to Financial Statements |
19 |
||||||
|
Proxy & Portfolio Information |
34 |
||||||
|
Dividend Reinvestment Plan |
35 |
||||||
|
Corporate Information |
36 |
||||||
|
Privacy Notice |
37 |
||||||
|
Directors and Officers |
38 |
||||||
Semi-Annual Report 2020
Ares Dynamic Credit Allocation Fund, Inc.
Letter to Shareholders
As of June 30, 2020 (Unaudited)
Dear Shareholders,
We thank you for your support of the Ares Dynamic Credit Allocation Fund, Inc. ("ARDC" or the "Fund") and recognize the trust and confidence that you have demonstrated in Ares through your investment in ARDC.
Economic Conditions and Leveraged Finance Market Update
In the first half of 2020, the liquid credit markets experienced a broad sell off in reaction to the impact of the coronavirus (COVID-19) pandemic and then partially recovered due to central bank intervention, fiscal stimulus and prospects of reopening the economy. As cases of COVID-19 spread globally, investor sentiment deteriorated and the financial fallout of the COVID-19 pandemic escalated drastically as high yield default expectations tripled1 and credit spreads increased to levels last seen during the Global Financial Crisis. Investor sentiment was further exacerbated by the onset of the Saudi- Russian oil price war, which left investors scrambling to manage the ensuing unprecedented volatility, and March marked one the most tumultuous months in financial markets in decades. The S&P 500, high yield bond and leveraged loan indices ended the first calendar quarter with negative returns of -19.60%, -13.12%2 and -13.19%,3 respectively. As a result, the world's major central banks moved with unexpected pace to enact economic and financial stimulus plans as they effectively pledged support without limits. This included a Federal Reserve interest rate cut of 50bps to safeguard the U.S. economy from the economic damage caused by the virus.
The second calendar quarter of 2020 marked a turning point for financial markets as investor sentiment was boosted by unprecedented levels of financial stimulus being pumped into the economy, the expansion of eligibility of the Federal Reserve's credit facilities and plans to begin to reopen the global economy. Despite concerns surrounding escalating social unrest, tense U.S.-China relations and the possibility of a second wave of COVID-19 infections, credit spreads tightened across almost all liquid asset classes. Within the high yield market, the combination of robust inflows and the Federal Reserve's direct support led to material spread tightening while the market was able to digest heavy new issuance. Amid this broad-based rally, the leveraged loan market demonstrated stronger secondary market prices as well, supported by incremental demand from opportunistic institutional investors and renewed demand from CLO managers. Against this backdrop, high yield bond and leveraged loan indices posted strong returns of 9.61%2 and 9.71%,3 respectively, for the second calendar quarter, ending the first half down just -4.78%2 and -4.76%.3
CLOs exhibited many of the same trends seen in the leveraged loan market during the first half of the year. CLO prices fell materially during the peak of the market dislocation with BB-rated tranches ending the first calendar quarter down — 32.7%, according to a leading CLO data source.4 Although CLO securities generally lagged the price recovery in underlying loans, CLO spreads rallied to levels that supported new CLO formation during the second quarter,5 a positive sign of investor demand for both the CLO and leveraged loan markets. As a result, CLO prices rallied throughout the second quarter and recovered a significant portion of the first quarter valuation declines. By the end of the first half of 2020, BB- rated tranches of CLOs were down just -8.2% for the year, according to the same source.4
Looking ahead, we continue to closely monitor the pandemic and its impact on the global economy and monitor additional sources of volatility such as the upcoming U.S. presidential election. Given the uncertain backdrop, we expect volatility to persist and will continue to utilize the full depth and breadth of our platform as we seek to actively rotate exposures and generate attractive risk-adjusted returns.
Portfolio Performance and Positioning
ARDC has not been immune to the dislocation caused by the COVID-19 pandemic. Over the six months ended June 30, 2020, ARDC has generated net investment returns of -12.5% and market price-based returns of -18.3%,6 reflecting the uncertainty around economic growth and the lag in the price recovery of the CLO market discussed above. While there is no single established benchmark that reasonably compares to ARDC as a whole, ARDC's loan and high yield segments of the portfolio have outperformed their respective benchmarks by 180 bps and 9 bps, respectively, during the first half of the year.7
With respect to CLOs, we continue to actively manage our positions and remain constructive on this asset class due to its structural protections, such as overcollateralization cushions and capacity to either withstand downgrades or redirect investment cash flows to de-lever. Even though CLOs have lagged the broader loan market in the recovery, they have historically experienced fewer defaults in comparison with leveraged loans and we believe continue to have less exposure to the weakest credits than other types of loan funds.8 In addition, the reinvestment periods of many of our positions may enable us to capture incremental return. To that end, ARDC's CLO portfolio has already begun to recover, returning 32.0%
Semi-Annual Report 2020
1
Ares Dynamic Credit Allocation Fund, Inc.
Letter to Shareholders (continued)
As of June 30, 2020 (Unaudited)
over the past three months,9 which has supported the overall recovery in ARDC's net investment returns (+20.9%) and market price-based returns (+13.4%) during the second calendar quarter.
Across our portfolio, we employed a thoughtful and disciplined approach to navigating unprecedented market conditions. The share of our investments rated B, BB or BBB10 increased 240 bps to 78.6% as of June 30, 2020, and we continued to favor defensive sectors with ARDC's top three industries being information technology, healthcare and services.11 In addition, the portfolio remains well diversified across 201 issuers with an average position size of 0.50% and the largest position representing only 1.4%.12
We continue to have strong conviction in the quality of the ARDC portfolio and believe that the Fund continues to be well positioned to take advantage of buying opportunities in both the new issue and secondary markets. We continue to believe that the ability to dynamically allocate is critical to successfully navigating an evolving market environment with headline risk and interest rate driven volatility. The increasing importance of credit selection has become the primary driver of generating alpha. Looking ahead, we will remain focused on performing solid fundamental credit analysis and in-depth due diligence as we seek attractive risk adjusted returns for our investors. We thank you again for your continued support in ARDC.
Best Regards,
Ares Capital Management II LLC
Ares Dynamic Credit Allocation Fund, Inc.
ARDC is a closed-end fund that trades on the New York Stock Exchange under the symbol "ARDC" and is externally managed by Ares Capital Management II LLC (the "Adviser"), a subsidiary of Ares Management Corporation. ARDC's investment objective is to provide an attractive level of total return, primarily through current income and, secondarily, through capital appreciation by investing in a broad, dynamically-managed portfolio of (i) senior secured loans made primarily to companies whose debt is rated below investment grade; (ii) corporate bonds that are primarily high yield issues rated below investment grade; (iii) other fixed-income instruments of a similar nature that may be represented by derivatives; and (iv) securities of collateralized loan obligations (CLOs).
On November 6, 2015, the Board of Directors (the "Board") of ARDC authorized the repurchase of shares of common stock of the Fund (the "Common Shares") on the open market when the Common Shares are trading on the New York Stock Exchange at a discount of 10% or more (or such other percentage as the Board may determine from time to time) from the net asset value ("NAV") of the Common Shares. The Fund may repurchase its outstanding Common Shares in open-market transactions at the Fund management's discretion. The Fund is not required to effect share repurchases. Any future purchases of Common Shares may not materially impact the discount of the market price of the Common Shares relative to their NAV and any narrowing of this discount that does result may not be maintained. Since the inception of the program through June 30, 2020, we have repurchased 566,217 shares at an average price of $13.17, representing an average discount of -15.3%.
Thank you again for your continued support of ARDC. If you have any questions about the Fund, please call 1-877-855-3434, or visit the Fund's website at www.arespublicfunds.com.
Note: The opinions of the Adviser expressed herein are subject to change without notice. Information contained herein has been obtained from sources believed to be reliable, but is not guaranteed. This information should not be considered investment advice or an offer of any security for sale. This material may contain "forward-looking" information that is not purely historical in nature. No representations are made as to the accuracy of such information or that such information will be realized. Actual events or conditions are unlikely to be consistent with, and may differ materially from, those assumed. Past performance is not indicative of future results. Ares does not undertake any obligation to publicly update or review any forward-looking information, whether as a result of new information, future developments or otherwise, except as required by law.
The recent outbreak of a novel and highly contagious form of coronavirus ("COVID-19"), which the World Health Organization has declared to constitute a pandemic, has resulted in numerous deaths, adversely impacted global commercial activity and contributed to significant volatility in certain equity and debt markets. The global impact of the outbreak is rapidly evolving, and many countries have reacted by instituting quarantines, prohibitions on travel and the closure of offices, businesses, schools, retail stores and other public venues. Businesses are also implementing similar precautionary measures. Such measures, as well as the general uncertainty surrounding the dangers and impact of COVID- 19, are creating significant disruption in supply chains and economic activity and are having a particularly adverse impact on energy, transportation, hospitality, tourism, entertainment and other industries. The impact of COVID-19 has led to significant volatility and declines in the global financial markets and oil prices and it is uncertain how long this volatility will continue. As COVID-19 continues to spread, the potential impacts, including a global, regional or other economic recession, are increasingly uncertain and difficult to assess. Any public health emergency, including any outbreak of COVID-19 or other existing or new epidemic diseases, or the threat thereof, and the resulting financial and economic market uncertainty could have a significant adverse impact on the Fund, the value of its investments and its portfolio companies. The performance and portfolio company information herein is as of June 30, 2020, and the effects, directly and indirectly, resulting from COVID-19 are not reflected in such information.
Semi-Annual Report 2020
2
Ares Dynamic Credit Allocation Fund, Inc.
Letter to Shareholders (continued)
As of June 30, 2020 (Unaudited)
Indices are provided for illustrative purposes only and not indicative of any investment. They have not been selected to represent appropriate benchmarks or targets for ARDC. Rather, the indices shown are provided solely to illustrate the performance of well-known and widely recognized indices. Any comparisons herein of the investment performance of ARDC to an index are qualified as follows: (i) the volatility of such index will likely be materially different from that of ARDC; (ii) such index will, in many cases, employ different investment guidelines and criteria than ARDC and, therefore, holdings in ARDC will differ significantly from holdings of the securities that comprise such index and ARDC may invest in different asset classes altogether from the illustrative index, which may materially impact the performance of ARDC relative to the index; and (iii) the performance of such index is disclosed solely to allow for comparison on ARDC's performance to that of a well-known index. Comparisons to indices have limitations because indices have risk profiles, volatility, asset composition and other material characteristics that will differ from ARDC. The indices do not reflect the deduction of fees or expenses. You cannot invest directly in an index. No representation is being made as to the risk profile of any benchmark or index relative to the risk profile of ARDC. There can be no assurance that the future performance of any specific investment, or product will be profitable, equal any corresponding indicated historical performance, or be suitable for a portfolio.
This may contain information sourced from Bank of America, used with permission. Bank of America's Global Research division's fixed income index platform is licensing the ICE BofA Indices and related data "as is," makes no warranties regarding same, does not guarantee the suitability, quality, accuracy, timeliness, and/or completeness of the ICE BofA Indices or any data included in, related to, or derived therefrom, assumes no liability in connection with their use and does not sponsor, endorse, or recommend Ares Management, or any of its products or services.
The ICE BofA US High Yield Index ("H0A0") tracks the performance of US dollar denominated below investment grade corporate debt publicly issued in the US domestic market. Qualifying securities must have a below investment grade rating (based on an average of Moody's, S&P and Fitch), at least 18 months to final maturity at the time of issuance, at least one- year remaining term to final maturity as of the rebalancing date, a fixed coupon schedule and a minimum amount outstanding of $100 million. Index constituents are capitalization-weighted based on their current amount outstanding times the market price plus accrued interest. Accrued interest is calculated assuming next-day settlement. Cash flows from bond payments that are received during the month are retained in the index until the end of the month and then are removed as part of the rebalancing. Cash does not earn any reinvestment income while it is held in the index. The index is rebalanced on the last calendar day of the month, based on information available up to and including the third business day before the last business day of the month. No changes are made to constituent holdings other than on month end rebalancing dates. Inception date: August 31, 1986.
The Credit Suisse Leveraged Loan Index ("CSLLI") is designed to mirror the investable universe of the $US-denominated leveraged loan market. The index inception is January 1992. The index frequency is daily, weekly and monthly. New loans are added to the index on their effective date if they qualify according to the following criteria: 1) loan facilities must be rated "5B" or lower; 2) only fully-funded term loan facilities are included; 3) the tenor must be at least one year; and 4) issuers must be domiciled in developed countries.
REF: TC- 01650
1 S&P Global Ratings Research, March 20, 2020.
2 ICE BofA High Yield Master II Index as of March 31, 2020 or June 30, 2020 as noted.
3 Credit Suisse Leveraged Loan Index as of March 31, 2020 or June 30, 2020 as noted.
4 J.P. Morgan, CLOIE Monitor, as of March 31, 2020 or June 30, 2020 as noted.
5 Wells Fargo, CLO Monthly Market Overview, as of June 30, 2020.
6 Past performance is not indicative of future results. Index provided for comparison purposes only.
7 Reflects the gross unlevered returns of ARDC's respective loan and high yield portfolios in comparison with the Credit Suisse Leveraged Loan Index and ICE BofA High Yield Master II Index.
8 Based on information from Ares INsight database, S&P LCD and Ares market observations as of June 9, 2020.
9 Reflects the gross unlevered returns of ARDC's CLO portfolio.
10 Based on S&P and/or Moody's rating. Credit quality is an assessment of the credit worthiness of an issuer of a security. AAA is the highest rating, meaning the obligor's capacity to meet its financial commitments is strong. As ratings decrease, the obligor is considered more speculative by market participants. Credit ratings apply only to the bonds and preferred securities in the portfolio and not to the shares of the fund which are not rated and will fluctuate in value.
11 Based on Credit Suisse industry classifications.
12 Diversification does not assure profit or protect against loss.
Semi-Annual Report 2020
3
Ares Dynamic Credit Allocation Fund, Inc.
Fund Profile & Financial Data
June 30, 2020 (Unaudited)
Portfolio Characteristics as of 6.30.20
|
Weighted Average Floating Coupon1 |
5.57 |
% |
|||||
|
Weighted Average Bond Coupon2 |
7.56 |
% |
|||||
|
Current Distribution Rate3 |
9.81 |
% |
|||||
|
Monthly Dividend Per Share4 |
$ |
0.0975 |
|||||
1 The weighted-average gross interest rate on the pool of loans as of June 30, 2020.
2 The weighted-average gross interest rate on the pool of bonds at the time the securities were issued.
3 Dividend per share annualized and divided by the June 30, 2020 market price per share. The distribution rate alone is not indicative of Fund performance.
4 Represents the Fund's June 2020 dividend of $0.0975 per share, which was comprised of net investment income. To the extent that any portion of the current distributions were estimated to be sourced from something other than income, such as return of capital, the source would have been disclosed in a Section 19(a) Notice located under the "Investor Documents" section of the Fund's website. Please note that distribution classifications are preliminary and certain distributions may be re-classified at year end. Please refer to year-end tax documents for the final classifications of the Fund's distributions for a given year.
Top 10 Holdings5 as of 6.30.20
|
Tegna |
1.44 |
% |
|||||
|
CenturyLink Inc |
1.42 |
% |
|||||
|
Williams Cos Inc/The |
1.33 |
% |
|||||
|
NRG Energy Inc |
1.30 |
% |
|||||
|
Iceland Topco Ltd |
1.29 |
% |
|||||
|
EchoStar Corp |
1.27 |
% |
|||||
|
Avantor, Inc. |
1.21 |
% |
|||||
|
Numericable |
1.19 |
% |
|||||
|
Eldorado Resorts |
1.16 |
% |
|||||
|
Altice USA |
1.16 |
% |
|||||
5 Market value percentage may represent multiple instruments by the named issuer and/or multiple issuers being consolidated to the extent they are owned by the same parent company. These values may be different than the issuer concentrations in certain regulatory filings.
Performance as of 6.30.20
|
Market |
NAV |
||||||||||
| 1 Month |
2.19 |
% |
6.43 |
% |
|||||||
|
Year to Date |
-18.33 |
% |
-12.50 |
% |
|||||||
|
3 Years (annualized) |
-1.96 |
% |
0.17 |
% |
|||||||
|
5 Years (annualized) |
3.75 |
% |
3.13 |
% |
|||||||
|
Since Inception** |
1.54 |
% |
3.66 |
% |
|||||||
*Since Inception of fund (11/27/2012) and annualized. Source: Ares
Performance data quoted represents past performance, which is no guarantee of future results, and current performance may be lower or higher than the figures shown. The NAV total return takes into account the Fund's total annual expenses and does not reflect transaction charges. If transaction charges were reflected, NAV total return would be reduced. Since Inception returns assume a purchase of common shares at the initial offering price of $20.00 per share for market price returns or initial net asset value (NAV) of $19.10 per share for NAV returns. Returns for periods of less than one year are not annualized. All distributions are assumed to be reinvested either in accordance with the dividend reinvestment plan (DRIP) for market price returns or NAV for NAV returns.
Portfolio Composition as of 6.30.20
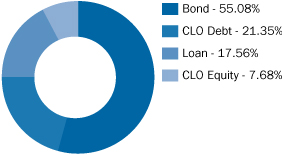
This data is subject to change on a daily basis. As of 6.30.20, the Fund held a negative traded cash balance of -1.67%.
Fixed vs. Floating Rate as of 6.30.20
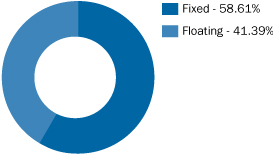
Excludes Equity and CLO Equity
Industry Allocation6 as of 6.30.20
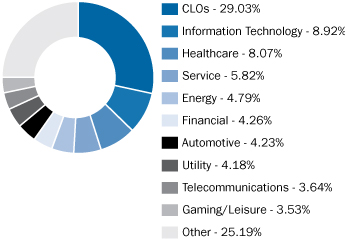
6 Credit Suisse industry classifications weighted by market value. These values may be different than industry classifications in certain regulatory filings.
Semi-Annual Report 2020
4
Ares Dynamic Credit Allocation Fund, Inc.
Schedule of Investments
June 30, 2020 (Unaudited)
Senior Loans 24.6%(b)(c)(d)
|
Principal Amount |
Value(a) |
||||||||||
|
Aerospace & Defense 0.5% |
|||||||||||
|
JetBlue Airways Corp., 1st Lien Term Loan, 3M LIBOR + 5.25%, 6.25%, 06/17/2024 |
$ |
1,599,634 |
$ |
1,563,643 |
|||||||
|
Automotive 0.3% |
|||||||||||
|
Navistar, Inc., Tranche 1st Lien Term Loan B, 1M LIBOR + 3.50%, 3.70%, 11/06/2024 |
1,000,000 |
944,580 |
|||||||||
|
Banking, Finance, Insurance & Real Estate 3.6% |
|||||||||||
|
Asurion, LLC, 2nd Lien Term Loan B-2, 1M LIBOR + 6.50%, 6.68%, 08/04/2025(e) |
4,499,695 |
4,465,948 |
|||||||||
|
Boels Rental Ltd., EUR 1st Lien Term Loan B, (Netherlands), 02/09/2027(e) |
€ |
2,205,882 |
2,377,535 |
||||||||
|
Financiere CEP, 1st Lien Term Loan, (France), 06/03/2027(e) |
2,250,000 |
2,480,368 |
|||||||||
|
GBT U.S., LLC, 1st Lien Delayed Draw Term Loan, 02/27/2027(e)(f) |
$ |
1,196,357 |
1,076,721 |
||||||||
|
GBT U.S., LLC, 1st Lien Term Loan, 02/27/2027(e)(f) |
1,428,659 |
1,285,793 |
|||||||||
|
11,686,365 |
|||||||||||
|
Chemicals, Plastics & Rubber 0.6% |
|||||||||||
|
DCG Acquisition Corp., Initial 1st Lien Term Loan, 1M LIBOR + 4.50%, 4.69%, 09/30/2026(f) |
2,123,738 |
1,890,127 |
|||||||||
|
Consumer Goods: Durable 1.2% |
|||||||||||
|
AI Aqua Merger Sub, Inc., 1st Lien 5th Amendment Incremental Term Loan, 3M LIBOR + 4.25%, 5.34%, 12/13/2023(f) |
1,990,000 |
1,940,250 |
|||||||||
|
Kronos Acquisition Intermediate, Inc., Initial 1st Lien Term Loan, 1M LIBOR + 4.00%, 5.00%, 05/15/2023(e) |
2,250,000 |
2,137,792 |
|||||||||
|
4,078,042 |
|||||||||||
|
Healthcare & Pharmaceuticals 4.4% |
|||||||||||
|
Albany Molecular Research, Inc., 2nd Lien Term Loan, 3M LIBOR + 7.00%, 8.00%, 08/30/2025 |
1,000,000 |
950,500 |
|||||||||
|
Albany Molecular Research, Inc., Initial 1st Lien Term Loan, 3M LIBOR + 3.25%, 4.25%, 08/30/2024(e) |
999,172 |
963,702 |
|||||||||
|
Cambrex Corp., Initial 1st Lien Term Loan, 1M LIBOR + 5.00%, 6.00%, 12/04/2026(f) |
3,980,000 |
3,900,400 |
|||||||||
Senior Loans(b)(c)(d) (continued)
|
Principal Amount |
Value(a) |
||||||||||
|
CPI Holdco, LLC, 1st Lien Term Loan, 1M LIBOR + 4.25%, 4.43%, 11/04/2026 |
$ |
1,317,123 |
$ |
1,264,438 |
|||||||
|
Hanger, Inc., 1st Lien Term Loan, 1M LIBOR + 3.50%, 3.68%, 03/06/2025 |
1,803,041 |
1,715,900 |
|||||||||
|
Ortho-Clinical Diagnostics, Inc., 1st Lien Term Loan B, 1M LIBOR + 3.25%, 3.43%, 06/30/2025 |
1,978,397 |
1,846,101 |
|||||||||
|
Sotera Health Holdings, LLC, Initial 1st Lien Term Loan, 1M LIBOR + 4.50%, 5.50%, 12/11/2026 |
3,990,000 |
3,889,412 |
|||||||||
|
14,530,453 |
|||||||||||
|
High Tech Industries 4.5% |
|||||||||||
|
Applied Systems, Inc., 2nd Lien Term Loan, 3M LIBOR + 7.00%, 8.00%, 09/19/2025 |
2,500,000 |
2,487,500 |
|||||||||
|
eResearch Technology, Inc., Initial 1st Lien Term Loan, 1M LIBOR + 4.50%, 5.50%, 02/04/2027 |
3,084,839 |
3,016,201 |
|||||||||
|
GlobalFoundries, Inc., Initial 1st Lien Term Loan, 3M LIBOR + 4.75%, 5.06%, 06/05/2026(f) |
1,550,107 |
1,488,103 |
|||||||||
|
Huskies Parent, Inc., 1st Lien Closing Date Term Loan, 1M LIBOR + 4.00%, 4.18%, 07/31/2026(f) |
2,034,820 |
1,983,949 |
|||||||||
|
Hyland Software, Inc., 2nd Lien Term Loan, 1M LIBOR + 7.00%, 7.75%, 07/07/2025 |
1,750,000 |
1,720,828 |
|||||||||
|
Informatica, LLC, Initial 2nd Lien Term Loan, 7.13%, 02/25/2025 |
1,290,878 |
1,289,264 |
|||||||||
|
MA FinanceCo., LLC, Tranche 1st Lien Term Loan B-4, 3M LIBOR + 4.25%, 5.25%, 06/05/2025 |
1,660,000 |
1,615,728 |
|||||||||
|
Sophia, LP, 1st Lien Term Loan B, 3M LIBOR + 3.25%, 4.25%, 09/30/2022 |
1,000,000 |
975,000 |
|||||||||
|
14,576,573 |
|||||||||||
|
Hotel, Gaming & Leisure 0.7% |
|||||||||||
|
Equinox Holdings, Inc., 1st Lien Term Loan B-2, 3M LIBOR + 9.00%, 10.00%, 03/08/2024(f) |
2,500,000 |
2,462,500 |
|||||||||
|
Media: Diversified & Production 0.6% |
|||||||||||
|
Formula One Management, Ltd., Facility 1st Lien Term Loan B-3, (Great Britain), 1M LIBOR + 2.50%, 3.50%, 02/01/2024 |
2,000,000 |
1,898,760 |
|||||||||
Semi-Annual Report 2020
5
Ares Dynamic Credit Allocation Fund, Inc.
Schedule of Investments (continued)
June 30, 2020 (Unaudited)
Senior Loans(b)(c)(d) (continued)
|
Principal Amount |
Value(a) |
||||||||||
|
Retail 0.6% |
|||||||||||
|
Bass Pro Group, LLC, 1st Lien Term Loan B, 6M LIBOR + 5.00%, 6.07%, 09/25/2024(e) |
$ |
590 |
$ |
571 |
|||||||
|
GOBP Holdings, Inc., 1st Lien Term Loan, 6M LIBOR + 2.75%, 3.74%, 10/22/2025 |
2,000,000 |
1,917,500 |
|||||||||
|
1,918,071 |
|||||||||||
|
Services: Business 2.7% |
|||||||||||
|
AVSC Holding Corp., Initial 2nd Lien Term Loan, 6M LIBOR + 7.25%, 8.25%, 09/01/2025 |
1,250,000 |
746,875 |
|||||||||
|
Casmar Holdings, Ltd., Initial 1st Lien Term Loan, (Australia), 3M LIBOR + 4.50%, 5.50%, 12/20/2023 |
3,342,921 |
2,340,044 |
|||||||||
|
Dun & Bradstreet Corp., Initial 1st Lien Term Loan, 1M LIBOR + 4.00%, 4.18%, 02/06/2026 |
1,995,000 |
1,940,137 |
|||||||||
|
Kronos, Inc., Initial 2nd Lien Term Loan, 1M LIBOR + 8.25%, 9.25%, 11/01/2024 |
1,525,000 |
1,524,055 |
|||||||||
|
Packers Holdings, LLC, Initial 1st Lien Term Loan, 1M LIBOR + 3.00%, 4.00%, 12/04/2024 |
2,386,076 |
2,279,896 |
|||||||||
|
8,831,007 |
|||||||||||
|
Services: Consumer 3.7% |
|||||||||||
|
Diebold Nixdorf, Inc., 1st Lien Term Loan A-1, 1M LIBOR + 9.25%, 9.44%, 08/31/2022 |
4,111,390 |
4,080,555 |
|||||||||
|
Gems Menasas Cayman, Ltd., Facility 1st Lien Term Loan B, (Cayman Islands), 6M LIBOR + 5.00%, 6.00%, 07/31/2026 |
2,861,091 |
2,700,154 |
|||||||||
|
Learning Care Group (US) No. 2 Inc., 1st Lien Term Loan B, 6M LIBOR + 3.25%, 4.25%, 03/13/2025 |
1,994,898 |
1,746,154 |
|||||||||
|
St. George's University Scholastic Services, LLC, 1st Lien Term Loan, 1M LIBOR + 3.25%, 3.43%, 07/17/2025(f) |
3,541,619 |
3,417,662 |
|||||||||
|
11,944,525 |
|||||||||||
|
Transportation: Consumer 0.4% |
|||||||||||
|
Mileage Plus Holdings, LLC, Term Loan B, 3M LIBOR + 5.25%, 6.25%, 06/25/2027 |
1,452,327 |
1,440,825 |
|||||||||
Senior Loans(b)(c)(d) (continued)
|
Principal Amount |
Value(a) |
||||||||||
|
Utilities: Electric 0.8% |
|||||||||||
|
PG&E Corporation, 1st Lien Term Loan, 3M LIBOR + 4.50%, 5.50%, 06/23/2025 |
$ |
2,750,000 |
$ |
2,698,437 |
|||||||
|
Total Senior Loans (Cost: $82,776,539) |
80,463,908 |
||||||||||
Corporate Bonds 75.3%
|
Aerospace & Defense 3.3% |
|||||||||||
|
Bombardier, Inc., (Canada), 8.75%, 12/01/2021(d) |
2,000,000 |
1,625,000 |
|||||||||
|
Howmet Aerospace, Inc., 6.88%, 05/01/2025 |
2,000,000 |
2,169,722 |
|||||||||
|
Leidos, Inc. (fka Leidos Innovations Corp.), 7.13%, 07/01/2032 |
2,500,000 |
3,155,650 |
|||||||||
|
TransDigm, Inc., 8.00%, 12/15/2025(d) |
3,500,000 |
3,678,465 |
|||||||||
|
10,628,837 |
|||||||||||
|
Automotive 4.5% |
|||||||||||
|
Clarios Global, LP, 8.50%, 05/15/2027(d) |
1,375,000 |
1,381,806 |
|||||||||
|
Clarios Global, LP, (Canada), 6.75%, 05/15/2025(d) |
668,000 |
694,720 |
|||||||||
|
Dana, Inc., 5.38%, 11/15/2027 |
525,000 |
524,008 |
|||||||||
|
Dana, Inc., 5.63%, 06/15/2028 |
725,000 |
719,707 |
|||||||||
|
Fiat Chrysler Automobiles N.V., 4.50%, 07/07/2028(f)(g) |
€ |
500,000 |
564,534 |
||||||||
|
Ford Motor Co., 8.50%, 04/21/2023 |
$ |
1,920,000 |
2,030,400 |
||||||||
|
Ford Motor Co., 9.00%, 04/22/2025 |
1,625,000 |
1,758,575 |
|||||||||
|
Goodyear Tire & Rubber Co. (The), 8.75%, 08/15/2020 |
2,522,000 |
2,536,628 |
|||||||||
|
Meritor, Inc., 6.25%, 06/01/2025(d) |
2,500,000 |
2,525,000 |
|||||||||
|
Navistar International Corp., 9.50%, 05/01/2025(d) |
1,750,000 |
1,875,212 |
|||||||||
|
14,610,590 |
|||||||||||
|
Banking, Finance, Insurance & Real Estate 4.3% |
|||||||||||
|
Acrisure, LLC, 10.13%, 08/01/2026(d) |
1,023,000 |
1,099,725 |
|||||||||
|
Acrisure, LLC, 8.13%, 02/15/2024(d) |
750,000 |
779,775 |
|||||||||
|
Ford Motor Credit Co, LLC, 5.13%, 06/16/2025 |
2,025,000 |
2,025,810 |
|||||||||
|
HAT Holdings I, LLC, 6.00%, 04/15/2025(d) |
2,500,000 |
2,618,750 |
|||||||||
|
NFP Corp., 7.00%, 05/15/2025(d) |
1,366,000 |
1,434,300 |
|||||||||
Semi-Annual Report 2020
6
Ares Dynamic Credit Allocation Fund, Inc.
Schedule of Investments (continued)
June 30, 2020 (Unaudited)
Corporate Bonds (continued)
|
Principal Amount |
Value(a) |
||||||||||
|
NMI Holdings, Inc., 7.38%, 06/01/2025(d) |
$ |
1,140,000 |
$ |
1,192,873 |
|||||||
|
Refinitiv U.S. Holdings, Inc., 8.25%, 11/15/2026(d) |
4,500,000 |
4,873,365 |
|||||||||
|
14,024,598 |
|||||||||||
|
Beverage, Food & Tobacco 2.1% |
|||||||||||
|
Albertsons Cos, Inc., 6.63%, 06/15/2024 |
2,000,000 |
2,050,000 |
|||||||||
|
Chobani, LLC, 7.50%, 04/15/2025(d) |
1,000,000 |
965,000 |
|||||||||
|
IRB Holding Corp., 7.00%, 06/15/2025(d) |
3,742,000 |
3,856,879 |
|||||||||
|
6,871,879 |
|||||||||||
|
Capital Equipment 2.7% |
|||||||||||
|
Avantor, Inc., 9.00%, 10/01/2025(d) |
5,000,000 |
5,375,000 |
|||||||||
|
Clark Equipment Co., 5.88%, 06/01/2025(d) |
2,205,000 |
2,254,613 |
|||||||||
|
Vertical Holdco GmbH, (Germany), 7.63%, 07/15/2028(d)(g) |
650,000 |
650,000 |
|||||||||
|
Vertical U.S. Newco, Inc., 5.25%, 07/15/2027(d)(g) |
667,000 |
667,000 |
|||||||||
|
8,946,613 |
|||||||||||
|
Chemicals, Plastics & Rubber 4.8% |
|||||||||||
|
Aruba Investments, Inc., 8.75%, 02/15/2023(d) |
3,750,000 |
3,768,750 |
|||||||||
|
Blue Cube Spinco, Inc., 9.75%, 10/15/2023 |
4,750,000 |
4,892,500 |
|||||||||
|
OCI NV, (Netherlands), 5.25%, 11/01/2024(d) |
2,000,000 |
1,920,000 |
|||||||||
|
Trident TPI Holdings, Inc., 9.25%, 08/01/2024(d) |
2,500,000 |
2,562,500 |
|||||||||
|
Tronox, Inc., 6.50%, 05/01/2025(d) |
1,747,000 |
1,764,470 |
|||||||||
|
Tronox, Inc., 6.50%, 04/15/2026(d) |
1,000,000 |
935,000 |
|||||||||
|
15,843,220 |
|||||||||||
|
Construction & Building 1.5% |
|||||||||||
|
PowerTeam Services, LLC, 9.03%, 12/04/2025(d) |
4,770,000 |
4,865,400 |
|||||||||
|
Consumer Goods: Durable 1.9% |
|||||||||||
|
CD&R Smokey Buyer, Inc., 6.75%, 07/15/2025(d)(g) |
2,500,000 |
2,599,250 |
|||||||||
|
Core & Main Holdings, LP, 8.63%, 09/15/2024(d) |
2,500,000 |
2,504,000 |
|||||||||
Corporate Bonds (continued)
|
Principal Amount |
Value(a) |
||||||||||
|
Kronos Acquisition Holdings, Inc., 9.00%, 08/15/2023(d) |
$ |
1,250,000 |
$ |
1,190,625 |
|||||||
|
6,293,875 |
|||||||||||
|
Consumer Goods: Non-Durable 2.1% |
|||||||||||
|
Adient US, LLC, 9.00%, 04/15/2025(d) |
1,175,000 |
1,265,710 |
|||||||||
|
Iceland Bondco, PLC, (Great Britain), 4.63%, 03/15/2025(d) |
£ |
2,000,000 |
2,209,835 |
||||||||
|
Iceland Bondco, PLC, (Great Britain), 6.75%, 07/15/2024(d) |
3,000,000 |
3,529,735 |
|||||||||
|
7,005,280 |
|||||||||||
|
Containers, Packaging & Glass 2.9% |
|||||||||||
|
Boise Cascade Co., 5.63%, 09/01/2024(d) |
$ |
1,750,000 |
1,763,125 |
||||||||
|
Crown Cork & Seal Co., Inc., 7.38%, 12/15/2026 |
4,350,000 |
5,089,500 |
|||||||||
|
Owens-Brockway Glass Container, Inc., 6.38%, 08/15/2025(d) |
1,750,000 |
1,850,625 |
|||||||||
|
Owens-Brockway Glass Container, Inc., 6.63%, 05/13/2027(d) |
672,000 |
698,880 |
|||||||||
|
9,402,130 |
|||||||||||
|
Energy: Electricity 0.7% |
|||||||||||
|
Enviva Partners, LP, 6.50%, 01/15/2026(d)(g) |
2,140,000 |
2,225,600 |
|||||||||
|
Energy: Oil & Gas 5.8% |
|||||||||||
|
Comstock Resources, Inc., 9.75%, 08/15/2026 |
500,000 |
466,250 |
|||||||||
|
EQT Corp., 7.00%, 02/01/2030 |
4,000,000 |
4,120,120 |
|||||||||
|
EQT Midstream Partners, LP, 6.00%, 07/01/2025(d) |
1,250,000 |
1,266,150 |
|||||||||
|
EQT Midstream Partners, LP, 6.50%, 07/01/2027(d) |
1,250,000 |
1,280,275 |
|||||||||
|
Exterran Energy Solutions, LP, 8.13%, 05/01/2025 |
3,000,000 |
2,482,500 |
|||||||||
|
Hilcorp Energy I, LP, 6.25%, 11/01/2028(d) |
1,200,000 |
963,000 |
|||||||||
|
Laredo Petroleum, Inc., 9.50%, 01/15/2025 |
2,500,000 |
1,728,125 |
|||||||||
|
Laredo Petroleum, Inc., 10.13%, 01/15/2028 |
1,250,000 |
862,500 |
|||||||||
|
Williams Cos., Inc., 8.75%, 03/15/2032 |
4,000,000 |
5,931,393 |
|||||||||
|
19,100,313 |
|||||||||||
Semi-Annual Report 2020
7
Ares Dynamic Credit Allocation Fund, Inc.
Schedule of Investments (continued)
June 30, 2020 (Unaudited)
Corporate Bonds (continued)
|
Principal Amount |
Value(a) |
||||||||||
|
Environmental Industries 2.1% |
|||||||||||
|
Core & Main, LP, 6.13%, 08/15/2025(d) |
$ |
1,000,000 |
$ |
996,650 |
|||||||
|
Covanta Holding Corp., 5.88%, 03/01/2024 |
1,000,000 |
1,008,750 |
|||||||||
|
Covanta Holding Corp., 5.88%, 07/01/2025 |
1,328,000 |
1,344,600 |
|||||||||
|
Covanta Holding Corp., 6.00%, 01/01/2027 |
925,000 |
936,655 |
|||||||||
|
GFL Environmental, Inc., (Canada), 8.50%, 05/01/2027(d) |
2,374,000 |
2,581,725 |
|||||||||
|
6,868,380 |
|||||||||||
|
Healthcare & Pharmaceuticals 4.0% |
|||||||||||
|
Bausch Health Cos., Inc., (Canada), 7.00%, 03/15/2024(d) |
2,250,000 |
2,334,375 |
|||||||||
|
Centene Corp., 5.25%, 04/01/2025(d) |
1,000,000 |
1,029,670 |
|||||||||
|
HCA, Inc., 7.69%, 06/15/2025 |
3,500,000 |
3,990,000 |
|||||||||
|
Immucor, Inc., 11.13%, 02/15/2022(d) |
3,000,000 |
2,677,500 |
|||||||||
|
Ortho-Clinical Diagnostics, Inc., 7.38%, 06/01/2025(d) |
1,250,000 |
1,271,875 |
|||||||||
|
RegionalCare Hospital Partners Holdings, Inc., 9.75%, 12/01/2026(d) |
1,633,000 |
1,681,990 |
|||||||||
|
12,985,410 |
|||||||||||
|
High Tech Industries 4.2% |
|||||||||||
|
Dell International, LLC, 6.02%, 06/15/2026(d) |
2,350,000 |
2,694,217 |
|||||||||
|
Dell International, LLC, 6.10%, 07/15/2027(d) |
1,500,000 |
1,732,881 |
|||||||||
|
Genesys Telecommunications Laboratories, Inc., 10.00%, 11/30/2024(d) |
4,000,000 |
4,160,000 |
|||||||||
|
Sophia, LP, 9.00%, 09/30/2023(d) |
2,250,000 |
2,272,500 |
|||||||||
|
Uber Technologies, Inc., 7.50%, 05/15/2025(d) |
3,000,000 |
3,022,500 |
|||||||||
|
13,882,098 |
|||||||||||
|
Hotel, Gaming & Leisure 4.0% |
|||||||||||
|
Colt Merger Sub, Inc., 6.25%, 07/01/2025(d)(g) |
2,500,000 |
2,484,375 |
|||||||||
|
Colt Merger Sub, Inc., 8.13%, 07/01/2027(d)(g) |
1,275,000 |
1,231,969 |
|||||||||
|
Eldorado Resorts, Inc., 7.00%, 08/01/2023 |
5,000,000 |
5,162,500 |
|||||||||
Corporate Bonds (continued)
|
Principal Amount |
Value(a) |
||||||||||
|
Golden Nugget, Inc., 8.75%, 10/01/2025(d)(f) |
$ |
1,500,000 |
$ |
877,500 |
|||||||
|
MGM Resorts International, 6.75%, 05/01/2025 |
3,000,000 |
2,970,240 |
|||||||||
|
MGM Resorts International, 7.75%, 03/15/2022 |
500,000 |
510,000 |
|||||||||
|
13,236,584 |
|||||||||||
|
Media: Broadcasting & Subscription 7.4% |
|||||||||||
|
Belo Corp., 7.25%, 09/15/2027 |
6,000,000 |
6,390,000 |
|||||||||
|
CSC Holdings, LLC, 7.50%, 04/01/2028(d) |
1,750,000 |
1,909,687 |
|||||||||
|
CSC Holdings, LLC, 10.88%, 10/15/2025(d) |
3,010,000 |
3,235,750 |
|||||||||
|
Cumulus Media New Holdings, Inc., 6.75%, 07/01/2026(d) |
1,316,000 |
1,215,655 |
|||||||||
|
Diamond Sports Group, LLC, 6.63%, 08/15/2027(d) |
2,973,000 |
1,583,123 |
|||||||||
|
Gray Television, Inc., 7.00%, 05/15/2027(d) |
2,000,000 |
2,050,000 |
|||||||||
|
Hughes Satellite Systems Corp., 7.63%, 06/15/2021 |
5,500,000 |
5,665,000 |
|||||||||
|
Quebecor Media, Inc., (Canada), 5.75%, 01/15/2023 |
2,000,000 |
2,095,000 |
|||||||||
|
24,144,215 |
|||||||||||
|
Metals & Mining 0.2% |
|||||||||||
|
Constellium SE, (France), 5.63%, 06/15/2028(d) |
597,000 |
585,060 |
|||||||||
|
Retail 2.4% |
|||||||||||
|
Burlington Coat Factory Warehouse Corp., 6.25%, 04/15/2025(d) |
1,778,000 |
1,858,010 |
|||||||||
|
L Brands, Inc., 5.63%, 02/15/2022 |
350,000 |
342,125 |
|||||||||
|
L Brands, Inc., 6.88%, 07/01/2025(d) |
1,250,000 |
1,290,625 |
|||||||||
|
L Brands, Inc., 9.38%, 07/01/2025(d) |
2,000,000 |
2,002,400 |
|||||||||
|
PetSmart, Inc., 7.13%, 03/15/2023(d) |
2,500,000 |
2,464,700 |
|||||||||
|
7,957,860 |
|||||||||||
|
Services: Business 2.2% |
|||||||||||
|
Aramark Services, Inc., 6.38%, 05/01/2025(d) |
1,500,000 |
1,548,945 |
|||||||||
|
Iron Mountain, Inc., 5.25%, 07/15/2030(d) |
2,000,000 |
1,970,000 |
|||||||||
Semi-Annual Report 2020
8
Ares Dynamic Credit Allocation Fund, Inc.
Schedule of Investments (continued)
June 30, 2020 (Unaudited)
Corporate Bonds (continued)
|
Principal Amount |
Value(a) |
||||||||||
|
Iron Mountain, Inc., 5.63%, 07/15/2032(d) |
$ |
1,500,000 |
$ |
1,496,850 |
|||||||
|
Solera, LLC, 10.50%, 03/01/2024(d) |
2,000,000 |
2,035,000 |
|||||||||
|
7,050,795 |
|||||||||||
|
Services: Consumer 1.0% |
|||||||||||
|
Dole Food Co., Inc., 7.25%, 06/15/2025(d) |
2,250,000 |
2,154,375 |
|||||||||
|
Gems Menasa Cayman, Ltd., (Cayman Islands), 7.13%, 07/31/2026(d) |
1,000,000 |
950,000 |
|||||||||
|
3,104,375 |
|||||||||||
|
Telecommunications 5.5% |
|||||||||||
|
Altice Financing S.A., (Luxembourg), 7.50%, 05/15/2026(d) |
500,000 |
523,750 |
|||||||||
|
Altice Finco S.A., (Luxembourg), 7.63%, 02/15/2025(d) |
500,000 |
519,065 |
|||||||||
|
Altice France Holding S.A., (Luxembourg), 10.50%, 05/15/2027(d) |
1,000,000 |
1,101,550 |
|||||||||
|
Altice France S.A., (France), 7.38%, 05/01/2026(d) |
3,235,000 |
3,373,458 |
|||||||||
|
Altice France S.A., (France), 8.13%, 02/01/2027(d) |
769,000 |
841,094 |
|||||||||
|
Embarq Corp., 8.00%, 06/01/2036 |
4,000,000 |
4,492,000 |
|||||||||
|
Qwest Corp., 6.75%, 12/01/2021 |
1,750,000 |
1,849,411 |
|||||||||
|
Sprint Corp., 7.63%, 03/01/2026 |
1,425,000 |
1,682,027 |
|||||||||
|
T-Mobile USA, Inc., 6.38%, 03/01/2025 |
1,885,000 |
1,936,838 |
|||||||||
|
T-Mobile USA, Inc., 6.50%, 01/15/2026 |
1,500,000 |
1,567,665 |
|||||||||
|
17,886,858 |
|||||||||||
|
Transportation: Cargo 2.0% |
|||||||||||
|
Watco Cos., LLC, 6.50%, 06/15/2027(d) |
3,280,000 |
3,360,622 |
|||||||||
|
XPO Logistics, Inc., 6.25%, 05/01/2025(d) |
500,000 |
523,750 |
|||||||||
|
XPO Logistics, Inc., 6.75%, 08/15/2024(d) |
2,500,000 |
2,619,000 |
|||||||||
|
6,503,372 |
|||||||||||
|
Transportation: Consumer 1.0% |
|||||||||||
|
Delta Air Lines, Inc., 7.00%, 05/01/2025(d) |
2,250,000 |
2,322,603 |
|||||||||
Corporate Bonds (continued)
|
Principal Amount |
Value(a) |
||||||||||
|
Mileage Plus Holdings, LLC, 6.50%, 06/20/2027(d)(g) |
$ |
1,053,000 |
$ |
1,055,633 |
|||||||
|
3,378,236 |
|||||||||||
|
Utilities: Electric 2.7% |
|||||||||||
|
NRG Energy, Inc., 7.25%, 05/15/2026 |
5,500,000 |
5,802,500 |
|||||||||
|
NSG Holdings, LLC, 7.75%, 12/15/2025(d) |
2,503,568 |
2,528,604 |
|||||||||
|
PG&E Corp., 5.25%, 07/01/2030 |
335,000 |
336,909 |
|||||||||
|
8,668,013 |
|||||||||||
|
Total Corporate Bonds (Cost: $245,309,892) |
246,069,591 |
||||||||||
Collateralized Loan Obligations 39.5%(d)(f)
|
Collateralized Loan Obligations — Debt 29.1%(c) |
|||||||||||
|
AMMC CLO XI, Ltd., (Cayman Islands), 3M LIBOR + 5.80%, 6.56%, 04/30/2031 |
2,000,000 |
1,567,716 |
|||||||||
|
AMMC CLO XI, Ltd., (Cayman Islands), 3M LIBOR + 7.95%, 8.71%, 04/30/2031 |
500,000 |
304,147 |
|||||||||
|
AMMC CLO XIV, Ltd., (Cayman Islands), 3M LIBOR + 7.35%, 8.34%, 07/25/2029 |
1,250,000 |
1,101,543 |
|||||||||
|
AMMC CLO XXII, Ltd., (Cayman Islands), 3M LIBOR + 5.50%, 6.49%, 04/25/2031 |
3,000,000 |
2,519,628 |
|||||||||
|
Apidos CLO XX, Ltd., (Cayman Islands), 3M LIBOR + 8.70%, 9.88%, 07/16/2031 |
850,000 |
545,813 |
|||||||||
|
Atlas Senior Loan Fund VII, Ltd., (Cayman Islands), 3M LIBOR + 8.05%, 8.42%, 11/27/2031 |
1,587,540 |
794,276 |
|||||||||
|
Bain Capital Credit CLO 2020-1, (Cayman Islands), 3M LIBOR + 8.25%, 9.52%, 04/18/2033 |
3,000,000 |
2,939,106 |
|||||||||
|
Bain Capital Credit CLO, Ltd. 2016-2, (Cayman Islands), 3M LIBOR + 7.04%, 8.26%, 01/15/2029 |
2,000,000 |
1,679,334 |
|||||||||
|
Canyon Capital CLO, Ltd. 2018-1, (Cayman Islands), 3M LIBOR + 5.75%, 6.97%, 07/15/2031 |
750,000 |
607,500 |
|||||||||
|
Carlyle Global Market Strategies CLO, Ltd. 2017-1, (Cayman Islands), 3M LIBOR + 6.00%, 7.14%, 04/20/2031 |
3,000,000 |
2,346,735 |
|||||||||
Semi-Annual Report 2020
9
Ares Dynamic Credit Allocation Fund, Inc.
Schedule of Investments (continued)
June 30, 2020 (Unaudited)
Collateralized Loan Obligations(d)(f) (continued)
|
Principal Amount |
Value(a) |
||||||||||
|
CBAM, Ltd. 2017-3, (Cayman Islands), 3M LIBOR + 6.50%, 7.64%, 10/17/2029 |
$ |
1,615,385 |
$ |
1,409,767 |
|||||||
|
Cedar Funding CLO VIII, Ltd., (Cayman Islands), 3M LIBOR + 6.35%, 7.49%, 10/17/2030 |
2,000,000 |
1,755,942 |
|||||||||
|
CIFC Funding 2015-2A, Ltd., (Cayman Islands), 3M LIBOR + 6.81%, 8.03%, 04/15/2030 |
1,500,000 |
1,393,866 |
|||||||||
|
Crestline Denali CLO XIV, Ltd., (Cayman Islands), 3M LIBOR + 6.35%, 7.39%, 10/23/2031 |
2,000,000 |
1,415,584 |
|||||||||
|
Crestline Denali CLO XV, Ltd., (Cayman Islands), 3M LIBOR + 7.35%, 8.49%, 04/20/2030 |
3,875,000 |
2,758,182 |
|||||||||
|
Denali Capital CLO XII, Ltd., (Cayman Islands), 3M LIBOR + 5.90%, 7.12%, 04/15/2031 |
5,000,000 |
3,448,285 |
|||||||||
|
Dryden 26 Senior Loan Fund, (Cayman Islands), 3M LIBOR + 5.54%, 6.76%, 04/15/2029 |
2,000,000 |
1,720,000 |
|||||||||
|
Dryden 40 Senior Loan Fund, (Cayman Islands), 3M LIBOR + 5.75%, 6.14%, 08/15/2031 |
3,000,000 |
2,584,146 |
|||||||||
|
Dryden 45 Senior Loan Fund, (Cayman Islands), 3M LIBOR + 5.85%, 7.07%, 10/15/2030 |
3,000,000 |
2,551,647 |
|||||||||
|
Dryden 68 Senior Loan Fund, (Cayman Islands), 3M LIBOR + 6.75%, 7.97%, 07/15/2032 |
1,250,000 |
1,126,183 |
|||||||||
|
Highbridge Loan Management, Ltd. 2013-2, (Cayman Islands), 3M LIBOR + 8.25%, 9.39%, 10/20/2029 |
2,306,639 |
1,466,130 |
|||||||||
|
Highbridge Loan Management, Ltd. 2014-4, (Cayman Islands), 3M LIBOR + 7.36%, 8.25%, 01/28/2030 |
2,046,286 |
1,301,194 |
|||||||||
|
ICG U.S. CLO, Ltd. 2018-2, (Cayman Islands), 3M LIBOR + 5.75%, 6.85%, 07/22/2031 |
1,200,000 |
947,015 |
|||||||||
|
INGIM, Ltd. 2013-3, (Cayman Islands), 3M LIBOR + 5.90%, 7.04%, 10/18/2031 |
2,750,000 |
2,132,779 |
|||||||||
|
KKR CLO 15, Ltd., (Cayman Islands), 3M LIBOR + 6.44%, 7.58%, 01/18/2032 |
3,000,000 |
2,296,470 |
|||||||||
|
LCM 30, Ltd., (Cayman Islands), 3M LIBOR + 6.95%, 8.09%, 04/20/2031 |
1,200,000 |
1,126,393 |
|||||||||
Collateralized Loan Obligations(d)(f) (continued)
|
Principal Amount |
Value(a) |
||||||||||
|
LCM XVII, LP, (Cayman Islands), 3M LIBOR + 6.00%, 7.22%, 10/15/2031 |
$ |
3,750,000 |
$ |
2,872,616 |
|||||||
|
LCM XXIII, LP, (Cayman Islands), 3M LIBOR + 7.05%, 8.19%, 10/20/2029 |
3,000,000 |
2,371,629 |
|||||||||
|
Madison Park Funding XIV, Ltd., (Cayman Islands), 3M LIBOR + 7.77%, 8.87%, 10/22/2030 |
2,500,000 |
1,528,877 |
|||||||||
|
Madison Park Funding XXVI, Ltd., (Cayman Islands), 3M LIBOR + 6.50%, 7.34%, 07/29/2030 |
1,500,000 |
1,364,984 |
|||||||||
|
Madison Park Funding XXXII, Ltd., (Cayman Islands), 3M LIBOR + 7.10%, 8.20%, 01/22/2031 |
3,000,000 |
2,855,130 |
|||||||||
|
Mariner CLO, LLC 2019 1A, (Cayman Islands), 3M LIBOR + 6.89%, 7.65%, 04/30/2032 |
1,000,000 |
938,303 |
|||||||||
|
Northwoods Capital XII-B, Ltd., (Cayman Islands), 3M LIBOR + 5.79%, 6.10%, 06/15/2031 |
2,000,000 |
1,291,680 |
|||||||||
|
Oaktree CLO, Ltd. 2014-1, (Cayman Islands), 3M LIBOR + 6.30%, 6.73%, 05/13/2029 |
5,100,091 |
3,556,604 |
|||||||||
|
Oaktree CLO, Ltd. 2019-2, (Cayman Islands), 3M LIBOR + 6.77%, 7.99%, 04/15/2031 |
2,000,000 |
1,426,022 |
|||||||||
|
Oaktree CLO, Ltd. 2019-4, (Cayman Islands), 3M LIBOR + 7.23%, 8.37%, 10/20/2032 |
1,500,000 |
1,406,807 |
|||||||||
|
OHA Credit Partners VII, Ltd., (Cayman Islands), 3M LIBOR + 7.50%, 7.88%, 11/20/2027 |
2,850,000 |
2,817,678 |
|||||||||
|
OHA Credit Partners XI, Ltd., (Cayman Islands), 3M LIBOR + 7.90%, 9.04%, 01/20/2032 |
2,750,000 |
1,805,059 |
|||||||||
|
OHA Credit Partners XII, Ltd., (Cayman Islands), 3M LIBOR + 5.45%, 6.49%, 07/23/2030 |
1,500,000 |
1,286,094 |
|||||||||
|
OZLM XI, Ltd. 2015-11A, (Cayman Islands), 3M LIBOR + 7.00%, 7.76%, 10/30/2030 |
2,750,000 |
2,349,333 |
|||||||||
|
Silver Creek CLO, Ltd., (Cayman Islands), 3M LIBOR + 6.40%, 7.54%, 07/20/2030 |
1,000,000 |
866,569 |
|||||||||
|
Steele Creek CLO, Ltd. 2015-1, (Cayman Islands), 3M LIBOR + 8.85%, 9.22%, 05/21/2029 |
3,000,000 |
1,729,881 |
|||||||||
Semi-Annual Report 2020
10
Ares Dynamic Credit Allocation Fund, Inc.
Schedule of Investments (continued)
June 30, 2020 (Unaudited)
Collateralized Loan Obligations(d)(f) (continued)
|
Principal Amount |
Value(a) |
||||||||||
|
Steele Creek CLO, Ltd. 2016-1, (Cayman Islands), 3M LIBOR + 5.75%, 6.06%, 06/15/2031 |
$ |
3,000,000 |
$ |
2,010,474 |
|||||||
|
TCI-Flatiron CLO, Ltd. 2018-1, (Cayman Islands), 3M LIBOR + 6.60%, 7.44%, 01/29/2032 |
3,000,000 |
2,771,757 |
|||||||||
|
TCI-Symphony CLO, Ltd. 2017-1, (Cayman Islands), 3M LIBOR + 6.45%, 7.67%, 07/15/2030 |
2,100,000 |
1,922,008 |
|||||||||
|
Venture XXIV CLO, Ltd., (Cayman Islands), 3M LIBOR + 6.72%, 7.86%, 10/20/2028 |
700,000 |
559,806 |
|||||||||
|
Venture XXVI CLO, Ltd., (Cayman Islands), 3M LIBOR + 6.80%, 7.94%, 01/20/2029 |
1,000,000 |
683,363 |
|||||||||
|
Venture XXVII CLO, Ltd., (Cayman Islands), 3M LIBOR + 6.35%, 7.49%, 07/20/2030 |
2,025,000 |
1,613,903 |
|||||||||
|
Venture XXVIII CLO, Ltd., (Cayman Islands), 3M LIBOR + 6.16%, 7.30%, 10/20/2029 |
4,000,000 |
3,252,480 |
|||||||||
|
Venture XXXVI CLO, Ltd., (Cayman Islands), 3M LIBOR + 6.92%, 8.06%, 04/20/2032 |
2,000,000 |
1,539,754 |
|||||||||
|
Vibrant CLO X, Ltd., (Cayman Islands), 3M LIBOR + 6.19%, 7.33%, 10/20/2031 |
3,000,000 |
2,297,856 |
|||||||||
|
Voya CLO, Ltd. 2015-3, (Cayman Islands), 3M LIBOR + 6.20%, 7.34%, 10/20/2031 |
3,000,000 |
2,447,541 |
|||||||||
|
Wellfleet CLO, Ltd. 2017-2, (Cayman Islands), 3M LIBOR + 6.75%, 7.89%, 10/20/2029 |
2,000,000 |
1,610,060 |
|||||||||
|
95,015,649 |
|||||||||||
|
Collateralized Loan Obligations — Equity 10.4% |
|||||||||||
|
Allegro CLO, Ltd. 2017-1A, (Cayman Islands), 1.15%, 10/16/2030 |
2,000,000 |
963,556 |
|||||||||
|
Allegro CLO, Ltd. 2018-2A, (Cayman Islands), 15.50%, 07/15/2031 |
3,500,000 |
2,067,142 |
|||||||||
|
AMMC CLO XXI, Ltd., (Cayman Islands), 6.55%, 11/02/2030 |
500,000 |
276,595 |
|||||||||
|
Atlas Senior Loan Fund I, Ltd., (Cayman Islands), 6.76%, 11/17/2027 |
1,800,000 |
221,632 |
|||||||||
|
Canyon Capital CLO, Ltd. 2019-1, (Cayman Islands), 10.83%, 04/15/2032 |
1,000,000 |
625,775 |
|||||||||
Collateralized Loan Obligations(d)(f) (continued)
|
Principal Amount |
Value(a) |
||||||||||
|
Carlyle Global Market Strategies CLO, Ltd. 2013-4, (Cayman Islands), 18.29%, 01/15/2031 |
$ |
1,259,000 |
$ |
424,526 |
|||||||
|
Carlyle Global Market Strategies CLO, Ltd. 2017-3, (Cayman Islands), 2.49%, 07/20/2029 |
1,750,000 |
393,507 |
|||||||||
|
Carlyle Global Market Strategies CLO, Ltd. 2018-3, (Cayman Islands), 13.43%, 10/15/2030 |
3,222,500 |
1,573,276 |
|||||||||
|
Cedar Funding CLO IV, Ltd., (Cayman Islands), 28.14%, 07/23/2030 |
2,500,000 |
1,260,940 |
|||||||||
|
Cedar Funding CLO V, Ltd., (Cayman Islands), 15.33%, 07/17/2031 |
2,546,000 |
1,553,620 |
|||||||||
|
Cedar Funding CLO VI, Ltd., (Cayman Islands), 24.27%, 10/20/2028 |
2,000,000 |
1,117,198 |
|||||||||
|
Cedar Funding CLO VIII, Ltd., (Cayman Islands), 12.84%, 10/17/2030 |
2,000,000 |
1,034,670 |
|||||||||
|
Crestline Denali CLO XVI, Ltd., (Cayman Islands), 12.27%, 01/20/2030 |
2,000,000 |
1,055,032 |
|||||||||
|
Dryden 57 Senior Loan Fund, (Cayman Islands), 15.92%, 05/15/2031 |
573,500 |
426,272 |
|||||||||
|
Eaton Vance CLO 2018-1, Ltd., (Cayman Islands), 13.92%, 10/15/2030 |
2,430,000 |
1,406,571 |
|||||||||
|
Halcyon Loan Advisors Funding, Ltd. 2017-1, (Cayman Islands), 7.27%, 06/25/2029 |
1,750,000 |
537,201 |
|||||||||
|
ICG U.S. CLO, Ltd. 2018-2, (Cayman Islands), 25.06%, 07/22/2031 |
3,500,000 |
2,598,953 |
|||||||||
|
LCM XIII, LP, (Cayman Islands), 16.39%, 07/19/2027 |
2,175,000 |
425,882 |
|||||||||
|
LCM XV, LP, (Cayman Islands), 27.59%, 07/20/2030 |
5,875,000 |
1,280,538 |
|||||||||
|
LCM XXIII, LP, (Cayman Islands), 13.18%, 10/20/2029 |
3,100,000 |
904,304 |
|||||||||
|
Madison Park Funding XII, Ltd., (Cayman Islands), 07/20/2026 |
4,000,000 |
632,412 |
|||||||||
|
Madison Park Funding XXXI, Ltd., (Cayman Islands), 15.62%, 01/23/2048 |
2,000,000 |
1,345,942 |
|||||||||
|
Mariner CLO, Ltd. 2018-5A, (Cayman Islands), 14.72%, 04/25/2031 |
2,567,500 |
1,617,746 |
|||||||||
Semi-Annual Report 2020
11
Ares Dynamic Credit Allocation Fund, Inc.
Schedule of Investments (continued)
June 30, 2020 (Unaudited)
Collateralized Loan Obligations(d)(f) (continued)
|
Principal Amount |
Value(a) |
||||||||||
|
Oaktree CLO, Ltd. 2015-1, (Cayman Islands), 11.61%, 10/20/2027 |
$ |
4,000,000 |
$ |
1,193,448 |
|||||||
|
Oaktree CLO, Ltd. 2018-1, (Cayman Islands), 5.62%, 10/20/2030 |
4,250,000 |
2,782,313 |
|||||||||
|
OHA Credit Partners VII, Ltd., (Cayman Islands), 7.42%, 11/20/2027 |
2,000,000 |
505,828 |
|||||||||
|
OZLM XIX, Ltd. 2017-19A, (Cayman Islands), 10.71%, 11/22/2030 |
2,440,000 |
1,009,199 |
|||||||||
|
OZLM XXI, Ltd. 2017-21A, (Cayman Islands), 12.00%, 01/20/2031 |
1,750,000 |
887,938 |
|||||||||
|
Venture XXX CLO, Ltd., (Cayman Islands), 16.63%, 01/15/2031 |
2,100,000 |
1,113,918 |
|||||||||
|
Vibrant CLO VI, Ltd., (Cayman Islands), 7.92%, 06/20/2029 |
1,500,000 |
463,022 |
|||||||||
|
Voya CLO, Ltd. 2017-2, (Cayman Islands), 8.76%, 06/07/2030 |
1,000,000 |
418,765 |
|||||||||
|
Wellfleet CLO, Ltd. 2018-3, (Cayman Islands), 20.92%, 01/20/2032 |
3,000,000 |
1,926,840 |
|||||||||
|
West CLO, Ltd. 2013-1, (Cayman Islands), 11/07/2025 |
500,000 |
25,766 |
|||||||||
|
34,070,327 |
|||||||||||
|
Total Collateralized Loan Obligations (Cost: $171,071,935) |
129,085,976 |
||||||||||
Common Stock 0.0%(d)(f)(h)(i)
|
Shares |
Value(a) |
||||||||||
|
Energy: Oil & Gas 0.0% |
|||||||||||
|
TE Holdcorp, LLC, Class A Common Equity |
145,457 |
$ |
— |
||||||||
|
Total Common Stocks (Cost: $5,396,473) |
— |
||||||||||
Preferred Stocks 0.0%(d)(f)(h)(i)
|
Energy: Oil & Gas 0.0% |
|||||||||||
|
TE Holdcorp, LLC, Class A Preferred Equity |
254,588 |
— |
|||||||||
|
Total Preferred Stocks (Cost: $2,210,246) |
— |
||||||||||
Warrants 0.0%(d)(f)(h)(i)
|
Media: Advertising, Printing & Publishing 0.0% |
|||||||||||
|
Affinion Holdings, (Common) |
7,874 |
— |
|||||||||
|
Total Warrants (Cost: $3,922,355) |
— |
||||||||||
|
Total Investments — 139.4% (Cost: $510,687,440) |
$ |
455,619,475 |
|||||||||
|
Liabilities in Excess of Other Assets — (39.4%) |
(128,706,725 |
) |
|||||||||
|
Net Assets — 100.0% |
$ |
326,912,750 |
|||||||||
Semi-Annual Report 2020
12
Ares Dynamic Credit Allocation Fund, Inc.
Schedule of Investments (continued)
June 30, 2020 (Unaudited)
Footnotes:
(a) Investment holdings in foreign currencies are converted to U.S. Dollars using period end spot rates. All investments are in United States enterprises unless otherwise noted.
(b) Variable rate loans bear interest at a rate that may be determined by reference to the London Interbank Offered Rate ("LIBOR"). Stated interest rates in this schedule represents the "all-in" rate as of June 30, 2020.
(c) Variable rate coupon rate shown as of June 30, 2020.
(d) All of Ares Dynamic Credit Allocation Fund, Inc. (the "Fund") Senior Loans, Collateralized Loan Obligations, Common Stock, Preferred Stocks, Warrants and Corporate Bonds exempt from registration under Rule 144A, which as of June 30, 2020 represented 111.5% of the Fund's net assets or 75.4% of the Fund's total assets, are subject to legal restrictions on sales.
(e) This loan or a portion of this loan represents an unsettled loan purchase. The interest rate will be determined at the time of settlement and will be based upon a spread plus the applicable reference rate determined at the time of purchase.
(f) Investments whose values were determined using significant unobservable inputs (Level 3) (See Note 3 of the Notes to Financial Statements).
(g) When-Issued or delayed delivery security based on typical market settlement convention for such security.
(h) Security valued at fair value using methods determined in good faith by or under the direction of the board of trustees.
(i) Non-income producing security as of June 30, 2020.
As of June 30, 2020, the aggregate cost of securities for Federal income tax purposes was $511,166,694. Unrealized appreciation and depreciation on investments for Federal income tax purposes are as follows:
|
Gross unrealized appreciation |
$ |
6,520,217 |
|||||
|
Gross unrealized depreciation |
(62,067,436 |
) |
|||||
|
Net unrealized depreciation |
$ |
(55,547,219 |
) |
||||
Abbreviations:
144A Certain conditions for public sale may exist. Unless otherwise noted, these securities are deemed to be liquid.
CLO Collateralized Loan Obligation
Currencies:
€ Euro Currency
£ British Pounds
$ U.S. Dollars
Semi-Annual Report 2020
13
Ares Dynamic Credit Allocation Fund, Inc.
Statement of Assets and Liabilities
June 30, 2020 (Unaudited)
|
Assets: |
|||||||
|
Investments, at value (cost $510,687,440) |
$455,619,475 |
||||||
|
Cash |
1,345,580 |
||||||
|
Cash denominated in foreign currency, at value (cost $5,400,996) |
5,444,878 |
||||||
|
Receivable for securities sold |
14,910,257 |
||||||
|
Interest and principal receivable |
5,817,090 |
||||||
|
Deferred debt issuance costs |
266,642 |
||||||
|
Other assets |
110,906 |
||||||
|
Total assets |
483,514,828 |
||||||
|
Liabilities: |
|||||||
|
Line of credit outstanding |
123,491,138 |
||||||
|
Payable for securities purchased |
32,241,695 |
||||||
|
Payable for investment advisory fees |
369,260 |
||||||
|
Payable for commitment fee |
103,329 |
||||||
|
Payable for administration and transfer agent fees |
30,025 |
||||||
|
Payable for interest expense |
26,625 |
||||||
|
Payable for investor support fees |
25,459 |
||||||
|
Accrued expenses and other payables |
314,547 |
||||||
|
Total liabilities |
156,602,078 |
||||||
|
Net assets |
$ |
326,912,750 |
|||||
|
Net assets consist of: |
|||||||
|
Paid-in capital |
$444,104,685 |
||||||
|
Distributable earnings accumulated loss |
(117,191,935) |
||||||
|
Net assets |
$ |
326,912,750 |
|||||
|
Common shares: |
|||||||
|
Net assets |
$326,912,750 |
||||||
|
Shares outstanding (authorized 1 billion shares of $0.001 par value) |
22,914,939 |
||||||
|
Net asset value per share |
$14.26 |
||||||
Semi-Annual Report 2020
14
Ares Dynamic Credit Allocation Fund, Inc.
Statement of Operations
For the six months ended June 30, 2020 (Unaudited)
|
Investment income: |
|||||||
|
Interest |
$ |
19,423,895 |
|||||
|
Expenses: |
|||||||
|
Investment advisory fees (Note 6) |
2,324,582 |
||||||
|
Interest expense (Note 5) |
1,298,595 |
||||||
|
Administrative services of the adviser (Note 6) |
245,113 |
||||||
|
Legal fees |
113,007 |
||||||
|
Investor support fees (Note 6) |
163,142 |
||||||
|
Administration, custodian and transfer agent fees (Note 6) |
186,862 |
||||||
|
Insurance expense |
79,113 |
||||||
|
Amortization of debt issuance cost (Note 5) |
89,220 |
||||||
|
Audit fees |
83,814 |
||||||
|
Directors fee expense |
79,692 |
||||||
|
Commitment fee expense (Note 5) |
59,738 |
||||||
|
Printing expense |
50,645 |
||||||
|
Tax expense |
61,964 |
||||||
|
Other expenses |
67,246 |
||||||
|
Total expenses |
4,902,733 |
||||||
|
Net investment income |
14,521,162 |
||||||
|
Net realized and unrealized gain/(loss) on investments and foreign currency |
|||||||
|
Net realized loss on investments |
(23,112,378 |
) |
|||||
|
Net realized gain on foreign currency |
64,315 |
||||||
|
Net unrealized loss on investments |
(40,544,903 |
) |
|||||
|
Net unrealized loss on foreign currency |
(19,210 |
) |
|||||
|
Net realized and unrealized loss on investments and foreign currency |
(63,612,176 |
) |
|||||
|
Total decrease in net assets resulting from operations |
$ |
(49,091,014 |
) |
||||
Semi-Annual Report 2020
15
Ares Dynamic Credit Allocation Fund, Inc.
Statements of Changes in Net Assets
|
Six Months Ended June 30, 2020 (Unaudited) |
For the Period Ended December 31, 2019(a) |
For the Year Ended October 31, 2019 |
|||||||||||||
|
Increase (decrease) in net assets from operations: |
|||||||||||||||
|
Net investment income |
$ |
14,521,162 |
$ |
3,937,469 |
$ |
31,771,646 |
|||||||||
|
Net realized loss on investments and foreign currency |
(23,048,063 |
) |
(285,432 |
) |
(9,491,193 |
) |
|||||||||
|
Net unrealized gain/(loss) on investments and foreign currency |
(40,564,113 |
) |
15,089,388 |
(17,716,274 |
) |
||||||||||
|
Net increase/(decrease) from operations |
(49,091,014 |
) |
18,741,425 |
4,564,179 |
|||||||||||
|
Distributions to shareholders from (Note 2): |
|||||||||||||||
|
Distributable earnings |
(14,092,688 |
) |
(4,926,712 |
) |
(29,565,391 |
) |
|||||||||
|
Increase (decrease) in net assets from operations and distributions |
(63,183,702 |
) |
13,814,713 |
(25,001,212 |
) |
||||||||||
|
Share transactions: |
|||||||||||||||
|
Cost of shares repurchased (Note 4) |
— |
— |
(673,460 |
) |
|||||||||||
|
Net increase (decrease) from share transactions |
— |
— |
(673,460 |
) |
|||||||||||
|
Total increase (decrease) in net assets |
(63,183,702 |
) |
13,814,713 |
(25,674,672 |
) |
||||||||||
|
Net Assets, beginning of period |
390,096,452 |
376,281,739 |
401,956,411 |
||||||||||||
|
Net Assets, end of period |
$ |
326,912,750 |
$ |
390,096,452 |
$ |
376,281,739 |
|||||||||
(a) For the two month period ended December 31, 2019. See Note 1 of Notes to Financial Statements.
Semi-Annual Report 2020
16
Ares Dynamic Credit Allocation Fund, Inc.
Statement of Cash Flows
For the six months ended June 30, 2020 (Unaudited)
|
Operating Activities: |
|||||||
|
Net decrease in net assets resulting from operations |
$ |
(49,091,014 |
) |
||||
|
Adjustments to reconcile net increase in net assets resulting from operations to net cash provided by operating activities: |
|||||||
|
Purchases of investments |
(360,093,504 |
) |
|||||
|
Proceeds from the sale of investments |
392,860,273 |
||||||
|
Amortization and accretion of discounts and premiums, net |
789,897 |
||||||
|
Net realized (gain)/loss on investments |
23,112,378 |
||||||
|
Net unrealized (gain)/loss on investments |
40,544,903 |
||||||
|
Effect of exchange rate changes on line of credit |
(1,424 |
) |
|||||
|
Amortization of debt issuance cost |
(89,220 |
) |
|||||
|
Changes in operating assets and liabilities: |
|||||||
|
Receivable for securities sold |
(7,096,208 |
) |
|||||
|
Interest and principal receivable |
1,593,614 |
||||||
|
Prepaid expenses |
88,721 |
||||||
|
Payable for securities purchased |
14,423,205 |
||||||
|
Payable for investment advisory fees |
(89,026 |
) |
|||||
|
Payable for interest expense |
(299,766 |
) |
|||||
|
Payable for administration, custodian and transfer agent fees |
11,184 |
||||||
|
Payable for investor support fees |
(6,625 |
) |
|||||
|
Payable for commitment fees |
59,738 |
||||||
|
Accrued expenses and other fees |
(276,481 |
) |
|||||
|
Net cash provided by operating activities |
56,440,645 |
||||||
|
Financing Activities: |
|||||||
|
Borrowings on line of credit |
108,974,336 |
||||||
|
Paydowns on line of credit |
(148,798,093 |
) |
|||||
|
Deferred debt issuance costs |
15,937 |
||||||
|
Distributions paid to common shareholders |
(14,092,688 |
) |
|||||
|
Net cash used in financing activities |
(53,900,508 |
) |
|||||
|
Net increase in Cash |
2,540,137 |
||||||
|
Cash: |
|||||||
|
Beginning of period |
4,250,321 |
||||||
|
End of period |
$ |
6,790,458 |
|||||
|
Supplemental disclosure of cash flow information: |
|||||||
|
Cash paid for interest during the period |
$ |
1,598,361 |
|||||
Semi-Annual Report 2020
17
Ares Dynamic Credit Allocation Fund, Inc.
Financial Highlights
|
For the Six Months Ended June 30, 2020 (Unaudited) |
For the Period Ended December 31, 2019* |
For the Year Ended October 31, 2019 |
For the Year Ended October 31, 2018 |
For the Year Ended October 31, 2017 |
For the Year Ended October 31, 2016 |
For the Year Ended October 31, 2015 |
|||||||||||||||||||||||||
|
Per share data: |
|||||||||||||||||||||||||||||||
|
Net asset value, beginning of period |
$ |
17.02 |
$ |
16.42 |
$ |
17.50 |
$ |
18.00 |
$ |
17.04 |
$ |
16.95 |
$ |
18.72 |
|||||||||||||||||
|
Income from investment operations: |
|||||||||||||||||||||||||||||||
|
Net investment income |
0.64 |
0.17 |
1.39 |
1.35 |
1.33 |
1.23 |
1.21 |
||||||||||||||||||||||||
|
Net realized and change in unrealized gain (loss) |
(2.78 |
) |
0.65 |
(1.18 |
) |
(0.56 |
) |
0.87 |
0.16 |
(1.58 |
) |
||||||||||||||||||||
|
Total increase (decrease) from investment operations |
(2.14 |
) |
0.82 |
0.21 |
0.79 |
2.20 |
1.39 |
(0.37 |
) |
||||||||||||||||||||||
|
Less distributions declared to shareholders: |
|||||||||||||||||||||||||||||||
|
From net investment income |
(0.62 |
) |
(0.22 |
) |
(1.29 |
) |
(1.29 |
) |
(1.24 |
) |
(1.23 |
) |
(1.33 |
) |
|||||||||||||||||
|
From net realized gains |
— |
— |
— |
— |
— |
— |
(0.07 |
) |
|||||||||||||||||||||||
|
From return of capital |
— |
— |
— |
— |
— |
(0.07 |
) |
— |
(a) |
||||||||||||||||||||||
|
Total distributions declared to shareholders |
(0.62 |
) |
(0.22 |
) |
(1.29 |
) |
(1.29 |
) |
(1.24 |
) |
(1.30 |
) |
(1.40 |
) |
|||||||||||||||||
|
Net asset value common shares, end of period |
$ |
14.26 |
$ |
17.02 |
$ |
16.42 |
$ |
17.50 |
$ |
18.00 |
$ |
17.04 |
$ |
16.95 |
|||||||||||||||||
|
Market value common shares, end of period |
$ |
11.93 |
$ |
15.35 |
$ |
14.48 |
$ |
14.97 |
$ |
16.45 |
$ |
14.70 |
$ |
14.37 |
|||||||||||||||||
|
Net asset value total return(b) |
(12.50 |
)%(c) |
4.99 |
%(c) |
1.23 |
% |
4.47 |
% |
13.33 |
% |
8.98 |
% |
(2.11 |
)% |
|||||||||||||||||
|
Market value total return(d) |
(18.33 |
)%(c) |
7.53 |
%(c) |
5.49 |
% |
(1.43 |
)% |
20.91 |
% |
12.47 |
% |
(6.74 |
)% |
|||||||||||||||||
|
Ratios to average net assets/ supplemental data: |
|||||||||||||||||||||||||||||||
|
Net assets, end of period |
$ |
326,912,750 |
$ |
390,096,452 |
$ |
376,281,739 |
$ |
401,956,411 |
$ |
413,385,894 |
$ |
391,787,051 |
$ |
398,044,094 |
|||||||||||||||||
|
Expenses, inclusive of interest expense and amortization of debt issuance |
2.95 |
%(e) |
3.36 |
%(e) |
3.37 |
% |
3.20 |
% |
2.90 |
% |
2.96 |
% |
2.83 |
% |
|||||||||||||||||
|
Expenses, exclusive of interest expense and amortization of debt issuance |
2.12 |
%(e) |
2.20 |
%(e) |
2.03 |
% |
2.02 |
% |
2.08 |
% |
2.34 |
% |
2.39 |
% |
|||||||||||||||||
|
Net investment income |
8.75 |
%(e) |
6.15 |
%(e) |
8.16 |
% |
7.54 |
% |
7.52 |
% |
7.68 |
% |
6.51 |
% |
|||||||||||||||||
|
Portfolio turnover rate |
76.90 |
%(c) |
11.70 |
%(c) |
78.40 |
% |
82.47 |
% |
84.35 |
% |
92.30 |
% |
89.67 |
% |
|||||||||||||||||
* For the two month period ended December 31, 2019. See Note 1 of Notes to Financial Statements.
(a) Less than $0.005.
(b) Based on net asset value per share. Distributions, if any, are assumed for purposes of this calculation to be reinvested at prices obtained under the Fund's Dividend Reinvestment Plan. Total Return is not annualized for periods less than one year.
(c) Not annualized.
(d) Based on market value per share (beginning market value common shares $20.00). Distributions, if any, are assumed for purposes of this calculation to be reinvested at prices obtained under the Fund's Dividend Reinvestment Plan.
(e) Annualized.
Semi-Annual Report 2020
18
Ares Dynamic Credit Allocation Fund, Inc.
Notes to Financial Statements
June 30, 2020 (Unaudited)
(1) Organization
Ares Dynamic Credit Allocation Fund, Inc. (NYSE: ARDC) ("ARDC" or "Fund") is a corporation incorporated under the laws of the State of Maryland and registered with the U.S. Securities and Exchange Commission (the "SEC") under the Investment Company Act of 1940, as amended (the "Investment Company Act"), as a closed-end, diversified, management investment company, and intends to qualify each year to be treated as a Regulated Investment Company ("RIC"), under Subchapter M of the Internal Revenue Code of 1986, as amended ("the Code"). The Fund commenced operations on November 27, 2012. Ares Capital Management II LLC (the "Adviser") was registered as a Registered Investment Adviser with the SEC on June 9, 2011 and serves as the investment adviser to the Fund.
Investment Objective and Policies
The Fund's investment objective is to seek an attractive risk adjusted level of total return, primarily through current income and, secondarily, through capital appreciation. The Fund seeks to achieve its investment objective by investing primarily in a broad, dynamically managed portfolio of (i) senior secured loans ("Senior Loans") made primarily to companies whose debt is rated below investment grade, (ii) corporate bonds ("Corporate Bonds") that are primarily high yield issues rated below investment grade, (iii) other fixed-income instruments of a similar nature that may be represented by derivatives, and (iv) securities issued by entities commonly referred to as collateralized loan obligations ("CLOs") and other asset-backed securities. The Fund's investments in CLOs may include investments in subordinated tranches of CLO securities. The Adviser will dynamically allocate the Fund's portfolio among investments in the various targeted credit markets, to seek to manage interest rate and credit risk and the duration of the Fund's portfolio. Under normal market conditions, effective July 10, 2020, the Fund will not invest more than (i) 45% of its Managed Assets in CLOs and other asset-backed securities, or (ii) 15% of its Managed Assets in subordinated (or residual) tranches of CLO securities. Previously, the Fund will not invest more than (i) 40% of its Managed Assets in CLOs and other asset-backed securities, or (ii) 10% of its Managed Assets in subordinated (or residual) tranches of CLO securities. "Managed Assets" means the total assets of the Fund (including any assets attributable to any preferred shares that may be issued or to indebtedness) minus the Fund's liabilities other than liabilities relating to indebtedness.
Fiscal Year End Change
On September 25, 2019, the Fund's board of directors approved a change to the fiscal year end of the Fund from October 31 to December 31. Accordingly, the Fund's financial
statements and related notes include information as of and for the six months ended June 30, 2020, the two month period ended December 31, 2019 and the year ended October 31, 2019.
(2) Significant Accounting Policies
Basis of Presentation
The accompanying financial statements have been prepared on an accrual basis of accounting in conformity with U.S. generally accepted accounting principles ("GAAP"), and includes the accounts of the Fund. The Fund is an investment company following accounting and reporting guidance in Financial Accounting Standards Board ("FASB") Accounting Standards Codification ("ASC") Topic 946, Financial Services — Investment Companies. The Adviser makes estimates and assumptions that affect the reported amounts and disclosures in the financial statements. Actual results may differ from those estimates and such differences may be material.
Investments Valuation
All investments in securities are recorded at their fair value. See Note 3 for more information on the Fund's valuation process.
Interest Income
Interest income is recorded on the accrual basis to the extent that such amounts are expected to be collected and adjusted for accretion of discounts and amortization of premiums. The Fund may have investments that contain payment-in-kind ("PIK") provisions. The PIK interest, computed at the contractual rate specified, may be added to the principal balance and adjusted cost of the investments and recorded as interest income. All interest for the six months ended June 30, 2020 was recorded as cash.
Discounts and Premiums
Discounts and premiums on securities purchased are accreted/amortized over the life of the respective security using the effective interest method. The adjusted cost of investments represents the original cost adjusted for PIK interest, the accretion of discounts, and amortization of premiums.
Cash and Cash Equivalents
The Fund considers all highly liquid investments with original maturities of 90 days or less to be cash equivalents. The Fund's cash and cash equivalents are maintained with a major United States financial institution, which is a member of the Federal Deposit Insurance Corporation. While the Fund's current cash balance exceeds insurance limits, the risk of loss is remote.
Semi-Annual Report 2020
19
Ares Dynamic Credit Allocation Fund, Inc.
Notes to Financial Statements (continued)
June 30, 2020 (Unaudited)
Investment Transactions, Related Investment Income and Expenses
Investment transactions are accounted for on the trade date. Interest income, adjusted for amortization of premiums and accretion of discounts on investments, is earned from settlement date and is recorded on the accrual basis. Realized gains and losses are reported on the specific identification method. Expenses are recorded on the accrual basis as incurred.
Foreign Currency Transactions and Forward Foreign Currency Contracts
Amounts denominated in foreign currencies are translated into U.S. dollars on the following basis: (i) investments and other assets and liabilities denominated in foreign currencies are translated into U.S. dollars based upon currency exchange rates effective on the date of valuation; and (ii) purchases and sales of investments and income and expense items denominated in foreign currencies are translated into U.S. dollars based upon currency exchange rates prevailing on transaction dates.
The Fund does not isolate that portion of the results of operations resulting from the changes in foreign exchange rates on investments from fluctuations arising from changes in market prices of securities held. Such fluctuations are included within the net realized and unrealized gain (loss) on investments in the Statement of Operations.
Reported net realized foreign exchange gains or losses arise from sales of foreign currencies, currency gains or losses realized between the trade and settlement dates of securities transactions, and the difference between the amounts of income and expense items recorded on the Fund's books and the U.S. dollar equivalent of the amounts actually received or paid. Net unrealized foreign currency gains and losses arise from the changes in fair values of assets and liabilities, other than investments in securities at period end, resulting from changes in exchange rates.
Investments in foreign companies and securities of foreign governments may involve special risks and considerations not typically associated with investing in U.S. companies and securities of the U.S. government. These risks include, among other things, revaluation of currencies, less reliable information about issuers, different transaction clearance and settlement practices, and potential future adverse political and economic developments. Moreover, investments in foreign companies and securities of foreign governments and their markets may be less liquid and their prices more volatile than those of comparable U.S. companies and the U.S. government.
The Fund may enter into forward foreign currency exchange contracts for operational purposes and to protect against adverse exchange rate fluctuations. A forward foreign currency contract is an agreement between the Fund and a counterparty to buy or sell a foreign currency at a specific exchange rate on a future date. The Fund may also enter into these contracts for purposes of increasing exposure to a foreign currency or to shift exposure to foreign currency fluctuations from one currency to another. The net U.S. dollar value of foreign currency underlying all contractual commitments held by the Fund and the resulting unrealized appreciation or depreciation are determined using foreign currency exchange rates from an independent pricing service. The Fund is subject to the credit risk that the other party will not complete the obligations of the contract. The fair values of the forward foreign currency exchange contracts are obtained from an independent pricing source.
Dividends to Shareholders
The Fund intends to make regular monthly cash distributions of all or a portion of its net investment income available to common shareholders. The Fund intends to pay common shareholders at least annually all or substantially all of its net investment income. The Fund intends to pay any capital gains distributions at least annually. Dividends to shareholders are recorded on the ex-dividend date.
The distributions for any full or partial year might not be made in equal amounts, and one distribution may be larger than another. The Fund will make distributions only if authorized by its board of directors and declared by the Fund out of assets legally available for these distributions. The Fund may pay a special distribution at the end of each calendar year. This distribution policy may, under certain circumstances, have certain adverse consequences to the Fund and its shareholders because it may result in a return of capital to shareholders, which would reduce the Fund's net asset value and, over time, potentially increase the Fund's expense ratios. If the Fund distributes a return of capital, it means that the Fund is returning to shareholders a portion of their investment rather than making a distribution that is funded from the Fund's earned income or other profits. The board of directors may elect to change the Fund's distribution policy at any time.
Commitments and Contingencies
In the normal course of business, the Fund's investment activities involve executions, settlement and financing of various transactions resulting in receivables from, and payables to, brokers, dealers and the Fund's custodian. These activities may expose the Fund to risk in the event that such parties are unable to fulfill contractual obligations. Management does not anticipate any material losses from
Semi-Annual Report 2020
20
Ares Dynamic Credit Allocation Fund, Inc.
Notes to Financial Statements (continued)
June 30, 2020 (Unaudited)
counterparties with whom it conducts business. Consistent with standard business practice, the Fund enters into contracts that contain a variety of indemnifications, and is engaged from time to time in various legal actions. The maximum exposure of the Fund under these arrangements and activities is unknown. However, the Fund expects the risk of material loss to be remote.
Commitments to extend credit include loan proceeds the Fund is obligated to advance, such as delayed draws or revolving credit arrangements. Commitments generally have fixed expiration dates or other termination clauses. Unrealized gains or losses associated with unfunded commitments are recorded in the financial statements and reflected as an adjustment to the fair value of the related security in the Schedule of Investments. The par amount of the unfunded commitments is not recognized by the Fund until it becomes funded. As of June 30, 2020, there were no unfunded loan commitments.
Income Taxes
The Fund intends to distribute all or substantially all of its taxable income and to comply with the other requirements of the Code, as amended, applicable to RICs. Accordingly, no provision for U.S. federal income taxes is required.
The Fund may elect to incur an excise tax if it is deemed prudent by its board of directors from a cash management perspective or in the best interest of shareholders due to other facts and circumstances. For the six months ended June 30, 2020, the Fund incurred U.S. federal excise tax of $61,964.
As of December 31, 2019, which is the end of the Fund's taxable year, the Fund had no uncertain tax positions that would require financial statement recognition, derecognition, or disclosure. The Fund files a U.S. federal income tax return annually after its fiscal year-end, which is subject to examination by the Internal Revenue Service for a period of three years from the date of filing.
Deferred Debt Issuance Costs
Debt issuance costs are amortized over the life of the related debt instrument using the straight line method.
Recent Accounting Pronouncement
In March 2020, the Financial Accounting Standards Board ("FASB") issued Accounting Standards Update ("ASU") No. 2020-04, "Reference Rate Reform (Topic 848)," which provides optional expedients and exceptions for applying GAAP to contracts, hedging relationships, and other transactions affected by reference rate reform if certain criteria are met. The amendments apply only to contracts, hedging relationships, and other transactions that reference LIBOR or another reference rate expected to be discontinued because of
reference rate reform. ASU 2020-04 is effective for all entities as of March 12, 2020 through December 31, 2022. The expedients and exceptions provided by the amendments do not apply to contract modifications and hedging relationships entered into or evaluated after December 31, 2022, except for hedging transactions as of December 31, 2022, that an entity has elected certain optional expedients for and that are retained through the end of the hedging relationship. The Fund is currently evaluating the impact of adopting ASU 2020-04 on the Fund's consolidated financial statements.
(3) Investments
Fair Value Measurements
The Fund follows the provisions of ASC 820, Fair Value Measurements and Disclosures under U.S. GAAP, which among other matters, requires enhanced disclosures about investments that are measured and reported at fair value. This standard defines fair value and establishes a hierarchal disclosure framework, which prioritizes and ranks the level of market price observability used in measuring investments at fair value and expands disclosures about assets and liabilities measured at fair value. ASC 820 defines "fair value" as the price that would be received to sell an asset or paid to transfer a liability in an orderly transaction between market participants at the measurement date. The hierarchal disclosure framework establishes a three-tier hierarchy to maximize the use of observable data and minimize the use of unobservable inputs. Inputs refer broadly to the assumptions that market participants would use in pricing the asset or liability, including assumptions about risk, for example, the risk inherent in a particular valuation technique used to measure fair value (such as a pricing model) and/or the risk inherent in the inputs to the valuation technique.
Inputs may be observable or unobservable. Observable inputs are inputs that reflect the assumptions market participants would use in pricing the asset or liability based on market data obtained from sources independent of the reporting entity. Unobservable inputs are inputs that reflect the reporting entity's own assumptions about the assumptions market participants would use in pricing the asset or liability based on the best information available in the circumstances. The three-tier hierarchy of inputs is summarized in the three broad levels listed below.
• Level 1 — Valuations based on quoted prices in active markets for identical assets or liabilities that the Fund has the ability to access.
• Level 2 — Valuations based on quoted prices in markets that are not active or which all significant inputs are observable either directly or indirectly.
Semi-Annual Report 2020
21
Ares Dynamic Credit Allocation Fund, Inc.
Notes to Financial Statements (continued)
June 30, 2020 (Unaudited)
• Level 3 — Valuations based on inputs that are unobservable and significant to the overall fair value measurement.
In addition to using the above inputs in investment valuations, the Fund continues to employ a valuation policy that is consistent with the provisions of ASC 820. Consistent with the Fund's valuation policy, the Fund evaluates the source of inputs, including any markets in which the Fund's investments are trading (or any markets it evaluates in which securities with similar attributes are trading), in determining fair value. The Fund's valuation policy considers the fact that because there may not be a readily available market value for the investments in the Fund's portfolio, therefore, the fair value of the investments may be determined using unobservable inputs.
The investments classified as Level 1 or Level 2 are typically valued based on quoted market prices, forward foreign exchange rates, dealer quotations or alternative pricing sources supported by observable inputs. The Adviser obtains prices from independent pricing services which generally utilize broker quotes and may use various other pricing techniques which take into account appropriate factors such as yield, quality, coupon rate, maturity, type of issue, trading characteristics and other data. The Adviser is responsible for all inputs and assumptions related to the pricing of securities. The Adviser has internal controls in place that support its reliance on information received from third-party pricing sources. As part of its internal controls, the Adviser obtains, reviews, and tests information to corroborate prices received from third-party pricing sources. For any security, if market or dealer quotations are not readily available, or if the Adviser determines that a quotation of a security does not represent a fair value, then the security is valued at a fair value as determined in good faith by the Adviser and will be classified as Level 3. In such instances, the Adviser will use valuation techniques consistent with the market or income approach to measure fair value and will give consideration to all factors which might reasonably affect the fair value.
Senior loans and corporate debts: The fair value of senior loans and corporate debt is estimated based on quoted market prices, forward foreign exchange rates, dealer quotations or alternative pricing sources supported by observable inputs and are generally classified within Level 2 or 3. The Adviser obtains prices from independent pricing services which generally utilize broker quotes and may use various other pricing techniques which take into account appropriate factors such as yield, quality, coupon rate, maturity, type of issue,
trading characteristics and other data. If the pricing services are only able to obtain a single broker quote or utilize a pricing model the securities will be classified as Level 3. If the pricing services are unable to provide prices, the Adviser will attempt to obtain one or more broker quotes directly from a dealer and price such securities at the last bid price obtained; such securities are classified as Level 3.
Collateralized loan obligations: The fair value of CLOs is estimated based on various valuation models from third-party pricing services as well as internal models. The valuation models generally utilize discounted cash flows and take into consideration prepayment and loss assumptions, based on historical experience and projected performance, economic factors, the characteristics and condition of the underlying collateral, comparable yields for similar securities and recent trading activity. These securities are classified as Level 3.
Common Stocks and warrants: The fair value of common stocks and warrants are estimated using either broker quotes or an analysis of the enterprise value ("EV") of the portfolio company. Enterprise value means the entire value of the portfolio company to a market participant, including the sum of the values of debt and equity securities used to capitalize the enterprise at a point in time. The primary method for determining EV uses a multiple analysis whereby appropriate multiples are applied to the portfolio company's EBITDA (generally defined as net income before net interest expense, income tax expense, depreciation and amortization). EBITDA multiples are typically determined based upon review of market comparable transactions and publicly traded comparable companies, if any. The Fund may also employ other valuation multiples to determine EV, such as revenues. The second method for determining EV uses a discounted cash flow analysis whereby future expected cash flows of the portfolio company are discounted to determine a present value using estimated discount rates (typically a weighted average cost of capital based on costs of debt and equity consistent with current market conditions). The EV analysis is performed to determine the value of equity investments, the value of debt investments in portfolio companies where the Fund has control or could gain control through an option or warrant security, and to determine if there is credit impairment for debt investments. If debt investments are credit impaired, an EV analysis may be used to value such debt investments; however, in addition to the methods outlined above, other methods such as a liquidation or wind down analysis may be utilized to estimate enterprise value.
Semi-Annual Report 2020
22
Ares Dynamic Credit Allocation Fund, Inc.
Notes to Financial Statements (continued)
June 30, 2020 (Unaudited)
The following is a summary of inputs used as of June 30, 2020 in valuing the Fund's investments carried at fair value:
|
Level 1 — Quoted Prices ($) |
Level 2 — Other Significant Observable Inputs ($) |
Level 3 — Significant Unobservable Inputs ($) |
Total ($) |
||||||||||||||||
|
Senior Loans |
— |
61,018,403 |
19,445,505 |
80,463,908 |
|||||||||||||||
|
Corporate Bonds |
— |
244,627,557 |
1,442,034 |
246,069,591 |
|||||||||||||||
|
Collateralized Loan Obligations |
— |
— |
129,085,976 |
129,085,976 |
|||||||||||||||
|
Level 1 — Quoted Prices ($) |
Level 2 — Other Significant Observable Inputs ($) |
Level 3 — Significant Unobservable Inputs ($) |
Total ($) |
||||||||||||||||
|
Common Stocks |
— |
— |
— |
— |
|||||||||||||||
|
Preferred Stocks |
— |
— |
— |
— |
|||||||||||||||
|
Warrants |
— |
— |
— |
— |
|||||||||||||||
|
Total Investments |
— |
305,645,960 |
149,973,515 |
455,619,475 |
|||||||||||||||
The following is a reconciliation of the Fund's investments in which significant unobservable inputs (Level 3) were used in determining fair value.
For the six months ended June 30, 2020:
|
Senior Loans ($) |
Corporate Bonds ($) |
Collateralized Loan Obligations ($) |
Common Stocks ($) |
Preferred Stocks ($) |
Warrants ($) |
Total ($) |
|||||||||||||||||||||||||
|
Balance as of December 31, 2019 |
15,596,819 |
— |
179,580,301 |
— |
— |
— |
195,177,120 |
||||||||||||||||||||||||
|
Purchases(a) |
7,759,782 |
561,725 |
5,743,217 |
— |
— |
— |
14,064,724 |
||||||||||||||||||||||||
|
Sales(b) |
(9,839,566 |
) |
— |
(21,388,405 |
) |
— |
— |
— |
(31,227,971 |
) |
|||||||||||||||||||||
|
Net Realized and Unrealized Gains (Loss) |
(1,360,289 |
) |
2,809 |
(34,982,552 |
) |
— |
— |
— |
(36,340,032 |
) |
|||||||||||||||||||||
|
Accrued Discounts/ (Premiums) |
11,091 |
— |
133,415 |
— |
— |
— |
144,506 |
||||||||||||||||||||||||
|
Transfers in to Level 3 |
11,242,261 |
877,500 |
— |
— |
— |
— |
12,119,761 |
||||||||||||||||||||||||
|
Transfers out of Level 3 |
(3,964,593 |
) |
— |
— |
— |
— |
— |
(3,964,593 |
) |
||||||||||||||||||||||
|
Balance as of June 30, 2020 |
19,445,505 |
1,442,034 |
129,085,976 |
— |
— |
— |
149,973,515 |
||||||||||||||||||||||||
|
Net Change in Unrealized appreciation/(depreciation) from investments held at June 30, 2020 |
(468,938 |
) |
2,809 |
(31,015,518 |
) |
— |
— |
— |
(31,481,647 |
) |
|||||||||||||||||||||
(a) Purchases include PIK interest and securities received from restructure.
(b) Sales include principal redemptions.
Semi-Annual Report 2020
23
Ares Dynamic Credit Allocation Fund, Inc.
Notes to Financial Statements (continued)
June 30, 2020 (Unaudited)
Investments were transferred into and out of Level 3 and out of and into Level 2 during the six months ended June 30, 2020 due to changes in the quantity and quality of information obtained to support the fair value of each investment as assessed by the Adviser. The valuation techniques used by the Adviser to measure fair value as of June 30, 2020 maximized the use of observable inputs and minimized the use of unobservable inputs. The valuation techniques and significant amounts of unobservable inputs used in the valuation of the Fund's Level 3 securities are outlined in the table below.
|
Fair Value ($) |
Valuation Technique |
Unobservable Inputs |
Range |
Weighted Average |
|||||||||||||||||||
|
Assets Investments in securities |
|||||||||||||||||||||||
|
Senior Loans |
19,445,505 |
Broker Quotes and/or 3rd Party Pricing Services |
N/A |
N/A |
N/A |
||||||||||||||||||
|
Corporate Bonds |
1,442,034 |
Broker Quotes and/or 3rd Party Pricing Services |
N/A |
N/A |
N/A |
||||||||||||||||||
|
Collateralized Loan Obligations |
129,085,976 |
Broker Quotes and/or 3rd Party Pricing Services |
N/A |
N/A |
N/A |
||||||||||||||||||
|
Common Stocks |
— |
Enterprise Value Analysis — Adjusted NAV |
IOI |
N/A |
N/A |
||||||||||||||||||
|
Preferred Stocks |
— |
Enterprise Value Analysis — Adjusted NAV |
IOI |
N/A |
N/A |
||||||||||||||||||
|
Warrants |
— |
Enterprise Value Analysis — Adjusted NAV |
EBITA |
10 |
x |
10 |
x |
||||||||||||||||
|
Total Level 3 Investments |
149,973,515 |
||||||||||||||||||||||
(4) Common Stock
Common share transactions were as follows:
|
For the Six Months Ended June 30, 2020 |
|||||||||||
|
Shares |
Amount ($) |
||||||||||
|
Common shares outstanding — beginning of period |
22,914,939 |
429,112,863 |
|||||||||
|
Common shares issued |
0 |
0 |
|||||||||
|
Common shares redeemed |
0 |
0 |
|||||||||
|
Common shares outstanding — end of period |
22,914,939 |
429,112,863 |
|||||||||
The board of directors has authorized the repurchase of shares of the Fund's outstanding common stock on the open market at the Fund management's discretion when shares of the common stock are trading on the NYSE at a discount of 10% or more (or such other percentage as the board of directors may determine from time to time) from the net asset value of the shares. The Fund is not required to effect common share repurchases. Any such purchases of Fund shares of common stock may not materially impact the discount of the market price of the Fund's shares of common stock relative to their net asset value and any narrowing of this discount that does result may not be maintained. There were no shares repurchased during the six months ended June 30, 2020.
(5) Credit Facility
The Fund is a party to a senior secured revolving credit facility (as amended, the "Credit Facility"), which allows for the Fund to borrow up to $212 million at any one time outstanding. The Credit Facility maturity date is June 8, 2022. Under the Credit Facility, the Fund is required to comply with various covenants, reporting requirements and other customary requirements for similar revolving credit facilities, including, without limitation, covenants related to: (a) limitations on the incurrence of additional indebtedness and liens, (b) limitations on certain investments, (c) limitations on certain restricted payments, and (d) maintaining a ratio of total assets (less total liabilities other than indebtedness) to total indebtedness of the Fund of not less than 3:1.0. These covenants are subject to important limitations and exceptions that are described in the documents governing the Credit Facility. Amounts available to borrow under the Credit Facility (and the incurrence of certain other permitted debt) are also subject to compliance with a borrowing base that applies different advance rates to different types of assets in the Fund's portfolio that are pledged as collateral. As of June 30, 2020, the Fund was in compliance in all material respects with the terms of the Credit Facility.
As of June 30, 2020, there was $123,491,138 outstanding under the Credit Facility. Loans under the Credit Facility generally bear interest at the applicable LIBOR rate plus
Semi-Annual Report 2020
24
Ares Dynamic Credit Allocation Fund, Inc.
Notes to Financial Statements (continued)
June 30, 2020 (Unaudited)
0.95%. Unused portions of the Credit Facility accrue a commitment fee equal to an annual rate of 0.15%. The fair value of the Fund's borrowings under the Credit Facility approximates the carrying amount presented in the accompanying Statement of Assets and Liabilities at cost for the remaining maturity for which the Fund has determined would be categorized as Level 2 in the fair value hierarchy.
For the six months ended June 30, 2020 the components of interest and unused commitment fees expense, average stated interest rates (i.e., rate in effect plus the spread) and average outstanding balances for the Credit Facility were as follows:
|
For the Six Months Ended June 30, 2020 ($) |
|||||||
|
Stated interest expense |
1,298,595 |
||||||
|
Unused commitment fees |
59,738 |
||||||
|
Total interest and credit facility fees expense |
1,358,333 |
||||||
|
Annualized average stated interest rate |
1.94 |
% |
|||||
|
Average outstanding balance |
134,136,278 |
||||||
|
Amortization of debt issuance costs |
89,220 |
||||||
Under the Investment Company Act, the Fund is not permitted to incur indebtedness, including through the issuance of debt securities, unless immediately thereafter the Fund will have an asset coverage of at least 300%. In general, the term "asset coverage" for this purpose means the ratio which the value of the total assets of the Fund, less all liabilities and indebtedness not represented by senior securities, bears to the aggregate amount of senior securities representing indebtedness of the Fund. In addition, the Fund may be limited in its ability to declare any cash distribution on its capital stock or purchase its capital stock unless, at the time of such declaration or purchase, the Fund has an asset coverage (on its indebtedness) of at least 300% after deducting the amount of such distribution or purchase price, as applicable. For non-public indebtedness issued by the Fund (for example, the Credit Facility), the Fund may be able to continue to pay distributions on its capital stock or purchase its capital stock even if the asset coverage ratio on its indebtedness falls below 300%. As of June 30, 2020, the Fund's asset coverage was 373%.
(6) Investment Advisory and Other Agreements
The Adviser is registered as an investment adviser under the Investment Advisers Act of 1940, as amended (the "Advisers Act"). The Adviser is an affiliate of Ares Management Corporation ("Ares") and leverages Ares' entire investment platform and benefits from the significant capital markets, trading and research expertise of all of Ares' investment professionals.
The Adviser provides certain investment advisory and administrative services to the Fund pursuant to the investment advisory agreement with the Fund ("Investment Advisory Agreement"). Pursuant to its Investment Advisory Agreement, the Fund has agreed to pay the Adviser a management fee at an annual rate of 1.00% of the average daily value of the Fund's total assets (including any assets attributable to any preferred shares that may be issued or to indebtedness) minus the Fund's liabilities other than liabilities relating to indebtedness ("Managed Assets"). The management fees incurred by the Fund for the six months ended June 30, 2020 were $2,324,582.
In addition to advisory services, the Adviser and its affiliates provide certain administrative services to the Fund at the Fund's request. Under the Investment Advisory Agreement, the Adviser may seek reimbursement from the Fund for the costs of these administrative services provided to the Fund by the Adviser and its affiliates. The Fund incurred such administrative costs of $245,113 for the six months ended June 30, 2020.
The Fund has engaged State Street Bank and Trust Company ("State Street") to serve as the Fund's administrator, custodian and transfer agent. Under the service agreements between State Street and the Fund, State Street provides certain administrative services necessary for the operation of the Fund. Such services include maintaining certain Fund books and records, providing accounting and tax services and preparing certain regulatory filings. State Street also performs custodial, fund accounting and portfolio accounting services, as well as transfer agency and dividend paying services with respect to the common shares. The Fund pays State Street for these services. The total expenses incurred by the Fund for the six months ended June 30, 2020 were $186,862.
The Fund has retained Destra Capital Investments LLC ("Destra") to provide investor support services in connection with the on-going operations of the Fund. Such services include providing ongoing contact with respect to the Fund and its performance with financial advisors that are representatives of broker-dealers and other financial intermediaries, communicating with the NYSE specialist for the Fund's common shares and with the closed-end fund analyst community regarding the Fund on a regular basis, and maintaining a website for the Fund. The Fund pays Destra a fee equal to 0.07% of Managed Assets per annum for these services. The terms of this agreement are in effect for an initial period of two years and shall thereafter continue for successive one year periods. The total expenses incurred by the Fund for the six months ended June 30, 2020 were $163,142.
Semi-Annual Report 2020
25
Ares Dynamic Credit Allocation Fund, Inc.
Notes to Financial Statements (continued)
June 30, 2020 (Unaudited)
(7) Investment Transactions
For the six months ended June 30, 2020, the cost of investments purchased and proceeds from the sale of investments, excluding short obligations, were as follows:
|
Cost of Investments Purchased |
Proceeds from the Sale of Investments |
||||||
| $ |
359,865,001 |
$ |
(387,063,386 |
) |
|||
(8) Risk Factors
Senior Loans Risk
Although senior loans ("Senior Loans") are senior and typically secured in a first or second lien position in contrast to other below investment grade fixed income instruments, which are often subordinated or unsecured, the risks associated with such Senior Loans are generally similar to the risks of other below investment grade fixed income instruments. Investments in below investment grade Senior Loans are considered speculative because of the credit risk of the issuers of debt instruments (each, a "Borrower"). Such Borrowers are more likely than investment grade Borrowers to default on their payments of interest and principal owed to the Fund, and such defaults would likely reduce the net asset value of the Fund and income distributions. An economic downturn would generally lead to a higher non-payment rate, and a Senior Loan may lose significant market value before a default occurs. Moreover, any specific collateral used to secure a Senior Loan may decline in value or become illiquid, which would likely adversely affect the Senior Loan's value.
Senior Loans are subject to the risk of non-payment of scheduled interest or principal. Such non-payment would result in a reduction of income to the Fund, a reduction in the value of the investment and a likely decrease in the net asset value of the Fund. There can be no assurance that the liquidation of any collateral securing a Senior Loan would satisfy the Borrower's obligation in the event of nonpayment of scheduled interest or principal payments, whether when due or upon acceleration, or that the collateral could be liquidated, readily or otherwise. In the event of bankruptcy or insolvency of a Borrower, the Fund could experience delays or limitations with respect to its ability to realize the benefits of the collateral, if any, securing a Senior Loan. The collateral securing a Senior Loan, if any, may lose all or substantially all of its value in the event of the bankruptcy or insolvency of a Borrower. Some Senior Loans are subject to the risk that a court, pursuant to fraudulent conveyance or other similar laws, could subordinate such Senior Loans to presently existing or future indebtedness of the Borrower or take other action detrimental to the holders of Senior Loans including, in
certain circumstances, invalidating such Senior Loans or causing interest previously paid to be refunded to the Borrower. Additionally, a Senior Loan may be "primed" in bankruptcy, which reduces the ability of the holders of the Senior Loan to recover on the collateral.
There may be less readily available information about most Senior Loans and the Borrowers thereunder than is the case for many other types of securities, including securities issued in transactions registered under the Securities Act of 1933, as amended (the "Securities Act") or the Securities Exchange Act of 1934, as amended (the "Exchange Act"), and Borrowers subject to the periodic reporting requirements of Section 13 of the Exchange Act. Senior Loans may be issued by companies that are not subject to SEC reporting requirements and these companies, therefore, do not file reports with the SEC that must comply with SEC form requirements and, in addition, are subject to a less stringent liability disclosure regime than companies subject to SEC reporting requirements. As a result, the Adviser will rely primarily on its own evaluation of a Borrower's credit quality rather than on any available independent sources. Consequently, the Fund will be particularly dependent on the analytical abilities of the Adviser. In certain circumstances, Senior Loans may not be deemed to be securities under certain federal securities laws, other than the Investment Company Act. Therefore, in the event of fraud or misrepresentation by a Borrower or an arranger, the Fund may not have the protection of the antifraud provisions of the federal securities laws as would otherwise be available for bonds or stocks. Instead, in such cases, parties generally would rely on the contractual provisions in the Senior Loan agreement itself and common law fraud protections under applicable state law.
The secondary trading market for Senior Loans may be less liquid than the secondary trading market for registered investment grade debt securities. No active trading market may exist for certain Senior Loans, which may make it difficult to value them. Illiquidity and adverse market conditions may mean that the Fund may not be able to sell Senior Loans quickly or at a fair price. To the extent that a secondary market does exist for certain Senior Loans, the market for them may be subject to irregular trading activity, wide bid/ask spreads and extended trade settlement periods.
Senior Loans are subject to legislative risk. If legislation or state or federal regulations impose additional requirements or restrictions on the ability of financial institutions to make loans, the availability of Senior Loans for investment by the Fund may be adversely affected. In addition, such requirements or restrictions could reduce or eliminate sources
Semi-Annual Report 2020
26
Ares Dynamic Credit Allocation Fund, Inc.
Notes to Financial Statements (continued)
June 30, 2020 (Unaudited)
of financing for certain Borrowers. This would increase the risk of default. If legislation or federal or state regulations require financial institutions to increase their capital requirements this may cause financial institutions to dispose of Senior Loans that are considered highly levered transactions. If the Fund attempts to sell a Senior Loan at a time when a financial institution is engaging in such a sale, the price the Fund could receive for the Senior Loan may be adversely affected.
Subordinated Loans Risk
Subordinated loans generally are subject to similar risks as those associated with investments in Senior Loans, except that such loans are subordinated in payment and/or lower in lien priority to first lien holders. In the event of default on a Subordinated Loan, the first priority lien holder has first claim to the underlying collateral of the loan to the extent such claim is secured. Additionally, an over secured creditor may be entitled to additional interest and other charges in bankruptcy increasing the amount of their allowed claim. Subordinated Loans are subject to the additional risk that the cash flow of the Borrower and property securing the loan or debt, if any, may be insufficient to meet scheduled payments after giving effect to the senior obligations of the Borrower. This risk is generally higher for subordinated unsecured loans or debt, which are not backed by a security interest in any specific collateral. Subordinated Loans generally have greater price volatility than Senior Loans and may be less liquid.
Corporate Bonds Risk
The market value of a corporate bond generally may be expected to rise and fall inversely with interest rates. The market value of intermediate- and longer-term corporate bonds is generally more sensitive to changes in interest rates than is the market value of shorter-term corporate bonds. The market value of a corporate bond also may be affected by factors directly related to the Borrower, such as investors' perceptions of the creditworthiness of the Borrower, the Borrower's financial performance, perceptions of the Borrower in the market place, performance of management of the Borrower, the Borrower's capital structure and use of financial leverage and demand for the Borrower's goods and services. There is a risk that the Borrowers of corporate bonds may not be able to meet their obligations on interest or principal payments at the time called for by an instrument. High yield corporate bonds are often high risk and have speculative characteristics. High yield corporate bonds may be particularly susceptible to adverse Borrower-specific developments.
CLO Securities Risk
Collateralized Loan Obligations ("CLO") issue securities in tranches with different payment characteristics and different credit ratings. The rated tranches of securities issued by CLOs ("CLO Securities") are generally assigned credit ratings by one or more nationally recognized statistical rating organizations. The subordinated (or residual) tranches do not receive ratings. Below investment grade tranches of CLO Securities typically experience a lower recovery, greater risk of loss or deferral or non-payment of interest than more senior tranches of the CLO.
The riskiest portion of the capital structure of a CLO is the subordinated (or residual) tranche, which bears the bulk of defaults from the loans in the CLO and serves to protect the other, more senior tranches from default in all but the most severe circumstances. Since it is partially protected from defaults, a senior tranche from a CLO typically has higher ratings and lower yields than the underlying securities, and can be rated investment grade. Despite the protection from the subordinated tranche, CLO tranches can experience substantial losses due to actual defaults, increased sensitivity to defaults due to collateral default and disappearance of protecting tranches, market anticipation of defaults and aversion to CLO Securities as a class. The risks of an investment in a CLO depend largely on the collateral and the tranche of the CLO in which the Fund invests.
The CLOs in which the Fund invests may have issued and sold debt tranches that will rank senior to the tranches in which the Fund invests. By their terms, such more senior tranches may entitle the holders to receive payment of interest or principal on or before the dates on which the Fund is entitled to receive payments with respect to the tranches in which the Fund invests. Also, in the event of insolvency, liquidation, dissolution, reorganization or bankruptcy of a CLO, holders of more senior tranches would typically be entitled to receive payment in full before the Fund receives any distribution. After repaying such senior creditors, such CLO may not have any remaining assets to use for repaying its obligation to the Fund. In the case of tranches ranking equally with the tranches in which the Fund invests, the Fund would have to share on an equal basis any distributions with other creditors holding such securities in the event of an insolvency, liquidation, dissolution, reorganization or bankruptcy of the relevant CLO. Therefore, the Fund may not receive back the full amount of its investment in a CLO.
The transaction documents relating to the issuance of CLO Securities may impose eligibility criteria on the assets of the CLO, restrict the ability of the CLO's investment manager to trade investments and impose certain portfolio-wide asset
Semi-Annual Report 2020
27
Ares Dynamic Credit Allocation Fund, Inc.
Notes to Financial Statements (continued)
June 30, 2020 (Unaudited)
quality requirements. These criteria, restrictions and requirements may limit the ability of the CLO's investment manager to maximize returns on the CLO Securities. In addition, other parties involved in CLOs, such as third-party credit enhancers and investors in the rated tranches, may impose requirements that have an adverse effect on the returns of the various tranches of CLO Securities. Furthermore, CLO Securities issuance transaction documents generally contain provisions that, in the event that certain tests are not met (generally interest coverage and over-collateralization tests at varying levels in the capital structure), proceeds that would otherwise be distributed to holders of a junior tranche must be diverted to pay down the senior tranches until such tests are satisfied. Failure (or increased likelihood of failure) of a CLO to make timely payments on a particular tranche will have an adverse effect on the liquidity and market value of such tranche.
Payments to holders of CLO Securities may be subject to deferral. If cash flows generated by the underlying assets are insufficient to make all current and, if applicable, deferred payments on CLO Securities, no other assets will be available for payment of the deficiency and, following realization of the underlying assets, the obligations of the Borrower of the related CLO Securities to pay such deficiency will be extinguished.
The market value of CLO Securities may be affected by, among other things, changes in the market value of the underlying assets held by the CLO, changes in the distributions on the underlying assets, defaults and recoveries on the underlying assets, capital gains and losses on the underlying assets, prepayments on underlying assets and the availability, prices and interest rate of underlying assets. Furthermore, the leveraged nature of each subordinated class may magnify the adverse impact on such class of changes in the value of the assets, changes in the distributions on the assets, defaults and recoveries on the assets, capital gains and losses on the assets, prepayment on assets and availability, price and interest rates of assets. Finally, CLO Securities are limited recourse and may not be paid in full and may be subject to up to 100% loss.
Asset-Backed Securities Risk
Asset-backed securities often involve risks that are different from or more acute than risks associated with other types of debt instruments. For instance, asset-backed securities may be particularly sensitive to changes in prevailing interest rates. In addition, the underlying assets are subject to prepayments that shorten the securities' weighted average maturity and may lower their return. Asset-backed securities are also subject to risks associated with their structure and the nature of the
assets underlying the security and the servicing of those assets. Payment of interest and repayment of principal on asset-backed securities is largely dependent upon the cash flows generated by the assets backing the securities and, in certain cases, supported by letters of credit, surety bonds or other credit enhancements. The values of asset-backed securities may be substantially dependent on the servicing of the underlying asset pools, and are therefore subject to risks associated with the negligence by, or defalcation of, their servicers. Furthermore, debtors may be entitled to the protection of a number of state and federal consumer credit laws with respect to the assets underlying these securities, which may give the debtor the right to avoid or reduce payment. In addition, due to their often complicated structures, various asset-backed securities may be difficult to value and may constitute illiquid investments. If many Borrowers on the underlying loans default, losses could exceed the credit enhancement level and result in losses to investors in asset-backed securities.
Investment and Market Risk
An investment in the common shares of the Fund is subject to investment risk, including the possible loss of the entire principal amount invested. An investment in the common shares of the Fund represents an indirect investment in the portfolio of Senior Loans, Corporate Bonds, CLO Securities and other securities and loans owned by the Fund, and the value of these securities and loans may fluctuate, sometimes rapidly and unpredictably. For instance, during periods of global economic downturn, the secondary markets for Senior Loans and investments with similar economic characteristics (such as second lien loans and unsecured loans) and Corporate Bonds may experience sudden and sharp price swings, which can be exacerbated by large or sustained sales by major investors in these markets, a high-profile default by a major Borrower, movements in indices tied to these markets or related securities or investments, or a change in the market's perception of Senior Loans and investments with similar economic characteristics (such as second lien loans and unsecured loans) and Corporate Bonds. At any point in time, an investment in the common shares of the Fund may be worth less than the original amount invested, even after taking into account distributions paid by the Fund, if any, and the ability of common shareholders to reinvest dividends. The Fund currently utilizes leverage, which magnifies the Fund's risks and, in turn, the risks to the common shareholders.
Interest Rate Risk
The market value of Corporate Bonds and other fixed-income securities changes in response to interest rate changes and other factors. Interest rate risk is the risk that prices of bonds
Semi-Annual Report 2020
28
Ares Dynamic Credit Allocation Fund, Inc.
Notes to Financial Statements (continued)
June 30, 2020 (Unaudited)
and other fixed-income securities will increase as interest rates fall and decrease as rates rise. Accordingly, an increase in market interest rates (which are currently considered low by historic standards) may cause a decrease in the price of a debt security and, therefore, a decline in the net asset value of the Fund's common shares. The magnitude of these fluctuations in the market price of bonds and other fixed-income securities is generally greater for those securities with longer maturities. Because Senior Loans with floating or variable rates reset their interest rates only periodically, changes in prevailing interest rates (and particularly sudden and significant changes) can be expected to cause some fluctuations in the net asset value of the Fund's common shares. In addition, Senior Loans or similar loans or securities may allow the Borrower to opt between LIBOR-based interest rates and interest rates based on bank prime rates, which may have an effect on the net asset value of the Fund's common shares.
LIBOR Rate Risk
National and international regulators and law enforcement agencies have conducted investigations into a number of rates or indices that are deemed to be "reference rates." Actions by such regulators and law enforcement agencies may result in changes to the manner in which certain reference rates are determined, their discontinuance, or the establishment of alternative reference rates. In particular, on July 27, 2017, the Chief Executive of the U.K. Financial Conduct Authority (the "FCA"), which regulates LIBOR, announced that the FCA will no longer persuade or compel banks to submit rates for the calculation of LIBOR after 2021. Such announcement indicates that the continuation of LIBOR on the current basis cannot and will not be guaranteed after 2021. It appears highly likely that LIBOR will be discontinued or modified by 2021.
The U.S. Federal Reserve, in conjunction with the Alternative Reference Rates Committee, a steering committee comprised of large U.S. financial institutions, is considering replacing U.S. dollar LIBOR with a new index calculated by short-term repurchase agreements, backed by Treasury securities (the" Secured Overnight Financing Rate," or "SOFR"). The future of LIBOR at this time is uncertain. Potential changes, or uncertainty related to such potential changes, may adversely affect the market for LIBOR-based securities, including our portfolio of LIBOR-indexed, floating-rate debt securities, or the cost of our borrowings. In addition, changes or reforms to the determination or supervision of LIBOR may result in a sudden or prolonged increase or decrease in reported LIBOR, which could have an adverse impact on the market for LIBOR-based securities, including the value of the LIBOR-indexed, floating-rate debt securities in our portfolio, or the cost of our borrowings. Additionally, if LIBOR ceases to exist, the Fund may need to renegotiate the credit agreement
extending beyond 2021 with our credit facility lenders that utilize LIBOR as a factor in determining the interest rate to replace LIBOR with the new standard that is established.
Liquidity Risk
The Fund may not be able to readily dispose of illiquid securities or loans at prices that approximate those at which the Fund could sell the securities or loans if they were more widely traded and, as a result of that illiquidity, the Fund may have to sell other investments or engage in borrowing transactions if necessary to raise cash to meet its obligations. Limited liquidity can also affect the market price of securities, thereby adversely affecting the net asset value of the common shares and ability to make dividend distributions. Some securities are not readily marketable and may be subject to restrictions on resale. securities generally are not listed on any national securities exchange and no active trading market may exist for the securities in which the Fund may invest. When a secondary market exists, if at all, the market for some securities may be subject to irregular trading activity, wide bid/ask spreads and extended trade settlement periods. Further, the lack of an established secondary market for illiquid securities may make it more difficult to value such securities, which may negatively affect the price the Fund would receive upon disposition of such securities.
Duration and Maturity Risk
The Fund has no fixed policy regarding portfolio maturity or duration. Holding long duration and long maturity investments will expose the Fund to certain additional risks.
When interest rates rise, certain obligations will be paid off by the Borrower more slowly than anticipated, causing the value of these obligations to fall. Rising interest rates tend to extend the duration of securities, making them more sensitive to changes in interest rates. The value of longer-term securities generally changes more in response to changes in interest rates than shorter-term securities. As a result, in a period of rising interest rates, securities may exhibit additional volatility and may lose value.
When interest rates fall, certain obligations will be paid off by the Borrower more quickly than originally anticipated, and the Fund may have to invest the proceeds in securities with lower yields. In periods of falling interest rates, the rate of prepayments tends to increase (as does price fluctuation) as Borrowers are motivated to pay off debt and refinance at new lower rates. During such periods, reinvestment of the prepayment proceeds by the Adviser will generally be at lower rates of return than the return on the assets that were prepaid. Prepayment reduces the yield to maturity and the average life of the security.
Semi-Annual Report 2020
29
Ares Dynamic Credit Allocation Fund, Inc.
Notes to Financial Statements (continued)
June 30, 2020 (Unaudited)
Special Situations and Stressed Investments Risk
Although investments in debt and equity securities and other obligations of companies that may be in some level of financial or business distress, including companies involved in, or that have recently completed, bankruptcy or other reorganization and liquidation proceedings ("Stressed Issuers") (such investments, "Special Situation Investments") may result in significant returns for the Fund, they are speculative and involve a substantial degree of risk. The level of analytical sophistication, both financial and legal, necessary for successful investment in distressed assets is unusually high. Therefore, the Fund will be particularly dependent on the analytical abilities of the Adviser. In any reorganization or liquidation proceeding relating to a company in which the Fund invests, the Fund may lose its entire investment, may be required to accept cash or securities with a value less than the Fund's original investment and/or may be required to accept payment over an extended period of time. Among the risks inherent in investments in a troubled company is that it may be difficult to obtain information as to the true financial condition of such company. Troubled company investments and other distressed asset-based investments require active monitoring.
The Fund may make investments in Stressed Issuers when the Adviser believes it is reasonably likely that the Stressed Issuer will make an exchange offer or will be the subject to a plan of reorganization pursuant to which the Fund will receive new securities in return for a Special Situation Investment. There can be no assurance, however, that such an exchange offer will be made or that such a plan of reorganization will be adopted. In addition, a significant period of time may pass between the time at which the Fund makes its investment in the Special Situation Investment and the time that any such exchange offer or plan of reorganization is completed, if at all. During this period, it is unlikely that the Fund would receive any interest payments on the Special Situation Investment, the Fund would be subject to significant uncertainty whether the exchange offer or plan of reorganization will be completed and the Fund may be required to bear certain extraordinary expenses to protect and recover its investment. Therefore, to the extent the Fund seeks capital appreciation through investment in Special Situation Investments, the Fund's ability to achieve current income for its shareholders may be diminished. The Fund also will be subject to significant uncertainty as to when, in what manner and for what value the obligations evidenced by Special Situation Investments will eventually be satisfied (e.g., through a liquidation of the obligor's assets, an exchange offer or plan of reorganization involving the Special Situation Investments or a payment of some amount in satisfaction of the obligation). Even if an exchange offer is made or plan of
reorganization is adopted with respect to Special Situation Investments held by the Fund, there can be no assurance that the securities or other assets received by the Fund in connection with such exchange offer or plan of reorganization will not have a lower value or income potential than may have been anticipated when the investment was made or even no value. Moreover, any securities received by the Fund upon completion of an exchange offer or plan of reorganization may be restricted as to resale. Similarly, if the Fund participates in negotiations with respect to any exchange offer or plan of reorganization with respect to an issuer of Special Situation Investments, the Fund may be restricted from disposing of such securities. To the extent that the Fund becomes involved in such proceedings, the Fund may have a more active participation in the affairs of the issuer than that assumed generally by an investor.
To the extent that the Fund holds interests in a Stressed Issuer that are different (or more senior or junior) than those held by other funds and/or accounts managed by Ares or its affiliates ("Other Accounts"), the Adviser is likely to be presented with decisions involving circumstances where the interests of such Other Accounts may be in conflict with the Fund's interests. Furthermore, it is possible that the Fund's interest may be subordinated or otherwise adversely affected by virtue of such Other Accounts' involvement and actions relating to their investment. In addition, when the Fund and Other Accounts hold investments in the same Stressed Issuer (including in the same level of the capital structure), the Fund may be prohibited by applicable law from participating in restructurings, work-outs, renegotiations or other activities related to its investment in the Stressed Issuer absent an exemption due to the fact that Other Accounts hold investments in the same Stressed Issuer. As a result, the Fund may not be permitted by law to make the same investment decisions as Other Accounts in the same or similar situations even if the Adviser believes it would be in the Fund's best economic interests to do so. Also, the Fund may be prohibited by applicable law from investing in a Stressed Issuer (or an affiliate) that Other Accounts are also investing in or currently invest in even if the Adviser believes it would be in the best economic interests of the Fund to do so. Furthermore, entering into certain transactions that are not deemed prohibited by law when made may potentially lead to a condition that raises regulatory or legal concerns in the future. This may be the case, for example, with Stressed Issuers who are near default and more likely to enter into restructuring or work-out transactions with their existing debt holders, which may include the Fund and its affiliates. In some cases, to avoid the potential of future prohibited transactions, the Adviser may avoid recommending allocating an investment opportunity to
Semi-Annual Report 2020
30
Ares Dynamic Credit Allocation Fund, Inc.
Notes to Financial Statements (continued)
June 30, 2020 (Unaudited)
the Fund that it would otherwise recommend, subject to the Adviser's then-current allocation policy and any applicable exemptions.
Below Investment Grade Rating Risk
Debt instruments that are rated below investment grade are often referred to as "high yield" securities or "junk bonds." Below investment grade instruments are rated "Ba1" or lower by Moody's, "BB+" or lower by S&P or "BB+" or lower by Fitch or, if unrated, are judged by the Adviser to be of comparable credit quality. While generally providing greater income and opportunity for gain, below investment grade debt instruments may be subject to greater risks than securities or instruments that have higher credit ratings, including a higher risk of default. The credit rating of an instrument that is rated below investment grade does not necessarily address its market value risk, and ratings may from time to time change, positively or negatively, to reflect developments regarding the Borrower's financial condition. Below investment grade instruments often are considered to be speculative with respect to the capacity of the Borrower to timely repay principal and pay interest or dividends in accordance with the terms of the obligation and may have more credit risk than higher rated securities. Lower grade securities and similar debt instruments may be particularly susceptible to economic downturns. It is likely that a prolonged or deepening economic recession could adversely affect the ability of some Borrowers issuing such debt instruments to repay principal and pay interest on the instrument, increase the incidence of default and severely disrupt the market value of the securities and similar debt instruments.
The secondary market for below investment grade instruments may be less liquid than that for higher rated instruments. Because unrated securities may not have an active trading market or may be difficult to value, the Fund might have difficulty selling them promptly at an acceptable price. To the extent that the Fund invests in unrated securities, the Fund's ability to achieve its investment objectives will be more dependent on the Adviser's credit analysis than would be the case when the Fund invests in rated securities.
Under normal market conditions, the Fund will invest in debt instruments rated in the lower rating categories ("Caa1" or lower by Moody's, "CCC+" or lower by S&P or "CCC+" or lower by Fitch) or unrated and of comparable quality. For these securities, the risks associated with below investment grade instruments are more pronounced. The Fund may incur additional expenses to the extent it is required to seek recovery upon a default in the payment of principal or interest on its portfolio holdings. In any reorganization or liquidation proceeding relating to an investment, the Fund may lose its
entire investment or may be required to accept cash or securities with a value substantially less than its original investment.
European Risk
The Fund may invest a portion of its capital in debt securities issued by issuers domiciled in Europe, including issuers domiciled in the United Kingdom ("UK"). Concerns regarding the sovereign debt of various Eurozone countries and proposals for investors to incur substantial write-downs and reductions in the face value of the sovereign debt of certain countries give rise to concerns about sovereign defaults, the possibility that one or more countries might leave the European Union or the Eurozone and various proposals (still under consideration and unclear in material respects) for support of affected countries and the Euro as a currency. The outcome of any such situation cannot be predicted. Sovereign debt defaults and European Union and/or Eurozone exits could have material adverse effects on investments by the Fund in securities of European companies, including but not limited to the availability of credit to support such companies' financing needs, uncertainty and disruption in relation to financing, customer and supply contracts denominated in Euro and wider economic disruption in markets served by those companies, while austerity and other measures that have been introduced in order to limit or contain these issues may themselves lead to economic contraction and resulting adverse effects for the Fund. A number of the Fund's securities may be denominated in the Euro. Legal uncertainty about the funding of Euro denominated obligations following any breakup or exits from the Eurozone (particularly in the case of investments in securities of companies in affected countries) could also have material adverse effects on the Fund. The uncertainty in the wake of the UK's "Brexit" referendum and subsequent political developments could have a negative impact on both the UK economy and the economies of other countries in Europe. The Brexit process also may lead to greater volatility in the global currency and financial markets, which could adversely affect the Fund. In connection with investments in non-US issuers, the Fund may engage in foreign currency exchange transactions but is not required to hedge its currency exposure. As such, the Fund makes investments that are denominated in British pound sterling or Euros. The Fund's assets are valued in US dollars and the depreciation of the British pound sterling and/or the Euro in relation to the US dollar in anticipation of Brexit or otherwise adversely affects the Fund's investments denominated in British pound sterling or Euros that are not fully hedged regardless of the performance of the underlying issuer. Global central banks may maintain historically low interest rates longer than was anticipated prior to the Brexit vote, which
Semi-Annual Report 2020
31
Ares Dynamic Credit Allocation Fund, Inc.
Notes to Financial Statements (continued)
June 30, 2020 (Unaudited)
could adversely affect the Fund's income and its level of distributions.
Market Disruption Risk
As of the filing date of these financial statements, there is an outbreak of a highly contagious form of a novel coronavirus ("COVID-19"), which the World Health Organization has declared a global pandemic, the United States has declared a national emergency, and for the first time in its history, every state in the United States is under a federal disaster declaration. Many states, including those in which the Fund's portfolio companies operate, have issued orders requiring the closure of, or certain restrictions on the operation of, non-essential businesses and/or requiring residents to stay at home. The COVID-19 pandemic and preventative measures taken to contain or mitigate its spread have caused, and are continuing to cause, business shutdowns, or the re-introduction of business shutdowns, cancellations of events and restrictions on travel, significant reductions in demand for certain goods and services, reductions in business activity and financial transactions, supply chain interruptions and overall economic and financial market instability both globally and in the United States. Such effects will likely continue for the duration of the pandemic, which is uncertain, and for some period thereafter. While several countries, as well as certain states, counties and cities in the United States, have begun to lift the public health restrictions with a view to reopening their economies, recurring COVID-19 outbreaks have led to the re-introduction of such restrictions in certain states in the United States and globally and could continue to lead to the re-introduction of such restrictions elsewhere. Additionally, the absence of viable treatment options or a vaccine could lead people to continue to self-isolate and not participate in the economy at prepandemic levels for a prolonged period of time. Even after the COVID-19 pandemic subsides, the U.S. economy and most other major global economies may continue to experience a recession, and the Fund's business and operations, as well as the business and operations the Fund's portfolio companies, could be materially adversely affected by a prolonged recession in the U.S. and other major markets.
The COVID-19 pandemic (including the preventative measures taken in response thereto) has to date (i) created significant business disruption issues for certain of the Fund's portfolio companies, and (ii) materially and adversely impacted the value and performance of certain of the Fund's portfolio companies. The COVID-19 pandemic is having a particularly adverse impact on industries in which certain of the Fund's portfolio companies operate, including energy, hospitality, travel, retail and restaurants. Certain of the Fund's portfolio companies in other industries have also been
significantly impacted. The COVID-19 pandemic is continuing as of the filing date of these financial statements, and its extended duration may have further adverse impacts on the Fund's portfolio companies after June 30, 2020, including for the reasons described below. Although on March 27, 2020, the U.S. government enacted the Coronavirus Aid, Relief, and Economic Security Act (the "CARES Act"), which contains provisions intended to mitigate the adverse economic effects of the COVID-19 pandemic, it is uncertain whether, or how much, the Fund's portfolio companies have benefited or may benefit from the CARES Act or any other subsequent legislation intended to provide financial relief or assistance.
The effects described above on the Fund's portfolio companies have, for certain of the Fund's portfolio companies to date, impacted their ability to make payments on their loans on a timely basis and in many cases have required us to amend certain terms, including payment terms. In addition, an extended duration of the COVID-19 pandemic may impact the ability of the Fund's portfolio companies to continue making their loan payments on a timely basis or meeting their loan covenants. The inability of portfolio companies to make timely payments or meet loan covenants may in the future require the Fund to undertake similar amendment actions with respect to other of the Fund's investments or to restructure the Fund's investments. The amendment or restructuring of the Fund's investments may include the need for the Fund to make additional investments in the Fund's portfolio companies (including debt or equity investments) beyond any existing commitments, or exchange debt for equity.
The COVID-19 pandemic has adversely impacted the fair value of the Fund's investments, including those reported as of June 30, 2020, and the values reported may differ materially from the values that the Fund may ultimately realize with respect to our investments. The impact of the COVID-19 pandemic may not yet be fully reflected in the valuation of the Fund's investments as the Fund's valuationsare inherently uncertain and may fluctuate over short periods of time.. The Fund's valuations, including those reported as of June 30, 2020, may not show the complete or continuing impact of the COVID-19 pandemic and the resulting measures taken in response thereto. In addition, write downs in the value of the Fund's investments have reduced, and any additional write downs may further reduce, the Fund's net asset value (and, as a result, the Fund's asset coverage calculation). Accordingly, the Fund may continue to incur additional net unrealized losses or may incur realized losses after June 30, 2020, which could have a material adverse effect on the Fund's business, financial condition and results of operations.
The volatility and disruption to the global economy from the COVID-19 pandemic has affected, and is expected to
Semi-Annual Report 2020
32
Ares Dynamic Credit Allocation Fund, Inc.
Notes to Financial Statements (continued)
June 30, 2020 (Unaudited)
continue to affect, the pace of the Fund's investment activity and the size of our portfolio, which may have a material adverse impact on the Fund's results of operations, including the Fund's total investment income.
In response to the COVID-19 pandemic, Ares has instituted a work from home policy until it is deemed safe to return to the office. Such a policy of an extended period of remote working by the Fund's investment adviser and/or its affiliate's employees could strain the Fund's technology resources and introduce operational risks, including heightened cybersecurity risk. Remote working environments may be less secure and more susceptible to hacking attacks, including phishing and social engineering attempts that seek to exploit the COVID-19 pandemic.
(9) Subsequent Events
The Adviser has evaluated the impact of all subsequent events on the Fund through the date the financial statements were issued and has determined that there were the following subsequent events:
The following common share distributions were declared on July 10, 2020:
Ex-Date: July 20, 2020
Record Date: July 21, 2020
Payable Date: July 31, 2020
Per Share Amount: $0.0975
The following common share distributions were declared on August 11, 2020:
Ex-Date: August 20, 2020
Record Date: August 21, 2020
Payable Date: August 31, 2020
Per Share Amount: $0.0975
Semi-Annual Report 2020
33
Ares Dynamic Credit Allocation Fund, Inc.
Additional Information
June 30, 2020 (Unaudited)
Proxy Information
The policies and procedures used to determine how to vote proxies relating to securities held by the Fund are available (1) without charge, upon request, by calling 1-877-855-3434, or (2) on the SEC's website at http://www.sec.gov. Information regarding how the Fund voted proxies relating to portfolio securities during the most recent twelve-month period ended June 30 will be available on Form N-PX by August 31 of each year (1) without charge, upon request, by calling 1-877-855-3434, or (2) on the SEC's website at http://www.sec.gov.
Portfolio Information
The Fund files its complete schedule of portfolio holdings for each month in a fiscal quarter within 60 days after the end of the relevant fiscal quarter on SEC Form N-PORT. The Fund's Form N-PORT will be available (1) without charge, upon request, by calling 1-877-855-3434; (2) on the SEC's website at http://www.sec.gov.
Semi-Annual Report 2020
34
Ares Dynamic Credit Allocation Fund, Inc.
Additional Information (continued)
June 30, 2020 (Unaudited)
Dividend Reinvestment Plan
Unless a shareholder specifically elects to receive distributions in cash, distributions will automatically be reinvested in additional common shares of the Fund. A shareholder may elect to have the cash portion of dividends and distributions distributed in cash. To exercise this option, such shareholder must notify State Street, the plan administrator and the Fund's transfer agent and registrar, in writing or by telephone so that such notice is received by the plan administrator not less than 10 days prior to the record date fixed by the board of directors for the dividend or distribution involved. Participants who hold their common shares through a broker or other nominee and who wish to elect to receive any dividends and other distributions in cash must contact their broker or nominee. The plan administrator will set up an account for shares acquired pursuant to the plan for each shareholder that does not elect to receive distributions in cash (each a "Participant"). The plan administrator may hold each Participant's common shares, together with the other Participant's common shares, in noncertificated form in the plan administrator's name or that of its nominee. The shares are acquired by the plan administrator for a Participant's account, depending upon the circumstances described below, either (i) through receipt of additional unissued but authorized common shares from the Fund ("Newly Issued Shares") or (ii) by purchase of outstanding common shares on the open market ("Open-Market Purchases") on the NYSE or elsewhere. If, on the dividend payment date, the net asset value per share of the common shares is equal to or less than the market price per common share on the NYSE plus estimated brokerage commissions (such condition being referred to as "market premium"), the plan administrator will invest the dividend amount in Newly Issued Shares on behalf of the Participant. The number of Newly Issued Shares to be credited to the Participant's account will be determined by dividing the dollar amount of the dividend by the net asset value per share of the common shares on the date the shares are issued, unless the net asset value of the common shares is less than 95% of the then current market price per share on the NYSE, in which case the dollar amount of the dividend will be divided by 95% of the then current market price per common share on the NYSE. If on the dividend payment date the net asset value per share of the common shares is greater than the market price per common share on the NYSE (such condition being referred to as "market discount"), the plan administrator will invest the dividend amount in common shares acquired on behalf of the Participant in Open-Market Purchases.
The plan administrator's service fee, if any, and expenses for administering the plan will be paid for by the Fund. There will be no brokerage charges to shareholders with respect to common shares issued directly by the Fund as a result of dividends or distributions payable either in common shares or in cash. However, each participant will pay a pro-rata share of brokerage commissions incurred with respect to the plan administrator's Open-Market Purchases in connection with the reinvestment of dividends and distributions.
Shareholders who elect to receive their distributions in cash are subject to the same federal, state and local tax consequences as shareholders who reinvest their distributions in additional common shares. A shareholder's basis for determining gain or loss upon the sale of shares acquired due to reinvestment of a distribution will generally be equal to the total dollar amount of the dividend payable to the shareholders. Any shares received due to reinvestment of a dividend will have a new holding period for tax purposes commencing on the day following the day on which the shares are credited to the U.S. shareholder's account.
Participants may terminate their accounts under the dividend reinvestment plan by writing to the plan administrator at State Street Bank and Trust Company, located at One Lincoln Street, Boston, Massachusetts, 02111 or by calling the plan administrator's hotline at (877) 272-8164. Such termination will be effective immediately if the Participant's notice is received by the plan administrator at least 10 days prior to any dividend or distribution record date for the payment of any dividend or distribution by the Fund; otherwise, such termination will be effective only with respect to any subsequent dividend or distribution. Participants who hold their common shares through a broker or other nominee and who wish to terminate their account under the plan may do so by notifying their broker or nominee. The dividend reinvestment plan may be terminated by the Fund upon notice in writing mailed to each Participant at least 30 days prior to any record date for the payment of any dividend or distribution by the Fund. Additional information about the dividend reinvestment plan may be obtained by contacting the plan administrator by mail at One Lincoln Street, Boston, Massachusetts 02111 or by telephone at (877) 272-8164.
Semi-Annual Report 2020
35
Ares Dynamic Credit Allocation Fund, Inc.
Additional Information (continued)
June 30, 2020 (Unaudited)
Investment Adviser
Ares Capital Management II LLC
2000 Avenue of the Stars, 12th Floor
Los Angeles CA 90067
Administrator Custodian and Transfer Agent
State Street Bank and Trust Company
One Lincoln Street
Boston, MA 02111
DRIP Administrator
State Street Bank and Trust Company
One Lincoln Street
Boston, MA 02111
Investor Support Services
Destra Capital Investments LLC
901 Warrenville Road, Suite 15
Lisle, IL 60532
Independent Registered Public Accounting Firm
Ernst & Young LLP
725 South Figueroa Street
Los Angeles, CA 90017
Fund Counsel
Willkie Farr & Gallagher LLP
787 7th Avenue
New York, NY 10019
Semi-Annual Report 2020
36
Ares Dynamic Credit Allocation Fund, Inc.
Additional Information (continued)
June 30, 2020 (Unaudited)
Privacy Notice
We are committed to maintaining the privacy of our shareholders and to safeguarding their nonpublic personal information. The following information is provided to help you understand what personal information we collect, how we protect that information and why, in certain cases, we may share information with select other parties.
Generally, we will not receive any non-public personal information about shareholders of the common stock of the Fund, although certain of our shareholders' non-public information may become available to us. The non-public personal information that we may receive falls into the following categories:
• Information we receive from shareholders, whether we receive it orally, in writing or electronically. This includes shareholders' communications to us concerning their investment;
• Information about shareholders' transactions and history with us; or
• Other general information that we may obtain about shareholders, such as demographic and contact information such as address.
We do not disclose any non-public personal information about shareholders, except:
• to our affiliates (such as our investment adviser) and their employees that have a legitimate business need for the information;
• to our service providers (such as our administrator, accountants, attorneys, custodians, transfer agent, underwriter and proxy solicitors) and their employees as is necessary to service shareholder accounts or otherwise provide the applicable service;
• to comply with court orders, subpoenas, lawful discovery requests, or other legal or regulatory requirements; or
• as allowed or required by applicable law or regulation.
When the Fund shares non-public shareholder personal information referred to above, the information is made available for limited business purposes and under controlled circumstances designed to protect our shareholders' privacy. The Fund does not permit use of shareholder information for any non-business or marketing purpose, nor does the Fund permit third parties to rent, sell, trade or otherwise release or disclose information to any other party.
The Fund's service providers, such as their adviser, administrator, and transfer agent, are required to maintain physical, electronic, and procedural safeguards to protect shareholder nonpublic personal information; to prevent unauthorized access or use; and to dispose of such information when it is no longer required.
Personnel of affiliates may access shareholder information only for business purposes. The degree of access is based on the sensitivity of the information and on personnel need for the information to service a shareholder's account or comply with legal requirements.
If a shareholder ceases to be a shareholder, we will adhere to the privacy policies and practices as described above. We may choose to modify our privacy policies at any time. Before we do so, we will notify shareholders and provide a description of our privacy policy.
In the event of a corporate change in control resulting from, for example, a sale to, or merger with, another entity, or in the event of a sale of assets, we reserve the right to transfer your non-public personal information to the new party in control or the party acquiring assets.
Semi-Annual Report 2020
37
Ares Dynamic Credit Allocation Fund, Inc.
Additional Information (continued)
June 30, 2020 (Unaudited)
Directors
|
Name, Address(1) and Year of Birth |
Position(s) Held with the Fund |
Length of Time Served and Term of Office |
Principal Occupation(s) or Employment During Past Five Years |
Number of Funds in the Complex(3) Overseen by the Director or Nominee |
Other Public Company Board Memberships During Past Five Years |
||||||||||||||||||
|
Interested Directors(2) |
|||||||||||||||||||||||
|
David A. Sachs 1956 |
Director and Chairman of the Board |
Since 2011*** |
Partner, Ares Management, L.P. |
1 |
Terex Corporation; CION Ares Diversified Credit Fund |
||||||||||||||||||
|
Seth J. Brufsky 1966 |
President, Chief Executive Officer, Director and Portfolio Manager of ARDC |
Since 2012** |
Mr. Brufsky is a Partner and Co-Head and Portfolio Manager of U.S. Liquid Credit in the Ares Credit Group and a member of the Management Committee of Ares Management. Additionally, he serves as a member of the Ares Credit Group's U.S. Liquid Credit Investment Committee and the Ares Dynamic Credit Allocation Fund Investment Committee. He has served as Director, President and Chief Executive Officer of ARDC since 2012. |
1 |
None |
||||||||||||||||||
|
Independent Directors |
|||||||||||||||||||||||
|
James K. Hunt 1951 |
Director |
Since 2016*** |
Consultant, Tournament Capital Advisors, LLC; from 2015 to 2016, Managing Partner and Chief Executive Officer, Middle Market Credit platform — Kayne Anderson Capital Advisors LLC; from 2014 to 2015, Chairman, THL Credit, Inc.; from 2010 to 2014, Chief Executive Officer and Chief Investment Officer, THL Credit, Inc. and THL Credit Advisors LLC |
1 |
PennyMac Financial Services, Inc.; CION Ares Diversified Credit Fund |
||||||||||||||||||
Semi-Annual Report 2020
38
Ares Dynamic Credit Allocation Fund, Inc.
Additional Information (continued)
June 30, 2020 (Unaudited)
Directors
|
Name, Address(1) and Year of Birth |
Position(s) Held with the Fund |
Length of Time Served and Term of Office |
Principal Occupation(s) or Employment During Past Five Years |
Number of Funds in the Complex(3) Overseen by the Director or Nominee |
Other Public Company Board Memberships During Past Five Years |
||||||||||||||||||
|
John J. Shaw 1951 |
Director |
Since 2012** |
Independent Consultant; prior to 2012, President, Los Angeles Rams |
1 |
CION Ares Diversified Credit Fund |
||||||||||||||||||
|
Bruce H. Spector 1942 |
Director |
Since 2014* |
Independent Consultant; from 2007 to 2015, Senior Advisor, Apollo Global Management LLC (private equity) |
1 |
The Private Bank of California (2007-2013); CION Ares Diversified Credit Fund |
||||||||||||||||||
(1) The address of each Director is care of the Secretary of the Fund at 2000 Avenue of the Stars, 12th Floor, Los Angeles, CA 90067.
(2) "Interested person," as defined in the Investment Company Act, of the Fund. Mr. Sachs and Mr. Brufsky are interested persons of the Fund due to their affiliation with the Adviser.
(3) The term "Fund Complex" means two or more registered investment companies that share the same investment adviser or have an investment adviser that is an affiliated person of the investment adviser of any of the other registered investment companies or hold themselves out to investors as related companies for the purpose of investment and investor services.
* Term continues until the Fund's 2023 Annual Meeting of Stockholders and until his successor is duly elected and qualifies.
** Term continues until the Fund's 2021 Annual Meeting of Stockholders and until his successor is duly elected and qualifies.
*** Term continues until the Fund's 2022 Annual Meeting of Stockholders and until his successor is duly elected and qualifies.
Semi-Annual Report 2020
39
Ares Dynamic Credit Allocation Fund, Inc.
Additional Information (continued)
June 30, 2020 (Unaudited)
Officers
|
Name, Address(1) and Year of Birth |
Position(s) Held with Funds |
Officer Since |
Principal Occupation(s) or Employment During Past Five Years |
||||||||||||
|
Seth J. Brufsky 1966 |
President, Chief Executive Officer, Director and Portfolio Manager of ARDC |
Since 2012 |
Mr. Brufsky is a Partner and Co-Head and Portfolio Manager of U.S. Liquid Credit in the Ares Credit Group and a member of the Management Committee of Ares Management. Additionally, he serves as a member of the Ares Credit Group's U.S. Liquid Credit Investment Committee and the Ares Dynamic Credit Allocation Fund Investment Committee. He has served as Director, President and Chief Executive Officer of ARDC since 2012. |
||||||||||||
|
Penni F. Roll 1965 |
Treasurer |
Since 2016 |
Ms. Roll is a Partner and the Chief Financial Officer of the Ares Credit Group. She also serves as the Chief Financial Officer of Ares Capital Corporation and Treasurer of CION Ares Diversified Credit Fund. She joined Ares in April 2010 as Executive Vice President — Finance of Ares Capital Management. She previously served as Chief Financial Officer of ARDC from October 2016 to September 2017. |
||||||||||||
|
Lisa Morgan 1976 |
Chief Compliance Officer and Anti-Money Laundering Officer |
Since 2019 |
Ms. Morgan is a Managing Director and Head of Regulatory Compliance in the Ares Compliance Department. She joined Ares in September 2017. |
||||||||||||
|
Scott Lem 1977 |
Chief Financial Officer |
Since 2016 |
Mr. Lem is a Partner and Chief Accounting Officer, Credit (Direct Lending) in the Ares Finance Department. Mr. Lem additionally serves as Chief Accounting Officer, Vice President and Treasurer of Ares Capital Corporation. He also serves as Chief Financial Officer of CION Ares Diversified Credit Fund. Mr. Lem previously served as Assistant Treasurer of Ares Capital Corporation from May 2009 to May 2013 and Treasurer of ARDC from October 2016 to September 2017. Mr. Lem joined Ares in 2003. |
||||||||||||
|
Ian Fitzgerald 1975 |
General Counsel and Secretary Vice President and Assistant Secretary |
Since 2019 2017-2019 |
Mr. Fitzgerald is a Managing Director and Associate General Counsel (Credit) in the Ares Legal Group, where he focuses on credit matters. He also serves as Vice President and Assistant Secretary of Ivy Hill Asset Management, L.P. and Vice President and Assistant Secretary of Ivy Hill Asset Management GP, LLC, Ivy Hill Asset Management's General Partner. Mr. Fitzgerald joined Ares in 2010. |
||||||||||||
|
Keith Ashton 1967 |
Vice President and Portfolio Manager of ARDC |
Since 2013 |
Mr. Ashton is a Director in the Ares Credit Group, Portfolio Manager of Alternative Credit and a member of the Management Committee of Ares Management. Additionally, he serves as a member of the Ares Credit Group's Global Structured Credit Investment Committee and the Ares Dynamic Credit Allocation Fund Investment Committee. Prior to joining Ares in 2011, Mr. Ashton was a Partner at Indicus Advisors LLP, where he focused on launching the global structured credit business in May 2007. Previously, Mr. Ashton was a Portfolio Manager and Head of Structured Credit at TIAA-CREF, where he focused on managing a portfolio of structured credit investments and helped launch TIAA's institutional asset management business. |
||||||||||||
|
Daniel Hayward 1985 |
Vice President |
Since 2016 |
Mr. Hayward is a Managing Director and Co-Portfolio Manager in the Ares Credit Group. Additionally, he serves as a member of the Ares Credit Group's U.S. Liquid Credit Investment Committee. Prior to joining Ares in 2012, he was a senior collateralized loan obligation analyst at State Street Bank, where he focused on managing a team in the Trustee Department. |
||||||||||||
|
Charles Arduini 1969 |
Vice President and portfolio manager of ARDC |
Since 2018 |
Mr. Arduini is a Managing Director and Portfolio Manager in the Ares Credit Group, where he focuses on structured credit investments. Mr. Arduini joined Ares in 2011. |
||||||||||||
|
Samantha Milner 1978 |
Vice President and portfolio manager of ARDC |
Since 2018 |
Ms. Milner is a Partner, Portfolio Manager and Head of Research of U.S. Liquid Credit in the Ares Credit Group, where she is primarily responsible for managing Ares' U.S. bank loan credit strategies. Additionally, she serves as a member of the Ares Credit Group's U.S. Liquid Credit Investment Committee. Ms. Milner joined Ares in 2004. |
||||||||||||
Semi-Annual Report 2020
40
Ares Dynamic Credit Allocation Fund, Inc.
Additional Information (continued)
June 30, 2020 (Unaudited)
Officers
|
Name, Address(1) and Year of Birth |
Position(s) Held with Funds |
Officer Since |
Principal Occupation(s) or Employment During Past Five Years |
||||||||||||
|
Jason Duko 1977 |
Vice President |
Since 2018 |
Mr. Duko is a Partner and Portfolio Manager of U.S. Liquid Credit in the Ares Credit Group, where he is primarily responsible for managing Ares' U.S. bank loan credit strategies. Additionally, he serves as a member of the Ares Credit Group's U.S. Liquid Credit Investment Committee. Prior to joining Ares in 2018, Mr. Duko was a Portfolio Manager at PIMCO, where he managed bank loan assets across a broad range of investment strategies and was responsible for secondary loan trading across all sectors. Previously, Mr. Duko was an Associate Portfolio Manager at Lord Abbett & Co. LLC, where he focused on its leveraged loan business, portfolio management, trading decisions and marketing. |
||||||||||||
|
Kapil Singh 1971 |
Vice President |
Since 2018 |
Mr. Singh is a Partner and Portfolio Manager of U.S. Liquid Credit in the Ares Credit Group, where he is primarily responsible for managing Ares' U.S. high yield credit strategies. Additionally, he serves as a member of the Ares Credit Group's U.S. Liquid Credit Investment Committee. Prior to joining Ares in 2018, Mr. Singh was a Portfolio Manager in the Global Developed Credit Group at Double Line Capital, where he managed high yield bonds across strategies and portfolios in a variety of investment vehicles. Previously, Mr. Singh was a Senior Analyst at the Post Advisory Group, where he managed high yield bonds and leveraged loans within the energy sector. In addition, Mr. Singh was a Co-Portfolio Manager and Senior Credit Analyst at Four Comers Capital, a subsidiary of Macquarie Funds Group. He also held positions as Bradford & Marzec, PPM America and Heller Financial. |
||||||||||||
|
Joshua Bloomstein 1973 |
Vice President and Assistant Secretary |
Since 2019 |
Mr. Bloomstein serves as a Partner and General Counsel (Credit) and Deputy General Counsel (Corporate) of Ares Management where he focuses on credit matters. He is General Counsel, Vice President and Secretary of Ares Capital Corporation and Vice President and Assistant Secretary of Ares Commercial Real Estate Corporation. He is also a member of the Ares Enterprise Risk Committee. Mr. Bloomstein joined Ares in 2006. |
||||||||||||
|
Naseem Sagati Aghili 1981 |
Vice President and Assistant Secretary |
Since 2019 |
Ms. Sagati Aghili is General Counsel of Ares Management and is a member of the Management Committee of Ares Management. Ms. Sagati Aghili also serves as Vice President and Assistant Secretary for the CION Ares Diversified Credit Fund. Ms. Sagati Aghili joined Ares in 2009. |
||||||||||||
(1) The address of each officer is care of the Secretary of the Fund at 2000 Avenue of the Stars, 12th Floor, Los Angeles, CA 90067.
Semi-Annual Report 2020
41

Item 2. Code of Ethics.
Not applicable for this filing.
Item 3. Audit Committee Financial Expert.
Not applicable for this filing.
Item 4. Principal Accountant Fees and Services.
Not applicable for this filing.
Item 5. Audit Committee of Listed Registrants.
Not applicable for this filing.
Item 6. Investments.
| (a) | Schedule of Investments is included as part of Item 1 of this Form N-CSR. |
| (b) | Not applicable. |
Item 7. Disclosure of Proxy Voting Policies and Procedures for Closed-End Investment Companies.
Not applicable for this filing.
Item 8. Portfolio Managers of Closed-End Management Investment Companies.
(a)(1) Not applicable for this filing.
(a)(2) Not applicable for this filing.
(a)(3) Not applicable for this filing.
(a)(4) Not applicable for this filing.
(b) There have been no changes to the portfolio managers identified in the most recently filed annual report on Form N-CSR (File No. 811-22535) of Ares Dynamic Credit Allocation Fund, Inc. (the “Fund”).
Item 9. Purchases of Equity Securities by Closed-End Management Investment Company and Affiliated Purchasers.
During the six months ended June 30, 2020, the following purchases were made by or on behalf of the Fund or any “affiliated purchaser”, as defined in Rule 10b-18(a)(3) under the Securities Exchange Act of 1934, as amended (the “1934 Act”) (17 CFR 240.10b-18(a)(3)), of shares of the Fund’s equity securities that are registered by the Fund pursuant to Section 12 of the 1934 Act.
| Period | (a) Total Number of Shares (or Units) Purchased | (b) Average Price Paid per Share (or Unit) | (c) Total Number of Shares (or Units) Purchased as Part of Publicly Announced Plans or Programs | (d) Maximum Number (or Approximate Dollar Value) of Shares (or Units) that May Yet Be Purchased Under the Plans or Programs | ||||||||
| Month #1 01/01/20 through 01/31/20 | None | --- | None | 1,781,899 | ||||||||
| Month #2 02/01/20 through 02/29/20 | None | --- | None | 1,781,899 | ||||||||
| Month #3 03/01/20 through 03/31/20 | None | --- | None | 1,781,899 | ||||||||
| Month #4 04/01/20 through 04/30/20 | None | --- | None | 1,781,899 | ||||||||
| Month #5 05/01/20 through 05/31/20 | None | --- | None | 1,781,899 | ||||||||
| Month #6 06/01/20 through 06/30/20 | None | --- | None | 1,781,899 | ||||||||
| Total | None | --- | None | ----- | ||||||||
(a), (b) On November 17, 2015, the Fund announced that its Board of Directors (the “Board”) had authorized the repurchase of shares of common stock of the Fund (the “Common Shares”) on the open market when the Common Shares are trading on the New York Stock Exchange at a discount of 10% or more (or such other percentage as the Board may determine from time to time) from the net asset value of the Common Shares. The Fund is authorized to repurchase up to 10% of its outstanding Common Shares. The Fund is not required to effect share repurchases.
| (c) | The above-referenced share repurchase program has no expiration date. |
(d), (e) Not applicable.
Item 10. Submission of Matters to a Vote of Security Holders.
There have been no material changes to the procedures by which shareholders may recommend nominees to the Fund’s Board of Directors during the period covered by this Form N-CSR filing.
Item 11. Controls and Procedures.
| (a) | The Fund’s principal executive and principal financial officers have concluded that the Fund’s disclosure controls and procedures (as defined in Rule 30a-3(c) under the Investment Company Act of 1940, as amended (the “1940 Act”) (17 CFR 270.30a-3(c)) are effective, as of a date within 90 days of the filing date of this Form N-CSR based on their evaluation of these controls and procedures required by Rule 30a-3(b) under the 1940 Act (17 CFR 270.30a-3(b)) and Rules 13a-15(b) or 15d-15(b) under the 1934 Act (17 CFR 240.13a-15(b) or 240.15d-15(b)). |
| (b) | There were no changes in the Fund’s internal control over financial reporting (as defined in Rule 30a-3(d) under the 1940 Act (17 CFR 270.30a-3(d))) that occurred during the period covered by this report that has materially affected, or is reasonably likely to materially affect, the Fund’s internal control over financial reporting. |
Item 12. Disclosure of Securities Lending Activities for Closed-End Management Investment Companies.
| (a) | Not applicable. |
| (b) | Not applicable. |
Item 13. Exhibits.
| (a)(1) | Not applicable for this filing. |
| (a)(2) | The certifications required by Rule 30a-2(a) under the 1940 Act (17 CFR 270.30a-2(a)) are attached hereto. |
| (a)(3) | Not applicable. |
| (a)(4) | Not applicable. |
| (a)(5) | Not applicable. |
| (b) | The certifications required by Rule 30a-2(b) under the 1940 Act (17 CFR 270.30a-2(b)) and Section 906 of the Sarbanes-Oxley Act of 2002 are attached hereto. |
SIGNATURES
Pursuant to the requirements of the Securities Exchange Act of 1934 and the Investment Company Act of 1940, the Fund has duly caused this report to be signed on its behalf by the undersigned, thereunto duly authorized.
| ARES DYNAMIC CREDIT ALLOCATION FUND, INC. | ||
| By: | /s/ Seth J. Brufsky | |
| Seth J. Brufsky | ||
| President and Chief Executive Officer | ||
| Date: | September 1, 2020 | |
Pursuant to the requirements of the Securities Exchange Act of 1934 and the Investment Company Act of 1940, this report has been signed below by the following persons on behalf of the Fund and in the capacities and on the dates indicated.
| By: | /s/ Seth J. Brufsky | |
| Seth J. Brufsky | ||
| President and Chief Executive Officer | ||
| Date: | September 1, 2020 | |
| By: | /s/ Scott C. Lem | |
| Scott C. Lem | ||
| Chief Financial Officer | ||
| Date: | September 1, 2020 | |