UNITED STATES
SECURITIES AND EXCHANGE
COMMISSION
Washington, D.C. 20549
FORM N-CSR
CERTIFIED SHAREHOLDER REPORT
OF
REGISTERED MANAGEMENT INVESTMENT COMPANIES
Investment Company Act file number: 811-22532
Name of Registrant: Royce Global Value Trust, Inc.
Address of Registrant: 745 Fifth Avenue
New York, NY 10151
| Name and address of agent for service: | John E. Denneen, Esq. | |
| 745 Fifth Avenue | ||
| New York, NY 10151 |
Registrant’s telephone
number, including area code: (212) 508-4500
Date of fiscal year end: December
31, 2017
Date of reporting period: January 1, 2017 – June 30, 2017
Item 1. Reports to Shareholders.
 |
| JUNE 30, 2017 | ||
| 2017 Semiannual | ||
| Review and Report to Stockholders | ||
| Royce Global Value Trust | |||
| Royce Micro-Cap Trust | |||
| Royce Value Trust | |||
| roycefunds.com |  |
||
A Few Words on Closed-End Funds |
||
Royce & Associates, LP manages three closed-end funds: Royce Global Value Trust, which invests primarily in
companies with headquarters outside of the United States, Royce Micro-Cap Trust, which invests primarily in
micro-cap securities; and Royce Value Trust, which invests primarily in small-cap securities. A closed-end fund is an
investment company whose shares are listed and traded on a stock exchange. Like all investment companies, including
open-end mutual funds, the assets of a closed-end fund are professionally managed in accordance with the investment
objectives and policies approved by the fund’s Board of Directors. A closed-end fund raises cash for investment by issuing
a fixed number of shares through initial and other public offerings that may include shelf offerings and periodic rights
offerings. Proceeds from the offerings are invested in an actively managed portfolio of securities. Investors wanting to buy
or sell shares of a publicly traded closed-end fund after the offerings must do so on a stock exchange, as with any publicly
traded stock. Shares of closed-end funds frequently trade at a discount to their net asset value. This is in contrast to open-end
mutual funds, which sell and redeem their shares at net asset value on a continuous basis. |
||
| A Closed-End Fund Can Offer Several Distinct Advantages | Why Dividend Reinvestment Is Important A very important component of an investor’s total return comes from the reinvestment of distributions. By reinvesting distributions, our investors can maintain an undiluted investment in a Fund. To get a fair idea of the impact of reinvested distributions, please see the charts on pages 55 and 56. For additional information on the Funds’ Distribution Reinvestment and Cash Purchase Options and the benefits for stockholders, please see page 57 or visit our website at www.roycefunds.com. Managed Distribution Policy The Board of Directors of each of Royce Micro-Cap Trust and Royce Value Trust has authorized a managed distribution policy (“MDP”). Under the MDP, Royce Micro-Cap Trust and Royce Value Trust pay quarterly distributions at an annual rate of 7% of the average of the prior four quarter-end net asset values, with the fourth quarter being the greater of these annualized rates or the distribution required by IRS regulations. With each distribution, the Fund will issue a notice to its stockholders and an accompanying press release that provides detailed information regarding the amount and composition of the distribution (including whether any portion of the distribution represents a return of capital) and other information required by a Fund’s MDP. You should not draw any conclusions about a Fund’s investment performance from the amount of distributions or from the terms of a Fund’s MDP. A Fund’s Board of Directors may amend or terminate the MDP at any time without prior notice to stockholders; however, at this time there are no reasonably foreseeable circumstances that might cause the termination of any of the MDPs. |
||||
| • | A closed-end fund does not issue redeemable securities or
offer its securities on a continuous basis, so it does not need to
liquidate securities or hold uninvested assets to meet investor
demands for cash redemptions. |
||||
| • | In a closed-end fund, not having to meet investor redemption
requests or invest at inopportune times can be effective for
value managers who attempt to buy stocks when prices are
depressed and sell securities when prices are high. |
||||
| • | A closed-end fund may invest in less liquid portfolio securities
because it is not subject to potential stockholder redemption
demands. This is potentially beneficial for Royce-managed
closed-end funds, with significant investments in small- and
micro-cap securities. |
||||
| • | The fixed capital structure allows permanent leverage to be
employed as a means to enhance capital appreciation potential. |
||||
| • | Royce Micro-Cap Trust and Royce Value Trust distribute capital
gains, if any, on a quarterly basis. Each of these Funds has adopted
a quarterly distribution policy for its common stock. |
||||
We believe that the closed-end fund structure can be an
appropriate investment for a long-term investor who understands
the benefits of a more stable pool of capital. |
|||||
This page is not part of the 2017 Semiannual Report to Stockholders |
| Table of Contents | |||
| Semiannual Review | |||
| Letter to Our Stockholders | 2 | ||
| Performance | 7 | ||
| Semiannual Report to Stockholders | |||
| Royce Global Value Trust | |||
Manager’s Discussion of Fund Performance |
8 | ||
Schedule of Investments |
10 | ||
Other Financial Statements |
14 | ||
| Royce Micro-Cap Trust | |||
Manager’s Discussion of Fund Performance |
22 | ||
Schedule of Investments |
24 | ||
Other Financial Statements |
29 | ||
| Royce Value Trust | |||
Manager’s Discussion of Fund Performance |
38 | ||
Schedule of Investments |
40 | ||
Other Financial Statements |
46 | ||
| History Since Inception | 55 | ||
| Distribution Reinvestment and Cash Purchase Options | 57 | ||
| Directors and Officers | 58 | ||
| Board Approval of Investment Advisory Agreements | 59 | ||
| Notes to Performance and Other Important Information | 61 |

| This page is not part of the 2017 Semiannual Report to Stockholders |
Letter to Our Stockholders
key reversals
| 2 | This page is not part of the 2017 Semiannual Report to Stockholders |
LETTER TO OUR STOCKHOLDERS
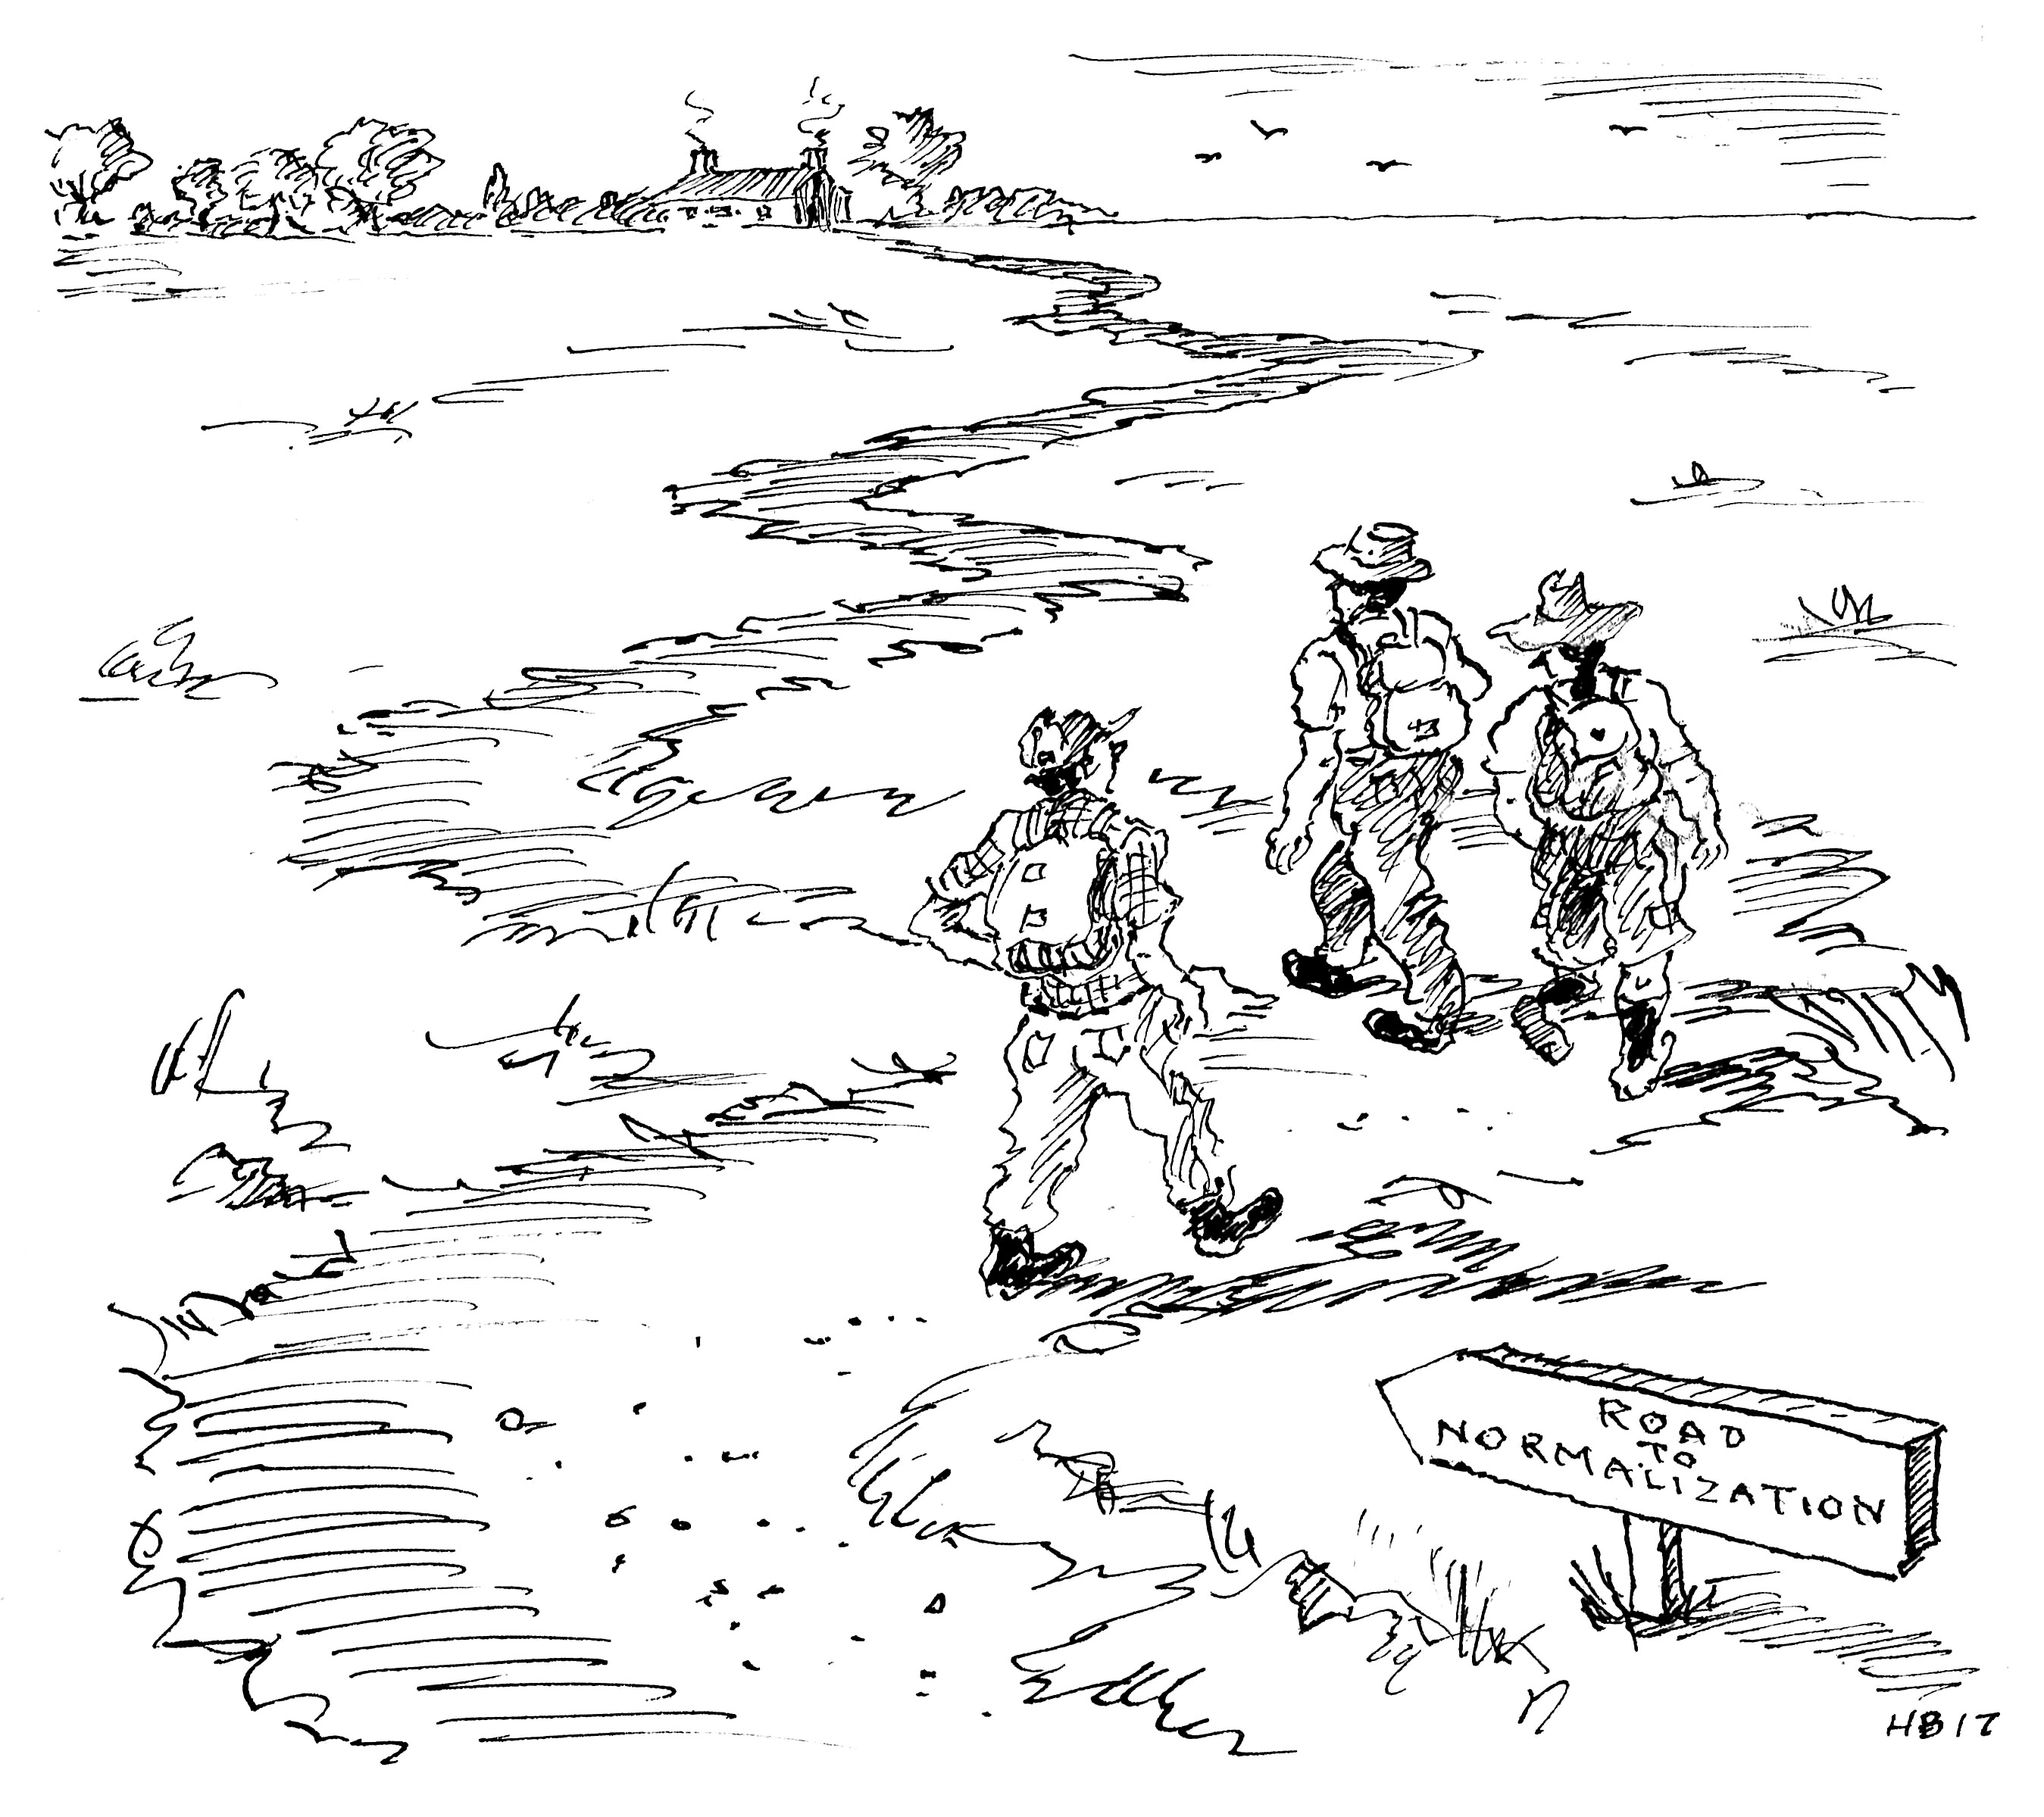
| It’s important to remember that we are still walking the road back to normalization. This is not a straight road—and it was never going to be. If 2017’s first half showed us anything, it was that the path back to normalization (and away from zero interest rates and abundant financial liquidity) will be a winding one with a few sharp twists and turns. |
| This page is not part of the 2017 Semiannual Report to Stockholders | 3 |
| 4 | This page is not part of the 2017 Semiannual Report to Stockholders |
LETTER TO OUR STOCKHOLDERS

| This page is not part of the 2017 Semiannual Report to Stockholders | 5 |
LETTER TO OUR STOCKHOLDERS
| Sincerely, |
 |
 |
 |
||
| Charles M. Royce | Christopher D. Clark | Francis D. Gannon | ||
| Chairman, | Chief Executive Officer, and | Co-Chief Investment Officer, | ||
| Royce & Associates, LP | Co-Chief Investment Officer, | Royce & Associates, LP | ||
| Royce & Associates, LP | ||||
| July 31, 2017 |
| 6 | This page is not part of the 2017 Semiannual Report to Stockholders |
Performance
| NAV Average Annual Total Returns As of June 30, 2017 (%) |
|||||||||||||||||||||
| YTD1 | 1-YR | 3-YR | 5-YR | 10-YR | 15-YR | 20-YR | 25-YR | 30-YR | SINCE INCEPTION |
INCEPTION DATE |
|||||||||||||
| Royce Global Value Trust | 16.11 | 24.23 | 3.43 | N/A | N/A | N/A | N/A | N/A | N/A | 5.06 | 10/17/13 | ||||||||||||
| Royce Micro-Cap Trust | 5.93 | 22.60 | 4.65 | 13.47 | 5.75 | 9.23 | 9.96 | N/A | N/A | 10.84 | 12/14/93 | ||||||||||||
| Royce Value Trust | 7.29 | 25.76 | 6.95 | 13.38 | 5.56 | 8.77 | 9.52 | 10.81 | 10.47 | 10.63 | 11/26/86 | ||||||||||||
| INDEX | |||||||||||||||||||||||
| Russell Global Small Cap Index | 10.47 | 21.47 | 4.50 | 10.82 | 3.92 | 9.39 | 6.94 | N/A | N/A | N/A | N/A | ||||||||||||
| Russell Microcap Index | 4.23 | 27.60 | 6.69 | 13.73 | 5.47 | 8.44 | N/A | N/A | N/A | N/A | N/A | ||||||||||||
| Russell 2000 Index | 4.99 | 24.60 | 7.36 | 13.70 | 6.92 | 9.19 | 7.98 | 9.89 | 9.03 | N/A | N/A | ||||||||||||
Important Performance and Risk Information
All performance information in this Review and Report reflects past performance, is presented on a total return basis, net of the Fund’s investment advisory fee, and reflects the reinvestment of distributions. Past performance is no guarantee of future results. Investment return and principal value of an investment will fluctuate, so that shares may be worth more or less than their original cost when sold. Current performance may be higher or lower than performance quoted. Current month-end performance may be obtained at www.roycefunds.com. The Funds are closed-end registered investment companies whose respective shares of common stock may trade at a discount to the net asset value. Shares of each Fund’s common stock are also subject to the market risk of investing in the underlying portfolio securities held by each Fund. Certain immaterial adjustments were made to the net assets of Royce Micro-Cap Trust at 12/31/12, as well as 12/31/14 and of Royce Value Trust at 12/31/16, for financial reporting purposes, and as a result the net asset value originally calculated on that date and the total return based on that net asset value differs from the adjusted net asset value and total return reported in the Financial Highlights. All indexes referenced are unmanaged and capitalization-weighted. Each index’s returns include net reinvested dividends and/or interest income. Russell Investment Group is the source and owner of the trademarks, service marks and copyrights related to the Russell Indexes. Russell® is a trademark of Russell Investment Group. The Russell 2000 Index is an index of domestic small-cap stocks that measures the performance of the 2,000 smallest publicly traded U.S. companies in the Russell 3000 Index. The Russell Microcap Index includes 1,000 of the smallest securities in the small-cap Russell 2000 Index, along with the next smallest eligible securities as determined by Russell. The Russell Global Small Cap Index is an unmanaged, capitalization-weighted index of global small-cap stocks. The performance of an index does not represent exactly any particular investment, as you cannot invest directly in an index. Index returns include net reinvested dividends and/or interest income. Royce Value, Micro-Cap and Global Value Trust shares of common stock trade on the NYSE. Royce Fund Services, Inc (“RFS”) is a member of FINRA and files certain material with FINRA on behalf of each Fund. RFS is not an underwriter or distributor of any of the Funds.
| This page is not part of the 2017 Semiannual Report to Stockholders | 7 |
| MANAGER’S DISCUSSION |
| Royce Global Value Trust (RGT) |
 |
Chuck Royce |
| FUND PERFORMANCE |
| Royce Global Value Trust (“RGT”) advanced 16.1% on a net asset value (“NAV”) basis and 19.6% on a market price basis for the year-to-date period ended June 30, 2017, significantly outperforming its unleveraged benchmark, the Russell Global Small Cap Index, which was up 10.5% for the same period. These were impressive results on both an absolute and relative basis. We were especially pleased that positive performances came from holdings in the U.S., the U.K., Japan, and more than 20 other countries in the first half. Indeed, after several years in which international small-caps languished, their recent resurgence has been more than welcome, especially as more than two-thirds of RGT’s net assets were invested in non-U.S. companies at the end of June compared to 58.7% for the benchmark. |
| Getting off to a fast start, the Fund climbed 7.9% on an NAV basis and 9.4% on a market price basis for the first quarter, outperforming its benchmark, which was up 6.0% for the same period. This trend continued in the second quarter, in which RGT’s results tracked very closely to its first-quarter returns. The Fund was up 7.6% based on NAV and rose 9.3% based on market price compared to 4.2% for the Russell Global Small Cap Index in the second quarter. We were also pleased that the Fund outperformed its global small-cap benchmark for the one-year period ended June 30, 2017 on both an NAV and market price basis. |
| WHAT WORKED... AND WHAT DIDN’T |
| Nine of the Fund’s 10 equity sectors finished the semiannual period in
the black. Industrials and Information Technology led by fairly wide
margins, though notable contributions also came from Financials
and Health Care. At the industry level, four groups made particularly
notable gains, led by capital markets (Financials), which has long
been an area of focus for us, especially on a global level. Strong results
also came from electronic equipment, instruments & components,
health care equipment & supplies, and IT services. The first and third
of these groups are in Information Technology, the second in Health
Care. (Along with Industrials, these were the top-contributing sectors
to the Russell Global Small Cap’s first-half performance.) At the position level, the portfolio’s top contributor was Indian consumer finance company Bajaj Finance, which rebounded off a relatively weak fourth quarter of 2016 owing to the government’s surprising decision to demonetize in November. During the first half of 2017, however, fiscal third-quarter results (released in January) revealed margin improvement and high asset quality while fiscal fourth-quarter results, which came in May, showed the strength of Bajaj’s 320-city presence in consumer and commercial lending operations. Although we trimmed our stake as its shares climbed, we believe the company can continue to benefit from its strong position in India’s nascent credit markets. The stock of California-based laser diode and equipment maker Coherent was galvanized by ongoing sales and earnings growth driven by vibrant demand for ramped up OLED (organic light-emitting diode) capacity. Raven Industries, also a U.S. firm, provides precision agriculture products, high-performance specialty films, and what it calls lighter-than-air technologies. Its shares rose on improvements in consolidated sales and earnings, driven by strength in the firm’s Applied Technology and Engineered Films units. |
| Hurt by falling oil prices, Energy was the only sector that detracted
from first-half performance, though its negative impact was comparably
modest. Unsurprisingly, the portfolio industries that detracted most
come from this same sector—energy equipment & services and oil,
gas & consumable fuels. The top detractor at the position level was
SEACOR Holdings, which provides marine transportation equipment
and logistics services mostly for the energy and agricultural markets.
Its earnings remained pressured by ongoing weakness in the offshore
marine vessel business, which was exacerbated by the decline in oil prices
in the first half, as well as overcapacity in its inland river barge and tow
business. From the otherwise strong capital markets group, Toronto-based
Dundee Corporation, which is involved in wealth management,
real estate, and natural resources, experienced losses in mining- and
resource-based activities that put downward pressure on its shares. Relative to the Russell Global Small Cap, the Fund benefited most from savvy stock selection in Financials, especially in capital markets and consumer finance. Also helping were superior stock picks in Industrials and Information Technology. The impact of relative detractors was far less significant and included ineffective stock picks in the Materials sector and our underweight in Telecommunication Services. |
| Top Contributors to Performance | |||
| Year-to-Date Through 6/30/17 (%)1 | |||
| Bajaj Finance | 0.59 | ||
| Coherent | 0.43 | ||
| Raven Industries | 0.38 | ||
| Cognex Corporation | 0.36 | ||
| Relo Group | 0.33 | ||
| 1 Includes dividends | |||
| Top Detractors from Performance | |||
| Year-to-Date Through 6/30/17 (%)2 | |||
| SEACOR Holdings | -0.25 | ||
| Dundee Corporation Cl. A | -0.17 | ||
| MBIA | -0.11 | ||
| Signet Jewelers | -0.10 | ||
| KBR | -0.09 | ||
| 2 Net of dividends | |||
| CURRENT POSITIONING AND OUTLOOK |
| Even after the strong start to 2017, we continue to find attractive opportunities in both U.S. and international companies. Select valuations in many parts of the world, including the U.S., still looked attractive to us at the end of June, especially in the context of expanding global growth. Recent data showed that the second quarter of 2017 was the eurozone’s best in more than six years, boosted by strong manufacturing numbers, job growth, and elevated business confidence. Additionally, in mid-July China reported surprisingly strong GDP growth for the second quarter, driven by increased retail sales, investment, and industry output. We are also confident in the prospects for smaller companies with earnings growth here in the U.S. |
| 8 | 2017 Semiannual Report to Stockholders |
| PERFORMANCE AND PORTFOLIO REVIEW | SYMBOLS MARKET PRICE RGT NAV XRGTX |
|
Performance Average Annual Total Return (%) Through 6/30/17 |
||||||||||||
| JAN-JUN 20171 | 1-YR | 3-YR | SINCE INCEPTION (10/17/13) | |||||||||
| RGT (NAV) | 16.11 | 24.23 | 3.43 | 5.06 | ||||||||
| 1 Not Annualized | ||||||||||||
|
Market Price Performance History Since Inception (10/17/13) Cumulative Performance of Investment1 |
||||||||||||
| 1-YR | 5-YR | 10-YR | 15-YR | 20-YR | SINCE INCEPTION (10/17/13) | |||||||
| RGT | 28.7% | N/A | N/A | N/A | N/A | 12.5% | ||||||
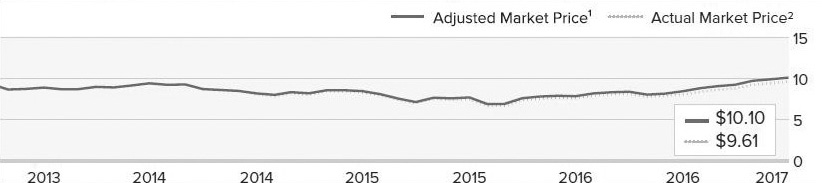 |
| 1 | Reflects the cumulative performance experience of a continuous common stockholder who purchased one share at inception ($8.975 IPO) and reinvested all distributions. |
| 2 | Reflects the actual month-end market price movement of one share as it has traded on NYSE and, prior to 12/1/03, on the Nasdaq. |
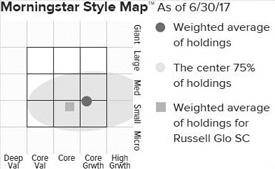
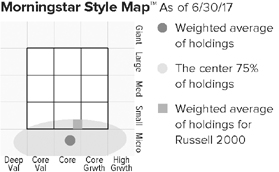
The Morningstar Style Map is the Morningstar Style Box™
with the center 75% of fund holdings plotted as the Morningstar
Ownership Zone™. The Morningstar Style Box is designed to reveal a
fund’s investment strategy. The Morningstar Ownership Zone provides
detail about a portfolio’s investment style by showing the range of
stock sizes and styles. The Ownership Zone is derived by plotting each
stock in the portfolio within the proprietary Morningstar Style Box.
Over time, the shape and location of a fund's ownership zone may vary.
See page 61 for additional information. |
| Top 10 Positions | ||
| % of Net Assets | ||
| Kirby Corporation | 1.9 | |
| SEI Investments | 1.9 | |
| Raven Industries | 1.4 | |
| Lazard Cl. A | 1.3 | |
| VZ Holding | 1.3 | |
| Cognex Corporation | 1.2 | |
| Virtu Financial Cl. A | 1.1 | |
| Ashmore Group | 1.1 | |
| Spirax-Sarco Engineering | 1.1 | |
| Clarkson | 1.1 | |
| Portfolio Sector Breakdown | ||
| % of Net Assets | ||
| Industrials | 26.7 | |
| Information Technology | 17.9 | |
| Financials | 17.3 | |
| Materials | 11.1 | |
| Health Care | 10.7 | |
| Consumer Discretionary | 7.7 | |
| Consumer Staples | 3.4 | |
| Real Estate | 2.7 | |
| Energy | 2.7 | |
| Telecommunication Services | 0.1 | |
| Outstanding Line of Credit, Net of Cash and Cash Equivalents | -0.3 | |
| Calendar Year Total Returns (%) | ||
YEAR |
RGT | |
| 2016 | 11.1 | |
| 2015 | -3.4 | |
| 2014 | -6.2 | |
| Portfolio Country Breakdown1,2 % of Net Assets |
|||
| United States | 31.8 | ||
| United Kingdom | 11.6 | ||
| Japan | 9.9 | ||
| Canada | 8.6 | ||
| France | 4.4 | ||
| Germany | 4.3 | ||
| Switzerland | 4.0 | ||
| 1 | Represents countries that are 3% or more of net assets. |
| 2 | Securities are categorized by the country of their headquarters. |
| Portfolio Diagnostics | |||
| Fund Net Assets | $116 million | ||
| Number of Holdings | 265 | ||
| Turnover Rate | 10% | ||
| Net Asset Value | $11.17 | ||
| Market Price | $9.61 | ||
| Net Leverage1 | 0.4% | ||
| Average Market Capitalization2 | $1,864 million | ||
| Weighted Average P/E Ratio3,4 | 22.9x | ||
| Weighted Average P/B Ratio3 | 2.8x | ||
| Active Share5 | 97% | ||
| 1 | Net leverage is the percentage, in excess of 100%, of the total value of
equity type investments, divided by net assets. |
| 2 | Geometric Average. This weighted calculation uses each portfolio
holding’s market cap in a way designed to not skew the effect of
very large or small holdings; instead, it aims to better identify
the portfolio’s center, which Royce believes offers a more accurate
measure of average market cap than a simple mean or median. |
| 3 | Harmonic Average. This weighted calculation evaluates a portfolio
as if it were a single stock and measures it overall. It compares the
total market value of the portfolio to the portfolio’s share in the
earnings or book value, as the case may be, of its underlying stocks. |
| 4 | The Fund’s P/E ratio calculation excludes companies with zero or
negative earnings (8% of portfolio holdings as of 6/30/17). |
| 5 | Active Share is the sum of the absolute values of the different
weightings of each holding in the Fund versus each holding in the
benchmark, divided by two. |
| Important Performance and Risk Information |
All performance information reflects past performance, is presented on a total return basis, net of the Fund’s investment advisory fee, and reflects the reinvestment of distributions. Past performance is no guarantee of future results. Current performance may be higher or lower than performance quoted. Returns as of the most recent month-end may be obtained at www.roycefunds.com. The market price of the Fund’s shares will fluctuate, so that shares may be worth more or less than their original cost when sold. The Fund invests primarily in securities of small- and mid-cap companies, which may involve considerably more risk than investments in securities of larger-cap companies. The Fund’s broadly diversified portfolio does not ensure a profit or guarantee against loss. From time to time, the Fund may invest a significant portion of its net assets in foreign securities, which may involve political, economic, currency and other risks not encountered in U.S. investments. Regarding the “Top Contributors” and “Top Detractors” tables shown above, the sum of all contributors to, and all detractors from, performance for all securities in the portfolio would approximate the Fund’s year-to-date performance for 2017. |
| 2017 Semiannual Report to Stockholders | 9 |
Royce Global Value Trust
| Schedule of Investments |
| Common Stocks – 100.3% |
| SHARES | VALUE | |||||||
| AUSTRALIA – 2.6% | ||||||||
ALS |
125,000 | $ | 715,759 | |||||
Austal |
87,400 | 122,931 | ||||||
| 56,800 | 30,560 | |||||||
Cochlear |
5,500 | 657,134 | ||||||
†Hansen Technologies |
100,000 | 310,514 | ||||||
IPH |
190,000 | 700,963 | ||||||
†Mantra Group |
96,700 | 226,687 | ||||||
NetComm Wireless 1 |
26,700 | 35,297 | ||||||
Programmed Maintenance Services |
60,500 | 86,723 | ||||||
Seeing Machines 1 |
1,084,800 | 54,750 | ||||||
†Tassal Group |
29,400 | 86,094 | ||||||
| Total (Cost $2,638,669) | 3,027,412 | |||||||
| AUSTRIA – 0.9% | ||||||||
Mayr-Melnhof Karton |
7,900 | 1,033,131 | ||||||
| Total (Cost $913,613) | 1,033,131 | |||||||
| BELGIUM – 0.1% | ||||||||
†Greenyard |
6,600 | 156,342 | ||||||
| Total (Cost $124,361) | 156,342 | |||||||
| BERMUDA – 1.3% | ||||||||
Lazard Cl. A |
32,600 | 1,510,358 | ||||||
| Total (Cost $1,010,334) | 1,510,358 | |||||||
| BRAZIL – 1.8% | ||||||||
†BM&FBOVESPA |
32,847 | 195,819 | ||||||
| 274,931 | 73,047 | |||||||
Minerva |
52,500 | 195,078 | ||||||
OdontoPrev |
200,000 | 703,311 | ||||||
T4F Entretenimento |
44,000 | 81,681 | ||||||
TOTVS |
88,000 | 801,135 | ||||||
| Total (Cost $2,278,574) | 2,050,071 | |||||||
| CANADA – 8.6% | ||||||||
Agnico Eagle Mines 2 |
5,000 | 225,600 | ||||||
AGT Food and Ingredients |
6,000 | 107,711 | ||||||
Altus Group |
9,900 | 213,986 | ||||||
Cameco Corporation 2 |
24,500 | 222,950 | ||||||
Canaccord Genuity Group |
92,000 | 378,131 | ||||||
Computer Modelling Group |
108,000 | 847,810 | ||||||
Dundee Corporation Cl. A 1 |
80,000 | 175,817 | ||||||
E-L Financial |
1,200 | 781,925 | ||||||
Exco Technologies |
23,500 | 193,538 | ||||||
FirstService Corporation |
10,300 | 658,994 | ||||||
Franco-Nevada Corporation 2 |
10,200 | 736,032 | ||||||
Genworth MI Canada |
13,000 | 357,681 | ||||||
Gluskin Sheff + Associates |
23,000 | 297,077 | ||||||
Magellan Aerospace |
18,800 | 293,424 | ||||||
Major Drilling Group International 1 |
160,500 | 1,050,775 | ||||||
Morneau Shepell |
35,000 | 562,461 | ||||||
| 31,800 | 534,876 | |||||||
Sandstorm Gold 1 |
25,300 | 97,911 | ||||||
Solium Capital 1 |
72,400 | 547,690 | ||||||
Sprott |
520,600 | 915,305 | ||||||
Western Forest Products |
123,100 | 222,127 | ||||||
Winpak |
13,500 | 606,084 | ||||||
| Total (Cost $10,882,436) | 10,027,905 | |||||||
| CHINA – 0.9% | ||||||||
China Communications Services |
118,400 | 68,243 | ||||||
TravelSky Technology |
250,000 | 736,476 | ||||||
†Xingda International Holdings |
321,000 | 129,922 | ||||||
Xtep International Holdings |
191,600 | 73,867 | ||||||
| Total (Cost $627,507) | 1,008,508 | |||||||
| CYPRUS – 0.3% | ||||||||
Globaltrans Investment GDR |
42,000 | 319,200 | ||||||
| Total (Cost $212,014) | 319,200 | |||||||
| DENMARK – 1.9% | ||||||||
Chr. Hansen Holding |
9,000 | 654,573 | ||||||
Coloplast Cl. B |
7,000 | 584,915 | ||||||
SimCorp |
7,500 | 454,353 | ||||||
Zealand Pharma 1 |
24,000 | 481,080 | ||||||
| Total (Cost $1,550,713) | 2,174,921 | |||||||
| FRANCE – 4.4% | ||||||||
Bigben Interactive 1 |
10,000 | 110,332 | ||||||
HighCo |
16,200 | 115,643 | ||||||
Interparfums |
16,500 | 624,350 | ||||||
Manutan International |
900 | 88,927 | ||||||
Neurones |
22,250 | 684,113 | ||||||
Rothschild & Co |
33,000 | 1,204,602 | ||||||
Thermador Groupe |
9,500 | 1,011,259 | ||||||
Vetoquinol |
10,000 | 583,867 | ||||||
Virbac 1 |
4,500 | 722,124 | ||||||
| Total (Cost $3,880,469) | 5,145,217 | |||||||
| GEORGIA – 0.1% | ||||||||
BGEO Group |
2,200 | 100,117 | ||||||
| Total (Cost $63,649) | 100,117 | |||||||
| GERMANY – 4.3% | ||||||||
Bertrandt |
2,000 | 200,470 | ||||||
CANCOM |
3,700 | 224,948 | ||||||
Carl Zeiss Meditec |
17,500 | 908,237 | ||||||
CompuGroup Medical |
12,500 | 701,423 | ||||||
Fielmann |
8,000 | 617,126 | ||||||
HolidayCheck Group 1 |
25,100 | 87,982 | ||||||
KWS Saat |
1,800 | 708,144 | ||||||
MorphoSys 1 |
6,000 | 425,565 | ||||||
mutares |
5,000 | 77,552 | ||||||
STRATEC Biomedical |
15,000 | 983,391 | ||||||
VIB Vermoegen |
3,600 | 85,031 | ||||||
| Total (Cost $3,732,480) | 5,019,869 | |||||||
| GREECE – 0.2% | ||||||||
Aegean Marine Petroleum Network 2 |
2,500 | 14,625 | ||||||
Hellenic Exchanges - Athens Stock Exchange |
28,000 | 181,648 | ||||||
| Total (Cost $160,960) | 196,273 | |||||||
| HONG KONG – 1.9% | ||||||||
| 2,500,000 | 0 | |||||||
China Metal International Holdings |
430,000 | 160,270 | ||||||
First Pacific |
180,000 | 132,796 | ||||||
HKBN |
105,900 | 106,206 | ||||||
I.T |
365,800 | 180,383 | ||||||
Oriental Watch Holdings |
465,900 | 101,445 | ||||||
Pico Far East Holdings |
418,200 | 175,155 | ||||||
| 10 | 2017 Semiannual Report to Stockholders | THE ACCOMPANYING NOTES ARE AN INTEGRAL PART OF THESE FINANCIAL STATEMENTS |
June 30, 2017 (unaudited)
| Schedule of Investments (continued) |
| SHARES | VALUE | |||||||
| HONG KONG (continued) | ||||||||
Television Broadcasts |
54,000 | $ | 203,344 | |||||
Value Partners Group |
1,275,000 | 1,161,103 | ||||||
| Total (Cost $2,495,560) | 2,220,702 | |||||||
| INDIA – 2.1% | ||||||||
Bajaj Finance |
53,500 | 1,136,878 | ||||||
IIFL Holdings |
5,500 | 51,522 | ||||||
Kewal Kiran Clothing |
6,500 | 172,562 | ||||||
Manappuram Finance |
55,100 | 83,199 | ||||||
SH Kelkar & Company 1 |
85,000 | 345,918 | ||||||
†Vakrangee |
95,000 | 632,059 | ||||||
| Total (Cost $1,546,947) | 2,422,138 | |||||||
| INDONESIA – 0.6% | ||||||||
Selamat Sempurna |
8,000,000 | 723,316 | ||||||
| Total (Cost $716,411) | 723,316 | |||||||
| IRELAND – 0.6% | ||||||||
| 12,300 | 100,245 | |||||||
Irish Continental Group |
26,700 | 154,917 | ||||||
Irish Residential Properties REIT |
57,281 | 88,976 | ||||||
Keywords Studios |
37,500 | 364,604 | ||||||
| Total (Cost $417,749) | 708,742 | |||||||
| ISRAEL – 0.4% | ||||||||
†Frutarom Industries |
5,000 | 349,879 | ||||||
| 3,600 | 79,524 | |||||||
Sarine Technologies |
25,700 | 28,747 | ||||||
| Total (Cost $407,197) | 458,150 | |||||||
| ITALY – 0.9% | ||||||||
| 22,000 | 125,636 | |||||||
DiaSorin |
10,000 | 768,096 | ||||||
| 9,800 | 117,751 | |||||||
| Total (Cost $668,671) | 1,011,483 | |||||||
| JAPAN – 9.9% | ||||||||
Ai Holdings |
30,000 | 806,846 | ||||||
†Ateam |
5,500 | 145,721 | ||||||
C. Uyemura & Co. |
1,300 | 66,806 | ||||||
GCA |
11,000 | 97,995 | ||||||
G-Tekt |
3,100 | 57,659 | ||||||
Horiba |
10,000 | 607,246 | ||||||
†IDOM |
29,600 | 203,956 | ||||||
Inabata & Co. |
6,500 | 86,050 | ||||||
†Investors Cloud |
2,600 | 126,677 | ||||||
Itochu Techno-Solutions |
3,000 | 104,823 | ||||||
Kenedix |
16,900 | 79,636 | ||||||
Kenko Mayonnaise |
3,300 | 95,061 | ||||||
Kintetsu World Express |
4,000 | 70,487 | ||||||
Leopalace21 |
10,600 | 65,782 | ||||||
Mandom Corporation |
1,600 | 86,633 | ||||||
Maruwa Unyu Kikan |
950 | 35,432 | ||||||
Meitec Corporation |
26,300 | 1,118,875 | ||||||
Miraca Holdings |
1,400 | 62,858 | ||||||
MISUMI Group |
43,800 | 999,251 | ||||||
Nabtesco |
2,400 | 69,669 | ||||||
Nifco |
1,300 | 69,696 | ||||||
Nihon Kohden |
35,000 | 807,202 | ||||||
NS Solutions |
4,900 | 116,319 | ||||||
Open House |
2,900 | 89,211 | ||||||
Outsourcing |
2,200 | 107,188 | ||||||
Pressance |
3,700 | 48,752 | ||||||
Relo Group |
57,500 | 1,118,049 | ||||||
Ryobi |
16,100 | 65,416 | ||||||
Santen Pharmaceutical |
80,000 | 1,083,974 | ||||||
Shimano |
3,500 | 553,279 | ||||||
SPARX Group |
55,100 | 105,816 | ||||||
Sugi Holdings |
12,500 | 669,038 | ||||||
Sun Frontier Fudousan |
7,300 | 73,211 | ||||||
Tokai Corporation |
1,800 | 71,216 | ||||||
| 19,800 | 95,237 | |||||||
USS |
62,500 | 1,240,831 | ||||||
†Yumeshin Holdings |
13,500 | 89,660 | ||||||
†Zenkoku Hosho |
4,000 | 163,414 | ||||||
| Total (Cost $8,584,143) | 11,554,972 | |||||||
| MEXICO – 0.8% | ||||||||
| 200,000 | 341,070 | |||||||
Bolsa Mexicana de Valores |
250,000 | 439,149 | ||||||
Rassini 1 |
23,400 | 115,396 | ||||||
| Total (Cost $897,653) | 895,615 | |||||||
| NETHERLANDS – 0.1% | ||||||||
†AMG Advanced Metallurgical Group |
2,400 | 70,105 | ||||||
Constellium Cl. A 1 |
8,900 | 61,410 | ||||||
| Total (Cost $104,166) | 131,515 | |||||||
| NEW ZEALAND – 0.8% | ||||||||
Fisher & Paykel Healthcare |
100,891 | 846,532 | ||||||
New Zealand Refining |
43,100 | 77,064 | ||||||
| Total (Cost $643,361) | 923,596 | |||||||
| NORWAY – 1.2% | ||||||||
Nordic Semiconductor 1 |
28,300 | 112,539 | ||||||
NRC Group |
10,900 | 73,113 | ||||||
†Protector Forsikring |
10,500 | 88,037 | ||||||
| TGS-NOPEC Geophysical | 55,000 | 1,127,175 | ||||||
| Total (Cost $1,350,045) | 1,400,864 | |||||||
| PHILIPPINES – 0.2% | ||||||||
Integrated Micro-Electronics |
756,900 | 199,500 | ||||||
Universal Robina |
22,500 | 72,637 | ||||||
| Total (Cost $155,675) | 272,137 | |||||||
| POLAND – 0.4% | ||||||||
Warsaw Stock Exchange |
33,000 | 434,758 | ||||||
| Total (Cost $459,764) | 434,758 | |||||||
| SINGAPORE – 0.8% | ||||||||
CSE Global |
320,300 | 100,039 | ||||||
†Duty Free International |
563,080 | 101,372 | ||||||
XP Power |
25,000 | 790,912 | ||||||
| Total (Cost $781,924) | 992,323 | |||||||
| SOUTH AFRICA – 0.5% | ||||||||
Adcock Ingram Holdings |
24,100 | 108,871 | ||||||
Coronation Fund Managers |
59,000 | 293,997 | ||||||
JSE |
15,000 | 140,466 | ||||||
Raubex Group |
46,100 | 84,677 | ||||||
| Total (Cost $715,434) | 628,011 | |||||||
| THE ACCOMPANYING NOTES ARE AN INTEGRAL PART OF THESE FINANCIAL STATEMENTS | 2017 Semiannual Report to Stockholders | 11 |
Royce Global Value Trust
| Schedule of Investments (continued) |
| SHARES | VALUE | |||||||
| SOUTH KOREA – 0.5% | ||||||||
Koh Young Technology |
3,200 | $ | 167,810 | |||||
KT Skylife |
11,600 | 165,765 | ||||||
Modetour Network |
7,494 | 207,303 | ||||||
| Total (Cost $398,205) | 540,878 | |||||||
| SPAIN – 0.1% | ||||||||
| 16,400 | 182,860 | |||||||
| Total (Cost $181,133) | 182,860 | |||||||
| SWEDEN – 2.2% | ||||||||
Addtech Cl. B |
53,960 | 1,027,999 | ||||||
| 10,000 | 98,520 | |||||||
Bravida Holding |
100,000 | 730,590 | ||||||
Byggmax Group |
21,400 | 155,584 | ||||||
Dustin Group |
19,500 | 162,023 | ||||||
Hoist Finance |
8,000 | 81,902 | ||||||
Knowit |
6,200 | 95,487 | ||||||
Proact IT Group |
7,600 | 184,481 | ||||||
| Total (Cost $1,981,794) | 2,536,586 | |||||||
| SWITZERLAND – 4.0% | ||||||||
Burckhardt Compression Holding |
2,500 | 716,967 | ||||||
dormakaba Holding |
800 | 694,963 | ||||||
LEM Holding |
600 | 775,889 | ||||||
Partners Group Holding |
1,600 | 991,970 | ||||||
VZ Holding |
4,600 | 1,476,327 | ||||||
| Total (Cost $3,291,021) | 4,656,116 | |||||||
| TAIWAN – 1.0% | ||||||||
Egis Technology 1 |
9,600 | 65,641 | ||||||
Flytech Technology |
32,780 | 106,896 | ||||||
†Formosa Laboratories |
58,100 | 166,737 | ||||||
Gourmet Master |
11,330 | 122,164 | ||||||
Posiflex Technology |
17,404 | 94,401 | ||||||
†Sinmag Equipment |
15,000 | 87,771 | ||||||
Sitronix Technology |
40,400 | 124,573 | ||||||
Sporton International |
26,997 | 136,671 | ||||||
Taiwan Paiho |
42,500 | 159,969 | ||||||
TCI |
21,700 | 138,033 | ||||||
| Total (Cost $1,114,367) | 1,202,856 | |||||||
| THAILAND – 0.1% | ||||||||
†Krungthai Card |
30,800 | 108,802 | ||||||
| Total (Cost $117,472) | 108,802 | |||||||
| TURKEY – 0.1% | ||||||||
Tat Gida Sanayi |
74,700 | 151,377 | ||||||
| Total (Cost $148,678) | 151,377 | |||||||
| UNITED KINGDOM – 11.6% | ||||||||
Abcam |
30,000 | 380,380 | ||||||
Ashmore Group |
279,000 | 1,283,470 | ||||||
AVEVA Group |
18,500 | 467,449 | ||||||
Avon Rubber |
8,700 | 115,579 | ||||||
Character Group |
11,400 | 71,641 | ||||||
Clarkson |
38,100 | 1,253,485 | ||||||
Computacenter |
14,800 | 156,331 | ||||||
Connect Group |
68,500 | 100,593 | ||||||
Consort Medical |
64,800 | 881,967 | ||||||
Conviviality |
51,600 | 206,996 | ||||||
Diploma |
30,000 | 431,762 | ||||||
dotdigital group |
150,200 | 132,049 | ||||||
Elementis |
175,000 | 670,338 | ||||||
Epwin Group |
47,500 | 68,053 | ||||||
Equiniti Group |
200,000 | 650,574 | ||||||
Ferroglobe |
41,100 | 491,145 | ||||||
| 41,100 | 0 | |||||||
Fidessa Group |
10,000 | 301,778 | ||||||
Finsbury Food Group |
66,400 | 100,320 | ||||||
Hilton Food Group |
19,200 | 184,552 | ||||||
Inspired Energy |
143,000 | 32,594 | ||||||
ITE Group |
350,000 | 702,020 | ||||||
Jupiter Fund Management |
36,000 | 236,785 | ||||||
| 3,000 | 25,593 | |||||||
Norcros |
57,560 | 136,444 | ||||||
Pendragon |
278,600 | 112,487 | ||||||
Polypipe Group |
60,000 | 298,756 | ||||||
Rank Group |
40,000 | 123,577 | ||||||
Real Estate Investors |
90,000 | 70,918 | ||||||
Rotork |
175,000 | 536,544 | ||||||
Spirax-Sarco Engineering |
18,000 | 1,254,259 | ||||||
Stallergenes Greer 1 |
10,800 | 465,408 | ||||||
Victrex |
40,000 | 977,358 | ||||||
Xaar |
115,000 | 566,175 | ||||||
| Total (Cost $13,467,956) | 13,487,380 | |||||||
| UNITED STATES – 31.8% | ||||||||
Air Lease Cl. A |
30,700 | 1,146,952 | ||||||
| 18,100 | 392,589 | |||||||
Century Casinos 1 |
21,400 | 157,718 | ||||||
CIRCOR International |
18,100 | 1,074,778 | ||||||
Cognex Corporation |
17,100 | 1,451,790 | ||||||
Coherent 1 |
5,000 | 1,124,950 | ||||||
Commercial Metals |
42,000 | 816,060 | ||||||
Copart 1 |
37,200 | 1,182,588 | ||||||
| 28,800 | 806,400 | |||||||
Diodes 1 |
20,500 | 492,615 | ||||||
DST Systems |
11,600 | 715,720 | ||||||
EnerSys 2 |
11,000 | 796,950 | ||||||
Expeditors International of Washington 2 |
13,300 | 751,184 | ||||||
| 14,100 | 488,706 | |||||||
Greif Cl. A 2 |
8,700 | 485,286 | ||||||
| 12,457 | 816,557 | |||||||
Kadant |
7,800 | 586,560 | ||||||
KBR 2 |
73,400 | 1,117,148 | ||||||
| 32,900 | 2,199,365 | |||||||
Lindsay Corporation |
13,700 | 1,222,725 | ||||||
Littelfuse |
5,000 | 825,000 | ||||||
ManpowerGroup |
11,000 | 1,228,150 | ||||||
MBIA 1 |
80,300 | 757,229 | ||||||
| 44,500 | 1,125,405 | |||||||
| 19,000 | 764,180 | |||||||
| 50,000 | 432,000 | |||||||
Oaktree Capital Group LLC Cl. A |
10,400 | 484,640 | ||||||
Popular |
13,100 | 546,401 | ||||||
Quaker Chemical 2 |
8,400 | 1,219,932 | ||||||
Raven Industries |
50,000 | 1,665,000 | ||||||
| 12 | 2017 Semiannual Report to Stockholders | THE ACCOMPANYING NOTES ARE AN INTEGRAL PART OF THESE FINANCIAL STATEMENTS |
June 30, 2017 (unaudited)
| Schedule of Investments (continued) |
| SHARES | VALUE | |||||||
| UNITED STATES (continued) | ||||||||
| 6,000 | $ | 651,720 | ||||||
Schnitzer Steel Industries Cl. A 2 |
19,100 | 481,320 | ||||||
SEACOR Holdings 1 |
20,200 | 692,860 | ||||||
| 20,309 | 413,491 | |||||||
SEI Investments 2 |
40,600 | 2,183,468 | ||||||
| 9,500 | 765,035 | |||||||
Signet Jewelers |
5,500 | 347,820 | ||||||
Standard Motor Products |
11,200 | 584,864 | ||||||
Sun Hydraulics 2 |
15,139 | 645,981 | ||||||
| 11,600 | 856,080 | |||||||
Valmont Industries |
4,500 | 673,200 | ||||||
Virtu Financial Cl. A |
74,300 | 1,311,395 | ||||||
World Fuel Services |
12,000 | 461,400 | ||||||
| Total (Cost $29,763,578) | 36,943,212 | |||||||
| URUGUAY – 0.3% | ||||||||
| 46,800 | 348,660 | |||||||
| Total (Cost $351,426) | 348,660 | |||||||
| TOTAL COMMON STOCKS | ||||||||
| (Cost $98,836,109) | 116,706,373 | |||||||
| REPURCHASE AGREEMENT – 6.6% | ||||||||
| Fixed Income
Clearing Corporation, 0.12% dated 6/30/17, due 7/3/17, maturity value $7,657,077 (collateralized by obligations of various U.S. Government Agencies, 2.375% due 8/15/24, valued at $7,812,982) |
||||||||
| (Cost $7,657,000) | 7,657,000 | |||||||
| TOTAL INVESTMENTS – 106.9% | ||||||||
| (Cost $106,493,109) | 124,363,373 | |||||||
| LIABILITIES LESS CASH AND OTHER ASSETS – (6.9)% | (8,048,860 | ) | ||||||
| NET ASSETS – 100.0% | $ | 116,314,513 | ||||||
| † | New additions in 2017. |
| 1 | Non-income producing. |
| 2 | All or a portion
of these securities were pledged as collateral in connection with the Fund’s revolving credit agreement at June 30, 2017. Total market value of pledged securities
at June 30, 2017, was $13,389,556. |
| 3 | At June 30,
2017, a portion of these securities were rehypothecated in connection with the Fund’s revolving credit agreement in the aggregate amount of $6,211,095. |
| 4 | Securities
for which market quotations are not readily available represent 0.0% of net assets.
These securities have been valued at their fair value under procedures approved
by the Fund’s Board of Directors. These securities are defined as Level 3 securities
due to the use of significant unobservable inputs in the determination of fair value.
See Notes to Financial Statements. |
Securities
of Global/International Funds are categorized by the country of their headquarters,
with the exception of exchange-traded funds. |
|
Bold indicates
the Fund’s 20 largest equity holdings in terms of June 30, 2017, market value.
|
|
TAX INFORMATION:
The cost of total investments for Federal income tax purposes was $106,553,829.
At June 30, 2017, net unrealized appreciation for all securities was $17,809,544,
consisting of aggregate gross unrealized appreciation of $23,819,812 and aggregate
gross unrealized depreciation of $6,010,268. The primary cause of the difference
between book and tax basis cost is the timing of the recognition of losses on securities
sold. |
| THE ACCOMPANYING NOTES ARE AN INTEGRAL PART OF THESE FINANCIAL STATEMENTS | 2017 Semiannual Report to Stockholders | 13 |
| Royce Global Value Trust | June 30, 2017 (unaudited) |
| Statement of Assets and Liabilities |
| ASSETS: | |||||
| Investments at value | $ | 116,706,373 | |||
| Repurchase agreements (at cost and value) | 7,657,000 | ||||
| Cash and foreign currency | 15,447 | ||||
| Receivable for investments sold | 9,942 | ||||
| Receivable for dividends and interest | 218,254 | ||||
| Prepaid expenses and other assets | 15,833 | ||||
| Total Assets | 124,622,849 | ||||
| LIABILITIES: | |||||
| Revolving credit agreement | 8,000,000 | ||||
| Payable for investment advisory fee | 118,929 | ||||
| Payable for directors’ fees | 8,073 | ||||
| Payable for interest expense | 999 | ||||
| Accrued expenses | 40,297 | ||||
| Deferred capital gains tax | 140,038 | ||||
| Total Liabilities | 8,308,336 | ||||
| Net Assets | $ | 116,314,513 | |||
| ANALYSIS OF NET ASSETS: | |||||
| Paid-in capital - $0.001 par value per share; 10,415,422 shares outstanding (150,000,000 shares authorized) | $ | 117,477,118 | |||
| Undistributed net investment income (loss) | (428,119 | ) | |||
| Accumulated net realized gain (loss) on investments and foreign currency | (18,464,782 | ) | |||
| Net unrealized appreciation (depreciation) on investments and foreign currency | 17,730,296 | ||||
| Net Assets (net asset value per share - $11.17) | $ | 116,314,513 | |||
| Investments at identified cost | $ | 98,836,109 | |||
| 14 | 2017 Semiannual Report to Stockholders | THE ACCOMPANYING NOTES ARE AN INTEGRAL PART OF THESE FINANCIAL STATEMENTS |
Royce Global Value Trust
| Statement of Changes in Net Assets |
| SIX MONTHS ENDED | ||||||||
| 6/30/17 | ||||||||
| (UNAUDITED) | YEAR ENDED 12/31/16 | |||||||
| INVESTMENT OPERATIONS: | ||||||||
| Net investment income (loss) | $ | 244,621 | $ | 651,129 | ||||
| Net realized gain (loss) on investments and foreign currency | 1,680,916 | (1,449,508 | ) | |||||
| Net change in unrealized appreciation (depreciation) on investments and foreign currency | 14,161,189 | 10,740,946 | ||||||
| Net increase (decrease) in net assets from investment operations | 16,086,726 | 9,942,567 | ||||||
| DISTRIBUTIONS: | ||||||||
| Net investment income | – | (1,435,789 | ) | |||||
| Net realized gain on investments and foreign currency | – | – | ||||||
| Return of capital | – | (12,497 | ) | |||||
| Total distributions | – | (1,448,286 | ) | |||||
| CAPITAL STOCK TRANSACTIONS: | ||||||||
| Reinvestment of distributions | – | 559,946 | ||||||
| Total capital stock transactions | – | 559,946 | ||||||
| Net Increase (Decrease) In Net Assets | 16,086,726 | 9,054,227 | ||||||
| NET ASSETS: | ||||||||
| Beginning of period | 100,227,787 | 91,173,560 | ||||||
| End of period (including undistributed net investment income (loss) of $(428,119) at 6/30/17 and $(672,740) at 12/31/16) | $ | 116,314,513 | $ | 100,227,787 | ||||
| THE ACCOMPANYING NOTES ARE AN INTEGRAL PART OF THESE FINANCIAL STATEMENTS | 2017 Semiannual Report to Stockholders | 15 |
| Royce Global Value Trust | Six Months Ended June 30, 2017 (unaudited) |
| Statement of Operations |
| INVESTMENT INCOME: | ||||||||
| INCOME: | ||||||||
| Dividends | $ | 1,212,111 | ||||||
| Foreign withholding tax | (66,605 | ) | ||||||
| Interest | 2,293 | |||||||
| Rehypothecation income | 1,149 | |||||||
| Total income | 1,148,948 | |||||||
| EXPENSES: | ||||||||
| Investment advisory fees | 674,539 | |||||||
| Interest expense | 83,884 | |||||||
| Custody and transfer agent fees | 43,199 | |||||||
| Stockholder reports | 35,642 | |||||||
| Professional fees | 30,548 | |||||||
| Directors’ fees | 13,433 | |||||||
| Administrative and office facilities | 12,904 | |||||||
| Other expenses | 10,230 | |||||||
| Total expenses | 904,379 | |||||||
| Compensating balance credits | (52 | ) | ||||||
| Net expenses | 904,327 | |||||||
| Net investment income (loss) | 244,621 | |||||||
| REALIZED AND UNREALIZED GAIN (LOSS) ON INVESTMENTS AND FOREIGN CURRENCY: | ||||||||
| NET REALIZED GAIN (LOSS): | ||||||||
| Investments | 1,677,715 | |||||||
| Foreign currency transactions | 3,201 | |||||||
| NET CHANGE IN UNREALIZED APPRECIATION (DEPRECIATION): | ||||||||
| Investments and foreign currency translations | 14,222,856 | |||||||
| Other assets and liabilities denominated in foreign currency | (61,667 | ) | ||||||
| Net realized and unrealized gain (loss) on investments and foreign currency | 15,842,105 | |||||||
| NET INCREASE (DECREASE) IN NET ASSETS FROM INVESTMENT OPERATIONS | $ | 16,086,726 | ||||||
| 16 | 2017 Semiannual Report to Stockholders | THE ACCOMPANYING NOTES ARE AN INTEGRAL PART OF THESE FINANCIAL STATEMENTS |
| Royce Global Value Trust | Six Months Ended June 30, 2017 (unaudited) |
| Statement of Cash Flows |
| CASH FLOWS FROM OPERATING ACTIVITIES: | ||||||||
| Net increase (decrease) in net assets from investment operations | $ | 16,086,726 | ||||||
| Adjustments to reconcile net increase (decrease) in net assets from investment operations to net cash used for operating activities: | ||||||||
Purchases of long-term investments |
(12,260,513 | ) | ||||||
Proceeds from sales and maturities of long-term investments |
12,720,762 | |||||||
Net purchases, sales and maturities of short-term investments |
(867,000 | ) | ||||||
Net (increase) decrease in dividends and interest receivable and other assets |
(17,895 | ) | ||||||
Net increase (decrease) in interest expense payable, accrued expenses and other liabilities |
57,981 | |||||||
Net change in unrealized appreciation (depreciation) on investments |
(14,222,856 | ) | ||||||
Net realized gain (loss) on investments and foreign currency |
(1,680,916 | ) | ||||||
| Net cash used for operating activities | (183,711 | ) | ||||||
| CASH FLOWS FROM FINANCING ACTIVITIES: | ||||||||
| Net increase (decrease) in revolving credit agreement | – | |||||||
| Distributions | – | |||||||
| Reinvestment of distributions | – | |||||||
| Net cash used for financing activities | – | |||||||
| INCREASE (DECREASE) IN CASH: | (183,711 | ) | ||||||
| Cash and foreign currency at beginning of period | 199,158 | |||||||
| Cash and foreign currency at end of period | $ | 15,447 | ||||||
| THE ACCOMPANYING NOTES ARE AN INTEGRAL PART OF THESE FINANCIAL STATEMENTS | 2017 Semiannual Report to Stockholders | 17 |
Royce Global Value Trust
| Financial Highlights |
| This table is presented to show selected data for a share outstanding throughout each period, and to assist stockholders in evaluating the Fund’s performance for the periods presented. |
| SIX MONTHS ENDED 6/30/2017(UNAUDITED) |
YEARS ENDED | |||||||||||||||||||
| PERIOD ENDED | ||||||||||||||||||||
| 12/31/16 | 12/31/15 | 12/31/14 | 12/31/131 | |||||||||||||||||
| Net Asset Value, Beginning of Period | $ | 9.62 | $ | 8.81 | $ | 9.25 | $ | 10.05 | $ | 9.78 | ||||||||||
| INVESTMENT OPERATIONS: | ||||||||||||||||||||
| Net investment income (loss) | 0.02 | 0.06 | 0.10 | 0.13 | (0.00 | ) | ||||||||||||||
| Net realized and unrealized gain (loss) on investments and foreign currency | 1.53 | 0.90 | (0.43 | ) | (0.77 | ) | 0.27 | |||||||||||||
| Net increase (decrease) in net assets from investment operations | 1.55 | 0.96 | (0.33 | ) | (0.64 | ) | 0.27 | |||||||||||||
| DISTRIBUTIONS: | ||||||||||||||||||||
| Net investment income | – | (0.14 | ) | (0.10 | ) | (0.15 | ) | – | ||||||||||||
| Net realized gain on investments and foreign currency | – | – | – | – | – | |||||||||||||||
| Total distributions | – | (0.14 | ) | (0.10 | ) | (0.15 | ) | – | ||||||||||||
| CAPITAL STOCK TRANSACTIONS: | ||||||||||||||||||||
| Effect of reinvestment of distributions by Common Stockholders | – | (0.01 | ) | (0.01 | ) | (0.01 | ) | – | ||||||||||||
| Total capital stock transactions | – | (0.01 | ) | (0.01 | ) | (0.01 | ) | – | ||||||||||||
| Net Asset Value, End of Period | $ | 11.17 | $ | 9.62 | $ | 8.81 | $ | 9.25 | $ | 10.05 | ||||||||||
| Market Value, End of Period | $ | 9.61 | $ | 8.04 | $ | 7.45 | $ | 8.04 | $ | 8.89 | ||||||||||
| TOTAL RETURN:2 | ||||||||||||||||||||
| Net Asset Value | 16.11 | %3 | 11.12 | % | (3.44 | )% | (6.23 | )% | 2.76 | %3 | ||||||||||
| Market Value | 19.58 | %3 | 9.77 | % | (6.06 | )% | (7.86 | )% | (0.95 | )%3 | ||||||||||
| RATIOS BASED ON AVERAGE NET ASSETS: | ||||||||||||||||||||
| Investment advisory fee expense | 1.25 | %4 | 1.25 | % | 1.25 | % | 1.25 | % | 1.25 | %4 | ||||||||||
| Other operating expenses | 0.43 | %4 | 0.46 | % | 0.43 | % | 0.24 | % | 0.37 | %4 | ||||||||||
| Total expenses (net) | 1.68 | %4 | 1.71 | % | 1.68 | % | 1.49 | % | 1.62 | %4 | ||||||||||
| Expenses excluding interest expense | 1.52 | %4 | 1.57 | % | 1.58 | % | 1.49 | % | 1.62 | %4 | ||||||||||
| Expenses prior to balance credits | 1.68 | %4 | 1.71 | % | 1.68 | % | 1.49 | % | 1.62 | %4 | ||||||||||
| Net investment income (loss) | 0.45 | %4 | 0.69 | % | 1.03 | % | 1.30 | % | (0.13 | )%4 | ||||||||||
| SUPPLEMENTAL DATA: | ||||||||||||||||||||
| Net Assets End of Period (in thousands) | $ | 116,315 | $ | 100,228 | $ | 91,174 | $ | 95,285 | $ | 102,684 | ||||||||||
| Portfolio Turnover Rate | 10 | % | 59 | % | 65 | % | 43 | % | 7 | % | ||||||||||
| REVOLVING CREDIT AGREEMENT: | ||||||||||||||||||||
| Asset coverage | 1554 | % | 1353 | % | 1240 | % | ||||||||||||||
| Asset coverage per $1,000 | 15,539 | 13,528 | 12,397 | |||||||||||||||||
| 1 | The Fund commenced operations on October 18, 2013. |
| 2 | The Market Value Total Return is calculated assuming a purchase of Common Stock on the opening of the first business day and a sale on the closing of the last business day of each period. Dividends and distributions are assumed for the purposes of this calculation to be reinvested at prices obtained under the Fund’s Distribution Reinvestment and Cash Purchase Plan. Net Asset Value Total Return is calculated on the same basis, except that the Fund’s net asset value is used on the purchase and sale dates instead of market value. |
| 3 | Not annualized |
| 4 | Annualized |
| 18 | 2017 Semiannual Report to Stockholders | THE ACCOMPANYING NOTES ARE AN INTEGRAL PART OF THESE FINANCIAL STATEMENTS |
Royce Global Value Trust
Notes to Financial Statements (unaudited)
| Summary of Significant Accounting Policies |
Royce Global Value Trust, Inc. (the “Fund”), is a diversified closed-end investment company that was incorporated under the laws of the
State of Maryland on February 14, 2011. The Fund commenced operations on October 18, 2013. |
The preparation of financial statements in conformity with accounting principles generally accepted in the United States of America
requires management to make estimates and assumptions that affect the reported amounts of assets and liabilities and the disclosure of
contingent assets and liabilities at the date of the financial statements and the reported amounts of income and expenses during the
reporting period. Actual results could differ from those estimates. |
The Fund is an investment company and accordingly follows the investment company accounting and reporting guidance of the Financial Accounting Standards Board (FASB) Accounting Standard Codification Topic 946 “Financial Services-Investment Companies”. |
| VALUATION OF INVESTMENTS: |
Securities are valued as of the close of trading on the New York Stock Exchange (NYSE) (generally 4:00 p.m. Eastern time) on the
valuation date. Securities that trade on an exchange, and securities traded on Nasdaq’s Electronic Bulletin Board, are valued at their last
reported sales price or Nasdaq official closing price taken from the primary market in which each security trades or, if no sale is reported
for such day, at their highest bid price. Other over-the-counter securities for which market quotations are readily available are valued at
their highest bid price, except in the case of some bonds and other fixed income securities which may be valued by reference to other
securities with comparable ratings, interest rates and maturities, using established independent pricing services. The Fund values its non-U.S. dollar denominated securities in U.S. dollars daily at the prevailing foreign currency exchange rates as quoted by a major bank.
Securities for which market quotations are not readily available are valued at their fair value in accordance with the provisions of the 1940
Act, under procedures approved by the Fund's Board of Directors, and are reported as Level 3 securities. As a general principle, the fair
value of a security is the amount which the Fund might reasonably expect to receive for the security upon its current sale. However, in
light of the judgment involved in fair valuations, there can be no assurance that a fair value assigned to a particular security will be the
amount which the Fund might be able to receive upon its current sale. In addition, if, between the time trading ends on a particular security
and the close of the customary trading session on the NYSE, events occur that are significant and may make the closing price unreliable,
the Fund may fair value the security. The Fund uses an independent pricing service to provide fair value estimates for relevant non-U.S.
equity securities on days when the U.S. market volatility exceeds a certain threshold. This pricing service uses proprietary correlations it
has developed between the movement of prices of non-U.S. equity securities and indices of U.S.-traded securities, futures contracts and
other indications to estimate the fair value of relevant non-U.S. securities. When fair value pricing is employed, the prices of securities used
by the Fund may differ from quoted or published prices for the same security. Investments in money market funds are valued at net asset
value per share. |
Various inputs are used in determining the value of the Fund’s investments, as noted above. These inputs are summarized in the three
broad levels below: |
| Level 1 | – | quoted prices in active markets for identical securities. |
||
| Level 2 | – | other significant observable inputs (including quoted prices for similar securities, foreign securities that may be fair valued and repurchase agreements). The table below includes all Level 2 securities. Any Level 2 securities with values based on quoted prices for similar securities would be noted in the Schedule of Investments. |
||
| Level 3 | – | significant unobservable inputs (including last trade price before trading was suspended, or at a discount thereto for lack of marketability or otherwise, market price information regarding other securities, information received from the company and/or published documents, including SEC filings and financial statements, or other publicly available information). |
The inputs or methodology used for valuing securities are not necessarily an indication of the risk associated with investing in those
securities. |
The following is a summary of the inputs used to value the Fund’s investments as of June 30, 2017. For a detailed breakout of common
stocks by country, please refer to the Schedule of Investments. |
| LEVEL 1 | LEVEL 2 | LEVEL 3 | TOTAL | ||||||||||||
| Common Stocks | $116,706,373 | $ | – | $0 | $116,706,373 | ||||||||||
| Cash Equivalents | – | 7,657,000 | – | 7,657,000 | |||||||||||
Certain securities have transferred in and out of Level 1 and Level 2 measurements during the reporting period. The Fund recognizes transfers between levels as of the end of the reporting period. For the six months ended June 30, 2017, securities valued at $61,425,779 were transferred from Level 2 to Level 1 within the fair value hierarchy. |
|||||||||||||||
| 2017 Semiannual Report to Stockholders | 19 |
Royce Global Value Trust
Notes to Financial Statements (unaudited) (continued)
VALUATION OF INVESTMENTS (continued):
| Level 3 Reconciliation: | ||||||||||||
| BALANCE AS OF 12/31/16 |
REALIZED AND UNREALIZED GAIN (LOSS)1 |
BALANCE AS OF 6/30/17 | ||||||||||
| Common Stocks | $9,349 | $(9,349) | $0 | |||||||||
| 1 | The net change in unrealized appreciation (depreciation) is included in the accompanying Statement of Operations. Change in unrealized appreciation (depreciation) includes net
unrealized appreciation (depreciation) resulting from changes in investment values during the reporting period and the reversal of previously recorded unrealized appreciation (depreciation) when gains or losses are realized. Net realized gain (loss) from investments and foreign currency transactions is included in the accompanying Statement of Operations. |
| REPURCHASE AGREEMENTS: |
The Fund may enter into repurchase agreements with institutions that the Fund’s investment adviser has determined are creditworthy. The Fund restricts repurchase agreements to maturities of no more than seven days. Securities pledged as collateral for repurchase agreements, which are held until maturity of the repurchase agreements, are marked-to-market daily and maintained at a value at least equal to the principal amount of the repurchase agreement (including accrued interest). Repurchase agreements could involve certain
risks in the event of default or insolvency of the counter-party, including possible delays or restrictions upon the ability of the Fund to
dispose of its underlying securities. The remaining contractual maturity of the repurchase agreement held by the Fund at June 30, 2017 is
overnight and continuous. |
| FOREIGN CURRENCY: |
Net realized foreign exchange gains or losses arise from sales and maturities of short-term securities, sales of foreign currencies,
expiration of currency forward contracts, currency gains or losses realized between the trade and settlement dates on securities
transactions, and the difference between the amounts of dividends, interest, and foreign withholding taxes recorded on the Fund's books
and the U.S. dollar equivalent of the amounts actually received or paid. Net unrealized foreign exchange gains and losses arise from
changes in the value of assets and liabilities, including investments in securities at the end of the reporting period, as a result of changes
in foreign currency exchange rates. |
| DISTRIBUTIONS AND TAXES: |
As a qualified regulated investment company under Subchapter M of the Internal Revenue Code, the Fund is not subject to income
taxes to the extent that it distributes substantially all of its taxable income for its fiscal year. The Schedule of Investments includes
information regarding income taxes under the caption “Tax Information”. |
The Fund pays any dividends and capital gain distributions annually in December. Because federal income tax regulations differ from generally accepted accounting principles, income and capital gain distributions determined in accordance with tax regulations may differ from net investment income and realized gains recognized for financial reporting purposes. Accordingly, the character of distributions and composition of net assets for tax purposes differ from those reflected in the accompanying financial statements. |
| CAPITAL GAINS TAXES: |
The Fund is subject to a tax imposed on short-term capital gains on securities of issuers domiciled in certain countries. The Fund records an estimated deferred tax liability for these securities that have been held for less than one year. This amount, if any, is reported as deferred capital gains tax in the accompanying Statement of Assets and Liabilities, assuming those positions were disposed of at the end of the period, and accounted for as a reduction in the market value of the security. |
| INVESTMENT TRANSACTIONS AND RELATED INVESTMENT INCOME: |
Investment transactions are accounted for on the trade date. Dividend income is recorded on the ex-dividend date. Non-cash dividend income is recorded at the fair market value of the securities received. Interest income is recorded on an accrual basis. Premiums and discounts on debt securities are amortized using the effective yield-to-maturity method. Realized gains and losses from investment transactions are determined on the basis of identified cost for book and tax purposes. |
| EXPENSES: |
The Fund incurs direct and indirect expenses. Expenses directly attributable to the Fund are charged to the Fund’s operations, while expenses applicable to more than one of the Royce Funds are allocated equitably. Certain personnel, occupancy costs and other administrative expenses related to the Funds are allocated by Royce & Associates (“Royce”) under an administration agreement and are
included in administrative and office facilities and professional fees. |
| 20 | 2017 Semiannual Report to Stockholders |
Royce Global Value Trust
Notes to Financial Statements (unaudited) (continued)
| COMPENSATING BALANCE CREDITS: |
The Fund has an arrangement with its custodian bank, whereby a portion of the custodian’s fee is paid indirectly by credits earned on the Fund’s cash on deposit with the bank. This deposit arrangement is an alternative to purchasing overnight investments. Conversely, the
Fund pays interest to the custodian on any cash overdrafts, to the extent they are not offset by credits earned on positive cash balances. |
| Capital Stock: |
The Fund issued 70,522 shares of Common Stock as reinvestment of distributions for the year ended December 31, 2016. |
| Borrowings: |
The Fund is party to a revolving credit agreement (the credit agreement) with BNP Paribas Prime Brokerage International, Limited (BNPPI). The Fund pays a commitment fee of 0.50% per annum on the unused portion of the credit agreement. The credit agreement has a 360-day rolling term that resets daily; however, if the Fund exceeds certain net asset value triggers, the credit agreement may convert to a 60-day rolling term that resets daily. The Fund is required to pledge portfolio securities as collateral in an amount up to two times the loan balance outstanding or as otherwise required by applicable regulatory standards and has granted a security interest in the securities pledged to, and in favor of, BNPPI as security for the loan balance outstanding. If the Fund fails to meet certain requirements, or maintain other financial covenants required under the credit agreement, the Fund may be required to repay immediately, in part or in full, the loan balance outstanding under the credit agreement which may necessitate the sale of portfolio securities at potentially inopportune times. BNPPI may terminate the credit agreement upon certain ratings downgrades of its corporate parent, which would result in the Fund’s entire loan balance becoming immediately due and payable. The occurrence of such ratings downgrades may necessitate the sale of portfolio securities at potentially inopportune times. The credit agreement also permits, subject to certain conditions, BNPPI to rehypothecate portfolio securities pledged by the Fund up to the amount of the loan balance outstanding. The Fund continues to receive payments in lieu of dividends and interest on rehypothecated securities. The Fund also has the right under the credit agreement to recall the rehypothecated securities from BNPPI on demand. If BNPPI fails to deliver the recalled security in a timely manner, the Fund is compensated by BNPPI for any fees or losses related to the failed delivery or, in the event a recalled security is not returned by BNPPI, the Fund, upon notice to BNPPI, may reduce the loan balance outstanding by the value of the recalled security failed to be returned. The Fund receives a portion of the fees earned by BNPPI in connection with the rehypothecation of portfolio securities. |
As of June 30, 2017, the Fund has outstanding borrowings of $8,000,000. During the six months ended June 30, 2017, the Fund borrowed an average daily balance of $8,000,000 at a weighted average borrowing cost of 2.09%. The maximum amount outstanding during the six months ended June 30, 2017 was $8,000,000. As of June 30, 2017, the aggregate value of rehypothecated securities was $6,211,095. During the six months ended June 30, 2017, the Fund earned $1,149 in fees from rehypothecated securities. |
| Investment Advisory Agreement: |
The investment advisory agreement between Royce and the Fund provides for fees to be paid at an annual rate of 1.25% of the Fund’s average daily net assets. For the six months ended June 30, 2017, the Fund expensed Royce investment advisory fees totaling $674,539. |
| Purchases and Sales of Investment Securities: |
For the six months ended June 30, 2017, the costs of purchases and proceeds from sales of investment securities, other than short-term securities, amounted to $11,134,896 and $11,226,117, respectively. |
| 2017 Semiannual Report to Stockholders | 21 |
| MANAGER’S DISCUSSION |
| Royce Micro-Cap Trust (RMT) |
 |
| Chuck Royce |
| FUND PERFORMANCE |
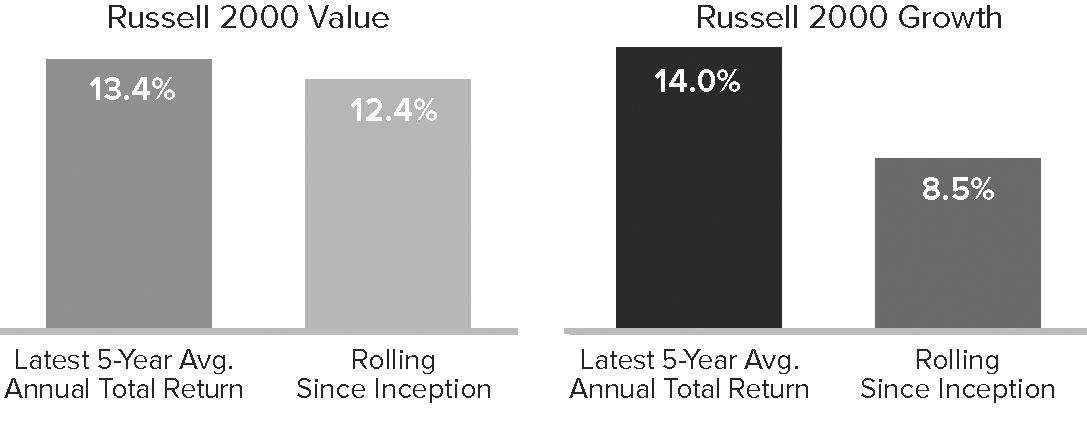
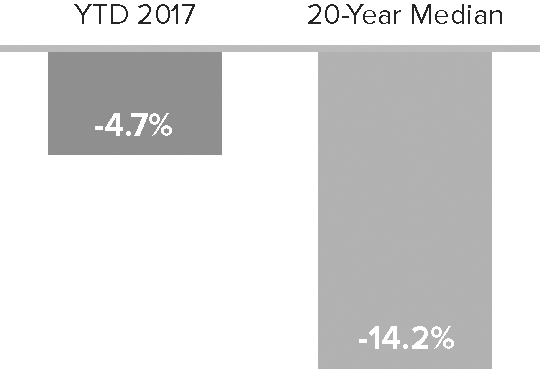
| Royce Micro-Cap Trust (“RMT”) gained a more-than-respectable 5.9% on a net asset value (“NAV”) basis and an impressive 10.1% on a market price basis for the year-to-date period ended June 30, 2017, outpacing each of its unleveraged benchmarks: the small-cap Russell 2000 Index was up 5.0% while the Russell Microcap Index increased 4.2% for the same period. The Fund’s results were all the more notable in that they were achieved in a period that showed more favor to larger market caps, high growth, and low quality than was given to the kind of micro-cap companies we seek using RMT’s diversified, multi-theme core approach. In fact, leadership in the first half of 2017 reversed most of what worked in 2016, when the Fund also beat both its benchmarks. |
| In a challenging first quarter for both value stocks and micro-caps, RMT gained 2.4% on an NAV basis and 4.8% based on market price while the Russell 2000 was up 2.5% and the Russell Microcap gained 0.4%. The first quarter’s leadership shifts remained largely in place through the end of June—with large-caps, growth, healthcare, and non-U.S. equities all staying in the lead after lagging in 2016. For the second quarter, the Fund advanced 3.5% on an NAV basis and 5.0% on a market price basis compared to 2.5% for the small-cap index and 3.8% for the micro-cap index. On an NAV basis, RMT outpaced the Russell Microcap for the 10- and 15-year periods ended June 30, 2017 while it also beat the Russell 2000 for the 15-, 20-year, and since inception (12/14/93) periods. (Returns for the Russell Microcap Index only go back to 2000.) RMT’s average annual NAV total return for the since inception period ended June 30, 2017 was 10.8%. |
| WHAT WORKED... AND WHAT DIDN’T |
| Eight of the Fund’s 11 equity sectors made positive contributions to first-half performance, led by Information Technology, Industrials, and Health Care. (After correcting in 2016, Health Care rallied in the first half to land as the top-contributing sector in both the small- and micro-cap indexes.) While several of the portfolio’s industry groups made solid contributions to performance in the semiannual period, the positive impacts of machinery (Industrials) and biotechnology (Health Care) stood out most. Also notable was the fact that the Information Technology sector had five groups among the Fund’s 10-best performers at the industry level. |
| RMT’s top contributor at the position level in the first half was Sangamo Therapeutics, which develops genomic therapies and medications that treat genetic diseases. Its share price surged in May when a collaboration with Pfizer to work on gene therapies for hemophilia was announced. From the Information Technology sector, Care.com offers home care services for children, adults, seniors, and even pets. Two consecutive quarters of revenue growth made investors feel at home, as did the company’s announcement of increased guidance for the rest of fiscal 2017. Shares of gold miner Exeter
Resource were mostly moving upward before the announcement of its acquisition at an attractive premium drove its shares even higher and
led us to begin selling our position. Of the three sectors that detracted from first-half results, only Energy made a notably negative impact, as net losses for Consumer Discretionary and Financials were comparably minor. A similar pattern played out at the industry level, where the only significant detraction came from energy equipment & services. At each level, tumbling oil prices led to formidable difficulties. The Fund’s top detractor at the position level was Era Group, which provides helicopter transportation services and personnel primarily to and from offshore oil drilling rigs and platforms. The challenges wrought by falling oil prices were reflected in disappointing earnings. Liking the long-term prospects for its niche business, we held shares at the end of June. Our experience with automotive parts recycler and reseller Fenix Parts continued to be highly disappointing as its shares were delisted on Nasdaq when it missed financial reporting filing deadlines. Toronto-based Dundee Corporation, which is involved in wealth management, real estate, and natural resources, experienced losses in mining- and resource-based activities that put downward pressure on its shares. |
| Relative to the Russell 2000, RMT benefited most from superior stock selection in Industrials, specifically in the previously mentioned machinery group. Also helping relative results were our lower exposure to banks, which gave us an edge in Financials, and stock-picking advantages in Materials and Information Technology. Conversely, stock selection in both Health Care and, to a lesser extent, Consumer Discretionary hurt the Fund vis-à-vis the small-cap index. |
| Top Contributors to Performance | |||
| Year-to-Date Through 6/30/17 (%)1 | |||
| Sangamo Therapeutics | 0.39 | ||
| Care.com | 0.34 | ||
| Exeter Resource | 0.28 | ||
| Intevac | 0.27 | ||
| Major Drilling Group International | 0.25 | ||
| 1 Includes dividends | |||
| Top Detractors from Performance | |||
| Year-to-Date Through 6/30/17 (%)2 | |||
| Era Group | -0.54 | ||
| Fenix Parts | -0.25 | ||
| Dundee Corporation Cl. A | -0.24 | ||
| Matrix Service | -0.18 | ||
| Alcobra | -0.17 | ||
| 2 Net of dividends | |||
| CURRENT POSITIONING AND OUTLOOK |
| We think that RMT’s portfolio remains well-positioned to benefit from a cyclical upswing. So while a correction would not be surprising, we are optimistic that expanding global growth can help certain micro-cap companies, especially those with earnings growth. The message that we have been receiving from the companies we speak to each day remains positive. With order books continuing to fill up, the management teams remain confident about their business, which in turn gives us a lot of confidence in the long-term prospects for RMT’s multi-themed core approach. |
| 22 | 2017 Semiannual Report to Stockholders |
| PERFORMANCE AND PORTFOLIO REVIEW | SYMBOLS MARKET PRICE RMT NAV XOTCX |
|
Performance Average Annual Total Return (%) Through 6/30/17 |
||||||||||||||||
| JAN-JUN 20171 | 1-YR | 3-YR | 5-YR | 10-YR | 15-YR | 20-YR | SINCE INCEPTION (12/14/93) | |||||||||
| RMT (NAV) | 5.93 | 22.60 | 4.65 | 13.47 | 5.75 | 9.23 | 9.96 | 10.84 | ||||||||
| 1 Not Annualized | ||||||||||||||||
| Market Price Performance History Since Inception (12/14/93) Cumulative Performance of Investment1 |
||||||||||||
| 1-YR | 5-YR | 10-YR | 15-YR | 20-YR | SINCE INCEPTION (12/14/93) | |||||||
| RMT | 27.3% | 89.5% | 54.5% | 246.3% | 587.5% | 865.4% | ||||||
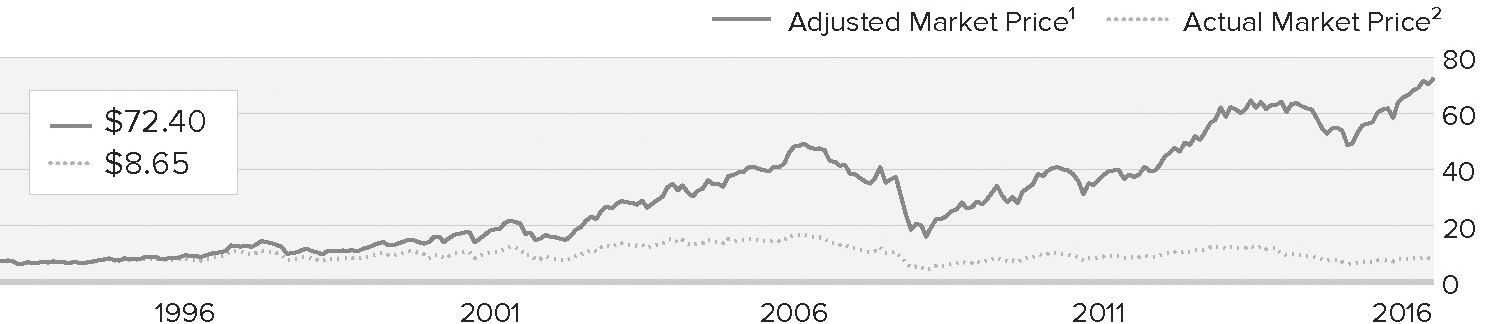 |
1Reflects the cumulative performance experience of a continuous common stockholder who purchased one share at inception ($7.50 IPO), reinvested all distributions and fully participated in the primary subscription of the Fund’s 1994 rights offering. |
2Reflects the actual month-end market price movement of one share as it has traded on NYSE and, prior to 12/1/03, on the Nasdaq. |
The Morningstar Style Map is the Morningstar Style Box™
with the center 75% of fund holdings plotted as the Morningstar
Ownership Zone™. The Morningstar Style Box is designed to reveal a
fund’s investment strategy. The Morningstar Ownership Zone provides
detail about a portfolio’s investment style by showing the range of
stock sizes and styles. The Ownership Zone is derived by plotting each
stock in the portfolio within the proprietary Morningstar Style Box.
Over time, the shape and location of a fund’s ownership zone may vary.
See page 61 for additional information. |
| Top 10 Positions | |||
| % of Net Assets | |||
| Major Drilling Group International | 1.5 | ||
| Mesa Laboratories | 1.3 | ||
| Surmodics | 1.1 | ||
| IES Holdings | 1.1 | ||
| Atrion Corporation | 1.1 | ||
| Kadant | 1.1 | ||
| Zealand Pharma | 1.1 | ||
| Heritage-Crystal Clean | 1.0 | ||
| Quaker Chemical | 1.0 | ||
| Seneca Foods | 1.0 | ||
| Portfolio Sector Breakdown | |||
| % of Net Assets | |||
| Industrials | 21.1 | ||
| Information Technology | 19.9 | ||
| Consumer Discretionary | 15.0 | ||
| Health Care | 14.9 | ||
| Financials | 11.6 | ||
| Materials | 6.7 | ||
| Energy | 4.6 | ||
| Real Estate | 4.1 | ||
| Consumer Staples | 2.8 | ||
| Utilities | 0.4 | ||
| Telecommunication Services | 0.2 | ||
| Miscellaneous | 4.2 | ||
| Outstanding Line of Credit, Net of Cash and Cash Equivalents | -5.5 | ||
| Calendar Year Total Returns (%) | |||
| YEAR | RMT | ||
| 2016 | 22.0 | ||
| 2015 | -11.7 | ||
| 2014 | 3.5 | ||
| 2013 | 44.5 | ||
| 2012 | 17.3 | ||
| 2011 | -7.7 | ||
| 2010 | 28.5 | ||
| 2009 | 46.5 | ||
| 2008 | -45.5 | ||
| 2007 | 0.6 | ||
| 2006 | 22.5 | ||
| 2005 | 6.8 | ||
| 2004 | 18.7 | ||
| 2003 | 55.5 | ||
| 2002 | -13.8 | ||
| Portfolio Diagnostics | |||
| Fund Net Assets | $377 million | ||
| Number of Holdings | 365 | ||
| Turnover Rate | 5% | ||
| Net Asset Value | $9.82 | ||
| Market Price | $8.65 | ||
| Net Leverage1 | 5.5% | ||
| Average Market Capitalization2 | $416 million | ||
| Weighted Average P/B Ratio3 | 1.9x | ||
| Active Share4 | 94% | ||
| U.S. Investments (% of Net Assets) | 84.0% | ||
| Non-U.S. Investments (% of Net Assets) | 21.5% | ||
| 1 | Net leverage is the percentage, in excess of 100%, of the total value of equity type investments, divided by net assets. |
| 2 | Geometric
Average. This weighted calculation uses each portfolio holding’s market cap in a way designed to not skew the effect of very large or small holdings; instead, it aims to better identify the portfolio’s center, which Royce believes offers a more accurate measure of average market cap than a simple mean or median. |
| 3 | Harmonic Average. This weighted calculation evaluates a portfolio as if it were a single stock and measures it overall. It compares the total market value of the portfolio to the portfolio’s share in the earnings or book value, as the case may be, of its underlying stocks. |
| 4 | Active Share is the sum of the absolute values of the different weightings of each holding in the Fund versus each holding in the benchmark, divided by two. |
| Important Performance and Risk Information |
All performance information reflects past performance, is presented on a total return basis, net of the Fund’s investment advisory fee, and reflects the reinvestment of distributions. Past performance is no guarantee of future results. Current performance may be higher or lower than performance quoted. Returns as of the most recent month-end may be obtained at www.roycefunds.com. Certain immaterial adjustments were made to the net assets of Royce Micro-Cap Trust at 12/31/12 and 12/31/14 for financial reporting purposes, and as a result the net asset value originally calculated on that date and the total return based on that net asset value differs from the adjusted net asset value and total return reported in the Financial Highlights. The market price of the Fund’s shares will fluctuate, so that shares may be worth more or less than their original cost when sold. The Fund normally invests in micro-cap companies, which may involve considerably more risk than investments in securities of larger-cap companies. The Fund’s broadly diversified portfolio does not ensure a profit or guarantee against loss. From time to time, the Fund may invest a significant portion of its net assets in foreign securities, which may involve political, economic, currency and other risks not encountered in U.S. investments. Regarding the “Top Contributors” and “Top Detractors” tables shown above, the sum of all contributors to, and all detractors from, performance for all securities in the portfolio would approximate the Fund’s year-to-date performance for 2017. |
| 2017 Semiannual Report to Stockholders | 23 |
Royce Micro-Cap Trust
| Schedule of Investments |
| Common Stocks – 105.5% |
| SHARES | VALUE | |||||||
| CONSUMER DISCRETIONARY– 15.0% | ||||||||
| AUTO COMPONENTS - 1.8% | ||||||||
Fox Factory Holding1 |
5,300 | $ | 188,680 | |||||
Motorcar Parts of America1 |
57,100 | 1,612,504 | ||||||
Sebang Global Battery |
50,500 | 1,754,469 | ||||||
Standard Motor Products |
53,860 | 2,812,569 | ||||||
Stoneridge1 |
7,500 | 115,575 | ||||||
Unique Fabricating |
12,200 | 116,144 | ||||||
| 6,599,941 | ||||||||
| DISTRIBUTORS - 0.7% | ||||||||
| 440,800 | 185,577 | |||||||
Uni-Select |
33,800 | 816,329 | ||||||
Weyco Group |
56,600 | 1,578,008 | ||||||
| 2,579,914 | ||||||||
| DIVERSIFIED CONSUMER SERVICES - 1.9% | ||||||||
American Public Education1 |
73,200 | 1,731,180 | ||||||
Collectors Universe |
108,200 | 2,688,770 | ||||||
Liberty Tax Cl. A |
148,900 | 1,928,255 | ||||||
Universal Technical Institute1 |
270,000 | 963,900 | ||||||
| 7,312,105 | ||||||||
| HOTELS, RESTAURANTS & LEISURE - 1.3% | ||||||||
Century Casinos1 |
222,500 | 1,639,825 | ||||||
Del Taco Restaurants1 |
8,200 | 112,750 | ||||||
Lindblad Expeditions Holdings1 |
234,000 | 2,457,000 | ||||||
Lindblad Expeditions Holdings (Warrants)1 |
18,100 | 40,725 | ||||||
Red Lion Hotels1 |
90,000 | 661,500 | ||||||
| 4,911,800 | ||||||||
| HOUSEHOLD DURABLES - 4.0% | ||||||||
AV Homes1 |
82,000 | 1,644,100 | ||||||
| 19,141 | 2,481,631 | |||||||
Ethan Allen Interiors3 |
45,200 | 1,459,960 | ||||||
Flexsteel Industries3 |
16,100 | 871,171 | ||||||
| 15,000 | 1,262,100 | |||||||
| 124,294 | 2,255,936 | |||||||
| 147,100 | 2,574,250 | |||||||
Stanley Furniture |
193,468 | 218,619 | ||||||
Universal Electronics1 |
15,100 | 1,009,435 | ||||||
ZAGG1 |
131,300 | 1,135,745 | ||||||
| 14,912,947 | ||||||||
| INTERNET & DIRECT MARKETING RETAIL - 0.7% | ||||||||
FTD Companies1 |
67,200 | 1,344,000 | ||||||
| 125,000 | 1,400,000 | |||||||
| 2,744,000 | ||||||||
| LEISURE PRODUCTS - 1.1% | ||||||||
| 27,100 | 600,536 | |||||||
Black Diamond1 |
194,926 | 1,296,258 | ||||||
Nautilus1 |
118,500 | 2,269,275 | ||||||
| 4,166,069 | ||||||||
| MEDIA - 0.6% | ||||||||
Entravision Communications Cl. A |
126,200 | 832,920 | ||||||
McClatchy Company (The) Cl. A1 |
69,313 | 647,383 | ||||||
New Media Investment Group |
66,200 | 892,376 | ||||||
| 2,372,679 | ||||||||
| SPECIALTY RETAIL - 1.6% | ||||||||
AutoCanada |
115,200 | 1,694,954 | ||||||
Barnes & Noble Education1 |
80,000 | 850,400 | ||||||
Destination Maternity1 |
212,000 | 686,880 | ||||||
Destination XL Group1 |
50,000 | 117,500 | ||||||
Haverty Furniture |
30,000 | 753,000 | ||||||
Kirkland’s1 |
11,000 | 113,080 | ||||||
MarineMax1 |
7,600 | 148,580 | ||||||
Shoe Carnival3 |
21,028 | 439,064 | ||||||
Stage Stores3 |
15,000 | 31,200 | ||||||
TravelCenters of America LLC1 |
5,400 | 22,140 | ||||||
West Marine |
86,000 | 1,105,100 | ||||||
| 5,961,898 | ||||||||
| TEXTILES, APPAREL & LUXURY GOODS - 1.3% | ||||||||
Crown Crafts |
112,159 | 773,897 | ||||||
Culp |
32,900 | 1,069,250 | ||||||
J.G. Boswell Company2 |
2,490 | 1,635,930 | ||||||
YGM Trading |
1,482,000 | 1,378,084 | ||||||
| 4,857,161 | ||||||||
| Total (Cost $54,578,416) | 56,418,514 | |||||||
| CONSUMER STAPLES – 2.8% | ||||||||
| BEVERAGES - 0.2% | ||||||||
| 58,124 | 619,021 | |||||||
| FOOD PRODUCTS - 2.5% | ||||||||
| 62,600 | 1,893,650 | |||||||
John B. Sanfilippo & Son3 |
17,800 | 1,123,358 | ||||||
| 75,610 | 1,122,809 | |||||||
Seneca Foods Cl. A1 |
73,087 | 2,269,351 | ||||||
Seneca Foods Cl. B1 |
40,400 | 1,454,400 | ||||||
SunOpta1 |
176,281 | 1,798,066 | ||||||
| 9,661,634 | ||||||||
| HOUSEHOLD PRODUCTS - 0.1% | ||||||||
Central Garden & Pet1 |
12,000 | 381,480 | ||||||
| Total (Cost $6,140,646) | 10,662,135 | |||||||
| ENERGY – 4.6% | ||||||||
| ENERGY EQUIPMENT & SERVICES - 1.8% | ||||||||
Aspen Aerogels1 |
94,985 | 422,683 | ||||||
| 34,000 | 232,900 | |||||||
CES Energy Solutions |
25,000 | 111,428 | ||||||
Dawson Geophysical1 |
73,654 | 288,724 | ||||||
Era Group1 |
297,409 | 2,813,489 | ||||||
| 9,500 | 131,385 | |||||||
Independence Contract Drilling1 |
134,400 | 522,816 | ||||||
| 53,700 | 502,095 | |||||||
Newpark Resources1 |
11,200 | 82,320 | ||||||
North American Energy Partners |
50,000 | 220,000 | ||||||
| 215,400 | 441,570 | |||||||
TerraVest Capital |
84,000 | 647,749 | ||||||
| 58,000 | 258,100 | |||||||
Trican Well Service1 |
53,300 | 149,197 | ||||||
| 6,824,456 | ||||||||
| OIL, GAS & CONSUMABLE FUELS - 2.8% | ||||||||
Ardmore Shipping |
182,700 | 1,489,005 | ||||||
Cross Timbers Royalty Trust |
67,631 | 1,036,107 | ||||||
Dorchester Minerals L.P. |
106,127 | 1,533,535 | ||||||
Dorian LPG1 |
50,000 | 409,000 | ||||||
Hugoton Royalty Trust |
287,574 | 517,633 | ||||||
Panhandle Oil and Gas Cl. A |
5,500 | 127,050 | ||||||
Permian Basin Royalty Trust |
176,333 | 1,534,097 | ||||||
Sabine Royalty Trust |
59,548 | 2,307,485 | ||||||
San Juan Basin Royalty Trust |
143,407 | 976,602 | ||||||
| 24 | 2017 Semiannual Report to Stockholders | THE ACCOMPANYING NOTES ARE AN INTEGRAL PART OF THESE FINANCIAL STATEMENTS |
| June 30, 2017 (unaudited) |
| Schedule of Investments (continued) |
| SHARES | VALUE | |||||||
| ENERGY (continued) | ||||||||
| OIL, GAS & CONSUMABLE FUELS (continued) | ||||||||
StealthGas1 |
229,664 | $ | 746,408 | |||||
| 10,676,922 | ||||||||
| Total (Cost $20,962,860) | 17,501,378 | |||||||
| FINANCIALS – 11.6% | ||||||||
| BANKS - 2.3% | ||||||||
Bank of N.T. Butterfield & Son |
43,810 | 1,493,921 | ||||||
Blue Hills Bancorp |
50,000 | 895,000 | ||||||
Bryn Mawr Bank |
25,000 | 1,062,500 | ||||||
Caribbean Investment Holdings1 |
735,647 | 126,954 | ||||||
Chemung Financial |
31,000 | 1,267,280 | ||||||
Fauquier Bankshares |
133,200 | 2,564,100 | ||||||
Live Oak Bancshares |
30,900 | 747,780 | ||||||
| 735,647 | 0 | |||||||
Peapack-Gladstone Financial |
20,606 | 644,762 | ||||||
| 8,802,297 | ||||||||
| CAPITAL MARKETS - 8.0% | ||||||||
ASA Gold and Precious Metals |
171,150 | 2,000,743 | ||||||
Canaccord Genuity Group |
224,100 | 921,077 | ||||||
| 3,584 | 714,650 | |||||||
Dundee Corporation Cl. A1 |
413,200 | 908,097 | ||||||
EQT Holdings |
43,150 | 587,354 | ||||||
Fiera Capital Cl. A |
78,000 | 827,036 | ||||||
GAIN Capital Holdings |
25,000 | 155,750 | ||||||
Gluskin Sheff + Associates |
67,400 | 870,566 | ||||||
| 41,727 | 1,575,611 | |||||||
JZ Capital Partners |
209,999 | 1,538,511 | ||||||
Manning & Napier Cl. A |
136,600 | 594,210 | ||||||
Medley Management Cl. A |
153,400 | 997,100 | ||||||
MVC Capital3 |
360,300 | 3,552,558 | ||||||
OHA Investment |
154,620 | 196,367 | ||||||
Pzena Investment Management Cl. A |
6,100 | 61,976 | ||||||
Queen City Investments2 |
948 | 1,256,100 | ||||||
Silvercrest Asset Management Group Cl. A |
203,300 | 2,734,385 | ||||||
Sprott |
1,414,533 | 2,486,995 | ||||||
U.S. Global Investors Cl. A |
646,254 | 988,769 | ||||||
Urbana Corporation |
237,600 | 646,767 | ||||||
Value Line |
144,774 | 2,649,364 | ||||||
Virtu Financial Cl. A |
107,800 | 1,902,670 | ||||||
Warsaw Stock Exchange |
52,900 | 696,930 | ||||||
Westaim Corporation1 |
20,000 | 48,890 | ||||||
Westwood Holdings Group3 |
12,400 | 702,956 | ||||||
| 262,960 | 612,697 | |||||||
| 30,228,129 | ||||||||
| CONSUMER FINANCE - 0.4% | ||||||||
| 201,000 | 1,547,700 | |||||||
| 135,000 | 28,350 | |||||||
| 1,576,050 | ||||||||
| DIVERSIFIED FINANCIAL SERVICES - 0.1% | ||||||||
Banca Finnat Euramerica |
568,000 | 240,034 | ||||||
| 806,207 | 241,862 | |||||||
| 481,896 | ||||||||
| INSURANCE - 0.8% | ||||||||
| 114,000 | 1,284,780 | |||||||
State Auto Financial |
59,264 | 1,524,863 | ||||||
| 2,809,643 | ||||||||
| Total (Cost $48,839,680) | 43,898,015 | |||||||
| HEALTH CARE – 14.9% | ||||||||
| BIOTECHNOLOGY - 4.7% | ||||||||
Abeona Therapeutics1 |
312,221 | 1,998,214 | ||||||
| 145,397 | 2,045,736 | |||||||
ARCA biopharma1 |
179,847 | 440,625 | ||||||
BioCryst Pharmaceuticals1 |
144,000 | 800,640 | ||||||
Invitae Corporation1 |
156,412 | 1,495,299 | ||||||
Keryx Biopharmaceuticals1 |
117,725 | 851,152 | ||||||
Kindred Biosciences1 |
126,000 | 1,083,600 | ||||||
Knight Therapeutics1 |
187,000 | 1,483,829 | ||||||
Progenics Pharmaceuticals1 |
6,500 | 44,135 | ||||||
Sangamo Therapeutics1 |
281,785 | 2,479,708 | ||||||
Zafgen1 |
332,491 | 1,167,043 | ||||||
Zealand Pharma1 |
199,700 | 4,002,988 | ||||||
| 17,892,969 | ||||||||
| HEALTH CARE EQUIPMENT & SUPPLIES - 5.3% | ||||||||
Analogic Corporation |
18,200 | 1,322,230 | ||||||
| 6,569 | 4,225,838 | |||||||
| 140,000 | 351,400 | |||||||
CRH Medical1 |
133,000 | 756,894 | ||||||
| 112,300 | 3,346,540 | |||||||
Inogen1 |
5,400 | 515,268 | ||||||
Invacare Corporation3 |
44,300 | 584,760 | ||||||
LeMaitre Vascular |
5,000 | 156,100 | ||||||
STRATEC Biomedical |
14,000 | 917,831 | ||||||
Surmodics1 |
151,992 | 4,278,575 | ||||||
Syneron Medical1 |
69,200 | 757,740 | ||||||
TearLab Corporation1 |
8,500 | 14,280 | ||||||
Utah Medical Products |
36,200 | 2,620,880 | ||||||
| 19,848,336 | ||||||||
| HEALTH CARE PROVIDERS & SERVICES - 3.1% | ||||||||
Aceto Corporation |
79,600 | 1,229,820 | ||||||
BioTelemetry1 |
49,700 | 1,662,465 | ||||||
Cross Country Healthcare1 |
157,100 | 2,028,161 | ||||||
Landauer |
30,400 | 1,589,920 | ||||||
National Research Cl. A |
89,529 | 2,408,330 | ||||||
PharMerica Corporation1 |
40,000 | 1,050,000 | ||||||
Psychemedics Corporation |
37,500 | 935,625 | ||||||
U.S. Physical Therapy |
10,000 | 604,000 | ||||||
| 11,508,321 | ||||||||
| HEALTH CARE TECHNOLOGY - 0.2% | ||||||||
Connecture1 |
20,000 | 12,358 | ||||||
Vocera Communications1 |
33,100 | 874,502 | ||||||
| 886,860 | ||||||||
| PHARMACEUTICALS - 1.6% | ||||||||
| 80,000 | 300,000 | |||||||
Alcobra1 |
745,055 | 834,462 | ||||||
Flex Pharma1 |
310,210 | 1,194,308 | ||||||
Lipocine1 |
355,404 | 1,428,724 | ||||||
Theravance Biopharma1 |
59,009 | 2,350,919 | ||||||
| 6,108,413 | ||||||||
| Total (Cost $38,115,232) | 56,244,899 | |||||||
| INDUSTRIALS – 21.1% | ||||||||
| AEROSPACE & DEFENSE - 0.7% | ||||||||
Astronics Corporation1 |
4,400 | 134,068 | ||||||
| 660 | 19,965 | |||||||
CPI Aerostructures1 |
11,800 | 110,920 | ||||||
FLYHT Aerospace Solutions1 |
1,916,800 | 332,573 | ||||||
Innovative Solutions and Support1 |
142,828 | 628,443 | ||||||
| THE ACCOMPANYING NOTES ARE AN INTEGRAL PART OF THESE FINANCIAL STATEMENTS | 2017 Semiannual Report to Stockholders | 25 |
Royce Micro-Cap Trust
| Schedule of Investments (continued) |
| SHARES | VALUE | |||||||
| INDUSTRIALS (continued) | ||||||||
| AEROSPACE & DEFENSE (continued) | ||||||||
| 29,700 | $ | 1,250,073 | ||||||
SIFCO Industries1 |
45,800 | 304,570 | ||||||
| 2,780,612 | ||||||||
| BUILDING PRODUCTS - 1.3% | ||||||||
Burnham Holdings Cl. A2 |
117,000 | 1,772,550 | ||||||
DIRTT Environmental Solutions1 |
171,000 | 903,262 | ||||||
Insteel Industries |
44,200 | 1,457,274 | ||||||
Patrick Industries1 |
11,500 | 837,775 | ||||||
| 4,970,861 | ||||||||
| COMMERCIAL SERVICES & SUPPLIES - 2.3% | ||||||||
Atento1 |
246,001 | 2,742,911 | ||||||
CompX International Cl. A |
107,500 | 1,639,375 | ||||||
| 241,677 | 3,842,664 | |||||||
| 17,500 | 410,375 | |||||||
| 8,635,325 | ||||||||
| CONSTRUCTION & ENGINEERING - 2.5% | ||||||||
Aecon Group |
40,500 | 504,064 | ||||||
Ameresco Cl. A1 |
261,900 | 2,016,630 | ||||||
IES Holdings1 |
234,000 | 4,247,100 | ||||||
| 50,000 | 439,500 | |||||||
| 61,600 | 1,001,616 | |||||||
| 27,400 | 1,164,500 | |||||||
| 9,373,410 | ||||||||
| ELECTRICAL EQUIPMENT - 1.1% | ||||||||
Encore Wire3 |
4,100 | 175,070 | ||||||
LSI Industries |
154,212 | 1,395,619 | ||||||
Orion Energy Systems1 |
170,000 | 217,600 | ||||||
Powell Industries |
21,400 | 684,586 | ||||||
Power Solutions International1,2,3,4 |
21,100 | 176,185 | ||||||
Preformed Line Products |
20,743 | 962,890 | ||||||
Revolution Lighting Technologies1 |
81,200 | 535,108 | ||||||
| 4,147,058 | ||||||||
| INDUSTRIAL CONGLOMERATES - 1.0% | ||||||||
Raven Industries3 |
108,959 | 3,628,335 | ||||||
| MACHINERY - 8.3% | ||||||||
Chart Industries1 |
1,100 | 38,203 | ||||||
CIRCOR International3 |
56,900 | 3,378,722 | ||||||
Columbus McKinnon |
1,500 | 38,130 | ||||||
Eastern Company (The) |
39,750 | 1,194,487 | ||||||
Exco Technologies |
118,200 | 973,455 | ||||||
| 99,300 | 2,129,985 | |||||||
FreightCar America |
81,000 | 1,408,590 | ||||||
Global Brass and Copper Holdings |
7,600 | 232,180 | ||||||
| 78,050 | 1,534,463 | |||||||
Harsco Corporation1 |
4,400 | 70,840 | ||||||
Hurco Companies |
36,866 | 1,281,094 | ||||||
Kadant |
53,500 | 4,023,200 | ||||||
Kornit Digital1 |
35,700 | 690,795 | ||||||
Lindsay Corporation3 |
29,400 | 2,623,950 | ||||||
Luxfer Holdings ADR3 |
59,712 | 763,716 | ||||||
Lydall1 |
1,800 | 93,060 | ||||||
NN |
45,300 | 1,243,485 | ||||||
Sun Hydraulics |
78,700 | 3,358,129 | ||||||
Tennant Company |
36,600 | 2,701,080 | ||||||
Titan International |
225,700 | 2,710,657 | ||||||
Westport Fuel Systems1 |
377,900 | 888,065 | ||||||
| 31,376,286 | ||||||||
| MARINE - 1.0% | ||||||||
Clarkson |
109,900 | 3,615,696 | ||||||
| PROFESSIONAL SERVICES - 1.4% | ||||||||
| 190,000 | 779,000 | |||||||
BG Staffing |
2,400 | 41,712 | ||||||
CBIZ1 |
47,000 | 705,000 | ||||||
Franklin Covey1 |
40,100 | 773,930 | ||||||
GP Strategies1 |
7,600 | 200,640 | ||||||
Heidrick & Struggles International |
46,300 | 1,007,025 | ||||||
Kforce3 |
4,700 | 92,120 | ||||||
Resources Connection |
8,800 | 120,560 | ||||||
RPX Corporation1 |
100,000 | 1,395,000 | ||||||
| 5,114,987 | ||||||||
| ROAD & RAIL - 0.6% | ||||||||
Marten Transport |
3,300 | 90,420 | ||||||
| 55,764 | 996,503 | |||||||
| 77,600 | 1,164,000 | |||||||
| 2,250,923 | ||||||||
| TRADING COMPANIES & DISTRIBUTORS - 0.9% | ||||||||
Central Steel & Wire2 |
788 | 433,400 | ||||||
EnviroStar |
64,400 | 1,742,020 | ||||||
Houston Wire & Cable1 |
249,918 | 1,312,069 | ||||||
| 3,487,489 | ||||||||
| Total (Cost $60,718,126) | 79,380,982 | |||||||
| INFORMATION TECHNOLOGY – 19.9% | ||||||||
| COMMUNICATIONS EQUIPMENT - 1.0% | ||||||||
ADTRAN |
23,300 | 481,145 | ||||||
| 3,500 | 216,265 | |||||||
CalAmp Corporation1 |
3,100 | 63,023 | ||||||
Clearfield1 |
61,300 | 809,160 | ||||||
EMCORE Corporation |
8,300 | 88,395 | ||||||
Harmonic1 |
147,000 | 771,750 | ||||||
Oclaro1 |
131,700 | 1,230,078 | ||||||
PCTEL |
34,100 | 241,428 | ||||||
| 3,901,244 | ||||||||
| ELECTRONIC EQUIPMENT, INSTRUMENTS & COMPONENTS - 5.8% | ||||||||
Airgain1 |
3,500 | 49,630 | ||||||
Bel Fuse Cl. A |
67,705 | 1,411,649 | ||||||
ePlus1 |
3,000 | 222,300 | ||||||
Fabrinet1 |
2,200 | 93,852 | ||||||
| 81,700 | 3,088,260 | |||||||
Firan Technology Group1 |
25,000 | 83,475 | ||||||
HollySys Automation Technologies |
62,900 | 1,044,769 | ||||||
Inficon Holding |
3,420 | 1,685,212 | ||||||
LRAD Corporation1 |
853,456 | 1,442,341 | ||||||
| 35,000 | 5,015,850 | |||||||
Netlist1 |
63,600 | 64,872 | ||||||
Novanta1 |
37,600 | 1,353,600 | ||||||
| 92,500 | 3,017,350 | |||||||
PC Connection |
43,716 | 1,182,955 | ||||||
Perceptron1 |
8,500 | 61,880 | ||||||
Richardson Electronics |
316,900 | 1,891,893 | ||||||
| 600 | 65,172 | |||||||
Vishay Precision Group1 |
10,000 | 173,000 | ||||||
| 21,948,060 | ||||||||
| INTERNET SOFTWARE & SERVICES - 3.7% | ||||||||
Actua Corporation1 |
36,876 | 518,108 | ||||||
| 181,787 | 2,744,984 | |||||||
| 26 | 2017 Semiannual Report to Stockholders | THE ACCOMPANYING NOTES ARE AN INTEGRAL PART OF THESE FINANCIAL STATEMENTS |
| June 30, 2017 (unaudited) |
| Schedule of Investments (continued) |
| SHARES | VALUE | |||||||
| INFORMATION TECHNOLOGY (continued) | ||||||||
| INTERNET SOFTWARE & SERVICES (continued) | ||||||||
| 64,195 | $ | 1,681,909 | ||||||
IZEA1 |
126,070 | 240,794 | ||||||
MINDBODY Cl. A1 |
38,900 | 1,058,080 | ||||||
QuinStreet1 |
525,550 | 2,191,543 | ||||||
Reis |
25,000 | 531,250 | ||||||
Solium Capital1 |
309,700 | 2,342,811 | ||||||
Stamps.com1 |
14,500 | 2,245,687 | ||||||
Support.com1 |
105,600 | 247,104 | ||||||
| 13,802,270 | ||||||||
| IT SERVICES - 0.6% | ||||||||
| 150,838 | 843,184 | |||||||
Hackett Group (The) |
27,700 | 429,350 | ||||||
Innodata1 |
437,275 | 765,231 | ||||||
Virtusa Corporation1 |
8,100 | 238,140 | ||||||
| 2,275,905 | ||||||||
| SEMICONDUCTORS & SEMICONDUCTOR EQUIPMENT - 4.6% | ||||||||
| 160,284 | 1,352,797 | |||||||
Brooks Automation |
103,800 | 2,251,422 | ||||||
CyberOptics Corporation1 |
43,000 | 887,950 | ||||||
FormFactor1 |
22,869 | 283,576 | ||||||
Intermolecular1 |
240,000 | 223,200 | ||||||
IXYS Corporation1 |
18,800 | 309,260 | ||||||
Kopin Corporation1 |
242,200 | 898,562 | ||||||
Kulicke & Soffa Industries1 |
88,000 | 1,673,760 | ||||||
MoSys1 |
68,427 | 117,010 | ||||||
Nanometrics1 |
67,300 | 1,702,017 | ||||||
NeoPhotonics Corporation1 |
14,000 | 108,080 | ||||||
Nova Measuring Instruments1 |
73,400 | 1,621,406 | ||||||
PDF Solutions1 |
25,000 | 411,250 | ||||||
Photronics1 |
189,700 | 1,783,180 | ||||||
Sigma Designs1 |
89,000 | 520,650 | ||||||
Silicon Motion Technology ADR |
34,100 | 1,644,643 | ||||||
Ultra Clean Holdings1 |
49,900 | 935,625 | ||||||
Veeco Instruments1 |
17,500 | 487,375 | ||||||
Xcerra Corporation1 |
11,300 | 110,401 | ||||||
| 17,322,164 | ||||||||
| SOFTWARE - 2.9% | ||||||||
Agilysys1 |
170,587 | 1,726,341 | ||||||
American Software Cl. A |
120,352 | 1,238,422 | ||||||
BSQUARE Corporation1 |
83,675 | 468,580 | ||||||
Computer Modelling Group |
337,700 | 2,650,976 | ||||||
Model N1 |
166,693 | 2,217,017 | ||||||
Monotype Imaging Holdings |
15,000 | 274,500 | ||||||
PSI |
34,000 | 546,964 | ||||||
RealNetworks1 |
130,171 | 563,640 | ||||||
Rubicon Project1 |
92,200 | 473,908 | ||||||
SeaChange International1 |
284,200 | 755,972 | ||||||
Varonis Systems1 |
2,600 | 96,720 | ||||||
| 11,013,040 | ||||||||
| TECHNOLOGY HARDWARE, STORAGE & PERIPHERALS - 1.3% | ||||||||
Intevac1 |
293,400 | 3,256,740 | ||||||
Kortek |
135,007 | 1,563,469 | ||||||
| 4,820,209 | ||||||||
| Total (Cost $62,452,717) | 75,082,892 | |||||||
| MATERIALS – 6.7% | ||||||||
| CHEMICALS - 2.2% | ||||||||
Balchem Corporation |
11,775 | 915,035 | ||||||
FutureFuel Corporation |
85,262 | 1,286,604 | ||||||
LSB Industries1 |
135,800 | 1,402,814 | ||||||
Quaker Chemical3 |
26,000 | 3,775,980 | ||||||
Trecora Resources1 |
89,600 | 1,008,000 | ||||||
| 8,388,433 | ||||||||
| CONSTRUCTION MATERIALS - 0.8% | ||||||||
Ash Grove Cement2 |
7,600 | 2,014,076 | ||||||
Monarch Cement2 |
16,303 | 821,671 | ||||||
U.S. Concrete1 |
3,400 | 267,070 | ||||||
| 3,102,817 | ||||||||
| CONTAINERS & PACKAGING - 0.3% | ||||||||
UFP Technologies1 |
36,445 | 1,031,394 | ||||||
| METALS & MINING - 3.4% | ||||||||
Alamos Gold Cl. A |
186,044 | 1,319,868 | ||||||
Ampco-Pittsburgh |
79,002 | 1,165,279 | ||||||
Comstock Mining1 |
1,875,000 | 342,750 | ||||||
Haynes International3 |
26,100 | 947,691 | ||||||
Imdex1 |
400,666 | 232,504 | ||||||
MAG Silver1 |
74,050 | 965,612 | ||||||
Major Drilling Group International1 |
850,357 | 5,567,189 | ||||||
Olympic Steel |
35,000 | 681,800 | ||||||
Pretium Resources1 |
80,000 | 768,661 | ||||||
Universal Stainless & Alloy Products1 |
15,300 | 298,350 | ||||||
Victoria Gold1 |
890,000 | 398,057 | ||||||
| 12,687,761 | ||||||||
| Total (Cost $18,309,690) | 25,210,405 | |||||||
| REAL ESTATE – 4.1% | ||||||||
| EQUITY REAL ESTATE INVESTMENT TRUSTS (REITS) - 0.5% | ||||||||
BRT Apartments1 |
230,331 | 1,810,402 | ||||||
| REAL ESTATE MANAGEMENT & DEVELOPMENT - 3.6% | ||||||||
Altus Group |
87,000 | 1,880,483 | ||||||
| 44,000 | 754,600 | |||||||
| 76,500 | 3,530,475 | |||||||
Griffin Industrial Realty |
43,384 | 1,360,956 | ||||||
Hopefluent Group Holdings |
1,400,000 | 478,773 | ||||||
| 49,567 | 1,306,586 | |||||||
RMR Group Cl. A |
37,100 | 1,804,915 | ||||||
| 115,162 | 2,376,944 | |||||||
| 13,493,732 | ||||||||
| Total (Cost $12,345,792) | 15,304,134 | |||||||
| TELECOMMUNICATION SERVICES – 0.2% | ||||||||
| DIVERSIFIED TELECOMMUNICATION SERVICES - 0.2% | ||||||||
ORBCOMM1 |
67,100 | 758,230 | ||||||
| Total (Cost $570,215) | 758,230 | |||||||
| UTILITIES – 0.4% | ||||||||
| GAS UTILITIES - 0.1% | ||||||||
Shizuoka Gas |
40,000 | 266,015 | ||||||
| INDEPENDENT POWER & RENEWABLE ELECTRICITY PRODUCER - 0.0% | ||||||||
Alterra Power |
45,000 | 197,447 | ||||||
| WATER UTILITIES - 0.3% | ||||||||
Global Water Resources |
106,000 | 1,049,400 | ||||||
| Total (Cost $1,145,614) | 1,512,862 | |||||||
| THE ACCOMPANYING NOTES ARE AN INTEGRAL PART OF THESE FINANCIAL STATEMENTS | 2017 Semiannual Report to Stockholders | 27 |
| Royce Micro-Cap Trust | June 30, 2017 (unaudited) |
| Schedule of Investments (continued) |
| VALUE | ||||||||
| MISCELLANEOUS6 – 4.2% | ||||||||
| Total (Cost $15,862,541) | $ | 15,944,179 | ||||||
| TOTAL COMMON STOCKS | ||||||||
| (Cost $340,041,529) | 397,918,625 | |||||||
| REPURCHASE AGREEMENT– 5.9% | ||||||||
|
Fixed Income Clearing Corporation, 0.12% dated 6/30/17, due 7/3/17, maturity value $22,318,223 (collateralized by obligations of various U.S. Government Agencies, 2.375% due 8/15/24, valued at $22,766,474) |
||||||||
| (Cost $22,318,000) | 22,318,000 | |||||||
| TOTAL INVESTMENTS – 111.4% | ||||||||
| (Cost $362,359,529) | 420,236,625 | |||||||
| LIABILITIES LESS CASH AND OTHER ASSETS – (11.4)% | (43,098,058 | ) | ||||||
| NET ASSETS – 100.0% | $ | 377,138,567 | ||||||
| † | New additions in 2017. |
| 1 | Non-income producing. |
| 2 | These securities
are defined as Level 2 securities due to fair value being based on quoted prices
for similar securities. See Notes to Financial Statements. |
| 3 | All or
a portion of these securities were pledged as collateral in connection with the
Fund’ s revolving credit agreement at June 30, 2017. Total market value of
pledged securities at June 30,
2017, was $71,646,333. |
| 4 | At June
30, 2017, a portion of these securities were rehypothecated in connection with the
Fund’ s revolving credit agreement in the aggregate amount of $43,068,441. |
| 5 | Securities
for which market quotations are not readily available represent 0.1% of net assets.
These securities have been valued at their fair value under procedures approved
by the Fund’s Board of Directors. These securities are defined as Level 3 securities
due to the use of significant unobservable inputs in the determination of fair value.
See Notes to Financial Statements. |
| 6 | Includes
securities first acquired in 2017 and less than 1% of net assets. |
Bold
indicates the Fund’s 20 largest equity holdings in terms of June 30, 2017,
market value. |
|
TAX
INFORMATION: The cost of total investments for Federal income tax purposes was $363,939,812.
At June 30, 2017, net unrealized appreciation for all securities was $56,296,813,
consisting of aggregate gross unrealized appreciation of $107,251,959 and aggregate
gross unrealized depreciation of $50,955,146. The primary cause of the difference
between book and tax basis cost is the timing of the recognition of losses on securities
sold. |
|
| 28 | 2017 Semiannual Report to Stockholders | THE ACCOMPANYING NOTES ARE AN INTEGRAL PART OF THESE FINANCIAL STATEMENTS |
| Royce Micro-Cap Trust | June 30, 2017 (unaudited) | |
| Statement of Assets and Liabilities |
| ASSETS: | |||||
| Investments at value | $ | 397,918,625 | |||
| Repurchase agreements (at cost and value) | 22,318,000 | ||||
| Cash and foreign currency | 238,591 | ||||
| Receivable for investments sold | 2,073,915 | ||||
| Receivable for dividends and interest | 201,909 | ||||
| Prepaid expenses and other assets | 25,599 | ||||
| Total Assets | 422,776,639 | ||||
| LIABILITIES: | |||||
| Revolving credit agreement | 45,000,000 | ||||
| Payable for investments purchased | 384,641 | ||||
| Payable for investment advisory fee | 148,907 | ||||
| Payable for directors’ fees | 24,804 | ||||
| Payable for interest expense | 5,622 | ||||
| Accrued expenses | 74,098 | ||||
| Total Liabilities | 45,638,072 | ||||
| Net Assets | $ | 377,138,567 | |||
| ANALYSIS OF NET ASSETS: | |||||
| Paid-in capital - $0.001 par value per share; 38,409,192 shares outstanding (150,000,000 shares authorized) | $ | 322,651,287 | |||
| Undistributed net investment income (loss) | (1,398,007 | ) | |||
| Accumulated net realized gain (loss) on investments and foreign currency | 10,150,463 | ||||
| Net unrealized appreciation (depreciation) on investments and foreign currency | 57,876,187 | ||||
| Quarterly distributions | (12,141,363 | ) | |||
| Net Assets (net asset value per share - $9.82) | $ | 377,138,567 | |||
| Investments at identified cost | $ | 340,041,529 | |||
| THE ACCOMPANYING NOTES ARE AN INTEGRAL PART OF THESE FINANCIAL STATEMENTS | 2017 Semiannual Report to Stockholders | 29 |
Royce Micro-Cap Trust
| Statement of Changes in Net Assets |
| SIX MONTHS ENDED | ||||||||
| 6/30/17 | ||||||||
| (UNAUDITED) | YEAR ENDED 12/31/16 | |||||||
| INVESTMENT OPERATIONS: | ||||||||
| Net investment income (loss) | $ | 589,423 | $ | 1,040,381 | ||||
| Net realized gain (loss) on investments and foreign currency | 9,012,314 | 17,298,523 | ||||||
| Net change in unrealized appreciation (depreciation) on investments and foreign currency | 10,742,788 | 46,017,634 | ||||||
| Net increase (decrease) in net assets from investment operations | 20,344,525 | 64,356,538 | ||||||
| DISTRIBUTIONS: | ||||||||
| Net investment income | (485,655 | )1 | (2,974,373 | ) | ||||
| Net realized gain on investments and foreign currency | (10,927,226 | )1 | (20,650,513 | ) | ||||
| Return of capital | (728,482 | )1 | – | |||||
| Total distributions | (12,141,363 | ) | (23,624,886 | ) | ||||
| CAPITAL STOCK TRANSACTIONS: | ||||||||
| Reinvestment of distributions | 5,234,652 | 10,562,009 | ||||||
| Total capital stock transactions | 5,234,652 | 10,562,009 | ||||||
| Net Increase (Decrease) In Net Assets | 13,437,814 | 51,293,661 | ||||||
| NET ASSETS: | ||||||||
| Beginning of period | 363,700,753 | 312,407,092 | ||||||
| End of period (including undistributed net investment income (loss) of $(1,398,007) at 6/30/17 and $(1,987,430) at 12/31/16) | $ | 377,138,567 | $ | 363,700,753 | ||||
| 1 Amounts are subject to change and recharacterization at year end. |
| 30 | 2017 Semiannual Report to Stockholders | THE ACCOMPANYING NOTES ARE AN INTEGRAL PART OF THESE FINANCIAL STATEMENTS |
| Royce Micro-Cap Trust | Six Months Ended June 30, 2017 (unaudited) |
| Statement of Operations |
| INVESTMENT INCOME: | ||||
| INCOME: | ||||
| Dividends | $ | 2,218,874 | ||
| Foreign withholding tax | (55,348 | ) | ||
| Interest | 15,462 | |||
| Rehypothecation income | 28,765 | |||
| Total income | 2,207,753 | |||
| EXPENSES: | ||||
| Investment advisory fees | 903,122 | |||
| Interest expense | 471,847 | |||
| Stockholder reports | 64,884 | |||
| Administrative and office facilities | 44,726 | |||
| Directors’ fees | 42,314 | |||
| Custody and transfer agent fees | 41,301 | |||
| Professional fees | 28,058 | |||
| Other expenses | 22,126 | |||
| Total expenses | 1,618,378 | |||
| Compensating balance credits | (48 | ) | ||
| Net expenses | 1,618,330 | |||
| Net investment income (loss) | 589,423 | |||
| REALIZED AND UNREALIZED GAIN (LOSS) ON INVESTMENTS AND FOREIGN CURRENCY: | ||||
| NET REALIZED GAIN (LOSS): | ||||
| Investments | 9,003,885 | |||
| Foreign currency transactions | 8,429 | |||
| NET CHANGE IN UNREALIZED APPRECIATION (DEPRECIATION): | ||||
| Investments and foreign currency translations | 10,742,220 | |||
| Other assets and liabilities denominated in foreign currency | 568 | |||
| Net realized and unrealized gain (loss) on investments and foreign currency | 19,755,102 | |||
| NET INCREASE (DECREASE) IN NET ASSETS FROM INVESTMENT OPERATIONS | $ | 20,344,525 | ||
| THE ACCOMPANYING NOTES ARE AN INTEGRAL PART OF THESE FINANCIAL STATEMENTS | 2017 Semiannual Report to Stockholders | 31 |
| Royce Micro-Cap Trust | Six Months Ended June 30, 2017 (unaudited) |
| Statement of Cash Flows |
| CASH FLOWS FROM OPERATING ACTIVITIES: | ||||
| Net increase (decrease) in net assets from investment operations | $ | 20,344,525 | ||
| Adjustments
to reconcile net increase (decrease) in net assets from investment operations to
net cash provided by operating activities: |
||||
Purchases of long-term investments |
(33,255,508 | ) | ||
Proceeds from sales and maturities of long-term investments |
18,367,371 | |||
Net purchases, sales and maturities of short-term investments |
21,154,000 | |||
Net (increase) decrease in dividends and interest receivable and other assets |
314,850 | |||
Net increase (decrease) in interest expense payable, accrued expenses and other liabilities |
(26,041 | ) | ||
Net change in unrealized appreciation (depreciation) on investments |
(10,742,220 | ) | ||
Net realized gain (loss) on investments and foreign currency |
(9,012,314 | ) | ||
| Net cash provided by operating activities | 7,144,663 | |||
| CASH FLOWS FROM FINANCING ACTIVITIES: | ||||
| Net increase (decrease) in revolving credit agreement | – | |||
| Distributions | (12,141,363 | ) | ||
| Reinvestment of distributions | 5,234,652 | |||
| Net cash used for financing activities | (6,906,711 | ) | ||
| INCREASE (DECREASE) IN CASH: | 237,952 | |||
| Cash and foreign currency at beginning of period | 639 | |||
| Cash and foreign currency at end of period | $ | 238,591 | ||
| 32 | 2017 Semiannual Report to Stockholders | THE ACCOMPANYING NOTES ARE AN INTEGRAL PART OF THESE FINANCIAL STATEMENTS |
Royce Micro-Cap Trust
| Financial Highlights |
| This table is presented to show selected data for a share of Common Stock outstanding throughout each period, and to assist stockholders in evaluating the Fund’s performance for the periods presented. |
| SIX MONTHS | YEARS ENDED | ||||||||||||||||||||||||
| ENDED 6/30/17 | |||||||||||||||||||||||||
| (UNAUDITED) | 12/31/16 | 12/31/15 | 12/31/14 | 12/31/13 | 12/31/12 | ||||||||||||||||||||
| Net Asset Value, Beginning of Period | $ | 9.63 | $ | 8.59 | $ | 11.33 | $ | 14.12 | $ | 10.93 | $ | 9.86 | |||||||||||||
| INVESTMENT OPERATIONS: | |||||||||||||||||||||||||
| Net investment income (loss) | 0.02 | 0.03 | 0.03 | (0.01 | ) | 0.01 | 0.15 | ||||||||||||||||||
| Net realized
and unrealized gain (loss) on investments and foreign currency |
0.51 | 1.70 | (1.42 | ) | 0.25 | 4.64 | 1.58 | ||||||||||||||||||
| Total investment operations | 0.53 | 1.73 | (1.39 | ) | 0.24 | 4.65 | 1.73 | ||||||||||||||||||
| DISTRIBUTIONS TO PREFERRED STOCKHOLDERS: | |||||||||||||||||||||||||
| Net investment income | – | – | – | – | – | (0.02 | ) | ||||||||||||||||||
| Net realized gain on investments and foreign currency | – | – | – | – | – | (0.09 | ) | ||||||||||||||||||
| Total distributions to Preferred Stockholders | – | – | – | – | – | (0.11 | ) | ||||||||||||||||||
| Net Increase (Decrease) in Net Assets Applicable to Common Stockholders from | |||||||||||||||||||||||||
Investment Operations |
0.53 | 1.73 | (1.39 | ) | 0.24 | 4.65 | 1.62 | ||||||||||||||||||
| DISTRIBUTIONS TO COMMON STOCKHOLDERS: | |||||||||||||||||||||||||
| Net investment income | (0.01 | )1 | (0.08 | ) | (0.01 | ) | (0.04 | ) | (0.03 | ) | (0.08 | ) | |||||||||||||
| Net realized gain on investments and foreign currency | (0.29 | )1 | (0.56 | ) | (1.25 | ) | (2.86 | ) | (1.35 | ) | (0.43 | ) | |||||||||||||
| Return of capital | (0.02 | )1 | – | – | – | – | – | ||||||||||||||||||
| Total distributions to Common Stockholders | (0.32 | ) | (0.64 | ) | (1.26 | ) | (2.90 | ) | (1.38 | ) | (0.51 | ) | |||||||||||||
| CAPITAL STOCK TRANSACTIONS: | |||||||||||||||||||||||||
| Effect of reinvestment of distributions by Common Stockholders | (0.02 | ) | (0.05 | ) | (0.09 | ) | (0.13 | ) | (0.08 | ) | (0.04 | ) | |||||||||||||
| Total capital stock transactions | (0.02 | ) | (0.05 | ) | (0.09 | ) | (0.13 | ) | (0.08 | ) | (0.04 | ) | |||||||||||||
| Net Asset Value, End of Period | $ | 9.82 | $ | 9.63 | $ | 8.59 | $ | 11.33 | $ | 14.12 | $ | 10.93 | |||||||||||||
| Market Value, End of Period | $ | 8.65 | $ | 8.16 | $ | 7.26 | $ | 10.08 | $ | 12.61 | $ | 9.45 | |||||||||||||
| TOTAL RETURN:2 | |||||||||||||||||||||||||
| Net Asset Value | 5.93 | %3 | 21.98 | % | (11.64 | )% | 3.46 | % | 44.66 | % | 17.23 | % | |||||||||||||
| Market Value | 10.12 | %3 | 22.30 | % | (16.06 | )% | 3.06 | % | 49.42 | % | 13.95 | % | |||||||||||||
| RATIOS BASED ON AVERAGE NET ASSETS APPLICABLE TO COMMON STOCKHOLDERS: | |||||||||||||||||||||||||
| Investment advisory fee expense4 | 0.50 | %5 | 0.87 | % | 0.93 | % | 0.93 | % | 0.82 | % | 1.12 | % | |||||||||||||
| Other operating expenses | 0.39 | %5 | 0.39 | % | 0.35 | % | 0.25 | % | 0.29 | % | 0.18 | % | |||||||||||||
| Total expenses (net)6 | 0.89 | %5 | 1.26 | % | 1.28 | % | 1.18 | % | 1.11 | % | 1.30 | % | |||||||||||||
| Expenses net of fee waivers and excluding interest expense | 0.63 | %5 | 1.02 | % | 1.08 | % | 1.05 | % | 0.96 | % | 1.27 | % | |||||||||||||
| Expenses prior to fee waivers and balance credits | 0.89 | %5 | 1.26 | % | 1.28 | % | 1.18 | % | 1.11 | % | 1.32 | % | |||||||||||||
| Expenses prior to fee waivers | 0.89 | %5 | 1.26 | % | 1.28 | % | 1.18 | % | 1.11 | % | 1.32 | % | |||||||||||||
| Net investment income (loss) | 0.32 | %5 | 0.32 | % | 0.26 | % | (0.09 | )% | 0.08 | % | 1.46 | % | |||||||||||||
| SUPPLEMENTAL DATA: | |||||||||||||||||||||||||
| Net Assets
Applicable to Common Stockholders, End of Period (in thousands) |
$ | 377,139 | $ | 363,701 | $ | 312,407 | $ | 387,488 | $ | 433,121 | $ | 318,545 | |||||||||||||
| Portfolio Turnover Rate | 5 | % | 26 | % | 39 | % | 41 | % | 29 | % | 28 | % | |||||||||||||
| REVOLVING CREDIT AGREEMENT: | |||||||||||||||||||||||||
| Asset coverage | 938 | % | 908 | % | 794 | % | 746 | % | 1062 | % | 808 | % | |||||||||||||
| Asset coverage per $1,000 | $ | 9,381 | $ | 9,082 | $ | 7,942 | $ | 7,458 | $ | 10,625 | $ | 8,079 | |||||||||||||
| 1 | Amounts are subject to change and recharacterization at year end. |
| 2 | The Market Value Total Return is calculated assuming a purchase of Common Stock on the opening of the first business day and a sale on the closing of the last business day of each period. Dividends and distributions are assumed for the purposes of this calculation to be reinvested at prices obtained under the Fund’s Distribution Reinvestment and Cash Purchase Plan. Net Asset Value Total Return is calculated on the same basis, except that the Fund’s net asset value is used on the purchase and sale dates instead of market value. |
| 3 | Not annualized |
| 4 | The investment advisory fee is calculated based on average net assets over a rolling 36-month basis, while the above ratios of investment advisory fee expenses are based on the average net assets applicable to Common Stockholders over a 12-month basis. |
| 5 | Annualized |
| 6 | Expense ratio based on total average net assets including liquidation value of Preferred Stock was 1.10% for the year ended December 31, 2012. |
| THE ACCOMPANYING NOTES ARE AN INTEGRAL PART OF THESE FINANCIAL STATEMENTS | 2017 Semiannual Report to Stockholders | 33 |
Royce Micro-Cap Trust
Notes to Financial Statements (unaudited)
| Summary of Significant Accounting Policies |
Royce Micro-Cap
Trust, Inc. (the “Fund”), is a diversified closed-end investment company that was
incorporated under the laws of the State of Maryland on September 9, 1993. The Fund
commenced operations on December 14, 1993. |
The preparation
of financial statements in conformity with accounting principles generally accepted
in the United States of America requires management to make estimates and assumptions
that affect the reported amounts of assets and liabilities and the disclosure of
contingent assets and liabilities at the date of the financial statements and the
reported amounts of income and expenses during the reporting period. Actual results
could differ from those estimates. |
The Fund is
an investment company and accordingly follows the investment company accounting
and reporting guidance of the Financial Accounting Standards Board (FASB) Accounting
Standard Codification Topic 946 “Financial Services-Investment Companies”. |
| VALUATION OF INVESTMENTS: |
Securities
are valued as of the close of trading on the New York Stock Exchange (NYSE) (generally
4:00 p.m. Eastern time) on the valuation date. Securities that trade on an exchange,
and securities traded on Nasdaq’s Electronic Bulletin Board, are valued at
their last reported sales price or Nasdaq official closing price taken from the
primary market in which each security trades or, if no sale is reported for such
day, at their highest bid price. Other over-the-counter securities for which market
quotations are readily available are valued at their highest bid price, except in
the case of some bonds and other fixed income securities which may be valued by
reference to other securities with comparable ratings, interest rates and maturities,
using established independent pricing services. The Fund values its non-U.S. dollar
denominated securities in U.S. dollars daily at the prevailing foreign currency
exchange rates as quoted by a major bank. Securities for which market quotations
are not readily available are valued at their fair value in accordance with the
provisions of the 1940 Act, under procedures approved by the Fund’s Board of
Directors, and are reported as Level 3 securities. As a general principle, the fair
value of a security is the amount which the Fund might reasonably expect to receive
for the security upon its current sale. However, in light of the judgment involved
in fair valuations, there can be no assurance that a fair value assigned to a particular
security will be the amount which the Fund might be able to receive upon its current
sale. In addition, if, between the time trading ends on a particular security and
the close of the customary trading session on the NYSE, events occur that are significant
and may make the closing price unreliable, the Fund may fair value the security.
The Fund uses an independent pricing service to provide fair value estimates for
relevant non-U.S. equity securities on days when the U.S. market volatility exceeds
a certain threshold. This pricing service uses proprietary correlations it has developed
between the movement of prices of non-U.S. equity securities and indices of U.S.-traded
securities, futures contracts and other indications to estimate the fair value of
relevant non-U.S. securities. When fair value pricing is employed, the prices of
securities used by the Fund may differ from quoted or published prices for the same
security. Investments in money market funds are valued at net asset value per share. |
Various inputs
are used in determining the value of the Fund’s investments, as noted above.
These inputs are summarized in the three broad levels below: |
| Level 1 | – | quoted prices in active markets for identical securities. | ||
| Level 2 | – | other significant
observable inputs (including quoted prices for similar securities, foreign securities
that may be fair valued and repurchase agreements). The table below includes all
Level 2 securities. Level 2 securities with values based on quoted prices for similar
securities are noted in the Schedule of Investments. |
||
| Level 3 | – | significant
unobservable inputs (including last trade price before trading was suspended, or
at a discount thereto for lack of marketability or otherwise, market price information
regarding other securities, information received from the company and/or published
documents, including SEC filings and financial statements, or other publicly available
information). |
||
The inputs or methodology used for valuing securities are not necessarily an indication
of the risk associated with investing in those securities. |
||||
The following is a summary of the inputs used to value the Fund’s investments
as of June 30, 2017. For a detailed breakout of common stocks by sector classification,
please refer to the Schedule of Investments. |
||||
| LEVEL 1 | LEVEL 2 | LEVEL 3 | TOTAL | |||||||||
| Common Stocks | $387,032,029 | $10,644,734 | $241,862 | $397,918,625 | ||||||||
| Cash Equivalents | – | 22,318,000 | – | 22,318,000 | ||||||||
Certain securities
have transferred in and out of Level 1 and Level 2 measurements during the reporting
period. The Fund recognizes transfers between levels as of the end of the reporting
period. For the six months ended June 30, 2017, securities valued at $2,043,671
were transferred from Level 1 to Level 2 and securities valued at $19,504,834 were
transferred from Level 2 to Level 1 within the fair value hierarchy. |
34 | 2017 Semiannual Report to Stockholders
Royce Micro-Cap Trust
Notes to Financial Statements (unaudited) (continued)
VALUATION OF INVESTMENTS (continued):
| BALANCE AS OF 12/31/16 | PURCHASES | REALIZED
AND UNREALIZED GAIN (LOSS)1 |
BALANCE AS OF 6/30/17 | |||||
| Common Stocks | $241,862 | $0 | $– | $241,862 | ||||
| 1 | The net change
in unrealized appreciation (depreciation) is included in the accompanying Statement
of Operations. Change in unrealized appreciation (depreciation) includes net unrealized
appreciation (depreciation) resulting from changes in investment values during the
reporting period and the reversal of previously recorded unrealized appreciation
(depreciation) when gains or losses are realized. Net realized gain (loss) from
investments and foreign currency transactions is included in the accompanying Statement
of Operations. |
The following table summarizes the valuation techniques used and unobservable inputs
approved by the Valuation Committee to determine the fair value of certain, material
Level 3 investments. The table does not include Level 3 investments with values
derived utilizing prices from prior transactions or third party pricing information
with adjustments (e.g. broker quotes, pricing services, net asset values). |
|
| FAIR
VALUE AT 6/30/17 |
VALUATION TECHNIQUE(S) | UNOBSERVABLE INPUT(S) | RANGE AVERAGE | IMPACT
TO VALUATION FROM AN INCREASE IN INPUT1 |
||||||
| Common Stocks | $241,862 | Discounted
Present Value Balance Sheet Analysis |
Liquidity Discount | 30%-40% | Decrease | |||||
| 1 | This column
represents the directional change in the fair value of the Level 3 investments that
would result in an increase from the corresponding unobservable input. A decrease
to the unobservable input would have the opposite effect. Significant increases
and decreases in these unobservable inputs in isolation could result in significantly
higher or lower fair value measurements. |
| REPURCHASE AGREEMENTS: |
The Fund may
enter into repurchase agreements with institutions that the Fund’s investment
adviser has determined are creditworthy. The Fund restricts repurchase agreements
to maturities of no more than seven days. Securities pledged as collateral for repurchase
agreements, which are held until maturity of the repurchase agreements, are marked-to-market
daily and maintained at a value at least equal to the principal amount of the repurchase
agreement (including accrued interest). Repurchase agreements could involve certain
risks in the event of default or insolvency of the counter-party, including possible
delays or restrictions upon the ability of the Fund to dispose of its underlying
securities. The remaining contractual maturity of the repurchase agreement held
by the Fund at June 30, 2017 is overnight and continuous. |
| FOREIGN CURRENCY: |
Net realized
foreign exchange gains or losses arise from sales and maturities of short-term securities,
sales of foreign currencies, expiration of currency forward contracts, currency
gains or losses realized between the trade and settlement dates on securities transactions,
and the difference between the amounts of dividends, interest, and foreign withholding
taxes recorded on the Fund’s books and the U.S. dollar equivalent of the amounts
actually received or paid. Net unrealized foreign exchange gains and losses arise
from changes in the value of assets and liabilities, including investments in securities
at the end of the reporting period, as a result of changes in foreign currency exchange
rates. |
| TAXES: |
As a qualified
regulated investment company under Subchapter M of the Internal Revenue Code, the
Fund is not subject to income taxes to the extent that it distributes substantially
all of its taxable income for its fiscal year. The Schedule of Investments includes
information regarding income taxes under the caption “Tax Information”. |
| DISTRIBUTIONS: |
The Fund pays
quarterly distributions on the Fund’s Common Stock at the annual rate of 7%
of the rolling average of the prior four calendar quarter-end NAVs of the Fund’s
Common Stock, with the fourth quarter distribution being the greater of 1.75% of
the rolling average or the distribution required by IRS regulations. Prior to November
15, 2012, distributions to Preferred Stockholders were accrued daily and paid quarterly.
Distributions to Common Stockholders are recorded on ex-dividend date. Distributable
capital gains and/or net investment income were first allocated to Preferred Stockholder
distributions, with any excess allocable to Common Stockholders. If capital gains
and/or net investment income were allocated to both Preferred and Common Stockholders,
the tax character of such allocations was proportional. To the extent that distributions
are not paid from long-term capital gains, net investment income or net short-term
capital gains, they will represent a return of capital. Distributions are determined
in accordance with income tax regulations that may differ from accounting principles
generally accepted in the United States of America. Permanent book and tax differences
relating to stockholder distributions will result in reclassifications within the
capital accounts. Undistributed net investment income may include temporary book
and tax basis differences, which will reverse in a subsequent period. Any taxable
income or gain remaining undistributed at fiscal year end is distributed in the
following year. |
2017 Semiannual Report to Stockholders | 35
Royce Micro-Cap Trust
Notes to Financial Statements (unaudited) (continued)
| INVESTMENT TRANSACTIONS AND RELATED INVESTMENT INCOME: |
Investment
transactions are accounted for on the trade date. Dividend income is recorded on
the ex-dividend date. Non-cash dividend income is recorded at the fair market value
of the securities received. Interest income is recorded on an accrual basis. Premiums
and discounts on debt securities are amortized using the effective yield-to-maturity
method. Realized gains and losses from investment transactions are determined on
the basis of identified cost for book and tax purposes. |
| EXPENSES: |
The Fund incurs
direct and indirect expenses. Expenses directly attributable to the Fund are charged
to the Fund’s operations, while expenses applicable to more than one of the
Royce Funds are allocated equitably. Certain personnel, occupancy costs and other
administrative expenses related to the Funds are allocated by Royce & Associates
(“Royce”) under an administration agreement and are included in administrative
and office facilities and professional fees. The Fund has adopted a deferred fee
agreement that allows the Directors to defer the receipt of all or a portion of
directors’ fees otherwise payable. The deferred fees are invested in certain
Royce Funds until distributed in accordance with the agreement. |
| COMPENSATING BALANCE CREDITS: |
The Fund has
an arrangement with its custodian bank, whereby a portion of the custodian’s
fee is paid indirectly by credits earned on the Fund’s cash on deposit with
the bank. This deposit arrangement is an alternative to purchasing overnight investments.
Conversely, the Fund pays interest to the custodian on any cash overdrafts, to the
extent they are not offset by credits earned on positive cash balances. |
| Capital Stock: |
The Fund issued
628,862 and 1,405,544 shares of Common Stock as reinvestment of distributions for
the six months ended June 30, 2017 and the year ended December 31, 2016, respectively. |
| Borrowings: |
The Fund is
party to a revolving credit agreement (the credit agreement) with BNP Paribas Prime
Brokerage International, Limited (BNPPI). The Fund pays a commitment fee of 0.50%
per annum on the unused portion of the credit agreement. The credit agreement has
a 360-day rolling term that resets daily; however, if the Fund exceeds certain net
asset value triggers, the credit agreement may convert to a 60-day rolling term
that resets daily. The Fund is required to pledge portfolio securities as collateral
in an amount up to two times the loan balance outstanding or as otherwise required
by applicable regulatory standards and has granted a security interest in the securities
pledged to, and in favor of, BNPPI as security for the loan balance outstanding.
If the Fund fails to meet certain requirements, or maintain other financial covenants
required under the credit agreement, the Fund may be required to repay immediately,
in part or in full, the loan balance outstanding under the credit agreement which
may necessitate the sale of portfolio securities at potentially inopportune times.
BNPPI may terminate the credit agreement upon certain ratings downgrades of its
corporate parent, which would result in the Fund’s entire loan balance becoming
immediately due and payable. The occurrence of such ratings downgrades may necessitate
the sale of portfolio securities at potentially inopportune times. The credit agreement
also permits, subject to certain conditions, BNPPI to rehypothecate portfolio securities
pledged by the Fund up to the amount of the loan balance outstanding. The Fund continues
to receive payments in lieu of dividends and interest on rehypothecated securities.
The Fund also has the right under the credit agreement to recall the rehypothecated
securities from BNPPI on demand. If BNPPI fails to deliver the recalled security
in a timely manner, the Fund is compensated by BNPPI for any fees or losses related
to the failed delivery or, in the event a recalled security is not returned by BNPPI,
the Fund, upon notice to BNPPI, may reduce the loan balance outstanding by the value
of the recalled security failed to be returned. The Fund receives a portion of the
fees earned by BNPPI in connection with the rehypothecation of portfolio securities. |
As of June
30, 2017, the Fund has outstanding borrowings of $45,000,000. During the six months
ended June 30, 2017, the Fund borrowed an average daily balance of $45,000,000 at
a weighted average borrowing cost of 2.09%. The maximum amount outstanding during
the six months ended June 30, 2017 was $45,000,000. As of June 30, 2017, the aggregate
value of rehypothecated securities was $43,068,441. During the six months ended June
30, 2017, the Fund earned $28,765 in fees from rehypothecated securities. |
| Investment Advisory Agreement: |
As compensation
for its services under the investment advisory agreement, Royce receives a fee comprised
of a Basic Fee (“Basic Fee”) and an adjustment to the Basic Fee based
on the investment performance of the Fund in relation to the investment record of
the Russell 2000. |
36 | 2017 Semiannual Report to Stockholders
Royce Micro-Cap Trust
Notes to Financial Statements (unaudited) (continued)
| Investment Advisory Agreement (continued): |
The Basic
Fee is a monthly fee equal to 1/12 of 1% (1% on an annualized basis) of the average
of the Fund’s month-end net assets applicable to Common Stockholders, plus
the liquidation value of outstanding Preferred Stock through October 31, 2015, for
the rolling 36-month period ending with such month (the “performance period”). The
Basic Fee for each month is increased or decreased at the rate of 1/12 of .05% for
each percentage point that the investment performance of the Fund exceeds, or is
exceeded by, the percentage change in the investment record of the Russell 2000
for the performance period by more than two percentage points. The performance period
for each such month is a rolling 36-month period ending with such month. The maximum
increase or decrease in the Basic Fee for any month may not exceed 1/12 of .5%. Accordingly,
for each month, the maximum monthly fee rate as adjusted for performance is 1/12
of 1.5% and is payable if the investment performance of the Fund exceeds the percentage
change in the investment record of the Russell 2000 by 12 or more percentage points
for the performance period, and the minimum monthly fee rate as adjusted for performance
is 1/12 of .5% and is payable if the percentage change in the investment record of
the Russell 2000 exceeds the investment performance of the Fund by 12 or more percentage
points for the performance period. |
For the six
rolling 36-month periods ended June 2017, the Fund’s investment performance
ranged from 13% to 15% below the investment performance of the Russell 2000. Accordingly,
the net investment advisory fee consisted of a Basic Fee of $1,806,242 and a net
downward adjustment of $903,120 for the performance of the Fund relative to that
of the Russell 2000. For the six months ended June 30, 2017, the Fund expensed Royce
investment advisory fees totaling $903,122. |
| Purchases and Sales of Investment Securities: |
For the six
months ended June 30, 2017, the costs of purchases and proceeds from sales of investment
securities, other than short-term securities, amounted to $33,365,684 and $20,263,468,
respectively. |
Cross trades
were executed by the Fund pursuant to Rule 17a-7 under the 1940 Act. Cross trading
is the buying or selling of portfolio securities between funds to which Royce serves
as investment adviser. At its regularly scheduled quarterly meetings, the Board
reviews such transactions as of the most recent calendar quarter for compliance
with the requirements and restrictions set forth by Rule 17a-7. Cross trades for
the six months ended June 30, 2017, were as follows: |
| COST OF PURCHASES | PROCEEDS FROM SALES | REALIZED GAIN (LOSS) | ||
| $1,007,283 | $– | $– | ||
2017 Semiannual Report to Stockholders | 37
| MANAGER’S DISCUSSION |
| Royce Value Trust (RVT) |
 |
| Chuck Royce |
| FUND PERFORMANCE |
| We were very pleased with Royce Value Trust’s (“RVT”) first-half results. Strong on both an absolute and relative basis, performance was all the more impressive in a semiannual period that saw value underperform growth and was thus not entirely conducive to the Fund’s multiple investment theme approach. RVT advanced 7.3% on a net asset value (“NAV”) basis and 13.1% on a market price basis for the year-to-date period ended June 30, 2017, in both cases outperforming its unleveraged small-cap benchmarks, the Russell 2000 and S&P SmallCap 600 Indexes, which had respective increases of 5.0% and 2.8% for the same period. |
| For the first quarter, RVT gained 3.8% based on NAV and 6.5% on market price, outpacing the Russell 2000, which was up 2.5%, and the S&P SmallCap 600, which rose 1.0%, for the same period. The Fund’s relative advantage extended to the second quarter, when it climbed 3.4% on an NAV basis and 6.2% on a market price basis versus 2.5% for the Russell 2000 and 1.7% for the S&P SmallCap 600. RVT beat both of its benchmarks on an NAV basis for the one-, 30-year, and since inception (11/26/86) periods ended June 30, 2017. The Fund added advantages over the Russell 2000 for the 20- and 25-year periods ended June 30, 2017 based on both NAV and market price. RVT’s average annual NAV total return for the since inception period was 10.6%, all under the management of Chuck Royce. |
| WHAT WORKED... AND WHAT DIDN’T |
| Seven of the Fund’s 11 equity sectors finished the first half in the black, two were essentially flat, and two more detracted from performance. Information Technology and Industrials made the biggest positive impacts. At the industry level, a group from each sector dominated returns in a similar fashion—the electronic equipment, instruments & components group (Information Technology) and machinery stocks (Industrials). |
| The Fund’s two top contributors at the position level were holdovers
from 2016’s top performers. Laser diode and equipment maker
Coherent took the top spot, as it did in 2016, galvanized by ongoing
sales and earnings growth driven by vibrant demand for ramped up
OLED (organic light-emitting diode) capacity. Cognex Corporation
is the market leader in machine vision technology, which captures
and analyzes visual information to automate tasks that previously
relied on human eyesight and is thus a major driver of industrial
and process automation. The trend toward automation continues to
drive broad order strength for its machine vision systems. Cognex
also supplemented its robust technology portfolio with three small
acquisitions that should enhance its capabilities in emerging areas such
as 3D and adaptive learning. Another top contributor, The Advisory
Board specializes in performance improvement software and solutions to the healthcare and higher education industries. Among 2016’s top
detractors, it rebounded soundly in the first half as an activist investor
disclosed a large equity stake, which encouraged other investors. Of the two portfolio sectors that detracted from first-half performance, only Energy had a significant negative impact. Net losses for Consumer Discretionary were modest, a pattern that was mirrored at the industry level. The energy equipment & services group (Energy) was by far the portfolio’s biggest detractor, followed by an appreciably lower negative impact for specialty retail (Consumer Discretionary), which continued to struggle with secular shifts in consumer spending and behavior. The top detractor at the position level was Era Group, which provides helicopter transportation services and personnel primarily to and from offshore oil drilling rigs and platforms. The cratering price of oil created challenges for its business that were reflected in disappointing earnings. Liking the long-term prospects for its niche business, we held shares at the end of June. Toronto-based Dundee Corporation, which is involved in wealth management, real estate, and natural resources, experienced losses in mining- and resource-based activities that put downward pressure on its shares. Relative to the Russell 2000, RVT benefited most from savvy stock picking in three sectors—Financials, where capital markets stood out, Industrials, where machinery and professional services provided a sizable relative edge, and Information Technology, where electronic equipment, instruments & components outperformed. Conversely, poor stock selection in specialty retail and an overweight in distributors created a disadvantage in Consumer Discretionary while our underweights in biotechnology (Health Care) and, to a lesser extent, Utilities also hurt relative results. |
| Top Contributors to Performance | |||
| Year-to-Date Through 6/30/17 (%)1 | |||
| Coherent | 0.76 | ||
| Cognex Corporation | 0.34 | ||
| Advisory Board (The) | 0.28 | ||
| MarketAxess Holdings | 0.27 | ||
| Community Health Systems | 0.25 | ||
| 1 Includes dividends | |||
| Top Detractors from Performance | |||
| Year-to-Date Through 6/30/17 (%)2 | |||
| Era Group | -0.30 | ||
| Dundee Corporation Cl. A | -0.18 | ||
| Wesco Aircraft Holdings | -0.18 | ||
| Monro Muffler Brake | -0.17 | ||
| Core-Mark Holding Company | -0.17 | ||
| 2 Net of dividends | |||
| CURRENT POSITIONING AND OUTLOOK |
| We think that RVT’s portfolio remains well-positioned to benefit from a cyclical upswing, with more than 70% of its net assets invested in Industrials, Information Technology, Financials, and Materials at the end of June. So while a correction would not be surprising, we are optimistic that the expanding rate of global growth can help small-cap companies, especially those with growing earnings, to excel. The message that we receive from the companies we speak to each day remains positive. With order books continuing to fill up, the management teams remain confident about their business, which in turn gives us confidence in the long-term prospects for RVT’s multi-themed core approach. |
| 38 | 2017 Semiannual Report to Stockholders |
| PERFORMANCE AND PORTFOLIO REVIEW | SYMBOLS MARKET PRICE RVT NAV XRVTX |
|
Performance Average Annual Total Return (%) Through 6/30/17 |
||||||||||||||||||||
| JAN-JUN 20171 | 1-YR | 3-YR | 5-YR | 10-YR | 15-YR | 20-YR | 25-YR | 30-YR | SINCE INCEPTION (11/26/86) | |||||||||||
| RVT (NAV) | 7.29 | 25.76 | 6.95 | 13.38 | 5.56 | 8.77 | 9.52 | 10.81 | 10.47 | 10.63 | ||||||||||
| 1 Not Annualized | ||||||||||||||||||||
| Market Price Performance History Since Inception (11/26/86) Cumulative Performance of Investment through 6/30/171 |
||||||||||||
| 1-YR | 5-YR | 10-YR | 15-YR | 20-YR | SINCE INCEPTION (11/26/86) | |||||||||||||||
| RVT | 33.8% | 92.2% | 55.2% | 215.6% | 549.8% | 1746.1% | ||||||||||||||
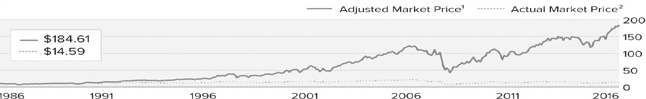 |
| 1 | Reflects the cumulative performance of an investment made by a stockholder who purchased one share at inception ($10.00 IPO), reinvested
all distributions and fully participated in primary subscriptions of the Fund's rights offerings. |
| 2 | Reflects the actual month-end market price movement of one share as it has traded on the NYSE. |
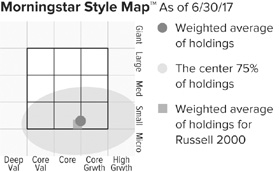
The Morningstar Style Map is the Morningstar Style Box™
with the center 75% of fund holdings plotted as the Morningstar
Ownership Zone™. The Morningstar Style Box is designed to reveal a
fund’s investment strategy. The Morningstar Ownership Zone provides
detail about a portfolio’s investment style by showing the range of
stock sizes and styles. The Ownership Zone is derived by plotting each
stock in the portfolio within the proprietary Morningstar Style Box.
Over time, the shape and location of a fund's ownership zone may vary.
See page 61 for additional information. |
| Top 10 Positions | |||
| % of Net Assets | |||
| Coherent | 1.7 | ||
| HEICO Corporation | 1.4 | ||
| Cognex Corporation | 1.3 | ||
| Quaker Chemical | 1.2 | ||
| E-L Financial | 1.0 | ||
| Copart | 1.0 | ||
| Ash Grove Cement Cl. B | 1.0 | ||
| Nautilus | 1.0 | ||
| ManpowerGroup | 0.9 | ||
| RBC Bearings | 0.9 | ||
| Portfolio Sector Breakdown | |||
| % of Net Assets | |||
| Industrials | 30.6 | ||
| Information Technology | 17.9 | ||
| Financials | 14.9 | ||
| Consumer Discretionary | 11.0 | ||
| Materials | 7.5 | ||
| Health Care | 5.7 | ||
| Energy | 4.1 | ||
| Real Estate | 3.0 | ||
| Consumer Staples | 2.2 | ||
| Telecommunication Services | 0.6 | ||
| Utilities | 0.1 | ||
| Miscellaneous | 2.2 | ||
| Cash and Cash Equivalents, Net of Outstanding Line of Credit |
0.2 | ||
| Calendar Year Total Returns (%) | |||
| YEAR | RVT | ||
| 2016 | 26.8 | ||
| 2015 | -8.1 | ||
| 2014 | 0.8 | ||
| 2013 | 34.1 | ||
| 2012 | 15.4 | ||
| 2011 | -10.1 | ||
| 2010 | 30.3 | ||
| 2009 | 44.6 | ||
| 2008 | -45.6 | ||
| 2007 | 5.0 | ||
| 2006 | 19.5 | ||
| 2005 | 8.4 | ||
| 2004 | 21.4 | ||
| 2003 | 40.8 | ||
| 2002 | -15.6 | ||
| Portfolio Diagnostics | |||
| Fund Net Assets | $1,361 million | ||
| Number of Holdings | 448 | ||
| Turnover Rate | 8% | ||
| Net Asset Value | $16.37 | ||
| Market Price | $14.59 | ||
| Average Market Capitalization1 | $1,590 million | ||
| Weighted Average P/E Ratio2,3 | 21.3x | ||
| Weighted Average P/B Ratio2 | 2.2x | ||
| Active Share4 | 89% | ||
| U.S. Investments (% of Net Assets) | 82.3% | ||
| Non-U.S. Investments (% of Net Assets) | 17.5% | ||
| 1 | Geometric
Average. This weighted calculation uses each portfolio
holding’s market cap in a way designed to not skew the effect of
very large or small holdings; instead, it aims to better identify
the portfolio’s center, which Royce believes offers a more accurate
measure of average market cap than a simple mean or median. |
| 2 | Harmonic
Average. This weighted calculation evaluates a portfolio
as if it were a single stock and measures it overall. It compares the
total market value of the portfolio to the portfolio’s share in the
earnings or book value, as the case may be, of its underlying stocks. |
| 3 | The Fund’s P/E ratio calculation excludes companies with zero or
negative earnings (16% of portfolio holdings as of 6/30/17). |
| 4 | Active Share
is the sum of the absolute values of the different
weightings of each holding in the Fund versus each holding in the
benchmark, divided by two. |
| Important Performance and Risk Information |
All performance information reflects past performance, is presented on a total return basis, net of the Fund’s investment advisory fee, and reflects the reinvestment of distributions. Past performance is no guarantee of future results. Current performance may be higher or lower than performance quoted. Returns as of the most recent month-end may be obtained at www.roycefunds.com. Certain immaterial adjustments were made to the net assets of Royce Value Trust at 12/31/16 for financial reporting purposes, and as a result the net asset value originally calculated on that date and the total return based on that net asset value differs from the adjusted net asset value and total return reported in the Financial Highlights. The market price of the Fund’s shares will fluctuate, so that shares may be worth more or less than their original cost when sold. The Fund invests primarily in securities of small- and micro-cap companies, which may involve considerably more risk than investing in larger-cap companies. The Fund’s broadly diversified portfolio does not ensure a profit or guarantee against loss. Regarding the “Top Contributors” and “Top Detractors” tables shown above, the sum of all contributors to, and all detractors from, performance for all securities in the portfolio would approximate the Fund’s year-to date performance for 2017. |
| 2017 Semiannual Report to Stockholders | 39 |
Royce Value Trust
| Schedule of Investments | |||||||
| Common Stocks – 99.8% | |||||||
| SHARES | VALUE | ||||||
| CONSUMER DISCRETIONARY – 11.0% | |||||||
| AUTO COMPONENTS - 1.4% | |||||||
Cooper Tire & Rubber |
86,700 | $ | 3,129,870 | ||||
Gentex Corporation |
222,170 | 4,214,565 | |||||
LCI Industries |
74,016 | 7,579,238 | |||||
Sebang Global Battery |
28,500 | 990,146 | |||||
Standard Motor Products |
50,391 | 2,631,418 | |||||
| 18,545,237 | |||||||
| AUTOMOBILES - 0.7% | |||||||
Thor Industries1 |
91,310 | 9,543,721 | |||||
| DISTRIBUTORS - 0.8% | |||||||
Core-Mark Holding Company |
220,900 | 7,302,954 | |||||
| 255,000 | 107,355 | ||||||
Uni-Select |
30,200 | 729,383 | |||||
Weyco Group |
97,992 | 2,732,017 | |||||
| 10,871,709 | |||||||
| DIVERSIFIED CONSUMER SERVICES - 0.8% | |||||||
Adtalem Global Education3 |
52,054 | 1,975,449 | |||||
American Public Education3 |
42,400 | 1,002,760 | |||||
Cambium Learning Group3 |
100,000 | 507,000 | |||||
Collectors Universe |
50,000 | 1,242,500 | |||||
H&R Block |
8,000 | 247,280 | |||||
Liberty Tax Cl. A |
151,573 | 1,962,871 | |||||
Lincoln Educational Services3 |
330,600 | 1,024,860 | |||||
Regis Corporation3 |
40,000 | 410,800 | |||||
Universal Technical Institute3 |
504,032 | 1,799,394 | |||||
| 10,172,914 | |||||||
| HOTELS, RESTAURANTS & LEISURE - 0.4% | |||||||
Biglari Holdings3 |
1,500 | 599,610 | |||||
Century Casinos3 |
222,360 | 1,638,793 | |||||
Lindblad Expeditions Holdings3 |
207,600 | 2,179,800 | |||||
Rank Group |
400,000 | 1,235,764 | |||||
Zoe’s Kitchen3 |
15,000 | 178,650 | |||||
| 5,832,617 | |||||||
| HOUSEHOLD DURABLES - 2.3% | |||||||
AV Homes3 |
66,100 | 1,325,305 | |||||
Cavco Industries3 |
14,700 | 1,905,855 | |||||
Ethan Allen Interiors |
231,000 | 7,461,300 | |||||
Flexsteel Industries |
13,900 | 752,129 | |||||
| 22,400 | 5,413,856 | ||||||
Natuzzi ADR3 |
2,096,300 | 5,555,195 | |||||
PICO Holdings3 |
409,400 | 7,164,500 | |||||
Samson Holding |
2,500,000 | 204,932 | |||||
Stanley Furniture5 |
912,235 | 1,030,826 | |||||
| 30,813,898 | |||||||
| INTERNET & DIRECT MARKETING RETAIL - 0.5% | |||||||
CafePress 3 |
110,000 | 284,900 | |||||
FTD Companies3 |
298,014 | 5,960,280 | |||||
| 6,245,180 | |||||||
| LEISURE PRODUCTS - 1.1% | |||||||
Character Group |
91,500 | 575,015 | |||||
MCBC Holdings3 |
84,500 | 1,651,975 | |||||
Nautilus3 |
677,500 | 12,974,125 | |||||
| 15,201,115 | |||||||
| MEDIA - 0.4% | |||||||
| 64,460 | 1,148,033 | ||||||
Entravision Communications Cl. A |
108,200 | 714,120 | |||||
Global Eagle Entertainment3 |
110,000 | 391,600 | |||||
Gray Television3 |
50,000 | 685,000 | |||||
New Media Investment Group |
60,100 | 810,148 | |||||
Pico Far East Holdings |
3,484,400 | 1,459,374 | |||||
T4F Entretenimento |
150,000 | 278,457 | |||||
Technicolor |
120,000 | 523,287 | |||||
| 6,010,019 | |||||||
| MULTILINE RETAIL - 0.0% | |||||||
New World Department Store China3 |
1,447,500 | 357,822 | |||||
| SPECIALTY RETAIL - 1.3% | |||||||
AutoCanada |
78,800 | 1,159,396 | |||||
Barnes & Noble |
47,000 | 357,200 | |||||
Barnes & Noble Education3 |
20,000 | 212,600 | |||||
Buckle (The)1 |
36,115 | 642,847 | |||||
Byggmax Group |
70,000 | 508,920 | |||||
Caleres 1 |
132,300 | 3,675,294 | |||||
| 158,200 | 936,544 | ||||||
Destination Maternity3 |
557,967 | 1,807,813 | |||||
Haverty Furniture |
23,700 | 594,870 | |||||
I.T |
827,000 | 407,809 | |||||
Monro Muffler Brake |
111,500 | 4,655,125 | |||||
Oriental Watch Holdings |
967,900 | 210,751 | |||||
Topps Tiles |
750,000 | 805,891 | |||||
TravelCenters of America LLC3 |
92,500 | 379,250 | |||||
West Marine |
131,100 | 1,684,635 | |||||
| 18,038,945 | |||||||
| TEXTILES, APPAREL & LUXURY GOODS - 1.3% | |||||||
Crown Crafts |
97,741 | 674,413 | |||||
Culp |
29,400 | 955,500 | |||||
Deckers Outdoor3 |
14,920 | 1,018,439 | |||||
J.G. Boswell Company2 |
3,940 | 2,588,580 | |||||
Movado Group |
67,261 | 1,698,341 | |||||
Wolverine World Wide |
360,200 | 10,089,202 | |||||
YGM Trading |
1,082,600 | 1,006,689 | |||||
| 18,031,164 | |||||||
| Total (Cost $130,786,940) | 149,664,341 | ||||||
| CONSUMER STAPLES – 2.2% | |||||||
| BEVERAGES - 0.2% | |||||||
Compania Cervecerias Unidas ADR1 |
99,500 | 2,610,880 | |||||
| FOOD & STAPLES RETAILING - 0.0% | |||||||
Conviviality |
90,000 | 361,039 | |||||
| FOOD PRODUCTS - 1.8% | |||||||
AGT Food and Ingredients |
9,000 | 161,567 | |||||
Cal-Maine Foods3 |
84,316 | 3,338,913 | |||||
Farmer Bros.3 |
54,700 | 1,654,675 | |||||
Hilton Food Group |
75,000 | 720,906 | |||||
Industrias Bachoco ADR |
43,495 | 2,521,840 | |||||
John B. Sanfilippo & Son |
17,200 | 1,085,492 | |||||
Lancaster Colony |
8,200 | 1,005,484 | |||||
Sanderson Farms |
15,000 | 1,734,750 | |||||
Seneca Foods Cl. A3 |
147,605 | 4,583,135 | |||||
Seneca Foods Cl. B3 |
13,840 | 498,240 | |||||
| 187,459 | 1,912,082 | ||||||
Tootsie Roll Industries1 |
155,308 | 5,412,484 | |||||
| 24,629,568 | |||||||
| HOUSEHOLD PRODUCTS - 0.0% | |||||||
Central Garden & Pet3 |
10,300 | 327,437 | |||||
| PERSONAL PRODUCTS - 0.2% | |||||||
Inter Parfums |
63,730 | 2,335,705 | |||||
| Total (Cost $23,077,724) | 30,264,629 | ||||||
| 40 | 2017 Semiannual Report to Stockholders | THE ACCOMPANYING NOTES ARE AN INTEGRAL PART OF THESE FINANCIAL STATEMENTS |
| June 30, 2017 (unaudited) |
| Schedule of Investments (continued) | |||||||
| SHARES | VALUE | ||||||
| ENERGY – 4.1% | |||||||
| ENERGY EQUIPMENT & SERVICES - 3.1% | |||||||
| 48,000 | $ | 328,800 | |||||
| 189,000 | 2,046,870 | ||||||
Era Group3 |
535,771 | 5,068,394 | |||||
Forum Energy Technologies3 |
118,654 | 1,851,002 | |||||
| 108,600 | 900,294 | ||||||
| 89,000 | 4,836,260 | ||||||
| 71,880 | 312,678 | ||||||
Oil States International3 |
65,833 | 1,787,366 | |||||
Pason Systems |
503,480 | 7,508,716 | |||||
Pioneer Energy Services3 |
138,100 | 283,105 | |||||
Precision Drilling3 |
73,100 | 249,271 | |||||
SEACOR Holdings3 |
150,469 | 5,161,087 | |||||
TGS-NOPEC Geophysical |
425,870 | 8,727,816 | |||||
Trican Well Service3 |
944,000 | 2,642,443 | |||||
| 41,704,102 | |||||||
| OIL, GAS & CONSUMABLE FUELS - 1.0% | |||||||
Ardmore Shipping |
61,600 | 502,040 | |||||
Dorchester Minerals L.P. |
177,172 | 2,560,135 | |||||
Dorian LPG3 |
184,034 | 1,505,398 | |||||
Green Plains |
50,000 | 1,027,500 | |||||
Hallador Energy |
21,000 | 163,170 | |||||
Hargreaves Services |
57,683 | 252,998 | |||||
New Zealand Refining |
310,000 | 554,290 | |||||
San Juan Basin Royalty Trust |
320,352 | 2,181,597 | |||||
World Fuel Services |
110,800 | 4,260,260 | |||||
WPX Energy3 |
110,000 | 1,062,600 | |||||
| 14,069,988 | |||||||
| Total (Cost $69,549,196) | 55,774,090 | ||||||
| FINANCIALS – 14.9% | |||||||
| BANKS - 2.4% | |||||||
Banca Sistema |
200,000 | 539,095 | |||||
Bank of N.T. Butterfield & Son |
178,416 | 6,083,986 | |||||
Blue Hills Bancorp |
54,080 | 968,032 | |||||
Canadian Western Bank |
279,500 | 5,901,226 | |||||
Farmers & Merchants Bank of Long Beach2 |
1,080 | 8,262,000 | |||||
Fauquier Bankshares |
160,800 | 3,095,400 | |||||
First Citizens BancShares Cl. A |
14,676 | 5,469,745 | |||||
Webster Financial |
40,300 | 2,104,466 | |||||
| 32,423,950 | |||||||
| CAPITAL MARKETS - 8.0% | |||||||
Ares Management L.P. |
366,300 | 6,593,400 | |||||
Artisan Partners Asset Management Cl. A |
270,500 | 8,304,350 | |||||
ASA Gold and Precious Metals |
199,821 | 2,335,908 | |||||
Ashmore Group |
1,354,000 | 6,228,741 | |||||
Associated Capital Group Cl. A1 |
20,200 | 686,800 | |||||
Citadel Capital3 |
8,549,921 | 377,480 | |||||
Cowen Group3 |
62,706 | 1,018,973 | |||||
Dundee Corporation Cl. A3 |
1,079,900 | 2,373,315 | |||||
Edmond de Rothschild (Suisse) |
153 | 2,608,770 | |||||
Federated Investors Cl. B |
108,640 | 3,069,080 | |||||
Gluskin Sheff + Associates |
57,600 | 743,985 | |||||
Houlihan Lokey Cl. A |
91,100 | 3,179,390 | |||||
Jupiter Fund Management |
230,000 | 1,512,795 | |||||
KKR & Co. L.P. |
24,100 | 448,260 | |||||
Lazard Cl. A |
99,535 | 4,611,457 | |||||
Manning & Napier Cl. A |
395,692 | 1,721,260 | |||||
MarketAxess Holdings |
56,600 | 11,382,260 | |||||
| 109,500 | 711,750 | ||||||
Morningstar |
84,600 | 6,627,564 | |||||
mutares |
39,266 | 609,031 | |||||
MVC Capital |
324,200 | 3,196,612 | |||||
Oaktree Capital Group LLC Cl. A |
101,100 | 4,711,260 | |||||
Rothschild & Co |
216,893 | 7,917,268 | |||||
SEI Investments |
185,600 | 9,981,568 | |||||
Sprott |
1,927,000 | 3,388,001 | |||||
TMX Group |
40,700 | 2,214,522 | |||||
U.S. Global Investors Cl. A |
520,551 | 796,443 | |||||
Value Partners Group |
5,453,000 | 4,965,876 | |||||
Virtu Financial Cl. A |
101,200 | 1,786,180 | |||||
Virtus Investment Partners |
3,930 | 436,034 | |||||
Westwood Holdings Group |
49,073 | 2,781,948 | |||||
| 492,300 | 1,147,059 | ||||||
| 108,467,340 | |||||||
| CONSUMER FINANCE - 0.1% | |||||||
Bajaj Finance |
55,000 | 1,168,752 | |||||
Currency Exchange International3 |
30,000 | 608,421 | |||||
| 1,777,173 | |||||||
| DIVERSIFIED FINANCIAL SERVICES - 0.1% | |||||||
First Pacific |
1,020,000 | 752,512 | |||||
| 2,973,544 | 892,063 | ||||||
| 1,644,575 | |||||||
| INSURANCE - 2.7% | |||||||
Alleghany Corporation3 |
709 | 421,713 | |||||
Atlas Financial Holdings3 |
48,900 | 728,610 | |||||
E-L Financial |
21,500 | 14,009,485 | |||||
Erie Indemnity Cl. A |
25,000 | 3,126,750 | |||||
Independence Holding Company |
314,523 | 6,431,995 | |||||
MBIA 3 |
942,400 | 8,886,832 | |||||
ProAssurance Corporation |
17,139 | 1,042,051 | |||||
RLI Corp. |
46,300 | 2,528,906 | |||||
WMIH 3 |
77,742 | 97,178 | |||||
| 37,273,520 | |||||||
| INVESTMENT COMPANIES - 0.2% | |||||||
RIT Capital Partners |
130,500 | 3,231,124 | |||||
| THRIFTS & MORTGAGE FINANCE - 1.4% | |||||||
| 16,300 | 386,636 | ||||||
Genworth MI Canada |
239,395 | 6,586,685 | |||||
Timberland Bancorp5 |
444,200 | 11,224,934 | |||||
| 53 | 117,130 | ||||||
| 18,315,385 | |||||||
| Total (Cost $173,007,388) | 203,133,067 | ||||||
| HEALTH CARE – 5.7% | |||||||
| BIOTECHNOLOGY - 1.1% | |||||||
| 139,000 | 1,004,970 | ||||||
| 550,000 | 632,500 | ||||||
Sangamo Therapeutics3 |
469,315 | 4,129,972 | |||||
Zealand Pharma3 |
479,607 | 9,613,725 | |||||
| 15,381,167 | |||||||
| HEALTH CARE EQUIPMENT & SUPPLIES - 2.0% | |||||||
Analogic Corporation |
53,735 | 3,903,848 | |||||
Atrion Corporation |
15,750 | 10,131,975 | |||||
Cerus Corporation3 |
108,000 | 271,080 | |||||
Hill-Rom Holdings |
5,000 | 398,050 | |||||
Integer Holdings3 |
42,400 | 1,833,800 | |||||
| THE ACCOMPANYING NOTES ARE AN INTEGRAL PART OF THESE FINANCIAL STATEMENTS | 2017 Semiannual Report to Stockholders | 41 |
Royce Value Trust
| Schedule of Investments (continued) | |||||||
| SHARES | VALUE | ||||||
| HEALTH CARE (continued) | |||||||
| HEALTH CARE EQUIPMENT & SUPPLIES (continued) | |||||||
Invacare Corporation |
38,900 | $ | 513,480 | ||||
Masimo Corporation3 |
50,000 | 4,559,000 | |||||
Neogen Corporation3 |
16,800 | 1,161,048 | |||||
Surmodics 3 |
138,500 | 3,898,775 | |||||
| 26,671,056 | |||||||
| HEALTH CARE PROVIDERS & SERVICES - 1.0% | |||||||
Aceto Corporation |
18,800 | 290,460 | |||||
AMN Healthcare Services3 |
74,300 | 2,901,415 | |||||
Community Health Systems3 |
790,000 | 7,868,400 | |||||
Landauer |
50,000 | 2,615,000 | |||||
| 13,675,275 | |||||||
| HEALTH CARE TECHNOLOGY - 0.6% | |||||||
| 32,500 | 4,567,875 | ||||||
Cegedim 3 |
10,000 | 347,213 | |||||
Medidata Solutions3 |
50,000 | 3,910,000 | |||||
| 8,825,088 | |||||||
| LIFE SCIENCES TOOLS & SERVICES - 0.9% | |||||||
Bio-Rad Laboratories Cl. A3 |
26,998 | 6,109,917 | |||||
Bio-Techne |
46,243 | 5,433,553 | |||||
| 75,000 | 101,250 | ||||||
| 11,644,720 | |||||||
| PHARMACEUTICALS - 0.1% | |||||||
Intra-Cellular Therapies3 |
30,000 | 372,600 | |||||
Theravance Biopharma3 |
34,291 | 1,366,153 | |||||
| 1,738,753 | |||||||
| Total (Cost $49,830,571) | 77,936,059 | ||||||
| INDUSTRIALS – 30.6% | |||||||
| AEROSPACE & DEFENSE - 2.7% | |||||||
Austal |
688,670 | 968,640 | |||||
Ducommun 3 |
117,200 | 3,701,176 | |||||
HEICO Corporation |
175,422 | 12,602,316 | |||||
HEICO Corporation Cl. A |
101,010 | 6,267,671 | |||||
Magellan Aerospace |
182,779 | 2,852,751 | |||||
Mercury Systems3 |
25,400 | 1,069,086 | |||||
Teledyne Technologies3 |
20,600 | 2,629,590 | |||||
Wesco Aircraft Holdings3 |
588,000 | 6,379,800 | |||||
| 36,471,030 | |||||||
| AIR FREIGHT & LOGISTICS - 1.8% | |||||||
Expeditors International of Washington |
158,900 | 8,974,672 | |||||
Forward Air |
179,750 | 9,577,080 | |||||
| 149,400 | 5,729,490 | ||||||
| 24,281,242 | |||||||
| BUILDING PRODUCTS - 0.6% | |||||||
American Woodmark3 |
17,100 | 1,633,905 | |||||
Apogee Enterprises1 |
48,700 | 2,768,108 | |||||
Burnham Holdings Cl. B2 |
36,000 | 545,400 | |||||
DIRTT Environmental Solutions3 |
65,000 | 343,345 | |||||
Epwin Group |
70,000 | 100,289 | |||||
Insteel Industries1 |
79,380 | 2,617,159 | |||||
Patrick Industries3 |
9,850 | 717,572 | |||||
| 8,725,778 | |||||||
| COMMERCIAL SERVICES & SUPPLIES - 2.7% | |||||||
Atento 3 |
271,200 | 3,023,880 | |||||
CECO Environmental |
99,028 | 909,077 | |||||
CompX International Cl. A |
211,100 | 3,219,275 | |||||
Copart3 |
439,920 | 13,985,057 | |||||
Heritage-Crystal Clean3 |
152,527 | 2,425,179 | |||||
Kimball International Cl. B |
286,180 | 4,776,344 | |||||
Mobile Mini |
105,000 | 3,134,250 | |||||
Steelcase Cl. A |
256,260 | 3,587,640 | |||||
UniFirst Corporation |
13,370 | 1,881,159 | |||||
| 36,941,861 | |||||||
| CONSTRUCTION & ENGINEERING - 3.5% | |||||||
Aecon Group |
34,500 | 429,388 | |||||
Ameresco Cl. A3 |
55,000 | 423,500 | |||||
Comfort Systems USA |
48,100 | 1,784,510 | |||||
EMCOR Group1 |
121,300 | 7,930,594 | |||||
IES Holdings3 |
594,244 | 10,785,528 | |||||
Jacobs Engineering Group |
164,900 | 8,968,911 | |||||
KBR |
326,000 | 4,961,720 | |||||
Northwest Pipe3 |
20,000 | 325,200 | |||||
NV5 Global3 |
23,500 | 998,750 | |||||
| 122,300 | 1,598,461 | ||||||
Valmont Industries1 |
65,145 | 9,745,692 | |||||
| 47,952,254 | |||||||
| ELECTRICAL EQUIPMENT - 0.7% | |||||||
| 631,820 | 2,021,824 | ||||||
Powell Industries |
94,500 | 3,023,055 | |||||
Preformed Line Products |
91,600 | 4,252,072 | |||||
| 9,296,951 | |||||||
| INDUSTRIAL CONGLOMERATES - 0.6% | |||||||
A. Soriano |
2,791,000 | 348,460 | |||||
Raven Industries |
251,725 | 8,382,443 | |||||
| 8,730,903 | |||||||
| MACHINERY - 11.2% | |||||||
Chen Hsong Holdings |
1,159,000 | 317,679 | |||||
China Metal International Holdings |
554,524 | 206,683 | |||||
CIRCOR International |
101,384 | 6,020,182 | |||||
Colfax Corporation3 |
77,242 | 3,041,017 | |||||
Deutz |
115,000 | 969,736 | |||||
Donaldson Company |
193,559 | 8,814,677 | |||||
Exco Technologies |
205,700 | 1,694,075 | |||||
Franklin Electric |
104,600 | 4,330,440 | |||||
Graco |
89,276 | 9,756,081 | |||||
Greenbrier Companies (The) |
46,800 | 2,164,500 | |||||
Hurco Companies |
25,952 | 901,832 | |||||
Hyster-Yale Materials Handling Cl. A |
10,000 | 702,500 | |||||
IDEX Corporation |
67,400 | 7,616,874 | |||||
John Bean Technologies |
68,626 | 6,725,348 | |||||
Kadant |
42,200 | 3,173,440 | |||||
Kennametal |
160,100 | 5,990,942 | |||||
Lincoln Electric Holdings |
61,360 | 5,650,642 | |||||
Lindsay Corporation1 |
80,000 | 7,140,000 | |||||
Luxfer Holdings ADR |
28,100 | 359,399 | |||||
| 55,480 | 2,868,316 | ||||||
NN |
308,700 | 8,473,815 | |||||
Nordson Corporation |
24,296 | 2,947,591 | |||||
Proto Labs3 |
10,000 | 672,500 | |||||
RBC Bearings3 |
123,700 | 12,587,712 | |||||
Sarine Technologies |
327,500 | 366,334 | |||||
Sun Hydraulics |
286,318 | 12,217,189 | |||||
| 141,300 | 2,324,385 | ||||||
Tennant Company |
111,900 | 8,258,220 | |||||
Titan International |
173,100 | 2,078,931 | |||||
Wabash National |
43,600 | 958,328 | |||||
| 42 | 2017 Semiannual Report to Stockholders | THE ACCOMPANYING NOTES ARE AN INTEGRAL PART OF THESE FINANCIAL STATEMENTS |
| June 30, 2017 (unaudited) |
| Schedule of Investments (continued) | |||||||
| SHARES | VALUE | ||||||
| INDUSTRIALS (continued) | |||||||
| MACHINERY (continued) | |||||||
Watts Water Technologies Cl. A |
61,000 | $ | 3,855,200 | ||||
Westinghouse Air Brake Technologies |
90,570 | 8,287,155 | |||||
| 327,100 | 768,685 | ||||||
Woodward |
154,600 | 10,447,868 | |||||
| 152,688,276 | |||||||
| MARINE - 1.4% | |||||||
Clarkson |
291,000 | 9,573,864 | |||||
Kirby Corporation3 |
144,500 | 9,659,825 | |||||
| 19,233,689 | |||||||
| PROFESSIONAL SERVICES - 3.0% | |||||||
| 209,377 | 10,782,915 | ||||||
Franklin Covey3 |
40,800 | 787,440 | |||||
Heidrick & Struggles International |
66,480 | 1,445,940 | |||||
ICF International3 |
6,336 | 298,426 | |||||
ManpowerGroup |
112,858 | 12,600,596 | |||||
| 179,295 | 9,708,824 | ||||||
Quess Corporation3 |
15,720 | 223,515 | |||||
Robert Half International |
44,032 | 2,110,454 | |||||
TrueBlue 3 |
75,820 | 2,009,230 | |||||
Volt Information Sciences3 |
75,000 | 296,250 | |||||
| 40,263,590 | |||||||
| ROAD & RAIL - 1.8% | |||||||
Genesee & Wyoming Cl. A3 |
15,000 | 1,025,850 | |||||
| 122,400 | 4,534,920 | ||||||
Landstar System |
142,460 | 12,194,576 | |||||
Patriot Transportation Holding3 |
139,100 | 2,485,717 | |||||
| 59,730 | 3,064,149 | ||||||
Universal Logistics Holdings |
78,916 | 1,183,740 | |||||
| 24,488,952 | |||||||
| TRADING COMPANIES & DISTRIBUTORS - 0.5% | |||||||
Central Steel & Wire2 |
4,862 | 2,674,100 | |||||
Houston Wire & Cable3 |
509,200 | 2,673,300 | |||||
MSC Industrial Direct Cl. A1 |
5,463 | 469,600 | |||||
SIG |
350,000 | 677,404 | |||||
| 6,494,404 | |||||||
| TRANSPORTATION INFRASTRUCTURE - 0.1% | |||||||
Hopewell Highway Infrastructure |
1,012,000 | 581,993 | |||||
| Total (Cost $240,658,301) | 416,150,923 | ||||||
| INFORMATION TECHNOLOGY – 17.9% | |||||||
| COMMUNICATIONS EQUIPMENT - 0.5% | |||||||
| 234,973 | 4,852,192 | ||||||
| 55,600 | 733,920 | ||||||
NetScout Systems3 |
31,100 | 1,069,840 | |||||
| 91,000 | 849,940 | ||||||
| 7,505,892 | |||||||
| ELECTRONIC EQUIPMENT, INSTRUMENTS & COMPONENTS - 9.0% | |||||||
| 70,895 | 5,543,989 | ||||||
Bel Fuse Cl. B |
30,238 | 746,878 | |||||
Celestica 3 |
169,600 | 2,303,168 | |||||
| 201,870 | 17,138,763 | ||||||
Coherent3 |
100,534 | 22,619,145 | |||||
Dolby Laboratories Cl. A |
9,150 | 447,984 | |||||
Fabrinet 3 |
60,600 | 2,585,196 | |||||
FARO Technologies3 |
161,467 | 6,103,453 | |||||
FLIR Systems |
317,000 | 10,987,220 | |||||
HollySys Automation Technologies |
53,882 | 894,980 | |||||
Horiba |
12,000 | 728,695 | |||||
| 58,000 | 8,415,800 | ||||||
LRAD Corporation3 |
744,944 | 1,258,955 | |||||
Methode Electronics |
30,530 | 1,257,836 | |||||
National Instruments |
261,850 | 10,531,607 | |||||
Orbotech 3 |
34,500 | 1,125,390 | |||||
Perceptron 3 |
357,700 | 2,604,056 | |||||
Plexus Corporation3 |
150,600 | 7,917,042 | |||||
Richardson Electronics |
573,732 | 3,425,180 | |||||
Rogers Corporation3 |
57,066 | 6,198,509 | |||||
Systemax |
38,520 | 724,176 | |||||
| 496,400 | 8,617,504 | ||||||
VST Holdings |
979,000 | 295,928 | |||||
Wasion Group Holdings |
1,500,000 | 691,647 | |||||
| 123,163,101 | |||||||
| INTERNET SOFTWARE & SERVICES - 2.0% | |||||||
Actua Corporation3 |
63,815 | 896,601 | |||||
Care.com 3 |
209,300 | 3,160,430 | |||||
CommerceHub Ser. C3 |
50,000 | 872,000 | |||||
| 211,136 | 5,531,763 | ||||||
HolidayCheck Group3 |
44,900 | 157,386 | |||||
IZEA 3 |
110,106 | 210,302 | |||||
j2 Global |
61,620 | 5,243,246 | |||||
Leaf Group3 |
50,000 | 390,000 | |||||
MiX Telematics ADR |
57,985 | 456,922 | |||||
QuinStreet 3 |
526,082 | 2,193,762 | |||||
Solium Capital3 |
182,800 | 1,382,841 | |||||
| 363,000 | 348,480 | ||||||
Stamps.com 3 |
37,500 | 5,807,813 | |||||
Support.com 3 |
216,766 | 507,232 | |||||
| 27,158,778 | |||||||
| IT SERVICES - 1.0% | |||||||
Acxiom Corporation3 |
48,000 | 1,247,040 | |||||
Convergys Corporation1 |
121,000 | 2,877,380 | |||||
| 20,000 | 1,234,000 | ||||||
Hackett Group (The) |
417,266 | 6,467,623 | |||||
Innodata 3 |
274,314 | 480,050 | |||||
Unisys Corporation3 |
60,000 | 768,000 | |||||
| 13,074,093 | |||||||
| SEMICONDUCTORS & SEMICONDUCTOR EQUIPMENT - 2.8% | |||||||
Amtech Systems3 |
141,471 | 1,194,015 | |||||
Brooks Automation |
121,000 | 2,624,490 | |||||
Cabot Microelectronics |
14,000 | 1,033,620 | |||||
CyberOptics Corporation3 |
37,600 | 776,440 | |||||
Diodes 3 |
270,850 | 6,508,526 | |||||
Intermolecular 3 |
40,000 | 37,200 | |||||
Kulicke & Soffa Industries3 |
77,400 | 1,472,148 | |||||
MKS Instruments |
24,210 | 1,629,333 | |||||
Nanometrics 3 |
61,000 | 1,542,690 | |||||
Nova Measuring Instruments3 |
46,500 | 1,027,185 | |||||
Photronics 3 |
159,900 | 1,503,060 | |||||
| 62,700 | 1,432,695 | ||||||
Sigma Designs3 |
78,900 | 461,565 | |||||
Silicon Motion Technology ADR |
97,000 | 4,678,310 | |||||
Teradyne |
130,000 | 3,903,900 | |||||
Ultra Clean Holdings3 |
42,800 | 802,500 | |||||
Veeco Instruments3 |
17,500 | 487,375 | |||||
Versum Materials |
123,000 | 3,997,500 | |||||
| THE ACCOMPANYING NOTES ARE AN INTEGRAL PART OF THESE FINANCIAL STATEMENTS | 2017 Semiannual Report to Stockholders | 43 |
Royce Value Trust
| Schedule of Investments (continued) | |||||||
| SHARES | VALUE | ||||||
| INFORMATION TECHNOLOGY (continued) | |||||||
| SEMICONDUCTORS & SEMICONDUCTOR EQUIPMENT (continued) | |||||||
Xperi |
111,430 | $ | 3,320,614 | ||||
| 38,433,166 | |||||||
| SOFTWARE - 1.9% | |||||||
American Software Cl. A |
108,690 | 1,118,420 | |||||
| 95,000 | 11,559,600 | ||||||
BroadSoft 3 |
25,000 | 1,076,250 | |||||
Computer Modelling Group |
316,300 | 2,482,984 | |||||
Micro Focus International |
25,000 | 739,466 | |||||
Model N3 |
300,387 | 3,995,147 | |||||
Monotype Imaging Holdings |
117,700 | 2,153,910 | |||||
PSI |
18,194 | 292,690 | |||||
RealNetworks 3 |
219,879 | 952,076 | |||||
Rosetta Stone3 |
40,000 | 431,200 | |||||
SeaChange International3 |
247,069 | 657,204 | |||||
| 25,458,947 | |||||||
| TECHNOLOGY HARDWARE, STORAGE & PERIPHERALS - 0.7% | |||||||
Diebold Nixdorf |
266,600 | 7,464,800 | |||||
Intevac 3 |
168,700 | 1,872,570 | |||||
| 9,337,370 | |||||||
| Total (Cost $158,446,124) | 244,131,347 | ||||||
| MATERIALS – 7.5% | |||||||
| CHEMICALS - 2.3% | |||||||
FutureFuel Corporation |
48,500 | 731,865 | |||||
Hawkins |
86,178 | 3,994,350 | |||||
Innospec |
36,883 | 2,417,681 | |||||
Minerals Technologies |
108,793 | 7,963,647 | |||||
Quaker Chemical |
109,669 | 15,927,229 | |||||
| 31,034,772 | |||||||
| CONSTRUCTION MATERIALS - 1.0% | |||||||
Ash Grove Cement Cl. B2 |
50,518 | 13,387,775 | |||||
| CONTAINERS & PACKAGING - 0.3% | |||||||
Mayr-Melnhof Karton |
34,000 | 4,446,389 | |||||
| METALS & MINING - 3.8% | |||||||
Alamos Gold Cl. A |
263,300 | 1,867,952 | |||||
Ampco-Pittsburgh |
36,966 | 545,249 | |||||
Constellium Cl. A3 |
70,000 | 483,000 | |||||
Ferroglobe |
50,000 | 597,500 | |||||
| 49,300 | 0 | ||||||
Franco-Nevada Corporation |
107,300 | 7,742,768 | |||||
Gold Fields ADR |
370,000 | 1,287,600 | |||||
Haynes International1 |
113,900 | 4,135,709 | |||||
Hecla Mining |
321,300 | 1,638,630 | |||||
Lundin Mining |
640,000 | 3,637,261 | |||||
Major Drilling Group International3 |
960,900 | 6,290,901 | |||||
Pretium Resources3 |
165,000 | 1,585,364 | |||||
Reliance Steel & Aluminum |
128,720 | 9,372,103 | |||||
Royal Gold |
16,600 | 1,297,622 | |||||
Sandstorm Gold3 |
270,000 | 1,044,900 | |||||
Synalloy Corporation3 |
178,800 | 2,029,380 | |||||
Tree Island Steel |
30,000 | 90,685 | |||||
Worthington Industries |
148,000 | 7,432,560 | |||||
| 51,079,184 | |||||||
| PAPER & FOREST PRODUCTS - 0.1% | |||||||
Stella-Jones |
40,300 | 1,375,446 | |||||
| Total (Cost $59,812,511) | 101,323,566 | ||||||
| REAL ESTATE – 3.0% | |||||||
| EQUITY REAL ESTATE INVESTMENT TRUSTS (REITS) - 0.0% | |||||||
Irish Residential Properties REIT |
200,000 | 310,665 | |||||
| REAL ESTATE MANAGEMENT & DEVELOPMENT - 3.0% | |||||||
Altus Group |
24,200 | 523,077 | |||||
FirstService Corporation |
135,100 | 8,643,698 | |||||
Forestar Group3 |
81,000 | 1,389,150 | |||||
FRP Holdings3 |
178,558 | 8,240,452 | |||||
Kennedy-Wilson Holdings |
101,300 | 1,929,765 | |||||
Marcus & Millichap3 |
273,013 | 7,196,622 | |||||
Real Estate Investors |
500,000 | 393,991 | |||||
RMR Group Cl. A1 |
27,200 | 1,323,280 | |||||
St. Joe Company (The)3 |
177,000 | 3,318,750 | |||||
Tejon Ranch3 |
360,035 | 7,431,122 | |||||
| 40,389,907 | |||||||
| Total (Cost $29,473,281) | 40,700,572 | ||||||
| TELECOMMUNICATION SERVICES – 0.6% | |||||||
| DIVERSIFIED TELECOMMUNICATION SERVICES - 0.1% | |||||||
China Communications Services |
750,182 | 432,384 | |||||
HKBN |
500,000 | 501,444 | |||||
| 933,828 | |||||||
| WIRELESS TELECOMMUNICATION SERVICES - 0.5% | |||||||
Boingo Wireless3 |
50,000 | 748,000 | |||||
Telephone and Data Systems |
208,270 | 5,779,493 | |||||
| 6,527,493 | |||||||
| Total (Cost $6,918,793) | 7,461,321 | ||||||
| UTILITIES – 0.1% | |||||||
| GAS UTILITIES - 0.1% | |||||||
Shizuoka Gas |
110,000 | 731,540 | |||||
Toho Gas |
60,000 | 436,364 | |||||
| 1,167,904 | |||||||
| INDEPENDENT POWER & RENEWABLE ELECTRICITY PRODUCER - 0.0% | |||||||
Calpine Corporation3 |
30,000 | 405,900 | |||||
| MULTI-UTILITIES - 0.0% | |||||||
Just Energy Group1 |
18,520 | 97,045 | |||||
| Total (Cost $1,561,806) | 1,670,849 | ||||||
| MISCELLANEOUS7 – 2.2% | |||||||
| Total (Cost $29,970,345) | 29,755,191 | ||||||
| TOTAL COMMON STOCKS | |||||||
| (Cost $973,092,980) | 1,357,965,955 | ||||||
| REPURCHASE AGREEMENT– 5.0% | |||||||
Fixed Income Clearing Corporation, 0.12% dated 6/30/17, due 7/3/17, maturity value $68,755,688 (collateralized by obligations of various U.S. Government Agencies, 2.25%- 2.375% due 8/15/24-11/15/24, valued at $70,132,893) |
|||||||
| (Cost $68,755,000) | 68,755,000 | ||||||
| TOTAL INVESTMENTS – 104.8% | |||||||
| (Cost $1,041,847,980) | 1,426,720,955 | ||||||
| LIABILITIES LESS CASH AND OTHER ASSETS – (4.8)% | (65,914,590 | ) | |||||
| NET ASSETS – 100.0% | $ | 1,360,806,365 | |||||
| 44 | 2017 Semiannual Report to Stockholders | THE ACCOMPANYING NOTES ARE AN INTEGRAL PART OF THESE FINANCIAL STATEMENTS |
| June 30, 2017 (unaudited) |
| † | New additions in 2017. |
| 1 | All or a portion
of these securities were pledged as collateral in connection with the Fund’s revolving credit agreement at June 30, 2017. Total market value of pledged securities
at June 30, 2017, was $114,108,923. |
| 2 | These securities
are defined as Level 2 securities due to fair value being based on quoted prices
for similar securities. See Notes to Financial Statements. |
| 3 | Non-income producing. |
| 4 | At June 30,
2017, a portion of these securities were rehypothecated in connection with the Fund’s revolving credit agreement in the aggregate amount of $66,420,057. |
| 5 | At June 30,
2017, the Fund owned 5% or more of the Company’s outstanding voting securities
thereby making the Company an Affiliated Company as that term is defined in the
Investment Company Act of 1940. See Notes to Financial Statements. |
| 6 | Securities
for which market quotations are not readily available represent 0.1% of net assets.
These securities have been valued at their fair value under procedures approved
by the Fund’s Board of Directors. These securities are defined as Level 3 securities
due to the use of significant unobservable inputs in the determination of fair value.
See Notes to Financial Statements. |
| 7 | Includes securities first acquired in 2017 and less than 1% of net assets. |
| Bold indicates the Fund’s 20 largest equity holdings in terms of June 30, 2017, market value. | |
TAX INFORMATION:
The cost of total investments for Federal income tax purposes was $1,044,320,297.
At June 30, 2017, net unrealized appreciation for all securities was $382,400,658,
consisting of aggregate gross unrealized appreciation of $471,036,166 and aggregate
gross unrealized depreciation of $88,635,508. The primary cause of the difference
between book and tax basis cost is the timing of the recognition of losses on securities
sold. |
| THE ACCOMPANYING NOTES ARE AN INTEGRAL PART OF THESE FINANCIAL STATEMENTS | 2017 Semiannual Report to Stockholders | 45 |
| Royce Value Trust | June 30, 2017 (unaudited) |
| Statement of Assets and Liabilities | ||||
| ASSETS: | ||||
| Investments at value | ||||
Non-Affiliated Companies |
$ | 1,345,710,195 | ||
Affiliated Companies |
12,255,760 | |||
| Repurchase agreements (at cost and value) | 68,755,000 | |||
| Cash and foreign currency | 280,471 | |||
| Receivable for investments sold | 4,042,117 | |||
| Receivable for dividends and interest | 906,311 | |||
| Prepaid expenses and other assets | 600,253 | |||
| Total Assets | 1,432,550,107 | |||
| LIABILITIES: | ||||
| Revolving credit agreement | 70,000,000 | |||
| Payable for investments purchased | 943,432 | |||
| Payable for investment advisory fee | 496,668 | |||
| Payable for directors’ fees | 48,125 | |||
| Payable for interest expense | 8,745 | |||
| Accrued expenses | 140,880 | |||
| Deferred capital gains tax | 105,892 | |||
| Total Liabilities | 71,743,742 | |||
| Net Assets | $ | 1,360,806,365 | ||
| ANALYSIS OF NET ASSETS: | ||||
| Paid-in capital - $0.001 par value per share; 83,108,427 shares outstanding (150,000,000 shares authorized) | $ | 981,272,685 | ||
| Undistributed net investment income (loss) | 2,033,021 | |||
| Accumulated net realized gain (loss) on investments and foreign currency | 36,276,725 | |||
| Net unrealized appreciation (depreciation) on investments and foreign currency | 384,752,871 | |||
| Quarterly distributions | (43,528,937 | ) | ||
| Net Assets (net asset value per share - $16.37) | $ | 1,360,806,365 | ||
| Investments at identified cost | $ | 973,092,980 | ||
| 46 | 2017 Semiannual Report to Stockholders | THE ACCOMPANYING NOTES ARE AN INTEGRAL PART OF THESE FINANCIAL STATEMENTS |
Royce Value Trust
| Statement of Changes in Net Assets | ||||||||
| SIX MONTHS ENDED | ||||||||
| 6/30/17 | ||||||||
| (UNAUDITED) | YEAR ENDED 12/31/16 | |||||||
| INVESTMENT OPERATIONS: | ||||||||
| Net investment income (loss) | $ | 3,992,392 | $ | 9,680,260 | ||||
| Net realized gain (loss) on investments and foreign currency | 26,622,919 | 75,719,009 | ||||||
| Net change in unrealized appreciation (depreciation) on investments and foreign currency | 59,248,466 | 186,502,762 | ||||||
| Net increase (decrease) in net assets from investment operations | 89,863,777 | 271,902,031 | ||||||
| DISTRIBUTIONS: | ||||||||
| Net investment income | (3,482,315 | )1 | (10,786,801 | ) | ||||
| Net realized gain on investments and foreign currency | (29,164,388 | )1 | (70,931,388 | ) | ||||
| Return of capital | (10,882,234 | )1 | – | |||||
| Total distributions | (43,528,937 | ) | (81,718,189 | ) | ||||
| CAPITAL STOCK TRANSACTIONS: | ||||||||
| Reinvestment of distributions | 18,459,813 | 33,793,124 | ||||||
| Total capital stock transactions | 18,459,813 | 33,793,124 | ||||||
| Net Increase (Decrease) In Net Assets | 64,794,653 | 223,976,966 | ||||||
| NET ASSETS: | ||||||||
| Beginning of period | 1,296,011,712 | 1,072,034,746 | ||||||
| End of period (including undistributed net investment income (loss) of $2,033,021 at 6/30/17 and $(1,959,371) at 12/31/16) | $ | 1,360,806,365 | $ | 1,296,011,712 | ||||
| 1 Amounts are subject to change and recharacterization at year end. | ||||||||
| THE ACCOMPANYING NOTES ARE AN INTEGRAL PART OF THESE FINANCIAL STATEMENTS | 2017 Semiannual Report to Stockholders | 47 |
| Royce Value Trust | Six Months Ended June 30, 2017 (unaudited) |
| Statement of Operations | ||||
| INVESTMENT INCOME: | ||||
| INCOME: | ||||
| Dividends | ||||
Non-Affiliated Companies |
$ | 8,351,412 | ||
Affiliated Companies |
97,724 | |||
| Foreign withholding tax | (229,771 | ) | ||
| Interest | 112,157 | |||
| Rehypothecation income | 13,888 | |||
| Total income | 8,345,410 | |||
| EXPENSES: | ||||
| Investment advisory fees | 2,959,024 | |||
| Interest expense | 733,983 | |||
| Stockholder reports | 192,588 | |||
| Administrative and office facilities | 159,233 | |||
| Custody and transfer agent fees | 95,490 | |||
| Directors’ fees | 83,239 | |||
| Professional fees | 81,518 | |||
| Other expenses | 48,216 | |||
| Total expenses | 4,353,291 | |||
| Compensating balance credits | (273 | ) | ||
| Net expenses | 4,353,018 | |||
| Net investment income (loss) | 3,992,392 | |||
| REALIZED AND UNREALIZED GAIN (LOSS) ON INVESTMENTS AND FOREIGN CURRENCY: | ||||
| NET REALIZED GAIN (LOSS): | ||||
| Investments | 26,582,541 | |||
| Foreign currency transactions | 40,378 | |||
| NET CHANGE IN UNREALIZED APPRECIATION (DEPRECIATION): | ||||
| Investments in Non-Affiliated Companies and foreign currency translations | 57,058,047 | |||
| Investments in Affiliated Companies | 2,257,394 | |||
| Other assets and liabilities denominated in foreign currency | (66,975 | ) | ||
| Net realized and unrealized gain (loss) on investments and foreign currency | 85,871,385 | |||
| NET INCREASE (DECREASE) IN NET ASSETS FROM INVESTMENT OPERATIONS | $ | 89,863,777 | ||
| 48 | 2017 Semiannual Report to Stockholders | THE ACCOMPANYING NOTES ARE AN INTEGRAL PART OF THESE FINANCIAL STATEMENTS |
| Royce Value Trust | Six Months Ended June 30, 2017 (unaudited) |
| Statement of Cash Flows | ||||
| CASH FLOWS FROM OPERATING ACTIVITIES: | ||||
| Net increase (decrease) in net assets from investment operations | $ | 89,863,777 | ||
| Adjustments to reconcile net increase (decrease) in net assets from investment operations to net cash provided by operating activities: | ||||
Purchases of long-term investments |
(114,948,208 | ) | ||
Proceeds from sales and maturities of long-term investments |
123,838,636 | |||
Net purchases, sales and maturities of short-term investments |
12,157,000 | |||
Net (increase) decrease in dividends and interest receivable and other assets |
373,134 | |||
Net increase (decrease) in interest expense payable, accrued expenses and other liabilities |
(61,632 | ) | ||
Net change in unrealized appreciation (depreciation) on investments |
(59,315,441 | ) | ||
Net realized gain (loss) on investments and foreign currency |
(26,622,919 | ) | ||
| Net cash provided by operating activities | 25,284,347 | |||
| CASH FLOWS FROM FINANCING ACTIVITIES: | ||||
| Net increase (decrease) in revolving credit agreement | – | |||
| Distributions | (43,528,937 | ) | ||
| Reinvestment of distributions | 18,459,813 | |||
| Net cash used for financing activities | (25,069,124 | ) | ||
| INCREASE (DECREASE) IN CASH: | 215,223 | |||
| Cash and foreign currency at beginning of period | 65,248 | |||
| Cash and foreign currency at end of period | $ | 280,471 | ||
| THE ACCOMPANYING NOTES ARE AN INTEGRAL PART OF THESE FINANCIAL STATEMENTS | 2017 Semiannual Report to Stockholders | 49 |
| Royce Value Trust |
| Financial Highlights |
This table
is presented to show selected data for a share of Common Stock outstanding throughout
each period, and to assist stockholders in evaluating the Fund’s performance
for the periods presented. |
| SIX MONTHS | YEARS ENDED | |||||||||||||||||||||||
| ENDED 6/30/17 | ||||||||||||||||||||||||
| (UNAUDITED) | 12/31/16 | 12/31/15 | 12/31/14 | 12/31/13 | 12/31/12 | |||||||||||||||||||
| Net Asset Value, Beginning of Period | $ | 15.85 | $ | 13.56 | $ | 16.24 | $ | 18.17 | $ | 15.40 | $ | 14.18 | ||||||||||||
| INVESTMENT OPERATIONS: | ||||||||||||||||||||||||
| Net investment income (loss) | 0.05 | 0.12 | 0.12 | 0.12 | 0.12 | 0.23 | ||||||||||||||||||
| Net realized
and unrealized gain (loss) on investments and foreign currency |
1.03 | 3.27 | (1.48 | ) | (0.13 | ) | 4.89 | 2.02 | ||||||||||||||||
| Total investment operations | 1.08 | 3.39 | (1.36 | ) | (0.01 | ) | 5.01 | 2.25 | ||||||||||||||||
| DISTRIBUTIONS TO PREFERRED STOCKHOLDERS: | ||||||||||||||||||||||||
| Net investment income | – | – | – | – | – | (0.04 | ) | |||||||||||||||||
| Net realized gain on investments and foreign currency | – | – | – | – | – | (0.13 | ) | |||||||||||||||||
| Total distributions to Preferred Stockholders | – | – | – | – | – | (0.17 | ) | |||||||||||||||||
Net Increase (Decrease) in Net Assets Applicable to Common Stockholders from Investment Operations |
1.08 | 3.39 | (1.36 | ) | (0.01 | ) | 5.01 | 2.08 | ||||||||||||||||
| DISTRIBUTIONS TO COMMON STOCKHOLDERS: | ||||||||||||||||||||||||
| Net investment income | (0.04 | )1 | (0.13 | ) | (0.16 | ) | (0.14 | ) | (0.11 | ) | (0.17 | ) | ||||||||||||
| Net realized gain on investments and foreign currency | (0.36 | )1 | (0.89 | ) | (1.08 | ) | (1.68 | ) | (2.08 | ) | (0.63 | ) | ||||||||||||
| Return of capital | (0.13 | )1 | – | – | – | – | – | |||||||||||||||||
| Total distributions to Common Stockholders | (0.53 | ) | (1.02 | ) | (1.24 | ) | (1.82 | ) | (2.19 | ) | (0.80 | ) | ||||||||||||
| CAPITAL STOCK TRANSACTIONS: | ||||||||||||||||||||||||
| Effect of reinvestment of distributions by Common Stockholders | (0.03 | ) | (0.08 | ) | (0.08 | ) | (0.10 | ) | (0.05 | ) | (0.06 | ) | ||||||||||||
| Total capital stock transactions | (0.03 | ) | (0.08 | ) | (0.08 | ) | (0.10 | ) | (0.05 | ) | (0.06 | ) | ||||||||||||
| Net Asset Value, End of Period | $ | 16.37 | $ | 15.85 | $ | 13.56 | $ | 16.24 | $ | 18.17 | $ | 15.40 | ||||||||||||
| Market Value, End of Period | $ | 14.59 | $ | 13.39 | $ | 11.77 | $ | 14.33 | $ | 16.01 | $ | 13.42 | ||||||||||||
| TOTAL RETURN:2 | ||||||||||||||||||||||||
| Net Asset Value | 7.22 | %3 | 26.87 | % | (8.09 | )% | 0.78 | % | 34.14 | % | 15.41 | % | ||||||||||||
| Market Value | 13.12 | %3 | 23.48 | % | (9.59 | )% | 0.93 | % | 35.63 | % | 16.22 | % | ||||||||||||
RATIOS BASED ON AVERAGE NET ASSETS APPLICABLE TO COMMON STOCKHOLDERS: |
||||||||||||||||||||||||
| Investment advisory fee expense4 | 0.45 | %5 | 0.51 | % | 0.50 | % | 0.46 | % | 0.54 | % | 0.56 | % | ||||||||||||
| Other operating expenses | 0.21 | %5 | 0.22 | % | 0.18 | % | 0.15 | % | 0.25 | % | 0.15 | % | ||||||||||||
| Total expenses (net)6 | 0.66 | %5 | 0.73 | % | 0.68 | % | 0.61 | % | 0.79 | % | 0.71 | % | ||||||||||||
| Expenses net of fee waivers and excluding interest expense | 0.55 | %5 | 0.62 | % | 0.61 | % | 0.55 | % | 0.65 | % | 0.68 | % | ||||||||||||
| Expenses prior to fee waivers and balance credits | 0.66 | %5 | 0.73 | % | 0.68 | % | 0.61 | % | 0.79 | % | 0.71 | % | ||||||||||||
| Expenses prior to fee waivers | 0.66 | %5 | 0.73 | % | 0.68 | % | 0.61 | % | 0.79 | % | 0.71 | % | ||||||||||||
| Net investment income (loss) | 0.60 | %5 | 0.85 | % | 0.78 | % | 0.72 | % | 0.70 | % | 1.57 | % | ||||||||||||
| SUPPLEMENTAL DATA: | ||||||||||||||||||||||||
| Net Assets
Applicable to Common Stockholders, End of Period (in thousands) |
$ | 1,360,806 | $ | 1,296,012 | $ | 1,072,035 | $ | 1,231,955 | $ | 1,307,829 | $ | 1,082,426 | ||||||||||||
| Portfolio Turnover Rate | 8 | % | 28 | % | 35 | % | 40 | % | 33 | % | 25 | % | ||||||||||||
| REVOLVING CREDIT AGREEMENT: | ||||||||||||||||||||||||
| Asset coverage | 2044 | % | 1951 | % | 1631 | % | 1860 | % | 1289 | % | 822 | % | ||||||||||||
| Asset coverage per $1,000 | $ | 20,440 | $ | 19,514 | $ | 16,315 | $ | 18,599 | $ | 12,889 | $ | 8,216 | ||||||||||||
| 1 | Amounts
are subject to change and recharacterization at year end. |
| 2 | The Market
Value Total Return is calculated assuming a purchase of Common Stock on the opening
of the first business day and a sale on the closing of the last business day of
each period. Dividends and distributions are assumed for the purposes of this calculation
to be reinvested at prices obtained under the Fund’s Distribution Reinvestment
and Cash Purchase Plan. Net Asset Value Total Return is calculated on the same basis,
except that the Fund’s net asset value is used on the purchase and sale dates
instead of market value. |
| 3 | Not annualized |
| 4 | The investment
advisory fee is calculated based on average net assets over a rolling 60-month basis,
while the above ratios of investment advisory fee expenses are based on the average
net assets applicable to Common Stockholders over a 12-month basis. |
| 5 | Annualized |
| 6 | Expense
ratio based on total average net assets including liquidation value of Preferred
Stock was 0.60% for the year ended December 31, 2012. |
50 | 2017
Semiannual Report to Stockholders |
THE ACCOMPANYING NOTES ARE AN INTEGRAL PART OF THESE FINANCIAL STATEMENTS |
Royce Value Trust
Notes to Financial Statements (unaudited)
| Level 1 | – | quoted prices in active markets for identical securities. | |
| Level 2 | – | other significant observable inputs (including quoted prices for similar securities, foreign securities that may be fair valued and repurchase agreements). The table below includes all Level 2 securities. Level 2 securities with values based on quoted prices for similar securities are noted in the Schedule of Investments. | |
| Level 3 | – | significant unobservable inputs (including last trade price before trading was suspended, or at a discount thereto for lack of marketability or otherwise, market price information regarding other securities, information received from the company and/or published documents, including SEC filings and financial statements, or other publicly available information). |
| LEVEL 1 | LEVEL 2 | LEVEL 3 | TOTAL | ||||||
| Common Stocks | $1,321,736,715 | $35,337,177 | $892,063 | $1,357,965,955 | |||||
| Cash Equivalents | – | 68,755,000 | – | 68,755,000 | |||||
| 2017 Semiannual Report to Stockholders | 51 |
Royce Value Trust
Notes to Financial Statements (unaudited) (continued)
VALUATION OF INVESTMENTS (continued):
Level 3 Reconciliation:
| BALANCE AS OF 12/31/16 | REALIZED
AND UNREALIZED GAIN (LOSS)1 |
BALANCE AS OF 6/30/17 | ||||
| Common Stocks | $892,063 | $– | $892,063 | |||
| 1 | The net change in unrealized appreciation (depreciation) is included in the accompanying Statement of Operations. Change in unrealized appreciation (depreciation) includes net unrealized appreciation (depreciation) resulting from changes in investment values during the reporting period and the reversal of previously recorded unrealized appreciation (depreciation) when gains or losses are realized. Net realized gain (loss) from investments and foreign currency transactions is included in the accompanying Statement of Operations. |
| FAIR VALUE AT | IMPACT TO VALUATION FROM | ||||||||||
| 6/30/17 | VALUATION TECHNIQUE(S) | UNOBSERVABLE INPUT(S) | RANGE AVERAGE | AN INCREASE IN INPUT1 | |||||||
| Discounted Present Value | |||||||||||
| Common Stocks | $892,063 | Balance Sheet Analysis | Liquidity Discount | 30%-40% | Decrease | ||||||
| 1 | This column represents the directional change in the fair value of the Level 3 investments that would result in an increase from the corresponding unobservable input. A decrease to the unobservable input would have the opposite effect. Significant increases and decreases in these unobservable inputs in isolation could result in significantly higher or lower fair value measurements. |
| 52 | 2017 Semiannual Report to Stockholders |
Royce Value Trust
Notes to Financial Statements (unaudited) (continued)
| 2017 Semiannual Report to Stockholders | 53 |
Royce Value Trust
Notes to Financial Statements (unaudited) (continued)
| COST OF PURCHASES | PROCEEDS FROM SALES | REALIZED GAIN (LOSS) | |||
| $2,700,488 | $– | $– | |||
| SHARES |
MARKET VALUE |
COST OF | PROCEEDS |
CHANGE IN NET UNREALIZED APPRECIATION |
REALIZED | DIVIDEND | SHARES | MARKET VALUE | ||||||||||||||||||||||||||||
| AFFILIATED COMPANY | 12/31/16 | 12/31/16 | PURCHASES | FROM SALES | (DEPRECIATION) | GAIN (LOSS) | INCOME | 6/30/17 | 6/30/17 | |||||||||||||||||||||||||||
| Stanley Furniture | 912,235 | $ | 821,194 | – | – | $ 209,632 | $ – | $ | – | 912,235 | $ | 1,030,826 | ||||||||||||||||||||||||
| Timberland Bancorp | 444,200 | 9,177,172 | – | – | 2,047,762 | – | 97,724 | 444,200 | 11,224,934 | |||||||||||||||||||||||||||
| $ | 9,998,366 | $2,257,394 | $ – | $ | 97,724 | $ | 12,255,760 | |||||||||||||||||||||||||||||
| 54 | 2017 Semiannual Report to Stockholders |
History Since Inception
The following table details the share accumulations by an initial investor in the Funds who reinvested all distributions and participated fully in primary subscriptions for each of the rights offerings. Full participation in distribution reinvestments and rights offerings can maximize the returns available to a long-term investor. This table should be read in conjunction with the Performance and Portfolio Reviews of the Funds.
| HISTORY | AMOUNT INVESTED | PURCHASE PRICE1 | SHARES | NAV VALUE2 | MARKET VALUE2 | |||||||||||||||||
| Royce Global Value Trust | ||||||||||||||||||||||
| 10/17/13 | Initial Purchase | $ | 8,975 | $ | 8.975 | 1,000 | $ | 9,780 | $ | 8,975 | ||||||||||||
| 12/11/14 | Distribution $0.15 | 7.970 | 19 | 9,426 | 8,193 | |||||||||||||||||
| 12/10/15 | Distribution $0.10 | 7.230 | 14 | 9,101 | 7,696 | |||||||||||||||||
| 12/9/16 | Distribution $0.14 | 7.940 | 18 | 10,111 | 8,446 | |||||||||||||||||
| 6/30/17 | $ | 8,975 | 1,051 | $ | 11,740 | $ | 10,100 | |||||||||||||||
| Royce Micro-Cap Trust | ||||||||||||||||||||||
| 12/14/93 | Initial Purchase | $ | 7,500 | $ | 7.500 | 1,000 | $ | 7,250 | $ | 7,500 | ||||||||||||
| 10/28/94 | Rights Offering | 1,400 | 7.000 | 200 | ||||||||||||||||||
| 12/19/94 | Distribution $0.05 | 6.750 | 9 | 9,163 | 8,462 | |||||||||||||||||
| 12/7/95 | Distribution $0.36 | 7.500 | 58 | 11,264 | 10,136 | |||||||||||||||||
| 12/6/96 | Distribution $0.80 | 7.625 | 133 | 13,132 | 11,550 | |||||||||||||||||
| 12/5/97 | Distribution $1.00 | 10.000 | 140 | 16,694 | 15,593 | |||||||||||||||||
| 12/7/98 | Distribution $0.29 | 8.625 | 52 | 16,016 | 14,129 | |||||||||||||||||
| 12/6/99 | Distribution $0.27 | 8.781 | 49 | 18,051 | 14,769 | |||||||||||||||||
| 12/6/00 | Distribution $1.72 | 8.469 | 333 | 20,016 | 17,026 | |||||||||||||||||
| 12/6/01 | Distribution $0.57 | 9.880 | 114 | 24,701 | 21,924 | |||||||||||||||||
| 2002 | Annual distribution total $0.80 | 9.518 | 180 | 21,297 | 19,142 | |||||||||||||||||
| 2003 | Annual distribution total $0.92 | 10.004 | 217 | 33,125 | 31,311 | |||||||||||||||||
| 2004 | Annual distribution total $1.33 | 13.350 | 257 | 39,320 | 41,788 | |||||||||||||||||
| 2005 | Annual distribution total $1.85 | 13.848 | 383 | 41,969 | 45,500 | |||||||||||||||||
| 2006 | Annual distribution total $1.55 | 14.246 | 354 | 51,385 | 57,647 | |||||||||||||||||
| 2007 | Annual distribution total $1.35 | 13.584 | 357 | 51,709 | 45,802 | |||||||||||||||||
| 2008 | Annual distribution total $1.193 | 8.237 | 578 | 28,205 | 24,807 | |||||||||||||||||
| 3/11/09 | Distribution $0.223 | 4.260 | 228 | 41,314 | 34,212 | |||||||||||||||||
| 12/2/10 | Distribution $0.08 | 9.400 | 40 | 53,094 | 45,884 | |||||||||||||||||
| 2011 | Annual distribution total $0.533 | 8.773 | 289 | 49,014 | 43,596 | |||||||||||||||||
| 2012 | Annual distribution total $0.51 | 9.084 | 285 | 57,501 | 49,669 | |||||||||||||||||
| 2013 | Annual distribution total $1.38 | 11.864 | 630 | 83,110 | 74,222 | |||||||||||||||||
| 2014 | Annual distribution total $2.90 | 10.513 | 1,704 | 86,071 | 76,507 | |||||||||||||||||
| 2015 | Annual distribution total $1.26 | 7.974 | 1,256 | 75,987 | 64,222 | |||||||||||||||||
| 2016 | Annual distribution total $0.64 | 7.513 | 779 | 92,689 | 78,540 | |||||||||||||||||
| 2017 | Year-to-date distribution total $0.32 | 8.317 | 374 | |||||||||||||||||||
| 6/30/17 | $ | 8,900 | 9,999 | $ | 98,190 | $ | 86,491 | |||||||||||||||
| 1 The purchase price used for annual distribution totals is a weighted average of the distribution reinvestment prices for the year. |
| 2 Values are stated as of December 31 of the year indicated, after reinvestment of distributions, other than for initial purchase. |
| 3 Includes a return of capital. |
| 2017 Semiannual Report to Stockholders | 55 |
History Since Inception (continued)
| HISTORY | AMOUNT INVESTED | PURCHASE PRICE1 | SHARES | NAV VALUE2 | MARKET VALUE2 | ||||||||||||||||||
| Royce Value Trust | |||||||||||||||||||||||
| 11/26/86 | Initial Purchase | $ | 10,000 | $ | 10.000 | 1,000 | $ | 9,280 | $ | 10,000 | |||||||||||||
| 10/15/87 | Distribution $0.30 | 7.000 | 42 | ||||||||||||||||||||
| 12/31/87 | Distribution $0.22 | 7.125 | 32 | 8,578 | 7,250 | ||||||||||||||||||
| 12/27/88 | Distribution $0.51 | 8.625 | 63 | 10,529 | 9,238 | ||||||||||||||||||
| 9/22/89 | Rights Offering | 405 | 9.000 | 45 | |||||||||||||||||||
| 12/29/89 | Distribution $0.52 | 9.125 | 67 | 12,942 | 11,866 | ||||||||||||||||||
| 9/24/90 | Rights Offering | 457 | 7.375 | 62 | |||||||||||||||||||
| 12/31/90 | Distribution $0.32 | 8.000 | 52 | 11,713 | 11,074 | ||||||||||||||||||
| 9/23/91 | Rights Offering | 638 | 9.375 | 68 | |||||||||||||||||||
| 12/31/91 | Distribution $0.61 | 10.625 | 82 | 17,919 | 15,697 | ||||||||||||||||||
| 9/25/92 | Rights Offering | 825 | 11.000 | 75 | |||||||||||||||||||
| 12/31/92 | Distribution $0.90 | 12.500 | 114 | 21,999 | 20,874 | ||||||||||||||||||
| 9/27/93 | Rights Offering | 1,469 | 13.000 | 113 | |||||||||||||||||||
| 12/31/93 | Distribution $1.15 | 13.000 | 160 | 26,603 | 25,428 | ||||||||||||||||||
| 10/28/94 | Rights Offering | 1,103 | 11.250 | 98 | |||||||||||||||||||
| 12/19/94 | Distribution $1.05 | 11.375 | 191 | 27,939 | 24,905 | ||||||||||||||||||
| 11/3/95 | Rights Offering | 1,425 | 12.500 | 114 | |||||||||||||||||||
| 12/7/95 | Distribution $1.29 | 12.125 | 253 | 35,676 | 31,243 | ||||||||||||||||||
| 12/6/96 | Distribution $1.15 | 12.250 | 247 | 41,213 | 36,335 | ||||||||||||||||||
| 1997 | Annual distribution total $1.21 | 15.374 | 230 | 52,556 | 46,814 | ||||||||||||||||||
| 1998 | Annual distribution total $1.54 | 14.311 | 347 | 54,313 | 47,506 | ||||||||||||||||||
| 1999 | Annual distribution total $1.37 | 12.616 | 391 | 60,653 | 50,239 | ||||||||||||||||||
| 2000 | Annual distribution total $1.48 | 13.972 | 424 | 70,711 | 61,648 | ||||||||||||||||||
| 2001 | Annual distribution total $1.49 | 15.072 | 437 | 81,478 | 73,994 | ||||||||||||||||||
| 2002 | Annual distribution total $1.51 | 14.903 | 494 | 68,770 | 68,927 | ||||||||||||||||||
| 1/28/03 | Rights Offering | 5,600 | 10.770 | 520 | |||||||||||||||||||
| 2003 | Annual distribution total $1.30 | 14.582 | 516 | 106,216 | 107,339 | ||||||||||||||||||
| 2004 | Annual distribution total $1.55 | 17.604 | 568 | 128,955 | 139,094 | ||||||||||||||||||
| 2005 | Annual distribution total $1.61 | 18.739 | 604 | 139,808 | 148,773 | ||||||||||||||||||
| 2006 | Annual distribution total $1.78 | 19.696 | 693 | 167,063 | 179,945 | ||||||||||||||||||
| 2007 | Annual distribution total $1.85 | 19.687 | 787 | 175,469 | 165,158 | ||||||||||||||||||
| 2008 | Annual distribution total $1.723 | 12.307 | 1,294 | 95,415 | 85,435 | ||||||||||||||||||
| 3/11/09 | Distribution $0.323 | 6.071 | 537 | 137,966 | 115,669 | ||||||||||||||||||
| 12/2/10 | Distribution $0.03 | 13.850 | 23 | 179,730 | 156,203 | ||||||||||||||||||
| 2011 | Annual distribution total $0.783 | 13.043 | 656 | 161,638 | 139,866 | ||||||||||||||||||
| 2012 | Annual distribution total $0.80 | 13.063 | 714 | 186,540 | 162,556 | ||||||||||||||||||
| 2013 | Annual distribution total $2.194 | 16.647 | 1,658 | 250,219 | 220,474 | ||||||||||||||||||
| 2014 | Annual distribution total $1.82 | 14.840 | 1,757 | 252,175 | 222,516 | ||||||||||||||||||
| 2015 | Annual distribution total $1.24 | 12.725 | 1,565 | 231,781 | 201,185 | ||||||||||||||||||
| 2016 | Annual distribution total $1.02 | 12.334 | 1,460 | 293,880 | 248,425 | ||||||||||||||||||
| 2017 | Year-to-date distribution total $0.53 | 14.023 | 708 | ||||||||||||||||||||
| 6/30/17 | $ | 21,922 | 19,261 | $ | 315,303 | $ | 281,018 | ||||||||||||||||
| 1 The purchase price used for annual distribution totals is a weighted average of the distribution reinvestment prices for the year. |
| 2 Values are stated as of December 31 of the year indicated, after reinvestment of distributions, other than for initial purchase. |
| 3 Includes a return of capital. |
| 4 Includes Royce Global Value Trust spin-off of $1.40 per share. |
| 56 | 2017 Semiannual Report to Stockholders |
Distribution Reinvestment and Cash Purchase Options
Why should I reinvest my distributions?
By reinvesting distributions, a stockholder can maintain an undiluted investment
in the Fund. The regular reinvestment of distributions has a significant impact
on stockholder returns. In contrast, the stockholder who takes distributions in
cash is penalized when shares are issued below net asset value to other stockholders.
How does the reinvestment of distributions
from the Royce closed-end funds work?
The Funds automatically issue shares in
payment of distributions unless you indicate otherwise. The shares are generally
issued at the lower of the market price or net asset value on the valuation date.
How does this apply to registered stockholders?
If your shares are registered directly
with a Fund, your distributions are automatically reinvested unless you have otherwise
instructed the Funds’ transfer agent, Computershare, in writing, in which case
you will receive your distribution in cash. A registered stockholder also may have
the option to receive the distribution in the form of a stock certificate.
What if my shares are held by a brokerage
firm or a bank?
If your shares are held by a brokerage firm, bank, or other intermediary
as the stockholder of record, you should contact your brokerage firm or bank to
be certain that it is automatically reinvesting distributions on your behalf. If
they are unable to reinvest distributions on your behalf, you should have your shares
registered in your name in order to participate.
What other features are available for registered
stockholders?
The Distribution Reinvestment and Cash Purchase Plans also allow
registered stockholders to make optional cash purchases of shares of a Fund’s
common stock directly through Computershare on a monthly basis, and to deposit certificates
representing your RVT and RMT shares with Computershare for safekeeping. (RGT does
not issue shares in certificated form). Plan participants are subject to a $0.75
service fee for each voluntary cash purchase under the Plans. The Funds’ investment
adviser absorbed all commissions on optional cash purchases under the Plans through
June 30, 2017.
How do the Plans work for registered stockholders?
Computershare maintains the accounts for registered stockholders in the Plans
and sends written confirmation of all transactions in the account. Shares in the
account of each participant will be held by Computershare in non-certificated form
in the name of the participant, and each participant will be able to vote those
shares at a stockholder meeting or by proxy. A participant may also send stock certificates
for RVT and RMT held by them to Computershare to be held in non-certificated form.
RGT does not issue shares in certificated form. There is no service fee charged
to participants for reinvesting distributions. If a participant elects to sell shares
from a Plan account, Computershare will deduct a $2.50 service fee from the sale
transaction. The Funds’ investment adviser absorbed all commissions on optional
sales under the Plans through June 30, 2017. If a nominee is the registered owner
of your shares, the nominee will maintain the accounts on your behalf.
How can I get more information on the Plans?
You can call an Investor Services Representative at (800) 221-4268 or you can
request a copy of the Plan for your Fund from Computershare. All correspondence
(including notifications) should be directed to: [Name of Fund] Distribution Reinvestment
and Cash Purchase Plan, c/o Computershare, PO Box 43078, Providence, RI 02940-3078,
telephone (800) 426-5523 (from 9:00 A.M. to 5:00 P.M.).
| 2017 Semiannual Report to Stockholders | 57 |
Directors and Officers
All Directors and Officers may be reached c/o The Royce Funds, 745 Fifth Avenue, New York, NY 10151
Charles M. Royce, Director1
Age: 77 | Number of Funds Overseen: 22 | Tenure: Since
1982
Non-Royce Directorships: Director of TICC Capital Corp.
Principal Occupation(s)
During Past Five Years: Chairman of the Board of Managers of Royce & Associates,
LP (“Royce”), the Trust’s investment adviser; Chief Executive Officer
(1972–June 2017), President (1972-July 2014) of Royce.
Christopher D. Clark,
Director1, President
Age: 52 | Number of Funds Overseen: 22 | Tenure: Since 2014
Principal Occupation(s) During Past Five Years: Chief Executive Officer (since July
2017), President (since July 2014), Co-Chief Investment Officer (Since January 2014),
Managing Director and, since June 2015, a Member of the Board of Managers of Royce,
having been employed by Royce since May 2007.
Patricia W. Chadwick, Director
Age:
68 | Number of Funds Overseen: 22 | Tenure: Since 2009
Non-Royce Directorships:
Trustee of ING Mutual Funds and Director of Wisconsin Energy Corp.
Principal Occupation(s)
During Past 5 Years: Consultant and President of Ravengate Partners LLC (since 2000).
Stephen L. Isaacs, Director
Age: 77 | Number of Funds Overseen: 22 | Tenure: Since
1989
Non-Royce Directorships: None
Principal Occupation(s) During Past Five Years:
Attorney and President of Health Policy Associates, Inc., consultants. Mr. Isaacs’s prior business experience includes having served as President of the Center
for Health and Social Policy (from 1996 to 2012); Director of Columbia University
Development Law and Policy Program and Professor at Columbia University (until August
1996).
Arthur S. Mehlman, Director
Age: 75 | Number of Funds Overseen: 40 | Tenure:
Since 2004
Non-Royce Directorships: Director/Trustee of registered investment companies
constituting the 18 Legg Mason Funds.
Principal Occupation(s) During Past Five Years:
Director of The League for People with Disabilities, Inc.; Director of University
of Maryland Foundation (non-profits). Formerly: Director of Municipal Mortgage
& Equity, LLC (from October 2004 to April 1, 2011); Director of University of
Maryland College Park Foundation (non-profit) (from 1998 to 2005); Partner, KPMG
LLP (international accounting firm) (from 1972 to 2002); Director of Maryland Business
Roundtable for Education (from July 1984 to June 2002).
David L. Meister, Director
Age: 77 | Number of Funds Overseen: 22 | Tenure: Since 1982
Non-Royce Directorships:
None
Principal Occupation(s) During Past Five Years: Consultant. Chairman and Chief
Executive Officer of The Tennis Channel (from June 2000 to March 2005). Mr. Meister’s prior business experience includes having served as Chief Executive Officer
of Seniorlife.com, a consultant to the communications industry, President of Financial
News Network, Senior Vice President of HBO, President of Time-Life Films, and Head
of Broadcasting for Major League Baseball.
G. Peter O’Brien, Director
Age:
71 | Number of Funds Overseen: 40 | Tenure: Since 2001
Non-Royce Directorships:
Director/Trustee of registered investment companies constituting the 18 Legg Mason
Funds; Director of TICC Capital Corp.
Principal Occupation(s) During Past Five Years:
Trustee Emeritus of Colgate University (since 2005); Board Member of Hill House,
Inc. (since 1999); Formerly: Trustee of Colgate University (from 1996 to 2005),
President of Hill House, Inc. (from 2001 to 2005) and Managing Director/Equity Capital
Markets Group of Merrill Lynch & Co. (from 1971 to 1999).
Michael K. Shields,
Director
Age: 59 | Number of Funds Overseen: 22 | Tenure: Since 2015
Principal Occupation(s)
During Past Five Years: President and Chief Executive Officer of Piedmont Trust
Company, a private North Carolina trust company (since May 2012). Mr. Shields’s
prior business experience includes owning Shields Advisors, an investment consulting
firm (from April 2010 to June 2012).
Francis D. Gannon, Vice President
Age: 49 |
Tenure: Since 2014
Principal Occupation(s) During Past Five Years: Co-Chief Investment
Officer (since January 2014) and Managing Director of Royce, having been employed
by Royce since September 2006.
Daniel A. O’Byrne, Vice President
Age: 55 |
Tenure: Since 1994
Principal Occupation(s) During Past Five Years: Principal and
Vice President of Royce, having been employed by Royce since October 1986.
Peter
K. Hoglund, Treasurer
Age: 51 | Tenure: Since 2015
Principal Occupation(s) During
Past Five Years: Chief Financial Officer, Chief Administrative Officer, and Managing
Director of Royce, having been employed by Royce since December 2014. Prior to joining
Royce, Mr. Hoglund spent more than 20 years with Munder Capital Management in Birmingham,
MI, serving as Managing Director and Chief Financial Officer and overseeing all
financial aspects of the firm. He began his career at Munder as a portfolio manager.
John E. Denneen, Secretary and Chief Legal Officer
Age: 50 | Tenure: 1996-2001 and
Since 2002
Principal Occupation(s) During Past Five Years: General Counsel, Managing
Director, and, since June 2015, a Member of the Board of Managers of Royce. Chief
Legal and Compliance Officer and Secretary of Royce.
Lisa Curcio, Chief Compliance
Officer
Age: 57 | Tenure: Since 2004
Principal Occupation(s) During Past Five Years:
Chief Compliance Officer of The Royce Funds (since October 2004) and Compliance
Officer of Royce (since June 2004).
| 1 Interested Director. |
| Director will hold office until their successors have been duly elected and qualified or until their earlier resignation or removal. |
| 58 | 2017 Semiannual Report to Stockholders |
Board Approval of Investment Advisory Agreements
At meetings held on June 5-6, 2017, the Funds’ respective Boards of Directors, including all of the non-interested directors, approved the continuation of investment advisory agreements (each, an “Investment Advisory Agreement” and collectively, the “Investment Advisory Agreements”) between Royce & Associates, LP (“R&A”) and each of Royce Value Trust, Inc., Royce Micro-Cap Trust, Inc., and Royce Global Value Trust, Inc. (each, a “Fund” and collectively, the “Funds”). In reaching these decisions, each Board reviewed the materials provided by R&A, which included, among other things, information prepared internally by R&A and independently by Morningstar Associates, LLC (“Morningstar”) containing detailed investment advisory fee, expense ratio, and investment performance comparisons for the Funds with other funds in their respective “peer groups”, information regarding the past performance of the Funds and other registered investment companies managed by R&A and a memorandum outlining the legal duties of each Board prepared by independent counsel to the non-interested directors. R&A also provided the directors with an analysis of its profitability with respect to providing investment advisory services to each of the Funds. In addition, each Board took into account information furnished throughout the year at regular Board meetings, including reports on investment performance, stockholder services, regulatory compliance, brokerage commissions and research, and brokerage and other execution products and services provided to the Funds. Each Board also considered other matters it deemed important to the approval process, such as allocation of brokerage commissions, “soft dollar” research services R&A receives and other direct and indirect benefits to R&A and its affiliates, from their relationship with the relevant Fund. The directors also met throughout the year with investment advisory personnel from R&A. Each Board, in its deliberations, recognized that, for many of the Funds’ stockholders, the decision to purchase Fund shares included a decision to select R&A as the investment adviser and that there was a strong association in the minds of Fund stockholders between R&A and each Fund. In considering factors relating to the approval of the continuance of the Investment Advisory Agreements, the non-interested directors received assistance and advice from, and met separately with, their independent counsel. While all three of the Investment Advisory Agreements were considered at the same Board meetings, the Boards dealt with each agreement separately. Among other factors, the directors considered the following:
The nature, extent and quality
of services provided by R&A:
Each Board considered the following factors to
be of fundamental importance to its consideration of whether to approve the continuance
of the Investment Advisory Agreement: (i) R&A’s more than 40 years of
value investing experience and track record; (ii) the history of long-tenured R
&A portfolio managers managing the Funds; (iii) R&A’s focus on mid-cap,
small-cap and micro-cap value investing; (iv) the consistency of R&A’s
approach to managing the Funds and open-end mutual funds over more than 40 years;
(v) the integrity and high ethical standards adhered to at R&A; (vi) R&A’s specialized experience in the area of trading small- and micro-cap securities;
(vii) R&A’s historical ability to attract and retain portfolio management
talent and (viii) R&A’s focus on stockholder interests as exemplified
by expansive stockholder reporting and communications. The Boards also noted that
R&A’s compensation policy arrangements strongly encourage portfolio manager
investment in each Fund that they manage. Each Board reviewed the services that
R&A provides to each Fund, including, but not limited to, managing each Fund’s investments in accordance with the stated policies of each Fund. Each Board
considered the fact that R&A provided certain administrative services to the
Funds at cost pursuant to the Administration Agreement between the Funds and R&A.
Each Board determined that the services to be provided to each Fund by R&A
would be the same as those that it previously provided to the relevant Fund. The
Boards also took into consideration the histories, reputations and backgrounds of
R&A’s portfolio managers for the Funds, finding that these would likely
have an impact on the continued success of the Funds. Lastly, each Board noted
R&A’s ability to attract and retain qualified and experienced personnel.
The directors concluded that the investment advisory services provided by R&A
to each Fund compared favorably to services provided by R&A to other R&A
client accounts, including other funds, in both nature and quality, and that the
scope of services provided by R&A would continue to be suitable for the Funds.
Investment performance of the Funds and R&A:
In light of R&A’s risk-averse
approach to investing, each Board believes that risk-adjusted performance continues
to be the most appropriate measure of each Fund’s investment performance. One
measure of risk-adjusted performance the Boards use in their review of the Funds’ performance is the Sharpe Ratio. The Sharpe Ratio is a risk-adjusted measure
of performance developed by Nobel Laureate William Sharpe. It is calculated by dividing
a Fund’s annualized excess returns by its annualized standard deviation to
determine reward per unit of risk. The higher the Sharpe Ratio, the better a Fund’s historical risk-adjusted performance. The Boards attach primary importance
to risk-adjusted performance over relatively long periods of time, typically 3 to
10 years. It was noted, however, that Royce Global Value Trust, Inc. (“RGT”) had less than five full calendar years of performance because its inception
date was October 18, 2013. Overall, the Boards noted that financial markets in 2016
were marked by increased return dispersion, declining correlation, and a steepening
yield curve. These factors resulted in a very strong year for small-cap stocks and
an even better year for small-cap value stocks and cyclical sectors. The 2016 market
environment enabled each of Royce Value Trust, Inc. (“RVT”) and Royce
Micro-Cap Trust, Inc. (“RMT”) to outperform its peers in 2016 as evidenced
by its Sharpe Ratio. While the directors recognize that one-year performance does
not define a trend and place primary emphasis on medium-term and longer-term risk
adjusted performance as referenced above, they also noted that the improved relative
risk-adjusted performance of RVT and RMT during the more historically customary
market environment that prevailed during 2016 was not insignificant. Along those
lines, the relevant Boards noted that RVT and RMT also generally underperformed
their respective peers, as evidenced by their Sharpe Ratios, from approximately
March 2009 through the end of 2015. This post-2008 market period was marked by historically
low interest rates and significant U.S. Federal Reserve market intervention. During
this period, highly leveraged, non-earning companies and yield-oriented securities
(e.g., master limited partnerships, real estate investment trusts, and utilities)
generally outperformed the higher quality companies (e.g., those with solid balance
sheets, low leverage, the ability to generate and effectively allocate free cash
flow, and strong returns on invested capital) and cyclical companies favored by
each of RVT and RMT. The directors also noted, however, as discussed below, that
the relative performance for each of RVT and RMT during the more historically customary
market cycle preceding the 2008 financial crisis was quite strong. Using Morningstar
data, the Sharpe Ratio for RVT placed in the 1st, 4th, 4th, and 4th quartiles within
the Small Blend category assigned by Morningstar for the 1-year, 3-year, 5-year,
and 10-year periods, respectively, ended December 31, 2016 while the Sharpe Ratio
for RMT placed in the 2nd, 4th, 4th, and 4th quartiles within the Small Blend category
assigned by Morningstar for the 1-year, 3-year, 5-year, and 10-year periods, respectively,
ended December 31, 2016. The relevant Boards further noted that the use of leverage
by each of RVT and RMT through preferred stock (prior to November 15, 2012) and
borrowings resulted in higher volatility and worse down market performance.
The
2016 market environment also enabled RGT to outperform its peers in 2016 as evidenced
by its Sharpe Ratio. Using Morningstar data, the Sharpe Ratio for RGT in the 1st
and 2nd quartiles within the Foreign Small/Mid Value category assigned by Morningstar
for the 1-year and 3-year periods, respectively, ended December 31, 2016. The Board
noted the inherent limitations of using 1-year and 3-year Sharpe Ratios in evaluating
RGT’s investment performance.
In addition to each Fund’s risk–adjusted
performance, the Boards also reviewed and considered the absolute total returns
and down market performance for each Fund and the long-term performance records
of each of RVT and RMT for periods of 10 years and longer. The Boards further noted
that R&A manages a number of funds that invest in micro-cap, small-cap, and
mid-cap issuers, many of which had outperformed
| 2017 Semiannual Report to Stockholders | 59 |
Board Approval of Investment Advisory Agreements (continued)
their benchmark indexes and their competitors during the periods prior to the U.S. Federal Reserve’s near zero interest rate policy and related market interventions and during 2016 as noted above. Although each Board recognized that past performance is not necessarily an indicator of future results, it found that R&A had the necessary qualifications, experience and track record in managing micro-cap, small-cap, and mid-cap securities to manage the relevant Fund. Each Board determined that R&A continued to be an appropriate investment adviser for the relevant Fund and concluded that the relevant Fund’s performance supported the approval of the continuance of its Investment Advisory Agreement.
Cost of the services provided and profits realized by R&A from its
relationship with the Funds:
Each Board considered the cost of the services provided
by R&A and profits realized by R&A from its relationship with each Fund.
As part of the analysis, each Board discussed with R&A its methodology in allocating
its costs to each Fund and concluded that its allocations were reasonable. The RVT
Board noted that RVT was not profitable to R&A during the year ended December
31, 2016. The Boards of RMT and RGT concluded that R&A’s profits in respect
of RMT and RGT, respectively, were reasonable in relation to the nature and quality
of services provided.
The extent to which economies of scale would be realized as
the Funds grow and whether fee levels would reflect such economies of scale:
Each
Board considered whether there have been economies of scale in respect of the management
of each Fund, whether each Fund has appropriately benefited from any economies of
scale and whether there is potential for realization of any further economies of
scale. Each Board noted the time and effort involved in managing portfolios of micro-,
small- and mid-cap stocks and that they did not involve the same efficiencies as
do portfolios of large-cap stocks. The directors noted that, as closed-end funds,
the Funds generally would not be expected to have significant inflows of capital
that might produce increasing economies of scale. Each Board concluded that the
current fee structure for each Fund was reasonable, that stockholders sufficiently
participated in economies of scale and that no changes were currently necessary.
Comparison of services to be rendered and fees to be paid to those under other investment
advisory contracts, such as contracts of the same and other investment advisers
or other clients:
Each Board reviewed the investment advisory fee paid by each Fund
and compared both the services to be rendered and the fees to be paid under the
Investment Advisory Agreements to other contracts of R&A and to contracts of
other investment advisers to registered investment companies investing in small-
and micro-cap stocks, as provided by Morningstar. Each Board noted the importance
of the net expense ratio in measuring a fund’s efficiency, particularly in
light of the variations in the mutual fund industry as to which entity is responsible
for particular types of expenses. In the case of RVT, its Board noted that it had
a 1.00% basic fee that is subject to adjustment up or down (up to 0.50% in either
direction) based on its performance versus the S&P 600 SmallCap Index over
a rolling period of 60 months. The fee is charged on average net assets over that
rolling period. As a result, in a rising market, the fee will be smaller than a
fee calculated on the current year’s average net assets, and vice versa. The
Board determined that the performance adjustment feature continued to serve as an
appropriate incentive to R&A to manage RVT for the benefit of its long-term
common stockholders. The Board also noted that the fee arrangement, which also includes
a provision for no fee in periods where RVT’s trailing three-year performance
is negative, requires R&A to measure RVT’s performance monthly against
the S&P 600, an unmanaged index. Instead of receiving a set fee regardless
of its performance, R&A is penalized for poor performance. The Board noted
that RVT’s net expense ratio of 0.73% placed it in the 1st quartile within
its Morningstar peer group for 2016. In the case of RMT, the Board noted that it
also had a 1.00% basic fee subject to adjustment up or down based on its performance
versus the Russell 2000 Index over a rolling 36 month period. The fee is charged
on average net assets over that rolling period. As a result, in a rising market,
the fee will be smaller than a fee calculated on the current year’s average
net assets, and vice versa. The Board determined that the performance adjustment
feature continued to serve as an incentive to R&A to manage RMT for the benefit
of its long-term common stockholders. The Board noted that RMT’s net expense
ratio of 1.26% placed it in the 2nd quartile when compared against its Morningstar
peer group for 2016. The Board further noted that RMT’s net expense ratio was
actually 2 basis points lower than its peer group median and 15 basis points lower
than the average expense ratio for the 44 non-institutional, non-ETF domestic funds
with weighted average market capitalizations of less than $1 billion within the
Morningstar peer group. Finally, in the case of RGT, the Board noted that its net
expense ratio based on average net assets fell within the 4th quartile of its Morningstar
peer group, 46 basis points above the Morningstar category median. The Board noted,
however, that RGT had the third lowest weighted average market capitalization within
that category.
The Boards also noted that R&A manages the Funds in an active
fashion. The industry accepted metric for measuring how actively an equity portfolio
is managed is called “active share.” In particular, active share measures
how much the holdings of an equity portfolio differ from the holdings of its appropriate
passive benchmark index. At the extremes, a portfolio with no holdings in common
with the benchmark would have 100% active share, while a portfolio that is identical
to the benchmark would have 0% active share. R&A presented a chart to the Boards
which demonstrated that funds with high active share scores had higher expense ratios
than funds with lower active share scores due to the resources required for the
active management of those funds. The Boards noted that the active shares for RVT,
RMT, and RGT were 89%, 95%, and 97%, respectively, for the calendar year ended December
31, 2016.
Each Board also considered fees charged by R&A to institutional and
other clients and noted that, given the greater levels of services that R&A
provides to registered investment companies such as the Funds as compared to other
accounts, the base investment advisory fee for RVT and RMT and the advisory fee
for RGT compared favorably to the investment advisory fees charged to those other
accounts.
No single factor was cited as determinative to the decision of the directors.
Rather, after weighing all of the considerations and conclusions discussed above,
each entire Board, including all of the non-interested directors, approved the continuation
of the relevant Investment Advisory Agreement, concluding that the continuation
of such agreements was in the best interest of the shareholders of the respective
Funds and that each Fund’s investment advisory fee rate was reasonable in relation
to the services provided.
| 60 | 2017 Semiannual Report to Stockholders |
Notes to Performance and Other Important Information
The thoughts expressed in this Review and Report
concerning recent market movements and future prospects for small company stocks
are solely the opinion of Royce at June 30, 2017, and, of course, historical market
trends are not necessarily indicative of future market movements. Statements regarding
the future prospects for particular securities held in the Funds’ portfolios
and Royce’s investment intentions with respect to those securities reflect
Royce’s opinions as of June 30, 2017 and are subject to change at any time
without notice. There can be no assurance that securities mentioned in this Review
and Report will be included in any Royce-managed portfolio in the future. Investments
in securities of micro-cap, small-cap and/or mid-cap companies may involve considerably
more risk than investments in securities of larger-cap companies. All publicly released
material information is always disclosed by the Funds on the website at www.roycefunds.com.
Sector weightings are determined using the Global Industry Classification Standard
(“GICS”). GICS was developed by, and is the exclusive property of, Standard
& Poor’s Financial Services LLC (“S&P”) and MSCI Inc. (“MSCI”). GICS is the trademark of S&P and MSCI. “Global Industry
Classification Standard (GICS)” and “GICS Direct” are service marks
of S&P and MSCI.
All indexes referred to are unmanaged and capitalization weighted.
Each index’s returns include net reinvested dividends and/or interest income.
Russell Investment Group is the source and owner of the trademarks, service marks,
and copyrights related to the Russell Indexes. Russell® is a trademark of Russell
Investment Group. The Russell 2000 Index is an index of domestic small-cap stocks.
It measures the performance of the 2,000 smallest publicly traded U.S. companies
in the Russell 3000 Index. The Russell 2000 Value and Growth Indexes consist of
the respective value and growth stocks within the Russell 2000 as determined by
Russell Investments. The Russell Microcap Index includes 1,000 of the smallest securities
in the Russell 2000 Index along with the next smallest eligible securities as determined
by Russell. The Russell 1000 Index is an index of domestic large-cap stocks. It
measures the performance of the 1,000 largest publicly traded companies in the Russell
3000 Index. The Russell Midcap Index measures the performance of the mid-cap segment
of the U.S. equity universe. It includes approximately 800 of the smallest securities
in the Russell 1000 Index. The Russell Global Small Cap Index is an unmanaged, capitalization-weighted
index of global small-cap stocks. The Russell Global ex-U.S. Large Cap Index is
an index of global large-cap stocks, excluding the United States. The Russell Global
ex-U.S. Small Cap Index is an index of global small-cap stocks, excluding the United
States. The S&P 500 and SmallCap 600 are indexes of U.S. large- and small-cap
stocks, respectively, selected by Standard & Poor’s based on market size,
liquidity, and industry grouping, among other factors. The Nasdaq Composite is an
index of the more than 3,000 common equities listed on the Nasdaq stock exchange.
The performance of an index does not represent exactly any particular investment,
as you cannot invest directly in an index. Returns for the market indexes used in
this report were based on information supplied to Royce by Russell Investments.
The Price-Earnings, or P/E, Ratio is calculated by dividing a company’s share
price by its trailing 12-month earnings-per share (EPS). The Priceto- Book, or P/B,
Ratio is calculated by dividing a company’s share price by its book value per
share. For the Morningstar Small Blend Category: © 2017 Morningstar. All Rights
Reserved. The information regarding the category in this piece is: (1) is proprietary
to Morningstar and/or its content providers; (2) may not be copied or distributed;
and (3) is not warranted to be accurate, complete or timely. Neither Morningstar
nor its content providers are responsible for any damages or losses arising from
any use of this information. The Morningstar Style Map uses proprietary scores of
a stock’s value and growth characteristics to determine its placement in one
of the five categories listed on the horizontal axis. These characteristics are
then compared to those of other stocks within the same market capitalization band.
Each is scored from zero to 100 for both value and growth attributes. The value
score is subtracted from the growth score to determine the overall style score.
For the vertical, market cap axis, Morningstar subdivides into size groups. Giant-cap
stocks are defined as those that account for the top 40% of the capitalization of
each style zone; large-cap stocks represent the next 30%; mid-cap stocks the next
20%; small-cap stocks the next 7%; micro-cap stocks the smallest 3%. The Royce Funds
is a service mark of The Royce Funds. Distributor: Royce Fund Services, LLC.
This material contains forward-looking statements within the meaning of the Securities Exchange Act of 1934, as amended (the “Exchange Act”), that involve risks and uncertainties, including, among others, statements as to:
| • | the Funds’ future operating results |
| • | the prospects of the Funds’ portfolio companies |
| • | the impact of investments that the Funds have made or may make |
| • | the dependence
of the Funds’ future success on the general economy and its impact
on the companies and industries in which the Funds invest, and |
| • | the ability of the Funds’ portfolio companies to achieve their objectives. |
The Royce Funds have based the forward-looking statements included in this Review and Report on information available to us on the date of the report, and we assume no obligation to update any such forward-looking statements. Although The Royce Funds undertake no obligation to revise or update any forward-looking statements, whether as a result of new information, future events or otherwise, you are advised to consult any additional disclosures that we may make through future stockholder communications or reports.
Royce Global Value Trust, Royce Micro-Cap Trust, and Royce Value Trust may each repurchase up to 5% of the issued and outstanding shares of its respective common stock during the year ending December 31, 2017. Any such repurchases would take place at then prevailing prices in the open market or in other transactions. Common stock repurchases would be effected at a price per share that is less than the share’s then current net asset value.
Royce Global Value Trust, Royce Micro-Cap Trust, and Royce Value Trust are also authorized to offer their common stockholders an opportunity to subscribe for additional shares of their common stock through rights offerings at a price per share that may be less than the share’s then current net asset value. The timing and terms of any such offerings are within each Board’s discretion.
Annual Certifications
As required, the Funds have submitted to the New York Stock
Exchange (“NYSE”) for the annual certification of the Funds’ Chief
Executive Officer that he is not aware of any violation of the NYSE’s listing
standards. The Funds also have included the certification of the Funds’ Chief
Executive Officer and Chief Financial Officer required by section 302 of the Sarbanes-Oxley
Act of 2002 as exhibits to the Funds’ form N-CSR for the period ended December
31, 2016, filed with the Securities and Exchange Commission.
Proxy Voting
A copy
of the policies and procedures that The Royce Funds use to determine how to vote
proxies relating to portfolio securities and information regarding how each of The
Royce Funds voted proxies relating to portfolio securities during the most recent
12-month period ended June 30 is available, without charge, on The Royce Funds’
website at www.roycefunds.com, by calling (800) 221-4268 (toll-free) and on the
website of the Securities and Exchange Commission (“SEC”), at www.sec.gov.
Form N-Q Filing
The Funds file their complete schedules of investments with the
SEC for the first and third quarters of each fiscal year on Form N-Q. The Funds’ Forms N-Q are available on the SEC’s website at www.sec.gov. The Royce
Funds’ holdings are also on the Funds’ website approximately 15 to 20
days after each calendar quarter end and remain available until the next quarter’s holdings are posted. The Funds’ Forms N-Q may also be reviewed and copied
at the SEC’s Public Reference Room in Washington, D.C. To find out more about
this public service, call the SEC at (800) 732-0330. The Funds’ complete schedules
of investments are updated quarterly, and are available at www.roycefunds.com.
| 2017 Semiannual Report to Stockholders | 61 |
 |
||||
| About The Royce Funds | Contact Us | |||
Unparalleled Knowledge + Experience Pioneers in small-cap investing, with 40+ years of experience, depth of knowledge, and focus. |
GENERAL INFORMATION General Royce Funds information including an overview of our firm and Funds (800) 221-4268 |
|||
Independent Thinking The confidence to go against consensus, the insight to uncover opportunities others might miss, and the tenacity to stay the course through market cycles. |
COMPUTERSHARE Transfer Agent and Registrar Speak with a representative about: • Your account, transactions, and forms (800) 426-5523 |
|||
Specialized Approaches Strategies that use value, core, or growth investment approaches to select micro-cap, small-cap, and mid-cap companies. |
FINANCIAL ADVISORS AND BROKER-DEALERS Speak with your regional Royce contact regarding: • Information about our firm, strategies, and Funds • Fund Materials (800) 337-6923 |
|||
Unwavering Commitment Our team of 17 portfolio managers have significant personal investments in the strategies they manage. |
||||
 |
 |
 |
||
Item 2. Code(s) of Ethics. Not applicable to this semi-annual report.
Item 3. Audit Committee Financial Expert. Not applicable to this semi-annual report.
Item 4. Principal Accountant Fees and Services. Not applicable to this semi-annual report.
Item 5. Audit Committee of Listed Registrants. Not applicable to this semi-annual report.
(b) Not applicable.
Item 7. Disclosure of Proxy Voting Policies and Procedures for Closed-End Management Investment Companies. Not applicable to this semi-annual report.
Item 8. Portfolio Managers of Closed-End Management Investment Companies. Not applicable to this semiannual report.
Item 9. Purchases of Equity Securities by Closed-End Management Investment Company and Affiliated Purchasers. Not applicable.
Item 10. Submission of Matters to a Vote of Security Holders. Not applicable.
Item 11. Controls and Procedures.
(a) Disclosure Controls and Procedures. The Principal Executive and Financial Officers concluded that the Registrant’s Disclosure Controls and Procedures are effective based on their evaluation of the Disclosure Controls and Procedures as of a date within 90 days of the filing date of this report.
(b) Internal Control over Financial Reporting. There were no significant changes in Registrant’s internal control over financial reporting or in other factors that could significantly affect this control subsequent to the date of the evaluation, including any corrective actions with regard to significant deficiencies and material weaknesses during the second fiscal quarter of the period covered by this report.
(a)(2) Separate certifications by the Registrant’s Principal Executive Officer and Principal Financial Officer as required by Rule 30a-2(a) under the Investment Company Act of 1940.
(a)(3) Not applicable
(b) Separate certifications by the Registrant’s Principal Executive Officer and Principal Financial Officer, pursuant to Section 906 of the Sarbanes-Oxley Act of 2002 and required by Rule 30a-2(b) under the Investment Company Act of 1940.
Pursuant to the requirements of the Securities Exchange Act of 1934 and the Investment Company Act of 1940, the registrant has duly caused this report to be signed on its behalf by the undersigned, thereunto duly authorized.
| ROYCE GLOBAL VALUE TRUST, INC. | ||
| BY: | /s/ Christopher D. Clark | |
| Christopher D. Clark | ||
| President | ||
Date: August 30, 2017
Pursuant to the requirements of the Securities Exchange Act of 1934 and the Investment Company Act of 1940, this report has been signed below by the following persons on behalf of the registrant and in the capacities and on the dates indicated.
| ROYCE GLOBAL VALUE TRUST, INC. | ROYCE GLOBAL VALUE TRUST, INC. | ||||
| BY: | /s/ Christopher D. Clark | BY: | /s/ Peter K. Hoglund | ||
| Christopher D. Clark | Peter K. Hoglund | ||||
| President | Chief Financial Officer | ||||
| Date: August 30, 2017 | Date: August 30, 2017 | ||||