Exhibit 99.1

Q4 2023 Shareholder Letter investors.block.xyz
February 22, 2024
To Our Shareholders:
We’ve done a lot recently to reduce our costs. Now we’re going to focus on growth.
We’re under our 12,000 people cap. This constraint forces us to prioritize more impactful work, which we believe will lead to growth. We’re going to operate under this cap until we feel it’s holding us back, which is likely years out, and continue to look critically at our organization and priorities.
On the topic of people, we’re reorganizing the people in Square back to a simple Engineering/Product/Design/Sales structure. The past organizational structure was holding us back, slowing us down, and weakening our skills. I want Square to be a leader in engineering and design again. A team people point to as inspiration, and aspire to join. This reorg will help us do that. Robert Andersen, our first Square, and then Cash App designer and team lead is rejoining our company to focus on making design at Square world-class again.
Our last shareholder letter was about how we’re going to grow Square through our 4 priorities of platform, local, AI, and banking. This one will be about growing Cash App.
Cash App aims to become one of the top providers of banking services to households in the United States which earn up to $150,000 per year, a segment that represents approximately 80% of consumers and more than 50% of household income.1
How are we going to achieve this? We have a three part strategy: (1) Banking our Base (2) Move Up Market by Serving Families and (3) Build the Next Generation Social Bank. The majority of our near term focus and current investments are on the first, where we see the most direct opportunity to drive meaningful top line growth for Cash App.
#1: Banking our Base.
As of December there were 2 million actives (3% of our monthly transacting actives) depositing their paycheck into Cash App each month, relative to 23 million Cash App Card monthly actives (41% of our monthly transacting actives) and our broader base of 56 million monthly transacting actives. In the same way that peer-to-peer (P2P) payments was a gateway to the Cash App Card, we see the Cash App Card as a gateway to our customers adopting Cash App as a primary banking solution.
We believe the most direct opportunity for Cash App to drive meaningful top line growth is by converting our existing base of 56 million monthly transacting actives, who mostly use P2P and Cash App Card, into primary banking actives who deposit their paycheck into Cash App and generate significantly more inflows per active. We see a meaningful step up in value and engagement as customers choose to deposit their paycheck with us: Cash App Card actives who deposit at least $2,000 of paychecks per month spend nearly 6x more than Cash App Card actives who do not deposit a paycheck with Cash App.
|
|
BLOCK Q4 2023 2 |

So how do we capture this opportunity?
It starts with earning our customer’s trust. Our top priority is continuing to improve upon safety, security, and support for our customers. This means continued focus on risk and fraud management, including protecting our customers from bad actors who attempt to abuse our platform through vectors like scams and phishing attacks. It also means ensuring our systems are highly reliable by improving system observability, redundancy and resiliency. And to support our customers in the case where they do run into a problem, we’re improving and scaling customer service through automation and features like priority phone support for the customers who rely on us the most.
Next, we will round out and differentiate our banking features. Today, we offer a free customizable Visa debit card, direct deposit which arrives up to 2 days earlier than most traditional banks, paper money deposits, instant discounts on debit spending, and a savings account with no minimum balance—all covered by FDIC insurance. We also offer short-term credit through Borrow, and round-ups/paycheck distribution into savings, stocks and Bitcoin—not to mention our suite of additional financial services like tax prep, investing, and of course P2P payments.
We stack up well against the competition, and will continue to build out our offering to make banking with Cash App an obvious choice. We recently launched free overdraft coverage and 4.5% yield on savings balances for paycheck direct deposit actives. We’re excited to push the boundary even further by offering new capabilities like credit building, spending insights, and subscription management tools. While some features like wire transfers, check deposits, and bill pay that our customers get from traditional banks are not yet widely available on Cash App, we’re aiming to close gaps like these soon to further grow customer adoption.
We’ll create even further differentiation by integrating our commerce payment tools. Cash App Card and Afterpay are two scaled payment tools that enable our customers to purchase goods and services from the largest and most frequently visited merchants in the United States. Afterpay enables customers to buy now and pay later both in network and out of network (via single use payment cards) as well as discover merchants through the Afterpay app. Our focuses in 2024 and beyond will be: 1) further integrating Afterpay into Cash App, 2) continuing to scale merchant discovery in Cash App, 3) using Afterpay’s distribution to continue growing Cash App Pay and 4) leveraging Cash App Card to distribute BNPL (e.g. Afterpay powering BNPL on the Cash App Card).
Finally, we will package all of this functionality together into a simple offering that makes it straightforward for customers to start banking with us and makes it easy for Cash App to go-to-market and acquire customers who will choose us as their primary provider of banking services.
|
|
BLOCK Q4 2023 3 |
#2: Move Up Market by Serving Families.
Today, Cash App’s base is largely made up of customers with a household income of less than $100,000 per year, and longer term we see an opportunity to serve customers with a household income of up to $150,000 per year. Strengthening our P2P network with families in the U.S.— including with higher-household-income parents and their dependents—is one lever that we believe will contribute meaningfully to our ability to move up market over the medium term. Dependents typically have less complicated financial lives compared to their parents and the families segment more broadly has historically not been well-served by P2P platforms in the U.S.
Over the last few years, we made Cash App available to individuals 13 and older, first starting with Cash App Card and P2P and then expanding into additional banking features. We’ve been focused on growing our feature set for teens and on earning trust by giving parents transparency into their family’s activity, allowing them to set permissions, and offering an increasingly robust set of oversight controls to promote safety.
Through this effort, we’re positioning Cash App for long-term growth by serving families in the near-term and then growing with our teen customer base as they mature, their income grows, and they engage more deeply with the full suite of banking products and financial services that Cash App offers.
#3: Build the Next Generation Social Bank.
Cash App is social. We show up where and when people interact, bringing together people and money (e.g., splitting the bill, contributing to a group gift, buying art at a craft fair). Cash App Card, our most successful banking product so far, is inherently social. Customers get Cash App Card because of its uniqueness and its utility tied to P2P payments, which they can’t get from traditional banks. We’re continuing to invest in building our social-driven feature set through areas like expanded profile functionality, sharing/recommendations, and exploring new ways for our customer base to transact together through financial services that have historically been disconnected from the community.
A big part of this vision is linking Square’s local priority with Cash App. In Cash App’s densest communities people commonly use Cash App to send money to pay for goods and services, like nails at a salon or fresh eggs at a farmers market—seller use cases that have historically been served by Square’s Card Reader. And with Cash App Card we see a considerable amount of Cash App customers buying from Square sellers. Given this area of natural overlap we are aiming to enable more local commerce by connecting our two largest ecosystems.
We believe there's an opportunity to offer Square sellers the ability to customize profiles in Cash App, that allows for better discovery and ordering for customers—ultimately connecting them to new local businesses through our commerce offerings.
|
|
BLOCK Q4 2023 4 |
All of this does represent a change in our approach: we are focused on growing within the U.S., not expanding into new markets, and we’re focused on driving growth through inflows per active more than actives. This past year we intentionally made decisions that impacted our actives growth, and that we believe allows us to move faster on overall profitable growth as we make progress towards Rule of 40. For example, we deprioritized global expansion, implemented tighter controls to improve risk loss, and introduced deliberate friction to the onboarding process that slowed actives growth some, but ultimately allowed customers to adopt banking products earlier and receive higher limits. Our ability to increase engagement in this way is evidenced by recent Cash App Card growth: monthly Cash App Card actives grew 20% year over year in December—more than 2x the growth rate of total monthly actives. We believe this strategy will enable us to build the largest network in the long run, with a highly engaged customer base using Cash App as their primary banking solution.
We thank you for your continued trust and belief in our work.

Jack Dorsey
1 Cash App is a financial services platform, not a bank. Banking services are provided by Cash App’s bank partners.
|
|
BLOCK Q4 2023 5 |
Q4’23 Highlights
|
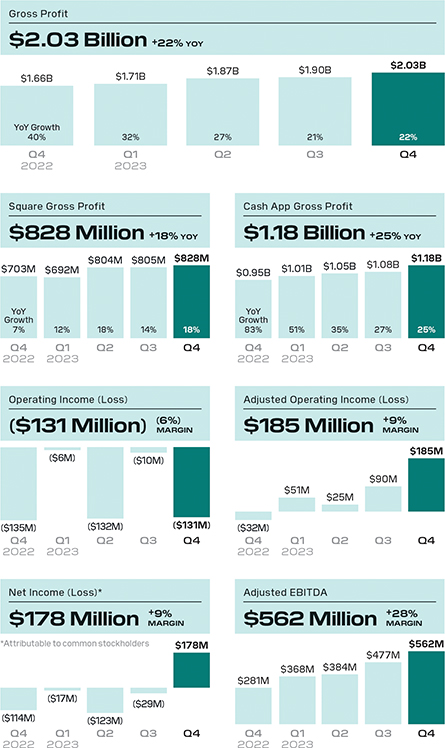
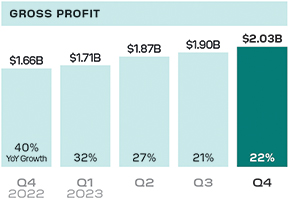
In the fourth quarter of 2023, gross profit grew 22% year over year to $2.03 billion. Square generated gross profit of $828 million, up 18% year over year, and Cash App generated gross profit of $1.18 billion, up 25% year over year.
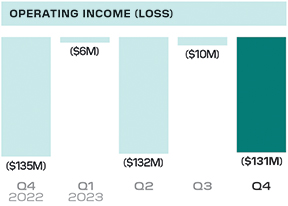
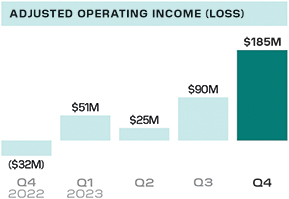
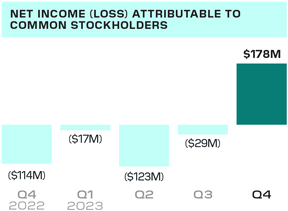
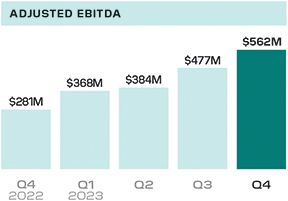
We saw improvement across all profitability measures in the fourth quarter of 2023. Operating loss was $131 million while Adjusted Operating Income was $185 million. Net income attributable to common stockholders was $178 million and Adjusted EBITDA was $562 million, up 2x year over year. |
|


Margins above are all calculated as a percent of gross profit. In the fourth quarter of 2023, total net revenue was $5.77 billion, up 24% year over year, and, excluding bitcoin revenue, revenue was $3.25 billion, up 15% year over year.
In the fourth quarter of 2023, we began reporting the financial results of our BNPL platform fully within Cash App, rather than allocating 50% of revenue and gross profit to each of Square and Cash App. The prior period segment financial information in this letter has been revised to conform to the new segment reporting. Please see the reconciliations at the end of this letter for select financial results related to this segment reorganization.
In the fourth quarter of 2023, operating expenses included a goodwill impairment charge related to TIDAL of $132 million, severance and other related expenses of $70 million, and lease impairment restructuring expenses of $34 million. Other income, net included a remeasurement gain on our bitcoin investment of $207 million upon adoption of the new accounting guidance on accounting for crypto assets. Reconciliations of non-GAAP financial measures used in this letter to their nearest GAAP equivalents are provided at the end of this letter. Please see these reconciliations for a description of certain items that affected operating income (loss) and net income (loss) in the fourth quarter of 2023.
|
|
BLOCK Q4 2023 6 |
2023 Highlights
|
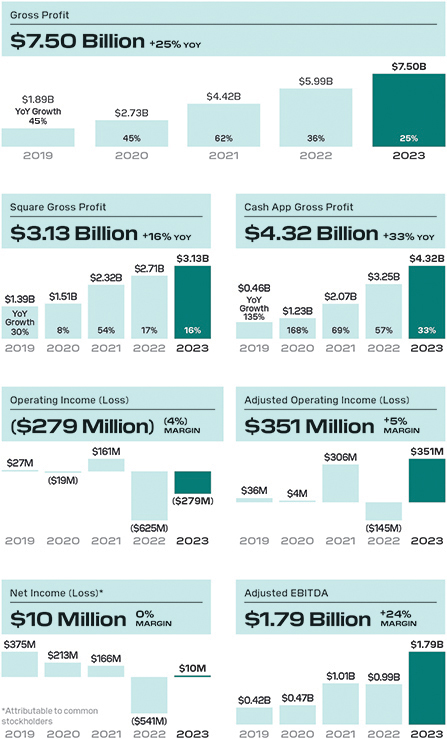
We experienced strong growth during 2023 with gross profit of $7.50 billion, up 25% year over year.
Our investment framework informed decisions throughout the year and led to a heightened focus on efficiency. Operating loss was $279 million while Adjusted Operating Income was $351 million. While operating loss margin was -4%, Adjusted Operating Income margin was 5%, and each expanded by seven points year over year. Net income was $10 million and Adjusted EBITDA was $1.79 billion, up 81% year over year.
We continue to drive toward our Rule of 40 target. For the full year 2023, we achieved Rule of 29% on a combined company basis, with gross profit growth of 24% and Adjusted Operating Income margin of 5%. |
|


Margins above are all calculated as a percent of gross profit. For the full year of 2023, total net revenue was $21.92 billion, up 25% year over year, and, excluding bitcoin revenue, revenue was $12.42 billion, up 19% year over year.
Reconciliations of non-GAAP financial measures used in this letter to their nearest GAAP equivalents are provided at the end of this letter. Please see these reconciliations for a description of certain items that affected operating income (loss) and net income (loss) in 2023.
On a combined company basis, gross profit is calculated assuming a $51 million gross profit contribution from our BNPL platform in January 2022, as if our BNPL platform had been acquired on January 1, 2022.
|
|
BLOCK Q4 2023 7 |
Square Ecosystem
Square’s ecosystem of software, hardware, and banking products takes the complexity out of commerce to save sellers time and help them grow their businesses.
Experimenting with and investing behind new marketing channels is essential to improving acquisition and understanding what is most aligned with our sellers’ preferences.
| • | In the fourth quarter, we began to leverage a Pay-as-You-Go model, offering select prospective sellers free hardware up front in exchange for a higher processing rate. Removing up-front hardware costs enables more sellers to adopt Square products and aims to minimize friction in onboarding, which can drive incremental sellers and gross profit to our ecosystem. |
| • | In January, we launched a Restaurant Essentials Bundle, which offers software products, such as Square for Restaurants, Square Online, and Payroll, at a flat price. We see an opportunity to win more upmarket food and beverage sellers, and we believe one way to do so is by cross-selling earlier in their journey and packaging products that resonate most. |
| • | We revamped our two referral programs at the beginning of 2024, both aimed at winning upmarket leads. For our seller program, we expanded the base available to make referrals, and increased the cash reward for successful conversions. For partner referrals, we are focused on increasing distribution by broadening the range of partners we work with, improving the program’s incentive structure, and establishing presence at local events. |

Our Restaurant Essentials Bundle offers access to six popular software tools at a discounted rate, taking the guesswork out of deciding which tools sellers need to run their business. With Square for Restaurants Plus, Square Online Premium, Square Team Plus, Square Shifts Plus, Square Team Communication, and Square Payroll, sellers can easily create and customize an eCommerce website, schedule shifts, manage payroll, keep their team connected, and more.
|
|
BLOCK Q4 2023 8 |
In the fourth quarter, we launched a GenAI conversational tool for our customer-facing teams to improve efficiency. This tool auto-populates answers to frequently asked seller questions for our sales and customer service teams and aggregates data in a concise, easy-to-read format. This reduces the amount of time these teams spend researching and retrieving information across databases so they can focus on serving our sellers.
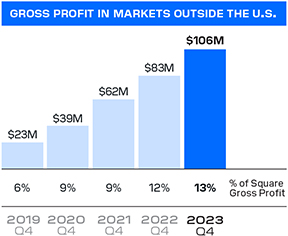
As our banking product offerings have expanded internationally, we have seen meaningful adoption, leading to strong growth. In the fourth quarter of 2023, 20% of Square gross profit in our international markets came from banking products.
| • | In January, we continued to expand our international banking presence by enabling access to capital to our sellers in Japan. We believe our offering makes it easier and faster for sellers to secure funds, as it can be difficult for these sellers to receive funding from traditional banks. Serving sellers beyond our payment and software capabilities can lead them to bring us more of their business. |
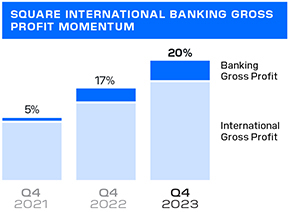
Gross profit from banking products in our international markets has grown with our expanded offerings and represented 20% of gross profit in our international markets in the fourth quarter of 2023.
|
|
BLOCK Q4 2023 9 |
A transacting active is a Cash App account that has at least one financial transaction using any product or service within Cash App during a specified period. A transacting active for a specific Cash App product has at least one financial transaction using that product during the specified period and is referred to as an active. Examples of transactions include sending or receiving a peer-to-peer payment, transferring money into or out of Cash App, making a purchase using Cash App Card, earning a dividend on a stock investment, paying back a loan, among others. Certain of these accounts may share an alias identifier with one or more other transacting active accounts. This could represent, among other things, one customer with multiple accounts or multiple customers sharing one alias identifier (for example, families).
A paycheck deposit monthly active is a Cash App account that receives $300 or more through direct deposit into Cash App during the month.
Cash App Ecosystem
Cash App is uniquely positioned to reinvent banking by seamlessly bringing together financial services, our network, and commerce for customers in one easy-to-use platform.
We are focused on winning the primary banking relationship with our customers, and, as a part of that, we are prioritizing products and features that make our offering more robust.
| • | In the fourth quarter, we launched free overdraft coverage, a feature that protects customers who overdraw on their Cash balance up to a certain amount from being charged the punitive fees that are an industry standard at traditional banks. This was a welcomed feature for customers who had considered switching their direct deposit to Cash App, and since launch, we’ve seen record direct deposit sign-ups. |
| • | Our Savings product was one of our fastest-growing products in its first year, so to build on that success we began rolling out a Savings Yield feature in January, offering 4.5% annual interest on savings balances to paycheck deposit monthly actives and 1.5% annual interest on savings balances to Cash App Card account holders. We believe this can drive customer acquisition for those looking for a robust savings product and increase inflows from existing customers. |
| • | Cash App Borrow continued to drive momentum in 2023, originating $3.6 billion in short-term loans, up 74% year over year, while maintaining historical loss rates at less than 3% on average. |
We rolled out Savings Yield for our Cash App Savings product in January, building on the success we’ve seen with our Savings product throughout 2023.
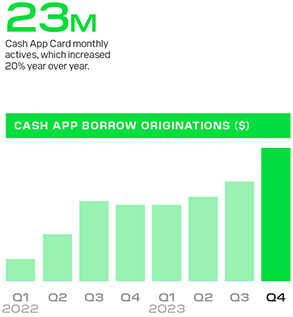
We originated $3.6 billion in short-term loans in 2023 while maintaining loss rates at less than 3% on average.
|
|
BLOCK Q4 2023 10 |
Our BNPL platform’s Gross Merchandise Value or “GMV” is a measure of the total order value processed on our BNPL platform.
With Commerce, we have the ability to make our customers’ money go further by allowing them to have more control over the way they pay.
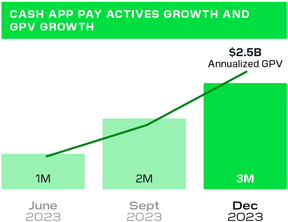
| • | Cash App Pay grew significantly during the year, ending December with 3 million monthly actives and $2.5 billion in annualized GPV. |
| • | We experienced strength from our BNPL Platform in the fourth quarter of 2023, with $8.6 billion in GMV up 25% year over year, driven by our Pay-in-Four offering as well as Single Use Payments (SUP). SUP allows customers across the U.S., U.K., and Australia to shop via the Afterpay app at merchants that do not have a direct relationship with Afterpay, and pay using BNPL. This enables us to reach highly engaged customers through personalized merchant recommendations in the app, while also offering a flexible payment option. |
|
|
BLOCK Q4 2023 11 |
Reconciliations of non-GAAP metrics used in this letter to their nearest GAAP equivalents are provided at the end of this letter.
Bitcoin gross profit was $66 million in the fourth quarter of 2023. The total sale amount of bitcoin sold to customers, which we recognize as bitcoin revenue, was $2.52 billion. Bitcoin gross profit was 3% of bitcoin revenue.
GPV includes Square GPV and Cash App Business GPV. Square GPV is defined as the total dollar amount of all card payments processed by sellers using Square, net of refunds, and ACH transfers. Cash App Business GPV comprises Cash App activity related to peer-to-peer transactions received by business accounts and peer-to-peer payments sent from a credit card. GPV does not include transactions from our BNPL platform because GPV is related only to transactionbased revenue and not to subscription and servicesbased revenue. Revenue from our BNPL platform includes fees generated from consumer receivables, late fees, and certain affiliate and advertising fees from the platform.
Financial
Discussion
REVENUE AND GROSS PROFIT
Total net revenue was $5.77 billion in the fourth quarter of 2023, up 24% year over year. Excluding bitcoin revenue, revenue in the fourth quarter was $3.25 billion, up 15% year over year. For the full year of 2023, total net revenue was $21.92 billion, up 25% year over year. Excluding bitcoin revenue, revenue for the full year was $12.42 billion, up 19% year over year.
Gross profit was $2.03 billion in the fourth quarter of 2023, up 22% year over year. For the full year of 2023, gross profit was $7.50 billion, up 25% year over year.
Transaction-based revenue was $1.60 billion in the fourth quarter of 2023, up 8% year over year, and transaction-based gross profit was $650 million, up 7% year over year. We processed $57.49 billion in GPV in the fourth quarter of 2023, up 8% year over year. Transaction-based gross profit as a percentage of GPV was 1.13% in the fourth quarter, down 1 basis point year over year and up 1 basis point quarter over quarter.
For the full year of 2023, transaction-based revenue was $6.32 billion, up 11% year over year, and transaction-based gross profit was $2.61 billion, up 12% year over year. We processed $227.70 billion in GPV for the full year of 2023, up 12% year over year. Transaction-based gross profit as a percentage of GPV was 1.15%, flat year over year.
Subscription and services-based revenue was $1.62 billion in the fourth quarter of 2023, up 24% year over year, and subscription and services-based gross profit was $1.35 billion, up 27% year over year. For the full year of 2023, subscription and services-based revenue was $5.94 billion, up 31% year over year, and subscription and services-based gross profit was $4.87 billion, up 32% year over year.
|
|
BLOCK Q4 2023 12 |
In the fourth quarter and for the full year of 2023, gross profit included $18 million and $73 million, respectively, of amortization of acquired technology assets, the majority of which was from the acquisition of our BNPL platform.
In the fourth quarter of 2023, we began reporting the financial results of the BNPL platform fully within Cash App, rather than allocating 50% of revenue and gross profit to each of Square and Cash App. The prior period segment financial information in this letter has been revised to conform to the new segment reporting. Please see the reconciliations at the end of this letter for select financial results related to this segment reorganization.
|
|
BLOCK Q4 2023 13 |
SQUARE ECOSYSTEM REVENUE AND GROSS PROFIT
In the fourth quarter of 2023, Square generated $1.81 billion of revenue and $828 million of gross profit, up 12% and 18% year over year, respectively. For the full year of 2023, Square generated $7.03 billion of revenue and $3.13 billion of gross profit, up 12% and 16% year over year, respectively.
We target positive gross profit retention to measure our ability to support our sellers and help them grow over time. In 2023, Square cohorts in aggregate achieved positive gross profit retention when compared to 2022, driven by strength from our software and banking products. Square cohorts onboarded prior to 2022 have achieved or are pacing toward an estimated return on investment of approximately 3x or greater over four years. Our 2022 and 2023 cohorts are pacing toward an estimated payback of approximately six to seven quarters.
Software and banking solutions are a key part of our strategic priority to help sellers save time and grow their businesses. Software and integrated payments gross profit grew 17% year over year in the fourth quarter of 2023, while gross profit from our banking products, which primarily include Square Loans, Instant Transfer, and Square Debit Card, grew 28% year over year. For the full year of 2023, gross profit from software and integrated payments and banking products each grew 18% year over year.
Square generated $1.49 billion of transaction-based revenue in the fourth quarter of 2023, up 10% year over year. During the quarter, Square saw a higher percentage of GPV with custom pricing on a year-over-year basis, as we intend to drive incremental growth with larger sellers through our go-to-market and product strategies. For the full year of 2023, Square generated $5.82 billion of transaction-based revenue, up 11% year over year.
Square gross profit retention rate is calculated as the year-over-year gross profit growth of all existing quarterly seller cohorts, averaged over the last four quarters (excluding gross profit from hardware, Caviar, PPP loans, and Weebly prior to the acquisition). A Square cohort represents new sellers onboarded to Square during a given period.
For Square, return on investment, or payback, measures the effectiveness of sales and marketing spend. Return on investment (ROI) is calculated by dividing the cumulative cohort gross profit of each cohort of sellers by Square sales and marketing expenses for the applicable time period, excluding historical Caviar sales and marketing expenses and the portion of sales and marketing expenses from the legacy Weebly business.
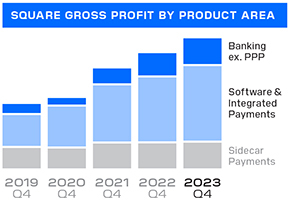
PERCENT OF TOTAL SQUARE GROSS PROFIT EX PPP
|
Q4’19 |
Q4’20 |
Q4’21 |
Q4’22 |
Q4’23 | ||||||
| 16% | 10% | 16% | 21% | 23% | Banking ex. PPP | |||||
| 54% | 62% | 62% | 60% | 59% | Software & Integrated Payments | |||||
| 36% | 31% | 27% | 24% | 20% | Sidecar Payments | |||||
Hardware gross profit losses are not presented for any period. Percentages are of Square gross profit excluding contributions from PPP loan forgiveness for each period.
|
|
BLOCK Q4 2023 14 |
Services verticals include professional services, beauty and personal care, health care and fitness, and home and repair.
In the fourth quarter of 2023, Square GPV was $53.54 billion, up 10% year over year on both a reported and constant currency basis. For the full year of 2023, Square GPV was $209.61 billion, up 12% year over year and 13% year over year on a constant currency basis. We observed the following trends in Square GPV during the fourth quarter of 2023:
| • | Acquisition and Retention: We achieved positive growth in acquisition of new sellers. Retention of existing sellers is a function of churn and GPV per seller. Churn of existing sellers remained consistent with prior periods. In the U.S., growth in GPV per seller continued to be affected by consumer demand as year-over-year growth in spend per card and in the number of unique cards decelerated in the fourth quarter of 2023 compared to the fourth quarter of 2022. |
| • | Geographies: Square GPV in our U.S. market grew 7% year over year, and in our international markets grew 26% year over year on both a reported and constant currency basis. |
| • | Verticals: On a year-over-year basis, food and drink GPV was up 15%, GPV from services verticals was up 8%, and retail GPV was up 4%. Gross profit from our vertical point-of-sale solutions, including Square Appointments, Square for Restaurants, and Square for Retail, was up 27% year over year. |
| • | Channels: Card-present GPV was up 13% year over year while card-not-present GPV was up 4% year over year. Within card-not-present volumes, GPV growth from online channels was up 11% year over year and was partially offset by a year-over-year decline in GPV from manual keyed-entry transactions. |
In the fourth quarter of 2023, Square generated $293 million of subscription and services-based revenue, up 24% year over year. Square Loans facilitated approximately 137,000 loans totaling $1.40 billion in originations, up 22% year over year. For the full year of 2023, Square generated $1.06 billion of subscription and services-based revenue, up 18% year over year. Square Loans facilitated approximately 489,000 loans totaling $4.78 billion in originations, up 18% year over year.
Hardware revenue in the fourth quarter of 2023 was $32 million, down 9% year over year, and gross loss was $24 million as we use hardware as an acquisition tool. For the full year of 2023, hardware revenue was $157 million, down 4% year over year, and gross loss was $110 million.
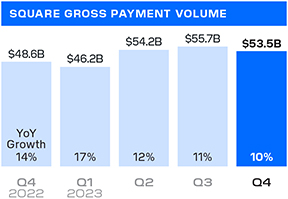
Square GPV is defined as the total dollar amount of all card payments processed by sellers using Square, net of refunds, and ACH transfers.
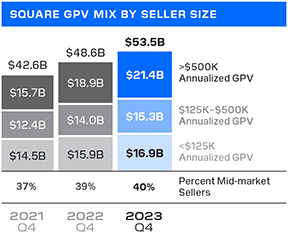
We determine seller size based on annualized GPV during the applicable quarter. A mid-market seller generates more than $500,000 in annualized GPV.
|
|
BLOCK Q4 2023 15 |
CASH APP ECOSYSTEM REVENUE AND GROSS PROFIT
In the fourth quarter of 2023, Cash App generated $3.91 billion of revenue and $1.18 billion of gross profit, up 31% and 25% year over year, respectively. Excluding bitcoin revenue, Cash App revenue was $1.39 billion, up 20% year over year. For the full year of 2023, Cash App generated $14.68 billion of revenue and $4.32 billion of gross profit, both up 33% year over year. Excluding bitcoin revenue, Cash App revenue was $5.18 billion, up 32% year over year.
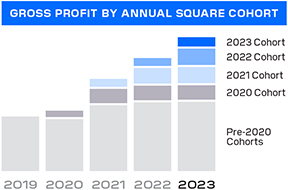
Our Cash App ecosystem has achieved positive annual gross profit retention in aggregate and for each annual cohort, demonstrating that existing customers have remained on the platform and increased their engagement with Cash App over time. We continued to efficiently grow our customer base and generate strong returns on customer acquisition for Cash App. Our historical Cash App cohorts through 2021 have achieved a return on investment of 6x or greater over three years, and our 2022 and 2023 Cash App cohorts are at or pacing toward an estimated payback of less than one year. In 2023, we onboarded our largest annual cohort on a gross profit basis.
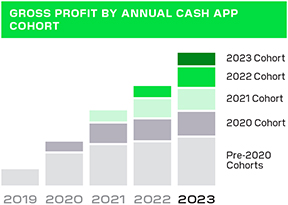
Cash App annual gross profit retention is calculated as the year-over-year gross profit growth of all existing quarterly Cash App cohorts, averaged over the last four quarters, and excluding BNPL platform gross profit and contra revenue. A Cash App transacting active’s cohort is determined based on the date they first became a transacting active on the platform. For example, retention for our 2019 cohort is the average annual gross profit growth from transacting actives who completed a first transaction in 2019. Each of our annual Cash App cohorts since 2013 and the pre-2019 cohort have exhibited positive overall gross profit retention on aggregate from the date of their first transaction through December 31, 2023.
For Cash App, return on investment, or payback, is calculated by taking a given Cash App monthly cohort’s cumulative variable profit and dividing by acquisition marketing spend for the initial month when onboarded. Cohort variable profit is calculated as gross profit across Cash App transaction-based profit, Cash App Card gross profit, Instant Deposit gross profit for Cash App, bitcoin gross profit, less certain variable sales and marketing expenses, including peer-to-peer processing and risk loss. Cohort variable profit includes estimates for certain risk loss measures. Cohort variable profit does not include profit from our BNPL platform.
|
|
BLOCK Q4 2023 16 |
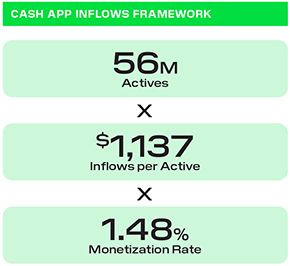
Inflows per transacting active refers to total inflows in the quarter divided by monthly actives for the last month of the quarter. Inflows refers to funds entering the Cash App ecosystem. Inflows does not include the movement of funds when funds remain in the Cash App ecosystem or when funds leave the Cash App ecosystem, or inflows related to the Afterpay or Verse apps. Inflows from Verse actives were not material to overall inflows.
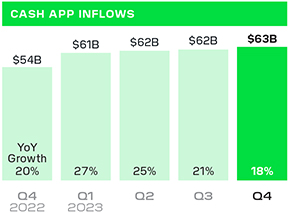
In December, Cash App had 56 million monthly transacting actives, up 9% year over year. Inflows per transacting active in the fourth quarter were $1,137, up 8% year over year and relatively stable quarter over quarter. Overall inflows were $63 billion in the fourth quarter, up 18% year over year and 2% quarter over quarter, and monetization rate was 1.48%, up 9 basis points year over year and 5 basis points quarter over quarter. Overall inflows for the full year of 2023 were $248 billion, up 22% year over year.
In the fourth quarter of 2023, Cash App Business GPV was $3.95 billion, down 13% year over year. Cash App Business GPV comprises Cash App activity related to peer-to-peer transactions received by business accounts and peer-to-peer payments sent from a credit card. Cash App generated $109 million of transaction-based revenue during the fourth quarter of 2023, down 11% year over year. For the full year of 2023, Cash App Business GPV was $18.09 billion, up 6% year over year. Cash App generated $498 million of transaction-based revenue during the full year of 2023, up 7% year over year.
We calculate monetization rate by dividing Cash App gross profit, excluding contributions from our BNPL platform, by Cash App inflows.
|
|
BLOCK Q4 2023 17 |
Bitcoin revenue is the total sale amount of bitcoin sold to customers. Bitcoin costs are the total amount we pay to purchase bitcoin in order to facilitate customers’ access to bitcoin. In future quarters, bitcoin revenue and gross profit may fluctuate as a result of changes in customer demand or the market price of bitcoin.
Cash App generated $1.28 billion of subscription and services-based revenue during the fourth quarter of 2023, up 24% year over year. The increase was driven by growth in Cash App Card, our BNPL platform, Instant Deposit, and other financial services products, as well as interest earned on customer funds. For the full year of 2023, Cash App generated $4.69 billion of subscription and services-based revenue, up 36% year over year.
Cash App generated $66 million of bitcoin gross profit in the fourth quarter of 2023, up 90% year over year. The total sale amount of bitcoin sold to customers, which we recognize as bitcoin revenue, was $2.52 billion, up 37% year over year. The year-over-year increase in bitcoin revenue and gross profit was driven by an increase in the average market price of bitcoin as well as a benefit from the price appreciation of our bitcoin inventory during the quarter. For the full year of 2023, Cash App generated $205 million of bitcoin gross profit and $9.50 billion of bitcoin revenue, up 31% and 34% year over year, respectively.
In the fourth quarter of 2023, our BNPL platform contributed $325 million of revenue and $242 million of gross profit to Cash App, compared to $264 million and $196 million in the fourth quarter of 2022, respectively. For the full year of 2023, our BNPL platform contributed $1.04 billion of revenue and $755 million of gross profit to Cash App, compared to $811 million and $588 million for the full year of 2022, respectively.
| PERCENT OF TOTAL CASH APP GROSS PROFIT | ||||||||||
|
2019 |
2020 |
2021 |
2022 |
2023 | ||||||
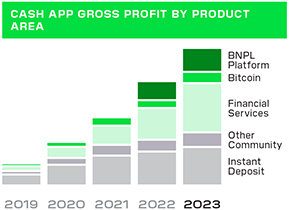
| 0% | 0% | 0% | 18% | 17% | BNPL Platform | |||||
| 2% | 8% | 10% | 6% | 7% | Bitcoin | |||||
| 21% | 25% | 29% | 32% | 38% | Financial Services | |||||
| 10% | 13% | 14% | 10% | 8% | Other Community | |||||
| 67% | 53% | 46% | 34% | 29% | Instant Deposit | |||||
As presented here, Bitcoin equals gross profit from bitcoin buying and selling and bitcoin withdrawal fees, as well as brokerage gross losses. Financial Services equals gross profit from transaction fees on Cash App Card, interest on customer funds, cash deposits, Cash App Card Studio, ATM fees, Cash App Borrow, and Cash App Pay. Other Community equals gross profit from business accounts and P2P transactions funded with a credit card.
|
|
BLOCK Q4 2023 18 |
CORPORATE AND OTHER REVENUE AND GROSS PROFIT
Corporate and Other generated $50 million in revenue and $14 million in gross profit in the fourth quarter of 2023. For the full year of 2023, Corporate and Other generated $201 million in revenue and $53 million in gross profit. Corporate and Other comprised areas outside Square and Cash App, which were primarily TIDAL and intersegment eliminations between Cash App and Square in 2023.
OPERATING EXPENSES
We implemented a number of initiatives during 2023 targeted at driving operating efficiency across our business, which had a modest benefit to 2023 results, and we expect to contribute more meaningfully to savings in 2024 and beyond. In November 2023, we announced we would implement an absolute cap of 12,000 on the number of employees we have at our company. We plan to operate below this cap through a combination of performance management, centralizing teams and functions to reduce duplication, and prioritization of our scope. We expect to keep this cap in place until we believe the growth of the business has meaningfully outpaced the growth of our company. We have also explored opportunities to reduce our corporate overhead spend, which involved scaling back on real estate facilities and curbing discretionary spending in 2023.
In the fourth quarter of 2023, operating expenses were $2.16 billion on a GAAP basis and $1.48 billion on a non-GAAP basis, up 20% and 6% year over year, respectively. In the fourth quarter, we recognized a goodwill impairment charge related to TIDAL of $132 million, severance and other related expenses of $70 million, and lease impairment restructuring expenses of $34 million.
For the full year of 2023, operating expenses were $7.78 billion on a GAAP basis and $5.79 billion on a non-GAAP basis, up 18% and 14% year over year, respectively.
Product development expenses were $685 million on a GAAP basis and $411 million on a non-GAAP basis in the fourth quarter of 2023, up 13% and 8% year over year, respectively. The increase was driven primarily by personnel costs related to our engineering team.
|
|
BLOCK Q4 2023 19 |
We discuss Cash App marketing expenses because a large portion is generated by our peer-to-peer service, which we offer free to our Cash App customers, and we consider it to be a marketing tool to encourage the use of Cash App. In the fourth quarter of 2023, we began reporting BNPL platform marketing expenses within Cash App. The year-over-year growth rate for Cash App marketing expenses presented in this letter reflect the new reporting classification for all historical periods.
In the fourth quarter of 2023, we reclassified interest expense on our warehouse funding facility for the full year of 2023 from “Product development” expenses to “General and administrative” expenses.
As bitcoin is considered an indefinite-lived intangible asset, and upon adoption of Accounting Standards Update No. 2023-08, Accounting for and Disclosure of Crypto Assets, we remeasure our bitcoin at fair value at each reporting date with changes recognized in net income.
Sales and marketing expenses were $506 million on a GAAP basis and $470 million on a non-GAAP basis in the fourth quarter of 2023, down 6% and 7% year over year, respectively.
| • | Cash App marketing expenses were down 11% year over year, driven by decreases in advertising costs and peer-to-peer transaction losses, and partially offset by increases in peer-to-peer processing costs and card issuance costs. |
| • | Other sales and marketing expenses were up 3% year over year. Other sales and marketing expenses primarily include expenses related to Square and TIDAL. |
General and administrative expenses were $746 million on a GAAP basis and $415 million on a non-GAAP basis in the fourth quarter of 2023, up 65% and 21% year over year, respectively. The increase was driven by a reclassification of certain interest expenses, and, on a GAAP basis, a goodwill impairment charge related to TIDAL, lease impairment restructuring expenses, and severance and other related expenses.
Transaction, loan, and consumer receivables losses were $176 million in the fourth quarter of 2023, up 13% year over year. The increase was driven primarily by growth in BNPL consumer receivables and Cash App Borrow volumes. In the fourth quarter, loss rates for Square GPV, Square Loans, and Cash App Borrow remained consistent with historical ranges, and losses on BNPL consumer receivables were 1.00% of GMV, also consistent with historical ranges. We will continue to monitor trends closely.
In the fourth quarter and for the full year of 2023, operating expenses included $43 million and $174 million, respectively, of amortization of customer and other acquired intangible assets, the majority of which was from the acquisition of our BNPL platform.
In the fourth quarter of 2020 and first quarter of 2021, we invested $50 million and $170 million, respectively, in bitcoin. As of December 31, 2023, we held approximately 8,038 bitcoins for investment purposes with a fair value of $340 million based on observable market prices, which is included within “Other non-current assets” on the consolidated balance sheets. In the fourth quarter of 2023, other income, net included a remeasurement gain on our bitcoin investment of $207 million for the year ended December 31, 2023.
|
|
BLOCK Q4 2023 20 |
EARNINGS
In the fourth quarter of 2023, operating loss was $131 million, compared to $135 million in the fourth quarter of 2022. Adjusted Operating Income was $185 million, compared to Adjusted Operating Loss of $32 million in the fourth quarter of 2022.
For the full year of 2023, operating loss was $279 million, compared to $625 million in 2022. Adjusted Operating Income was $351 million, compared to Adjusted Operating Loss of $145 million in 2022.
For both the fourth quarter and full year of 2023, the year-over-year improvement in operating loss and Adjusted Operating Income was driven by gross profit growth across our Cash App and Square ecosystems.
Please see the reconciliations at the end of this letter for a description of certain items that affected operating income (loss) in the fourth quarter of 2023.
|
|
BLOCK Q4 2023 21 |
Net income attributable to common stockholders was $178 million in the fourth quarter of 2023. Net income per share attributable to common stockholders was $0.29 on a basic and $0.28 on a diluted basis in the fourth quarter of 2023, based on 615 million weighted-average basic and 629 million weighted-average diluted shares outstanding during the fourth quarter of 2023, representing a $0.48 and $0.47 increase year over year, respectively.
For the full year of 2023, net income attributable to common stockholders was $10 million. Net income per share was $0.02 on a basic and diluted basis, based on 609 million weighted-average basic and 614 million weighted-average diluted shares outstanding during the full year of 2023.
Adjusted EBITDA was $562 million in the fourth quarter of 2023, compared to $281 million in the fourth quarter of 2022. For the full year of 2023, Adjusted EBITDA was $1.79 billion, compared to $991 million in 2022.
For both the fourth quarter and full year of 2023, the year-over-year improvement in net income attributable to common stockholders and Adjusted EBITDA was driven by gross profit growth across our Cash App and Square ecosystems and, on a net income basis, a gain from the remeasurement of our bitcoin investment.
In the fourth quarter of 2023, Adjusted Net Income Per Share (Adjusted EPS) was $0.45 on a diluted basis based on 631 million weighted-average diluted shares outstanding during the fourth quarter of 2023, representing a $0.23 increase year over year. For the full year of 2023, Adjusted EPS was $1.80 based on 628 million weighted-average diluted shares, compared to $1.00 for the full year of 2022.
Please see the reconciliations at the end of this letter for a description of certain items that affected net income (loss) in the fourth quarter of 2023.
|
|
BLOCK Q4 2023 22 |
Adjusted Free Cash Flow is a non-GAAP financial measure that represents our net cash provided by operating activities adjusted for changes in settlements receivable, changes in customers payable, changes in settlements payable, the purchase of property and equipment, payments for originations of consumer receivables, proceeds from principal repayments and sales of consumer receivables, and sales, principal payments, and forgiveness of PPP loans. We present Adjusted Free Cash Flow because we use it to understand the cash generated by our business and make strategic decisions related to our balance sheet, and because we are focused on growing our Adjusted Free Cash Flow generation over time. It is not intended to represent amounts available for discretionary purposes.
BALANCE SHEET/CASH FLOW
We ended the fourth quarter of 2023 with $7.7 billion in available liquidity, with $6.9 billion in cash, cash equivalents, restricted cash, and investments in marketable debt securities, as well as $775 million available to be withdrawn from our revolving credit facility, subject to compliance with our covenants. Additionally, we had $99 million available to be withdrawn under our warehouse funding facilities, to support funding of growth in our consumer receivables related to our BNPL platform.
In October 2023, our board of directors authorized the repurchase of up to $1 billion of our Class A common stock. In 2023, we repurchased 2.5 million shares of our Class A common stock for an aggregate amount of $157 million. As of December 31, 2023, $843 million remained available and authorized for repurchases.
In the fourth quarter of 2023, Adjusted EBITDA contributed positively to our overall liquidity.
Net cash provided by operating activities was $101 million for the twelve months ended December 31, 2023, compared to $176 million for the twelve months ended December 31, 2022. Adjusted Free Cash Flow was $515 million for the twelve months ended December 31, 2023, compared to negative $346 million for the twelve months ended December 31, 2022.
Adjusted Free Cash Flow has historically been lower in the fourth quarter due to the funding of seasonally higher BNPL consumer receivables originations, which are historically collected in the following quarters. Adjusted Free Cash Flow for the twelve months ended December 31, 2023 was negatively impacted by a $350 million deposit held by a processor to meet requirements related to processing volumes under an arrangement that was executed in the fourth quarter of 2023.
|
|
BLOCK Q4 2023 23 |
Guidance
| Q1 2024 OUTLOOK
|
Q1 2024
| |||
| Gross Profit |
$2.00B to $2.02B | |||
| YoY Growth (midpoint) |
17% | |||
| Adjusted EBITDA1 |
$570M to $590M | |||
| % Margin (midpoint) |
29% | |||
| Adjusted Operating Income1 |
$225M to $245M | |||
| % Margin (midpoint)
|
12%
| |||
In the first quarter of 2024, we expect our share-based compensation expense to decrease slightly quarter over quarter on a dollar basis.
2024 OUTLOOK
We remain focused on achieving Rule of 40 in 2026, which is gross profit growth plus Adjusted Operating Income margin. Our primary objective in 2024 is to deliver an improvement from the Rule of 29 we achieved in 2023, on a combined company basis. To achieve this, we have put forward an initial guidance that we intend to exceed, by at least one point of outperformance during the year, either on gross profit growth or Adjusted Operating Income margin, or both. Our initial 2024 guidance calls for gross profit of at least $8.65 billion, up at least 15% year over year. For Adjusted Operating Income we expect at least $1.15 billion, for a 13% margin. For Adjusted EBITDA we expect at least $2.63 billion, for a 30% margin. This outlook does not assume any additional macroeconomic deterioration, which could impact results.
On a combined company basis, gross profit is calculated assuming a $51 million gross profit contribution from our BNPL platform in January 2022, as if our BNPL platform had been acquired on January 1, 2022.
On a GAAP basis, we expect to recognize approximately $61 million in expenses related to amortization of intangible assets in each quarter of 2024, based on the intangible assets as of December 31, 2023. This quarterly expense includes approximately $18 million recognized in cost of sales and approximately $43 million in operating expenses. These amounts may be affected by fluctuations in foreign exchange rates in future periods.
1. We have not provided the forward-looking GAAP equivalents for certain forward-looking non-GAAP metrics, including Adjusted EBITDA, and Adjusted Operating Income (Loss), or GAAP reconciliations of any of the aforementioned, as a result of the uncertainty regarding, and the potential variability of, reconciling items such as share-based compensation expense. Accordingly, the Company has relied upon the exception in item 10(e)(1)(i)(B) of Regulation S-K to exclude such reconciliations, as the reconciliations of these non-GAAP guidance metrics to their corresponding GAAP equivalents are not available without unreasonable effort. However, it is important to note that material changes to reconciling items could have a significant effect on future GAAP results. We have provided reconciliations of other historical GAAP to non-GAAP metrics in tables at the end of this letter.
Adjusted Operating Income margin is defined by dividing Adjusted Operating Income over a given period by gross profit over the same period.
|
|
BLOCK Q4 2023 24 |
MEDIA CONTACT
press@block.xyz
INVESTOR RELATIONS CONTACT
ir@block.xyz
Earnings Webcast
Block (NYSE:SQ) will host a conference call and earnings webcast at 2:00 p.m. Pacific time/5:00 p.m. Eastern time, February 22, to discuss these financial results. To register to participate in the conference call, or to listen to the live audio webcast, please visit the Events & Presentations section of Block’s Investor Relations website at investors.block.xyz. A replay will be available on the same website following the call.
We will release financial results for the first quarter of 2024 on May 2, 2024, after the market closes, and will also host a conference call and earnings webcast at 2:00 p.m. Pacific time/5:00 p.m. Eastern time on the same day to discuss those financial results.
|
|
| |
| Jack Dorsey | Amrita Ahuja |

|
|
BLOCK Q4 2023 25 |
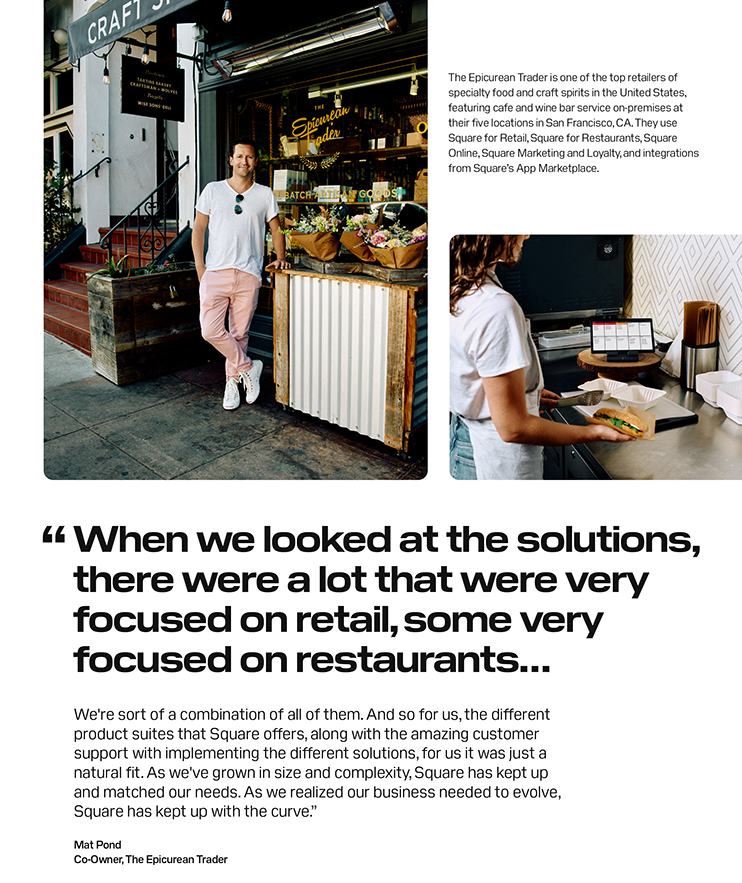
The Epicurean Trader is one of the top retailers of specialty food and craft spirits in the United States, featuring cafe and wine bar service on-premises at their five locations in San Francisco, CA. They use Square for Retail, Square for Restaurants, Square Online, Square Marketing and Loyalty, and integrations from Square’s App Marketplace. “When we looked at the solutions, there were a lot that were very focused on retail, some very focused on restaurants… We’re sort of a combination of all of them. And so for us, the different product suites that Square offers, along with the amazing customer support with implementing the different solutions, for us it was just a natural fit. As we’ve grown in size and complexity, Square has kept up and matched our needs. As we realized our business needed to evolve, Square has kept up with the curve.” Mat Pond Co-Owner, The Epicurean Trader
|
|
BLOCK Q4 2023 26 |
Love that cash app sound when the coins hit @_iRanOutOfIdeas Via X Cash app do a purple or blue card next @justchillyay Via TikTok This is really cool. @CashApp is adding free overdraft coverage for customers. This would’ve saved me a small fortune when I was a teenager learning how to manage my money. I remember getting nailed for a $27 overdraft fee on a $5 sandwich. Well done Cash App team! @ryanfinlay Via Twitter I do round ups and it came in handy for Christmas. @susanheflin08 Via Instagram Just ordered mine I literally have pink hair I needed the pink card @basswitchmars Via Instagram
|
|
BLOCK Q4 2023 27 |
SAFE HARBOR STATEMENT
This letter contains “forward-looking statements” within the meaning of the Safe Harbor provisions of the U.S. Private Securities Litigation Reform Act of 1995. All statements other than statements of historical fact could be deemed forward-looking, including, but not limited to, statements regarding the future performance of Block, Inc. and its consolidated subsidiaries (the Company); the Company’s strategies, including expected impact of such strategies on our customers, actives, and sellers as well as our business and financial performance, expected financial results, guidance, and general business outlook for current and future periods; the Company’s integration of Afterpay, and its impacts on the Company’s business and financial results; future profitability and growth in the Company’s businesses and products and the Company’s ability to drive such profitability and growth; the Company’s expectations regarding scale, economics, and the demand for or benefits from its products, product features, and services; the Company’s product development plans; the ability of the Company’s products to attract and retain customers, particularly in new or different markets or demographics; trends in the Company’s markets and the continuation of such trends; the Company’s expectations and intentions regarding future expenses, including future transaction and loan losses and the Company’s estimated reserves for such losses; the Company’s bitcoin investments and strategy as well as the potential financial impact and volatility; and management’s statements related to business strategy, plans, investments, opportunities, and objectives for future operations. In some cases, forward-looking statements can be identified by terms such as “may,” “will,” “appears,” “should,” “expects,” “plans,” “anticipates,” “could,” “intends,” “target,” “projects,” “contemplates,” “believes,” “estimates,” “predicts,” “potential,” or “continue,” or the negative of these words or other similar terms or expressions that concern our expectations, strategy, plans, or intentions.
Such statements are subject to a number of known and unknown risks, uncertainties, assumptions, and other factors that may cause the Company’s actual results, performance, or achievements to differ materially from results expressed or implied in this letter. Investors are cautioned not to place undue reliance on these statements, and reported results should not be considered as an indication of future performance.
Risks that contribute to the uncertain nature of the forward-looking statements include, among others, a continued or prolonged economic downturn in the United States and in other countries around the world; the Company’s investments in its business and ability to maintain profitability; the Company’s efforts to expand its product portfolio and market reach; the Company’s ability to develop products and services to address the rapidly evolving market for payments and financial services; the Company’s ability to deal with the substantial and increasingly intense competition in its industry; acquisitions, strategic investments, entries into new businesses, joint ventures, divestitures, and other transactions that the Company may undertake; the integration of Afterpay; the Company’s ability to ensure the integration of its services with a variety of operating systems and the interoperability of its technology with that of third parties; the Company’s ability to retain existing customers, attract new customers, and increase sales to all customers; the Company’s dependence on payment card networks and acquiring processors; the effect of extensive regulation and oversight related to the Company’s business in a variety of areas; risks related to the banking ecosystem, including through our bank partnerships, and FDIC and other regulatory obligations; the effect of management changes and business initiatives; the liabilities and loss potential associated with new products, product features, and services; litigation, including intellectual property claims, government investigations or inquiries, and regulatory matters or disputes; adoption of the Company’s products and services in international markets; changes in political, business, and economic conditions; as well as other risks listed or described from time to time in the Company’s filings with the Securities and Exchange Commission (the SEC), including the Company’s Annual Report on Form 10-K for the fiscal year ended December 31, 2022, and its Quarterly Reports on Form 10-Q for the quarters ended March 31, 2023; June 30, 2023; and November 30, 2023, which are on file with the SEC and available on the Investor Relations page of the Company’s website. Additional information will also be set forth in the Company’s Annual Report on Form 10-K for the year ended December 31, 2023. All forward-looking statements represent management’s current expectations and predictions regarding trends affecting the Company’s business and industry and are based on information and estimates available to the Company at the time of this letter and are not guarantees of future performance. Except as required by law, the Company assumes no obligation to update any of the statements in this letter.
|
|
BLOCK Q4 2023 28 |
KEY OPERATING METRICS AND
NON-GAAP FINANCIAL MEASURES
To supplement our financial information presented in accordance with generally accepted accounting principles in the United States (GAAP), from period to period, we consider and present certain operating and financial measures that we consider key metrics or are not prepared in accordance with GAAP, including Gross Payment Volume (GPV), Adjusted EBITDA, Adjusted EBITDA margin, Adjusted Net Income (Loss), Diluted Adjusted Net Income (Loss) Per Share (Adjusted EPS), Adjusted Operating Income (Loss), Adjusted Operating Income (Loss) margin, Adjusted Free Cash Flow, constant currency, and non-GAAP operating expenses as well as other measures defined in this letter such as measures excluding bitcoin revenue, and measures excluding PPP loan forgiveness gross profit. We believe these metrics and measures are useful to facilitate period-to-period comparisons of our business and to facilitate comparisons of our performance to that of other payments solution providers.
We define GPV as the total dollar amount of all card payments processed by sellers using Square, net of refunds, and ACH transfers. Additionally, GPV includes Cash App Business GPV, which comprises Cash App activity related to peer-to-peer transactions received by business accounts, and peer-to-peer payments sent from a credit card. GPV does not include transactions from our BNPL platform.
Adjusted EBITDA, Adjusted EBITDA margin, Adjusted Net Income (Loss), and Diluted Adjusted Net Income (Loss) Per Share (Adjusted EPS) are non-GAAP financial measures that represent our net income (loss) and net income (loss) per share, adjusted to eliminate the effect of share-based compensation expenses; amortization of intangible assets; gain or loss on revaluation of equity investments; bitcoin impairment losses; amortization of debt discount and issuance costs; and the gain or loss on the disposal of property and equipment, as applicable. Adjusted Operating Income (Loss) is a non-GAAP financial measure that represents our operating income (loss), adjusted to eliminate the effect of amortization of acquired technology assets; acquisition-related and integration cost,; restructuring and other charges; goodwill impairment; bitcoin impairment losses; amortization of customer and other acquired intangible assets; and acquisition-related share-based acceleration costs. We also exclude from these measures certain acquisition-related and integration costs associated with business combinations, and various other costs that are not reflective of our core operating performance. We exclude amortization of intangible assets arising from business combinations because the amount of such expenses in any specific period may not directly correlate to the underlying performance of our ongoing business operations. Acquisition-related costs include amounts paid to redeem acquirees’ unvested stock-based compensation awards, and legal, accounting, and due diligence costs. Integration costs include advisory and other professional services or consulting fees necessary to integrate acquired businesses. Other costs that are not reflective of our core business operating expenses may include contingent losses, impairment charges, and certain litigation and regulatory charges. We also add back the impact of the acquired deferred revenue and deferred cost adjustment, which was written down to fair value in purchase accounting. Additionally, for purposes of calculating diluted Adjusted EPS, we add back cash interest expense on convertible senior notes, as if converted at the beginning of the period, if the impact is dilutive. In addition to the items above, Adjusted EBITDA is a non-GAAP financial measure that also excludes depreciation and amortization, interest income and expense, other income and expense, and provision or benefit from income taxes, as applicable. Adjusted Operating Income (Loss) margin is calculated as Adjusted Operating Income (Loss) divided by gross profit.
Adjusted EBITDA margin is calculated as Adjusted EBITDA divided by gross profit. To calculate the diluted Adjusted EPS, we adjust the weighted-average number of shares of common stock outstanding for the dilutive effect of all potential shares of common stock. In periods when we recorded an Adjusted Net Loss, the diluted Adjusted EPS is the same as basic Adjusted EPS because the effects of potentially dilutive items were anti-dilutive given the Adjusted Net Loss position.
Adjusted Free Cash Flow is a non-GAAP financial measure that represents our net cash provided by operating activities adjusted for changes in settlements receivable, changes in customers payable, changes in settlements payable, the purchase of property and equipment, payments for originations of consumer receivables, proceeds from principal repayments and sales of consumer receivables, and sales, principal payments, and forgiveness of PPP loans. We present Adjusted Free Cash Flow because we use it to understand the cash generated by our business and make strategic decisions related to our balance sheet, and because we are focused on growing our Adjusted Free Cash Flow generation over time. It is not intended to represent amounts available for discretionary purposes.
Constant currency growth is calculated by assuming international results in a given period and the comparative prior period are translated from local currencies to the U.S. dollar at rates consistent with the monthly average rates in the comparative prior period. We discuss growth on a constant currency basis because a portion of our business operates in markets outside the U.S. and is subject to changes in foreign exchange rates.
Non-GAAP operating expenses is a non-GAAP financial measure that represents operating expenses adjusted to remove the impact of share-based compensation, depreciation and amortization, bitcoin impairment losses, loss on disposal of property and equipment, and acquisition-related integration and other costs.
We have included Adjusted EBITDA, Adjusted EBITDA margin, Adjusted Operating Income (Loss), Adjusted Operating Income (Loss) margin, Adjusted Net Income, Adjusted EPS, and non-GAAP operating expenses because they are key measures used by our management to evaluate our operating performance, generate future operating plans, and make strategic decisions, including those relating to operating expenses and the allocation of internal resources. Accordingly, we believe that Adjusted EBITDA, Adjusted EBITDA margin, Adjusted Operating Income (Loss), Adjusted Operating Income (Loss) margin, Adjusted Net Income, Adjusted EPS, and non-GAAP operating expenses provide useful information to investors and others in understanding and evaluating our operating results in the same manner as our management and board of directors. In addition, they provide useful measures for period-to-period comparisons of our business, as they remove the effect of certain non-cash items and certain variable charges that do not vary with our operations. We have included measures excluding our BNPL platform because we believe these measures are useful in understanding the ongoing results of our operations. We have included measures excluding bitcoin revenue because our role is to facilitate customers’ access to bitcoin. When customers buy bitcoin through Cash App, we only apply a small margin to the market cost of bitcoin, which tends to be volatile and outside our control. Therefore, we believe deducting bitcoin revenue or gross profit better reflects the economic benefits as well as our performance from these transactions. We have included measures excluding PPP loan forgiveness gross profit because we believe these measures are useful in order to facilitate comparisons of our business without PPP loan forgiveness.
|
|
BLOCK Q4 2023 29 |
KEY OPERATING METRICS AND
NON-GAAP FINANCIAL MEASURES
Adjusted EBITDA, Adjusted EBITDA margin, Adjusted Net Income, Adjusted Operating Income (Loss), Adjusted Operating Income (Loss) margin, Adjusted EPS, and non-GAAP operating expenses, as well as other measures defined in the shareholder letter, such as measures excluding our BNPL platform, bitcoin revenue, and PPP loan forgiveness gross profit, have limitations as financial measures, should be considered as supplemental in nature, and are not meant as substitutes for the related financial information prepared in accordance with GAAP.
We believe that the aforementioned metrics and measures provide useful information about our operating results, enhance the overall understanding of our past performance and future prospects, and provide useful measures for period-to-period comparisons of our business, as they remove the effect of certain variable amounts, or they remove amounts that were not repeated across periods and therefore make comparisons more difficult. Our management uses these measures to evaluate our operating performance, generate future operating plans, and make strategic decisions, including those relating to operating expenses and the allocation of internal resources.
These non-GAAP financial measures should not be considered in isolation from, or as a substitute for, financial information prepared in accordance with GAAP. These non-GAAP financial measures are not based on any standardized methodology prescribed by GAAP. Other companies, including companies in our industry, may calculate the non-GAAP financial measures differently or not at all, which reduces their usefulness as comparative measures.
|
|
BLOCK Q4 2023 30 |
Consolidated Statements
of Operations
AUDITED
In thousands, except per share data
| TWELVE MONTHS ENDED | ||||||||||||||||
| Dec. 31, 2023 | Dec. 31, 2022 | Dec. 31, 2021 | ||||||||||||||
| Revenue: |
||||||||||||||||
| Transaction-based revenue |
$ | 6,315,301 | $ | 5,701,540 | $ | 4,793,146 | ||||||||||
| Subscription and services-based revenue |
5,944,842 | 4,552,773 | 2,709,731 | |||||||||||||
| Hardware revenue |
157,178 | 164,418 | 145,679 | |||||||||||||
| Bitcoin revenue |
9,498,302 | 7,112,856 | 10,012,647 | |||||||||||||
| Total net revenue |
21,915,623 | 17,531,587 | 17,661,203 | |||||||||||||
| Cost of revenue: |
||||||||||||||||
| Transaction-based costs |
3,702,016 | 3,364,028 | 2,719,502 | |||||||||||||
| Subscription and services-based costs |
1,075,129 | 861,745 | 483,056 | |||||||||||||
| Hardware costs |
267,650 | 286,995 | 221,185 | |||||||||||||
| Bitcoin costs |
9,293,113 | 6,956,733 | 9,794,992 | |||||||||||||
| Amortization of acquired technology assets |
72,829 | 70,194 | 22,645 | |||||||||||||
| Total cost of revenue |
14,410,737 | 11,539,695 | 13,241,380 | |||||||||||||
| Gross profit |
7,504,886 | 5,991,892 | 4,419,823 | |||||||||||||
| Operating expenses: |
||||||||||||||||
| Product development |
2,720,819 | 2,135,612 | 1,383,841 | |||||||||||||
| Sales and marketing |
2,019,009 | 2,057,951 | 1,617,189 | |||||||||||||
| General and administrative |
2,209,190 | 1,686,849 | 982,817 | |||||||||||||
| Transaction, loan, and consumer receivable losses |
660,663 | 550,683 | 187,991 | |||||||||||||
| Bitcoin impairment losses |
— | 46,571 | 71,126 | |||||||||||||
| Amortization of customer and other acquired intangible assets |
174,044 | 138,758 | 15,747 | |||||||||||||
| Total operating expenses |
7,783,725 | 6,616,424 | 4,258,711 | |||||||||||||
| Operating income (loss) |
(278,839 | ) | (624,532 | ) | 161,112 | |||||||||||
| Interest expense (income), net |
(47,221 | ) | 36,228 | 33,124 | ||||||||||||
| Other income, net |
(202,475 | ) | (95,443 | ) | (29,474 | ) | ||||||||||
| Income (loss) before income tax |
(29,143 | ) | (565,317 | ) | 157,462 | |||||||||||
| Benefit for income taxes |
(8,019 | ) | (12,312 | ) | (1,364 | ) | ||||||||||
| Net income (loss) |
(21,124 | ) | (553,005 | ) | 158,826 | |||||||||||
| Less: Net loss attributable to noncontrolling interests |
(30,896 | ) | (12,258 | ) | (7,458 | ) | ||||||||||
| Net income (loss) attributable to common stockholders |
$ | 9,772 | $ | (540,747 | ) | $ | 166,284 | |||||||||
| Net income (loss) per share attributable to common stockholders: |
||||||||||||||||
| Basic |
$ | 0.02 | $ | (0.93 | ) | $ | 0.36 | |||||||||
| Diluted |
$ | 0.02 | $ | (0.93 | ) | $ | 0.33 | |||||||||
| Weighted-average shares used to compute net income (loss) per share attributable to common stockholders: |
||||||||||||||||
| Basic |
608,856 | 578,949 | 458,432 | |||||||||||||
| Diluted |
614,024 | 578,949 | 501,779 | |||||||||||||
|
|
BLOCK Q4 2023 31 |
Consolidated Balance Sheets
AUDITED
In thousands, except per share data
| Dec. 31, 2023 | Dec. 31, 2022 | |||||||||
| Assets |
||||||||||
| Current assets: |
||||||||||
| Cash and cash equivalents |
$ | 4,996,465 | $ | 4,544,202 | ||||||
| Investments in short-term debt securities |
851,901 | 1,081,851 | ||||||||
| Settlements receivable |
3,226,294 | 2,416,324 | ||||||||
| Customer funds |
3,170,430 | 3,180,324 | ||||||||
| Consumer receivables, net |
2,444,695 | 1,871,160 | ||||||||
| Loans held for sale |
775,424 | 474,036 | ||||||||
| Safeguarding asset related to bitcoin held for other parties |
1,038,585 | 428,243 | ||||||||
| Other current assets |
2,353,488 | 1,627,265 | ||||||||
| Total current assets |
18,857,282 | 15,623,405 | ||||||||
| Property and equipment, net |
296,056 | 329,302 | ||||||||
| Goodwill |
11,919,720 | 11,966,761 | ||||||||
| Acquired intangible assets, net |
1,761,521 | 2,014,034 | ||||||||
| Investments in long-term debt securities |
251,127 | 573,429 | ||||||||
| Operating lease right-of-use assets |
244,701 | 373,172 | ||||||||
| Other non-current assets |
739,486 | 484,237 | ||||||||
| Total assets |
$ | 34,069,893 | $ | 31,364,340 | ||||||
| Liabilities and Stockholders’ Equity |
||||||||||
| Current liabilities: |
||||||||||
| Customers payable |
$ | 6,795,340 | $ | 5,548,656 | ||||||
| Settlements payable |
8,469 | 462,505 | ||||||||
| Accrued expenses and other current liabilities |
1,326,200 | 1,073,516 | ||||||||
| Current portion of long-term debt (Note 15) |
— | 460,356 | ||||||||
| Warehouse funding facilities, current |
753,035 | 461,240 | ||||||||
| Safeguarding obligation liability related to bitcoin held for other parties |
1,038,585 | 428,243 | ||||||||
| Total current liabilities |
9,921,629 | 8,434,516 | ||||||||
| Deferred tax liabilities |
35,695 | 132,498 | ||||||||
| Warehouse funding facilities, non-current |
854,882 | 877,066 | ||||||||
| Long-term debt (Note 15) |
4,120,091 | 4,109,829 | ||||||||
| Operating lease liabilities, non-current |
289,788 | 357,419 | ||||||||
| Other non-current liabilities |
154,972 | 201,657 | ||||||||
| Total liabilities |
15,377,057 | 14,112,985 | ||||||||
| Commitments and contingencies (Note 20) |
||||||||||
| Stockholders’ equity: |
||||||||||
| Preferred stock, $0.0000001 par value: 100,000 shares authorized at December 31, 2023 and December 31, 2022. None issued and outstanding at December 31, 2023 and December 31, 2022. |
— | — | ||||||||
| Class A common stock, $0.0000001 par value: 1,000,000 shares authorized at December 31, 2023 and December 31, 2022; 555,306 and 539,408 issued and outstanding at December 31, 2023 and December 31, 2022, respectively. |
— | — | ||||||||
| Class B common stock, $0.0000001 par value: 500,000 shares authorized at December 31, 2023 and December 31, 2022; 60,515 and 60,652 issued and outstanding at December 31, 2023 and December 31, 2022, respectively. |
— | — | ||||||||
| Additional paid-in capital |
19,601,992 | 18,314,681 | ||||||||
| Accumulated other comprehensive loss |
(378,307 | ) | (523,090 | ) | ||||||
| Accumulated deficit |
(528,429 | ) | (568,712 | ) | ||||||
| Total stockholders’ equity attributable to common stockholders |
18,695,256 | 17,222,879 | ||||||||
| Noncontrolling interests |
(2,420 | ) | 28,476 | |||||||
| Total stockholders’ equity |
18,692,836 | 17,251,355 | ||||||||
| Total liabilities and stockholders’ equity |
$ | 34,069,893 | $ | 31,364,340 | ||||||
|
|
BLOCK Q4 2023 32 |
Consolidated Statements
of Cash Flows
AUDITED
In thousands
| TWELVE MONTHS ENDED | ||||||||||||||||
| Dec. 31, 2023 | Dec. 31, 2022 | Dec. 31, 2021 | ||||||||||||||
| Cash flows from operating activities: |
||||||||||||||||
| Net income (loss) |
$ | (21,124) | $ | (553,005 | ) | $ | 158,826 | |||||||||
| Adjustments to reconcile net income (loss) to net cash provided by operating activities: |
||||||||||||||||
| Depreciation and amortization |
408,560 | 340,523 | 134,757 | |||||||||||||
| Amortization of discounts and premiums and other non-cash adjustments |
(984,442) | (592,489 | ) | 31,104 | ||||||||||||
| Non-cash lease expense |
144,198 | 129,811 | 83,137 | |||||||||||||
| Share-based compensation |
1,276,097 | 1,071,278 | 608,040 | |||||||||||||
| Loss (gain) on revaluation of equity investments |
16,523 | (73,457 | ) | (35,492 | ) | |||||||||||
| Bitcoin remeasurement |
(207,084) | — | — | |||||||||||||
| Transaction, loan, and consumer receivable losses |
660,663 | 550,683 | 187,991 | |||||||||||||
| Bitcoin impairment losses |
— | 46,571 | 71,126 | |||||||||||||
| Change in deferred income taxes |
(85,879) | (69,593 | ) | (10,435 | ) | |||||||||||
| Goodwill impairment |
132,313 | — | — | |||||||||||||
| Changes in operating assets and liabilities: |
||||||||||||||||
| Settlements receivable |
(1,108,529) | (1,499,057 | ) | (346,217 | ) | |||||||||||
| Purchases and originations of loans |
(8,586,293) | (6,114,847 | ) | (3,227,172 | ) | |||||||||||
| Proceeds from payments and forgiveness of loans |
8,032,687 | 6,040,369 | 3,067,344 | |||||||||||||
| Customers payable |
1,256,578 | 1,060,861 | 171,555 | |||||||||||||
| Settlements payable |
(454,036) | 207,894 | 15,249 | |||||||||||||
| Other assets and liabilities |
(379,271) | (369,639 | ) | (61,983 | ) | |||||||||||
| Net cash provided by operating activities |
100,961 | 175,903 | 847,830 | |||||||||||||
| Cash flows from investing activities: |
||||||||||||||||
| Purchases of marketable debt securities |
(1,126,615) | (755,697 | ) | (2,714,560 | ) | |||||||||||
| Proceeds from maturities of marketable debt securities |
1,387,830 | 999,569 | 831,019 | |||||||||||||
| Proceeds from sale of marketable debt securities |
339,095 | 449,723 | 617,097 | |||||||||||||
| Purchases of marketable debt securities from customer funds |
— | — | (488,851 | ) | ||||||||||||
| Proceeds from maturities of marketable debt securities from customer funds |
— | 73,000 | 505,501 | |||||||||||||
| Proceeds from sale of marketable debt securities from customer funds |
— | 316,576 | 35,071 | |||||||||||||
| Payments for originations of consumer receivables |
(23,968,787) | (18,361,871 | ) | — | ||||||||||||
| Proceeds from principal repayments and sales of consumer receivables |
24,241,651 | 18,192,470 | — | |||||||||||||
| Purchases of property and equipment |
(151,151) | (170,815 | ) | (134,320 | ) | |||||||||||
| Purchases of bitcoin investments |
— | — | (170,000 | ) | ||||||||||||
| Purchases of other investments |
(33,853) | (56,712 | ) | (48,510 | ) | |||||||||||
| Proceeds from sale of equity investments |
— | — | 420,644 | |||||||||||||
| Business combinations, net of cash acquired |
(4,969) | 539,453 | (163,970 | ) | ||||||||||||
| Net cash provided by (used in) investing activities |
683,201 | 1,225,696 | (1,310,879 | ) | ||||||||||||
|
|
BLOCK Q4 2023 33 |
Consolidated Statements
of Cash Flows, Continued
AUDITED
In thousands
| TWELVE MONTHS ENDED | ||||||||||||||||
| Dec. 31, 2023 | Dec. 31, 2022 | Dec. 31, 2021 | ||||||||||||||
| Cash flows from financing activities: |
||||||||||||||||
| Proceeds from issuance of senior notes, net |
— | — | 1,971,828 | |||||||||||||
| Payments to redeem convertible notes |
(461,761) | (1,071,788 | ) | — | ||||||||||||
| Proceeds from PPP Liquidity Facility advances |
— | — | 681,539 | |||||||||||||
| Repayments of PPP Liquidity Facility advances |
(16,840) | (480,694 | ) | (648,100 | ) | |||||||||||
| Proceeds from warehouse facilities borrowings |
1,387,662 | 1,620,805 | — | |||||||||||||
| Repayments of warehouse facilities borrowings |
(1,118,083) | (391,463 | ) | — | ||||||||||||
| Proceeds from the exercise of stock options and purchases under the employee stock purchase plan |
130,433 | 81,768 | 126,719 | |||||||||||||
| Payments for tax withholding related to vesting of restricted stock units |
— | (4,735 | ) | (323,011 | ) | |||||||||||
| Net increase in interest-bearing deposits |
25,135 | 82,049 | 59,844 | |||||||||||||
| Repurchases of common stock |
(156,812) | — | — | |||||||||||||
| Other financing activities |
(19,977) | (87,692 | ) | (9,948 | ) | |||||||||||
| Change in customer funds, restricted from use in the Company’s operations |
(9,894) | 349,330 | 793,163 | |||||||||||||
| Net cash provided by (used in) financing activities |
(240,137) | 97,580 | 2,652,034 | |||||||||||||
| Effect of foreign exchange rate on cash and cash equivalents |
29,156 | (38,363 | ) | (7,066 | ) | |||||||||||
| Net increase in cash, cash equivalents, restricted cash, and customer funds |
573,181 | 1,460,816 | 2,181,919 | |||||||||||||
| Cash, cash equivalents, restricted cash, and customer funds, beginning of the period |
8,435,906 | 6,975,090 | 4,793,171 | |||||||||||||
| Cash, cash equivalents, restricted cash, and customer funds, end of the period |
$ | 9,009,087 | $ | 8,435,906 | $ | 6,975,090 | ||||||||||
|
|
BLOCK Q4 2023 34 |
Reportable Segment Disclosures
Information on the reportable segments revenue and segment operating profit (in thousands)
| THREE MONTHS ENDED | TWELVE MONTHS ENDED | |||||||||||||||||||||||||||||||
| Dec. 31, 2023 | Dec. 31, 2023 | |||||||||||||||||||||||||||||||
| (UNAUDITED) | (AUDITED) | |||||||||||||||||||||||||||||||
| Cash App | Square | Corporate and Other (i) |
Total | Cash App | Square | Corporate and Other (i) |
Total | |||||||||||||||||||||||||
| Revenue: |
||||||||||||||||||||||||||||||||
| Transaction-based revenue |
$ | 108,990 | $ | 1,487,284 | $ | — | $ | 1,596,274 | $ | 498,176 | $ | 5,817,125 | $ | — | $ | 6,315,301 | ||||||||||||||||
| Subscription and services-based revenue |
1,281,357 | 293,164 | 49,700 | 1,624,221 | 4,685,208 | 1,059,081 | 200,553 | 5,944,842 | ||||||||||||||||||||||||
| Hardware revenue |
— | 32,464 | — | 32,464 | — | 157,178 | — | 157,178 | ||||||||||||||||||||||||
| Bitcoin revenue |
2,520,083 | — | — | 2,520,083 | 9,498,302 | — | — | 9,498,302 | ||||||||||||||||||||||||
|
|
|
|
|
|
|
|
|
|
|
|
|
|
|
|
|
|
|
|
|
|
|
|
|
| ||||||||
| Segment revenue |
$ | 3,910,430 | $ | 1,812,912 | $ | 49,700 | $ | 5,773,042 | $ | 14,681,686 | $ | 7,033,384 | $ | 200,553 | $ | 21,915,623 | ||||||||||||||||
|
|
|
|
|
|
|
|
|
|
|
|
|
|
|
|
|
|
|
|
|
|
|
|
|
| ||||||||
| Segment gross profit (ii) | $ | 1,183,734 | $ | 827,717 | $ | 14,301 | $ | 2,025,752 | $ | 4,323,463 | $ | 3,128,654 | $ | 52,769 | $ | 7,504,886 | ||||||||||||||||
|
|
|
|
|
|
|
|
|
|
|
|
|
|
|
|
|
|
|
|
|
|
|
|
|
| ||||||||
| THREE MONTHS ENDED | TWELVE MONTHS ENDED | |||||||||||||||||||||||||||||||
| Dec. 31, 2022 | Dec. 31, 2022 | |||||||||||||||||||||||||||||||
| (UNAUDITED) | (AUDITED) | |||||||||||||||||||||||||||||||
| Cash App | Square | Corporate and Other (i) |
Total | Cash App | Square | Corporate and Other (i) |
Total | |||||||||||||||||||||||||
| Revenue: |
||||||||||||||||||||||||||||||||
| Transaction-based revenue |
$ | 122,403 | $ | 1,352,571 | $ | — | $ | 1,474,974 | $ | 466,171 | $ | 5,235,369 | $ | — | $ | 5,701,540 | ||||||||||||||||
| Subscription and services-based revenue |
1,032,702 | 236,074 | 38,073 | 1,306,849 | 3,452,777 | 894,350 | 205,646 | 4,552,773 | ||||||||||||||||||||||||
| Hardware revenue |
— | 35,653 | — | 35,653 | — | 164,418 | — | 164,418 | ||||||||||||||||||||||||
| Bitcoin revenue |
1,833,426 | — | — | 1,833,426 | 7,112,856 | — | — | 7,112,856 | ||||||||||||||||||||||||
|
|
|
|
|
|
|
|
|
|
|
|
|
|
|
|
|
|
|
|
|
|
|
|
|
| ||||||||
| Segment revenue |
$ | 2,988,531 | $ | 1,624,298 | $ | 38,073 | $ | 4,650,902 | $ | 11,031,804 | $ | 6,294,137 | $ | 205,646 | $ | 17,531,587 | ||||||||||||||||
|
|
|
|
|
|
|
|
|
|
|
|
|
|
|
|
|
|
|
|
|
|
|
|
|
| ||||||||
| Segment gross profit (ii) | $ | 946,190 | $ | 703,103 | $ | 10,901 | $ | 1,660,194 | $ | 3,245,044 | $ | 2,706,901 | $ | 39,947 | $ | 5,991,892 | ||||||||||||||||
|
|
|
|
|
|
|
|
|
|
|
|
|
|
|
|
|
|
|
|
|
|
|
|
|
| ||||||||
Operating Segment Disclosures
A reconciliation of total segment gross profit to the Company’s income (loss) before
applicable income taxes (in thousands):
| THREE MONTHS ENDED | TWELVE MONTHS ENDED | |||||||||||||||
| (UNAUDITED) | (AUDITED) | |||||||||||||||
| Dec. 31, 2023 | Dec. 31, 2022 | Dec. 31, 2023 | Dec. 31, 2022 | |||||||||||||
| Total segment gross profit |
$ | 2,025,752 | $ | 1,660,195 | $ | 7,504,886 | $ | 5,991,892 | ||||||||
| Less: Product development |
685,422 | 604,524 | 2,720,819 | 2,135,612 | ||||||||||||
| Less: Sales and marketing |
506,010 | 539,724 | 2,019,009 | 2,057,951 | ||||||||||||
| Less: General and administrative |
746,187 | 451,543 | 2,209,190 | 1,686,849 | ||||||||||||
| Less: Transaction, loan, and consumer receivable losses |
175,658 | 155,250 | 660,663 | 550,683 | ||||||||||||
| Less: Bitcoin impairment losses |
— | 8,991 | — | 46,571 | ||||||||||||
| Less: Amortization of customer and other intangible assets |
43,127 | 35,344 | 174,044 | 138,758 | ||||||||||||
| Less: Interest expense (income), net |
(18,701) | 1,472 | (47,221 | ) | 36,228 | |||||||||||
| Less: Other income, net |
(217,963) | (24,407 | ) | (202,475 | ) | (95,443 | ) | |||||||||
|
|
|
|
|
|
|
|
|
|
| |||||||
| Income (loss) before applicable income taxes |
$ | 106,012 | $ | (112,246 | ) | $ | (29,143 | ) | $ | (565,317 | ) | |||||
|
|
|
|
|
|
|
|
|
|
| |||||||
(i) Corporate and other represents results related to products and services that are not assigned to a specific reportable segment, and intersegment eliminations.
(ii) Segment gross profit for Cash App for the years ended December 31, 2023 and 2022 included $56.1 million and $53.9 million of amortization of acquired technology assets expense, respectively. Segment gross profit for Square for the years ended December 31, 2023 and 2022 included $10.6 million and $10.5 million of amortization of acquired technology assets expense, respectively. Amortization of acquired technology assets expense included in Corporate and Other was immaterial for the years ended December 31, 2023 and 2022.
|
|
BLOCK Q4 2023 35 |
Key Operating Metrics and
Non-GAAP Financial Measures
UNAUDITED
| THREE MONTHS ENDED | TWELVE MONTHS ENDED | |||||||||||||||
| Dec. 31, 2023 | Dec. 31, 2022 | Dec. 31, 2023 | Dec. 31, 2022 | |||||||||||||
| Gross Payment Volume (“GPV”) (in millions) |
$ | 57,494 | $ | 53,160 | $ | 227,699 | $ | 203,536 | ||||||||
| Adjusted Operating Income (Loss) (in thousands) |
$ | 185,129 | $ | (31,864) | $ | 351,351 | $ | (145,408) | ||||||||
| Adjusted EBITDA (in thousands) |
$ | 562,163 | $ | 280,901 | $ | 1,792,420 | $ | 990,964 | ||||||||
| Adjusted Net Income Per Share: |
||||||||||||||||
| Basic |
$ | 0.46 | $ | 0.22 | $ | 1.85 | $ | 1.05 | ||||||||
| Diluted |
$ | 0.45 | $ | 0.22 | $ | 1.80 | $ | 1.00 | ||||||||
| THREE MONTHS ENDED | TWELVE MONTHS ENDED | |||||||||||||||
| Dec. 31, 2023 | Dec. 31, 2022 | Dec. 31, 2023 | Dec. 31, 2022 | |||||||||||||
| Square GPV (in millions) |
$ | 53,543 | $ | 48,618 | $ | 209,606 | $ | 186,471 | ||||||||
| Cash App GPV (in millions) |
3,951 | 4,542 | 18,093 | 17,065 | ||||||||||||
|
|
|
|
|
|
|
|
||||||||||
| Total GPV | $ | 57,494 | $ | 53,160 | $ | 227,699 | $ | 203,536 | ||||||||
|
|
|
|
|
|
|
|
||||||||||
|
|
BLOCK Q4 2023 36 |
Adjusted EBITDA
UNAUDITED
In thousands
| THREE MONTHS ENDED | ||||||||||||||||||||
|
Dec. 31, 2023 |
Dec 31, 2022 | Mar 31, 2023 | June 30, 2023 | Sept. 30, 2023 | ||||||||||||||||
| Net income (loss) attributable to common stockholders |
$ | 178,070 | $ | (113,823) | $ | (16,838) | $ | (122,506) | $ | (28,954) | ||||||||||
| Net loss attributable to noncontrolling interests |
(20,266) | (3,798) | (2,488) | (3,336) | (4,806) | |||||||||||||||
|
|
|
|
|
|
|
|
|
|
||||||||||||
| Net income (loss) |
157,804 | (117,621) | (19,326) | (125,842) | (33,760) | |||||||||||||||
| Share-based compensation expense |
331,568 | 274,495 | 279,591 | 319,248 | 345,690 | |||||||||||||||
| Depreciation and amortization |
105,324 | 90,907 | 93,173 | 94,545 | 115,518 | |||||||||||||||
| Acquisition-related and integration costs |
5,118 | 4,216 | 1,479 | 1,434 | 3,391 | |||||||||||||||
| Restructuring and other charges |
117,174 | 36,446 | 72 | 100,915 | 21,421 | |||||||||||||||
| Goodwill impairment |
132,313 | — | — | — | — | |||||||||||||||
| Interest expense (income), net |
(18,701) | 1,472 | (3,161) | (3,944) | (21,415) | |||||||||||||||
| Other expense (income), net |
(217,963) | (24,407) | 18,371 | 1,379 | (4,262) | |||||||||||||||
| Bitcoin impairment losses |
— | 8,991 | — | — | — | |||||||||||||||
| Provision (benefit) for income taxes |
(51,792) | 5,375 | (2,056) | (3,700) | 49,529 | |||||||||||||||
| Loss on disposal of property and equipment |
1,297 | 984 | 191 | 343 | 1,355 | |||||||||||||||
| Acquired deferred revenue and cost adjustment |
21 | 43 | 33 | 24 | 21 | |||||||||||||||
|
|
|
|
|
|
|
|
|
|
||||||||||||
| Adjusted EBITDA |
$ | 562,163 | $ | 280,901 | $ | 368,367 | $ | 384,402 | $ | 477,488 | ||||||||||
|
|
|
|
|
|
|
|
|
|
||||||||||||
| TWELVE MONTHS ENDED | ||||||||||||||||||||
|
Dec. 31, 2023 |
Dec 31, 2022 | Dec. 31, 2021 | Dec. 31, 2020 | Dec. 31, 2019 | ||||||||||||||||
| Net income (loss) attributable to common stockholders |
$ | 9,772 | $ | (540,747) | $ | 166,284 | $ | 213,105 | $ | 375,446 | ||||||||||
| Net loss attributable to noncontrolling interests |
(30,896) | (12,258) | (7,458) | — | — | |||||||||||||||
|
|
|
|
|
|
|
|
|
|
||||||||||||
| Net income (loss) |
(21,124) | (553,005) | 158,826 | 213,105 | 375,446 | |||||||||||||||
| Share-based compensation expense |
1,276,097 | 1,069,289 | 608,042 | 397,500 | 297,863 | |||||||||||||||
| Depreciation and amortization |
408,560 | 340,523 | 134,756 | 84,212 | 75,598 | |||||||||||||||
| Acquisition-related and integration costs |
11,422 | 105,518 | 15,474 | 7,482 | 9,739 | |||||||||||||||
| Restructuring and other charges |
239,582 | 51,746 | 20,000 | — | — | |||||||||||||||
| Goodwill impairment |
132,313 | — | — | — | — | |||||||||||||||
| Interest expense (income), net |
(47,221) | 36,228 | 33,124 | 56,943 | 21,516 | |||||||||||||||
| Other expense (income), net |
(202,475) | (95,443) | (29,474) | (291,725) | 273 | |||||||||||||||
| Bitcoin impairment losses |
— | 46,571 | 71,126 | — | — | |||||||||||||||
| Provision (benefit) for income taxes |
(8,019) | (12,312) | (1,364) | 2,862 | 2,767 | |||||||||||||||
| Loss on disposal of property and equipment |
3,186 | 1,619 | 2,633 | 2,570 | 1,008 | |||||||||||||||
| Gain on sale of asset group |
— | — | — | — | (373,445) | |||||||||||||||
| Acquired deferred revenue and cost adjustment |
99 | 230 | 514 | 1,122 | 6,088 | |||||||||||||||
|
|
|
|
|
|
|
|
|
|
||||||||||||
| Adjusted EBITDA |
$ | 1,792,420 | $ | 990,964 | $ | 1,013,657 | $ | 474,071 | $ | 416,853 | ||||||||||
|
|
|
|
|
|
|
|
|
|
||||||||||||
|
|
BLOCK Q4 2023 37 |
Adjusted Operating
Income (Loss)
UNAUDITED
In thousands
| THREE MONTHS ENDED | ||||||||||||||||||||
|
Dec. 31, 2023 |
Dec 31, 2022 | Mar 31, 2023 | June 30, 2023 | Sept. 30, 2023 | ||||||||||||||||
| Operating loss |
$ | (130,652) | $ | (135,181) | $ | (6,172) | $ | (132,107) | $ | (9,908) | ||||||||||
| Amortization of acquired technology assets |
18,049 | 18,320 | 18,508 | 18,392 | 17,880 | |||||||||||||||
| Acquisition-related and integration costs |
5,118 | 40,662 | 1,479 | 1,434 | 3,391 | |||||||||||||||
| Restructuring and other charges |
117,174 | — | 72 | 100,915 | 21,421 | |||||||||||||||
| Goodwill impairment |
132,313 | — | — | — | — | |||||||||||||||
| Bitcoin impairment losses |
— | 8,991 | — | — | — | |||||||||||||||
| Amortization of customer and other acquired intangible |
43,127 | 35,344 | 37,087 | 36,865 | 56,965 | |||||||||||||||
|
|
|
|
|
|
|
|
|
|
||||||||||||
| Adjusted Operating Income (Loss) |
$ | 185,129 | $ | (31,864) | $ | 50,974 | $ | 25,499 | $ | 89,749 | ||||||||||
|
|
|
|
|
|
|
|
|
|
||||||||||||
| TWELVE MONTHS ENDED | ||||||||||||||||||||
|
Dec. 31, 2023 |
Dec 31, 2022 | Dec. 31, 2021 | Dec. 31, 2020 | Dec. 31, 2019 | ||||||||||||||||
| Operating income (loss) |
$ | (278,839) | $ | (624,532) | $ | 161,112 | $ | (18,815) | $ | 26,557 | ||||||||||
| Amortization of acquired technology assets |
72,829 | 70,194 | 22,645 | 11,174 | 6,950 | |||||||||||||||
| Acquisition-related and integration costs |
11,422 | 105,518 | 15,474 | 7,482 | 9,739 | |||||||||||||||
| Restructuring and other charges |
239,582 | 51,746 | 20,000 | — | — | |||||||||||||||
| Goodwill impairment |
132,313 | — | — | — | — | |||||||||||||||
| Bitcoin impairment losses |
— | 46,571 | 71,126 | — | — | |||||||||||||||
| Amortization of customer and other acquired intangible |
174,044 | 138,758 | 15,747 | 3,855 | 4,481 | |||||||||||||||
| Acquisition-related share based acceleration costs |
— | 66,337 | — | — | — | |||||||||||||||
|
|
|
|
|
|
|
|
|
|
||||||||||||
| Adjusted Operating Income (Loss) |
$ | 351,351 | $ | (145,408) | $ | 306,104 | $ | 3,696 | $ | 47,727 | ||||||||||
|
|
|
|
|
|
|
|
|
|
||||||||||||
Key Metric Margins
UNAUDITED
In thousands
| TWELVE MONTHS ENDED | ||||||||
|
Dec. 31, 2023 |
Dec. 31, 2022 | |||||||
| Gross profit |
$ | 7,504,886 | $ | 5,991,892 | ||||
| Gross profit change (%) YoY |
25 % | 36 % | ||||||
| Operating loss |
(278,839) | (624,532) | ||||||
| Operating loss margin (%) of gross profit |
(4)% | (10)% | ||||||
| Net loss |
(21,124) | (553,005) | ||||||
| Net loss margin (%) of gross profit |
— % | (9)% | ||||||
| Adjusted Operating Income (Loss) |
351,351 | (145,408) | ||||||
| Adjusted Operating Income (Loss) margin (%) of gross profit |
5 % | (2)% | ||||||
| Adjusted EBITDA |
1,792,420 | 990,964 | ||||||
| Adjusted EBITDA margin (%) of gross profit |
24 % | 17 % | ||||||
|
|
|
|
||||||
|
|
BLOCK Q4 2023 38 |
Adjusted Free Cash Flow
UNAUDITED
In thousands
| TWELVE MONTHS ENDED | ||||||||
|
Dec. 31, 2023 |
Dec. 31, 2022 | |||||||
| Net cash provided by operating activities |
$ | 100,961 | $ | 175,903 | ||||
| Consumer receivables cash flows included within investing activities in the GAAP statement of cash flows: |
||||||||
| Payments for originations of consumer receivables |
(23,968,787) | (18,361,871) | ||||||
| Proceeds from principal repayments and sales of consumer receivables |
24,241,651 | 18,192,470 | ||||||
| Less: Purchase of property and equipment |
(151,151) | (170,815) | ||||||
| Reversal of: |
||||||||
| Changes in settlements receivable |
1,108,529 | 1,499,057 | ||||||
| Changes in customers payable |
(1,256,578) | (1,060,861) | ||||||
| Changes in settlements payable |
454,036 | (207,894) | ||||||
| Sales, principal payments and forgiveness of PPP loans |
(13,881) | (412,130) | ||||||
|
|
|
|
||||||
| Adjusted Free Cash Flow |
$ | 514,780 | $ | (346,141) | ||||
|
|
|
|
||||||
| Net cash provided by investing activities |
$ | 683,201 | $ | 1,225,696 | ||||
| Net cash provided by (used in) financing activities |
$ | (240,137) | $ | 97,580 | ||||
|
|
|
|
||||||
|
|
BLOCK Q4 2023 39 |
Select Financial Results Excluding
Bitcoin and PPP
UNAUDITED
In thousands
| THREE MONTHS ENDED | TWELVE MONTHS ENDED | |||||||||||||||
| Dec. 31, 2023 | Dec. 31, 2022 | Dec. 31, 2023 | Dec. 31, 2022 | |||||||||||||
| Bitcoin revenue |
$ | 2,520,083 | $ | 1,833,426 | $ | 9,498,302 | $ | 7,112,856 | ||||||||
| Bitcoin costs |
2,454,199 | 1,798,798 | 9,293,113 | 6,956,733 | ||||||||||||
|
|
|
|
|
|
|
|
||||||||||
| Bitcoin gross profit |
$ | 65,884 | $ | 34,628 | $ | 205,189 | $ | 156,123 | ||||||||
|
|
|
|
|
|
|
|
||||||||||
| THREE MONTHS ENDED | TWELVE MONTHS ENDED | |||||||||||||||
| Dec. 31, 2023 | Dec. 31, 2022 | Dec. 31, 2023 | Dec. 31, 2022 | |||||||||||||
| Revenue (GAAP) |
$ | 5,773,042 | $ | 4,650,902 | $ | 21,915,623 | $ | 17,531,587 | ||||||||
| Less: Bitcoin revenue |
2,520,083 | 1,833,426 | 9,498,302 | 7,112,856 | ||||||||||||
|
|
|
|
|
|
|
|
||||||||||
| Total revenue, excluding Bitcoin |
$ | 3,252,959 | $ | 2,817,476 | $ | 12,417,321 | $ | 10,418,731 | ||||||||
|
|
|
|
|
|
|
|
||||||||||
| THREE MONTHS ENDED | TWELVE MONTHS ENDED | |||||||||||||||
| Dec. 31, 2023 | Dec. 31, 2022 | Dec. 31, 2023 | Dec. 31, 2022 | |||||||||||||
| Cash App revenue (GAAP) |
$ | 3,910,430 | $ | 2,988,531 | $ | 14,681,686 | $ | 11,031,804 | ||||||||
| Less: Bitcoin contribution to Cash App revenue |
2,520,083 | 1,833,426 | 9,498,302 | 7,112,856 | ||||||||||||
|
|
|
|
|
|
|
|
||||||||||
| Total Cash App revenue, excluding Bitcoin |
$ | 1,390,347 | $ | 1,155,105 | $ | 5,183,384 | $ | 3,918,948 | ||||||||
|
|
|
|
|
|
|
|
||||||||||
| THREE MONTHS ENDED | ||||||||||||||||||||
|
Dec. 31, 2023 |
Dec. 31, 2022 | Dec. 31, 2021 | Dec. 31, 2020 | Dec. 31, 2019 | ||||||||||||||||
| Square gross profit (GAAP) |
$ | 827,717 | $ | 703,103 | $ | 657,293 | $ | 427,031 | $ | 378,831 | ||||||||||
| Less: Square gross profit - U.S. |
721,517 | 662,297 | 595,182 | 388,348 | 355,370 | |||||||||||||||
|
|
|
|
|
|
|
|
|
|
||||||||||||
| Total Square gross profit - International |
$ | 106,200 | $ | 40,806 | $ | 62,111 | $ | 38,683 | $ | 23,461 | ||||||||||
|
|
|
|
|
|
|
|
|
|
||||||||||||
| THREE MONTHS ENDED | ||||||||||||||||||||
|
Dec. 31, 2023 |
Dec. 31, 2022 | Dec. 31, 2021 | Dec. 31, 2020 | Dec. 31, 2019 | ||||||||||||||||
| Square gross profit (GAAP) |
$ | 827,717 | $ | 703,103 | $ | 657,293 | $ | 427,031 | $ | 378,831 | ||||||||||
| Less: gross profit from Paycheck Protection Program (PPP) loan forgiveness |
226 | 2,094 | 58,622 | 2,369 | — | |||||||||||||||
|
|
|
|
|
|
|
|
|
|
||||||||||||
| Square gross profit excluding Paycheck Protection Program (PPP) loan forgiveness |
$ | 827,491 | $ | 701,009 | $ | 598,671 | $ | 424,662 | $ | 378,831 | ||||||||||
|
|
|
|
|
|
|
|
|
|
||||||||||||
| THREE MONTHS ENDED | ||||||||||||||||||||
|
Dec. 31, 2023 |
Dec. 31, 2022 | Dec. 31, 2021 | Dec. 31, 2020 | Dec. 31, 2019 | ||||||||||||||||
| Square gross profit from Banking |
$ | 190,374 | $ | 148,229 | $ | 156,430 | $ | 44,964 | $ | 59,699 | ||||||||||
| Less: gross profit from Paycheck Protection Program (PPP) loan forgiveness |
226 | 2,094 | 58,622 | 2,369 | — | |||||||||||||||
|
|
|
|
|
|
|
|
|
|
||||||||||||
| Square banking gross profit excluding PPP loan forgiveness |
$ | 190,148 | $ | 146,135 | $ | 97,808 | $ | 42,595 | $ | 59,699 | ||||||||||
|
|
|
|
|
|
|
|
|
|
||||||||||||
|
|
BLOCK Q4 2023 40 |
Select Financial Results
Segment Reorganization(i)
UNAUDITED
In thousands
| THREE MONTHS ENDED | TWELVE MONTHS ENDED | |||||||||||||||
| Dec. 31, 2023 | Dec. 31, 2022 | Dec. 31, 2023 | Dec. 31, 2022 | |||||||||||||
| Cash App gross profit pre reorganization |
$ | 1,021,396 | $ | 847,944 | $ | 3,802,579 | $ | 2,950,967 | ||||||||
| Afterpay contribution to Square pre reorganization |
162,338 | 98,246 | 520,884 | 294,077 | ||||||||||||
|
|
|
|
|
|
|
|
||||||||||
| Cash App gross profit post reorganization |
$ | 1,183,734 | $ | 946,190 | $ | 4,323,463 | $ | 3,245,044 | ||||||||
|
|
|
|
|
|
|
|
||||||||||
| THREE MONTHS ENDED | TWELVE MONTHS ENDED | |||||||||||||||
| Dec. 31, 2023 | Dec. 31, 2022 | Dec. 31, 2023 | Dec. 31, 2022 | |||||||||||||
| Square gross profit pre reorganization |
$ | 990,055 | $ | 801,349 | $ | 3,649,538 | $ | 3,000,978 | ||||||||
| Afterpay contribution to Square pre reorganization |
(162,338) | (98,246) | (520,884) | (294,077) | ||||||||||||
|
|
|
|
|
|
|
|
||||||||||
| Square gross profit post reorganization |
$ | 827,717 | $ | 703,103 | $ | 3,128,654 | $ | 2,706,901 | ||||||||
|
|
|
|
|
|
|
|
||||||||||
(i) In the fourth quarter of 2023, we changed our management reporting structure and moved the business activities and management of our BNPL platform fully under Cash App. We believe that this transition will allow us to better focus on consumer based commerce as well as the development of its financial tools within Cash App.
|
|
BLOCK Q4 2023 41 |
Adjusted Net Income and
Adjusted EPS
UNAUDITED
In thousands, except per share data
| THREE MONTHS ENDED | TWELVE MONTHS ENDED | |||||||||||||||
| Dec. 31, 2023 | Dec. 31, 2022 | Dec. 31, 2023 | Dec. 31, 2022 | |||||||||||||
| Net income (loss) attributable to common stockholders |
$ | 178,070 | $ | (113,823) | $ | 9,772 | $ | (540,747) | ||||||||
| Net loss attributable to noncontrolling interests |
(20,266) | (3,798) | (30,896) | (12,258) | ||||||||||||
|
|
|
|
|
|
|
|
||||||||||
| Net income (loss) |
157,804 | (117,621) | (21,124) | (553,005) | ||||||||||||
| Share-based compensation expense |
331,568 | 274,495 | 1,276,097 | 1,069,289 | ||||||||||||
| Acquisition-related and integration costs |
5,118 | 40,662 | 11,422 | 105,518 | ||||||||||||
| Restructuring and other charges |
117,174 | — | 239,582 | 51,746 | ||||||||||||
| Goodwill impairment |
132,313 | — | 132,313 | — | ||||||||||||
| Amortization of intangible assets |
61,176 | 53,637 | 246,873 | 208,952 | ||||||||||||
| Amortization of debt discount and issuance costs |
3,097 | 3,855 | 11,904 | 15,162 | ||||||||||||
| Loss (gain) on revaluation of equity investments |
(315) | (29,543) | 16,523 | (73,457) | ||||||||||||
| Bitcoin remeasurement |
(207,084) | (207,084) | ||||||||||||||
| Bitcoin impairment losses |
— | 8,991 | — | 46,571 | ||||||||||||
| Loss on disposal of property and equipment |
1,297 | 984 | 3,186 | 1,619 | ||||||||||||
| Acquired deferred revenue and cost adjustment |
21 | 43 | 99 | 230 | ||||||||||||
| Tax effect of non-GAAP net income adjustments |
(317,399) | (102,523) | (582,703) | (264,523) | ||||||||||||
|
|
|
|
|
|
|
|
||||||||||
| Adjusted Net Income - basic |
$ | 284,770 | $ | 132,980 | $ | 1,127,088 | $ | 608,102 | ||||||||
|
|
|
|
|
|
|
|
||||||||||
| Cash interest expense on convertible notes |
680 | 1,263 | 3,554 | 5,014 | ||||||||||||
| Adjusted Net Income - diluted |
$ | 285,450 | $ | 134,243 | $ | 1,130,642 | $ | 613,116 | ||||||||
|
|
|
|
|
|
|
|
||||||||||
| Weighted-average shares used to compute net income per share attributable to common stockholders: |
||||||||||||||||
| Basic |
615,053 | 598,875 | 608,856 | 578,949 | ||||||||||||
|
|
|
|
|
|
|
|
||||||||||
| Diluted |
629,126 | 598,875 | 614,024 | 578,949 | ||||||||||||
|
|
|
|
|
|
|
|
||||||||||
| Net loss per share attributable to common stockholders: |
||||||||||||||||
| Basic |
$ | 0.29 | $ | (0.19) | $ | 0.02 | $ | (0.93) | ||||||||
|
|
|
|
|
|
|
|
||||||||||
| Diluted |
$ | 0.28 | $ | (0.19) | $ | 0.02 | $ | (0.93) | ||||||||
|
|
|
|
|
|
|
|
||||||||||
| Weighted-average shares used to compute Adjusted Net Income Per Share: |
||||||||||||||||
| Basic |
615,053 | 598,875 | 608,856 | 578,949 | ||||||||||||
|
|
|
|
|
|
|
|
||||||||||
| Diluted |
631,048 | 622,520 | 628,320 | 615,034 | ||||||||||||
|
|
|
|
|
|
|
|
||||||||||
| Adjusted Net Income Per Share: |
||||||||||||||||
| Basic |
$ | 0.46 | $ | 0.22 | $ | 1.85 | $ | 1.05 | ||||||||
|
|
|
|
|
|
|
|
||||||||||
| Diluted |
$ | 0.45 | $ | 0.22 | $ | 1.80 | $ | 1.00 | ||||||||
|
|
|
|
|
|
|
|
||||||||||
|
|
BLOCK Q4 2023 42 |
Non-GAAP Operating Expenses
UNAUDITED
In thousands
| THREE MONTHS ENDED | TWELVE MONTHS ENDED | |||||||||||||||
| Dec. 31, 2023 | Dec. 31, 2022 | Dec. 31, 2023 | Dec. 31, 2022 | |||||||||||||
| Operating expenses |
$ | (2,156,404) | $ | (1,795,376) | $ | (7,783,725) | $ | (6,616,424) | ||||||||
| Share-based compensation |
331,394 | 274,353 | 1,275,496 | 1,068,795 | ||||||||||||
| Depreciation and amortization |
86,308 | 71,874 | 331,666 | 268,676 | ||||||||||||
| Bitcoin impairment losses |
— | 8,991 | — | 46,571 | ||||||||||||
| Loss on disposal of property and equipment |
1,297 | 984 | 3,186 | 1,619 | ||||||||||||
| Acquisition-related and integration costs |
5,118 | 4,216 | 11,422 | 105,518 | ||||||||||||
| Goodwill impairment |
132,313 | — | 132,313 | — | ||||||||||||
| Restructuring and other charges |
117,174 | 36,446 | 239,582 | 51,746 | ||||||||||||
|
|
|
|
|
|
|
|
||||||||||
| Non-GAAP operating expenses |
$ | (1,482,800) | $ | (1,398,512) | $ | (5,790,060) | $ | (5,073,499) | ||||||||
|
|
|
|
|
|
|
|
||||||||||
| THREE MONTHS ENDED | TWELVE MONTHS ENDED | |||||||||||||||
| Dec. 31, 2023 | Dec. 31, 2022 | Dec. 31, 2023 | Dec. 31, 2022 | |||||||||||||
| Product development |
$ | (685,422) | $ | (604,524) | $ | (2,720,819) | $ | (2,135,612) | ||||||||
| Share-based compensation |
235,618 | 192,934 | 902,130 | 701,715 | ||||||||||||
| Depreciation and amortization |
38,952 | 29,943 | 148,838 | 122,266 | ||||||||||||
| Loss on disposal of property and equipment |
265 | — | 1,139 | 461 | ||||||||||||
|
|
|
|
|
|
|
|
||||||||||
| Non-GAAP product development |
$ | (410,587) | $ | (381,647) | $ | (1,668,712) | $ | (1,311,170) | ||||||||
|
|
|
|
|
|
|
|
||||||||||
| THREE MONTHS ENDED | TWELVE MONTHS ENDED | |||||||||||||||
| Dec. 31, 2023 | Dec. 31, 2022 | Dec. 31, 2023 | Dec. 31, 2022 | |||||||||||||
| Sales and marketing |
$ | (506,010) | $ | (539,724) | $ | (2,019,009) | $ | (2,057,951) | ||||||||
| Share-based compensation |
32,807 | 30,098 | 130,665 | 105,231 | ||||||||||||
| Depreciation and amortization |
2,219 | 1,677 | 7,592 | 6,197 | ||||||||||||
| Loss on disposal of property and equipment |
993 | 192 | 993 | 244 | ||||||||||||
|
|
|
|
|
|
|
|
||||||||||
| Non-GAAP sales and marketing |
$ | (469,991) | $ | (507,757) | $ | (1,879,759) | $ | (1,946,279) | ||||||||
|
|
|
|
|
|
|
|
||||||||||
| THREE MONTHS ENDED | TWELVE MONTHS ENDED | |||||||||||||||
| Dec. 31, 2023 | Dec. 31, 2022 | Dec. 31, 2023 | Dec. 31, 2022 | |||||||||||||
| General and administrative |
$ | (746,187) | $ | (451,543) | $ | (2,209,190) | $ | (1,686,849) | ||||||||
| Share-based compensation |
62,969 | 51,321 | 242,701 | 261,849 | ||||||||||||
| Depreciation and amortization |
13,690 | 15,578 | 48,516 | 47,095 | ||||||||||||
| Loss on disposal of property and equipment |
39 | 792 | 1,054 | 914 | ||||||||||||
| Acquisition-related and integration costs |
5,118 | 4,216 | 11,422 | 105,518 | ||||||||||||
| Goodwill impairment |
132,313 | — | 132,313 | — | ||||||||||||
| Restructuring and other charges |
117,174 | 36,446 | 239,582 | 51,746 | ||||||||||||
|
|
|
|
|
|
|
|
||||||||||
| Non-GAAP general and administrative |
$ | (414,884) | $ | (343,190) | $ | (1,533,602) | $ | (1,219,727) | ||||||||
|
|
|
|
|
|
|
|
||||||||||
|
|
BLOCK Q4 2023 43 |
Depreciation and Amortization
by Function
UNAUDITED
In thousands
| THREE MONTHS ENDED | TWELVE MONTHS ENDED | |||||||||||||||
| Dec. 31, 2023 | Dec. 31, 2022 | Dec. 31, 2023 | Dec. 31, 2022 | |||||||||||||
| Cost of revenue |
$ | 19,016 | $ | 19,033 | $ | 76,894 | $ | 71,847 | ||||||||
| Product development |
38,952 | 29,943 | 148,838 | 122,266 | ||||||||||||
| Sales and marketing |
2,219 | 1,677 | 7,592 | 6,197 | ||||||||||||
| General and administrative |
13,690 | 15,578 | 48,516 | 47,095 | ||||||||||||
| Amortization of acquired customer assets |
31,447 | 24,676 | 126,720 | 93,118 | ||||||||||||
|
|
|
|
|
|
|
|
||||||||||
| Total depreciation and amortization |
$ | 105,324 | $ | 90,907 | $ | 408,560 | $ | 340,523 | ||||||||
|
|
|
|
|
|
|
|
||||||||||
Combined Company Gross
Profit Reporting
UNAUDITED
In thousands
| TWELVE MONTHS ENDED |
||||||||||||
| Dec. 31, 2023 | Dec. 31, 2022 | % Change | ||||||||||
| Gross profit |
$ | 7,504,886 | $ | 5,991,892 | 25 % | |||||||
| Assumed BNPL gross profit January 2022 |
— | 50,700 | ||||||||||
|
|
|
|
|
|
||||||||
| Gross profit including BNPL gross profit January |
$ | 7,504,886 | $ | 6,042,592 | 24 % | |||||||
|
|
|
|
|
|
||||||||
|
|
BLOCK Q4 2023 44 |