UNITED STATES
SECURITIES AND EXCHANGE COMMISSION
Washington, D.C. 20549
SECURITIES AND EXCHANGE COMMISSION
Washington, D.C. 20549
FORM N-CSR
CERTIFIED SHAREHOLDER REPORT OF REGISTERED
MANAGEMENT INVESTMENT COMPANIES
Investment Company Act file number 811-22525
Managed Portfolio Series
(Exact name of Registrant as specified in charter)
(Exact name of Registrant as specified in charter)
615 East Michigan Street
Milwaukee, WI 53202
(Address of principal executive offices) (Zip code)
(Address of principal executive offices) (Zip code)
Brian R. Wiedmeyer, President
Managed Portfolio Series
c/o U.S. Bancorp Fund Services, LLC
777 East Wisconsin Ave, 5th Fl
Milwaukee, WI 53202
(Name and address of agent for service)
(Name and address of agent for service)
(414) 516-1712
Registrant's telephone number, including area code
Date of fiscal year end: March 31, 2024
Date of reporting period: March 31, 2024
Item 1. Report to Stockholders.
(a)
Annual Report
March 31, 2024
CornerCap Small-Cap Value Fund
Table of Contents
|
Manager’s Report to Shareholders (Unaudited)
|
1
|
|
Fund Expenses (Unaudited)
|
6
|
|
Schedule of Investments
|
7
|
|
Statement of Assets and Liabilities
|
19
|
|
Statement of Operations
|
20
|
|
Statements of Changes in Net Assets
|
21
|
|
Financial Highlights
|
22
|
|
Notes to Financial Statements
|
24
|
|
Report of Independent Registered Public Accounting Firm
|
31
|
|
Additional Information (Unaudited)
|
32
|
Manager’s Report to Shareholders (Unaudited)
March 31, 2024
MANAGEMENT DISCUSSION OF FUND PERFORMANCE
Despite a challenging economic backdrop marked by high inflation and multiple interest rate hikes by the Federal Reserve, I am pleased to report that the CornerCap Small-Cap Value Fund has outperformed
its benchmark, the Russell 2000 Value Index, over the past twelve months.
During this period, the Federal Reserve aggressively sought to tame inflation by increasing rates four times in 2023. Expectations have shifted away from further increases with the next move likely a
rate cut, although its timing is increasingly uncertain, deferred by enduring inflation pressures. Despite efforts to cool the economy, consumer confidence remained resilient. With the advantage of existing low fixed-rate mortgages, consumers
demonstrated reduced sensitivity to interest rate changes compared to previous rate hike regimes. This, coupled with low unemployment and strong wage growth, contributed to consumer spending remaining robust in the face of economic headwinds.
The environment of rising interest rates this cycle has posed challenges for small-cap stocks. These stocks have become increasingly sensitive to fluctuations in interest rates, primarily because they
tend to carry more floating-rate debt compared to large-cap stocks. This sensitivity has resulted in harsher penalties from investors during this cycle. However, with forecasts now anticipating a cut in interest rates, small-cap stocks are poised for
improved relative performance and investor interest.
Investor penalties imposed on small-cap stocks have created a compelling entry point compared to larger companies. Valuations among smaller companies can appear volatile, partly because the Russell 2000
small-cap index has a substantial proportion of unprofitable companies. To navigate this, our investment team divides our small-cap universe of companies into two segments. The upper segment includes non-earners and highly valued stocks, which are
typically excluded from portfolio considerations. The lower segment, more central to our Fundametrics research process and model, consists of stocks that are attractively priced. Stocks in the lower half of price to current earnings ratio trade at
11.9 multiple, which is significantly lower than the median large-cap stock’s ratio of 22.9 (top 500 in market capitalization) and a capitalization-weighted ratio of 35.5 for the top 100 stocks. This presents a notable discount in an environment
where expectations for small caps are modest, especially when contrasted with the lofty expectations often associated with artificial intelligence.
The investing environment within small caps favored stocks with lower valuations, strong momentum, high returns on capital and positive changes to earnings estimates while higher valuation, high short
interest and poor momentum were underperforming characteristics. These are conditions that tend to favor our approach, and our buy decisions beat our sell decisions by a healthy spread.
The CornerCap Small-Cap Value Fund continues to benefit from our systematic research process that evaluates companies within custom peer groups. This approach has allowed us to identify and capitalize
on peer-group specific alpha drivers. Historically, this improves factor efficacy and stock selection. That was true in the current fiscal year with our stock selection positive in 9 of 11 sectors and contributing 100% of the alpha. Notable selection
strengths were in health care, financials, technology, and real estate sectors, while the two negative sectors consisted of consumer discretionary and utilities. Allocation choices slightly hindered performance. The strategy to overweight healthcare
and underweight energy and financials had a negative impact on results. Conversely, the decision to underweight utilities and real estate while overweighting industrials and technology contributed positively to performance.
The equity markets have gotten off to a good start in 2024, although there is concern that optimism is too high. Inflation is being closely watched for signs of trending higher and economic data needs
to be good, but not too good, to keep the Fed on target for rate cuts in the second half of the year. We do not expect a smooth path as investors’ expectations for rate changes oscillate. This will likely lead to volatility in equity markets and can
present opportunity for active management, particularly in more inefficient parts of the market like small caps. The combination of the CornerCap approach to diversified portfolios to mitigate some of the broader market volatility and continued
attractive valuations within small cap gives the investment team confidence in the Fund’s investment approach for the next fiscal year.
|
Annual Report | March 31, 2024
|
1
Manager’s Report to Shareholders (Unaudited)
March 31, 2024
|
CornerCap Investment Counsel
|
March 31, 2024
|
There are risks associated with investing including possible loss of principal. In addition to the normal risks of investing, funds focusing on smaller companies generally
experience greater price volatility. Investments in real estate securities are subject to risks inherent in the real estate market, including risk related to possible declines in the value of and demand for real estate, which may cause the value of
the Fund to decline.
The Russell 2000 Value Index is an index that measures the 2,000 smallest of the 3,000 largest U.S. Companies (based on total market capitalization) that have lower price-to-book
ratios and lower forecasted growth values. It is not possible to invest directly in an index.
The price-to-earnings (P/E) ratio measures a company’s share price relative to its earnings per share.
Alpha is used in finance as a measure of performance, indicating when a fund has managed to beat the market return or other benchmark over some period.
Must be proceeded or accompanied by a prospectus.
The CornerCap Small-Cap Value Fund is distributed by Foreside Fund Services, LLC.
|
www.cornercapfunds.com
|
2
Manager’s Report to Shareholders (Unaudited)
March 31, 2024
Investment Performance through March 31, 2024 (In Thousands)
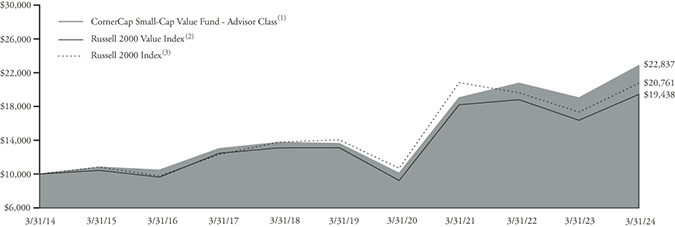
The chart assumes an initial investment of $10,000. Performance reflects waivers of fee and operating expenses in effect. In the absence of such waivers, total return would be
reduced. Performance data quoted represents past performance and does not guarantee future results. Investment returns and principal value will fluctuate, and when sold, may be worth more or less than their original cost. Performance current to the
most recent month-end may be lower or higher than the performance quoted and can be obtained by calling 888-813-8637. Performance assumes the reinvestment of capital gains and income distributions. The performance does not reflect the deduction of
taxes that a shareholder would pay on Fund distributions or the redemption of Fund shares.
Annualized Rates of Return as of March 31, 2024
|
1-Year
|
3-Year
|
5-Year
|
10-Year
|
Since Inception(5)
|
|
|
Advisor Class(1)
|
20.14%
|
6.28%
|
10.91%
|
8.61%
|
9.64%
|
|
Institutional Class(4)
|
20.43%
|
6.59%
|
11.22%
|
8.88%
|
9.73%
|
|
Russell 2000 Value Index(2)
|
18.75%
|
2.22%
|
8.17%
|
6.87%
|
10.13%
|
|
Russell 2000 Index(3)
|
19.71%
|
-0.10%
|
8.10%
|
7.58%
|
9.39%
|
|
(1)
|
Performance shown for Advisor Class is that of the Predecessor Fund’s Investor Shares (See Note 12), and is calculated using the fees and expenses in effect for the Investor
Shares during the periods shown, net of any applicable fee and expense limitations or waivers.
|
|
(2)
|
The Russell 2000 Value Index is an index that measures the 2,000 smallest of the 3,000 largest U.S. Companies (based on total market capitalization) that have lower
price-to-book ratios and lower forecasted growth values. It is not possible to invest directly in an index.
|
|
(3)
|
The Russell 2000 Index is an index that measures the performance of the 2,000 smallest companies in the Russell 3000® Index. The index figures do not reflect any deduction for fees, expenses or taxes. It is not possible to invest directly in an index.
|
|
(4)
|
Performance shown for Institutional Class is that of the Predecessor Fund’s Institutional Shares. Institutional Shares of the Predecessor Fund commenced operations on
December 29, 2015. Performance for the 10 year and Since Inception periods is a blended average annual return which includes the returns of Investor Shares of the Predecessor Fund (inception date September 30, 1992) prior to the commencement
of operations of Institutional Shares of the Predecessor Fund, and is calculated using the fees and expenses in effect for the Investor Shares during the periods shown, net of any applicable fee and expense limitations or waivers. If
Institutional Shares had been available during periods prior to December 29, 2015, the performance shown may have been different. The performance shown for the periods following the Predecessor Fund’s commencement of Institutional Shares
reflects the fees and expenses of Institutional Shares, net of any applicable fee and expense limitations or waivers.
|
|
(5)
|
Inception date of the Advisor Class was September 30, 1992 and the Institutional Class was December 29, 2015.
|
|
Annual Report | March 31, 2024
|
3
Manager’s Report to Shareholders (Unaudited)
March 31, 2024
The following is expense information for the CornerCap Small-Cap Value Fund as disclosed in the Fund’s most recent prospectus dated August 1, 2023:
|
Advisor Class Gross Expense Ratio: 1.45%
|
Net Expense Ratio: 1.25%
|
|
Institutional Class Gross Expense Ratio: 1.15%
|
Net Expense Ratio: 0.95%
|
CornerCap Investment Counsel, Inc. (the “Adviser”) has contractually agreed to waive a portion or all of its management fees and pay Fund expenses (excluding Rule 12b-1 fees, Shareholder Servicing Plan
fees, leverage/borrowing interest, interest expense, dividends paid on short sales, brokerage and other transactional expenses, acquired fund fees and expenses, expenses incurred in connection with any merger or reorganization, or extraordinary
expenses) in order to limit the total annual fund operating expenses to 0.95% of average daily net assets of the Fund. Fees waived and expenses paid by the Adviser may be recouped by the Adviser for a period of 36 months following the day on which
such fee waiver and/or expense payment was made, if such recoupment can be achieved without exceeding the expense limit in effect at the time the fee waiver and/or expense payment occurred and the expense limit in place at the time of recoupment. The
Operating Expenses Limitation Agreement cannot be terminated through at least November 18, 2025. Thereafter, the agreement may be terminated at any time upon 60 days’ written notice by the Trust’s Board of Trustees (the “Board”) or the Adviser.
|
www.cornercapfunds.com
|
4
Manager’s Report to Shareholders (Unaudited)
March 31, 2024
Allocation of Portfolio Net Assets(1)(2) at March 31, 2024 (% of Net Assets)

Top Ten Equity Holdings(1)
at March 31, 2024 (% of Net Assets)
|
Chord Energy Corp.
|
0.8%
|
|
|
International Game Technology PLC
|
0.7%
|
|
|
American Eagle Outfitters, Inc.
|
0.6%
|
|
|
Gates Industrial Corp. Plc
|
0.5%
|
|
|
Oshkosh Corp.
|
0.5%
|
|
|
Assurant, Inc.
|
0.5%
|
|
|
Helix Energy Solutions Group, Inc.
|
0.5%
|
|
|
Gulfport Energy Corp.
|
0.5%
|
|
|
Hillman Solutions Corp.
|
0.5%
|
|
|
R1 RCM, Inc.
|
0.5%
|
|
(1)
|
Fund holdings and sector allocations are subject to change at any time and are not recommendations to buy or sell any security.
|
|
(2)
|
Excludes securities lending collateral.
|
|
Annual Report | March 31, 2024
|
5
Fund Expenses (Unaudited)
March 31, 2024
As a shareholder of a Fund, you incur two types of costs: (1) transaction costs, including brokerage commissions on purchases and sales of Fund shares, and (2) ongoing costs, including management fees,
distribution and/or service (12b-1) fees, interest expense, and other Fund expenses. This Example is intended to help you understand your ongoing costs (in dollars) of investing in a Fund and to compare these costs with the ongoing costs of investing
in other mutual funds. The Example is based on an investment of $1,000 invested at the beginning of the period and held for the entire period (October 1, 2023 – March 31, 2024).
Actual Expenses – For each class, the first line of each table provides information about actual account values and actual expenses. You may use the information
in this line, together with the amount you invested, to estimate the expenses that you paid over the period. Simply divide your account value by $1,000 (for example, an $8,600 account value divided by $1,000 = 8.6), then multiply the result by the
number in the first line under the heading entitled “Expenses Paid During Period” to estimate the expenses you paid on your account during this period.
Hypothetical Example for Comparison Purposes – For each class, the second line of each table below provides information about hypothetical account values and
hypothetical expenses based on the Fund’s actual expense ratio and an assumed rate of return of 5% per year before expenses, which is not the Fund’s actual return. The hypothetical account values and expenses may not be used to estimate the actual
ending account balance or expenses you paid for the period. You may use this information to compare the ongoing costs of investing in the Fund and other funds. To do so, compare this 5% hypothetical example with the 5% hypothetical examples that
appear in the shareholder reports of the other funds.
Please note that the expenses shown in the tables are meant to highlight your ongoing costs only and do not reflect any transactional costs. Therefore, the second line of each table
for each class is useful in comparing ongoing costs only and will not help you determine the relative total costs of owning different funds. In addition, if transactional costs were included, your costs may have been higher.
|
Beginning
|
Ending
|
Expenses Paid
|
|
|
Account Value
|
Account Value
|
During Period(1)
|
|
|
(10/1/2023)
|
(3/31/2024)
|
(10/1/2023 – 3/31/2024)
|
|
|
Advisor Class
|
|||
|
Actual(2)
|
$1,000.00
|
$1,192.70
|
$6.85
|
|
Hypothetical (5% return before expenses)
|
$1,000.00
|
$1,018.75
|
$6.31
|
|
Institutional Class
|
|||
|
Actual(2)
|
$1,000.00
|
$1,193.80
|
$5.21
|
|
Hypothetical (5% return before expenses)
|
$1,000.00
|
$1,020.25
|
$4.80
|
|
(1)
|
Expenses are equal to the Fund’s annualized expense ratio for the most recent six-month period of 1.25% and 0.95% for the Advisor Class and Institutional Class, respectively,
multiplied by the average account value over the period, multiplied by 183/366 to reflect the one-half year period.
|
|
(2)
|
Based on the actual returns for the six-month period ended March 31, 2024, of 19.27% and 19.38% for the Advisor Class and Institutional Class, respectively.
|
|
www.cornercapfunds.com
|
6
Schedule of Investments
March 31, 2024
|
Shares
|
Value
|
|||||||
|
COMMON STOCKS – 99.1%
|
||||||||
|
Agriculture – 1.0%
|
||||||||
|
Andersons, Inc.
|
5,862
|
$
|
336,303
|
|||||
|
Dole Plc
|
22,080
|
263,414
|
||||||
|
Fresh Del Monte Produce, Inc.
|
8,670
|
224,640
|
||||||
|
Vector Group Ltd.
|
50,071
|
548,778
|
||||||
|
1,373,135
|
||||||||
|
Apparel – 0.2%
|
||||||||
|
Carter’s, Inc. (a)
|
3,433
|
290,706
|
||||||
|
Auto Manufacturers – 0.8%
|
||||||||
|
Blue Bird Corp. (b)
|
12,613
|
483,582
|
||||||
|
REV Group, Inc.
|
28,265
|
624,374
|
||||||
|
1,107,956
|
||||||||
|
Auto Parts & Equipment – 2.1%
|
||||||||
|
Allison Transmission Holdings, Inc.
|
6,898
|
559,841
|
||||||
|
Commercial Vehicle Group, Inc.(b)
|
35,415
|
227,718
|
||||||
|
Dorman Products, Inc.(b)
|
2,798
|
269,699
|
||||||
|
Gentex Corp.
|
16,623
|
600,423
|
||||||
|
Standard Motor Products, Inc.
|
13,425
|
450,409
|
||||||
|
Titan International, Inc. (a)(b)
|
21,887
|
272,712
|
||||||
|
Visteon Corp.(b)
|
3,995
|
469,852
|
||||||
|
2,850,654
|
||||||||
|
Banks – 12.5%
|
||||||||
|
Amalgamated Financial Corp.
|
10,708
|
256,992
|
||||||
|
Ameris Bancorp
|
11,807
|
571,223
|
||||||
|
Bank OZK (a)
|
12,324
|
560,249
|
||||||
|
Bridgewater Bancshares, Inc. (b)
|
21,252
|
247,373
|
||||||
|
Business First Bancshares, Inc.
|
10,639
|
237,037
|
||||||
|
Byline Bancorp, Inc.
|
25,777
|
559,875
|
||||||
|
Capital City Bank Group, Inc.
|
15,640
|
433,228
|
||||||
|
Cathay General Bancorp
|
6,359
|
240,561
|
||||||
|
Central Pacific Financial Corp.
|
13,550
|
267,613
|
||||||
|
Columbia Banking System, Inc.
|
22,434
|
434,098
|
||||||
|
Community Trust Bancorp, Inc.
|
5,829
|
248,607
|
||||||
|
ConnectOne Bancorp, Inc.
|
12,886
|
251,277
|
||||||
|
CrossFirst Bankshares, Inc. (b)
|
47,336
|
655,131
|
||||||
|
Customers Bancorp, Inc. (b)
|
10,261
|
544,449
|
||||||
|
Dime Community Bancshares, Inc.
|
13,348
|
257,082
|
||||||
|
Eastern Bankshares, Inc.
|
19,129
|
263,598
|
||||||
|
Enterprise Financial Services Corp.
|
13,257
|
537,704
|
||||||
|
Equity Bancshares, Inc. – Class A
|
7,117
|
244,611
|
||||||
|
Financial Institutions, Inc.
|
12,607
|
237,264
|
||||||
|
First Bancshares Inc.
|
10,549
|
273,747
|
||||||
|
First Commonwealth Financial Corp.
|
35,591
|
495,427
|
||||||
|
First Foundation, Inc.
|
35,846
|
270,637
|
||||||
The accompanying notes to financial statements are an integral part of these financial statements.
|
Annual Report | March 31, 2024
|
7
Schedule of Investments (continued)
March 31, 2024
|
Shares
|
Value
|
|||||||
|
Banks – 12.5% (continued)
|
||||||||
|
First Internet Bancorp
|
8,187
|
$
|
284,416
|
|||||
|
First Mid Bancshares, Inc.
|
7,213
|
235,721
|
||||||
|
FNB Corp./PA
|
41,268
|
581,879
|
||||||
|
Hancock Whitney Corp.
|
5,824
|
268,137
|
||||||
|
Hanmi Financial Corp. (a)
|
34,212
|
544,655
|
||||||
|
Horizon Bancorp Inc.
|
19,829
|
254,406
|
||||||
|
Independent Bank Corp.
|
5,122
|
266,446
|
||||||
|
Mercantile Bank Corp.
|
14,206
|
546,789
|
||||||
|
Merchants Bancorp/IN
|
5,708
|
246,471
|
||||||
|
Metropolitan Bank Holding Corp. (b)
|
4,679
|
180,142
|
||||||
|
Northfield Bancorp, Inc.
|
25,665
|
249,464
|
||||||
|
Peoples Bancorp, Inc./OH
|
18,032
|
533,928
|
||||||
|
Pinnacle Financial Partners, Inc. (a)
|
5,515
|
473,628
|
||||||
|
Preferred Bank Los Angeles (a)
|
3,460
|
265,624
|
||||||
|
Premier Financial Corp.
|
10,782
|
218,875
|
||||||
|
Primis Financial Corp.
|
18,725
|
227,883
|
||||||
|
Provident Financial Services, Inc.
|
33,427
|
487,031
|
||||||
|
QCR Holdings, Inc.
|
4,490
|
272,723
|
||||||
|
Shore Bancshares, Inc.
|
22,523
|
259,015
|
||||||
|
Southern First Bancshares, Inc. (b)
|
8,168
|
259,416
|
||||||
|
Valley National Bancorp (a)
|
65,022
|
517,575
|
||||||
|
Webster Financial Corp.
|
12,018
|
610,154
|
||||||
|
Western Alliance Bancorp
|
10,506
|
674,380
|
||||||
|
Wintrust Financial Corp. (a)
|
4,798
|
500,863
|
||||||
|
17,047,404
|
||||||||
|
Beverages – 0.6%
|
||||||||
|
Primo Water Corp. (a)
|
15,944
|
290,340
|
||||||
|
The Boston Beer Co. Inc. – Class A (b)
|
653
|
198,786
|
||||||
|
Vita Coco Co., Inc. (a)(b)
|
12,535
|
306,230
|
||||||
|
|
795,356
|
|||||||
|
Biotechnology – 5.4%
|
||||||||
|
Adicet Bio, Inc. (b)
|
18,074
|
42,474
|
||||||
|
Aldeyra Therapeutics, Inc. (a)(b)
|
27,962
|
91,436
|
||||||
|
Allogene Therapeutics, Inc. (a)(b)
|
28,533
|
127,543
|
||||||
|
ANI Pharmaceuticals, Inc. (b)
|
5,680
|
392,658
|
||||||
|
Annexon, Inc. (b)
|
22,604
|
162,071
|
||||||
|
Arcus Biosciences, Inc. (b)
|
6,192
|
116,905
|
||||||
|
Athira Pharma, Inc. (b)
|
37,648
|
103,156
|
||||||
|
BioAtla, Inc. (b)
|
29,805
|
102,529
|
||||||
|
Black Diamond Therapeutics, Inc. (b)
|
22,583
|
114,496
|
||||||
|
Caribou Biosciences, Inc. (b)
|
16,522
|
84,923
|
||||||
|
Century Therapeutics, Inc. (b)
|
25,978
|
108,588
|
||||||
|
Cogent Biosciences, Inc. (b)
|
16,165
|
108,629
|
||||||
|
Cue Biopharma, Inc. (b)
|
28,405
|
53,685
|
||||||
|
Cullinan Oncology, Inc. (b)
|
8,053
|
137,223
|
||||||
|
CytomX Therapeutics, Inc. (b)
|
41,458
|
90,378
|
||||||
The accompanying notes to financial statements are an integral part of these financial statements.
|
www.cornercapfunds.com
|
8
Schedule of Investments (continued)
March 31, 2024
|
Shares
|
Value
|
|||||||
|
Biotechnology – 5.4% (continued)
|
||||||||
|
Deciphera Pharmaceuticals, Inc. (b)
|
7,514
|
$
|
118,195
|
|||||
|
Editas Medicine, Inc. (b)
|
9,513
|
70,586
|
||||||
|
Entrada Therapeutics, Inc. (b)
|
5,752
|
81,506
|
||||||
|
Erasca, Inc. (b)
|
27,198
|
56,028
|
||||||
|
Exelixis, Inc. (b)
|
24,903
|
590,947
|
||||||
|
Fate Therapeutics, Inc. (b)
|
20,683
|
151,813
|
||||||
|
Generation Bio Co. (b)
|
44,094
|
179,463
|
||||||
|
Halozyme Therapeutics, Inc. (b)
|
12,552
|
510,615
|
||||||
|
Ikena Oncology, Inc. (b)
|
14,078
|
19,991
|
||||||
|
Intellia Therapeutics, Inc. (b)
|
3,072
|
84,511
|
||||||
|
Ionis Pharmaceuticals, Inc. (b)
|
1,751
|
75,906
|
||||||
|
Iovance Biotherapeutics, Inc. (a)(b)
|
13,248
|
196,336
|
||||||
|
iTeos Therapeutics, Inc. (b)
|
6,219
|
84,827
|
||||||
|
Kronos Bio, Inc. (b)
|
14,607
|
18,989
|
||||||
|
LENZ Therapeutics, Inc.
|
5,026
|
112,231
|
||||||
|
MacroGenics, Inc. (b)
|
6,314
|
92,942
|
||||||
|
MeiraGTx Holdings Plc (b)
|
13,290
|
80,670
|
||||||
|
Monte Rosa Therapeutics, Inc. (b)
|
19,236
|
135,614
|
||||||
|
Nurix Therapeutics, Inc. (b)
|
9,383
|
137,930
|
||||||
|
Nuvation Bio, Inc. (b)
|
64,161
|
233,546
|
||||||
|
Poseida Therapeutics, Inc. (b)
|
43,177
|
137,735
|
||||||
|
Prime Medicine, Inc. (a)(b)
|
13,774
|
96,418
|
||||||
|
Pyxis Oncology, Inc. (a)(b)
|
36,737
|
156,499
|
||||||
|
REGENXBIO, Inc. (b)
|
5,601
|
118,013
|
||||||
|
Relay Therapeutics, Inc. (b)
|
10,811
|
89,731
|
||||||
|
Replimune Group, Inc.(b)
|
12,167
|
99,404
|
||||||
|
Sage Therapeutics, Inc. (b)
|
5,294
|
99,210
|
||||||
|
Sutro Biopharma, Inc. (b)
|
18,563
|
104,881
|
||||||
|
Tenaya Therapeutics, Inc. (b)
|
30,222
|
158,061
|
||||||
|
Ultragenyx Pharmaceutical, Inc. (b)
|
2,430
|
113,457
|
||||||
|
United Therapeutics Corp. (b)
|
2,027
|
465,642
|
||||||
|
Verastem, Inc. (b)
|
11,810
|
139,358
|
||||||
|
Verve Therapeutics, Inc. (b)
|
7,310
|
97,077
|
||||||
|
Vir Biotechnology, Inc. (b)
|
10,587
|
107,246
|
||||||
|
WaVe Life Sciences Ltd. (b)
|
25,296
|
156,076
|
||||||
|
Zentalis Pharmaceuticals, Inc. (b)
|
6,108
|
96,262
|
||||||
|
Zymeworks, Inc. (b)
|
12,571
|
132,247
|
||||||
|
7,236,658
|
||||||||
|
Building Materials – 1.5%
|
||||||||
|
American Woodmark Corp. (b)
|
6,080
|
618,093
|
||||||
|
Apogee Enterprises, Inc.
|
5,158
|
305,354
|
||||||
|
Gibraltar Industries, Inc. (b)
|
6,818
|
549,054
|
||||||
|
Masterbrand, Inc. (b)
|
14,170
|
265,546
|
||||||
|
Mohawk Industries, Inc. (b)
|
2,751
|
360,078
|
||||||
|
|
2,098,125
|
|||||||
The accompanying notes to financial statements are an integral part of these financial statements.
|
Annual Report | March 31, 2024
|
9
Schedule of Investments (continued)
March 31, 2024
|
Shares
|
Value
|
|||||||
|
Chemicals – 1.1%
|
||||||||
|
Ecovyst, Inc.(b)
|
24,122
|
$
|
268,960
|
|||||
|
Minerals Technologies, Inc.
|
8,168
|
614,887
|
||||||
|
Quaker Chemical Corp.
|
2,870
|
589,068
|
||||||
|
1,472,915
|
||||||||
|
Coal – 0.2%
|
||||||||
|
Ramaco Resources, Inc.(b)
|
14,383
|
242,210
|
||||||
|
Commercial Services – 7.4%
|
||||||||
|
Aaron’s Co., Inc.
|
43,507
|
326,303
|
||||||
|
ABM Industries, Inc.
|
11,195
|
499,521
|
||||||
|
ADT, Inc.
|
80,481
|
540,832
|
||||||
|
Adtalem Global Education, Inc. (b)
|
10,171
|
522,789
|
||||||
|
Alarm.com Holdings, Inc. (b)
|
7,603
|
550,989
|
||||||
|
Alight, Inc. – Class A (b)
|
29,111
|
286,743
|
||||||
|
Brink’s Co.
|
2,889
|
266,886
|
||||||
|
Dun & Bradstreet Holdings, Inc.
|
25,015
|
251,151
|
||||||
|
Ennis, Inc.
|
10,496
|
215,273
|
||||||
|
Euronet Worldwide, Inc. (b)
|
5,581
|
613,520
|
||||||
|
Forrester Research, Inc. (b)
|
18,955
|
408,670
|
||||||
|
Healthcare Services Group, Inc. (b)
|
44,048
|
549,719
|
||||||
|
Herc Holdings, Inc.
|
1,938
|
326,165
|
||||||
|
John Wiley & Sons, Inc. – Class A
|
15,103
|
575,877
|
||||||
|
LiveRamp Holdings, Inc. (b)
|
15,081
|
520,295
|
||||||
|
Perdoceo Education Corp.
|
14,922
|
262,030
|
||||||
|
Progyny, Inc. (a)(b)
|
14,029
|
535,206
|
||||||
|
R1 RCM, Inc. (b)
|
52,529
|
676,574
|
||||||
|
Stride, Inc. (b)
|
5,332
|
336,183
|
||||||
|
Upbound Group, Inc. (a)
|
15,210
|
535,544
|
||||||
|
V2X, Inc. (b)
|
12,058
|
563,229
|
||||||
|
WEX, Inc. (a)(b)
|
2,385
|
566,509
|
||||||
|
9,930,008
|
||||||||
|
Computers – 2.5%
|
||||||||
|
Crane NXT Co.
|
4,207
|
260,413
|
||||||
|
ExlService Holdings, Inc. (b)
|
8,524
|
271,063
|
||||||
|
Genpact Ltd.
|
13,695
|
451,250
|
||||||
|
Maximus, Inc.
|
6,173
|
517,915
|
||||||
|
NetScout Systems, Inc. (b)
|
22,626
|
494,152
|
||||||
|
OneSpan, Inc. (b)
|
23,189
|
269,688
|
||||||
|
Rapid7, Inc. (a)(b)
|
5,207
|
255,351
|
||||||
|
TaskUS, Inc. – Class A (a)(b)
|
17,362
|
202,267
|
||||||
|
Tenable Holdings, Inc. (b)
|
5,466
|
270,185
|
||||||
|
TTEC Holdings, Inc.
|
26,883
|
278,777
|
||||||
|
3,271,061
|
||||||||
|
Distribution/Wholesale – 0.2%
|
||||||||
|
MRC Global, Inc.(b)
|
20,245
|
254,480
|
||||||
The accompanying notes to financial statements are an integral part of these financial statements.
|
www.cornercapfunds.com
|
10
Schedule of Investments (continued)
March 31, 2024
|
Shares
|
Value
|
|||||||
|
Diversified Financial Services – 3.1%
|
||||||||
|
Affiliated Managers Group, Inc.
|
3,229
|
$
|
540,760
|
|||||
|
BGC Group, Inc. – Class A
|
60,032
|
466,448
|
||||||
|
Bridge Investment Group Holdings, Inc. – Class A
|
39,514
|
270,671
|
||||||
|
Federated Hermes, Inc. – Class B
|
13,899
|
502,032
|
||||||
|
International Money Express, Inc. (b)
|
11,530
|
263,230
|
||||||
|
Invesco Ltd.
|
16,755
|
277,965
|
||||||
|
StoneX Group, Inc. (b)
|
3,889
|
273,241
|
||||||
|
Victory Capital Holdings, Inc. – Class A
|
8,519
|
361,461
|
||||||
|
Virtu Financial, Inc. – Class A
|
29,967
|
614,923
|
||||||
|
Virtus Investment Partners, Inc.
|
1,104
|
273,770
|
||||||
|
Western Union Co.
|
19,054
|
266,375
|
||||||
|
4,110,876
|
||||||||
|
Electric – 1.4%
|
||||||||
|
ALLETE, Inc.
|
8,157
|
486,483
|
||||||
|
Avista Corp. (a)
|
14,196
|
497,144
|
||||||
|
Black Hills Corp.
|
9,462
|
516,625
|
||||||
|
NorthWestern Energy Group, Inc.
|
8,876
|
452,055
|
||||||
|
1,952,307
|
||||||||
|
Electrical Components & Equipment – 0.9%
|
||||||||
|
Energizer Holdings, Inc.
|
6,930
|
204,019
|
||||||
|
EnerSys
|
5,274
|
498,182
|
||||||
|
Generac Holdings, Inc. (b)
|
4,541
|
572,802
|
||||||
|
1,275,003
|
||||||||
|
Electronics – 1.8%
|
||||||||
|
Allient, Inc.
|
8,695
|
310,238
|
||||||
|
Brady Corp. – Class A
|
7,974
|
472,698
|
||||||
|
Itron, Inc. (b)
|
3,878
|
358,793
|
||||||
|
Sanmina Corp. (b)
|
8,560
|
532,260
|
||||||
|
Sensata Technologies Holding Plc
|
14,124
|
518,916
|
||||||
|
TTM Technologies, Inc. (b)
|
18,024
|
282,076
|
||||||
|
2,474,981
|
||||||||
|
Energy – Alternate Sources – 0.5%
|
||||||||
|
REX American Resources Corp. (b)
|
11,482
|
674,108
|
||||||
|
|
||||||||
|
Engineering & Construction – 1.7%
|
||||||||
|
Fluor Corp. (b)
|
6,689
|
282,811
|
||||||
|
Frontdoor, Inc. (b)
|
6,910
|
225,128
|
||||||
|
Granite Construction, Inc. (a)
|
4,821
|
275,424
|
||||||
|
Great Lakes Dredge & Dock Corp. (b)
|
30,697
|
268,599
|
||||||
|
Latham Group, Inc. (b)
|
105,699
|
418,568
|
||||||
|
Primoris Services Corp.
|
14,145
|
602,152
|
||||||
|
Tutor Perini Corp. (b)
|
18,582
|
268,696
|
||||||
|
2,341,378
|
||||||||
The accompanying notes to financial statements are an integral part of these financial statements.
|
Annual Report | March 31, 2024
|
11
Schedule of Investments (continued)
March 31, 2024
|
Shares
|
Value
|
|||||||
|
Entertainment – 1.6%
|
||||||||
|
Accel Entertainment, Inc. (b)
|
44,083
|
$
|
519,739
|
|||||
|
Everi Holdings, Inc. (b)
|
42,268
|
424,793
|
||||||
|
International Game Technology Plc
|
41,753
|
943,200
|
||||||
|
Monarch Casino & Resort, Inc.
|
3,354
|
251,516
|
||||||
|
2,139,248
|
||||||||
|
Food – 0.2%
|
||||||||
|
Post Holdings, Inc. (b)
|
2,591
|
275,371
|
||||||
|
Gas – 1.0%
|
||||||||
|
National Fuel Gas Co.
|
8,888
|
477,463
|
||||||
|
Northwest Natural Holding Co.
|
12,592
|
468,674
|
||||||
|
ONE Gas, Inc. (a)
|
3,912
|
252,441
|
||||||
|
UGI Corp.
|
10,779
|
264,517
|
||||||
|
1,463,095
|
||||||||
|
Hand/Machine Tools – 0.2%
|
||||||||
|
Kennametal, Inc.
|
10,747
|
268,030
|
||||||
|
Healthcare-Products – 1.7%
|
||||||||
|
CONMED Corp. (a)
|
3,078
|
246,486
|
||||||
|
Haemonetics Corp. (b)
|
6,930
|
591,476
|
||||||
|
Integer Holdings Corp. (a)(b)
|
5,736
|
669,276
|
||||||
|
LeMaitre Vascular, Inc.
|
4,454
|
295,567
|
||||||
|
Semler Scientific, Inc. (b)
|
8,324
|
243,144
|
||||||
|
Tactile Systems Technology, Inc. (b)
|
16,179
|
262,909
|
||||||
|
2,308,858
|
||||||||
|
Healthcare-Services – 1.8%
|
||||||||
|
Addus HomeCare Corp. (a)(b)
|
5,537
|
572,194
|
||||||
|
Encompass Health Corp.
|
3,295
|
272,101
|
||||||
|
HealthEquity, Inc. (b)
|
7,405
|
604,470
|
||||||
|
Pennant Group, Inc. (b)
|
15,522
|
304,697
|
||||||
|
Select Medical Holdings Corp.
|
17,134
|
516,590
|
||||||
|
Viemed Healthcare, Inc. (b)
|
24,684
|
232,770
|
||||||
|
2,502,822
|
||||||||
|
Home Builders – 0.6%
|
||||||||
|
Forestar Group, Inc. (b)
|
11,991
|
481,918
|
||||||
|
Meritage Homes Corp.
|
1,632
|
286,351
|
||||||
|
768,269
|
||||||||
|
Home Furnishings – 0.3%
|
||||||||
|
Hooker Furnishings Corp.
|
9,728
|
233,569
|
||||||
|
Lovesac Co. (a)(b)
|
9,417
|
212,824
|
||||||
|
446,393
|
||||||||
|
Household Products/Wares – 0.9%
|
||||||||
|
ACCO Brands Corp.
|
42,401
|
237,870
|
||||||
|
Helen of Troy Ltd. (a)(b)
|
4,030
|
464,417
|
||||||
The accompanying notes to financial statements are an integral part of these financial statements.
|
www.cornercapfunds.com
|
12
Schedule of Investments (continued)
March 31, 2024
|
Shares
|
Value
|
|||||||
|
Household Products/Wares – 0.9% (continued)
|
||||||||
|
Quanex Building Products Corp.
|
7,493
|
$
|
287,956
|
|||||
|
Reynolds Consumer Products, Inc.
|
8,978
|
256,412
|
||||||
|
1,246,655
|
||||||||
|
Housewares – 0.4%
|
||||||||
|
Newell Brands, Inc.
|
69,102
|
554,889
|
||||||
|
Insurance – 3.2%
|
||||||||
|
Assurant, Inc.
|
3,825
|
720,019
|
||||||
|
BRP Group, Inc. – Class A (a)(b)
|
19,229
|
556,487
|
||||||
|
CNO Financial Group, Inc.
|
9,748
|
267,875
|
||||||
|
Essent Group Ltd.
|
4,765
|
283,565
|
||||||
|
F&G Annuities & Life, Inc.
|
6,837
|
277,240
|
||||||
|
Goosehead Insurance, Inc. – Class A (a)(b)
|
3,134
|
208,787
|
||||||
|
James River Group Holdings Ltd.
|
27,058
|
251,639
|
||||||
|
Lincoln National Corp.
|
18,582
|
593,323
|
||||||
|
Mercury General Corp.
|
5,118
|
264,089
|
||||||
|
NMI Holdings, Inc. – Class A – Class A (b)
|
8,715
|
281,843
|
||||||
|
Skyward Specialty Insurance Group, Inc. (b)
|
9,773
|
365,608
|
||||||
|
Universal Insurance Holdings, Inc.
|
14,148
|
287,487
|
||||||
|
4,357,962
|
||||||||
|
Internet – 2.1%
|
||||||||
|
1-800-Flowers.com, Inc. – Class A (b)
|
23,383
|
253,238
|
||||||
|
Eventbrite, Inc. – Class A (b)
|
60,289
|
330,384
|
||||||
|
HealthStream, Inc.
|
10,110
|
269,533
|
||||||
|
Liquidity Services, Inc. (b)
|
14,346
|
266,836
|
||||||
|
Magnite, Inc. (a)(b)
|
28,830
|
309,923
|
||||||
|
Solo Brands, Inc. – Class A (a)(b)
|
80,142
|
173,908
|
||||||
|
TripAdvisor, Inc. (b)
|
19,011
|
528,315
|
||||||
|
Upwork, Inc. (b)
|
16,334
|
200,255
|
||||||
|
Yelp, Inc. (b)
|
14,203
|
559,598
|
||||||
|
2,891,990
|
||||||||
|
Iron/Steel – 0.9%
|
||||||||
|
Carpenter Technology Corp.
|
9,229
|
659,136
|
||||||
|
Universal Stainless & Alloy Products, Inc. (b)
|
12,465
|
279,465
|
||||||
|
Worthington Steel, Inc.
|
7,672
|
275,041
|
||||||
|
1,213,642
|
||||||||
|
Lodging – 0.9%
|
||||||||
|
Boyd Gaming Corp.
|
9,126
|
614,363
|
||||||
|
Travel + Leisure Co.
|
12,443
|
609,209
|
||||||
|
|
1,223,572
|
|||||||
|
Machinery – Construction & Mining – 1.2%
|
||||||||
|
Hyster-Yale Materials Handling, Inc.
|
10,441
|
669,999
|
||||||
|
Oshkosh Corp.
|
5,882
|
733,544
|
||||||
The accompanying notes to financial statements are an integral part of these financial statements.
|
Annual Report | March 31, 2024
|
13
Schedule of Investments (continued)
March 31, 2024
|
Shares
|
Value
|
|||||||
|
Machinery – Construction & Mining – 1.2% (continued)
|
||||||||
|
Terex Corp.
|
4,274
|
$
|
275,246
|
|||||
|
1,678,789
|
||||||||
|
Machinery-Diversified – 0.9%
|
||||||||
|
Columbus McKinnon Corp.
|
13,464
|
600,898
|
||||||
|
Gates Industrial Corp. Plc (b)
|
42,015
|
744,086
|
||||||
|
1,344,984
|
||||||||
|
Media – 0.7%
|
||||||||
|
Cable One, Inc. (a)
|
885
|
374,470
|
||||||
|
Scholastic Corp.
|
12,959
|
488,684
|
||||||
|
863,154
|
||||||||
|
Metal Fabricate & Hardware – 1.6%
|
||||||||
|
Hillman Solutions Corp.(b)
|
63,664
|
677,384
|
||||||
|
Metallus, Inc. (a)(b)
|
22,811
|
507,545
|
||||||
|
Park-Ohio Holdings Corp.
|
9,970
|
266,000
|
||||||
|
Ryerson Holding Corp.
|
8,110
|
271,685
|
||||||
|
Worthington Enterprises, Inc. (a)
|
7,672
|
477,429
|
||||||
|
2,200,043
|
||||||||
|
Office Furnishings – 0.4%
|
||||||||
|
Steelcase, Inc. – Class A
|
40,881
|
534,723
|
||||||
|
Oil & Gas – 3.9%
|
||||||||
|
Berry Corp.
|
71,774
|
577,781
|
||||||
|
California Resources Corp. (a)
|
5,277
|
290,763
|
||||||
|
Callon Petroleum Co. (b)
|
6,883
|
246,136
|
||||||
|
Chord Energy Corp. (a)
|
6,218
|
1,108,296
|
||||||
|
Evolution Petroleum Corp.
|
80,892
|
496,677
|
||||||
|
Gulfport Energy Corp. (b)
|
4,369
|
699,565
|
||||||
|
Noble Corp. Plc
|
5,372
|
260,488
|
||||||
|
Ovintiv, Inc.
|
11,169
|
579,671
|
||||||
|
Riley Exploration Permian, Inc.
|
14,134
|
466,422
|
||||||
|
Sitio Royalties Corp. – Class A
|
10,695
|
264,380
|
||||||
|
VAALCO Energy, Inc.
|
42,924
|
299,180
|
||||||
|
5,289,359
|
||||||||
|
Oil & Gas Services – 1.0%
|
||||||||
|
Archrock, Inc.
|
18,917
|
372,097
|
||||||
|
Helix Energy Solutions Group, Inc. (b)
|
64,645
|
700,752
|
||||||
|
Newpark Resources, Inc. (b)
|
37,325
|
269,487
|
||||||
|
1,342,336
|
||||||||
|
Packaging & Containers – 1.5%
|
||||||||
|
Berry Global Group, Inc.
|
8,781
|
531,075
|
||||||
|
Clearwater Paper Corp. (b)
|
15,182
|
663,909
|
||||||
|
Pactiv Evergreen, Inc.
|
33,159
|
474,837
|
||||||
The accompanying notes to financial statements are an integral part of these financial statements.
|
www.cornercapfunds.com
|
14
Schedule of Investments (continued)
March 31, 2024
|
Shares
|
Value
|
|||||||
|
Packaging & Containers – 1.5% (continued)
|
||||||||
|
TriMas Corp. (a)
|
18,062
|
$
|
482,797
|
|||||
|
2,152,618
|
||||||||
|
Pharmaceuticals – 4.1%
|
||||||||
|
AdaptHealth Corp. (b)
|
23,292
|
268,091
|
||||||
|
Alector, Inc. (b)
|
11,767
|
70,837
|
||||||
|
Alkermes Plc (a)(b)
|
18,052
|
488,669
|
||||||
|
Arvinas, Inc. (b)
|
2,076
|
85,697
|
||||||
|
Collegium Pharmaceutical, Inc. (a)(b)
|
10,395
|
403,534
|
||||||
|
Corcept Therapeutics, Inc. (b)
|
9,212
|
232,050
|
||||||
|
Enanta Pharmaceuticals, Inc. (b)
|
6,712
|
117,192
|
||||||
|
Foghorn Therapeutics, Inc. (a)(b)
|
13,147
|
88,216
|
||||||
|
GoodRx Holdings, Inc. – Class A (b)
|
36,489
|
259,072
|
||||||
|
Gritstone bio, Inc. (a)(b)
|
40,619
|
104,391
|
||||||
|
Harmony Biosciences Holdings, Inc. (a)(b)
|
8,790
|
295,168
|
||||||
|
Herbalife Nutrition Ltd. (b)
|
10,784
|
108,379
|
||||||
|
Lyell Immunopharma, Inc. (b)
|
47,763
|
106,511
|
||||||
|
Option Care Health, Inc. (b)
|
15,835
|
531,106
|
||||||
|
Pacira BioSciences, Inc. (a)(b)
|
17,353
|
507,056
|
||||||
|
Perrigo Co Plc
|
14,746
|
474,674
|
||||||
|
PetIQ, Inc. (b)
|
26,441
|
483,341
|
||||||
|
Premier, Inc. – Class A
|
22,032
|
486,907
|
||||||
|
USANA Health Sciences, Inc. (b)
|
4,901
|
237,699
|
||||||
|
Vanda Pharmaceuticals, Inc. (b)
|
16,101
|
66,175
|
||||||
|
Voyager Therapeutics, Inc. (b)
|
10,937
|
101,823
|
||||||
|
5,516,588
|
||||||||
|
Pipelines – 0.2%
|
||||||||
|
EnLink Midstream LLC
|
19,612
|
267,508
|
||||||
|
Real Estate – 7.5%
|
||||||||
|
American Assets Trust, Inc.
|
21,225
|
465,040
|
||||||
|
Brixmor Property Group, Inc. (a)
|
20,455
|
479,670
|
||||||
|
Broadstone Net Lease, Inc.
|
26,835
|
420,504
|
||||||
|
CareTrust REIT, Inc.
|
18,600
|
453,282
|
||||||
|
Chatham Lodging Trust
|
38,119
|
385,383
|
||||||
|
COPT Defense Properties
|
15,916
|
384,690
|
||||||
|
EastGroup Properties, Inc.
|
2,203
|
396,033
|
||||||
|
EPR Properties
|
11,602
|
492,505
|
||||||
|
Essential Properties Realty Trust, Inc. (a)
|
19,479
|
519,310
|
||||||
|
Getty Realty Corp.
|
12,276
|
335,749
|
||||||
|
Independence Realty Trust, Inc. (a)
|
35,976
|
580,292
|
||||||
|
Innovative Industrial Properties, Inc. (a)
|
5,445
|
563,775
|
||||||
|
LXP Industrial Trust
|
21,572
|
194,579
|
||||||
|
National Health Investors, Inc.
|
7,200
|
452,375
|
||||||
|
NETSTREIT Corp. (a)
|
22,126
|
406,455
|
||||||
|
Park Hotels & Resorts, Inc.
|
35,218
|
615,962
|
||||||
The accompanying notes to financial statements are an integral part of these financial statements.
|
Annual Report | March 31, 2024
|
15
Schedule of Investments (continued)
March 31, 2024
|
Shares
|
Value
|
|||||||
|
Real Estate – 7.5% (continued)
|
||||||||
|
Phillips Edison & Co, Inc.
|
12,017
|
$
|
431,050
|
|||||
|
Plymouth Industrial REIT, Inc.
|
16,735
|
376,538
|
||||||
|
RE/MAX Holdings, Inc. – Class A
|
22,615
|
198,334
|
||||||
|
Retail Opportunity Investments Corp. (a)
|
32,639
|
418,432
|
||||||
|
RLJ Lodging Trust
|
37,575
|
444,137
|
||||||
|
Sabra Health Care REIT, Inc.
|
28,584
|
422,186
|
||||||
|
Terreno Realty Corp.
|
6,513
|
432,463
|
||||||
|
UMH Properties, Inc.
|
24,328
|
395,087
|
||||||
|
10,263,832
|
||||||||
|
Retail – 2.5%
|
||||||||
|
American Eagle Outfitters, Inc. (a)
|
30,384
|
783,603
|
||||||
|
Brinker International, Inc. (a)(b)
|
7,570
|
376,078
|
||||||
|
Build-A-Bear Workshop, Inc. (a)
|
10,845
|
323,940
|
||||||
|
Caleres, Inc.(a)
|
15,891
|
652,008
|
||||||
|
El Pollo Loco Holdings, Inc. (b)
|
25,047
|
243,958
|
||||||
|
FirstCash Holdings, Inc.
|
2,001
|
255,208
|
||||||
|
ODP Corp. (a)(b)
|
9,811
|
520,474
|
||||||
|
Vera Bradley, Inc. (b)
|
30,766
|
209,209
|
||||||
|
3,364,477
|
||||||||
|
Savings & Loans – 2.3%
|
||||||||
|
Axos Financial, Inc. (a)(b)
|
12,108
|
654,317
|
||||||
|
Brookline Bancorp, Inc.
|
26,005
|
259,010
|
||||||
|
Capitol Federal Financial, Inc.
|
44,548
|
265,506
|
||||||
|
Flushing Financial Corp.
|
19,541
|
246,412
|
||||||
|
FS Bancorp, Inc.
|
9,148
|
317,527
|
||||||
|
HomeTrust Bancshares, Inc.
|
11,645
|
318,374
|
||||||
|
OceanFirst Financial Corp.
|
16,758
|
274,999
|
||||||
|
Southern Missouri Bancorp, Inc.
|
6,193
|
270,696
|
||||||
|
WaFd, Inc.
|
17,666
|
512,844
|
||||||
|
3,119,685
|
||||||||
|
Semiconductors – 1.2%
|
||||||||
|
Cirrus Logic, Inc. (b)
|
6,405
|
592,846
|
||||||
|
inTEST Corp. (b)
|
19,666
|
260,575
|
||||||
|
MKS Instruments, Inc. (a)
|
2,995
|
398,335
|
||||||
|
SMART Global Holdings, Inc. (b)
|
15,877
|
417,883
|
||||||
|
|
1,669,639
|
|||||||
|
Software – 7.1%
|
||||||||
|
Appfolio, Inc. – Class A (b)
|
1,223
|
301,763
|
||||||
|
Blackbaud, Inc. (a)(b)
|
7,509
|
556,717
|
||||||
|
Box, Inc. – Class A (a)(b)
|
9,521
|
269,635
|
||||||
|
Cerence, Inc. (b)
|
12,858
|
202,514
|
||||||
|
Clear Secure, Inc. – Class A (a)
|
12,359
|
262,876
|
||||||
|
CommVault Systems, Inc. (b)
|
3,383
|
343,138
|
||||||
The accompanying notes to financial statements are an integral part of these financial statements.
|
www.cornercapfunds.com
|
16
Schedule of Investments (continued)
March 31, 2024
|
Shares
|
Value
|
|||||||
|
Software – 7.1% (continued)
|
||||||||
|
CSG Systems International, Inc.
|
4,429
|
$
|
228,271
|
|||||
|
Definitive Healthcare Corp. (b)
|
28,294
|
228,333
|
||||||
|
Doximity, Inc. – Class A (b)
|
8,608
|
231,641
|
||||||
|
Elastic NV (b)
|
4,135
|
414,492
|
||||||
|
Envestnet, Inc. (b)
|
4,690
|
271,598
|
||||||
|
Everbridge, Inc. (b)
|
7,448
|
259,414
|
||||||
|
IBEX Holdings Ltd. (b)
|
16,599
|
256,123
|
||||||
|
JFrog Ltd. (b)
|
12,076
|
534,001
|
||||||
|
nCino, Inc. (b)
|
7,538
|
281,770
|
||||||
|
Nutanix, Inc. – Class A (b)
|
4,316
|
266,384
|
||||||
|
Olo, Inc. – Class A (b)
|
94,941
|
521,226
|
||||||
|
PagerDuty, Inc. (a)(b)
|
20,986
|
475,962
|
||||||
|
Pegasystems, Inc.
|
9,961
|
643,879
|
||||||
|
Progress Software Corp.
|
9,593
|
511,403
|
||||||
|
SEMrush Holdings, Inc. – Class A (b)
|
19,762
|
262,044
|
||||||
|
SentinelOne, Inc. – Class A (b)
|
11,392
|
265,548
|
||||||
|
Smartsheet, Inc. – Class A (b)
|
11,768
|
453,067
|
||||||
|
Teradata Corp. (b)
|
13,761
|
532,138
|
||||||
|
Verint Systems, Inc. (b)
|
8,135
|
269,675
|
||||||
|
Yext, Inc. (b)
|
79,054
|
476,696
|
||||||
|
Zuora, Inc. – Class A (b)
|
55,662
|
507,637
|
||||||
|
9,827,945
|
||||||||
|
Telecommunications – 0.9%
|
||||||||
|
Extreme Networks, Inc. (b)
|
27,219
|
314,107
|
||||||
|
Lantronix, Inc. (b)
|
60,945
|
216,964
|
||||||
|
Ooma, Inc. (b)
|
18,798
|
160,347
|
||||||
|
Ubiquiti, Inc. (a)
|
4,635
|
536,965
|
||||||
|
1,228,383
|
||||||||
|
Toys/Games/Hobbies – 0.2%
|
||||||||
|
Mattel, Inc. (b)
|
12,648
|
250,557
|
||||||
|
|
||||||||
|
Transportation – 1.2%
|
||||||||
|
DHT Holdings, Inc.
|
46,582
|
535,693
|
||||||
|
Pangaea Logistics Solutions Ltd.
|
38,027
|
265,048
|
||||||
|
Radiant Logistics, Inc.(b)
|
47,428
|
257,060
|
||||||
|
World Kinect Corp.
|
23,067
|
610,121
|
||||||
|
1,667,922
|
||||||||
|
TOTAL COMMON STOCKS
|
||||||||
|
(Cost $119,873,920)
|
135,042,659
|
|||||||
|
CONTINGENT VALUE RIGHTS – 0.0% (C)
|
||||||||
|
Ligand Pharmaceuticals, Inc. Earn-Out Shares (b)(d)
|
491
|
0
|
||||||
|
Ligand Pharmaceuticals, Inc. Earn-Out Shares (b)(d)
|
491
|
0
|
||||||
|
TOTAL CONTINGENT VALUE RIGHTS
|
||||||||
|
(Cost $0)
|
0
|
|||||||
The accompanying notes to financial statements are an integral part of these financial statements.
|
Annual Report | March 31, 2024
|
17
Schedule of Investments (continued)
March 31, 2024
|
Shares
|
Value
|
|||||||
|
SHORT-TERM INVESTMENTS – 15.6%
|
||||||||
|
Investments Purchased with Proceeds from Securities Lending – 14.5%
|
||||||||
|
Mount Vernon Liquid Assets Portfolio, LLC, 5.44% (e)
|
19,795,746
|
$
|
19,795,746
|
|||||
|
Money Market Funds – 1.1%
|
||||||||
|
First American Government Obligations Fund – Class X, 5.23% (e)
|
1,495,219
|
1,495,219
|
||||||
|
TOTAL SHORT-TERM INVESTMENTS
|
||||||||
|
(Cost $21,290,965)
|
21,290,965
|
|||||||
|
TOTAL INVESTMENTS – 114.7%
|
||||||||
|
(Cost $141,164,885)
|
156,333,624
|
|||||||
|
Liabilities in Excess of Other Assets – (14.7)%
|
(20,054,670
|
)
|
||||||
|
TOTAL NET ASSETS – 100.0%
|
$
|
136,278,954
|
||||||
Percentages are stated as a percent of net assets.
|
NV –
|
Naamloze Vennootschap
|
|
PLC –
|
Public Limited Company
|
|
REIT –
|
Real Estate Investment Trust
|
|
(a)
|
All or a portion of this security is on loan as of March 31, 2024. The total market value of these securities was $19,401,651 which represented 14.2% of net assets.
|
|
(b)
|
Non-income producing security.
|
|
(c)
|
Represents less than 0.05% of net assets.
|
|
(d)
|
Fair value determined using significant unobservable inputs in accordance with procedures established by and under the supervision of the Adviser, acting as Valuation
Designee. These securities represented $0 or 0.0% of net assets as of March 31, 2024.
|
|
(e)
|
The rate shown represents the 7-day effective yield as of March 31, 2024.
|
The accompanying notes to financial statements are an integral part of these financial statements.
|
www.cornercapfunds.com
|
18
Statement of Assets and Liabilities
March 31, 2024
|
ASSETS:
|
||||
|
Investment securities:
|
||||
|
At cost
|
$
|
141,164,885
|
||
|
At value(1)
|
$
|
156,333,624
|
||
|
Cash
|
4,231
|
|||
|
Dividends & interest receivable
|
156,326
|
|||
|
Receivable for capital shares sold
|
61,373
|
|||
|
Income receivable from securities lending
|
2,392
|
|||
|
Prepaid expenses
|
65,288
|
|||
|
Total Assets
|
156,623,234
|
|||
|
LIABILITIES:
|
||||
|
Payable upon return of securities loaned (See Note 9)
|
19,795,746
|
|||
|
Payable for capital shares redeemed
|
410,686
|
|||
|
Payable to investment adviser
|
76,057
|
|||
|
Payable for fund administration & accounting fees
|
32,104
|
|||
|
Payable for transfer agent fees & expenses
|
11,095
|
|||
|
Payable for custody fees
|
2,000
|
|||
|
Accrued other fees
|
15,174
|
|||
|
Accrued distribution & shareholder service fees
|
1,418
|
|||
|
Total Liabilities
|
20,344,280
|
|||
|
NET ASSETS
|
$
|
136,278,954
|
||
|
COMPOSITION OF NET ASSETS
|
||||
|
Paid-in capital
|
$
|
118,912,467
|
||
|
Total distributable earnings
|
17,366,487
|
|||
|
Total net assets
|
$
|
136,278,954
|
||
|
(1) Includes loaned securities of:
|
$
|
19,401,651
|
||
|
|
||||
|
Advisor Class Shares:
|
||||
|
Net Assets
|
$
|
559,618
|
||
|
Shares issued and outstanding(2)
|
37,997
|
|||
|
Net asset value, offering price, and redemption price per share
|
$
|
14.73
|
||
|
Institutional Class Shares:
|
||||
|
Net Assets
|
$
|
135,719,336
|
||
|
Shares issued and outstanding(2)
|
9,151,135
|
|||
|
Net asset value, offering price, and redemption price per share
|
$
|
14.83
|
||
|
(2)
|
Unlimited shares authorized without par value.
|
The accompanying notes to financial statements are an integral part of these financial statements.
|
Annual Report | March 31, 2024
|
19
Statement of Operations
For the Year Ended March 31, 2024
|
INVESTMENT INCOME:
|
||||
|
Interest income
|
$
|
83,756
|
||
|
Dividend income
|
2,286,743
|
|||
|
Less: Foreign taxes withheld
|
(3,949
|
)
|
||
|
Securities lending income
|
32,250
|
|||
|
Total investment income
|
2,398,800
|
|||
|
EXPENSES:
|
||||
|
Investment advisory fees (See Note 4)
|
1,099,489
|
|||
|
Fund administration & accounting fees (See Note 4)
|
147,310
|
|||
|
Transfer agent fees & expenses (See Note 4)
|
47,899
|
|||
|
Trustee fees
|
18,883
|
|||
|
Audit and tax fees
|
18,749
|
|||
|
Federal & state registration fees
|
15,273
|
|||
|
Custody fees (See Note 4)
|
14,366
|
|||
|
Postage & printing fees
|
12,026
|
|||
|
Legal fees
|
10,607
|
|||
|
Other fees
|
3,249
|
|||
|
Distribution & shareholder service fees – Advisor Class (See Note 5)
|
1,418
|
|||
|
Total expenses before waiver
|
1,389,269
|
|||
|
Less: Fee waiver from investment adviser (See Note 4)
|
(200,442
|
)
|
||
|
Total net expenses
|
1,188,827
|
|||
|
NET INVESTMENT INCOME
|
1,209,973
|
|||
|
REALIZED AND UNREALIZED GAIN ON INVESTMENTS
|
||||
|
Net realized gain on investments
|
2,494,064
|
|||
|
Net change in unrealized appreciation/depreciation of investments
|
19,714,448
|
|||
|
Net realized and unrealized gain on investments
|
22,208,512
|
|||
|
NET INCREASE IN NET ASSETS FROM OPERATIONS
|
$
|
23,418,485
|
||
The accompanying notes to financial statements are an integral part of these financial statements.
|
www.cornercapfunds.com
|
20
Statements of Changes in Net Assets
|
For the Year
|
For the Year
|
|||||||
|
Ended
|
Ended
|
|||||||
|
March 31, 2024
|
March 31, 2023
|
|||||||
|
OPERATIONS:
|
||||||||
|
Net investment income
|
$
|
1,209,973
|
$
|
1,155,429
|
||||
|
Net realized gain on investments
|
2,494,064
|
969,514
|
||||||
|
Net change in unrealized appreciation/depreciation of investments
|
19,714,448
|
(14,275,630
|
)
|
|||||
|
Net increase (decrease) resulting from operations
|
23,418,485
|
(12,150,687
|
)
|
|||||
|
CAPITAL SHARE TRANSACTIONS:
|
||||||||
|
Advisor Class:
|
||||||||
|
Proceeds from shares sold
|
656,251
|
10,000
|
||||||
|
Proceeds from reinvestment of distributions
|
7,612
|
449
|
||||||
|
Payments for shares redeemed
|
(201,634
|
)
|
—
|
|||||
|
Redemption Fees
|
1
|
—
|
||||||
|
Increase in net assets from Advisor Class transactions
|
462,230
|
10,449
|
||||||
|
Institutional Class:
|
||||||||
|
Proceeds from shares sold
|
8,415,586
|
12,036,118
|
||||||
|
Proceeds from reinvestment of distributions
|
1,666,019
|
12,342,886
|
||||||
|
Payments for shares redeemed
|
(21,230,135
|
)
|
(21,082,709
|
)
|
||||
|
Redemption Fees
|
1
|
7
|
||||||
|
Proceeds from conversion of Investor Class (See Note 12)
|
—
|
73,231,101
|
||||||
|
Increase (Decrease) in net assets from Institutional Class transactions
|
(11,148,529
|
)
|
76,527,403
|
|||||
|
Investor Class:
|
||||||||
|
Proceeds from shares sold
|
—
|
3,604,989
|
||||||
|
Proceeds from reinvestment of distributions
|
—
|
—
|
||||||
|
Payments for shares redeemed
|
—
|
(8,517,907
|
)
|
|||||
|
Redemption Fees
|
—
|
4
|
||||||
|
Payments from conversion into Institutional Class
|
—
|
(73,231,101
|
)
|
|||||
|
Decrease in net assets from Investor Class transactions
|
—
|
(78,144,015
|
)
|
|||||
|
Net decrease in net assets from capital share transactions
|
(10,686,299
|
)
|
(1,606,163
|
)
|
||||
|
DISTRIBUTIONS TO SHAREHOLDERS:
|
||||||||
|
Net Distributions to Shareholders – Advisor Class
|
(7,612
|
)
|
(449
|
)
|
||||
|
Net Distributions to Shareholders – Institutional Class
|
(1,666,123
|
)
|
(12,343,162
|
)
|
||||
|
Total distributions to shareholders
|
(1,673,735
|
)
|
(12,343,611
|
)
|
||||
|
TOTAL INCREASE (DECREASE) IN NET ASSETS
|
11,058,451
|
(26,100,461
|
)
|
|||||
|
NET ASSETS:
|
||||||||
|
Beginning of Year
|
125,220,503
|
151,320,964
|
||||||
|
End of Year
|
$
|
136,278,954
|
$
|
125,220,503
|
||||
The accompanying notes to financial statements are an integral part of these financial statements.
|
Annual Report | March 31, 2024
|
21
Financial Highlights
CornerCap Small-Cap Value Fund – Advisor Class
|
Period Since
|
||||||||
|
Commencement
|
||||||||
|
For the Year
|
of Operations(1)
|
|||||||
|
Ended
|
through
|
|||||||
|
For a Fund share outstanding throughout each period.
|
March 31, 2024
|
March 31, 2023
|
||||||
|
PER COMMON SHARE DATA
|
||||||||
|
Net asset value, beginning of period
|
$
|
12.40
|
$
|
14.21
|
||||
|
INVESTMENT OPERATIONS:
|
||||||||
|
Net investment income(2)
|
0.09
|
0.05
|
||||||
|
Net realized and unrealized gain (loss) on investments
|
2.40
|
(0.60
|
)
|
|||||
|
Total from investment operations
|
2.49
|
(0.55
|
)
|
|||||
|
LESS DISTRIBUTIONS FROM:
|
||||||||
|
Net investment income
|
(0.14
|
)
|
(0.07
|
)
|
||||
|
Net realized gains
|
(0.02
|
)
|
(1.19
|
)
|
||||
|
Total distributions
|
(0.16
|
)
|
(1.26
|
)
|
||||
|
Paid-in capital from redemption fees(2)
|
—
|
(3)
|
—
|
|||||
|
Net asset value, end of period
|
$
|
14.73
|
$
|
12.40
|
||||
|
Total return
|
20.14
|
%
|
-4.00
|
%(4)
|
||||
|
SUPPLEMENTAL DATA AND RATIOS
|
||||||||
|
Net assets, at end of year (000’s)
|
$
|
560
|
$
|
9
|
||||
|
RATIO OF EXPENSES TO AVERAGE NET ASSETS:
|
||||||||
|
Before expense waiver
|
1.42
|
%
|
1.45
|
%(5)
|
||||
|
After expense waiver
|
1.25
|
%
|
1.25
|
%(5)
|
||||
|
RATIO OF NET INVESTMENT INCOME TO AVERAGE NET ASSETS:
|
||||||||
|
After expense waiver
|
0.67
|
%
|
1.15
|
%(5)
|
||||
|
Portfolio Turnover Rate
|
111
|
%
|
131
|
%
|
||||
|
(1)
|
Commencement of operations of the Advisor Class was November 18, 2022.
|
|
(2)
|
Per share amounts calculated using the average shares method.
|
|
(3)
|
Less than $0.005 per share.
|
|
(4)
|
Not annualized.
|
|
(5)
|
Annualized.
|
The accompanying notes to financial statements are an integral part of these financial statements.
|
www.cornercapfunds.com
|
22
Financial Highlights
CornerCap Small-Cap Value Fund – Institutional Class
|
Year Ended March 31,
|
||||||||||||||||||||
|
For a Fund share outstanding throughout each year.
|
2024
|
2023
|
2022
|
2021
|
2020
|
|||||||||||||||
|
PER COMMON SHARE DATA
|
||||||||||||||||||||
|
Net asset value, beginning of year
|
$
|
12.47
|
$
|
14.93
|
$
|
18.16
|
$
|
9.69
|
$
|
13.15
|
||||||||||
|
INVESTMENT OPERATIONS:
|
||||||||||||||||||||
|
Net investment income(1)
|
0.13
|
0.12
|
0.17
|
0.18
|
0.14
|
|||||||||||||||
|
Net realized and unrealized gain (loss) on investments
|
2.41
|
(1.31
|
)
|
1.63
|
8.43
|
(3.48
|
)
|
|||||||||||||
|
Total from investment operations
|
2.54
|
(1.19
|
)
|
1.80
|
8.61
|
(3.34
|
)
|
|||||||||||||
|
LESS DISTRIBUTIONS FROM:
|
||||||||||||||||||||
|
Net investment income
|
(0.16
|
)
|
(0.08
|
)
|
(0.17
|
)
|
(0.14
|
)
|
(0.12
|
)
|
||||||||||
|
Net realized gains
|
(0.02
|
)
|
(1.19
|
)
|
(4.86
|
)
|
—
|
—
|
||||||||||||
|
Total distributions
|
(0.18
|
)
|
(1.27
|
)
|
(5.03
|
)
|
(0.14
|
)
|
(0.12
|
)
|
||||||||||
|
Paid-in capital from redemption fees(1)
|
—
|
(2)
|
—
|
(2)
|
—
|
(2)
|
—
|
(2)
|
—
|
(2)
|
||||||||||
|
Net asset value, end of year
|
$
|
14.83
|
$
|
12.47
|
$
|
14.93
|
$
|
18.16
|
$
|
9.69
|
||||||||||
|
Total return
|
20.43
|
%
|
-8.12
|
%
|
9.45
|
%
|
89.19
|
%
|
-25.72
|
%
|
||||||||||
|
SUPPLEMENTAL DATA AND RATIOS
|
||||||||||||||||||||
|
Net assets, at end of year (000’s)
|
$
|
135,719
|
$
|
125,211
|
$
|
69,206
|
$
|
63,407
|
$
|
27,890
|
||||||||||
|
RATIO OF EXPENSES TO AVERAGE NET ASSETS:
|
||||||||||||||||||||
|
Before expense waiver
|
1.11
|
%
|
1.08
|
%
|
1.00
|
%
|
1.00
|
%
|
1.00
|
%
|
||||||||||
|
After expense waiver
|
0.95
|
%
|
0.98
|
%(3)
|
1.00
|
%
|
1.00
|
%
|
1.00
|
%
|
||||||||||
|
RATIO OF NET INVESTMENT INCOME
|
||||||||||||||||||||
|
TO AVERAGE NET ASSETS:
|
||||||||||||||||||||
|
After expense waiver
|
0.97
|
%
|
0.96
|
%
|
0.96
|
%
|
1.31
|
%
|
1.05
|
%
|
||||||||||
|
Portfolio Turnover Rate
|
111
|
%
|
131
|
%
|
116
|
%
|
121
|
%
|
127
|
%
|
||||||||||
|
(1)
|
Per share amounts calculated using the average shares method.
|
|
(2)
|
Less than $0.005 per share.
|
|
(3)
|
Effective November 18, 2022, the Adviser entered into an Operating Expenses Limitation Agreement to ensure that total annual operating expenses do not exceed 0.95% of the
average daily net assets of the Fund (See Note 4 in Notes to Financial Statements).
|
The accompanying notes to financial statements are an integral part of these financial statements.
|
Annual Report | March 31, 2024
|
23
Notes to Financial Statements
March 31, 2024
1. ORGANIZATION
Managed Portfolio Series (the “Trust”) was organized as a Delaware statutory trust on January 27, 2011. The Trust is registered under the Investment Company Act of 1940, as amended (the “1940 Act”), as
an open-end management investment company. The CornerCap Small-Cap Value Fund (the “Fund”) is a diversified series with its own investment objectives and policies within the Trust. The investment objective of the Fund is long-term capital
appreciation with a secondary objective of generating income from dividends or interest on securities. The Fund is an investment company and accordingly follows the investment company accounting and reporting guidance of the Financial Accounting
Standards Board (“FASB”) Accounting Standards Codification (“ASC”) 946 Financial Services – Investment Companies. The Fund commenced operations on September 30, 1992. On November 18, 2022, the CornerCap
Small-Cap Value Fund, a series of The CornerCap Group of Funds (the “Acquired Fund”), reorganized into the Fund, a series of the Trust. The Fund currently offers two classes, the Advisor Class and the Institutional Class. The Adviser Class commenced
operations on November 18, 2022. Advisor Class shares are subject to a 0.25% of average daily net assets distribution and servicing fee and a shareholder servicing fee of up to 0.05% of average daily net assets. Each class of shares has identical
rights and privileges with respect to voting on matters affecting a single share class. The Fund may issue an unlimited number of shares of beneficial interest, with no par value.
2. SIGNIFICANT ACCOUNTING POLICIES
The following is a summary of significant accounting policies consistently followed by the Fund in the preparation of its financial statements. These policies are in conformity with generally accepted
accounting principles in the United States of America (“GAAP”).
Security Valuation – All investments in securities are recorded at their estimated fair value, as described in Note 3.
Federal Income Taxes – The Fund complies with the requirements of Subchapter M of the Internal Revenue Code of 1986, as amended, necessary to qualify as a
regulated investment company and distributes substantially all net taxable investment income and net realized gains to shareholders in a manner which results in no tax cost to the Fund. Therefore, no federal income or excise tax provision is
required. As of and during the year ended March 31, 2024, the Fund did not have any tax positions that did not meet the “more-likely-than-not” threshold of being sustained by the applicable tax authority. The Fund recognizes interest and penalties,
if any, related to unrecognized tax benefits on uncertain tax positions as income tax expense in the Statement of Operations. During the year ended March 31, 2024, the Fund did not incur any interest or penalties. The Fund is subject to examination
by U.S. taxing authorities for the tax years ended March 31, 2021 through 2024.
Security Transactions, Income and Distributions – The Fund follows industry practice and records security transactions on the trade date. Realized gains and
losses on sales of securities are calculated on the basis of identified cost. Dividend income is recorded on the ex-dividend date and interest income is recorded on an accrual basis. Withholding taxes on foreign dividends have been provided for in
accordance with the Fund’s understanding of the applicable country’s tax rules and regulations. Discounts and premiums on securities purchased are amortized over the expected life of the respective securities using the constant yield method of
calculation.
The Fund will make distributions, if any, of net investment income annually. The Fund will also distribute net realized capital gains, if any, annually. Distributions to shareholders are recorded on
the ex-dividend date. The treatment for financial reporting purposes of distributions made to shareholders during the year from net investment income or net realized capital gains may differ from their treatment for federal income tax purposes.
These differences are caused primarily by differences in the timing of the recognition of certain components of income, expense or realized capital gain for federal income tax purposes. Where such differences are permanent in nature, GAAP requires
that they be reclassified in the components of the net assets based on their ultimate characterization for federal income tax purposes. Any such reclassifications will have no effect on net assets, results of operations or net asset values per share
of the Fund. For the year ended March 31, 2024, there were no reclassifications.
|
www.cornercapfunds.com
|
24
Notes to Financial Statements
March 31, 2024
Use of Estimates – The preparation of financial statements in conformity with GAAP requires management to make estimates and assumptions that affect the reported
amounts of assets and liabilities and disclosure of contingent assets and liabilities at the date of the financial statements and the reported amounts of revenues and expenses during the reporting period. Actual results could differ from those
estimates.
Allocation of Income, Expenses and Gains/Losses – Income, expenses (other than those deemed attributable to a specific share class), and gains and losses of the
Fund are allocated daily to each class of shares based upon the ratio of net assets represented by each class as a percentage of the net assets of the Fund. Expenses deemed directly attributable to a class of shares are recorded by the specific
class. Most Fund expenses are allocated by class based on relative net assets. 12b-1 fees are expensed at 0.25% of average daily net assets of Advisor Class shares. Shareholder service fees are expensed at up to 0.05% of average daily net assets
Advisor Class shares. Expenses associated with a specific fund in the Trust are charged to that fund. Common Trust expenses are typically allocated evenly between the funds of the Trust, or by other equitable means.
Security Loans – When the Fund loans securities held in its portfolio, the Fund receives compensation in the form of fees, or retains a portion of the interest on
the investment of any cash received as collateral. The Fund also continues to receive dividends on the securities loaned. The loans are secured by collateral at least equal to 105% of the value of the loaned securities that are foreign securities or
102% of the value of any other loaned securities marked-to market daily. Loans shall be marked to market daily and the margin restored in the event collateralization is below 100% of the value of securities loaned. Gain or loss in the value of
securities loaned that may occur during the term of the loan will be for the account of the Fund. The Fund has the right under the lending agreement to recover the securities from the borrower on demand. See Note 9.
3. SECURITIES VALUATION
The Fund has adopted authoritative fair value accounting standards which establish an authoritative definition of fair value and set out a hierarchy for measuring fair value. These standards require
additional disclosures about the various inputs and valuation techniques used to develop the measurements of fair value, a discussion in changes in valuation techniques and related inputs during the period and expanded disclosure of valuation levels
for major security types. These inputs are summarized in the three broad levels listed below:
| Level 1 – | Unadjusted quoted prices in active markets for identical assets or liabilities that the Fund has the ability to access. |
|
Level 2 –
|
Observable inputs other than quoted prices included in Level 1 that are observable for the asset or liability, either directly or indirectly. These inputs may include quoted prices for the identical instrument on an inactive market, prices for similar instruments, interest rates, prepayment speeds, credit risk, yield curves, default rates and similar data. |
|
Level 3 –
|
Unobservable inputs for the asset or liability, to the extent relevant observable inputs are not available, representing the Fund’s own assumptions about the assumptions a market participant would use in valuing the asset or liability, and would be based on the best information available. |
Following is a description of the valuation techniques applied to the Fund’s major categories of assets and liabilities measured at fair value on a recurring basis. The Fund’s investments are carried
at fair value.
Equity Securities – Securities that are primarily traded on a national securities exchange are valued at the last sale price on the exchange on which they are
primarily traded on the day of valuation or, if there has been no sale on such day, at the mean between the bid and ask prices. Securities traded primarily in the Nasdaq Global Market System for which market quotations are readily available are
valued using the Nasdaq Official Closing Price (“NOCP”). If the NOCP is not available, such securities are valued at the last sale price on the day of valuation, or if there has been no sale on such day, at the mean between the bid and ask prices.
To the extent these securities are actively traded and valuation adjustments are not applied, they are categorized in Level 1 of the fair value hierarchy.
Short-Term Investments – Investments in other mutual funds, including money market funds are valued at their net asset value per share and are categorized in
Level 1 of the fair value hierarchy. To the extent these securities are actively traded and valuation adjustments are not applied, they are categorized in Level 1 of the fair value hierarchy.
|
Annual Report | March 31, 2024
|
25
Notes to Financial Statements
March 31, 2024
The Board of Trustees (the “Board”) has adopted a pricing and valuation policy for use by the Funds and their Valuation Designee (as defined below) in calculating the Fund’s NAV. Pursuant to Rule 2a-5
under the 1940 Act, the Funds have designated CornerCap Investment Counsel, Inc. (the “Adviser”) as its “Valuation Designee” to perform all of the fair value determinations as well as to perform all of the responsibilities that may be performed by
the Valuation Designee in accordance with Rule 2a-5. The Valuation Designee is authorized to make all necessary determinations of the fair values of portfolio securities and other assets for which market quotations are not readily available or if it
is deemed that the prices obtained from brokers and dealers or independent pricing services are unreliable.
The inputs or methodology used for valuing securities are not an indication of the risk associated with investing in those securities. The following is a summary of the inputs used to value the Fund’s
securities as of March 31, 2024:
|
Small-Cap Value Fund
|
Uncategorized
|
Level 1
|
Level 2
|
Level 3**
|
Total
|
|||||||||||||||
|
Common Stocks
|
$
|
—
|
$
|
135,042,659
|
$
|
—
|
$
|
—
|
$
|
135,042,659
|
||||||||||
|
Investment Purchased with
|
||||||||||||||||||||
|
Proceeds from Securities Lending*
|
19,795,746
|
—
|
—
|
—
|
19,795,746
|
|||||||||||||||
|
Contingent Value Rights
|
—
|
—
|
—
|
—
|
—
|
|||||||||||||||
|
Money Market Fund
|
—
|
1,495,219
|
—
|
—
|
1,495,219
|
|||||||||||||||
|
Total Investments
|
$
|
19,795,746
|
$
|
136,537,878
|
$
|
—
|
$
|
—
|
$
|
156,333,624
|
||||||||||
|
*
|
Certain investments that are measured at fair value using the NAV per share (or its equivalent) as a practical expedient have not been characterized in the fair value
hierarchy. The fair value amounts presented in the table are intended to permit reconciliation of the fair value hierarchy to the amount presented in the Statements of Assets and Liabilities. See Note 9 for additional information regarding
securities lending activity.
|
|
**
|
Additional Level 3 disclosures deemed immaterial to the financial statements.
|
Refer to the Schedule of Investments for further information on the classification of investments.
The following is a reconciliation of Level 3 assets for which significant unobservable inputs were used to determine fair value:
|
Investments
|
||||
|
in Securities
|
||||
|
Balance as of 3/31/2023
|
$
|
—
|
||
|
Accrued discounts/ premiums
|
—
|
|||
|
Realized gain (loss)
|
—
|
|||
|
Change in net unrealized appreciation (depreciation)
|
—
|
|||
|
Net purchases (sales)
|
—
|
|||
|
Transfers in and/or out of Level 3
|
—
|
|||
|
Balance as of 3/31/2024
|
$
|
—
|
||
|
Net change in unrealized appreciation/depreciation of Level 3 assets as of March 31, 2024
|
$
|
—
|
||
|
|
||||
Additional Level 3 disclosures were deemed immaterial to the financial statements by Management.
4. INVESTMENT ADVISORY FEE AND OTHER TRANSACTIONS WITH AFFILIATES
The Trust has an agreement with the Adviser to furnish investment advisory services to the Fund. Pursuant to an Investment Advisory Agreement between the Trust and the Adviser, the Adviser is entitled
to receive, on a monthly basis, an annual advisory fee equal to 0.88% of the Fund’s average daily net assets.
The Fund’s Adviser has contractually agreed to waive a portion or all of its management fees and reimburse the Fund for its expenses to ensure that total annual operating expenses (excluding Rule 12b-1
fees, Shareholder Servicing Plan fees, leverage/borrowing interest, interest expense, dividend paid on short sales, brokerage and other transactional expenses, acquired fund fees and expenses, expenses incurred in connection with any merger or
reorganization, or extraordinary
|
www.cornercapfunds.com
|
26
Notes to Financial Statements
March 31, 2024
expenses) for the Fund do not exceed 0.95% of average daily net assets of the Fund. Fees waived and expenses reimbursed by the Adviser may be recouped by the Adviser for a period of thirty-six months
following the month during which such waiver or reimbursement was made if such recoupment can be achieved without exceeding the expense limit in effect at the time the waiver and reimbursement occurred. The Operating Expenses Limitation Agreement
cannot be terminated through at least November 18, 2025. Thereafter, the agreement may be terminated at any time upon 60 days’ written notice by the Trust’s Board of Trustees (the “Board”) or the Adviser, with the consent of the Board. For the year
ended March 31, 2024, the Adviser did not recoup any previously waived expenses. Waived fees and reimbursed expenses subject to potential recovery by year of expiration are as follows:
|
Expiration
|
Amount
|
|
|
November 2025 – March 2026
|
$ 90,816
|
|
|
April 2026 – March 2027
|
200,442
|
U.S. Bancorp Fund Services, LLC, doing business as U.S. Bank Global Fund Services, (“Fund Services” or the “Administrator”), acts as the Fund’s Administrator, Transfer Agent, and Fund Accountant. U.S.
Bank N.A. (the “Custodian”) serves as the custodian to the Fund. The Custodian is an affiliate of the Administrator. The Administrator performs various administrative and accounting services for the Fund. The Administrator prepares various federal
and state regulatory filings, reports and returns for the Fund; prepares reports and materials to be supplied to the Trustees; monitors the activities of the Fund’s custodian; coordinates the payment of the Fund’s expenses and reviews the Fund’s
expense accruals. The officers of the Trust, including the Chief Compliance Officer are employees of the Administrator. As compensation for its services, the Administrator is entitled to a monthly fee at an annual rate based upon the average daily
net assets of the Fund, subject to annual minimums. Fees paid by the Fund for administration and accounting (which includes compliance), transfer agency, and custody services for the year ended March 31, 2024, are disclosed in the Statement of
Operations.
5. DISTRIBUTION & SHAREHOLDER SERVICING FEES
The Fund has adopted a Distribution Plan pursuant to Rule 12b-1 (the “Plan”) in the Advisor Class only. The Plan permits the Fund to pay for distribution and related expenses at an annual rate of 0.25%
of the Advisor Class average daily net assets. The expenses covered by the Plan may include the cost of preparing and distributing prospectuses and other sales material, advertising and public relations expenses, payments to financial intermediaries
and compensation of personnel involved in selling shares of the Fund. Payments made pursuant to the Plan will represent compensation for distribution and service activities, not reimbursements for specific expenses incurred. For the year ended March
31, 2024, the Advisor Class incurred expenses of $1,182 pursuant to the Plan.
The Fund has entered into a shareholder servicing agreement (the “Agreement”) where the Adviser acts as the shareholder agent, under which the Fund may pay servicing fees at an annual rate of up to
0.05% of the average daily net assets of the Advisor Class. Payments, if any, to the Adviser under the Agreement may reimburse the Adviser for payments it makes to selected brokers, dealers and administrators which have entered into service
agreements with the Adviser for services provided to shareholders of the Fund. Payments may also be made directly to the intermediaries providing shareholder services. Services provided by such intermediaries also include the provision of support
services to the Fund and includes establishing and maintaining shareholders’ accounts and record processing, purchase and redemption transactions, answering routine client inquiries regarding the Fund, and providing such other personal services to
shareholders as the Fund may reasonably request. For the year ended March 31, 2024, the Advisor Class incurred $236 of shareholder servicing fees under the Agreement.
|
Annual Report | March 31, 2024
|
27
Notes to Financial Statements
March 31, 2024
6. CAPITAL SHARE TRANSACTIONS
Transactions in shares of the Funds were as follows:
|
Small-Cap Value Fund
|
||||||||
|
Year Ended
|
Year Ended
|
|||||||
|
March 31, 2024
|
March 31, 2023
|
|||||||
|
Advisor Class(1):
|
||||||||
|
Shares sold
|
51,076
|
721
|
||||||
|
Shares issued in reinvestment of distributions
|
540
|
35
|
||||||
|
Shares redeemed
|
(14,375
|
)
|
—
|
|||||
|
Net increase
|
37,241
|
756
|
||||||
|
Institutional Class:
|
||||||||
|
Shares sold
|
649,031
|
906,115
|
||||||
|
Shares issued in reinvestment of distributions
|
117,339
|
963,987
|
||||||
|
Shares redeemed
|
(1,657,673
|
)
|
(1,594,964
|
)
|
||||
|
Shares converted from Investor Class(2)
|
—
|
5,130,700
|
||||||
|
Net increase (decrease)
|
(891,303
|
)
|
5,405,838
|
|||||
|
Investor Class:
|
||||||||
|
Shares sold
|
—
|
263,039
|
||||||
|
Shares issued in reinvestment of distributions
|
—
|
—
|
||||||
|
Shares redeemed
|
—
|
(624,806
|
)
|
|||||
|
Shares converted into Institutional Class(2)
|
—
|
(5,154,535
|
)
|
|||||
|
Net decrease
|
—
|
(5,516,302
|
)
|
|||||
|
Net decrease in capital shares
|
(854,062
|
)
|
(109,708
|
)
|
||||
|
(1)
|
Advisor Class inception was November 18, 2022.
|
|
(2)
|
Effective November 18, 2022, all outstanding shares of the Investor Class were merged into the Institutional Class (See Note 12).
|
7. INVESTMENT TRANSACTIONS
The aggregate purchases and sales, excluding short-term investments, by the Fund for the year ended March 31, 2024, were as follows:
|
Purchases
|
Sales
|
||
|
U.S. Government
|
$ —
|
$ —
|
|
|
Other
|
$ 137,386,801
|
$ 147,923,375
|
8. FEDERAL TAX INFORMATION
The aggregate gross unrealized appreciation and depreciation of securities held by the Fund and the total cost of securities for federal income tax purposes at March 31, 2024, were as follows:
|
Aggregate Gross
|
Aggregate Gross
|
Federal Income
|
||
|
Appreciation
|
Depreciation
|
Net Appreciation
|
Tax Cost
|
|
|
$21,736,701
|
$(6,580,171)
|
$15,156,530
|
$141,177,094
|
|
www.cornercapfunds.com
|
28
Notes to Financial Statements
March 31, 2024
At March 31, 2024, components of distributable earnings on a tax-basis were as follows:
|
Undistributed
|
||||
|
Undistributed
|
Long-Term
|
Other
|
Net
|
Total
|
|
Ordinary Income
|
Capital Gains
|
Accumulated Losses
|
Appreciation
|
Distributable Earnings
|
|
$429,264
|
$1,780,693
|
$—
|
$15,156,530
|
$17,366,487
|
As of March 31, 2024, the Fund’s most recent fiscal year end, the Fund did not have any capital loss carryovers. A regulated investment company may elect for any taxable year to treat any portion of
any qualified late year loss as arising on the first day of the next taxable year. Qualified late year losses are certain capital, and ordinary losses which occur during the portion of the Fund’s taxable year subsequent to October 31. For the
taxable year ended March 31, 2024, the Fund did not defer any qualified later year losses.
The tax character of distributions paid during the year ended March 31, 2024, were as follows:
|
Long-Term
|
|||
|
Ordinary Income*
|
Capital Gains
|
Total
|
|
|
$1,474,599
|
$199,136
|
$1,673,735
|
The tax character of distributions paid during the year ended March 31, 2023, were as follows:
|
Long-Term
|
|||
|
Ordinary Income*
|
Capital Gains
|
Total
|
|
|
$3,776,748
|
$8,566,863
|
$12,343,611
|
|
*
|
For federal income tax purposes, distributions of short-term capital gains are treated as ordinary income distributions.
|
The Fund designated as long-term capital gain dividend, pursuant to Internal Revenue Code Section 852(b)(3), the amount necessary to reduce the earnings and profits of the Fund related to net capital
gain to zero for the tax year ended March 31, 2024.
9. SECURITIES LENDING
Following the terms of a securities lending agreement with the Fund’s Custodian, the Fund may lend securities from its portfolio to brokers, dealers and financial institutions in order to increase the
return on its portfolio, primarily through the receipt of borrowing fees and earnings on invested collateral. Any such loan must be continuously secured by collateral in cash or cash equivalents maintained on a current basis in an amount at least
equal to 105% of the value of the loaned securities that are foreign securities or 102% of the value of any other loaned securities marked-to-market daily. Loans shall be marked to market daily and the margin restored in the event the
collateralization is below 100% of the value of the securities loaned. During the time securities are on loan, the borrower will pay the applicable Fund any accrued income on those securities, and the Fund may invest the cash collateral and earn
income or receive an agreed-upon fee from a borrower that has delivered cash-equivalent collateral. In determining whether or not to lend a security to a particular broker, dealer or financial institution, the Adviser considers all relevant facts and
circumstances, including the size, creditworthiness and reputation of the broker, relevant facts dealer or financial institution. Securities lending involves the risk of a default or insolvency of the borrower. In either of these cases, a Fund could
experience delays in recovering securities or collateral or could lose all or part of the value of the loaned securities. A Fund also could lose money in the event of a decline in the value of the collateral provided for loaned securities.
Additionally, the loaned portfolio securities may not be available to a Fund on a timely basis and that Fund may therefore lose the opportunity to sell the securities at a desirable price. Any decline in the value of a security that occurs while the
security is out on loan would continue to be borne by the applicable Fund. As of March 31, 2024, the Fund had securities on loan with a value of $19,401,651 and collateral value of $19,795,746.
The Fund receives cash as collateral in return for securities lent as part of the securities lending program. The collateral is invested in the Mount Vernon Liquid Assets Portfolio, LLC of which the
investment objective is to seek to maximize current income to the extent with the preservation of capital and liquidity and maintain a stable NAV of $1.00 per unit. The remaining
|
Annual Report | March 31, 2024
|
29
Notes to Financial Statements
March 31, 2024
contractual maturity of all securities lending transactions is overnight and continuous. The Fund manages credit exposure arising from these lending transactions by, in appropriate circumstances,
entering into master netting agreements and collateral agreements with third party borrowers that provide the Fund, in the event of default (such as bankruptcy or a borrower’s failure to pay or perform), the right to net a third party borrower’s
rights and obligations under such agreement and liquidate and set off collateral against the net amount owed by the counterparty. The net income earned by the Fund on investments of cash collateral received from borrowers for the securities loaned
to them are reflected in the Fund’s Statements of Operations. Securities lending income, as disclosed in the Fund’s Statements of Operations, represents the income earned from the investment of cash collateral, net of fee rebates paid to the borrower
and net of fees paid to the Custodian as lending agent.
10. CONTROL OWNERSHIP
The beneficial ownership, either directly or indirectly, of more than 25% of the voting securities of a fund creates a presumption of control of the fund, under Section 2(a)(9) of the Investment Company
Act of 1940. As of March 31, 2024, Charles Schwab & Co., Inc, for the benefit of its customers, owned 90.26% of the Fund.
11. OTHER REGULATORY MATTERS
In October 2022, the Securities and Exchange Commission (the “SEC”) adopted a final rule relating to Tailored Shareholder Reports for Mutual Funds and Exchange-Traded Funds; Fee Information in
Investment Company Advertisements. The rule and form amendments will, among other things, require the Fund to transmit concise and visually engaging shareholder reports that highlight key information. The amendments will require that funds tag
information in a structured data format and that certain more in-depth information be made available online and available for delivery free of charge to investors on request. The amendments became effective January 24, 2023. There is an 18-month
transition period after the effective date of the amendment.
12. REORGANIZATION OF THE FUND
On November 18, 2022, as the result of a tax-free reorganization, the CornerCap Small-Cap Value Fund (the “Predecessor Fund”), a series in The CornerCap Group of Funds, was reorganized into the Trust by
transferring all of the Predecessor Fund’s assets to the Fund in the Trust. The Predecessor Fund was deemed to be the accounting survivor for financial reporting purposes. The primary purpose of the Reorganization is to provide shareholders with the
opportunity to continue their CornerCap mutual fund investment while benefiting from lower annual fund operating expenses within a larger investment company comprised of numerous funds.
As a tax-free reorganization, any unrealized appreciation or depreciation on the securities on the date of reorganization was treated as a non-taxable event, thus the cost basis of the securities held
reflect the historical cost basis as of the date of reorganization. Immediately prior to the reorganization, the net assets, fair value of investments, and net unrealized appreciation of the CornerCap Small-Cap Value Fund was $139,905,974,
$137,174,412 and $128,696, respectively. At the date of reorganization, fund shares outstanding for the Predecessor Fund were 5,154,535 and 4,671,358 for the Investor Class and Institutional Class, respectively. As part of the reorganization, the
Predecessor Fund’s Investor Class shares were converted into the Fund’s Institutional Class. The shareholders of the Predecessor Fund’s Investor Class were exchanged for the Fund’s Institutional Class shares on a pro rata basis. The Adviser paid for
all costs of the Reorganization.
13. SUBSEQUENT EVENTS
Management has performed an evaluation of subsequent events through the date the financial statements were issued and has determined that no additional items require recognition or disclosure.
|
www.cornercapfunds.com
|
30
Report of Independent Registered Public Accounting Firm
To the Shareholders of CornerCap Small-Cap Value Fund and
Board of Trustees of Managed Portfolio Series
Opinion on the Financial Statements
We have audited the accompanying statement of assets and liabilities, including the schedule of investments, of CornerCap Small-Cap Value Fund (the “Fund”), a series of Managed Portfolio Series, as of
March 31, 2024, the related statement of operations for the year then ended, the statements of changes in net assets for each of the two years in the period then ended, the financial highlights for each of the five years in the period then ended, and
the related notes (collectively referred to as the “financial statements”). In our opinion, the financial statements present fairly, in all material respects, the financial position of the Fund as of March 31, 2024, the results of its operations for
the year then ended, the changes in net assets for each of the two years in the period then ended, and the financial highlights for each of the five years in the period then ended, in conformity with accounting principles generally accepted in the
United States of America.
Basis for Opinion
These financial statements are the responsibility of the Fund’s management. Our responsibility is to express an opinion on the Fund’s financial statements based on our audits. We are a public
accounting firm registered with the Public Company Accounting Oversight Board (United States) (“PCAOB”) and are required to be independent with respect to the Fund in accordance with the U.S. federal securities laws and the applicable rules and
regulations of the Securities and Exchange Commission and the PCAOB.
We conducted our audits in accordance with the standards of the PCAOB. Those standards require that we plan and perform the audit to obtain reasonable assurance about whether the financial statements
are free of material misstatement whether due to error or fraud.
Our audits included performing procedures to assess the risks of material misstatement of the financial statements, whether due to error or fraud, and performing procedures that respond to those risks.
Such procedures included examining, on a test basis, evidence regarding the amounts and disclosures in the financial statements. Our procedures included confirmation of securities owned as of March 31, 2024, by correspondence with the custodian. Our
audits also included evaluating the accounting principles used and significant estimates made by management, as well as evaluating the overall presentation of the financial statements. We believe that our audits provide a reasonable basis for our
opinion.
We have served as the Fund’s auditor since 2004.

COHEN & COMPANY, LTD.
Milwaukee, Wisconsin
May 28, 2024
|
Annual Report | March 31, 2024
|
31
Additional Information (Unaudited)
March 31, 2024
TRUSTEES AND OFFICERS
The Trustees and officers of the Trust are listed below with their addresses, present positions with the Trust and principal occupations over at least the last five years.
|
Number of
|
|||||
|
Term of
|
Portfolios
|
||||
|
Position(s)
|
Office and
|
in Trust
|
Principal
|
Other Directorships
|
|
|
Name, Address and
|
Held with
|
Length of
|
Overseen
|
Occupation(s) During
|
Held by Trustee During
|
|
Year of Birth
|
the Trust
|
Time Served
|
by Trustee
|
the Past Five Years
|
the Past Five Years
|
|
INDEPENDENT TRUSTEES
|
|||||
|
Leonard M. Rush, CPA
|
Chairman,
|
Indefinite
|
29
|
Retired (2011-Present);
|
Independent Trustee,
|
|
615 E. Michigan St.
|
Trustee
|
Term; Since
|
Chief Financial Officer,
|
ETF Series Solutions
|
|
|
Milwaukee, WI 53202
|
and Audit
|
April 2011
|
Robert W. Baird & Co.
|
(57 Portfolios)
|
|
|
Year of Birth: 1946
|
Committee
|
Incorporated,
|
(2012-Present)
|
||
|
Chairman
|
(2000-2011).
|
||||
|
David A. Massart
|
Trustee
|
Indefinite
|
29
|
Partner and Managing
|
Independent Trustee,
|
|
615 E. Michigan St.
|
Term; Since
|
Director, Beacon Pointe
|
ETF Series Solutions
|
||
|
Milwaukee, WI 53202
|
April 2011
|
Advisors, LLC (since
|
(57 Portfolios)
|
||
|
Year of Birth: 1967
|
2022); Co-Founder and
|
(2012-Present)
|
|||
|
Chief Investment
|
|||||
|
Strategist, Next
|
|||||
|
Generation Wealth
|
|||||
|
Management, Inc.
|
|||||
|
(2005-2021).
|
|
www.cornercapfunds.com
|
32
Additional Information (Unaudited)
March 31, 2024
|
Number of
|
|||||
|
Term of
|
Portfolios
|
||||
|
Position(s)
|
Office and
|
in Trust
|
Principal
|
Other Directorships
|
|
|
Name, Address and
|
Held with
|
Length of
|
Overseen
|
Occupation(s) During
|
Held by Trustee During
|
|
Year of Birth
|
the Trust
|
Time Served
|
by Trustee
|
the Past Five Years
|
the Past Five Years
|
|
David M. Swanson
|
Trustee and
|
Indefinite
|
29
|
Founder and Managing
|
Independent Trustee,
|
|
615 E. Michigan St.
|
Nominating &
|
Term; Since
|
Principal, SwanDog
|
ALPS Variable
|
|
|
Milwaukee, WI 53202
|
Governance
|
April 2011
|
Strategic Marketing, LLC
|
Investment Trust
|
|
|
Year of Birth: 1957
|
Committee
|
(2006-Present).
|
(7 Portfolios) (2006-
|
||
|
Chairman
|
Present); Independent
|
||||
|
Trustee, RiverNorth
|
|||||
|
Funds (3 Portfolios)
|
|||||
|
(2018-Present);
|
|||||
|
RiverNorth Managed
|
|||||
|
Duration Municipal
|
|||||
|
Income Fund, Inc.
|
|||||
|
(1 Portfolio) (2019-
|
|||||
|
Present); RiverNorth
|
|||||
|
Opportunistic Municipal
|
|||||
|
Income Fund, Inc.
|
|||||
|
(1 Portfolio) (2018-
|
|||||
|
Present); RiverNorth
|
|||||
|
Capital and Income
|
|||||
|
Fund (1 Portfolio) (2018-
|
|||||
|
Present); RiverNorth
|
|||||
|
Opportunities Funds, Inc.
|
|||||
|
(1 portfolio) (2015-
|
|||||
|
Present); RiverNorth/
|
|||||
|
DoubleLine Strategic
|
|||||
|
Opportunity Fund, Inc.
|
|||||
|
(1 Portfolio) (2019-
|
|||||
|
Present); RiverNorth
|
|||||
|
Flexible Municipal
|
|||||
|
Income Fund, Inc.
|
|||||
|
(1 Portfolio) (2020-
|
|||||
|
Present); RiverNorth
|
|||||
|
Flexible Municipal
|
|||||
|
Income Fund II, Inc.
|
|||||
|
(1 Portfolio) (2021-
|
|||||
|
Present); RiverNorth
|
|||||
|
Managed Duration
|
|||||
|
Municipal Income Fund
|
|||||
|
II, Inc. (1 Portfolio)
|
|||||
|
(2022-Present).
|
|
Annual Report | March 31, 2024
|
33
Additional Information (Unaudited)
March 31, 2024
|
Number of
|
|||||
|
Term of
|
Portfolios
|
||||
|
Position(s)
|
Office and
|
in Trust
|
Principal
|
Other Directorships
|
|
|
Name, Address and
|
Held with
|
Length of
|
Overseen
|
Occupation(s) During
|
Held by Trustee During
|
|
Year of Birth
|
the Trust
|
Time Served
|
by Trustee
|
the Past Five Years
|
the Past Five Years
|
|
Robert J. Kern
|
Trustee
|
Indefinite
|
29
|
Retired (2018-Present);
|
None
|
|
615 E. Michigan St.
|
Term; Since
|
Executive Vice President,
|
|||
|
Milwaukee, WI 53202
|
January 2011
|
U.S. Bancorp Fund
|
|||
|
Year of Birth: 1958
|
Services, LLC (1994-2018).
|
||||
|
OFFICERS
|
|||||
|
Brian R. Wiedmeyer
|
President and
|
Indefinite
|
N/A
|
Vice President, U.S.
|
N/A
|
|
615 E. Michigan St.
|
Principal
|
Term; Since
|
Bancorp Fund Services,
|
||
|
Milwaukee, WI 53202
|
Executive
|
November 2018
|
LLC (2005-Present).
|
||
|
Year of Birth: 1973
|
Officer
|
||||
|
Deborah Ward
|
Vice President,
|
Indefinite
|
N/A
|
Senior Vice President,
|
N/A
|
|
615 E. Michigan St.
|
Chief
|
Term; Since
|
U.S. Bancorp Fund
|
||
|
Milwaukee, WI 53202
|
Compliance
|
April 2013
|
Services, LLC
|
||
|
Year of Birth: 1966
|
Officer and
|
(2004-Present).
|
|||
|
Anti-Money
|
|||||
|
Laundering
|
|||||
|
Officer
|
|||||
|
Benjamin Eirich
|
Treasurer,
|
Indefinite
|
N/A
|
Assistant Vice President,
|
N/A
|
|
615 E. Michigan St.
|
Principal
|
Term; Since
|
U.S. Bancorp Fund
|
||
|
Milwaukee, WI 53202
|
Financial
|
August 2019
|
Services, LLC
|
||
|
Year of Birth: 1981
|
Officer and
|
(Treasurer);
|
(2008-Present).
|
||
|
Vice President
|
Indefinite
|
||||
|
Term; Since
|
|||||
|
November
|
|||||
|
2018 (Vice
|
|||||
|
President)
|
|||||
|
John Hadermayer
|
Secretary
|
Indefinite
|
N/A
|
Vice President, U.S.
|
N/A
|
|
615 E. Michigan St.
|
Term; Since
|
Bancorp Fund Services,
|
|||
|
Milwaukee, WI 53202
|
May 2022
|
LLC (2022-Present);
|
|||
|
Year of Birth: 1977
|
Executive Director,
|
||||
|
AQR Capital Management,
|
|||||
|
LLC (2013-2022).
|
|||||
|
Peter A. Walker, CPA
|
Assistant
|
Indefinite
|
N/A
|
Officer, U.S. Bancorp
|
N/A
|
|
615 E. Michigan St.
|
Treasurer
|
Term: Since
|
Fund Services, LLC
|
||
|
Milwaukee, WI 53202
|
and Vice
|
November
|
(2016-Present).
|
||
|
Year of Birth: 1993
|
President
|
2021
|
|||
|
Silinapha Saycocie
|
Assistant
|
Indefinite
|
N/A
|
Officer, U.S. Bancorp
|
N/A
|
|
615 E. Michigan St.
|
Treasurer
|
Term: Since
|
Fund Services, LLC
|
||
|
Milwaukee, WI 53202
|
and Vice
|
November
|
(2020-Present).
|
||
|
Year of Birth: 1998
|
President
|
2023
|
|
www.cornercapfunds.com
|
34
Additional Information (Unaudited)
March 31, 2024
|
Number of
|
|||||
|
Term of
|
Portfolios
|
||||
|
Position(s)
|
Office and
|
in Trust
|
Principal
|
Other Directorships
|
|
|
Name, Address and
|
Held with
|
Length of
|
Overseen
|
Occupation(s) During
|
Held by Trustee During
|
|
Year of Birth
|
the Trust
|
Time Served
|
by Trustee
|
the Past Five Years
|
the Past Five Years
|
|
Daniel Umland
|
Assistant
|
Indefinite
|
N/A
|
Officer, U.S. Bancorp
|
N/A
|
|
615 E. Michigan St.
|
Treasurer
|
Term: Since
|
Fund Services, LLC
|
||
|
Milwaukee, WI 53202
|
and Vice
|
March 2024
|
(2021-Present);
|
||
|
Year of Birth: 1993
|
President
|
Securities Specialist,
|
|||
|
U.S. Bank N.A.
|
|||||
|
(2016-2021).
|
|||||
|
Eli Bilderback
|
Assistant
|
Indefinite
|
N/A
|
Officer, U.S. Bancorp
|
N/A
|
|
615 E. Michigan St.
|
Treasurer
|
Term: Since
|
Fund Services, LLC
|
||
|
Milwaukee, WI 53202
|
and Vice
|
March 2024
|
(2022-Present);
|
||
|
Year of Birth: 1991
|
President
|
Operations Analyst,
|
|||
|
U.S. Bank N.A.
|
|||||
|
(2018-2022).
|
|
Annual Report | March 31, 2024
|
35
Additional Information (Unaudited)
March 31, 2024
BOARD APPROVAL OF THE INVESTMENT ADVISORY AGREEMENT
At the regular meeting of the Board of Trustees of Managed Portfolio Series (“Trust”) on February 21-22, 2024, the Trust’s Board of Trustees (“Board”), including all of the Trustees who are not
“interested persons” of the Trust, as that term is defined in Section 2(a)(19) of the Investment Company Act of 1940, as amended (“Independent Trustees”), considered and approved the continuation of the Investment Advisory Agreement between the Trust
and CornerCap Investment Counsel, Inc. (“CornerCap” or the “Adviser”) regarding the CornerCap Small-Cap Value Fund (the “Fund”) (the “Investment Advisory Agreement”) for another annual term.
Prior to the meeting and at a meeting held on January 4, 2024, the Trustees received and considered information from CornerCap and the Trust’s administrator designed to provide the Trustees with the
information necessary to evaluate the continuance of the Investment Advisory Agreement (“Support Materials”). Before voting to approve the continuance of the Investment Advisory Agreement, the Trustees reviewed the Support Materials with Trust
management and with counsel to the Independent Trustees and received a memorandum and advice from such counsel discussing the legal standards for the Trustees’ consideration of the renewal of the Investment Advisory Agreement. This information,
together with the information provided to the Board throughout the course of the year, formed the primary (but not exclusive) basis for the Board’s determinations.
In determining whether to continue the Investment Advisory Agreement, the Trustees considered all factors they believed relevant, including the following with respect to the Fund: (1) the nature,
extent, and quality of the services provided by CornerCap with respect to the Fund; (2) the Fund’s historical performance and the performance of other investment accounts managed by CornerCap; (3) the costs of the services provided by CornerCap and
the profits realized by CornerCap from services rendered to the Fund; (4) comparative fee and expense data for the Fund and other investment companies with similar investment objectives; (5) the extent to which economies of scale may be realized as
the Fund grows, and whether the advisory fee for the Fund reflects such economies of scale for the Fund’s benefit; and (6) other benefits to CornerCap resulting from its relationship with the Fund. In their deliberations, the Trustees weighed to
varying degrees the importance of the information provided to them and did not identify any particular information that was all-important or controlling.
Based upon the information provided to the Board throughout the course of the year, including a presentation to the Board by representatives of CornerCap, and the Support Materials, the Board concluded
that the overall arrangement between the Trust and CornerCap set forth in the Investment Advisory Agreement continues to be fair and reasonable in light of the services that CornerCap performs, investment advisory fees the Fund pays, and such other
matters as the Trustees considered relevant in the exercise of their reasonable business judgment. The material factors and conclusions that formed the basis of the Trustees’ determination to approve the continuation of the Investment Advisory
Agreement are summarized below.
Nature, Extent and Quality of Services Provided. The Trustees considered the scope of services that CornerCap provides under the Investment Advisory Agreement,
noting that such services include, but are not limited to, the following: (1) investing the Fund’s assets consistent with the Fund’s investment objective and investment policies; (2) determining the portfolio securities to be purchased, sold or
otherwise disposed of and the timing of such transactions; (3) voting all proxies, if any, with respect to the Fund’s portfolio securities; (4) maintaining the required books and records for transactions that CornerCap effects on behalf of the Fund;
(5) selecting broker-dealers to execute orders on behalf of the Fund; and (6) monitoring and maintaining the Fund’s compliance with policies and procedures of the Trust and with applicable securities laws. The Trustees considered the long history
that CornerCap has serving as investment adviser to the Fund, dating back to before the Fund reorganized into the Trust. The Trustees also reviewed CornerCap’s financial statements and capitalization and concluded that CornerCap had sufficient
resources to support the management of the Fund. The Trustees concluded that they were satisfied with the nature, extent and quality of services that CornerCap provides to the Fund under the Investment Advisory Agreement.
Fund Historical Performance and the Overall Performance of CornerCap. In assessing the quality of the portfolio management delivered by CornerCap, the Trustees
reviewed the short-term and long-term performance of the Fund on both an absolute basis and in comparison to an appropriate benchmark index, the Fund’s Morningstar category (“Category”) as well as a smaller sub-set of peer funds (“Cohort”), and the
composite of separate accounts that CornerCap manages utilizing a similar investment
|
www.cornercapfunds.com
|
36
Additional Information (Unaudited)
March 31, 2024
strategy as that of the Fund. When reviewing the Fund’s performance against its Category and Cohort, the Trustees took into account that the investment objective and strategies of the Fund, as well as
the Fund’s level of risk tolerance, may differ significantly from the funds in the Category and Cohort.
The Trustees noted that the Fund had outperformed both the Category and Cohort averages for the five-year period ended September 30, 2023, as well as the Cohort average for the three-year period ended
September 30, 2023, but had underperformed both the Category and Cohort averages for all other periods presented. The Trustees also noted that the Fund had outperformed its benchmark index for all periods presented as of September 30, 2023, except
that it had underperformed this benchmark index for the since inception period ended September 30, 2023. The Trustees observed that the Fund’s performance was generally consistent with, though slightly below, the performance of a composite of similar
accounts managed by CornerCap over relevant time periods, when taking into account differences in expenses. The Trustees noted that the Fund’s performance included performance of a predecessor fund that was reorganized into to the Fund.
Cost of Advisory Services and Profitability. The Trustees considered the annual advisory fee that the Fund pays to CornerCap under the Investment Advisory
Agreement, as well as CornerCap’s profitability from services that CornerCap rendered to the Fund during the 12-month period ended September 30, 2023. The Trustees also noted favorably that CornerCap had agreed to continue the expense limitation
agreement under which CornerCap contractually agreed to reduce its advisory fees and, if necessary, reimburse the Fund for operating expenses, as specified in the Fund’s prospectus, and observed that CornerCap had waived a portion of its management
fee over the Fund’s most recent fiscal year. The Trustees further considered that the management fee CornerCap charges to the Fund could be higher or lower than the fees charged to separately managed accounts with similar investment strategies to the
Fund, depending on the size and type of account. The Trustees considered the reasonableness of CornerCap’s profits from its service relationship with the Fund.
Comparative Fee and Expense Data. The Trustees considered a comparative analysis of the contractual expenses borne by the Fund and those of funds in the same
Category and Cohort as of September 30, 2023. The Trustees noted that while the Fund’s management fee was above the Category and Cohort averages, the total expenses of the Fund’s Institutional Class (after waivers and expense reimbursements) were
equal to or lower than the Category and Cohort averages. The Trustees also noted that the Fund’s Advisor Class, which has total expenses (after waivers and expense reimbursements) that are higher than the Category and Cohort averages, has a
shareholder servicing fee and a Rule 12b-1 fee, which is not necessarily the case for the funds included in the Category and Cohort. While recognizing that it is difficult to compare advisory fees because the scope of advisory services provided may
vary from one investment adviser to another, the Trustees concluded that CornerCap’s advisory fee continues to be reasonable.
Economies of Scale. The Trustees considered whether the Fund would benefit from any economies of scale, noting that the investment advisory fee for the Fund does
not contain breakpoints. The Trustees took into account the fact that CornerCap had agreed to consider breakpoints in the future should asset levels grow materially. The Trustees agreed to revisit the issue in the future as circumstances change and
asset levels increase.
Other Benefits. The Trustees considered the direct and indirect benefits that could be realized by the Adviser and its affiliates from the Adviser’s relationship
with the Fund. The Trustees considered that CornerCap realizes a soft dollar benefit with respect to portfolio transactions of the Fund. The Trustees also noted that while CornerCap does not use affiliated brokers to execute the portfolio
transactions of the Fund. the Fund utilizes Rule 12b-1 fees to pay for shareholder and distribution services for Advisor Class shareholders of the Fund. The Trustees also considered that CornerCap may receive some form of reputational benefit from
services rendered to the Fund, but that such benefits are immaterial and cannot otherwise be quantified. The Trustees concluded that CornerCap does not receive any additional material benefits from its relationship with the Fund.
|
Annual Report | March 31, 2024
|
37
Additional Information (Unaudited)
March 31, 2024
AVAILABILITY OF FUND PORTFOLIO INFORMATION
The Fund files complete schedules of portfolio holdings with the U.S. Securities and Exchange Commission (the “SEC”) for the first and third quarters of each fiscal year on Part F of Form N-PORT. The
Fund’s Part F of Form N-PORT is available on the SEC’s website at www.sec.gov and may be reviewed and copied at the SEC’s Public Reference Room in Washington, D.C. Information on the operation of the Public Reference Room may be obtained by calling
1-800-732-0330. The Fund’s Part F of Form N-PORT may also be obtained by calling 1-888-813-8637.
AVAILABILITY OF PROXY VOTING INFORMATION
A description of the Fund’s Proxy Voting Policies and Procedures is available without charge, upon request, by calling 1-888-813-8637. Information regarding how the Fund voted proxies relating to
portfolio securities during the most recent 12-month period ended June 30, is available (1) without charge, upon request, by calling 1-888-621-9258, or (2) on the SEC’s website at www.sec.gov.
QUALIFIED DIVIDEND INCOME/DIVIDENDS RECEIVED DEDUCTION
For the fiscal year ended March 31, 2024, certain dividends paid by the Fund may be reported as qualified dividend income and may be eligible for taxation at capital gains rates. The percentage of
dividends declared from ordinary income designated as qualified dividend income was 100.00% for the Fund.
For corporate shareholders, the percent of ordinary income distributions qualifying for the corporate dividends received deduction for the fiscal year ended March 31, 2024 was 100.00% for the Fund.
The percentage of taxable ordinary income distributions that are designated as short-term capital gain distributions under Internal Revenue Section 871 (k)(2)(c) was 0.00%.
|
www.cornercapfunds.com
|
38
Privacy Notice
The Fund collects only relevant information about you that the law allows or requires it to have in order to conduct its business and properly service you. The Fund collects financial and personal
information about you (“Personal Information”) directly (e.g., information on account applications and other forms, such as your name, address, and social security number, and information provided to access account information or conduct account
transactions online, such as password, account number, e-mail address, and alternate telephone number), and indirectly (e.g., information about your transactions with us, such as transaction amounts, account balance and account holdings).
The Fund does not disclose any non-public personal information about its shareholders or former shareholders other than for everyday business purposes such as to process a transaction, service an
account, respond to court orders and legal investigations or as otherwise permitted by law. Third parties that may receive this information include companies that provide transfer agency, technology and administrative services to the Fund, as well as
the Fund’s investment adviser who is an affiliate of the Fund. If you maintain a retirement/educational custodial account directly with the Fund, we may also disclose your Personal Information to the custodian for that account for shareholder
servicing purposes. The Fund limits access to your Personal Information provided to unaffiliated third parties to information necessary to carry out their assigned responsibilities to the Fund. All shareholder records will be disposed of in
accordance with applicable law. The Fund maintains physical, electronic and procedural safeguards to protect your Personal Information and requires its third-party service providers with access to such information to treat your Personal Information
with the same high degree of confidentiality.
In the event that you hold shares of the Fund through a financial intermediary, including, but not limited to, a broker dealer, bank, credit union or trust company, the privacy policy of your financial
intermediary governs how your nonpublic personal information is shared with unaffiliated third parties.
|
Annual Report | March 31, 2024
|
39
[INTENTIONALLY LEFT BLANK]
INVESTMENT ADVISER
CornerCap Investment Counsel, Inc.
1355 Peachtree Street NE, Suite 1700
Atlanta, GA 30309
DISTRIBUTOR
Quasar Distributors, LLC
Three Canal Plaza, Suite 100
Portland, ME 04101
CUSTODIAN
U.S. Bank, N.A.
1555 North Rivercenter Drive
Milwaukee, WI 53212
ADMINISTRATOR, FUND ACCOUNTANT
AND TRANSFER AGENT
U.S. Bancorp Fund Services, LLC
615 East Michigan Street
Milwaukee, WI 53202
INDEPENDENT REGISTERED PUBLIC ACCOUNTING FIRM
Cohen & Company, Ltd.
342 North Water Street, Suite 830
Milwaukee, WI 53202
LEGAL COUNSEL
Stradley Ronon Stevens & Young, LLP
2005 Market Street, Suite 2600
Philadelphia, PA 19103
This report must be accompanied or preceded by a prospectus.
The Fund’s Statement of Additional Information contains additional information about the
Fund’s trustees and is available without charge upon request by calling 1-888-813-8637.
www.cornercapfunds.com
888-813-8637
|
DISTRIBUTOR
|
|
|
Foreside Fund Services, LLC
|
|
|
Three Canal Plaza, Suite 100
|
|
|
Portland, Maine 04101
|
|
|
www.foreside.com
|
|
This report is submitted for the general information of the shareholders of the Fund. It is not authorized for distribution to prospective investors unless preceded or accompanied by an
effective prospectus, which includes information regarding the Fund’s risks, objectives, fees and expenses, experience of their management and other information.
|
(b) Not Applicable.
Item 2. Code of Ethics.
The Registrant has adopted a code of ethics that applies to the Registrant’s principal executive officer and principal financial officer. The Registrant has not made any substantive amendments to its code of ethics during the period covered by
this report.
The Registrant has not granted any waivers from any provisions of the code of ethics during the period covered by this report.
A copy of the Registrant’s Code of Ethics that applies to the Registrant’s principal executive officer and principal financial officer is filed herewith.
Item 3. Audit Committee Financial Expert.
The Registrant’s board of trustees has determined that there is at least one audit committee financial expert serving on its audit committee. Leonard M. Rush is the “audit committee financial expert” and is considered to be “independent” as each
term is defined in Item 3 of Form N‑CSR.
Item 4. Principal Accountant Fees and Services.
The Registrant has engaged its principal accountant to perform audit services, audit-related services, tax services and other services during the past two fiscal years. “Audit services” refer to performing an audit of the Registrant's annual
financial statements or services that are normally provided by the accountant in connection with statutory and regulatory filings or engagements for those fiscal years. “Audit-related services” refer to the assurance and related services by the
principal accountant that are reasonably related to the performance of the audit. “Tax services” refer to professional services rendered by the principal accountant for tax compliance, tax advice, and tax planning; including reviewing the Fund’s tax
returns and distributions calculations. There were no “other services” provided by the principal accountant. For the fiscal years ended March 31, 2024 and March 31, 2023, the Fund’s principal accountant was Cohen & Company, Ltd. The following
table details the aggregate fees billed or expected to be billed for each of the last two fiscal years for audit fees, audit-related fees, tax fees and other fees by the principal accountant.
|
FYE 3/31/2024
|
FYE 3/31/2023
|
|
|
(a) Audit Fees
|
$15,250
|
$17,750
|
|
(b) Audit-Related Fees
|
$0
|
$0
|
|
(c) Tax Fees
|
$3,500
|
$3,500
|
|
(d) All Other Fees
|
$0
|
$0
|
(e)(1) The audit committee has adopted pre-approval policies and procedures that require the audit committee to pre‑approve all audit and non‑audit services of the Registrant, including services provided to any entity
affiliated with the Registrant.
(e)(2) The percentage of fees billed by Cohen & Company, Ltd. for the fiscal years ended March 31, 2024 and March 31, 2023, applicable to non-audit services pursuant to waiver of pre-approval
requirement were as follows:
.
|
FYE 3/31/2024
|
FYE 3/31/2023
|
|
|
Audit-Related Fees
|
0%
|
0%
|
|
Tax Fees
|
0%
|
0%
|
|
All Other Fees
|
0%
|
0%
|
(f) All of the principal accountant’s hours spent on auditing the Registrant’s financial statements were attributed to work performed by full‑time permanent employees of the principal accountant.
(g) The following table indicates the non-audit fees billed or expected to be billed by the Registrant’s accountant for services to the Registrant and to the Registrant’s
investment adviser (and any other controlling entity, etc.—not sub-adviser) for the last two years.
|
Non-Audit Related Fees
|
FYE 3/31/2024
|
FYE 3/31/2023
|
|
Registrant
|
N/A
|
N/A
|
|
Registrant’s Investment Adviser
|
N/A
|
N/A
|
(h) The audit committee of the board of trustees/directors has considered whether the provision of non-audit services that were rendered to the Registrant's investment adviser is compatible with maintaining the principal
accountant's independence and has concluded that the provision of such non-audit services by the accountant has not compromised the accountant’s independence.
|
(i)
|
Not applicable.
|
|
(j)
|
Not applicable.
|
Item 5. Audit Committee of Listed Registrants.
Not applicable to Registrants who are not listed as issuers (as defined in Rule 10A-3 under the Securities Exchange Act of 1934).
Item 6. Schedule of Investments.
|
(a)
|
Schedule of Investments is included as part of the report to shareholders filed under Item 1 of this Form.
|
|
(b)
|
Not applicable.
|
Item 7. Disclosure of Proxy Voting Policies and Procedures for Closed-End Management Investment Companies.
Not applicable to open-end investment companies.
Item 8. Portfolio Managers of Closed-End Management Investment Companies.
Not applicable to open-end investment companies.
Item 9. Purchases of Equity Securities by Closed‑End Management Investment Company and Affiliated Purchases.
Not applicable to open-end investment companies.
Item 10. Submission of Matters to a Vote of Security Holders.
There have been no material changes to the procedures by which shareholders may recommend nominees to the Registrant’s Board of Trustees.
Item 11. Controls and Procedures.
|
(a)
|
The Registrant’s President and Treasurer have reviewed the Registrant's disclosure controls and procedures (as defined in Rule 30a-3(c) under the Investment Company Act of 1940 (the “Act”)) as of a date within 90 days of the filing of
this report, as required by Rule 30a-3(b) under the Act and Rules 13a-15(b) or 15d‑15(b) under the Securities Exchange Act of 1934. Based on their review, such officers have concluded that the disclosure controls and procedures are
effective in ensuring that information required to be disclosed in this report is appropriately recorded, processed, summarized and reported and made known to them by others within the Registrant and by the Registrant’s service provider.
|
|
(b)
|
There were no significant changes in the Registrant's internal control over financial reporting (as defined in Rule 30a-3(d) under the Act) that occurred during the period covered by this report that has materially affected, or is
reasonably likely to materially affect, the Registrant's internal control over financial reporting.
|
Item 12. Disclosure of Securities Lending Activities for Closed-End Management Investment Companies
Not applicable to open-end investment companies.
Item 13. Exhibits.
(3) Any written solicitation to purchase securities under Rule 23c‑1 under the Act sent or given during the period covered by the report by or on behalf of the Registrant to 10 or more
persons. Not applicable to open-end investment companies.
(4) Change in the registrant’s independent public accountant. There was no change in the registrant’s independent public accountant for the period covered by this report.
SIGNATURES
Pursuant to the requirements of the Securities Exchange Act of 1934 and the Investment Company Act of 1940, the Registrant has duly caused this report to be signed on its behalf by the undersigned, thereunto duly
authorized.
(Registrant) Managed Portfolio Series
By (Signature and Title) /s/ Brian R. Wiedmeyer
Brian R. Wiedmeyer, President
Date June 3, 2024
Pursuant to the requirements of the Securities Exchange Act of 1934 and the Investment Company Act of 1940, this report has been signed below by the following persons on behalf of the Registrant and in the capacities and
on the dates indicated.
By (Signature and Title) /s/ Brian R. Wiedmeyer
Brian R. Wiedmeyer, President
Date June 3, 2024
By (Signature and Title) /s/ Benjamin J. Eirich
Benjamin J. Eirich, Treasurer