UNITED STATES
SECURITIES AND EXCHANGE COMMISSION
Washington, D.C. 20549
SECURITIES AND EXCHANGE COMMISSION
Washington, D.C. 20549
FORM N-CSR
CERTIFIED SHAREHOLDER REPORT OF REGISTERED
MANAGEMENT INVESTMENT COMPANIES
Investment Company Act file number 811-22525
Managed Portfolio Series
(Exact name of registrant as specified in charter)
(Exact name of registrant as specified in charter)
615 East Michigan Street
Milwaukee, WI 53202
(Address of principal executive offices) (Zip code)
(Address of principal executive offices) (Zip code)
Brian R. Wiedmeyer, President
Managed Portfolio Series
c/o U.S. Bancorp Fund Services, LLC
777 East Wisconsin Ave, 5th Fl
Milwaukee, WI 53202
(Name and address of agent for service)
(Name and address of agent for service)
(414) 516-1712
Registrant's telephone number, including area code
Date of fiscal year end: April 30, 2024
Date of reporting period: October 31, 2023
Item 1. Reports to Stockholders.
|
(a)
|
|
Nuance Concentrated Value Fund
Investor Class Shares – NCAVX
Institutional Class Shares – NCVLX
Semi-Annual Report
|
www.nuanceinvestments.com
|
October 31, 2023
|
NUANCE CONCENTRATED VALUE FUND
October 31, 2023
Dear Fellow Shareholders:
We are pleased to write our semi-annual shareholder letter for the Nuance Concentrated Value Fund (the “Fund”). The Fund is a classic value investment product investing primarily in the equity or
equity-linked securities of United States based companies. The Fund will typically maintain 15-35 positions in the securities of companies that, in the opinion of the Nuance Investments team, have leading and sustainable market share positions, above
average financial strength, and are trading at prices below our internally derived view of intrinsic value. Although the strategy will invest primarily in the equity securities of U.S. companies, the strategy may invest up to 25% of its assets in
equity securities of foreign companies that are classified as “developed” by MSCI. The primary benchmark for the Fund is the Russell 3000® Value Index. Clients may also
be interested in comparing the Fund to the S&P 500® Index.
Average Annual Rates of Return as of October 31, 2023:
|
6 Months
|
1 Year
|
3 Year
|
5 Year
|
10 Year
|
Since Inception(1)
|
|
|
Institutional Class
|
-14.12%
|
-0.79%
|
3.51%
|
5.19%
|
5.98%
|
7.88%
|
|
Russell 3000® Value Index(2)
|
-4.18%
|
-0.48%
|
10.20%
|
6.38%
|
7.43%
|
8.65%
|
|
S&P 500® Index(3)
|
1.39%
|
10.14%
|
10.36%
|
11.01%
|
11.18%
|
11.74%
|
|
6 Months
|
1 Year
|
3 Year
|
5 Year
|
10 Year
|
Since Inception(4)
|
|
|
Investor Class, no load
|
-14.19%
|
-1.01%
|
3.26%
|
4.92%
|
5.70%
|
8.23%
|
|
Investor Class with load
|
-18.48%
|
-5.97%
|
1.50%
|
3.85%
|
5.16%
|
7.74%
|
|
Russell 3000® Value Index(2)
|
-4.18%
|
-0.48%
|
10.20%
|
6.38%
|
7.43%
|
9.46%
|
|
S&P 500® Index(3)
|
1.39%
|
10.14%
|
10.36%
|
11.01%
|
11.18%
|
12.54%
|
Performance data quoted represents past performance. Past performance does not guarantee future results. The investment return and principal value of an investment will fluctuate so
that an investor’s shares, when redeemed, may be worth more or less than their original cost. Current performance of the fund may be lower or higher than the performance quoted. Investor Class performance data shown reflects both performance with the
maximum sales charge of 5.75% (for periods prior to September 17, 2015) or 5.00% (for period September 17, 2015 and after) and without it. Performance data current to the most recent month end may be obtained by calling 1-855-682-6233.
The Adviser has contractually agreed to waive its management fees and pay Fund expenses in order to ensure that Total Annual Fund Operating Expenses (excluding any front-end or contingent deferred
loads, acquired fund fees and expenses, leverage/borrowing, interest, interest expense, dividends paid on short sales, taxes, brokerage commissions and extraordinary expenses) do not exceed 1.28% of the average daily net assets of the Investor Class
and 1.03% of the average daily net assets of the Institutional Class through at least August 28, 2024.
|
Institutional Class Gross Expense Ratio – 1.11%
|
Net Expense Ratio – 1.04%
|
|
Investor Class Gross Expense Ratio – 1.36%
|
Net Expense Ratio – 1.29%
|
|
(1)
|
May 31, 2011
|
|
(2)
|
The Russell 3000® Value Index measures performance of those Russell 3000 Index companies with lower price-to-book ratios and
lower forecasted growth values. This index cannot be invested in directly.
|
|
(3)
|
The Standard & Poor’s 500® Index (S&P 500) is an unmanaged, capitalization-weighted index generally representative of
the U.S. Market for large capitalization stocks. This Index cannot be invested in directly.
|
|
(4)
|
July 31, 2012
|
In terms of performance, since its inception on May 31, 2011 thru October 31, 2023, the Institutional Class is up 7.88 percent (annualized) versus its primary index – the Russell 3000® Value Index – up 8.65 percent (annualized)
1
NUANCE CONCENTRATED VALUE FUND
and the S&P 500® Index up 11.74 percent (annualized). For more perspective on our longer-term performance please
refer to your prospectus. Nuance Investments, LLC offers a similar strategy. While our Nuance Concentrated Value Fund underperformed the primary benchmark over the 6-month time horizon, Nuance cautions clients regarding the use of short-term
performance as a tool to make investment decisions. As we remind our clients, your team continues to try and find leading business franchises with sustainable competitive positions that are trading below our internally derived view of fair or
intrinsic value. We believe that our time-tested process of finding what we consider best of breed businesses with better than the market downside support and better than the market upside potential over the long-term should lead to solid risk
adjusted returns versus our peers and benchmarks.
At Nuance, our team and our processes are designed to emphasize consistency and what we believe is thorough fundamental analysis of companies that have the potential to lead to investment returns that
will be acceptable for our shareholders over the long term. To do this, we focus our attention on studying one company at a time using the Nuance approach. Part of that approach is to ensure that each company we own has a sound and solid competitive
position and that the companies are undervalued based on our internally derived view of sustainable cash flows, earnings and valuation. We believe in a thorough fundamental valuation analysis and that focusing simply on the value of a business is not
enough. Rather, we spend considerable time studying the down-side potential of each company we own. As such, we believe that we understand the potential upside and the potential downside risks to our investments. This approach is critical to our goal
of trying to provide shareholders with not only above-average returns over time, but above-average risk-adjusted returns as well.
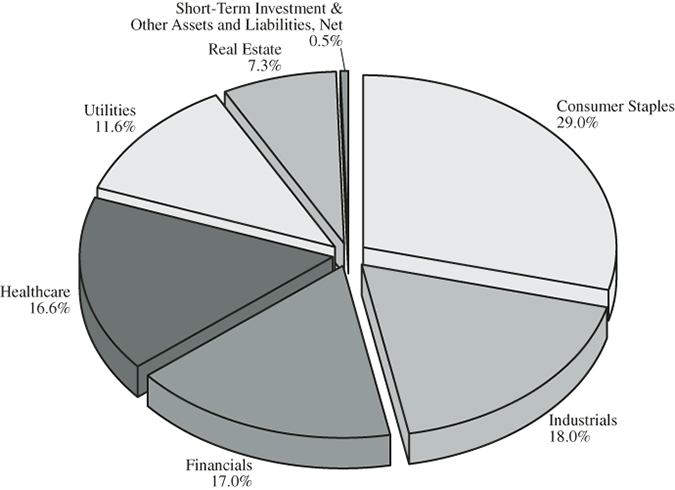
Our largest overweight position, relative to the index, is the Consumer Staples sector. Within the Consumer Staples sector, we are continuing to see input cost inflation-related under-earning in a
number of leaders across the Household Products sub-industry group. Our view is that earnings in this industry group have been negatively impacted by rising raw material costs. We believe these costs can ultimately be mostly offset by price increases
which generally lag the raw material price increases. Additionally, we are seeing some one-off opportunities within the Packaged Foods & Meats and Distillers & Vintners sub-industries. We have added to our exposure within the Utilities
sector. Our overweight in the Utilities sector is primarily made up of exposure to the Water Utilities industry as we believe these companies are under-earning. The prolonged period of low interest rates over the last decade has resulted in
historically low allowed returns on equity and regulatory lag, which has been exacerbated by the recent inflationary environment. We believe these lower returns on equity will reset higher as utility regulators incorporate a more normal cost of
capital environment. We are also finding what we believe to be select opportunities within the Industrials sector, and we have added to our position within the sector. We are also now overweight the Real Estate sector as we are finding, what we
believe to be, one-off opportunities within the Health Care REITs industry. While we have reduced our exposure to the Health Care sector, we continue to find opportunities within the Health Care Supplies and Life Sciences Tools & Services
sub-industries. While we remain underweight the Financials sector, it still makes up a meaningful portion of the portfolio as we have been able to find select risk rewards across different parts of the sector, in our view. We are finding select
opportunities within the Property & Casualty Insurance and Asset Management & Custody Banks sub-industries, to name a few. We reduced our exposure in the Information Technology and Materials sectors and moved into what we view as more
attractive risk rewards in other parts of the economy. We remain underweight the Energy sector where we believe the sector is facing a multi-year period of competitive transition. Lastly, we remain underweight the Consumer Discretionary and
Communication Services sectors primarily due to competitive uncertainty and valuation concerns.
Thank you for your interest and your continued support.
Scott A. Moore, CFA
2
NUANCE CONCENTRATED VALUE FUND
Please visit our website at www.nuanceinvestments.com for more information about our team, our process, and value investing. You can also get real-time access to the Nuance Investment website updates
and information via traditional mail or e-mail. Simply contact us at client.services@nuanceinvestments.com or call 816-743-7080 to sign-up.
This report must be preceded or accompanied by a prospectus.
Mutual fund investing involves risk. Principal loss is possible. Investments in small and mid-capitalization companies involve additional risk such as limited liquidity and greater
volatility than larger capitalization companies. Investments in foreign securities involve political, economic and currency risks, greater volatility and differences in accounting methods. The Fund is non-diversified, meaning it may concentrate its
assets in fewer individual holdings than a diversified fund. Therefore, the Fund is more exposed to individual stock volatility than a diversified fund. The Fund's value investments are subject to the risk that their intrinsic values may not be
recognized by the broad market or that their prices may decline.
Past performance does not guarantee future results.
Opinions expressed are subject to change, are not guaranteed and should not be considered investment advice or recommendations to buy or sell any security.
Nuance Investments is the adviser to the Nuance Concentrated Value Fund which is distributed by Quasar Distributors, LLC.
3
NUANCE CONCENTRATED VALUE FUND
Value of $10,000 Investment (Unaudited)
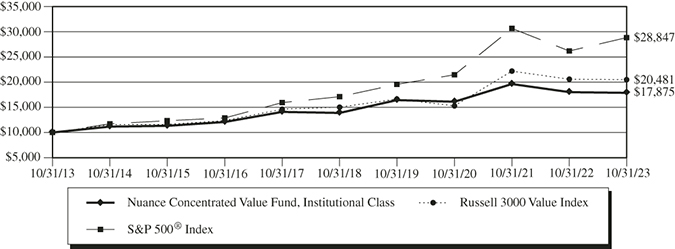
The chart assumes an initial investment of $10,000. Performance reflects waivers of fee and operating expenses in effect. In the absence of such waivers, total return would be
reduced. Performance data quoted represents past performance and does not guarantee future results. Investment returns and principal value will fluctuate, and when sold, may be worth more or less than their original cost. Performance current to the
most recent month-end may be lower or higher than the performance quoted and can be obtained by calling 1-855-682-6233. Performance assumes the reinvestment of capital gains and income distributions. The performance does not reflect the deduction of
taxes that a shareholder would pay on Fund distributions or the redemption of Fund shares.
Average Annual Rates of Return (%) As of October 31, 2023
|
Since
|
|||||
|
1 Year
|
3 Years
|
5 Years
|
10 Years
|
Inception(1)
|
|
|
Investor Class (without sales load)
|
-1.01%
|
3.26%
|
4.92%
|
5.70%
|
7.59%
|
|
Investor Class (with sales load)(2)
|
-5.97%
|
1.50%
|
3.85%
|
5.16%
|
7.15%
|
|
Institutional Class
|
-0.79%
|
3.51%
|
5.19%
|
5.98%
|
7.88%
|
|
Russell 3000 Value Index(3)
|
-0.48%
|
10.20%
|
6.38%
|
7.43%
|
8.65%
|
|
S&P 500 Index(4)
|
10.14%
|
10.36%
|
11.01%
|
11.18%
|
11.74%
|
|
(1)
|
Period from Fund inception through October 31, 2023. The Institutional Class shares commenced operations on May 31, 2011 and Investor Class shares commenced operations on July 31, 2012.
Performance shown for the Investor Class prior to inception of the Investor Class shares is based on the performance of the Institutional Class shares, adjusted for the higher expenses applicable to Investor Class shares.
|
|
(2)
|
Returns reflect a sales load of 5.00%.
|
|
(3)
|
The Russell 3000 Value Index measures performance of those Russell 3000 Index companies with lower price-to-book ratios and lower forecasted growth values. This Index cannot be invested in
directly.
|
|
(4)
|
The Standard & Poor’s 500 Index (S&P 500) is an unmanaged, capitalization-weighted index generally representative of the U.S. market for large capitalization stocks. This Index cannot be
invested in directly.
|
The following is expense information for the Nuance Concentrated Value Fund as disclosed in the Fund’s most recent prospectus dated August 28, 2023:
|
Investor Class Gross Expenses: 1.36%
|
Investor Class Net Expenses: 1.29%
|
|
Institutional Class Gross Expenses: 1.11%
|
Institutional Class Net Expenses: 1.04%
|
4
NUANCE CONCENTRATED VALUE FUND
Nuance Investments, LLC (the “Adviser”) has contractually agreed to waive its management fees and pay Fund expenses, in order to ensure that Total Annual Fund Operating Expenses (excluding any front-end
or contingent deferred loads, acquired fund fees and expenses, leverage/borrowing interest, interest expense, dividends paid on short sales, taxes, brokerage commissions and extraordinary expenses) do not exceed 1.28% of the average daily net assets
of the Investor Class and 1.03% of the average daily net assets of the Institutional Class. Fees waived and expenses paid by the Adviser may be recouped by the Adviser for a period of 36 months following the month during which such fee waiver and/or
expense payment was made if such recoupment can be achieved without exceeding the expense limit in effect at the time the fee waiver and/or expense payment occurred and the expense limit in place at the time of recoupment. The Operating Expenses
Limitation Agreement is indefinite but cannot be terminated through at least August 28, 2024. Thereafter, the agreement may be terminated at any time upon 60 days’ written notice by the Trust’s Board of Trustees (the “Board”) or the Adviser.
5
NUANCE CONCENTRATED VALUE FUND
Expense Example (Unaudited)
October 31, 2023
As a shareholder of the Fund, you incur two types of costs: (1) transaction costs, which may include but are not limited to, sales charges (loads) on purchases; and (2) ongoing costs, including
management fees, distribution and service (12b-1) fees, shareholder servicing fees, and other Fund expenses. This Example is intended to help you understand your ongoing costs (in dollars) of investing in the Fund and to compare these costs with the
ongoing costs of investing in other mutual funds. The Example is based on an investment of $1,000 invested at the beginning of the period and held for the entire period (May 1, 2023 – October 31, 2023).
ACTUAL EXPENSES
For each class, the first line of the table below provides information about actual account values and actual expenses. You may use the information in this line, together with the amount you invested,
to estimate the expenses that you paid over the period. Simply divide your account value by $1,000 (for example, an $8,600 account value divided by $1,000 = 8.6), then multiply the result by the number in the first line under the heading entitled
“Expenses Paid During Period” to estimate the expenses you paid on your account during this period.
HYPOTHETICAL EXAMPLE FOR COMPARISON PURPOSES
For each class, the second line of the table below provides information about hypothetical account values and hypothetical expenses based on the Fund’s actual expense ratio and an assumed rate of return
of 5% per year before expenses, which is not the Fund’s actual return. The hypothetical account values and expenses may not be used to estimate the actual ending account balance or expenses you paid for the period. You may use this information to
compare the ongoing costs of investing in the Fund and other funds. To do so, compare this 5% hypothetical example with the 5% hypothetical examples that appear in the shareholder reports of the other funds.
Please note that the expenses shown in the table are meant to highlight your ongoing costs only and do not reflect any transactional costs. Therefore, the second line of the table is
useful in comparing ongoing costs only, and will not help you determine the relative total costs of owning different funds. In addition, if transactional costs were included, your costs may have been higher.
|
Expenses Paid
|
||||||||||||
|
Beginning Account
|
Ending Account
|
During Period(1)
|
||||||||||
|
Value (5/1/23)
|
Value (10/31/23)
|
(5/1/23 to 10/31/23)
|
||||||||||
|
Investor Class
|
||||||||||||
|
Actual(2)
|
$
|
1,000.00
|
$
|
858.10
|
$
|
5.98
|
||||||
|
Hypothetical (5% return before expenses)
|
$
|
1,000.00
|
$
|
1,018.70
|
$
|
6.50
|
||||||
|
Institutional Class
|
||||||||||||
|
Actual(2)
|
$
|
1,000.00
|
$
|
858.80
|
$
|
4.81
|
||||||
|
Hypothetical (5% return before expenses)
|
$
|
1,000.00
|
$
|
1,019.96
|
$
|
5.23
|
||||||
|
(1)
|
Expenses are equal to the Fund’s annualized expense ratio for the most recent six-month period of 1.28% and 1.03% for the Investor Class and Institutional Class, respectively, multiplied by the
average account value over the period, multiplied by 184/366 to reflect the one-half year period.
|
|
(2)
|
Based on the actual returns for the six-month period ended October 31, 2023 of -14.19% and -14.12% for the Investor Class and Institutional Class, respectively.
|
6
NUANCE CONCENTRATED VALUE FUND
Allocation of Portfolio(1) (% of Net Assets) (Unaudited)
October 31, 2023
Top Ten Equity Holdings(1) (Unaudited)
as of October 31, 2023
(% of Net Assets)
|
3M Co.
|
10.0%
|
||
|
Henkel AG & Co. KGaA – ADR
|
8.5%
|
||
|
Dentsply Sirona, Inc.
|
7.5%
|
||
|
Kimberly-Clark Corp.
|
6.3%
|
||
|
Travelers Companies, Inc.
|
5.8%
|
||
|
Clorox Co.
|
5.8%
|
||
|
United Utilities Group PLC
|
5.4%
|
||
|
Northern Trust Corp.
|
4.8%
|
||
|
Pennon Group PLC
|
4.1%
|
||
|
Healthcare Realty Trust, Inc.
|
3.4%
|
|
(1)
|
Fund holdings and sector allocations are subject to change at any time and are not recommendations to buy or sell any security.
|
ADR – American Depository Receipt
7
NUANCE CONCENTRATED VALUE FUND
Schedule of Investments (Unaudited)
October 31, 2023
|
Shares
|
Value
|
|||||||
|
COMMON STOCKS – 99.5%
|
||||||||
|
Consumer Staples – 29.0%(a)
|
||||||||
|
Beiersdorf AG – ADR
|
44,090
|
$
|
1,155,599
|
|||||
|
Cal-Maine Foods, Inc.
|
100,662
|
4,560,995
|
||||||
|
Clorox Co.
|
109,199
|
12,852,722
|
||||||
|
Diageo PLC – ADR
|
29,121
|
4,470,074
|
||||||
|
Henkel AG & Co. KGaA – ADR
|
1,209,517
|
19,037,798
|
||||||
|
Kimberly-Clark Corp.
|
117,275
|
14,030,781
|
||||||
|
Mission Produce, Inc.(b)
|
441,500
|
4,154,515
|
||||||
|
Pernod Ricard SA – ADR
|
62,377
|
2,215,693
|
||||||
|
Target Corp.
|
20,387
|
2,258,676
|
||||||
|
Total Consumer Staples
|
64,736,853
|
|||||||
|
Financials – 17.0%
|
||||||||
|
Charles Schwab Corp.
|
45,091
|
2,346,536
|
||||||
|
Independent Bank Corp.
|
85,593
|
4,176,938
|
||||||
|
Northern Trust Corp.
|
162,977
|
10,741,814
|
||||||
|
Reinsurance Group of America, Inc.
|
31,612
|
4,725,046
|
||||||
|
TowneBank
|
133,997
|
3,207,888
|
||||||
|
Travelers Companies, Inc.
|
76,852
|
12,868,099
|
||||||
|
Total Financials
|
38,066,321
|
|||||||
|
Health Care – 16.6%
|
||||||||
|
Dentsply Sirona, Inc.
|
549,001
|
16,695,121
|
||||||
|
Envista Holdings Corp.(b)
|
96,011
|
2,234,176
|
||||||
|
Globus Medical, Inc. – Class A(b)
|
140,228
|
6,409,822
|
||||||
|
Smith & Nephew – ADR
|
74,585
|
1,658,770
|
||||||
|
Universal Health Services, Inc.
|
35,789
|
4,505,477
|
||||||
|
Waters Corp.(b)
|
23,253
|
5,546,538
|
||||||
|
Total Health Care
|
37,049,904
|
|||||||
|
Industrials – 18.0%
|
||||||||
|
3M Co.
|
244,542
|
22,241,095
|
||||||
|
Knorr-Bremse AG – ADR
|
461,786
|
6,395,736
|
||||||
|
Lindsay Corp.
|
17,461
|
2,181,228
|
||||||
|
Mueller Water Products, Inc.
|
572,993
|
7,087,924
|
||||||
|
Werner Enterprises, Inc.
|
60,598
|
2,200,919
|
||||||
|
Total Industrials
|
40,106,902
|
|||||||
See Notes to the Financial Statements
8
NUANCE CONCENTRATED VALUE FUND
Schedule of Investments (Unaudited) – Continued
October 31, 2023
|
Shares
|
Value
|
|||||||
|
Real Estate – 7.3%
|
||||||||
|
Alexandria Real Estate Equities, Inc.
|
11,581
|
$
|
1,078,539
|
|||||
|
Equity Commonwealth
|
249,394
|
4,723,522
|
||||||
|
Healthcare Realty Trust, Inc.
|
535,367
|
7,682,516
|
||||||
|
Healthpeak Properties, Inc.
|
187,620
|
2,917,491
|
||||||
|
Total Real Estate
|
16,402,068
|
|||||||
|
Utilities – 11.6%
|
||||||||
|
California Water Service Group
|
97,436
|
4,743,184
|
||||||
|
Pennon Group PLC – ADR
|
509,800
|
9,140,714
|
||||||
|
United Utilities Group PLC – ADR
|
456,710
|
12,016,040
|
||||||
|
Total Utilities
|
25,899,938
|
|||||||
|
TOTAL COMMON STOCKS
|
||||||||
|
(Cost $237,159,392)
|
222,261,986
|
|||||||
|
SHORT-TERM INVESTMENTS – 0.2%
|
||||||||
|
Money Market Funds – 0.2%
|
||||||||
|
First American Government Obligations Fund – Class X, 5.28%(c)
|
404,884
|
404,884
|
||||||
|
Total Money Market Funds
|
404,884
|
|||||||
|
TOTAL SHORT-TERM INVESTMENTS
|
||||||||
|
(Cost $404,884)
|
404,884
|
|||||||
|
TOTAL INVESTMENTS – 99.7%
|
||||||||
|
(Cost $237,564,276)
|
222,666,870
|
|||||||
|
Other Assets in Excess of Liabilities – 0.3%
|
614,902
|
|||||||
|
TOTAL NET ASSETS – 100.0%
|
$
|
223,281,772
|
||||||
Percentages are stated as a percent of net assets.
The Global Industry Classification Standard (GICS®) was developed by and/or is the exclusive property of MSCI, Inc. and
Standard & Poor’s Financial Services LLC (“S&P”). GICS is a service mark of MSCI and S&P and has been licensed for use by U.S. Bank Global Fund Services.
ADR – American Depositary Receipt
PLC – Public Limited Company
|
(a)
|
As of October 31, 2023, the Fund had a significant portion of its assets invested in this sector and therefore is subject to additional risks.
|
|
(b)
|
Non-income producing security.
|
|
(c)
|
The rate shown represents the 7-day effective yield as of October 31, 2023.
|
See Notes to the Financial Statements
9
NUANCE CONCENTRATED VALUE FUND
Statement of Assets and Liabilities (Unaudited)
October 31, 2023
|
ASSETS:
|
||||
|
Investments, at value
|
||||
|
(cost $237,564,276)
|
$
|
222,666,870
|
||
|
Receivable for investment securities sold
|
3,514,845
|
|||
|
Receivable for capital shares sold
|
47,640
|
|||
|
Dividends & interest receivable
|
597,968
|
|||
|
Prepaid expenses
|
21,465
|
|||
|
Total assets
|
226,848,788
|
|||
|
LIABILITIES:
|
||||
|
Payable for investment securities purchased
|
3,171,883
|
|||
|
Payable for capital shares redeemed
|
164,783
|
|||
|
Payable to investment adviser
|
153,931
|
|||
|
Payable for trustee fees
|
4,955
|
|||
|
Accrued distribution & shareholder service fees
|
41,751
|
|||
|
Accrued expenses
|
29,713
|
|||
|
Total liabilities
|
3,567,016
|
|||
|
NET ASSETS
|
$
|
223,281,772
|
||
|
NET ASSETS CONSIST OF:
|
||||
|
Paid-in capital
|
$
|
257,526,856
|
||
|
Total distributable earnings
|
(34,245,084
|
)
|
||
|
Net Assets
|
$
|
223,281,772
|
||
|
Investor
|
Institutional
|
|||||||
|
Class
|
Class
|
|||||||
|
Net Assets
|
$
|
11,931,964
|
$
|
211,349,808
|
||||
|
Shares issued and outstanding(1)
|
1,107,714
|
19,616,985
|
||||||
|
Net asset value, redemption price and minimum offering price per share
|
$
|
10.77
|
$
|
10.77
|
||||
|
Maximum offering price per share ($10.77/0.95)(2)
|
$
|
11.34
|
N/A
|
|||||
|
(1)
|
Unlimited shares authorized with no par value.
|
|
(2)
|
Reflects a maximum sales charge of 5.00%.
|
See Notes to the Financial Statements
10
NUANCE CONCENTRATED VALUE FUND
Statement of Operations (Unaudited)
For the Six Months Ended October 31, 2023
|
INVESTMENT INCOME:
|
||||
|
Dividend income
|
$
|
3,363,392
|
||
|
Less: Foreign taxes withheld
|
(39,445
|
)
|
||
|
Interest income
|
343,949
|
|||
|
Total investment income
|
3,667,896
|
|||
|
EXPENSES:
|
||||
|
Investment adviser fees (See Note 4)
|
1,107,082
|
|||
|
Fund services fees (See Note 4)
|
78,405
|
|||
|
Federal & state registration fees
|
23,304
|
|||
|
Trustee fees
|
10,567
|
|||
|
Audit fees
|
9,703
|
|||
|
Legal fees
|
5,430
|
|||
|
Postage & printing fees
|
5,118
|
|||
|
Other
|
4,054
|
|||
|
Insurance fees
|
1,951
|
|||
|
Distribution & shareholder service fees (See Note 5):
|
||||
|
Investor Class
|
27,727
|
|||
|
Institutional Class
|
129,479
|
|||
|
Total expenses before waiver
|
1,402,820
|
|||
|
Less: waiver from investment adviser (See Note 4)
|
(43,968
|
)
|
||
|
Net expenses
|
1,358,852
|
|||
|
NET INVESTMENT INCOME
|
2,309,044
|
|||
|
REALIZED AND UNREALIZED LOSS ON INVESTMENTS:
|
||||
|
Net realized loss on investments
|
(491,099
|
)
|
||
|
Net change in unrealized appreciation/depreciation on investments
|
(39,846,963
|
)
|
||
|
Net realized and unrealized loss on investments
|
(40,338,062
|
)
|
||
|
NET DECREASE IN NET ASSETS RESULTING FROM OPERATIONS
|
$
|
(38,029,018
|
)
|
|
See Notes to the Financial Statements
11
NUANCE CONCENTRATED VALUE FUND
Statements of Changes in Net Assets
|
Six Months Ended
|
||||||||
|
October 31, 2023
|
Year Ended
|
|||||||
|
(Unaudited)
|
April 30, 2023
|
|||||||
|
OPERATIONS:
|
||||||||
|
Net investment income
|
$
|
2,309,044
|
$
|
4,007,931
|
||||
|
Net realized loss on investments
|
(491,099
|
)
|
(12,310,188
|
)
|
||||
|
Net change in unrealized appreciation/depreciation on investments
|
(39,846,963
|
)
|
24,736,397
|
|||||
|
Net increase (decrease) in net assets resulting from operations
|
(38,029,018
|
)
|
16,434,140
|
|||||
|
CAPITAL SHARE TRANSACTIONS:
|
||||||||
|
Investor Class:
|
||||||||
|
Proceeds from shares sold
|
373,455
|
871,339
|
||||||
|
Proceeds from reinvestment of distributions
|
186,252
|
1,879,907
|
||||||
|
Payments for shares redeemed
|
(1,761,247
|
)
|
(3,921,892
|
)
|
||||
|
Decrease in net assets resulting from Investor Class transactions
|
(1,201,540
|
)
|
(1,170,646
|
)
|
||||
|
Institutional Class:
|
||||||||
|
Proceeds from shares sold
|
10,255,601
|
40,417,652
|
||||||
|
Proceeds from reinvestment of distributions
|
3,101,672
|
28,464,378
|
||||||
|
Payments for shares redeemed
|
(33,051,924
|
)
|
(183,776,950
|
)
|
||||
|
Decrease in net assets resulting from Institutional Class transactions
|
(19,694,651
|
)
|
(114,894,920
|
)
|
||||
|
Net decrease in net assets resulting from capital share transactions
|
(20,896,191
|
)
|
(116,065,566
|
)
|
||||
|
DISTRIBUTIONS TO SHAREHOLDERS:
|
||||||||
|
Investor Class
|
(189,270
|
)
|
(1,915,852
|
)
|
||||
|
Institutional Class
|
(3,655,066
|
)
|
(36,466,421
|
)
|
||||
|
Total distributions to shareholders
|
(3,844,336
|
)
|
(38,382,273
|
)
|
||||
|
TOTAL DECREASE IN NET ASSETS
|
(62,769,545
|
)
|
(138,013,699
|
)
|
||||
|
NET ASSETS:
|
||||||||
|
Beginning of period
|
286,051,317
|
424,065,016
|
||||||
|
End of period
|
$
|
223,281,772
|
$
|
286,051,317
|
||||
See Notes to the Financial Statements
12
NUANCE CONCENTRATED VALUE FUND
Financial Highlights
For a Fund share outstanding throughout the period.
|
Six Months Ended
|
Year Ended
|
Year Ended
|
Year Ended
|
Year Ended
|
Year Ended
|
|||||||||||||||||||
|
October 31, 2023
|
April 30,
|
April 30,
|
April 30,
|
April 30,
|
April 30,
|
|||||||||||||||||||
|
(Unaudited)
|
2023
|
2022
|
2021
|
2020
|
2019
|
|||||||||||||||||||
|
Investor Class
|
||||||||||||||||||||||||
|
PER SHARE DATA:
|
||||||||||||||||||||||||
|
Net asset value, beginning of period
|
$
|
12.72
|
$
|
13.48
|
$
|
16.18
|
$
|
12.49
|
$
|
14.17
|
$
|
14.35
|
||||||||||||
|
INVESTMENT OPERATIONS:
|
||||||||||||||||||||||||
|
Net investment income
|
0.10
|
0.13
|
0.14
|
0.05
|
0.13
|
0.10
|
||||||||||||||||||
|
Net realized and unrealized
|
||||||||||||||||||||||||
|
gain (loss) on investments
|
(1.89
|
)
|
0.73
|
(0.50
|
)
|
3.68
|
(0.70
|
)
|
1.32
|
|||||||||||||||
|
Total from investment operations
|
(1.79
|
)
|
0.86
|
(0.36
|
)
|
3.73
|
(0.57
|
)
|
1.42
|
|||||||||||||||
|
LESS DISTRIBUTIONS:
|
||||||||||||||||||||||||
|
Distributions from net investment income
|
(0.16
|
)
|
(0.08
|
)
|
(0.08
|
)
|
(0.04
|
)
|
(0.12
|
)
|
(0.10
|
)
|
||||||||||||
|
Distributions from net realized gains
|
—
|
(1.54
|
)
|
(2.26
|
)
|
—
|
(0.99
|
)
|
(1.50
|
)
|
||||||||||||||
|
Total distributions
|
(0.16
|
)
|
(1.62
|
)
|
(2.34
|
)
|
(0.04
|
)
|
(1.11
|
)
|
(1.60
|
)
|
||||||||||||
|
Net asset value, end of period
|
$
|
10.77
|
$
|
12.72
|
$
|
13.48
|
$
|
16.18
|
$
|
12.49
|
$
|
14.17
|
||||||||||||
|
TOTAL RETURN(1)(2)
|
(14.19
|
)%
|
7.47
|
%
|
(2.35
|
)%
|
29.96
|
%
|
(5.02
|
)%
|
11.76
|
%
|
||||||||||||
|
SUPPLEMENTAL DATA AND RATIOS:
|
||||||||||||||||||||||||
|
Net assets, end of period (in millions)
|
$
|
11.9
|
$
|
15.4
|
$
|
17.4
|
$
|
27.7
|
$
|
52.4
|
$
|
89.1
|
||||||||||||
|
Ratio of expenses to
|
||||||||||||||||||||||||
|
average net assets(3):
|
||||||||||||||||||||||||
|
Before expense waiver/recoupment
|
1.36
|
%
|
1.35
|
%
|
1.33
|
%
|
1.33
|
%
|
1.34
|
%
|
1.38
|
%
|
||||||||||||
|
After expense waiver/recoupment
|
1.28
|
%
|
1.28
|
%
|
1.28
|
%
|
1.28
|
%
|
1.28
|
%
|
1.38
|
%(4)
|
||||||||||||
|
Ratio of net investment income to
|
||||||||||||||||||||||||
|
average net assets(3):
|
||||||||||||||||||||||||
|
Before expense waiver/recoupment
|
1.46
|
%
|
0.90
|
%
|
0.67
|
%
|
0.16
|
%
|
0.84
|
%
|
0.64
|
%
|
||||||||||||
|
After expense waiver/recoupment
|
1.54
|
%
|
0.97
|
%
|
0.72
|
%
|
0.21
|
%
|
0.90
|
%
|
0.64
|
%
|
||||||||||||
|
Portfolio turnover rate(2)
|
44
|
%
|
67
|
%
|
68
|
%
|
87
|
%
|
130
|
%
|
93
|
%
|
||||||||||||
|
(1)
|
Total return does not reflect sales charges.
|
|
(2)
|
Not annualized for periods less than one year.
|
|
(3)
|
Annualized for periods less than one year.
|
|
(4)
|
On April 30, 2019, the Adviser lowered the limit of annual operating expenses from 1.40% to 1.28% of average daily net assets.
|
See Notes to the Financial Statements
13
NUANCE CONCENTRATED VALUE FUND
Financial Highlights
For a Fund share outstanding throughout the period.
|
Six Months Ended
|
Year Ended
|
Year Ended
|
Year Ended
|
Year Ended
|
Year Ended
|
|||||||||||||||||||
|
October 31, 2023
|
April 30,
|
April 30,
|
April 30,
|
April 30,
|
April 30,
|
|||||||||||||||||||
|
(Unaudited)
|
2023
|
2022
|
2021
|
2020
|
2019
|
|||||||||||||||||||
|
Institutional Class
|
||||||||||||||||||||||||
|
PER SHARE DATA:
|
||||||||||||||||||||||||
|
Net asset value, beginning of period
|
$
|
12.73
|
$
|
13.50
|
$
|
16.21
|
$
|
12.53
|
$
|
14.23
|
$
|
14.39
|
||||||||||||
|
INVESTMENT OPERATIONS:
|
||||||||||||||||||||||||
|
Net investment income
|
0.11
|
0.17
|
0.15
|
0.07
|
0.16
|
0.14
|
||||||||||||||||||
|
Net realized and unrealized
|
||||||||||||||||||||||||
|
gain (loss) on investments
|
(1.89
|
)
|
0.72
|
(0.47
|
)
|
3.71
|
(0.71
|
)
|
1.34
|
|||||||||||||||
|
Total from investment operations
|
(1.78
|
)
|
0.89
|
(0.32
|
)
|
3.78
|
(0.55
|
)
|
1.48
|
|||||||||||||||
|
LESS DISTRIBUTIONS:
|
||||||||||||||||||||||||
|
Distributions from net investment income
|
(0.18
|
)
|
(0.12
|
)
|
(0.13
|
)
|
(0.10
|
)
|
(0.16
|
)
|
(0.14
|
)
|
||||||||||||
|
Distributions from net realized gains
|
—
|
(1.54
|
)
|
(2.26
|
)
|
—
|
(0.99
|
)
|
(1.50
|
)
|
||||||||||||||
|
Total distributions
|
(0.18
|
)
|
(1.66
|
)
|
(2.39
|
)
|
(0.10
|
)
|
(1.15
|
)
|
(1.64
|
)
|
||||||||||||
|
Net asset value, end of period
|
$
|
10.77
|
$
|
12.73
|
$
|
13.50
|
$
|
16.21
|
$
|
12.53
|
$
|
14.23
|
||||||||||||
|
TOTAL RETURN(1)
|
(14.12
|
)%
|
7.78
|
%
|
(2.09
|
)%
|
30.30
|
%
|
(4.85
|
)%
|
12.14
|
%
|
||||||||||||
|
SUPPLEMENTAL DATA AND RATIOS:
|
||||||||||||||||||||||||
|
Net assets, end of period (in millions)
|
$
|
211.3
|
$
|
270.7
|
$
|
406.6
|
$
|
488.2
|
$
|
381.3
|
$
|
343.4
|
||||||||||||
|
Ratio of expenses to
|
||||||||||||||||||||||||
|
average net assets(2):
|
||||||||||||||||||||||||
|
Before expense waiver/recoupment
|
1.06
|
%
|
1.06
|
%
|
1.04
|
%
|
1.04
|
%
|
1.05
|
%
|
1.07
|
%
|
||||||||||||
|
After expense waiver/recoupment
|
1.03
|
%
|
1.03
|
%
|
1.03
|
%
|
1.03
|
%
|
1.03
|
%
|
1.07
|
%(3)
|
||||||||||||
|
Ratio of net investment income to
|
||||||||||||||||||||||||
|
average net assets(2):
|
||||||||||||||||||||||||
|
Before expense waiver/recoupment
|
1.76
|
%
|
1.19
|
%
|
0.97
|
%
|
0.45
|
%
|
1.13
|
%
|
0.95
|
%
|
||||||||||||
|
After expense waiver/recoupment
|
1.79
|
%
|
1.22
|
%
|
0.98
|
%
|
0.46
|
%
|
1.15
|
%
|
0.95
|
%
|
||||||||||||
|
Portfolio turnover rate(1)
|
44
|
%
|
67
|
%
|
68
|
%
|
87
|
%
|
130
|
%
|
93
|
%
|
||||||||||||
|
(1)
|
Not annualized for periods less than one year.
|
|
(2)
|
Annualized for periods less than one year.
|
|
(3)
|
On April 30, 2019, the Adviser lowered the limit of annual operating expenses from 1.15% to 1.03% of average daily net assets.
|
See Notes to the Financial Statements
14
NUANCE CONCENTRATED VALUE FUND
Notes to the Financial Statements (Unaudited)
October 31, 2023
1. ORGANIZATION
Managed Portfolio Series (the “Trust”) was organized as a Delaware statutory trust on January 27, 2011. The Trust is registered under the Investment Company Act of 1940, as amended (the “1940 Act”), as
an open-end management investment company. The Nuance Concentrated Value Fund (the “Fund”) is a non-diversified series with its own investment objectives and policies within the Trust. The investment objective of the Fund is long-term capital
appreciation. The Fund is an investment company and accordingly follows the investment company accounting and reporting guidance of the Financial Accounting Standards Board (“FASB”) Accounting Standards Codification Topic 946 Financial Services –
Investment Companies. The Fund commenced operations on May 31, 2011. The Fund currently offers two classes, the Investor Class and the Institutional Class. Investor Class shares are subject to a 0.25% of average daily net assets distribution and
servicing fee and each class of shares is subject to a shareholder servicing fee of up to 0.15% of average daily net assets. Each class of shares has identical rights and privileges with respect to voting on matters affecting a single share class.
The Fund may issue an unlimited number of shares of beneficial interest, with no par value.
2. SIGNIFICANT ACCOUNTING POLICIES
The following is a summary of significant accounting policies consistently followed by the Fund in the preparation of its financial statements. These policies are in conformity with generally accepted
accounting principles in the United States of America (“GAAP”).
Security Valuation – All investments in securities are recorded at their estimated fair value, as described in Note 3.
Federal Income Taxes – The Fund complies with the requirements of Subchapter M of the Internal Revenue Code of 1986, as amended, necessary to qualify as a
regulated investment company and distributes substantially all net taxable investment income and net realized gains to shareholders in a manner which results in no tax cost to the Fund. Therefore, no federal income or excise tax provision is
required. As of and during the period ended October 31, 2023, the Fund did not have any tax positions that did not meet the “more-likely-than-not” threshold of being sustained by the applicable tax authority. The Fund recognizes interest and
penalties, if any, related to unrecognized tax benefits on uncertain tax positions as income tax expense in the Statement of Operations. During the period ended October 31, 2023, the Fund did not incur any interest or penalties.
Security Transactions, Income and Distributions – The Fund follows industry practice and records security transactions on the trade date. Realized gains and
losses on sales of securities are calculated on the basis of identified cost. Dividend income is recorded on the ex-dividend date and interest income is recorded on an accrual basis. Withholding taxes on foreign dividends have been provided for in
accordance with the Fund’s understanding of the applicable country’s tax rules and regulations. Discounts and premiums on securities purchased are amortized over the expected life of the respective securities using the constant yield method of
calculation.
The Fund will make distributions, if any, of net investment income quarterly. The Fund will also distribute net realized capital gains, if any, annually. Distributions to shareholders are recorded on
the ex-dividend date. The treatment for financial reporting purposes of distributions made to shareholders during the year from net investment income or net realized capital gains may differ from their treatment for federal income tax purposes.
These differences are caused primarily by differences in the timing of the recognition of certain components of income, expense or realized capital gain for federal income tax purposes. Where such differences are permanent in nature, GAAP requires
that they be reclassified in the components of the net assets based on their ultimate
15
NUANCE CONCENTRATED VALUE FUND
Notes to the Financial Statements (Unaudited) – Continued
October 31, 2023
characterization for federal income tax purposes. Any such reclassifications will have no effect on net assets, results of operations or net asset values per share of the Fund.
Use of Estimates – The preparation of financial statements in conformity with GAAP requires management to make estimates and assumptions that affect the reported
amounts of assets and liabilities and disclosure of contingent assets and liabilities at the date of the financial statements and the reported amounts of revenues and expenses during the reporting period. Actual results could differ from those
estimates.
Allocation of Income, Expenses and Gains/Losses – Income, expenses (other than those deemed attributable to a specific share class), and gains and losses of the
Fund are allocated daily to each class of shares based upon the ratio of net assets represented by each class as a percentage of the net assets of the Fund. Expenses deemed directly attributable to a class of shares are recorded by the specific
class. Most Fund expenses are allocated by class based on relative net assets. 12b-1 fees are expensed at 0.25% of average daily net assets of Investor Class shares. Shareholder service fees are expensed at up to 0.15% of average daily net assets
for each class of shares. Expenses associated with a specific fund in the Trust are charged to that fund. Common Trust expenses are typically allocated evenly between the funds of the Trust, or by other equitable means.
3. SECURITIES VALUATION
The Fund has adopted authoritative fair value accounting standards which establish an authoritative definition of fair value and set out a hierarchy for measuring fair value. These standards require
additional disclosures about the various inputs and valuation techniques used to develop the measurements of fair value, a discussion in changes in valuation techniques and related inputs during the period and expanded disclosure of valuation levels
for major security types. These inputs are summarized in the three broad levels listed below:
|
Level 1 –
|
Unadjusted quoted prices in active markets for identical assets or liabilities that the Fund has the ability to access.
|
|
Level 2 –
|
Observable inputs other than quoted prices included in Level 1 that are observable for the asset or liability, either directly or indirectly. These inputs may include quoted prices for the
identical instrument on an inactive market, prices for similar instruments, interest rates, prepayment speeds, credit risk, yield curves, default rates and similar data.
|
|
Level 3 –
|
Unobservable inputs for the asset or liability, to the extent relevant observable inputs are not available, representing the Fund’s own assumptions about the assumptions a market participant
would use in valuing the asset or liability, and would be based on the best information available.
|
Following is a description of the valuation techniques applied to the Fund’s major categories of assets and liabilities measured at fair value on a recurring basis. The Fund’s investments are carried
at fair value.
Equity Securities – Securities that are primarily traded on a national securities exchange are valued at the last sale price on the exchange on which they are
primarily traded on the day of valuation or, if there has been no sale on such day, at the mean between the bid and ask prices. Securities traded primarily in the Nasdaq Global Market System for which market quotations are readily available are
valued using the Nasdaq Official Closing Price (“NOCP”). If the NOCP is not available, such securities are valued at the last sale price on the day of valuation, or if there has been no sale on such day, at the mean between the bid and ask prices.
To the extent these securities are actively traded and valuation adjustments are not applied, they are categorized in Level 1 of the fair value hierarchy.
16
NUANCE CONCENTRATED VALUE FUND
Notes to the Financial Statements (Unaudited) – Continued
October 31, 2023
Short-Term Investments – Investments in other mutual funds, including money market funds are valued at their net asset value per share and are categorized in
Level 1 of the fair value hierarchy. To the extent these securities are actively traded and valuation adjustments are not applied, they are categorized in Level 1 of the fair value hierarchy.
The Board of Trustees (the “Board”) has adopted a pricing and valuation policy for use by the Fund and its Valuation Designee (as defined below) in calculating the Fund’s NAV. Pursuant to Rule 2a-5
under the 1940 Act, the Fund has designated Nuance Investments, LLC (the “Adviser”) as its “Valuation Designee” to perform all of the fair value determinations as well as to perform all of the responsibilities that may be performed by the Valuation
Designee in accordance with Rule 2a-5. The Valuation Designee is authorized to make all necessary determinations of the fair values of portfolio securities and other assets for which market quotations are not readily available or if it is deemed that
the prices obtained from brokers and dealers or independent pricing services are unreliable.
The inputs or methodology used for valuing securities are not an indication of the risk associated with investing in those securities. The following is a summary of the inputs used to value the Fund’s
securities as of October 31, 2023:
|
Level 1
|
Level 2
|
Level 3
|
Total
|
|||||||||||||
|
Common Stocks
|
$
|
222,261,286
|
$
|
—
|
$
|
—
|
$
|
222,261,286
|
||||||||
|
Short-Term Investment
|
414,884
|
—
|
—
|
414,884
|
||||||||||||
|
Total Investments in Securities
|
$
|
222,666,870
|
$
|
—
|
$
|
—
|
$
|
222,666,870
|
||||||||
Refer to the Schedule of Investments for further information on the classification of investments.
4. INVESTMENT ADVISORY FEE AND OTHER TRANSACTIONS WITH AFFILIATES
The Trust has an agreement with Nuance Investments, LLC (the “Adviser”) to furnish investment advisory services to the Fund. Pursuant to an Investment Advisory Agreement between the Trust and the
Adviser, the Adviser is entitled to receive, on a monthly basis, an annual advisory fee equal to 0.85% of the Fund’s average daily net assets.
The Fund’s Adviser has contractually agreed to waive a portion or all of its management fees and reimburse the Fund for its expenses to ensure that total annual operating expenses (excluding acquired
fund fees and expenses, leverage, interest, dividend and interest expense on short sales, taxes, brokerage commissions and extraordinary expenses) for the Fund do not exceed 1.28% and 1.03% of average daily net assets of the Fund’s Investor Class and
Institutional Class, respectively. Fees waived and expenses reimbursed by the Adviser may be recouped by the Adviser for a period of thirty-six months following the month during which such waiver or reimbursement was made if such recoupment can be
achieved without exceeding the expense limit in effect at the time the waiver and reimbursement occurred. The Operating Expense Limitation Agreement is intended to be continual in nature and cannot be terminated within a year after the effective
date of the Fund’s prospectus. After that date, the agreement may be terminated at any time upon 60 days’ written notice by the Trust’s Board or the Adviser, with the consent of the Board. Waived fees and reimbursed expenses subject to potential
recovery by year of expiration are as follows:
|
Expiration
|
Amount
|
|
|
November 2023 – April 2024
|
$ 22,285
|
|
|
May 2024 – April 2025
|
$ 64,815
|
|
|
May 2025 – April 2026
|
$114,061
|
|
|
May 2026 – October 2026
|
$ 43,968
|
17
NUANCE CONCENTRATED VALUE FUND
Notes to the Financial Statements (Unaudited) – Continued
October 31, 2023
U.S. Bancorp Fund Services, LLC, doing business as U.S. Bank Global Fund Services, (“Fund Services” or the “Administrator”), acts as the Fund’s Administrator, Transfer Agent, and Fund Accountant. U.S.
Bank N.A. (the “Custodian”) serves as the custodian to the Fund. The Custodian is an affiliate of the Administrator. The Administrator performs various administrative and accounting services for the Fund. The Administrator prepares various federal
and state regulatory filings, reports and returns for the Fund; prepares reports and materials to be supplied to the Trustees; monitors the activities of the Fund’s custodian; coordinates the payment of the Fund’s expenses and reviews the Fund’s
expense accruals. The officers of the Trust, including the Chief Compliance Officer are employees of the Administrator. As compensation for its services, the Administrator is entitled to a monthly fee at an annual rate based upon the average daily
net assets of the Fund, subject to annual minimums. Fees paid by the Fund for administration and accounting, transfer agency, custody and compliance services for the period ended October 31, 2023, are disclosed in the Statement of Operations as fund
services fees.
5. DISTRIBUTION & SHAREHOLDER SERVICING FEES
The Fund has adopted a Distribution Plan pursuant to Rule 12b-1 (the “Plan”) in the Investor Class only. The Plan permits the Fund to pay for distribution and related expenses at an annual rate of
0.25% of the Investor Class average daily net assets. The expenses covered by the Plan may include the cost of preparing and distributing prospectuses and other sales material, advertising and public relations expenses, payments to financial
intermediaries and compensation of personnel involved in selling shares of the Fund. Payments made pursuant to the Plan will represent compensation for distribution and service activities, not reimbursements for specific expenses incurred. For the
period ended October 31, 2023, the Investor Class incurred expenses of $17,330 pursuant to the Plan.
The Fund has entered into a shareholder servicing agreement (the “Agreement”) where the Adviser acts as the shareholder agent, under which the Fund may pay servicing fees at an annual rate of up to
0.15% of the average daily net assets of each class. Payments, if any, to the Adviser under the Agreement may reimburse the Adviser for payments it makes to selected brokers, dealers and administrators which have entered into service agreements with
the Adviser for services provided to shareholders of the Fund. Payments may also be made directly to the intermediaries providing shareholder services. Services provided by such intermediaries also include the provision of support services to the
Fund and includes establishing and maintaining shareholders’ accounts and record processing, purchase and redemption transactions, answering routine client inquiries regarding the Fund, and providing such other personal services to shareholders as
the Fund may reasonably request. For the period ended October 31, 2023, the Investor and Institutional Class incurred $10,397 and $129,479, respectively, of shareholder servicing fees under the Agreement.
18
NUANCE CONCENTRATED VALUE FUND
Notes to the Financial Statements (Unaudited) – Continued
October 31, 2023
6. CAPITAL SHARE TRANSACTIONS
Transactions in shares of the Fund were as follows:
|
Period Ended
|
Year Ended
|
|||||||
|
October 31, 2023
|
April 30, 2023
|
|||||||
|
Investor Class:
|
||||||||
|
Shares sold
|
31,011
|
69,656
|
||||||
|
Shares issued to holders in reinvestment of distributions
|
15,533
|
160,457
|
||||||
|
Shares redeemed
|
(146,207
|
)
|
(315,486
|
)
|
||||
|
Net decrease in Investor Class shares
|
(99,663
|
)
|
(85,373
|
)
|
||||
|
Institutional Class:
|
||||||||
|
Shares sold
|
855,568
|
3,214,931
|
||||||
|
Shares issued to holders in reinvestment of distributions
|
259,562
|
2,424,323
|
||||||
|
Shares redeemed
|
(2,770,745
|
)
|
(14,479,189
|
)
|
||||
|
Net decrease in Institutional Class shares
|
(1,655,615
|
)
|
(8,839,935
|
)
|
||||
|
Net decrease in shares outstanding
|
(1,725,278
|
)
|
(8,925,308
|
)
|
||||
7. INVESTMENT TRANSACTIONS
The aggregate purchases and sales, excluding short-term investments, by the Fund for the period ended October 31, 2023, were as follows:
|
Purchases
|
Sales
|
||
|
U.S. Government
|
$ —
|
$ —
|
|
|
Other
|
$109,742,292
|
$106,839,983
|
8. FEDERAL TAX INFORMATION
The aggregate gross unrealized appreciation and depreciation of securities held by the Fund and the total cost of securities for federal income tax purposes at April 30, 2023, the Fund’s most recent
fiscal year end, were as follows:
|
Aggregate Gross
|
Aggregate Gross
|
Net Unrealized
|
Federal Income
|
|
|
Appreciation
|
Depreciation
|
Appreciation
|
Tax Cost
|
|
|
$33,379,331
|
$(17,368,236)
|
$16,011,095
|
$269,577,960
|
The difference between book-basis and tax-basis unrealized appreciation is attributable primarily to the deferral of wash sale losses. At April 30, 2023, components of distributable earnings on a
tax-basis were as follows:
|
Undistributed
|
Other
|
Net
|
Total
|
|
|
Undistributed
|
Long-Term
|
Accumulated
|
Unrealized
|
Distributable
|
|
Ordinary Income
|
Capital Gains
|
Losses
|
Appreciation
|
Earnings
|
|
$1,686,181
|
$—
|
$(10,069,006)
|
$16,011,095
|
$7,628,270
|
As of April 30, 2023, the Fund’s most recent fiscal year end, the Fund had 7,013,997 in short term and 3,055,009 in long term capital loss carryovers. A regulated investment company may elect for any
taxable year to treat any portion of any qualified late year loss as arising on the first day of the next taxable year. Qualified late year losses are certain capital, and ordinary losses which occur during the portion of the Fund’s taxable year
subsequent to October 31. For the taxable year ended April 30, 2023, the Fund does not plan to defer any qualified later year losses.
19
NUANCE CONCENTRATED VALUE FUND
Notes to the Financial Statements (Unaudited) – Continued
October 31, 2023
The tax character of distributions paid during the year ended October 31, 2023, were as follows:
|
Ordinary
|
Long-Term
|
||
|
Income*
|
Capital Gains
|
Total
|
|
|
$3,844,336
|
$—
|
$3,844,336
|
The tax character of distributions paid during the year ended April 30, 2023, were as follows:
|
Ordinary
|
Long-Term
|
||
|
Income*
|
Capital Gains
|
Total
|
|
|
$4,711,234
|
$33,611,039
|
$38,382,273
|
|
*
|
For federal income tax purposes, distributions of short-term capital gains are treated as ordinary income distributions.
|
The Fund designated as long-term capital gain dividend, pursuant to Internal Revenue Code Section 852(b)(3), the amount necessary to reduce the earnings and profits of the Fund related to net capital
gain to zero for the tax year ended April 30, 2023.
9. CONTROL OWNERSHIP
The beneficial ownership, either directly or indirectly, of more than 25% of the voting securities of a fund creates a presumption of control of the fund, under Section 2(a)(9) of the Investment Company
Act of 1940. As of October 31, 2023, Charles Schwab & Co., Inc. and National Financial Services, LLC, for the benefit of their customers, owned 54.25% and 37.52% of the Fund, respectively.
10. OTHER REGULATORY MATTERS
In October 2022, the Securities and Exchange Commission (the “SEC”) adopted a final rule relating to Tailored Shareholder Reports for Mutual Funds and Exchange-Traded Funds; Fee Information in
Investment Company Advertisements. The rule and form amendments will, among other things, require the Fund to transmit concise and visually engaging shareholder reports that highlight key information. The amendments will require that funds tag
information in a structured data format and that certain more in-depth information be made available online and available for delivery free of charge to investors on request. The amendments became effective January 24, 2023. There is an 18-month
transition period after the effective date of the amendment.
20
NUANCE CONCENTRATED VALUE FUND
Liquidity Risk Management Discussion
Pursuant to Rule 22e-4 under the Investment Company Act of 1940, Managed Portfolio Series (the “Trust”), on behalf of the Nuance Concentrated Value Fund (the “Fund”), has adopted and implemented a
written liquidity risk management program (the “Program”) that includes policies and procedures reasonably designed to comply with the requirements of Rule 22e-4, including: (i) assessment, management and periodic review of liquidity risk; (ii)
classification of portfolio holdings; (iii) establishment of a highly liquid investment minimum (“HLIM”), as applicable; (iv) limitation on illiquid investments; and (v) redemptions in-kind. The Trust’s Board of Trustees (the “Board”) has approved
the designation of Nuance Investments, LLC (“Nuance Investments”) as the administrator of the Program (the “Program Administrator”). Personnel of Nuance Investments conduct the day-to-day operation of the Program pursuant to policies and procedures
administered by the Program Administrator.
In accordance with Rule 22e-4, the Board reviewed a report prepared by the Program Administrator (the “Report”) regarding the operation of the Program and its adequacy and effectiveness of
implementation for the period January 1, 2022, through December 31, 2022 (the “Reporting Period”). No significant liquidity events impacting the Fund during the Reporting Period or material changes to the Program were noted in the Report.
Under the Program, Nuance Investments manages and periodically reviews the Fund’s liquidity risk, including consideration of applicable factors specified in Rule 22e-4 and the Program. Liquidity risk is
defined as the risk that the Fund could not meet shareholder redemption requests without significant dilution of remaining shareholders’ interests in the Fund. In general, this risk was managed during the Reporting Period by monitoring the degree of
liquidity of the Fund’s investments, limiting the amount of the Fund’s illiquid investments, and utilizing various risk management tools and facilities available to the Fund for meeting shareholder redemptions, among other means. In the Report,
Nuance Investments provided its assessment that, based on the information considered in its review, the Program remains reasonably designed to manage the Fund’s liquidity risk and the Fund’s investment strategy remains appropriate for an open-end
fund.
Pursuant to the Program, the Program Administrator oversaw the classification of each of the Fund’s portfolio investments as highly liquid, moderately liquid, less liquid or illiquid during the
Reporting Period, including in connection with recording investment classifications on Form N-PORT. Nuance Investments’ process of determining the degree of liquidity of the Fund’s investments is supported by one or more third-party liquidity
assessment vendors.
The Fund qualified as a “primarily highly liquid” fund as defined in the Program during the Reporting Period. Accordingly, the Fund was not required to establish a HLIM or comply with the related
Program provisions during the Reporting Period.
During the Reporting Period, the Fund’s investments were monitored for compliance with the 15% limitation on illiquid investments pursuant to the Program and in accordance with Rule 22e-4. The Fund did
not have redemptions in-kind during the Reporting Period.
The Report concluded: (i) the Program was implemented and operated effectively to achieve the goal of assessing and managing the Fund’s liquidity risk during the Reporting Period; and (ii) the Fund was
able to meet requests for redemption without significant dilution of remaining investors’ interests in the Fund during the Reporting Period.
21
NUANCE CONCENTRATED VALUE FUND
Additional Information (Unaudited)
October 31, 2023
AVAILABILITY OF FUND PORTFOLIO INFORMATION
The Fund files complete schedules of portfolio holdings with the U.S. Securities and Exchange Commission (the “SEC”) for the first and third quarters of each fiscal year on Part F of Form N-PORT. The
Fund’s Part F of Form N-PORT is available on the SEC’s website at www.sec.gov and may be reviewed and copied at the SEC’s Public Reference Room in Washington, D.C. Information on the operation of the Public Reference Room may be obtained by calling
1-800-732-0330. The Fund’s Part F of Form N-PORT may also be obtained by calling 1-855-682-6233.
AVAILABILITY OF PROXY VOTING INFORMATION
A description of the Fund’s Proxy Voting Policies and Procedures is available without charge, upon request, by calling 1-855-682-6233. Information regarding how the Fund voted proxies relating to
portfolio securities during the most recent 12 month period ended June 30, is available (1) without charge, upon request, by calling 1-888-621-9258, or (2) on the SEC’s website at www.sec.gov.
22
(This Page Intentionally Left Blank.)
NUANCE CONCENTRATED VALUE FUND
Privacy Notice (Unaudited)
The Fund collects only relevant information about you that the law allows or requires it to have in order to conduct its business and properly service you. The Fund collects financial and personal
information about you (“Personal Information”) directly (e.g., information on account applications and other forms, such as your name, address, and social security number, and information provided to access account information or conduct account
transactions online, such as password, account number, e-mail address, and alternate telephone number), and indirectly (e.g., information about your transactions with us, such as transaction amounts, account balance and account holdings).
The Fund does not disclose any non-public personal information about its shareholders or former shareholders other than for everyday business purposes such as to process a
transaction, service an account, respond to court orders and legal investigations or as otherwise permitted by law. Third parties that may receive this information include companies that provide transfer agency, technology and administrative
services to the Fund, as well as the Fund’s investment adviser who is an affiliate of the Fund. If you maintain a retirement/educational custodial account directly with the Fund, we may also disclose your Personal Information to the custodian for
that account for shareholder servicing purposes. The Fund limits access to your Personal Information provided to unaffiliated third parties to information necessary to carry out their cable law. The Fund maintains physical, electronic and
procedural safeguards to protect your Personal Information and requires its third party service providers with access to such information to treat your Personal Information with the same high degree of confidentiality.
In the event that you hold shares of the Fund through a financial intermediary, including, but not limited to, a broker-dealer, credit union, bank or trust company, the privacy policy
of your financial intermediary governs how your non-public personal information is shared with unaffiliated third parties.
INVESTMENT ADVISER
Nuance Investments, LLC
4900 Main Street, Suite 220
Kansas City, MO 64112
DISTRIBUTOR
Quasar Distributors, LLC
111 East Kilbourn Avenue, Suite 2200
Milwaukee, WI 53202
CUSTODIAN
U.S. Bank, N.A.
1555 North Rivercenter Drive
Milwaukee, WI 53212
ADMINISTRATOR, FUND ACCOUNTANT
AND TRANSFER AGENT
U.S. Bancorp Fund Services, LLC
615 East Michigan Street
Milwaukee, WI 53202
INDEPENDENT REGISTERED PUBLIC ACCOUNTING FIRM
Cohen & Company, Ltd.
342 North Water Street, Suite 830
Milwaukee, WI 53202
LEGAL COUNSEL
Stradley Ronon Stevens & Young, LLP
2005 Market Street, Suite 2600
Philadelphia, PA 19103
This report must be accompanied or preceded by a prospectus.
The Fund’s Statement of Additional Information contains additional information about the
Fund’s trustees and is available without charge upon request by calling 1-855-682-6233.
NU-SEMI-ANNUAL-CV
Nuance Mid Cap Value Fund
Investor Class Shares – NMAVX
Z Class Shares – NMVZX
Institutional Class Shares – NMVLX
Semi-Annual Report
|
www.nuanceinvestments.com
|
October 31, 2023
|
NUANCE MID CAP VALUE FUND
October 31, 2023
Dear Fellow Shareholders:
We are pleased to write our semi-annual shareholder letter for the Nuance Mid Cap Value Fund (the “Fund”). The Fund is a classic value investment product investing primarily in the equity or
equity-linked securities of United States based companies. The Fund seeks long-term capital appreciation primarily through investments in equity securities of companies organized in the United States that the investment team believes are high
quality, though temporarily out of favor. The strategy typically invests in a portfolio of 50 to 90 companies with at least 80 percent of the portfolio invested in companies with mid-sized market capitalizations. The Adviser defines mid-
capitalization companies as companies within the range of the capitalization of companies constituting the Russell Midcap® Index. The Adviser intends to manage the Fund
so that the average weighted market capitalization of its portfolio (excluding short-term investments) falls between the range of the smallest and largest members of the Russell Midcap® Index (defined using a trailing 12 month average of the smallest and largest members on a month to month basis). Although the strategy will invest primarily in the equity securities of U.S. companies, the strategy may invest up to
15% of its assets in equity securities of foreign companies that are classified as “developed” by MSCI. The primary benchmark for the Fund is the Russell Midcap® Value
Index. Clients may also be interested in comparing the Fund to the S&P 500® Index.
Average Annual Rates of Return as of October 31, 2023:
|
6 Months
|
1 Year
|
3 Year
|
5 Year
|
Since Inception(1)
|
|
|
Institutional Class
|
-13.08%
|
-4.16%
|
3.28%
|
5.63%
|
7.02%
|
|
Russell Midcap® Value Index(2)
|
-5.69%
|
-3.56%
|
8.78%
|
5.69%
|
6.60%
|
|
S&P 500® Index(3)
|
1.39%
|
10.14%
|
10.36%
|
11.01%
|
10.75%
|
|
6 Months
|
1 Year
|
3 Year
|
5 Year
|
Since Inception(1)
|
|
|
Investor Class, no load
|
-13.14%
|
-4.40%
|
3.00%
|
5.35%
|
6.74%
|
|
Investor Class with load
|
-17.48%
|
-9.21%
|
1.26%
|
4.28%
|
6.18%
|
|
Russell Midcap® Value Index(2)
|
-5.69%
|
-3.56%
|
8.78%
|
5.69%
|
6.60%
|
|
S&P 500® Index(3)
|
1.39%
|
10.14%
|
10.36%
|
11.01%
|
10.75%
|
|
6 Months
|
1 Year
|
3 Year
|
5 Year
|
Since Inception(4)
|
|
|
Z Share Class
|
-12.91%
|
-4.00%
|
3.43%
|
5.79%
|
5.52%
|
|
Russell Mid Cap® Value Index(2)
|
-5.69%
|
-3.56%
|
8.78%
|
5.69%
|
5.08%
|
|
S&P 500® Index(3)
|
1.39%
|
10.14%
|
10.36%
|
11.01%
|
10.95%
|
Performance data quoted represents past performance. Past performance does not guarantee future results. The investment return and principal value of an investment will fluctuate so
that an investor’s shares, when redeemed, may be worth more or less than their original cost. Current performance of the fund may be lower or higher than the performance quoted. Short term performance, in particular, is not a good indication of the
fund’s future performance, and an investment should not be made solely based on returns. Investor Class performance data shown reflects both performance with the maximum sales charge of 5.75% (for periods prior to September 17, 2015) or 5.00% (for
period September 17, 2015 and after) and without it. Performance data current to the most recent month end may be obtained by calling 1-855-682-6233.
The Adviser has contractually agreed to waive its management fees and pay Fund expenses, in order to ensure that Total Annual Fund Operating Expenses (excluding any front-end or contingent deferred
loads, acquired fund fees and expenses, leverage/borrowing, interest, interest expense, dividends paid on short sales, taxes, brokerage
1
NUANCE MID CAP VALUE FUND
commissions and extraordinary expenses) do not exceed 1.18% of the average daily net assets of the Investor Class, 0.93% of the average daily net assets of the Institutional Class and 0.78% of the
average daily net assets of the Z Class through at least August 28, 2024.
|
Institutional Class Gross Expense Ratio – 0.98%
|
Net Expense Ratio – 0.94%
|
|
Investor Class Gross Expense Ratio – 1.23%
|
Net Expense Ratio – 1.19%
|
|
Z Class Gross Expense Ratio – 0.83%
|
Net Expense Ratio – 0.79%
|
|
(1)
|
December 31, 2013
|
|
(2)
|
The Russell Midcap® Value Index measures the performance of those Russell Midcap companies with lower
price-to-book ratios and lower forecasted growth values. This Index cannot be invested in directly.
|
|
(3)
|
The Standard & Poor’s 500® Index (S&P 500) is an unmanaged, capitalization-weighted index generally
representative of the U.S. Market for large capitalization stocks. This Index cannot be invested in directly.
|
|
(4)
|
May 8, 2017
|
In terms of performance, since its inception on December 31, 2013 through October 31, 2023, the Institutional Class is up 7.02 percent (annualized) versus its primary index –the Russell Midcap® Value Index – up 6.60 percent and the S&P 500® Index up 10.75 percent. For more
perspective on our long-term performance, please refer to your prospectus. Nuance Investments, LLC offers a similar strategy. While our Nuance Mid Cap Value Fund underperformed the benchmark over the 6-month time horizon, Nuance cautions clients
regarding the use of short-term performance as a tool to make investment decisions. As we remind our clients, your team continues to try and find leading business franchises with sustainable competitive positions that are trading below our internally
derived view of fair or intrinsic value. We believe that our time-tested process of finding what we consider best of breed businesses with better than the market downside support and better than the market upside potential over the long term should
lead to solid risk adjusted returns versus our peers and benchmarks.
At Nuance, our team and our processes are designed to emphasize consistency and what we believe is thorough fundamental analysis of companies that have the potential to lead to investment returns that
will be acceptable for our shareholders over the long term. To do this, we focus our attention on studying one company at a time using the Nuance approach. Part of that approach is to ensure that each company we own has a sound and solid competitive
position and that the companies are undervalued based on our internally derived view of sustainable cash flows, earnings and valuation. We believe in a thorough fundamental valuation analysis and that focusing simply on the value of a business is not
enough. Rather, we spend considerable time studying the downside potential of each company we own. As such, we believe that we understand the potential upside and the potential downside risks to our investments. This approach is critical to our goal
of trying to provide shareholders with not only above-average returns over time, but above-average risk-adjusted returns as well.
While our largest overweight positions, relative to the benchmark, remain the Consumer Staples and Health Care sectors, we added to our positioning within the Utilities sector during the period as the
risk rewards have become more attractive, in our view. Our overweight in the Utilities sector is primarily made up of exposure to the Water Utilities industry as we believe these companies are under-earning. The prolonged period of low interest rates
over the last decade has resulted in historically low allowed returns on equity and regulatory lag, which has been exacerbated by the recent inflationary environment. We believe these lower returns on equity will reset higher as utility regulators
incorporate a more normal cost of capital environment. Within the Consumer Staples sector, we are continuing to see input cost inflation-related under-earning in a number of leaders across the Household & Personal Products industry group. Our
view is that earnings in this industry group have been negatively impacted by rising raw material costs. We believe these costs can ultimately be mostly offset by price increases which generally lag the raw material price increases. We are also
finding what we believe to be select opportunities within the Packaged Foods & Meats sub-industry. Our overweight position in the Health Care sector is primarily
2
NUANCE MID CAP VALUE FUND
in the Health Care Supplies and Life Sciences Tools & Services sub-industries. The Financials sector remains a modestly overweight position. Our overweight position within the sector continues to be
made up primarily of stocks in the Insurance and Capital Markets industries. While we remain underweight the Industrials sector, it still makes up a meaningful portion of the portfolio as we have been able to find select risk rewards across different
parts of the sector, in our view. The Real Estate sector is also an underweight position where we maintain a meaningful portion of the portfolio, primarily in the Health Care REIT sub-industry. We reduced our exposure in the Information Technology
and Materials sectors and moved into what we view as more attractive risk rewards in other parts of the economy. We remain underweight the Energy sector where we believe the sector is facing a multi-year period of competitive transition. Lastly, we
remain underweight the Consumer Discretionary and Communication Services sectors primarily due to competitive uncertainty and valuation concerns.
Thank you for your interest and your continued support.
Scott Moore, CFA
Please visit our website at www.nuanceinvestments.com for more information about our team, our process, and value investing. You can also get real-time access to the Nuance Investment website updates
and information via traditional mail or e-mail. Simply contact us at client.services@nuanceinvestments.com or call 816-743-7080 to sign-up.
This report must be preceded or accompanied by a current prospectus.
Mutual fund investing involves risk. Principal loss is possible. Investments in small and mid-capitalization companies involve additional risk such as limited liquidity and greater
volatility than larger capitalization companies. Investments in foreign securities involve political, economic and currency risks, greater volatility and differences in accounting methods. The Fund's value investments are subject to the risk that
their intrinsic values may not be recognized by the broad market or that their prices may decline.
Past performance does not guarantee future results.
Weighted Market Capitalization: The average market capitalization of all companies in a fund – with each company weighted according to its percent held in the fund.
A Cash Flow is a revenue or expense stream that changes an account over a given period.
Opinions expressed are subject to change, are not guaranteed and should not be considered investment advice or recommendations to buy or sell any security.
Nuance Investments is the adviser to the Nuance Mid Cap Value Fund which is distributed by Quasar Distributors, LLC.
3
NUANCE MID CAP VALUE FUND
Value of $10,000 Investment (Unaudited)
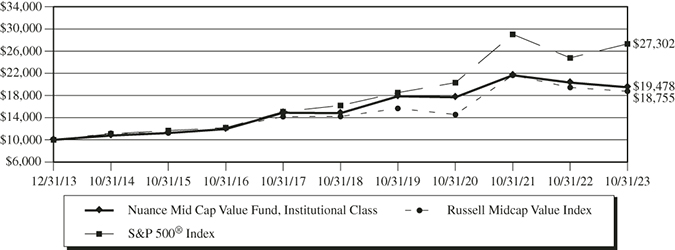
The chart assumes an initial investment of $10,000. Performance reflects waivers of fee and operating expenses in effect. In the absence of such waivers, total return would be
reduced. Performance data quoted represents past performance and does not guarantee future results. Investment returns and principal value will fluctuate, and when sold, may be worth more or less than their original cost. Performance current to the
most recent month-end may be lower or higher than the performance quoted and can be obtained by calling 1-855-682-6233. Performance assumes the reinvestment of capital gains and income distributions. The performance does not reflect the deduction of
taxes that a shareholder would pay on Fund distributions or the redemption of Fund shares.
Average Annual Rates of Return (%) As of October 31, 2023
|
Since
|
||||
|
1 Year
|
3 Year
|
5 Year
|
Inception(1)
|
|
|
Investor Class (without sales load)
|
-4.40%
|
3.00%
|
5.35%
|
6.74%
|
|
Investor Class (with sales load)(2)
|
-9.21%
|
1.26%
|
4.28%
|
6.18%
|
|
Z Class
|
-4.00%
|
3.43%
|
5.79%
|
7.12%
|
|
Institutional Class
|
-4.16%
|
3.28%
|
5.63%
|
7.02%
|
|
Russell Midcap Value Index(3)
|
-3.56%
|
8.78%
|
5.69%
|
6.60%
|
|
S&P 500 Index(4)
|
10.14%
|
10.36%
|
11.01%
|
10.75%
|
|
(1)
|
Period from Fund inception through October 31, 2023. The Investor Class and Institutional Class commenced operations on December 31, 2013 and Z Class shares commenced operations on May 8, 2017.
Performance Shown for the Z Class prior to the inception of the Z Class is based on the performance of the Institutional Class shares, adjusted for the lower expenses applicable to Z Class shares.
|
|
(2)
|
Returns reflects a sales load of 5.00%.
|
|
(3)
|
The Russell Midcap® Value Index measures the performance of those Russell Midcap companies with lower
price-to-book ratios and lower forecasted growth values. This Index cannot be invested in directly.
|
|
(4)
|
The Standard & Poor’s 500 Index (S&P 500) is an unmanaged, capitalization-weighted index generally representative of the U.S. market for large capitalization stocks. This Index cannot be
invested in directly.
|
4
NUANCE MID CAP VALUE FUND
The following is expense information for the Nuance Mid Cap Value Fund as disclosed in the Fund’s most recent prospectus dated August 28, 2023:
|
Investor Class Gross Expense Ratio – 1.23%
|
Net Expense Ratio – 1.19%
|
|
Z Class Gross Expense Ratio – 0.83%
|
Net Expense Ratio – 0.79%
|
|
Institutional Class Gross Expense Ratio – 0.98%
|
Net Expense Ratio – 0.94%
|
Nuance Investments, LLC (the “Adviser”) has contractually agreed to waive its management fees and pay Fund expenses, in order to ensure that Total Annual Fund Operating Expenses (excluding any front-end or contingent deferred loads, acquired fund fees and expenses, leverage/borrowing interest, interest expense, dividends paid on short sales, taxes, brokerage commissions and extraordinary expenses) do not exceed 1.18% of the average daily net assets of the Investor Class, 0.93% of the average daily net assets of the Institutional Class and 0.78% of the average daily net assets of the Z Class. Fees waived and expenses paid by the Adviser may be recouped by the Adviser for a period of 36 months following the month during which such fee waiver and/or expense payment was made if such recoupment can be achieved without exceeding the expense limit in effect at the time the fee waiver and/or expense payment occurred and the expense limit in place at the time of recoupment. The Operating Expenses Limitation Agreement is indefinite but cannot be terminated through at least August 28, 2024. Thereafter, the agreement may be terminated at any time upon 60 days’ written notice by the Trust’s Board of Trustees (the “Board”) or the Adviser, with consent of the Board.
5
NUANCE MID CAP VALUE FUND
Expense Example (Unaudited)
October 31, 2023
As a shareholder of the Fund, you incur two types of costs: (1) transaction costs, which may include but are not limited to, sales charges (loads) on purchases; and (2) ongoing costs, including
management fees, distribution and service (12b-1) fees, shareholder servicing fees, and other Fund expenses. This Example is intended to help you understand your ongoing costs (in dollars) of investing in the Fund and to compare these costs with the
ongoing costs of investing in other mutual funds. The Example is based on an investment of $1,000 invested at the beginning of the period and held for the entire period (May 1, 2023 – October 31, 2023).
ACTUAL EXPENSES
For each class, the first line of the table below provides information about actual account values and actual expenses. You may use the information in this line, together with the amount you invested,
to estimate the expenses that you paid over the period. Simply divide your account value by $1,000 (for example, an $8,600 account value divided by $1,000 = 8.6), then multiply the result by the number in the first line under the heading entitled
“Expenses Paid During Period” to estimate the expenses you paid on your account during this period.
HYPOTHETICAL EXAMPLE FOR COMPARISON PURPOSES
For each class, the second line of the table below provides information about hypothetical account values and hypothetical expenses based on the Fund’s actual expense ratio and an assumed rate of return
of 5% per year before expenses, which is not the Fund’s actual return. The hypothetical account values and expenses may not be used to estimate the actual ending account balance or expenses you paid for the period. You may use this information to
compare the ongoing costs of investing in the Fund and other funds. To do so, compare this 5% hypothetical example with the 5% hypothetical examples that appear in the shareholder reports of the other funds.
Please note that the expenses shown in the table are meant to highlight your ongoing costs only and do not reflect any transactional costs. Therefore, the second line of the table is
useful in comparing ongoing costs only, and will not help you determine the relative total costs of owning different funds. In addition, if transactional costs were included, your costs may have been higher.
|
Expenses Paid
|
||||||||||||
|
Beginning Account
|
Ending Account
|
During Period(1)
|
||||||||||
|
Value (5/1/23)
|
Value (10/31/23)
|
(5/1/23 to 10/31/23)
|
||||||||||
|
Investor Class
|
||||||||||||
|
Actual(2)
|
$
|
1,000.00
|
$
|
868.60
|
$
|
5.54
|
||||||
|
Hypothetical (5% return before expenses)
|
$
|
1,000.00
|
$
|
1,019.20
|
$
|
5.99
|
||||||
|
Z Class
|
||||||||||||
|
Actual(2)
|
$
|
1,000.00
|
$
|
870.90
|
$
|
3.67
|
||||||
|
Hypothetical (5% return before expenses)
|
$
|
1,000.00
|
$
|
1,021.22
|
$
|
3.96
|
||||||
|
Institutional Class
|
||||||||||||
|
Actual(2)
|
$
|
1,000.00
|
$
|
869.20
|
$
|
4.18
|
||||||
|
Hypothetical (5% return before expenses)
|
$
|
1,000.00
|
$
|
1,020.66
|
$
|
4.52
|
||||||
|
(1)
|
Expenses are equal to the Fund’s annualized expense ratio for the most recent six-month period of 1.18%, 0.78% and 0.89% for the Investor Class, Z Class and Institutional Class, respectively,
multiplied by the average account value over the period, multiplied by 184/366 to reflect the one-half year period.
|
|
(2)
|
Based on the actual returns for the six-month period ended October 31, 2023 of -13.14%, -12.91% and -13.08% for the Investor Class, Z Class and Institutional Class, respectively.
|
6
NUANCE MID CAP VALUE FUND
Allocation of Portfolio(1) (% of Net Assets) (Unaudited)
October 31, 2023
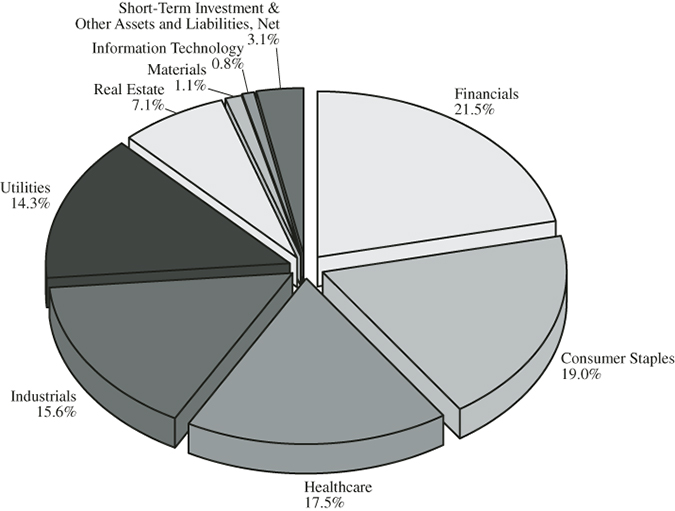
Top Ten Equity Holdings(1) (Unaudited)
as of October 31, 2023
as of October 31, 2023
(% of Net Assets)
|
Dentsply Sirona, Inc.
|
7.3%
|
||
|
3M Co.
|
7.2%
|
||
|
Northern Trust Corp.
|
4.8%
|
||
|
Kimberly-Clark Corp.
|
4.8%
|
||
|
Travelers Companies, Inc.
|
4.7%
|
||
|
Clorox Co.
|
3.5%
|
||
|
United Utilities Group PLC
|
3.5%
|
||
|
Healthcare Realty Trust, Inc.
|
3.4%
|
||
|
Henkel AG & Co. KGaA – ADR
|
3.3%
|
||
|
Mueller Water Products, Inc. – Class A
|
3.2%
|
|
(1)
|
Fund holdings and sector allocations are subject to change at any time and are not recommendations to buy or sell any security.
|
ADR – American Depository Receipt
7
NUANCE MID CAP VALUE FUND
Schedule of Investments (Unaudited)
October 31, 2023
|
Shares
|
Value
|
|||||||
|
COMMON STOCKS – 89.8%
|
||||||||
|
Consumer Staples – 15.7%
|
||||||||
|
Beiersdorf AG – ADR
|
285,137
|
$
|
7,473,441
|
|||||
|
Calavo Growers, Inc.
|
887,251
|
22,482,940
|
||||||
|
Cal-Maine Foods, Inc.
|
903,297
|
40,928,387
|
||||||
|
Clorox Co.
|
755,376
|
88,907,755
|
||||||
|
Diageo PLC – ADR
|
41,465
|
6,364,877
|
||||||
|
Henkel AG & Co. KGaA – ADR
|
4,252,654
|
66,936,774
|
||||||
|
Kimberly-Clark Corp.
|
1,001,048
|
119,765,383
|
||||||
|
Mission Produce, Inc.(a)
|
1,880,686
|
17,697,255
|
||||||
|
Pernod Ricard SA – ADR
|
179,915
|
6,390,761
|
||||||
|
Sysco Corp.
|
97,181
|
6,461,565
|
||||||
|
Target Corp.
|
114,691
|
12,706,616
|
||||||
|
Total Consumer Staples
|
396,115,754
|
|||||||
|
Financials – 17.7%
|
||||||||
|
Charles Schwab Corp.
|
498,160
|
25,924,246
|
||||||
|
Chubb Ltd.
|
30,230
|
6,487,963
|
||||||
|
Globe Life, Inc.
|
54,350
|
6,324,166
|
||||||
|
Hartford Financial Services Group, Inc.
|
202,156
|
14,848,358
|
||||||
|
Independent Bank Corp.
|
838,382
|
40,913,042
|
||||||
|
Northern Trust Corp.
|
1,839,482
|
121,240,259
|
||||||
|
Raymond James Financial, Inc.
|
68,513
|
6,538,881
|
||||||
|
Reinsurance Group of America, Inc.
|
498,415
|
74,498,090
|
||||||
|
TowneBank
|
1,233,910
|
29,539,805
|
||||||
|
Travelers Companies, Inc.
|
711,001
|
119,050,007
|
||||||
|
Total Financials
|
445,364,817
|
|||||||
|
Health Care – 17.5%
|
||||||||
|
Dentsply Sirona, Inc.
|
6,034,950
|
183,522,829
|
||||||
|
Envista Holdings Corp.(a)
|
1,636,747
|
38,087,103
|
||||||
|
Globus Medical, Inc. – Class A(a)
|
1,594,851
|
72,900,639
|
||||||
|
ICU Medical, Inc.(a)
|
121,415
|
11,905,955
|
||||||
|
Smith & Nephew – ADR
|
847,712
|
18,853,115
|
||||||
|
Universal Health Services, Inc.
|
402,987
|
50,732,033
|
||||||
|
Waters Corp.(a)
|
264,501
|
63,091,424
|
||||||
|
Total Health Care
|
439,093,098
|
|||||||
|
Industrials – 15.6%
|
||||||||
|
3M Co.
|
1,995,381
|
181,479,902
|
||||||
|
Graco Inc.
|
270,526
|
20,113,608
|
||||||
|
Knorr-Bremse AG – ADR
|
3,306,084
|
45,789,263
|
||||||
|
Legrand SA – ADR
|
367,042
|
6,309,452
|
||||||
See Notes to the Financial Statements
8
NUANCE MID CAP VALUE FUND
Schedule of Investments (Unaudited) – Continued
October 31, 2023
|
Shares
|
Value
|
|||||||
|
Industrials – 15.6% – Continued
|
||||||||
|
Lindsay Corp.
|
162,127
|
$
|
20,252,905
|
|||||
|
Mueller Water Products, Inc.
|
6,508,591
|
80,511,271
|
||||||
|
Werner Enterprises, Inc.
|
1,030,209
|
37,417,191
|
||||||
|
Total Industrials
|
391,873,592
|
|||||||
|
Information Technology – 0.8%
|
||||||||
|
Amphenol Corp. – Class A
|
241,816
|
19,478,279
|
||||||
|
Total Information Technology
|
19,478,279
|
|||||||
|
Materials – 1.1%
|
||||||||
|
AptarGroup, Inc.
|
167,292
|
20,454,793
|
||||||
|
Ecolab Inc.
|
39,753
|
6,668,168
|
||||||
|
Total Materials
|
27,122,961
|
|||||||
|
Real Estate – 7.1%
|
||||||||
|
Alexandria Real Estate Equities, Inc.
|
136,335
|
12,696,878
|
||||||
|
Equity Commonwealth
|
2,551,557
|
48,326,490
|
||||||
|
Healthcare Realty Trust, Inc.
|
5,929,079
|
85,082,284
|
||||||
|
Healthpeak Properties, Inc.
|
2,093,548
|
32,554,671
|
||||||
|
Total Real Estate
|
178,660,323
|
|||||||
|
Utilities – 14.3%
|
||||||||
|
American Water Works Co., Inc.
|
331,747
|
39,030,035
|
||||||
|
Avista Corp.
|
1,087,989
|
34,478,371
|
||||||
|
California Water Service Group
|
1,158,223
|
56,382,296
|
||||||
|
Essential Utilities, Inc.
|
367,303
|
12,289,958
|
||||||
|
Pennon Group PLC – ADR
|
2,664,992
|
47,783,307
|
||||||
|
Portland General Electric Co.
|
782,825
|
31,328,656
|
||||||
|
Severn Trent PLC – ADR
|
203,308
|
6,672,569
|
||||||
|
SJW Group
|
674,221
|
42,125,328
|
||||||
|
United Utilities Group PLC – ADR
|
3,365,998
|
88,559,407
|
||||||
|
Total Utilities
|
358,649,927
|
|||||||
|
TOTAL COMMON STOCKS
|
||||||||
|
(Cost $2,497,284,424)
|
2,256,358,751
|
|||||||
See Notes to the Financial Statements
9
NUANCE MID CAP VALUE FUND
Schedule of Investments (Unaudited) – Continued
October 31, 2023
|
Shares
|
Value
|
|||||||
|
PREFERRED STOCKS – 7.1%
|
||||||||
|
Consumer Staples – 3.3%
|
||||||||
|
Henkel AG & Co. KGaA
|
4,594,299
|
$
|
82,548,067
|
|||||
|
Total Consumer Staples
|
82,548,067
|
|||||||
|
Financials – 3.8%
|
||||||||
|
Charles Schwab Corp.
|
||||||||
|
Series D, 5.950%, Perpetual
|
892,961
|
20,189,848
|
||||||
|
MetLife, Inc., Series E, 5.625% (Call 11/30/2023 @ $25.00)
|
||||||||
|
Series E, 5.625%, Perpetual
|
867,595
|
18,661,969
|
||||||
|
MetLife, Inc., Series F, 4.750% (Call 03/15/2025 @ $25.00)
|
||||||||
|
Series F, 4.750%, Perpetual
|
1,303,699
|
24,418,282
|
||||||
|
US Bancorp, Series B, 3.500% (Call 11/30/2023 @ $25.00)
|
||||||||
|
Series B, 3.500% (3 mo. Term SOFR + 0.86%), Perpetual(b)
|
1,776,927
|
34,294,691
|
||||||
|
Total Financials
|
97,564,790
|
|||||||
|
TOTAL PREFERRED STOCKS
|
||||||||
|
(Cost $185,877,093)
|
180,112,857
|
|||||||
|
SHORT-TERM INVESTMENTS – 1.9%
|
||||||||
|
Money Market Funds – 1.9%
|
||||||||
|
First American Government Obligations Fund – Class X, 5.28%(c)
|
47,001,986
|
47,001,986
|
||||||
|
Total Money Market Funds
|
47,001,986
|
|||||||
|
TOTAL SHORT-TERM INVESTMENTS
|
||||||||
|
(Cost $47,001,986)
|
47,001,986
|
|||||||
|
TOTAL INVESTMENTS – 98.8%
|
||||||||
|
(Cost $2,730,163,503)
|
2,483,473,594
|
|||||||
|
Other Assets in Excess of Liabilities – 1.2%
|
29,781,541
|
|||||||
|
TOTAL NET ASSETS – 100.0%
|
$
|
2,513,255,135
|
||||||
Percentages are stated as a percent of net assets.
The Global Industry Classification Standard (GICS®) was developed by and/or is the exclusive property of MSCI, Inc. and
Standard & Poor’s Financial Services LLC (“S&P”). GICS is a service mark of MSCI and S&P and has been licensed for use by U.S. Bank Global Fund Services.
ADR – American Depositary Receipt
PLC – Public Limited Company
SOFR – Secured Overnight Financing Rate
|
(a)
|
Non-income producing security.
|
|
(b)
|
Coupon rate is variable or floats based on components including but not limited to reference rate and spread. These securities may not indicate a reference rate and/or spread in their
description. The rate disclosed is as of October 31, 2023.
|
|
(c)
|
The rate shown represents the 7-day effective yield as of October 31, 2023.
|
See Notes to the Financial Statements
10
NUANCE MID CAP VALUE FUND
Statement of Assets and Liabilities (Unaudited)
October 31, 2023
|
ASSETS:
|
||||
|
Investments, at value
|
||||
|
Unaffiliated Investments (cost $2,730,163,503)
|
$
|
2,483,473,594
|
||
|
Receivable for investment securities sold
|
54,609,842
|
|||
|
Receivable for capital shares sold
|
4,372,082
|
|||
|
Dividends and interest receivable
|
4,328,761
|
|||
|
Prepaid expenses
|
41,999
|
|||
|
Total assets
|
2,546,826,278
|
|||
|
LIABILITIES:
|
||||
|
Payable for investment securities purchased
|
27,623,367
|
|||
|
Payable for capital shares redeemed
|
4,179,532
|
|||
|
Payable to investment adviser
|
1,622,718
|
|||
|
Payable for fund services fees
|
92,430
|
|||
|
Payable for trustee fees
|
4,135
|
|||
|
Accrued distribution & shareholder service fees
|
45,276
|
|||
|
Accrued expenses
|
3,685
|
|||
|
Total liabilities
|
33,571,143
|
|||
|
NET ASSETS
|
$
|
2,513,255,135
|
||
|
NET ASSETS CONSIST OF:
|
||||
|
Paid-in capital
|
$
|
2,883,484,448
|
||
|
Total distributable earnings
|
(370,229,313
|
)
|
||
|
Net Assets
|
$
|
2,513,255,135
|
||
|
|
Investor
|
Institutional
|
||||||||||
|
Class
|
Z Class
|
Class
|
||||||||||
|
Net assets
|
$
|
48,019,945
|
$
|
301,365,196
|
$
|
2,163,869,994
|
||||||
|
Shares issued and outstanding(1)
|
4,397,054
|
27,506,546
|
198,626,311
|
|||||||||
|
Net asset value, redemption price
|
||||||||||||
|
and minimum offering price per share
|
$
|
10.92
|
$
|
10.96
|
$
|
10.89
|
||||||
|
Maximum offering price per share ($10.92/0.95)(2)
|
$
|
11.49
|
N/A
|
N/A
|
||||||||
|
(1)
|
Unlimited shares authorized with no par value.
|
|
(2)
|
Reflects a maximum sales charge of 5.00%.
|
See Notes to the Financial Statements
11
NUANCE MID CAP VALUE FUND
Statement of Operations (Unaudited)
For the Six Months Ended October 31, 2023
|
INVESTMENT INCOME:
|
||||
|
Dividend income from unaffiliated common stock
|
$
|
37,576,380
|
||
|
Less: Foreign taxes withheld
|
(217,488
|
)
|
||
|
Interest income
|
4,771,848
|
|||
|
Total investment income
|
42,130,740
|
|||
|
EXPENSES:
|
||||
|
Investment adviser fees (See Note 4)
|
10,983,820
|
|||
|
Fund services fees (See Note 4)
|
881,643
|
|||
|
Postage & printing fees
|
83,196
|
|||
|
Federal & state registration fees
|
51,352
|
|||
|
Trustee fees
|
11,005
|
|||
|
Audit fees
|
9,939
|
|||
|
Insurance fees
|
9,752
|
|||
|
Other
|
9,658
|
|||
|
Legal fees
|
5,430
|
|||
|
Distribution & shareholder service fees (See Note 5):
|
||||
|
Investor Class
|
120,585
|
|||
|
Institutional Class
|
884,471
|
|||
|
Total expenses before waiver
|
13,050,851
|
|||
|
Less: waiver from investment adviser (See Note 4)
|
(85,440
|
)
|
||
|
Net expenses
|
12,965,411
|
|||
|
NET INVESTMENT INCOME
|
29,165,329
|
|||
|
REALIZED AND UNREALIZED LOSS ON INVESTMENTS:
|
||||
|
Net realized loss on unaffiliated investments
|
(20,735,523
|
)
|
||
|
Net change in unrealized appreciation/depreciation on unaffiliated investments
|
(402,604,590
|
)
|
||
|
Net realized and unrealized loss on investments
|
(423,340,113
|
)
|
||
|
NET DECREASE IN NET ASSETS RESULTING FROM OPERATIONS
|
$
|
(394,174,784
|
)
|
|
See Notes to the Financial Statements
12
NUANCE MID CAP VALUE FUND
Statements of Changes in Net Assets
|
Six Months Ended
|
||||||||
|
October 31, 2023
|
Year Ended
|
|||||||
|
(Unaudited)
|
April 30, 2023
|
|||||||
|
OPERATIONS:
|
||||||||
|
Net investment income
|
$
|
29,165,329
|
$
|
56,188,688
|
||||
|
Net realized loss on investments
|
(20,735,523
|
)
|
(79,683,589
|
)
|
||||
|
Net realized loss on affiliated investments
|
—
|
(54,096
|
)
|
|||||
|
Net change in unrealized appreciation/depreciation
|
||||||||
|
on unaffiliated investments
|
(402,604,590
|
)
|
134,896,065
|
|||||
|
Net change in unrealized appreciation/depreciation
|
||||||||
|
on affiliated investments
|
—
|
(30,320,279
|
)
|
|||||
|
Net increase (decrease) in net assets resulting from operations
|
(394,174,784
|
)
|
141,667,347
|
|||||
|
CAPITAL SHARE TRANSACTIONS:
|
||||||||
|
Investor Class:
|
||||||||
|
Proceeds from shares sold
|
6,164,209
|
17,562,817
|
||||||
|
Proceeds from reinvestment of distributions
|
744,075
|
6,453,413
|
||||||
|
Payments for shares redeemed
|
(18,592,966
|
)
|
(29,927,445
|
)
|
||||
|
Decrease in net assets resulting from Investor Class transactions
|
(11,684,682
|
)
|
(5,911,215
|
)
|
||||
|
Z Class:
|
||||||||
|
Proceeds from shares sold
|
27,412,377
|
94,835,627
|
||||||
|
Proceeds from reinvestment of distributions
|
2,722,445
|
19,937,179
|
||||||
|
Payments for shares redeemed
|
(40,027,458
|
)
|
(130,272,155
|
)
|
||||
|
Decrease in net assets resulting from Z Class transactions
|
(9,892,636
|
)
|
(15,499,349
|
)
|
||||
|
Institutional Class:
|
||||||||
|
Proceeds from shares sold
|
265,612,408
|
624,394,713
|
||||||
|
Proceeds from reinvestment of distributions
|
30,933,322
|
228,889,609
|
||||||
|
Payments for shares redeemed
|
(459,061,989
|
)
|
(1,045,792,861
|
)
|
||||
|
Decrease in net assets resulting
|
||||||||
|
from Institutional Class transactions
|
(162,516,259
|
)
|
(192,508,539
|
)
|
||||
|
Net decrease in net assets resulting
|
||||||||
|
from capital share transactions
|
(184,093,577
|
)
|
(213,919,103
|
)
|
||||
|
DISTRIBUTIONS TO SHAREHOLDERS:
|
||||||||
|
Investor Class
|
(748,286
|
)
|
(6,485,015
|
)
|
||||
|
Z Class
|
(4,910,102
|
)
|
(35,791,916
|
)
|
||||
|
Institutional Class
|
(35,936,108
|
)
|
(259,544,750
|
)
|
||||
|
Total distributions to shareholders
|
(41,594,496
|
)
|
(301,821,681
|
)
|
||||
|
TOTAL DECREASE IN NET ASSETS
|
(619,862,857
|
)
|
(374,073,437
|
)
|
||||
|
NET ASSETS:
|
||||||||
|
Beginning of period
|
3,133,117,992
|
3,507,191,429
|
||||||
|
End of period
|
$
|
2,513,255,135
|
$
|
3,133,117,992
|
||||
See Notes to the Financial Statements
13
NUANCE MID CAP VALUE FUND
Financial Highlights
For a Fund share outstanding throughout the period.
|
Six Months Ended
|
Year Ended
|
Year Ended
|
Year Ended
|
Year Ended
|
Year Ended
|
|||||||||||||||||||
|
October 31, 2023
|
April 30,
|
April 30,
|
April 30,
|
April 30,
|
April 30,
|
|||||||||||||||||||
|
(Unaudited)
|
2023
|
2022
|
2021
|
2020
|
2019
|
|||||||||||||||||||
|
Investor Class
|
||||||||||||||||||||||||
|
PER SHARE DATA:
|
||||||||||||||||||||||||
|
Net asset value, beginning of period
|
$
|
12.73
|
$
|
13.40
|
$
|
15.36
|
$
|
11.81
|
$
|
12.80
|
$
|
12.33
|
||||||||||||
|
INVESTMENT OPERATIONS:
|
||||||||||||||||||||||||
|
Net investment income
|
0.12
|
0.19
|
0.13
|
0.07
|
0.12
|
0.11
|
||||||||||||||||||
|
Net realized and unrealized
|
||||||||||||||||||||||||
|
gain (loss) on investments
|
(1.78
|
)
|
0.35
|
(0.42
|
)
|
3.55
|
(0.30
|
)
|
1.15
|
|||||||||||||||
|
Total from investment operations
|
(1.66
|
)
|
0.54
|
(0.29
|
)
|
3.62
|
(0.18
|
)
|
1.26
|
|||||||||||||||
|
LESS DISTRIBUTIONS:
|
||||||||||||||||||||||||
|
Distributions from net investment income
|
(0.15
|
)
|
(0.15
|
)
|
(0.08
|
)
|
(0.07
|
)
|
(0.14
|
)
|
(0.10
|
)
|
||||||||||||
|
Distributions from net realized gains
|
—
|
(1.06
|
)
|
(1.59
|
)
|
—
|
(0.67
|
)
|
(0.69
|
)
|
||||||||||||||
|
Total distributions
|
(0.15
|
)
|
(1.21
|
)
|
(1.67
|
)
|
(0.07
|
)
|
(0.81
|
)
|
(0.79
|
)
|
||||||||||||
|
Net asset value, end of period
|
$
|
10.92
|
$
|
12.73
|
$
|
13.40
|
$
|
15.36
|
$
|
11.81
|
$
|
12.80
|
||||||||||||
|
TOTAL RETURN(1)(2)
|
(13.14
|
)%
|
4.51
|
%
|
(2.07
|
)%
|
30.77
|
%
|
(2.12
|
)%
|
11.33
|
%
|
||||||||||||
|
SUPPLEMENTAL DATA AND RATIOS:
|
||||||||||||||||||||||||
|
Net assets, end of period (in millions)
|
$
|
48.0
|
$
|
68.3
|
$
|
78.1
|
$
|
117.1
|
$
|
94.3
|
$
|
36.3
|
||||||||||||
|
Ratio of expenses to average net assets(3):
|
||||||||||||||||||||||||
|
Before expense waiver/recoupment
|
1.22
|
%
|
1.22
|
%
|
1.22
|
%
|
1.23
|
%
|
1.24
|
%
|
1.27
|
%
|
||||||||||||
|
After expense waiver/recoupment
|
1.18
|
%
|
1.18
|
%
|
1.18
|
%
|
1.18
|
%
|
1.18
|
%
|
1.18
|
%
|
||||||||||||
|
Ratio of net investment income
|
||||||||||||||||||||||||
|
to average net assets(3):
|
||||||||||||||||||||||||
|
Before expense waiver/recoupment
|
1.66
|
%
|
1.39
|
%
|
0.74
|
%
|
0.48
|
%
|
0.96
|
%
|
0.86
|
%
|
||||||||||||
|
After expense waiver/recoupment
|
1.70
|
%
|
1.43
|
%
|
0.78
|
%
|
0.53
|
%
|
1.02
|
%
|
0.95
|
%
|
||||||||||||
|
Portfolio turnover rate(2)
|
33
|
%
|
62
|
%
|
61
|
%
|
76
|
%
|
124
|
%
|
99
|
%
|
||||||||||||
|
(1)
|
Total return does not reflect sales charges.
|
|
(2)
|
Not annualized for periods less than one year.
|
|
(3)
|
Annualized for periods less than one year.
|
See Notes to the Financial Statements
14
NUANCE MID CAP VALUE FUND
Financial Highlights
For a Fund share outstanding throughout the period.
|
Six Months Ended
|
Year Ended
|
Year Ended
|
Year Ended
|
Year Ended
|
Year Ended
|
|||||||||||||||||||
|
October 31, 2023
|
April 30,
|
April 30,
|
April 30,
|
April 30,
|
April 30,
|
|||||||||||||||||||
|
(Unaudited)
|
2023
|
2022
|
2021
|
2020
|
2019
|
|||||||||||||||||||
|
Z Class
|
||||||||||||||||||||||||
|
PER SHARE DATA:
|
||||||||||||||||||||||||
|
Net asset value, beginning of period
|
$
|
12.77
|
$
|
13.45
|
$
|
15.42
|
$
|
11.84
|
$
|
12.83
|
$
|
12.37
|
||||||||||||
|
INVESTMENT OPERATIONS:
|
||||||||||||||||||||||||
|
Net investment income
|
0.13
|
0.24
|
0.17
|
0.12
|
0.18
|
0.16
|
||||||||||||||||||
|
Net realized and unrealized
|
||||||||||||||||||||||||
|
gain (loss) on investments
|
(1.76
|
)
|
0.34
|
(0.40
|
)
|
3.57
|
(0.32
|
)
|
1.14
|
|||||||||||||||
|
Total from investment operations
|
(1.63
|
)
|
0.58
|
(0.23
|
)
|
3.69
|
(0.14
|
)
|
1.30
|
|||||||||||||||
|
LESS DISTRIBUTIONS:
|
||||||||||||||||||||||||
|
Distributions from net investment income
|
(0.18
|
)
|
(0.20
|
)
|
(0.15
|
)
|
(0.11
|
)
|
(0.18
|
)
|
(0.15
|
)
|
||||||||||||
|
Distributions from net realized gains
|
—
|
(1.06
|
)
|
(1.59
|
)
|
—
|
(0.67
|
)
|
(0.69
|
)
|
||||||||||||||
|
Total distributions
|
(0.18
|
)
|
(1.26
|
)
|
(1.74
|
)
|
(0.11
|
)
|
(0.85
|
)
|
(0.84
|
)
|
||||||||||||
|
Net asset value, end of period
|
$
|
10.96
|
$
|
12.77
|
$
|
13.45
|
$
|
15.42
|
$
|
11.84
|
$
|
12.83
|
||||||||||||
|
TOTAL RETURN(2)
|
(12.91
|
)%
|
4.87
|
%
|
(1.62
|
)%
|
31.34
|
%
|
(1.78
|
)%
|
11.73
|
%
|
||||||||||||
|
SUPPLEMENTAL DATA AND RATIOS:
|
||||||||||||||||||||||||
|
Net assets, end of period (in millions)
|
$
|
301.4
|
$
|
362.4
|
$
|
395.3
|
$
|
409.5
|
$
|
254.2
|
$
|
130.9
|
||||||||||||
|
Ratio of expenses to average net assets(3):
|
||||||||||||||||||||||||
|
Before expense waiver/recoupment
|
0.82
|
%
|
0.82
|
%
|
0.82
|
%
|
0.83
|
%
|
0.84
|
%
|
0.88
|
%
|
||||||||||||
|
After expense waiver/recoupment
|
0.78
|
%
|
0.78
|
%
|
0.78
|
%
|
0.78
|
%
|
0.78
|
%
|
0.78
|
%
|
||||||||||||
|
Ratio of net investment income
|
||||||||||||||||||||||||
|
to average net assets(3):
|
||||||||||||||||||||||||
|
Before expense waiver/recoupment
|
2.06
|
%
|
1.79
|
%
|
1.15
|
%
|
0.88
|
%
|
1.36
|
%
|
1.25
|
%
|
||||||||||||
|
After expense waiver/recoupment
|
2.10
|
%
|
1.83
|
%
|
1.19
|
%
|
0.93
|
%
|
1.42
|
%
|
1.35
|
%
|
||||||||||||
|
Portfolio turnover rate(2)
|
33
|
%
|
62
|
%
|
61
|
%
|
76
|
%
|
124
|
%
|
99
|
%
|
||||||||||||
|
(1)
|
Inception date of the Z Class was May 8, 2017.
|
|
(2)
|
Not annualized for periods less than one year.
|
|
(3)
|
Annualized for periods less than one year.
|
See Notes to the Financial Statements
15
NUANCE MID CAP VALUE FUND
Financial Highlights
For a Fund share outstanding throughout the period.
|
Six Months Ended
|
Year Ended
|
Year Ended
|
Year Ended
|
Year Ended
|
Year Ended
|
|||||||||||||||||||
|
October 31, 2023
|
April 30,
|
April 30,
|
April 30,
|
April 30,
|
April 30,
|
|||||||||||||||||||
|
(Unaudited)
|
2023
|
2022
|
2021
|
2020
|
2019
|
|||||||||||||||||||
|
Institutional Class
|
||||||||||||||||||||||||
|
PER SHARE DATA:
|
||||||||||||||||||||||||
|
Net asset value, beginning of period
|
$
|
12.71
|
$
|
13.39
|
$
|
15.36
|
$
|
11.81
|
$
|
12.80
|
$
|
12.35
|
||||||||||||
|
INVESTMENT OPERATIONS:
|
||||||||||||||||||||||||
|
Net investment income
|
0.12
|
0.22
|
0.16
|
0.10
|
0.17
|
0.14
|
||||||||||||||||||
|
Net realized and unrealized
|
||||||||||||||||||||||||
|
gain (loss) on investments
|
(1.77
|
)
|
0.35
|
(0.40
|
)
|
3.55
|
(0.31
|
)
|
1.14
|
|||||||||||||||
|
Total from investment operations
|
(1.65
|
)
|
0.57
|
(0.24
|
)
|
3.65
|
(0.14
|
)
|
1.28
|
|||||||||||||||
|
LESS DISTRIBUTIONS:
|
||||||||||||||||||||||||
|
Distributions from net investment income
|
(0.17
|
)
|
(0.19
|
)
|
(0.14
|
)
|
(0.10
|
)
|
(0.18
|
)
|
(0.14
|
)
|
||||||||||||
|
Distributions from net realized gains
|
—
|
(1.06
|
)
|
(1.59
|
)
|
—
|
(0.67
|
)
|
(0.69
|
)
|
||||||||||||||
|
Total distributions
|
(0.17
|
)
|
(1.25
|
)
|
(1.73
|
)
|
(0.10
|
)
|
(0.85
|
)
|
(0.83
|
)
|
||||||||||||
|
Net asset value, end of period
|
$
|
10.89
|
$
|
12.71
|
$
|
13.39
|
$
|
15.36
|
$
|
11.81
|
$
|
12.80
|
||||||||||||
|
TOTAL RETURN
|
(13.08
|
)%
|
4.82
|
%
|
(1.71
|
)%
|
31.09
|
%
|
(1.85
|
)%
|
11.57
|
%
|
||||||||||||
|
SUPPLEMENTAL DATA AND RATIOS:
|
||||||||||||||||||||||||
|
Net assets, end of period (in millions)
|
$
|
2,163.9
|
$
|
2,702.4
|
$
|
3,033.8
|
$
|
3,284.4
|
$
|
1,474.8
|
$
|
952.0
|
||||||||||||
|
Ratio of expenses to average net assets(2):
|
||||||||||||||||||||||||
|
Before expense waiver/recoupment
|
0.89
|
%
|
0.89
|
%
|
0.88
|
%
|
0.91
|
%
|
0.92
|
%
|
0.95
|
%
|
||||||||||||
|
After expense waiver/recoupment
|
0.89
|
%
|
0.89
|
%
|
0.88
|
%
|
0.92
|
%
|
0.93
|
%
|
0.93
|
%
|
||||||||||||
|
Ratio of net investment income
|
||||||||||||||||||||||||
|
to average net assets(2):
|
||||||||||||||||||||||||
|
Before expense waiver/recoupment
|
1.98
|
%
|
1.72
|
%
|
1.08
|
%
|
0.80
|
%
|
1.29
|
%
|
1.18
|
%
|
||||||||||||
|
After expense waiver/recoupment
|
1.98
|
%
|
1.72
|
%
|
1.08
|
%
|
0.79
|
%
|
1.28
|
%
|
1.20
|
%
|
||||||||||||
|
Portfolio turnover rate(1)
|
33
|
%
|
62
|
%
|
61
|
%
|
76
|
%
|
124
|
%
|
99
|
%
|
||||||||||||
|
(1)
|
Not annualized for periods less than one year.
|
|
(2)
|
Annualized for periods less than one year.
|
See Notes to the Financial Statements
16
NUANCE MID CAP VALUE FUND
Notes to the Financial Statements (Unaudited)
October 31, 2023
1. ORGANIZATION
Managed Portfolio Series (the “Trust”) was organized as a Delaware statutory trust on January 27, 2011. The Trust is registered under the Investment Company Act of 1940, as amended (the “1940 Act”), as
an open-end management investment company. The Nuance Mid Cap Value Fund (the “Fund”) is a diversified series with its own investment objectives and policies within the Trust. The investment objective of the Fund is long-term capital appreciation.
The Fund is an investment company and accordingly follows the investment company accounting and reporting guidance of the Financial Accounting Standards Board (“FASB”) Accounting Standards Codification Topic 946 Financial Services – Investment
Companies. The Fund commenced operations on May 31, 2011. The Fund currently offers three classes, the Investor Class, the Institutional Class and the Z Class. Investor Class shares may be subject to a front-end sales charge of up to 5.00%.
Investor Class shares are subject to a 0.25% of average daily net assets of distribution and servicing fee and Investor Class and Institutional Class shares are subject to a shareholder servicing fee of up to 0.15% of average daily net assets. Each
class of shares has identical rights and privileges with respect to voting on matters affecting a single share class. The Fund may issue an unlimited number of shares of beneficial interest, with no par value.
2. SIGNIFICANT ACCOUNTING POLICIES
The following is a summary of significant accounting policies consistently followed by the Fund in the preparation of its financial statements. These policies are in conformity with generally accepted
accounting principles in the United States of America (“GAAP”).
Security Valuation – All investments in securities are recorded at their estimated fair value, as described in Note 3.
Federal Income Taxes – The Fund complies with the requirements of Subchapter M of the Internal Revenue Code of 1986, as amended, necessary to qualify as a
regulated investment company and distributes substantially all net taxable investment income and net realized gains to shareholders in a manner which results in no tax cost to the Fund. Therefore, no federal income or excise tax provision is
required. As of and during the period ended October 31, 2023, the Fund did not have any tax positions that did not meet the “more-likely-than-not” threshold of being sustained by the applicable tax authority. The Fund recognizes interest and
penalties, if any, related to unrecognized tax benefits on uncertain tax positions as income tax expense in the Statement of Operations. During the period ended October 31, 2023, the Fund did not incur any interest or penalties.
Security Transactions, Income and Distributions – The Fund follows industry practice and records security transactions on the trade date. Realized gains and
losses on sales of securities are calculated on the basis of identified cost. Dividend income is recorded on the ex-dividend date and interest income is recorded on an accrual basis. Withholding taxes on foreign dividends have been provided for in
accordance with the Fund’s understanding of the applicable country’s tax rules and regulations. Discounts and premiums on securities purchased are amortized over the expected life of the respective securities using the constant yield method of
calculation.
The Fund will make distributions, if any, of net investment income quarterly. The Fund will also distribute net realized capital gains, if any, annually. Distributions to shareholders are recorded on
the ex-dividend date. The treatment for financial reporting purposes of distributions made to shareholders during the year from net investment income or net realized capital gains may differ from their treatment for federal income tax purposes.
These differences are caused primarily by differences in the timing of the recognition of certain components of income, expense or realized capital gain for federal income tax purposes. Where such differences are permanent in
17
NUANCE MID CAP VALUE FUND
Notes to the Financial Statements (Unaudited) – Continued
October 31, 2023
nature, GAAP requires that they be reclassified in the components of the net assets based on their ultimate characterization for federal income tax purposes. Any such reclassifications will have no
effect on net assets, results of operations or net asset values per share of the Fund.
Use of Estimates – The preparation of financial statements in conformity with GAAP requires management to make estimates and assumptions that affect the reported
amounts of assets and liabilities and disclosure of contingent assets and liabilities at the date of the financial statements and the reported amounts of revenues and expenses during the reporting period. Actual results could differ from those
estimates.
Allocation of Income, Expenses and Gains/Losses – Income, expenses (other than those deemed attributable to a specific share class), and gains and losses of the
Fund are allocated daily to each class of shares based upon the ratio of net assets represented by each class as a percentage of the net assets of the Fund. Expenses deemed directly attributable to a class of shares are recorded by the specific
class. Most Fund expenses are allocated by class based on relative net assets. 12b-1 fees are expensed at 0.25% of average daily net assets of Investor Class shares. Shareholder service fees are expensed at up to 0.15% of average daily net assets
for Investor and Institutional shares. Expenses associated with a specific fund in the Trust are charged to that fund. Common Trust expenses are typically allocated evenly between the funds of the Trust, or by other equitable means.
3. SECURITIES VALUATION
The Fund has adopted authoritative fair value accounting standards which establish an authoritative definition of fair value and set out a hierarchy for measuring fair value. These standards require
additional disclosures about the various inputs and valuation techniques used to develop the measurements of fair value, a discussion in changes in valuation techniques and related inputs during the period and expanded disclosure of valuation levels
for major security types. These inputs are summarized in the three broad levels listed below:
|
Level 1 –
|
Unadjusted quoted prices in active markets for identical assets or liabilities that the Fund has the ability to access.
|
|
Level 2 –
|
Observable inputs other than quoted prices included in Level 1 that are observable for the asset or liability, either directly or indirectly. These inputs may include quoted prices for the
identical instrument on an inactive market, prices for similar instruments, interest rates, prepayment speeds, credit risk, yield curves, default rates and similar data.
|
|
Level 3 –
|
Unobservable inputs for the asset or liability, to the extent relevant observable inputs are not available, representing the Fund’s own assumptions about the assumptions a market participant
would use in valuing the asset or liability, and would be based on the best information available.
|
Following is a description of the valuation techniques applied to the Fund’s major categories of assets and liabilities measured at fair value on a recurring basis. The Fund’s investments are carried
at fair value.
Equity Securities – Securities that are primarily traded on a national securities exchange are valued at the last sale price on the exchange on which they are
primarily traded on the day of valuation or, if there has been no sale on such day, at the mean between the bid and ask prices. Securities traded primarily in the Nasdaq Global Market System for which market quotations are readily available are
valued using the Nasdaq Official Closing Price (“NOCP”). If the NOCP is not available, such securities are valued at the last sale price on the day of valuation, or
18
NUANCE MID CAP VALUE FUND
Notes to the Financial Statements (Unaudited) – Continued
October 31, 2023
if there has been no sale on such day, at the mean between the bid and ask prices. To the extent these securities are actively traded and valuation adjustments are not applied, they are categorized in
Level 1 of the fair value hierarchy.
Short-Term Investments – Investments in other mutual funds, including money market funds are valued at their net asset value per share and are categorized in
Level 1 of the fair value hierarchy. To the extent these securities are actively traded and valuation adjustments are not applied, they are categorized in Level 1 of the fair value hierarchy.
The Board of Trustees (the “Board”) has adopted a pricing and valuation policy for use by the Fund and its Valuation Designee (as defined below) in calculating the Fund’s NAV. Pursuant to Rule 2a-5
under the 1940 Act, the Fund has designated Nuance Investments, LLC (the “Adviser”) as its “Valuation Designee” to perform all of the fair value determinations as well as to perform all of the responsibilities that may be performed by the Valuation
Designee in accordance with Rule 2a-5. The Valuation Designee is authorized to make all necessary determinations of the fair values of portfolio securities and other assets for which market quotations are not readily available or if it is deemed that
the prices obtained from brokers and dealers or independent pricing services are unreliable.
The inputs or methodology used for valuing securities are not an indication of the risk associated with investing in those securities. The following is a summary of the inputs used to value the Fund’s
securities as of October 31, 2023:
|
Level 1
|
Level 2
|
Level 3
|
Total
|
|||||||||||||
|
Common Stocks
|
$
|
2,256,358,751
|
$
|
—
|
$
|
—
|
$
|
2,256,358,751
|
||||||||
|
Preferred Stocks
|
180,112,857
|
—
|
—
|
180,112,857
|
||||||||||||
|
Short-Term Investment
|
47,001,986
|
—
|
—
|
47,001,986
|
||||||||||||
|
Total Investments in Securities
|
$
|
2,483,473,594
|
$
|
—
|
$
|
—
|
$
|
2,483,473,594
|
||||||||
Refer to the Schedule of Investments for further information on the classification of investments.
4. INVESTMENT ADVISORY FEE AND OTHER TRANSACTIONS WITH AFFILIATES
The Trust has an agreement with Nuance Investments, LLC (the “Adviser”) to furnish investment advisory services to the Fund. Pursuant to an Investment Advisory Agreement between the Trust and the
Adviser, the Adviser is entitled to receive, on a monthly basis, an annual advisory fee equal to 0.75% of the Fund’s average daily net assets.
The Fund’s Adviser has contractually agreed to waive a portion or all of its management fees and reimburse the Fund for its expenses to ensure that total annual operating expenses (excluding acquired
fund fees and expenses, leverage, interest, dividend and interest expense on short sales, taxes, brokerage commissions and extraordinary expenses) for the Fund do not exceed 1.18%, 0.78% and 0.93% of average daily net assets of the Fund’s Investor
Class, Z Class and Institutional Class, respectively. Fees waived and expenses reimbursed by the Adviser may be recouped by the Adviser for a period of thirty-six months following the month during which such waiver or reimbursement was made if such
recoupment can be achieved without exceeding the expense limit in effect at the time the waiver and reimbursement occurred. The Operating Expense Limitation Agreement is intended to be continual in nature and cannot be terminated within a year after
the effective date of the Fund’s prospectus. After that date, the agreement may be terminated at any time upon 60 days’ written notice by the Trust’s Board or the Adviser, with the consent of the Board. For the period ended October 31, 2023, the
Adviser recouped expenses of
19
NUANCE MID CAP VALUE FUND
Notes to the Financial Statements (Unaudited) – Continued
October 31, 2023
$72 relating to fees waived in the current year. Waived fees and reimbursed expenses subject to potential recovery by year of expiration are as follows:
|
Expiration
|
Amount
|
|||
|
November 2023 – April 2024
|
$
|
109,982
|
||
|
May 2024 – April 2025
|
$
|
201,565
|
||
|
May 2025 – April 2026
|
$
|
173,502
|
||
|
May 2026 – October 2026
|
$
|
85,440
|
||
U.S. Bancorp Fund Services, LLC, doing business as U.S. Bank Global Fund Services, (“Fund Services” or the “Administrator”), acts as the Fund’s Administrator, Transfer Agent, and Fund Accountant. U.S.
Bank N.A. (the “Custodian”) serves as the custodian to the Fund. The Custodian is an affiliate of the Administrator. The Administrator performs various administrative and accounting services for the Fund. The Administrator prepares various federal
and state regulatory filings, reports and returns for the Fund; prepares reports and materials to be supplied to the Trustees; monitors the activities of the Fund’s custodian; coordinates the payment of the Fund’s expenses and reviews the Fund’s
expense accruals. The officers of the Trust, including the Chief Compliance Officer are employees of the Administrator. As compensation for its services, the Administrator is entitled to a monthly fee at an annual rate based upon the average daily
net assets of the Fund, subject to annual minimums. Fees paid by the Fund for administration and accounting, transfer agency, custody and compliance services for the period ended October 31, 2023, are disclosed in the Statement of Operations as fund
services fees.
5. DISTRIBUTION & SHAREHOLDER SERVICING FEES
The Fund has adopted a Distribution Plan pursuant to Rule 12b-1 (the “Plan”) in the Investor Class only. The Plan permits the Fund to pay for distribution and related expenses at an annual rate of
0.25% of the Investor Class average daily net assets. The expenses covered by the Plan may include the cost of preparing and distributing prospectuses and other sales material, advertising and public relations expenses, payments to financial
intermediaries and compensation of personnel involved in selling shares of the Fund. Payments made pursuant to the Plan will represent compensation for distribution and service activities, not reimbursements for specific expenses incurred. For the
period ended October 31, 2023, the Investor Class incurred expenses of $75,366 pursuant to the Plan.
The Fund has entered into a shareholder servicing agreement (the “Agreement”) where the Adviser acts as the shareholder agent, under which the Fund may pay servicing fees at an annual rate of up to
0.15% of the average daily net assets of each class. Payments, if any, to the Adviser under the Agreement may reimburse the Adviser for payments it makes to selected brokers, dealers and administrators which have entered into service agreements with
the Adviser for services provided to shareholders of the Fund. Payments may also be made directly to the intermediaries providing shareholder services. The services provided by such intermediaries are primarily designed to assist shareholders of
the Fund and include the furnishing of office space and equipment, telephone facilities, personnel and assistance to the Fund in servicing such shareholders. Services provided by such intermediaries also include the provision of support services to
the Fund and includes establishing and maintaining shareholders’ accounts and record processing, purchase and redemption transactions, answering routine client inquiries regarding the Fund, and providing such other personal services to shareholders
as the Fund may reasonably request. For the period ended October 31, 2023, the Investor and Institutional Class incurred $45,219 and $884,471, respectively, of shareholder servicing fees under the Agreement.
20
NUANCE MID CAP VALUE FUND
Notes to the Financial Statements (Unaudited) – Continued
October 31, 2023
6. CAPITAL SHARE TRANSACTIONS
Transactions in shares of the Fund were as follows:
|
Period Ended
|
Year Ended
|
|||||||
|
October 31, 2023
|
April 30, 2023
|
|||||||
|
Investor Class:
|
||||||||
|
Shares sold
|
510,156
|
1,377,852
|
||||||
|
Shares issued to holders in reinvestment of distributions
|
61,941
|
530,824
|
||||||
|
Shares redeemed
|
(1,542,863
|
)
|
(2,367,396
|
)
|
||||
|
Net decrease in Investor Class shares
|
(970,766
|
)
|
(458,720
|
)
|
||||
|
Z Class:
|
||||||||
|
Shares sold
|
2,276,391
|
7,555,877
|
||||||
|
Shares issued to holders in reinvestment of distributions
|
227,476
|
1,634,595
|
||||||
|
Shares redeemed
|
(3,366,273
|
)
|
(10,214,278
|
)
|
||||
|
Net decrease in Z Class shares
|
(862,406
|
)
|
(1,023,806
|
)
|
||||
|
Institutional Class:
|
||||||||
|
Shares sold
|
22,219,568
|
49,410,158
|
||||||
|
Shares issued to holders in reinvestment of distributions
|
2,592,331
|
18,856,825
|
||||||
|
Shares redeemed
|
(38,877,030
|
)
|
(82,179,369
|
)
|
||||
|
Net decrease in Institutional Class shares
|
(14,065,131
|
)
|
(13,912,386
|
)
|
||||
|
Net decrease in shares outstanding
|
(15,898,303
|
)
|
(15,394,912
|
)
|
||||
7. INVESTMENT TRANSACTIONS
The aggregate purchases and sales, excluding short-term investments, by the Fund for the period ended October 31, 2023, were as follows:
|
Purchases
|
Sales
|
||
|
U.S. Government
|
$ —
|
$ —
|
|
|
Other
|
$884,223,181
|
$925,408,482
|
8. FEDERAL TAX INFORMATION
The aggregate gross unrealized appreciation and depreciation of securities held by the Fund and the total cost of securities for federal income tax purposes at April 30, 2023, the Fund’s most recent
fiscal year end, were as follows:
|
Aggregate Gross
|
Aggregate Gross
|
Net Unrealized
|
Federal Income
|
|
|
Appreciation
|
Depreciation
|
Appreciation
|
Tax Cost
|
|
|
$329,508,611
|
$(199,986,510)
|
$129,522,101
|
$2,995,631,130
|
21
NUANCE MID CAP VALUE FUND
Notes to the Financial Statements (Unaudited) – Continued
October 31, 2023
The difference between book-basis and tax-basis unrealized appreciation is attributable primarily to the deferral of wash sale losses. At April 30, 2023, components of distributed earnings on a
tax-basis were as follows:
|
Undistributed
|
Undistributed
|
Other
|
Net
|
Total
|
|
Ordinary
|
Long-Term
|
Accumulated
|
Unrealized
|
Distributable
|
|
Income
|
Capital Gains
|
Losses
|
Appreciation
|
Earnings
|
|
$15,365,651
|
$—
|
$(79,347,785)
|
$129,522,101
|
$65,539,967
|
As of April 30, 2023, the Fund’s most recent fiscal year end, the Fund had 57,315,108 in short term and 22,032,677 in long term capital loss carryovers. A regulated investment company may elect for any
taxable year to treat any portion of any qualified late year loss as arising on the first day of the next taxable year. Qualified late year losses are certain capital, and ordinary losses which occur during the portion of the Fund’s taxable year
subsequent to October 31. For the taxable year ended April 30, 2023, the Fund does not plan to defer any qualified later year losses.
The tax character of distributions paid during the period ended October 31, 2023, were as follows:
|
Ordinary
|
Long-Term
|
||
|
Income*
|
Capital Gains
|
Total
|
|
|
$41,594,496
|
$—
|
$41,594,496
|
The tax character of distributions paid during the year ended April 30, 2023, were as follows:
|
Ordinary
|
Long-Term
|
||
|
Income*
|
Capital Gains
|
Total
|
|
|
$48,410,022
|
$253,411,600
|
$301,821,682
|
|
*
|
For federal income tax purposes, distributions of short-term capital gains are treated as ordinary income distributions.
|
The Fund designated as long-term capital gain dividend, pursuant to Internal Revenue Code Section 852(b)(3), the amount necessary to reduce the earnings of the Fund related to net capital gain to zero
for the tax year ended April 30, 2023.
9. TRANSACTIONS WITH AFFILIATES
If the Fund’s holding represents ownership of 5% or more of the voting securities of a company, the company is deemed to be an affiliate as defined by the 1940 Act. The Fund conducted transactions
during the period ended October 31, 2023 with affiliated companies as so defined:
|
Beginning Value
|
Additions
|
Reductions
|
Ending Value
|
|
|
Calavo Growers, Inc.(1)
|
$28,821,144
|
$1,966,724
|
$(2,675,035)
|
$22,482,940
|
|
Change in
|
|||||
|
Ending Shares
|
Unrealized
|
||||
|
as of
|
Dividend
|
Return of
|
Realized
|
Appreciation/
|
|
|
October 31, 2023
|
Income
|
Capital
|
Gain (Loss)
|
Depreciation
|
|
|
Calavo Growers, Inc.(1)
|
887,251
|
$185,861
|
$ —
|
$(2,361,839)
|
$(3,268,054)
|
|
(1)
|
Security was unaffiliated as of April 30, 2023.
|
22
NUANCE MID CAP VALUE FUND
Notes to the Financial Statements (Unaudited) – Continued
October 31, 2023
10. OTHER REGULATORY MATTERS
In October 2022, the Securities and Exchange Commission (the “SEC”) adopted a final rule relating to Tailored Shareholder Reports for Mutual Funds and Exchange-Traded Funds; Fee Information in
Investment Company Advertisements. The rule and form amendments will, among other things, require the Fund to transmit concise and visually engaging shareholder reports that highlight key information. The amendments will require that funds tag
information in a structured data format and that certain more in-depth information be made available online and available for delivery free of charge to investors on request. The amendments became effective January 24, 2023. There is an 18-month
transition period after the effective date of the amendment.
23
NUANCE MID CAP VALUE FUND
Liquidity Risk Management Discussion
Pursuant to Rule 22e-4 under the Investment Company Act of 1940, Managed Portfolio Series (the “Trust”), on behalf of the Nuance Mid Cap Value Fund (the “Fund”), has adopted and implemented a written
liquidity risk management program (the “Program”) that includes policies and procedures reasonably designed to comply with the requirements of Rule 22e-4, including: (i) assessment, management and periodic review of liquidity risk;
(ii) classification of portfolio holdings; (iii) establishment of a highly liquid investment minimum (“HLIM”), as applicable; (iv) limitation on illiquid investments; and (v) redemptions in-kind. The Trust’s Board of Trustees (the “Board”) has
approved the designation of Nuance Investments, LLC (“Nuance Investments”) as the administrator of the Program (the “Program Administrator”). Personnel of Nuance Investments conduct the day-to-day operation of the Program pursuant to policies and
procedures administered by the Program Administrator.
In accordance with Rule 22e-4, the Board reviewed a report prepared by the Program Administrator (the “Report”) regarding the operation of the Program and its adequacy and effectiveness of
implementation for the period January 1, 2022, through December 31, 2022 (the “Reporting Period”). No significant liquidity events impacting the Fund during the Reporting Period or material changes to the Program were noted in the Report.
Under the Program, Nuance Investments manages and periodically reviews the Fund’s liquidity risk, including consideration of applicable factors specified in Rule 22e-4 and the Program. Liquidity risk is
defined as the risk that the Fund could not meet shareholder redemption requests without significant dilution of remaining shareholders’ interests in the Fund. In general, this risk was managed during the Reporting Period by monitoring the degree of
liquidity of the Fund’s investments, limiting the amount of the Fund’s illiquid investments, and utilizing various risk management tools and facilities available to the Fund for meeting shareholder redemptions, among other means. In the Report,
Nuance Investments provided its assessment that, based on the information considered in its review, the Program remains reasonably designed to manage the Fund’s liquidity risk and the Fund’s investment strategy remains appropriate for an open-end
fund.
Pursuant to the Program, the Program Administrator oversaw the classification of each of the Fund’s portfolio investments as highly liquid, moderately liquid, less liquid or illiquid during the
Reporting Period, including in connection with recording investment classifications on Form N-PORT. Nuance Investments’ process of determining the degree of liquidity of the Fund’s investments is supported by one or more third-party liquidity
assessment vendors.
The Fund qualified as a “primarily highly liquid” fund as defined in the Program during the Reporting Period. Accordingly, the Fund was not required to establish a HLIM or comply with the related
Program provisions during the Reporting Period.
During the Reporting Period, the Fund’s investments were monitored for compliance with the 15% limitation on illiquid investments pursuant to the Program and in accordance with Rule 22e-4. The Fund did
not have redemptions in-kind during the Reporting Period.
The Report concluded: (i) the Program was implemented and operated effectively to achieve the goal of assessing and managing the Fund’s liquidity risk during the Reporting Period; and (ii) the Fund was
able to meet requests for redemption without significant dilution of remaining investors’ interests in the Fund during the Reporting Period.
24
NUANCE MID CAP VALUE FUND
Additional Information (Unaudited)
October 31, 2023
AVAILABILITY OF FUND PORTFOLIO INFORMATION
The Fund files complete schedules of portfolio holdings with the U.S. Securities and Exchange Commission (the “SEC”) for the first and third quarters of each fiscal year on Part F of Form N-PORT. The
Fund’s Part F of Form N-PORT is available on the SEC’s website at www.sec.gov and may be reviewed and copied at the SEC’s Public Reference Room in Washington, D.C. Information on the operation of the Public Reference Room may be obtained by calling
1-800-732-0330. The Fund’s Part F of Form N-PORT may also be obtained by calling 1-855-682-6233.
AVAILABILITY OF PROXY VOTING INFORMATION
A description of the Fund’s Proxy Voting Policies and Procedures is available without charge, upon request, by calling 1-855-682-6233. Information regarding how the Fund voted proxies relating to
portfolio securities during the most recent 12 month period ended June 30, is available (1) without charge, upon request, by calling 1-888-621-9258, or (2) on the SEC’s website at www.sec.gov.
25
(This Page Intentionally Left Blank.)
NUANCE MID CAP VALUE FUND
Privacy Notice (Unaudited)
The Fund collects only relevant information about you that the law allows or requires it to have in order to conduct its business and properly service you. The Fund collects financial and personal
information about you (“Personal Information”) directly (e.g., information on account applications and other forms, such as your name, address, and social security number, and information provided to access account information or conduct account
transactions online, such as password, account number, e-mail address, and alternate telephone number), and indirectly (e.g., information about your transactions with us, such as transaction amounts, account balance and account holdings).
The Fund does not disclose any non-public personal information about its shareholders or former shareholders other than for everyday business purposes such as to process a
transaction, service an account, respond to court orders and legal investigations or as otherwise permitted by law. Third parties that may receive this information include companies that provide transfer agency, technology and administrative
services to the Fund, as well as the Fund’s investment adviser who is an affiliate of the Fund. If you maintain a retirement/educational custodial account directly with the Fund, we may also disclose your Personal Information to the custodian for
that account for shareholder servicing purposes. The Fund limits access to your Personal Information provided to unaffiliated third parties to information necessary to carry out their assigned responsibilities to the Fund. All shareholder records
will be disposed of in accordance with applicable law. The Fund maintains physical, electronic and procedural safeguards to protect your Personal Information and requires its third party service providers with access to such information to treat
your Personal Information with the same high degree of confidentiality.
In the event that you hold shares of the Fund through a financial intermediary, including, but not limited to, a broker-dealer, credit union, bank or trust company, the privacy policy
of your financial intermediary governs how your non-public personal information is shared with unaffiliated third parties.
INVESTMENT ADVISER
Nuance Investments, LLC
4900 Main Street, Suite 220
Kansas City, MO 64112
DISTRIBUTOR
Quasar Distributors, LLC
111 East Kilbourn Avenue, Suite 2200
Milwaukee, WI 53202
CUSTODIAN
U.S. Bank, N.A.
1555 North Rivercenter Drive
Milwaukee, WI 53212
ADMINISTRATOR, FUND ACCOUNTANT
AND TRANSFER AGENT
U.S. Bancorp Fund Services, LLC
615 East Michigan Street
Milwaukee, WI 53202
INDEPENDENT REGISTERED PUBLIC ACCOUNTING FIRM
Cohen & Company, Ltd.
342 North Water Street, Suite 830
Milwaukee, WI 53202
LEGAL COUNSEL
Stradley Ronon Stevens & Young, LLP
2005 Market Street, Suite 2600
Philadelphia, PA 19103
This report must be accompanied or preceded by a prospectus.
The Fund’s Statement of Additional Information contains additional information about the
Fund’s trustees and is available without charge upon request by calling 1-855-682-6233.
NU-SEMI-ANNUAL-MCV
Nuance Concentrated Value Long-Short Fund
Investor Class Shares – NCLIX
Institutional Class Shares – NCLSX
Semi-Annual Report
|
www.nuanceinvestments.com
|
October 31, 2023
|
NUANCE CONCENTRATED VALUE LONG-SHORT FUND
October 31, 2023
Dear Fellow Shareholders:
We are pleased to write our semi-annual shareholder letter for the Nuance Concentrated Value Long-Short Fund (the “Fund”). The Fund seeks long-term capital appreciation by taking long positions in
securities priced below, and short positions in securities priced above, our internal view of their estimated intrinsic value. The Fund will typically maintain 15-35 long positions and up to 50 short positions. The primary benchmark for the Fund is
the S&P 500® Index.
Average Annual Rates of Return as of October 31, 2023:
|
6 Months
|
1 Year
|
3 Year
|
5 Year
|
Since Inception(1)
|
|
|
Institutional Class
|
-11.06%
|
1.12%
|
-3.10%
|
0.47%
|
2.08%
|
|
S&P 500® Index(2)
|
1.39%
|
10.14%
|
10.36%
|
11.01%
|
11.63%
|
|
6 Months
|
1 Year
|
3 Year
|
5 Year
|
Since Inception(1)
|
|
|
Investor Class
|
-11.20%
|
0.80%
|
-3.36%
|
0.20%
|
1.79%
|
|
S&P 500® Index(2)
|
1.39%
|
10.14%
|
10.36%
|
11.01%
|
11.63%
|
Performance data quoted represents past performance. Past performance does not guarantee future results. The investment return and principal value of an investment will fluctuate so
that an investor’s shares, when redeemed, may be worth more or less than their original cost. Current performance of the fund may be lower or higher than the performance quoted. Short term performance, in particular, is not a good indication of the
fund’s future performance, and an investment should not be made solely based on returns. Performance data current to the most recent month end may be obtained by calling 1-855-682-6233.
The Adviser has contractually agreed to waive its management fees, and pay Fund expenses, in order to ensure that Total Annual Fund Operating Expenses (excluding acquired fund fees and expenses,
leverage/borrowing interest, interest expense, dividends paid on short sales, taxes, brokerage commissions, and extraordinary expenses) do not exceed 1.55% of the average daily net assets of the Investor Class and 1.30% of the average daily net
assets of the Institutional Class through at least August 28, 2024.
|
Institutional Class Expense Ratio – 3.25%
|
|
Investor Class Expense Ratio – 3.51 %
|
|
(1)
|
December 31, 2015
|
|
(2)
|
The Standard & Poor’s 500® Index (S&P 500) is an unmanaged, capitalization-weighted index generally
representative of the U.S. Market for large capitalization stocks. This Index cannot be invested in directly.
|
In terms of performance, since its inception on December 31, 2015 through October 31, 2023, the Institutional Class is up 2.08 percent (annualized) versus its primary index –the S&P 500® Index – up 11.63 percent (annualized). Nuance Concentrated Value Long Short Fund underperformed the benchmark over the 1-year period and 6-month period. Nuance cautions
clients regarding the use of short-term performance as a tool to make investment decisions. As we remind our clients, your team continues to try and find leading business franchises with sustainable competitive positions that are trading below our
internally derived view of fair or intrinsic value. We believe that our time-tested process of finding what we consider best of breed businesses with better than the market downside support and better than the market upside potential over the
long-term should lead to solid risk adjusted returns versus our peers and benchmarks.
At Nuance, our team and our processes are designed to emphasize consistency and what we believe is thorough fundamental analysis of companies that have the potential to lead to investment returns that
will be acceptable for
1
NUANCE CONCENTRATED VALUE LONG-SHORT FUND
our shareholders over the long-term. To do this, we focus our attention on studying one company at a time using the Nuance approach.
Nuance employs a bottom-up stock selection process that emphasizes one stock at a time valuation and fundamental work. Sector/industry weightings are a fallout primarily of the emphasis of the team to
optimize the risk reward profile of the portfolio. We would note that often specific events will result in an entire industry or sector being out of favor and thus showing positively skewed risk rewards. During those periods, we are likely to be
overweight those areas. The reverse is also true and certain sectors or industries can become overvalued at the same time. During those periods we would be underweight. Those decisions are made as a direct result of the time-tested process of
studying valuations for leading business franchises one stock at a time as opposed to a top-down view of a space.
The Investment Team believed the opportunity set was healthy for both sides of the Fund’s investment portfolio at the end of October. As of October 31, 2023, the median company in the Nuance proprietary
long universe, which consists of companies we view as sub-industry leaders, was trading at just under a 20 percent premium to what we would consider fair value. Said another way, our long universe appeared to be overvalued by roughly 15 to 20 percent
on average, based on our internal estimates. From a downside perspective, according to our company-by-company valuation work, the same universe had more than 60 percent downside potential. This implies that if our list of leading companies were all
to trade down to their historic trough valuation multiples, the average stock in our long universe could decline by more than 60 percent.
On the long side of the portfolio, the Investment Team continued to find what we consider to be attractive value investments during a volatile period. As of October 31, 2023, the Investment Team
believed the long side of the portfolio was invested in a compelling set of long investment ideas with transitory under-earnings and depressed valuations. Sub-industries that we believed were under-earning and undervalued included Household Products,
Health Care Supplies, and Industrial Conglomerates. On the short side of the portfolio, the Investment Team believed that over-earning and overvaluation remained widespread, and that abundant short investment opportunities could be found across the
majority of the economy including the Automotive Retail, Oil & Gas Refining & Marketing, Environmental & Facilities Services, and Industrial Machinery & Supplies & Components sub-industries.
Thank you for your interest and your continued support.
Chad Baumler, CFA
Please visit our website at www.nuanceinvestments.com for more information about our team, our process, and value investing. You can also get real-time access to the Nuance Investment website updates
and information via traditional mail or e-mail. Simply contact us at client.services@nuanceinvestments.com or call 816-743-7080 to sign-up.
This report must be preceded or accompanied by a prospectus.
Mutual fund investing involves risk. Principal loss is possible. Investments in small and mid-capitalization companies involve additional risk such as limited liquidity and greater
volatility than larger capitalization companies. Investments in foreign securities involve political, economic and currency risks, greater volatility and differences in accounting methods. The Fund is non-diversified, meaning it may concentrate its
assets in fewer individual holdings than a diversified fund. Therefore, the Fund is more exposed to individual stock volatility than a diversified fund. Short sale of securities involves unlimited risk including the possibility that losses may exceed
the original amount invested. However, a mutual fund investor’s risk is limited to one’s amount of investment in a mutual fund. The Fund’s value investments are subject to the risk that their intrinsic values may not be recognized by the broad market
or that their prices may decline.
Past performance does not guarantee future results.
Opinions expressed are subject to change, are not guaranteed and should not be considered investment advice or recommendations to buy or sell any security.
Nuance Investments is the adviser to the Nuance Concentrated Value Long-Short Fund which is distributed by Quasar Distributors, LLC.
2
NUANCE CONCENTRATED VALUE LONG-SHORT FUND
Value of $10,000 Investment (Unaudited)
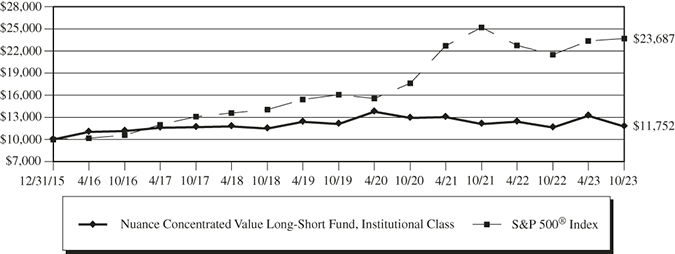
The chart assumes an initial investment of $10,000. Performance reflects waivers of fee and operating expenses in effect. In the absence of such waivers, total return would be
reduced. Performance data quoted represents past performance and does not guarantee future results. Investment returns and principal value will fluctuate, and when sold, may be worth more or less than their original cost. Performance current to the
most recent month-end may be lower or higher than the performance quoted and can be obtained by calling 1-855-682-6233. Performance assumes the reinvestment of capital gains and income distributions. The performance does not reflect the deduction of
taxes that a shareholder would pay on Fund distributions or the redemption of Fund shares.
Average Annual Rates of Return (%) As of October 31, 2023
|
Since
|
||||
|
1 Year
|
3 Year
|
5 Year
|
Inception(1)
|
|
|
Investor Class
|
0.80%
|
-3.36%
|
0.20%
|
1.79%
|
|
Institutional Class
|
1.12%
|
-3.10%
|
0.47%
|
2.08%
|
|
S&P 500 Index(2)
|
10.14%
|
10.36%
|
11.01%
|
11.63%
|
|
(1)
|
December 31, 2015.
|
|
(2)
|
The Standard & Poor’s 500 Index (S&P 500) is an unmanaged, capitalization-weighted index generally representative of the U.S. market for large capitalization stocks. This Index cannot be
invested in directly.
|
The following is expense information for the Nuance Concentrated Value Long-Short Fund as disclosed in the Fund’s most recent prospectus dated August 28, 2023:
Institutional Class Gross Expense Ratio – 3.25%
Investor Class Gross Expense Ratio – 3.51%
Nuance Investments, LLC (the “Adviser”) has contractually agreed to waive its management fees and pay Fund expenses, in order to ensure that Total Annual Fund Operating Expenses (excluding acquired fund
fees and expenses, leverage/borrowing interest, interest expense, dividends paid on short sales, taxes, brokerage commissions and extraordinary expenses) do not exceed 1.55% of the average daily net assets of the Investor Class and 1.30% of the
average daily net assets of the Institutional Class. Fees waived and expenses paid by the Adviser may be recouped by the Adviser for a period of 36 months following the month during which such fee
3
NUANCE CONCENTRATED VALUE LONG-SHORT FUND
waiver and/or expense payment was made if such recoupment can be achieved without exceeding the expense limit in effect at the time the fee waiver and/or expense payment occurred and the expense limit
in place at the time of recoupment. The Operating Expenses Limitation Agreement is indefinite but cannot be terminated through at least August 28, 2024. Thereafter, the agreement may be terminated at any time upon 60 days’ written notice by the
Trust’s Board of Trustees (the “Board”) or the Adviser, with consent of the Board.
4
NUANCE CONCENTRATED VALUE LONG-SHORT FUND
Expense Example (Unaudited)
October 31, 2023
As a shareholder of the Fund, you incur two types of costs: (1) transaction costs and (2) ongoing costs, including management fees, distribution and service (12b-1) fees, shareholder servicing fees, and
other Fund expenses. This Example is intended to help you understand your ongoing costs (in dollars) of investing in the Fund and to compare these costs with the ongoing costs of investing in other mutual funds. The Example is based on an investment
of $1,000 invested at the beginning of the period and held for the entire period (May 1, 2023 – October 31, 2023).
ACTUAL EXPENSES
For each class, the first line of the table below provides information about actual account values and actual expenses. You may use the information in this line, together with the amount you invested,
to estimate the expenses that you paid over the period. Simply divide your account value by $1,000 (for example, an $8,600 account value divided by $1,000 = 8.6), then multiply the result by the number in the first line under the heading entitled
“Expenses Paid During Period” to estimate the expenses you paid on your account during this period.
HYPOTHETICAL EXAMPLE FOR COMPARISON PURPOSES
For each class, the second line of the table below provides information about hypothetical account values and hypothetical expenses based on the Fund’s actual expense ratio and an assumed rate of return
of 5% per year before expenses, which is not the Fund’s actual return. The hypothetical account values and expenses may not be used to estimate the actual ending account balance or expenses you paid for the period. You may use this information to
compare the ongoing costs of investing in the Fund and other funds. To do so, compare this 5% hypothetical example with the 5% hypothetical examples that appear in the shareholder reports of the other funds.
Please note that the expenses shown in the table are meant to highlight your ongoing costs only and do not reflect any transactional costs. Therefore, the second line of the table is
useful in comparing ongoing costs only, and will not help you determine the relative total costs of owning different funds. In addition, if transactional costs were included, your costs may have been higher.
|
Expenses Paid
|
||||||||||||
|
Beginning Account
|
Ending Account
|
During Period(1)
|
||||||||||
|
Value (5/1/23)
|
Value (10/31/23)
|
(5/1/23 to 10/31/23)
|
||||||||||
|
Investor Class
|
||||||||||||
|
Actual(2)(3)
|
$
|
1,000.00
|
$
|
888.00
|
$
|
15.19
|
||||||
|
Hypothetical(4) (5% return before expenses)
|
$
|
1,000.00
|
$
|
1,009.05
|
$
|
16.16
|
||||||
|
Institutional Class
|
||||||||||||
|
Actual(2)(3)
|
$
|
1,000.00
|
$
|
889.40
|
$
|
13.92
|
||||||
|
Hypothetical(4) (5% return before expenses)
|
$
|
1,000.00
|
$
|
1,010.41
|
$
|
14.81
|
||||||
|
(1)
|
Expenses are equal to the Fund’s annualized expense ratio for the six-month period of 3.20% and 2.93% for the Investor Class and Institutional Class, respectively, multiplied by the average
account value over the period, multiplied by 184/366 to reflect the one-half year period.
|
|
(2)
|
Based on the actual returns for the six-month period ended October 31, 2023 of -11.20% and -11.06% for the Investor Class and Institutional Class, respectively.
|
|
(3)
|
Excluding dividends and interest on short positions, the actual expenses would be $7.36 and $6.03 for the Investor Class and Institutional Class, respectively.
|
|
(4)
|
Excluding dividends and interest on short positions, the hypothetical expenses would be $7.86 and $6.44 for the Investor Class and Institutional Class, respectively.
|
5
NUANCE CONCENTRATED VALUE LONG-SHORT FUND
Allocation of Portfolio(1)(2) (% of Net As
sets) (Unaudited)
October 31, 2023
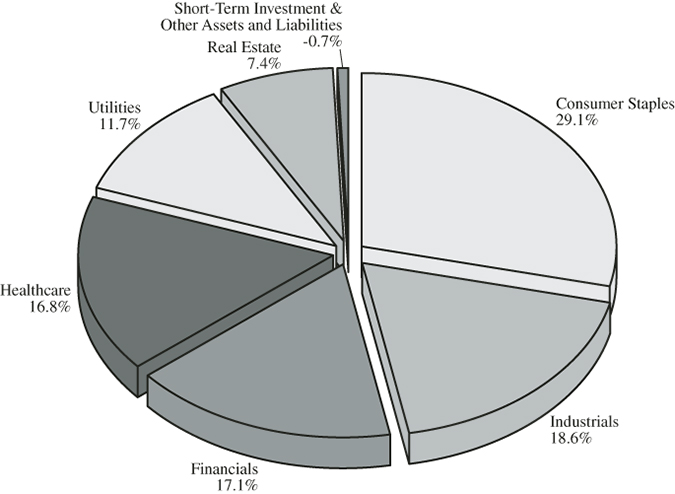
Top Ten Long Positions(1)(2) (Unaudited)
as of October 31, 2023 (% of Net Assets)
|
3M Co.
|
10.4%
|
||
|
Henkel AG & Co. KGaA – ADR
|
8.7%
|
||
|
Dentsply Sirona, Inc
|
7.6%
|
||
|
Kimberly-Clark Corp.
|
6.2%
|
||
|
Clorox Co.
|
5.9%
|
||
|
Travelers Companies, Inc.
|
5.8%
|
||
|
United Utilities Group PLC
|
5.4%
|
||
|
Northern Trust Corp.
|
5.0%
|
||
|
Pennon Group PLC
|
4.1%
|
||
|
Healthcare Realty Trust, Inc.
|
3.5%
|
Top Five Short Positions(2) (Unaudited)
as of October 31, 2023 (% of Net Assets)
|
Progressive Corp.
|
-4.3%
|
||
|
O'Reilly Automotive, Inc.
|
-4.0%
|
||
|
Republic Services, Inc.
|
-3.9%
|
||
|
Waste Management, Inc.
|
-3.9%
|
||
|
Marathon Petroleum Corp.
|
-3.8%
|
|
(1)
|
Excludes short positions.
|
|
(2)
|
Fund holdings and sector allocations are subject to change at any time and are not recommendations to buy or sell any security.
|
ADR – American Depository Receipt
6
NUANCE CONCENTRATED VALUE LONG-SHORT FUND
Schedule of Investments (Unaudited)
October 31, 2023
|
Shares
|
Value
|
|||||||
|
COMMON STOCKS – 100.7%
|
||||||||
|
Consumer Staples – 29.1%(a)
|
||||||||
|
Beiersdorf AG – ADR
|
29,944
|
$
|
784,832
|
|||||
|
Cal-Maine Foods, Inc.
|
64,832
|
2,937,538
|
||||||
|
Clorox Co.
|
71,785
|
8,449,094
|
||||||
|
Diageo PLC – ADR
|
18,788
|
2,883,958
|
||||||
|
Henkel AG & Co. KGaA – ADR
|
794,586
|
12,506,784
|
||||||
|
Kimberly-Clark Corp.
|
74,481
|
8,910,907
|
||||||
|
Mission Produce, Inc.(b)
|
262,115
|
2,466,502
|
||||||
|
Pernod Ricard SA – ADR
|
40,714
|
1,446,202
|
||||||
|
Target Corp.
|
13,363
|
1,480,487
|
||||||
|
Total Consumer Staples
|
41,866,304
|
|||||||
|
Financials – 17.1%
|
||||||||
|
Charles Schwab Corp.
|
29,432
|
1,531,641
|
||||||
|
Independent Bank Corp.
|
54,693
|
2,669,018
|
||||||
|
Northern Trust Corp.
|
109,903
|
7,243,707
|
||||||
|
Reinsurance Group of America, Inc.
|
19,830
|
2,963,990
|
||||||
|
TowneBank
|
85,569
|
2,048,522
|
||||||
|
Travelers Companies, Inc.
|
50,162
|
8,399,125
|
||||||
|
Total Financials
|
24,856,003
|
|||||||
|
Health Care – 16.8%
|
||||||||
|
Dentsply Sirona, Inc.
|
360,684
|
10,968,399
|
||||||
|
Envista Holdings Corp.(b)
|
63,023
|
1,466,545
|
||||||
|
Globus Medical, Inc. – Class A(b)
|
92,060
|
4,208,063
|
||||||
|
Smith & Nephew – ADR
|
48,115
|
1,070,078
|
||||||
|
Universal Health Services, Inc.
|
23,503
|
2,958,793
|
||||||
|
Waters Corp.(b)
|
15,227
|
3,632,097
|
||||||
|
Total Health Care
|
24,303,975
|
|||||||
|
Industrials – 18.6%
|
||||||||
|
3M Co.
|
165,297
|
15,033,762
|
||||||
|
Knorr-Bremse AG – ADR
|
298,554
|
4,134,973
|
||||||
|
Lindsay Corp.
|
11,271
|
1,407,973
|
||||||
|
Mueller Water Products, Inc.
|
378,873
|
4,686,659
|
||||||
|
Werner Enterprises, Inc.
|
39,630
|
1,439,362
|
||||||
|
Total Industrials
|
26,702,729
|
|||||||
See Notes to the Financial Statements
7
NUANCE CONCENTRATED VALUE LONG-SHORT FUND
Schedule of Investments (Unaudited) – Continued
October 31, 2023
|
Shares
|
Value
|
|||||||
|
Real Estate – 7.4%
|
||||||||
|
Alexandria Real Estate Equities, Inc.
|
7,351
|
$
|
684,599
|
|||||
|
Equity Commonwealth
|
157,894
|
2,990,512
|
||||||
|
Healthcare Realty Trust, Inc.
|
352,303
|
5,055,548
|
||||||
|
Healthpeak Properties, Inc.
|
127,832
|
1,987,788
|
||||||
|
Total Real Estate
|
10,718,447
|
|||||||
|
Utilities – 11.7%
|
||||||||
|
California Water Service Group
|
61,501
|
2,993,869
|
||||||
|
Pennon Group PLC – ADR
|
333,258
|
5,975,316
|
||||||
|
United Utilities Group PLC – ADR
|
297,910
|
7,838,012
|
||||||
|
Total Utilities
|
16,807,198
|
|||||||
|
TOTAL COMMON STOCKS
|
||||||||
|
(Cost $151,230,916)
|
145,254,656
|
|||||||
|
SHORT-TERM INVESTMENTS – 0.1%
|
||||||||
|
Money Market Funds – 0.1%
|
||||||||
|
First American Government Obligations Fund – Class X, 5.28%(c)
|
184,133
|
184,133
|
||||||
|
Total Money Market Funds
|
184,133
|
|||||||
|
TOTAL SHORT-TERM INVESTMENTS
|
||||||||
|
(Cost $184,133)
|
184,133
|
|||||||
|
TOTAL INVESTMENTS – 100.8%
|
||||||||
|
(Cost $151,415,049)
|
145,438,789
|
|||||||
|
Liabilities in Excess of Other Assets – (0.8)%
|
(1,178,036
|
)
|
||||||
|
TOTAL NET ASSETS – 100.0%
|
$
|
144,260,753
|
||||||
Percentages are stated as a percent of net assets.
The Global Industry Classification Standard (GICS®) was developed by and/or is the exclusive property of MSCI, Inc. and
Standard & Poor’s Financial Services LLC (“S&P”). GICS is a service mark of MSCI and S&P and has been licensed for use by U.S. Bank Global Fund Services.
ADR – American Depositary Receipt
PLC – Public Limited Company
|
(a)
|
As of October 31, 2023, the Fund had a significant portion of its assets invested in this sector and therefore is subject to additional risks.
|
|
(b)
|
Non-income producing security.
|
|
(c)
|
The rate shown represents the 7-day effective yield as of October 31, 2023.
|
See Notes to the Financial Statements
8
NUANCE CONCENTRATED VALUE LONG-SHORT FUND
Schedule of Securities Sold Short (Unaudited)
October 31, 2023
|
Shares
|
Value
|
|||||||
|
COMMON STOCKS – (83.7)%
|
||||||||
|
Consumer Discretionary – (16.0)%
|
||||||||
|
AutoZone, Inc.(a)
|
(967
|
)
|
$
|
(2,395,385
|
)
|
|||
|
D.R. Horton, Inc.
|
(11,872
|
)
|
(1,239,437
|
)
|
||||
|
Home Depot, Inc.
|
(15,645
|
)
|
(4,453,975
|
)
|
||||
|
Lennar Corp.
|
(11,292
|
)
|
(1,204,631
|
)
|
||||
|
Lowe’s Companies, Inc.
|
(6,010
|
)
|
(1,145,326
|
)
|
||||
|
McDonald’s Corp.
|
(4,237
|
)
|
(1,110,814
|
)
|
||||
|
O’Reilly Automotive, Inc.(a)
|
(6,183
|
)
|
(5,752,910
|
)
|
||||
|
Royal Caribbean Cruises Ltd.(a)
|
(25,303
|
)
|
(2,143,923
|
)
|
||||
|
TJX Companies, Inc.
|
(28,405
|
)
|
(2,501,628
|
)
|
||||
|
Yum Brands, Inc.
|
(9,219
|
)
|
(1,114,208
|
)
|
||||
|
Total Consumer Discretionary
|
(23,062,237
|
)
|
||||||
|
Consumer Staples – (7.4)%
|
||||||||
|
Coca-Cola Co.
|
(20,063
|
)
|
(1,133,359
|
)
|
||||
|
Costco Wholesale Corp.
|
(1,990
|
)
|
(1,099,356
|
)
|
||||
|
General Mills, Inc.
|
(17,470
|
)
|
(1,139,743
|
)
|
||||
|
Mondelez International, Inc.
|
(57,573
|
)
|
(3,811,908
|
)
|
||||
|
Nestle SA – ADR
|
(10,192
|
)
|
(1,098,290
|
)
|
||||
|
PepsiCo, Inc.
|
(14,454
|
)
|
(2,360,049
|
)
|
||||
|
Total Consumer Staples
|
(10,642,705
|
)
|
||||||
|
Energy – (11.4)%
|
||||||||
|
Canadian Natural Resources Ltd.
|
(29,360
|
)
|
(1,865,241
|
)
|
||||
|
Chevron Corp.
|
(11,231
|
)
|
(1,636,694
|
)
|
||||
|
ConocoPhillips
|
(33,582
|
)
|
(3,989,542
|
)
|
||||
|
Marathon Petroleum Corp.
|
(36,594
|
)
|
(5,534,842
|
)
|
||||
|
Phillips 66
|
(3,135
|
)
|
(357,609
|
)
|
||||
|
Valero Energy Corp.
|
(23,619
|
)
|
(2,999,613
|
)
|
||||
|
Total Energy
|
(16,383,541
|
)
|
||||||
|
Financials – (8.5)%
|
||||||||
|
Allstate Corp.
|
(8,448
|
)
|
(1,082,442
|
)
|
||||
|
Arch Capital Group Ltd.(a)
|
(32,454
|
)
|
(2,813,113
|
)
|
||||
|
JPMorgan Chase & Co.
|
(7,734
|
)
|
(1,075,490
|
)
|
||||
|
Marsh & McLennan Companies, Inc.
|
(5,681
|
)
|
(1,077,402
|
)
|
||||
|
Progressive Corp.
|
(39,561
|
)
|
(6,254,198
|
)
|
||||
|
Total Financials
|
(12,302,645
|
)
|
||||||
|
Health Care – (1.4)%
|
||||||||
|
HCA Healthcare, Inc.
|
(9,214
|
)
|
(2,083,654
|
)
|
||||
|
Total Health Care
|
(2,083,654
|
)
|
||||||
See Notes to the Financial Statements
9
NUANCE CONCENTRATED VALUE LONG-SHORT FUND
Schedule of Securities Sold Short (Unaudited) – Continued
October 31, 2023
|
Shares
|
Value
|
|||||||
|
Industrials – (31.9)%
|
||||||||
|
Automatic Data Processing, Inc.
|
(10,839
|
)
|
$
|
(2,365,287
|
)
|
|||
|
Carrier Global Corp.
|
(21,742
|
)
|
(1,036,224
|
)
|
||||
|
Caterpillar, Inc.
|
(19,597
|
)
|
(4,429,902
|
)
|
||||
|
Cintas Corp.
|
(7,750
|
)
|
(3,930,180
|
)
|
||||
|
CSX Corp.
|
(78,642
|
)
|
(2,347,464
|
)
|
||||
|
Cummins, Inc.
|
(10,770
|
)
|
(2,329,551
|
)
|
||||
|
Eaton Corporation PLC
|
(5,251
|
)
|
(1,091,734
|
)
|
||||
|
Ferguson PLC
|
(15,065
|
)
|
(2,262,763
|
)
|
||||
|
Illinois Tool Works, Inc.
|
(12,423
|
)
|
(2,784,243
|
)
|
||||
|
Otis Worldwide Corp.
|
(14,295
|
)
|
(1,103,717
|
)
|
||||
|
Parker-Hannifin Corp.
|
(2,956
|
)
|
(1,090,498
|
)
|
||||
|
Paychex, Inc.
|
(21,829
|
)
|
(2,424,109
|
)
|
||||
|
Republic Services, Inc.
|
(37,716
|
)
|
(5,600,449
|
)
|
||||
|
Trane Technologies
|
(27,028
|
)
|
(5,143,699
|
)
|
||||
|
Union Pacific Corp.
|
(12,506
|
)
|
(2,596,371
|
)
|
||||
|
Waste Management, Inc.
|
(33,814
|
)
|
(5,556,655
|
)
|
||||
|
Total Industrials
|
(46,092,846
|
)
|
||||||
|
Materials – (2.5)%
|
||||||||
|
PPG Industries, Inc.
|
(8,718
|
)
|
(1,070,309
|
)
|
||||
|
Sherwin-Williams Co.
|
(10,540
|
)
|
(2,510,733
|
)
|
||||
|
Total Materials
|
(3,581,042
|
)
|
||||||
|
Real Estate – (4.6)%
|
||||||||
|
Prologis, Inc.
|
(20,611
|
)
|
(2,076,558
|
)
|
||||
|
Public Storage
|
(3,622
|
)
|
(864,608
|
)
|
||||
|
Welltower Inc.
|
(32,422
|
)
|
(2,710,803
|
)
|
||||
|
Weyerhaeuser Co.
|
(35,208
|
)
|
(1,010,119
|
)
|
||||
|
Total Real Estate
|
(6,662,088
|
)
|
||||||
|
TOTAL COMMON STOCKS
|
||||||||
|
(Proceeds $117,739,970)
|
(120,810,758
|
)
|
||||||
|
TOTAL SECURITIES SOLD SHORT
|
||||||||
|
(Proceeds $117,739,970)
|
$
|
(120,810,758
|
)
|
|||||
|
(a)
|
Non-income producing security.
|
See Notes to the Financial Statements
10
NUANCE CONCENTRATED VALUE LONG-SHORT FUND
Statement of Assets and Liabilities (Unaudited)
October 31, 2023
|
ASSETS:
|
||||
|
Investments, at value
|
||||
|
(cost $151,415,049)
|
$
|
145,438,789
|
||
|
Cash(1)
|
223,558
|
|||
|
Deposits at broker(1)
|
121,813,067
|
|||
|
Receivable for investment securities sold
|
1,506,016
|
|||
|
Receivable for capital shares sold
|
53,397
|
|||
|
Dividends & interest receivable
|
246,298
|
|||
|
Prepaid expenses
|
20,665
|
|||
|
Total assets
|
269,301,790
|
|||
|
LIABILITIES:
|
||||
|
Securities sold short, at value (proceeds $117,739,970)
|
120,810,758
|
|||
|
Dividends payable
|
55,787
|
|||
|
Payable for investment securities purchased
|
2,312,925
|
|||
|
Payable for capital shares redeemed
|
1,683,473
|
|||
|
Payable to investment adviser
|
123,848
|
|||
|
Payable for fund services fees
|
1,562
|
|||
|
Payable for trustee fees
|
4,384
|
|||
|
Accrued distribution & shareholder service fees
|
24,380
|
|||
|
Accrued expenses
|
23,920
|
|||
|
Total liabilities
|
125,041,037
|
|||
|
NET ASSETS
|
$
|
144,260,753
|
||
|
NET ASSETS CONSIST OF:
|
||||
|
Paid-in capital
|
$
|
170,691,009
|
||
|
Total accumulated loss
|
(26,430,256
|
)
|
||
|
Net Assets
|
$
|
144,260,753
|
||
|
Investor
|
Institutional
|
|||||||
|
Class
|
Class
|
|||||||
|
Net Assets
|
$
|
3,069,637
|
$
|
141,191,116
|
||||
|
Shares issued and outstanding(2)
|
348,774
|
15,671,352
|
||||||
|
Net asset value, redemption price and offering price per share
|
$
|
8.80
|
$
|
9.01
|
||||
|
(1)
|
Pledged as collateral for securities sold short.
|
|
(2)
|
Unlimited shares authorized with no par value.
|
See Notes to the Financial Statements
11
NUANCE CONCENTRATED VALUE LONG-SHORT FUND
Statement of Operations (Unaudited)
For the Six Months Ended October 31, 2023
|
INVESTMENT INCOME:
|
||||
|
Dividend income
|
$
|
2,005,249
|
||
|
Less: Foreign taxes withheld
|
(22,178
|
)
|
||
|
Broker interest income on short positions
|
3,347,883
|
|||
|
Interest income
|
220,415
|
|||
|
Total investment income
|
5,551,369
|
|||
|
EXPENSES:
|
||||
|
Dividends on short positions
|
1,308,294
|
|||
|
Investment adviser fees (See Note 4)
|
789,891
|
|||
|
Fund services fees (See Note 4)
|
47,561
|
|||
|
Federal & state registration fees
|
20,650
|
|||
|
Audit fees
|
10,234
|
|||
|
Trustee fees
|
9,769
|
|||
|
Postage & printing fees
|
5,681
|
|||
|
Legal fees
|
4,836
|
|||
|
Other
|
2,743
|
|||
|
Insurance expense
|
1,583
|
|||
|
Distribution & shareholder service fees (See Note 5):
|
||||
|
Investor Class
|
6,654
|
|||
|
Institutional Class
|
107,847
|
|||
|
Total expenses before recoupment
|
2,315,743
|
|||
|
Fee recoupment (see Note 4)
|
323
|
|||
|
Net expenses
|
2,316,066
|
|||
|
NET INVESTMENT INCOME
|
3,235,303
|
|||
|
REALIZED AND UNREALIZED GAIN (LOSS) ON INVESTMENTS:
|
||||
|
Net realized gain (loss) on transactions from:
|
||||
|
Investments
|
457,840
|
|||
|
Securities sold short
|
(5,358,523
|
)
|
||
|
Net change in unrealized appreciation/depreciation on:
|
||||
|
Investments
|
(24,430,431
|
)
|
||
|
Securities sold short
|
7,710,419
|
|||
|
Net realized and unrealized loss on investments
|
(21,620,695
|
)
|
||
|
NET DECREASE IN NET ASSETS RESULTING FROM OPERATIONS
|
$
|
(18,385,392
|
)
|
|
See Notes to the Financial Statements
12
NUANCE CONCENTRATED VALUE LONG-SHORT FUND
Statements of Changes in Net Assets
|
Six Months Ended
|
||||||||
|
October 31, 2023
|
Year Ended
|
|||||||
|
(Unaudited)
|
April 30, 2023
|
|||||||
|
OPERATIONS:
|
||||||||
|
Net investment income
|
$
|
3,235,303
|
$
|
2,422,257
|
||||
|
Net realized gain (loss) on transactions from:
|
||||||||
|
Investments
|
457,840
|
(7,268,864
|
)
|
|||||
|
Securities sold short
|
(5,358,523
|
)
|
4,322,683
|
|||||
|
Net change in unrealized appreciation/depreciation on:
|
||||||||
|
Investments
|
(24,430,431
|
)
|
18,670,676
|
|||||
|
Securities sold short
|
7,710,419
|
(7,023,527
|
)
|
|||||
|
Net increase (decrease) in net assets resulting from operations
|
(18,385,392
|
)
|
11,123,225
|
|||||
|
CAPITAL SHARE TRANSACTIONS:
|
||||||||
|
Investor Class:
|
||||||||
|
Proceeds from shares sold
|
199,712
|
337,405
|
||||||
|
Proceeds from reinvestment of distributions
|
—
|
95,218
|
||||||
|
Payments for shares redeemed
|
(214,225
|
)
|
(922,377
|
)
|
||||
|
Decrease in net assets resulting from Investor Class transactions
|
(14,513
|
)
|
(489,754
|
)
|
||||
|
Institutional Class:
|
||||||||
|
Proceeds from shares sold
|
9,796,662
|
58,766,602
|
||||||
|
Proceeds from reinvestment of distributions
|
—
|
1,969,223
|
||||||
|
Payments for shares redeemed
|
(13,672,104
|
)
|
(31,342,373
|
)
|
||||
|
Increase (decrease) in net assets resulting
|
||||||||
|
from Institutional Class transactions
|
(3,875,442
|
)
|
29,393,452
|
|||||
|
Net increase (decrease) in net assets resulting
|
||||||||
|
from capital share transactions
|
(3,889,955
|
)
|
28,903,698
|
|||||
|
DISTRIBUTIONS TO SHAREHOLDERS:
|
||||||||
|
Investor Class
|
—
|
(95,260
|
)
|
|||||
|
Institutional Class
|
—
|
(3,809,886
|
)
|
|||||
|
Total distributions to shareholders
|
—
|
(3,905,146
|
)
|
|||||
|
TOTAL INCREASE (DECREASE) IN NET ASSETS
|
(22,275,347
|
)
|
36,121,777
|
|||||
|
NET ASSETS:
|
||||||||
|
Beginning of period
|
166,536,100
|
130,414,323
|
||||||
|
End of period
|
$
|
144,260,753
|
$
|
166,536,100
|
||||
See Notes to the Financial Statements
13
NUANCE CONCENTRATED VALUE LONG-SHORT FUND
Financial Highlights
For a Fund share outstanding throughout the period.
|
Six Months Ended
|
Year Ended
|
Year Ended
|
Year Ended
|
Year Ended
|
Year Ended
|
|||||||||||||||||||
|
October 31, 2023
|
April 30,
|
April 30,
|
April 30,
|
April 30,
|
April 30,
|
|||||||||||||||||||
|
(Unaudited)
|
2023
|
2022
|
2021
|
2020
|
2019
|
|||||||||||||||||||
|
Investor Class
|
||||||||||||||||||||||||
|
PER SHARE DATA:
|
||||||||||||||||||||||||
|
Net asset value, beginning of period
|
$
|
9.91
|
$
|
9.58
|
$
|
10.50
|
$
|
11.68
|
$
|
10.68
|
$
|
10.90
|
||||||||||||
|
INVESTMENT OPERATIONS:
|
||||||||||||||||||||||||
|
Net investment loss
|
0.18
|
0.13
|
(0.18
|
)
|
(0.28
|
)
|
(0.02
|
)
|
(0.03
|
)(1)
|
||||||||||||||
|
Net realized and unrealized
|
||||||||||||||||||||||||
|
gain (loss) on investments
|
(1.29
|
)
|
0.44
|
(0.37
|
)
|
(0.36
|
)(2)
|
1.17
|
0.55
|
|||||||||||||||
|
Total from investment operations
|
(1.11
|
)
|
0.57
|
(0.55
|
)
|
(0.64
|
)
|
1.15
|
0.52
|
|||||||||||||||
|
LESS DISTRIBUTIONS:
|
||||||||||||||||||||||||
|
Distributions from net realized gains
|
—
|
(0.24
|
)
|
(0.37
|
)
|
(0.54
|
)
|
(0.15
|
)
|
(0.74
|
)
|
|||||||||||||
|
Total distributions
|
—
|
(0.24
|
)
|
(0.37
|
)
|
(0.54
|
)
|
(0.15
|
)
|
(0.74
|
)
|
|||||||||||||
|
Net asset value, end of period
|
$
|
8.80
|
$
|
9.91
|
$
|
9.58
|
$
|
10.50
|
$
|
11.68
|
$
|
10.68
|
||||||||||||
|
TOTAL RETURN(3)
|
(11.20
|
)%
|
6.17
|
%
|
(5.04
|
)%
|
(5.49
|
)%
|
10.91
|
%
|
4.96
|
%
|
||||||||||||
|
SUPPLEMENTAL DATA AND RATIOS:
|
||||||||||||||||||||||||
|
Net assets, end of period (in millions)
|
$
|
3.1
|
$
|
3.5
|
$
|
3.9
|
$
|
3.8
|
$
|
7.5
|
$
|
2.6
|
||||||||||||
|
Ratio of expenses to average net assets(4):
|
||||||||||||||||||||||||
|
Before expense waiver/recoupment
|
3.18
|
%
|
3.50
|
%
|
3.57
|
%
|
3.60
|
%
|
3.71
|
%
|
4.16
|
%
|
||||||||||||
|
After expense waiver/recoupment
|
3.20
|
%
|
3.51
|
%
|
3.58
|
%
|
3.58
|
%
|
3.59
|
%
|
3.60
|
%
|
||||||||||||
|
Ratio of expenses excluding dividend
|
||||||||||||||||||||||||
|
expense and broker interest/expense
|
||||||||||||||||||||||||
|
to average net assets(4):
|
||||||||||||||||||||||||
|
Before expense waiver/recoupment
|
1.53
|
%
|
1.54
|
%
|
1.54
|
%
|
1.57
|
%
|
1.67
|
%
|
2.11
|
%
|
||||||||||||
|
After expense waiver/recoupment
|
1.55
|
%
|
1.55
|
%
|
1.55
|
%
|
1.55
|
%
|
1.55
|
%
|
1.55
|
%
|
||||||||||||
|
Ratio of net investment income (loss)
|
||||||||||||||||||||||||
|
to average net assets(4):
|
||||||||||||||||||||||||
|
Before expense waiver/recoupment
|
3.84
|
%
|
1.45
|
%
|
(1.62
|
)%
|
(2.14
|
)%
|
(0.53
|
)%
|
(0.84
|
)%
|
||||||||||||
|
After expense waiver/recoupment
|
3.82
|
%
|
1.44
|
%
|
(1.63
|
)%
|
(2.12
|
)%
|
(0.41
|
)%
|
(0.28
|
)%
|
||||||||||||
|
Portfolio turnover rate(3)
|
54
|
%
|
131
|
%
|
125
|
%
|
154
|
%
|
156
|
%
|
123
|
%
|
||||||||||||
|
(1)
|
Per share amounts calculated using the average shares method.
|
|
(2)
|
Realized and unrealized gains (losses) per share in this caption are balancing amounts necessary to reconcile the change in net asset value per share for the period, and may not reconcile with
the aggregate gains on the Statement of Operations due to share transactions for the period.
|
|
(3)
|
Not annualized for periods less than one year.
|
|
(4)
|
Annualized for periods less than one year.
|
See Notes to the Financial Statements
14
NUANCE CONCENTRATED VALUE LONG-SHORT FUND
Financial Highlights
For a Fund share outstanding throughout the period.
|
Six Months Ended
|
Year Ended
|
Year Ended
|
Year Ended
|
Year Ended
|
Year Ended
|
|||||||||||||||||||
|
October 31, 2023
|
April 30,
|
April 30,
|
April 30,
|
April 30,
|
April 30,
|
|||||||||||||||||||
|
(Unaudited)
|
2023
|
2022
|
2021
|
2020
|
2019
|
|||||||||||||||||||
|
Institutional Class
|
||||||||||||||||||||||||
|
PER SHARE DATA:
|
||||||||||||||||||||||||
|
Net asset value, beginning of period
|
$
|
10.13
|
$
|
9.76
|
$
|
10.66
|
$
|
11.82
|
$
|
10.81
|
$
|
10.99
|
||||||||||||
|
INVESTMENT OPERATIONS:
|
||||||||||||||||||||||||
|
Net investment loss
|
0.20
|
0.16
|
(0.17
|
)
|
(0.17
|
)
|
(0.01
|
)
|
(0.00
|
)(1)(2)
|
||||||||||||||
|
Net realized and unrealized
|
||||||||||||||||||||||||
|
gain (loss) on investments
|
(1.32
|
)
|
0.45
|
(0.36
|
)
|
(0.45
|
)(3)
|
1.19
|
0.56
|
|||||||||||||||
|
Total from investment operations
|
(1.12
|
)
|
0.61
|
(0.53
|
)
|
(0.62
|
)
|
1.18
|
0.56
|
|||||||||||||||
|
LESS DISTRIBUTIONS:
|
||||||||||||||||||||||||
|
Distributions from net investment income
|
—
|
—
|
—
|
—
|
(0.02
|
)
|
—
|
|||||||||||||||||
|
Distributions from net realized gains
|
—
|
(0.24
|
)
|
(0.37
|
)
|
(0.54
|
)
|
(0.15
|
)
|
(0.74
|
)
|
|||||||||||||
|
Total distributions
|
—
|
(0.24
|
)
|
(0.37
|
)
|
(0.54
|
)
|
(0.17
|
)
|
(0.74
|
)
|
|||||||||||||
|
Net asset value, end of period
|
$
|
9.01
|
$
|
10.13
|
$
|
9.76
|
$
|
10.66
|
$
|
11.82
|
$
|
10.81
|
||||||||||||
|
TOTAL RETURN(4)
|
(11.06
|
)%
|
6.47
|
%
|
(4.77
|
)%
|
(5.33
|
)%
|
11.10
|
%
|
5.30
|
%
|
||||||||||||
|
SUPPLEMENTAL DATA AND RATIOS:
|
||||||||||||||||||||||||
|
Net assets, end of period (in millions)
|
$
|
141.2
|
$
|
163.0
|
$
|
126.5
|
$
|
118.0
|
$
|
56.9
|
$
|
29.5
|
||||||||||||
|
Ratio of expenses to average net assets(5):
|
||||||||||||||||||||||||
|
Before expense waiver/recoupment
|
2.93
|
%
|
3.22
|
%
|
3.30
|
%
|
3.40
|
%
|
3.39
|
%
|
3.69
|
%
|
||||||||||||
|
After expense waiver/recoupment
|
2.93
|
%
|
3.24
|
%
|
3.33
|
%
|
3.42
|
%
|
3.33
|
%
|
3.33
|
%
|
||||||||||||
|
Ratio of expenses excluding dividend
|
||||||||||||||||||||||||
|
expense and broker interest/expense
|
||||||||||||||||||||||||
|
to average net assets(5):
|
||||||||||||||||||||||||
|
Before expense waiver/recoupment
|
1.27
|
%
|
1.27
|
%
|
1.27
|
%
|
1.28
|
%
|
1.36
|
%
|
1.66
|
%
|
||||||||||||
|
After expense waiver/recoupment
|
1.27
|
%
|
1.29
|
%
|
1.30
|
%
|
1.30
|
%
|
1.30
|
%
|
1.30
|
%
|
||||||||||||
|
Ratio of net investment income (loss)
|
||||||||||||||||||||||||
|
to average net assets(5):
|
||||||||||||||||||||||||
|
Before expense waiver/recoupment
|
4.10
|
%
|
1.74
|
%
|
(1.35
|
)%
|
(1.94
|
)%
|
(0.21
|
)%
|
(0.37
|
)%
|
||||||||||||
|
After expense waiver/recoupment
|
4.10
|
%
|
1.72
|
%
|
(1.38
|
)%
|
(1.96
|
)%
|
(0.15
|
)%
|
(0.01
|
)%
|
||||||||||||
|
Portfolio turnover rate(4)
|
54
|
%
|
131
|
%
|
125
|
%
|
154
|
%
|
156
|
%
|
123
|
%
|
||||||||||||
|
(1)
|
Per share amounts calculated using the average shares method.
|
|
(2)
|
Amount rounds to less than $(0.01).
|
|
(3)
|
Realized and unrealized gains (losses) per share in this caption are balancing amounts necessary to reconcile the change in net asset value per share for the period, and may not reconcile with
the aggregate gains on the Statement of Operations due to share transactions for the period.
|
|
(4)
|
Not annualized for periods less than one year.
|
|
(5)
|
Annualized for periods less than one year.
|
See Notes to the Financial Statements
15
NUANCE CONCENTRATED VALUE LONG-SHORT FUND
Notes to the Financial Statements (Unaudited)
October 31, 2023
1. ORGANIZATION
Managed Portfolio Series (the “Trust”) was organized as a Delaware statutory trust on January 27, 2011. The Trust is registered under the Investment Company Act of 1940, as amended (the “1940 Act”), as
an open-end management investment company. The Nuance Concentrated Value Long-Short Fund (the “Fund”) is a non-diversified series with its own investment objectives and policies within the Trust. The investment objective of the Fund is long-term
capital appreciation. The Fund is an investment company and accordingly follows the investment company accounting and reporting guidance of the Financial Accounting Standards Board (“FASB”) Accounting Standards Codification Topic 946 Financial
Services – Investment Companies. The Fund commenced operations on December 31, 2015. The Fund currently offers two classes, the Investor Class and the Institutional Class. Investor Class shares are subject to a 0.25% of average daily net assets
distribution and servicing fee and each class of shares is subject to a shareholder servicing fee of up to 0.15% of average daily net assets. Each class of shares has identical rights and privileges with respect to voting on matters affecting a
single share class. The Fund may issue an unlimited number of shares of beneficial interest, with no par value.
2. SIGNIFICANT ACCOUNTING POLICIES
The following is a summary of significant accounting policies consistently followed by the Fund in the preparation of its financial statements. These policies are in conformity with generally accepted
accounting principles in the United States of America (“GAAP”).
Security Valuation – All investments in securities are recorded at their estimated fair value, as described in Note 3.
Federal Income Taxes – The Fund complies with the requirements of Subchapter M of the Internal Revenue Code of 1986, as amended, necessary to qualify as a
regulated investment company and distributes substantially all net taxable investment income and net realized gains to shareholders in a manner which results in no tax cost to the Fund. Therefore, no federal income or excise tax provision is
required. As of and during the period ended October 31, 2023, the Fund did not have any tax positions that did not meet the “more-likely-than-not” threshold of being sustained by the applicable tax authority. The Fund recognizes interest and
penalties, if any, related to unrecognized tax benefits on uncertain tax positions as income tax expense in the Statement of Operations. During the period ended October 31, 2023, the Fund did not incur any interest or penalties.
Security Transactions, Income and Distributions – The Fund follows industry practice and records security transactions on the trade date. Realized gains and
losses on sales of securities are calculated on the basis of identified cost. Dividend income and expense is recorded on the ex-dividend date and interest income is recorded on an accrual basis. Withholding taxes on foreign dividends have been
provided for in accordance with the Fund’s understanding of the applicable country’s tax rules and regulations. Discounts and premiums on securities purchased are amortized over the expected life of the respective securities using the constant yield
method of calculation.
The Fund will make distributions, if any, of net investment income quarterly. The Fund will also distribute net realized capital gains, if any, annually. Distributions to shareholders are recorded on
the ex-dividend date. The treatment for financial reporting purposes of distributions made to shareholders during the year from net investment income or net realized capital gains may differ from their treatment for federal income tax purposes.
These differences are caused primarily by differences in the timing of the recognition of certain components of income, expense or realized capital gain for federal income tax purposes. Where such differences are permanent in nature, GAAP requires
that they be reclassified in the components of the net assets based on their ultimate characterization for federal income tax purposes. Any such reclassifications will have no effect on net assets, results of operations or net asset values per share
of the Fund.
16
NUANCE CONCENTRATED VALUE LONG-SHORT FUND
Notes to the Financial Statements (Unaudited) – Continued
October 31, 2023
Short Sales – A short sale is the sale by the Fund of a security which they do not own in anticipation of purchasing the same security in the future at a lower
price to close the short position. A short sale will be successful if the price of the shorted security decreases. However, if the underlying security goes up in price during the period in which the short position is outstanding, the Fund will
realize a loss. The risk on a short sale is unlimited because the Fund must buy the shorted security at the higher price to complete the transaction. Therefore, short sales may be subject to greater risks than investments in long positions. With a
long position, the maximum sustainable loss is limited to the amount paid for the security plus the transaction costs, whereas there is no maximum attainable price of the shorted security. The Fund would also incur increased transaction costs
associated with selling securities short. In addition, the Fund segregates liquid securities at least equal to the fair value of the securities sold short (not including the proceeds from the short sales). Cash deposits by the Fund are presented as
deposits at broker on the Statement of Assets and Liabilities and may exceed federally insured limits.
Use of Estimates – The preparation of financial statements in conformity with GAAP requires management to make estimates and assumptions that affect the reported
amounts of assets and liabilities and disclosure of contingent assets and liabilities at the date of the financial statements and the reported amounts of revenues and expenses during the reporting period. Actual results could differ from those
estimates.
Allocation of Income, Expenses and Gains/Losses – Income, expenses (other than those deemed attributable to a specific share class), and gains and losses of the
Fund are allocated daily to each class of shares based upon the ratio of net assets represented by each class as a percentage of the net assets of the Fund. Expenses deemed directly attributable to a class of shares are recorded by the specific
class. Most Fund expenses are allocated by class based on relative net assets. 12b-1 fees are expensed at 0.25% of average daily net assets of Investor Class shares. Shareholder service fees are expensed at up to 0.15% of average daily net assets
for each class of shares. Expenses associated with a specific fund in the Trust are charged to that fund. Common Trust expenses are typically allocated evenly between the funds of the Trust, or by other equitable means.
3. SECURITIES VALUATION
The Fund has adopted authoritative fair value accounting standards which establish an authoritative definition of fair value and set out a hierarchy for measuring fair value. These standards require
additional disclosures about the various inputs and valuation techniques used to develop the measurements of fair value, a discussion in changes in valuation techniques and related inputs during the period and expanded disclosure of valuation levels
for major security types. These inputs are summarized in the three broad levels listed below:
|
Level 1 –
|
Unadjusted quoted prices in active markets for identical assets or liabilities that the Fund has the ability to access.
|
|
Level 2 –
|
Observable inputs other than quoted prices included in Level 1 that are observable for the asset or liability, either directly or indirectly. These inputs may include quoted prices for the
identical instrument on an inactive market, prices for similar instruments, interest rates, prepayment speeds, credit risk, yield curves, default rates and similar data.
|
|
Level 3 –
|
Unobservable inputs for the asset or liability, to the extent relevant observable inputs are not available, representing the Fund’s own assumptions about the assumptions a market participant
would use in valuing the asset or liability, and would be based on the best information available.
|
17
NUANCE CONCENTRATED VALUE LONG-SHORT FUND
Notes to the Financial Statements (Unaudited) – Continued
October 31, 2023
Following is a description of the valuation techniques applied to the Fund’s major categories of assets and liabilities measured at fair value on a recurring basis. The Fund’s investments are carried
at fair value.
Equity Securities – Securities that are primarily traded on a national securities exchange are valued at the last sale price on the exchange on which they are
primarily traded on the day of valuation or, if there has been no sale on such day, at the mean between the bid and ask prices. Securities traded primarily in the Nasdaq Global Market System for which market quotations are readily available are
valued using the Nasdaq Official Closing Price (“NOCP”). If the NOCP is not available, such securities are valued at the last sale price on the day of valuation, or if there has been no sale on such day, at the mean between the bid and ask prices.
To the extent these securities are actively traded and valuation adjustments are not applied, they are categorized in Level 1 of the fair value hierarchy.
Short-Term Investments – Investments in other mutual funds, including money market funds are valued at their net asset value per share and are categorized in
Level 1 of the fair value hierarchy. To the extent these securities are actively traded and valuation adjustments are not applied, they are categorized in Level 1 of the fair value hierarchy.
The Board of Trustees (the “Board”) has adopted a pricing and valuation policy for use by the Fund and its Valuation Designee (as defined below) in calculating the Fund’s NAV. Pursuant to Rule 2a-5
under the 1940 Act, the Fund has designated Nuance Investments, LLC (the “Adviser”) as its “Valuation Designee” to perform all of the fair value determinations as well as to perform all of the responsibilities that may be performed by the Valuation
Designee in accordance with Rule 2a-5. The Valuation Designee is authorized to make all necessary determinations of the fair values of portfolio securities and other assets for which market quotations are not readily available or if it is deemed that
the prices obtained from brokers and dealers or independent pricing services are unreliable.
The inputs or methodology used for valuing securities are not an indication of the risk associated with investing in those securities. The following is a summary of the inputs used to value the Fund’s
securities as of October 31, 2023:
|
Level 1
|
Level 2
|
Level 3
|
Total
|
|||||||||||||
|
Common Stocks
|
$
|
145,254,656
|
$
|
—
|
$
|
—
|
$
|
145,254,656
|
||||||||
|
Short-Term Investment
|
184,133
|
—
|
—
|
184,133
|
||||||||||||
|
Total Investments in Securities
|
$
|
145,438,789
|
$
|
—
|
$
|
—
|
$
|
145,438,789
|
||||||||
|
Securities Sold Short
|
||||||||||||||||
|
Common Stocks
|
$
|
(120,810,758
|
)
|
$
|
—
|
$
|
—
|
$
|
(120,810,758
|
)
|
||||||
|
Total Securities Sold Short
|
$
|
(120,810,758
|
)
|
$
|
—
|
$
|
—
|
$
|
(120,810,758
|
)
|
||||||
Refer to the Schedule of Investments for further information on the classification of investments.
4. INVESTMENT ADVISORY FEE AND OTHER TRANSACTIONS WITH AFFILIATES
The Trust has an agreement with Nuance Investments, LLC (the “Adviser”) to furnish investment advisory services to the Fund. Pursuant to an Investment Advisory Agreement between the Trust and the
Adviser, the Adviser is entitled to receive, on a monthly basis, an annual advisory fee equal to 1.00% of the Fund’s average daily net assets.
The Fund’s Adviser has contractually agreed to waive a portion or all of its management fees and reimburse the Fund for its expenses to ensure that total annual operating expenses (excluding acquired
fund fees and expenses, dividends and interest on short positions, interest, taxes, brokerage commissions and extraordinary expenses) for the
18
NUANCE CONCENTRATED VALUE LONG-SHORT FUND
Notes to the Financial Statements (Unaudited) – Continued
October 31, 2023
Fund do not exceed 1.55% and 1.30% of average daily net assets of the Fund’s Investor Class and Institutional Class, respectively. Fees waived and expenses reimbursed by the Adviser may be recouped by
the Adviser for a period of thirty-six months following the month during which such waiver or reimbursement was made if such recoupment can be achieved without exceeding the expense limit in effect at the time the waiver and reimbursement occurred.
The Operating Expense Limitation Agreement is intended to be continual in nature and cannot be terminated within a year after the effective date of the Fund’s prospectus. After that date, the agreement may be terminated at any time upon 60 days’
written notice by the Trust’s Board or the Adviser, with the consent of the Board. For the period ended October 31, 2023, the Adviser recouped expenses of $323 relating to fees waived in prior years. Waived fees and reimbursed expenses subject to
potential recovery by year of expiration are as follows:
|
Expiration
|
Amount
|
|
|
November 2023 – April 2024
|
$60
|
|
|
May 2024 – April 2025
|
$35
|
U.S. Bancorp Fund Services, LLC, doing business as U.S. Bank Global Fund Services, (“Fund Services” or the “Administrator”), acts as the Fund’s Administrator, Transfer Agent, and Fund Accountant. U.S.
Bank N.A. (the “Custodian”) serves as the custodian to the Fund. The Custodian is an affiliate of the Administrator. The Administrator performs various administrative and accounting services for the Fund. The Administrator prepares various federal
and state regulatory filings, reports and returns for the Fund; prepares reports and materials to be supplied to the Trustees; monitors the activities of the Fund’s custodian; coordinates the payment of the Fund’s expenses and reviews the Fund’s
expense accruals. The officers of the Trust, including the Chief Compliance Officer are employees of the Administrator. As compensation for its services, the Administrator is entitled to a monthly fee at an annual rate based upon the average daily
net assets of the Fund, subject to annual minimums. Fees paid by the Fund for administration and accounting, transfer agency, custody and compliance services for the period ended October 31, 2023, are disclosed in the Statement of Operations.
5. DISTRIBUTION & SHAREHOLDER SERVICING FEES
The Fund has adopted a Distribution Plan pursuant to Rule 12b-1 (the “Plan”) in the Investor Class only. The Plan permits the Fund to pay for distribution and related expenses at an annual rate of
0.25% of the Investor Class average daily net assets. The expenses covered by the Plan may include the cost of preparing and distributing prospectuses and other sales material, advertising and public relations expenses, payments to financial
intermediaries and compensation of personnel involved in selling shares of the Fund. Payments made pursuant to the Plan will represent compensation for distribution and service activities, not reimbursements for specific expenses incurred. For the
period ended October 31, 2023, the Investor Class incurred expenses of $4,159 pursuant to the Plan.
The Fund has entered into a shareholder servicing agreement (the “Agreement”) where the Adviser acts as the shareholder agent, under which the Fund may pay servicing fees at an annual rate of up to
0.15% of the average daily net assets of each class. Payments, if any, to the Adviser under the Agreement may reimburse the Adviser for payments it makes to selected brokers, dealers and administrators which have entered into service agreements with
the Adviser for services provided to shareholders of the Fund. Payments may also be made directly to the intermediaries providing shareholder services. The services provided by such intermediaries are primarily designed to assist shareholders of the
Fund and include the furnishing of office space and equipment, telephone facilities, personnel and assistance to the Fund in servicing such shareholders. Services provided by such intermediaries also include the provision of support services to the
Fund and includes establishing and
19
NUANCE CONCENTRATED VALUE LONG-SHORT FUND
Notes to the Financial Statements (Unaudited) – Continued
October 31, 2023
maintaining shareholders’ accounts and record processing, purchase and redemption transactions, answering routine client inquiries regarding the Fund, and providing such other personal services to
shareholders as the Fund may reasonably request. For the period ended October 31, 2023, the Investor and Institutional Class incurred $2,495 and $107,847, respectively, of shareholder servicing fees under the Agreement.
6. CAPITAL SHARE TRANSACTIONS
Transactions in shares of the Fund were as follows:
|
Six Months Ended
|
Year Ended
|
|||||||
|
October 31, 2023
|
April 30, 2023
|
|||||||
|
Investor Class:
|
||||||||
|
Shares sold
|
20,649
|
35,621
|
||||||
|
Shares issued to holders in reinvestment of distributions
|
—
|
10,545
|
||||||
|
Shares redeemed
|
(22,786
|
)
|
(98,909
|
)
|
||||
|
Net decrease in Investor Class shares
|
(2,137
|
)
|
(52,743
|
)
|
||||
|
Institutional Class:
|
||||||||
|
Shares sold
|
1,026,020
|
6,221,242
|
||||||
|
Shares issued to holders in reinvestment of distributions
|
—
|
213,582
|
||||||
|
Shares redeemed
|
(1,452,764
|
)
|
(3,301,471
|
)
|
||||
|
Net increase (decrease) in Institutional Class shares
|
(426,744
|
)
|
3,133,353
|
|||||
|
Net increase (decrease) in shares outstanding
|
(428,881
|
)
|
3,080,610
|
|||||
7. INVESTMENT TRANSACTIONS
The aggregate purchases and sales, excluding short-term investments and securities sold short, by the Fund for the period ended October 31, 2023, were as follows:
|
Purchases
|
Sales
|
||
|
U.S. Government
|
$ —
|
$ —
|
|
|
Other
|
$97,818,812
|
$79,483,363
|
8. FEDERAL TAX INFORMATION
The aggregate gross unrealized appreciation and depreciation of securities and securities sold short held by the Fund and the total cost of securities for federal income tax purposes at April 30, 2023,
the Fund’s most recent fiscal year end, were as follows:
|
Federal Income
|
||||
|
Unrealized
|
Unrealized
|
Net
|
Tax Cost,
|
|
|
Aggregate Gross
|
Aggregate Gross
|
Unrealized
|
Net of Proceeds for
|
|
|
Appreciation
|
Depreciation
|
Depreciation
|
Securities Sold Short
|
|
|
$25,535,987
|
$(33,748,776)
|
$(8,212,789)
|
$30,311,454
|
20
NUANCE CONCENTRATED VALUE LONG-SHORT FUND
Notes to the Financial Statements (Unaudited) – Continued
October 31, 2023
The difference between book-basis and tax-basis unrealized appreciation is attributable primarily to the deferral of wash sale losses. At April 30, 2023, components of accumulated loss on a tax-basis
were as follows:
|
Undistributed
|
Other
|
Net
|
Total
|
|
|
Undistributed
|
Long-Term
|
Accumulated
|
Unrealized
|
Accumulated
|
|
Ordinary Income
|
Capital Gains
|
Losses
|
Depreciation
|
Loss
|
|
$328,165
|
$—
|
$(160,240)
|
$(8,212,789)
|
$(8,044,864)
|
As of April 30, 2023, the Fund did not have any capital loss carryovers. A regulated investment company may elect for any taxable year to treat any portion of any qualified late year loss as arising on
the first day of the next taxable year. Qualified late year losses are certain capital, and ordinary losses which occur during the portion of the Fund’s taxable year subsequent to October 31. For the taxable ended April 30, 2023, the Fund does not
plan to defer any qualified later year losses.
There were no distributions made by the Fund for the period ended October 31, 2023.
The tax character of distributions paid during the year ended April 30, 2023, were as follows:
|
Ordinary
|
Long-Term
|
||
|
Income*
|
Capital Gains
|
Total
|
|
|
$3,065,464
|
$839,682
|
$3,905,146
|
|
*
|
For federal income tax purposes, distributions of short-term capital gains are treated as ordinary income distributions.
|
The Fund designated as long-term capital gain dividend, pursuant to Internal Revenue Code Section 852(b)(3), the amount necessary to reduce the earnings and profits of the Fund related to net capital
gain to zero for the tax year ended April 30, 2023 and April 30, 2022.
10. CONTROL OWNERSHIP
The beneficial ownership, either directly or indirectly, of more than 25% of the voting securities of a fund creates a presumption of control of the fund, under Section 2(a)(9) of the Investment Company
Act of 1940. As of October 31, 2023, National Financial Services, LLC, for the benefit of its customers, owned 70.19% of the Fund.
11. OTHER REGULATORY MATTERS
In October 2022, the Securities and Exchange Commission (the “SEC”) adopted a final rule relating to Tailored Shareholder Reports for Mutual Funds and Exchange-Traded Funds; Fee Information in
Investment Company Advertisements. The rule and form amendments will, among other things, require the Fund to transmit concise and visually engaging shareholder reports that highlight key information. The amendments will require that funds tag
information in a structured data format and that certain more in-depth information be made available online and available for delivery free of charge to investors on request. The amendments became effective January 24, 2023. There is an 18-month
transition period after the effective date of the amendment.
21
NUANCE CONCENTRATED VALUE LONG-SHORT FUND
Liquidity Risk Management Discussion
Pursuant to Rule 22e-4 under the Investment Company Act of 1940, Managed Portfolio Series (the “Trust”), on behalf of the Nuance Concentrated Value Long-Short Fund (the “Fund”), has adopted and
implemented a written liquidity risk management program (the “Program”) that includes policies and procedures reasonably designed to comply with the requirements of Rule 22e-4, including: (i) assessment, management and periodic review of liquidity
risk; (ii) classification of portfolio holdings; (iii) establishment of a highly liquid investment minimum (“HLIM”), as applicable; (iv) limitation on illiquid investments; and (v) redemptions in-kind. The Trust’s Board of Trustees (the “Board”) has
approved the designation of Nuance Investments, LLC (“Nuance Investments”) as the administrator of the Program (the “Program Administrator”). Personnel of Nuance Investments conduct the day-to-day operation of the Program pursuant to policies and
procedures administered by the Program Administrator.
In accordance with Rule 22e-4, the Board reviewed a report prepared by the Program Administrator (the “Report”) regarding the operation of the Program and its adequacy and effectiveness of
implementation for the period January 1, 2022, through December 31, 2022 (the “Reporting Period”). No significant liquidity events impacting the Fund during the Reporting Period or material changes to the Program were noted in the Report.
Under the Program, Nuance Investments manages and periodically reviews the Fund’s liquidity risk, including consideration of applicable factors specified in Rule 22e-4 and the Program. Liquidity risk is
defined as the risk that the Fund could not meet shareholder redemption requests without significant dilution of remaining shareholders’ interests in the Fund. In general, this risk was managed during the Reporting Period by monitoring the degree of
liquidity of the Fund’s investments, limiting the amount of the Fund’s illiquid investments, and utilizing various risk management tools and facilities available to the Fund for meeting shareholder redemptions, among other means. In the Report,
Nuance Investments provided its assessment that, based on the information considered in its review, the Program remains reasonably designed to manage the Fund’s liquidity risk and the Fund’s investment strategy remains appropriate for an open-end
fund.
Pursuant to the Program, the Program Administrator oversaw the classification of each of the Fund’s portfolio investments as highly liquid, moderately liquid, less liquid or illiquid during the
Reporting Period, including in connection with recording investment classifications on Form N-PORT. Nuance Investments’ process of determining the degree of liquidity of the Fund’s investments is supported by one or more third-party liquidity
assessment vendors.
The Fund qualified as a “primarily highly liquid” fund as defined in the Program during the Reporting Period. Accordingly, the Fund was not required to establish a HLIM or comply with the related
Program provisions during the Reporting Period.
During the Reporting Period, the Fund’s investments were monitored for compliance with the 15% limitation on illiquid investments pursuant to the Program and in accordance with Rule 22e-4. The Fund did
not have redemptions in-kind during the Reporting Period.
The Report concluded: (i) the Program was implemented and operated effectively to achieve the goal of assessing and managing the Fund’s liquidity risk during the Reporting Period; and (ii) the Fund was
able to meet requests for redemption without significant dilution of remaining investors’ interests in the Fund during the Reporting Period.
22
NUANCE CONCENTRATED VALUE LONG-SHORT FUND
Additional Information (Unaudited)
October 31, 2023
AVAILABILITY OF FUND PORTFOLIO INFORMATION
The Fund files complete schedules of portfolio holdings with the U.S. Securities and Exchange Commission (the “SEC”) for the first and third quarters of each fiscal year on Part F of Form N-PORT. The
Fund’s Part F of Form N-PORT is available on the SEC’s website at www.sec.gov and may be reviewed and copied at the SEC’s Public Reference Room in Washington, D.C. Information on the operation of the Public Reference Room may be obtained by calling
1-800-732-0330. The Fund’s Part F of Form N-PORT may also be obtained by calling 1-855-682-6233.
AVAILABILITY OF PROXY VOTING INFORMATION
A description of the Fund’s Proxy Voting Policies and Procedures is available without charge, upon request, by calling 1-855-682-6233. Information regarding how the Fund voted proxies relating to
portfolio securities during the most recent 12 month period ended June 30, is available (1) without charge, upon request, by calling 1-888-621-9258, or (2) on the SEC’s website at www.sec.gov.
23
(This Page Intentionally Left Blank.)
NUANCE CONCENTRATED VALUE LONG-SHORT FUND
Privacy Notice (Unaudited)
The Fund collects only relevant information about you that the law allows or requires it to have in order to conduct its business and properly service you. The Fund collects financial and personal
information about you (“Personal Information”) directly (e.g., information on account applications and other forms, such as your name, address, and social security number, and information provided to access account information or conduct account
transactions online, such as password, account number, e-mail address, and alternate telephone number), and indirectly (e.g., information about your transactions with us, such as transaction amounts, account balance and account holdings).
The Fund does not disclose any non-public personal information about its shareholders or former shareholders other than for everyday business purposes such as to process a
transaction, service an account, respond to court orders and legal investigations or as otherwise permitted by law. Third parties that may receive this information include companies that provide transfer agency, technology and administrative
services to the Fund, as well as the Fund’s investment adviser who is an affiliate of the Fund. If you maintain a retirement/educational custodial account directly with the Fund, we may also disclose your Personal Information to the custodian for
that account for shareholder servicing purposes. The Fund limits access to your Personal Information provided to unaffiliated third parties to information necessary to carry out their assigned responsibilities to the Fund. All shareholder records
will be disposed of in accordance with applicable law. The Fund maintains physical, electronic and procedural safeguards to protect your Personal Information and requires its third party service providers with access to such information to treat
your Personal Information with the same high degree of confidentiality.
In the event that you hold shares of the Fund through a financial intermediary, including, but not limited to, a broker-dealer, credit union, bank or trust company, the privacy policy
of your financial intermediary governs how your non-public personal information is shared with unaffiliated third parties.
INVESTMENT ADVISER
Nuance Investments, LLC
4900 Main Street, Suite 220
Kansas City, MO 64112
DISTRIBUTOR
Quasar Distributors, LLC
111 East Kilbourn Avenue, Suite 2200
Milwaukee, WI 53202
CUSTODIAN
U.S. Bank, N.A.
1555 North Rivercenter Drive
Milwaukee, WI 53212
ADMINISTRATOR, FUND ACCOUNTANT
AND TRANSFER AGENT
U.S. Bancorp Fund Services, LLC
615 East Michigan Street
Milwaukee, WI 53202
INDEPENDENT REGISTERED PUBLIC ACCOUNTING FIRM
Cohen & Company, Ltd.
342 North Water Street, Suite 830
Milwaukee, WI 53202
LEGAL COUNSEL
Stradley Ronon Stevens & Young, LLP
2005 Market Street, Suite 2600
Philadelphia, PA 19103
This report must be accompanied or preceded by a prospectus.
The Fund’s Statement of Additional Information contains additional information about the
Fund’s trustees and is available without charge upon request by calling 1-855-682-6233.
NU-SEMI-ANNUAL-CVLS
|
(b)
|
Not Applicable.
|
Item 2. Code of Ethics.
Not applicable for semi-annual reports.
Item 3. Audit Committee Financial Expert.
Not applicable for semi-annual reports.
Item 4. Principal Accountant Fees and Services.
Not applicable for semi-annual reports.
Item 5. Audit Committee of Listed Registrants.
Not applicable to registrants who are not listed issuers (as defined in Rule 10A-3 under the Securities Exchange Act of 1934).
Item 6. Investments.
|
(a)
|
Schedule of Investments is included as part of the report to shareholders filed under Item 1 of this Form.
|
|
(b)
|
Not Applicable.
|
Item 7. Disclosure of Proxy Voting Policies and Procedures for Closed-End Management Investment Companies.
Not applicable to open-end investment companies.
Item 8. Portfolio Managers of Closed-End Management Investment Companies.
Not applicable to open-end investment companies.
Item 9. Purchases of Equity Securities by Closed‑End Management Investment Company and Affiliated Purchasers.
Not applicable to open-end investment companies.
Item 10. Submission of Matters to a Vote of Security Holders.
There have been no material changes to the procedures by which shareholders may recommend nominees to the registrant’s board of trustees.
Item 11. Controls and Procedures.
|
(a)
|
The Registrant’s [President/Chief Executive Officer] and [Treasurer/Chief Financial Officer] have reviewed the Registrant's disclosure controls and procedures (as defined in Rule 30a-3(c) under the Investment Company Act of 1940 (the
“Act”)) as of a date within 90 days of the filing of this report, as required by Rule 30a-3(b) under the Act and Rules 13a-15(b) or 15d‑15(b) under the Securities Exchange Act of 1934. Based on their review, such officers have concluded
that the disclosure controls and procedures are effective in ensuring that information required to be disclosed in this report is appropriately recorded, processed, summarized and reported and made known to them by others within the
Registrant and by the Registrant’s service provider.
|
|
(b)
|
There were no changes in the Registrant's internal control over financial reporting (as defined in Rule 30a-3(d) under the Act) that occurred during the period covered by this report that has materially affected, or is reasonably
likely to materially affect, the Registrant's internal control over financial reporting.
|
Item 12. Disclosure of Securities Lending Activities for Closed-End Management Investment Companies
Not applicable to open-end investment companies.
Item 13. Exhibits.
|
(a)
|
(1) Any code of ethics or amendment thereto, that is the subject of the disclosure required by Item 2, to the extent that the registrant intends to satisfy Item 2 requirements through filing an
exhibit. Not applicable for semi-annual reports.
|
(3) Any written solicitation to purchase securities under Rule 23c‑1 under the Act sent or given during the period covered by the report by or on behalf of the registrant to 10 or
more persons. Not applicable to open-end investment companies.
(4) Change in the registrant’s independent public accountant. There was no change in the registrant’s independent public accountant for the period covered by this report.
SIGNATURES
Pursuant to the requirements of the Securities Exchange Act of 1934 and the Investment Company Act of 1940, the registrant has duly caused this report to be signed on its behalf by the undersigned, thereunto duly
authorized.
(Registrant) Managed Portfolio Series
By (Signature and Title)* /s/Brian R. Wiedmeyer
Brian R. Wiedmeyer, President
Date December 22, 2023
Pursuant to the requirements of the Securities Exchange Act of 1934 and the Investment Company Act of 1940, this report has been signed below by the following persons on behalf of the registrant and in the capacities
and on the dates indicated.
By (Signature and Title)* /s/Brian R. Wiedmeyer
Brian R. Wiedmeyer, President
Date December 22, 2023
By (Signature and Title)* /s/Benjamin J. Eirich
Benjamin J. Eirich, Treasurer
Date December 22, 2023
* Print the name and title of each signing officer under his or her signature.