UNITED STATES
SECURITIES AND EXCHANGE COMMISSION
Washington, D.C. 20549
FORM N-CSR
CERTIFIED SHAREHOLDER REPORT OF REGISTERED
MANAGEMENT INVESTMENT COMPANIES
Investment Company Act file number 811-22519
First Trust Exchange-Traded AlphaDEX®
Fund II
(Exact name of registrant as specified in charter)
120 East Liberty Drive, Suite 400
Wheaton, IL 60187
(Address of principal executive offices) (Zip code)
W. Scott Jardine, Esq.
First Trust Portfolios L.P.
120 East Liberty Drive, Suite 400
Wheaton, IL 60187
(Name and address of agent for service)
Registrant's telephone number, including area
code: (630) 765-8000
Date of fiscal year end: December 31
Date of reporting period: December 31, 2022
Form N-CSR is to be used by management investment
companies to file reports with the Commission not later than 10 days after the transmission to stockholders of any report that is required
to be transmitted to stockholders under Rule 30e-1 under the Investment Company Act of 1940 (17 CFR 270.30e-1). The Commission may use
the information provided on Form N-CSR in its regulatory, disclosure review, inspection, and policymaking roles.
A registrant is required to disclose the information
specified by Form N-CSR, and the Commission will make this information public. A registrant is not required to respond to the collection
of information contained in Form N-CSR unless the Form displays a currently valid Office of Management and Budget (“OMB”)
control number. Please direct comments concerning the accuracy of the information collection burden estimate and any suggestions for reducing
the burden to Secretary, Securities and Exchange Commission, 100 F Street, NE, Washington, DC 20549-0609. The OMB has reviewed this collection
of information under the clearance requirements of 44 U.S.C. § 3507.
Item 1. Report to Stockholders.
| (a) | | The registrant's annual report transmitted to shareholders pursuant to Rule 30e-1 under the
Investment Company Act of 1940 is as follows: |
First Trust Exchange-Traded AlphaDEX® Fund II
First Trust Asia Pacific ex-Japan
AlphaDEX® Fund (FPA)
First Trust Europe AlphaDEX® Fund (FEP)
First Trust Latin America
AlphaDEX® Fund (FLN)
First Trust Brazil AlphaDEX® Fund (FBZ)
First Trust China AlphaDEX® Fund (FCA)
First Trust Japan AlphaDEX® Fund (FJP)
First Trust Developed Markets ex-US
AlphaDEX® Fund (FDT)
First Trust Emerging Markets
AlphaDEX® Fund (FEM)
First Trust Germany AlphaDEX® Fund (FGM)
First Trust United Kingdom
AlphaDEX® Fund (FKU)
First Trust India NIFTY 50 Equal
Weight ETF (NFTY)
First Trust Switzerland
AlphaDEX® Fund (FSZ)
First Trust Developed Markets ex-US
Small Cap AlphaDEX® Fund (FDTS)
First Trust Emerging Markets Small
Cap AlphaDEX® Fund (FEMS)
First Trust Eurozone AlphaDEX® ETF (FEUZ)
AlphaDEX® is a registered
trademark of First Trust Portfolios L.P.
First Trust Exchange-Traded
AlphaDEX® Fund II
Annual Report
December 31, 2022
Caution Regarding
Forward-Looking Statements
This report contains
certain forward-looking statements within the meaning of the Securities Act of 1933, as amended, and the Securities Exchange Act of 1934, as amended. Forward-looking statements include statements regarding the goals,
beliefs, plans or current expectations of First Trust Advisors L.P. (“First Trust” or the “Advisor”) and its representatives, taking into account the information currently available to them.
Forward-looking statements include all statements that do not relate solely to current or historical fact. For example, forward-looking statements include the use of words such as “anticipate,”
“estimate,” “intend,” “expect,” “believe,” “plan,” “may,” “should,” “would” or other words that convey uncertainty of
future events or outcomes.
Forward-looking
statements involve known and unknown risks, uncertainties and other factors that may cause the actual results, performance or achievements of any series of First Trust Exchange-Traded AlphaDEX® Fund II (the “Trust”) described in this report (each such series is referred to as a “Fund” and collectively, the
“Funds”) to be materially different from any future results, performance or achievements expressed or implied by the forward-looking statements. When evaluating the information included in this report, you
are cautioned not to place undue reliance on these forward-looking statements, which reflect the judgment of the Advisor and its representatives only as of the date hereof. We undertake no obligation to publicly
revise or update these forward-looking statements to reflect events and circumstances that arise after the date hereof.
Performance and Risk
Disclosure
There is no assurance
that any Fund described in this report will achieve its investment objective. Each Fund is subject to market risk, which is the possibility that the market values of securities owned by the Fund will decline and that
the value of the Fund’s shares may therefore be less than what you paid for them. Accordingly, you can lose money by investing in a Fund. See “Risk Considerations” in the Additional Information
section of this report for a discussion of certain other risks of investing in the Funds.
Performance data quoted
represents past performance, which is no guarantee of future results, and current performance may be lower or higher than the figures shown. For the most recent month-end performance figures, please visit www.ftportfolios.com or speak with your financial advisor. Investment returns, net asset value and share price will fluctuate and Fund shares, when sold, may be
worth more or less than their original cost.
The Advisor may also
periodically provide additional information on Fund performance on each Fund’s web page at www.ftportfolios.com.
How to Read This
Report
This report contains
information that may help you evaluate your investment. It includes details about each Fund and presents data and analysis that provide insight into each Fund’s performance and investment approach.
By reading the market
overview by Robert F. Carey, Chief Market Strategist of the Advisor, you may obtain an understanding of how the market environment affected the performance of each Fund. The statistical information that follows may
help you understand each Fund’s performance compared to that of relevant market benchmarks.
It is important to keep
in mind that the opinions expressed by personnel of the Advisor are just that: informed opinions. They should not be considered to be promises or advice. The opinions, like the statistics, cover the period through the
date on the cover of this report. The material risks of investing in each Fund are spelled out in the prospectus, the statement of additional information, and other Fund regulatory filings.
First Trust Exchange-Traded
AlphaDEX® Fund II
Annual Letter from the Chairman and
CEO
December 31, 2022
Dear Shareholders,
First Trust is pleased
to provide you with the annual report for the First Trust Exchange-Traded AlphaDEX® Fund II (the “Funds”), which contains detailed information about the Funds for the twelve months ended December 31, 2022.
The past year was filled
with challenges, several of which surely tested the resolve of even the most seasoned investors. The year began with the same headwinds that existed at the end of 2021, namely: stubbornly high inflation and rising
interest rates. When Russia invaded Ukraine in late February 2022, we added war, geopolitical tension, and potential food and energy shortages to the list. Considering the bleak backdrop at the start of the year, it
probably does not surprise you to read that with a total return of -18.11%, 2022 was the worst year for the S&P 500® Index since 2008. Even the bond market struggled to provide a haven to weary investors. The Bloomberg U.S. Aggregate Bond Index posted a total
return of -13.01% for the year; its worst total return in 45 years.
A common topic of
discussion in 2022 was whether central banks around the world had tightened monetary policy enough to quell inflation without causing excess damage to their economies. In the U.S., the Federal Reserve (the
“Fed”) described this as a “soft landing,” stating it was their intent to keep the labor market strong but to increase interest rates enough to bring inflation down to 2.0%. True to their word,
over the course of seven interest rate hikes, the Fed increased the Federal Funds target rate (upper bound) from 0.25% (where it stood in March 2022) to 4.50% as of December 2022. This is the highest the Federal Funds
rate has been since 2008.
The economic impact of
the Fed’s tighter monetary policy quickly became evident. Excluding the economic contraction from COVID-19 in 2020, the U.S. experienced its first decline in the gross domestic product (“GDP”) growth
rate since March 2014. Data from the U.S. Bureau of Economic Analysis indicates that annualized real GDP growth rates over the first three quarters of 2022 were -1.6%, -0.6%, and 3.2%, respectively. Thankfully,
inflation, as measured by the trailing 12-month rate on the Consumer Price Index (“CPI”), appears to be responding to the Fed’s tightening. After peaking at 9.1% in June 2022, the CPI rate fell to
6.5% at the end of December 2022. For comparative purposes, the CPI rate has averaged 2.5% over the past 30 years. Job creation has provided a respite from dreary economic data in recent months, but that could quickly
change. Nearly 125,000 employees have lost their jobs since June 2022 as more than 120 U.S. companies announced layoffs, according to Forbes. The jury is still out on whether the Fed will be able to pull off a soft landing, but the job market will tell the tale, in my opinion.
Since 1928, the S&P
500® Index has only fallen for two consecutive years on four occasions: The Great Depression, World War II, the oil crisis of the 1970s and the
burst of the dot-com bubble in the early 2000s. As we enter 2023, the U.S. economy has significant obstacles to overcome to avoid a recession and another negative year. We will be watching and reporting on what
transpires.
Thank you for giving
First Trust the opportunity to play a role in your financial future. We value our relationship with you and will report on the Funds again in six months.
Sincerely,
James A. Bowen
Chairman of the Board of Trustees
Chief Executive Officer of First Trust
Advisors L.P.
First Trust Exchange-Traded
AlphaDEX® Fund II
Annual Report
December 31, 2022
Robert
F. Carey, CFA
Senior Vice President
and Chief Market Strategist
First Trust Advisors
L.P.
Mr.
Carey is responsible for the overall management of research and analysis of the First Trust product line. Mr. Carey has more than 30 years of experience as an Equity and Fixed-Income Analyst and is a recipient of the
Chartered Financial Analyst (“CFA”) designation. He is a graduate of the University of Illinois at Champaign-Urbana with a B.S. in Physics. He is also a member of the Investment Analysts Society of Chicago
and the CFA Institute. Mr. Carey has appeared as a guest on such programs as Bloomberg TV, CNBC, and WBBM Radio, and has been quoted by several publications, including The Wall Street Journal, The Wall Street Reporter, Bloomberg News Service, and Registered Rep.
State of the
Economy/Investing
The Federal Reserve
(the “Fed”) remained steadfast in its battle with stubbornly high inflation in 2022. The Federal Funds target rate (upper bound), which stood at a mere 0.25% in January 2022 closed the year at 4.50%, its
highest level in over a decade. Fortunately, it appears that inflation, as measured by the Consumer Price Index (“CPI”) is responding to the Fed’s tightening. After peaking at 9.1% on a trailing
12-month basis in June 2022, the CPI fell to 6.5% in December 2022. While we were glad to see a decline in the CPI, it still stands significantly higher than the Fed’s stated goal of 2.0%, suggesting that
further action by the Fed may be warranted, in my opinion.
Inflation was not a
strictly domestic phenomenon in 2022. The headline inflation rates in the countries that make up the G-10 are still significantly higher than their target rates. In Sweden and the U.K., for example, headline inflation
stood at 12.3% and 10.7%, respectively, as of January 17, 2023. The central banks of both countries have a target inflation rate of 2.0%. The war between Russia and Ukraine, which began in late February 2022, still
rages on, pressuring global food and energy prices and causing geopolitical unrest across the globe. Furthermore, China’s COVID-19 lockdowns may have ended, but the country’s larger-than-expected waves of
COVID-19 infections pose a threat to the re-emergence of the Chinese economy.
The global growth
forecast from the International Monetary Fund (“IMF”) released in October 2022 projected a 2.7% real gross domestic product (“GDP”) growth rate for 2023, down from 3.2% in 2022. The IMF is
calling for a 1.0% growth rate for the U.S. GDP in 2023, down from its 1.6% estimate for 2022. As has been the case for many years, Emerging Market and Developing Economies are expected to grow faster than Advanced
Economies. Their 2023 growth rate estimates are 3.7% and 1.1%, respectively.
Investors continued to
funnel capital into exchange-traded funds (“ETFs”) and related exchange-traded products (“ETPs”) in 2022 despite the sharp sell-off in the markets. ETFGI, an independent research and
consultancy firm, reported that total assets invested in ETFs/ETPs listed in the U.S. stood at $6.51 trillion as of year-end, down 9.8% from $7.21 trillion at the end of 2021, according to its own release. Net inflows
to ETFs/ETPs listed in the U.S. stood at $607.23 billion in 2022, their second highest level on record, surpassed only by the $919.78 billion of inflows in 2021.
Foreign Stocks and
Bonds
The U.S. dollar
appreciated by 8.21% against a basket of major currencies in 2022, as measured by the U.S. Dollar Index (“DXY”), according to Bloomberg. The DXY Index closed 2022 at a reading of 103.52, significantly
above its 20-year average of 88.53. The stronger U.S. dollar likely had a negative influence on the returns of unhedged foreign securities held by U.S. investors.
The Bloomberg EM Hard
Currency Aggregate Index of emerging markets debt posted a total return of -16.60% (USD), while the Bloomberg Global Aggregate Index of higher quality debt declined 16.25% (USD). With respect to equities, the MSCI
Emerging Markets Index of stocks posted a total return of -20.09% (USD), while the MSCI World ex USA Index declined by 14.29% (USD) on a total return basis, according to Bloomberg.
Fund Performance
Overview (Unaudited)
First Trust Asia Pacific ex-Japan
AlphaDEX® Fund (FPA)
The First Trust Asia
Pacific ex-Japan AlphaDEX® Fund (the “Fund”) seeks investment results that correspond generally to the price and yield (before the Fund’s fees and
expenses) of an equity index called the Nasdaq AlphaDEX® Asia Pacific Ex-Japan Index (the “Index”). The Fund will normally invest at least 90% of its net assets (including investment
borrowings) in the common stocks, depositary receipts, real estate investment trusts and preferred shares that comprise the Index. The shares of the Fund are listed and trade on The Nasdaq Stock Market LLC (the
“Nasdaq”) under the ticker symbol “FPA.” The Fund commenced trading on April 19, 2011.
The Index employs the
AlphaDEX® stock selection methodology which uses fundamental growth and value factors to objectively select stocks from the Nasdaq DM Asia Pacific
Ex-Japan Index which may generate positive alpha relative to traditional passive indices. The Index is a modified equal-dollar weighted index where higher ranked stocks receive a higher weight within the Index.
| Performance
|
|
|
|
|
|
|
|
|
|
|
| Average Annual Total Returns
|
| Cumulative Total Returns
|
|
| 1 Year
Ended
12/31/22
| 5 Years
Ended
12/31/22
| 10 Years
Ended
12/31/22
| Inception
(4/18/11)
to 12/31/22
|
| 5 Years
Ended
12/31/22
| 10 Years
Ended
12/31/22
| Inception
(4/18/11)
to 12/31/22
|
| Fund Performance
|
|
|
|
|
|
|
|
|
| NAV
| -15.62%
| -3.25%
| 2.36%
| 1.65%
|
| -15.22%
| 26.30%
| 21.06%
|
| Market Price
| -15.27%
| -3.26%
| 2.17%
| 1.57%
|
| -15.28%
| 23.93%
| 20.01%
|
| Index Performance
|
|
|
|
|
|
|
|
|
| Nasdaq AlphaDEX® Asia Pacific Ex-Japan Index(1)
| -14.51%
| -2.24%
| N/A
| N/A
|
| -10.70%
| N/A
| N/A
|
| Nasdaq DM Asia Pacific Ex-Japan Index(1)
| -13.59%
| 0.83%
| N/A
| N/A
|
| 4.21%
| N/A
| N/A
|
| MSCI Pacific ex-Japan Index
| -5.94%
| 2.18%
| 3.81%
| 3.55%
|
| 11.38%
| 45.32%
| 50.50%
|
(See Notes to Fund
Performance Overview Page 34.)
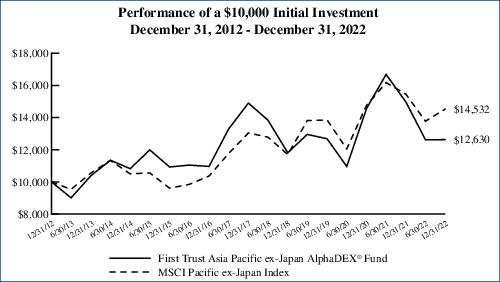
Performance Review
The Fund generated a net
asset value (“NAV”) return of -15.62% during the 12-month period covered by this report. During the same period, the MSCI Pacific ex-Japan Index (the “Benchmark”) generated a return
of -5.94%. During the same period, the Fund was most heavily weighted toward investments in Australia and South Korea, which had average weights of 33.4% and 41.7%, respectively. The largest negative contribution to
the Fund’s return was from South Korea, which contributed -10.4% during the period. This compares only to the -1.6% contribution from Australia, the Fund’s second largest holding. Investments in Singapore
generated a contribution of 0.8% to the Fund’s return, the greatest positive contribution of any country for the period. The Fund’s currency exposure caused -3.5% of underperformance during the
period.
| (1)
| Performance data is not available for all the periods shown in the table for the index because performance data does not exist for some of the entire periods.
|
Nasdaq® and Nasdaq AlphaDEX® Asia Pacific Ex-Japan Index are registered trademarks and service marks of Nasdaq, Inc. (together with its affiliates hereinafter referred to
as the “Corporations”) and are licensed for use by First Trust. AlphaDEX® is a registered trademark owned by First Trust that has been licensed to Nasdaq, Inc. for use in the name of the Index. The Fund has not been
passed on by the Corporations as to its legality or suitability. The Fund is not issued, endorsed, sold or promoted by the Corporations. THE CORPORATIONS MAKE NO WARRANTIES AND BEAR NO LIABILITY WITH RESPECT TO THE
FUND.
Fund Performance
Overview (Unaudited) (Continued)
First Trust Asia Pacific ex-Japan
AlphaDEX® Fund (FPA) (Continued)
| Sector Allocation
| % of Total
Long-Term
Investments
|
| Materials
| 23.3%
|
| Industrials
| 16.9
|
| Real Estate
| 13.5
|
| Energy
| 9.7
|
| Information Technology
| 8.3
|
| Consumer Discretionary
| 6.5
|
| Financials
| 5.3
|
| Consumer Staples
| 5.0
|
| Communication Services
| 4.9
|
| Health Care
| 3.7
|
| Utilities
| 2.9
|
| Total
| 100.0%
|
| Top Ten Holdings
| % of Total
Long-Term
Investments
|
| POSCO Holdings, Inc.
| 2.2%
|
| Samsung Electronics Co., Ltd.
| 1.7
|
| Sembcorp Industries Ltd.
| 1.7
|
| BlueScope Steel Ltd.
| 1.7
|
| South32 Ltd.
| 1.7
|
| S-Oil Corp.
| 1.7
|
| Hyundai Glovis Co., Ltd.
| 1.7
|
| New Hope Corp., Ltd.
| 1.7
|
| Whitehaven Coal Ltd.
| 1.6
|
| POSCO Chemical Co., Ltd.
| 1.6
|
| Total
| 17.3%
|
Performance figures assume reinvestment of all distributions and do not reflect the deduction of taxes that a shareholder would pay on Fund distributions or the redemption or sale of Fund shares. An index is a
statistical composite that tracks a specified financial market or sector. Unlike the Fund, the index does not actually hold a portfolio of securities and therefore does not incur the expenses incurred by the
Fund. These expenses negatively impact the performance of the Fund. The Fund’s past performance does not predict future performance.
Frequency
Distribution of Discounts and Premiums
Information
showing the number of days the market price of the Fund’s shares was greater (at a premium) and less (at a discount) than the Fund’s net asset value for the most recently completed year, and the most
recently completed calendar quarters since that year (or life of the Fund, if shorter), is available at https://www.ftportfolios.com/Retail/etf/home.aspx.
Fund Performance
Overview (Unaudited) (Continued)
First Trust Europe AlphaDEX® Fund (FEP)
The First Trust Europe
AlphaDEX® Fund (the “Fund”) seeks investment results that correspond generally to the price and yield (before the Fund’s fees and
expenses) of an equity index called the Nasdaq AlphaDEX® Europe Index (the “Index”). The Fund will normally invest at least 90% of its net assets (including investment borrowings) in the
common stocks, depositary receipts, real estate investment trusts and preferred shares that comprise the Index. The shares of the Fund are listed and trade on the Nasdaq under the ticker symbol “FEP.” The
Fund commenced trading on April 19, 2011.
The Index employs the
AlphaDEX® stock selection methodology which uses fundamental growth and value factors to objectively select stocks from the Nasdaq DM Europe Index which
may generate positive alpha relative to traditional passive indices. The Index is a modified equal-dollar weighted index where higher ranked stocks receive a higher weight within the Index.
| Performance
|
|
|
|
|
|
|
|
|
|
|
| Average Annual Total Returns
|
| Cumulative Total Returns
|
|
| 1 Year
Ended
12/31/22
| 5 Years
Ended
12/31/22
| 10 Years
Ended
12/31/22
| Inception
(4/18/11)
to 12/31/22
|
| 5 Years
Ended
12/31/22
| 10 Years
Ended
12/31/22
| Inception
(4/18/11)
to 12/31/22
|
| Fund Performance
|
|
|
|
|
|
|
|
|
| NAV
| -22.87%
| -0.93%
| 4.87%
| 3.41%
|
| -4.55%
| 60.83%
| 48.06%
|
| Market Price
| -22.73%
| -0.98%
| 4.63%
| 3.37%
|
| -4.82%
| 57.28%
| 47.34%
|
| Index Performance
|
|
|
|
|
|
|
|
|
| Nasdaq AlphaDEX® Europe Index(1)
| -22.82%
| -0.40%
| N/A
| N/A
|
| -2.00%
| N/A
| N/A
|
| Nasdaq DM Europe Index(1)
| -16.42%
| 1.51%
| N/A
| N/A
|
| 7.80%
| N/A
| N/A
|
| MSCI Europe Index
| -15.06%
| 1.87%
| 4.58%
| 3.93%
|
| 9.70%
| 56.53%
| 56.96%
|
(See Notes to Fund
Performance Overview Page 34.)
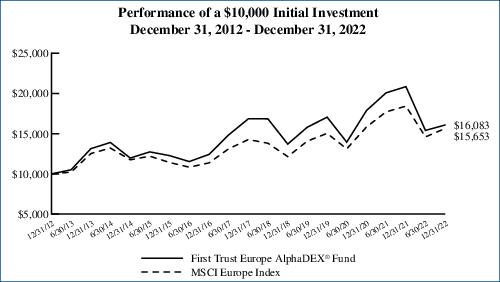
Performance Review
The Fund generated a NAV
return of -22.87% during the 12-month period covered by this report. During the same period, the MSCI Europe Index (the “Benchmark”) generated a return of -15.06%. During the same period, the Fund was most
heavily weighted toward investments in the United Kingdom, which had an average weight of 21.7%. The largest negative contribution to the Fund’s return was from Sweden, which contributed -5.5% during the period.
Investments in Ireland generated a contribution of 0.8% to the Fund’s return, the greatest positive contribution of any country. The Fund’s currency exposure caused -5.8% of underperformance during the
period.
| (1)
| Performance data is not available for all the periods shown in the table for the index because performance data does not exist for some of the entire periods.
|
Nasdaq® and Nasdaq AlphaDEX® Europe Index are registered trademarks and service marks of Nasdaq, Inc. (together with its affiliates hereinafter referred to as the
“Corporations”) and are licensed for use by First Trust. AlphaDEX® is a registered trademark owned by First Trust that has been licensed to Nasdaq, Inc. for use in the name of the Index. The Fund has not been
passed on by the Corporations as to its legality or suitability. The Fund is not issued, endorsed, sold or promoted by the Corporations. THE CORPORATIONS MAKE NO WARRANTIES AND BEAR NO LIABILITY WITH RESPECT TO THE
FUND.
Fund Performance
Overview (Unaudited) (Continued)
First Trust Europe AlphaDEX® Fund (FEP) (Continued)
| Sector Allocation
| % of Total
Long-Term
Investments
|
| Financials
| 17.8%
|
| Materials
| 15.8
|
| Industrials
| 14.3
|
| Consumer Discretionary
| 14.0
|
| Energy
| 9.2
|
| Real Estate
| 9.1
|
| Consumer Staples
| 6.8
|
| Utilities
| 5.8
|
| Communication Services
| 3.7
|
| Health Care
| 2.9
|
| Information Technology
| 0.6
|
| Total
| 100.0%
|
| Top Ten Holdings
| % of Total
Long-Term
Investments
|
| Covestro AG
| 0.9%
|
| Tenaris S.A.
| 0.9
|
| Eni S.p.A.
| 0.9
|
| 3i Group PLC
| 0.9
|
| TotalEnergies SE
| 0.9
|
| Commerzbank AG
| 0.9
|
| Hannover Rueck SE
| 0.9
|
| Beazley PLC
| 0.9
|
| Bayerische Motoren Werke AG
| 0.9
|
| ArcelorMittal S.A.
| 0.9
|
| Total
| 9.0%
|
Performance figures assume reinvestment of all distributions and do not reflect the deduction of taxes that a shareholder would pay on Fund distributions or the redemption or sale of Fund shares. An index is a
statistical composite that tracks a specified financial market or sector. Unlike the Fund, the index does not actually hold a portfolio of securities and therefore does not incur the expenses incurred by the Fund.
These expenses negatively impact the performance of the Fund. The Fund’s past performance does not predict future performance.
Frequency
Distribution of Discounts and Premiums
Information
showing the number of days the market price of the Fund’s shares was greater (at a premium) and less (at a discount) than the Fund’s net asset value for the most recently completed year, and the most
recently completed calendar quarters since that year (or life of the Fund, if shorter), is available at https://www.ftportfolios.com/Retail/etf/home.aspx.
Fund Performance
Overview (Unaudited) (Continued)
First Trust Latin America AlphaDEX® Fund (FLN)
The First Trust Latin
America AlphaDEX® Fund (the “Fund”) seeks investment results that correspond generally to the price and yield (before the Fund’s fees and
expenses) of an equity index called the Nasdaq AlphaDEX® Latin America Index (the “Index”). The Fund will normally invest at least 90% of its net assets (including investment borrowings)
in the common stocks, depositary receipts, real estate investment trusts and preferred shares that comprise the Index. The shares of the Fund are listed and trade on the Nasdaq under the ticker symbol
“FLN.” The Fund commenced trading on April 19, 2011.
The Index employs the
AlphaDEX® stock selection methodology which uses fundamental growth and value factors to objectively select stocks from the Nasdaq Latin America Index
which may generate positive alpha relative to traditional passive indices. The Index is a modified equal-dollar weighted index where higher ranked stocks receive a higher weight within the Index.
| Performance
|
|
|
|
|
|
|
|
|
|
|
| Average Annual Total Returns
|
| Cumulative Total Returns
|
|
| 1 Year
Ended
12/31/22
| 5 Years
Ended
12/31/22
| 10 Years
Ended
12/31/22
| Inception
(4/18/11)
to 12/31/22
|
| 5 Years
Ended
12/31/22
| 10 Years
Ended
12/31/22
| Inception
(4/18/11)
to 12/31/22
|
| Fund Performance
|
|
|
|
|
|
|
|
|
| NAV
| 2.17%
| -0.47%
| -1.03%
| -1.34%
|
| -2.34%
| -9.85%
| -14.58%
|
| Market Price
| 2.58%
| -0.48%
| -1.19%
| -1.35%
|
| -2.38%
| -11.31%
| -14.73%
|
| Index Performance
|
|
|
|
|
|
|
|
|
| Nasdaq AlphaDEX® Latin America Index(1)
| 3.05%
| 0.82%
| N/A
| N/A
|
| 4.18%
| N/A
| N/A
|
| Nasdaq Latin America Index(1)
| 5.49%
| -2.09%
| -3.04%
| N/A
|
| -10.00%
| -26.58%
| N/A
|
| MSCI EM Latin America Index
| 8.92%
| -1.08%
| -2.15%
| -2.77%
|
| -5.30%
| -19.53%
| -27.98%
|
(See Notes to Fund
Performance Overview Page 34.)
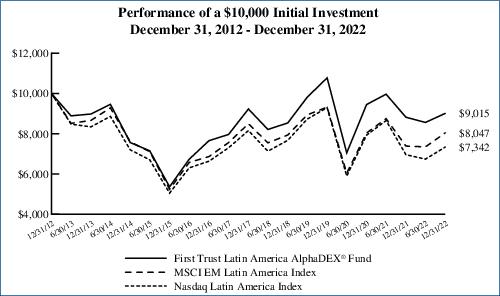
Performance Review
The Fund generated a NAV
return of 2.17% during the 12-month period covered by this report. During the same period, the MSCI EM Latin America Index (the “Benchmark”) generated a return of 8.92%. During the same period, the Fund
was most heavily weighted toward investments in Brazil, which had an average weight of 56.7%. Investments in Brazil generated a contribution of 3.3% to the Fund’s return, which was the greatest positive
contribution of any country. The largest negative contribution to the Fund’s return was from Colombia, which contributed -0.2% during the period. The Fund’s currency exposure caused 5.3% of overperformance
during the period.
| (1)
| Performance data is not available for all the periods shown in the table for the index because performance data does not exist for some of the entire periods.
|
Nasdaq® and Nasdaq AlphaDEX® Latin America Index are registered trademarks and service marks of Nasdaq, Inc. (together with its affiliates hereinafter referred to as the
“Corporations”) and are licensed for use by First Trust. AlphaDEX® is a registered trademark owned by First Trust that has been licensed to Nasdaq, Inc. for use in the name of the Index. The Fund has not been
passed on by the Corporations as to its legality or suitability. The Fund is not issued, endorsed, sold or promoted by the Corporations. THE CORPORATIONS MAKE NO WARRANTIES AND BEAR NO LIABILITY WITH RESPECT TO THE
FUND.
Fund Performance
Overview (Unaudited) (Continued)
First Trust Latin America AlphaDEX® Fund (FLN) (Continued)
| Sector Allocation
| % of Total
Long-Term
Investments
|
| Materials
| 25.5%
|
| Consumer Staples
| 16.1
|
| Financials
| 14.5
|
| Utilities
| 13.1
|
| Energy
| 10.6
|
| Industrials
| 6.8
|
| Consumer Discretionary
| 6.3
|
| Communication Services
| 3.8
|
| Health Care
| 2.6
|
| Real Estate
| 0.7
|
| Total
| 100.0%
|
| Top Ten Holdings
| % of Total
Long-Term
Investments
|
| Petro Rio S.A.
| 4.3%
|
| Gerdau S.A. (Preference Shares)
| 3.9
|
| Empresas Copec S.A.
| 3.6
|
| Cia Sud Americana de Vapores S.A.
| 3.6
|
| Equatorial Energia S.A.
| 3.2
|
| Vale S.A.
| 3.2
|
| Cia Paranaense de Energia, Class B (Preference Shares)
| 3.1
|
| Grupo Bimbo S.A.B. de C.V., Series A
| 3.0
|
| Cia Siderurgica Nacional S.A.
| 2.9
|
| Banco do Brasil S.A.
| 2.9
|
| Total
| 33.7%
|
Performance figures assume reinvestment of all distributions and do not reflect the deduction of taxes that a shareholder would pay on Fund distributions or the redemption or sale of Fund shares. An index is a
statistical composite that tracks a specified financial market or sector. Unlike the Fund, the indices do not actually hold a portfolio of securities and therefore do not incur the expenses incurred by the Fund. These
expenses negatively impact the performance of the Fund. The Fund’s past performance does not predict future performance.
Frequency
Distribution of Discounts and Premiums
Information
showing the number of days the market price of the Fund’s shares was greater (at a premium) and less (at a discount) than the Fund’s net asset value for the most recently completed year, and the most
recently completed calendar quarters since that year (or life of the Fund, if shorter), is available at https://www.ftportfolios.com/Retail/etf/home.aspx.
Fund Performance
Overview (Unaudited) (Continued)
First Trust Brazil AlphaDEX® Fund (FBZ)
The First Trust Brazil
AlphaDEX® Fund (the “Fund”) seeks investment results that correspond generally to the price and yield (before the Fund’s fees and
expenses) of an equity index called the Nasdaq AlphaDEX® Brazil Index (the “Index”). The Fund will normally invest at least 90% of its net assets (including investment borrowings) in the
common stocks, depositary receipts, real estate investment trusts and preferred shares that comprise the Index. The shares of the Fund are listed and trade on the Nasdaq under the ticker symbol “FBZ.” The
Fund commenced trading on April 19, 2011.
The Index employs the
AlphaDEX® stock selection methodology which uses fundamental growth and value factors to objectively select stocks from the Nasdaq Brazil Index which may
generate positive alpha relative to traditional passive indices. The Index is a modified equal-dollar weighted index where higher ranked stocks receive a higher weight within the Index.
| Performance
|
|
|
|
|
|
|
|
|
|
|
| Average Annual Total Returns
|
| Cumulative Total Returns
|
|
| 1 Year
Ended
12/31/22
| 5 Years
Ended
12/31/22
| 10 Years
Ended
12/31/22
| Inception
(4/18/11)
to 12/31/22
|
| 5 Years
Ended
12/31/22
| 10 Years
Ended
12/31/22
| Inception
(4/18/11)
to 12/31/22
|
| Fund Performance
|
|
|
|
|
|
|
|
|
| NAV
| 1.45%
| 0.71%
| -1.43%
| -2.77%
|
| 3.62%
| -13.43%
| -28.04%
|
| Market Price
| 1.27%
| 0.66%
| -1.58%
| -2.80%
|
| 3.37%
| -14.69%
| -28.24%
|
| Index Performance
|
|
|
|
|
|
|
|
|
| Nasdaq AlphaDEX® Brazil Index(1)
| 2.31%
| 2.59%
| N/A
| N/A
|
| 13.67%
| N/A
| N/A
|
| Nasdaq Brazil Index(1)
| 7.14%
| -2.27%
| -2.63%
| N/A
|
| -10.86%
| -23.38%
| N/A
|
| MSCI Brazil Index
| 14.15%
| -0.82%
| -1.75%
| -3.47%
|
| -4.03%
| -16.22%
| -33.89%
|
(See Notes to Fund
Performance Overview Page 34.)
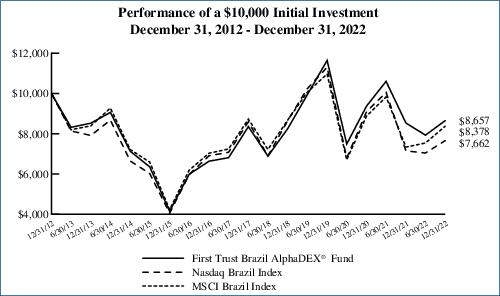
Performance Review
The Fund generated a NAV
return of 1.45% during the 12-month period covered by this report. During the same period, the MSCI Brazil Index (the “Benchmark”) generated a return of 14.15%. The Materials sector received the greatest
allocation of any sector in the Fund with an allocation of 25.2%. Investments in this sector contributed -2.1% to the Fund’s return, which was the greatest drag of any sector in the Fund. The greatest positive
contribution came from investments in the Energy sector with a contribution of 4.3% to the Fund’s return. The total currency effect to the Fund during the period covered by this report was 8.7%.
| (1)
| Performance data is not available for all the periods shown in the table for the index because performance data does not exist for some of the entire periods.
|
Nasdaq® and Nasdaq AlphaDEX® Brazil Index are registered trademarks and service marks of Nasdaq, Inc. (together with its affiliates hereinafter referred to as the
“Corporations”) and are licensed for use by First Trust. AlphaDEX® is a registered trademark owned by First Trust that has been licensed to Nasdaq, Inc. for use in the name of the Index. The Fund has not been
passed on by the Corporations as to its legality or suitability. The Fund is not issued, endorsed, sold or promoted by the Corporations. THE CORPORATIONS MAKE NO WARRANTIES AND BEAR NO LIABILITY WITH RESPECT TO THE
FUND.
Fund Performance
Overview (Unaudited) (Continued)
First Trust Brazil AlphaDEX® Fund (FBZ) (Continued)
| Sector Allocation
| % of Total
Long-Term
Investments
|
| Materials
| 25.7%
|
| Utilities
| 22.8
|
| Financials
| 13.4
|
| Consumer Staples
| 11.5
|
| Energy
| 11.0
|
| Health Care
| 3.7
|
| Information Technology
| 3.5
|
| Communication Services
| 3.4
|
| Industrials
| 2.9
|
| Consumer Discretionary
| 1.5
|
| Real Estate
| 0.6
|
| Total
| 100.0%
|
| Top Ten Holdings
| % of Total
Long-Term
Investments
|
| Petro Rio S.A.
| 5.3%
|
| Gerdau S.A. (Preference Shares)
| 4.1
|
| Hypera S.A.
| 3.7
|
| Bradespar S.A. (Preference Shares)
| 3.7
|
| Cia Paranaense de Energia, Class B (Preference Shares)
| 3.6
|
| Cielo S.A.
| 3.5
|
| Metalurgica Gerdau S.A. (Preference Shares)
| 3.4
|
| Banco do Brasil S.A.
| 3.3
|
| Cia Siderurgica Nacional S.A.
| 2.9
|
| Vale S.A.
| 2.9
|
| Total
| 36.4%
|
Performance figures assume reinvestment of all distributions and do not reflect the deduction of taxes that a shareholder would pay on Fund distributions or the redemption or sale of Fund shares. An index is a
statistical composite that tracks a specified financial market or sector. Unlike the Fund, the indices do not actually hold a portfolio of securities and therefore do not incur the expenses incurred by the Fund.
These expenses negatively impact the performance of the Fund. The Fund’s past performance does not predict future performance.
Frequency
Distribution of Discounts and Premiums
Information
showing the number of days the market price of the Fund’s shares was greater (at a premium) and less (at a discount) than the Fund’s net asset value for the most recently completed year, and the most
recently completed calendar quarters since that year (or life of the Fund, if shorter), is available at https://www.ftportfolios.com/Retail/etf/home.aspx.
Fund Performance
Overview (Unaudited) (Continued)
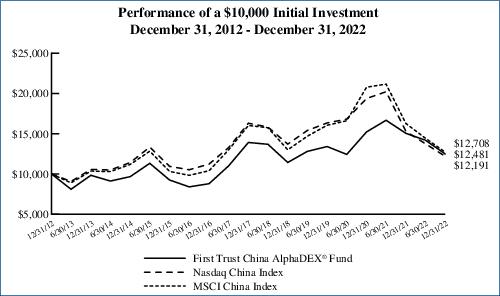
First Trust China AlphaDEX® Fund (FCA)
The First Trust China
AlphaDEX® Fund (the “Fund”) seeks investment results that correspond generally to the price and yield (before the Fund’s fees and
expenses) of an equity index called the Nasdaq AlphaDEX® China Index (the “Index”). The Fund will normally invest at least 90% of its net assets (including investment borrowings) in the
common stocks, depositary receipts, real estate investment trusts and preferred shares that comprise the Index. The shares of the Fund are listed and trade on the Nasdaq under the ticker symbol “FCA.” The
Fund commenced trading on April 19, 2011.
The Index employs the
AlphaDEX® stock selection methodology which uses fundamental growth and value factors to objectively select stocks from the Nasdaq China Index which may
generate positive alpha relative to traditional passive indices. The Index is a modified equal-dollar weighted index where higher ranked stocks receive a higher weight within the Index.
| Performance
|
|
|
|
|
|
|
|
|
|
|
| Average Annual Total Returns
|
| Cumulative Total Returns
|
|
| 1 Year
Ended
12/31/22
| 5 Years
Ended
12/31/22
| 10 Years
Ended
12/31/22
| Inception
(4/18/11)
to 12/31/22
|
| 5 Years
Ended
12/31/22
| 10 Years
Ended
12/31/22
| Inception
(4/18/11)
to 12/31/22
|
| Fund Performance
|
|
|
|
|
|
|
|
|
| NAV
| -17.10%
| -2.16%
| 2.24%
| 0.58%
|
| -10.33%
| 24.81%
| 6.96%
|
| Market Price
| -17.58%
| -2.22%
| 1.99%
| 0.48%
|
| -10.62%
| 21.73%
| 5.73%
|
| Index Performance
|
|
|
|
|
|
|
|
|
| Nasdaq AlphaDEX® China Index(1)
| -16.04%
| -1.28%
| N/A
| N/A
|
| -6.22%
| N/A
| N/A
|
| Nasdaq China Index(1)
| -20.26%
| -5.66%
| 2.00%
| N/A
|
| -25.25%
| 21.91%
| N/A
|
| MSCI China Index
| -21.93%
| -4.54%
| 2.43%
| 1.63%
|
| -20.74%
| 27.08%
| 20.83%
|
(See Notes to Fund
Performance Overview Page 34.)
Performance Review
The Fund generated a NAV
return of -17.10% during the 12-month period covered by this report. During the same period, the MSCI China Index (the “Benchmark”) generated a return of -21.93%. During the same period, the Materials
sector carried more weight, at 18.1%, than any other sector in the Fund. The Materials sector also had the greatest impact on the Fund’s return, with a -3.8% contribution to the Fund’s return. The most
positive contribution to the Fund’s return came from investments in the Energy sector, which received an 8.5% weight and contributed 1.9% to the Fund’s return. The Fund’s currency exposure was
negligible with less than a 0.1% impact on performance for the period.
| (1)
| Performance data is not available for all the periods shown in the table for the index because performance data does not exist for some of the entire periods.
|
Nasdaq® and Nasdaq AlphaDEX® China Index are registered trademarks and service marks of Nasdaq, Inc. (together with its affiliates hereinafter referred to as the
“Corporations”) and are licensed for use by First Trust. AlphaDEX® is a registered trademark owned by First Trust that has been licensed to Nasdaq, Inc. for use in the name of the Index. The Fund has not been
passed on by the Corporations as to its legality or suitability. The Fund is not issued, endorsed, sold or promoted by the Corporations. THE CORPORATIONS MAKE NO WARRANTIES AND BEAR NO LIABILITY WITH RESPECT TO THE
FUND.
Fund Performance
Overview (Unaudited) (Continued)
First Trust China AlphaDEX® Fund (FCA) (Continued)
| Sector Allocation
| % of Total
Long-Term
Investments
|
| Industrials
| 19.6%
|
| Materials
| 19.5
|
| Real Estate
| 14.8
|
| Energy
| 9.9
|
| Information Technology
| 9.7
|
| Utilities
| 7.5
|
| Consumer Discretionary
| 6.9
|
| Health Care
| 6.3
|
| Financials
| 4.3
|
| Consumer Staples
| 0.8
|
| Communication Services
| 0.7
|
| Total
| 100.0%
|
| Top Ten Holdings
| % of Total
Long-Term
Investments
|
| China Resources Pharmaceutical Group Ltd.
| 4.7%
|
| China Conch Venture Holdings Ltd.
| 3.9
|
| China Coal Energy Co., Ltd., Class H
| 3.8
|
| Yuexiu Property Co., Ltd.
| 3.7
|
| Kunlun Energy Co., Ltd.
| 3.4
|
| C&D International Investment Group Ltd.
| 3.4
|
| Kingboard Holdings Ltd.
| 3.3
|
| Inner Mongolia Yitai Coal Co., Ltd., Class B
| 3.2
|
| Yankuang Energy Group Co., Ltd., Class H
| 3.0
|
| Inner Mongolia ERDOS Resources Co., Ltd., Class B
| 2.9
|
| Total
| 35.3%
|
Performance figures assume reinvestment of all distributions and do not reflect the deduction of taxes that a shareholder would pay on Fund distributions or the redemption or sale of Fund shares. An index is a
statistical composite that tracks a specified financial market or sector. Unlike the Fund, the indices do not actually hold a portfolio of securities and therefore do not incur the expenses incurred by the Fund.
These expenses negatively impact the performance of the Fund. The Fund’s past performance does not predict future performance.
Frequency
Distribution of Discounts and Premiums
Information
showing the number of days the market price of the Fund’s shares was greater (at a premium) and less (at a discount) than the Fund’s net asset value for the most recently completed year, and the most
recently completed calendar quarters since that year (or life of the Fund, if shorter), is available at https://www.ftportfolios.com/Retail/etf/home.aspx.
Fund Performance
Overview (Unaudited) (Continued)
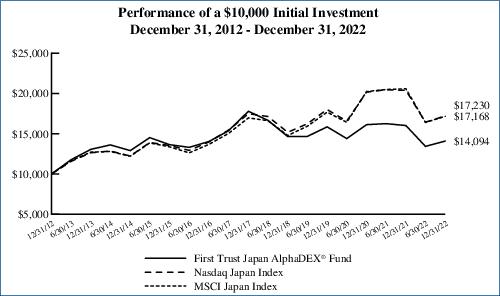
First Trust Japan AlphaDEX® Fund (FJP)
The First Trust Japan
AlphaDEX® Fund (the “Fund”) seeks investment results that correspond generally to the price and yield (before the Fund’s fees and
expenses) of an equity index called the Nasdaq AlphaDEX® Japan Index (the “Index”). The Fund will normally invest at least 90% of its net assets (including investment borrowings) in the
common stocks, depositary receipts, real estate investment trusts and preferred shares that comprise the Index. The shares of the Fund are listed and trade on the Nasdaq under the ticker symbol “FJP.” The
Fund commenced trading on April 19, 2011.
The Index employs the
AlphaDEX® stock selection methodology which uses fundamental growth and value factors to objectively select stocks from the Nasdaq Japan Index which may
generate positive alpha relative to traditional passive indices. The Index is a modified equal-dollar weighted index where higher ranked stocks receive a higher weight within the Index.
| Performance
|
|
|
|
|
|
|
|
|
|
|
| Average Annual Total Returns
|
| Cumulative Total Returns
|
|
| 1 Year
Ended
12/31/22
| 5 Years
Ended
12/31/22
| 10 Years
Ended
12/31/22
| Inception
(4/18/11)
to 12/31/22
|
| 5 Years
Ended
12/31/22
| 10 Years
Ended
12/31/22
| Inception
(4/18/11)
to 12/31/22
|
| Fund Performance
|
|
|
|
|
|
|
|
|
| NAV
| -12.04%
| -4.56%
| 3.49%
| 2.14%
|
| -20.79%
| 40.94%
| 28.18%
|
| Market Price
| -13.15%
| -4.80%
| 3.29%
| 2.03%
|
| -21.81%
| 38.28%
| 26.51%
|
| Index Performance
|
|
|
|
|
|
|
|
|
| Nasdaq AlphaDEX® Japan Index(1)
| -12.24%
| -4.09%
| N/A
| N/A
|
| -18.84%
| N/A
| N/A
|
| Nasdaq Japan Index(1)
| -15.52%
| -0.31%
| 5.59%
| N/A
|
| -1.55%
| 72.30%
| N/A
|
| MSCI Japan Index
| -16.65%
| 0.23%
| 5.55%
| 4.76%
|
| 1.14%
| 71.68%
| 72.32%
|
(See Notes to Fund
Performance Overview Page 34.)
Performance Review
The Fund generated a NAV
return of -12.04% during the 12-month period covered by this report. During the same period, the MSCI Japan Index (the “Benchmark”) generated a return of -16.65%. During the same period, the Industrials
sector received the greatest allocation, with an average weight of 31.6%. The greatest drag on the Fund’s performance was the Information Technology sector, with an average weight of 8.7% and a -4.3%
contribution to the Fund’s return. During the period, no sectors contributed positively to the Fund’s return. The total currency effect to the Fund during the period covered by this report was -12.2%.
| (1)
| Performance data is not available for all the periods shown in the table for the index because performance data does not exist for some of the entire periods.
|
Nasdaq® and Nasdaq AlphaDEX® Japan Index are registered trademarks and service marks of Nasdaq, Inc. (together with its affiliates hereinafter referred to as the
“Corporations”) and are licensed for use by First Trust. AlphaDEX® is a registered trademark owned by First Trust that has been licensed to Nasdaq, Inc. for use in the name of the Index. The Fund has not been
passed on by the Corporations as to its legality or suitability. The Fund is not issued, endorsed, sold or promoted by the Corporations. THE CORPORATIONS MAKE NO WARRANTIES AND BEAR NO LIABILITY WITH RESPECT TO THE
FUND.
Fund Performance
Overview (Unaudited) (Continued)
First Trust Japan AlphaDEX® Fund (FJP) (Continued)
| Sector Allocation
| % of Total
Long-Term
Investments
|
| Industrials
| 32.1%
|
| Consumer Discretionary
| 18.9
|
| Materials
| 15.4
|
| Financials
| 9.8
|
| Information Technology
| 5.5
|
| Utilities
| 5.3
|
| Energy
| 4.6
|
| Consumer Staples
| 3.3
|
| Real Estate
| 2.3
|
| Health Care
| 2.2
|
| Communication Services
| 0.6
|
| Total
| 100.0%
|
| Top Ten Holdings
| % of Total
Long-Term
Investments
|
| Nippon Steel Corp.
| 2.0%
|
| Mitsubishi Motors Corp.
| 1.9
|
| Mitsubishi Heavy Industries Ltd.
| 1.9
|
| Sumitomo Metal Mining Co., Ltd.
| 1.8
|
| JFE Holdings, Inc.
| 1.8
|
| Mitsui OSK Lines Ltd.
| 1.8
|
| Sojitz Corp.
| 1.8
|
| Mitsui & Co., Ltd.
| 1.7
|
| Mitsui Chemicals, Inc.
| 1.7
|
| Kawasaki Kisen Kaisha Ltd.
| 1.7
|
| Total
| 18.1%
|
Performance figures assume reinvestment of all distributions and do not reflect the deduction of taxes that a shareholder would pay on Fund distributions or the redemption or sale of Fund shares. An index is a
statistical composite that tracks a specified financial market or sector. Unlike the Fund, the indices do not actually hold a portfolio of securities and therefore do not incur the expenses incurred by the Fund.
These expenses negatively impact the performance of the Fund. The Fund’s past performance does not predict future performance.
Frequency
Distribution of Discounts and Premiums
Information
showing the number of days the market price of the Fund’s shares was greater (at a premium) and less (at a discount) than the Fund’s net asset value for the most recently completed year, and the most
recently completed calendar quarters since that year (or life of the Fund, if shorter), is available at https://www.ftportfolios.com/Retail/etf/home.aspx.
Fund Performance
Overview (Unaudited) (Continued)
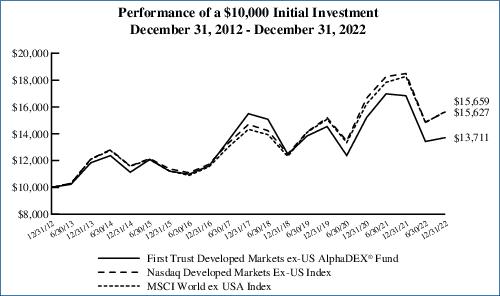
First Trust Developed Markets ex-US
AlphaDEX® Fund (FDT)
The First Trust Developed
Markets ex-US AlphaDEX® Fund (the “Fund”) seeks investment results that correspond generally to the price and yield (before the Fund’s fees and
expenses) of an equity index called the Nasdaq AlphaDEX® Developed Markets Ex-US Index (the “Index”). The Fund will normally invest at least 90% of its net assets (including investment
borrowings) in the common stocks, depositary receipts, real estate investment trusts and preferred shares that comprise the Index. The shares of the Fund are listed and trade on the Nasdaq under the ticker symbol
“FDT.” The Fund commenced trading on April 19, 2011.
The Index employs the
AlphaDEX® stock selection methodology which uses fundamental growth and value factors to objectively select stocks from the Nasdaq Developed Markets
Ex-US Index which may generate positive alpha relative to traditional passive indices. The Index is a modified equal-dollar weighted index where higher ranked stocks receive a higher weight within the Index.
| Performance
|
|
|
|
|
|
|
|
|
|
|
| Average Annual Total Returns
|
| Cumulative Total Returns
|
|
| 1 Year
Ended
12/31/22
| 5 Years
Ended
12/31/22
| 10 Years
Ended
12/31/22
| Inception
(4/18/11)
to 12/31/22
|
| 5 Years
Ended
12/31/22
| 10 Years
Ended
12/31/22
| Inception
(4/18/11)
to 12/31/22
|
| Fund Performance
|
|
|
|
|
|
|
|
|
| NAV
| -18.57%
| -2.42%
| 3.21%
| 2.05%
|
| -11.53%
| 37.11%
| 26.83%
|
| Market Price
| -18.86%
| -2.52%
| 3.10%
| 2.02%
|
| -11.99%
| 35.77%
| 26.36%
|
| Index Performance
|
|
|
|
|
|
|
|
|
| Nasdaq AlphaDEX® Developed Markets Ex-US Index(1)
| -18.23%
| -1.71%
| N/A
| N/A
|
| -8.24%
| N/A
| N/A
|
| Nasdaq Developed Markets Ex-US Index(1)
| -15.51%
| 1.23%
| 4.56%
| N/A
|
| 6.32%
| 56.27%
| N/A
|
| MSCI World ex USA Index
| -14.29%
| 1.79%
| 4.59%
| 3.86%
|
| 9.29%
| 56.59%
| 55.77%
|
(See Notes to Fund
Performance Overview Page 34.)
Performance Review
The Fund generated a NAV
return of -18.57% during the 12-month period covered by this report. During the same period, the MSCI World ex USA Index (the “Benchmark”) generated a return of -14.29%. The two largest allocations by
country during the period were Japan, with an allocation of 23.5%, and Canada which received a 14.3% allocation. However, the largest contribution toward the Fund’s return came from South Korea, which was
weighted at 9.5% and contributed -3.0% to the Fund’s overall return. Portfolio returns were widely distributed as the Fund allocated to over 30 countries during the period. The largest positive contribution to
the Fund’s return came from investments in Ireland, which contributed 0.4% to the Fund’s return. The total currency effect to the Fund during the period covered by this report was -6.7%.
| (1)
| Performance data is not available for all the periods shown in the table for the index because performance data does not exist for some of the entire periods.
|
Nasdaq® and Nasdaq AlphaDEX® Developed Markets Ex-US Index are registered trademarks and service marks of Nasdaq, Inc. (together with its affiliates hereinafter referred to
as the “Corporations”) and are licensed for use by First Trust. AlphaDEX® is a registered trademark owned by First Trust that has been licensed to Nasdaq, Inc. for use in the name of the Index. The Fund has not been
passed on by the Corporations as to its legality or suitability. The Fund is not issued, endorsed, sold or promoted by the Corporations. THE CORPORATIONS MAKE NO WARRANTIES AND BEAR NO LIABILITY WITH RESPECT TO THE
FUND.
Fund Performance
Overview (Unaudited) (Continued)
First Trust Developed Markets ex-US
AlphaDEX® Fund (FDT) (Continued)
| Sector Allocation
| % of Total
Long-Term
Investments
|
| Materials
| 19.8%
|
| Industrials
| 18.6
|
| Energy
| 13.5
|
| Consumer Discretionary
| 12.0
|
| Real Estate
| 10.0
|
| Financials
| 9.2
|
| Consumer Staples
| 5.7
|
| Utilities
| 4.5
|
| Information Technology
| 3.4
|
| Communication Services
| 2.3
|
| Health Care
| 1.0
|
| Total
| 100.0%
|
| Top Ten Holdings
| % of Total
Long-Term
Investments
|
| Kawasaki Kisen Kaisha Ltd.
| 0.7%
|
| POSCO Holdings, Inc.
| 0.7
|
| Mitsui OSK Lines Ltd.
| 0.7
|
| Nippon Yusen KK
| 0.7
|
| Mitsui & Co., Ltd.
| 0.7
|
| 3i Group PLC
| 0.6
|
| Marubeni Corp.
| 0.6
|
| Beazley PLC
| 0.6
|
| Sojitz Corp.
| 0.6
|
| Bayerische Motoren Werke AG
| 0.6
|
| Total
| 6.5%
|
Performance figures assume reinvestment of all distributions and do not reflect the deduction of taxes that a shareholder would pay on Fund distributions or the redemption or sale of Fund shares. An index is a
statistical composite that tracks a specified financial market or sector. Unlike the Fund, the indices do not actually hold a portfolio of securities and therefore do not incur the expenses incurred by the Fund.
These expenses negatively impact the performance of the Fund. The Fund’s past performance does not predict future performance.
Frequency
Distribution of Discounts and Premiums
Information
showing the number of days the market price of the Fund’s shares was greater (at a premium) and less (at a discount) than the Fund’s net asset value for the most recently completed year, and the most
recently completed calendar quarters since that year (or life of the Fund, if shorter), is available at https://www.ftportfolios.com/Retail/etf/home.aspx.
Fund Performance
Overview (Unaudited) (Continued)
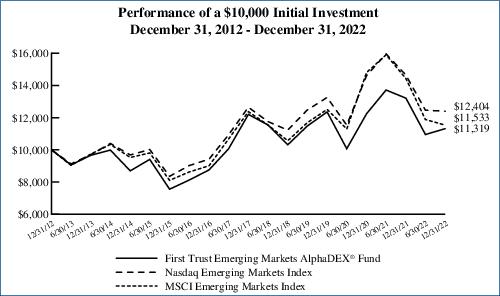
First Trust Emerging Markets AlphaDEX® Fund (FEM)
The First Trust Emerging
Markets AlphaDEX® Fund (the “Fund”) seeks investment results that correspond generally to the price and yield (before the Fund’s fees and
expenses) of an equity index called the Nasdaq AlphaDEX® Emerging Markets Index (the “Index”). The Fund will normally invest at least 90% of its net assets (including investment
borrowings) in the common stocks, depositary receipts, real estate investment trusts and preferred shares that comprise the Index. The shares of the Fund are listed and trade on the Nasdaq under the ticker symbol
“FEM.” The Fund commenced trading on April 19, 2011.
The Index employs the
AlphaDEX® stock selection methodology which uses fundamental growth and value factors to objectively select stocks from the Nasdaq Emerging Markets Index
which may generate positive alpha relative to traditional passive indices. The Index is a modified equal-dollar weighted index where higher ranked stocks receive a higher weight within the Index.
| Performance
|
|
|
|
|
|
|
|
|
|
|
| Average Annual Total Returns
|
| Cumulative Total Returns
|
|
| 1 Year
Ended
12/31/22
| 5 Years
Ended
12/31/22
| 10 Years
Ended
12/31/22
| Inception
(4/18/11)
to 12/31/22
|
| 5 Years
Ended
12/31/22
| 10 Years
Ended
12/31/22
| Inception
(4/18/11)
to 12/31/22
|
| Fund Performance
|
|
|
|
|
|
|
|
|
| NAV
| -14.33%
| -1.49%
| 1.25%
| 0.43%
|
| -7.25%
| 13.19%
| 5.17%
|
| Market Price
| -14.30%
| -1.65%
| 1.07%
| 0.38%
|
| -7.99%
| 11.26%
| 4.59%
|
| Index Performance
|
|
|
|
|
|
|
|
|
| Nasdaq AlphaDEX® Emerging Markets Index(1)
| -14.38%
| -0.58%
| N/A
| N/A
|
| -2.88%
| N/A
| N/A
|
| Nasdaq Emerging Markets Index(1)
| -15.31%
| -0.39%
| 2.18%
| N/A
|
| -1.93%
| 24.04%
| N/A
|
| MSCI Emerging Markets Index
| -20.09%
| -1.40%
| 1.44%
| 0.79%
|
| -6.79%
| 15.33%
| 9.65%
|
(See Notes to Fund
Performance Overview Page 34.)
Performance Review
The Fund generated a NAV
return of -14.33% during the 12-month period covered by this report. During the same period, the MSCI Emerging Markets Index (the “Benchmark”) generated a return of -20.09%. During the period, the Fund was
most heavily weighted toward investments in China, which had an average weight of 22.9%. The largest negative contribution to the Fund’s return was also from China, which contributed -5.4% during the period.
Investments in Turkey generated a contribution of 6.4% to the Fund’s return, the greatest of any country. The Fund’s currency exposure caused -4.6% of underperformance during the period.
| (1)
| Performance data is not available for all the periods shown in the table for the index because performance data does not exist for some of the entire periods.
|
Nasdaq® and Nasdaq AlphaDEX® Emerging Markets Index are registered trademarks and service marks of Nasdaq, Inc. (together with its affiliates hereinafter referred to as the
“Corporations”) and are licensed for use by First Trust. AlphaDEX® is a registered trademark owned by First Trust that has been licensed to Nasdaq, Inc. for use in the name of the Index. The Fund has not been
passed on by the Corporations as to its legality or suitability. The Fund is not issued, endorsed, sold or promoted by the Corporations. THE CORPORATIONS MAKE NO WARRANTIES AND BEAR NO LIABILITY WITH RESPECT TO THE
FUND.
Fund Performance
Overview (Unaudited) (Continued)
First Trust Emerging Markets AlphaDEX® Fund (FEM) (Continued)
| Sector Allocation
| % of Total
Long-Term
Investments
|
| Industrials
| 21.2%
|
| Materials
| 19.8
|
| Energy
| 16.0
|
| Financials
| 10.0
|
| Information Technology
| 9.1
|
| Consumer Discretionary
| 6.1
|
| Utilities
| 5.8
|
| Consumer Staples
| 4.8
|
| Health Care
| 3.4
|
| Real Estate
| 3.0
|
| Communication Services
| 0.8
|
| Total
| 100.0%
|
| Top Ten Holdings
| % of Total
Long-Term
Investments
|
| Turk Hava Yollari AO
| 1.9%
|
| KOC Holding A.S.
| 1.8
|
| Turkiye Petrol Rafinerileri A.S.
| 1.7
|
| Akbank T.A.S.
| 1.6
|
| Turkiye Is Bankasi A.S., Class C
| 1.6
|
| Aselsan Elektronik Sanayi Ve Ticaret A.S.
| 1.6
|
| Turkiye Sise ve Cam Fabrikalari A.S.
| 1.6
|
| KGHM Polska Miedz S.A.
| 1.6
|
| Ford Otomotiv Sanayi A.S.
| 1.5
|
| Turkiye Garanti Bankasi A.S.
| 1.5
|
| Total
| 16.4%
|
Performance figures assume reinvestment of all distributions and do not reflect the deduction of taxes that a shareholder would pay on Fund distributions or the redemption or sale of Fund shares. An index is a
statistical composite that tracks a specified financial market or sector. Unlike the Fund, the indices do not actually hold a portfolio of securities and therefore do not incur the expenses incurred by the Fund.
These expenses negatively impact the performance of the Fund. The Fund’s past performance does not predict future performance.
Frequency
Distribution of Discounts and Premiums
Information
showing the number of days the market price of the Fund’s shares was greater (at a premium) and less (at a discount) than the Fund’s net asset value for the most recently completed year, and the most
recently completed calendar quarters since that year (or life of the Fund, if shorter), is available at https://www.ftportfolios.com/Retail/etf/home.aspx.
Fund Performance
Overview (Unaudited) (Continued)
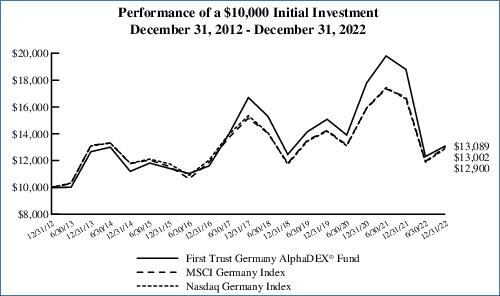
First Trust Germany AlphaDEX® Fund (FGM)
The First Trust Germany
AlphaDEX® Fund (the “Fund”) seeks investment results that correspond generally to the price and yield (before the Fund’s fees and
expenses) of an equity index called the Nasdaq AlphaDEX® Germany Index (the “Index”). The Fund will normally invest at least 90% of its net assets (including investment borrowings) in the
common stocks, depositary receipts, real estate investment trusts and preferred shares that comprise the Index. The shares of the Fund are listed and trade on the Nasdaq under the ticker symbol “FGM.” The
Fund commenced trading on February 15, 2012.
The Index employs the
AlphaDEX® stock selection methodology which uses fundamental growth and value factors to objectively select stocks from the Nasdaq Germany Index which
may generate positive alpha relative to traditional passive indices. The Index is a modified equal-dollar weighted index where higher ranked stocks receive a higher weight within the Index.
| Performance
|
|
|
|
|
|
|
|
|
|
|
| Average Annual Total Returns
|
| Cumulative Total Returns
|
|
| 1 Year
Ended
12/31/22
| 5 Years
Ended
12/31/22
| 10 Years
Ended
12/31/22
| Inception
(2/14/12)
to 12/31/22
|
| 5 Years
Ended
12/31/22
| 10 Years
Ended
12/31/22
| Inception
(2/14/12)
to 12/31/22
|
| Fund Performance
|
|
|
|
|
|
|
|
|
| NAV
| -30.39%
| -4.76%
| 2.73%
| 3.67%
|
| -21.63%
| 30.89%
| 48.02%
|
| Market Price
| -30.61%
| -4.77%
| 2.64%
| 3.64%
|
| -21.69%
| 29.74%
| 47.51%
|
| Index Performance
|
|
|
|
|
|
|
|
|
| Nasdaq AlphaDEX® Germany Index(1)
| -30.51%
| -4.53%
| N/A
| N/A
|
| -20.70%
| N/A
| N/A
|
| Nasdaq Germany Index(1)
| -22.28%
| -3.41%
| 2.58%
| N/A
|
| -15.94%
| 29.00%
| N/A
|
| MSCI Germany Index
| -22.34%
| -3.02%
| 2.66%
| 3.64%
|
| -14.23%
| 30.02%
| 47.46%
|
(See Notes to Fund
Performance Overview Page 34.)
Performance Review
The Fund generated a NAV
return of -30.39% during the 12-month period covered by this report. During the same period, the MSCI Germany Index (the “Benchmark”) generated a return of -22.34%. During the period, the Fund allocated
23.9% to the Consumer Discretionary sector, which was more than the weight given to any other sector. Investments in the Materials sector returned -33.5% during the period, and contributed -6.2% to the Fund’s
return, which was the greatest drag on the portfolio of any sector. The Financials sector received a weight of 13.5% and contributed 1.7% to the Fund’s return, which was the greatest of any sector. The
total currency effect to the Fund during the period covered by this report was -3.9%.
| (1)
| Performance data is not available for all the periods shown in the table for the index because performance data does not exist for some of the entire periods.
|
Nasdaq® and Nasdaq AlphaDEX® Germany Index are registered trademarks and service marks of Nasdaq, Inc. (together with its affiliates hereinafter referred to as the
“Corporations”) and are licensed for use by First Trust. AlphaDEX® is a registered trademark owned by First Trust that has been licensed to Nasdaq, Inc. for use in the name of the Index. The Fund has not been
passed on by the Corporations as to its legality or suitability. The Fund is not issued, endorsed, sold or promoted by the Corporations. THE CORPORATIONS MAKE NO WARRANTIES AND BEAR NO LIABILITY WITH RESPECT TO THE
FUND.
Fund Performance
Overview (Unaudited) (Continued)
First Trust Germany AlphaDEX® Fund (FGM) (Continued)
| Sector Allocation
| % of Total
Long-Term
Investments
|
| Consumer Discretionary
| 26.5%
|
| Materials
| 22.7
|
| Financials
| 17.1
|
| Industrials
| 8.7
|
| Utilities
| 6.7
|
| Communication Services
| 6.0
|
| Consumer Staples
| 5.2
|
| Real Estate
| 4.3
|
| Health Care
| 2.8
|
| Total
| 100.0%
|
| Top Ten Holdings
| % of Total
Long-Term
Investments
|
| Talanx AG
| 4.9%
|
| RWE AG
| 4.8
|
| Bayerische Motoren Werke AG
| 4.6
|
| Covestro AG
| 4.5
|
| HUGO BOSS AG
| 4.3
|
| Suedzucker AG
| 4.3
|
| Commerzbank AG
| 4.3
|
| Hella GmbH & Co., KGaA
| 3.8
|
| HeidelbergCement AG
| 3.7
|
| Mercedes-Benz Group AG
| 3.6
|
| Total
| 42.8%
|
Performance figures assume reinvestment of all distributions and do not reflect the deduction of taxes that a shareholder would pay on Fund distributions or the redemption or sale of Fund shares. An index is a
statistical composite that tracks a specified financial market or sector. Unlike the Fund, the indices do not actually hold a portfolio of securities and therefore do not incur the expenses incurred by the Fund. These
expenses negatively impact the performance of the Fund. The Fund’s past performance does not predict future performance.
Frequency
Distribution of Discounts and Premiums
Information
showing the number of days the market price of the Fund’s shares was greater (at a premium) and less (at a discount) than the Fund’s net asset value for the most recently completed year, and the most
recently completed calendar quarters since that year (or life of the Fund, if shorter), is available at https://www.ftportfolios.com/Retail/etf/home.aspx.
Fund Performance
Overview (Unaudited) (Continued)
First Trust United Kingdom AlphaDEX® Fund (FKU)
The First Trust United
Kingdom AlphaDEX® Fund (the “Fund”) seeks investment results that correspond generally to the price and yield (before the Fund’s fees and
expenses) of an equity index called the Nasdaq AlphaDEX® United Kingdom Index (the “Index”). The Fund will normally invest at least 90% of its net assets (including investment borrowings)
in the common stocks, depositary receipts, real estate investment trusts and preferred shares that comprise the Index. The shares of the Fund are listed and trade on the Nasdaq under the ticker symbol
“FKU.” The Fund commenced trading on February 15, 2012.
The Index employs the
AlphaDEX® stock selection methodology which uses fundamental growth and value factors to objectively select stocks from the Nasdaq United Kingdom Index
which may generate positive alpha relative to traditional passive indices. The Index is a modified equal-dollar weighted index where higher ranked stocks receive a higher weight within the Index.
| Performance
|
|
|
|
|
|
|
|
|
|
|
| Average Annual Total Returns
|
| Cumulative Total Returns
|
|
| 1 Year
Ended
12/31/22
| 5 Years
Ended
12/31/22
| 10 Years
Ended
12/31/22
| Inception
(2/14/12)
to 12/31/22
|
| 5 Years
Ended
12/31/22
| 10 Years
Ended
12/31/22
| Inception
(2/14/12)
to 12/31/22
|
| Fund Performance
|
|
|
|
|
|
|
|
|
| NAV
| -23.52%
| -0.86%
| 2.61%
| 3.81%
|
| -4.22%
| 29.34%
| 50.26%
|
| Market Price
| -24.10%
| -0.73%
| 2.57%
| 3.79%
|
| -3.62%
| 28.86%
| 49.85%
|
| Index Performance
|
|
|
|
|
|
|
|
|
| Nasdaq AlphaDEX® United Kingdom Index(1)
| -22.91%
| 0.09%
| N/A
| N/A
|
| 0.47%
| N/A
| N/A
|
| Nasdaq United Kingdom Index(1)
| -9.02%
| 0.41%
| 3.18%
| N/A
|
| 2.05%
| 36.80%
| N/A
|
| MSCI United Kingdom Index
| -4.84%
| 0.96%
| 3.07%
| 3.54%
|
| 4.91%
| 35.27%
| 45.98%
|
(See Notes to Fund
Performance Overview Page 34.)
Performance Review
The Fund generated a NAV
return of -23.52% during the 12-month period covered by this report. During the same period, the MSCI United Kingdom Index (the “Benchmark”) generated a return of -4.84%. The greatest allocation to the
Fund were investments in the Financials sector, which received an allocation of 23.8%. The -6.5% contribution to the Fund’s return came from investments in the Consumer Discretionary sector which was the
greatest drag of any sector. Investments in the Energy sector contributed 0.6% to the Fund’s total return and was the only sector with a positive contribution. The Fund’s currency exposure had a -9.0%
impact on the Fund’s return.
| (1)
| Performance data is not available for all the periods shown in the table for the index because performance data does not exist for some of the entire periods.
|
Nasdaq® and Nasdaq AlphaDEX® United Kingdom Index are registered trademarks and service marks of Nasdaq, Inc. (together with its affiliates hereinafter referred to as the
“Corporations”) and are licensed for use by First Trust. AlphaDEX® is a registered trademark owned by First Trust that has been licensed to Nasdaq, Inc. for use in the name of the Index. The Fund has not been
passed on by the Corporations as to its legality or suitability. The Fund is not issued, endorsed, sold or promoted by the Corporations. THE CORPORATIONS MAKE NO WARRANTIES AND BEAR NO LIABILITY WITH RESPECT TO THE
FUND.
Fund Performance
Overview (Unaudited) (Continued)
First Trust United Kingdom AlphaDEX® Fund (FKU) (Continued)
| Sector Allocation
| % of Total
Long-Term
Investments
|
| Financials
| 26.9%
|
| Consumer Discretionary
| 14.2
|
| Materials
| 14.1
|
| Consumer Staples
| 9.5
|
| Real Estate
| 8.0
|
| Health Care
| 7.3
|
| Industrials
| 5.5
|
| Energy
| 5.0
|
| Utilities
| 4.8
|
| Communication Services
| 2.9
|
| Information Technology
| 1.8
|
| Total
| 100.0%
|
| Top Ten Holdings
| % of Total
Long-Term
Investments
|
| Beazley PLC
| 2.9%
|
| Glencore PLC
| 2.7
|
| BP PLC
| 2.6
|
| 3i Group PLC
| 2.6
|
| Centrica PLC
| 2.6
|
| abrdn PLC
| 2.6
|
| Shell PLC
| 2.4
|
| Mediclinic International PLC
| 2.4
|
| Kingfisher PLC
| 2.1
|
| Rio Tinto PLC
| 2.0
|
| Total
| 24.9%
|
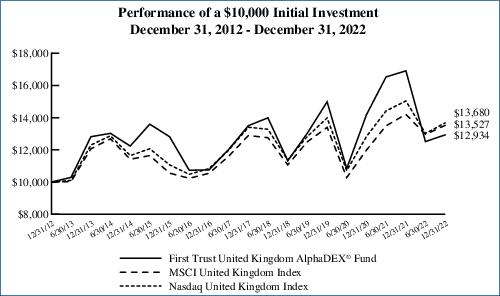
Performance figures assume reinvestment of all distributions and do not reflect the deduction of taxes that a shareholder would pay on Fund distributions or the redemption or sale of Fund shares. An index is a
statistical composite that tracks a specified financial market or sector. Unlike the Fund, the indices do not actually hold a portfolio of securities and therefore do not incur the expenses incurred by the Fund. These
expenses negatively impact the performance of the Fund. The Fund’s past performance does not predict future performance.
Frequency
Distribution of Discounts and Premiums
Information
showing the number of days the market price of the Fund’s shares was greater (at a premium) and less (at a discount) than the Fund’s net asset value for the most recently completed year, and the most
recently completed calendar quarters since that year (or life of the Fund, if shorter), is available at https://www.ftportfolios.com/Retail/etf/home.aspx.
Fund Performance
Overview (Unaudited) (Continued)
First Trust India NIFTY 50 Equal Weight
ETF (NFTY)
The First Trust India
NIFTY 50 Equal Weight ETF (the “Fund”) seeks investment results that correspond generally to the price and yield (before the Fund’s fees and expenses) of an equity index called the NIFTY 50 Equal
Weight Index (the “Index”). The Fund will normally invest at least 90% of its net assets (including investment borrowings) in the common stocks that comprise the Index. The shares of the Fund are listed
and trade on the Nasdaq under the ticker symbol “NFTY.” The Fund commenced trading on February 15, 2012.
The Index is an equally
weighted total return index designed to provide diversified exposure to the NIFTY 50 Index, the main index for Indian equity securities. The NIFTY 50 Index is a market capitalization-weighted index comprising the 50
largest and most liquid Indian equity securities listed on the National Stock Exchange of India. All constituents of the NIFTY 50 Index will be included in the Index, but will be equally weighted.
| Performance
|
|
|
|
|
|
|
|
|
|
|
| Average Annual Total Returns
|
| Cumulative Total Returns
|
|
| 1 Year
Ended
12/31/22
| 5 Years
Ended
12/31/22
| 10 Years
Ended
12/31/22
| Inception
(2/14/12)
to 12/31/22
|
| 5 Years
Ended
12/31/22
| 10 Years
Ended
12/31/22
| Inception
(2/14/12)
to 12/31/22
|
| Fund Performance
|
|
|
|
|
|
|
|
|
| NAV
| -4.45%
| 5.50%
| 6.30%
| 5.84%
|
| 30.70%
| 84.14%
| 85.43%
|
| Market Price
| -3.97%
| 5.79%
| 6.25%
| 5.91%
|
| 32.48%
| 83.33%
| 86.65%
|
| Index Performance
|
|
|
|
|
|
|
|
|
| NIFTY 50 Equal Weight Index*
| -2.86%
| N/A
| N/A
| N/A
|
| N/A
| N/A
| N/A
|
| NIFTY 50 Index
| -5.14%
| 7.25%
| 8.66%
| 7.88%
|
| 41.89%
| 129.44%
| 128.10%
|
(See Notes to Fund
Performance Overview Page 34.)
Performance Review
The Fund generated a NAV
return of -4.45% during the 12-month period covered by this report. During the same period, the NIFTY 50 Index (the “Benchmark”) generated a return of -5.14%. The Fund allocated the greatest weight to the
Financials sector during the period. Investments in this sector received an allocation of 22.3%. The Information Technology sector generated the largest drag to the Fund’s return at -3.5%. The sector with the
largest contribution to the Fund’s return was the Consumer Discretionary sector with a 0.8% contribution to the Fund’s return. The Fund’s currency exposure generated a -10.1% impact on the
Fund’s return during the period covered by this report.
| *
| On April 17, 2018, the Fund’s underlying index changed from the Nasdaq AlphaDEX® Taiwan Index to the Index. On July 14, 2015, the Fund’s underlying index changed from the Defined Taiwan Index to the Nasdaq
AlphaDEX® Taiwan Index. Therefore, the Fund’s performance and total returns shown for the periods prior to April 17, 2018, are not necessarily
indicative of the performance that the Fund, based on the current index, would have generated. Since the Fund’s new underlying index had an inception date of September 29, 2017, it was not in existence for all
the periods disclosed.
|
The First Trust India
NIFTY 50 Equal Weight ETF (the “Product”) offered by First Trust is not sponsored, endorsed, sold or promoted by NSE INDICES LIMITED (formerly known as India Index Services & Products Limited (IISL)).
NSE INDICES LIMITED does not make any representation or warranty, express or implied (including warranties of merchantability or fitness for particular purpose or use) and disclaims all liability to the owners of the
Product or any member of the public regarding the advisability of investing in securities generally or in the Product linked to the NIFTY 50 Equal Weight Index or particularly in the ability of the NIFTY 50 Equal
Weight Index to track general stock market performance in India. Please read the full Disclaimers in relation to the NIFTY 50 Equal Weight Index in the Prospectus and Statement of Additional Information.
Fund Performance
Overview (Unaudited) (Continued)
First Trust India NIFTY 50 Equal Weight
ETF (NFTY) (Continued)
| Sector Allocation
| % of Total
Long-Term
Investments
|
| Financials
| 22.1%
|
| Consumer Discretionary
| 14.1
|
| Materials
| 14.0
|
| Information Technology
| 10.0
|
| Consumer Staples
| 9.9
|
| Health Care
| 9.8
|
| Energy
| 8.1
|
| Industrials
| 6.0
|
| Utilities
| 4.0
|
| Communication Services
| 2.0
|
| Total
| 100.0%
|
| Top Ten Holdings
| % of Total
Long-Term
Investments
|
| Titan Co., Ltd.
| 2.1%
|
| Adani Enterprises Ltd.
| 2.0
|
| State Bank of India
| 2.0
|
| Coal India Ltd.
| 2.0
|
| Wipro Ltd.
| 2.0
|
| IndusInd Bank Ltd.
| 2.0
|
| Bharat Petroleum Corp., Ltd.
| 2.0
|
| Hero MotoCorp Ltd.
| 2.0
|
| Tata Steel Ltd.
| 2.0
|
| Oil & Natural Gas Corp., Ltd.
| 2.0
|
| Total
| 20.1%
|
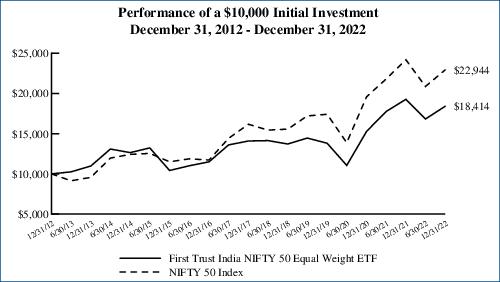
Performance figures assume reinvestment of all distributions and do not reflect the deduction of taxes that a shareholder would pay on Fund distributions or the redemption or sale of Fund shares. An index is a
statistical composite that tracks a specified financial market or sector. Unlike the Fund, the index does not actually hold a portfolio of securities and therefore does not incur the expenses incurred by the
Fund. These expenses negatively impact the performance of the Fund. The Fund’s past performance does not predict future performance.
Frequency
Distribution of Discounts and Premiums
Information
showing the number of days the market price of the Fund’s shares was greater (at a premium) and less (at a discount) than the Fund’s net asset value for the most recently completed year, and the most
recently completed calendar quarters since that year (or life of the Fund, if shorter), is available at https://www.ftportfolios.com/Retail/etf/home.aspx.
Fund Performance
Overview (Unaudited) (Continued)
First Trust Switzerland AlphaDEX® Fund (FSZ)
The First Trust
Switzerland AlphaDEX® Fund (the “Fund”) seeks investment results that correspond generally to the price and yield (before the Fund’s fees and
expenses) of an equity index called the Nasdaq AlphaDEX® Switzerland Index (the “Index”). The Fund will normally invest at least 90% of its net assets (including investment borrowings) in
the common stocks, depositary receipts, real estate investment trusts and preferred shares that comprise the Index. The shares of the Fund are listed and trade on the Nasdaq under the ticker symbol “FSZ.”
The Fund commenced trading on February 15, 2012.
The Index employs the
AlphaDEX® stock selection methodology which uses fundamental growth and value factors to objectively select stocks from the Nasdaq Switzerland Index
which may generate positive alpha relative to traditional passive indices. The Index is a modified equal-dollar weighted index where higher ranked stocks receive a higher weight within the Index.
| Performance
|
|
|
|
|
|
|
|
|
|
|
| Average Annual Total Returns
|
| Cumulative Total Returns
|
|
| 1 Year
Ended
12/31/22
| 5 Years
Ended
12/31/22
| 10 Years
Ended
12/31/22
| Inception
(2/14/12)
to 12/31/22
|
| 5 Years
Ended
12/31/22
| 10 Years
Ended
12/31/22
| Inception
(2/14/12)
to 12/31/22
|
| Fund Performance
|
|
|
|
|
|
|
|
|
| NAV
| -20.88%
| 2.93%
| 7.45%
| 7.77%
|
| 15.56%
| 105.15%
| 125.75%
|
| Market Price
| -20.77%
| 2.86%
| 7.35%
| 7.76%
|
| 15.15%
| 103.30%
| 125.43%
|
| Index Performance
|
|
|
|
|
|
|
|
|
| Nasdaq AlphaDEX® Switzerland Index(1)
| -20.98%
| 3.36%
| N/A
| N/A
|
| 17.95%
| N/A
| N/A
|
| Nasdaq Switzerland Index(1)
| -18.21%
| 5.03%
| 6.67%
| N/A
|
| 27.79%
| 90.73%
| N/A
|
| MSCI Switzerland Index
| -18.32%
| 5.53%
| 6.84%
| 7.54%
|
| 30.88%
| 93.78%
| 120.42%
|
(See Notes to Fund
Performance Overview Page 34.)
Performance Review
The Fund generated a NAV
return of -20.88% during the 12-month period covered by this report. During the same period, the MSCI Switzerland Index (the “Benchmark”) generated a return of -18.32%. During the same period, the Fund was
most heavily weighted toward the Financials sector at 23.2%, with the Industrials sector a close second at 22.5%. The Industrials sector contributed -7.8% to the Fund’s overall return, the most negative of any
sector. No sector contributed positively to the Fund’s total return. The total currency effect to the Fund during the period covered by this report was -0.3%.
| (1)
| Performance data is not available for all the periods shown in the table for the index because performance data does not exist for some of the entire periods.
|
Nasdaq® and Nasdaq AlphaDEX® Switzerland Index are registered trademarks and service marks of Nasdaq, Inc. (together with its affiliates hereinafter referred to as the
“Corporations”) and are licensed for use by First Trust. AlphaDEX® is a registered trademark owned by First Trust that has been licensed to Nasdaq, Inc. for use in the name of the Index. The Fund has not been
passed on by the Corporations as to its legality or suitability. The Fund is not issued, endorsed, sold or promoted by the Corporations. THE CORPORATIONS MAKE NO WARRANTIES AND BEAR NO LIABILITY WITH RESPECT TO THE
FUND.
Fund Performance
Overview (Unaudited) (Continued)
First Trust Switzerland AlphaDEX® Fund (FSZ) (Continued)
| Sector Allocation
| % of Total
Long-Term
Investments
|
| Industrials
| 24.8%
|
| Financials
| 23.8
|
| Health Care
| 14.3
|
| Consumer Staples
| 8.0
|
| Consumer Discretionary
| 7.7
|
| Materials
| 7.4
|
| Real Estate
| 5.8
|
| Communication Services
| 3.2
|
| Utilities
| 3.1
|
| Information Technology
| 1.9
|
| Total
| 100.0%
|
| Top Ten Holdings
| % of Total
Long-Term
Investments
|
| Holcim AG
| 4.8%
|
| Swatch Group (The) AG
| 4.8
|
| Zurich Insurance Group AG
| 4.4
|
| Novartis AG
| 4.2
|
| Galenica AG
| 4.2
|
| PSP Swiss Property AG
| 4.2
|
| Helvetia Holding AG
| 4.0
|
| Bucher Industries AG
| 3.8
|
| Baloise Holding AG
| 3.8
|
| UBS Group AG
| 3.7
|
| Total
| 41.9%
|
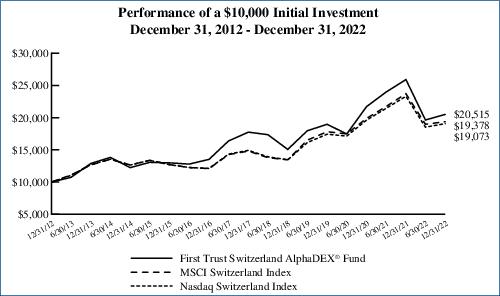
Performance figures assume reinvestment of all distributions and do not reflect the deduction of taxes that a shareholder would pay on Fund distributions or the redemption or sale of Fund shares. An index is a
statistical composite that tracks a specified financial market or sector. Unlike the Fund, the indices do not actually hold a portfolio of securities and therefore do not incur the expenses incurred by the Fund. These
expenses negatively impact the performance of the Fund. The Fund’s past performance does not predict future performance.
Frequency
Distribution of Discounts and Premiums
Information
showing the number of days the market price of the Fund’s shares was greater (at a premium) and less (at a discount) than the Fund’s net asset value for the most recently completed year, and the most
recently completed calendar quarters since that year (or life of the Fund, if shorter), is available at https://www.ftportfolios.com/Retail/etf/home.aspx.
Fund Performance
Overview (Unaudited) (Continued)
First Trust Developed Markets ex-US Small
Cap AlphaDEX® Fund (FDTS)
The First Trust Developed
Markets ex-US Small Cap AlphaDEX® Fund (the “Fund”) seeks investment results that correspond generally to the price and yield (before the Fund’s fees and
expenses) of an equity index called the Nasdaq AlphaDEX® Developed Markets Ex-US Small Cap Index (the “Index”). The Fund will normally invest at least 90% of its net assets (including
investment borrowings) in the common stocks, depositary receipts, real estate investment trusts and preferred shares that comprise the Index. The shares of the Fund are listed and trade on the Nasdaq under the ticker
symbol “FDTS.” The Fund commenced trading on February 16, 2012.
The Index employs the
AlphaDEX® stock selection methodology which uses fundamental growth and value factors to objectively select stocks from the Nasdaq Developed Markets
Ex-US Small Cap Index which may generate positive alpha relative to traditional passive indices. The Index is a modified equal-dollar weighted index where higher ranked stocks receive a higher weight within the
Index.
| Performance
|
|
|
|
|
|
|
|
|
|
|
| Average Annual Total Returns
|
| Cumulative Total Returns
|
|
| 1 Year
Ended
12/31/22
| 5 Years
Ended
12/31/22
| 10 Years
Ended
12/31/22
| Inception
(2/15/12)
to 12/31/22
|
| 5 Years
Ended
12/31/22
| 10 Years
Ended
12/31/22
| Inception
(2/15/12)
to 12/31/22
|
| Fund Performance
|
|
|
|
|
|
|
|
|
| NAV
| -15.00%
| -0.84%
| 4.55%
| 4.51%
|
| -4.13%
| 56.08%
| 61.58%
|
| Market Price
| -14.88%
| -0.78%
| 4.44%
| 4.49%
|
| -3.85%
| 54.46%
| 61.15%
|
| Index Performance
|
|
|
|
|
|
|
|
|
| Nasdaq AlphaDEX® Developed Markets Ex-US Small Cap Index(1)
| -14.80%
| -0.08%
| N/A
| N/A
|
| -0.40%
| N/A
| N/A
|
| Nasdaq Developed Markets Ex-US Small Cap Index(1)
| -18.14%
| -0.81%
| 4.65%
| N/A
|
| -3.99%
| 57.58%
| N/A
|
| MSCI World ex-USA Small Cap Index
| -20.59%
| 0.45%
| 5.77%
| 5.80%
|
| 2.27%
| 75.21%
| 84.64%
|
(See Notes to Fund
Performance Overview Page 34.)
Performance Review
The Fund generated a NAV
return of -15.00% during the 12-month period covered by this report. During the same period, the MSCI World ex-USA Small Cap Index generated a return of -20.59%. The largest average weight by country was Japan at
27.44%, which contributed -2.2% toward the Fund’s return. Denmark, at 0.3%, was the largest positive contribution toward the Fund’s return. The most negative contribution to the Fund’s return came
from investments in South Korea. These securities received an allocation of 18.0% and contributed -6.1% to the Fund’s overall return. The total currency effect to the Fund during the period covered by this
report was -7.0%.
| (1)
| Performance data is not available for all the periods shown in the table for the index because performance data does not exist for some of the entire periods.
|
Nasdaq® and Nasdaq AlphaDEX® Developed Markets Ex-US Small Cap Index are registered trademarks and service marks of Nasdaq, Inc. (together with its affiliates hereinafter
referred to as the “Corporations”) and are licensed for use by First Trust. AlphaDEX® is a registered trademark owned by First Trust that has been licensed to Nasdaq, Inc. for use in the name of the Index. The Fund has not been
passed on by the Corporations as to its legality or suitability. The Fund is not issued, endorsed, sold or promoted by the Corporations. THE CORPORATIONS MAKE NO WARRANTIES AND BEAR NO LIABILITY WITH RESPECT TO THE
FUND.
Fund Performance
Overview (Unaudited) (Continued)
First Trust Developed Markets ex-US Small
Cap AlphaDEX® Fund (FDTS) (Continued)
| Sector Allocation
| % of Total
Long-Term
Investments
|
| Industrials
| 23.6%
|
| Materials
| 20.0
|
| Real Estate
| 12.6
|
| Energy
| 11.5
|
| Consumer Discretionary
| 11.0
|
| Information Technology
| 6.9
|
| Financials
| 4.5
|
| Consumer Staples
| 3.3
|
| Utilities
| 2.8
|
| Health Care
| 2.1
|
| Communication Services
| 1.7
|
| Total
| 100.0%
|
| Top Ten Holdings
| % of Total
Long-Term
Investments
|
| Samchully Co., Ltd.
| 0.6%
|
| Salzgitter AG
| 0.6
|
| Torex Gold Resources, Inc.
| 0.6
|
| voestalpine AG
| 0.6
|
| Samhallsbyggnadsbolaget i Norden AB
| 0.5
|
| Outokumpu OYJ
| 0.5
|
| Pan Ocean Co., Ltd.
| 0.5
|
| Hakuto Co., Ltd.
| 0.5
|
| D/S Norden A/S
| 0.5
|
| Bank of Georgia Group PLC
| 0.5
|
| Total
| 5.4%
|
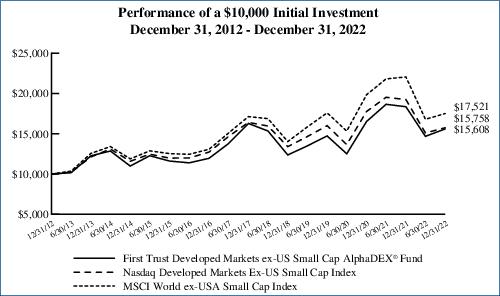
Performance figures assume reinvestment of all distributions and do not reflect the deduction of taxes that a shareholder would pay on Fund distributions or the redemption or sale of Fund shares. An index is a
statistical composite that tracks a specified financial market or sector. Unlike the Fund, the indices do not actually hold a portfolio of securities and therefore do not incur the expenses incurred by the Fund.
These expenses negatively impact the performance of the Fund. The Fund’s past performance does not predict future performance.
Frequency
Distribution of Discounts and Premiums
Information
showing the number of days the market price of the Fund’s shares was greater (at a premium) and less (at a discount) than the Fund’s net asset value for the most recently completed year, and the most
recently completed calendar quarters since that year (or life of the Fund, if shorter), is available at https://www.ftportfolios.com/Retail/etf/home.aspx.
Fund Performance
Overview (Unaudited) (Continued)
First Trust Emerging Markets Small Cap
AlphaDEX® Fund (FEMS)
The First Trust Emerging
Markets Small Cap AlphaDEX® Fund (the “Fund”) seeks investment results that correspond generally to the price and yield (before the Fund’s fees and
expenses) of an equity index called the Nasdaq AlphaDEX® Emerging Markets Small Cap Index (the “Index”). The Fund will normally invest at least 90% of its net assets (including investment
borrowings) in the common stocks, depositary receipts, real estate investment trusts and preferred shares that comprise the Index. The shares of the Fund are listed and trade on the Nasdaq under the ticker symbol
“FEMS.” The Fund commenced trading on February 16, 2012.
The Index employs the
AlphaDEX® stock selection methodology which uses fundamental growth and value factors to objectively select stocks from the Nasdaq Emerging Markets Small
Cap Index which may generate positive alpha relative to traditional passive indices. The Index is a modified equal-dollar weighted index where higher ranked stocks receive a higher weight within the Index.
| Performance
|
|
|
|
|
|
|
|
|
|
|
| Average Annual Total Returns
|
| Cumulative Total Returns
|
|
| 1 Year
Ended
12/31/22
| 5 Years
Ended
12/31/22
| 10 Years
Ended
12/31/22
| Inception
(2/15/12)
to 12/31/22
|
| 5 Years
Ended
12/31/22
| 10 Years
Ended
12/31/22
| Inception
(2/15/12)
to 12/31/22
|
| Fund Performance
|
|
|
|
|
|
|
|
|
| NAV
| 1.36%
| 2.64%
| 5.14%
| 6.11%
|
| 13.94%
| 65.00%
| 90.67%
|
| Market Price
| 1.91%
| 2.62%
| 5.04%
| 6.15%
|
| 13.78%
| 63.54%
| 91.39%
|
| Index Performance
|
|
|
|
|
|
|
|
|
| Nasdaq AlphaDEX® Emerging Markets Small Cap Index(1)
| 2.75%
| 4.16%
| N/A
| N/A
|
| 22.63%
| N/A
| N/A
|
| Nasdaq Emerging Markets Small Cap Index(1)
| -13.78%
| 1.72%
| 4.07%
| N/A
|
| 8.91%
| 49.05%
| N/A
|
| MSCI Emerging Markets Small Cap Index
| -18.02%
| 1.06%
| 3.21%
| 3.23%
|
| 5.41%
| 37.20%
| 41.27%
|
(See Notes to Fund
Performance Overview Page 34.)
Performance Review
The Fund generated a NAV
return of 1.36% during the 12-month period covered by this report. During the same period, the MSCI Emerging Markets Small Cap Index (the “Benchmark”) generated a return of -18.02%. During the period, the
Fund was most heavily weighted toward investments in Taiwan and Turkey with an allocation of 19.1% and 18.1%, respectively. Investments in Taiwan contributed -6.5% to the Fund’s overall return, which was the
most negative of any country. Investments in Turkey contributed 18.9% to the Fund’s return, which was the greatest of any country. The total currency effect to the Fund during the period covered by this report
was -6.7%.
| (1)
| Performance data is not available for all the periods shown in the table for the index because performance data does not exist for some of the entire periods.
|
Nasdaq® and Nasdaq AlphaDEX® Emerging Markets Small Cap Index are registered trademarks and service marks of Nasdaq, Inc. (together with its affiliates hereinafter referred
to as the “Corporations”) and are licensed for use by First Trust. AlphaDEX® is a registered trademark owned by First Trust that has been licensed to Nasdaq, Inc. for use in the name of the Index. The Fund has not been
passed on by the Corporations as to its legality or suitability. The Fund is not issued, endorsed, sold or promoted by the Corporations. THE CORPORATIONS MAKE NO WARRANTIES AND BEAR NO LIABILITY WITH RESPECT TO THE
FUND.
Fund Performance
Overview (Unaudited) (Continued)
First Trust Emerging Markets Small Cap
AlphaDEX® Fund (FEMS) (Continued)
| Sector Allocation
| % of Total
Long-Term
Investments
|
| Materials
| 19.2%
|
| Industrials
| 17.1
|
| Information Technology
| 13.3
|
| Consumer Discretionary
| 9.3
|
| Consumer Staples
| 9.1
|
| Energy
| 8.8
|
| Real Estate
| 6.1
|
| Utilities
| 5.5
|
| Financials
| 5.4
|
| Communication Services
| 3.3
|
| Health Care
| 2.9
|
| Total
| 100.0%
|
| Top Ten Holdings
| % of Total
Long-Term
Investments
|
| Is Yatirim Menkul Degerler A.S.
| 1.6%
|
| Dogan Sirketler Grubu Holding A.S.
| 1.5
|
| Enerjisa Enerji A.S.
| 1.4
|
| Pegasus Hava Tasimaciligi A.S.
| 1.4
|
| Jastrzebska Spolka Weglowa S.A.
| 1.3
|
| Hektas Ticaret TAS
| 1.3
|
| Turk Traktor ve Ziraat Makineleri A.S.
| 1.3
|
| Vestel Elektronik Sanayi ve Ticaret A.S.
| 1.2
|
| Haci Omer Sabanci Holding A.S.
| 1.2
|
| Cimsa Cimento Sanayi VE Ticare
| 1.2
|
| Total
| 13.4%
|
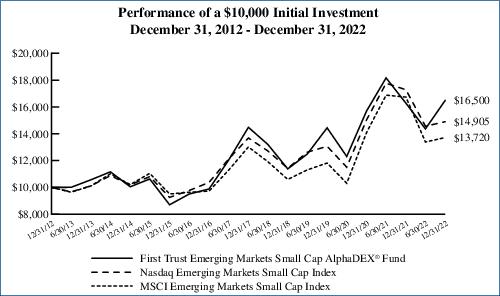
Performance figures assume reinvestment of all distributions and do not reflect the deduction of taxes that a shareholder would pay on Fund distributions or the redemption or sale of Fund shares. An index is a
statistical composite that tracks a specified financial market or sector. Unlike the Fund, the indices do not actually hold a portfolio of securities and therefore do not incur the expenses incurred by the Fund.
These expenses negatively impact the performance of the Fund. The Fund’s past performance does not predict future performance.
Frequency
Distribution of Discounts and Premiums
Information
showing the number of days the market price of the Fund’s shares was greater (at a premium) and less (at a discount) than the Fund’s net asset value for the most recently completed year, and the most
recently completed calendar quarters since that year (or life of the Fund, if shorter), is available at https://www.ftportfolios.com/Retail/etf/home.aspx.
Fund Performance
Overview (Unaudited) (Continued)
First Trust Eurozone AlphaDEX® ETF (FEUZ)
The First Trust Eurozone
AlphaDEX® ETF (the “Fund”) seeks investment results that correspond generally to the price and yield (before the Fund’s fees and
expenses) of an equity index called the Nasdaq AlphaDEX® Eurozone Index (the “Index”). The Fund will normally invest at least 90% of its net assets (including investment borrowings) in the
common stocks, depositary receipts, real estate investment trusts and preferred shares that comprise the Index. The shares of the Fund are listed and trade on the Nasdaq under the ticker symbol “FEUZ.” The
Fund commenced trading on October 22, 2014.
The Index employs the
AlphaDEX® stock selection methodology which uses fundamental growth and value factors to objectively select stocks from the Nasdaq Eurozone Index which
may generate positive alpha relative to traditional passive indices. The Index is a modified equal-dollar weighted index where higher ranked stocks receive a higher weight within the Index.
| Performance
|
|
|
|
|
|
|
|
|
| Average Annual Total Returns
|
| Cumulative Total Returns
|
|
| 1 Year
Ended
12/31/22
| 5 Years
Ended
12/31/22
| Inception
(10/21/14)
to 12/31/22
|
| 5 Years
Ended
12/31/22
| Inception
(10/21/14)
to 12/31/22
|
| Fund Performance
|
|
|
|
|
|
|
| NAV
| -19.65%
| -1.60%
| 4.08%
|
| -7.74%
| 38.80%
|
| Market Price
| -19.96%
| -1.82%
| 3.95%
|
| -8.76%
| 37.37%
|
| Index Performance
|
|
|
|
|
|
|
| Nasdaq AlphaDEX® Eurozone Index
| -19.54%
| -1.14%
| 4.60%
|
| -5.56%
| 44.59%
|
| Nasdaq Eurozone Index
| -17.95%
| 0.35%
| 3.67%
|
| 1.75%
| 34.37%
|
| MSCI EMU Index
| -17.86%
| 0.60%
| 3.59%
|
| 3.03%
| 33.52%
|
(See Notes to Fund
Performance Overview Page 34.)
Performance Review
The Fund generated a NAV
return of -19.65% during the 12-month period covered by this report. During the same period, the MSCI EMU Index (the “Benchmark”) generated a return of -17.86%. The two largest allocations by country
during the same period were France, with an allocation of 24.9%, and Germany, with an allocation of 26.0%. Germany contributed -6.8% toward the Fund’s return, which was the largest contribution by country, while
France contributed -3.5%. The largest positive contribution to the Fund’s return came from Irish investments, which contributed 0.9%. The total currency effect to the Fund during the period covered by this
report was -4.4%.
Nasdaq® and Nasdaq AlphaDEX® Eurozone Index are registered trademarks and service marks of Nasdaq, Inc. (together with its affiliates hereinafter referred to as the
“Corporations”) and are licensed for use by First Trust. AlphaDEX® is a registered trademark owned by First Trust that has been licensed to Nasdaq, Inc. for use in the name of the Index. The Fund has not been
passed on by the Corporations as to its legality or suitability. The Fund is not issued, endorsed, sold or promoted by the Corporations. THE CORPORATIONS MAKE NO WARRANTIES AND BEAR NO LIABILITY WITH RESPECT TO THE
FUND.
Fund Performance
Overview (Unaudited) (Continued)
First Trust Eurozone AlphaDEX® ETF (FEUZ) (Continued)
| Sector Allocation
| % of Total
Long-Term
Investments
|
| Financials
| 19.1%
|
| Industrials
| 16.2
|
| Consumer Discretionary
| 13.2
|
| Materials
| 13.0
|
| Energy
| 8.7
|
| Utilities
| 7.2
|
| Real Estate
| 6.9
|
| Consumer Staples
| 5.8
|
| Communication Services
| 5.4
|
| Health Care
| 3.1
|
| Information Technology
| 1.4
|
| Total
| 100.0%
|
| Top Ten Holdings
| % of Total
Long-Term
Investments
|
| Deutsche Lufthansa AG
| 1.3%
|
| OMV AG
| 1.3
|
| Repsol S.A.
| 1.2
|
| Covestro AG
| 1.2
|
| TotalEnergies SE
| 1.2
|
| Tenaris S.A.
| 1.2
|
| Eni S.p.A.
| 1.2
|
| Commerzbank AG
| 1.2
|
| Hannover Rueck SE
| 1.2
|
| Bayerische Motoren Werke AG
| 1.2
|
| Total
| 12.2%
|
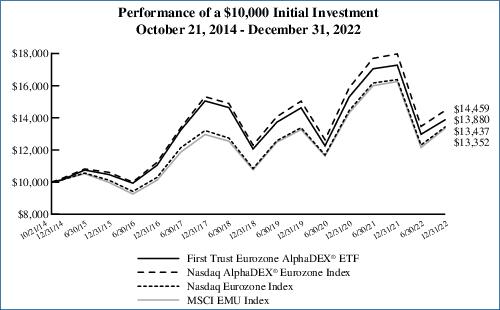
Performance figures assume reinvestment of all distributions and do not reflect the deduction of taxes that a shareholder would pay on Fund distributions or the redemption or sale of Fund shares. An index is a
statistical composite that tracks a specified financial market or sector. Unlike the Fund, the indices do not actually hold a portfolio of securities and therefore do not incur the expenses incurred by the Fund.
These expenses negatively impact the performance of the Fund. The Fund’s past performance does not predict future performance.
Frequency
Distribution of Discounts and Premiums
Information
showing the number of days the market price of the Fund’s shares was greater (at a premium) and less (at a discount) than the Fund’s net asset value for the most recently completed year, and the most
recently completed calendar quarters since that year (or life of the Fund, if shorter), is available at https://www.ftportfolios.com/Retail/etf/home.aspx.
Notes to Fund
Performance Overview (Unaudited)
Total returns for the
periods since inception are calculated from the inception date of each Fund. “Average Annual Total Returns” represent the average annual change in value of an investment over the periods indicated.
“Cumulative Total Returns” represent the total change in value of an investment over the periods indicated.
Each Fund’s per
share net asset value (“NAV”) is the value of one share of the Fund and is computed by dividing the value of all assets of the Fund (including accrued interest and dividends), less all liabilities
(including accrued expenses and dividends declared but unpaid), by the total number of outstanding shares. The price used to calculate market return (“Market Price”) is determined by using the midpoint of
the national best bid and offer price (“NBBO”) as of the time that the Fund’s NAV is calculated. Under SEC rules, the NBBO consists of the highest displayed buy and lowest sell prices among the
various exchanges trading the Fund at the time the Fund’s NAV is calculated. Prior to January 1, 2019, the price used was the midpoint between the highest bid and the lowest offer on the stock exchange on which
shares of the Fund were listed for trading as of the time that the Fund’s NAV was calculated. Since shares of each Fund did not trade in the secondary market until after the Fund’s inception, for the
period from inception to the first day of secondary market trading in shares of the Fund, the NAV of each Fund is used as a proxy for the secondary market trading price to calculate market returns. NAV and market
returns assume that all distributions have been reinvested in each Fund at NAV and Market Price, respectively.
An index is a statistical
composite that tracks a specified financial market or sector. Unlike each Fund, the indices do not actually hold a portfolio of securities and therefore do not incur the expenses incurred by each Fund. These expenses
negatively impact the performance of each Fund. Also, market returns do not include brokerage commissions that may be payable on secondary market transactions. If brokerage commissions were included, market returns
would be lower. The total returns presented reflect the reinvestment of dividends on securities in the indices. The returns presented do not reflect the deduction of taxes that a shareholder would pay on Fund
distributions or the redemption or sale of Fund shares. The investment return and principal value of shares of each Fund will vary with changes in market conditions. Shares of each Fund may be worth more or less than
their original cost when they are redeemed or sold in the market. Each Fund’s past performance is no guarantee of future performance.
First Trust Exchange-Traded AlphaDEX® Fund II
Understanding Your Fund
Expenses
December 31, 2022
(Unaudited)
As a shareholder of First
Trust Asia Pacific ex-Japan AlphaDEX® Fund, First Trust Europe AlphaDEX® Fund, First Trust Latin America AlphaDEX® Fund, First Trust Brazil AlphaDEX® Fund, First Trust China AlphaDEX® Fund, First Trust Japan AlphaDEX® Fund, First Trust Developed Markets ex-US AlphaDEX® Fund, First Trust Emerging Markets AlphaDEX® Fund, First Trust Germany AlphaDEX® Fund, First Trust United Kingdom AlphaDEX® Fund, First Trust India NIFTY 50 Equal Weight ETF, First Trust Switzerland AlphaDEX® Fund, First Trust Developed Markets ex-US Small Cap AlphaDEX® Fund, First Trust Emerging Markets Small Cap AlphaDEX® Fund or First Trust Eurozone AlphaDEX® ETF (each a “Fund” and collectively, the “Funds”), you incur two types of costs: (1) transaction costs; and (2) ongoing
costs, including management fees, distribution and/or service (12b-1) fees, if any, and other Fund expenses. This Example is intended to help you understand your ongoing costs (in U.S. dollars) of investing in the
Funds and to compare these costs with the ongoing costs of investing in other funds.
The Example is based on
an investment of $1,000 invested at the beginning of the period and held through the six-month period ended December 31, 2022.
Actual Expenses
The first line in the
following table provides information about actual account values and actual expenses. You may use the information in this line, together with the amount you invested, to estimate the expenses that you paid over the
period. Simply divide your account value by $1,000 (for example, an $8,600 account value divided by $1,000 = 8.6), then multiply the result by the number in the first line under the heading entitled “Expenses
Paid During the Six-Month Period” to estimate the expenses you paid on your account during this six-month period.
Hypothetical Example for
Comparison Purposes
The second line in the
following table provides information about hypothetical account values and hypothetical expenses based on each Fund’s actual expense ratio and an assumed rate of return of 5% per year before expenses, which is
not each Fund’s actual return. The hypothetical account values and expenses may not be used to estimate the actual ending account balance or expenses you paid for the period. You may use this information to
compare the ongoing costs of investing in the Funds and other funds. To do so, compare this 5% hypothetical example with the 5% hypothetical examples that appear in the shareholder reports of the other funds.
Please note that the
expenses shown in the table are meant to highlight your ongoing costs only and do not reflect any transactional costs such as brokerage commissions. Therefore, the second line in the table is useful in comparing
ongoing costs only, and will not help you determine the relative total costs of owning different funds. In addition, if these transactional costs were included, your costs would have been higher.
|
| Beginning
Account Value
July 1, 2022
| Ending
Account Value
December 31, 2022
| Annualized
Expense Ratio
Based on the
Six-Month
Period
| Expenses Paid
During the
Six-Month
Period (a)
|
| First Trust Asia Pacific ex-Japan AlphaDEX® Fund (FPA)
|
| Actual
| $1,000.00
| $1,000.60
| 0.80%
| $4.03
|
| Hypothetical (5% return before expenses)
| $1,000.00
| $1,021.17
| 0.80%
| $4.08
|
| First Trust Europe AlphaDEX® Fund (FEP)
|
| Actual
| $1,000.00
| $1,044.20
| 0.80%
| $4.12
|
| Hypothetical (5% return before expenses)
| $1,000.00
| $1,021.17
| 0.80%
| $4.08
|
| First Trust Latin America AlphaDEX® Fund (FLN)
|
| Actual
| $1,000.00
| $1,052.80
| 0.80%
| $4.14
|
| Hypothetical (5% return before expenses)
| $1,000.00
| $1,021.17
| 0.80%
| $4.08
|
| First Trust Brazil AlphaDEX® Fund (FBZ)
|
| Actual
| $1,000.00
| $1,091.60
| 0.80%
| $4.22
|
| Hypothetical (5% return before expenses)
| $1,000.00
| $1,021.17
| 0.80%
| $4.08
|
| First Trust China AlphaDEX® Fund (FCA)
|
| Actual
| $1,000.00
| $878.90
| 0.80%
| $3.79
|
| Hypothetical (5% return before expenses)
| $1,000.00
| $1,021.17
| 0.80%
| $4.08
|
First Trust Exchange-Traded AlphaDEX® Fund II
Understanding Your Fund
Expenses (Continued)
December 31, 2022
(Unaudited)
|
| Beginning
Account Value
July 1, 2022
| Ending
Account Value
December 31, 2022
| Annualized
Expense Ratio
Based on the
Six-Month
Period
| Expenses Paid
During the
Six-Month
Period (a)
|
| First Trust Japan AlphaDEX® Fund (FJP)
|
| Actual
| $1,000.00
| $1,049.10
| 0.80%
| $4.13
|
| Hypothetical (5% return before expenses)
| $1,000.00
| $1,021.17
| 0.80%
| $4.08
|
| First Trust Developed Markets ex-US AlphaDEX® Fund (FDT)
|
| Actual
| $1,000.00
| $1,021.30
| 0.80%
| $4.08
|
| Hypothetical (5% return before expenses)
| $1,000.00
| $1,021.17
| 0.80%
| $4.08
|
| First Trust Emerging Markets AlphaDEX® Fund (FEM)
|
| Actual
| $1,000.00
| $1,033.40
| 0.80%
| $4.10
|
| Hypothetical (5% return before expenses)
| $1,000.00
| $1,021.17
| 0.80%
| $4.08
|
| First Trust Germany AlphaDEX® Fund (FGM)
|
| Actual
| $1,000.00
| $1,064.00
| 0.80%
| $4.16
|
| Hypothetical (5% return before expenses)
| $1,000.00
| $1,021.17
| 0.80%
| $4.08
|
| First Trust United Kingdom AlphaDEX® Fund (FKU)
|
| Actual
| $1,000.00
| $1,033.60
| 0.80%
| $4.10
|
| Hypothetical (5% return before expenses)
| $1,000.00
| $1,021.17
| 0.80%
| $4.08
|
| First Trust India NIFTY 50 Equal Weight ETF (NFTY)
|
| Actual
| $1,000.00
| $1,094.60
| 0.80%
| $4.22
|
| Hypothetical (5% return before expenses)
| $1,000.00
| $1,021.17
| 0.80%
| $4.08
|
| First Trust Switzerland AlphaDEX® Fund (FSZ)
|
| Actual
| $1,000.00
| $1,044.30
| 0.80%
| $4.12
|
| Hypothetical (5% return before expenses)
| $1,000.00
| $1,021.17
| 0.80%
| $4.08
|
| First Trust Developed Markets ex-US Small Cap AlphaDEX® Fund (FDTS)
|
| Actual
| $1,000.00
| $1,063.10
| 0.80%
| $4.16
|
| Hypothetical (5% return before expenses)
| $1,000.00
| $1,021.17
| 0.80%
| $4.08
|
| First Trust Emerging Markets Small Cap AlphaDEX® Fund (FEMS)
|
| Actual
| $1,000.00
| $1,148.70
| 0.80%
| $4.33
|
| Hypothetical (5% return before expenses)
| $1,000.00
| $1,021.17
| 0.80%
| $4.08
|
| First Trust Eurozone AlphaDEX® ETF (FEUZ)
|
| Actual
| $1,000.00
| $1,069.80
| 0.80%
| $4.17
|
| Hypothetical (5% return before expenses)
| $1,000.00
| $1,021.17
| 0.80%
| $4.08
|
| (a)
| Expenses are equal to the annualized expense ratios as indicated in the table multiplied by the average account value over the period (July 1, 2022 through
December 31, 2022), multiplied by 184/365 (to reflect the six-month period).
|
First Trust Asia Pacific ex-Japan
AlphaDEX® Fund (FPA)
Portfolio of Investments
December 31, 2022
| Shares
|
| Description
|
| Value
|
| COMMON STOCKS (a) – 90.0%
|
|
|
| Australia – 32.7%
|
|
|
| 18,813
|
| Allkem Ltd. (b)
|
| $143,971
|
| 7,250
|
| Ampol Ltd.
|
| 139,595
|
| 1,353
|
| BHP Group Ltd.
|
| 42,034
|
| 17,154
|
| BlueScope Steel Ltd.
|
| 196,679
|
| 18,269
|
| Brambles Ltd.
|
| 150,132
|
| 57,690
|
| Cleanaway Waste Management Ltd.
|
| 103,302
|
| 6,314
|
| Computershare Ltd.
|
| 112,631
|
| 9,295
|
| Fortescue Metals Group Ltd.
|
| 129,798
|
| 38,698
|
| Harvey Norman Holdings Ltd.
|
| 108,815
|
| 15,215
|
| IGO Ltd.
|
| 139,434
|
| 59,388
|
| Incitec Pivot Ltd.
|
| 152,033
|
| 22,658
|
| Insurance Australia Group Ltd.
|
| 73,277
|
| 45,054
|
| Medibank Pvt Ltd.
|
| 90,491
|
| 2,378
|
| Mineral Resources Ltd.
|
| 124,992
|
| 43,776
|
| New Hope Corp., Ltd.
|
| 189,559
|
| 6,161
|
| Newcrest Mining Ltd.
|
| 86,579
|
| 6,656
|
| Northern Star Resources Ltd.
|
| 49,441
|
| 10,080
|
| Origin Energy Ltd.
|
| 52,982
|
| 8,086
|
| OZ Minerals Ltd.
|
| 153,599
|
| 57,141
|
| Pilbara Minerals Ltd. (b)
|
| 145,892
|
| 2,077
|
| Pro Medicus Ltd.
|
| 78,145
|
| 41,524
|
| Qantas Airways Ltd. (b)
|
| 169,912
|
| 9,040
|
| QBE Insurance Group Ltd.
|
| 82,660
|
| 1,675
|
| Rio Tinto Ltd.
|
| 132,757
|
| 14,700
|
| Santos Ltd.
|
| 71,461
|
| 6,149
|
| Seven Group Holdings Ltd.
|
| 87,792
|
| 1,704
|
| Sonic Healthcare Ltd.
|
| 34,770
|
| 71,781
|
| South32 Ltd.
|
| 195,488
|
| 13,536
|
| Telstra Corp., Ltd.
|
| 36,772
|
| 4,146
|
| Treasury Wine Estates Ltd.
|
| 38,418
|
| 28,920
|
| Whitehaven Coal Ltd.
|
| 185,481
|
| 2,004
|
| WiseTech Global Ltd.
|
| 69,244
|
| 4,938
|
| Woodside Energy Group Ltd.
|
| 119,151
|
| 1,535
|
| Woolworths Group Ltd.
|
| 35,074
|
| 4,094
|
| Worley Ltd.
|
| 41,811
|
|
|
|
|
| 3,764,172
|
|
|
| Cayman Islands – 6.0%
|
|
|
| 16,871
|
| CK Asset Holdings Ltd.
|
| 103,857
|
| 24,110
|
| CK Hutchison Holdings Ltd.
|
| 144,713
|
| 114,496
|
| Shimao Group Holdings Ltd. (b) (c) (d) (e)
|
| 32,418
|
| 213,900
|
| Sino Biopharmaceutical Ltd.
|
| 125,236
|
| 72,800
|
| SITC International Holdings Co., Ltd.
|
| 161,914
|
| 212,429
|
| WH Group Ltd. (f) (g)
|
| 123,558
|
|
|
|
|
| 691,696
|
|
|
| Hong Kong – 1.7%
|
|
|
| 3,101
|
| Sun Hung Kai Properties Ltd.
|
| 42,430
|
| 18,000
|
| Swire Pacific Ltd., Class A
|
| 158,428
|
|
|
|
|
| 200,858
|
| Shares
|
| Description
|
| Value
|
|
|
|
|
| Luxembourg – 1.6%
|
|
|
| 69,030
|
| Samsonite International S.A. (b) (f) (g)
|
| $181,741
|
|
|
| New Zealand – 2.5%
|
|
|
| 3,150
|
| EBOS Group Ltd.
|
| 87,797
|
| 13,696
|
| Infratil Ltd.
|
| 75,217
|
| 35,541
|
| Spark New Zealand Ltd.
|
| 121,851
|
|
|
|
|
| 284,865
|
|
|
| Singapore – 9.3%
|
|
|
| 19,000
|
| City Developments Ltd.
|
| 116,746
|
| 1,400
|
| DBS Group Holdings Ltd.
|
| 35,455
|
| 7,100
|
| Jardine Cycle & Carriage Ltd.
|
| 151,605
|
| 27,700
|
| Keppel Corp., Ltd.
|
| 150,143
|
| 4,100
|
| Oversea-Chinese Banking Corp., Ltd.
|
| 37,284
|
| 78,000
|
| Sembcorp Industries Ltd.
|
| 196,834
|
| 37,800
|
| Singapore Airlines Ltd.
|
| 156,065
|
| 18,200
|
| Singapore Telecommunications Ltd.
|
| 34,922
|
| 7,200
|
| UOL Group Ltd.
|
| 36,124
|
| 5,900
|
| Venture Corp., Ltd.
|
| 75,149
|
| 25,000
|
| Wilmar International Ltd.
|
| 77,833
|
|
|
|
|
| 1,068,160
|
|
|
| South Korea – 36.2%
|
|
|
| 583
|
| CJ CheilJedang Corp.
|
| 175,430
|
| 1,352
|
| Hana Financial Group, Inc.
|
| 44,960
|
| 5,078
|
| Hanwha Solutions Corp. (b)
|
| 172,680
|
| 2,333
|
| HLB, Inc. (b)
|
| 52,398
|
| 1,475
|
| Hyundai Glovis Co., Ltd.
|
| 190,718
|
| 753
|
| Hyundai Mobis Co., Ltd.
|
| 119,396
|
| 815
|
| Hyundai Motor Co.
|
| 97,323
|
| 10,071
|
| Industrial Bank of Korea
|
| 78,210
|
| 1,097
|
| KB Financial Group, Inc.
|
| 42,075
|
| 3,334
|
| Kia Corp.
|
| 156,351
|
| 403
|
| Korea Zinc Co., Ltd.
|
| 179,748
|
| 6,507
|
| Korean Air Lines Co., Ltd. (b)
|
| 118,099
|
| 5,297
|
| KT Corp.
|
| 141,588
|
| 1,661
|
| KT&G Corp.
|
| 120,191
|
| 179
|
| LG Chem Ltd.
|
| 84,935
|
| 2,591
|
| LG Corp.
|
| 160,029
|
| 1,220
|
| LG Electronics, Inc.
|
| 83,456
|
| 526
|
| LG Innotek Co., Ltd.
|
| 105,034
|
| 17,837
|
| LG Uplus Corp.
|
| 155,871
|
| 694
|
| Lotte Chemical Corp.
|
| 97,967
|
| 1,278
|
| POSCO Chemical Co., Ltd. (h)
|
| 181,922
|
| 1,136
|
| POSCO Holdings, Inc.
|
| 248,402
|
| 59
|
| Samsung Biologics Co., Ltd. (b) (f) (g)
|
| 38,307
|
| 1,712
|
| Samsung Electro-Mechanics Co., Ltd.
|
| 176,683
|
| 4,514
|
| Samsung Electronics Co., Ltd.
|
| 197,409
|
| 6,321
|
| Samsung Engineering Co., Ltd. (b)
|
| 111,224
|
| 417
|
| Samsung SDS Co., Ltd.
|
| 40,562
|
See Notes to Financial
Statements
Page 37
First Trust Asia Pacific ex-Japan
AlphaDEX® Fund (FPA)
Portfolio of Investments
(Continued)
December 31, 2022
| Shares
|
| Description
|
| Value
|
| COMMON STOCKS (a) (Continued)
|
|
|
| South Korea (Continued)
|
|
|
| 1,431
|
| Shinhan Financial Group Co., Ltd.
|
| $39,835
|
| 2,884
|
| SK Hynix, Inc.
|
| 171,056
|
| 1,336
|
| SK Innovation Co., Ltd. (i)
|
| 162,708
|
| 1,887
|
| SK Telecom Co., Ltd.
|
| 70,734
|
| 499
|
| SK, Inc.
|
| 74,584
|
| 2,959
|
| S-Oil Corp.
|
| 195,161
|
| 8,960
|
| Woori Financial Group, Inc.
|
| 81,841
|
|
|
|
|
| 4,166,887
|
|
|
| Total Common Stocks
|
| 10,358,379
|
|
|
| (Cost $10,220,057)
|
|
|
| REAL ESTATE INVESTMENT TRUSTS (a) – 9.1%
|
|
|
| Australia – 7.3%
|
|
|
| 13,618
|
| Charter Hall Group
|
| 111,076
|
| 33,752
|
| Dexus
|
| 178,095
|
| 3,302
|
| Goodman Group
|
| 39,028
|
| 54,426
|
| GPT (The) Group
|
| 155,635
|
| 53,588
|
| Mirvac Group
|
| 77,714
|
| 47,810
|
| Stockland
|
| 118,162
|
| 120,145
|
| Vicinity Ltd.
|
| 163,602
|
|
|
|
|
| 843,312
|
|
|
| Singapore – 1.8%
|
|
|
| 195,400
|
| Frasers Logistics & Commercial Trust (f)
|
| 169,228
|
| 30,800
|
| Mapletree Logistics Trust
|
| 36,563
|
|
|
|
|
| 205,791
|
|
|
| Total Real Estate Investment Trusts
|
| 1,049,103
|
|
|
| (Cost $1,157,064)
|
|
|
| RIGHTS (a) – 0.1%
|
|
|
| South Korea – 0.1%
|
|
|
| 150
|
| Lotte Chemical Corp., expiring 1/20/23 (b) (c) (d)
|
| 4,211
|
|
|
| (Cost $0)
|
|
|
| MONEY MARKET FUNDS – 1.2%
|
| 139,904
|
| Goldman Sachs Financial Square Treasury Obligations Fund - Institutional Class - 4.14% (j) (k)
|
| 139,904
|
|
|
| (Cost $139,904)
|
|
|
|
|
| Total Investments – 100.4%
|
| 11,551,597
|
|
|
| (Cost $11,517,025)
|
|
|
|
|
| Net Other Assets and Liabilities – (0.4)%
|
| (40,423)
|
|
|
| Net Assets – 100.0%
|
| $11,511,174
|
| (a)
| Portfolio securities are categorized based upon their country of incorporation, which can be different from the country categorization of the Fund’s underlying index. For a
breakdown of the portfolio securities by sector, please see the Fund Performance Overview.
|
| (b)
| Non-income producing security.
|
| (c)
| This security is fair valued by the Advisor’s Pricing Committee in accordance with procedures approved by the Trust’s Board of Trustees, and in accordance with the
provisions of the Investment Company Act of 1940 and rules thereunder, as amended. At December 31, 2022, securities noted as such are valued at $36,629 or 0.3% of net assets.
|
| (d)
| Pursuant to procedures adopted by the Trust’s Board of Trustees, this security has been determined to be illiquid by First Trust Advisors L.P., the Fund’s advisor.
|
| (e)
| This security’s value was determined using significant unobservable inputs (see Note 2A – Portfolio Valuation in the Notes to Financial Statements).
|
| (f)
| This security may be resold to qualified foreign investors and foreign institutional buyers under Regulation S of the Securities Act of 1933, as amended (the “1933 Act”).
|
| (g)
| This security is exempt from registration upon resale under Rule 144A of the 1933 Act and may be resold in transactions exempt from registration, normally to qualified institutional
buyers. This security is not restricted on the foreign exchange where it trades freely without any additional registration. As such, it does not require the additional disclosure required of restricted securities.
|
| (h)
| All or a portion of this security is on loan (see Note 2F - Securities Lending in the Notes to Financial Statements). The remaining contractual maturity of all of the securities
lending transactions is overnight and continuous. The aggregate value of such securities is $133,238 and the total value of the collateral held by the Fund is $139,904.
|
| (i)
| Non-income producing security that makes payment-in-kind (“PIK”) distributions. For the fiscal year ended December 31, 2022, the Fund received 4 PIK shares of SK
Innovation Co., Ltd.
|
| (j)
| Rate shown reflects yield as of December 31, 2022.
|
| (k)
| This security serves as collateral for securities on loan.
|
Offsetting Assets and Liabilities
Offsetting assets and
liabilities requires entities to disclose both gross and net information about instruments and transactions eligible for offset, and to disclose instruments and transactions subject to master netting or similar
agreements (see Note 2E – Offsetting on the Statements of Assets and Liabilities in the Notes to Financial Statements).
The Fund’s loaned
securities were all subject to an enforceable Securities Lending Agency Agreement. Securities lent in accordance with the Securities Lending Agency Agreement on a gross basis were as follows:
Page 38
See Notes to Financial
Statements
First Trust Asia Pacific ex-Japan
AlphaDEX® Fund (FPA)
Portfolio of Investments
(Continued)
December 31, 2022
| Securities Lending Agency Agreement
|
|
| Total gross amount presented on the Statements of Assets and Liabilities (1)
| $133,238
|
| Non-cash Collateral (2)
| (133,238)
|
| Net Amount
| $—
|
| (1)
| The amount presented on the Statements of Assets and Liabilities, which is included in “Investments, at value,” is not offset and is shown on a gross basis.
|
| (2)
| At December 31, 2022, the value of the collateral received from each borrower exceeded the value of the related securities loaned. This amount is disclosed on the
Portfolio of Investments.
|
Currency Exposure
Diversification
| % of Total
Investments
|
| Australian Dollar
| 39.9%
|
| South Korean Won
| 36.1
|
| Singapore Dollar
| 11.0
|
| Hong Kong Dollar
| 9.3
|
| New Zealand Dollar
| 2.5
|
| United States Dollar
| 1.2
|
| Total
| 100.0%
|
Valuation Inputs
A summary of the inputs
used to value the Fund’s investments as of December 31, 2022 is as follows (see Note 2A - Portfolio Valuation in the Notes to Financial Statements):
|
| Total
Value at
12/31/2022
| Level 1
Quoted
Prices
| Level 2
Significant
Observable
Inputs
| Level 3
Significant
Unobservable
Inputs
|
| Common Stocks:
|
|
|
|
|
| Cayman Islands
| $ 691,696
| $ 659,278
| $ —
| $ 32,418
|
| Other Country Categories*
| 9,666,683
| 9,666,683
| —
| —
|
| Real Estate Investment Trusts*
| 1,049,103
| 1,049,103
| —
| —
|
| Rights*
| 4,211
| —
| 4,211
| —
|
| Money Market Funds
| 139,904
| 139,904
| —
| —
|
| Total Investments
| $ 11,551,597
| $ 11,514,968
| $ 4,211
| $ 32,418
|
| *
| See Portfolio of Investments for country breakout.
|
Level 3 investments are
fair valued by the Advisor’s Pricing Committee and are footnoted in the Portfolio of Investments. The Level 3 investments values are based on unobservable and non-quantitative inputs.
See Notes to Financial Statements
Page 39
First Trust Europe AlphaDEX® Fund (FEP)
Portfolio of Investments
December 31, 2022
| Shares
|
| Description
|
| Value
|
| COMMON STOCKS (a) – 93.4%
|
|
|
| Austria – 3.1%
|
|
|
| 24,315
|
| ANDRITZ AG
|
| $1,393,799
|
| 23,868
|
| BAWAG Group AG (b) (c)
|
| 1,272,365
|
| 34,912
|
| CA Immobilien Anlagen AG
|
| 1,059,483
|
| 15,622
|
| Erste Group Bank AG
|
| 500,005
|
| 37,864
|
| OMV AG
|
| 1,949,566
|
| 86,903
|
| Raiffeisen Bank International AG (d)
|
| 1,427,939
|
| 4,041
|
| Verbund AG
|
| 340,215
|
|
|
|
|
| 7,943,372
|
|
|
| Belgium – 1.1%
|
|
|
| 100,156
|
| Proximus S.A.D.P.
|
| 964,479
|
| 17,768
|
| Solvay S.A.
|
| 1,796,606
|
|
|
|
|
| 2,761,085
|
|
|
| Denmark – 2.4%
|
|
|
| 949
|
| AP Moller - Maersk A.S., Class B
|
| 2,133,843
|
| 2,939
|
| Carlsberg A.S., Class B
|
| 390,581
|
| 1,066
|
| Genmab A.S. (d)
|
| 451,302
|
| 26,455
|
| Jyske Bank A.S. (d)
|
| 1,718,653
|
| 3,454
|
| Novo Nordisk A.S., Class B
|
| 466,381
|
| 2,185
|
| ROCKWOOL International A.S., Class B
|
| 513,633
|
| 16,759
|
| Tryg A.S.
|
| 398,903
|
|
|
|
|
| 6,073,296
|
|
|
| Finland – 2.3%
|
|
|
| 107,840
|
| Kojamo Oyj
|
| 1,593,035
|
| 31,585
|
| Neste Oyj
|
| 1,454,513
|
| 81,072
|
| Stora Enso Oyj, Class R
|
| 1,141,204
|
| 43,422
|
| UPM-Kymmene Oyj
|
| 1,623,584
|
|
|
|
|
| 5,812,336
|
|
|
| France – 13.9%
|
|
|
| 5,943
|
| Aeroports de Paris (d)
|
| 796,483
|
| 9,340
|
| Alten S.A.
|
| 1,167,767
|
| 23,557
|
| Arkema S.A.
|
| 2,115,168
|
| 374,541
|
| Bollore SE
|
| 2,092,841
|
| 13,173
|
| Bouygues S.A.
|
| 395,393
|
| 24,885
|
| Carrefour S.A.
|
| 416,621
|
| 28,648
|
| Cie de Saint-Gobain
|
| 1,399,914
|
| 30,547
|
| Cie Generale des Etablissements Michelin SCA
|
| 849,684
|
| 42,297
|
| Credit Agricole S.A.
|
| 445,116
|
| 7,462
|
| Edenred
|
| 406,414
|
| 8,567
|
| Eiffage S.A.
|
| 842,957
|
| 149,355
|
| Engie S.A.
|
| 2,140,434
|
| 26,280
|
| Eurazeo SE
|
| 1,634,436
|
| 577
|
| Hermes International
|
| 892,504
|
| 1,165
|
| LVMH Moet Hennessy Louis Vuitton SE
|
| 847,886
|
| 19,239
|
| Nexans S.A.
|
| 1,739,196
|
| 114,743
|
| Orange S.A.
|
| 1,139,954
|
| 3,744
|
| Pernod Ricard S.A.
|
| 736,427
|
| Shares
|
| Description
|
| Value
|
|
|
|
|
| France (Continued)
|
|
|
| 7,235
|
| Publicis Groupe S.A.
|
| $460,190
|
| 2,073
|
| Remy Cointreau S.A.
|
| 349,721
|
| 50,589
|
| Renault S.A. (d)
|
| 1,693,635
|
| 68,545
|
| Rexel S.A.
|
| 1,353,016
|
| 34,649
|
| Societe Generale S.A.
|
| 870,874
|
| 22,921
|
| Sodexo S.A. (e)
|
| 2,195,462
|
| 65,559
|
| SPIE S.A.
|
| 1,709,527
|
| 36,641
|
| TotalEnergies SE
|
| 2,300,391
|
| 8,509
|
| Vinci S.A.
|
| 849,728
|
| 221,854
|
| Vivendi SE
|
| 2,116,929
|
| 14,366
|
| Wendel SE
|
| 1,340,969
|
|
|
|
|
| 35,299,637
|
|
|
| Germany – 17.7%
|
|
|
| 26,792
|
| BASF SE
|
| 1,330,442
|
| 25,269
|
| Bayerische Motoren Werke AG
|
| 2,255,362
|
| 3,509
|
| Beiersdorf AG
|
| 402,666
|
| 11,344
|
| Brenntag SE
|
| 725,191
|
| 240,894
|
| Commerzbank AG (d)
|
| 2,278,495
|
| 7,698
|
| Continental AG
|
| 461,293
|
| 59,877
|
| Covestro AG (b) (c)
|
| 2,342,684
|
| 30,297
|
| Daimler Truck Holding AG (d)
|
| 938,727
|
| 9,329
|
| Delivery Hero SE (b) (c) (d)
|
| 447,183
|
| 4,201
|
| Deutsche Boerse AG
|
| 725,809
|
| 239,079
|
| Deutsche Lufthansa AG (d)
|
| 1,987,235
|
| 22,734
|
| Deutsche Post AG
|
| 856,127
|
| 44,803
|
| E.ON SE
|
| 447,653
|
| 61,514
|
| Evonik Industries AG
|
| 1,180,978
|
| 24,373
|
| Fresenius Medical Care AG & Co., KGaA
|
| 797,574
|
| 48,343
|
| Fresenius SE & Co., KGaA
|
| 1,358,405
|
| 11,470
|
| Hannover Rueck SE
|
| 2,277,580
|
| 34,630
|
| HeidelbergCement AG
|
| 1,975,073
|
| 22,075
|
| HUGO BOSS AG
|
| 1,279,811
|
| 91,160
|
| K+S AG
|
| 1,793,073
|
| 28,817
|
| LEG Immobilien SE
|
| 1,877,358
|
| 33,787
|
| Mercedes-Benz Group AG
|
| 2,220,672
|
| 5,723
|
| Muenchener Rueckversicherungs-Gesellschaft AG in Muenchen
|
| 1,862,360
|
| 30,405
|
| Porsche Automobil Holding SE (Preference Shares)
|
| 1,667,710
|
| 46,802
|
| RWE AG
|
| 2,083,626
|
| 8,621
|
| Sixt SE
|
| 793,177
|
| 29,148
|
| Talanx AG
|
| 1,382,849
|
| 170,630
|
| Telefonica Deutschland Holding AG
|
| 420,645
|
| 36,730
|
| United Internet AG
|
| 742,710
|
| 23,386
|
| VERBIO Vereinigte BioEnergie AG
|
| 1,517,033
|
| 13,016
|
| Volkswagen AG (Preference Shares)
|
| 1,622,077
|
| 31,851
|
| Vonovia SE
|
| 750,770
|
| 16,663
|
| Wacker Chemie AG
|
| 2,129,727
|
|
|
|
|
| 44,932,075
|
Page 40
See Notes to Financial
Statements
First Trust Europe AlphaDEX® Fund (FEP)
Portfolio of Investments
(Continued)
December 31, 2022
| Shares
|
| Description
|
| Value
|
| COMMON STOCKS (a) (Continued)
|
|
|
| Greece – 0.3%
|
|
|
| 57,609
|
| OPAP S.A.
|
| $815,862
|
|
|
| Ireland – 3.1%
|
|
|
| 426,854
|
| AIB Group PLC
|
| 1,652,244
|
| 214,838
|
| Bank of Ireland Group PLC
|
| 2,046,763
|
| 32,094
|
| CRH PLC
|
| 1,271,479
|
| 150,141
|
| Glanbia PLC
|
| 1,915,764
|
| 24,047
|
| Smurfit Kappa Group PLC
|
| 892,789
|
|
|
|
|
| 7,779,039
|
|
|
| Italy – 4.4%
|
|
|
| 393,898
|
| Banco BPM S.p.A.
|
| 1,405,775
|
| 21,203
|
| Brunello Cucinelli S.p.A.
|
| 1,568,345
|
| 162,102
|
| Eni S.p.A.
|
| 2,305,414
|
| 97,278
|
| Leonardo S.p.A.
|
| 839,298
|
| 210,550
|
| Pirelli & C S.p.A. (b) (c)
|
| 902,435
|
| 59,715
|
| Prysmian S.p.A.
|
| 2,215,534
|
| 135,288
|
| UniCredit S.p.A.
|
| 1,922,038
|
|
|
|
|
| 11,158,839
|
|
|
| Jersey – 1.3%
|
|
|
| 324,600
|
| Glencore PLC
|
| 2,167,757
|
| 415,555
|
| Man Group PLC
|
| 1,073,597
|
|
|
|
|
| 3,241,354
|
|
|
| Luxembourg – 2.1%
|
|
|
| 85,587
|
| ArcelorMittal S.A.
|
| 2,251,478
|
| 156,726
|
| Aroundtown S.A.
|
| 366,236
|
| 101,411
|
| B&M European Value Retail S.A.
|
| 504,257
|
| 133,332
|
| Tenaris S.A.
|
| 2,324,281
|
|
|
|
|
| 5,446,252
|
|
|
| Netherlands – 5.4%
|
|
|
| 20,955
|
| Aalberts N.V.
|
| 812,685
|
| 38,333
|
| ABN AMRO Bank N.V. (b) (c)
|
| 530,359
|
| 20,067
|
| Heineken Holding N.V.
|
| 1,547,686
|
| 15,750
|
| Heineken N.V.
|
| 1,481,621
|
| 40,597
|
| Koninklijke Ahold Delhaize N.V.
|
| 1,166,387
|
| 110,539
|
| Koninklijke Philips N.V.
|
| 1,657,044
|
| 8,855
|
| NN Group N.V.
|
| 361,712
|
| 47,086
|
| OCI N.V.
|
| 1,684,475
|
| 19,666
|
| Prosus N.V.
|
| 1,356,767
|
| 23,798
|
| Randstad N.V.
|
| 1,451,031
|
| 39,846
|
| Signify N.V. (b) (c)
|
| 1,338,456
|
| 3,533
|
| Wolters Kluwer N.V.
|
| 369,719
|
|
|
|
|
| 13,757,942
|
|
|
| Norway – 3.9%
|
|
|
| 26,748
|
| Aker ASA, Class A
|
| 1,964,436
|
| 24,158
|
| Aker BP ASA
|
| 749,882
|
| 52,722
|
| Equinor ASA
|
| 1,893,230
|
| 54,534
|
| Mowi ASA
|
| 930,721
|
| 256,708
|
| Norsk Hydro ASA
|
| 1,921,222
|
| 95,363
|
| Orkla ASA
|
| 690,537
|
| Shares
|
| Description
|
| Value
|
|
|
|
|
| Norway (Continued)
|
|
|
| 39,407
|
| Yara International ASA
|
| $1,732,061
|
|
|
|
|
| 9,882,089
|
|
|
| Portugal – 1.5%
|
|
|
| 318,664
|
| EDP - Energias de Portugal S.A.
|
| 1,588,226
|
| 108,018
|
| Galp Energia SGPS S.A.
|
| 1,458,067
|
| 37,131
|
| Jeronimo Martins SGPS S.A.
|
| 802,092
|
|
|
|
|
| 3,848,385
|
|
|
| Spain – 4.9%
|
|
|
| 7,833
|
| Acciona S.A.
|
| 1,441,353
|
| 61,165
|
| ACS Actividades de Construccion y Servicios S.A.
|
| 1,752,741
|
| 229,662
|
| Banco Bilbao Vizcaya Argentaria S.A.
|
| 1,385,072
|
| 513,829
|
| Banco de Sabadell S.A.
|
| 484,465
|
| 295,082
|
| Banco Santander S.A.
|
| 885,227
|
| 122,695
|
| Bankinter S.A.
|
| 823,232
|
| 427,327
|
| CaixaBank S.A.
|
| 1,679,691
|
| 110,751
|
| Iberdrola S.A.
|
| 1,295,789
|
| 29,810
|
| Naturgy Energy Group S.A.
|
| 775,735
|
| 119,861
|
| Repsol S.A.
|
| 1,905,332
|
|
|
|
|
| 12,428,637
|
|
|
| Sweden – 3.6%
|
|
|
| 26,092
|
| AddTech AB, Class B
|
| 371,819
|
| 33,291
|
| Boliden AB
|
| 1,248,231
|
| 153,631
|
| Castellum AB (e)
|
| 1,858,763
|
| 429,628
|
| Fastighets AB Balder, Class B (d)
|
| 1,997,686
|
| 123,848
|
| Husqvarna AB, Class B
|
| 867,839
|
| 38,412
|
| Nibe Industrier AB, Class B
|
| 357,437
|
| 401,916
|
| SSAB AB, Class B
|
| 2,087,605
|
| 24,326
|
| Volvo AB, Class B
|
| 439,390
|
|
|
|
|
| 9,228,770
|
|
|
| Switzerland – 2.7%
|
|
|
| 3,643
|
| Banque Cantonale Vaudoise
|
| 349,663
|
| 14,439
|
| BKW AG
|
| 1,975,378
|
| 49,172
|
| Coca-Cola HBC AG
|
| 1,172,879
|
| 9,500
|
| Galenica AG (b) (c)
|
| 776,213
|
| 24,969
|
| Holcim AG
|
| 1,292,939
|
| 4,512
|
| Novartis AG
|
| 407,893
|
| 1,390
|
| Siegfried Holding AG
|
| 922,257
|
|
|
|
|
| 6,897,222
|
|
|
| United Kingdom – 19.4%
|
|
|
| 142,006
|
| 3i Group PLC
|
| 2,303,062
|
| 892,652
|
| abrdn PLC
|
| 2,042,332
|
| 45,393
|
| Anglo American PLC
|
| 1,776,122
|
| 24,603
|
| Associated British Foods PLC
|
| 468,762
|
| 39,309
|
| BAE Systems PLC
|
| 406,794
|
| 272,146
|
| Barratt Developments PLC
|
| 1,305,515
|
| 275,194
|
| Beazley PLC
|
| 2,260,668
|
| 18,830
|
| Berkeley Group Holdings PLC
|
| 858,906
|
| 358,366
|
| BP PLC
|
| 2,057,488
|
See Notes to Financial
Statements
Page 41
First Trust Europe AlphaDEX® Fund (FEP)
Portfolio of Investments
(Continued)
December 31, 2022
| Shares
|
| Description
|
| Value
|
| COMMON STOCKS (a) (Continued)
|
|
|
| United Kingdom (Continued)
|
|
|
| 511,608
|
| BT Group PLC
|
| $693,039
|
| 33,740
|
| Bunzl PLC
|
| 1,125,395
|
| 68,684
|
| Burberry Group PLC
|
| 1,685,621
|
| 1,750,434
|
| Centrica PLC
|
| 2,042,544
|
| 85,985
|
| Compass Group PLC
|
| 1,993,271
|
| 16,351
|
| Diageo PLC
|
| 721,515
|
| 120,828
|
| DS Smith PLC
|
| 469,631
|
| 114,619
|
| Evraz PLC (d) (f) (g) (h)
|
| 11,210
|
| 45,779
|
| Frasers Group PLC (d)
|
| 392,946
|
| 346,533
|
| Harbour Energy PLC
|
| 1,275,257
|
| 22,767
|
| Hikma Pharmaceuticals PLC
|
| 427,175
|
| 61,451
|
| Howden Joinery Group PLC
|
| 417,219
|
| 81,314
|
| IG Group Holdings PLC
|
| 768,742
|
| 33,471
|
| Imperial Brands PLC
|
| 838,025
|
| 7,109
|
| InterContinental Hotels Group PLC
|
| 407,720
|
| 31,588
|
| Intermediate Capital Group PLC
|
| 438,402
|
| 534,290
|
| J Sainsbury PLC
|
| 1,406,189
|
| 422,538
|
| Kingfisher PLC
|
| 1,206,063
|
| 1,497,955
|
| Lloyds Banking Group PLC
|
| 822,354
|
| 8,137
|
| London Stock Exchange Group PLC
|
| 701,984
|
| 89,079
|
| Mondi PLC
|
| 1,517,920
|
| 549,662
|
| NatWest Group PLC
|
| 1,762,291
|
| 143,256
|
| Pearson PLC
|
| 1,626,594
|
| 100,340
|
| Persimmon PLC
|
| 1,476,295
|
| 25,356
|
| Rio Tinto PLC
|
| 1,777,327
|
| 96,108
|
| RS GROUP PLC
|
| 1,040,479
|
| 69,091
|
| Shell PLC
|
| 1,942,851
|
| 82,227
|
| Smiths Group PLC
|
| 1,589,042
|
| 20,329
|
| SSE PLC
|
| 420,754
|
| 109,530
|
| Standard Chartered PLC
|
| 824,159
|
| 1,404,311
|
| Taylor Wimpey PLC
|
| 1,725,754
|
| 150,109
|
| Tesco PLC
|
| 406,865
|
| 23,470
|
| Unilever PLC
|
| 1,186,603
|
| 613,961
|
| Vodafone Group PLC
|
| 625,270
|
|
|
|
|
| 49,246,155
|
|
|
| United States – 0.3%
|
|
|
| 10,124
|
| Autoliv, Inc., SDR (e)
|
| 772,675
|
|
|
| Total Common Stocks
|
| 237,325,022
|
|
|
| (Cost $236,695,712)
|
|
|
| REAL ESTATE INVESTMENT TRUSTS (a) – 5.2%
|
|
|
| Belgium – 0.6%
|
|
|
| 56,322
|
| Warehouses De Pauw CVA
|
| 1,609,740
|
|
|
| France – 1.0%
|
|
|
| 21,430
|
| Covivio
|
| 1,272,009
|
| 13,190
|
| Gecina S.A.
|
| 1,343,445
|
|
|
|
|
| 2,615,454
|
|
|
| Spain – 0.7%
|
|
|
| 178,987
|
| Merlin Properties Socimi S.A.
|
| 1,681,261
|
| Shares
|
| Description
|
| Value
|
|
|
|
|
| United Kingdom – 2.9%
|
|
|
| 442,573
|
| British Land (The) Co., PLC
|
| $2,113,977
|
| 237,957
|
| Land Securities Group PLC
|
| 1,787,632
|
| 206,121
|
| Segro PLC
|
| 1,902,814
|
| 144,638
|
| UNITE Group (The) PLC
|
| 1,591,227
|
|
|
|
|
| 7,395,650
|
|
|
| Total Real Estate Investment Trusts
|
| 13,302,105
|
|
|
| (Cost $12,867,582)
|
|
|
| MONEY MARKET FUNDS – 1.5%
|
| 3,880,055
|
| Goldman Sachs Financial Square Treasury Obligations Fund - Institutional Class - 4.14% (i) (j)
|
| 3,880,055
|
|
|
| (Cost $3,880,055)
|
|
|
|
|
| Total Investments – 100.1%
|
| 254,507,182
|
|
|
| (Cost $253,443,349)
|
|
|
|
|
| Net Other Assets and Liabilities – (0.1)%
|
| (340,673)
|
|
|
| Net Assets – 100.0%
|
| $254,166,509
|
| (a)
| Portfolio securities are categorized based upon their country of incorporation, which can be different from the country categorization of the Fund’s underlying index. For a
breakdown of the portfolio securities by sector, please see the Fund Performance Overview.
|
| (b)
| This security may be resold to qualified foreign investors and foreign institutional buyers under Regulation S of the Securities Act of 1933, as amended (the “1933 Act”).
|
| (c)
| This security is exempt from registration upon resale under Rule 144A of the 1933 Act and may be resold in transactions exempt from registration, normally to qualified institutional
buyers. This security is not restricted on the foreign exchange where it trades freely without any additional registration. As such, it does not require the additional disclosure required of restricted securities.
|
| (d)
| Non-income producing security.
|
| (e)
| All or a portion of this security is on loan (see Note 2F - Securities Lending in the Notes to Financial Statements). The remaining contractual maturity of all of the securities
lending transactions is overnight and continuous. The aggregate value of such securities is $3,644,826 and the total value of the collateral held by the Fund is $3,880,055.
|
| (f)
| This security is fair valued by the Advisor’s Pricing Committee in accordance with procedures approved by the Trust’s Board of Trustees, and in accordance with the
provisions of the Investment Company Act of 1940 and rules thereunder, as amended. At December 31, 2022, securities noted as such are valued at $11,210 or 0.0% of net assets.
|
| (g)
| Pursuant to procedures adopted by the Trust’s Board of Trustees, this security has been determined to be illiquid by First Trust Advisors L.P., the Fund’s advisor.
|
| (h)
| This security’s value was determined using significant unobservable inputs (see Note 2A – Portfolio Valuation in the Notes to Financial Statements).
|
Page 42
See Notes to Financial
Statements
First Trust Europe AlphaDEX® Fund (FEP)
Portfolio of Investments
(Continued)
December 31, 2022
| (i)
| Rate shown reflects yield as of December 31, 2022.
|
| (j)
| This security serves as collateral for securities on loan.
|
| SDR
| Swedish Depositary Receipt
|
Offsetting Assets and Liabilities
Offsetting assets and
liabilities requires entities to disclose both gross and net information about instruments and transactions eligible for offset, and to disclose instruments and transactions subject to master netting or similar
agreements (see Note 2E – Offsetting on the Statements of Assets and Liabilities in the Notes to Financial Statements).
The Fund’s loaned
securities were all subject to an enforceable Securities Lending Agency Agreement. Securities lent in accordance with the Securities Lending Agency Agreement on a gross basis were as follows:
| Securities Lending Agency Agreement
|
|
| Total gross amount presented on the Statements of Assets and Liabilities (1)
| $3,644,826
|
| Non-cash Collateral (2)
| (3,644,826)
|
| Net Amount
| $—
|
| (1)
| The amount presented on the Statements of Assets and Liabilities, which is included in “Investments, at value,” is not offset and is shown on a gross basis.
|
| (2)
| At December 31, 2022, the value of the collateral received from each borrower exceeded the value of the related securities loaned. This amount is disclosed on the
Portfolio of Investments.
|
Currency Exposure
Diversification
| % of Total
Investments
|
| Euro
| 61.5%
|
| British Pound Sterling
| 24.5
|
| Swedish Krona
| 3.9
|
| Norwegian Krone
| 3.9
|
| Danish Krone
| 2.4
|
| Swiss Franc
| 2.3
|
| United States Dollar
| 1.5
|
| Total
| 100.0%
|
Valuation Inputs
A summary of the inputs
used to value the Fund’s investments as of December 31, 2022 is as follows (see Note 2A - Portfolio Valuation in the Notes to Financial Statements):
|
| Total
Value at
12/31/2022
| Level 1
Quoted
Prices
| Level 2
Significant
Observable
Inputs
| Level 3
Significant
Unobservable
Inputs
|
| Common Stocks:
|
|
|
|
|
| United Kingdom
| $ 49,246,155
| $ 49,234,945
| $ —
| $ 11,210
|
| Other Country Categories*
| 188,078,867
| 188,078,867
| —
| —
|
| Real Estate Investment Trusts*
| 13,302,105
| 13,302,105
| —
| —
|
| Money Market Funds
| 3,880,055
| 3,880,055
| —
| —
|
| Total Investments
| $ 254,507,182
| $ 254,495,972
| $—
| $ 11,210
|
| *
| See Portfolio of Investments for country breakout.
|
Level 3 investments are
fair valued by the Advisor’s Pricing Committee and are footnoted in the Portfolio of Investments. Level 3 investments values are based on unobservable and non-quantitative inputs.
See Notes to Financial
Statements
Page 43
First Trust Latin America AlphaDEX® Fund (FLN)
Portfolio of Investments
December 31, 2022
| Shares
|
| Description
|
| Value
|
| COMMON STOCKS (a) – 98.4%
|
|
|
| Brazil – 62.3%
|
|
|
| 152,109
|
| Ambev S.A.
|
| $418,320
|
| 244,571
|
| Atacadao S.A.
|
| 684,646
|
| 476,567
|
| Banco Bradesco S.A. (Preference Shares)
|
| 1,367,487
|
| 306,824
|
| Banco do Brasil S.A.
|
| 2,018,277
|
| 180,166
|
| Braskem S.A., Class A (Preference Shares)
|
| 810,785
|
| 277,764
|
| Caixa Seguridade Participacoes S.A.
|
| 439,288
|
| 377,298
|
| CCR S.A.
|
| 773,212
|
| 55,010
|
| Centrais Eletricas Brasileiras S.A.
|
| 438,851
|
| 142,970
|
| Cia de Saneamento Basico do Estado de Sao Paulo
|
| 1,547,832
|
| 308,721
|
| Cia de Transmissao de Energia Electrica Paulista (Preference Shares)
|
| 1,344,871
|
| 439,363
|
| Cia Energetica de Minas Gerais (Preference Shares)
|
| 927,033
|
| 1,436,945
|
| Cia Paranaense de Energia, Class B (Preference Shares)
|
| 2,152,798
|
| 743,325
|
| Cia Siderurgica Nacional S.A.
|
| 2,048,464
|
| 56,428
|
| Energisa S.A.
|
| 472,500
|
| 439,363
|
| Equatorial Energia S.A.
|
| 2,248,513
|
| 483,587
|
| Gerdau S.A. (Preference Shares)
|
| 2,690,080
|
| 213,675
|
| Hypera S.A.
|
| 1,829,274
|
| 421,200
|
| Itau Unibanco Holding S.A. (Preference Shares)
|
| 1,994,413
|
| 1,068,922
|
| Itausa S.A. (Preference Shares)
|
| 1,722,908
|
| 470,497
|
| JBS S.A.
|
| 1,959,606
|
| 130,236
|
| Klabin S.A.
|
| 492,601
|
| 254,626
|
| Lojas Renner S.A.
|
| 987,687
|
| 429,309
|
| Petro Rio S.A. (b)
|
| 3,025,633
|
| 396,606
|
| Petroleo Brasileiro S.A. (Preference Shares)
|
| 1,840,399
|
| 207,987
|
| Raia Drogasil S.A.
|
| 934,410
|
| 538,752
|
| Sendas Distribuidora S.A.
|
| 1,986,742
|
| 106,237
|
| Suzano S.A.
|
| 970,666
|
| 175,138
|
| Telefonica Brasil S.A.
|
| 1,272,133
|
| 587,030
|
| TIM S.A.
|
| 1,378,696
|
| 131,248
|
| Vale S.A.
|
| 2,209,446
|
| 274,061
|
| Vibra Energia S.A.
|
| 807,169
|
|
|
|
|
| 43,794,740
|
|
|
| Chile – 17.4%
|
|
|
| 14,745,946
|
| Banco de Chile
|
| 1,529,789
|
| 683,490
|
| Cencosud S.A.
|
| 1,124,042
|
| 31,382,115
|
| Cia Sud Americana de Vapores S.A.
|
| 2,478,752
|
| 1,136,752
|
| Empresas CMPC S.A.
|
| 1,897,468
|
| 337,545
|
| Empresas Copec S.A.
|
| 2,518,506
|
| 433,821
|
| Falabella S.A.
|
| 843,860
|
| Shares
|
| Description
|
| Value
|
|
|
|
|
| Chile (Continued)
|
|
|
| 23,232
|
| Sociedad Quimica y Minera de Chile S.A., Class B (Preference Shares)
|
| $1,878,827
|
|
|
|
|
| 12,271,244
|
|
|
| Colombia – 0.7%
|
|
|
| 71,653
|
| Bancolombia S.A. (Preference Shares)
|
| 495,866
|
|
|
| Mexico – 18.0%
|
|
|
| 181,783
|
| Arca Continental S.A.B. de C.V.
|
| 1,474,302
|
| 2,532,385
|
| Cemex S.A.B. de C.V., Series CPO (b)
|
| 1,029,251
|
| 297,877
|
| El Puerto de Liverpool S.A.B. de C.V.
|
| 1,762,513
|
| 69,619
|
| Fomento Economico Mexicano S.A.B. de C.V., Series UBD
|
| 544,298
|
| 495,273
|
| Grupo Bimbo S.A.B. de C.V., Series A
|
| 2,091,754
|
| 357,404
|
| Grupo Carso S.A.B. de C.V., Series A1
|
| 1,504,338
|
| 67,951
|
| Grupo Financiero Banorte S.A.B. de C.V., Class O
|
| 489,028
|
| 386,995
|
| Grupo Mexico S.A.B. de C.V., Series B
|
| 1,364,358
|
| 44,884
|
| Industrias Penoles S.A.B. de C.V.
|
| 548,609
|
| 1,040,542
|
| Orbia Advance Corp. S.A.B. de C.V.
|
| 1,844,904
|
|
|
|
|
| 12,653,355
|
|
|
| Total Common Stocks
|
| 69,215,205
|
|
|
| (Cost $72,612,445)
|
|
|
| REAL ESTATE INVESTMENT TRUSTS (a) – 0.7%
|
|
|
| Mexico – 0.7%
|
|
|
| 423,896
|
| Fibra Uno Administracion S.A. de C.V.
|
| 500,326
|
|
|
| (Cost $483,989)
|
|
|
|
|
| Total Investments – 99.1%
|
| 69,715,531
|
|
|
| (Cost $73,096,434)
|
|
|
|
|
| Net Other Assets and Liabilities – 0.9%
|
| 642,877
|
|
|
| Net Assets – 100.0%
|
| $70,358,408
|
| (a)
| Portfolio securities are categorized based upon their country of incorporation, which can be different from the country categorization of the Fund’s underlying index. For a
breakdown of the portfolio securities by sector, please see the Fund Performance Overview.
|
| (b)
| Non-income producing security.
|
Page 44
See Notes to Financial
Statements
First Trust Latin America AlphaDEX® Fund (FLN)
Portfolio of Investments
(Continued)
December 31, 2022
Currency Exposure
Diversification
| % of Total
Investments
|
| Brazilian Real
| 62.8%
|
| Mexican Peso
| 18.9
|
| Chilean Peso
| 17.6
|
| Colombian Peso
| 0.7
|
| Total
| 100.0%
|
Valuation Inputs
A summary of the inputs
used to value the Fund’s investments as of December 31, 2022 is as follows (see Note 2A - Portfolio Valuation in the Notes to Financial Statements):
|
| Total
Value at
12/31/2022
| Level 1
Quoted
Prices
| Level 2
Significant
Observable
Inputs
| Level 3
Significant
Unobservable
Inputs
|
| Common Stocks*
| $ 69,215,205
| $ 69,215,205
| $ —
| $ —
|
| Real Estate Investment Trusts*
| 500,326
| 500,326
| —
| —
|
| Total Investments
| $ 69,715,531
| $ 69,715,531
| $—
| $—
|
| *
| See Portfolio of Investments for country breakout.
|
See Notes to Financial Statements
Page 45
First Trust Brazil AlphaDEX® Fund (FBZ)
Portfolio of Investments
December 31, 2022
| Shares
|
| Description
|
| Value
|
| COMMON STOCKS – 99.2%
|
|
|
| Aerospace & Defense – 0.8%
|
|
|
| 181,609
|
| Embraer S.A. (a)
|
| $492,225
|
|
|
| Banks – 8.5%
|
|
|
| 120,802
|
| Banco Bradesco S.A. (Preference Shares)
|
| 346,636
|
| 311,196
|
| Banco do Brasil S.A.
|
| 2,047,036
|
| 72,109
|
| Banco Santander Brasil S.A.
|
| 385,009
|
| 183,291
|
| Itau Unibanco Holding S.A. (Preference Shares)
|
| 867,896
|
| 1,096,168
|
| Itausa S.A. (Preference Shares)
|
| 1,766,824
|
|
|
|
|
| 5,413,401
|
|
|
| Chemicals – 3.6%
|
|
|
| 167,370
|
| Braskem S.A., Class A (Preference Shares)
|
| 753,201
|
| 91,243
|
| Unipar Carbocloro S.A., Class B (Preference Shares)
|
| 1,520,961
|
|
|
|
|
| 2,274,162
|
|
|
| Containers & Packaging – 0.6%
|
|
|
| 102,837
|
| Klabin S.A.
|
| 388,968
|
|
|
| Diversified Telecommunication
Services – 1.5%
|
|
|
| 132,447
|
| Telefonica Brasil S.A.
|
| 962,042
|
|
|
| Electric Utilities – 17.4%
|
|
|
| 224,882
|
| Centrais Eletricas Brasileiras S.A.
|
| 1,794,030
|
| 271,350
|
| Cia de Transmissao de Energia Electrica Paulista (Preference Shares)
|
| 1,182,073
|
| 800,679
|
| Cia Energetica de Minas Gerais (Preference Shares)
|
| 1,689,391
|
| 1,521,032
|
| Cia Paranaense de Energia, Class B (Preference Shares)
|
| 2,278,775
|
| 405,216
|
| EDP - Energias do Brasil S.A.
|
| 1,595,614
|
| 103,000
|
| Energisa S.A.
|
| 862,471
|
| 181,948
|
| Equatorial Energia S.A.
|
| 931,149
|
| 107,604
|
| Transmissora Alianca de Energia Eletrica S.A.
|
| 706,592
|
|
|
|
|
| 11,040,095
|
|
|
| Food & Staples Retailing – 3.1%
|
|
|
| 124,643
|
| Atacadao S.A.
|
| 348,923
|
| 436,790
|
| Sendas Distribuidora S.A.
|
| 1,610,739
|
|
|
|
|
| 1,959,662
|
|
|
| Food Products – 7.8%
|
|
|
| 263,074
|
| JBS S.A.
|
| 1,095,695
|
| 238,824
|
| M. Dias Branco S.A.
|
| 1,620,733
|
| 114,396
|
| Sao Martinho S.A.
|
| 574,607
|
| 188,324
|
| SLC Agricola S.A.
|
| 1,673,238
|
|
|
|
|
| 4,964,273
|
| Shares
|
| Description
|
| Value
|
|
|
|
|
| Independent Power &
Renewable Electricity Producers – 2.7%
|
|
|
| 422,017
|
| Eneva S.A. (a)
|
| $953,580
|
| 100,635
|
| Engie Brasil Energia S.A.
|
| 722,014
|
|
|
|
|
| 1,675,594
|
|
|
| Insurance – 4.7%
|
|
|
| 240,123
|
| BB Seguridade Participacoes S.A.
|
| 1,533,131
|
| 599,643
|
| Caixa Seguridade Participacoes S.A.
|
| 948,344
|
| 116,981
|
| Porto Seguro S.A.
|
| 512,924
|
|
|
|
|
| 2,994,399
|
|
|
| Internet & Direct Marketing
Retail – 0.9%
|
|
|
| 309,392
|
| Americanas S.A.
|
| 565,488
|
|
|
| IT Services – 3.5%
|
|
|
| 2,216,274
|
| Cielo S.A.
|
| 2,199,588
|
|
|
| Metals & Mining – 19.5%
|
|
|
| 411,588
|
| Bradespar S.A. (Preference Shares)
|
| 2,316,851
|
| 672,837
|
| Cia Siderurgica Nacional S.A.
|
| 1,854,212
|
| 464,829
|
| Gerdau S.A. (Preference Shares)
|
| 2,585,734
|
| 870,261
|
| Metalurgica Gerdau S.A. (Preference Shares)
|
| 2,137,845
|
| 1,200,998
|
| Usinas Siderurgicas de Minas Gerais S.A., Class A (Preference Shares)
|
| 1,628,703
|
| 108,562
|
| Vale S.A.
|
| 1,827,547
|
|
|
|
|
| 12,350,892
|
|
|
| Oil, Gas & Consumable Fuels – 10.9%
|
|
|
| 228,313
|
| Cosan S.A.
|
| 740,323
|
| 472,416
|
| Petro Rio S.A. (a)
|
| 3,329,438
|
| 371,971
|
| Petroleo Brasileiro S.A. (Preference Shares)
|
| 1,726,083
|
| 452,679
|
| Raizen S.A. (Preference Shares)
|
| 320,663
|
| 337,565
|
| Ultrapar Participacoes S.A.
|
| 806,230
|
|
|
|
|
| 6,922,737
|
|
|
| Paper & Forest Products – 1.8%
|
|
|
| 125,449
|
| Suzano S.A.
|
| 1,146,202
|
|
|
| Personal Products – 0.5%
|
|
|
| 154,833
|
| Natura & Co. Holding S.A.
|
| 340,473
|
|
|
| Pharmaceuticals – 3.7%
|
|
|
| 273,113
|
| Hypera S.A.
|
| 2,338,124
|
|
|
| Real Estate Management &
Development – 0.6%
|
|
|
| 94,655
|
| Multiplan Empreendimentos Imobiliarios S.A.
|
| 392,622
|
Page 46
See Notes to Financial
Statements
First Trust Brazil AlphaDEX® Fund (FBZ)
Portfolio of Investments
(Continued)
December 31, 2022
| Shares
|
| Description
|
| Value
|
| COMMON STOCKS (Continued)
|
|
|
| Specialty Retail – 0.6%
|
|
|
| 124,354
|
| Vibra Energia S.A.
|
| $366,249
|
|
|
| Transportation Infrastructure – 2.2%
|
|
|
| 663,265
|
| CCR S.A.
|
| 1,359,255
|
|
|
| Water Utilities – 2.5%
|
|
|
| 147,806
|
| Cia de Saneamento Basico do Estado de Sao Paulo
|
| 1,600,188
|
|
|
| Wireless Telecommunication
Services – 1.8%
|
|
|
| 488,489
|
| TIM S.A.
|
| 1,147,263
|
|
|
| Total Investments – 99.2%
|
| 62,893,902
|
|
|
| (Cost $63,417,736)
|
|
|
|
|
| Net Other Assets and Liabilities – 0.8%
|
| 483,378
|
|
|
| Net Assets – 100.0%
|
| $63,377,280
|
| (a)
| Non-income producing security.
|
| Country Allocation†
| % of Net
Assets
|
| Brazil
| 99.2%
|
| Total Investments
| 99.2
|
| Net Other Assets and Liabilities
| 0.8
|
| Total
| 100.0%
|
† Portfolio
securities are categorized based upon their country of incorporation, which can be different from the country categorization of the Fund’s underlying index.
Currency Exposure
Diversification
| % of Total
Investments
|
| Brazilian Real
| 100.0%
|
Valuation Inputs
A summary of the inputs
used to value the Fund’s investments as of December 31, 2022 is as follows (see Note 2A - Portfolio Valuation in the Notes to Financial Statements):
|
| Total
Value at
12/31/2022
| Level 1
Quoted
Prices
| Level 2
Significant
Observable
Inputs
| Level 3
Significant
Unobservable
Inputs
|
| Common Stocks*
| $ 62,893,902
| $ 62,893,902
| $ —
| $ —
|
| *
| See Portfolio of Investments for industry breakout.
|
See Notes to Financial
Statements
Page 47
First Trust China AlphaDEX® Fund (FCA)
Portfolio of Investments
December 31, 2022
| Shares
|
| Description
|
| Value
|
| COMMON STOCKS – 99.8%
|
|
|
| Air Freight & Logistics – 1.8%
|
|
|
| 412,000
|
| Sinotrans Ltd., Class H
|
| $134,070
|
|
|
| Airlines – 1.6%
|
|
|
| 136,000
|
| Air China Ltd., Class H (a)
|
| 121,095
|
|
|
| Automobiles – 5.6%
|
|
|
| 4,272
|
| BYD Co., Ltd., Class H
|
| 105,412
|
| 311,880
|
| Dongfeng Motor Group Co., Ltd., Class H
|
| 179,006
|
| 62,000
|
| Guangzhou Automobile Group Co., Ltd., Class H
|
| 41,781
|
| 60,000
|
| Yadea Group Holdings Ltd. (b) (c)
|
| 100,391
|
|
|
|
|
| 426,590
|
|
|
| Banks – 0.7%
|
|
|
| 183,000
|
| China Everbright Bank Co., Ltd., Class H
|
| 55,799
|
|
|
| Beverages – 0.8%
|
|
|
| 3,789
|
| Anhui Gujing Distillery Co., Ltd., Class B
|
| 60,679
|
|
|
| Capital Markets – 1.4%
|
|
|
| 754,000
|
| China Cinda Asset Management Co., Ltd., Class H
|
| 104,327
|
|
|
| Commercial Services &
Supplies – 1.8%
|
|
|
| 300,000
|
| China Everbright Environment Group Ltd.
|
| 134,137
|
|
|
| Construction & Engineering – 7.8%
|
|
|
| 135,517
|
| China Conch Venture Holdings Ltd.
|
| 294,457
|
| 287,000
|
| China Railway Group Ltd., Class H
|
| 151,489
|
| 78,800
|
| Xinte Energy Co., Ltd., Class H
|
| 145,779
|
|
|
|
|
| 591,725
|
|
|
| Construction Materials – 6.8%
|
|
|
| 54,356
|
| Anhui Conch Cement Co., Ltd., Class H
|
| 190,113
|
| 166,000
|
| China National Building Material Co., Ltd., Class H
|
| 136,323
|
| 351,822
|
| China Resources Cement Holdings Ltd.
|
| 186,606
|
|
|
|
|
| 513,042
|
|
|
| Diversified Financial Services – 0.7%
|
|
|
| 70,000
|
| Far East Horizon Ltd.
|
| 54,705
|
|
|
| Diversified Telecommunication
Services – 0.7%
|
|
|
| 459,403
|
| China Tower Corp., Ltd., Class H (b) (c)
|
| 49,440
|
| Shares
|
| Description
|
| Value
|
|
|
|
|
| Electronic Equipment,
Instruments & Components – 7.4%
|
|
|
| 349,554
|
| BOE Technology Group Co., Ltd., Class B
|
| $154,055
|
| 77,950
|
| Kingboard Holdings Ltd.
|
| 248,167
|
| 143,500
|
| Kingboard Laminates Holdings Ltd.
|
| 157,740
|
|
|
|
|
| 559,962
|
|
|
| Gas Utilities – 6.2%
|
|
|
| 66,500
|
| Beijing Enterprises Holdings Ltd.
|
| 212,992
|
| 361,400
|
| Kunlun Energy Co., Ltd.
|
| 257,897
|
|
|
|
|
| 470,889
|
|
|
| Health Care Providers &
Services – 1.6%
|
|
|
| 48,800
|
| Sinopharm Group Co., Ltd., Class H
|
| 124,041
|
|
|
| Hotels, Restaurants &
Leisure – 1.3%
|
|
|
| 466,000
|
| Haichang Ocean Park Holdings Ltd. (a) (b) (c)
|
| 95,523
|
|
|
| Independent Power &
Renewable Electricity Producers – 1.3%
|
|
|
| 93,000
|
| China Power International Development Ltd.
|
| 39,319
|
| 118,000
|
| Huaneng Power International, Inc., Class H (a)
|
| 55,784
|
|
|
|
|
| 95,103
|
|
|
| Industrial Conglomerates – 1.4%
|
|
|
| 128,000
|
| Fosun International Ltd.
|
| 104,296
|
|
|
| Insurance – 1.4%
|
|
|
| 114,068
|
| PICC Property & Casualty Co., Ltd., Class H
|
| 108,289
|
|
|
| Marine – 2.8%
|
|
|
| 211,490
|
| COSCO SHIPPING Holdings Co., Ltd., Class H
|
| 215,678
|
|
|
| Metals & Mining – 12.7%
|
|
|
| 792,200
|
| Angang Steel Co., Ltd., Class H
|
| 216,180
|
| 209,265
|
| China Hongqiao Group Ltd.
|
| 197,591
|
| 318,000
|
| CMOC Group Ltd., Class H
|
| 146,667
|
| 134,467
|
| Inner Mongolia ERDOS Resources Co., Ltd., Class B
|
| 219,047
|
| 584,000
|
| Maanshan Iron & Steel Co., Ltd., Class H
|
| 136,171
|
| 160,000
|
| MMG Ltd. (a)
|
| 40,997
|
|
|
|
|
| 956,653
|
Page 48
See Notes to Financial
Statements
First Trust China AlphaDEX® Fund (FCA)
Portfolio of Investments
(Continued)
December 31, 2022
| Shares
|
| Description
|
| Value
|
| COMMON STOCKS (Continued)
|
|
|
| Oil, Gas & Consumable Fuels – 9.9%
|
|
|
| 348,836
|
| China Coal Energy Co., Ltd., Class H
|
| $283,790
|
| 180,288
|
| Inner Mongolia Yitai Coal Co., Ltd., Class B
|
| 238,160
|
| 74,534
|
| Yankuang Energy Group Co., Ltd., Class H
|
| 227,266
|
|
|
|
|
| 749,216
|
|
|
| Pharmaceuticals – 4.7%
|
|
|
| 435,000
|
| China Resources Pharmaceutical Group Ltd. (b) (c)
|
| 352,215
|
|
|
| Real Estate Management &
Development – 14.8%
|
|
|
| 87,000
|
| C&D International Investment Group Ltd.
|
| 253,573
|
| 56,272
|
| China Overseas Land & Investment Ltd.
|
| 148,512
|
| 12,200
|
| China Resources Land Ltd.
|
| 55,878
|
| 95,000
|
| Country Garden Holdings Co., Ltd.
|
| 32,496
|
| 142,500
|
| Greentown China Holdings Ltd.
|
| 208,124
|
| 240,000
|
| Seazen Group Ltd. (a)
|
| 88,861
|
| 171,300
|
| Sunac China Holdings
Ltd. (a) (d) (e) (f)
|
| 50,257
|
| 230,000
|
| Yuexiu Property Co., Ltd.
|
| 278,459
|
|
|
|
|
| 1,116,160
|
|
|
| Semiconductors &
Semiconductor Equipment – 2.2%
|
|
|
| 45,000
|
| Shanghai Fudan Microelectronics Group Co., Ltd., Class H
|
| 170,073
|
|
|
| Trading Companies &
Distributors – 1.0%
|
|
|
| 591,000
|
| COSCO SHIPPING Development Co., Ltd., Class H
|
| 78,745
|
|
|
| Transportation Infrastructure – 1.4%
|
|
|
| 70,000
|
| China Merchants Port Holdings Co., Ltd.
|
| 102,595
|
|
|
| Total Investments – 99.8%
|
| 7,545,047
|
|
|
| (Cost $9,199,720)
|
|
|
|
|
| Net Other Assets and Liabilities – 0.2%
|
| 14,862
|
|
|
| Net Assets – 100.0%
|
| $7,559,909
|
| (a)
| Non-income producing security.
|
| (b)
| This security may be resold to qualified foreign investors and foreign institutional buyers under Regulation S of the Securities Act of 1933, as amended (the
“1933 Act”).
|
| (c)
| This security is exempt from registration upon resale under Rule 144A of the 1933 Act and may be resold in transactions exempt from registration, normally to qualified institutional
buyers. This security is not restricted on the foreign exchange where it trades freely without any additional registration. As such, it does not require the additional disclosure required of restricted securities.
|
| (d)
| This security is fair valued by the Advisor’s Pricing Committee in accordance with procedures approved by the Trust’s Board of Trustees, and in accordance with the
provisions of the Investment Company Act of 1940 and rules thereunder, as amended. At December 31, 2022, securities noted as such are valued at $50,257 or 0.7% of net assets.
|
| (e)
| Pursuant to procedures adopted by the Trust’s Board of Trustees, this security has been determined to be illiquid by First Trust Advisors L.P., the Fund’s advisor.
|
| (f)
| This security’s value was determined using significant unobservable inputs (see Note 2A – Portfolio Valuation in the Notes to Financial Statements).
|
| Country Allocation†
| % of Net
Assets
|
| China
| 50.9%
|
| Cayman Islands
| 26.1
|
| Hong Kong
| 19.4
|
| Bermuda
| 3.4
|
| Total Investments
| 99.8
|
| Net Other Assets and Liabilities
| 0.2
|
| Total
| 100.0%
|
† Portfolio
securities are categorized based upon their country of incorporation, which can be different from the country categorization of the Fund’s underlying index.
Currency Exposure
Diversification
| % of Total
Investments
|
| Hong Kong Dollar
| 93.9%
|
| United States Dollar
| 6.1
|
| Total
| 100.0%
|
See Notes
to Financial Statements
Page 49
First Trust China AlphaDEX® Fund (FCA)
Portfolio of Investments
(Continued)
December 31, 2022
Valuation Inputs
A summary of the inputs
used to value the Fund’s investments as of December 31, 2022 is as follows (see Note 2A - Portfolio Valuation in the Notes to Financial Statements):
|
| Total
Value at
12/31/2022
| Level 1
Quoted
Prices
| Level 2
Significant
Observable
Inputs
| Level 3
Significant
Unobservable
Inputs
|
| Common Stocks:
|
|
|
|
|
| Real Estate Management & Development
| $ 1,116,160
| $ 1,065,903
| $ —
| $ 50,257
|
| Other Industry Categories*
| 6,428,887
| 6,428,887
| —
| —
|
| Total Investments
| $ 7,545,047
| $ 7,494,790
| $—
| $ 50,257
|
| *
| See Portfolio of Investments for industry breakout.
|
Level 3 investments are
fair valued by the Advisor’s Pricing Committee and are footnoted in the Portfolio of Investments. The Level 3 investments values are based on unobservable and non-quantitative inputs.
Page 50
See Notes to Financial Statements
First Trust Japan AlphaDEX® Fund (FJP)
Portfolio of Investments
December 31, 2022
| Shares
|
| Description
|
| Value
|
| COMMON STOCKS – 99.9%
|
|
|
| Airlines – 0.4%
|
|
|
| 15,900
|
| Japan Airlines Co., Ltd. (a)
|
| $326,505
|
|
|
| Auto Components – 3.2%
|
|
|
| 27,400
|
| Aisin Corp.
|
| 736,986
|
| 76,300
|
| NGK Spark Plug Co., Ltd.
|
| 1,417,980
|
| 50,800
|
| Sumitomo Electric Industries Ltd.
|
| 582,357
|
|
|
|
|
| 2,737,323
|
|
|
| Automobiles – 6.8%
|
|
|
| 23,400
|
| Honda Motor Co., Ltd.
|
| 540,604
|
| 50,800
|
| Isuzu Motors Ltd.
|
| 598,808
|
| 135,700
|
| Mazda Motor Corp.
|
| 1,039,153
|
| 410,900
|
| Mitsubishi Motors Corp. (a)
|
| 1,596,762
|
| 143,100
|
| Nissan Motor Co., Ltd.
|
| 455,883
|
| 15,800
|
| Subaru Corp.
|
| 244,091
|
| 60,400
|
| Yamaha Motor Co., Ltd. (b)
|
| 1,385,279
|
|
|
|
|
| 5,860,580
|
|
|
| Beverages – 0.6%
|
|
|
| 15,100
|
| Suntory Beverage & Food Ltd.
|
| 517,754
|
|
|
| Building Products – 1.2%
|
|
|
| 31,800
|
| AGC, Inc. (b)
|
| 1,064,927
|
|
|
| Capital Markets – 1.0%
|
|
|
| 43,000
|
| SBI Holdings, Inc.
|
| 824,680
|
|
|
| Chemicals – 8.5%
|
|
|
| 108,700
|
| Asahi Kasei Corp.
|
| 779,718
|
| 152,900
|
| Mitsubishi Chemical Group Corp.
|
| 797,704
|
| 57,100
|
| Mitsubishi Gas Chemical Co., Inc.
|
| 793,152
|
| 64,700
|
| Mitsui Chemicals, Inc.
|
| 1,466,645
|
| 283,800
|
| Sumitomo Chemical Co., Ltd.
|
| 1,025,001
|
| 197,200
|
| Toray Industries, Inc.
|
| 1,106,808
|
| 111,700
|
| Tosoh Corp.
|
| 1,336,247
|
|
|
|
|
| 7,305,275
|
|
|
| Commercial Services &
Supplies – 1.7%
|
|
|
| 25,000
|
| Dai Nippon Printing Co., Ltd.
|
| 504,800
|
| 67,000
|
| Toppan, Inc.
|
| 997,547
|
|
|
|
|
| 1,502,347
|
|
|
| Construction & Engineering – 4.0%
|
|
|
| 64,300
|
| JGC Holdings Corp.
|
| 822,123
|
| 72,400
|
| Kajima Corp.
|
| 847,351
|
| 115,100
|
| Obayashi Corp.
|
| 875,265
|
| 27,100
|
| Taisei Corp.
|
| 877,591
|
|
|
|
|
| 3,422,330
|
|
|
| Diversified Financial Services – 1.7%
|
|
|
| 240,300
|
| Mitsubishi HC Capital, Inc.
|
| 1,188,317
|
| Shares
|
| Description
|
| Value
|
|
|
|
|
| Diversified Financial
Services (Continued)
|
|
|
| 8,200
|
| Tokyo Century Corp.
|
| $279,914
|
|
|
|
|
| 1,468,231
|
|
|
| Diversified Telecommunication
Services – 0.7%
|
|
|
| 19,600
|
| Nippon Telegraph & Telephone Corp.
|
| 561,835
|
|
|
| Electric Utilities – 2.4%
|
|
|
| 84,100
|
| Kansai Electric Power (The) Co., Inc.
|
| 819,597
|
| 332,100
|
| Tokyo Electric Power Co., Holdings, Inc. (a)
|
| 1,204,508
|
|
|
|
|
| 2,024,105
|
|
|
| Electronic Equipment,
Instruments & Components – 1.7%
|
|
|
| 9,100
|
| Ibiden Co., Ltd.
|
| 331,785
|
| 8,100
|
| Taiyo Yuden Co., Ltd.
|
| 236,384
|
| 27,400
|
| TDK Corp.
|
| 905,052
|
|
|
|
|
| 1,473,221
|
|
|
| Food & Staples Retailing – 0.4%
|
|
|
| 7,400
|
| MatsukiyoCocokara & Co.
|
| 372,143
|
|
|
| Food Products – 2.3%
|
|
|
| 5,000
|
| MEIJI Holdings Co., Ltd.
|
| 256,781
|
| 27,000
|
| NH Foods Ltd.
|
| 756,058
|
| 8,000
|
| Nissin Foods Holdings Co., Ltd.
|
| 635,172
|
| 4,500
|
| Yakult Honsha Co., Ltd.
|
| 293,508
|
|
|
|
|
| 1,941,519
|
|
|
| Gas Utilities – 2.9%
|
|
|
| 72,400
|
| Osaka Gas Co., Ltd.
|
| 1,175,038
|
| 67,300
|
| Tokyo Gas Co., Ltd.
|
| 1,325,590
|
|
|
|
|
| 2,500,628
|
|
|
| Health Care Equipment &
Supplies – 0.3%
|
|
|
| 13,100
|
| Olympus Corp.
|
| 234,770
|
|
|
| Hotels, Restaurants &
Leisure – 1.0%
|
|
|
| 35,100
|
| Zensho Holdings Co., Ltd.
|
| 885,256
|
|
|
| Household Durables – 4.8%
|
|
|
| 71,300
|
| Haseko Corp.
|
| 800,251
|
| 90,800
|
| Iida Group Holdings Co., Ltd.
|
| 1,384,416
|
| 120,100
|
| Nikon Corp.
|
| 1,076,178
|
| 68,400
|
| Panasonic Holdings Corp.
|
| 578,773
|
| 15,900
|
| Sekisui House Ltd.
|
| 282,709
|
|
|
|
|
| 4,122,327
|
See Notes to Financial
Statements
Page 51
First Trust Japan AlphaDEX® Fund (FJP)
Portfolio of Investments
(Continued)
December 31, 2022
| Shares
|
| Description
|
| Value
|
| COMMON STOCKS (Continued)
|
|
|
| Industrial Conglomerates – 1.4%
|
|
|
| 5,100
|
| Hitachi Ltd.
|
| $260,013
|
| 27,600
|
| Toshiba Corp.
|
| 968,019
|
|
|
|
|
| 1,228,032
|
|
|
| Insurance – 7.1%
|
|
|
| 44,600
|
| Dai-ichi Life Holdings, Inc.
|
| 1,017,467
|
| 39,200
|
| Japan Post Holdings Co., Ltd.
|
| 331,396
|
| 68,800
|
| Japan Post Insurance Co., Ltd.
|
| 1,216,739
|
| 27,500
|
| MS&AD Insurance Group Holdings, Inc.
|
| 885,096
|
| 31,700
|
| Sompo Holdings, Inc.
|
| 1,415,437
|
| 56,700
|
| Tokio Marine Holdings, Inc.
|
| 1,221,573
|
|
|
|
|
| 6,087,708
|
|
|
| IT Services – 0.3%
|
|
|
| 7,500
|
| NEC Corp.
|
| 264,877
|
|
|
| Leisure Products – 0.9%
|
|
|
| 52,000
|
| Sega Sammy Holdings, Inc.
|
| 791,253
|
|
|
| Machinery – 5.8%
|
|
|
| 24,600
|
| Hitachi Construction Machinery Co., Ltd.
|
| 554,643
|
| 40,900
|
| IHI Corp.
|
| 1,198,267
|
| 24,600
|
| Komatsu Ltd.
|
| 539,086
|
| 39,800
|
| Mitsubishi Heavy Industries Ltd.
|
| 1,587,269
|
| 82,900
|
| NGK Insulators Ltd.
|
| 1,059,937
|
|
|
|
|
| 4,939,202
|
|
|
| Marine – 5.1%
|
|
|
| 68,300
|
| Kawasaki Kisen Kaisha Ltd. (b)
|
| 1,450,412
|
| 60,400
|
| Mitsui OSK Lines Ltd. (b)
|
| 1,514,142
|
| 60,600
|
| Nippon Yusen KK (b)
|
| 1,436,041
|
|
|
|
|
| 4,400,595
|
|
|
| Metals & Mining – 5.7%
|
|
|
| 131,700
|
| JFE Holdings, Inc.
|
| 1,541,384
|
| 99,400
|
| Nippon Steel Corp.
|
| 1,735,940
|
| 44,200
|
| Sumitomo Metal Mining Co., Ltd.
|
| 1,573,135
|
|
|
|
|
| 4,850,459
|
|
|
| Multiline Retail – 0.9%
|
|
|
| 68,300
|
| Isetan Mitsukoshi Holdings Ltd.
|
| 747,844
|
|
|
| Oil, Gas & Consumable Fuels – 4.6%
|
|
|
| 367,000
|
| ENEOS Holdings, Inc.
|
| 1,252,789
|
| 57,000
|
| Idemitsu Kosan Co., Ltd.
|
| 1,333,359
|
| 127,900
|
| Inpex Corp. (b)
|
| 1,360,472
|
|
|
|
|
| 3,946,620
|
|
|
| Paper & Forest Products – 1.2%
|
|
|
| 256,100
|
| Oji Holdings Corp.
|
| 1,036,186
|
| Shares
|
| Description
|
| Value
|
|
|
|
|
| Pharmaceuticals – 1.9%
|
|
|
| 11,400
|
| Daiichi Sankyo Co., Ltd.
|
| $369,171
|
| 21,000
|
| Ono Pharmaceutical Co., Ltd.
|
| 493,318
|
| 103,600
|
| Sumitomo Pharma Co., Ltd.
|
| 788,604
|
|
|
|
|
| 1,651,093
|
|
|
| Real Estate Management &
Development – 2.3%
|
|
|
| 19,500
|
| Mitsubishi Estate Co., Ltd.
|
| 254,225
|
| 12,500
|
| Mitsui Fudosan Co., Ltd.
|
| 230,208
|
| 44,800
|
| Nomura Real Estate Holdings, Inc.
|
| 966,047
|
| 104,900
|
| Tokyu Fudosan Holdings Corp.
|
| 501,960
|
|
|
|
|
| 1,952,440
|
|
|
| Road & Rail – 3.1%
|
|
|
| 20,200
|
| Hankyu Hanshin Holdings, Inc.
|
| 603,353
|
| 8,500
|
| Kintetsu Group Holdings Co., Ltd.
|
| 282,059
|
| 27,000
|
| Kyushu Railway Co.
|
| 601,143
|
| 104,900
|
| Seibu Holdings, Inc.
|
| 1,152,589
|
|
|
|
|
| 2,639,144
|
|
|
| Semiconductors &
Semiconductor Equipment – 1.3%
|
|
|
| 20,900
|
| Shinko Electric Industries Co., Ltd.
|
| 539,858
|
| 43,200
|
| SUMCO Corp. (b)
|
| 578,348
|
|
|
|
|
| 1,118,206
|
|
|
| Specialty Retail – 1.2%
|
|
|
| 3,100
|
| Hikari Tsushin, Inc.
|
| 439,820
|
| 3,500
|
| Shimamura Co., Ltd.
|
| 349,360
|
| 76,700
|
| Yamada Holdings Co., Ltd.
|
| 272,927
|
|
|
|
|
| 1,062,107
|
|
|
| Technology Hardware,
Storage & Peripherals – 2.2%
|
|
|
| 47,700
|
| Brother Industries Ltd.
|
| 729,457
|
| 79,000
|
| Seiko Epson Corp.
|
| 1,159,357
|
|
|
|
|
| 1,888,814
|
|
|
| Trading Companies &
Distributors – 9.3%
|
|
|
| 20,300
|
| ITOCHU Corp.
|
| 641,297
|
| 123,400
|
| Marubeni Corp.
|
| 1,424,497
|
| 28,000
|
| Mitsubishi Corp.
|
| 913,777
|
| 50,900
|
| Mitsui & Co., Ltd.
|
| 1,494,344
|
| 78,900
|
| Sojitz Corp.
|
| 1,510,787
|
| 80,700
|
| Sumitomo Corp.
|
| 1,350,329
|
| 16,600
|
| Toyota Tsusho Corp.
|
| 617,883
|
|
|
|
|
| 7,952,914
|
|
|
| Total Common Stocks
|
| 85,703,250
|
|
|
| (Cost $86,282,639)
|
|
|
Page 52
See Notes to Financial
Statements
First Trust Japan AlphaDEX® Fund (FJP)
Portfolio of Investments
(Continued)
December 31, 2022
| Shares
|
| Description
|
| Value
|
| MONEY MARKET FUNDS – 5.1%
|
| 4,329,690
|
| Goldman Sachs Financial Square Treasury Obligations Fund - Institutional Class - 4.14% (c) (d)
|
| $4,329,690
|
|
|
| (Cost $4,329,690)
|
|
|
|
|
| Total Investments – 105.0%
|
| 90,032,940
|
|
|
| (Cost $90,612,329)
|
|
|
|
|
| Net Other Assets and Liabilities – (5.0)%
|
| (4,264,573)
|
|
|
| Net Assets – 100.0%
|
| $85,768,367
|
| (a)
| Non-income producing security.
|
| (b)
| All or a portion of this security is on loan (see Note 2F - Securities Lending in the Notes to Financial Statements). The remaining contractual maturity of all of the securities
lending transactions is overnight and continuous. The aggregate value of such securities is $4,081,930 and the total value of the collateral held by the Fund is $4,329,690.
|
| (c)
| Rate shown reflects yield as of December 31, 2022.
|
| (d)
| This security serves as collateral for securities on loan.
|
Offsetting Assets and Liabilities
Offsetting assets and
liabilities requires entities to disclose both gross and net information about instruments and transactions eligible for offset, and to disclose instruments and transactions subject to master netting or similar
agreements (see Note 2E – Offsetting on the Statements of Assets and Liabilities in the Notes to Financial Statements).
The Fund’s loaned
securities were all subject to an enforceable Securities Lending Agency Agreement. Securities lent in accordance with the Securities Lending Agency Agreement on a gross basis were as follows:
| Securities Lending Agency Agreement
|
|
| Total gross amount presented on the Statements of Assets and Liabilities (1)
| $4,081,930
|
| Non-cash Collateral (2)
| (4,081,930)
|
| Net Amount
| $—
|
| (1)
| The amount presented on the Statements of Assets and Liabilities, which is included in “Investments, at value,” is not offset and is shown on a gross basis.
|
| (2)
| At December 31, 2022, the value of the collateral received from each borrower exceeded the value of the related securities loaned. This amount is disclosed on the
Portfolio of Investments.
|
| Country Allocation†
| % of Net
Assets
|
| Japan
| 99.9%
|
| United States
| 5.1
|
| Total Investments
| 105.0
|
| Net Other Assets and Liabilities
| (5.0)
|
| Total
| 100.0%
|
† Portfolio
securities are categorized based upon their country of incorporation, which can be different from the country categorization of the Fund’s underlying index.
Currency Exposure
Diversification
| % of Total
Investments
|
| Japanese Yen
| 95.2%
|
| United States Dollar
| 4.8
|
| Total
| 100.0%
|
Valuation Inputs
A summary of the inputs
used to value the Fund’s investments as of December 31, 2022 is as follows (see Note 2A - Portfolio Valuation in the Notes to Financial Statements):
|
| Total
Value at
12/31/2022
| Level 1
Quoted
Prices
| Level 2
Significant
Observable
Inputs
| Level 3
Significant
Unobservable
Inputs
|
| Common Stocks*
| $ 85,703,250
| $ 85,703,250
| $ —
| $ —
|
| Money Market Funds
| 4,329,690
| 4,329,690
| —
| —
|
| Total Investments
| $ 90,032,940
| $ 90,032,940
| $—
| $—
|
| *
| See Portfolio of Investments for industry breakout.
|
See Notes to Financial
Statements
Page 53
First Trust Developed Markets ex-US
AlphaDEX® Fund (FDT)
Portfolio of Investments
December 31, 2022
| Shares
|
| Description
|
| Value
|
| COMMON STOCKS (a) – 93.2%
|
|
|
| Australia – 5.5%
|
|
|
| 225,794
|
| Allkem Ltd. (b)
|
| $1,727,946
|
| 21,755
|
| Ampol Ltd.
|
| 418,880
|
| 16,237
|
| BHP Group Ltd.
|
| 504,438
|
| 205,876
|
| BlueScope Steel Ltd.
|
| 2,360,474
|
| 109,632
|
| Brambles Ltd.
|
| 900,940
|
| 74,370
|
| Fortescue Metals Group Ltd.
|
| 1,038,520
|
| 464,443
|
| Harvey Norman Holdings Ltd.
|
| 1,305,972
|
| 91,307
|
| IGO Ltd.
|
| 836,759
|
| 534,573
|
| Incitec Pivot Ltd.
|
| 1,368,505
|
| 522,319
|
| New Hope Corp., Ltd.
|
| 2,261,749
|
| 36,965
|
| Newcrest Mining Ltd.
|
| 519,460
|
| 24,261
|
| OZ Minerals Ltd.
|
| 460,855
|
| 685,801
|
| Pilbara Minerals Ltd. (b)
|
| 1,750,978
|
| 373,775
|
| Qantas Airways Ltd. (b)
|
| 1,529,453
|
| 20,092
|
| Rio Tinto Ltd.
|
| 1,592,447
|
| 861,502
|
| South32 Ltd.
|
| 2,346,214
|
| 347,087
|
| Whitehaven Coal Ltd.
|
| 2,226,080
|
|
|
|
|
| 23,149,670
|
|
|
| Austria – 1.0%
|
|
|
| 9,233
|
| BAWAG Group AG (c) (d)
|
| 492,196
|
| 13,503
|
| CA Immobilien Anlagen AG
|
| 409,779
|
| 43,937
|
| OMV AG
|
| 2,262,257
|
| 67,238
|
| Raiffeisen Bank International AG (b)
|
| 1,104,815
|
|
|
|
|
| 4,269,047
|
|
|
| Belgium – 0.6%
|
|
|
| 38,744
|
| Proximus S.A.D.P.
|
| 373,096
|
| 20,617
|
| Solvay S.A.
|
| 2,084,682
|
|
|
|
|
| 2,457,778
|
|
|
| Canada – 11.2%
|
|
|
| 49,681
|
| Alimentation Couche-Tard, Inc.
|
| 2,183,175
|
| 62,671
|
| AltaGas Ltd.
|
| 1,082,163
|
| 133,225
|
| ARC Resources Ltd.
|
| 1,795,684
|
| 36,520
|
| Aritzia, Inc. (b)
|
| 1,277,121
|
| 373,345
|
| B2Gold Corp.
|
| 1,326,285
|
| 17,186
|
| Canadian Natural Resources Ltd.
|
| 954,369
|
| 47,126
|
| Capital Power Corp.
|
| 1,612,517
|
| 16,504
|
| CCL Industries, Inc., Class B
|
| 705,016
|
| 78,436
|
| Cenovus Energy, Inc.
|
| 1,521,797
|
| 326,095
|
| Crescent Point Energy Corp.
|
| 2,326,498
|
| 13,936
|
| Dollarama, Inc.
|
| 815,060
|
| 67,798
|
| Element Fleet Management Corp.
|
| 923,835
|
| 141,245
|
| Enerplus Corp.
|
| 2,493,172
|
| 1,752
|
| Fairfax Financial Holdings Ltd.
|
| 1,037,834
|
| 46,192
|
| Imperial Oil Ltd.
|
| 2,249,898
|
| 11,306
|
| Intact Financial Corp.
|
| 1,627,513
|
| 316,648
|
| Lundin Mining Corp.
|
| 1,943,386
|
| 142,963
|
| MEG Energy Corp. (b)
|
| 1,990,290
|
| 19,186
|
| Nutrien Ltd.
|
| 1,400,691
|
| 34,883
|
| Onex Corp.
|
| 1,682,061
|
| 50,339
|
| Saputo, Inc.
|
| 1,246,206
|
| Shares
|
| Description
|
| Value
|
|
|
|
|
| Canada (Continued)
|
|
|
| 13,292
|
| Spin Master Corp. (c) (d)
|
| $327,097
|
| 9,121
|
| Stantec, Inc.
|
| 437,054
|
| 42,613
|
| Suncor Energy, Inc.
|
| 1,351,720
|
| 65,764
|
| Teck Resources Ltd., Class B
|
| 2,485,335
|
| 17,680
|
| TFI International, Inc.
|
| 1,770,742
|
| 31,653
|
| Tourmaline Oil Corp.
|
| 1,597,144
|
| 93,431
|
| Vermilion Energy, Inc.
|
| 1,654,019
|
| 5,921
|
| Waste Connections, Inc.
|
| 784,860
|
| 27,647
|
| West Fraser Timber Co., Ltd.
|
| 1,996,342
|
| 316,105
|
| Whitecap Resources, Inc. (e)
|
| 2,507,362
|
|
|
|
|
| 47,106,246
|
|
|
| Cayman Islands – 1.2%
|
|
|
| 66,925
|
| CK Asset Holdings Ltd.
|
| 411,987
|
| 218,373
|
| CK Hutchison Holdings Ltd.
|
| 1,310,722
|
| 826,967
|
| Shimao Group Holdings Ltd. (b) (f) (g) (h)
|
| 234,144
|
| 1,711,130
|
| Sino Biopharmaceutical Ltd.
|
| 1,001,847
|
| 651,730
|
| SITC International Holdings Co., Ltd.
|
| 1,449,504
|
| 1,275,666
|
| WH Group Ltd. (c) (d)
|
| 741,985
|
|
|
|
|
| 5,150,189
|
|
|
| Denmark – 0.8%
|
|
|
| 1,101
|
| AP Moller - Maersk A.S., Class B
|
| 2,475,618
|
| 15,353
|
| Jyske Bank A.S. (b)
|
| 997,410
|
|
|
|
|
| 3,473,028
|
|
|
| Finland – 1.4%
|
|
|
| 125,148
|
| Kojamo Oyj
|
| 1,848,713
|
| 27,488
|
| Neste Oyj
|
| 1,265,843
|
| 94,076
|
| Stora Enso Oyj, Class R
|
| 1,324,253
|
| 37,798
|
| UPM-Kymmene Oyj
|
| 1,413,298
|
|
|
|
|
| 5,852,107
|
|
|
| France – 5.4%
|
|
|
| 21,869
|
| Arkema S.A.
|
| 1,963,603
|
| 434,654
|
| Bollore SE
|
| 2,428,738
|
| 22,159
|
| Cie de Saint-Gobain
|
| 1,082,823
|
| 138,654
|
| Engie S.A.
|
| 1,987,076
|
| 30,491
|
| Eurazeo SE
|
| 1,896,331
|
| 22,333
|
| Nexans S.A.
|
| 2,018,892
|
| 44,387
|
| Orange S.A.
|
| 440,978
|
| 29,352
|
| Renault S.A. (b)
|
| 982,656
|
| 53,034
|
| Rexel S.A.
|
| 1,046,843
|
| 21,280
|
| Sodexo S.A. (e)
|
| 2,038,281
|
| 38,043
|
| SPIE S.A.
|
| 992,015
|
| 34,601
|
| TotalEnergies SE
|
| 2,172,316
|
| 257,455
|
| Vivendi SE
|
| 2,456,633
|
| 11,117
|
| Wendel SE
|
| 1,037,697
|
|
|
|
|
| 22,544,882
|
|
|
| Germany – 7.8%
|
|
|
| 31,098
|
| BASF SE
|
| 1,544,270
|
| 29,325
|
| Bayerische Motoren Werke AG
|
| 2,617,377
|
Page 54
See Notes to Financial
Statements
First Trust Developed Markets ex-US
AlphaDEX® Fund (FDT)
Portfolio of Investments
(Continued)
December 31, 2022
| Shares
|
| Description
|
| Value
|
| COMMON STOCKS (a) (Continued)
|
|
|
| Germany (Continued)
|
|
|
| 223,638
|
| Commerzbank AG (b)
|
| $2,115,279
|
| 55,584
|
| Covestro AG (c) (d)
|
| 2,174,721
|
| 208,087
|
| Deutsche Lufthansa AG (b)
|
| 1,729,628
|
| 23,796
|
| Evonik Industries AG
|
| 456,848
|
| 14,140
|
| Fresenius Medical Care AG & Co., KGaA
|
| 462,712
|
| 18,701
|
| Fresenius SE & Co., KGaA
|
| 525,485
|
| 10,648
|
| Hannover Rueck SE
|
| 2,114,357
|
| 30,146
|
| HeidelbergCement AG
|
| 1,719,334
|
| 105,796
|
| K+S AG
|
| 2,080,956
|
| 33,449
|
| LEG Immobilien SE
|
| 2,179,122
|
| 31,365
|
| Mercedes-Benz Group AG
|
| 2,061,484
|
| 3,317
|
| Muenchener Rueckversicherungs-Gesellschaft AG in Muenchen
|
| 1,079,408
|
| 35,289
|
| Porsche Automobil Holding SE (Preference Shares)
|
| 1,935,597
|
| 54,312
|
| RWE AG
|
| 2,417,971
|
| 11,277
|
| Talanx AG
|
| 535,007
|
| 20,355
|
| VERBIO Vereinigte BioEnergie AG
|
| 1,320,414
|
| 11,323
|
| Volkswagen AG (Preference Shares)
|
| 1,411,093
|
| 18,482
|
| Vonovia SE
|
| 435,645
|
| 15,468
|
| Wacker Chemie AG
|
| 1,976,992
|
|
|
|
|
| 32,893,700
|
|
|
| Hong Kong – 0.3%
|
|
|
| 161,125
|
| Swire Pacific Ltd., Class A
|
| 1,418,149
|
|
|
| Ireland – 1.4%
|
|
|
| 330,239
|
| AIB Group PLC
|
| 1,278,272
|
| 186,982
|
| Bank of Ireland Group PLC
|
| 1,781,378
|
| 24,825
|
| CRH PLC
|
| 983,501
|
| 139,384
|
| Glanbia PLC
|
| 1,778,507
|
|
|
|
|
| 5,821,658
|
|
|
| Israel – 0.3%
|
|
|
| 19,730
|
| First International Bank of Israel (The) Ltd.
|
| 780,197
|
| 49,667
|
| ICL Group Ltd.
|
| 359,598
|
|
|
|
|
| 1,139,795
|
|
|
| Italy – 1.7%
|
|
|
| 8,201
|
| Brunello Cucinelli S.p.A.
|
| 606,612
|
| 150,499
|
| Eni S.p.A.
|
| 2,140,397
|
| 122,169
|
| Pirelli & C S.p.A. (c) (d)
|
| 523,626
|
| 55,434
|
| Prysmian S.p.A.
|
| 2,056,701
|
| 117,753
|
| UniCredit S.p.A.
|
| 1,672,918
|
|
|
|
|
| 7,000,254
|
|
|
| Japan – 27.3%
|
|
|
| 21,500
|
| Aeon Co., Ltd.
|
| 455,917
|
| 25,900
|
| AGC, Inc. (e)
|
| 867,346
|
| 15,700
|
| Aisin Corp.
|
| 422,287
|
| Shares
|
| Description
|
| Value
|
|
|
|
|
| Japan (Continued)
|
|
|
| 58,800
|
| Ajinomoto Co., Inc.
|
| $1,806,026
|
| 85,700
|
| ANA Holdings, Inc. (b)
|
| 1,828,406
|
| 60,900
|
| Asahi Kasei Corp.
|
| 436,843
|
| 70,100
|
| Brother Industries Ltd.
|
| 1,072,011
|
| 36,700
|
| Canon, Inc. (e)
|
| 798,513
|
| 14,400
|
| Daiichi Sankyo Co., Ltd.
|
| 466,321
|
| 12,900
|
| Daito Trust Construction Co., Ltd.
|
| 1,330,890
|
| 7,800
|
| East Japan Railway Co.
|
| 446,937
|
| 625,700
|
| ENEOS Holdings, Inc.
|
| 2,135,885
|
| 22,700
|
| Fukuoka Financial Group, Inc.
|
| 519,762
|
| 66,900
|
| Hankyu Hanshin Holdings, Inc.
|
| 1,998,232
|
| 74,100
|
| Haseko Corp.
|
| 831,677
|
| 3,400
|
| Hikari Tsushin, Inc.
|
| 482,383
|
| 65,300
|
| Hitachi Construction Machinery Co., Ltd.
|
| 1,472,285
|
| 92,800
|
| Idemitsu Kosan Co., Ltd.
|
| 2,170,802
|
| 89,000
|
| Iida Group Holdings Co., Ltd.
|
| 1,356,972
|
| 171,300
|
| Inpex Corp. (e)
|
| 1,822,118
|
| 94,900
|
| Isetan Mitsukoshi Holdings Ltd.
|
| 1,039,099
|
| 182,200
|
| Isuzu Motors Ltd.
|
| 2,147,694
|
| 90,200
|
| Japan Airlines Co., Ltd. (b)
|
| 1,852,248
|
| 24,500
|
| Japan Tobacco, Inc. (e)
|
| 496,758
|
| 173,600
|
| JFE Holdings, Inc.
|
| 2,031,771
|
| 64,400
|
| JGC Holdings Corp.
|
| 823,401
|
| 143,200
|
| Kawasaki Kisen Kaisha Ltd. (e)
|
| 3,040,981
|
| 48,300
|
| Kintetsu Group Holdings Co., Ltd.
|
| 1,602,762
|
| 26,100
|
| Kirin Holdings Co., Ltd. (e)
|
| 399,932
|
| 15,900
|
| Kyocera Corp.
|
| 793,789
|
| 74,500
|
| Kyushu Railway Co.
|
| 1,658,709
|
| 12,300
|
| Lawson, Inc.
|
| 471,419
|
| 229,500
|
| Marubeni Corp.
|
| 2,649,288
|
| 28,000
|
| MatsukiyoCocokara & Co.
|
| 1,408,107
|
| 121,800
|
| Mazda Motor Corp.
|
| 932,711
|
| 88,000
|
| Mitsubishi Chemical Group Corp.
|
| 459,110
|
| 44,000
|
| Mitsubishi Corp.
|
| 1,435,934
|
| 467,900
|
| Mitsubishi HC Capital, Inc.
|
| 2,313,830
|
| 36,300
|
| Mitsubishi Heavy Industries Ltd.
|
| 1,447,685
|
| 561,800
|
| Mitsubishi Motors Corp. (b)
|
| 2,183,161
|
| 94,200
|
| Mitsui & Co., Ltd.
|
| 2,765,564
|
| 61,900
|
| Mitsui Chemicals, Inc.
|
| 1,403,174
|
| 111,900
|
| Mitsui OSK Lines Ltd. (e)
|
| 2,805,174
|
| 97,000
|
| NGK Insulators Ltd.
|
| 1,240,216
|
| 90,900
|
| NGK Spark Plug Co., Ltd.
|
| 1,689,310
|
| 31,600
|
| NIPPON EXPRESS HOLDINGS, Inc.
|
| 1,815,483
|
| 145,000
|
| Nippon Steel Corp.
|
| 2,532,307
|
| 14,900
|
| Nippon Telegraph & Telephone Corp.
|
| 427,109
|
| 118,000
|
| Nippon Yusen KK (e)
|
| 2,796,251
|
| 126,500
|
| Nissan Motor Co., Ltd.
|
| 402,999
|
| 17,300
|
| Nissin Foods Holdings Co., Ltd.
|
| 1,373,560
|
See Notes to Financial
Statements
Page 55
First Trust Developed Markets ex-US
AlphaDEX® Fund (FDT)
Portfolio of Investments
(Continued)
December 31, 2022
| Shares
|
| Description
|
| Value
|
| COMMON STOCKS (a) (Continued)
|
|
|
| Japan (Continued)
|
|
|
| 71,100
|
| Nomura Real Estate Holdings, Inc.
|
| $1,533,168
|
| 216,400
|
| Oji Holdings Corp.
|
| 875,559
|
| 26,600
|
| Osaka Gas Co., Ltd.
|
| 431,713
|
| 68,200
|
| Pan Pacific International Holdings Corp.
|
| 1,274,723
|
| 43,500
|
| Persol Holdings Co., Ltd.
|
| 937,351
|
| 55,100
|
| Ricoh Co., Ltd.
|
| 422,780
|
| 100,400
|
| Rohto Pharmaceutical Co., Ltd.
|
| 1,774,825
|
| 22,400
|
| SBI Holdings, Inc.
|
| 429,601
|
| 80,500
|
| Seibu Holdings, Inc.
|
| 884,494
|
| 59,100
|
| Seiko Epson Corp.
|
| 867,316
|
| 48,500
|
| Sekisui House Ltd.
|
| 862,350
|
| 50,100
|
| Seven & i Holdings Co., Ltd.
|
| 2,160,668
|
| 9,500
|
| Shimamura Co., Ltd.
|
| 948,263
|
| 137,000
|
| Sojitz Corp.
|
| 2,623,293
|
| 30,300
|
| Sompo Holdings, Inc.
|
| 1,352,926
|
| 34,500
|
| SUMCO Corp. (e)
|
| 461,875
|
| 351,300
|
| Sumitomo Chemical Co., Ltd.
|
| 1,268,792
|
| 129,200
|
| Sumitomo Corp.
|
| 2,161,865
|
| 70,000
|
| Sumitomo Metal Mining Co., Ltd.
|
| 2,491,390
|
| 11,300
|
| Suntory Beverage & Food Ltd.
|
| 387,458
|
| 29,000
|
| Taisei Corp.
|
| 939,119
|
| 15,600
|
| Taiyo Yuden Co., Ltd.
|
| 455,258
|
| 52,300
|
| TDK Corp.
|
| 1,727,526
|
| 45,500
|
| TIS, Inc.
|
| 1,206,492
|
| 34,100
|
| Tobu Railway Co., Ltd.
|
| 800,274
|
| 45,400
|
| Tokio Marine Holdings, Inc.
|
| 978,120
|
| 71,200
|
| Tokyo Gas Co., Ltd.
|
| 1,402,408
|
| 232,500
|
| Tokyu Fudosan Holdings Corp.
|
| 1,112,542
|
| 81,100
|
| Toppan, Inc.
|
| 1,207,478
|
| 81,800
|
| Toray Industries, Inc.
|
| 459,112
|
| 11,300
|
| Toshiba Corp.
|
| 396,327
|
| 180,780
|
| Tosoh Corp.
|
| 2,162,638
|
| 9,800
|
| Toyo Suisan Kaisha Ltd.
|
| 380,829
|
| 26,000
|
| Toyota Tsusho Corp.
|
| 967,769
|
| 7,400
|
| Trend Micro, Inc.
|
| 346,205
|
| 20,800
|
| Yakult Honsha Co., Ltd.
|
| 1,356,660
|
| 64,500
|
| Yamaha Motor Co., Ltd. (e)
|
| 1,479,313
|
| 64,900
|
| Zensho Holdings Co., Ltd.
|
| 1,636,841
|
|
|
|
|
| 114,326,470
|
|
|
| Jersey – 0.7%
|
|
|
| 376,699
|
| Glencore PLC
|
| 2,515,686
|
| 160,749
|
| Man Group PLC
|
| 415,299
|
|
|
|
|
| 2,930,985
|
|
|
| Luxembourg – 1.7%
|
|
|
| 99,319
|
| ArcelorMittal S.A.
|
| 2,612,716
|
| 829,935
|
| Samsonite International S.A. (b) (c) (d)
|
| 2,185,033
|
| 123,780
|
| Tenaris S.A.
|
| 2,157,767
|
|
|
|
|
| 6,955,516
|
| Shares
|
| Description
|
| Value
|
|
|
|
|
| Marshall Islands – 0.2%
|
|
|
| 57,861
|
| Atlas Corp. (e)
|
| $887,588
|
|
|
| Netherlands – 1.4%
|
|
|
| 11,645
|
| Heineken Holding N.V.
|
| 898,131
|
| 4,568
|
| Heineken N.V.
|
| 429,717
|
| 102,622
|
| Koninklijke Philips N.V.
|
| 1,538,364
|
| 54,644
|
| OCI N.V.
|
| 1,954,858
|
| 7,606
|
| Prosus N.V.
|
| 524,742
|
| 15,415
|
| Signify N.V. (c) (d)
|
| 517,801
|
|
|
|
|
| 5,863,613
|
|
|
| New Zealand – 0.1%
|
|
|
| 82,188
|
| Infratil Ltd.
|
| 451,367
|
|
|
| Norway – 1.9%
|
|
|
| 24,828
|
| Aker ASA, Class A
|
| 1,823,427
|
| 62,050
|
| Equinor ASA
|
| 2,228,196
|
| 297,902
|
| Norsk Hydro ASA
|
| 2,229,521
|
| 35,074
|
| Yara International ASA
|
| 1,541,612
|
|
|
|
|
| 7,822,756
|
|
|
| Portugal – 0.3%
|
|
|
| 277,356
|
| EDP - Energias de Portugal S.A.
|
| 1,382,347
|
|
|
| Singapore – 1.8%
|
|
|
| 151,800
|
| City Developments Ltd.
|
| 932,741
|
| 85,400
|
| Jardine Cycle & Carriage Ltd.
|
| 1,823,533
|
| 332,100
|
| Keppel Corp., Ltd.
|
| 1,800,094
|
| 936,700
|
| Sembcorp Industries Ltd.
|
| 2,363,779
|
| 113,100
|
| Singapore Airlines Ltd.
|
| 466,958
|
|
|
|
|
| 7,387,105
|
|
|
| South Korea – 7.0%
|
|
|
| 5,599
|
| CJ CheilJedang Corp.
|
| 1,684,792
|
| 60,946
|
| Hanwha Solutions Corp. (b)
|
| 2,072,501
|
| 10,622
|
| Hyundai Glovis Co., Ltd.
|
| 1,373,426
|
| 3,012
|
| Hyundai Mobis Co., Ltd.
|
| 477,585
|
| 3,260
|
| Hyundai Motor Co.
|
| 389,292
|
| 32,007
|
| Kia Corp.
|
| 1,501,001
|
| 4,835
|
| Korea Zinc Co., Ltd.
|
| 2,156,536
|
| 52,066
|
| Korean Air Lines Co., Ltd. (b)
|
| 944,970
|
| 47,679
|
| KT Corp.
|
| 1,274,456
|
| 15,550
|
| LG Corp.
|
| 960,423
|
| 14,639
|
| LG Electronics, Inc.
|
| 1,001,403
|
| 4,207
|
| LG Innotek Co., Ltd.
|
| 840,069
|
| 107,038
|
| LG Uplus Corp.
|
| 935,366
|
| 4,166
|
| Lotte Chemical Corp. (e)
|
| 588,083
|
| 3,836
|
| POSCO Chemical Co., Ltd. (e)
|
| 546,050
|
| 13,634
|
| POSCO Holdings, Inc.
|
| 2,981,258
|
| 15,411
|
| Samsung Electro-Mechanics Co., Ltd.
|
| 1,590,459
|
| 32,504
|
| Samsung Electronics Co., Ltd.
|
| 1,421,488
|
| 50,579
|
| Samsung Engineering Co., Ltd. (b)
|
| 889,982
|
| 34,617
|
| SK Hynix, Inc.
|
| 2,053,203
|
| 8,019
|
| SK Innovation Co., Ltd. (i)
|
| 976,612
|
| 11,326
|
| SK Telecom Co., Ltd.
|
| 424,557
|
Page 56
See Notes to Financial
Statements
First Trust Developed Markets ex-US
AlphaDEX® Fund (FDT)
Portfolio of Investments
(Continued)
December 31, 2022
| Shares
|
| Description
|
| Value
|
| COMMON STOCKS (a) (Continued)
|
|
|
| South Korea (Continued)
|
|
|
| 2,996
|
| SK, Inc.
|
| $447,801
|
| 28,411
|
| S-Oil Corp.
|
| 1,873,845
|
|
|
|
|
| 29,405,158
|
|
|
| Spain – 1.8%
|
|
|
| 9,092
|
| Acciona S.A.
|
| 1,673,022
|
| 53,241
|
| ACS Actividades de Construccion y Servicios S.A.
|
| 1,525,671
|
| 371,930
|
| CaixaBank S.A.
|
| 1,461,943
|
| 42,839
|
| Iberdrola S.A.
|
| 501,217
|
| 139,089
|
| Repsol S.A.
|
| 2,210,984
|
|
|
|
|
| 7,372,837
|
|
|
| Sweden – 1.7%
|
|
|
| 12,877
|
| Boliden AB
|
| 482,817
|
| 142,634
|
| Castellum AB (e)
|
| 1,725,712
|
| 498,567
|
| Fastighets AB Balder, Class B (b)
|
| 2,318,238
|
| 466,416
|
| SSAB AB, Class B
|
| 2,422,627
|
|
|
|
|
| 6,949,394
|
|
|
| Switzerland – 0.6%
|
|
|
| 13,406
|
| BKW AG
|
| 1,834,055
|
| 38,040
|
| Coca-Cola HBC AG
|
| 907,352
|
|
|
|
|
| 2,741,407
|
|
|
| United Kingdom – 8.1%
|
|
|
| 164,793
|
| 3i Group PLC
|
| 2,672,623
|
| 776,933
|
| abrdn PLC
|
| 1,777,574
|
| 26,338
|
| Anglo American PLC
|
| 1,030,544
|
| 210,542
|
| Barratt Developments PLC
|
| 1,009,994
|
| 319,360
|
| Beazley PLC
|
| 2,623,483
|
| 415,883
|
| BP PLC
|
| 2,387,710
|
| 296,858
|
| BT Group PLC
|
| 402,132
|
| 39,849
|
| Burberry Group PLC
|
| 977,962
|
| 1,525,569
|
| Centrica PLC
|
| 1,780,154
|
| 79,831
|
| Compass Group PLC
|
| 1,850,612
|
| 402,141
|
| Harbour Energy PLC
|
| 1,479,896
|
| 47,182
|
| IG Group Holdings PLC
|
| 446,058
|
| 413,354
|
| J Sainsbury PLC
|
| 1,087,900
|
| 490,342
|
| Kingfisher PLC
|
| 1,399,598
|
| 77,526
|
| Mondi PLC
|
| 1,321,055
|
| 318,935
|
| NatWest Group PLC
|
| 1,022,549
|
| 124,679
|
| Pearson PLC
|
| 1,415,663
|
| 116,441
|
| Persimmon PLC
|
| 1,713,187
|
| 22,074
|
| Rio Tinto PLC
|
| 1,547,275
|
| 80,178
|
| Shell PLC
|
| 2,254,620
|
| 47,714
|
| Smiths Group PLC
|
| 922,076
|
| 1,631,881
|
| Taylor Wimpey PLC
|
| 2,005,415
|
| 9,076
|
| Unilever PLC
|
| 458,867
|
| 356,248
|
| Vodafone Group PLC
|
| 362,810
|
|
|
|
|
| 33,949,757
|
|
|
| Total Common Stocks
|
| 390,702,803
|
|
|
| (Cost $375,107,681)
|
|
|
| Shares
|
| Description
|
| Value
|
| REAL ESTATE INVESTMENT TRUSTS (a) – 6.1%
|
|
|
| Australia – 1.4%
|
|
|
| 108,964
|
| Charter Hall Group
|
| $888,774
|
| 324,068
|
| Dexus
|
| 1,709,973
|
| 489,909
|
| GPT (The) Group
|
| 1,400,929
|
| 382,539
|
| Stockland
|
| 945,440
|
| 720,980
|
| Vicinity Ltd.
|
| 981,758
|
|
|
|
|
| 5,926,874
|
|
|
| Belgium – 0.4%
|
|
|
| 65,364
|
| Warehouses De Pauw CVA
|
| 1,868,169
|
|
|
| Canada – 0.9%
|
|
|
| 41,439
|
| Granite Real Estate Investment Trust
|
| 2,114,185
|
| 85,172
|
| SmartCentres Real Estate Investment Trust
|
| 1,684,569
|
|
|
|
|
| 3,798,754
|
|
|
| France – 0.6%
|
|
|
| 24,868
|
| Covivio
|
| 1,476,076
|
| 10,205
|
| Gecina S.A.
|
| 1,039,413
|
|
|
|
|
| 2,515,489
|
|
|
| Singapore – 0.4%
|
|
|
| 1,876,500
|
| Frasers Logistics & Commercial Trust (c)
|
| 1,625,161
|
|
|
| Spain – 0.5%
|
|
|
| 207,710
|
| Merlin Properties Socimi S.A.
|
| 1,951,061
|
|
|
| United Kingdom – 1.9%
|
|
|
| 513,598
|
| British Land (The) Co., PLC
|
| 2,453,232
|
| 276,150
|
| Land Securities Group PLC
|
| 2,074,554
|
| 239,202
|
| Segro PLC
|
| 2,208,203
|
| 125,884
|
| UNITE Group (The) PLC
|
| 1,384,906
|
|
|
|
|
| 8,120,895
|
|
|
| Total Real Estate Investment Trusts
|
| 25,806,403
|
|
|
| (Cost $25,978,483)
|
|
|
| RIGHTS (a) – 0.0%
|
|
|
| South Korea – 0.0%
|
|
|
| 797
|
| Lotte Chemical Corp., expiring 1/20/23 (b) (e) (f) (g)
|
| 22,375
|
|
|
| (Cost $0)
|
|
|
See Notes to Financial
Statements
Page 57
First Trust Developed Markets ex-US
AlphaDEX® Fund (FDT)
Portfolio of Investments
(Continued)
December 31, 2022
| Shares
|
| Description
|
| Value
|
| MONEY MARKET FUNDS – 4.7%
|
| 19,545,743
|
| Goldman Sachs Financial Square Treasury Obligations Fund - Institutional Class - 4.14% (j) (k)
|
| $19,545,743
|
|
|
| (Cost $19,545,743)
|
|
|
|
|
| Total Investments – 104.0%
|
| 436,077,324
|
|
|
| (Cost $420,631,907)
|
|
|
|
|
| Net Other Assets and Liabilities – (4.0)%
|
| (16,743,911)
|
|
|
| Net Assets – 100.0%
|
| $419,333,413
|
| (a)
| Portfolio securities are categorized based upon their country of incorporation, which can be different from the country categorization of the Fund’s underlying index. For a
breakdown of the portfolio securities by sector, please see the Fund Performance Overview.
|
| (b)
| Non-income producing security.
|
| (c)
| This security may be resold to qualified foreign investors and foreign institutional buyers under Regulation S of the Securities Act of 1933, as amended (the “1933 Act”).
|
| (d)
| This security is exempt from registration upon resale under Rule 144A of the 1933 Act and may be resold in transactions exempt from registration, normally to qualified institutional
buyers. This security is not restricted on the foreign exchange where it trades freely without any additional registration. As such, it does not require the additional disclosure required of restricted securities.
|
| (e)
| All or a portion of this security is on loan (see Note 2F - Securities Lending in the Notes to Financial Statements). The remaining contractual maturity of all of the securities
lending transactions is overnight and continuous. The aggregate value of such securities is $18,631,244 and the total value of the collateral held by the Fund is $19,545,743.
|
| (f)
| This security is fair valued by the Advisor’s Pricing Committee in accordance with procedures approved by the Trust’s Board of Trustees, and in accordance with the
provisions of the Investment Company Act of 1940 and rules thereunder, as amended. At December 31, 2022, securities noted as such are valued at $256,519 or 0.1% of net assets.
|
| (g)
| Pursuant to procedures adopted by the Trust’s Board of Trustees, this security has been determined to be illiquid by First Trust Advisors L.P., the Fund’s advisor.
|
| (h)
| This security’s value was determined using significant unobservable inputs (see Note 2A – Portfolio Valuation in the Notes to Financial Statements).
|
| (i)
| Non-income producing security that makes payment-in-kind (“PIK”) distributions. There were no in-kind distributions received for the fiscal year ended December 31, 2022.
|
| (j)
| Rate shown reflects yield as of December 31, 2022.
|
| (k)
| This security serves as collateral for securities on loan.
|
Offsetting Assets and Liabilities
Offsetting assets and
liabilities requires entities to disclose both gross and net information about instruments and transactions eligible for offset, and to disclose instruments and transactions subject to master netting or similar
agreements (see Note 2E – Offsetting on the Statements of Assets and Liabilities in the Notes to Financial Statements).
The Fund’s loaned
securities were all subject to an enforceable Securities Lending Agency Agreement. Securities lent in accordance with the Securities Lending Agency Agreement on a gross basis were as follows:
| Securities Lending Agency Agreement
|
|
| Total gross amount presented on the Statements of Assets and Liabilities (1)
| $18,631,244
|
| Non-cash Collateral (2)
| (18,631,244)
|
| Net Amount
| $—
|
| (1)
| The amount presented on the Statements of Assets and Liabilities, which is included in “Investments, at value,” is not offset and is shown on a gross basis.
|
| (2)
| At December 31, 2022, the value of the collateral received from each borrower exceeded the value of the related securities loaned. This amount is disclosed on the
Portfolio of Investments.
|
Currency Exposure
Diversification
| % of Total
Investments
|
| Japanese Yen
| 26.2%
|
| Euro
| 24.4
|
| Canadian Dollar
| 11.7
|
| British Pound Sterling
| 10.5
|
| South Korean Won
| 6.7
|
| Australian Dollar
| 6.7
|
| United States Dollar
| 4.7
|
| Singapore Dollar
| 2.1
|
| Hong Kong Dollar
| 2.0
|
| Norwegian Krone
| 1.8
|
| Swedish Krona
| 1.6
|
| Danish Krone
| 0.8
|
| Swiss Franc
| 0.4
|
| Israeli Shekel
| 0.3
|
| New Zealand Dollar
| 0.1
|
| Total
| 100.0%
|
Page 58
See Notes to Financial
Statements
First Trust Developed Markets ex-US
AlphaDEX® Fund (FDT)
Portfolio of Investments
(Continued)
December 31, 2022
Valuation Inputs
A summary of the inputs
used to value the Fund’s investments as of December 31, 2022 is as follows (see Note 2A - Portfolio Valuation in the Notes to Financial Statements):
|
| Total
Value at
12/31/2022
| Level 1
Quoted
Prices
| Level 2
Significant
Observable
Inputs
| Level 3
Significant
Unobservable
Inputs
|
| Common Stocks:
|
|
|
|
|
| Cayman Islands
| $ 5,150,189
| $ 4,916,045
| $ —
| $ 234,144
|
| Other Country Categories*
| 385,552,614
| 385,552,614
| —
| —
|
| Real Estate Investment Trusts*
| 25,806,403
| 25,806,403
| —
| —
|
| Rights*
| 22,375
| —
| 22,375
| —
|
| Money Market Funds
| 19,545,743
| 19,545,743
| —
| —
|
| Total Investments
| $ 436,077,324
| $ 435,820,805
| $ 22,375
| $ 234,144
|
| *
| See Portfolio of Investments for country breakout.
|
Level 3 investments are
fair valued by the Advisor’s Pricing Committee and are footnoted in the Portfolio of Investments. Level 3 investments values are based on unobservable and non-quantitative inputs.
See Notes to Financial Statements
Page 59
First Trust Emerging Markets AlphaDEX® Fund (FEM)
Portfolio of Investments
December 31, 2022
| Shares
|
| Description
|
| Value
|
| COMMON STOCKS (a) – 99.7%
|
|
|
| Bermuda – 1.6%
|
|
|
| 593,999
|
| China Gas Holdings Ltd.
|
| $864,502
|
| 1,970,530
|
| Kunlun Energy Co., Ltd.
|
| 1,406,178
|
| 203,100
|
| Orient Overseas International Ltd.
|
| 3,668,860
|
|
|
|
|
| 5,939,540
|
|
|
| Brazil – 11.9%
|
|
|
| 199,209
|
| Atacadao S.A.
|
| 557,661
|
| 776,450
|
| Banco Bradesco S.A. (Preference Shares)
|
| 2,227,988
|
| 399,910
|
| Banco do Brasil S.A.
|
| 2,630,593
|
| 307,364
|
| CCR S.A.
|
| 629,893
|
| 77,645
|
| Cia de Saneamento Basico do Estado de Sao Paulo
|
| 840,606
|
| 335,318
|
| Cia de Transmissao de Energia Electrica Paulista (Preference Shares)
|
| 1,460,735
|
| 357,911
|
| Cia Energetica de Minas Gerais (Preference Shares)
|
| 755,174
|
| 1,755,812
|
| Cia Paranaense de Energia, Class B (Preference Shares)
|
| 2,630,517
|
| 908,272
|
| Cia Siderurgica Nacional S.A.
|
| 2,503,027
|
| 429,503
|
| Equatorial Energia S.A.
|
| 2,198,053
|
| 787,868
|
| Gerdau S.A. (Preference Shares)
|
| 4,382,723
|
| 261,108
|
| Hypera S.A.
|
| 2,235,349
|
| 548,969
|
| Itau Unibanco Holding S.A. (Preference Shares)
|
| 2,599,408
|
| 870,760
|
| Itausa S.A. (Preference Shares)
|
| 1,403,507
|
| 613,220
|
| JBS S.A.
|
| 2,554,043
|
| 276,537
|
| Lojas Renner S.A.
|
| 1,072,679
|
| 559,541
|
| Petro Rio S.A. (b)
|
| 3,943,467
|
| 646,132
|
| Petroleo Brasileiro S.A. (Preference Shares)
|
| 2,998,292
|
| 658,309
|
| Sendas Distribuidora S.A.
|
| 2,427,629
|
| 95,091
|
| Telefonica Brasil S.A.
|
| 690,703
|
| 318,793
|
| TIM S.A.
|
| 748,716
|
| 160,357
|
| Vale S.A.
|
| 2,699,471
|
|
|
|
|
| 44,190,234
|
|
|
| Cayman Islands – 6.4%
|
|
|
| 827,512
|
| C&D International Investment Group Ltd.
|
| 2,411,891
|
| 4,299,161
|
| China Hongqiao Group Ltd.
|
| 4,059,320
|
| 6,141,907
|
| China Resources Cement Holdings Ltd.
|
| 3,257,659
|
| 703,809
|
| China State Construction International Holdings Ltd.
|
| 790,781
|
| 966,424
|
| Country Garden Services Holdings Co., Ltd.
|
| 2,406,944
|
| 1,514,833
|
| Greentown China Holdings Ltd.
|
| 2,212,441
|
| 1,258,692
|
| Kingboard Holdings Ltd.
|
| 4,007,264
|
| 1,757,614
|
| Sunac China Holdings
Ltd. (b) (c) (d) (e)
|
| 515,657
|
| 1,467,785
|
| Xinyi Glass Holdings Ltd.
|
| 2,734,191
|
| Shares
|
| Description
|
| Value
|
|
|
|
|
| Cayman Islands (Continued)
|
|
|
| 426,500
|
| Zhen Ding Technology Holding Ltd.
|
| $1,457,029
|
|
|
|
|
| 23,853,177
|
|
|
| Chile – 4.2%
|
|
|
| 16,016,107
|
| Banco de Chile
|
| 1,661,559
|
| 556,760
|
| Cencosud S.A.
|
| 915,627
|
| 51,127,933
|
| Cia Sud Americana de Vapores S.A.
|
| 4,038,398
|
| 1,851,982
|
| Empresas CMPC S.A.
|
| 3,091,331
|
| 439,931
|
| Empresas Copec S.A.
|
| 3,282,432
|
| 30,290
|
| Sociedad Quimica y Minera de Chile S.A., Class B (Preference Shares)
|
| 2,449,625
|
|
|
|
|
| 15,438,972
|
|
|
| China – 12.9%
|
|
|
| 8,641,802
|
| Angang Steel Co., Ltd., Class H
|
| 2,358,229
|
| 897,792
|
| Anhui Conch Cement Co., Ltd., Class H
|
| 3,140,078
|
| 3,924,601
|
| China Coal Energy Co., Ltd., Class H
|
| 3,192,797
|
| 1,231,053
|
| China Construction Bank Corp., Class H
|
| 771,237
|
| 2,789,263
|
| China National Building Material Co., Ltd., Class H
|
| 2,290,601
|
| 4,976,318
|
| China Petroleum & Chemical Corp., Class H
|
| 2,403,541
|
| 2,903,542
|
| China Railway Group Ltd., Class H
|
| 1,532,595
|
| 476,827
|
| China Shenhua Energy Co., Ltd., Class H
|
| 1,377,557
|
| 13,306,913
|
| China Tower Corp., Ltd., Class H (f) (g)
|
| 1,432,052
|
| 11,291,376
|
| COSCO SHIPPING Development Co., Ltd., Class H
|
| 1,504,466
|
| 1,712,896
|
| COSCO SHIPPING Energy Transportation Co., Ltd., Class H (b)
|
| 1,312,303
|
| 3,034,005
|
| COSCO SHIPPING Holdings Co., Ltd., Class H
|
| 3,094,079
|
| 11,177,968
|
| Datang International Power Generation Co., Ltd., Class H
|
| 1,818,732
|
| 522,440
|
| Dongfang Electric Corp., Ltd., Class H
|
| 888,866
|
| 3,991,322
|
| Dongfeng Motor Group Co., Ltd., Class H
|
| 2,290,851
|
| 1,504,165
|
| Inner Mongolia ERDOS Resources Co., Ltd., Class B
|
| 2,450,285
|
| 2,361,976
|
| Inner Mongolia Yitai Coal Co., Ltd., Class B
|
| 3,120,170
|
| 615,712
|
| Jiangxi Copper Co., Ltd., Class H
|
| 908,724
|
| 6,941,968
|
| PetroChina Co., Ltd., Class H
|
| 3,175,067
|
Page 60
See Notes to Financial
Statements
First Trust Emerging Markets AlphaDEX® Fund (FEM)
Portfolio of Investments
(Continued)
December 31, 2022
| Shares
|
| Description
|
| Value
|
| COMMON STOCKS (a) (Continued)
|
|
|
| China (Continued)
|
|
|
| 355,193
|
| Sinopharm Group Co., Ltd., Class H
|
| $902,834
|
| 8,467,825
|
| Sinotrans Ltd., Class H
|
| 2,755,546
|
| 1,253,448
|
| Yangtze Optical Fibre and Cable Joint Stock Ltd., Co., Class H (f) (g)
|
| 2,232,149
|
| 979,217
|
| Yankuang Energy Group Co., Ltd., Class H
|
| 2,985,781
|
|
|
|
|
| 47,938,540
|
|
|
| Hong Kong – 4.1%
|
|
|
| 1,013,612
|
| Beijing Enterprises Holdings Ltd.
|
| 3,246,488
|
| 2,265,241
|
| China Merchants Port Holdings Co., Ltd.
|
| 3,320,034
|
| 273,086
|
| China Overseas Land & Investment Ltd.
|
| 720,724
|
| 4,148,048
|
| China Resources Pharmaceutical Group Ltd. (f) (g)
|
| 3,358,636
|
| 2,295,279
|
| Fosun International Ltd.
|
| 1,870,228
|
| 2,358,736
|
| Yuexiu Property Co., Ltd.
|
| 2,855,704
|
|
|
|
|
| 15,371,814
|
|
|
| Hungary – 1.7%
|
|
|
| 638,986
|
| MOL Hungarian Oil & Gas PLC
|
| 4,457,514
|
| 83,084
|
| Richter Gedeon Nyrt
|
| 1,848,798
|
|
|
|
|
| 6,306,312
|
|
|
| India – 8.1%
|
|
|
| 67,047
|
| Adani Enterprises Ltd.
|
| 3,126,928
|
| 620,301
|
| Adani Power Ltd. (b)
|
| 2,245,995
|
| 1,517,784
|
| Ashok Leyland Ltd.
|
| 2,630,850
|
| 1,312,430
|
| Bank of Baroda
|
| 2,945,948
|
| 31,533
|
| Eicher Motors Ltd.
|
| 1,230,275
|
| 148,302
|
| Hindalco Industries Ltd.
|
| 848,528
|
| 348,723
|
| ITC Ltd.
|
| 1,397,548
|
| 31,357
|
| Larsen & Toubro Ltd.
|
| 790,577
|
| 137,010
|
| Mahindra & Mahindra Ltd.
|
| 2,068,813
|
| 109,151
|
| State Bank of India
|
| 809,694
|
| 3,773,426
|
| Steel Authority of India Ltd.
|
| 3,769,777
|
| 535,084
|
| Tata Power (The) Co., Ltd.
|
| 1,343,369
|
| 2,333,220
|
| Tata Steel Ltd.
|
| 3,177,049
|
| 44,442
|
| Titan Co., Ltd.
|
| 1,395,360
|
| 428,960
|
| Vedanta Ltd.
|
| 1,599,072
|
| 3,701,088
|
| YES Bank Ltd. (b) (d)
|
| 921,581
|
|
|
|
|
| 30,301,364
|
|
|
| Indonesia – 4.3%
|
|
|
| 13,689,410
|
| Adaro Energy Indonesia Tbk PT
|
| 3,385,529
|
| 4,909,585
|
| Astra International Tbk PT
|
| 1,797,632
|
| 1,150,358
|
| Bank Mandiri Persero Tbk PT
|
| 733,406
|
| 13,000,013
|
| Bukit Asam Tbk PT
|
| 3,081,423
|
| 4,792,043
|
| Indah Kiat Pulp & Paper Tbk PT
|
| 2,685,760
|
| 5,924,622
|
| Kalbe Farma Tbk PT
|
| 795,405
|
| 1,651,467
|
| United Tractors Tbk PT
|
| 2,766,148
|
| Shares
|
| Description
|
| Value
|
|
|
|
|
| Indonesia (Continued)
|
|
|
| 1,694,063
|
| Vale Indonesia Tbk PT (b)
|
| $772,625
|
|
|
|
|
| 16,017,928
|
|
|
| Malaysia – 0.2%
|
|
|
| 412,000
|
| Tenaga Nasional Bhd
|
| 900,695
|
|
|
| Mexico – 2.2%
|
|
|
| 197,426
|
| Arca Continental S.A.B. de C.V.
|
| 1,601,170
|
| 161,755
|
| El Puerto de Liverpool S.A.B. de C.V.
|
| 957,091
|
| 605,158
|
| Grupo Bimbo S.A.B. de C.V., Series A
|
| 2,555,847
|
| 388,205
|
| Grupo Carso S.A.B. de C.V., Series A1
|
| 1,633,981
|
| 847,618
|
| Orbia Advance Corp. S.A.B. de C.V.
|
| 1,502,846
|
|
|
|
|
| 8,250,935
|
|
|
| Philippines – 0.6%
|
|
|
| 546,870
|
| Jollibee Foods Corp.
|
| 2,257,056
|
|
|
| Poland – 2.9%
|
|
|
| 200,569
|
| KGHM Polska Miedz S.A.
|
| 5,802,349
|
| 328,388
|
| Polski Koncern Naftowy ORLEN S.A.
|
| 4,814,873
|
|
|
|
|
| 10,617,222
|
|
|
| Russia – 0.1%
|
|
|
| 76,383,797
|
| Inter RAO UES PJSC (c) (d) (e)
|
| 73,908
|
| 11,679
|
| Magnit PJSC (b) (c) (d) (e)
|
| 12,290
|
| 4,142,443
|
| Magnitogorsk Iron & Steel Works PJSC (c) (d) (e)
|
| 67,989
|
| 262,800,255
|
| RusHydro PJSC (c) (d) (e)
|
| 62,431
|
| 403,137
|
| Tatneft PJSC (c) (d) (e)
|
| 51,304
|
|
|
|
|
| 267,922
|
|
|
| South Africa – 5.0%
|
|
|
| 189,630
|
| Exxaro Resources Ltd.
|
| 2,425,277
|
| 86,792
|
| Gold Fields Ltd.
|
| 899,781
|
| 301,695
|
| Impala Platinum Holdings Ltd.
|
| 3,784,493
|
| 81,587
|
| Northam Platinum Holdings Ltd. (b)
|
| 898,784
|
| 616,082
|
| Pepkor Holdings Ltd. (f) (g)
|
| 725,176
|
| 385,563
|
| Remgro Ltd.
|
| 3,018,698
|
| 179,111
|
| Sasol Ltd.
|
| 2,840,161
|
| 117,938
|
| Shoprite Holdings Ltd.
|
| 1,568,689
|
| 913,822
|
| Sibanye Stillwater Ltd.
|
| 2,405,127
|
|
|
|
|
| 18,566,186
|
|
|
| Taiwan – 10.6%
|
|
|
| 82,184
|
| Accton Technology Corp.
|
| 627,032
|
| 846,511
|
| ASE Technology Holding Co., Ltd.
|
| 2,586,175
|
| 289,664
|
| Asustek Computer, Inc.
|
| 2,530,455
|
| 5,695,767
|
| AUO Corp.
|
| 2,779,734
|
| 1,693,279
|
| China Steel Corp.
|
| 1,641,740
|
| 1,397,535
|
| Far Eastern New Century Corp.
|
| 1,450,485
|
See Notes to Financial
Statements
Page 61
First Trust Emerging Markets AlphaDEX® Fund (FEM)
Portfolio of Investments
(Continued)
December 31, 2022
| Shares
|
| Description
|
| Value
|
| COMMON STOCKS (a) (Continued)
|
|
|
| Taiwan (Continued)
|
|
|
| 8,613,771
|
| Innolux Corp.
|
| $3,096,815
|
| 336,792
|
| Nan Ya Plastics Corp.
|
| 778,000
|
| 2,308,999
|
| Nanya Technology Corp.
|
| 3,846,391
|
| 309,000
|
| Novatek Microelectronics Corp.
|
| 3,171,886
|
| 1,896,947
|
| United Microelectronics Corp.
|
| 2,511,940
|
| 2,790,474
|
| Walsin Lihwa Corp.
|
| 4,285,285
|
| 1,691,782
|
| Wan Hai Lines Ltd.
|
| 4,408,965
|
| 133,128
|
| Yageo Corp.
|
| 1,953,465
|
| 1,837,460
|
| Yang Ming Marine Transport Corp.
|
| 3,915,786
|
|
|
|
|
| 39,584,154
|
|
|
| Thailand – 4.8%
|
|
|
| 1,822,800
|
| Bangkok Dusit Medical Services PCL, Class F
|
| 1,526,237
|
| 354,700
|
| Bumrungrad Hospital PCL
|
| 2,171,110
|
| 678,700
|
| Central Retail Corp PCL
|
| 906,305
|
| 120,800
|
| Delta Electronics Thailand PCL
|
| 2,894,875
|
| 1,023,200
|
| Gulf Energy Development PCL
|
| 1,632,216
|
| 1,377,200
|
| Indorama Ventures PCL
|
| 1,620,352
|
| 500,900
|
| PTT Exploration & Production PCL
|
| 2,552,587
|
| 645,500
|
| PTT Global Chemical PCL
|
| 880,609
|
| 3,130,600
|
| PTT Oil & Retail Business PCL
|
| 2,151,242
|
| 1,581,000
|
| PTT PCL
|
| 1,517,778
|
|
|
|
|
| 17,853,311
|
|
|
| Turkey – 18.1%
|
|
|
| 5,845,597
|
| Akbank T.A.S.
|
| 6,110,571
|
| 1,801,971
|
| Aselsan Elektronik Sanayi Ve Ticaret A.S.
|
| 5,988,183
|
| 570,417
|
| BIM Birlesik Magazalar A.S.
|
| 4,175,438
|
| 2,341,706
|
| Enka Insaat ve Sanayi A.S.
|
| 4,149,455
|
| 1,821,851
|
| Eregli Demir ve Celik Fabrikalari T.A.S.
|
| 4,019,280
|
| 201,837
|
| Ford Otomotiv Sanayi A.S.
|
| 5,660,469
|
| 1,453,668
|
| KOC Holding A.S.
|
| 6,505,742
|
| 934,790
|
| Turk Hava Yollari AO (b)
|
| 7,042,570
|
| 3,396,627
|
| Turkiye Garanti Bankasi A.S.
|
| 5,455,743
|
| 8,776,168
|
| Turkiye Is Bankasi A.S., Class C
|
| 5,992,416
|
| 227,909
|
| Turkiye Petrol Rafinerileri A.S. (b)
|
| 6,457,457
|
| 2,596,258
|
| Turkiye Sise ve Cam Fabrikalari A.S.
|
| 5,958,181
|
|
|
|
|
| 67,515,505
|
|
|
| Total Investments – 99.7%
|
| 371,170,867
|
|
|
| (Cost $379,110,079)
|
|
|
|
|
| Net Other Assets and Liabilities – 0.3%
|
| 1,206,991
|
|
|
| Net Assets – 100.0%
|
| $372,377,858
|
| (a)
| Portfolio securities are categorized based upon their country of incorporation, which can be different from the country categorization of the Fund’s underlying index. For a
breakdown of the portfolio securities by sector, please see the Fund Performance Overview.
|
| (b)
| Non-income producing security.
|
| (c)
| This security is fair valued by the Advisor’s Pricing Committee in accordance with procedures approved by the Trust’s Board of Trustees, and in accordance with the
provisions of the Investment Company Act of 1940 and rules thereunder, as amended. At December 31, 2022, securities noted as such are valued at $783,579 or 0.2% of net assets.
|
| (d)
| Pursuant to procedures adopted by the Trust’s Board of Trustees, this security has been determined to be illiquid by First Trust Advisors L.P., the Fund’s advisor.
|
| (e)
| This security’s value was determined using significant unobservable inputs (see Note 2A – Portfolio Valuation in the Notes to Financial Statements).
|
| (f)
| This security may be resold to qualified foreign investors and foreign institutional buyers under Regulation S of the Securities Act of 1933, as amended (the “1933 Act”).
|
| (g)
| This security is exempt from registration upon resale under Rule 144A of the 1933 Act and may be resold in transactions exempt from registration, normally to
qualified institutional buyers. This security is not restricted on the foreign exchange where it trades freely without any additional registration. As such, it does not require the additional disclosure required of
restricted securities.
|
Currency Exposure
Diversification
| % of Total
Investments
|
| Hong Kong Dollar
| 23.2%
|
| Turkish Lira
| 18.2
|
| Brazilian Real
| 11.9
|
| New Taiwan Dollar
| 11.0
|
| Indian Rupee
| 8.2
|
| South African Rand
| 5.0
|
| Thai Baht
| 4.8
|
| Indonesian Rupiah
| 4.3
|
| Chilean Peso
| 4.2
|
| Polish Zloty
| 2.9
|
| Mexican Peso
| 2.2
|
| Hungarian Forint
| 1.7
|
| United States Dollar
| 1.5
|
| Philippine Peso
| 0.6
|
| Malaysian Ringgit
| 0.2
|
| Russian Ruble
| 0.1
|
| Total
| 100.0%
|
Page 62
See Notes to Financial
Statements
First Trust Emerging Markets AlphaDEX® Fund (FEM)
Portfolio of Investments
(Continued)
December 31, 2022
Valuation Inputs
A summary of the inputs
used to value the Fund’s investments as of December 31, 2022 is as follows (see Note 2A - Portfolio Valuation in the Notes to Financial Statements):
|
| Total
Value at
12/31/2022
| Level 1
Quoted
Prices
| Level 2
Significant
Observable
Inputs
| Level 3
Significant
Unobservable
Inputs
|
| Common Stocks:
|
|
|
|
|
| Cayman Islands
| $ 23,853,177
| $ 23,337,520
| $ —
| $ 515,657
|
| Russia
| 267,922
| —
| —
| 267,922
|
| Thailand
| 17,853,311
| —
| 17,853,311
| —
|
| Other Country Categories*
| 329,196,457
| 329,196,457
| —
| —
|
| Total Investments
| $ 371,170,867
| $ 352,533,977
| $ 17,853,311
| $ 783,579
|
| *
| See Portfolio of Investments for country breakout.
|
Level 3 investments are
fair valued by the Advisor’s Pricing Committee and are footnoted in the Portfolio of Investments. The Level 3 investments values are based on unobservable and non-quantitative inputs.
See Notes to Financial Statements
Page 63
First Trust Germany AlphaDEX® Fund (FGM)
Portfolio of Investments
December 31, 2022
| Shares
|
| Description
|
| Value
|
| COMMON STOCKS – 99.5%
|
|
|
| Aerospace & Defense – 1.4%
|
|
|
| 962
|
| Rheinmetall AG
|
| $191,589
|
|
|
| Air Freight & Logistics – 1.6%
|
|
|
| 5,928
|
| Deutsche Post AG
|
| 223,239
|
|
|
| Airlines – 2.2%
|
|
|
| 38,078
|
| Deutsche Lufthansa AG (a)
|
| 316,506
|
|
|
| Auto Components – 7.3%
|
|
|
| 1,593
|
| Continental AG
|
| 95,459
|
| 6,585
|
| Hella GmbH & Co., KGaA
|
| 536,070
|
| 58,852
|
| Schaeffler AG (Preference Shares) (b)
|
| 400,983
|
|
|
|
|
| 1,032,512
|
|
|
| Automobiles – 14.8%
|
|
|
| 7,210
|
| Bayerische Motoren Werke AG
|
| 643,522
|
| 7,674
|
| Mercedes-Benz Group AG
|
| 504,379
|
| 8,391
|
| Porsche Automobil Holding SE (Preference Shares)
|
| 460,245
|
| 3,865
|
| Volkswagen AG (Preference Shares)
|
| 481,663
|
|
|
|
|
| 2,089,809
|
|
|
| Banks – 4.2%
|
|
|
| 63,376
|
| Commerzbank AG (a)
|
| 599,442
|
|
|
| Capital Markets – 1.6%
|
|
|
| 1,327
|
| Deutsche Boerse AG
|
| 229,267
|
|
|
| Chemicals – 15.5%
|
|
|
| 7,653
|
| BASF SE
|
| 380,034
|
| 16,060
|
| Covestro AG (c) (d)
|
| 628,347
|
| 10,406
|
| Evonik Industries AG
|
| 199,780
|
| 3,982
|
| FUCHS PETROLUB SE (Preference Shares)
|
| 139,555
|
| 22,840
|
| K+S AG
|
| 449,252
|
| 3,079
|
| Wacker Chemie AG
|
| 393,532
|
|
|
|
|
| 2,190,500
|
|
|
| Construction Materials – 3.7%
|
|
|
| 9,244
|
| HeidelbergCement AG
|
| 527,218
|
|
|
| Diversified Telecommunication
Services – 4.4%
|
|
|
| 16,774
|
| Deutsche Telekom AG
|
| 334,659
|
| 115,986
|
| Telefonica Deutschland Holding AG
|
| 285,934
|
|
|
|
|
| 620,593
|
|
|
| Food Products – 4.3%
|
|
|
| 34,439
|
| Suedzucker AG
|
| 602,378
|
|
|
| Health Care Providers &
Services – 0.7%
|
|
|
| 3,666
|
| Fresenius SE & Co., KGaA
|
| 103,012
|
| Shares
|
| Description
|
| Value
|
|
|
|
|
| Independent Power &
Renewable Electricity Producers – 4.8%
|
|
|
| 15,099
|
| RWE AG
|
| $672,208
|
|
|
| Insurance – 11.2%
|
|
|
| 582
|
| Allianz SE
|
| 125,161
|
| 1,530
|
| Hannover Rueck SE
|
| 303,810
|
| 1,417
|
| Muenchener Rueckversicherungs-Gesellschaft AG in Muenchen
|
| 461,115
|
| 14,583
|
| Talanx AG
|
| 691,852
|
|
|
|
|
| 1,581,938
|
|
|
| Machinery – 2.0%
|
|
|
| 4,253
|
| Daimler Truck Holding AG (a)
|
| 131,776
|
| 5,352
|
| KION Group AG
|
| 153,366
|
|
|
|
|
| 285,142
|
|
|
| Metals & Mining – 3.4%
|
|
|
| 78,324
|
| thyssenkrupp AG (a)
|
| 477,564
|
|
|
| Multi-Utilities – 1.9%
|
|
|
| 26,457
|
| E.ON SE
|
| 264,347
|
|
|
| Personal Products – 0.9%
|
|
|
| 1,087
|
| Beiersdorf AG
|
| 124,736
|
|
|
| Pharmaceuticals – 2.0%
|
|
|
| 5,603
|
| Bayer AG
|
| 289,840
|
|
|
| Real Estate Management &
Development – 4.3%
|
|
|
| 5,356
|
| LEG Immobilien SE
|
| 348,930
|
| 10,810
|
| Vonovia SE
|
| 254,806
|
|
|
|
|
| 603,736
|
|
|
| Road & Rail – 0.7%
|
|
|
| 1,083
|
| Sixt SE
|
| 99,642
|
|
|
| Textiles, Apparel & Luxury
Goods – 4.3%
|
|
|
| 10,518
|
| HUGO BOSS AG
|
| 609,787
|
|
|
| Trading Companies &
Distributors – 0.8%
|
|
|
| 1,706
|
| Brenntag SE
|
| 109,060
|
|
|
| Wireless Telecommunication
Services – 1.5%
|
|
|
| 17,656
|
| 1&1 AG
|
| 219,238
|
|
|
| Total Common Stocks
|
| 14,063,303
|
|
|
| (Cost $17,443,176)
|
|
|
Page 64
See Notes to Financial
Statements
First Trust Germany AlphaDEX® Fund (FGM)
Portfolio of Investments
(Continued)
December 31, 2022
| Shares
|
| Description
|
| Value
|
| MONEY MARKET FUNDS – 0.9%
|
| 130,753
|
| Goldman Sachs Financial Square Treasury Obligations Fund - Institutional Class - 4.14% (e) (f)
|
| $130,753
|
|
|
| (Cost $130,753)
|
|
|
|
|
| Total Investments – 100.4%
|
| 14,194,056
|
|
|
| (Cost $17,573,929)
|
|
|
|
|
| Net Other Assets and Liabilities – (0.4)%
|
| (50,474)
|
|
|
| Net Assets – 100.0%
|
| $14,143,582
|
| (a)
| Non-income producing security.
|
| (b)
| All or a portion of this security is on loan (see Note 2F - Securities Lending in the Notes to Financial Statements). The remaining contractual maturity of all of the securities
lending transactions is overnight and continuous. The aggregate value of such securities is $123,561 and the total value of the collateral held by the Fund is $130,753.
|
| (c)
| This security may be resold to qualified foreign investors and foreign institutional buyers under Regulation S of the Securities Act of 1933, as amended (the “1933 Act”).
|
| (d)
| This security is exempt from registration upon resale under Rule 144A of the 1933 Act and may be resold in transactions exempt from registration, normally to qualified institutional
buyers. This security is not restricted on the foreign exchange where it trades freely without any additional registration. As such, it does not require the additional disclosure required of restricted securities.
|
| (e)
| Rate shown reflects yield as of December 31, 2022.
|
| (f)
| This security serves as collateral for securities on loan.
|
Offsetting Assets and Liabilities
Offsetting assets and
liabilities requires entities to disclose both gross and net information about instruments and transactions eligible for offset, and to disclose instruments and transactions subject to master netting or similar
agreements (see Note 2E – Offsetting on the Statements of Assets and Liabilities in the Notes to Financial Statements).
The Fund’s loaned
securities were all subject to an enforceable Securities Lending Agency Agreement. Securities lent in accordance with the Securities Lending Agency Agreement on a gross basis were as follows:
| Securities Lending Agency Agreement
|
|
| Total gross amount presented on the Statements of Assets and Liabilities (1)
| $123,561
|
| Non-cash Collateral (2)
| (123,561)
|
| Net Amount
| $—
|
| (1)
| The amount presented on the Statements of Assets and Liabilities, which is included in “Investments, at value,” is not offset and is shown on a gross basis.
|
| (2)
| At December 31, 2022, the value of the collateral received from each borrower exceeded the value of the related securities loaned. This amount is disclosed on the
Portfolio of Investments.
|
| Country Allocation†
| % of Net
Assets
|
| Germany
| 99.5%
|
| United States
| 0.9
|
| Total Investments
| 100.4
|
| Net Other Assets and Liabilities
| (0.4)
|
| Total
| 100.0%
|
† Portfolio
securities are categorized based upon their country of incorporation, which can be different from the country categorization of the Fund’s underlying index.
Currency Exposure
Diversification
| % of Total
Investments
|
| Euro
| 99.1%
|
| United States Dollar
| 0.9
|
| Total
| 100.0%
|
Valuation Inputs
A summary of the inputs
used to value the Fund’s investments as of December 31, 2022 is as follows (see Note 2A - Portfolio Valuation in the Notes to Financial Statements):
|
| Total
Value at
12/31/2022
| Level 1
Quoted
Prices
| Level 2
Significant
Observable
Inputs
| Level 3
Significant
Unobservable
Inputs
|
| Common Stocks*
| $ 14,063,303
| $ 14,063,303
| $ —
| $ —
|
| Money Market Funds
| 130,753
| 130,753
| —
| —
|
| Total Investments
| $ 14,194,056
| $ 14,194,056
| $—
| $—
|
| *
| See Portfolio of Investments for industry breakout.
|
See Notes to Financial
Statements
Page 65
First Trust United Kingdom AlphaDEX® Fund (FKU)
Portfolio of Investments
December 31, 2022
| Shares
|
| Description
|
| Value
|
| COMMON STOCKS – 91.5%
|
|
|
| Aerospace & Defense – 1.8%
|
|
|
| 54,472
|
| BAE Systems PLC
|
| $563,710
|
|
|
| Banks – 7.3%
|
|
|
| 221,508
|
| Barclays PLC
|
| 424,504
|
| 63,326
|
| HSBC Holdings PLC
|
| 394,809
|
| 801,636
|
| Lloyds Banking Group PLC
|
| 440,086
|
| 154,626
|
| NatWest Group PLC
|
| 495,752
|
| 73,106
|
| Standard Chartered PLC
|
| 550,086
|
|
|
|
|
| 2,305,237
|
|
|
| Beverages – 0.5%
|
|
|
| 6,205
|
| Coca-Cola HBC AG
|
| 148,005
|
|
|
| Capital Markets – 12.5%
|
|
|
| 50,995
|
| 3i Group PLC
|
| 827,040
|
| 353,636
|
| abrdn PLC
|
| 809,097
|
| 65,493
|
| IG Group Holdings PLC
|
| 619,170
|
| 8,637
|
| Intermediate Capital Group PLC
|
| 119,871
|
| 101,670
|
| Investec PLC
|
| 628,582
|
| 4,444
|
| London Stock Exchange Group PLC
|
| 383,387
|
| 226,296
|
| Man Group PLC
|
| 584,642
|
|
|
|
|
| 3,971,789
|
|
|
| Chemicals – 0.5%
|
|
|
| 5,871
|
| Johnson Matthey PLC
|
| 150,969
|
|
|
| Containers & Packaging – 2.0%
|
|
|
| 122,312
|
| DS Smith PLC
|
| 475,399
|
| 4,102
|
| Smurfit Kappa Group PLC
|
| 152,294
|
|
|
|
|
| 627,693
|
|
|
| Diversified Consumer
Services – 0.5%
|
|
|
| 15,078
|
| Pearson PLC
|
| 171,203
|
|
|
| Diversified Financial Services – 0.8%
|
|
|
| 116,194
|
| M&G PLC
|
| 263,878
|
|
|
| Diversified Telecommunication
Services – 0.5%
|
|
|
| 121,371
|
| BT Group PLC
|
| 164,413
|
|
|
| Electric Utilities – 1.4%
|
|
|
| 20,989
|
| SSE PLC
|
| 434,414
|
|
|
| Electronic Equipment,
Instruments & Components – 1.4%
|
|
|
| 12,511
|
| Spectris PLC
|
| 454,058
|
|
|
| Food & Staples Retailing – 4.5%
|
|
|
| 221,681
|
| J Sainsbury PLC
|
| 583,439
|
| 333,749
|
| Marks & Spencer Group PLC (a)
|
| 497,498
|
| Shares
|
| Description
|
| Value
|
|
|
|
|
| Food & Staples
Retailing (Continued)
|
|
|
| 132,749
|
| Tesco PLC
|
| $359,811
|
|
|
|
|
| 1,440,748
|
|
|
| Food Products – 1.3%
|
|
|
| 14,330
|
| Associated British Foods PLC
|
| 273,030
|
| 15,087
|
| Tate & Lyle PLC
|
| 129,719
|
|
|
|
|
| 402,749
|
|
|
| Health Care Equipment &
Supplies – 0.9%
|
|
|
| 100,764
|
| ConvaTec Group PLC (b) (c)
|
| 283,350
|
|
|
| Health Care Providers &
Services – 2.3%
|
|
|
| 123,479
|
| Mediclinic International PLC
|
| 743,414
|
|
|
| Hotels, Restaurants &
Leisure – 2.0%
|
|
|
| 26,918
|
| Compass Group PLC
|
| 624,003
|
|
|
| Household Durables – 6.6%
|
|
|
| 123,587
|
| Barratt Developments PLC
|
| 592,861
|
| 21,073
|
| Bellway PLC
|
| 485,959
|
| 6,071
|
| Berkeley Group Holdings PLC
|
| 276,921
|
| 18,206
|
| Persimmon PLC
|
| 267,863
|
| 387,681
|
| Taylor Wimpey PLC
|
| 476,420
|
|
|
|
|
| 2,100,024
|
|
|
| Industrial Conglomerates – 1.5%
|
|
|
| 4,435
|
| DCC PLC
|
| 218,757
|
| 151,046
|
| Melrose Industries PLC
|
| 245,607
|
|
|
|
|
| 464,364
|
|
|
| Insurance – 6.1%
|
|
|
| 28,172
|
| Aviva PLC
|
| 150,811
|
| 113,284
|
| Beazley PLC
|
| 930,607
|
| 44,917
|
| Direct Line Insurance Group PLC
|
| 120,171
|
| 23,993
|
| Hiscox Ltd.
|
| 316,024
|
| 57,448
|
| Phoenix Group Holdings PLC
|
| 422,684
|
|
|
|
|
| 1,940,297
|
|
|
| IT Services – 0.3%
|
|
|
| 4,807
|
| Computacenter PLC
|
| 111,056
|
|
|
| Media – 1.5%
|
|
|
| 519,725
|
| ITV PLC
|
| 472,246
|
|
|
| Metals & Mining – 10.7%
|
|
|
| 15,398
|
| Anglo American PLC
|
| 602,488
|
| 29,366
|
| Antofagasta PLC
|
| 548,684
|
| 26,570
|
| Endeavour Mining PLC
|
| 562,774
|
| 153,120
|
| Evraz PLC (a) (d) (e) (f)
|
| 14,976
|
| 14,744
|
| Fresnillo PLC
|
| 160,743
|
| 129,590
|
| Glencore PLC
|
| 865,433
|
Page 66
See Notes to Financial
Statements
First Trust United Kingdom AlphaDEX® Fund (FKU)
Portfolio of Investments
(Continued)
December 31, 2022
| Shares
|
| Description
|
| Value
|
| COMMON STOCKS (Continued)
|
|
|
| Metals & Mining (Continued)
|
|
|
| 9,198
|
| Rio Tinto PLC
|
| $644,733
|
|
|
|
|
| 3,399,831
|
|
|
| Multiline Retail – 1.0%
|
|
|
| 61,662
|
| B&M European Value Retail S.A.
|
| 306,609
|
|
|
| Multi-Utilities – 3.4%
|
|
|
| 706,609
|
| Centrica PLC
|
| 824,527
|
| 21,493
|
| National Grid PLC
|
| 259,164
|
|
|
|
|
| 1,083,691
|
|
|
| Oil, Gas & Consumable Fuels – 5.0%
|
|
|
| 145,580
|
| BP PLC
|
| 835,819
|
| 26,490
|
| Shell PLC
|
| 744,903
|
|
|
|
|
| 1,580,722
|
|
|
| Paper & Forest Products – 0.8%
|
|
|
| 15,541
|
| Mondi PLC
|
| 264,821
|
|
|
| Personal Products – 0.5%
|
|
|
| 3,038
|
| Unilever PLC
|
| 153,596
|
|
|
| Pharmaceuticals – 4.0%
|
|
|
| 4,188
|
| AstraZeneca PLC
|
| 567,976
|
| 25,141
|
| GSK PLC
|
| 436,947
|
| 13,979
|
| Hikma Pharmaceuticals PLC
|
| 262,287
|
|
|
|
|
| 1,267,210
|
|
|
| Specialty Retail – 3.5%
|
|
|
| 50,965
|
| Frasers Group PLC (a)
|
| 437,460
|
| 231,390
|
| Kingfisher PLC
|
| 660,464
|
|
|
|
|
| 1,097,924
|
|
|
| Textiles, Apparel & Luxury
Goods – 0.5%
|
|
|
| 6,890
|
| Burberry Group PLC
|
| 169,092
|
|
|
| Tobacco – 2.7%
|
|
|
| 6,425
|
| British American Tobacco PLC
|
| 254,891
|
| 24,631
|
| Imperial Brands PLC
|
| 616,695
|
|
|
|
|
| 871,586
|
|
|
| Trading Companies &
Distributors – 2.3%
|
|
|
| 3,288
|
| Ashtead Group PLC
|
| 187,621
|
| 8,316
|
| Bunzl PLC
|
| 277,380
|
| 37,523
|
| Howden Joinery Group PLC
|
| 254,761
|
|
|
|
|
| 719,762
|
|
|
| Wireless Telecommunication
Services – 0.9%
|
|
|
| 267,782
|
| Vodafone Group PLC
|
| 272,714
|
|
|
| Total Common Stocks
|
| 29,025,178
|
|
|
| (Cost $35,114,497)
|
|
|
| Shares
|
| Description
|
| Value
|
| REAL ESTATE INVESTMENT TRUSTS – 8.0%
|
|
|
| Equity Real Estate Investment
Trusts – 8.0%
|
|
|
| 126,434
|
| British Land (The) Co., PLC
|
| $603,920
|
| 4,329
|
| Derwent London PLC
|
| 123,930
|
| 85,133
|
| Land Securities Group PLC
|
| 639,554
|
| 57,871
|
| Segro PLC
|
| 534,239
|
| 311,453
|
| Tritax Big Box REIT PLC
|
| 521,872
|
| 10,626
|
| UNITE Group (The) PLC
|
| 116,901
|
|
|
| Total Real Estate Investment Trusts
|
| 2,540,416
|
|
|
| (Cost $3,678,661)
|
|
|
|
|
| Total Investments – 99.5%
|
| 31,565,594
|
|
|
| (Cost $38,793,158)
|
|
|
|
|
| Net Other Assets and Liabilities – 0.5%
|
| 162,635
|
|
|
| Net Assets – 100.0%
|
| $31,728,229
|
| (a)
| Non-income producing security.
|
| (b)
| This security may be resold to qualified foreign investors and foreign institutional buyers under Regulation S of the Securities Act of 1933, as amended (the “1933 Act”).
|
| (c)
| This security is exempt from registration upon resale under Rule 144A of the 1933 Act and may be resold in transactions exempt from registration, normally to qualified institutional
buyers. This security is not restricted on the foreign exchange where it trades freely without any additional registration. As such, it does not require the additional disclosure required of restricted securities.
|
| (d)
| This security is fair valued by the Advisor’s Pricing Committee in accordance with procedures approved by the Trust’s Board of Trustees, and in accordance with the
provisions of the Investment Company Act of 1940 and rules thereunder, as amended. At December 31, 2022, securities noted as such are valued at $14,976 or 0.0% of net assets.
|
| (e)
| Pursuant to procedures adopted by the Trust’s Board of Trustees, this security has been determined to be illiquid by First Trust Advisors L.P., the Fund’s advisor.
|
| (f)
| This security’s value was determined using significant unobservable inputs (see Note 2A – Portfolio Valuation in the Notes to Financial Statements).
|
See Notes
to Financial Statements
Page 67
First Trust United Kingdom AlphaDEX® Fund (FKU)
Portfolio of Investments
(Continued)
December 31, 2022
| Country Allocation†
| % of Net
Assets
|
| United Kingdom
| 91.3%
|
| Jersey
| 4.6
|
| Ireland
| 1.2
|
| Bermuda
| 1.0
|
| Luxembourg
| 0.9
|
| Switzerland
| 0.5
|
| Total Investments
| 99.5
|
| Net Other Assets and Liabilities
| 0.5
|
| Total
| 100.0%
|
† Portfolio
securities are categorized based upon their country of incorporation, which can be different from the country categorization of the Fund’s underlying index.
Currency Exposure
Diversification
| % of Total
Investments
|
| British Pound Sterling
| 100.0%
|
Valuation Inputs
A summary of the inputs
used to value the Fund’s investments as of December 31, 2022 is as follows (see Note 2A - Portfolio Valuation in the Notes to Financial Statements):
|
| Total
Value at
12/31/2022
| Level 1
Quoted
Prices
| Level 2
Significant
Observable
Inputs
| Level 3
Significant
Unobservable
Inputs
|
| Common Stocks:
|
|
|
|
|
| Metals & Mining
| $ 3,399,831
| $ 3,384,855
| $ —
| $ 14,976
|
| Other Industry Categories*
| 25,625,347
| 25,625,347
| —
| —
|
| Real Estate Investment Trusts*
| 2,540,416
| 2,540,416
| —
| —
|
| Total Investments
| $ 31,565,594
| $ 31,550,618
| $—
| $ 14,976
|
| *
| See Portfolio of Investments for industry breakout.
|
Level 3 investments are
fair valued by the Advisor’s Pricing Committee and are footnoted in the Portfolio of Investments. The Level 3 investments values are based on unobservable and non-quantitative inputs.
Page 68
See Notes to Financial Statements
First Trust India NIFTY 50 Equal Weight
ETF (NFTY)
Portfolio of Investments
December 31, 2022
| Shares
|
| Description
|
| Value
|
| COMMON STOCKS – 101.2%
|
|
|
| Automobiles – 12.2%
|
|
|
| 34,475
|
| Bajaj Auto Ltd.
|
| $1,506,870
|
| 38,665
|
| Eicher Motors Ltd.
|
| 1,508,533
|
| 45,811
|
| Hero MotoCorp Ltd.
|
| 1,516,614
|
| 100,302
|
| Mahindra & Mahindra Ltd.
|
| 1,514,532
|
| 14,906
|
| Maruti Suzuki India Ltd.
|
| 1,512,509
|
| 314,088
|
| Tata Motors Ltd. (a)
|
| 1,472,869
|
|
|
|
|
| 9,031,927
|
|
|
| Banks – 12.2%
|
|
|
| 132,802
|
| Axis Bank Ltd.
|
| 1,498,898
|
| 75,898
|
| HDFC Bank Ltd.
|
| 1,493,694
|
| 137,454
|
| ICICI Bank Ltd.
|
| 1,480,127
|
| 102,963
|
| IndusInd Bank Ltd.
|
| 1,518,496
|
| 67,987
|
| Kotak Mahindra Bank Ltd.
|
| 1,501,623
|
| 205,678
|
| State Bank of India
|
| 1,525,742
|
| 75,422
|
| YES Bank Ltd. Lock-In (a) (b) (c)
|
| 18,780
|
|
|
|
|
| 9,037,360
|
|
|
| Chemicals – 4.0%
|
|
|
| 39,773
|
| Asian Paints Ltd.
|
| 1,484,528
|
| 172,817
|
| UPL Ltd.
|
| 1,495,986
|
|
|
|
|
| 2,980,514
|
|
|
| Construction & Engineering – 2.0%
|
|
|
| 58,282
|
| Larsen & Toubro Ltd.
|
| 1,469,414
|
|
|
| Construction Materials – 4.0%
|
|
|
| 71,173
|
| Grasim Industries Ltd.
|
| 1,482,735
|
| 17,419
|
| UltraTech Cement Ltd.
|
| 1,465,245
|
|
|
|
|
| 2,947,980
|
|
|
| Consumer Finance – 2.1%
|
|
|
| 19,032
|
| Bajaj Finance Ltd.
|
| 1,512,622
|
|
|
| Diversified Financial Services – 4.0%
|
|
|
| 80,508
|
| Bajaj Finserv Ltd.
|
| 1,506,277
|
| 46,382
|
| Housing Development Finance Corp., Ltd.
|
| 1,478,752
|
|
|
|
|
| 2,985,029
|
|
|
| Electric Utilities – 2.0%
|
|
|
| 582,167
|
| Power Grid Corp. of India Ltd.
|
| 1,503,796
|
|
|
| Food Products – 6.0%
|
|
|
| 28,334
|
| Britannia Industries Ltd.
|
| 1,475,248
|
| 6,260
|
| Nestle India Ltd.
|
| 1,483,544
|
| 159,154
|
| Tata Consumer Products Ltd.
|
| 1,475,440
|
|
|
|
|
| 4,434,232
|
|
|
| Health Care Providers &
Services – 2.0%
|
|
|
| 26,659
|
| Apollo Hospitals Enterprise Ltd.
|
| 1,442,866
|
| Shares
|
| Description
|
| Value
|
|
|
|
|
| Independent Power &
Renewable Electricity Producers – 2.0%
|
|
|
| 749,381
|
| NTPC Ltd.
|
| $1,507,730
|
|
|
| Insurance – 4.0%
|
|
|
| 217,265
|
| HDFC Life Insurance Co., Ltd. (d) (e)
|
| 1,487,082
|
| 99,752
|
| SBI Life Insurance Co., Ltd. (d) (e)
|
| 1,484,645
|
|
|
|
|
| 2,971,727
|
|
|
| IT Services – 10.2%
|
|
|
| 119,456
|
| HCL Technologies Ltd.
|
| 1,500,672
|
| 81,723
|
| Infosys Ltd.
|
| 1,489,842
|
| 37,981
|
| Tata Consultancy Services Ltd.
|
| 1,495,137
|
| 122,627
|
| Tech Mahindra Ltd.
|
| 1,506,565
|
| 320,222
|
| Wipro Ltd.
|
| 1,520,213
|
|
|
|
|
| 7,512,429
|
|
|
| Life Sciences Tools &
Services – 2.0%
|
|
|
| 35,604
|
| Divi’s Laboratories Ltd.
|
| 1,468,918
|
|
|
| Metals & Mining – 6.1%
|
|
|
| 262,840
|
| Hindalco Industries Ltd.
|
| 1,503,872
|
| 161,838
|
| JSW Steel Ltd.
|
| 1,502,474
|
| 1,113,790
|
| Tata Steel Ltd.
|
| 1,516,601
|
|
|
|
|
| 4,522,947
|
|
|
| Oil, Gas & Consumable Fuels – 8.2%
|
|
|
| 379,748
|
| Bharat Petroleum Corp., Ltd.
|
| 1,517,064
|
| 559,538
|
| Coal India Ltd.
|
| 1,522,109
|
| 854,957
|
| Oil & Natural Gas Corp., Ltd.
|
| 1,516,559
|
| 48,649
|
| Reliance Industries Ltd.
|
| 1,497,869
|
|
|
|
|
| 6,053,601
|
|
|
| Personal Products – 2.0%
|
|
|
| 47,738
|
| Hindustan Unilever Ltd.
|
| 1,477,812
|
|
|
| Pharmaceuticals – 6.0%
|
|
|
| 112,970
|
| Cipla Ltd.
|
| 1,469,238
|
| 29,123
|
| Dr. Reddy’s Laboratories Ltd.
|
| 1,491,722
|
| 123,779
|
| Sun Pharmaceutical Industries Ltd.
|
| 1,498,275
|
|
|
|
|
| 4,459,235
|
|
|
| Textiles, Apparel & Luxury
Goods – 2.1%
|
|
|
| 49,449
|
| Titan Co., Ltd.
|
| 1,552,566
|
|
|
| Tobacco – 2.0%
|
|
|
| 371,598
|
| ITC Ltd.
|
| 1,489,222
|
|
|
| Trading Companies &
Distributors – 2.1%
|
|
|
| 32,841
|
| Adani Enterprises Ltd.
|
| 1,531,634
|
See Notes to Financial
Statements
Page 69
First Trust India NIFTY 50 Equal Weight
ETF (NFTY)
Portfolio of Investments
(Continued)
December 31, 2022
| Shares
|
| Description
|
| Value
|
| COMMON STOCKS (Continued)
|
|
|
| Transportation Infrastructure – 2.0%
|
|
|
| 151,499
|
| Adani Ports & Special Economic Zone Ltd.
|
| $1,498,142
|
|
|
| Wireless Telecommunication
Services – 2.0%
|
|
|
| 151,936
|
| Bharti Airtel Ltd.
|
| 1,480,426
|
|
|
| Total Investments – 101.2%
|
| 74,872,129
|
|
|
| (Cost $70,223,201)
|
|
|
|
|
| Net Other Assets and Liabilities – (1.2)%
|
| (873,326)
|
|
|
| Net Assets – 100.0%
|
| $73,998,803
|
| (a)
| Non-income producing security.
|
| (b)
| Pursuant to procedures adopted by the Trust’s Board of Trustees, this security has been determined to be illiquid by First Trust Advisors L.P., the Fund’s advisor.
|
| (c)
| This security has a lock-in period of 3 years from commencement of the YES Bank Ltd. Reconstruction Scheme 2020 (the “Scheme”), which was effective March 13, 2020. Shares
to the extent of 75% held by existing shareholders as on the date of commencement of the Scheme are locked in for a period of three years. The lock-in period does not apply to shareholders holding less than 100 shares
(see Note 2C - Restricted Securities in the Notes to Financial Statements).
|
| (d)
| This security may be resold to qualified foreign investors and foreign institutional buyers under Regulation S of the Securities Act of 1933, as amended (the “1933 Act”).
|
| (e)
| This security is exempt from registration upon resale under Rule 144A of the 1933 Act and may be resold in transactions exempt from registration, normally to
qualified institutional buyers. This security is not restricted on the foreign exchange where it trades freely without any additional registration. As such, it does not require the additional disclosure required of
restricted securities.
|
| Country Allocation†
| % of Net
Assets
|
| India
| 101.2%
|
| Total Investments
| 101.2
|
| Net Other Assets and Liabilities
| (1.2)
|
| Total
| 100.0%
|
† Portfolio
securities are categorized based upon their country of incorporation, which can be different from the country categorization of the Fund’s underlying index.
Currency Exposure
Diversification
| % of Total
Investments
|
| Indian Rupee
| 100.0%
|
Valuation Inputs
A summary of the inputs
used to value the Fund’s investments as of December 31, 2022 is as follows (see Note 2A - Portfolio Valuation in the Notes to Financial Statements):
|
| Total
Value at
12/31/2022
| Level 1
Quoted
Prices
| Level 2
Significant
Observable
Inputs
| Level 3
Significant
Unobservable
Inputs
|
| Common Stocks*
| $ 74,872,129
| $ 74,872,129
| $ —
| $ —
|
| *
| See Portfolio of Investments for industry breakout.
|
Page 70
See Notes to Financial
Statements
First Trust Switzerland AlphaDEX® Fund (FSZ)
Portfolio of Investments
December 31, 2022
| Shares
|
| Description
|
| Value
|
| COMMON STOCKS – 99.0%
|
|
|
| Banks – 1.0%
|
|
|
| 9,820
|
| Banque Cantonale Vaudoise
|
| $942,546
|
|
|
| Capital Markets – 8.9%
|
|
|
| 50,083
|
| Julius Baer Group Ltd.
|
| 2,917,288
|
| 858
|
| Partners Group Holding AG
|
| 757,924
|
| 191,097
|
| UBS Group AG
|
| 3,555,750
|
| 21,918
|
| Vontobel Holding AG
|
| 1,453,061
|
|
|
|
|
| 8,684,023
|
|
|
| Chemicals – 2.6%
|
|
|
| 161,777
|
| Clariant AG
|
| 2,563,168
|
|
|
| Construction Materials – 4.8%
|
|
|
| 89,997
|
| Holcim AG
|
| 4,660,203
|
|
|
| Diversified Telecommunication
Services – 3.1%
|
|
|
| 5,578
|
| Swisscom AG
|
| 3,056,091
|
|
|
| Electric Utilities – 3.1%
|
|
|
| 22,129
|
| BKW AG
|
| 3,027,436
|
|
|
| Electrical Equipment – 2.8%
|
|
|
| 89,353
|
| ABB Ltd.
|
| 2,711,561
|
|
|
| Food Products – 7.9%
|
|
|
| 1,377
|
| Barry Callebaut AG
|
| 2,723,769
|
| 149
|
| Chocoladefabriken Lindt & Spruengli AG
|
| 1,519,570
|
| 2,373
|
| Emmi AG
|
| 2,009,473
|
| 13,201
|
| Nestle S.A.
|
| 1,529,611
|
|
|
|
|
| 7,782,423
|
|
|
| Health Care Equipment &
Supplies – 2.9%
|
|
|
| 33,081
|
| Alcon, Inc.
|
| 2,260,377
|
| 2,416
|
| Sonova Holding AG
|
| 573,005
|
|
|
|
|
| 2,833,382
|
|
|
| Health Care Providers &
Services – 4.2%
|
|
|
| 50,152
|
| Galenica AG (a) (b)
|
| 4,097,749
|
|
|
| Insurance – 13.7%
|
|
|
| 23,581
|
| Baloise Holding AG
|
| 3,639,224
|
| 32,910
|
| Helvetia Holding AG
|
| 3,836,801
|
| 1,582
|
| Swiss Life Holding AG
|
| 815,765
|
| 9,938
|
| Swiss Re AG
|
| 929,474
|
| 8,855
|
| Zurich Insurance Group AG
|
| 4,235,729
|
|
|
|
|
| 13,456,993
|
|
|
| Life Sciences Tools &
Services – 2.2%
|
|
|
| 4,329
|
| Lonza Group AG
|
| 2,121,311
|
|
|
| Machinery – 12.7%
|
|
|
| 8,858
|
| Bucher Industries AG
|
| 3,705,482
|
| 11,189
|
| Daetwyler Holding AG
|
| 2,226,546
|
| Shares
|
| Description
|
| Value
|
|
|
|
|
| Machinery (Continued)
|
|
|
| 31,316
|
| Georg Fischer AG
|
| $1,916,926
|
| 30,482
|
| SFS Group AG
|
| 2,884,524
|
| 47,343
|
| Stadler Rail AG
|
| 1,679,393
|
|
|
|
|
| 12,412,871
|
|
|
| Marine – 2.3%
|
|
|
| 9,759
|
| Kuehne + Nagel International AG
|
| 2,271,277
|
|
|
| Pharmaceuticals – 4.9%
|
|
|
| 45,470
|
| Novartis AG
|
| 4,110,569
|
| 2,307
|
| Roche Holding AG
|
| 724,797
|
|
|
|
|
| 4,835,366
|
|
|
| Professional Services – 5.9%
|
|
|
| 90,657
|
| Adecco Group AG
|
| 2,986,440
|
| 37,326
|
| DKSH Holding AG
|
| 2,833,813
|
|
|
|
|
| 5,820,253
|
|
|
| Real Estate Management &
Development – 5.7%
|
|
|
| 34,622
|
| PSP Swiss Property AG
|
| 4,062,604
|
| 17,562
|
| Swiss Prime Site AG
|
| 1,522,300
|
|
|
|
|
| 5,584,904
|
|
|
| Specialty Retail – 1.0%
|
|
|
| 23,828
|
| Dufry AG (c)
|
| 992,393
|
|
|
| Technology Hardware,
Storage & Peripherals – 1.9%
|
|
|
| 29,486
|
| Logitech International S.A.
|
| 1,819,576
|
|
|
| Textiles, Apparel & Luxury
Goods – 6.6%
|
|
|
| 14,612
|
| Cie Financiere Richemont S.A., Class A
|
| 1,894,748
|
| 16,233
|
| Swatch Group (The) AG
|
| 4,617,184
|
|
|
|
|
| 6,511,932
|
|
|
| Transportation Infrastructure – 0.8%
|
|
|
| 5,101
|
| Flughafen Zurich AG (c)
|
| 789,437
|
|
|
| Total Investments – 99.0%
|
| 96,974,895
|
|
|
| (Cost $96,906,713)
|
|
|
|
|
| Net Other Assets and Liabilities – 1.0%
|
| 984,398
|
|
|
| Net Assets – 100.0%
|
| $97,959,293
|
| (a)
| This security may be resold to qualified foreign investors and foreign institutional buyers under Regulation S of the Securities Act of 1933, as amended (the
“1933 Act”).
|
See Notes to Financial
Statements
Page 71
First Trust Switzerland AlphaDEX® Fund (FSZ)
Portfolio of Investments
(Continued)
December 31, 2022
| (b)
| This security is exempt from registration upon resale under Rule 144A of the 1933 Act and may be resold in transactions exempt from registration, normally to qualified institutional
buyers. This security is not restricted on the foreign exchange where it trades freely without any additional registration. As such, it does not require the additional disclosure required of restricted securities.
|
| (c)
| Non-income producing security.
|
| Country Allocation†
| % of Net
Assets
|
| Switzerland
| 99.0%
|
| Total Investments
| 99.0
|
| Net Other Assets and Liabilities
| 1.0
|
| Total
| 100.0%
|
† Portfolio
securities are categorized based upon their country of incorporation, which can be different from the country categorization of the Fund’s underlying index.
Currency Exposure
Diversification
| % of Total
Investments
|
| Swiss Franc
| 100.0%
|
Valuation Inputs
A summary of the inputs
used to value the Fund’s investments as of December 31, 2022 is as follows (see Note 2A - Portfolio Valuation in the Notes to Financial Statements):
|
| Total
Value at
12/31/2022
| Level 1
Quoted
Prices
| Level 2
Significant
Observable
Inputs
| Level 3
Significant
Unobservable
Inputs
|
| Common Stocks*
| $ 96,974,895
| $ 96,974,895
| $ —
| $ —
|
| *
| See Portfolio of Investments for industry breakout.
|
Page 72
See Notes to Financial Statements
First Trust Developed Markets ex-US Small
Cap AlphaDEX® Fund (FDTS)
Portfolio of Investments
December 31, 2022
| Shares
|
| Description
|
| Value
|
| COMMON STOCKS (a) – 90.4%
|
|
|
| Australia – 2.8%
|
|
|
| 1,220
|
| AGL Energy Ltd.
|
| $6,703
|
| 7,318
|
| Austal Ltd.
|
| 10,364
|
| 5,618
|
| Beach Energy Ltd.
|
| 6,101
|
| 1,162
|
| Brickworks Ltd.
|
| 17,540
|
| 46,585
|
| Firefinch Ltd. (b) (c) (d)
|
| 1,903
|
| 47,670
|
| Grange Resources Ltd.
|
| 27,425
|
| 2,475
|
| Healius Ltd.
|
| 5,173
|
| 1,177
|
| Lovisa Holdings Ltd.
|
| 18,520
|
| 1,916
|
| Monadelphous Group Ltd.
|
| 17,428
|
| 14,020
|
| NRW Holdings Ltd.
|
| 26,823
|
| 4,473
|
| Sandfire Resources Ltd.
|
| 16,567
|
| 1,870
|
| Sims Ltd.
|
| 16,666
|
| 15,260
|
| Syrah Resources Ltd. (d)
|
| 21,403
|
| 9,589
|
| Viva Energy Group Ltd. (e) (f)
|
| 17,823
|
|
|
|
|
| 210,439
|
|
|
| Austria – 0.7%
|
|
|
| 1,563
|
| voestalpine AG
|
| 41,460
|
| 532
|
| Wienerberger AG
|
| 12,847
|
|
|
|
|
| 54,307
|
|
|
| Belgium – 1.0%
|
|
|
| 500
|
| Barco N.V.
|
| 12,353
|
| 846
|
| Bekaert S.A.
|
| 32,855
|
| 655
|
| KBC Ancora
|
| 29,532
|
|
|
|
|
| 74,740
|
|
|
| Bermuda – 3.1%
|
|
|
| 2,204
|
| BW LPG Ltd. (e) (f)
|
| 17,053
|
| 675
|
| FLEX LNG Ltd.
|
| 22,103
|
| 3,580
|
| Golden Ocean Group Ltd.
|
| 31,405
|
| 12,072
|
| Gulf Keystone Petroleum Ltd.
|
| 29,335
|
| 11,230
|
| Hopson Development Holdings Ltd.
|
| 11,049
|
| 8,500
|
| Kerry Properties Ltd.
|
| 18,513
|
| 2,900
|
| Lancashire Holdings Ltd.
|
| 22,789
|
| 86,334
|
| Pacific Basin Shipping Ltd.
|
| 29,200
|
| 14,400
|
| PAX Global Technology Ltd.
|
| 12,453
|
| 1,344
|
| Stolt-Nielsen Ltd.
|
| 36,972
|
|
|
|
|
| 230,872
|
|
|
| Canada – 8.6%
|
|
|
| 1,119
|
| ADENTRA, Inc.
|
| 23,421
|
| 2,969
|
| Advantage Energy Ltd. (d)
|
| 20,765
|
| 229
|
| Ag Growth International, Inc.
|
| 7,332
|
| 13,840
|
| Athabasca Oil Corp. (d)
|
| 24,634
|
| 2,520
|
| Baytex Energy Corp. (d)
|
| 11,316
|
| 3,023
|
| Birchcliff Energy Ltd.
|
| 21,054
|
| 720
|
| Canadian Solar, Inc. (d)
|
| 22,248
|
| 1,832
|
| Canfor Corp. (d)
|
| 28,833
|
| 4,152
|
| Cardinal Energy Ltd.
|
| 23,366
|
| 917
|
| Cascades, Inc.
|
| 5,730
|
| 6,061
|
| Centerra Gold, Inc.
|
| 31,379
|
| 7,155
|
| Crew Energy, Inc. (d)
|
| 29,751
|
| Shares
|
| Description
|
| Value
|
|
|
|
|
| Canada (Continued)
|
|
|
| 301
|
| DREAM Unlimited Corp., Class A
|
| $5,653
|
| 4,801
|
| Dundee Precious Metals, Inc.
|
| 23,083
|
| 1,025
|
| Freehold Royalties Ltd.
|
| 11,984
|
| 1,524
|
| Interfor Corp. (d)
|
| 23,637
|
| 1,415
|
| Kelt Exploration Ltd. (d)
|
| 5,236
|
| 5,626
|
| Lion Electric (The) Co. (d)
|
| 12,602
|
| 167
|
| Methanex Corp.
|
| 6,322
|
| 2,588
|
| Mullen Group Ltd.
|
| 27,810
|
| 5,992
|
| New Gold, Inc. (d)
|
| 5,886
|
| 1,503
|
| NuVista Energy Ltd. (d)
|
| 13,853
|
| 2,969
|
| Obsidian Energy Ltd. (d)
|
| 19,691
|
| 604
|
| Paramount Resources Ltd., Class A
|
| 12,776
|
| 1,462
|
| Parex Resources, Inc.
|
| 21,757
|
| 828
|
| PrairieSky Royalty Ltd.
|
| 13,270
|
| 860
|
| Russel Metals, Inc.
|
| 18,280
|
| 5,109
|
| Secure Energy Services, Inc.
|
| 26,526
|
| 862
|
| Stelco Holdings, Inc.
|
| 28,196
|
| 2,831
|
| Surge Energy, Inc.
|
| 19,048
|
| 5,834
|
| Tamarack Valley Energy Ltd.
|
| 19,217
|
| 3,696
|
| Torex Gold Resources, Inc. (d)
|
| 42,447
|
| 2,467
|
| Tricon Capital Group, Inc.
|
| 19,022
|
| 606
|
| Uni-Select, Inc. (d)
|
| 19,174
|
| 164
|
| Winpak Ltd.
|
| 5,094
|
|
|
|
|
| 650,393
|
|
|
| Cayman Islands – 0.6%
|
|
|
| 15,000
|
| Cowell e Holdings, Inc. (d)
|
| 20,870
|
| 138,000
|
| Truly International Holdings Ltd.
|
| 21,570
|
|
|
|
|
| 42,440
|
|
|
| Denmark – 0.8%
|
|
|
| 633
|
| D/S Norden A/S
|
| 38,089
|
| 451
|
| NKT A.S. (d)
|
| 25,410
|
|
|
|
|
| 63,499
|
|
|
| Finland – 0.5%
|
|
|
| 7,733
|
| Outokumpu OYJ
|
| 39,162
|
|
|
| France – 1.4%
|
|
|
| 3,987
|
| Derichebourg S.A.
|
| 23,559
|
| 135
|
| Eramet S.A.
|
| 12,117
|
| 4,101
|
| Etablissements Maurel et Prom S.A.
|
| 17,626
|
| 337
|
| Societe BIC S.A.
|
| 23,069
|
| 2,786
|
| Television Francaise 1
|
| 21,338
|
| 238
|
| Vicat S.A.
|
| 5,974
|
|
|
|
|
| 103,683
|
|
|
| Germany – 3.2%
|
|
|
| 403
|
| 1&1 AG
|
| 5,004
|
| 439
|
| AIXTRON SE
|
| 12,674
|
| 287
|
| AURELIUS Equity Opportunities SE & Co. KGaA
|
| 5,628
|
| 406
|
| Aurubis AG
|
| 33,186
|
See Notes to Financial
Statements
Page 73
First Trust Developed Markets ex-US Small
Cap AlphaDEX® Fund (FDTS)
Portfolio of Investments
(Continued)
December 31, 2022
| Shares
|
| Description
|
| Value
|
| COMMON STOCKS (a) (Continued)
|
|
|
| Germany (Continued)
|
|
|
| 444
|
| CropEnergies AG
|
| $6,188
|
| 170
|
| Hornbach Holding AG & Co. KGaA
|
| 14,058
|
| 276
|
| KION Group AG
|
| 7,909
|
| 3,476
|
| Kloeckner & Co., SE
|
| 34,362
|
| 242
|
| Krones AG
|
| 27,200
|
| 1,399
|
| Salzgitter AG
|
| 42,711
|
| 2,666
|
| TAG Immobilien AG
|
| 17,251
|
| 2,497
|
| thyssenkrupp AG (d)
|
| 15,225
|
| 328
|
| Vitesco Technologies Group AG (d)
|
| 19,048
|
|
|
|
|
| 240,444
|
|
|
| Greece – 0.6%
|
|
|
| 3,231
|
| FF Group (b) (c) (d) (g)
|
| 0
|
| 1,357
|
| Motor Oil Hellas Corinth Refineries S.A.
|
| 31,696
|
| 783
|
| Mytilineos S.A.
|
| 17,014
|
|
|
|
|
| 48,710
|
|
|
| Isle Of Man (U.K.) – 0.3%
|
|
|
| 3,264
|
| Playtech PLC (d)
|
| 20,085
|
|
|
| Israel – 1.2%
|
|
|
| 337
|
| Airport City Ltd. (d)
|
| 5,394
|
| 395
|
| Delek Automotive Systems Ltd.
|
| 4,631
|
| 170
|
| Delek Group Ltd. (d)
|
| 18,716
|
| 55
|
| Israel Corp., Ltd.
|
| 19,402
|
| 78,191
|
| Oil Refineries Ltd.
|
| 27,383
|
| 49
|
| Paz Oil Co., Ltd. (d)
|
| 6,104
|
| 583
|
| Plus500 Ltd.
|
| 12,715
|
|
|
|
|
| 94,345
|
|
|
| Italy – 0.6%
|
|
|
| 1,869
|
| Anima Holding S.p.A (e) (f)
|
| 7,487
|
| 751
|
| Buzzi Unicem S.p.A
|
| 14,470
|
| 16,829
|
| Saras S.p.A. (d)
|
| 20,699
|
|
|
|
|
| 42,656
|
|
|
| Japan – 32.3%
|
|
|
| 900
|
| Aeon Fantasy Co., Ltd.
|
| 18,550
|
| 700
|
| Alps Electric Co., Ltd.
|
| 6,384
|
| 300
|
| Amvis Holdings, Inc.
|
| 7,635
|
| 1,100
|
| Arcland Sakamoto Co., Ltd.
|
| 13,142
|
| 2,000
|
| Avex, Inc.
|
| 25,663
|
| 1,100
|
| AZ-COM MARUWA Holdings, Inc.
|
| 13,201
|
| 600
|
| Bic Camera, Inc.
|
| 5,861
|
| 500
|
| BML, Inc.
|
| 12,782
|
| 500
|
| C Uyemura & Co., Ltd.
|
| 23,164
|
| 500
|
| Canon Marketing Japan, Inc.
|
| 11,388
|
| 500
|
| Central Glass Co., Ltd.
|
| 10,706
|
| 6,400
|
| Citizen Watch Co., Ltd.
|
| 28,918
|
| 1,000
|
| Cosmo Energy Holdings Co., Ltd.
|
| 26,592
|
| Shares
|
| Description
|
| Value
|
|
|
|
|
| Japan (Continued)
|
|
|
| 900
|
| Credit Saison Co., Ltd.
|
| $11,665
|
| 900
|
| Daicel Corp.
|
| 6,549
|
| 400
|
| Daido Steel Co., Ltd.
|
| 13,151
|
| 1,300
|
| DCM Holdings Co., Ltd.
|
| 11,906
|
| 900
|
| Doutor Nichires Holdings Co., Ltd.
|
| 11,788
|
| 400
|
| Dowa Holdings Co., Ltd.
|
| 12,649
|
| 500
|
| DTS Corp.
|
| 11,361
|
| 1,100
|
| Electric Power Development Co., Ltd.
|
| 17,568
|
| 1,400
|
| eRex Co., Ltd.
|
| 23,170
|
| 900
|
| Exedy Corp.
|
| 11,082
|
| 600
|
| FCC Co., Ltd.
|
| 6,176
|
| 1,000
|
| Ferrotec Holdings Corp.
|
| 21,236
|
| 3,400
|
| Financial Products Group Co., Ltd.
|
| 28,834
|
| 1,000
|
| Fuji Oil Holdings, Inc.
|
| 15,529
|
| 200
|
| Fuji Soft, Inc.
|
| 11,521
|
| 2,700
|
| Fujikura Ltd.
|
| 20,655
|
| 1,000
|
| Furukawa Electric Co., Ltd.
|
| 18,851
|
| 100
|
| Fuyo General Lease Co., Ltd.
|
| 6,568
|
| 2,300
|
| GA Technologies Co., Ltd. (d)
|
| 23,379
|
| 2,200
|
| Geo Holdings Corp.
|
| 36,544
|
| 300
|
| H.U. Group Holdings, Inc.
|
| 6,586
|
| 700
|
| H2O Retailing Corp.
|
| 6,881
|
| 1,200
|
| Hakuto Co., Ltd.
|
| 38,174
|
| 1,100
|
| Hanwa Co., Ltd.
|
| 31,389
|
| 1,800
|
| Hitachi Zosen Corp.
|
| 11,329
|
| 200
|
| Hogy Medical Co., Ltd.
|
| 5,197
|
| 3,100
|
| Hokuetsu Corp.
|
| 17,999
|
| 1,600
|
| Hosiden Corp.
|
| 19,189
|
| 800
|
| Idec Corp.
|
| 17,799
|
| 3,600
|
| IDOM, Inc.
|
| 18,214
|
| 3,600
|
| Iino Kaiun Kaisha Ltd.
|
| 25,511
|
| 1,700
|
| Inabata & Co., Ltd.
|
| 30,920
|
| 600
|
| Insource Co., Ltd.
|
| 7,109
|
| 1,500
|
| Itochu Enex Co., Ltd.
|
| 12,001
|
| 100
|
| Iwatani Corp.
|
| 4,412
|
| 6,700
|
| J Trust Co., Ltd.
|
| 26,445
|
| 700
|
| JAC Recruitment Co., Ltd.
|
| 12,956
|
| 200
|
| Jaccs Co., Ltd.
|
| 6,286
|
| 900
|
| Japan Petroleum Exploration Co., Ltd.
|
| 26,368
|
| 900
|
| Joyful Honda Co., Ltd.
|
| 13,249
|
| 1,000
|
| Kaga Electronics Co., Ltd.
|
| 31,126
|
| 200
|
| Kaneka Corp.
|
| 5,014
|
| 2,200
|
| Kanematsu Corp.
|
| 25,145
|
| 4,800
|
| Kitz Corp.
|
| 28,857
|
| 1,400
|
| Koa Corp.
|
| 20,108
|
| 1,300
|
| Kobe Steel Ltd.
|
| 6,359
|
| 3,400
|
| Koshidaka Holdings Co., Ltd.
|
| 25,699
|
| 200
|
| Kotobuki Spirits Co., Ltd.
|
| 11,780
|
| 800
|
| Kuraray Co., Ltd.
|
| 6,449
|
| 800
|
| KYB Corp.
|
| 20,756
|
| 2,200
|
| Kyoei Steel Ltd.
|
| 21,055
|
Page 74
See Notes to Financial
Statements
First Trust Developed Markets ex-US Small
Cap AlphaDEX® Fund (FDTS)
Portfolio of Investments
(Continued)
December 31, 2022
| Shares
|
| Description
|
| Value
|
| COMMON STOCKS (a) (Continued)
|
|
|
| Japan (Continued)
|
|
|
| 600
|
| Kyoritsu Maintenance Co., Ltd.
|
| $26,973
|
| 7,000
|
| Leopalace21 Corp. (d)
|
| 15,521
|
| 1,100
|
| Macnica Holdings, Inc.
|
| 26,360
|
| 700
|
| Makino Milling Machine Co., Ltd.
|
| 23,095
|
| 800
|
| Maruichi Steel Tube Ltd.
|
| 16,477
|
| 300
|
| Meiko Electronics Co., Ltd.
|
| 5,498
|
| 700
|
| Mitsubishi Logistics Corp.
|
| 16,161
|
| 400
|
| Mitsubishi Materials Corp.
|
| 6,352
|
| 800
|
| Mitsuboshi Belting Ltd.
|
| 20,847
|
| 1,000
|
| Mitsui Mining & Smelting Co., Ltd.
|
| 23,507
|
| 1,300
|
| Mitsui-Soko Holdings Co., Ltd.
|
| 35,610
|
| 600
|
| Mizuno Corp.
|
| 12,860
|
| 2,600
|
| Modec, Inc.
|
| 26,983
|
| 400
|
| Nagase & Co., Ltd.
|
| 6,102
|
| 500
|
| Nankai Electric Railway Co., Ltd.
|
| 10,862
|
| 1,200
|
| Nextage Co., Ltd.
|
| 23,225
|
| 1,800
|
| NHK Spring Co., Ltd.
|
| 11,603
|
| 2,200
|
| Nichicon Corp.
|
| 20,552
|
| 4,600
|
| Nihon Nohyaku Co., Ltd.
|
| 25,376
|
| 1,700
|
| Nikkiso Co., Ltd.
|
| 12,293
|
| 600
|
| Nippon Electric Glass Co., Ltd. (h)
|
| 10,716
|
| 1,100
|
| Nippon Gas Co., Ltd.
|
| 17,450
|
| 500
|
| Nippon Light Metal Holdings Co., Ltd.
|
| 5,764
|
| 7,700
|
| Nippon Parking Development Co., Ltd.
|
| 18,188
|
| 300
|
| Nippon Shokubai Co., Ltd.
|
| 12,069
|
| 500
|
| Nippon Soda Co., Ltd.
|
| 16,458
|
| 200
|
| Nishimatsu Construction Co., Ltd.
|
| 5,966
|
| 800
|
| Nishi-Nippon Railroad Co., Ltd.
|
| 15,062
|
| 500
|
| Nissha Co., Ltd.
|
| 6,972
|
| 1,200
|
| Nisshin Oillio Group (The) Ltd.
|
| 30,037
|
| 700
|
| Nisshinbo Holdings, Inc.
|
| 5,195
|
| 300
|
| Nitto Kogyo Corp.
|
| 5,386
|
| 600
|
| Nojima Corp.
|
| 6,524
|
| 1,600
|
| Noritsu Koki Co., Ltd.
|
| 29,028
|
| 800
|
| NS United Kaiun Kaisha Ltd.
|
| 23,621
|
| 3,100
|
| NTN Corp.
|
| 6,236
|
| 1,100
|
| Optex Group Co., Ltd.
|
| 15,053
|
| 200
|
| Osaka Soda Co., Ltd.
|
| 5,837
|
| 1,000
|
| OSAKA Titanium Technologies Co., Ltd.
|
| 29,564
|
| 1,500
|
| Pacific Industrial Co., Ltd.
|
| 11,509
|
| 1,300
|
| PAL GROUP Holdings Co., Ltd.
|
| 24,853
|
| 100
|
| Pilot Corp.
|
| 3,661
|
| 2,800
|
| Rengo Co., Ltd.
|
| 19,372
|
| 4,900
|
| Round One Corp.
|
| 17,921
|
| 200
|
| RS Technologies Co., Ltd.
|
| 5,402
|
| 2,100
|
| San-Ai Oil Co., Ltd.
|
| 20,002
|
| 2,200
|
| San-In Godo (The) Bank Ltd.
|
| 13,025
|
| Shares
|
| Description
|
| Value
|
|
|
|
|
| Japan (Continued)
|
|
|
| 700
|
| Sankyo Co., Ltd.
|
| $28,696
|
| 600
|
| Sanrio Co., Ltd.
|
| 21,853
|
| 300
|
| Sanyo Denki Co., Ltd.
|
| 13,098
|
| 800
|
| Sanyo Special Steel Co., Ltd.
|
| 13,173
|
| 500
|
| Sapporo Holdings Ltd.
|
| 12,496
|
| 800
|
| Seiko Holdings Corp.
|
| 18,927
|
| 1,600
|
| Senko Group Holdings Co., Ltd.
|
| 11,765
|
| 900
|
| Shin Nippon Biomedical Laboratories Ltd.
|
| 15,498
|
| 1,300
|
| Shin-Etsu Polymer Co., Ltd.
|
| 11,213
|
| 300
|
| Ship Healthcare Holdings, Inc.
|
| 6,144
|
| 2,400
|
| Shizuoka Gas Co., Ltd.
|
| 20,171
|
| 800
|
| Sosei Group Corp. (d)
|
| 13,033
|
| 1,400
|
| Star Micronics Co., Ltd.
|
| 17,271
|
| 1,100
|
| Sumitomo Forestry Co., Ltd.
|
| 19,554
|
| 1,500
|
| Sumitomo Pharma Co., Ltd.
|
| 11,418
|
| 400
|
| Sumitomo Warehouse (The) Co., Ltd.
|
| 5,965
|
| 400
|
| Sundrug Co., Ltd.
|
| 11,932
|
| 1,400
|
| Takashimaya Co., Ltd.
|
| 19,660
|
| 900
|
| Takeuchi Manufacturing Co., Ltd.
|
| 19,983
|
| 500
|
| Tamron Co., Ltd.
|
| 11,338
|
| 600
|
| TKP Corp. (d)
|
| 13,144
|
| 1,300
|
| Toho Titanium Co., Ltd.
|
| 27,636
|
| 1,800
|
| Tokuyama Corp.
|
| 24,633
|
| 400
|
| Tokyo Kiraboshi Financial Group, Inc.
|
| 7,955
|
| 600
|
| Tokyo Steel Manufacturing Co., Ltd.
|
| 5,463
|
| 800
|
| Tokyo Tatemono Co., Ltd.
|
| 9,747
|
| 2,800
|
| Topre Corp.
|
| 24,194
|
| 300
|
| Toridoll Holdings Corp.
|
| 6,174
|
| 600
|
| Tosei Corp.
|
| 6,245
|
| 2,200
|
| Toyo Seikan Group Holdings Ltd.
|
| 27,190
|
| 500
|
| Toyo Tanso Co., Ltd.
|
| 14,325
|
| 1,500
|
| Toyo Tire Corp. (h)
|
| 17,110
|
| 100
|
| Trancom Co., Ltd.
|
| 5,631
|
| 400
|
| Transcosmos, Inc.
|
| 9,921
|
| 300
|
| Tsubakimoto Chain Co.
|
| 6,817
|
| 1,200
|
| UACJ Corp.
|
| 20,280
|
| 300
|
| Visional, Inc. (d)
|
| 19,933
|
| 500
|
| Yamato Kogyo Co., Ltd.
|
| 17,163
|
| 1,800
|
| Yokohama Rubber (The) Co., Ltd.
|
| 28,226
|
| 2,900
|
| Yonex Co., Ltd.
|
| 26,295
|
|
|
|
|
| 2,432,928
|
|
|
| Jersey – 0.8%
|
|
|
| 5,328
|
| Centamin PLC
|
| 7,272
|
| 12,257
|
| TP ICAP Group PLC
|
| 25,858
|
| 5,920
|
| Yellow Cake PLC (d) (e) (f)
|
| 26,810
|
|
|
|
|
| 59,940
|
See Notes to Financial
Statements
Page 75
First Trust Developed Markets ex-US Small
Cap AlphaDEX® Fund (FDTS)
Portfolio of Investments
(Continued)
December 31, 2022
| Shares
|
| Description
|
| Value
|
| COMMON STOCKS (a) (Continued)
|
|
|
| Luxembourg – 1.3%
|
|
|
| 1,121
|
| APERAM S.A.
|
| $35,387
|
| 1,613
|
| Grand City Properties S.A.
|
| 15,868
|
| 1,392
|
| Millicom International Cellular S.A. (d)
|
| 17,629
|
| 2,703
|
| Subsea 7 S.A.
|
| 31,191
|
|
|
|
|
| 100,075
|
|
|
| Marshall Islands – 0.4%
|
|
|
| 974
|
| Teekay Tankers Ltd. (d)
|
| 30,009
|
|
|
| Mauritius – 0.3%
|
|
|
| 116,200
|
| Golden Agri-Resources Ltd.
|
| 21,689
|
|
|
| Netherlands – 0.4%
|
|
|
| 54,388
|
| MFE-MediaForEurope N.V., Class A
|
| 21,041
|
| 284
|
| RHI Magnesita N.V.
|
| 7,636
|
| 1,590
|
| SRH N.V. (b) (c) (d) (g)
|
| 0
|
|
|
|
|
| 28,677
|
|
|
| Norway – 2.4%
|
|
|
| 7,662
|
| Aker Solutions ASA
|
| 29,250
|
| 14,198
|
| DNO ASA
|
| 17,116
|
| 8,307
|
| Elkem ASA (e) (f)
|
| 29,847
|
| 1,588
|
| Grieg Seafood ASA
|
| 12,741
|
| 12,828
|
| MPC Container Ships ASA
|
| 21,278
|
| 5,289
|
| Norske Skog ASA (d) (f)
|
| 36,306
|
| 3,229
|
| Wallenius Wilhelmsen ASA
|
| 31,987
|
|
|
|
|
| 178,525
|
|
|
| Portugal – 0.2%
|
|
|
| 1,910
|
| Greenvolt-Energias Renovaveis S.A. (d)
|
| 15,948
|
|
|
| Singapore – 0.6%
|
|
|
| 6,100
|
| UMS Holdings Ltd.
|
| 5,374
|
| 61,600
|
| Yangzijiang Financial Holding Ltd. (d)
|
| 16,327
|
| 22,400
|
| Yangzijiang Shipbuilding Holdings Ltd.
|
| 22,744
|
|
|
|
|
| 44,445
|
|
|
| South Korea – 15.9%
|
|
|
| 192
|
| Advanced Nano Products Co., Ltd.
|
| 11,768
|
| 1,493
|
| BH Co., Ltd.
|
| 26,507
|
| 356
|
| Daesang Corp.
|
| 6,166
|
| 347
|
| Daesung Holdings Co., Ltd.
|
| 30,049
|
| 1,863
|
| Daewoo Engineering & Construction Co., Ltd. (d)
|
| 6,158
|
| 822
|
| DB HiTek Co., Ltd.
|
| 24,150
|
| 895
|
| DL E&C Co., Ltd.
|
| 23,888
|
| 3,553
|
| Dongkuk Steel Mill Co., Ltd.
|
| 31,329
|
| 269
|
| Doosan Bobcat, Inc.
|
| 7,361
|
| 341
|
| Ecopro Co., Ltd.
|
| 27,776
|
| 457
|
| E-MART, Inc.
|
| 35,418
|
| Shares
|
| Description
|
| Value
|
|
|
|
|
| South Korea (Continued)
|
|
|
| 340
|
| GS Engineering & Construction Corp.
|
| $5,687
|
| 920
|
| GS Holdings Corp.
|
| 31,867
|
| 1,199
|
| GS Retail Co., Ltd.
|
| 26,692
|
| 1,194
|
| Handsome Co., Ltd.
|
| 25,542
|
| 616
|
| Hanjin Kal Corp. (d)
|
| 18,244
|
| 435
|
| Hankook Tire & Technology Co., Ltd.
|
| 10,716
|
| 499
|
| Hanwha Aerospace Co., Ltd.
|
| 29,044
|
| 2,196
|
| Harim Holdings Co., Ltd.
|
| 13,285
|
| 219
|
| Hyosung Corp.
|
| 11,621
|
| 119
|
| Hyosung TNC Corp.
|
| 32,938
|
| 141
|
| Hyundai Department Store Co., Ltd.
|
| 6,579
|
| 5,173
|
| Hyundai Doosan Infracore Co., Ltd. (d)
|
| 32,728
|
| 964
|
| Hyundai Electric & Energy System Co., Ltd.
|
| 32,400
|
| 142
|
| Hyundai Heavy Industries Holdings Co., Ltd.
|
| 6,412
|
| 298
|
| Hyundai Mipo Dockyard Co., Ltd.
|
| 19,914
|
| 607
|
| Hyundai Rotem Co., Ltd. (d)
|
| 13,633
|
| 1,092
|
| Hyundai Steel Co.
|
| 26,426
|
| 502
|
| IS Dongseo Co., Ltd.
|
| 11,195
|
| 261
|
| JYP Entertainment Corp.
|
| 13,994
|
| 576
|
| KCC Glass Corp.
|
| 16,831
|
| 3,707
|
| KG DONGBUSTEEL
|
| 21,664
|
| 181
|
| Kolon Industries, Inc.
|
| 5,890
|
| 454
|
| Korea Gas Corp.
|
| 12,997
|
| 19,727
|
| Korea Line Corp. (d)
|
| 33,931
|
| 332
|
| Kumho Petrochemical Co., Ltd.
|
| 33,082
|
| 340
|
| LIG Nex1 Co., Ltd.
|
| 24,791
|
| 801
|
| Lotte Corp.
|
| 19,510
|
| 681
|
| LOTTE Fine Chemical Co., Ltd.
|
| 30,536
|
| 986
|
| LX International Corp.
|
| 26,473
|
| 202
|
| LX Semicon Co., Ltd.
|
| 11,454
|
| 52
|
| NongShim Co., Ltd.
|
| 14,681
|
| 422
|
| OCI Co., Ltd.
|
| 26,965
|
| 17
|
| Ottogi Corp.
|
| 6,399
|
| 8,526
|
| Pan Ocean Co., Ltd.
|
| 38,635
|
| 1,263
|
| Poongsan Corp.
|
| 33,610
|
| 1,469
|
| Posco International Corp.
|
| 26,255
|
| 143
|
| Samchully Co., Ltd.
|
| 44,217
|
| 290
|
| Samyang Foods Co., Ltd.
|
| 29,126
|
| 1,154
|
| SD Biosensor, Inc.
|
| 27,515
|
| 859
|
| Seegene, Inc.
|
| 18,478
|
| 66
|
| Shinsegae, Inc.
|
| 11,483
|
| 260
|
| SIMMTECH Co., Ltd.
|
| 5,439
|
| 153
|
| SK Gas Ltd.
|
| 13,975
|
| 950
|
| SL Corp.
|
| 17,242
|
| 183
|
| SNT Motiv Co., Ltd.
|
| 6,078
|
| 1,108
|
| Ssangyong Motor Co. (b) (c) (d) (g)
|
| 4,381
|
| 308
|
| Unid Co., Ltd.
|
| 19,827
|
Page 76
See Notes to Financial
Statements
First Trust Developed Markets ex-US Small
Cap AlphaDEX® Fund (FDTS)
Portfolio of Investments
(Continued)
December 31, 2022
| Shares
|
| Description
|
| Value
|
| COMMON STOCKS (a) (Continued)
|
|
|
| South Korea (Continued)
|
|
|
| 516
|
| Youngone Corp.
|
| $19,159
|
|
|
|
|
| 1,200,111
|
|
|
| Spain – 0.5%
|
|
|
| 3,339
|
| Acerinox S.A.
|
| 33,033
|
| 1,783
|
| Ence Energia y Celulosa S.A.
|
| 5,363
|
| 533
|
| Let’s GOWEX
S.A. (b) (c) (d) (g) (i)
|
| 0
|
|
|
|
|
| 38,396
|
|
|
| Sweden – 3.2%
|
|
|
| 691
|
| Camurus AB (d)
|
| 16,727
|
| 360
|
| Catena AB
|
| 13,407
|
| 1,690
|
| Dios Fastigheter AB
|
| 12,220
|
| 3,137
|
| Fabege AB
|
| 26,666
|
| 2,261
|
| Hexatronic Group AB
|
| 30,671
|
| 651
|
| Loomis AB
|
| 17,843
|
| 2,285
|
| Munters Group AB (e) (f)
|
| 22,533
|
| 2,446
|
| Neobo Fastigheter AB (b) (c) (d)
|
| 4,643
|
| 405
|
| New Wave Group AB
|
| 8,011
|
| 3,677
|
| Nyfosa AB
|
| 28,401
|
| 8,940
|
| Orron Energy AB
|
| 19,242
|
| 24,465
|
| Samhallsbyggnadsbolaget i Norden AB (h)
|
| 40,748
|
|
|
|
|
| 241,112
|
|
|
| Switzerland – 0.7%
|
|
|
| 466
|
| Arbonia AG
|
| 6,511
|
| 672
|
| EFG International AG
|
| 6,417
|
| 184
|
| Sulzer AG
|
| 14,328
|
| 219
|
| u-blox Holding AG
|
| 26,101
|
|
|
|
|
| 53,357
|
|
|
| United Kingdom – 6.0%
|
|
|
| 6,273
|
| Balfour Beatty PLC
|
| 25,603
|
| 1,208
|
| Bank of Georgia Group PLC
|
| 38,044
|
| 846
|
| Bellway PLC
|
| 19,509
|
| 18,523
|
| Diversified Energy Co. PLC (e)
|
| 26,066
|
| 90,486
|
| EnQuest PLC (d)
|
| 23,410
|
| 19,757
|
| Ferrexpo PLC
|
| 37,548
|
| 4,567
|
| Firstgroup PLC
|
| 5,576
|
| 10,420
|
| International Distributions Services PLC
|
| 26,832
|
| 20,925
|
| Jupiter Fund Management PLC
|
| 33,595
|
| 4,174
|
| Mitchells & Butlers PLC (d)
|
| 6,964
|
| 38,377
|
| Mitie Group PLC
|
| 34,611
|
| 7,913
|
| Molten Ventures PLC (d)
|
| 33,884
|
| 3,319
|
| Redde Northgate PLC
|
| 16,532
|
| 5,132
|
| Serica Energy PLC
|
| 17,682
|
| 4,512
|
| Synthomer PLC
|
| 7,866
|
| 1,307
|
| TORM PLC, Class A
|
| 37,328
|
| 1,522
|
| Trainline PLC (d) (e) (f)
|
| 5,053
|
| 1,238
|
| Travis Perkins PLC
|
| 13,311
|
| 37,953
|
| Tritax EuroBox PLC (e) (f)
|
| 28,172
|
| 1,553
|
| Vesuvius PLC
|
| 7,589
|
| Shares
|
| Description
|
| Value
|
|
|
|
|
| United Kingdom (Continued)
|
|
|
| 816
|
| Vistry Group PLC
|
| $6,171
|
|
|
|
|
| 451,346
|
|
|
| Total Common Stocks
|
| 6,812,333
|
|
|
| (Cost $6,591,665)
|
|
|
| REAL ESTATE INVESTMENT TRUSTS (a) – 8.8%
|
|
|
| Australia – 3.0%
|
|
|
| 13,401
|
| Abacus Property Group
|
| 23,996
|
| 7,515
|
| Arena REIT
|
| 19,597
|
| 4,509
|
| BWP Trust
|
| 12,004
|
| 9,663
|
| Centuria Industrial REIT
|
| 20,527
|
| 10,507
|
| Charter Hall Long Wale REIT
|
| 31,691
|
| 9,068
|
| Charter Hall Retail REIT
|
| 23,646
|
| 13,676
|
| Charter Hall Social Infrastructure REIT
|
| 31,658
|
| 5,435
|
| Growthpoint Properties Australia Ltd.
|
| 11,027
|
| 7,415
|
| HomeCo Daily Needs REIT (e)
|
| 6,487
|
| 11,223
|
| National Storage REIT
|
| 17,728
|
| 3,550
|
| Region RE Ltd.
|
| 6,550
|
| 10,560
|
| Waypoint REIT Ltd.
|
| 19,772
|
|
|
|
|
| 224,683
|
|
|
| Belgium – 0.1%
|
|
|
| 343
|
| Xior Student Housing N.V. (e)
|
| 10,611
|
|
|
| Canada – 2.4%
|
|
|
| 2,330
|
| Artis Real Estate Investment Trust
|
| 15,505
|
| 478
|
| Boardwalk Real Estate Investment Trust
|
| 17,450
|
| 3,434
|
| Dream Industrial Real Estate Investment Trust
|
| 29,648
|
| 1,811
|
| Dream Office Real Estate Investment Trust
|
| 19,983
|
| 3,543
|
| H&R Real Estate Investment Trust
|
| 31,688
|
| 1,928
|
| InterRent Real Estate Investment Trust
|
| 18,226
|
| 2,305
|
| Primaris Real Estate Investment Trust
|
| 24,923
|
| 1,292
|
| Summit Industrial Income REIT
|
| 21,651
|
|
|
|
|
| 179,074
|
|
|
| Guernsey – 0.8%
|
|
|
| 29,955
|
| Balanced Commercial Property Trust Ltd.
|
| 32,049
|
| 39,841
|
| UK Commercial Property REIT Ltd.
|
| 28,129
|
|
|
|
|
| 60,178
|
|
|
| Netherlands – 0.2%
|
|
|
| 538
|
| Eurocommercial Properties N.V.
|
| 13,015
|
See Notes to Financial
Statements
Page 77
First Trust Developed Markets ex-US Small
Cap AlphaDEX® Fund (FDTS)
Portfolio of Investments
(Continued)
December 31, 2022
| Shares
|
| Description
|
| Value
|
| REAL ESTATE INVESTMENT TRUSTS (a) (Continued)
|
|
|
| Spain – 0.2%
|
|
|
| 2,218
|
| Inmobiliaria Colonial Socimi S.A.
|
| $14,269
|
|
|
| United Kingdom – 2.1%
|
|
|
| 1,813
|
| Big Yellow Group PLC
|
| 25,140
|
| 13,767
|
| LondonMetric Property PLC
|
| 28,677
|
| 1,717
|
| Safestore Holdings PLC
|
| 19,616
|
| 17,691
|
| Tritax Big Box REIT PLC
|
| 29,643
|
| 18,551
|
| Urban Logistics REIT PLC
|
| 30,165
|
| 22,244
|
| Warehouse Reit PLC (e)
|
| 28,129
|
|
|
|
|
| 161,370
|
|
|
| Total Real Estate Investment Trusts
|
| 663,200
|
|
|
| (Cost $668,040)
|
|
|
| MONEY MARKET FUNDS – 0.9%
|
| 64,189
|
| Goldman Sachs Financial Square Treasury Obligations Fund - Institutional Class - 4.14% (j) (k)
|
| 64,189
|
|
|
| (Cost $64,189)
|
|
|
|
|
| Total Investments – 100.1%
|
| 7,539,722
|
|
|
| (Cost $7,323,894)
|
|
|
|
|
| Net Other Assets and Liabilities – (0.1)%
|
| (4,659)
|
|
|
| Net Assets – 100.0%
|
| $7,535,063
|
| (a)
| Portfolio securities are categorized based upon their country of incorporation, which can be different from the country categorization of the Fund’s underlying index. For a
breakdown of the portfolio securities by sector, please see the Fund Performance Overview.
|
| (b)
| This security is fair valued by the Advisor’s Pricing Committee in accordance with procedures approved by the Trust’s Board of Trustees, and in accordance with the
provisions of the Investment Company Act of 1940 and rules thereunder, as amended. At December 31, 2022, securities noted as such are valued at $10,927 or 0.1% of net assets.
|
| (c)
| Pursuant to procedures adopted by the Trust’s Board of Trustees, this security has been determined to be illiquid by First Trust Advisors L.P., the Fund’s advisor.
|
| (d)
| Non-income producing security.
|
| (e)
| This security may be resold to qualified foreign investors and foreign institutional buyers under Regulation S of the Securities Act of 1933, as amended (the “1933 Act”).
|
| (f)
| This security is exempt from registration upon resale under Rule 144A of the 1933 Act and may be resold in transactions exempt from registration, normally to qualified institutional
buyers. This security is not restricted on the foreign exchange where it trades freely without any additional registration. As such, it does not require the additional disclosure required of restricted securities.
|
| (g)
| This security’s value was determined using significant unobservable inputs (see Note 2A – Portfolio Valuation in the Notes to Financial Statements).
|
| (h)
| All or a portion of this security is on loan (see Note 2F - Securities Lending in the Notes to Financial Statements). The remaining contractual maturity of all of the securities
lending transactions is overnight and continuous. The aggregate value of such securities is $61,686 and the total value of the collateral held by the Fund is $64,189.
|
| (i)
| This issuer has filed for protection in bankruptcy court.
|
| (j)
| Rate shown reflects yield as of December 31, 2022.
|
| (k)
| This security serves as collateral for securities on loan.
|
Offsetting Assets and Liabilities
Offsetting assets and
liabilities requires entities to disclose both gross and net information about instruments and transactions eligible for offset, and to disclose instruments and transactions subject to master netting or similar
agreements (see Note 2E – Offsetting on the Statements of Assets and Liabilities in the Notes to Financial Statements).
The Fund’s loaned
securities were all subject to an enforceable Securities Lending Agency Agreement. Securities lent in accordance with the Securities Lending Agency Agreement on a gross basis were as follows:
| Securities Lending Agency Agreement
|
|
| Total gross amount presented on the Statements of Assets and Liabilities (1)
| $61,686
|
| Non-cash Collateral (2)
| (61,686)
|
| Net Amount
| $—
|
| (1)
| The amount presented on the Statements of Assets and Liabilities, which is included in “Investments, at value,” is not offset and is shown on a gross basis.
|
| (2)
| At December 31, 2022, the value of the collateral received from each borrower exceeded the value of the related securities loaned. This amount is disclosed on the
Portfolio of Investments.
|
Currency Exposure
Diversification
| % of Total
Investments
|
| Japanese Yen
| 32.3%
|
| South Korean Won
| 15.9
|
| Canadian Dollar
| 10.5
|
| British Pound Sterling
| 10.5
|
| Euro
| 10.2
|
| Australian Dollar
| 5.8
|
| Norwegian Krone
| 4.2
|
| Swedish Krona
| 3.4
|
| United States Dollar
| 1.7
|
| Hong Kong Dollar
| 1.5
|
| Danish Krone
| 1.3
|
| Israeli Shekel
| 1.1
|
| Singapore Dollar
| 0.9
|
| Swiss Franc
| 0.7
|
| Total
| 100.0%
|
Page 78
See Notes to Financial
Statements
First Trust Developed Markets ex-US Small
Cap AlphaDEX® Fund (FDTS)
Portfolio of Investments
(Continued)
December 31, 2022
Valuation Inputs
A summary of the inputs
used to value the Fund’s investments as of December 31, 2022 is as follows (see Note 2A - Portfolio Valuation in the Notes to Financial Statements):
|
| Total
Value at
12/31/2022
| Level 1
Quoted
Prices
| Level 2
Significant
Observable
Inputs
| Level 3
Significant
Unobservable
Inputs
|
| Common Stocks:
|
|
|
|
|
| Australia
| $ 210,439
| $ 208,536
| $ 1,903
| $ —
|
| Greece
| 48,710
| 48,710
| —
| —**
|
| Netherlands
| 28,677
| 28,677
| —
| —**
|
| South Korea
| 1,200,111
| 1,195,730
| —
| 4,381
|
| Spain
| 38,396
| 38,396
| —
| —**
|
| Sweden
| 241,112
| 236,469
| 4,643
| —
|
| Other Country Categories*
| 5,044,888
| 5,044,888
| —
| —
|
| Real Estate Investment Trusts*
| 663,200
| 663,200
| —
| —
|
| Money Market Funds
| 64,189
| 64,189
| —
| —
|
| Total Investments
| $ 7,539,722
| $ 7,528,795
| $ 6,546
| $ 4,381
|
| *
| See Portfolio of Investments for country breakout.
|
| **
| Investment is valued at $0.
|
Level 3 investments are
fair valued by the Advisor’s Pricing Committee and are footnoted in the Portfolio of Investments. The Level 3 investments values are based on unobservable and non-quantitative inputs.
See Notes to Financial Statements
Page 79
First Trust Emerging Markets Small Cap
AlphaDEX® Fund (FEMS)
Portfolio of Investments
December 31, 2022
| Shares
|
| Description
|
| Value
|
| COMMON STOCKS (a) – 99.3%
|
|
|
| Bermuda – 1.1%
|
|
|
| 374,961
|
| BOE Varitronix Ltd.
|
| $712,889
|
| 2,125,604
|
| China Ruyi Holdings Ltd. (b) (c)
|
| 531,030
|
| 594,966
|
| Shenzhen International Holdings Ltd.
|
| 583,879
|
|
|
|
|
| 1,827,798
|
|
|
| Brazil – 12.4%
|
|
|
| 202,903
|
| Anima Holding S.A. (c)
|
| 148,341
|
| 37,323
|
| Arezzo Industria e Comercio S.A.
|
| 553,156
|
| 234,324
|
| Banco ABC Brasil S.A. (Preference Shares)
|
| 871,656
|
| 416,777
|
| Banco do Estado do Rio Grande do Sul S.A., Class B (Preference Shares)
|
| 765,706
|
| 257,643
|
| Bradespar S.A. (Preference Shares)
|
| 1,450,286
|
| 81,435
|
| BrasilAgro - Co Brasileira de Propriedades Agricolas
|
| 462,104
|
| 321,054
|
| Cia Brasileira de Aluminio
|
| 702,339
|
| 189,430
|
| Cia Brasileira de Distribuicao
|
| 592,714
|
| 285,544
|
| Cia de Saneamento do Parana
|
| 976,737
|
| 70,667
|
| Cia Ferro Ligas da Bahia-Ferbasa (Preference Shares)
|
| 715,671
|
| 455,430
|
| Cielo S.A.
|
| 452,001
|
| 418,240
|
| Cogna Educacao (c)
|
| 167,938
|
| 67,007
|
| Cyrela Brazil Realty S.A. Empreendimentos e Participacoes
|
| 165,876
|
| 286,189
|
| Dexco S.A.
|
| 367,510
|
| 290,626
|
| Direcional Engenharia S.A.
|
| 860,910
|
| 112,657
|
| EDP - Energias do Brasil S.A.
|
| 443,608
|
| 421,587
|
| Enauta Participacoes S.A.
|
| 1,077,972
|
| 166,164
|
| JHSF Participacoes S.A.
|
| 157,989
|
| 49,688
|
| LOG Commercial Properties e Participacoes S.A.
|
| 151,706
|
| 74,639
|
| Log-in Logistica Intermodal S.A. (c)
|
| 496,203
|
| 84,201
|
| M. Dias Branco S.A.
|
| 571,414
|
| 850,965
|
| Marcopolo S.A. (Preference Shares)
|
| 456,126
|
| 496,163
|
| Marfrig Global Foods S.A.
|
| 817,580
|
| 462,434
|
| Metalurgica Gerdau S.A. (Preference Shares)
|
| 1,135,995
|
| 443,180
|
| Mills Estruturas e Servicos de Engenharia S.A.
|
| 959,429
|
| 196,107
|
| Minerva S.A.
|
| 481,376
|
| 116,382
|
| Porto Seguro S.A.
|
| 510,298
|
| 129,435
|
| Randon S.A. Implementos e Participacoes (Preference Shares)
|
| 201,271
|
| 48,178
|
| Sao Martinho S.A.
|
| 241,996
|
| 445,205
|
| Tres Tentos Agroindustrial S.A.
|
| 785,892
|
| 195,114
|
| Tupy S.A.
|
| 1,010,724
|
| Shares
|
| Description
|
| Value
|
|
|
|
|
| Brazil (Continued)
|
|
|
| 38,265
|
| Unipar Carbocloro S.A., Class B (Preference Shares)
|
| $637,853
|
| 814,021
|
| Usinas Siderurgicas de Minas Gerais S.A., Class A (Preference Shares)
|
| 1,103,914
|
| 89,953
|
| Vamos Locacao de Caminhoes Maquinas e Equipamentos S.A.
|
| 215,352
|
|
|
|
|
| 20,709,643
|
|
|
| Cayman Islands – 8.8%
|
|
|
| 1,939,111
|
| Agile Group Holdings Ltd. (b) (c)
|
| 573,874
|
| 912,000
|
| China Aoyuan Group Ltd. (c) (d) (e) (f)
|
| 68,936
|
| 709,826
|
| China Conch Venture Holdings Ltd.
|
| 1,542,339
|
| 189,971
|
| China Medical System Holdings Ltd.
|
| 298,874
|
| 11,550
|
| China Metal Recycling Holdings Ltd. (c) (d) (e) (f)
|
| 0
|
| 1,162,211
|
| China Risun Group Ltd. (b) (g)
|
| 454,137
|
| 1,688,028
|
| China Yongda Automobiles Services Holdings Ltd.
|
| 1,254,324
|
| 3,171,951
|
| China Zhongwang Holdings Ltd. (c) (d) (e)
|
| 682,712
|
| 610,976
|
| CIFI Ever Sunshine Services Group Ltd. (b) (g)
|
| 343,630
|
| 4,460,449
|
| CIFI Holdings Group Co., Ltd.
|
| 628,598
|
| 680,290
|
| Dongyue Group Ltd.
|
| 748,668
|
| 2,215,590
|
| Fufeng Group Ltd.
|
| 1,348,295
|
| 90,795
|
| Fulgent Sun International Holding Co., Ltd.
|
| 449,020
|
| 92,951
|
| General Interface Solution Holding Ltd.
|
| 266,132
|
| 1,617,908
|
| Kaisa Group Holdings Ltd. (c) (d) (e) (f)
|
| 87,057
|
| 757,314
|
| Kingboard Laminates Holdings Ltd.
|
| 832,464
|
| 4,461,675
|
| Powerlong Real Estate Holdings Ltd. (b)
|
| 897,428
|
| 1,939,621
|
| Seazen Group Ltd. (c)
|
| 718,153
|
| 2,137,169
|
| Shimao Services Holdings Ltd. (b) (c) (g) (h)
|
| 772,129
|
| 1,551,710
|
| Tian Lun Gas Holdings Ltd. (b)
|
| 775,313
|
| 520,064
|
| Tianneng Power International Ltd. (b)
|
| 549,017
|
| 695,021
|
| Wisdom Marine Lines Co., Ltd.
|
| 1,388,437
|
|
|
|
|
| 14,679,537
|
|
|
| Chile – 1.7%
|
|
|
| 138,549
|
| CAP S.A.
|
| 1,135,179
|
| 259,868
|
| Embotelladora Andina S.A., Class B (Preference Shares)
|
| 637,193
|
| 23,240,133
|
| Enel Chile S.A.
|
| 1,068,238
|
|
|
|
|
| 2,840,610
|
Page 80
See Notes to Financial
Statements
First Trust Emerging Markets Small Cap
AlphaDEX® Fund (FEMS)
Portfolio of Investments
(Continued)
December 31, 2022
| Shares
|
| Description
|
| Value
|
| COMMON STOCKS (a) (Continued)
|
|
|
| China – 2.3%
|
|
|
| 1,428,356
|
| A-Living Smart City Services Co., Ltd., Class H (g) (h)
|
| $1,721,980
|
| 3,112,367
|
| BAIC Motor Corp., Ltd., Class H (g) (h)
|
| 825,398
|
| 677,134
|
| China Communications Services Corp., Ltd., Class H
|
| 247,242
|
| 261,680
|
| Legend Holdings Corp., Class H (g) (h)
|
| 279,936
|
| 426,270
|
| Xinte Energy Co., Ltd., Class H
|
| 788,595
|
|
|
|
|
| 3,863,151
|
|
|
| Egypt – 0.3%
|
|
|
| 771,223
|
| Egyptian Financial Group-Hermes Holding Co. (i)
|
| 557,038
|
|
|
| Hong Kong – 2.2%
|
|
|
| 1,094,512
|
| China Everbright Environment Group Ltd.
|
| 489,382
|
| 1,189,719
|
| China Nonferrous Mining Corp., Ltd.
|
| 611,211
|
| 1,839,295
|
| China Overseas Grand Oceans Group Ltd.
|
| 798,828
|
| 336,290
|
| Far East Horizon Ltd.
|
| 262,812
|
| 443,691
|
| Genertec Universal Medical Group Co., Ltd. (g) (h)
|
| 269,439
|
| 3,878,790
|
| Shougang Fushan Resources Group Ltd.
|
| 1,237,365
|
|
|
|
|
| 3,669,037
|
|
|
| India – 2.0%
|
|
|
| 922,242
|
| Bharat Heavy Electricals Ltd.
|
| 882,891
|
| 1,643,947
|
| Brightcom Group Ltd.
|
| 584,214
|
| 1,033,040
|
| National Aluminium Co., Ltd.
|
| 1,003,946
|
| 6,377,346
|
| Suzlon Energy Ltd. (c)
|
| 817,114
|
|
|
|
|
| 3,288,165
|
|
|
| Indonesia – 6.1%
|
|
|
| 12,765,932
|
| AKR Corporindo Tbk PT
|
| 1,148,052
|
| 839,243
|
| Astra Agro Lestari Tbk PT
|
| 432,627
|
| 8,547,729
|
| Berkah Beton Sadaya Tbk PT
|
| 406,316
|
| 63,360,331
|
| Bukalapak.com PT Tbk (c)
|
| 1,066,350
|
| 100,636,547
|
| Bumi Resources Tbk PT (c)
|
| 1,040,789
|
| 5,744,661
|
| Indika Energy Tbk PT
|
| 1,007,414
|
| 416,038
|
| Indo Tambangraya Megah Tbk PT
|
| 1,042,935
|
| 18,834,976
|
| Medco Energi Internasional Tbk PT
|
| 1,228,039
|
| 9,755,093
|
| Mitra Adiperkasa Tbk PT (c)
|
| 905,483
|
| 5,917,671
|
| Perusahaan Gas Negara Tbk PT
|
| 669,029
|
| 10,437,712
|
| Surya Esa Perkasa Tbk PT
|
| 613,490
|
| 7,779,408
|
| Timah Tbk PT
|
| 584,674
|
|
|
|
|
| 10,145,198
|
|
|
| Jersey – 0.5%
|
|
|
| 6,692,498
|
| West China Cement Ltd.
|
| 788,820
|
| Shares
|
| Description
|
| Value
|
|
|
|
|
| Malaysia – 1.4%
|
|
|
| 4,134,600
|
| Dagang NeXchange Bhd
|
| $478,694
|
| 1,897,700
|
| Hartalega Holdings Bhd
|
| 732,370
|
| 4,859,200
|
| Kossan Rubber Industries
|
| 1,213,421
|
|
|
|
|
| 2,424,485
|
|
|
| Mexico – 2.8%
|
|
|
| 154,716
|
| Coca-Cola Femsa S.A.B. de C.V.
|
| 1,047,161
|
| 786,066
|
| Gentera S.A.B. de C.V.
|
| 886,651
|
| 382,412
|
| Grupo Comercial Chedraui S.A. de C.V.
|
| 1,629,223
|
| 209,684
|
| Grupo Televisa S.A.B., Series CPO
|
| 190,460
|
| 336,464
|
| Megacable Holdings S.A.B. de C.V.
|
| 895,614
|
|
|
|
|
| 4,649,109
|
|
|
| Philippines – 0.5%
|
|
|
| 1,367,000
|
| Semirara Mining & Power Corp.
|
| 846,288
|
|
|
| Poland – 4.0%
|
|
|
| 348,277
|
| Cyfrowy Polsat S.A.
|
| 1,399,833
|
| 167,668
|
| Jastrzebska Spolka Weglowa S.A. (c)
|
| 2,225,700
|
| 1,078,688
|
| Orange Polska S.A.
|
| 1,631,320
|
| 712,521
|
| PGE Polska Grupa Energetyczna S.A. (c)
|
| 1,119,517
|
| 553,933
|
| Tauron Polska Energia S.A. (c)
|
| 267,905
|
|
|
|
|
| 6,644,275
|
|
|
| Russia – 0.0%
|
|
|
| 378,620,637
|
| Federal Grid Co. Unified Energy System PJSC (c) (d) (e) (f)
|
| 11,705
|
| 580,351
|
| Mechel PJSC (c) (d) (e) (f)
|
| 16,410
|
| 41,053,967
|
| ROSSETI PJSC (c) (d) (e) (f)
|
| 9,486
|
|
|
|
|
| 37,601
|
|
|
| South Africa – 3.2%
|
|
|
| 66,552
|
| African Rainbow Minerals Ltd.
|
| 1,128,050
|
| 63,455
|
| Astral Foods Ltd.
|
| 607,801
|
| 71,202
|
| Motus Holdings Ltd.
|
| 463,806
|
| 120,890
|
| Omnia Holdings Ltd.
|
| 445,104
|
| 139,552
|
| OUTsurance Group Ltd.
|
| 259,043
|
| 462,075
|
| Sappi Ltd. (c)
|
| 1,339,076
|
| 176,117
|
| Telkom S.A. SOC Ltd. (c)
|
| 311,162
|
| 48,839
|
| Thungela Resources Ltd.
|
| 823,965
|
|
|
|
|
| 5,378,007
|
|
|
| Taiwan – 16.5%
|
|
|
| 426,145
|
| Aerospace Industrial Development Corp.
|
| 495,671
|
| 129,459
|
| Asia Vital Components Co., Ltd.
|
| 471,748
|
| 90,795
|
| Charoen Pokphand Enterprise
|
| 231,304
|
| 87,603
|
| Chicony Electronics Co., Ltd.
|
| 245,974
|
| 1,197,735
|
| ChipMOS Technologies, Inc.
|
| 1,305,465
|
| 159,169
|
| Compeq Manufacturing Co., Ltd.
|
| 230,451
|
| 953,418
|
| Continental Holdings Corp.
|
| 868,562
|
See Notes to Financial
Statements
Page 81
First Trust Emerging Markets Small Cap
AlphaDEX® Fund (FEMS)
Portfolio of Investments
(Continued)
December 31, 2022
| Shares
|
| Description
|
| Value
|
| COMMON STOCKS (a) (Continued)
|
|
|
| Taiwan (Continued)
|
|
|
| 474,863
|
| CTCI Corp.
|
| $646,582
|
| 338,823
|
| Elite Semiconductor Microelectronics Technology, Inc.
|
| 716,549
|
| 1,110,429
|
| Elitegroup Computer Systems Co., Ltd. (c)
|
| 744,248
|
| 173,917
|
| Ennostar, Inc.
|
| 253,218
|
| 309,343
|
| Fitipower Integrated Technology, Inc.
|
| 1,162,471
|
| 471,250
|
| FocalTech Systems Co., Ltd.
|
| 898,481
|
| 81,190
|
| Gigabyte Technology Co., Ltd.
|
| 281,327
|
| 11,947
|
| Global Unichip Corp.
|
| 249,159
|
| 1,237,342
|
| Grand Pacific Petrochemical
|
| 758,858
|
| 438,976
|
| Greatek Electronics, Inc.
|
| 685,554
|
| 159,169
|
| Huaku Development Co., Ltd.
|
| 460,902
|
| 370,947
|
| International CSRC Investment Holding Co.
|
| 234,742
|
| 18,588
|
| Jentech Precision Industrial Co., Ltd.
|
| 227,697
|
| 285,282
|
| Kindom Development Co., Ltd.
|
| 271,030
|
| 14,116
|
| King Slide Works Co., Ltd.
|
| 176,361
|
| 702,625
|
| King Yuan Electronics Co., Ltd.
|
| 827,545
|
| 155,217
|
| Kinsus Interconnect Technology Corp.
|
| 527,734
|
| 8,976
|
| Lotes Co., Ltd.
|
| 241,225
|
| 922,808
|
| Macronix International Co., Ltd.
|
| 1,013,316
|
| 1,330,827
|
| Mitac Holdings Corp.
|
| 1,277,331
|
| 402,157
|
| Nantex Industry Co., Ltd.
|
| 484,779
|
| 279,908
|
| Powertech Technology, Inc.
|
| 721,274
|
| 226,264
|
| Primax Electronics Ltd.
|
| 408,572
|
| 376,087
|
| Sanyang Motor Co Ltd.
|
| 414,197
|
| 274,182
|
| Sercomm Corp.
|
| 680,649
|
| 508,290
|
| Sigurd Microelectronics Corp.
|
| 802,898
|
| 559,518
|
| Sinon Corp.
|
| 663,546
|
| 130,918
|
| Sitronix Technology Corp.
|
| 756,062
|
| 381,227
|
| TA Chen Stainless Pipe Co., Ltd.
|
| 525,907
|
| 1,239,673
|
| Taiwan Glass Industry Corp.
|
| 857,089
|
| 86,000
|
| Taiwan Hon Chuan Enterprise Co., Ltd.
|
| 243,432
|
| 1,592,558
|
| Ton Yi Industrial Corp.
|
| 883,445
|
| 39,133
|
| Tong Hsing Electronic Industries Ltd.
|
| 243,185
|
| 139,656
|
| Topco Scientific Co., Ltd.
|
| 745,183
|
| 197,681
|
| TSEC Corp. (c)
|
| 222,215
|
| 395,343
|
| U-Ming Marine Transport Corp.
|
| 625,129
|
| 368,396
|
| Unitech Printed Circuit Board Corp. (c)
|
| 206,759
|
| 182,261
|
| Via Technologies, Inc.
|
| 399,088
|
| 193,764
|
| Walsin Technology Corp.
|
| 498,035
|
| 1,455,476
|
| Winbond Electronics Corp.
|
| 928,156
|
| 264,710
|
| Wistron NeWeb Corp.
|
| 675,221
|
|
|
|
|
| 27,488,326
|
|
|
| Thailand – 8.7%
|
|
|
| 1,805,500
|
| AP Thailand PCL
|
| 604,700
|
| Shares
|
| Description
|
| Value
|
|
|
|
|
| Thailand (Continued)
|
|
|
| 1,162,400
|
| Bangchak Corp. PCL
|
| $1,057,185
|
| 707,900
|
| Bangkok Airways PCL (c)
|
| 273,881
|
| 2,788,200
|
| Banpu PCL
|
| 1,102,883
|
| 174,300
|
| Central Plaza Hotel PCL (c)
|
| 252,882
|
| 3,348,700
|
| Esso Thailand PCL
|
| 1,218,237
|
| 169,600
|
| Forth Corp PCL
|
| 157,921
|
| 5,496,600
|
| IRPC PCL
|
| 479,276
|
| 2,450,300
|
| Precious Shipping PCL
|
| 1,139,016
|
| 2,143,300
|
| PTG Energy PCL
|
| 897,296
|
| 1,478,600
|
| Regional Container Lines PCL
|
| 1,312,746
|
| 1,759,900
|
| Sri Trang Agro-Industry PCL
|
| 1,072,149
|
| 3,009,100
|
| Sri Trang Gloves Thailand PCL
|
| 868,803
|
| 4,044,300
|
| Star Petroleum Refining PCL
|
| 1,249,430
|
| 1,360,600
|
| Supalai PCL
|
| 954,600
|
| 836,100
|
| Thai Oil PCL
|
| 1,357,893
|
| 1,490,600
|
| Thaifoods Group PCL, Class F
|
| 221,643
|
| 2,435,600
|
| WHA Corp. PCL
|
| 286,914
|
|
|
|
|
| 14,507,455
|
|
|
| Turkey – 24.1%
|
|
|
| 256,644
|
| AG Anadolu Grubu Holding A.S.
|
| 1,514,978
|
| 568,899
|
| Aksa Enerji Uretim A.S.
|
| 1,429,681
|
| 285,698
|
| Alarko Holding A.S.
|
| 1,252,643
|
| 523,741
|
| Anadolu Efes Biracilik Ve Malt Sanayii A.S.
|
| 1,897,283
|
| 361,119
|
| Cimsa Cimento Sanayi VE Ticare
|
| 1,938,609
|
| 124,701
|
| Coca-Cola Icecek A.S.
|
| 1,362,878
|
| 4,361,979
|
| Dogan Sirketler Grubu Holding A.S.
|
| 2,467,603
|
| 1,209,276
|
| Enerjisa Enerji A.S. (g) (h)
|
| 2,331,617
|
| 813,844
|
| Haci Omer Sabanci Holding A.S.
|
| 1,961,694
|
| 1,067,012
|
| Hektas Ticaret TAS
|
| 2,146,319
|
| 760,740
|
| Is Yatirim Menkul Degerler A.S.
|
| 2,643,965
|
| 1,404,583
|
| Kardemir Karabuk Demir Celik Sanayi ve Ticaret A.S., Class D
|
| 1,351,091
|
| 207,328
|
| Migros Ticaret A.S. (c)
|
| 1,624,059
|
| 340,884
|
| MLP Saglik Hizmetleri A.S. (c) (g) (h)
|
| 1,644,066
|
| 29,768
|
| Otokar Otomotiv Ve Savunma Sanayi A.S.
|
| 1,652,164
|
| 88,078
|
| Pegasus Hava Tasimaciligi A.S. (c)
|
| 2,260,554
|
| 1,692,029
|
| Petkim Petrokimya Holding A.S. (c)
|
| 1,805,820
|
| 1,014,555
|
| Sok Marketler Ticaret A.S. (c)
|
| 1,516,767
|
| 266,630
|
| TAV Havalimanlari Holding A.S. (c)
|
| 1,332,990
|
| 712,675
|
| Tekfen Holding A.S.
|
| 1,877,120
|
| 60,100
|
| Turk Traktor ve Ziraat Makineleri A.S.
|
| 2,120,921
|
| 524,524
|
| Vestel Elektronik Sanayi ve Ticaret A.S. (c)
|
| 1,998,280
|
|
|
|
|
| 40,131,102
|
Page 82
See Notes to Financial
Statements
First Trust Emerging Markets Small Cap
AlphaDEX® Fund (FEMS)
Portfolio of Investments
(Continued)
December 31, 2022
| Shares
|
| Description
|
| Value
|
| COMMON STOCKS (a) (Continued)
|
|
|
| Virgin Islands (British) – 0.7%
|
|
|
| 5,416,715
|
| E-Commodities Holdings Ltd.
|
| $1,096,466
|
|
|
| Total Common Stocks
|
| 165,572,111
|
|
|
| (Cost $156,500,644)
|
|
|
| REAL ESTATE INVESTMENT TRUSTS (a) – 0.3%
|
|
|
| South Africa – 0.3%
|
|
|
| 253,781
|
| Equites Property Fund Ltd.
|
| 251,522
|
| 346,558
|
| Growthpoint Properties Ltd.
|
| 296,562
|
|
|
| Total Real Estate Investment Trusts
|
| 548,084
|
|
|
| (Cost $480,005)
|
|
|
| MONEY MARKET FUNDS – 1.7%
|
| 2,767,630
|
| Goldman Sachs Financial Square Treasury Obligations Fund - Institutional Class - 4.14% (j) (k)
|
| 2,767,630
|
|
|
| (Cost $2,767,630)
|
|
|
|
|
| Total Investments – 101.3%
|
| 168,887,825
|
|
|
| (Cost $159,748,279)
|
|
|
|
|
| Net Other Assets and Liabilities – (1.3)%
|
| (2,134,925)
|
|
|
| Net Assets – 100.0%
|
| $166,752,900
|
| (a)
| Portfolio securities are categorized based upon their country of incorporation, which can be different from the country categorization of the Fund’s underlying index. For a
breakdown of the portfolio securities by sector, please see the Fund Performance Overview.
|
| (b)
| All or a portion of this security is on loan (see Note 2F - Securities Lending in the Notes to Financial Statements). The remaining contractual maturity of all of the securities
lending transactions is overnight and continuous. The aggregate value of such securities is $2,129,737 and the total value of the collateral held by the Fund is $2,767,630.
|
| (c)
| Non-income producing security.
|
| (d)
| This security is fair valued by the Advisor’s Pricing Committee in accordance with procedures approved by the Trust’s Board of Trustees, and in accordance with the
provisions of the Investment Company Act of 1940 and rules thereunder, as amended. At December 31, 2022, securities noted as such are valued at $876,306 or 0.5% of net assets.
|
| (e)
| Pursuant to procedures adopted by the Trust’s Board of Trustees, this security has been determined to be illiquid by First Trust Advisors L.P., the Fund’s advisor.
|
| (f)
| This security’s value was determined using significant unobservable inputs (see Note 2A – Portfolio Valuation in the Notes to Financial Statements).
|
| (g)
| This security may be resold to qualified foreign investors and foreign institutional buyers under Regulation S of the Securities Act of 1933, as amended (the
“1933 Act”).
|
| (h)
| This security is exempt from registration upon resale under Rule 144A of the 1933 Act and may be resold in transactions exempt from registration, normally to qualified institutional
buyers. This security is not restricted on the foreign exchange where it trades freely without any additional registration. As such, it does not require the additional disclosure required of restricted securities.
|
| (i)
| Non-income producing security that makes payment-in-kind (“PIK”) distributions. For the fiscal year ended December 31, 2022, the Fund received 44,205 PIK shares of
Egyptian Financial Group-Hermes Holding Co.
|
| (j)
| Rate shown reflects yield as of December 31, 2022.
|
| (k)
| This security serves as collateral for securities on loan.
|
Offsetting Assets and Liabilities
Offsetting assets and
liabilities requires entities to disclose both gross and net information about instruments and transactions eligible for offset, and to disclose instruments and transactions subject to master netting or similar
agreements (see Note 2E – Offsetting on the Statements of Assets and Liabilities in the Notes to Financial Statements).
The Fund’s loaned
securities were all subject to an enforceable Securities Lending Agency Agreement. Securities lent in accordance with the Securities Lending Agency Agreement on a gross basis were as follows:
| Securities Lending Agency Agreement
|
|
| Total gross amount presented on the Statements of Assets and Liabilities (1)
| $2,129,737
|
| Non-cash Collateral (2)
| (2,129,737)
|
| Net Amount
| $—
|
| (1)
| The amount presented on the Statements of Assets and Liabilities, which is included in “Investments, at value,” is not offset and is shown on a gross basis.
|
| (2)
| At December 31, 2022, the value of the collateral received from each borrower exceeded the value of the related securities loaned. This amount is disclosed on the
Portfolio of Investments.
|
See Notes
to Financial Statements
Page 83
First Trust Emerging Markets Small Cap
AlphaDEX® Fund (FEMS)
Portfolio of Investments
(Continued)
December 31, 2022
Currency Exposure
Diversification
| % of Total
Investments
|
| Turkish Lira
| 23.8%
|
| New Taiwan Dollar
| 17.5
|
| Hong Kong Dollar
| 14.1
|
| Brazilian Real
| 12.3
|
| Thai Baht
| 8.6
|
| Indonesian Rupiah
| 6.0
|
| Polish Zloty
| 3.9
|
| South African Rand
| 3.5
|
| Mexican Peso
| 2.8
|
| Indian Rupee
| 2.0
|
| Chilean Peso
| 1.7
|
| United States Dollar
| 1.6
|
| Malaysian Ringgit
| 1.4
|
| Philippine Peso
| 0.5
|
| Egyptian Pound
| 0.3
|
| Russian Ruble
| 0.0†
|
| Total
| 100.0%
|
| †
| Amount is less than 0.1%.
|
Valuation Inputs
A summary of the inputs
used to value the Fund’s investments as of December 31, 2022 is as follows (see Note 2A - Portfolio Valuation in the Notes to Financial Statements):
|
| Total
Value at
12/31/2022
| Level 1
Quoted
Prices
| Level 2
Significant
Observable
Inputs
| Level 3
Significant
Unobservable
Inputs
|
| Common Stocks:
|
|
|
|
|
| Cayman Islands
| $ 14,679,537
| $ 13,840,832
| $ 682,712
| $ 155,993
|
| Russia
| 37,601
| —
| —
| 37,601
|
| Thailand
| 14,507,455
| —
| 14,507,455
| —
|
| Other Country Categories*
| 136,347,518
| 136,347,518
| —
| —
|
| Real Estate Investment Trusts*
| 548,084
| 548,084
| —
| —
|
| Money Market Funds
| 2,767,630
| 2,767,630
| —
| —
|
| Total Investments
| $ 168,887,825
| $ 153,504,064
| $ 15,190,167
| $ 193,594
|
| *
| See Portfolio of Investments for country breakout.
|
Level 3 investments are
fair valued by the Advisor’s Pricing Committee and are footnoted in the Portfolio of Investments. The Level 3 investments values are based on unobservable and non-quantitative inputs.
Page 84
See Notes to Financial Statements
First Trust Eurozone AlphaDEX® ETF (FEUZ)
Portfolio of Investments
December 31, 2022
| Shares
|
| Description
|
| Value
|
| COMMON STOCKS (a) – 95.3%
|
|
|
| Austria – 5.0%
|
|
|
| 2,042
|
| ANDRITZ AG
|
| $117,053
|
| 2,004
|
| BAWAG Group AG (b) (c)
|
| 106,830
|
| 2,931
|
| CA Immobilien Anlagen AG
|
| 88,948
|
| 2,623
|
| Erste Group Bank AG
|
| 83,953
|
| 3,973
|
| OMV AG
|
| 204,564
|
| 9,729
|
| Raiffeisen Bank International AG (d)
|
| 159,861
|
| 679
|
| Verbund AG
|
| 57,166
|
|
|
|
|
| 818,375
|
|
|
| Belgium – 1.9%
|
|
|
| 228
|
| Ackermans & van Haaren N.V.
|
| 39,099
|
| 204
|
| D’ieteren Group
|
| 39,132
|
| 8,409
|
| Proximus S.A.D.P.
|
| 80,977
|
| 1,492
|
| Solvay S.A.
|
| 150,863
|
|
|
|
|
| 310,071
|
|
|
| Finland – 4.5%
|
|
|
| 4,313
|
| Fortum Oyj
|
| 71,746
|
| 909
|
| Huhtamaki Oyj
|
| 31,137
|
| 9,054
|
| Kojamo Oyj
|
| 133,748
|
| 4,332
|
| Metso Outotec Oyj
|
| 44,573
|
| 3,314
|
| Neste Oyj
|
| 152,612
|
| 689
|
| Orion Oyj, Class B
|
| 37,791
|
| 9,075
|
| Stora Enso Oyj, Class R
|
| 127,743
|
| 3,646
|
| UPM-Kymmene Oyj
|
| 136,327
|
|
|
|
|
| 735,677
|
|
|
| France – 23.9%
|
|
|
| 749
|
| Aeroports de Paris (d)
|
| 100,381
|
| 784
|
| Alten S.A.
|
| 98,022
|
| 691
|
| Amundi S.A. (b) (c)
|
| 39,203
|
| 1,978
|
| Arkema S.A.
|
| 177,603
|
| 1,321
|
| AXA S.A.
|
| 36,844
|
| 681
|
| BNP Paribas S.A.
|
| 38,818
|
| 31,446
|
| Bollore SE
|
| 175,712
|
| 2,212
|
| Bouygues S.A.
|
| 66,394
|
| 179
|
| Capgemini SE
|
| 29,882
|
| 4,178
|
| Carrefour S.A.
|
| 69,947
|
| 2,405
|
| Cie de Saint-Gobain
|
| 117,523
|
| 2,565
|
| Cie Generale des Etablissements Michelin SCA
|
| 71,347
|
| 3,551
|
| Credit Agricole S.A.
|
| 37,369
|
| 1,254
|
| Edenred
|
| 68,299
|
| 1,080
|
| Eiffage S.A.
|
| 106,267
|
| 12,539
|
| Engie S.A.
|
| 179,699
|
| 212
|
| EssilorLuxottica S.A.
|
| 38,398
|
| 2,206
|
| Eurazeo SE
|
| 137,198
|
| 3,734
|
| Getlink SE
|
| 59,856
|
| 73
|
| Hermes International
|
| 112,916
|
| 313
|
| Ipsen S.A.
|
| 33,673
|
| 90
|
| L’Oreal S.A.
|
| 32,139
|
| 146
|
| LVMH Moet Hennessy Louis Vuitton SE
|
| 106,259
|
| 1,616
|
| Nexans S.A.
|
| 146,086
|
| Shares
|
| Description
|
| Value
|
|
|
|
|
| France (Continued)
|
|
|
| 12,845
|
| Orange S.A.
|
| $127,613
|
| 472
|
| Pernod Ricard S.A.
|
| 92,840
|
| 1,215
|
| Publicis Groupe S.A.
|
| 77,282
|
| 348
|
| Remy Cointreau S.A.
|
| 58,709
|
| 4,247
|
| Renault S.A. (d)
|
| 142,182
|
| 7,674
|
| Rexel S.A.
|
| 151,478
|
| 459
|
| SEB S.A.
|
| 38,447
|
| 4,364
|
| Societe Generale S.A.
|
| 109,686
|
| 1,924
|
| Sodexo S.A.
|
| 184,288
|
| 5,505
|
| SPIE S.A.
|
| 143,549
|
| 263
|
| Thales S.A.
|
| 33,586
|
| 3,129
|
| TotalEnergies SE (e)
|
| 196,445
|
| 1,900
|
| Valeo
|
| 33,965
|
| 714
|
| Vinci S.A.
|
| 71,302
|
| 18,626
|
| Vivendi SE
|
| 177,729
|
| 1,609
|
| Wendel SE
|
| 150,189
|
|
|
|
|
| 3,869,125
|
|
|
| Germany – 27.2%
|
|
|
| 3,000
|
| BASF SE
|
| 148,975
|
| 626
|
| Bayer AG
|
| 32,383
|
| 2,122
|
| Bayerische Motoren Werke AG
|
| 189,397
|
| 588
|
| Beiersdorf AG
|
| 67,474
|
| 1,428
|
| Brenntag SE
|
| 91,288
|
| 20,224
|
| Commerzbank AG (d)
|
| 191,289
|
| 1,293
|
| Continental AG
|
| 77,481
|
| 5,027
|
| Covestro AG (b) (c)
|
| 196,681
|
| 2,544
|
| Daimler Truck Holding AG (d)
|
| 78,824
|
| 783
|
| Delivery Hero SE (b) (c) (d)
|
| 37,533
|
| 3,884
|
| Deutsche Bank AG
|
| 44,021
|
| 530
|
| Deutsche Boerse AG
|
| 91,568
|
| 25,091
|
| Deutsche Lufthansa AG (d)
|
| 208,557
|
| 2,863
|
| Deutsche Post AG
|
| 107,816
|
| 1,698
|
| Deutsche Telekom AG
|
| 33,877
|
| 7,522
|
| E.ON SE
|
| 75,157
|
| 5,165
|
| Evonik Industries AG
|
| 99,160
|
| 3,069
|
| Fresenius Medical Care AG & Co., KGaA
|
| 100,429
|
| 4,059
|
| Fresenius SE & Co., KGaA
|
| 114,055
|
| 1,142
|
| FUCHS PETROLUB SE (Preference Shares)
|
| 40,023
|
| 963
|
| Hannover Rueck SE
|
| 191,221
|
| 2,908
|
| HeidelbergCement AG
|
| 165,854
|
| 487
|
| Henkel AG & Co., KGaA (Preference Shares)
|
| 33,896
|
| 1,854
|
| HUGO BOSS AG
|
| 107,487
|
| 7,654
|
| K+S AG
|
| 150,550
|
| 2,420
|
| LEG Immobilien SE
|
| 157,657
|
| 2,836
|
| Mercedes-Benz Group AG
|
| 186,398
|
| 480
|
| Muenchener Rueckversicherungs-Gesellschaft AG in Muenchen
|
| 156,200
|
| 2,553
|
| Porsche Automobil Holding SE (Preference Shares)
|
| 140,032
|
| 3,929
|
| RWE AG
|
| 174,919
|
See Notes to Financial
Statements
Page 85
First Trust Eurozone AlphaDEX® ETF (FEUZ)
Portfolio of Investments
(Continued)
December 31, 2022
| Shares
|
| Description
|
| Value
|
| COMMON STOCKS (a) (Continued)
|
|
|
| Germany (Continued)
|
|
|
| 574
|
| Scout24 AG (b) (c)
|
| $28,836
|
| 724
|
| Sixt SE
|
| 66,612
|
| 3,263
|
| Talanx AG
|
| 154,804
|
| 28,652
|
| Telefonica Deutschland Holding AG
|
| 70,634
|
| 3,084
|
| United Internet AG
|
| 62,361
|
| 1,963
|
| VERBIO Vereinigte BioEnergie AG
|
| 127,338
|
| 1,092
|
| Volkswagen AG (Preference Shares)
|
| 136,087
|
| 4,011
|
| Vonovia SE
|
| 94,545
|
| 1,399
|
| Wacker Chemie AG
|
| 178,809
|
|
|
|
|
| 4,410,228
|
|
|
| Greece – 0.6%
|
|
|
| 2,000
|
| Hellenic Telecommunications Organization S.A.
|
| 31,235
|
| 4,837
|
| OPAP S.A.
|
| 68,502
|
|
|
|
|
| 99,737
|
|
|
| Ireland – 4.1%
|
|
|
| 47,784
|
| AIB Group PLC
|
| 184,960
|
| 18,037
|
| Bank of Ireland Group PLC
|
| 171,839
|
| 3,592
|
| CRH PLC
|
| 142,305
|
| 12,605
|
| Glanbia PLC
|
| 160,837
|
|
|
|
|
| 659,941
|
|
|
| Italy – 7.1%
|
|
|
| 33,071
|
| Banco BPM S.p.A.
|
| 118,026
|
| 2,373
|
| Brunello Cucinelli S.p.A.
|
| 175,526
|
| 13,610
|
| Eni S.p.A.
|
| 193,561
|
| 2,102
|
| ERG S.p.A.
|
| 65,163
|
| 13,585
|
| Hera S.p.A.
|
| 36,632
|
| 12,252
|
| Leonardo S.p.A.
|
| 105,708
|
| 26,516
|
| Pirelli & C S.p.A. (b) (c)
|
| 113,650
|
| 5,013
|
| Prysmian S.p.A.
|
| 185,991
|
| 11,359
|
| UniCredit S.p.A.
|
| 161,378
|
|
|
|
|
| 1,155,635
|
|
|
| Luxembourg – 2.8%
|
|
|
| 7,185
|
| ArcelorMittal S.A.
|
| 189,011
|
| 26,316
|
| Aroundtown S.A.
|
| 61,495
|
| 11,194
|
| Tenaris S.A.
|
| 195,137
|
|
|
|
|
| 445,643
|
|
|
| Netherlands – 8.4%
|
|
|
| 1,759
|
| Aalberts N.V.
|
| 68,218
|
| 6,436
|
| ABN AMRO Bank N.V. (b) (c)
|
| 89,046
|
| 7,240
|
| Aegon N.V.
|
| 36,720
|
| 751
|
| ASR Nederland N.V.
|
| 35,653
|
| 1,685
|
| Heineken Holding N.V.
|
| 129,957
|
| 1,322
|
| Heineken N.V.
|
| 124,362
|
| 3,409
|
| Koninklijke Ahold Delhaize N.V.
|
| 97,944
|
| 9,281
|
| Koninklijke Philips N.V.
|
| 139,128
|
| 1,486
|
| NN Group N.V.
|
| 60,701
|
| Shares
|
| Description
|
| Value
|
|
|
|
|
| Netherlands (Continued)
|
|
|
| 3,953
|
| OCI N.V.
|
| $141,416
|
| 1,651
|
| Prosus N.V.
|
| 113,903
|
| 1,998
|
| Randstad N.V.
|
| 121,824
|
| 3,346
|
| Signify N.V. (b) (c)
|
| 112,395
|
| 921
|
| STMicroelectronics N.V.
|
| 32,529
|
| 594
|
| Wolters Kluwer N.V.
|
| 62,160
|
|
|
|
|
| 1,365,956
|
|
|
| Portugal – 2.0%
|
|
|
| 26,755
|
| EDP - Energias de Portugal S.A.
|
| 133,347
|
| 9,069
|
| Galp Energia SGPS S.A.
|
| 122,417
|
| 3,118
|
| Jeronimo Martins SGPS S.A.
|
| 67,354
|
|
|
|
|
| 323,118
|
|
|
| Spain – 7.8%
|
|
|
| 822
|
| Acciona S.A.
|
| 151,257
|
| 6,420
|
| ACS Actividades de Construccion y Servicios S.A.
|
| 183,971
|
| 19,282
|
| Banco Bilbao Vizcaya Argentaria S.A.
|
| 116,288
|
| 86,280
|
| Banco de Sabadell S.A.
|
| 81,349
|
| 24,774
|
| Banco Santander S.A.
|
| 74,321
|
| 10,301
|
| Bankinter S.A.
|
| 69,115
|
| 35,878
|
| CaixaBank S.A.
|
| 141,025
|
| 12,397
|
| Iberdrola S.A.
|
| 145,045
|
| 1,414
|
| Industria de Diseno Textil S.A.
|
| 37,613
|
| 2,503
|
| Naturgy Energy Group S.A.
|
| 65,135
|
| 12,578
|
| Repsol S.A.
|
| 199,942
|
|
|
|
|
| 1,265,061
|
|
|
| Total Common Stocks
|
| 15,458,567
|
|
|
| (Cost $16,485,110)
|
|
|
| REAL ESTATE INVESTMENT TRUSTS (a) – 3.5%
|
|
|
| Belgium – 0.8%
|
|
|
| 4,729
|
| Warehouses De Pauw CVA
|
| 135,160
|
|
|
| France – 1.8%
|
|
|
| 2,399
|
| Covivio
|
| 142,396
|
| 1,107
|
| Gecina S.A.
|
| 112,751
|
| 1,659
|
| Klepierre S.A.
|
| 38,235
|
|
|
|
|
| 293,382
|
|
|
| Spain – 0.9%
|
|
|
| 15,027
|
| Merlin Properties Socimi S.A.
|
| 141,152
|
|
|
| Total Real Estate Investment Trusts
|
| 569,694
|
|
|
| (Cost $668,996)
|
|
|
Page 86
See Notes to Financial
Statements
First Trust Eurozone AlphaDEX® ETF (FEUZ)
Portfolio of Investments
(Continued)
December 31, 2022
| Shares
|
| Description
|
| Value
|
| MONEY MARKET FUNDS – 1.1%
|
| 172,701
|
| Goldman Sachs Financial Square Treasury Obligations Fund - Institutional Class - 4.14% (f) (g)
|
| $172,701
|
|
|
| (Cost $172,701)
|
|
|
|
|
| Total Investments – 99.9%
|
| 16,200,962
|
|
|
| (Cost $17,326,807)
|
|
|
|
|
| Net Other Assets and Liabilities – 0.1%
|
| 18,304
|
|
|
| Net Assets – 100.0%
|
| $16,219,266
|
| (a)
| Portfolio securities are categorized based upon their country of incorporation, which can be different from the country categorization of the Fund’s underlying index. For a
breakdown of the portfolio securities by sector, please see the Fund Performance Overview.
|
| (b)
| This security may be resold to qualified foreign investors and foreign institutional buyers under Regulation S of the Securities Act of 1933, as amended (the “1933 Act”).
|
| (c)
| This security is exempt from registration upon resale under Rule 144A of the 1933 Act and may be resold in transactions exempt from registration, normally to qualified institutional
buyers. This security is not restricted on the foreign exchange where it trades freely without any additional registration. As such, it does not require the additional disclosure required of restricted securities.
|
| (d)
| Non-income producing security.
|
| (e)
| All or a portion of this security is on loan (see Note 2F - Securities Lending in the Notes to Financial Statements). The remaining contractual maturity of all of the securities
lending transactions is overnight and continuous. The aggregate value of such securities is $162,605 and the total value of the collateral held by the Fund is $172,701.
|
| (f)
| Rate shown reflects yield as of December 31, 2022.
|
| (g)
| This security serves as collateral for securities on loan.
|
Offsetting Assets and Liabilities
Offsetting assets and
liabilities requires entities to disclose both gross and net information about instruments and transactions eligible for offset, and to disclose instruments and transactions subject to master netting or similar
agreements (see Note 2E – Offsetting on the Statements of Assets and Liabilities in the Notes to Financial Statements).
The Fund’s loaned
securities were all subject to an enforceable Securities Lending Agency Agreement. Securities lent in accordance with the Securities Lending Agency Agreement on a gross basis were as follows:
| Securities Lending Agency Agreement
|
|
| Total gross amount presented on the Statements of Assets and Liabilities (1)
| $162,605
|
| Non-cash Collateral (2)
| (162,605)
|
| Net Amount
| $—
|
| (1)
| The amount presented on the Statements of Assets and Liabilities, which is included in “Investments, at value,” is not offset and is shown on a gross basis.
|
| (2)
| At December 31, 2022, the value of the collateral received from each borrower exceeded the value of the related securities loaned. This amount is disclosed on the
Portfolio of Investments.
|
Currency Exposure
Diversification
| % of Total
Investments
|
| Euro
| 98.9%
|
| United States Dollar
| 1.1
|
| Total
| 100.0%
|
Valuation Inputs
A summary of the inputs
used to value the Fund’s investments as of December 31, 2022 is as follows (see Note 2A - Portfolio Valuation in the Notes to Financial Statements):
|
| Total
Value at
12/31/2022
| Level 1
Quoted
Prices
| Level 2
Significant
Observable
Inputs
| Level 3
Significant
Unobservable
Inputs
|
| Common Stocks*
| $ 15,458,567
| $ 15,458,567
| $ —
| $ —
|
| Real Estate Investment Trusts*
| 569,694
| 569,694
| —
| —
|
| Money Market Funds
| 172,701
| 172,701
| —
| —
|
| Total Investments
| $ 16,200,962
| $ 16,200,962
| $—
| $—
|
| *
| See Portfolio of Investments for country breakout.
|
See Notes to Financial
Statements
Page 87
First Trust Exchange-Traded AlphaDEX® Fund II
Statements of Assets and
Liabilities
December 31, 2022
|
| First Trust
Asia Pacific
ex-Japan
AlphaDEX®
Fund
(FPA)
|
| First Trust
Europe
AlphaDEX®
Fund
(FEP)
|
| First Trust
Latin
America
AlphaDEX®
Fund
(FLN)
|
| First Trust
Brazil
AlphaDEX®
Fund
(FBZ)
|
| ASSETS:
|
|
|
|
|
|
|
|
Investments, at value
| $ 11,551,597
|
| $ 254,507,182
|
| $ 69,715,531
|
| $ 62,893,902
|
Cash
| 12,036
|
| 616,133
|
| 375,109
|
| 92,743
|
Foreign currency
| 2
|
| —
|
| 193,556
|
| 43,680
|
| Receivables:
|
|
|
|
|
|
|
|
Fund shares sold
| —
|
| —
|
| —
|
| —
|
Dividends
| 95,703
|
| 437,454
|
| 445,950
|
| 380,440
|
Dividend reclaims
| —
|
| 2,700,683
|
| —
|
| —
|
Securities lending income
| 124
|
| 5,505
|
| —
|
| —
|
Investment securities sold
| 189
|
| —
|
| 463
|
| —
|
Miscellaneous
| —
|
| 91,538
|
| 20,240
|
| —
|
Total Assets
| 11,659,651
|
| 258,358,495
|
| 70,750,849
|
| 63,410,765
|
| LIABILITIES:
|
|
|
|
|
|
|
|
Due to custodian
| —
|
| —
|
| —
|
| —
|
Due to custodian foreign currency
| —
|
| 74,797
|
| —
|
| —
|
| Payables:
|
|
|
|
|
|
|
|
Investment securities purchased
| —
|
| —
|
| 350,087
|
| —
|
Investment advisory fees
| 8,573
|
| 177,621
|
| 38,950
|
| 33,485
|
Collateral for securities on loan
| 139,904
|
| 3,880,055
|
| —
|
| —
|
Fund shares redeemed
| —
|
| 46,524
|
| —
|
| —
|
Deferred foreign capital gains tax
| —
|
| —
|
| —
|
| —
|
Other liabilities
| —
|
| 12,989
|
| 3,404
|
| —
|
Total Liabilities
| 148,477
|
| 4,191,986
|
| 392,441
|
| 33,485
|
NET ASSETS
| $11,511,174
|
| $254,166,509
|
| $70,358,408
|
| $63,377,280
|
| NET ASSETS consist of:
|
|
|
|
|
|
|
|
Paid-in capital
| $ 27,517,445
|
| $ 509,675,121
|
| $ 118,294,790
|
| $ 91,450,467
|
Par value
| 4,500
|
| 78,500
|
| 42,000
|
| 60,000
|
Accumulated distributable earnings (loss)
| (16,010,771)
|
| (255,587,112)
|
| (47,978,382)
|
| (28,133,187)
|
NET ASSETS
| $11,511,174
|
| $254,166,509
|
| $70,358,408
|
| $63,377,280
|
NET ASSET VALUE, per share
| $25.58
|
| $32.38
|
| $16.75
|
| $10.56
|
Number of shares outstanding (unlimited number of shares authorized, par value $0.01 per share)
| 450,002
|
| 7,850,002
|
| 4,200,002
|
| 6,000,002
|
Investments, at cost
| $11,517,025
|
| $253,443,349
|
| $73,096,434
|
| $63,417,736
|
Foreign currency, at cost (proceeds)
| $2
|
| $(74,548)
|
| $194,214
|
| $43,841
|
Securities on loan, at value
| $133,238
|
| $3,644,826
|
| $—
|
| $—
|
Page 88
See Notes to Financial Statements
First Trust
China
AlphaDEX®
Fund
(FCA)
|
| First Trust
Japan
AlphaDEX®
Fund
(FJP)
|
| First Trust
Developed
Markets
ex-US
AlphaDEX®
Fund
(FDT)
|
| First Trust
Emerging
Markets
AlphaDEX®
Fund
(FEM)
|
| First Trust
Germany
AlphaDEX®
Fund
(FGM)
|
|
|
|
|
|
|
|
|
|
|
| $ 7,545,047
|
| $ 90,032,940
|
| $ 436,077,324
|
| $ 371,170,867
|
| $ 14,194,056
|
| 13,053
|
| 27,295
|
| 824,462
|
| 507,412
|
| 9,988
|
| —
|
| —
|
| 144,582
|
| 205,196
|
| 195
|
|
|
|
|
|
|
|
|
|
|
| —
|
| —
|
| —
|
| —
|
| —
|
| 5,859
|
| 79,936
|
| 1,198,299
|
| 655,250
|
| 50,502
|
| —
|
| 1,664
|
| 1,006,414
|
| 270,513
|
| 29,080
|
| 1,302
|
| 2,034
|
| 11,020
|
| 1,585
|
| 109
|
| —
|
| —
|
| 2,144
|
| —
|
| —
|
| —
|
| —
|
| —
|
| 178,585
|
| —
|
| 7,565,261
|
| 90,143,869
|
| 439,264,245
|
| 372,989,408
|
| 14,283,930
|
|
|
|
|
|
|
|
|
|
|
| —
|
| —
|
| —
|
| —
|
| —
|
| —
|
| —
|
| —
|
| —
|
| —
|
|
|
|
|
|
|
|
|
|
|
| —
|
| —
|
| 106,231
|
| —
|
| —
|
| 5,352
|
| 45,812
|
| 278,858
|
| 240,487
|
| 9,595
|
| —
|
| 4,329,690
|
| 19,545,743
|
| —
|
| 130,753
|
| —
|
| —
|
| —
|
| —
|
| —
|
| —
|
| —
|
| —
|
| 371,063
|
| —
|
| —
|
| —
|
| —
|
| —
|
| —
|
| 5,352
|
| 4,375,502
|
| 19,930,832
|
| 611,550
|
| 140,348
|
| $ 7,559,909
|
| $ 85,768,367
|
| $ 419,333,413
|
| $ 372,377,858
|
| $ 14,143,582
|
|
|
|
|
|
|
|
|
|
|
| $ 16,561,012
|
| $ 141,421,216
|
| $ 757,928,813
|
| $ 596,619,517
|
| $ 48,037,014
|
| 3,500
|
| 20,000
|
| 86,864
|
| 176,500
|
| 4,000
|
| (9,004,603)
|
| (55,672,849)
|
| (338,682,264)
|
| (224,418,159)
|
| (33,897,432)
|
| $ 7,559,909
|
| $ 85,768,367
|
| $ 419,333,413
|
| $ 372,377,858
|
| $ 14,143,582
|
| $21.60
|
| $42.88
|
| $48.27
|
| $21.10
|
| $35.36
|
| 350,002
|
| 2,000,002
|
| 8,686,412
|
| 17,650,002
|
| 400,002
|
| $9,199,720
|
| $90,612,329
|
| $420,631,907
|
| $379,110,079
|
| $17,573,929
|
| $—
|
| $—
|
| $144,506
|
| $206,274
|
| $194
|
| $—
|
| $4,081,930
|
| $18,631,244
|
| $—
|
| $123,561
|
See Notes to Financial
Statements
Page 89
First Trust Exchange-Traded AlphaDEX® Fund II
Statements of Assets and
Liabilities (Continued)
December 31, 2022
|
| First Trust
United
Kingdom
AlphaDEX®
Fund
(FKU)
|
| First Trust
India
NIFTY 50
Equal Weight
ETF
(NFTY)
|
| First Trust
Switzerland
AlphaDEX®
Fund
(FSZ)
|
| First Trust
Developed
Markets
ex-US
Small Cap
AlphaDEX®
Fund
(FDTS)
|
| ASSETS:
|
|
|
|
|
|
|
|
Investments, at value
| $ 31,565,594
|
| $ 74,872,129
|
| $ 96,974,895
|
| $ 7,539,722
|
Cash
| 28,893
|
| —
|
| 251,647
|
| 5,843
|
Foreign currency
| —
|
| 2,434,099
|
| —
|
| 657
|
| Receivables:
|
|
|
|
|
|
|
|
Fund shares sold
| —
|
| 13,709
|
| —
|
| —
|
Dividends
| 143,095
|
| —
|
| —
|
| 43,761
|
Dividend reclaims
| 12,432
|
| —
|
| 789,045
|
| 13,936
|
Securities lending income
| —
|
| —
|
| —
|
| 505
|
Investment securities sold
| —
|
| 2,530,715
|
| —
|
| —
|
Miscellaneous
| 5
|
| —
|
| —
|
| —
|
Total Assets
| 31,750,019
|
| 79,850,652
|
| 98,015,587
|
| 7,604,424
|
| LIABILITIES:
|
|
|
|
|
|
|
|
Due to custodian
| —
|
| 2,529,580
|
| —
|
| —
|
Due to custodian foreign currency
| —
|
| —
|
| —
|
| —
|
| Payables:
|
|
|
|
|
|
|
|
Investment securities purchased
| —
|
| 2,430,487
|
| —
|
| —
|
Investment advisory fees
| 21,790
|
| 41,325
|
| 56,294
|
| 5,172
|
Collateral for securities on loan
| —
|
| —
|
| —
|
| 64,189
|
Fund shares redeemed
| —
|
| —
|
| —
|
| —
|
Deferred foreign capital gains tax
| —
|
| 850,457
|
| —
|
| —
|
Other liabilities
| —
|
| —
|
| —
|
| —
|
Total Liabilities
| 21,790
|
| 5,851,849
|
| 56,294
|
| 69,361
|
NET ASSETS
| $31,728,229
|
| $73,998,803
|
| $97,959,293
|
| $7,535,063
|
| NET ASSETS consist of:
|
|
|
|
|
|
|
|
Paid-in capital
| $ 90,891,121
|
| $ 71,113,406
|
| $ 127,902,684
|
| $ 12,958,996
|
Par value
| 10,000
|
| 17,000
|
| 18,000
|
| 2,000
|
Accumulated distributable earnings (loss)
| (59,172,892)
|
| 2,868,397
|
| (29,961,391)
|
| (5,425,933)
|
NET ASSETS
| $31,728,229
|
| $73,998,803
|
| $97,959,293
|
| $7,535,063
|
NET ASSET VALUE, per share
| $31.73
|
| $43.53
|
| $54.42
|
| $37.67
|
Number of shares outstanding (unlimited number of shares authorized, par value $0.01 per share)
| 1,000,002
|
| 1,700,002
|
| 1,800,002
|
| 200,002
|
Investments, at cost
| $38,793,158
|
| $70,223,201
|
| $96,906,713
|
| $7,323,894
|
Foreign currency, at cost (proceeds)
| $—
|
| $2,434,096
|
| $—
|
| $656
|
Securities on loan, at value
| $—
|
| $—
|
| $—
|
| $61,686
|
Page 90
See Notes to Financial Statements
First Trust
Emerging
Markets
Small Cap
AlphaDEX®
Fund
(FEMS)
|
| First Trust
Eurozone
AlphaDEX®
ETF
(FEUZ)
|
|
|
|
|
| $ 168,887,825
|
| $ 16,200,962
|
| —
|
| 17,499
|
| 921,480
|
| —
|
|
|
|
|
| 4,066,813
|
| —
|
| 194,316
|
| 20,214
|
| 3,293
|
| 168,433
|
| 31,372
|
| 343
|
| 15,831
|
| —
|
| —
|
| —
|
| 174,120,930
|
| 16,407,451
|
|
|
|
|
| 565,477
|
| —
|
| —
|
| 3,947
|
|
|
|
|
| 3,922,139
|
| —
|
| 96,803
|
| 11,537
|
| 2,767,630
|
| 172,701
|
| 15,981
|
| —
|
| —
|
| —
|
| —
|
| —
|
| 7,368,030
|
| 188,185
|
| $ 166,752,900
|
| $ 16,219,266
|
|
|
|
|
| $ 203,979,201
|
| $ 39,593,329
|
| 43,000
|
| 4,500
|
| (37,269,301)
|
| (23,378,563)
|
| $ 166,752,900
|
| $ 16,219,266
|
| $38.78
|
| $36.04
|
| 4,300,002
|
| 450,002
|
| $159,748,279
|
| $17,326,807
|
| $921,377
|
| $(3,935)
|
| $2,129,737
|
| $162,605
|
See Notes to Financial Statements
Page 91
First Trust Exchange-Traded AlphaDEX® Fund II
Statements of Operations
For the Year Ended December
31, 2022
|
| First Trust
Asia Pacific
ex-Japan
AlphaDEX®
Fund
(FPA)
|
| First Trust
Europe
AlphaDEX®
Fund
(FEP)
|
| First Trust
Latin
America
AlphaDEX®
Fund
(FLN)
|
| First Trust
Brazil
AlphaDEX®
Fund
(FBZ)
|
| INVESTMENT INCOME:
|
|
|
|
|
|
|
|
Dividends
| $ 675,380
|
| $ 16,305,917
|
| $ 3,776,359
|
| $ 1,537,370
|
Securities lending income (net of fees)
| 3,888
|
| 161,058
|
| —
|
| —
|
Foreign withholding tax
| (64,341)
|
| (1,543,365)
|
| (426,148)
|
| (99,442)
|
Other
| 27
|
| 6,864
|
| 3
|
| 4
|
Total investment income
| 614,954
|
| 14,930,474
|
| 3,350,214
|
| 1,437,932
|
| EXPENSES:
|
|
|
|
|
|
|
|
Investment advisory fees
| 111,106
|
| 2,960,737
|
| 310,932
|
| 118,659
|
Total expenses
| 111,106
|
| 2,960,737
|
| 310,932
|
| 118,659
|
NET INVESTMENT INCOME (LOSS)
| 503,848
|
| 11,969,737
|
| 3,039,282
|
| 1,319,273
|
| NET REALIZED AND UNREALIZED GAIN (LOSS):
|
|
|
|
|
|
|
|
| Net realized gain (loss) on:
|
|
|
|
|
|
|
|
Investments
| (2,414,359)
|
| (87,923,185)
|
| (3,280,203)
|
| (770,580)
|
In-kind redemptions
| 744,213
|
| (2,478,919)
|
| 292,536
|
| (306)
|
Foreign currency transactions
| (52,372)
|
| (196,225)
|
| (274,916)
|
| (90,999)
|
Foreign capital gains tax
| —
|
| —
|
| (7,620)
|
| —
|
Net realized gain (loss)
| (1,722,518)
|
| (90,598,329)
|
| (3,270,203)
|
| (861,885)
|
| Net change in unrealized appreciation (depreciation) on:
|
|
|
|
|
|
|
|
Investments
| (1,334,563)
|
| (50,308,701)
|
| (4,089,746)
|
| (73,640)
|
Foreign currency translation
| 524
|
| (164,317)
|
| (354)
|
| 2,336
|
Deferred foreign capital gains tax
| —
|
| —
|
| —
|
| —
|
Net change in unrealized appreciation (depreciation)
| (1,334,039)
|
| (50,473,018)
|
| (4,090,100)
|
| (71,304)
|
NET REALIZED AND UNREALIZED GAIN (LOSS)
| (3,056,557)
|
| (141,071,347)
|
| (7,360,303)
|
| (933,189)
|
NET INCREASE (DECREASE) IN NET ASSETS RESULTING FROM OPERATIONS
| $(2,552,709)
|
| $(129,101,610)
|
| $(4,321,021)
|
| $ 386,084
|
Page 92
See Notes to Financial Statements
|
| First Trust
China
AlphaDEX®
Fund
(FCA)
|
| First Trust
Japan
AlphaDEX®
Fund
(FJP)
|
| First Trust
Developed
Markets
ex-US
AlphaDEX®
Fund
(FDT)
|
| First Trust
Emerging
Markets
AlphaDEX®
Fund
(FEM)
|
| First Trust
Germany
AlphaDEX®
Fund
(FGM)
|
|
|
|
|
|
|
|
|
|
|
|
|
| $546,240
|
| $1,418,948
|
| $17,526,910
|
| $27,152,373
|
| $1,154,122
|
|
| 9,310
|
| 11,573
|
| 165,682
|
| 36,129
|
| 3,624
|
|
| (37,827)
|
| (141,895)
|
| (1,699,433)
|
| (2,935,082)
|
| (151,923)
|
|
| —
|
| —
|
| 4,424
|
| 1,725
|
| 208
|
|
| 517,723
|
| 1,288,626
|
| 15,997,583
|
| 24,255,145
|
| 1,006,031
|
|
|
|
|
|
|
|
|
|
|
|
|
| 69,152
|
| 276,995
|
| 3,293,493
|
| 2,895,068
|
| 265,577
|
|
| 69,152
|
| 276,995
|
| 3,293,493
|
| 2,895,068
|
| 265,577
|
|
| 448,571
|
| 1,011,631
|
| 12,704,090
|
| 21,360,077
|
| 740,454
|
|
|
|
|
|
|
|
|
|
|
|
|
|
|
|
|
|
|
|
|
|
|
|
| (992,306)
|
| (4,324,532)
|
| (87,040,662)
|
| (49,676,365)
|
| (5,484,264)
|
|
| —
|
| (518,456)
|
| 1,266,728
|
| 1,267,685
|
| (7,082,804)
|
|
| 142
|
| (35,547)
|
| (587,169)
|
| (731,250)
|
| (6,891)
|
|
| —
|
| —
|
| —
|
| (720,370)
|
| —
|
|
| (992,164)
|
| (4,878,535)
|
| (86,361,103)
|
| (49,860,300)
|
| (12,573,959)
|
|
|
|
|
|
|
|
|
|
|
|
|
| (1,097,892)
|
| (186,881)
|
| (14,592,456)
|
| (33,665,330)
|
| (7,955,968)
|
|
| (23)
|
| 999
|
| (44,969)
|
| (10,514)
|
| 2,643
|
|
| —
|
| —
|
| —
|
| 915,672
|
| —
|
|
| (1,097,915)
|
| (185,882)
|
| (14,637,425)
|
| (32,760,172)
|
| (7,953,325)
|
|
| (2,090,079)
|
| (5,064,417)
|
| (100,998,528)
|
| (82,620,472)
|
| (20,527,284)
|
|
| $(1,641,508)
|
| $(4,052,786)
|
| $(88,294,438)
|
| $(61,260,395)
|
| $(19,786,830)
|
See Notes to Financial
Statements
Page 93
First Trust Exchange-Traded AlphaDEX® Fund II
Statements of Operations
(Continued)
For the Year Ended December
31, 2022
|
| First Trust
United
Kingdom
AlphaDEX®
Fund
(FKU)
|
| First Trust
India
NIFTY 50
Equal Weight
ETF
(NFTY)
|
| First Trust
Switzerland
AlphaDEX®
Fund
(FSZ)
|
| First Trust
Developed
Markets
ex-US
Small Cap
AlphaDEX®
Fund
(FDTS)
|
| INVESTMENT INCOME:
|
|
|
|
|
|
|
|
Dividends
| $ 3,259,314
|
| $ 1,009,264
|
| $ 2,300,483
|
| $ 386,892
|
Securities lending income (net of fees)
| —
|
| —
|
| —
|
| 4,504
|
Foreign withholding tax
| (23,463)
|
| (220,917)
|
| (279,705)
|
| (39,987)
|
Other
| 19
|
| —
|
| 9
|
| 136
|
Total investment income
| 3,235,870
|
| 788,347
|
| 2,020,787
|
| 351,545
|
| EXPENSES:
|
|
|
|
|
|
|
|
Investment advisory fees
| 508,271
|
| 426,173
|
| 521,452
|
| 76,373
|
Total expenses
| 508,271
|
| 426,173
|
| 521,452
|
| 76,373
|
NET INVESTMENT INCOME (LOSS)
| 2,727,599
|
| 362,174
|
| 1,499,335
|
| 275,172
|
| NET REALIZED AND UNREALIZED GAIN (LOSS):
|
|
|
|
|
|
|
|
| Net realized gain (loss) on:
|
|
|
|
|
|
|
|
Investments
| (14,481,017)
|
| 2,004,869
|
| (929,540)
|
| (2,028,145)
|
In-kind redemptions
| (2,803,893)
|
| —
|
| (2,380,368)
|
| 16,045
|
Foreign currency transactions
| (76,004)
|
| (50,267)
|
| 3,709
|
| (18,307)
|
Foreign capital gains tax
| —
|
| (696,773)
|
| —
|
| —
|
Net realized gain (loss)
| (17,360,914)
|
| 1,257,829
|
| (3,306,199)
|
| (2,030,407)
|
| Net change in unrealized appreciation (depreciation) on:
|
|
|
|
|
|
|
|
Investments
| (10,722,264)
|
| (5,236,486)
|
| (18,705,169)
|
| (191,793)
|
Foreign currency translation
| (7,364)
|
| (178)
|
| (17,754)
|
| (660)
|
Deferred foreign capital gains tax
| —
|
| 657,231
|
| —
|
| —
|
Net change in unrealized appreciation (depreciation)
| (10,729,628)
|
| (4,579,433)
|
| (18,722,923)
|
| (192,453)
|
NET REALIZED AND UNREALIZED GAIN (LOSS)
| (28,090,542)
|
| (3,321,604)
|
| (22,029,122)
|
| (2,222,860)
|
NET INCREASE (DECREASE) IN NET ASSETS RESULTING FROM OPERATIONS
| $(25,362,943)
|
| $(2,959,430)
|
| $(20,529,787)
|
| $(1,947,688)
|
Page 94
See Notes to Financial Statements
|
| First Trust
Emerging
Markets
Small Cap
AlphaDEX®
Fund
(FEMS)
|
| First Trust
Eurozone
AlphaDEX®
ETF
(FEUZ)
|
|
|
|
|
|
|
| $7,533,444
|
| $1,125,371
|
|
| 187,625
|
| 4,956
|
|
| (783,913)
|
| (141,747)
|
|
| 888
|
| 648
|
|
| 6,938,044
|
| 989,228
|
|
|
|
|
|
|
| 1,028,448
|
| 273,844
|
|
| 1,028,448
|
| 273,844
|
|
| 5,909,596
|
| 715,384
|
|
|
|
|
|
|
|
|
|
|
|
| (13,852,543)
|
| (6,986,094)
|
|
| (146,844)
|
| (5,116,880)
|
|
| (284,791)
|
| (3,202)
|
|
| (1,644)
|
| —
|
|
| (14,285,822)
|
| (12,106,176)
|
|
|
|
|
|
|
| 9,206,228
|
| (857,718)
|
|
| 4,492
|
| (6,192)
|
|
| 4,745
|
| —
|
|
| 9,215,465
|
| (863,910)
|
|
| (5,070,357)
|
| (12,970,086)
|
|
| $839,239
|
| $(12,254,702)
|
See Notes to Financial Statements
Page 95
First Trust Exchange-Traded AlphaDEX® Fund II
Statements of Changes in
Net Assets
|
| First Trust Asia Pacific
ex-Japan AlphaDEX® Fund (FPA)
|
| First Trust Europe
AlphaDEX® Fund (FEP)
|
|
| Year
Ended
12/31/2022
|
| Year
Ended
12/31/2021
|
| Year
Ended
12/31/2022
|
| Year
Ended
12/31/2021
|
| OPERATIONS:
|
|
|
|
|
|
|
|
Net investment income (loss)
| $ 503,848
|
| $ 925,520
|
| $ 11,969,737
|
| $ 11,969,339
|
Net realized gain (loss)
| (1,722,518)
|
| 1,481,007
|
| (90,598,329)
|
| 75,355,601
|
Net change in unrealized appreciation (depreciation)
| (1,334,039)
|
| (2,508,413)
|
| (50,473,018)
|
| (9,103,026)
|
Net increase (decrease) in net assets resulting from operations
| (2,552,709)
|
| (101,886)
|
| (129,101,610)
|
| 78,221,914
|
| DISTRIBUTIONS TO SHAREHOLDERS FROM:
|
|
|
|
|
|
|
|
Investment operations
| (523,132)
|
| (1,196,923)
|
| (9,500,812)
|
| (18,281,993)
|
| SHAREHOLDER TRANSACTIONS:
|
|
|
|
|
|
|
|
Proceeds from shares sold
| —
|
| 10,439,636
|
| 12,410,312
|
| 301,558,631
|
Cost of shares redeemed
| (10,670,530)
|
| (1,618,879)
|
| (193,550,082)
|
| (230,355,044)
|
Net increase (decrease) in net assets resulting from shareholder transactions
| (10,670,530)
|
| 8,820,757
|
| (181,139,770)
|
| 71,203,587
|
Total increase (decrease) in net assets
| (13,746,371)
|
| 7,521,948
|
| (319,742,192)
|
| 131,143,508
|
| NET ASSETS:
|
|
|
|
|
|
|
|
Beginning of period
| 25,257,545
|
| 17,735,597
|
| 573,908,701
|
| 442,765,193
|
End of period
| $ 11,511,174
|
| $ 25,257,545
|
| $ 254,166,509
|
| $ 573,908,701
|
| CHANGES IN SHARES OUTSTANDING:
|
|
|
|
|
|
|
|
Shares outstanding, beginning of period
| 800,002
|
| 550,002
|
| 13,250,002
|
| 11,500,002
|
Shares sold
| —
|
| 300,000
|
| 300,000
|
| 7,200,000
|
Shares redeemed
| (350,000)
|
| (50,000)
|
| (5,700,000)
|
| (5,450,000)
|
Shares outstanding, end of period
| 450,002
|
| 800,002
|
| 7,850,002
|
| 13,250,002
|
Page 96
See Notes to Financial Statements
First Trust Latin America
AlphaDEX® Fund (FLN)
|
| First Trust Brazil
AlphaDEX® Fund (FBZ)
|
| First Trust China
AlphaDEX® Fund (FCA)
|
Year
Ended
12/31/2022
|
| Year
Ended
12/31/2021
|
| Year
Ended
12/31/2022
|
| Year
Ended
12/31/2021
|
| Year
Ended
12/31/2022
|
| Year
Ended
12/31/2021
|
|
|
|
|
|
|
|
|
|
|
|
|
| $ 3,039,282
|
| $ 441,518
|
| $ 1,319,273
|
| $ 665,597
|
| $ 448,571
|
| $ 468,390
|
| (3,270,203)
|
| 1,704,097
|
| (861,885)
|
| 360,032
|
| (992,164)
|
| 1,187,903
|
| (4,090,100)
|
| (2,901,672)
|
| (71,304)
|
| (2,116,477)
|
| (1,097,915)
|
| (1,661,645)
|
| (4,321,021)
|
| (756,057)
|
| 386,084
|
| (1,090,848)
|
| (1,641,508)
|
| (5,352)
|
|
|
|
|
|
|
|
|
|
|
|
|
| (2,717,117)
|
| (400,317)
|
| (1,187,607)
|
| (502,366)
|
| (447,653)
|
| (517,232)
|
|
|
|
|
|
|
|
|
|
|
|
|
| 77,412,376
|
| 912,884
|
| 62,254,979
|
| 16,473,683
|
| —
|
| 7,297,067
|
| (7,821,296)
|
| (5,550,414)
|
| (10,114,794)
|
| (12,214,912)
|
| —
|
| (10,245,972)
|
| 69,591,080
|
| (4,637,530)
|
| 52,140,185
|
| 4,258,771
|
| —
|
| (2,948,905)
|
| 62,552,942
|
| (5,793,904)
|
| 51,338,662
|
| 2,665,557
|
| (2,089,161)
|
| (3,471,489)
|
|
|
|
|
|
|
|
|
|
|
|
|
| 7,805,466
|
| 13,599,370
|
| 12,038,618
|
| 9,373,061
|
| 9,649,070
|
| 13,120,559
|
| $ 70,358,408
|
| $ 7,805,466
|
| $ 63,377,280
|
| $ 12,038,618
|
| $ 7,559,909
|
| $ 9,649,070
|
|
|
|
|
|
|
|
|
|
|
|
|
| 450,002
|
| 700,002
|
| 1,050,002
|
| 700,002
|
| 350,002
|
| 450,002
|
| 4,200,000
|
| 50,000
|
| 5,750,000
|
| 1,250,000
|
| —
|
| 250,000
|
| (450,000)
|
| (300,000)
|
| (800,000)
|
| (900,000)
|
| —
|
| (350,000)
|
| 4,200,002
|
| 450,002
|
| 6,000,002
|
| 1,050,002
|
| 350,002
|
| 350,002
|
See Notes to Financial
Statements
Page 97
First Trust Exchange-Traded AlphaDEX® Fund II
Statements of Changes in
Net Assets (Continued)
|
| First Trust Japan
AlphaDEX® Fund (FJP)
|
| First Trust Developed Markets
ex-US AlphaDEX® Fund (FDT)
|
|
| Year
Ended
12/31/2022
|
| Year
Ended
12/31/2021
|
| Year
Ended
12/31/2022
|
| Year
Ended
12/31/2021
|
| OPERATIONS:
|
|
|
|
|
|
|
|
Net investment income (loss)
| $ 1,011,631
|
| $ 589,668
|
| $ 12,704,090
|
| $ 9,579,953
|
Net realized gain (loss)
| (4,878,535)
|
| 372,425
|
| (86,361,103)
|
| 49,704,396
|
Net change in unrealized appreciation (depreciation)
| (185,882)
|
| (883,872)
|
| (14,637,425)
|
| (21,075,655)
|
Net increase (decrease) in net assets resulting from operations
| (4,052,786)
|
| 78,221
|
| (88,294,438)
|
| 38,208,694
|
| DISTRIBUTIONS TO SHAREHOLDERS FROM:
|
|
|
|
|
|
|
|
Investment operations
| (908,402)
|
| (875,402)
|
| (8,989,980)
|
| (15,144,146)
|
| SHAREHOLDER TRANSACTIONS:
|
|
|
|
|
|
|
|
Proceeds from shares sold
| 61,526,977
|
| —
|
| 113,556,642
|
| 36,993,954
|
Cost of shares redeemed
| (5,698,439)
|
| (5,437,368)
|
| (11,518,070)
|
| (5,897,300)
|
Net increase (decrease) in net assets resulting from shareholder transactions
| 55,828,538
|
| (5,437,368)
|
| 102,038,572
|
| 31,096,654
|
Total increase (decrease) in net assets
| 50,867,350
|
| (6,234,549)
|
| 4,754,154
|
| 54,161,202
|
| NET ASSETS:
|
|
|
|
|
|
|
|
Beginning of period
| 34,901,017
|
| 41,135,566
|
| 414,579,259
|
| 360,418,057
|
End of period
| $ 85,768,367
|
| $ 34,901,017
|
| $ 419,333,413
|
| $ 414,579,259
|
| CHANGES IN SHARES OUTSTANDING:
|
|
|
|
|
|
|
|
Shares outstanding, beginning of period
| 700,002
|
| 800,002
|
| 6,836,412
|
| 6,336,412
|
Shares sold
| 1,450,000
|
| —
|
| 2,100,000
|
| 600,000
|
Shares redeemed
| (150,000)
|
| (100,000)
|
| (250,000)
|
| (100,000)
|
Shares outstanding, end of period
| 2,000,002
|
| 700,002
|
| 8,686,412
|
| 6,836,412
|
Page 98
See Notes to Financial Statements
First Trust Emerging Markets
AlphaDEX® Fund (FEM)
|
| First Trust Germany
AlphaDEX® Fund (FGM)
|
| First Trust United Kingdom
AlphaDEX® Fund (FKU)
|
Year
Ended
12/31/2022
|
| Year
Ended
12/31/2021
|
| Year
Ended
12/31/2022
|
| Year
Ended
12/31/2021
|
| Year
Ended
12/31/2022
|
| Year
Ended
12/31/2021
|
|
|
|
|
|
|
|
|
|
|
|
|
| $ 21,360,077
|
| $ 20,291,122
|
| $ 740,454
|
| $ 1,764,495
|
| $ 2,727,599
|
| $ 1,655,416
|
| (49,860,300)
|
| 54,058,582
|
| (12,573,959)
|
| 13,492,527
|
| (17,360,914)
|
| 2,683,372
|
| (32,760,172)
|
| (39,795,292)
|
| (7,953,325)
|
| (9,078,155)
|
| (10,729,628)
|
| 149,705
|
| (61,260,395)
|
| 34,554,412
|
| (19,786,830)
|
| 6,178,867
|
| (25,362,943)
|
| 4,488,493
|
|
|
|
|
|
|
|
|
|
|
|
|
| (20,583,503)
|
| (19,810,512)
|
| (1,006,869)
|
| (1,500,281)
|
| (2,909,539)
|
| (1,744,928)
|
|
|
|
|
|
|
|
|
|
|
|
|
| 59,772,868
|
| 79,485,441
|
| 2,232,300
|
| 13,472,609
|
| 8,421,726
|
| 79,396,844
|
| (42,466,046)
|
| (99,025,014)
|
| (66,792,218)
|
| (14,034,516)
|
| (47,363,817)
|
| (2,227,657)
|
| 17,306,822
|
| (19,539,573)
|
| (64,559,918)
|
| (561,907)
|
| (38,942,091)
|
| 77,169,187
|
| (64,537,076)
|
| (4,795,673)
|
| (85,353,617)
|
| 4,116,679
|
| (67,214,573)
|
| 79,912,752
|
|
|
|
|
|
|
|
|
|
|
|
|
| 436,914,934
|
| 441,710,607
|
| 99,497,199
|
| 95,380,520
|
| 98,942,802
|
| 19,030,050
|
| $ 372,377,858
|
| $ 436,914,934
|
| $ 14,143,582
|
| $ 99,497,199
|
| $ 31,728,229
|
| $ 98,942,802
|
|
|
|
|
|
|
|
|
|
|
|
|
| 16,650,002
|
| 17,450,002
|
| 1,850,002
|
| 1,850,002
|
| 2,250,002
|
| 500,002
|
| 2,850,000
|
| 2,950,000
|
| 50,000
|
| 250,000
|
| 250,000
|
| 1,800,000
|
| (1,850,000)
|
| (3,750,000)
|
| (1,500,000)
|
| (250,000)
|
| (1,500,000)
|
| (50,000)
|
| 17,650,002
|
| 16,650,002
|
| 400,002
|
| 1,850,002
|
| 1,000,002
|
| 2,250,002
|
See Notes to Financial
Statements
Page 99
First Trust Exchange-Traded AlphaDEX® Fund II
Statements of Changes in
Net Assets (Continued)
|
| First Trust India
NIFTY 50 Equal Weight ETF (NFTY)
|
| First Trust Switzerland
AlphaDEX® Fund (FSZ)
|
|
| Year
Ended
12/31/2022
|
| Year
Ended
12/31/2021
|
| Year
Ended
12/31/2022
|
| Year
Ended
12/31/2021
|
| OPERATIONS:
|
|
|
|
|
|
|
|
Net investment income (loss)
| $ 362,174
|
| $ 517,271
|
| $ 1,499,335
|
| $ 1,340,611
|
Net realized gain (loss)
| 1,257,829
|
| 4,125,186
|
| (3,306,199)
|
| 11,727,434
|
Net change in unrealized appreciation (depreciation)
| (4,579,433)
|
| 7,778,700
|
| (18,722,923)
|
| 5,471,228
|
Net increase (decrease) in net assets resulting from operations
| (2,959,430)
|
| 12,421,157
|
| (20,529,787)
|
| 18,539,273
|
| DISTRIBUTIONS TO SHAREHOLDERS FROM:
|
|
|
|
|
|
|
|
Investment operations
| (3,582,360)
|
| (824,801)
|
| (1,456,984)
|
| (1,875,162)
|
| SHAREHOLDER TRANSACTIONS:
|
|
|
|
|
|
|
|
Proceeds from shares sold
| 34,032,699
|
| 66,917,813
|
| 62,419,231
|
| 6,345,850
|
Cost of shares redeemed
| (16,195,436)
|
| (19,693,610)
|
| (42,415,993)
|
| (20,420,756)
|
Net increase (decrease) in net assets resulting from shareholder transactions
| 17,837,263
|
| 47,224,203
|
| 20,003,238
|
| (14,074,906)
|
Total increase (decrease) in net assets
| 11,295,473
|
| 58,820,559
|
| (1,983,533)
|
| 2,589,205
|
| NET ASSETS:
|
|
|
|
|
|
|
|
Beginning of period
| 62,703,330
|
| 3,882,771
|
| 99,942,826
|
| 97,353,621
|
End of period
| $ 73,998,803
|
| $ 62,703,330
|
| $ 97,959,293
|
| $ 99,942,826
|
| CHANGES IN SHARES OUTSTANDING:
|
|
|
|
|
|
|
|
Shares outstanding, beginning of period
| 1,300,002
|
| 100,002
|
| 1,400,002
|
| 1,600,002
|
Shares sold
| 750,000
|
| 1,600,000
|
| 1,200,000
|
| 100,000
|
Shares redeemed
| (350,000)
|
| (400,000)
|
| (800,000)
|
| (300,000)
|
Shares outstanding, end of period
| 1,700,002
|
| 1,300,002
|
| 1,800,002
|
| 1,400,002
|
Page 100
See Notes to Financial Statements
First Trust Developed Markets ex-US
Small Cap AlphaDEX® Fund (FDTS)
|
| First Trust Emerging Markets
Small Cap AlphaDEX® Fund (FEMS)
|
| First Trust Eurozone
AlphaDEX® ETF (FEUZ)
|
Year
Ended
12/31/2022
|
| Year
Ended
12/31/2021
|
| Year
Ended
12/31/2022
|
| Year
Ended
12/31/2021
|
| Year
Ended
12/31/2022
|
| Year
Ended
12/31/2021
|
|
|
|
|
|
|
|
|
|
|
|
|
| $ 275,172
|
| $ 145,363
|
| $ 5,909,596
|
| $ 5,574,164
|
| $ 715,384
|
| $ 899,396
|
| (2,030,407)
|
| 1,706,019
|
| (14,285,822)
|
| 29,064,086
|
| (12,106,176)
|
| 4,839,728
|
| (192,453)
|
| (856,439)
|
| 9,215,465
|
| (30,029,448)
|
| (863,910)
|
| (3,425,251)
|
| (1,947,688)
|
| 994,943
|
| 839,239
|
| 4,608,802
|
| (12,254,702)
|
| 2,313,873
|
|
|
|
|
|
|
|
|
|
|
|
|
| (304,718)
|
| (347,513)
|
| (5,878,163)
|
| (8,877,525)
|
| (761,407)
|
| (1,009,147)
|
|
|
|
|
|
|
|
|
|
|
|
|
| —
|
| 9,293,815
|
| 43,083,272
|
| 25,725,874
|
| —
|
| 68,170,224
|
| (4,029,334)
|
| (4,668,214)
|
| (14,321,514)
|
| (31,008,175)
|
| (51,899,978)
|
| (15,702,337)
|
| (4,029,334)
|
| 4,625,601
|
| 28,761,758
|
| (5,282,301)
|
| (51,899,978)
|
| 52,467,887
|
| (6,281,740)
|
| 5,273,031
|
| 23,722,834
|
| (9,551,024)
|
| (64,916,087)
|
| 53,772,613
|
|
|
|
|
|
|
|
|
|
|
|
|
| 13,816,803
|
| 8,543,772
|
| 143,030,066
|
| 152,581,090
|
| 81,135,353
|
| 27,362,740
|
| $ 7,535,063
|
| $ 13,816,803
|
| $ 166,752,900
|
| $ 143,030,066
|
| $ 16,219,266
|
| $ 81,135,353
|
|
|
|
|
|
|
|
|
|
|
|
|
| 300,002
|
| 200,002
|
| 3,550,002
|
| 3,700,002
|
| 1,750,002
|
| 650,002
|
| —
|
| 200,000
|
| 1,150,000
|
| 550,000
|
| —
|
| 1,450,000
|
| (100,000)
|
| (100,000)
|
| (400,000)
|
| (700,000)
|
| (1,300,000)
|
| (350,000)
|
| 200,002
|
| 300,002
|
| 4,300,002
|
| 3,550,002
|
| 450,002
|
| 1,750,002
|
See Notes to Financial Statements
Page 101
First Trust Exchange-Traded AlphaDEX® Fund II
Financial Highlights
For a share outstanding
throughout each period
First Trust Asia Pacific ex-Japan
AlphaDEX® Fund (FPA)
|
| Year Ended December 31,
|
| 2022
|
| 2021
|
| 2020
|
| 2019
|
| 2018
|
Net asset value, beginning of period
| $ 31.57
|
| $ 32.25
|
| $ 28.57
|
| $ 27.65
|
| $ 35.73
|
| Income from investment operations:
|
|
|
|
|
|
|
|
|
|
Net investment income (loss)
| 0.97
|
| 1.28
|
| 0.58
|
| 0.63
|
| 0.40
|
Net realized and unrealized gain (loss)
| (5.88)
|
| (0.37)
|
| 3.61
|
| 1.40
|
| (7.72)
|
Total from investment operations
| (4.91)
|
| 0.91
|
| 4.19
|
| 2.03
|
| (7.32)
|
| Distributions paid to shareholders from:
|
|
|
|
|
|
|
|
|
|
Net investment income
| (1.08)
|
| (1.59)
|
| (0.51)
|
| (1.09)
|
| (0.69)
|
Return of capital
| —
|
| —
|
| —
|
| (0.02)
|
| (0.07)
|
Total distributions
| (1.08)
|
| (1.59)
|
| (0.51)
|
| (1.11)
|
| (0.76)
|
Net asset value, end of period
| $25.58
|
| $31.57
|
| $32.25
|
| $28.57
|
| $27.65
|
Total return (a)
| (15.62)%
|
| 2.75%
|
| 14.89%
|
| 7.35%
|
| (20.71)%
|
| Ratios to average net assets/supplemental data:
|
|
|
|
|
|
|
|
|
|
Net assets, end of period (in 000’s)
| $ 11,511
|
| $ 25,258
|
| $ 17,736
|
| $ 19,997
|
| $ 30,419
|
Ratio of total expenses to average net assets
| 0.80%
|
| 0.80%
|
| 0.80%
|
| 0.80%
|
| 0.80%
|
Ratio of net investment income (loss) to average net assets
| 3.63%
|
| 4.03%
|
| 2.33%
|
| 2.64%
|
| 1.68%
|
Portfolio turnover rate (b)
| 82%
|
| 102%
|
| 103%
|
| 101%
|
| 88%
|
| (a)
| Total return is calculated assuming an initial investment made at the net asset value at the beginning of the period, reinvestment of all distributions at net asset value during the
period, and redemption at net asset value on the last day of the period. The returns presented do not reflect the deduction of taxes that a shareholder would pay on Fund distributions or the redemption or sale of Fund
shares. Total return is calculated for the time period presented and is not annualized for periods of less than a year.
|
| (b)
| Portfolio turnover is calculated for the time period presented and is not annualized for periods of less than a year and does not include securities received or
delivered from processing creations or redemptions and in-kind transactions.
|
Page 102
See Notes to Financial Statements
First Trust Exchange-Traded AlphaDEX® Fund II
Financial Highlights
(Continued)
For a share outstanding
throughout each period
First Trust Europe AlphaDEX® Fund (FEP)
|
| Year Ended December 31,
|
| 2022
|
| 2021
|
| 2020
|
| 2019
|
| 2018
|
Net asset value, beginning of period
| $ 43.31
|
| $ 38.50
|
| $ 37.64
|
| $ 31.11
|
| $ 39.07
|
| Income from investment operations:
|
|
|
|
|
|
|
|
|
|
Net investment income (loss)
| 0.93
|
| 1.05
|
| 0.42
|
| 0.87
|
| 0.84
|
Net realized and unrealized gain (loss)
| (10.90)
|
| 5.26
|
| 1.32
|
| 6.65
|
| (7.99)
|
Total from investment operations
| (9.97)
|
| 6.31
|
| 1.74
|
| 7.52
|
| (7.15)
|
| Distributions paid to shareholders from:
|
|
|
|
|
|
|
|
|
|
Net investment income
| (0.96)
|
| (1.50)
|
| (0.88)
|
| (0.99)
|
| (0.81)
|
Net asset value, end of period
| $32.38
|
| $43.31
|
| $38.50
|
| $37.64
|
| $31.11
|
Total return (a)
| (22.87)%
|
| 16.53%
|
| 4.95%
|
| 24.38%
|
| (18.67)%
|
| Ratios to average net assets/supplemental data:
|
|
|
|
|
|
|
|
|
|
Net assets, end of period (in 000’s)
| $ 254,167
|
| $ 573,909
|
| $ 442,765
|
| $ 511,890
|
| $ 592,586
|
Ratio of total expenses to average net assets
| 0.80%
|
| 0.80%
|
| 0.80%
|
| 0.80%
|
| 0.80%
|
Ratio of net investment income (loss) to average net assets
| 3.23%
|
| 2.33%
|
| 1.32%
|
| 2.49%
|
| 2.30%
|
Portfolio turnover rate (b)
| 88%
|
| 105%
|
| 109%
|
| 102%
|
| 99%
|
| (a)
| Total return is calculated assuming an initial investment made at the net asset value at the beginning of the period, reinvestment of all distributions at net asset value during the
period, and redemption at net asset value on the last day of the period. The returns presented do not reflect the deduction of taxes that a shareholder would pay on Fund distributions or the redemption or sale of Fund
shares. Total return is calculated for the time period presented and is not annualized for periods of less than a year.
|
| (b)
| Portfolio turnover is calculated for the time period presented and is not annualized for periods of less than a year and does not include securities received or
delivered from processing creations or redemptions and in-kind transactions.
|
See Notes to Financial Statements
Page 103
First Trust Exchange-Traded AlphaDEX® Fund II
Financial Highlights
(Continued)
For a share outstanding
throughout each period
First Trust Latin America AlphaDEX® Fund (FLN)
|
| Year Ended December 31,
|
| 2022
|
| 2021
|
| 2020
|
| 2019
|
| 2018
|
Net asset value, beginning of period
| $ 17.35
|
| $ 19.43
|
| $ 22.67
|
| $ 18.33
|
| $ 20.43
|
| Income from investment operations:
|
|
|
|
|
|
|
|
|
|
Net investment income (loss)
| 0.98
|
| 0.89
|
| 0.52
|
| 0.48
|
| 0.52
|
Net realized and unrealized gain (loss)
| (0.65)
|
| (2.16)
|
| (3.44)
|
| 4.29
|
| (2.06)
|
Total from investment operations
| 0.33
|
| (1.27)
|
| (2.92)
|
| 4.77
|
| (1.54)
|
| Distributions paid to shareholders from:
|
|
|
|
|
|
|
|
|
|
Net investment income
| (0.93)
|
| (0.81)
|
| (0.20)
|
| (0.43)
|
| (0.51)
|
Return of capital
| —
|
| —
|
| (0.12)
|
| —
|
| (0.05)
|
Total distributions
| (0.93)
|
| (0.81)
|
| (0.32)
|
| (0.43)
|
| (0.56)
|
Net asset value, end of period
| $16.75
|
| $17.35
|
| $19.43
|
| $22.67
|
| $18.33
|
Total return (a)
| 2.17%
|
| (6.66)%
|
| (12.32)%
|
| 26.26%
|
| (7.50)%
|
| Ratios to average net assets/supplemental data:
|
|
|
|
|
|
|
|
|
|
Net assets, end of period (in 000’s)
| $ 70,358
|
| $ 7,805
|
| $ 13,599
|
| $ 131,463
|
| $ 17,418
|
Ratio of total expenses to average net assets
| 0.80%
|
| 0.80%
|
| 0.80%
|
| 0.80%
|
| 0.80%
|
Ratio of net investment income (loss) to average net assets
| 7.82%
|
| 4.28%
|
| 0.81%
|
| 2.02%
|
| 2.46%
|
Portfolio turnover rate (b)
| 104%
|
| 91%
|
| 34%
|
| 165%
|
| 158%
|
| (a)
| Total return is calculated assuming an initial investment made at the net asset value at the beginning of the period, reinvestment of all distributions at net asset value during the
period, and redemption at net asset value on the last day of the period. The returns presented do not reflect the deduction of taxes that a shareholder would pay on Fund distributions or the redemption or sale of Fund
shares. Total return is calculated for the time period presented and is not annualized for periods of less than a year.
|
| (b)
| Portfolio turnover is calculated for the time period presented and is not annualized for periods of less than a year and does not include securities received or
delivered from processing creations or redemptions and in-kind transactions.
|
Page 104
See Notes to Financial Statements
First Trust Exchange-Traded AlphaDEX® Fund II
Financial Highlights
(Continued)
For a share outstanding
throughout each period
First Trust Brazil AlphaDEX® Fund (FBZ)
|
| Year Ended December 31,
|
| 2022
|
| 2021
|
| 2020
|
| 2019
|
| 2018
|
Net asset value, beginning of period
| $ 11.47
|
| $ 13.39
|
| $ 17.24
|
| $ 13.38
|
| $ 15.51
|
| Income from investment operations:
|
|
|
|
|
|
|
|
|
|
Net investment income (loss)
| 0.95
|
| 0.94
|
| 0.09
|
| 0.35
|
| 0.55
|
Net realized and unrealized gain (loss)
| (0.82)
|
| (2.08)
|
| (3.60)
|
| 5.08
|
| (0.97)
|
Total from investment operations
| 0.13
|
| (1.14)
|
| (3.51)
|
| 5.43
|
| (0.42)
|
| Distributions paid to shareholders from:
|
|
|
|
|
|
|
|
|
|
Net investment income
| (1.04)
|
| (0.78)
|
| (0.28)
|
| (1.57)
|
| (0.54)
|
Net realized gain
| —
|
| —
|
| —
|
| —
|
| (1.17)
|
Return of capital
| —
|
| —
|
| (0.06)
|
| —
|
| —
|
Total distributions
| (1.04)
|
| (0.78)
|
| (0.34)
|
| (1.57)
|
| (1.71)
|
Net asset value, end of period
| $10.56
|
| $11.47
|
| $13.39
|
| $17.24
|
| $13.38
|
Total return (a)
| 1.45%
|
| (9.00)%
|
| (19.48)%
|
| 41.06%
|
| (1.17)%
|
| Ratios to average net assets/supplemental data:
|
|
|
|
|
|
|
|
|
|
Net assets, end of period (in 000’s)
| $ 63,377
|
| $ 12,039
|
| $ 9,373
|
| $ 116,374
|
| $ 129,081
|
Ratio of total expenses to average net assets
| 0.80%
|
| 0.80%
|
| 0.80%
|
| 0.80%
|
| 0.80%
|
Ratio of net investment income (loss) to average net assets
| 8.88%
|
| 7.36%
|
| 0.72%
|
| 2.15%
|
| 6.84%
|
Portfolio turnover rate (b)
| 95%
|
| 225%
|
| 154%
|
| 90%
|
| 128%
|
| (a)
| Total return is calculated assuming an initial investment made at the net asset value at the beginning of the period, reinvestment of all distributions at net asset value during the
period, and redemption at net asset value on the last day of the period. The returns presented do not reflect the deduction of taxes that a shareholder would pay on Fund distributions or the redemption or sale of Fund
shares. Total return is calculated for the time period presented and is not annualized for periods of less than a year.
|
| (b)
| Portfolio turnover is calculated for the time period presented and is not annualized for periods of less than a year and does not include securities received or
delivered from processing creations or redemptions and in-kind transactions.
|
See Notes to Financial Statements
Page 105
First Trust Exchange-Traded AlphaDEX® Fund II
Financial Highlights
(Continued)
For a share outstanding
throughout each period
First Trust China AlphaDEX® Fund (FCA)
|
| Year Ended December 31,
|
| 2022
|
| 2021
|
| 2020
|
| 2019
|
| 2018
|
Net asset value, beginning of period
| $ 27.57
|
| $ 29.16
|
| $ 26.87
|
| $ 23.81
|
| $ 29.77
|
| Income from investment operations:
|
|
|
|
|
|
|
|
|
|
Net investment income (loss)
| 1.28
|
| 1.22
|
| 1.22
|
| 1.03
|
| 0.84
|
Net realized and unrealized gain (loss)
| (5.97)
|
| (1.47)
|
| 2.26
|
| 3.03
|
| (6.07)
|
Total from investment operations
| (4.69)
|
| (0.25)
|
| 3.48
|
| 4.06
|
| (5.23)
|
| Distributions paid to shareholders from:
|
|
|
|
|
|
|
|
|
|
Net investment income
| (1.28)
|
| (1.34)
|
| (1.19)
|
| (1.00)
|
| (0.73)
|
Net asset value, end of period
| $21.60
|
| $27.57
|
| $29.16
|
| $26.87
|
| $23.81
|
Total return (a)
| (17.10)%
|
| (1.18)%
|
| 13.58%
|
| 17.34%
|
| (17.87)%
|
| Ratios to average net assets/supplemental data:
|
|
|
|
|
|
|
|
|
|
Net assets, end of period (in 000’s)
| $ 7,560
|
| $ 9,649
|
| $ 13,121
|
| $ 9,403
|
| $ 7,142
|
Ratio of total expenses to average net assets
| 0.80%
|
| 0.80%
|
| 0.80%
|
| 0.80%
|
| 0.80%
|
Ratio of net investment income (loss) to average net assets
| 5.19%
|
| 3.66%
|
| 5.16%
|
| 4.21%
|
| 2.90%
|
Portfolio turnover rate (b)
| 117%
|
| 166%
|
| 83%
|
| 111%
|
| 97%
|
| (a)
| Total return is calculated assuming an initial investment made at the net asset value at the beginning of the period, reinvestment of all distributions at net asset value during the
period, and redemption at net asset value on the last day of the period. The returns presented do not reflect the deduction of taxes that a shareholder would pay on Fund distributions or the redemption or sale of Fund
shares. Total return is calculated for the time period presented and is not annualized for periods of less than a year.
|
| (b)
| Portfolio turnover is calculated for the time period presented and is not annualized for periods of less than a year and does not include securities received or
delivered from processing creations or redemptions and in-kind transactions.
|
Page 106
See Notes to Financial Statements
First Trust Exchange-Traded AlphaDEX® Fund II
Financial Highlights
(Continued)
For a share outstanding
throughout each period
First Trust Japan AlphaDEX® Fund (FJP)
|
| Year Ended December 31,
|
| 2022
|
| 2021
|
| 2020
|
| 2019
|
| 2018
|
Net asset value, beginning of period
| $ 49.86
|
| $ 51.42
|
| $ 51.10
|
| $ 48.55
|
| $ 59.80
|
| Income from investment operations:
|
|
|
|
|
|
|
|
|
|
Net investment income (loss)
| 1.19
|
| 0.81
|
| 0.49
|
| 1.12
|
| 0.79
|
Net realized and unrealized gain (loss)
| (7.23)
|
| (1.16)
|
| 0.34
|
| 2.84
|
| (11.30)
|
Total from investment operations
| (6.04)
|
| (0.35)
|
| 0.83
|
| 3.96
|
| (10.51)
|
| Distributions paid to shareholders from:
|
|
|
|
|
|
|
|
|
|
Net investment income
| (0.94)
|
| (1.21)
|
| (0.51)
|
| (1.41)
|
| (0.74)
|
Net asset value, end of period
| $42.88
|
| $49.86
|
| $51.42
|
| $51.10
|
| $48.55
|
Total return (a)
| (12.04)%
|
| (0.69)%
|
| 1.71%
|
| 8.27%
|
| (17.66)%
|
| Ratios to average net assets/supplemental data:
|
|
|
|
|
|
|
|
|
|
Net assets, end of period (in 000’s)
| $ 85,768
|
| $ 34,901
|
| $ 41,136
|
| $ 76,647
|
| $ 152,934
|
Ratio of total expenses to average net assets
| 0.80%
|
| 0.80%
|
| 0.80%
|
| 0.80%
|
| 0.80%
|
Ratio of net investment income (loss) to average net assets
| 2.92%
|
| 1.53%
|
| 1.13%
|
| 1.90%
|
| 1.34%
|
Portfolio turnover rate (b)
| 79%
|
| 126%
|
| 136%
|
| 127%
|
| 90%
|
| (a)
| Total return is calculated assuming an initial investment made at the net asset value at the beginning of the period, reinvestment of all distributions at net asset value during the
period, and redemption at net asset value on the last day of the period. The returns presented do not reflect the deduction of taxes that a shareholder would pay on Fund distributions or the redemption or sale of Fund
shares. Total return is calculated for the time period presented and is not annualized for periods of less than a year.
|
| (b)
| Portfolio turnover is calculated for the time period presented and is not annualized for periods of less than a year and does not include securities received or
delivered from processing creations or redemptions and in-kind transactions.
|
See Notes to Financial Statements
Page 107
First Trust Exchange-Traded AlphaDEX® Fund II
Financial Highlights
(Continued)
For a share outstanding
throughout each period
First Trust Developed Markets ex-US
AlphaDEX® Fund (FDT)
|
| Year Ended December 31,
|
| 2022
|
| 2021
|
| 2020
|
| 2019
|
| 2018
|
Net asset value, beginning of period
| $ 60.64
|
| $ 56.88
|
| $ 55.79
|
| $ 49.24
|
| $ 62.31
|
| Income from investment operations:
|
|
|
|
|
|
|
|
|
|
Net investment income (loss)
| 1.67
|
| 1.52
|
| 0.68
|
| 1.19
|
| 1.04
|
Net realized and unrealized gain (loss)
| (12.95)
|
| 4.55
|
| 1.78
|
| 6.91
|
| (13.06)
|
Total from investment operations
| (11.28)
|
| 6.07
|
| 2.46
|
| 8.10
|
| (12.02)
|
| Distributions paid to shareholders from:
|
|
|
|
|
|
|
|
|
|
Net investment income
| (1.09)
|
| (2.31)
|
| (1.37)
|
| (1.55)
|
| (1.01)
|
Return of capital
| —
|
| —
|
| —
|
| —
|
| (0.04)
|
Total distributions
| (1.09)
|
| (2.31)
|
| (1.37)
|
| (1.55)
|
| (1.05)
|
Net asset value, end of period
| $48.27
|
| $60.64
|
| $56.88
|
| $55.79
|
| $49.24
|
Total return (a)
| (18.57)%
|
| 10.70%
|
| 4.61%
|
| 16.56%
|
| (19.52)%
|
| Ratios to average net assets/supplemental data:
|
|
|
|
|
|
|
|
|
|
Net assets, end of period (in 000’s)
| $ 419,333
|
| $ 414,579
|
| $ 360,418
|
| $ 691,886
|
| $ 940,633
|
Ratio of total expenses to average net assets
| 0.80%
|
| 0.80%
|
| 0.80%
|
| 0.80%
|
| 0.80%
|
Ratio of net investment income (loss) to average net assets
| 3.09%
|
| 2.42%
|
| 1.39%
|
| 2.13%
|
| 1.76%
|
Portfolio turnover rate (b)
| 95%
|
| 111%
|
| 117%
|
| 107%
|
| 109%
|
| (a)
| Total return is calculated assuming an initial investment made at the net asset value at the beginning of the period, reinvestment of all distributions at net asset value during the
period, and redemption at net asset value on the last day of the period. The returns presented do not reflect the deduction of taxes that a shareholder would pay on Fund distributions or the redemption or sale of Fund
shares. Total return is calculated for the time period presented and is not annualized for periods of less than a year.
|
| (b)
| Portfolio turnover is calculated for the time period presented and is not annualized for periods of less than a year and does not include securities received or
delivered from processing creations or redemptions and in-kind transactions.
|
Page 108
See Notes to Financial Statements
First Trust Exchange-Traded AlphaDEX® Fund II
Financial Highlights
(Continued)
For a share outstanding
throughout each period
First Trust Emerging Markets AlphaDEX® Fund (FEM)
|
| Year Ended December 31,
|
| 2022
|
| 2021
|
| 2020
|
| 2019
|
| 2018
|
Net asset value, beginning of period
| $ 26.24
|
| $ 25.31
|
| $ 26.36
|
| $ 22.80
|
| $ 27.84
|
| Income from investment operations:
|
|
|
|
|
|
|
|
|
|
Net investment income (loss)
| 1.34
|
| 1.11
|
| 0.63
|
| 0.88
|
| 0.88
|
Net realized and unrealized gain (loss)
| (5.19)
|
| 0.90
|
| (1.00)
|
| 3.56
|
| (5.12)
|
Total from investment operations
| (3.85)
|
| 2.01
|
| (0.37)
|
| 4.44
|
| (4.24)
|
| Distributions paid to shareholders from:
|
|
|
|
|
|
|
|
|
|
Net investment income
| (1.29)
|
| (1.08)
|
| (0.68)
|
| (0.88)
|
| (0.80)
|
Net asset value, end of period
| $21.10
|
| $26.24
|
| $25.31
|
| $26.36
|
| $22.80
|
Total return (a)
| (14.33)%
|
| 7.90%
|
| (0.92)%
|
| 19.81%
|
| (15.48)%
|
| Ratios to average net assets/supplemental data:
|
|
|
|
|
|
|
|
|
|
Net assets, end of period (in 000’s)
| $ 372,378
|
| $ 436,915
|
| $ 441,711
|
| $ 644,615
|
| $ 452,607
|
Ratio of total expenses to average net assets
| 0.80%
|
| 0.80%
|
| 0.80%
|
| 0.80%
|
| 0.80%
|
Ratio of net investment income (loss) to average net assets
| 5.90%
|
| 4.03%
|
| 2.53%
|
| 3.61%
|
| 3.37%
|
Portfolio turnover rate (b)
| 106%
|
| 119%
|
| 111%
|
| 122%
|
| 103%
|
| (a)
| Total return is calculated assuming an initial investment made at the net asset value at the beginning of the period, reinvestment of all distributions at net asset value during the
period, and redemption at net asset value on the last day of the period. The returns presented do not reflect the deduction of taxes that a shareholder would pay on Fund distributions or the redemption or sale of Fund
shares. Total return is calculated for the time period presented and is not annualized for periods of less than a year.
|
| (b)
| Portfolio turnover is calculated for the time period presented and is not annualized for periods of less than a year and does not include securities received or
delivered from processing creations or redemptions and in-kind transactions.
|
See Notes to Financial Statements
Page 109
First Trust Exchange-Traded AlphaDEX® Fund II
Financial Highlights
(Continued)
For a share outstanding
throughout each period
First Trust Germany AlphaDEX® Fund (FGM)
|
| Year Ended December 31,
|
| 2022
|
| 2021
|
| 2020
|
| 2019
|
| 2018
|
Net asset value, beginning of period
| $ 53.78
|
| $ 51.56
|
| $ 44.39
|
| $ 37.57
|
| $ 51.26
|
| Income from investment operations:
|
|
|
|
|
|
|
|
|
|
Net investment income (loss)
| 1.77
|
| 0.91
|
| 0.68
|
| 1.02
|
| 0.72
|
Net realized and unrealized gain (loss)
| (18.27)
|
| 2.08
|
| 7.17
|
| 6.82
|
| (13.59)
|
Total from investment operations
| (16.50)
|
| 2.99
|
| 7.85
|
| 7.84
|
| (12.87)
|
| Distributions paid to shareholders from:
|
|
|
|
|
|
|
|
|
|
Net investment income
| (1.92)
|
| (0.77)
|
| (0.68)
|
| (1.02)
|
| (0.82)
|
Net asset value, end of period
| $35.36
|
| $53.78
|
| $51.56
|
| $44.39
|
| $37.57
|
Total return (a)
| (30.39)%
|
| 5.74%
|
| 17.90%
|
| 21.06%
|
| (25.40)%
|
| Ratios to average net assets/supplemental data:
|
|
|
|
|
|
|
|
|
|
Net assets, end of period (in 000’s)
| $ 14,144
|
| $ 99,497
|
| $ 95,381
|
| $ 144,261
|
| $ 139,022
|
Ratio of total expenses to average net assets
| 0.80%
|
| 0.80%
|
| 0.80%
|
| 0.80%
|
| 0.80%
|
Ratio of net investment income (loss) to average net assets
| 2.23%
|
| 1.67%
|
| 1.40%
|
| 2.48%
|
| 1.66%
|
Portfolio turnover rate (b)
| 152%
|
| 80%
|
| 106%
|
| 99%
|
| 81%
|
| (a)
| Total return is calculated assuming an initial investment made at the net asset value at the beginning of the period, reinvestment of all distributions at net asset value during the
period, and redemption at net asset value on the last day of the period. The returns presented do not reflect the deduction of taxes that a shareholder would pay on Fund distributions or the redemption or sale of Fund
shares. Total return is calculated for the time period presented and is not annualized for periods of less than a year.
|
| (b)
| Portfolio turnover is calculated for the time period presented and is not annualized for periods of less than a year and does not include securities received or
delivered from processing creations or redemptions and in-kind transactions.
|
Page 110
See Notes to Financial Statements
First Trust Exchange-Traded AlphaDEX® Fund II
Financial Highlights
(Continued)
For a share outstanding
throughout each period
First Trust United Kingdom AlphaDEX® Fund (FKU)
|
| Year Ended December 31,
|
| 2022
|
| 2021
|
| 2020
|
| 2019
|
| 2018
|
Net asset value, beginning of period
| $ 43.97
|
| $ 38.06
|
| $ 40.99
|
| $ 32.11
|
| $ 39.97
|
| Income from investment operations:
|
|
|
|
|
|
|
|
|
|
Net investment income (loss)
| 1.54
|
| 1.29
|
| 0.58
|
| 1.34
|
| 1.13
|
Net realized and unrealized gain (loss)
| (12.02)
|
| 5.93
|
| (2.95)
|
| 8.91
|
| (7.35)
|
Total from investment operations
| (10.48)
|
| 7.22
|
| (2.37)
|
| 10.25
|
| (6.22)
|
| Distributions paid to shareholders from:
|
|
|
|
|
|
|
|
|
|
Net investment income
| (1.76)
|
| (1.31)
|
| (0.56)
|
| (1.37)
|
| (1.64)
|
Net asset value, end of period
| $31.73
|
| $43.97
|
| $38.06
|
| $40.99
|
| $32.11
|
Total return (a)
| (23.52)%
|
| 19.10%
|
| (5.25)%
|
| 32.36%
|
| (16.16)%
|
| Ratios to average net assets/supplemental data:
|
|
|
|
|
|
|
|
|
|
Net assets, end of period (in 000’s)
| $ 31,728
|
| $ 98,943
|
| $ 19,030
|
| $ 18,444
|
| $ 9,632
|
Ratio of total expenses to average net assets
| 0.80%
|
| 0.80%
|
| 0.80%
|
| 0.80%
|
| 0.80%
|
Ratio of net investment income (loss) to average net assets
| 4.29%
|
| 3.34%
|
| 1.72%
|
| 3.58%
|
| 2.81%
|
Portfolio turnover rate (b)
| 98%
|
| 45%
|
| 109%
|
| 73%
|
| 107%
|
| (a)
| Total return is calculated assuming an initial investment made at the net asset value at the beginning of the period, reinvestment of all distributions at net asset value during the
period, and redemption at net asset value on the last day of the period. The returns presented do not reflect the deduction of taxes that a shareholder would pay on Fund distributions or the redemption or sale of Fund
shares. Total return is calculated for the time period presented and is not annualized for periods of less than a year.
|
| (b)
| Portfolio turnover is calculated for the time period presented and is not annualized for periods of less than a year and does not include securities received or
delivered from processing creations or redemptions and in-kind transactions.
|
See Notes to Financial Statements
Page 111
First Trust Exchange-Traded AlphaDEX® Fund II
Financial Highlights
(Continued)
For a share outstanding
throughout each period
First Trust India NIFTY 50 Equal Weight ETF
(NFTY)
|
| Year Ended December 31,
|
| 2022
|
| 2021
|
| 2020
|
| 2019
|
| 2018
|
Net asset value, beginning of period
| $ 48.23
|
| $ 38.83
|
| $ 35.26
|
| $ 35.35
|
| $ 36.33
|
| Income from investment operations:
|
|
|
|
|
|
|
|
|
|
Net investment income (loss)
| 0.22
|
| 0.48
|
| 0.30
|
| 0.26
|
| 0.23
|
Net realized and unrealized gain (loss)
| (2.35)
|
| 9.65
|
| 3.50
|
| (0.01)
|
| (1.21)
|
Total from investment operations
| (2.13)
|
| 10.13
|
| 3.80
|
| 0.25
|
| (0.98)
|
| Distributions paid to shareholders from:
|
|
|
|
|
|
|
|
|
|
Net investment income
| (0.05)
|
| (0.73)
|
| (0.23)
|
| (0.27)
|
| (0.01)
|
Net realized gain
| (2.52)
|
| —
|
| —
|
| —
|
| —
|
Return of capital
| —
|
| —
|
| —
|
| (0.07)
|
| —
|
Total distributions
| (2.57)
|
| (0.73)
|
| (0.23)
|
| (0.34)
|
| —
|
Net asset value, end of period
| $43.53
|
| $48.23
|
| $38.83
|
| $35.26
|
| $35.35
|
Total return (a)
| (4.45)%
|
| 26.15%
|
| 10.66%
|
| 0.71%
|
| (2.67)% (b)
|
| Ratios to average net assets/supplemental data:
|
|
|
|
|
|
|
|
|
|
Net assets, end of period (in 000’s)
| $ 73,999
|
| $ 62,703
|
| $ 3,883
|
| $ 3,526
|
| $ 3,535
|
Ratio of total expenses to average net assets
| 0.80%
|
| 0.80%
|
| 0.80%
|
| 0.80%
|
| 0.80%
|
Ratio of net investment income (loss) to average net assets
| 0.68%
|
| 0.95%
|
| 0.98%
|
| 0.74%
|
| 0.77%
|
Portfolio turnover rate (c)
| 56%
|
| 57%
|
| 38%
|
| 24%
|
| 156% (d)
|
| (a)
| Total return is calculated assuming an initial investment made at the net asset value at the beginning of the period, reinvestment of all distributions at net asset value during the
period, and redemption at net asset value on the last day of the period. The returns presented do not reflect the deduction of taxes that a shareholder would pay on Fund distributions or the redemption or sale of Fund
shares. Total return is calculated for the time period presented and is not annualized for periods of less than a year.
|
| (b)
| The Fund received a reimbursement from the advisor in the amount of $7,227, which represents less than $0.01 per share. Since the advisor reimbursed the Fund, there was no effect on
the Fund’s total return.
|
| (c)
| Portfolio turnover is calculated for the time period presented and is not annualized for periods of less than a year and does not include securities received or delivered from
processing creations or redemptions and in-kind transactions.
|
| (d)
| The variation in the portfolio turnover rate is due to the change in the Fund’s underlying index effective April 17, 2018 which resulted in a complete
rebalance of the Fund’s portfolio.
|
Page 112
See Notes to Financial Statements
First Trust Exchange-Traded AlphaDEX® Fund II
Financial Highlights
(Continued)
For a share outstanding
throughout each period
First Trust Switzerland AlphaDEX® Fund (FSZ)
|
| Year Ended December 31,
|
| 2022
|
| 2021
|
| 2020
|
| 2019
|
| 2018
|
Net asset value, beginning of period
| $ 71.39
|
| $ 60.85
|
| $ 54.11
|
| $ 43.89
|
| $ 52.73
|
| Income from investment operations:
|
|
|
|
|
|
|
|
|
|
Net investment income (loss)
| 1.98
|
| 0.78
|
| 0.88
|
| 1.07
|
| 0.82
|
Net realized and unrealized gain (loss)
| (17.03)
|
| 10.92
|
| 6.78
|
| 10.24
|
| (8.66)
|
Total from investment operations
| (15.05)
|
| 11.70
|
| 7.66
|
| 11.31
|
| (7.84)
|
| Distributions paid to shareholders from:
|
|
|
|
|
|
|
|
|
|
Net investment income
| (1.92)
|
| (1.16)
|
| (0.92)
|
| (1.09)
|
| (0.84)
|
Return of capital
| —
|
| —
|
| —
|
| —
|
| (0.16)
|
Total distributions
| (1.92)
|
| (1.16)
|
| (0.92)
|
| (1.09)
|
| (1.00)
|
Net asset value, end of period
| $54.42
|
| $71.39
|
| $60.85
|
| $54.11
|
| $43.89
|
Total return (a)
| (20.88)%
|
| 19.34%
|
| 14.50%
|
| 25.91%
|
| (15.11)%
|
| Ratios to average net assets/supplemental data:
|
|
|
|
|
|
|
|
|
|
Net assets, end of period (in 000’s)
| $ 97,959
|
| $ 99,943
|
| $ 97,354
|
| $ 148,811
|
| $ 151,409
|
Ratio of total expenses to average net assets
| 0.80%
|
| 0.80%
|
| 0.80%
|
| 0.80%
|
| 0.80%
|
Ratio of net investment income (loss) to average net assets
| 2.30%
|
| 1.25%
|
| 1.59%
|
| 2.24%
|
| 1.79%
|
Portfolio turnover rate (b)
| 64%
|
| 66%
|
| 86%
|
| 77%
|
| 65%
|
| (a)
| Total return is calculated assuming an initial investment made at the net asset value at the beginning of the period, reinvestment of all distributions at net asset value during the
period, and redemption at net asset value on the last day of the period. The returns presented do not reflect the deduction of taxes that a shareholder would pay on Fund distributions or the redemption or sale of Fund
shares. Total return is calculated for the time period presented and is not annualized for periods of less than a year.
|
| (b)
| Portfolio turnover is calculated for the time period presented and is not annualized for periods of less than a year and does not include securities received or
delivered from processing creations or redemptions and in-kind transactions.
|
See Notes to Financial Statements
Page 113
First Trust Exchange-Traded AlphaDEX® Fund II
Financial Highlights
(Continued)
For a share outstanding
throughout each period
First Trust Developed Markets ex-US Small
Cap AlphaDEX® Fund (FDTS)
|
| Year Ended December 31,
|
| 2022
|
| 2021
|
| 2020
|
| 2019
|
| 2018
|
Net asset value, beginning of period
| $ 46.06
|
| $ 42.72
|
| $ 39.03
|
| $ 33.54
|
| $ 44.89
|
| Income from investment operations:
|
|
|
|
|
|
|
|
|
|
Net investment income (loss)
| 1.09
|
| 0.74
|
| 0.46
|
| 0.61
|
| 0.58
|
Net realized and unrealized gain (loss)
| (8.09)
|
| 3.99
|
| 4.09
|
| 5.77
|
| (11.28)
|
Total from investment operations
| (7.00)
|
| 4.73
|
| 4.55
|
| 6.38
|
| (10.70)
|
| Distributions paid to shareholders from:
|
|
|
|
|
|
|
|
|
|
Net investment income
| (1.39)
|
| (1.39)
|
| (0.86)
|
| (0.89)
|
| (0.62)
|
Return of capital
| —
|
| —
|
| —
|
| —
|
| (0.03)
|
Total distributions
| (1.39)
|
| (1.39)
|
| (0.86)
|
| (0.89)
|
| (0.65)
|
Net asset value, end of period
| $37.67
|
| $46.06
|
| $42.72
|
| $39.03
|
| $33.54
|
Total return (a)
| (15.00)%
|
| 11.09%
|
| 12.18%
|
| 19.13%
|
| (24.03)%
|
| Ratios to average net assets/supplemental data:
|
|
|
|
|
|
|
|
|
|
Net assets, end of period (in 000’s)
| $ 7,535
|
| $ 13,817
|
| $ 8,544
|
| $ 9,758
|
| $ 10,063
|
Ratio of total expenses to average net assets
| 0.80%
|
| 0.80%
|
| 0.80%
|
| 0.80%
|
| 0.80%
|
Ratio of net investment income (loss) to average net assets
| 2.88%
|
| 1.46%
|
| 1.35%
|
| 1.66%
|
| 1.30%
|
Portfolio turnover rate (b)
| 109%
|
| 116%
|
| 127%
|
| 119%
|
| 142%
|
| (a)
| Total return is calculated assuming an initial investment made at the net asset value at the beginning of the period, reinvestment of all distributions at net asset value during the
period, and redemption at net asset value on the last day of the period. The returns presented do not reflect the deduction of taxes that a shareholder would pay on Fund distributions or the redemption or sale of Fund
shares. Total return is calculated for the time period presented and is not annualized for periods of less than a year.
|
| (b)
| Portfolio turnover is calculated for the time period presented and is not annualized for periods of less than a year and does not include securities received or
delivered from processing creations or redemptions and in-kind transactions.
|
Page 114
See Notes to Financial Statements
First Trust Exchange-Traded AlphaDEX® Fund II
Financial Highlights
(Continued)
For a share outstanding
throughout each period
First Trust Emerging Markets Small Cap
AlphaDEX® Fund (FEMS)
|
| Year Ended December 31,
|
| 2022
|
| 2021
|
| 2020
|
| 2019
|
| 2018
|
Net asset value, beginning of period
| $ 40.29
|
| $ 41.24
|
| $ 39.28
|
| $ 32.44
|
| $ 43.02
|
| Income from investment operations:
|
|
|
|
|
|
|
|
|
|
Net investment income (loss)
| 1.86
|
| 1.57
|
| 0.74
|
| 1.11
|
| 1.19
|
Net realized and unrealized gain (loss)
| (1.60)
|
| (0.01)
|
| 2.41
|
| 7.46
|
| (10.26)
|
Total from investment operations
| 0.26
|
| 1.56
|
| 3.15
|
| 8.57
|
| (9.07)
|
| Distributions paid to shareholders from:
|
|
|
|
|
|
|
|
|
|
Net investment income
| (1.77)
|
| (2.51)
|
| (1.19)
|
| (1.73)
|
| (1.44)
|
Net realized gain
| —
|
| —
|
| —
|
| —
|
| (0.07)
|
Total distributions
| (1.77)
|
| (2.51)
|
| (1.19)
|
| (1.73)
|
| (1.51)
|
Net asset value, end of period
| $38.78
|
| $40.29
|
| $41.24
|
| $39.28
|
| $32.44
|
Total return (a)
| 1.36%
|
| 3.68%
|
| 8.73%
|
| 26.90%
|
| (21.42)%
|
| Ratios to average net assets/supplemental data:
|
|
|
|
|
|
|
|
|
|
Net assets, end of period (in 000’s)
| $ 166,753
|
| $ 143,030
|
| $ 152,581
|
| $ 163,004
|
| $ 157,326
|
Ratio of total expenses to average net assets
| 0.80%
|
| 0.80%
|
| 0.80%
|
| 0.80%
|
| 0.80%
|
Ratio of net investment income (loss) to average net assets
| 4.60%
|
| 3.65%
|
| 2.38%
|
| 2.88%
|
| 3.02%
|
Portfolio turnover rate (b)
| 117%
|
| 127%
|
| 123%
|
| 127%
|
| 126%
|
| (a)
| Total return is calculated assuming an initial investment made at the net asset value at the beginning of the period, reinvestment of all distributions at net asset value during the
period, and redemption at net asset value on the last day of the period. The returns presented do not reflect the deduction of taxes that a shareholder would pay on Fund distributions or the redemption or sale of Fund
shares. Total return is calculated for the time period presented and is not annualized for periods of less than a year.
|
| (b)
| Portfolio turnover is calculated for the time period presented and is not annualized for periods of less than a year and does not include securities received or
delivered from processing creations or redemptions and in-kind transactions.
|
See Notes to Financial Statements
Page 115
First Trust Exchange-Traded AlphaDEX® Fund II
Financial Highlights
(Continued)
For a share outstanding
throughout each period
First Trust Eurozone AlphaDEX® ETF (FEUZ)
|
| Year Ended December 31,
|
| 2022
|
| 2021
|
| 2020
|
| 2019
|
| 2018
|
Net asset value, beginning of period
| $ 46.36
|
| $ 42.10
|
| $ 40.88
|
| $ 34.43
|
| $ 43.81
|
| Income from investment operations:
|
|
|
|
|
|
|
|
|
|
Net investment income (loss)
| 0.85
|
| 1.10
|
| 0.50
|
| 0.73
|
| 0.80
|
Net realized and unrealized gain (loss)
| (10.05)
|
| 4.32
|
| 1.34
|
| 6.51
|
| (9.34)
|
Total from investment operations
| (9.20)
|
| 5.42
|
| 1.84
|
| 7.24
|
| (8.54)
|
| Distributions paid to shareholders from:
|
|
|
|
|
|
|
|
|
|
Net investment income
| (1.12)
|
| (1.16)
|
| (0.62)
|
| (0.79)
|
| (0.84)
|
Net asset value, end of period
| $36.04
|
| $46.36
|
| $42.10
|
| $40.88
|
| $34.43
|
Total return (a)
| (19.65)%
|
| 12.90%
|
| 4.69%
|
| 21.15%
|
| (19.82)%
|
| Ratios to average net assets/supplemental data:
|
|
|
|
|
|
|
|
|
|
Net assets, end of period (in 000’s)
| $ 16,219
|
| $ 81,135
|
| $ 27,363
|
| $ 53,145
|
| $ 49,925
|
Ratio of total expenses to average net assets
| 0.80%
|
| 0.80%
|
| 0.80%
|
| 0.80%
|
| 0.80%
|
Ratio of net investment income (loss) to average net assets
| 2.09%
|
| 2.27%
|
| 1.26%
|
| 1.96%
|
| 2.10%
|
Portfolio turnover rate (b)
| 56%
|
| 59%
|
| 93%
|
| 87%
|
| 90%
|
| (a)
| Total return is calculated assuming an initial investment made at the net asset value at the beginning of the period, reinvestment of all distributions at net asset value during the
period, and redemption at net asset value on the last day of the period. The returns presented do not reflect the deduction of taxes that a shareholder would pay on Fund distributions or the redemption or sale of Fund
shares. Total return is calculated for the time period presented and is not annualized for periods of less than a year.
|
| (b)
| Portfolio turnover is calculated for the time period presented and is not annualized for periods of less than a year and does not include securities received or
delivered from processing creations or redemptions and in-kind transactions.
|
Page 116
See Notes to Financial Statements
Notes to Financial Statements
First Trust
Exchange-Traded AlphaDEX® Fund II
December 31, 2022
1. Organization
First Trust
Exchange-Traded AlphaDEX® Fund II (the “Trust”) is an open-end management investment company organized as a Massachusetts business trust on December 3, 2010,
and is registered with the Securities and Exchange Commission (“SEC”) under the Investment Company Act of 1940, as amended (the “1940 Act”).
The Trust currently
consists of the following fifteen funds (each a “Fund” and collectively, the “Funds”). The shares of each Fund are listed and traded on The Nasdaq Stock Market LLC (“Nasdaq”).
First
Trust Asia Pacific ex-Japan AlphaDEX® Fund – (ticker “FPA”)
First Trust Europe AlphaDEX® Fund – (ticker “FEP”)
First Trust Latin America AlphaDEX® Fund – (ticker “FLN”)
First Trust Brazil AlphaDEX® Fund – (ticker “FBZ”)
First Trust China AlphaDEX® Fund – (ticker “FCA”)
First Trust Japan AlphaDEX® Fund – (ticker “FJP”)
First Trust Developed Markets ex-US AlphaDEX® Fund – (ticker “FDT”)
First Trust Emerging Markets AlphaDEX® Fund – (ticker “FEM”)
First Trust Germany AlphaDEX® Fund – (ticker “FGM”)
First Trust United Kingdom AlphaDEX® Fund – (ticker “FKU”)
First Trust India NIFTY 50 Equal Weight ETF – (ticker “NFTY”)
First Trust Switzerland AlphaDEX® Fund – (ticker “FSZ”)
First Trust Developed Markets ex-US Small Cap AlphaDEX® Fund – (ticker “FDTS”)
First Trust Emerging Markets Small Cap AlphaDEX® Fund – (ticker “FEMS”)
First Trust Eurozone AlphaDEX® ETF – (ticker “FEUZ”)
Each Fund represents a
separate series of beneficial interest in the Trust. Unlike conventional mutual funds, each Fund issues and redeems shares on a continuous basis, at net asset value (“NAV”), only in large blocks of shares
known as “Creation Units.” The investment objective of each Fund is to seek investment results that correspond generally to the price and yield (before the Fund’s fees and expenses) of the following
indices:
| Fund
| Index
|
| First Trust Asia Pacific ex-Japan AlphaDEX® Fund
| Nasdaq AlphaDEX® Asia Pacific Ex-Japan Index
|
| First Trust Europe AlphaDEX® Fund
| Nasdaq AlphaDEX® Europe Index
|
| First Trust Latin America AlphaDEX® Fund
| Nasdaq AlphaDEX® Latin America Index
|
| First Trust Brazil AlphaDEX® Fund
| Nasdaq AlphaDEX® Brazil Index
|
| First Trust China AlphaDEX® Fund
| Nasdaq AlphaDEX® China Index
|
| First Trust Japan AlphaDEX® Fund
| Nasdaq AlphaDEX® Japan Index
|
| First Trust Developed Markets ex-US AlphaDEX® Fund
| Nasdaq AlphaDEX® Developed Markets Ex-US Index
|
| First Trust Emerging Markets AlphaDEX® Fund
| Nasdaq AlphaDEX® Emerging Markets Index
|
| First Trust Germany AlphaDEX® Fund
| Nasdaq AlphaDEX® Germany Index
|
| First Trust United Kingdom AlphaDEX® Fund
| Nasdaq AlphaDEX® United Kingdom Index
|
| First Trust India NIFTY 50 Equal Weight ETF
| NIFTY 50 Equal Weight Index
|
| First Trust Switzerland AlphaDEX® Fund
| Nasdaq AlphaDEX® Switzerland Index
|
| First Trust Developed Markets ex-US Small Cap AlphaDEX® Fund
| Nasdaq AlphaDEX® Developed Markets Ex-US Small Cap Index
|
| First Trust Emerging Markets Small Cap AlphaDEX® Fund
| Nasdaq AlphaDEX® Emerging Markets Small Cap Index
|
| First Trust Eurozone AlphaDEX® ETF
| Nasdaq AlphaDEX® Eurozone Index
|
2. Significant
Accounting Policies
The Funds are each
considered an investment company and follow accounting and reporting guidance under Financial Accounting Standards Board Accounting Standards Codification Topic 946, “Financial Services-Investment
Companies.” The following is a summary of significant accounting policies consistently followed by the Funds in the preparation of the financial statements. The preparation of the financial statements in
accordance with accounting principles generally accepted in the United States of America (“U.S. GAAP”) requires management to make estimates and assumptions that affect the reported amounts and disclosures
in the financial statements. Actual results could differ from those estimates.
A. Portfolio
Valuation
Each Fund’s NAV is
determined daily as of the close of regular trading on the New York Stock Exchange (“NYSE”), normally 4:00 p.m. Eastern time, on each day the NYSE is open for trading. If the NYSE closes early on a
valuation day, the NAV is determined
Notes to Financial Statements (Continued)
First Trust
Exchange-Traded AlphaDEX® Fund II
December 31, 2022
as of that time. Foreign securities are
priced using data reflecting the earlier closing of the principal markets for those securities. Each Fund’s NAV is calculated by dividing the value of all assets of each Fund (including accrued interest and
dividends), less all liabilities (including accrued expenses and dividends declared but unpaid), by the total number of shares outstanding.
Each Fund’s
investments are valued daily at market value or, in the absence of market value with respect to any portfolio securities, at fair value. Market value prices represent readily available market quotations such as last
sale or official closing prices from a national or foreign exchange (i.e., a regulated market) and are primarily obtained from third-party pricing services. Fair value prices represent any prices not considered market
value prices and are either obtained from a third-party pricing service or are determined by the Pricing Committee of the Funds’ investment advisor, First Trust Advisors L.P. (“First Trust” or the
“Advisor”), in accordance with valuation procedures approved by the Trust’s Board of Trustees, and in accordance with provisions of the 1940 Act and rules thereunder. Investments valued by the
Advisor’s Pricing Committee, if any, are footnoted as such in the footnotes to the Portfolio of Investments. Each Fund’s investments are valued as follows:
Common
stocks, real estate investment trusts (“REITs”), and other equity securities listed on any national or foreign exchange (excluding Nasdaq and the London Stock Exchange Alternative Investment Market
(“AIM”)) are valued at the last sale price on the exchange on which they are principally traded or, for Nasdaq and AIM securities, the official closing price. Securities traded on more than one securities
exchange are valued at the last sale price or official closing price, as applicable, at the close of the securities exchange representing the primary exchange for such securities.
Securities trading on foreign exchanges or over-the-counter markets that close prior to the NYSE close may be valued using a systematic fair valuation model provided by a third-party pricing service. If these
foreign securities meet certain criteria in relation to the valuation model, their valuation is systematically adjusted to reflect the impact of movement in the U.S. market after the close of the foreign markets.
Shares
of open-end funds are valued based on NAV per share.
Securities traded in an over-the-counter market are valued at the mean of their most recent bid and asked price, if available, and otherwise at their last trade price.
Overnight repurchase agreements are valued at amortized cost when it represents the most appropriate reflection of fair market value.
Certain securities may
not be able to be priced by pre-established pricing methods. Such securities may be valued by the Advisor’s Pricing Committee at fair value. These securities generally include, but are not limited to, restricted
securities (securities which may not be publicly sold without registration under the Securities Act of 1933, as amended (the “1933 Act”)) for which a third-party pricing service is unable to provide a
market price; securities whose trading has been formally suspended; a security whose market or fair value price is not available from a pre-established pricing source; a security with respect to which an event has
occurred that is likely to materially affect the value of the security after the market has closed but before the calculation of a Fund’s NAV or make it difficult or impossible to obtain a reliable market
quotation; and a security whose price, as provided by the third-party pricing service, does not reflect the security’s fair value. As a general principle, the current fair value of a security would appear to be
the amount which the owner might reasonably expect to receive for the security upon its current sale. When fair value prices are used, generally they will differ from market quotations or official closing prices on
the applicable exchanges. A variety of factors may be considered in determining the fair value of such securities, including, but not limited to, the following:
| 1)
| the last sale price on the exchange on which they are principally traded or, for Nasdaq and AIM securities, the official closing price;
|
| 2)
| the type of security;
|
| 3)
| the size of the holding;
|
| 4)
| the initial cost of the security;
|
| 5)
| transactions in comparable securities;
|
| 6)
| price quotes from dealers and/or third-party pricing services;
|
| 7)
| relationships among various securities;
|
| 8)
| information obtained by contacting the issuer, analysts, or the appropriate stock exchange;
|
| 9)
| an analysis of the issuer’s financial statements;
|
| 10)
| the existence of merger proposals or tender offers that might affect the value of the security; and
|
| 11)
| other relevant factors.
|
Notes to Financial Statements (Continued)
First Trust
Exchange-Traded AlphaDEX® Fund II
December 31, 2022
If the securities in
question are foreign securities, the following additional information may be considered:
| 1)
| the value of similar foreign securities traded on other foreign markets;
|
| 2)
| ADR trading of similar securities;
|
| 3)
| closed-end fund or exchange-traded fund trading of similar securities;
|
| 4)
| foreign currency exchange activity;
|
| 5)
| the trading prices of financial products that are tied to baskets of foreign securities;
|
| 6)
| factors relating to the event that precipitated the pricing problem;
|
| 7)
| whether the event is likely to recur;
|
| 8)
| whether the effects of the event are isolated or whether they affect entire markets, countries or regions; and
|
| 9)
| other relevant factors.
|
In addition, differences
between the prices used to calculate a Fund’s NAV and the prices used by such Fund’s corresponding index could result in a difference between a Fund’s performance and the performance of its
underlying index.
Because foreign markets
may be open on different days than the days during which investors may transact in the shares of a Fund, the value of the Fund’s securities may change on the days when investors are not able to transact in the
shares of the Fund. The value of securities denominated in foreign currencies is converted into U.S. dollars using exchange rates determined daily as of the close of regular trading on the NYSE. Any use of a different
rate from the rates used by a relevant index may adversely affect the Fund’s ability to track the index.
The Funds are subject to
fair value accounting standards that define fair value, establish the framework for measuring fair value and provide a three-level hierarchy for fair valuation based upon the inputs to the valuation as of the
measurement date. The three levels of the fair value hierarchy are as follows:
| •
| Level 1 – Level 1 inputs are quoted prices in active markets for identical investments. An active market is a market in which transactions for the investment occur with sufficient frequency and
volume to provide pricing information on an ongoing basis.
|
| •
| Level 2 – Level 2 inputs are observable inputs, either directly or indirectly, and include the following:
|
| o
| Quoted prices for similar investments in active markets.
|
| o
| Quoted prices for identical or similar investments in markets that are non-active. A non-active market is a market where there are few transactions for the investment, the prices are not current, or
price quotations vary substantially either over time or among market makers, or in which little information is released publicly.
|
| o
| Inputs other than quoted prices that are observable for the investment (for example, interest rates and yield curves observable at commonly quoted intervals, volatilities, prepayment speeds, loss
severities, credit risks, and default rates).
|
| o
| Inputs that are derived principally from or corroborated by observable market data by correlation or other means.
|
| •
| Level 3 – Level 3 inputs are unobservable inputs. Unobservable inputs may reflect the reporting entity’s own assumptions about the assumptions that market participants would use in pricing
the investment.
|
The inputs or
methodologies used for valuing investments are not necessarily an indication of the risk associated with investing in those investments. A summary of the inputs used to value each Fund’s investments as of
December 31, 2022, is included with each Fund’s Portfolio of Investments.
In December 2020, the SEC
adopted Rule 2a-5 under the 1940 Act, establishing requirements to determine fair value in good faith for purposes of the 1940 Act. The rule permits fund boards to designate a fund’s investment advisor to
perform fair value determinations, subject to board oversight and certain other conditions. The rule also defines when market quotations are “readily available” for purposes of the 1940 Act and requires a
fund to fair value a portfolio investment when a market quotation is not readily available. The SEC also adopted new Rule 31a-4 under the 1940 Act, which sets forth recordkeeping requirements associated with fair
value determinations. The compliance date for Rule 2a-5 and Rule 31a-4 was September 8, 2022.
Effective September 8,
2022 and pursuant to the requirements of Rule 2a-5, the Trust’s Board of Trustees designated the Advisor as its valuation designee to perform fair value determinations and approved new Advisor Valuation
Procedures for the Trust.
Notes to Financial Statements (Continued)
First Trust
Exchange-Traded AlphaDEX® Fund II
December 31, 2022
B. Securities
Transactions and Investment Income
Securities transactions
are recorded as of the trade date. Realized gains and losses from securities transactions are recorded on the identified cost basis. Dividend income is recorded on the ex-dividend date except that certain dividends
from foreign securities are recorded as soon as the information becomes available after the ex-dividend date. Interest income, if any, is recorded on the accrual basis.
Withholding taxes and tax
reclaims on foreign dividends have been provided for in accordance with each Fund’s understanding of the applicable country’s tax rules and rates.
Distributions received
from a Fund’s investments in REITs may be comprised of return of capital, capital gains, and income. The actual character of the amounts received during the year are not known until after the REITs’ fiscal
year end. A Fund records the character of distributions received from the REITs during the year based on estimates available. The characterization of distributions received by a Fund may be subsequently revised based
on information received from the REITs after their tax reporting periods conclude.
C. Restricted
Securities
NFTY invests in
restricted securities, which are securities that may not be offered for public sale without first being registered under the 1933 Act. Prior to registration, restricted securities may only be resold in transactions
exempt from registration under Rule 144A under the 1933 Act, normally to qualified institutional buyers. As of December 31, 2022, NFTY held restricted securities as shown in the following table that the Advisor has
deemed illiquid pursuant to procedures adopted by the Trust’s Board of Trustees. Although market instability can result in periods of increased overall market illiquidity, liquidity for each security is
determined based on security-specific factors and assumptions, which require subjective judgment. NFTY does not have the right to demand that such securities be registered. These securities are valued according to the
valuation procedures as stated in the Portfolio Valuation note (Note 2A) and are not expressed as a discount to the carrying value of a comparable unrestricted security. There are no unrestricted securities with the
same maturity dates and yields for these issuers.
| Security
| Acquisition
Date
| Principal
Value/Shares
| Current Price
| Carrying
Cost
| Value
| % of
Net
Assets
|
| YES Bank Ltd. Lock-In
| 03/18/20
| 75,422
| $0.25
| $36,638
| $18,780
| 0.03%
|
D. Foreign
Currency
The books and records of
the Funds are maintained in U.S. dollars. Foreign currencies, investments and other assets and liabilities are translated into U.S. dollars at the exchange rates prevailing at the end of the period. Purchases and
sales of investments and items of income and expense are translated on the respective dates of such transactions. Unrealized gains and losses on assets and liabilities, other than investments in securities, which
result from changes in foreign currency exchange rates have been included in “Net change in unrealized appreciation (depreciation) on foreign currency translation” on the Statements of Operations.
Unrealized gains and losses on investments in securities which result from changes in foreign exchange rates are included with fluctuations arising from changes in market price and are included in “Net change in
unrealized appreciation (depreciation) on investments” on the Statements of Operations. Net realized foreign currency gains and losses include the effect of changes in exchange rates between trade date and
settlement date on investment security transactions, foreign currency transactions and interest and dividends received and are included in “Net realized gain (loss) on foreign currency transactions” on the
Statements of Operations. The portion of foreign currency gains and losses related to fluctuations in exchange rates between the initial purchase settlement date and subsequent sale trade date is included in
“Net realized gain (loss) on investments” on the Statements of Operations.
E. Offsetting on the
Statements of Assets and Liabilities
Offsetting assets and
liabilities requires entities to disclose both gross and net information about instruments and transactions eligible for offset on the Statements of Assets and Liabilities and disclose instruments and transactions
subject to master netting or similar agreements. These disclosure requirements are intended to help investors and other financial statement users better assess the effect or potential effect of offsetting arrangements
on a Fund’s financial position. The transactions subject to offsetting disclosures are derivative instruments, repurchase agreements and reverse repurchase agreements, and securities borrowing and securities
lending transactions.
This disclosure, if
applicable, is included within each Fund’s Portfolio of Investments under the heading “Offsetting Assets and Liabilities.” For financial reporting purposes, the Funds do not offset financial assets
and financial liabilities that are subject to master netting arrangements (“MNAs”) or similar agreements on the Statements of Assets and Liabilities. MNAs provide the right, in the
Notes to Financial Statements (Continued)
First Trust
Exchange-Traded AlphaDEX® Fund II
December 31, 2022
event of default (including bankruptcy
and insolvency), for the non-defaulting counterparty to liquidate the collateral and calculate the net exposure to the defaulting party or request additional collateral.
F. Securities
Lending
The Funds may lend
securities representing up to 33 1/3% of the value of their total assets to broker-dealers, banks and other institutions to generate additional income. When a Fund loans its portfolio securities, it will receive, at
the inception of each loan, collateral equal to at least 102% (for domestic securities) or 105% (for international securities) of the market value of the loaned securities. The collateral amount is valued at the
beginning of each business day and is compared to the market value of the loaned securities from the prior business day to determine if additional collateral is required. If additional collateral is required, a
request is sent to the borrower. Securities lending involves the risk that the Fund may lose money because the borrower of the Fund’s loaned securities fails to return the securities in a timely manner or at
all. The Fund could also lose money in the event of (i) a decline in the value of the collateral provided for the loaned securities, (ii) a decline in the value of any investments made with cash collateral or (iii) an
increase in the value of the loaned securities if the borrower does not increase the collateral accordingly and the borrower fails to return the securities. These events could also trigger adverse tax consequences for
the Funds.
Under the Funds’
Securities Lending Agency Agreement, the securities lending agent will generally bear the risk that a borrower may default on its obligation to return loaned securities. Brown Brothers Harriman & Co.
(“BBH”) acts as the Funds’ securities lending agent and is responsible for executing the lending of the portfolio securities to creditworthy borrowers. The Funds, however, will be responsible for the
risks associated with the investment of cash collateral. A Fund may lose money on its investment of cash collateral, which may affect its ability to repay the collateral to the borrower without the use of other Fund
assets. Each Fund that engages in securities lending receives compensation (net of any rebate and securities lending agent fees) for lending its securities. Compensation can be in the form of fees received from the
securities lending agent or dividends or interest earned from the investment of cash collateral. The fees received from the securities lending agent are accrued daily. The dividend and interest earned on the
securities loaned is accounted for in the same manner as other dividend and interest income. At December 31, 2022, FPA, FEP, FJP, FDT, FGM, FDTS, FEMS, and FEUZ had securities in the securities lending program. During
the fiscal year ended December 31, 2022, FPA, FEP, FCA, FJP, FDT, FEM, FGM, FDTS, FEMS and FEUZ participated in the securities lending program.
In the event of a default
by a borrower with respect to any loan, BBH will exercise any and all remedies provided under the applicable borrower agreement to make the Funds whole. These remedies include purchasing replacement securities by
applying the collateral held from the defaulting broker against the purchase cost of the replacement securities. If, despite such efforts by BBH to exercise these remedies, a Fund sustains losses as a result of a
borrower’s default, BBH will indemnify the Fund by purchasing replacement securities at its own expense, or paying the Funds an amount equal to the market value of the replacement securities, subject to certain
limitations which are set forth in detail in the Securities Lending Agency Agreement between the Trust on behalf of the Funds and BBH.
G. Repurchase
Agreements
Repurchase agreements
involve the purchase of securities subject to the seller’s agreement to repurchase the securities at a mutually agreed upon date and price, under the terms of a Master Repurchase Agreement (“MRA”).
During the term of a repurchase agreement, the value of the underlying securities held as collateral on behalf of a Fund, including accrued interest, is required to exceed the value of the repurchase agreement,
including accrued interest. The underlying securities for all repurchase agreements are held at the Funds’ custodian or designated sub-custodians under tri-party repurchase agreements.
MRAs govern transactions
between a Fund and select counterparties. The MRAs maintain provisions for, among other things, initiation, income payments, events of default, and maintenance of collateral for repurchase agreements.
Repurchase agreements
received for lending securities are collateralized by U.S. Treasury securities. The U.S. Treasury securities are held in a joint custody account at BBH on behalf of the Funds participating in the securities lending
program. In the event the counterparty defaults on the repurchase agreement, the U.S. Treasury securities can either be maintained as part of a Fund’s portfolio or sold for cash. A Fund could suffer a loss to
the extent that the proceeds from the sale of the underlying collateral held by the Fund are less than the repurchase price and the Fund’s costs associated with the delay and enforcement of the MRA.
While the Funds may
invest in repurchase agreements, any repurchase agreements held by the Funds during the fiscal year ended December 31, 2022, were received as collateral for lending securities. There were no repurchase agreements held
by the Funds as of December 31, 2022.
Notes to Financial Statements (Continued)
First Trust
Exchange-Traded AlphaDEX® Fund II
December 31, 2022
H. Dividends and
Distributions to Shareholders
Dividends from net
investment income, if any, are declared and paid quarterly by each Fund, or as the Board of Trustees may determine from time to time. Distributions of net realized capital gains earned by each Fund, if any, are
distributed at least annually. A Fund may also designate a portion of the amount paid to redeeming shareholders as a distribution for tax purposes.
Distributions from net
investment income and realized capital gains are determined in accordance with federal income tax regulations, which may differ from U.S. GAAP. Certain capital accounts in the financial statements are periodically
adjusted for permanent differences in order to reflect their tax character. These permanent differences are primarily due to the varying treatment of income and gain/loss on portfolio securities held by the Funds and
have no impact on net assets or NAV per share. Temporary differences, which arise from recognizing certain items of income, expense and gain/loss in different periods for financial statement and tax purposes, will
reverse at some time in the future.
The tax character of
distributions paid by each Fund during the fiscal year ended December 31, 2022, was as follows:
|
| Distributions
paid from
Ordinary
Income
|
| Distributions
paid from
Capital
Gains
|
| Distributions
paid from
Return of
Capital
|
First Trust Asia Pacific ex-Japan AlphaDEX® Fund
| $ 523,132
|
| $ —
|
| $ —
|
First Trust Europe AlphaDEX® Fund
| 9,500,812
|
| —
|
| —
|
First Trust Latin America AlphaDEX® Fund
| 2,717,117
|
| —
|
| —
|
First Trust Brazil AlphaDEX® Fund
| 1,187,607
|
| —
|
| —
|
First Trust China AlphaDEX® Fund
| 447,653
|
| —
|
| —
|
First Trust Japan AlphaDEX® Fund
| 908,402
|
| —
|
| —
|
First Trust Developed Markets ex-US AlphaDEX® Fund
| 8,989,980
|
| —
|
| —
|
First Trust Emerging Markets AlphaDEX® Fund
| 20,583,503
|
| —
|
| —
|
First Trust Germany AlphaDEX® Fund
| 1,006,869
|
| —
|
| —
|
First Trust United Kingdom AlphaDEX® Fund
| 2,909,539
|
| —
|
| —
|
First Trust India NIFTY 50 Equal Weight ETF
| 3,010,329
|
| 572,031
|
| —
|
First Trust Switzerland AlphaDEX® Fund
| 1,456,984
|
| —
|
| —
|
First Trust Developed Markets ex-US Small Cap AlphaDEX® Fund
| 304,718
|
| —
|
| —
|
First Trust Emerging Markets Small Cap AlphaDEX® Fund
| 5,878,163
|
| —
|
| —
|
First Trust Eurozone AlphaDEX® ETF
| 761,407
|
| —
|
| —
|
Notes to Financial Statements (Continued)
First Trust
Exchange-Traded AlphaDEX® Fund II
December 31, 2022
The tax character of
distributions paid by each Fund during the fiscal year ended December 31, 2021, was as follows:
|
| Distributions
paid from
Ordinary
Income
|
| Distributions
paid from
Capital
Gains
|
| Distributions
paid from
Return of
Capital
|
First Trust Asia Pacific ex-Japan AlphaDEX® Fund
| $ 1,196,923
|
| $ —
|
| $ —
|
First Trust Europe AlphaDEX® Fund
| 18,281,993
|
| —
|
| —
|
First Trust Latin America AlphaDEX® Fund
| 400,317
|
| —
|
| —
|
First Trust Brazil AlphaDEX® Fund
| 502,366
|
| —
|
| —
|
First Trust China AlphaDEX® Fund
| 517,232
|
| —
|
| —
|
First Trust Japan AlphaDEX® Fund
| 875,402
|
| —
|
| —
|
First Trust Developed Markets ex-US AlphaDEX® Fund
| 15,144,146
|
| —
|
| —
|
First Trust Emerging Markets AlphaDEX® Fund
| 19,810,512
|
| —
|
| —
|
First Trust Germany AlphaDEX® Fund
| 1,500,281
|
| —
|
| —
|
First Trust United Kingdom AlphaDEX® Fund
| 1,744,928
|
| —
|
| —
|
First Trust India NIFTY 50 Equal Weight ETF
| 824,801
|
| —
|
| —
|
First Trust Switzerland AlphaDEX® Fund
| 1,875,162
|
| —
|
| —
|
First Trust Developed Markets ex-US Small Cap AlphaDEX® Fund
| 347,513
|
| —
|
| —
|
First Trust Emerging Markets Small Cap AlphaDEX® Fund
| 8,877,525
|
| —
|
| —
|
First Trust Eurozone AlphaDEX® ETF
| 1,009,147
|
| —
|
| —
|
As of December 31, 2022,
the components of distributable earnings on a tax basis for each Fund were as follows:
|
| Undistributed
Ordinary
Income
|
| Accumulated
Capital and
Other
Gain (Loss)
|
| Net
Unrealized
Appreciation
(Depreciation)
|
| Other
|
First Trust Asia Pacific ex-Japan AlphaDEX® Fund
| $ —
|
| $ (15,930,099)
|
| $ (80,672)
|
| $ —
|
First Trust Europe AlphaDEX® Fund
| —
|
| (255,822,778)
|
| (26,554)
|
| 262,220
|
First Trust Latin America AlphaDEX® Fund
| 54,237
|
| (43,566,993)
|
| (4,465,626)
|
| —
|
First Trust Brazil AlphaDEX® Fund
| 394,076
|
| (27,521,574)
|
| (1,005,689)
|
| —
|
First Trust China AlphaDEX® Fund
| 1,060
|
| (7,303,369)
|
| (1,702,294)
|
| —
|
First Trust Japan AlphaDEX® Fund
| 263,987
|
| (55,011,790)
|
| (925,046)
|
| —
|
First Trust Developed Markets ex-US AlphaDEX® Fund
| 748,385
|
| (351,864,237)
|
| 12,285,100
|
| 148,488
|
First Trust Emerging Markets AlphaDEX® Fund
| 338
|
| (213,255,786)
|
| (11,162,711)
|
| —
|
First Trust Germany AlphaDEX® Fund
| —
|
| (30,493,437)
|
| (3,403,995)
|
| —
|
First Trust United Kingdom AlphaDEX® Fund
| 7,414
|
| (51,874,536)
|
| (7,305,770)
|
| —
|
First Trust India NIFTY 50 Equal Weight ETF
| —
|
| —
|
| 2,868,397
|
| —
|
First Trust Switzerland AlphaDEX® Fund
| 169,451
|
| (29,942,722)
|
| (188,120)
|
| —
|
First Trust Developed Markets ex-US Small Cap AlphaDEX® Fund
| —
|
| (5,545,476)
|
| 119,543
|
| —
|
First Trust Emerging Markets Small Cap AlphaDEX® Fund
| 375,099
|
| (44,354,948)
|
| 6,710,548
|
| —
|
First Trust Eurozone AlphaDEX® ETF
| —
|
| (22,211,805)
|
| (1,166,758)
|
| —
|
I. Income and Other
Taxes
Each Fund intends to
continue to qualify as a regulated investment company by complying with the requirements under Subchapter M of the Internal Revenue Code of 1986, as amended, which includes distributing substantially all of its net
investment income and net realized gains to shareholders. Accordingly, no provision has been made for federal and state income taxes. However, due to the timing and amount of distributions, each Fund may be subject to
an excise tax of 4% of the amount by which approximately 98% of each Fund’s taxable income exceeds the distributions from such taxable income for the calendar year.
Notes to Financial Statements (Continued)
First Trust
Exchange-Traded AlphaDEX® Fund II
December 31, 2022
Certain countries assess
a capital gains tax on securities sold in their local markets. This tax is accrued as the securities in these foreign markets appreciate in value and is paid at the time of sale to the extent a capital gain is
realized. Taxes accrued on securities in an unrealized appreciation position are included in “Net change in unrealized appreciation (depreciation) on deferred foreign capital gains tax” on the Statements
of Operations. The capital gains tax paid on securities sold is included in “Net realized gain (loss) on foreign capital gains tax” on the Statements of Operations.
India’s Finance
Bill, 2018 (“Finance Bill, 2018”) was enacted into law on March 29, 2018 and amongst other provisions, it introduced a long-term capital gains tax beginning April 1, 2018. Long-term capital gains on the
sale of listed shares in excess of INR 0.1 million are taxed at the rate of 10% (plus applicable surcharge and cess (which is a type of tax)) subject to satisfaction of certain conditions. Long-term capital gains
accruing as of January 31, 2018 are considered exempt due to a grandfather clause in the provision. The aforesaid exemption from long-term capital gains tax is available with respect to shares acquired between October
1, 2004 and March 31, 2018 only if on such acquisitions Securities Transaction Tax (“STT”) was chargeable. Certain exceptions in this regard, such as acquisition of shares in a public offer, bonus, rights
issued, etc. for which the condition of chargeability of STT on acquisition is not applicable, have been notified.
In the case of the sale
of listed shares held by a Fund for one year or less, the income is classified as short-term capital gains and is taxable at 15% (plus applicable surcharge and cess) provided the shares are sold on the stock exchange
and subjected to STT. For above purposes, the applicable rate of surcharge is 2% or 5% (depending on the level of income of the Fund). The Finance Bill, 2018 increases the cess imposed on the sum of tax and surcharge
from 3% to 4%. The cess 4% rate is applied to the capital gains tax, resulting in a higher effective rate of capital gains tax.
Where the sale of shares
is outside the stock exchange and not subject to STT, the long-term capital gains are taxed at 10% (plus applicable surcharge and cess) and short-term capital gains are taxed at 30% (plus applicable surcharge and
cess). The Finance Bill, 2018, approves the carry forward of long-term capital losses to be offset against long-term capital gains. Short-term losses can be netted against both short-term gains and long-term gains.
Until March 31, 2020,
dividends received by a Fund from Indian companies were exempt from tax in India because Indian companies were required to pay dividend distribution tax. The Indian Finance Act, 2020 has amended the dividend taxation
framework effective April 1, 2020 and accordingly dividends would now be taxable in the hands of the shareholders at 20%, plus applicable surcharge and cess. Subsequent to the Indian Finance Act, 2020, “The
Taxation and Other Laws (Relaxation and Amendment of Certain Provisions) Bill, 2020” (the “Bill”) was enacted into law and is effective retroactively to April 1, 2020. The Bill caps the maximum
surcharge at 15% of the tax on dividend income earned by the Fund. The highest effective tax rate proposed for non-corporate entities on dividends will be 23.92%. Note, the Fund will not obtain relief under the
US-India tax treaty as the treaty rate of 25% is higher than the domestic rate. Any excess taxes withheld can be off-set against capital gains tax liability during the year or claimed as a refund in the annual tax
return.
Please note that the
above description is based on current provisions of Indian law, and any change or modification made by subsequent legislation, regulation, or administrative or judicial decision could increase the Indian tax liability
of a Fund and thus reduce the return to a Fund’s shareholders. There can be no assurance that the Indian tax authorities and/or regulators will not take a position contrary to the views expressed herein. If the
Indian tax authorities and/or regulators take a position contrary to the views expressed herein, adverse unpredictable consequences may follow.
The Funds are subject to
accounting standards that establish a minimum threshold for recognizing, and a system for measuring, the benefits of a tax position taken or expected to be taken in a tax return. Taxable years ended 2019, 2020, 2021,
and 2022 remain open to federal and state audit. As of December 31, 2022, management has evaluated the application of these standards to the Funds and has determined that no provision for income tax is required in the
Funds’ financial statements for uncertain tax positions.
The Funds intend to
utilize provisions of the federal income tax laws, which allow them to carry a realized capital loss forward indefinitely following the year of the loss and offset such loss against any future realized capital gains.
The Funds are subject to certain limitations under U.S. tax rules on the use of capital loss carryforwards and net unrealized built-in losses. These limitations apply when there has been a 50% change in ownership. At
December 31, 2022, for federal income tax purposes, each applicable Fund had a capital loss carryforward available that is shown in the following table, to the extent provided by regulations, to offset future capital
gains.
Notes to Financial Statements (Continued)
First Trust
Exchange-Traded AlphaDEX® Fund II
December 31, 2022
|
| Non-Expiring
Capital Loss
Carryforward
|
First Trust Asia Pacific ex-Japan AlphaDEX® Fund
| $ 15,930,099
|
First Trust Europe AlphaDEX® Fund
| 255,822,778
|
First Trust Latin America AlphaDEX® Fund
| 43,566,993
|
First Trust Brazil AlphaDEX® Fund
| 27,521,574
|
First Trust China AlphaDEX® Fund
| 7,303,369
|
First Trust Japan AlphaDEX® Fund
| 55,011,790
|
First Trust Developed Markets ex-US AlphaDEX® Fund*
| 351,864,237
|
First Trust Emerging Markets AlphaDEX® Fund
| 213,255,786
|
First Trust Germany AlphaDEX® Fund
| 30,493,437
|
First Trust United Kingdom AlphaDEX® Fund
| 51,874,536
|
First Trust India NIFTY 50 Equal Weight ETF
| —
|
First Trust Switzerland AlphaDEX® Fund
| 29,942,722
|
First Trust Developed Markets ex-US Small Cap AlphaDEX® Fund
| 5,545,476
|
First Trust Emerging Markets Small Cap AlphaDEX® Fund
| 44,354,948
|
First Trust Eurozone AlphaDEX® ETF
| 22,211,805
|
* Of these losses,
$69,180,869 is subject to loss limitation resulting from reorganization activity. This limitation generally reduces the utilization of these losses to an additional amount of $96,428 per year.
Certain losses realized
during the current fiscal year may be deferred and treated as occurring on the first day of the following fiscal year for federal income tax purposes. For the fiscal year ended December 31, 2022, the Funds did not
defer any net ordinary losses.
In order to present
paid-in capital and accumulated distributable earnings (loss) (which consists of accumulated net investment income (loss), accumulated net realized gain (loss) on investments and net unrealized appreciation
(depreciation) on investments) on the Statements of Assets and Liabilities that more closely represent their tax character, certain adjustments have been made to paid-in capital, accumulated net investment income
(loss) and accumulated net realized gain (loss) on investments. These adjustments are primarily due to the difference between book and tax treatments of income and gains on various investment securities held by the
Funds and in-kind transactions. The results of operations and net assets were not affected by these adjustments. For the fiscal year ended December 31, 2022, the adjustments for each Fund were as follows:
|
| Accumulated
Net
Investment
Income (Loss)
|
| Accumulated
Net Realized
Gain (Loss)
on Investments
|
| Paid-in
Capital
|
First Trust Asia Pacific ex-Japan AlphaDEX® Fund
| $ 31,611
|
| $ (706,369)
|
| $ 674,758
|
First Trust Europe AlphaDEX® Fund
| 4,024,390
|
| 2,968,372
|
| (6,992,762)
|
First Trust Latin America AlphaDEX® Fund
| (282,536)
|
| 30,170
|
| 252,366
|
First Trust Brazil AlphaDEX® Fund
| (82,237)
|
| 89,857
|
| (7,620)
|
First Trust China AlphaDEX® Fund
| 142
|
| (142)
|
| —
|
First Trust Japan AlphaDEX® Fund
| 39,117
|
| 528,695
|
| (567,812)
|
First Trust Developed Markets ex-US AlphaDEX® Fund
| 395,376
|
| (1,585,847)
|
| 1,190,471
|
First Trust Emerging Markets AlphaDEX® Fund
| 138,454
|
| (25,605)
|
| (112,849)
|
First Trust Germany AlphaDEX® Fund
| 4,085
|
| 8,097,644
|
| (8,101,729)
|
First Trust United Kingdom AlphaDEX® Fund
| 253,022
|
| 3,401,784
|
| (3,654,806)
|
First Trust India NIFTY 50 Equal Weight ETF
| (569,909)
|
| 273,516
|
| 296,393
|
First Trust Switzerland AlphaDEX® Fund
| 184,817
|
| 2,556,225
|
| (2,741,042)
|
First Trust Developed Markets ex-US Small Cap AlphaDEX® Fund
| 44,661
|
| 15,340
|
| (60,001)
|
First Trust Emerging Markets Small Cap AlphaDEX® Fund
| 498,461
|
| 22,665
|
| (521,126)
|
First Trust Eurozone AlphaDEX® ETF
| 126,867
|
| 5,323,666
|
| (5,450,533)
|
Notes to Financial Statements (Continued)
First Trust
Exchange-Traded AlphaDEX® Fund II
December 31, 2022
As of December 31, 2022,
the aggregate cost, gross unrealized appreciation, gross unrealized depreciation, and net unrealized appreciation/(depreciation) on investments (including short positions and derivatives, if any) for federal income
tax purposes were as follows:
|
| Tax Cost
|
| Gross
Unrealized
Appreciation
|
| Gross
Unrealized
(Depreciation)
|
| Net Unrealized
Appreciation
(Depreciation)
|
First Trust Asia Pacific ex-Japan AlphaDEX® Fund
| $ 11,632,535
|
| $ 1,111,538
|
| $ (1,192,476)
|
| $ (80,938)
|
First Trust Europe AlphaDEX® Fund
| 254,221,451
|
| 28,293,682
|
| (28,007,951)
|
| 285,731
|
First Trust Latin America AlphaDEX® Fund
| 74,181,060
|
| 1,836,684
|
| (6,302,213)
|
| (4,465,529)
|
First Trust Brazil AlphaDEX® Fund
| 63,897,728
|
| 1,587,802
|
| (2,591,628)
|
| (1,003,826)
|
First Trust China AlphaDEX® Fund
| 9,247,318
|
| 445,956
|
| (2,148,227)
|
| (1,702,271)
|
First Trust Japan AlphaDEX® Fund
| 90,958,820
|
| 2,432,217
|
| (3,358,097)
|
| (925,880)
|
First Trust Developed Markets ex-US AlphaDEX® Fund
| 423,717,848
|
| 40,879,461
|
| (28,519,985)
|
| 12,359,476
|
First Trust Emerging Markets AlphaDEX® Fund
| 381,919,545
|
| 45,583,283
|
| (56,331,961)
|
| (10,748,678)
|
First Trust Germany AlphaDEX® Fund
| 17,596,478
|
| 774,085
|
| (4,176,507)
|
| (3,402,422)
|
First Trust United Kingdom AlphaDEX® Fund
| 38,870,177
|
| 1,496,967
|
| (8,801,550)
|
| (7,304,583)
|
First Trust India NIFTY 50 Equal Weight ETF
| 71,153,762
|
| 5,631,242
|
| (1,912,875)
|
| 3,718,367
|
First Trust Switzerland AlphaDEX® Fund
| 97,172,016
|
| 3,133,442
|
| (3,330,563)
|
| (197,121)
|
First Trust Developed Markets ex-US Small Cap AlphaDEX® Fund
| 7,419,156
|
| 818,639
|
| (698,073)
|
| 120,566
|
First Trust Emerging Markets Small Cap AlphaDEX® Fund
| 162,179,362
|
| 21,647,305
|
| (14,938,842)
|
| 6,708,463
|
First Trust Eurozone AlphaDEX® ETF
| 17,358,244
|
| 1,351,007
|
| (2,508,289)
|
| (1,157,282)
|
J. Expenses
Expenses that are
directly related to the Funds are charged to First Trust pursuant to the Investment Management Agreement, with the exception of the advisory fees, Rule 12b-1 distribution and service fees, if any, brokerage expenses,
taxes, interest, acquired fund fees and expenses, and extraordinary expenses, which are paid by each respective Fund.
First Trust Portfolios
L.P. (“FTP”) has entered into licensing agreements with Nasdaq (“Licensor”) for all the Funds except NFTY and with NSE Indices Limited (“NSE”) for NFTY (Nasdaq and NSE collectively,
the “Licensors”). The respective license agreements allow for the use by First Trust of each Fund’s respective index and of certain trademarks and trade names of the Licensors. The Funds are
sub-licensees to the applicable license agreements.
3. Investment
Advisory Fee, Affiliated Transactions and Other Fee Arrangements
First Trust, the
investment advisor to the Funds, is a limited partnership with one limited partner, Grace Partners of DuPage L.P., and one general partner, The Charger Corporation. The Charger Corporation is an Illinois corporation
controlled by James A. Bowen, Chief Executive Officer of First Trust. First Trust is responsible for the selection and ongoing monitoring of the securities in each Fund’s portfolio, managing the Funds’
business affairs and providing certain administrative services necessary for the management of the Funds.
First Trust is paid an
annual unitary management fee for each Fund. First Trust is responsible for the expenses of each Fund including the cost of transfer agency, custody, fund administration, licensing fees, legal, audit and other
services, but excluding fee payments under the Investment Management Agreement, Rule 12b-1 distribution and service fees, if any, brokerage expenses, taxes, interest, acquired fund fees and expenses, and extraordinary
expenses, which are paid by each respective Fund. Effective November 1, 2022, the annual unitary management fee payable by each Fund to First Trust for these services will be reduced at certain levels of each
Fund’s net assets (“breakpoints”) and calculated pursuant to the following schedule:
Notes to Financial Statements (Continued)
First Trust
Exchange-Traded AlphaDEX® Fund II
December 31, 2022
| Breakpoints
|
|
| Fund net assets up to and including $2.5 billion
| 0.80%
|
| Fund net assets greater than $2.5 billion up to and including $5 billion
| 0.78%
|
| Fund net assets greater than $5 billion up to and including $7.5 billion
| 0.76%
|
| Fund net assets greater than $7.5 billion up to and including $10 billion
| 0.74%
|
| Fund net assets greater than $10 billion
| 0.72%
|
Prior to November 1,
2022, each Fund paid First Trust an annual unitary management fee equal to 0.80% of the Fund’s average daily net assets. First Trust also provides fund reporting services to the Funds for a flat annual fee in
the amount of $9,250, which is covered under the annual unitary management fee.
The Trust has multiple
service agreements with BBH. Under the service agreements, BBH performs custodial, fund accounting, certain administrative services, and transfer agency services for the Funds. As custodian, BBH is responsible for
custody of each Fund’s assets. As fund accountant and administrator, BBH is responsible for maintaining the books and records of each Fund’s securities and cash. As transfer agent, BBH is responsible for
maintaining shareholder records for each Fund.
Each Trustee who is not
an officer or employee of First Trust, any sub-advisor or any of their affiliates (“Independent Trustees”) is paid a fixed annual retainer that is allocated equally among each fund in the First Trust Fund
Complex. Each Independent Trustee is also paid an annual per fund fee that varies based on whether the fund is a closed-end or other actively managed fund, a target outcome fund or an index fund.
Additionally, the Lead
Independent Trustee and the Chairs of the Audit Committee, Nominating and Governance Committee and Valuation Committee are paid annual fees to serve in such capacities, with such compensation allocated pro rata among
each fund in the First Trust Fund Complex based on net assets. Independent Trustees are reimbursed for travel and out-of-pocket expenses in connection with all meetings. The Lead Independent Trustee and Committee
Chairs rotate every three years. The officers and “Interested” Trustee receive no compensation from the Trust for acting in such capacities.
4. Purchases and
Sales of Securities
For the fiscal year ended
December 31, 2022, the cost of purchases and proceeds from sales of investment securities for each Fund, excluding short-term investments and in-kind transactions, were as follows:
|
| Purchases
|
| Sales
|
| First Trust Asia Pacific ex-Japan AlphaDEX® Fund
| $ 11,771,294
|
| $ 16,604,249
|
| First Trust Europe AlphaDEX® Fund
| 324,728,576
|
| 325,949,925
|
| First Trust Latin America AlphaDEX® Fund
| 88,728,132
|
| 40,574,476
|
| First Trust Brazil AlphaDEX® Fund
| 68,079,908
|
| 16,297,973
|
| First Trust China AlphaDEX® Fund
| 9,998,867
|
| 10,014,457
|
| First Trust Japan AlphaDEX® Fund
| 29,116,906
|
| 28,071,503
|
| First Trust Developed Markets ex-US AlphaDEX® Fund
| 406,135,369
|
| 390,288,290
|
| First Trust Emerging Markets AlphaDEX® Fund
| 401,240,601
|
| 381,914,699
|
| First Trust Germany AlphaDEX® Fund
| 52,876,576
|
| 53,352,012
|
| First Trust United Kingdom AlphaDEX® Fund
| 63,343,456
|
| 63,899,541
|
| First Trust India NIFTY 50 Equal Weight ETF
| 44,625,212
|
| 30,757,949
|
| First Trust Switzerland AlphaDEX® Fund
| 42,041,789
|
| 42,021,198
|
| First Trust Developed Markets ex-US Small Cap AlphaDEX® Fund
| 10,373,917
|
| 11,221,351
|
| First Trust Emerging Markets Small Cap AlphaDEX® Fund
| 169,284,904
|
| 153,322,823
|
| First Trust Eurozone AlphaDEX® ETF
| 19,492,241
|
| 19,779,083
|
|
|
|
|
|
Notes to Financial Statements (Continued)
First Trust
Exchange-Traded AlphaDEX® Fund II
December 31, 2022
For the fiscal year ended
December 31, 2022, the cost of in-kind purchases and proceeds from in-kind sales for each Fund were as follows:
|
| Purchases
|
| Sales
|
| First Trust Asia Pacific ex-Japan AlphaDEX® Fund
| $ —
|
| $ 5,832,950
|
| First Trust Europe AlphaDEX® Fund
| 12,346,168
|
| 191,062,366
|
| First Trust Latin America AlphaDEX® Fund
| 22,453,672
|
| 1,581,525
|
| First Trust Brazil AlphaDEX® Fund
| 18,879
|
| 19,156
|
| First Trust China AlphaDEX® Fund
| —
|
| —
|
| First Trust Japan AlphaDEX® Fund
| 60,430,379
|
| 5,592,964
|
| First Trust Developed Markets ex-US AlphaDEX® Fund
| 98,817,512
|
| 10,623,408
|
| First Trust Emerging Markets AlphaDEX® Fund
| 21,588,360
|
| 22,987,223
|
| First Trust Germany AlphaDEX® Fund
| 2,229,794
|
| 66,662,523
|
| First Trust United Kingdom AlphaDEX® Fund
| 8,365,113
|
| 46,729,983
|
| First Trust India NIFTY 50 Equal Weight ETF
| —
|
| —
|
| First Trust Switzerland AlphaDEX® Fund
| 61,247,470
|
| 41,529,086
|
| First Trust Developed Markets ex-US Small Cap AlphaDEX® Fund
| —
|
| 3,226,331
|
| First Trust Emerging Markets Small Cap AlphaDEX® Fund
| 20,626,700
|
| 8,388,364
|
| First Trust Eurozone AlphaDEX® ETF
| —
|
| 51,696,000
|
5. Creations,
Redemptions and Transaction Fees
Each Fund generally
issues and redeems its shares in primary market transactions through a creation and redemption mechanism and does not sell or redeem individual shares. Instead, financial entities known as “Authorized
Participants” have contractual arrangements with a Fund or one of the Fund’s service providers to purchase and redeem Fund shares directly with the Fund in large blocks of shares known as “Creation
Units.” Prior to start of trading on every business day, a Fund publishes through the National Securities Clearing Corporation (“NSCC”) the “basket” of securities, cash or other assets
that it will accept in exchange for a Creation Unit of the Fund’s shares. An Authorized Participant that wishes to effectuate a creation of a Fund’s shares deposits with the Fund the “basket”
of securities, cash or other assets identified by the Fund that day, and then receives the Creation Unit of the Fund’s shares in return for those assets. After purchasing a Creation Unit, the Authorized
Participant may continue to hold the Fund’s shares or sell them in the secondary market. The redemption process is the reverse of the purchase process: the authorized participant redeems a Creation Unit of a
Fund’s shares for a basket of securities, cash or other assets. The combination of the creation and redemption process with secondary market trading in a Fund’s shares and underlying securities provides
arbitrage opportunities that are designed to help keep the market price of a Fund’s shares at or close to the NAV per share of the Fund.
Each Fund imposes fees in
connection with the purchase of Creation Units. These fees may vary based upon various facts-based circumstances, including, but not limited to, the composition of the securities included in the Creation Unit or the
countries in which the transactions are settled. The price for each Creation Unit will equal the daily NAV per share of a Fund times the number of shares in a Creation Unit, plus the fees described above and, if
applicable, any operational processing and brokerage costs, transfer fees, stamp taxes and part or all of the spread between the expected bid and offer side of the market related to the securities comprising the
creation basket.
Each Fund also imposes
fees in connection with the redemption of Creation Units. These fees may vary based upon various facts-based circumstances, including, but not limited to, the composition of the securities included in the Creation
Unit or the countries in which the transactions are settled. The price received for each Creation Unit will equal the daily NAV per share of a Fund times the number of shares in a Creation Unit, minus the fees
described above and, if applicable, any operational processing and brokerage costs, transfer fees, stamp taxes and part or all of the spread between the expected bid and offer side of the market related to the
securities comprising the redemption basket. Investors who use the services of a broker or other such intermediary in addition to an Authorized Participant to effect a redemption of a Creation Unit may also be
assessed an amount to cover the cost of such services. The redemption fee charged by a Fund will comply with Rule 22c-2 of the 1940 Act which limits redemption fees to no more than 2% of the value of the shares
redeemed.
Notes to Financial Statements (Continued)
First Trust
Exchange-Traded AlphaDEX® Fund II
December 31, 2022
6. Distribution
Plan
The Board of Trustees
adopted a Distribution and Service Plan pursuant to Rule 12b-1 under the 1940 Act. In accordance with the Rule 12b-1 plan, each Fund is authorized to pay an amount up to 0.25% of its average daily net assets each year
to reimburse FTP, the distributor of the Funds, for amounts expended to finance activities primarily intended to result in the sale of Creation Units or to provide investor services. FTP may also use this amount to
compensate securities dealers or other persons that are Authorized Participants for providing distribution assistance, including broker-dealer and shareholder support and educational and promotional services.
No 12b-1 fees are
currently paid by the Funds, and pursuant to a contractual arrangement, no 12b-1 fees will be paid any time before April 30, 2024.
7. Indemnification
The Trust, on behalf of
the Funds, has a variety of indemnification obligations under contracts with its service providers. The Trust’s maximum exposure under these arrangements is unknown. However, the Trust has not had prior claims
or losses pursuant to these contracts and expects the risk of loss to be remote.
8. Subsequent
Events
Management has evaluated
the impact of all subsequent events to the Funds through the date the financial statements were issued and has determined that there were no subsequent events requiring recognition or disclosure in the financial
statements that have not already been disclosed.
Report of Independent
Registered Public Accounting Firm
To the Shareholders and the
Board of Trustees of First Trust Exchange-Traded AlphaDEX® Fund II:
Opinion on the Financial
Statements and Financial Highlights
We have audited the
accompanying statements of assets and liabilities of First Trust Asia Pacific ex-Japan AlphaDEX® Fund, First Trust Europe AlphaDEX® Fund, First Trust Latin America AlphaDEX® Fund, First Trust Brazil AlphaDEX® Fund, First Trust China AlphaDEX® Fund, First Trust Japan AlphaDEX® Fund, First Trust Developed Markets ex-US AlphaDEX® Fund, First Trust Emerging Markets AlphaDEX® Fund, First Trust Germany AlphaDEX® Fund, First Trust United Kingdom AlphaDEX® Fund, First Trust India NIFTY 50 Equal Weight ETF, First Trust Switzerland AlphaDEX® Fund, First Trust Developed Markets ex-US Small Cap AlphaDEX® Fund, First Trust Emerging Markets Small Cap AlphaDEX® Fund, and First Trust Eurozone AlphaDEX® ETF (the “Funds”), each a series of First Trust Exchange-Traded AlphaDEX® Fund II, including the portfolios of investments, as of December 31, 2022, the related statements of operations for the year then ended, the
statements of changes in net assets for each of the two years in the period then ended, the financial highlights for each of the five years in the period then ended, and the related notes. In our opinion, the
financial statements and financial highlights present fairly, in all material respects, the financial position of each of the Funds as of December 31, 2022, and the results of their operations for the year then ended,
the changes in their net assets for each of the two years in the period then ended, and the financial highlights for each of the five years in the period then ended in conformity with accounting principles generally
accepted in the United States of America.
Basis for Opinion
These financial
statements and financial highlights are the responsibility of the Funds’ management. Our responsibility is to express an opinion on the Funds’ financial statements and financial highlights based on our
audits. We are a public accounting firm registered with the Public Company Accounting Oversight Board (United States) (PCAOB) and are required to be independent with respect to the Funds in accordance with the U.S.
federal securities laws and the applicable rules and regulations of the Securities and Exchange Commission and the PCAOB.
We conducted our audits
in accordance with the standards of the PCAOB. Those standards require that we plan and perform the audit to obtain reasonable assurance about whether the financial statements and financial highlights are free of
material misstatement, whether due to error or fraud. The Funds are not required to have, nor were we engaged to perform, an audit of their internal control over financial reporting. As part of our audits we are
required to obtain an understanding of internal control over financial reporting but not for the purpose of expressing an opinion on the effectiveness of the Funds’ internal control over financial reporting.
Accordingly, we express no such opinion.
Our audits included
performing procedures to assess the risks of material misstatement of the financial statements and financial highlights, whether due to error or fraud, and performing procedures that respond to those risks. Such
procedures included examining, on a test basis, evidence regarding the amounts and disclosures in the financial statements and financial highlights. Our audits also included evaluating the accounting principles used
and significant estimates made by management, as well as evaluating the overall presentation of the financial statements and financial highlights. Our procedures included confirmation of securities owned as of
December 31, 2022, by correspondence with the custodian and brokers; when replies were not received from brokers, we performed other auditing procedures. We believe that our audits provide a reasonable basis for our
opinion.
Chicago, Illinois
February 23, 2023
We have served as the
auditor of one or more First Trust investment companies since 2001.
Additional Information
First Trust
Exchange-Traded AlphaDEX® Fund II
December 31, 2022
(Unaudited)
Proxy Voting Policies
and Procedures
A description of the
policies and procedures that the Trust uses to determine how to vote proxies and information on how each Fund voted proxies relating to portfolio investments during the most recent 12-month period ended June 30 is
available (1) without charge, upon request, by calling (800) 988-5891; (2) on each Fund’s website at www.ftportfolios.com; and (3) on the Securities and Exchange Commission’s (“SEC”) website at www.sec.gov.
Portfolio Holdings
Each Fund files portfolio
holdings information for each month in a fiscal quarter within 60 days after the end of the relevant fiscal quarter on Form N-PORT. Portfolio holdings information for the third month of each fiscal quarter will be
publicly available on the SEC’s website at www.sec.gov. Each Fund’s complete schedule of portfolio holdings for the second and fourth quarters of each fiscal year is included in the semi-annual and
annual reports to shareholders, respectively, and is filed with the SEC on Form N-CSR. The semi-annual and annual report for each Fund is available to investors within 60 days after the period to which it relates.
Each Fund’s Forms N-PORT and Forms N-CSR are available on the SEC’s website listed above.
Federal Tax
Information
For the taxable year
ended December 31, 2022, the First Trust India NIFTY 50 Equal Weight ETF (“NFTY”) designated $296,393, or amounts necessary, as long-term capital gain. During the tax year, NFTY shareholders redeemed
amounts in excess of the long-term capital gain and of these proceeds, $296,393, or amounts necessary, represents long-term capital gain.
Long-term capital gain
distributions designated by NFTY are taxable at the applicable capital gain tax rates for federal income tax purposes. For the taxable year ended December 31, 2022, NFTY designated long-term capital gain distributions
of $572,031.
For the taxable year
ended December 31, 2022, none of the income dividends paid by the Funds qualify for the dividends received deduction available to corporations.
For the taxable year
ended December 31, 2022, the following percentages of income dividends paid by the Funds are hereby designated as qualified dividend income:
|
| Qualified
Dividend Income
|
First Trust Asia Pacific ex-Japan AlphaDEX® Fund
| 85.69%
|
First Trust Europe AlphaDEX® Fund
| 100.00%
|
First Trust Latin America AlphaDEX® Fund
| 8.55%
|
First Trust Brazil AlphaDEX® Fund
| 0.00%
|
First Trust China AlphaDEX® Fund
| 77.03%
|
First Trust Japan AlphaDEX® Fund
| 74.16%
|
First Trust Developed Markets ex-US AlphaDEX® Fund
| 100.00%
|
First Trust Emerging Markets AlphaDEX® Fund
| 55.85%
|
First Trust Germany AlphaDEX® Fund
| 100.00%
|
First Trust United Kingdom AlphaDEX® Fund
| 100.00%
|
First Trust India NIFTY 50 Equal Weight ETF
| 36.28%
|
First Trust Switzerland AlphaDEX® Fund
| 100.00%
|
First Trust Developed Markets ex-US Small Cap AlphaDEX® Fund
| 76.18%
|
First Trust Emerging Markets Small Cap AlphaDEX® Fund
| 35.60%
|
First Trust Eurozone AlphaDEX® ETF
| 100.00%
|
Additional Information (Continued)
First Trust
Exchange-Traded AlphaDEX® Fund II
December 31, 2022
(Unaudited)
The following Funds met
the requirements of Section 853 of the Internal Revenue Code of 1986, as amended, and elect to pass through to their shareholders credit for foreign taxes paid. For the taxable year ended December 31, 2022, the total
amount of income received by the Funds from sources within foreign countries and possessions of the United States and of taxes paid to such countries are as follows:
|
| Gross Foreign Income
|
| Foreign Taxes Paid
|
|
| Amount
|
| Per Share
|
| Amount
|
| Per Share
|
First Trust Asia Pacific ex-Japan AlphaDEX® Fund
| $655,144
|
| $1.46
|
| $57,340
|
| $0.13
|
First Trust Europe AlphaDEX® Fund
| 13,081,623
|
| 1.67
|
| 1,191,230
|
| 0.15
|
First Trust Latin America AlphaDEX® Fund
| 3,776,359
|
| 0.90
|
| 424,820
|
| 0.10
|
First Trust Brazil AlphaDEX® Fund
| 1,537,370
|
| 0.26
|
| 97,722
|
| 0.02
|
First Trust China AlphaDEX® Fund
| 546,240
|
| 1.56
|
| 37,451
|
| 0.11
|
First Trust Japan AlphaDEX® Fund
| 1,051,039
|
| 0.53
|
| 105,104
|
| 0.05
|
First Trust Developed Markets ex-US AlphaDEX® Fund
| 14,300,117
|
| 1.65
|
| 1,363,305
|
| 0.16
|
First Trust Emerging Markets AlphaDEX® Fund
| 27,152,373
|
| 1.54
|
| 3,620,633
|
| 0.21
|
First Trust Germany AlphaDEX® Fund
| 1,154,122
|
| 2.89
|
| 151,214
|
| 0.38
|
First Trust United Kingdom AlphaDEX® Fund
| 3,259,314
|
| 3.26
|
| 2,580
|
| 0.00*
|
First Trust India NIFTY 50 Equal Weight ETF
| 1,009,264
|
| 0.59
|
| 917,690
|
| 0.54
|
First Trust Switzerland AlphaDEX® Fund
| 2,300,476
|
| 1.28
|
| 279,705
|
| 0.16
|
First Trust Developed Markets ex-US Small Cap AlphaDEX® Fund
| 383,339
|
| 1.92
|
| 36,565
|
| 0.18
|
First Trust Emerging Markets Small Cap AlphaDEX® Fund
| 7,437,518
|
| 1.73
|
| 752,659
|
| 0.18
|
First Trust Eurozone AlphaDEX® ETF
| 1,011,609
|
| 2.25
|
| 124,631
|
| 0.28
|
* Rate per share is less
than $0.01.
Risk Considerations
Risks are inherent in all
investing. Certain general risks that may be applicable to a Fund are identified below, but not all of the material risks relevant to each Fund are included in this report and not all of the risks below apply to each
Fund. The material risks of investing in each Fund are spelled out in its prospectus, statement of additional information and other regulatory filings. Before investing, you should consider each Fund’s
investment objective, risks, charges and expenses, and read each Fund’s prospectus and statement of additional information carefully. You can download each Fund’s prospectus at www.ftportfolios.com or
contact First Trust Portfolios L.P. at (800) 621-1675 to request a prospectus, which contains this and other information about each Fund.
Concentration Risk. To the extent that a fund is able to invest a significant percentage of its assets in a single asset class or the securities of issuers within the same country, state, region, industry or
sector, an adverse economic, business or political development may affect the value of the fund’s investments more than if the fund were more broadly diversified. A fund that tracks an index will be concentrated
to the extent the fund’s corresponding index is concentrated. A concentration makes a fund more susceptible to any single occurrence and may subject the fund to greater market risk than a fund that is more
broadly diversified.
Credit Risk. Credit risk is the risk that an issuer of a security will be unable or unwilling to make dividend, interest and/or principal payments when due and the related risk that the value of a
security may decline because of concerns about the issuer’s ability to make such payments.
Cyber Security Risk. The funds are susceptible to potential operational risks through breaches in cyber security. A breach in cyber security refers to both intentional and unintentional events that may cause a
fund to lose proprietary information, suffer data corruption or lose operational capacity. Such events could cause a fund to incur regulatory penalties, reputational damage, additional compliance costs associated with
corrective measures and/or financial loss. In addition, cyber security breaches of a fund’s third-party service providers, such as its administrator, transfer agent, custodian, or sub-advisor, as applicable, or
issuers in which the fund invests, can also subject a fund to many of the same risks associated with direct cyber security breaches.
Defined Outcome Funds
Risk. To the extent a fund’s investment strategy is designed to deliver returns tied to the price performance of an underlying ETF, an investor may not realize the returns the fund seeks
to achieve if that investor does not hold shares for the entire target outcome period. In the event an investor purchases shares after the first day of the target outcome period or sells shares prior to the end of the
target outcome period, the buffer that the fund seeks to provide against a decline in the value of the underlying
Additional Information (Continued)
First Trust
Exchange-Traded AlphaDEX® Fund II
December 31, 2022
(Unaudited)
ETF may not be available, the enhanced
returns that the fund seeks to provide (if any) may not be available and the investor may not participate in a gain in the value of the underlying ETF up to the cap for the investor’s investment period.
Additionally, the fund will not participate in gains of the underlying ETF above the cap and a shareholder may lose their entire investment. If the fund seeks enhanced returns, there are certain time periods when the
value of the fund may fall faster than the value of the underlying ETF, and it is very unlikely that, on any given day during which the underlying ETF share price increases in value, the fund’s share price will
increase at the same rate as the enhanced returns sought by the fund, which is designed for an entire target outcome period. Trading flexible exchange options involves risks different from, or possibly greater than,
the risks associated with investing directly in securities, such as less liquidity and correlation and valuation risks. A fund may experience substantial downside from specific flexible exchange option positions and
certain positions may expire worthless.
Derivatives Risk. To the extent a fund uses derivative instruments such as futures contracts, options contracts and swaps, the fund may experience losses because of adverse movements in the price or value
of the underlying asset, index or rate, which may be magnified by certain features of the derivative. These risks are heightened when a fund’s portfolio managers use derivatives to enhance the fund’s
return or as a substitute for a position or security, rather than solely to hedge (or offset) the risk of a position or security held by the fund.
Equity Securities
Risk. To the extent a fund invests in equity securities, the value of the fund’s shares will fluctuate with changes in the value of the equity securities. Equity securities prices
fluctuate for several reasons, including changes in investors’ perceptions of the financial condition of an issuer or the general condition of the relevant stock market, such as market volatility, or when
political or economic events affecting the issuers occur. In addition, common stock prices may be particularly sensitive to rising interest rates, as the cost of capital rises and borrowing costs increase. Equity
securities may decline significantly in price over short or extended periods of time, and such declines may occur in the equity market as a whole, or they may occur in only a particular country, company, industry or
sector of the market.
ETF Risk. The shares of an ETF trade like common stock and represent an interest in a portfolio of securities. The risks of owning an ETF generally reflect the risks of owning the underlying
securities, although lack of liquidity in an ETF could result in it being more volatile and ETFs have management fees that increase their costs. Shares of an ETF trade on an exchange at market prices rather than net
asset value, which may cause the shares to trade at a price greater than net asset value (premium) or less than net asset value (discount). In times of market stress, decisions by market makers to reduce or step away
from their role of providing a market for an ETF’s shares, or decisions by an ETF’s authorized participants that they are unable or unwilling to proceed with creation and/or redemption orders of an
ETF’s shares, could result in shares of the ETF trading at a discount to net asset value and in greater than normal intraday bid-ask spreads.
Fixed Income Securities
Risk. To the extent a fund invests in fixed income securities, the fund will be subject to credit risk, income risk, interest rate risk, liquidity risk and prepayment risk. Income risk is the
risk that income from a fund’s fixed income investments could decline during periods of falling interest rates. Interest rate risk is the risk that the value of a fund’s fixed income securities will
decline because of rising interest rates. Liquidity risk is the risk that a security cannot be purchased or sold at the time desired, or cannot be purchased or sold without adversely affecting the price. Prepayment
risk is the risk that the securities will be redeemed or prepaid by the issuer, resulting in lower interest payments received by the fund. In addition to these risks, high yield securities, or “junk”
bonds, are subject to greater market fluctuations and risk of loss than securities with higher ratings, and the market for high yield securities is generally smaller and less liquid than that for investment grade
securities.
Index or Model Constituent
Risk. Certain funds may be a constituent of one or more indices or ETF models. As a result, such a fund may be included in one or more index-tracking exchange-traded funds or mutual funds. Being
a component security of such a vehicle could greatly affect the trading activity involving a fund, the size of the fund and the market volatility of the fund. Inclusion in an index could increase demand for the fund
and removal from an index could result in outsized selling activity in a relatively short period of time. As a result, a fund’s net asset value could be negatively impacted and the fund’s market price may
be significantly below its net asset value during certain periods. In addition, index rebalances may potentially result in increased trading activity in a fund’s shares.
Index Provider Risk. To the extent a fund seeks to track an index, it is subject to Index Provider Risk. There is no assurance that the Index Provider will compile the Index accurately, or that the Index will
be determined, maintained, constructed, reconstituted, rebalanced, composed, calculated or disseminated accurately. To correct any such error, the Index Provider may carry out an unscheduled rebalance or other
modification of the Index constituents or weightings, which may increase the fund’s costs. The Index Provider does not provide any representation or warranty in relation to the quality, accuracy or completeness
of data in the Index, and it does not guarantee that the Index will be calculated in accordance with its stated methodology. Losses or costs associated with any Index Provider errors generally will be borne by the
fund and its shareholders.
Additional Information (Continued)
First Trust
Exchange-Traded AlphaDEX® Fund II
December 31, 2022
(Unaudited)
Investment Companies
Risk. To the extent a fund invests in the securities of other investment vehicles, the fund will incur additional fees and expenses that would not be present in a direct investment in those
investment vehicles. Furthermore, the fund’s investment performance and risks are directly related to the investment performance and risks of the investment vehicles in which the fund invests.
LIBOR Risk. To the extent a fund invests in floating or variable rate obligations that use the London Interbank Offered Rate (“LIBOR”) as a reference interest rate, it is subject to LIBOR
Risk. The United Kingdom’s Financial Conduct Authority, which regulates LIBOR has ceased making LIBOR available as a reference rate over a phase-out period that began December 31, 2021. There is no assurance
that any alternative reference rate, including the Secured Overnight Financing Rate (“SOFR”) will be similar to or produce the same value or economic equivalence as LIBOR or that instruments using an
alternative rate will have the same volume or liquidity. The unavailability or replacement of LIBOR may affect the value, liquidity or return on certain fund investments and may result in costs incurred in connection
with closing out positions and entering into new trades. Any potential effects of the transition away from LIBOR on the fund or on certain instruments in which the fund invests can be difficult to ascertain, and they
may vary depending on a variety of factors, and they could result in losses to the fund.
Management Risk. To the extent that a fund is actively managed, it is subject to management risk. In managing an actively-managed fund’s investment portfolio, the fund’s portfolio managers will
apply investment techniques and risk analyses that may not have the desired result. There can be no guarantee that a fund will meet its investment objective.
Market Risk. Market risk is the risk that a particular security, or shares of a fund in general, may fall in value. Securities held by a fund, as well as shares of a fund itself, are subject to
market fluctuations caused by factors such as general economic conditions, political events, regulatory or market developments, changes in interest rates and perceived trends in securities prices. Shares of
a fund could decline in value or underperform other investments as a result of the risk of loss associated with these market fluctuations. In addition, local, regional or global events such as war, acts of
terrorism, spread of infectious diseases or other public health issues, recessions, or other events could have a significant negative impact on a fund and its investments. Such events may affect certain
geographic regions, countries, sectors and industries more significantly than others. In February 2022, Russia invaded Ukraine which has caused and could continue to cause significant market disruptions and
volatility within the markets in Russia, Europe, and the United States. The hostilities and sanctions resulting from those hostilities could have a significant impact on certain fund investments as well as
fund performance. The COVID-19 global pandemic and the ensuing policies enacted by governments and central banks have caused and may continue to cause significant volatility and uncertainty in global
financial markets. While the U.S. has resumed “reasonably” normal business activity, many countries continue to impose lockdown measures. Additionally, there is no guarantee that vaccines will be
effective against emerging variants of the disease. These events also adversely affect the prices and liquidity of a fund’s portfolio securities or other instruments and could result in disruptions in the
trading markets. Any of such circumstances could have a materially negative impact on the value of a fund’s shares and result in increased market volatility. During any such events, a fund’s
shares may trade at increased premiums or discounts to their net asset value and the bid/ask spread on a fund’s shares may widen.
Non-U.S. Securities
Risk. To the extent a fund invests in non-U.S. securities, it is subject to additional risks not associated with securities of domestic issuers. Non-U.S. securities are subject to higher
volatility than securities of domestic issuers due to: possible adverse political, social or economic developments; restrictions on foreign investment or exchange of securities; capital controls; lack of liquidity;
currency exchange rates; excessive taxation; government seizure of assets; the imposition of sanctions by foreign governments; different legal or accounting standards; and less government supervision and regulation of
exchanges in foreign countries. Investments in non-U.S. securities may involve higher costs than investments in U.S. securities, including higher transaction and custody costs, as well as additional taxes imposed by
non-U.S. governments. These risks may be heightened for securities of companies located, or with significant operations, in emerging market countries.
Operational Risk. Each fund is subject to risks arising from various operational factors, including, but not limited to, human error, processing and communication errors, errors of a fund’s service
providers, counterparties or other third-parties, failed or inadequate processes and technology or systems failures. Each fund relies on third-parties for a range of services, including custody. Any delay or failure
relating to engaging or maintaining such service providers may affect a fund’s ability to meet its investment objective. Although the funds and the funds’ investment advisor seek to reduce these
operational risks through controls and procedures, there is no way to completely protect against such risks.
Passive Investment
Risk. To the extent a fund seeks to track an index, the fund will invest in the securities included in, or representative of, the index regardless of their investment merit. A fund generally
will not attempt to take defensive positions in declining markets.
Preferred Securities
Risk. Preferred securities combine some of the characteristics of both common stocks and bonds. Preferred securities are typically subordinated to bonds and other debt securities in a
company’s capital structure in terms of priority to corporate income, subjecting them to greater credit risk than those debt securities. Generally, holders of preferred securities have no voting rights
Additional Information (Continued)
First Trust
Exchange-Traded AlphaDEX® Fund II
December 31, 2022
(Unaudited)
with respect to the issuing company
unless preferred dividends have been in arrears for a specified number of periods, at which time the preferred security holders may obtain limited rights. In certain circumstances, an issuer of preferred securities
may defer payment on the securities and, in some cases, redeem the securities prior to a specified date. Preferred securities may also be substantially less liquid than other securities, including common stock.
Valuation Risk. The valuation of certain securities may carry more risk than that of common stock. Uncertainties in the conditions of the financial markets, unreliable reference data, lack of transparency
and inconsistency of valuation models and processes may lead to inaccurate asset pricing. A fund may hold investments in sizes smaller than institutionally sized round lot positions (sometimes referred to as odd
lots). However, third-party pricing services generally provide evaluations on the basis of institutionally-sized round lots. If a fund sells certain of its investments in an odd lot transaction, the sale price may be
less than the value at which such securities have been held by the fund. Odd lots often trade at lower prices than institutional round lots. There is no assurance that the fund will be able to sell a portfolio
security at the price established by the pricing service, which could result in a loss to the fund.
Variable Interest Entities
Risk. In order to gain exposure to certain Chinese companies that are included in a Fund’s Index but are unavailable to direct investment by foreign investors, certain Funds invest
significantly in non-Chinese shell companies that have created structures known as variable interest entities (“VIEs”) in order to gain exposure to such Chinese companies. In China, direct ownership of
companies in certain sectors by foreign individuals and entities is prohibited. In order to allow for foreign investment in these businesses, many Chinese companies have created VIE structures to enable indirect
foreign ownership. In such an arrangement, a Chinese operating company typically establishes an offshore shell company in another jurisdiction, such as the Cayman Islands. That shell company enters into service and
other contracts with the Chinese issuer or operating company to obtain economic exposure to the Chinese company, then issues shares on an exchange outside of mainland China, and U.S. investors hold stock in the
non-Chinese shell company rather than directly in the Chinese issuer or operating company. This arrangement allows U.S. investors, such as the Fund, to obtain economic exposure to the Chinese issuer or operating
company through contractual means rather than through formal equity ownership. Because neither the shell company nor the Fund owns actual equity interests in the Chinese operating company, they do not have the voting
rights or other types of control that an equity holder would expect to benefit from. Although VIEs are a longstanding industry practice and well known to officials and regulators in China, VIEs are not formally
recognized under Chinese law. Intervention by the Chinese government with respect to VIEs could significantly affect the Chinese company’s performance and the enforceability of the VIE’s contractual
arrangements that establish the links between the Chinese company and the shell company in which the Fund invests. This could considerably impact the financial condition of the shell company in which the Fund invests
by limiting its ability to consolidate the financial results of the Chinese operating company into its own financial statements, as well as make the value of the shares held by the Fund effectively worthless. Further,
if Chinese officials prohibit the existence of VIEs, the market value of the Fund’s associated holdings would likely suffer significant, and possibly permanent effects, which could negatively impact the
Fund’s net asset value and could result in substantial losses. Further, it is uncertain whether any new laws, rules or regulations relating to VIE structures will be adopted or, if adopted, what impact they
would have on the value of the Fund’s shares.
VIEs are also subject
to the investment risks associated with the underlying Chinese issuer or operating company. Chinese companies are not subject to the same degree of regulatory requirements or accounting standards and oversight as
companies in more developed countries. As a result, information about the Chinese securities and VIEs in which the Fund invests may be less reliable and incomplete. There also may be significant obstacles to obtaining
information necessary for investigations into or litigation against Chinese companies and VIEs, and shareholders may have limited legal remedies, which could negatively impact the Fund. Additionally, U.S.-listed VIEs
may be delisted if they do not meet U.S. accounting standards and auditor oversight requirements. Delisting would significantly decrease the liquidity and value of the securities, decrease the ability of the Fund to
invest in such securities and may increase the cost of the Fund if required to seek alternative markets in which to invest in such securities.
| NOT FDIC INSURED
| NOT BANK GUARANTEED
| MAY LOSE VALUE
|
Advisory Agreements
Board Considerations
Regarding Approval of Amendments to the Investment Management Agreements
The Board of Trustees of
First Trust Exchange-Traded AlphaDEX® Fund II (the “Trust”), including the Independent Trustees, unanimously approved the amendment (as applicable to a specific Fund,
the “Amendment” and collectively, the “Amendments”) of the Investment Management Agreements (as applicable to a specific Fund, the “Agreement” and collectively, the
“Agreements”) with First Trust Advisors L.P. (the “Advisor”) on behalf of the following fifteen series of the Trust (each a “Fund” and collectively, the “Funds”):
First
Trust Developed Markets ex-US AlphaDEX® Fund (FDT)
First
Trust Emerging Markets AlphaDEX® Fund (FEM)
First
Trust Asia Pacific ex-Japan AlphaDEX® Fund (FPA)
First
Trust Europe AlphaDEX® Fund (FEP)
Additional Information (Continued)
First Trust
Exchange-Traded AlphaDEX® Fund II
December 31, 2022
(Unaudited)
First
Trust Latin America AlphaDEX® Fund (FLN)
First
Trust Brazil AlphaDEX® Fund (FBZ)
First
Trust China AlphaDEX® Fund (FCA)
First
Trust Japan AlphaDEX® Fund (FJP)
First
Trust Germany AlphaDEX® Fund (FGM)
First
Trust United Kingdom AlphaDEX® Fund (FKU)
First
Trust India NIFTY 50 Equal Weight ETF (NFTY)
First
Trust Switzerland AlphaDEX® Fund (FSZ)
First
Trust Developed Markets ex-US Small Cap AlphaDEX® Fund (FDTS)
First
Trust Emerging Markets Small Cap AlphaDEX® Fund (FEMS)
First
Trust Eurozone AlphaDEX® ETF (FEUZ)
The Board approved the
Amendment for each Fund at a meeting held on October 24, 2022. As part of the review process, the Board reviewed information and had preliminary discussions with the Advisor regarding the proposed Amendments at
meetings held on April 18, 2022, June 12–13, 2022 and September 18–19, 2022. Following those preliminary discussions, the Board requested and received information from the Advisor regarding the proposed
Amendments, and that information was considered at an executive session of the Independent Trustees and their counsel held prior to the October 24, 2022 meeting, as well as at the October meeting.
In reviewing the
Amendment for each Fund, the Board considered that the purpose of the Amendments is to modify the unitary fee rate for each Fund under the applicable Agreement by introducing a breakpoint schedule pursuant to which
the unitary fee rate paid by each Fund to the Advisor will be reduced as assets of such Fund meet certain thresholds. The Board noted the Advisor’s representations that the quality and quantity of the services
provided to each Fund by the Advisor under the applicable Agreement will not be reduced or modified as a result of the applicable Amendment, and that the obligations of the Advisor under each Agreement will remain the
same in all respects.
The Board noted that it,
including the Independent Trustees, last approved the continuation of the applicable Agreement for each Fund for a one-year period ending June 30, 2023 at a meeting held on June 12–13, 2022. The Board noted that
in connection with such approval it had determined for each Fund, based upon the information provided, that the terms of the applicable Agreement were fair and reasonable and that the continuation of the applicable
Agreement was in the best interests of the Fund in light of the nature, extent and quality of the services provided and such other matters as the Board considered to be relevant in the exercise of its business
judgment.
Based on all of the
information considered, the Board, including the Independent Trustees, unanimously determined that the terms of the Amendments are fair and reasonable and that the Amendments are in the best interests of each Fund.
Additional Information (Continued)
First Trust
Exchange-Traded AlphaDEX® Fund II
December 31, 2022
(Unaudited)
Remuneration
First Trust Advisors L.P.
(“First Trust”) is authorised and regulated by the U.S. Securities and Exchange Commission and is entitled to market shares of the First Trust Exchange-Traded AlphaDEX® Fund II funds it manages (the “Funds”), in certain member states in the European Economic Area in accordance with the
cooperation arrangements in Article 42 of the Alternative Investment Fund Managers Directive (the “Directive”). First Trust is required under the Directive to make disclosures in respect of remuneration.
The following disclosures are made in line with First Trust’s interpretation of currently available regulatory guidance on remuneration disclosures.
During the year ended
December 31, 2022, the amount of remuneration paid (or to be paid) by First Trust Advisors L.P. in respect of the Funds is $805,117. This figure is comprised of $31,212 paid (or to be paid) in fixed compensation and
$773,905 paid (or to be paid) in variable compensation. There were a total of 24 beneficiaries of the remuneration described above. Those amounts include $424,621 paid (or to be paid) to senior management of First
Trust Advisors L.P. and $380,496 paid (or to be paid) to other employees whose professional activities have a material impact on the risk profiles of First Trust Advisors L.P. or the Funds (collectively, “Code
Staff”).
Code Staff included in
the aggregated figures disclosed above are rewarded in line with First Trust’s remuneration policy (the “Remuneration Policy”) which is determined and implemented by First Trust’s senior
management. The Remuneration Policy reflects First Trust’s ethos of good governance and encapsulates the following principal objectives:
i. to
provide a clear link between remuneration and performance of First Trust and to avoid rewarding for failure;
ii. to
promote sound and effective risk management consistent with the risk profiles of the funds managed by First Trust; and
iii. to remunerate staff in line with the business strategy, objectives, values and interests of First Trust and the funds managed by First Trust in a manner that avoids conflicts of interest.
First Trust assesses
various risk factors which it is exposed to when considering and implementing remuneration for Code Staff and considers whether any potential award to such person(s) would give rise to a conflict of interest. First
Trust does not reward failure, or consider the taking of risk or failure to take risk in its remuneration of Code Staff.
First Trust assesses
performance for the purposes of determining payments in respect of performance-related remuneration of Code Staff by reference to a broad range of measures including (i) individual performance (using financial and
non-financial criteria), and (ii) the overall performance of First Trust. Remuneration is not based upon the performance of the Funds.
The elements of
remuneration are balanced between fixed and variable and the senior management sets fixed salaries at a level sufficient to ensure that variable remuneration incentivises and rewards strong individual performance but
does not encourage excessive risk taking.
No individual is involved
in setting his or her own remuneration.
Board of Trustees and Officers
First Trust
Exchange-Traded AlphaDEX® Fund II
December 31, 2022
(Unaudited)
The following tables
identify the Trustees and Officers of the Trust. Unless otherwise indicated, the address of all persons is 120 East Liberty Drive, Suite 400, Wheaton, IL 60187.
The Trust’s
statement of additional information includes additional information about the Trustees and is available, without charge, upon request, by calling (800) 988-5891.
| Name, Year of Birth and Position with the Trust
| Term of Office and Year First Elected or Appointed
| Principal Occupations
During Past 5 Years
| Number of Portfolios in the First Trust Fund Complex Overseen by Trustee
| Other Trusteeships or Directorships Held by Trustee During Past 5 Years
|
| INDEPENDENT TRUSTEES
|
Richard E. Erickson, Trustee
(1951)
| • Indefinite Term
• Since Inception
| Physician, Edward-Elmhurst Medical Group; Physician and Officer, Wheaton Orthopedics (1990 to 2021)
| 222
| None
|
Thomas R. Kadlec, Trustee
(1957)
| • Indefinite Term
• Since Inception
| Retired; President, ADM Investor Services, Inc. (Futures Commission Merchant) (2010 to July 2022)
| 222
| Director, National Futures Association and ADMIS Singapore Ltd.; Formerly, Director of ADM Investor Services, Inc., ADM Investor Services International, ADMIS Hong Kong Ltd., and
Futures Industry Association
|
Denise M. Keefe, Trustee
(1964)
| • Indefinite Term
• Since 2021
| Executive Vice President, Advocate Aurora Health and President, Advocate Aurora Continuing Health Division (Integrated Healthcare System)
| 222
| Director and Board Chair of Advocate Home Health Services, Advocate Home Care Products and Advocate Hospice; Director and Board Chair of Aurora At Home (since 2018); Director of
Advocate Physician Partners Accountable Care Organization; Director and Board Chair of RML Long Term Acute Care Hospitals; and Director of Senior Helpers (since 2021)
|
Robert F. Keith, Trustee
(1956)
| • Indefinite Term
• Since Inception
| President, Hibs Enterprises (Financial and Management Consulting)
| 222
| Formerly, Director of Trust Company of Illinois
|
Niel B. Nielson, Trustee
(1954)
| • Indefinite Term
• Since Inception
| Senior Advisor (2018 to Present), Managing Director and Chief Operating Officer (2015 to 2018), Pelita Harapan Educational Foundation (Educational Products and
Services)
| 222
| None
|
| INTERESTED TRUSTEE
|
James A. Bowen(1), Trustee and
Chairman of the Board
(1955)
| • Indefinite Term
• Since Inception
| Chief Executive Officer, First Trust Advisors L.P. and First Trust Portfolios L.P.; Chairman of the Board of Directors, BondWave LLC (Software
Development Company) and Stonebridge Advisors LLC (Investment Advisor)
| 222
| None
|
| (1)
| Mr. Bowen is deemed an “interested person” of the Trust due to his position as CEO of First Trust Advisors L.P., investment advisor of the Trust.
|
Board of Trustees and Officers (Continued)
First Trust
Exchange-Traded AlphaDEX® Fund II
December 31, 2022
(Unaudited)
| Name and Year of Birth
| Position and Offices with Trust
| Term of Office and Length of Service
| Principal Occupations
During Past 5 Years
|
| OFFICERS(2)
|
James M. Dykas
(1966)
| President and Chief Executive Officer
| • Indefinite Term
• Since 2016
| Managing Director and Chief Financial Officer, First Trust Advisors L.P. and First Trust Portfolios L.P.; Chief Financial Officer, BondWave LLC (Software Development Company) and
Stonebridge Advisors LLC (Investment Advisor)
|
Donald P. Swade
(1972)
| Treasurer, Chief Financial Officer and Chief Accounting Officer
| • Indefinite Term
• Since 2016
| Senior Vice President, First Trust Advisors L.P. and First Trust Portfolios L.P.
|
W. Scott Jardine
(1960)
| Secretary and Chief Legal Officer
| • Indefinite Term
• Since Inception
| General Counsel, First Trust Advisors L.P. and First Trust Portfolios L.P.; Secretary and General Counsel, BondWave LLC; Secretary, Stonebridge Advisors LLC
|
Daniel J. Lindquist
(1970)
| Vice President
| • Indefinite Term
• Since Inception
| Managing Director, First Trust Advisors L.P. and First Trust Portfolios L.P.
|
Kristi A. Maher
(1966)
| Chief Compliance Officer and Assistant Secretary
| • Indefinite Term
• Since Inception
| Deputy General Counsel, First Trust Advisors L.P. and First Trust Portfolios L.P.
|
Roger F. Testin
(1966)
| Vice President
| • Indefinite Term
• Since Inception
| Senior Vice President, First Trust Advisors L.P. and First Trust Portfolios L.P.
|
Stan Ueland
(1970)
| Vice President
| • Indefinite Term
• Since Inception
| Senior Vice President, First Trust Advisors L.P. and First Trust Portfolios L.P.
|
| (2)
| The term “officer” means the president, vice president, secretary, treasurer, controller or any other officer who performs a policy making function.
|
Privacy Policy
First Trust
Exchange-Traded AlphaDEX® Fund II
December 31, 2022
(Unaudited)
Privacy Policy
First Trust values our
relationship with you and considers your privacy an important priority in maintaining that relationship. We are committed to protecting the security and confidentiality of your personal information.
Sources of Information
We collect nonpublic
personal information about you from the following sources:
| •
| Information we receive from you and your broker-dealer, investment professional or financial representative through interviews, applications, agreements or other forms;
|
| •
| Information about your transactions with us, our affiliates or others;
|
| •
| Information we receive from your inquiries by mail, e-mail or telephone; and
|
| •
| Information we collect on our website through the use of “cookies.” For example, we may identify the pages on our website that your browser requests or visits.
|
Information Collected
The type of data we
collect may include your name, address, social security number, age, financial status, assets, income, tax information, retirement and estate plan information, transaction history, account balance, payment history,
investment objectives, marital status, family relationships and other personal information.
Disclosure of
Information
We do not disclose any
nonpublic personal information about our customers or former customers to anyone, except as permitted by law. In addition to using this information to verify your identity (as required under law), the permitted uses
may also include the disclosure of such information to unaffiliated companies for the following reasons:
| •
| In order to provide you with products and services and to effect transactions that you request or authorize, we may disclose your personal information as described above to unaffiliated financial
service providers and other companies that perform administrative or other services on our behalf, such as transfer agents, custodians and trustees, or that assist us in the distribution of investor materials such as
trustees, banks, financial representatives, proxy services, solicitors and printers.
|
| •
| We may release information we have about you if you direct us to do so, if we are compelled by law to do so, or in other legally limited circumstances (for example to protect your
account from fraud).
|
In addition, in order to
alert you to our other financial products and services, we may share your personal information within First Trust.
Use of Website
Analytics
We currently use third
party analytics tools, Google Analytics and AddThis, to gather information for purposes of improving First Trust’s website and marketing our products and services to you. These tools employ cookies, which are
small pieces of text stored in a file by your web browser and sent to websites that you visit, to collect information, track website usage and viewing trends such as the number of hits, pages visited, videos and PDFs
viewed and the length of user sessions in order to evaluate website performance and enhance navigation of the website. We may also collect other anonymous information, which is generally limited to technical and
web navigation information such as the IP address of your device, internet browser type and operating system for purposes of analyzing the data to make First Trust’s website better and more useful to our users.
The information collected does not include any personal identifiable information such as your name, address, phone number or email address unless you provide that information through the website for us to
contact you in order to answer your questions or respond to your requests. To find out how to opt-out of these services click on: Google Analytics and AddThis.
Confidentiality and
Security
With regard to our
internal security procedures, First Trust restricts access to your nonpublic personal information to those First Trust employees who need to know that information to provide products or services to you. We maintain
physical, electronic and procedural safeguards to protect your nonpublic personal information.
Policy Updates and
Inquiries
As required by federal
law, we will notify you of our privacy policy annually. We reserve the right to modify this policy at any time, however, if we do change it, we will tell you promptly. For questions about our policy, or for additional
copies of this notice, please go to www.ftportfolios.com, or contact us at 1-800-621-1675 (First Trust Portfolios) or 1-800-222-6822 (First Trust Advisors).
March 2022
First Trust Exchange-Traded AlphaDEX® Fund II
INVESTMENT ADVISOR
First Trust Advisors L.P.
120 East Liberty Drive, Suite
400
Wheaton, IL 60187
ADMINISTRATOR, CUSTODIAN,
FUND ACCOUNTANT &
TRANSFER AGENT
Brown Brothers Harriman &
Co.
50 Post Office Square
Boston, MA 02110
INDEPENDENT REGISTERED
PUBLIC ACCOUNTING FIRM
Deloitte & Touche LLP
111 S. Wacker Drive
Chicago, IL 60606
LEGAL COUNSEL
Chapman and Cutler LLP
320 South Canal Street
Chicago, IL 60606
Item 2. Code of Ethics.
| (a) | | The registrant, as of the end of the period covered by this report, has adopted a code of
ethics that applies to the registrant’s principal executive officer, principal financial officer, principal accounting officer
or controller, or persons performing similar functions, regardless of whether these individuals are employed by the registrant or a third
party. |
| (c) | | There have been no amendments, during the period covered by this report, to a provision of
the code of ethics that applies to the registrant's principal executive officer, principal financial officer, principal accounting officer
or controller, or persons performing similar functions, regardless of whether these individuals are employed by the registrant or a third
party, and that relates to any element of the code of ethics description. |
| (d) | | The registrant has not granted any waivers, including an implicit waiver, from a provision
of the code of ethics that applies to the registrant’s principal executive officer, principal financial officer, principal accounting
officer or controller, or persons performing similar functions, regardless of whether these individuals are employed by the registrant
or a third party, that relates to one or more of the items set forth in paragraph (b) of this item’s instructions. |
| (f) | | copy of the code of ethics that applies to the registrant’s principal executive officer,
principal financial officer, principal accounting officer or controller is filed as an exhibit pursuant to Item 13(a)(1). |
Item 3. Audit Committee Financial Expert.
As of the end of the period covered by the report,
the registrant's board of trustees has determined that Thomas R. Kadlec and Robert F. Keith are qualified to serve as audit committee
financial experts serving on its audit committee and that each of them is “independent,” as defined by Item 3 of Form N-CSR.
Item 4. Principal Accountant Fees and Services.
(a) Audit
Fees (Registrant) — The aggregate fees billed for each of the last two fiscal years for
professional services rendered by the principal accountant for the audit of the registrant’s annual financial statements or services
that are normally provided by the accountant in connection with statutory and regulatory filings or engagements were $327,500 for the
fiscal year ended December 31, 2021 and $337,500 for the fiscal year ended December 31, 2022.
(b) Audit-Related
Fees (Registrant) — The aggregate fees billed in each of the last two fiscal years for assurance and related services
by the principal accountant that are reasonably related to the performance of the audit of the registrant’s financial statements
and are not reported under paragraph (a) of this Item were $0 for the fiscal year ended December 31, 2021, and $0 for the fiscal year
ended December 31, 2022.
Audit-Related
Fees (Investment Advisor and Distributor) — The aggregate fees billed in each of the last two fiscal years for
assurance and related services by the principal accountant that are reasonably related to the performance of the audit of the registrant’s
financial statements and are not reported under paragraph (a) of this Item were $0 for the fiscal year ended December 31, 2021 and $0
for the fiscal year ended December 31, 2022.
(c) Tax Fees (Registrant)
— The aggregate fees billed in each of the last two fiscal years for professional services rendered by the principal accountant
for tax compliance, tax advice, and tax planning to the registrant were $278,962 for the fiscal year ended December 31, 2021, and $195,000
for the fiscal year ended December 31, 2022. These fees were for tax consultation and/or tax return preparation and professional services
rendered for PFIC (Passive Foreign Investment Company) Identification Services.
Tax Fees (Investment
Advisor and Distributor) —The aggregate fees billed in each of the last two fiscal years for professional services rendered
by the principal accountant for tax compliance, tax advice, and tax planning to the registrant’s advisor and distributor were $0
for the fiscal year ended December 31, 2021 and $0 for the fiscal year ended December 31, 2022.
(d) All
Other Fees (Registrant) — The aggregate fees billed in each of the last two fiscal years for products and services provided
by the principal accountant to the registrant, other than the services reported in paragraphs (a) through (c) of this Item were $0 for
the fiscal year ended December 31, 2021, and $0 for the fiscal year ended December 31, 2022.
All
Other Fees (Investment Advisor and Distributor) — The aggregate fees billed in each of the last two fiscal years
for products and services provided by the principal accountant to the registrant’s investment advisor and distributor, other than
the services reported in paragraphs (a) through (c) of this Item were $0 for the fiscal year ended December 31, 2021, and $0 for the fiscal
year ended December 31, 2022.
(e)(1) Disclose the
audit committee’s pre-approval policies and procedures described in paragraph (c)(7) of Rule 2-01 of Regulation S-X.
Pursuant to its charter
and its Audit and Non-Audit Services Pre-Approval Policy, the Audit Committee (the “Committee”) is responsible for
the pre-approval of all audit services and permitted non-audit services (including the fees and terms thereof) to be performed for the
registrant by its independent auditors. The Chairman of the Committee authorized to give such pre-approvals on behalf of the Committee
up to $25,000 and report any such pre-approval to the full Committee.
The Committee is also
responsible for the pre-approval of the independent auditor’s engagements for non-audit services with the registrant’s advisor
(not including a sub-advisor whose role is primarily portfolio management and is sub-contracted or overseen by another investment advisor)
and any entity controlling, controlled by or under common control with the investment advisor that provides ongoing services to the registrant,
if the engagement relates directly to the operations and financial reporting of the registrant, subject to the de minimis exceptions
for non-audit services described in Rule 2-01 of Regulation S-X. If the independent auditor has provided non-audit services to the
registrant’s advisor (other than any sub-advisor whose role is primarily portfolio management and is sub-contracted with or overseen
by another investment advisor) and any entity controlling, controlled by or under common control with the investment advisor that provides
ongoing services to the registrant that were not pre-approved pursuant to the de minimis exception, the Committee will consider
whether the provision of such non-audit services is compatible with the auditor’s independence.
(e)(2) The
percentage of services described in each of paragraphs (b) through (d) for the registrant and the registrant’s investment advisor
of this Item that were approved by the audit committee pursuant to the pre-approval exceptions included in paragraph (c)(7)(i)(c) or paragraph
(c)(7)(ii) of Rule 2-01 of Regulation S-X are as follows:
(b) 0%
(c) 0%
(d) 0%
(f) The
percentage of hours expended on the principal accountant’s engagement to audit the registrant’s financial statements for the
most recent fiscal year that were attributed to work performed by persons other than the principal accountant’s full-time, permanent
employees was less than fifty percent.
(g) The
aggregate non-audit fees billed by the registrant’s accountant for services rendered to the registrant, and rendered to the registrant’s
investment advisor (not including any sub-advisor whose role is primarily portfolio management and is subcontracted with or overseen by
another investment advisor), and any entity controlling, controlled by, or under common control with the advisor that provides ongoing
services to the registrant for the fiscal year ended December 31, 2021 were $278,962for the registrant, $16,500 for the registrant’s
investment advisor, and $29,500 for the registrant’s distributor; and for the fiscal year ended December 31, 2022 were $195,000
for the registrant, $0 for the registrant’s investment advisor, and $0 for the registrant’s distributor.
(h) The
registrant’s audit committee of its Board of Trustees has determined that the provision of non-audit services that were rendered
to the registrant’s investment advisor (not including any sub-advisor whose role is primarily portfolio management and is subcontracted
with or overseen by another investment advisor), and any entity controlling, controlled by, or under common control with the investment
advisor that provides ongoing services to the registrant that were not pre-approved pursuant to paragraph (c)(7)(ii) of Rule 2-01 of Regulation
S-X is compatible with maintaining the principal accountant’s independence.
(i) Not
applicable.
(j) Not
applicable.
Item 5. Audit Committee of Listed Registrants.
The registrant has a separately designated standing
audit committee established in accordance with Section 3(a)(58)(A) of the Securities Exchange Act of 1934 consisting of all the independent
directors of the registrant. The audit committee of the registrant is comprised of: Richard E. Erickson, Thomas R. Kadlec, Denise M. Keefe,
Robert F. Keith and Niel B. Nielson.
Item 6. Investments.
| (a) | | Schedule of Investments in securities of unaffiliated issuers as of the close of the reporting
period is included as part of the report to shareholders filed under Item 1 of this form. |
Item 7. Disclosure of Proxy Voting Policies
and Procedures for Closed-End Management Investment Companies.
Not applicable.
Item 8. Portfolio Managers of Closed-End
Management Investment Companies.
Not applicable.
Item 9. Purchases of Equity Securities by
Closed-End Management Investment Company and Affiliated Purchasers.
Not applicable.
Item 10. Submission of Matters to a Vote
of Security Holders.
There have been no material changes to the
procedures by which the shareholders may recommend nominees to the registrant’s board of trustees, where those changes were implemented
after the registrant last provided disclosure in response to the requirements of Item 407 (c) (2) (iv) of Regulation S-K (17 CFR 229.407)
(as required by Item 22 (b) (15) of Schedule 14A (17 CFR 240.14a-101)), or this Item.
Item 11. Controls and Procedures.
| (a) | | The registrant’s principal executive and principal financial officers, or persons performing
similar functions, have concluded that the registrant’s disclosure controls and procedures (as defined in Rule 30a-3(c) under the
Investment Company Act of 1940, as amended (the “1940 Act”) (17 CFR 270.30a-3 (c))) are effective, as of a date within 90
days of the filing date of the report that includes the disclosure required by this paragraph, based on their evaluation of these controls
and procedures required by Rule 30a-3(b) under the 1940 Act (17 CFR 270.30a-3(b)) and Rules 13a-15(b) or 15d-15(b) under the Securities
Exchange Act of 1934, as amended (17 CFR 240.13a-15(b) or 240.15d-15 (b)). |
| (b) | | There were no changes in the registrant's internal control over financial reporting (as defined
in Rule 30a-3(d) under the 1940 Act (17 CFR 270.30a-3(d)) that occurred during the period covered by this report that have materially
affected, or are reasonably likely to materially affect, the registrant's internal control over financial reporting. |
Item 12. Disclosure of Securities Lending
Activities for Closed-End Management Investment Companies
Item 13. Exhibits.
SIGNATURES
Pursuant to the requirements of the Securities Exchange
Act of 1934 and the Investment Company Act of 1940, the registrant has duly caused this report to be signed on its behalf by the undersigned,
thereunto duly authorized.
| (registrant) |
|
First Trust Exchange-Traded AlphaDEX®
Fund II |
| By (Signature and Title)* |
|
/s/ James M. Dykas |
| |
|
James M. Dykas, President and Chief Executive Officer
(principal executive
officer)
|
Pursuant
to the requirements of the Securities Exchange Act of 1934 and the Investment Company Act of 1940, this report has been signed
below by the following persons on behalf of the registrant and in the capacities and on the dates indicated.
| By (Signature and Title)* |
|
/s/ James M. Dykas |
| |
|
James M. Dykas, President and Chief Executive Officer
(principal executive
officer)
|
| By (Signature and Title)* |
|
/s/ Donald P. Swade |
| |
|
Donald P. Swade, Treasurer, Chief Financial Officer
and Chief Accounting Officer
(principal financial officer)
|
* Print the name and title of each signing officer under
his or her signature.