Exhibit 99.5
CONFIDENTIAL DRAFT
Subject to Material Revision Subject to F.R.E. 408

Contents IMAGE OMITTED Corporate Overview IMAGE OMITTED DJ Basin Overview IMAGE OMITTED Business Plan IMAGE OMITTED Acreage IMAGE OMITTED Reserves and Type Curves IMAGE OMITTED Firm Transportation Commitments IMAGE OMITTED Rocky Mountain Infrastructure Assets IMAGE OMITTED
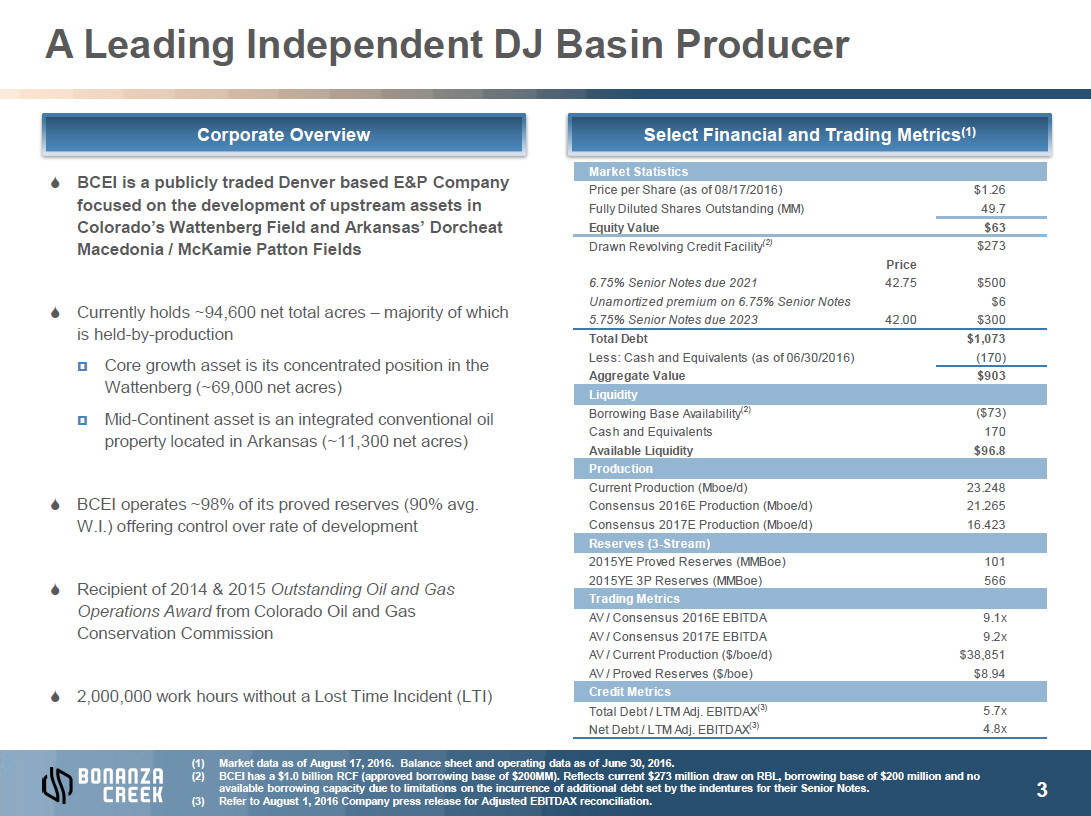
A Leading Independent DJ Basin Producer IMAGE OMITTED
S BCEI
is a publicly traded Denver based E&P Company focused on the development of upstream assets in Colorado’s
Wattenberg Field and Arkansas’ Dorcheat Macedonia
/ McKamie Patton Fields S Currently
holds ~94,600 net total acres – majority of which is held-by-production ¤ Core
growth asset is its concentrated position in the Wattenberg (~69,000 net acres) ¤ Mid-Continent
asset is an integrated conventional oil property located in Arkansas (~11,300 net acres) S BCEI
operates ~98% of its proved reserves (90% avg. W.I.) offering control over rate of development S Recipient
of 2014 & 2015 Outstanding Oil and Gas Operations Award from Colorado Oil and Gas Conservation Commission S 2,000,000
work hours without a Lost Time Incident (LTI) IMAGE
OMITTED
Market Statistics Price
per Share (as of 08/17/2016) $1.26 Fully Diluted Shares Outstanding (MM) 49.7 Equity Value $63 Drawn
Revolving Credit Facility(2) $273 Price 6.75% Senior Notes due 2021 42.75 $500 Unamortized
premium on 6.75% Senior Notes $6 5.75% Senior Notes due 2023 42.00 $300 Total Debt $1,073 Less:
Cash and Equivalents (as of 06/30/2016) (170) Aggregate Value $903 Liquidity Borrowing
Base Availability(2) ($73) Cash and Equivalents 170 Available Liquidity $96.8 Production Current
Production (Mboe/d) 23.248 Consensus 2016E Production (Mboe/d) 21.265 Consensus 2017E Production
(Mboe/d) 16.423 Reserves (3-Stream) 2015YE Proved Reserves (MMBoe) 101 2015YE
3P Reserves (MMBoe) 566 Trading Metrics AV / Consensus 2016E EBITDA 9.1x AV /
Consensus 2017E EBITDA 9.2x AV / Current Production ($/boe/d) $38,851 AV / Proved Reserves ($/boe) $8.94 Credit
Metrics Total Debt / LTM Adj. EBITDAX(3) 5.7x Net Debt / LTM Adj. EBITDAX(3) 4.8x IMAGE
OMITTED
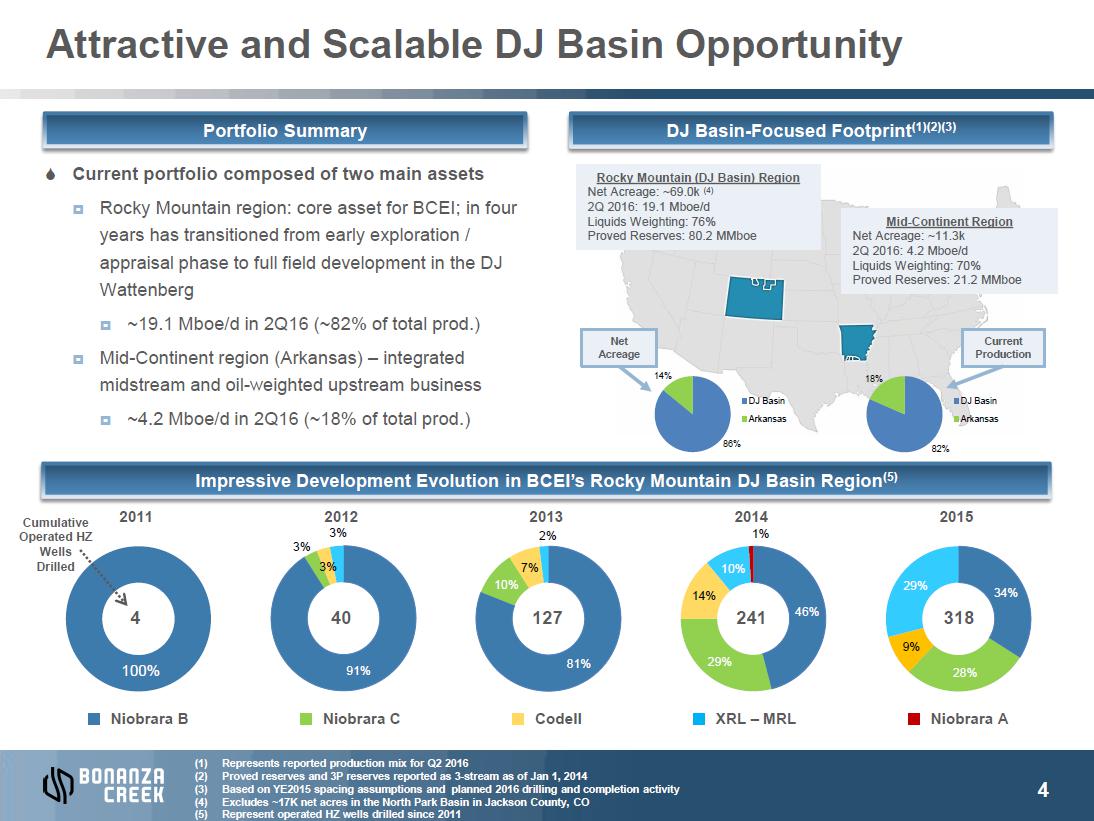
IMAGE OMITTEDAttractive and Scalable DJ Basin Opportunity
Portfolio
Summary S Current
portfolio composed of two main assets ¤ Rocky
Mountain region: core asset for BCEI; in four years has transitioned from early exploration / appraisal phase to full field development
in the DJ Wattenberg
DJ Basin-Focused Footprint(1)(2)(3) Rocky
Mountain (DJ Basin) Region Net Acreage: ~69.0k (4) 2Q 2016: 19.1 Mboe/d Liquids
Weighting: 76% Mid-Continent Region Proved Reserves: 80.2 MMboe Net Acreage: ~11.3k 2Q 2016:
4.2 Mboe/d Liquids Weighting: 70% Proved Reserves: 21.2 MMboe
¤ ~19.1
Mboe/d in 2Q16 (~82% of total prod.) ¤ Mid-Continent
region (Arkansas) – integrated midstream and oil-weighted upstream business ¤ ~4.2
Mboe/d in 2Q16 (~18% of total prod.)
Net Current Acreage Production 14% 18% DJ
Basin DJ Basin Arkansas Arkansas 86% 82%
Impressive Development Evolution in BCEI’s Rocky Mountain DJ Basin Region(5) Cumulative 2011 2012 2013 2014 2015 3% Operated HZ 2% 1% Wells 3% Drilled 3% 7% 10% 10% 29% 14% 34% 4 40 127 241 46% 318 9% 100% 91% 81% 29% 28%
Niobrara B Niobrara C Codell XRL – MRL Niobrara A IMAGE OMITTED
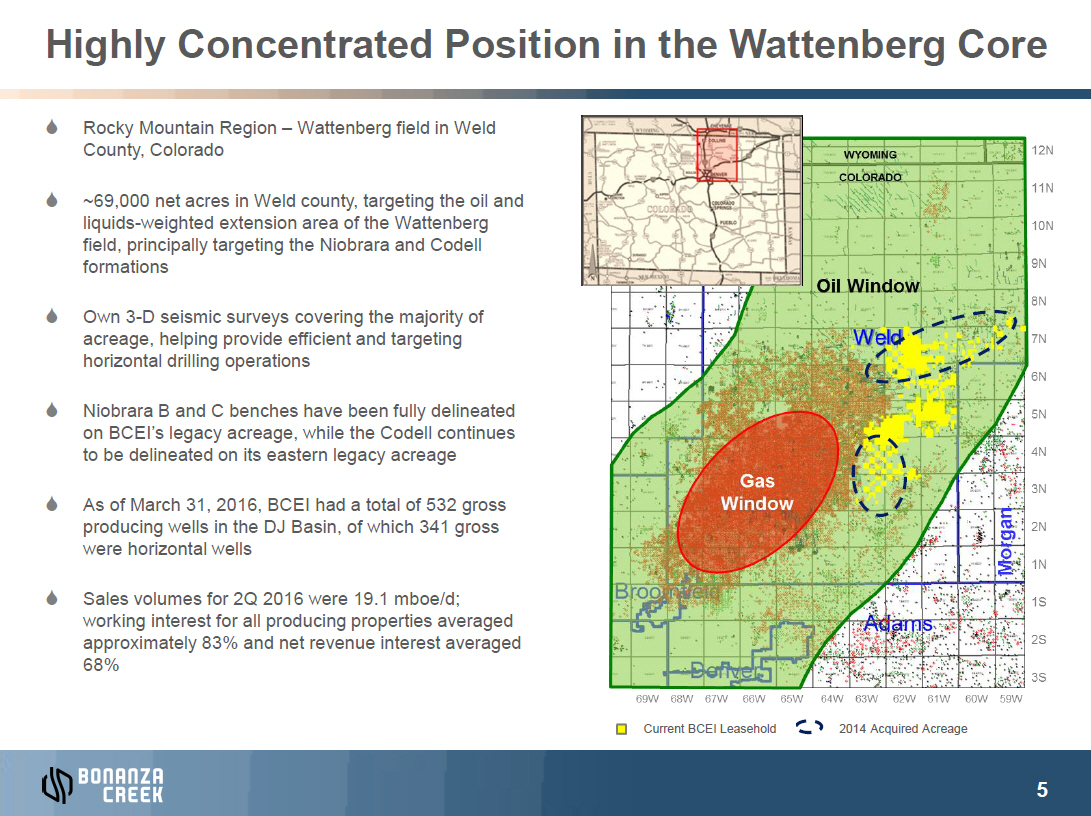
Highly Concentrated Position in the Wattenberg Core IMAGE OMITTED S Rocky Mountain Region – Wattenberg field in Weld County, Colorado S ~69,000 net acres in Weld county, targeting the oil and liquids-weighted extension area of the Wattenberg field, principally targeting the Niobrara and Codell formations S Own 3-D seismic surveys covering the majority of acreage, helping provide efficient and targeting horizontal drilling operations S Niobrara B and C benches have been fully delineated on BCEI’s legacy acreage, while the Codell continues to be delineated on its eastern legacy acreage S As of March 31, 2016, BCEI had a total of 532 gross producing wells in the DJ Basin, of which 341 gross were horizontal wells S Sales volumes for 2Q 2016 were 19.1 mboe/d; working interest for all producing properties averaged approximately 83% and net revenue interest averaged 68% IMAGE OMITTED
| Current BCEI Leasehold | 2014 Acquired Acreage |
IMAGE OMITTED
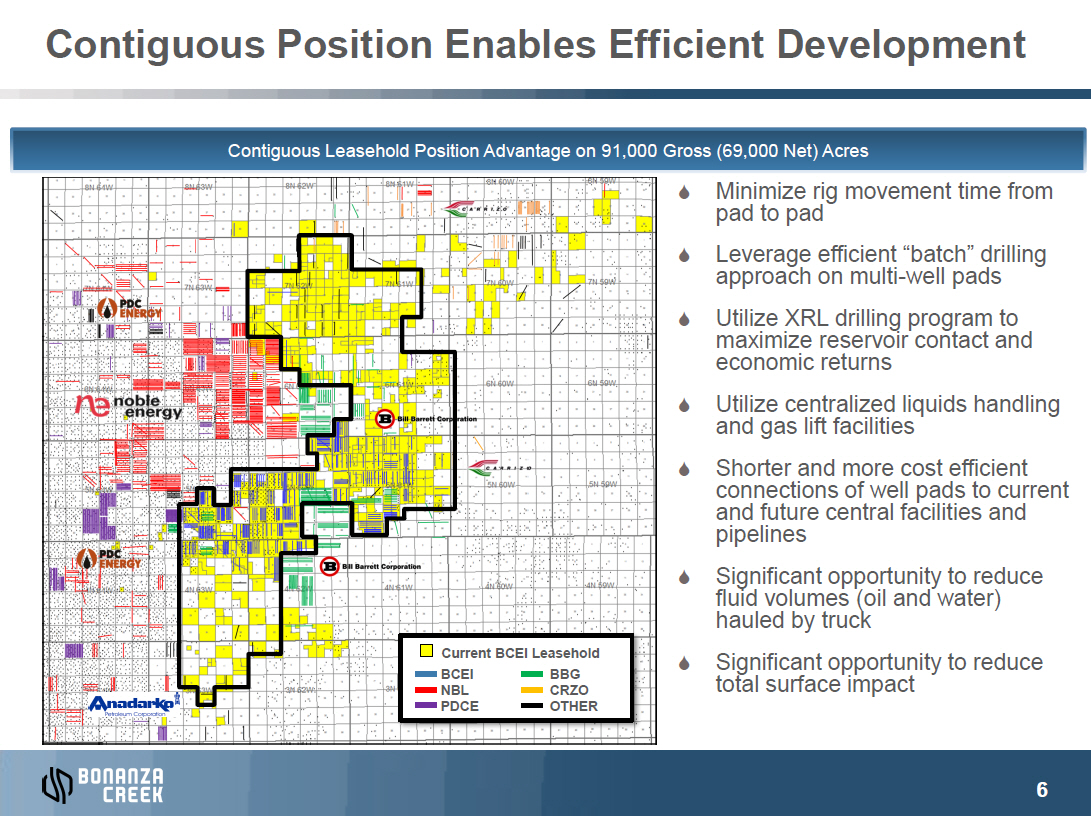
IMAGE OMITTEDContiguous Position Enables Efficient Development Contiguous Leasehold Position Advantage on 91,000 Gross (69,000 Net) Acres
Current BCEI Leasehold
| BCEI | BBG |
| NBL | CRZO |
| PDCE | OTHER |
IMAGE
OMITTED
S Minimize
rig movement time from pad to pad S Leverage
efficient “ba approach on multi-well pads S Utilize
XRL drilling program to maximize reservoir contact and economic returns S Utilize
centralized liquids handling and gas lift facilities S Shorter
and more cost efficient connections of well pads to current and future central facilities and pipelines S Significant
opportunity to reduce fluid volumes (oil and water) hauled by truck S Significant
opportunity to reduce total surface impact
Contents IMAGE OMITTED Corporate Overview IMAGE OMITTED DJ Basin Overview IMAGE OMITTED Business Plan IMAGE OMITTED Acreage IMAGE OMITTED Reserves and Type Curves IMAGE OMITTED Firm Transportation Commitments IMAGE OMITTED Rocky Mountain Infrastructure Assets IMAGE OMITTED
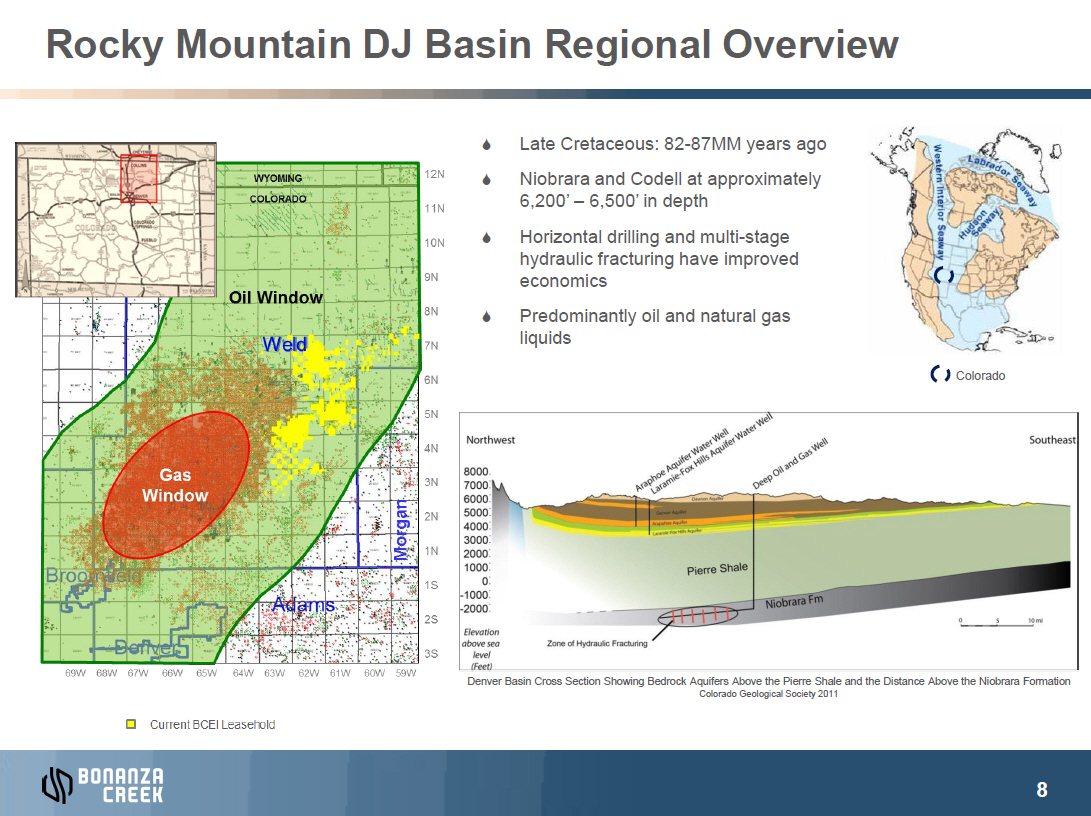
Rocky Mountain DJ Basin Regional Overview IMAGE OMITTED S Late Cretaceous: 82-87MM years ago S Niobrara and Codell at approximately 6,200’–6,500’ in depth S Horizontal drilling and multi-stage hydraulic fracturing have improved economics S Predominantly oil and natural gas liquids IMAGE OMITTED IMAGE OMITTEDColorado IMAGE OMITTED Denver Basin Cross Section Showing Bedrock Aquifers Above the Pierre Shale and the Distance Above the Niobrara Formation
Colorado Geological Society 2011 IMAGE OMITTED
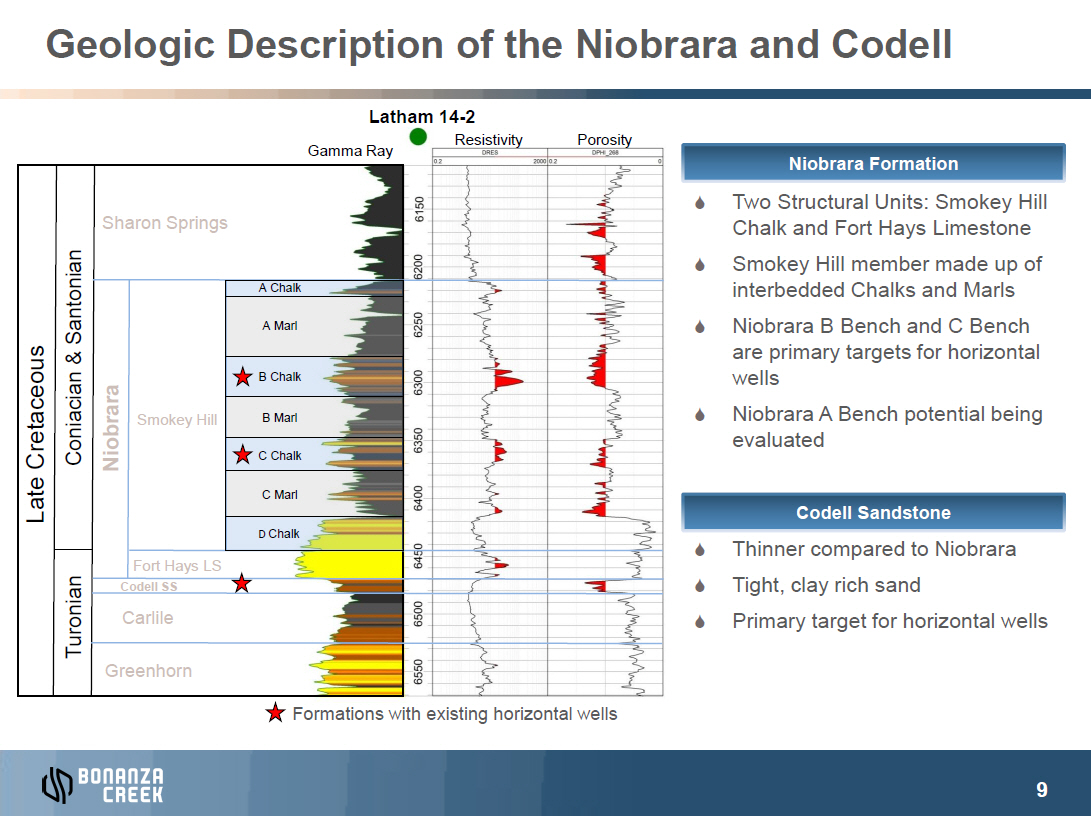
Geologic Description of the Niobrara and Codell
Santonian Cretaceous& Coniacian Late Turonian
Latham 14-2 IMAGE
OMITTED Resistivity Porosity Gamma Ray Sharon
Springs
| A Chalk | ||
| A Marl | ||
| B Chalk | ||
| Smokey Hill | B Marl | |
| Niobrara | C Chalk | |
| C Marl |
D
Chalk Fort Hays LS Codell SS Carlile Greenhorn Formations
with existing horizontal wells
Niobrara Formation IMAGE
OMITTED S Two
Structural Units: Smokey Hill Chalk and Fort Hays Limestone S Smokey
Hill member made up of interbedded Chalks and Marls S Niobrara
B Bench and C Bench are primary targets for horizontal wells S Niobrara
A Bench potential being evaluated IMAGE
OMITTED Codell Sandstone S Thinner
compared to Niobrara S Tight,
clay rich sand S Primary
target for horizontal wells
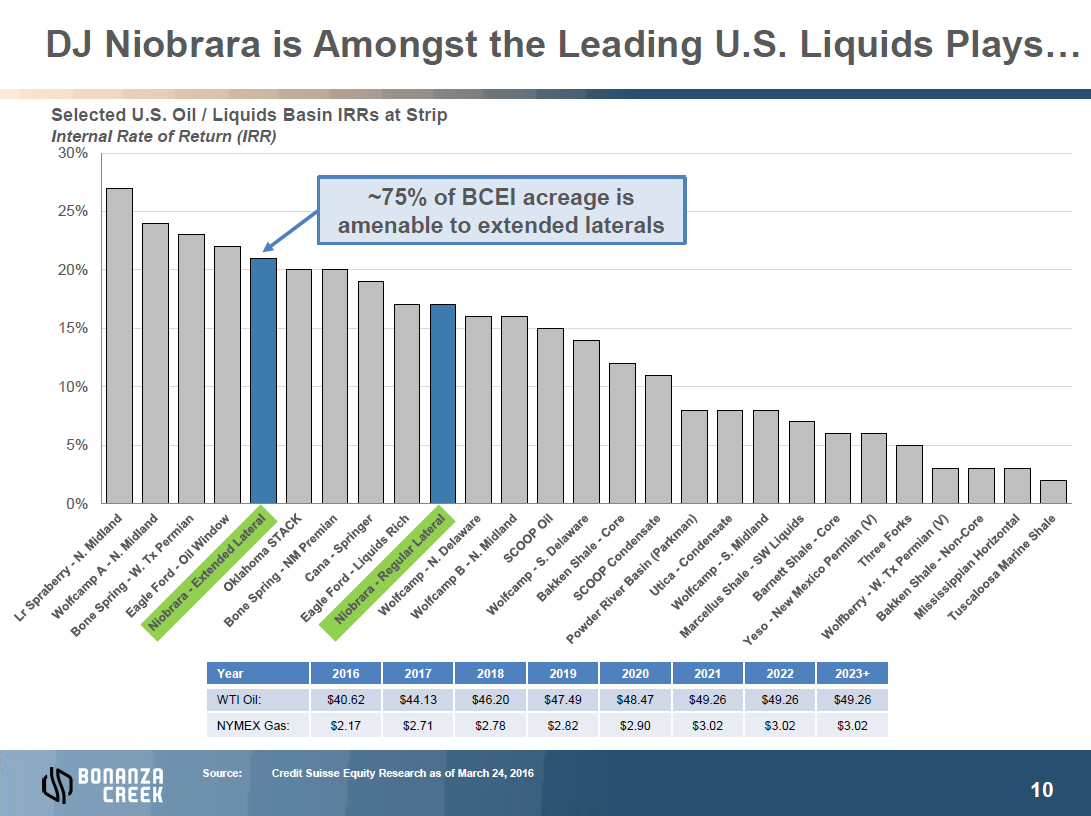
DJ Niobrara is Amongst the Leading U.S. Liquids Plays… Selected U.S. Oil / Liquids Basin IRRs at Strip Internal Rate of Return (IRR) 30% IMAGE OMITTED 25% ~75% of BCEI acreage is amenable to extended laterals 20% 15% 10% 5% 0% IMAGE OMITTED Year 2016 2017 2018 2019 2020 2021 2022 2023+ WTI Oil: $40.62 $44.13 $46.20 $47.49 $48.47 $49.26 $49.26 $49.26 NYMEX Gas: $2.17 $2.71 $2.78 $2.82 $2.90 $3.02 $3.02 $3.02 IMAGE OMITTED
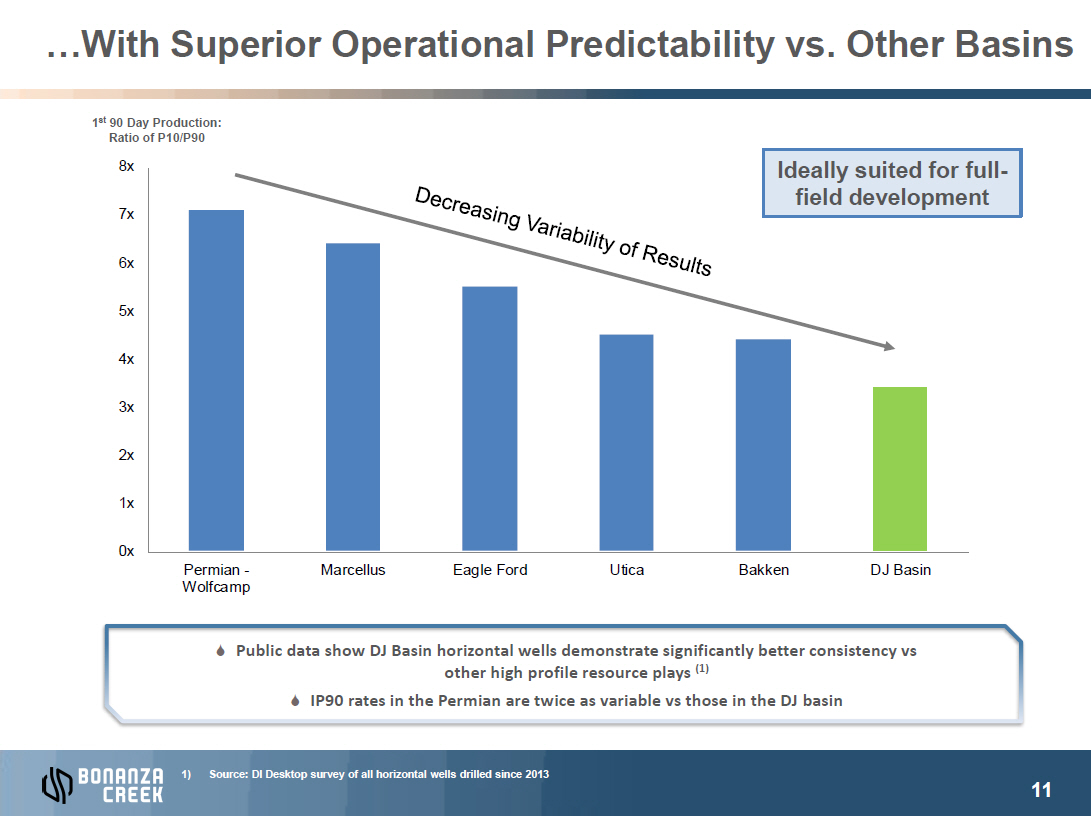
…With Superior Operational Predictability vs. Other Basins
1st 90 Day Production: Ratio of P10/P90 IMAGE OMITTED 8x Ideally suited for full- 7x field development 6x 5x 4x 3x 2x 1x 0x Permian - Marcellus Eagle Ford Utica Bakken DJ Basin Wolfcamp IMAGE OMITTED S Public data show DJ Basin horizontal wells demonstrate significantly better consistency vs other high profile resource plays (1) S IP90 rates in the Permian are twice as variable vs those in the DJ basin IMAGE OMITTED
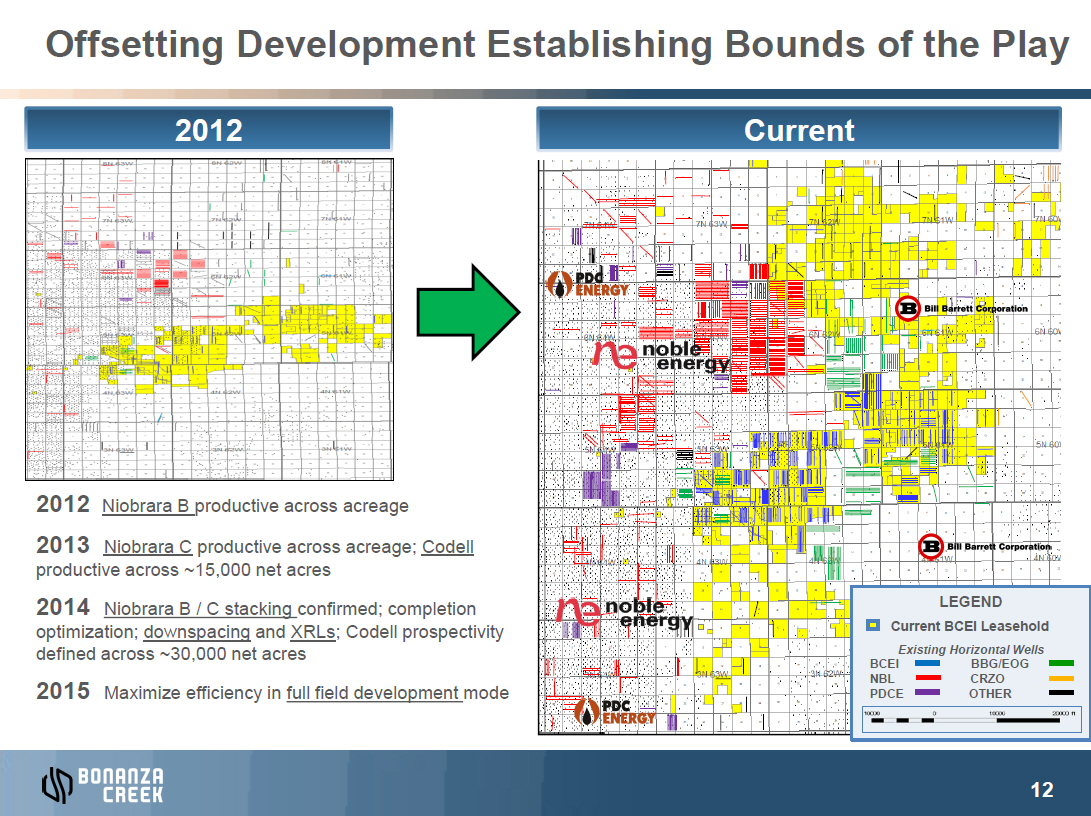
Offsetting Development Establishing Bounds of the Play IMAGE OMITTED
2012
Niobrara B productive across acreage IMAGE
OMITTED 2013 Niobrara C
productive across acreage; Codell productive across ~15,000 net acres 2014 Niobrara B / C stacking confirmed;
completion optimization; downspacing and XRLs; Codell prospectivity defined across ~30,000 net acres 2015
Maximize efficiency in full field development mode IMAGE
OMITTED
Current LEGEND Current
BCEI Leasehold Existing Horizontal Wells
| BCEI | BBG/EOG | ||||
| NBL | CRZO | ||||
| PDCE | OTHER | ||||
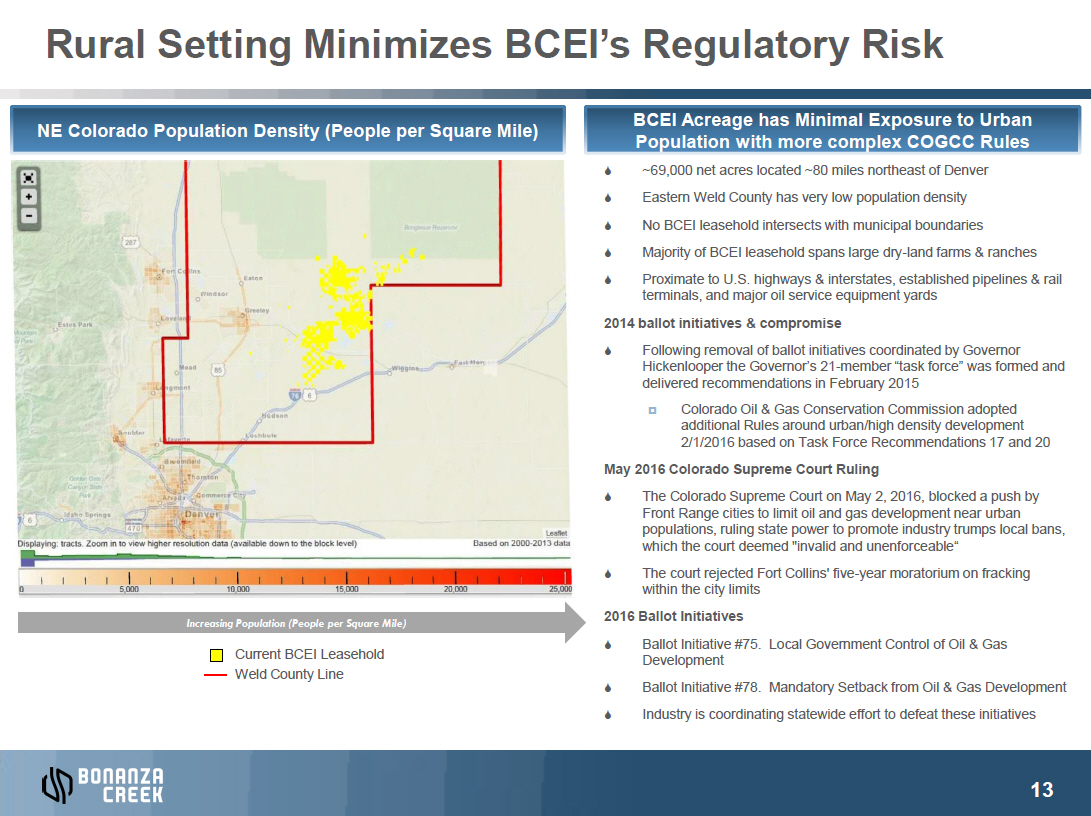
IMAGE OMITTEDRural Setting Minimizes BCEI’s Regulatory Risk
NE
Colorado Population Density (People per Square Mile) Increasing
Population (People per Square Mile) Current BCEI Leasehold Weld County Line IMAGE
OMITTED
BCEI Acreage has Minimal Exposure to Urban Population
with more complex COGCC Rules S ~69,000
net acres located ~80 miles northeast of Denver S Eastern
Weld County has very low population density S No
BCEI leasehold intersects with municipal boundaries S Majority
of BCEI leasehold spans large dry-land farms & ranches S Proximate
to U.S. highways & interstates, established pipelines & rail terminals, and major oil service equipment yards 2014
ballot initiatives & compromise S Following
removal of ballot initiatives coordinated by Governor Hickenlooper
the Gov21-mernomber’s“task wasforce”formed and delivered recommendations in February 2015 ¤ Colorado
Oil & Gas Conservation Commission adopted additional Rules around urban/high density development 2/1/2016 based on Task Force
Recommendations 17 and 20 May
2016 Colorado Supreme Court Ruling S The
Colorado Supreme Court on May 2, 2016, blocked a push by Front Range cities to limit oil and gas development near urban populations,
ruling state power to promote industry trumps local bans, which
the court deemed "invalid and unenforc S The
court rejected Fort Collins' five-year moratorium on fracking within the city limits 2016
Ballot Initiatives S Ballot
Initiative #75. Local Government Control of Oil & Gas Development S Ballot
Initiative #78. Mandatory Setback from Oil & Gas Development S Industry
is coordinating statewide effort to defeat these initiatives
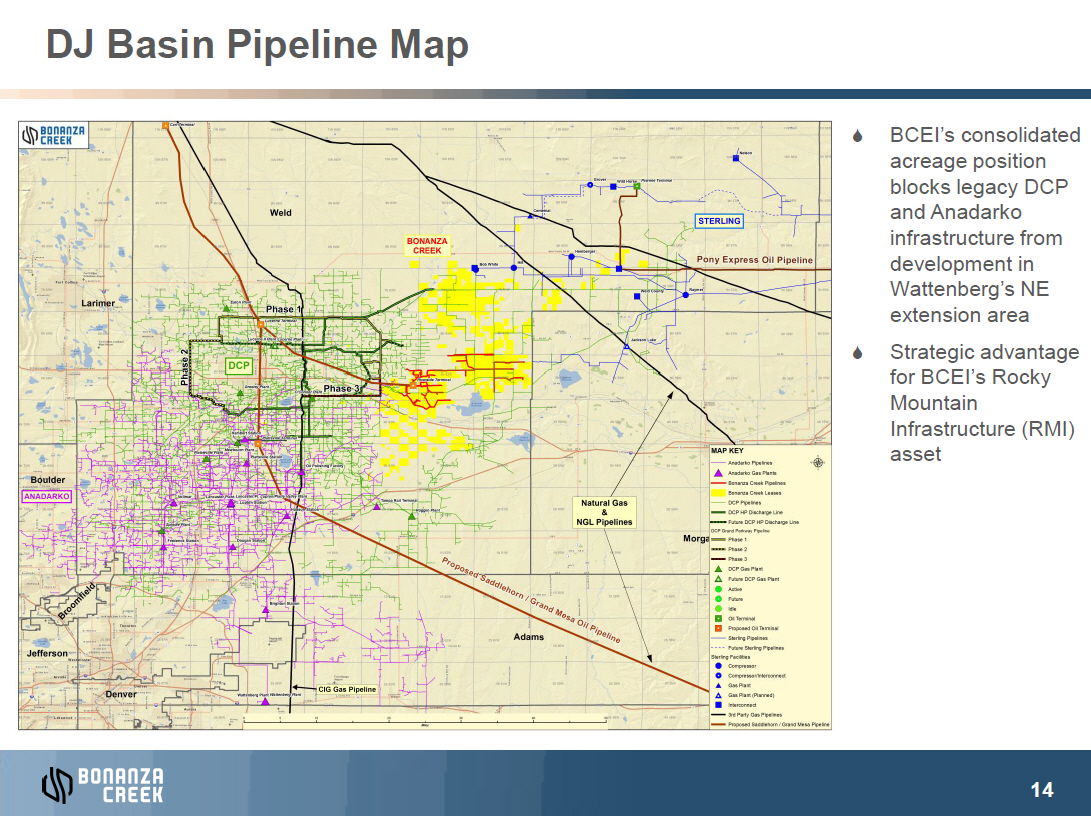
DJ Basin Pipeline Map IMAGE OMITTED S BCEI’s consol acreage position blocks legacy DCP and Anadarko infrastructure from development in Wattenberg’s extension area S Strategic advantage for BCEI’s Ro Mountain Infrastructure (RMI) asset IMAGE OMITTED
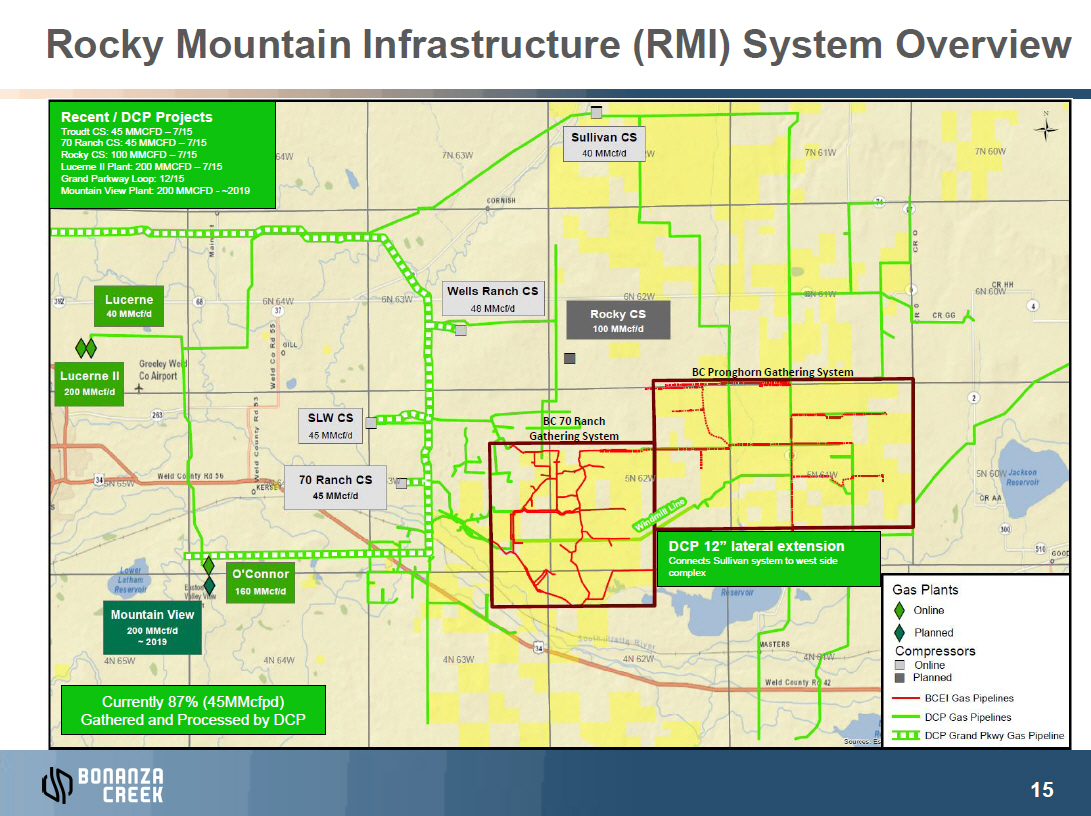
Rocky Mountain Infrastructure (RMI) System Overview IMAGE OMITTED Recent / DCP Projects Troudt CS: 45 MMCFD – 7/15 70 Ranch CS: 45 MMCFD – 7/15 Rocky CS: 100 MMCFD – 7/15 Lucerne II Plant: 200 MMCFD – 7/15 Grand Parkway Loop: 12/15 Mountain View Plant: 200 MMCFD - ~2019 BC Pronghorn Gathering System BC 70 Ranch Gathering System DCP 12” lateral extension Connects Sullivan system to west side complex
Currently 87% (45MMcfpd) Gathered and Processed by DCP IMAGE OMITTED
RMI Centralized Production Facility (CPF) Strategy
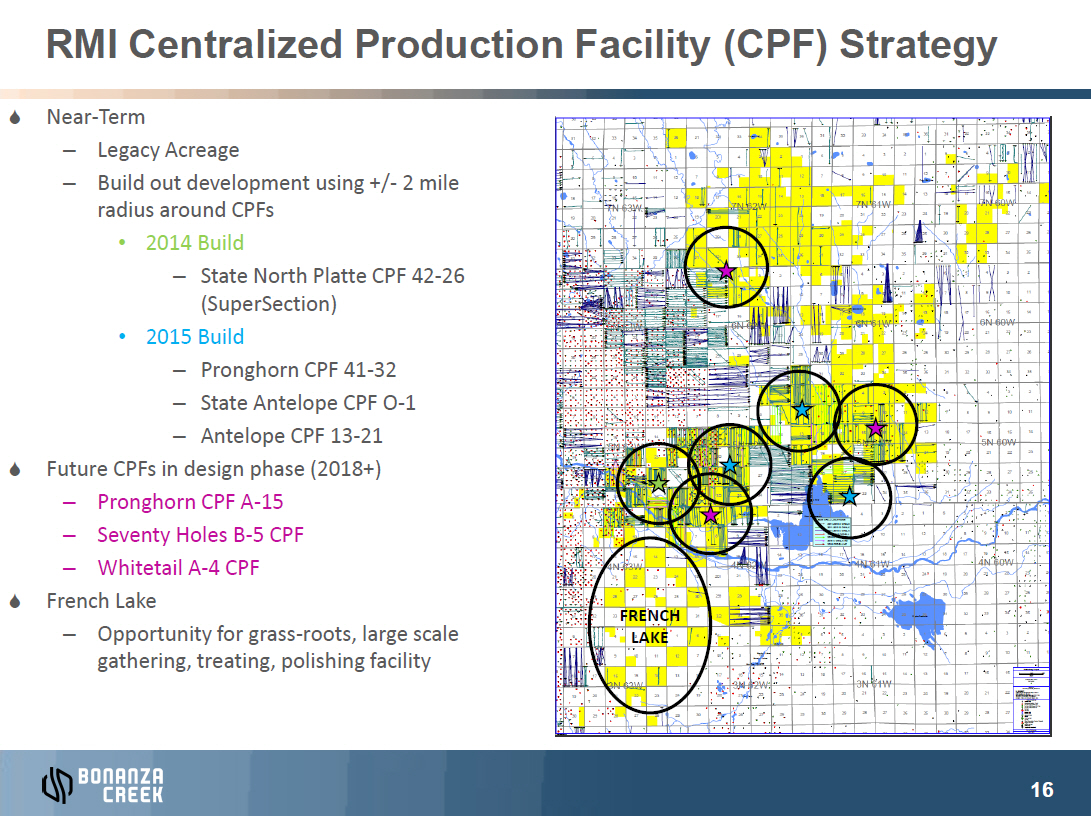
S Near-Term
–
Legacy Acreage –
Build out development using +/- 2 mile radius around CPFs • 2014
Build – State North Platte CPF 42-26 (SuperSection)
• 2015 Build –
Pronghorn CPF 41-32 – State Antelope CPF
O-1 – Antelope CPF 13-21 S Future
CPFs in design phase (2018+) –
Pronghorn CPF A-15 –
Seventy Holes B-5 CPF –
Whitetail A-4 CPF S French Lake –
Opportunity for grass-roots, large scale gathering, treating, polishing facility IMAGE
OMITTED
FRENCH IMAGE
OMITTEDLAKE
Contents IMAGE OMITTED Corporate Overview IMAGE OMITTED DJ Basin Overview IMAGE OMITTED Business Plan IMAGE OMITTED Acreage IMAGE OMITTED Reserves and Type Curves IMAGE OMITTED Firm Transportation Commitments IMAGE OMITTED Rocky Mountain Infrastructure Assets IMAGE OMITTED

Base Case Business Plan – 1-Rig 1Q17, 2-Rig 2Q17, 3-Rig 4Q17 Drilling Program and Strip Pricing(1) ($ in millions) Depicts BCEI’s base case business plan, which includes a 1-rig drilling program starting in 2017 increasing to 3 rigs by year end. Projections do not include transportation costs / penalties under current pipeline contracts 2016 2017 2018 Jun-16 Jul-16 Aug-16 Sep-16 Oct-16 Nov-16 Dec-16 1Q 2017 2Q 2017 3Q 2017 4Q 2017 2017 1Q 2018 2Q 2018 3Q 2018 4Q 2018 2018 Rockies Gross Operated Production Crude Oil (b/d) 13,466 11,778 11,172 10,656 10,208 9,335 8,999 8,980 10,935 16,267 19,620 13,986 23,278 27,321 29,880 31,005 27,897 Rockies Net Production Crude Oil (b/d) 10,268 9,107 8,672 8,272 7,925 7,254 6,995 6,929 8,120 12,417 13,831 10,349 15,201 18,125 18,856 20,779 18,257 NGLs (b/d) 3,828 3,647 3,485 3,346 3,223 2,877 2,784 2,775 2,845 3,586 4,310 3,384 4,713 5,333 5,771 6,171 5,502 Natural Gas (Mcf/d) 27,301 28,887 27,670 26,527 25,529 22,753 22,005 21,918 22,344 27,827 33,191 26,355 36,164 40,769 44,021 46,988 42,021 Rockies Equivalent (boe/d) 18,646 17,569 16,769 16,039 15,404 13,924 13,447 13,357 14,689 20,641 23,673 18,125 25,941 30,252 31,965 34,781 30,762 Mid-Con Net Production Crude Oil (b/d) 2,412 2,056 2,018 1,972 1,925 1,895 1,854 1,760 1,650 1,561 1,485 1,613 1,420 1,362 1,310 1,262 1,338 NGLs (b/d) 685 651 642 628 612 604 589 554 518 489 464 506 443 424 407 392 416 Natural Gas (Mcf/d) 7,622 7,149 7,043 6,889 6,717 6,622 6,467 6,105 5,705 5,380 5,104 5,570 4,868 4,661 4,473 4,303 4,574 Mid-Con Equivalent (boe/d) 4,367 3,898 3,834 3,749 3,656 3,602 3,520 3,331 3,119 2,947 2,800 3,048 2,674 2,563 2,462 2,371 2,516 Total Net Production (mboe/d) 23,013 21,467 20,603 19,788 19,060 17,526 16,967 16,688 17,808 23,588 26,473 21,173 28,615 32,815 34,427 37,152 33,279 Realized Oil ($/bbl)(2) $43.37 $49.67 $49.55 $49.98 $50.13 $50.49 $50.77 $49.49 $50.36 $50.89 $51.43 $50.71 $51.89 $52.32 $52.71 $53.17 $52.57 NGL ($/bbl)(2) $10.59 $13.23 $13.27 $13.51 $13.69 $14.05 $14.25 $14.43 $14.53 $14.25 $14.11 $14.30 $14.09 $14.04 $14.05 $14.08 $14.06 Gas ($/Mcf)(2) $1.50 $2.20 $2.21 $2.19 $2.22 $2.38 $2.59 $2.67 $2.44 $2.44 $2.49 $2.51 $2.60 $2.22 $2.24 $2.32 $2.34 Realized Prices ($/boe)(2) $28.25 $32.18 $32.09 $32.28 $32.43 $33.14 $33.67 $33.14 $34.22 $36.06 $35.90 $35.06 $36.41 $36.61 $36.56 $37.23 $36.73 Total Revenues $19.7 $21.6 $20.6 $19.3 $19.3 $17.6 $17.8 $50.1 $56.0 $78.8 $88.4 $273.3 $95.6 $111.2 $118.6 $129.7 $455.1 Less: Rockies Lease Operating Expense ($2.6) ($3.2) ($3.1) ($3.0) ($3.0) ($2.8) ($2.8) ($8.4) ($8.8) ($9.2) ($9.7) ($36.1) ($10.4) ($11.4) ($12.3) ($13.3) ($47.4) Less: Mid-Con Lease Operating Expense (1.7) (1.4) (1.4) (1.3) (1.3) (1.3) (1.3) (3.8) (3.7) (3.6) (3.6) (14.7) (3.5) (3.4) (3.4) (3.3) (13.6) Less: Production Tax (1.5) (1.3) (1.3) (1.2) (1.2) (1.1) (1.1) (3.2) (3.6) (5.2) (5.9) (18.0) (6.4) (7.5) (7.9) (8.7) (30.4) Less: G&A - Cash (3.8) (3.1) (3.1) (3.1) (3.1) (3.1) (3.1) (10.5) (10.5) (10.5) (10.5) (42.0) (10.5) (10.5) (10.5) (10.5) (42.0) Less: RMI Operating Expense (0.5) (0.5) (0.5) (0.5) (0.5) (0.5) (0.5) (1.4) (1.4) (1.5) (1.7) (5.9) (1.9) (2.1) (2.3) (2.4) (8.7) Less: Total Operating Expenses ($10.2) ($9.4) ($9.3) ($9.1) ($9.1) ($8.8) ($8.8) ($27.3) ($28.0) ($30.1) ($31.3) ($116.7) ($32.6) ($34.8) ($36.4) ($38.2) ($142.1) EBITDAX $9.5 $12.2 $11.4 $10.2 $10.2 $8.8 $9.1 $22.9 $28.0 $48.7 $57.1 $156.6 $62.9 $76.4 $82.1 $91.5 $313.0 Less: Total Adjustments(3) - 1.6 1.3 (0.9) (0.6) 0.1 (0.8) 4.2 (0.3) 2.8 13.9 20.6 3.8 (2.0) 4.2 (8.0) (2.7) Operating Cash Flow $9.5 $13.7 $12.7 $9.4 $9.6 $8.9 $8.3 $27.1 $27.7 $51.5 $71.0 $177.3 $66.7 $74.5 $86.3 $83.6 $310.3 E&P Capex (0.3) (2.0) (2.7) (1.1) (0.6) (1.0) (0.2) (25.4) (58.6) (63.7) (71.5) (219.2) (75.4) (79.9) (92.8) (86.7) (334.8) RMI Capex - (0.2) (0.2) - - - - (29.8) (44.6) (19.2) (14.4) (108.1) (14.2) (14.4) (10.0) (16.0) (54.6) Less: Total Capex (0.3) (2.2) (2.9) (1.1) (0.6) (1.0) (0.2) (55.3) (103.2) (82.9) (85.9) (327.2) (89.6) (94.3) (102.8) (102.7) (389.4) Less: (Increase) / Decrease in Working Capital 22.0 3.8 (4.9) 3.8 (13.1) 3.9 3.8 (3.9) (18.0) 10.3 2.1 (9.6) 2.6 (14.9) 9.1 0.9 (2.3) Unlevered FCF $31.2 $15.2 $4.9 $12.1 ($4.1) $11.7 $11.8 ($32.1) ($93.5) ($21.1) ($12.9) ($159.5) ($20.4) ($34.7) ($7.4) ($18.2) ($81.4) EBITDAX Under Current Pipeline Transport Agreeements $9.5 $9.7 $8.9 $7.9 $7.8 $3.9 $4.0 $7.6 $12.7 $32.7 $41.9 $94.9 $49.2 $62.3 $67.6 $75.6 $254.7 IMAGE OMITTED
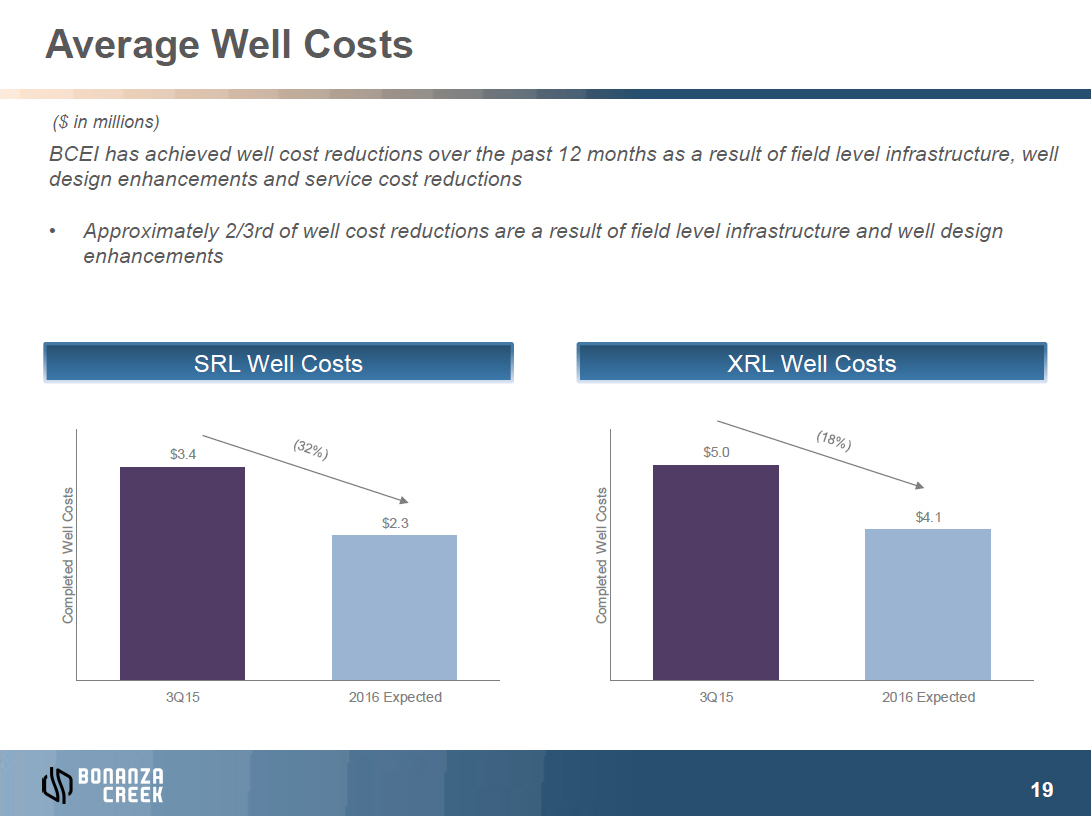
Average Well Costs ($ in millions) BCEI has achieved well cost reductions over the past 12 months as a result of field level infrastructure, well design enhancements and service cost reductions • Approximately 2/3rd of well cost reductions are a result of field level infrastructure and well design enhancements IMAGE OMITTED
$3.4 Costs Well Completed
$2.3
$5.0 Costs Well Completed
$4.1
3Q15 2016 Expected 3Q15 2016 Expected IMAGE OMITTED
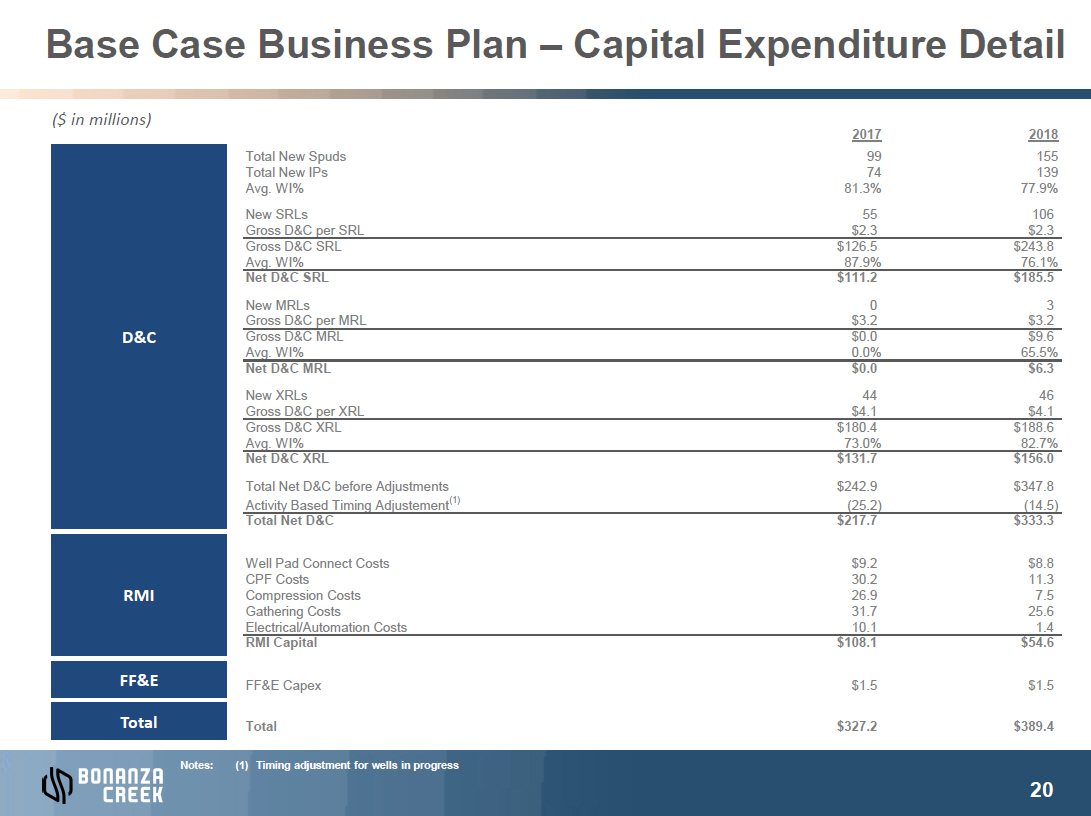
Base Case Business Plan – Capital Expenditure Detail
($
in millions) IMAGE OMITTED D&C IMAGE
OMITTED RMI IMAGE
OMITTED FF&E IMAGE
OMITTED Total IMAGE
OMITTED
2017 2018 Total
New Spuds 99 155 Total New IPs 74 139 Avg. WI% 81.3% 77.9% New SRLs 55 106 Gross
D&C per SRL $2.3 $2.3 Gross D&C SRL $126.5 $243.8 Avg. WI% 87.9% 76.1% Net
D&C SRL $111.2 $185.5 New MRLs 0 3 Gross D&C per MRL $3.2 $3.2 Gross D&C
MRL $0.0 $9.6 Avg. WI% 0.0% 65.5% Net D&C MRL $0.0 $6.3 New XRLs 44 46 Gross
D&C per XRL $4.1 $4.1 Gross D&C XRL $180.4 $188.6 Avg. WI% 73.0% 82.7% Net
D&C XRL $131.7 $156.0 Total Net D&C before Adjustments $242.9 $347.8 Activity Based Timing
Adjustement(1) (25.2) (14.5) Total Net D&C $217.7 $333.3 Well Pad Connect Costs $9.2 $8.8 CPF
Costs 30.2 11.3 Compression Costs 26.9 7.5 Gathering Costs 31.7 25.6 Electrical/Automation
Costs 10.1 1.4 RMI Capital $108.1 $54.6 FF&E Capex $1.5 $1.5 Total $327.2 $389.4
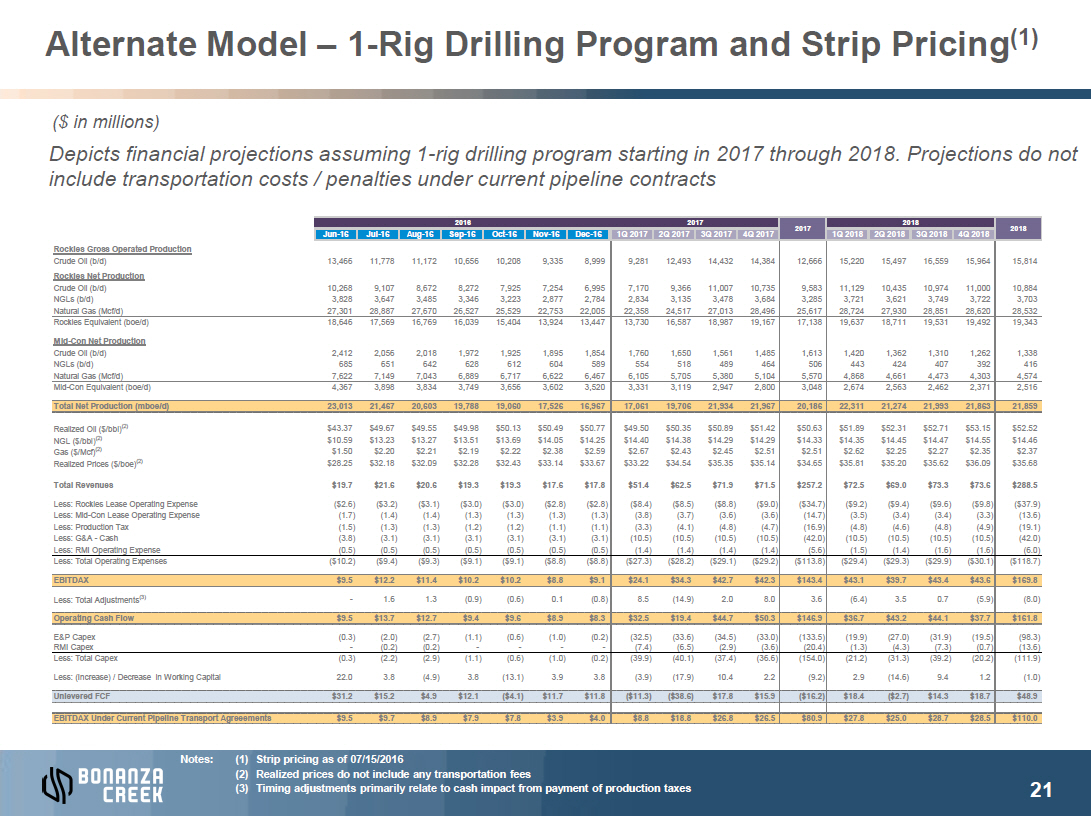
Alternate Model – 1-Rig Drilling Program and Strip Pricing(1) ($ in millions) Depicts financial projections assuming 1-rig drilling program starting in 2017 through 2018. Projections do not include transportation costs / penalties under current pipeline contracts 2016 2017 2018 Jun-16 Jul-16 Aug-16 Sep-16 Oct-16 Nov-16 Dec-16 1Q 2017 2Q 2017 3Q 2017 4Q 2017 2017 1Q 2018 2Q 2018 3Q 2018 4Q 2018 2018 Rockies Gross Operated Production Crude Oil (b/d) 13,466 11,778 11,172 10,656 10,208 9,335 8,999 9,281 12,493 14,432 14,384 12,666 15,220 15,497 16,559 15,964 15,814 Rockies Net Production Crude Oil (b/d) 10,268 9,107 8,672 8,272 7,925 7,254 6,995 7,170 9,366 11,007 10,735 9,583 11,129 10,435 10,974 11,000 10,884 NGLs (b/d) 3,828 3,647 3,485 3,346 3,223 2,877 2,784 2,834 3,135 3,478 3,684 3,285 3,721 3,621 3,749 3,722 3,703 Natural Gas (Mcf/d) 27,301 28,887 27,670 26,527 25,529 22,753 22,005 22,358 24,517 27,013 28,496 25,617 28,724 27,930 28,851 28,620 28,532 Rockies Equivalent (boe/d) 18,646 17,569 16,769 16,039 15,404 13,924 13,447 13,730 16,587 18,987 19,167 17,138 19,637 18,711 19,531 19,492 19,343 Mid-Con Net Production Crude Oil (b/d) 2,412 2,056 2,018 1,972 1,925 1,895 1,854 1,760 1,650 1,561 1,485 1,613 1,420 1,362 1,310 1,262 1,338 NGLs (b/d) 685 651 642 628 612 604 589 554 518 489 464 506 443 424 407 392 416 Natural Gas (Mcf/d) 7,622 7,149 7,043 6,889 6,717 6,622 6,467 6,105 5,705 5,380 5,104 5,570 4,868 4,661 4,473 4,303 4,574 Mid-Con Equivalent (boe/d) 4,367 3,898 3,834 3,749 3,656 3,602 3,520 3,331 3,119 2,947 2,800 3,048 2,674 2,563 2,462 2,371 2,516 Total Net Production (mboe/d) 23,013 21,467 20,603 19,788 19,060 17,526 16,967 17,061 19,706 21,934 21,967 20,186 22,311 21,274 21,993 21,863 21,859 Realized Oil ($/bbl)(2) $43.37 $49.67 $49.55 $49.98 $50.13 $50.49 $50.77 $49.50 $50.35 $50.89 $51.42 $50.63 $51.89 $52.31 $52.71 $53.15 $52.52 NGL ($/bbl)(2) $10.59 $13.23 $13.27 $13.51 $13.69 $14.05 $14.25 $14.40 $14.38 $14.29 $14.29 $14.33 $14.35 $14.45 $14.47 $14.55 $14.46 Gas ($/Mcf)(2) $1.50 $2.20 $2.21 $2.19 $2.22 $2.38 $2.59 $2.67 $2.43 $2.45 $2.51 $2.51 $2.62 $2.25 $2.27 $2.35 $2.37 Realized Prices ($/boe)(2) $28.25 $32.18 $32.09 $32.28 $32.43 $33.14 $33.67 $33.22 $34.54 $35.35 $35.14 $34.65 $35.81 $35.20 $35.62 $36.09 $35.68 Total Revenues $19.7 $21.6 $20.6 $19.3 $19.3 $17.6 $17.8 $51.4 $62.5 $71.9 $71.5 $257.2 $72.5 $69.0 $73.3 $73.6 $288.5 Less: Rockies Lease Operating Expense ($2.6) ($3.2) ($3.1) ($3.0) ($3.0) ($2.8) ($2.8) ($8.4) ($8.5) ($8.8) ($9.0) ($34.7) ($9.2) ($9.4) ($9.6) ($9.8) ($37.9) Less: Mid-Con Lease Operating Expense (1.7) (1.4) (1.4) (1.3) (1.3) (1.3) (1.3) (3.8) (3.7) (3.6) (3.6) (14.7) (3.5) (3.4) (3.4) (3.3) (13.6) Less: Production Tax (1.5) (1.3) (1.3) (1.2) (1.2) (1.1) (1.1) (3.3) (4.1) (4.8) (4.7) (16.9) (4.8) (4.6) (4.8) (4.9) (19.1) Less: G&A - Cash (3.8) (3.1) (3.1) (3.1) (3.1) (3.1) (3.1) (10.5) (10.5) (10.5) (10.5) (42.0) (10.5) (10.5) (10.5) (10.5) (42.0) Less: RMI Operating Expense (0.5) (0.5) (0.5) (0.5) (0.5) (0.5) (0.5) (1.4) (1.4) (1.4) (1.4) (5.6) (1.5) (1.4) (1.6) (1.6) (6.0) Less: Total Operating Expenses ($10.2) ($9.4) ($9.3) ($9.1) ($9.1) ($8.8) ($8.8) ($27.3) ($28.2) ($29.1) ($29.2) ($113.8) ($29.4) ($29.3) ($29.9) ($30.1) ($118.7) EBITDAX $9.5 $12.2 $11.4 $10.2 $10.2 $8.8 $9.1 $24.1 $34.3 $42.7 $42.3 $143.4 $43.1 $39.7 $43.4 $43.6 $169.8 Less: Total Adjustments(3) - 1.6 1.3 (0.9) (0.6) 0.1 (0.8) 8.5 (14.9) 2.0 8.0 3.6 (6.4) 3.5 0.7 (5.9) (8.0) Operating Cash Flow $9.5 $13.7 $12.7 $9.4 $9.6 $8.9 $8.3 $32.5 $19.4 $44.7 $50.3 $146.9 $36.7 $43.2 $44.1 $37.7 $161.8 E&P Capex (0.3) (2.0) (2.7) (1.1) (0.6) (1.0) (0.2) (32.5) (33.6) (34.5) (33.0) (133.5) (19.9) (27.0) (31.9) (19.5) (98.3) RMI Capex - (0.2) (0.2) - - - - (7.4) (6.5) (2.9) (3.6) (20.4) (1.3) (4.3) (7.3) (0.7) (13.6) Less: Total Capex (0.3) (2.2) (2.9) (1.1) (0.6) (1.0) (0.2) (39.9) (40.1) (37.4) (36.6) (154.0) (21.2) (31.3) (39.2) (20.2) (111.9) Less: (Increase) / Decrease in Working Capital 22.0 3.8 (4.9) 3.8 (13.1) 3.9 3.8 (3.9) (17.9) 10.4 2.2 (9.2) 2.9 (14.6) 9.4 1.2 (1.0) Unlevered FCF $31.2 $15.2 $4.9 $12.1 ($4.1) $11.7 $11.8 ($11.3) ($38.6) $17.8 $15.9 ($16.2) $18.4 ($2.7) $14.3 $18.7 $48.9 EBITDAX Under Current Pipeline Transport Agreeements $9.5 $9.7 $8.9 $7.9 $7.8 $3.9 $4.0 $8.8 $18.8 $26.8 $26.5 $80.9 $27.8 $25.0 $28.7 $28.5 $110.0 IMAGE OMITTED
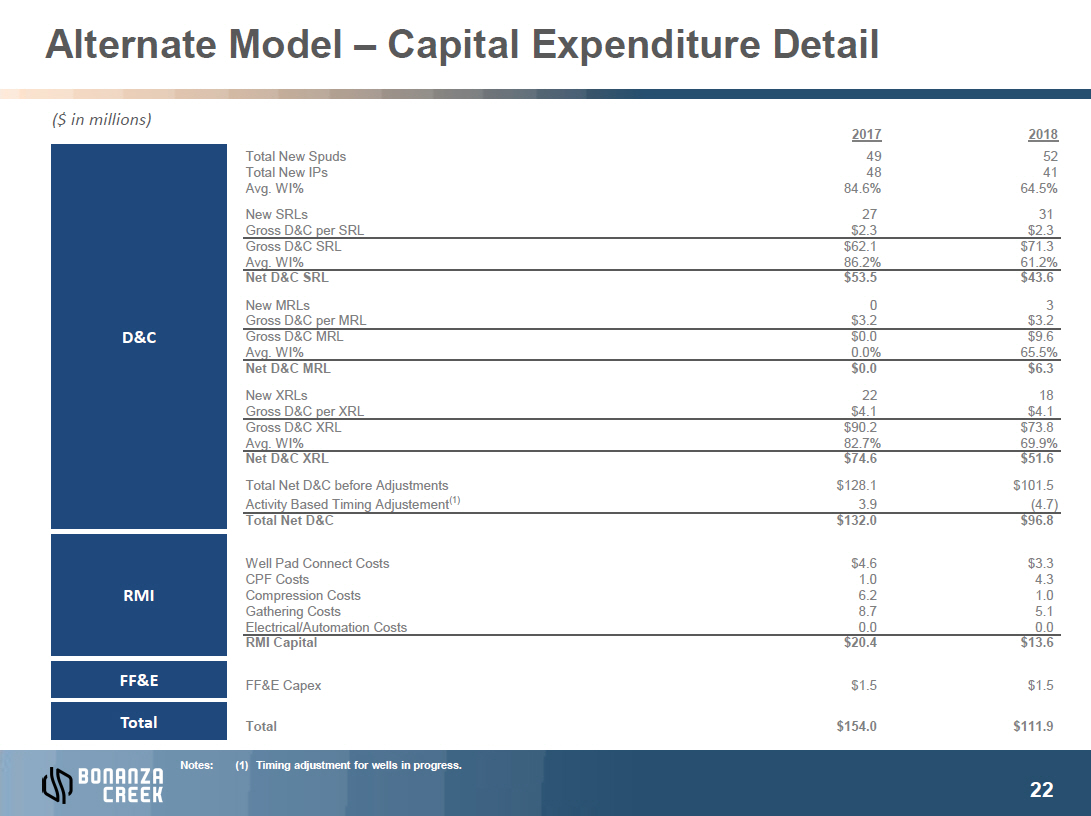
Alternate Model – Capital Expenditure Detail
($
in millions) IMAGE OMITTED D&C IMAGE
OMITTED RMI IMAGE
OMITTED FF&E IMAGE
OMITTED Total IMAGE
OMITTED
2017 2018 Total
New Spuds 49 52 Total New IPs 48 41 Avg. WI% 84.6% 64.5% New SRLs 27 31 Gross
D&C per SRL $2.3 $2.3 Gross D&C SRL $62.1 $71.3 Avg. WI% 86.2% 61.2% Net
D&C SRL $53.5 $43.6 New MRLs 0 3 Gross D&C per MRL $3.2 $3.2 Gross D&C
MRL $0.0 $9.6 Avg. WI% 0.0% 65.5% Net D&C MRL $0.0 $6.3 New XRLs 22 18 Gross
D&C per XRL $4.1 $4.1 Gross D&C XRL $90.2 $73.8 Avg. WI% 82.7% 69.9% Net
D&C XRL $74.6 $51.6 Total Net D&C before Adjustments $128.1 $101.5 Activity Based Timing
Adjustement(1) 3.9 (4.7) Total Net D&C $132.0 $96.8 Well Pad Connect Costs $4.6 $3.3 CPF
Costs 1.0 4.3 Compression Costs 6.2 1.0 Gathering Costs 8.7 5.1 Electrical/Automation
Costs 0.0 0.0 RMI Capital $20.4 $13.6 FF&E Capex $1.5 $1.5 Total $154.0 $111.9

Capital Constrained Model – Zero-Rig Drilling Program and Strip Pricing(1) ($ in millions) Depicts financial projections assuming no drilling through 2019. Projections do not include transportation costs / penalties under current pipeline contracts IMAGE OMITTED 2016 2017 2017 2018 2018 Jun-16 Jul-16 Aug-16 Sep-16 Oct-16 Nov-16 Dec-16 1Q 2017 2Q 2017 3Q 2017 4Q 2017 1Q 2018 2Q 2018 3Q 2018 4Q 2018 Rockies Gross Operated Production Crude Oil (b/d) 13,466 11,778 11,172 10,656 10,208 9,335 8,999 8,992 8,580 7,859 7,527 8,234 7,254 7,472 7,235 6,643 7,149 Rockies Net Production Crude Oil (b/d) 10,268 9,107 8,672 8,272 7,925 7,254 6,995 6,947 6,434 5,990 5,617 6,243 5,303 5,032 4,791 4,576 4,923 NGLs (b/d) 3,828 3,647 3,485 3,346 3,223 2,877 2,784 2,768 2,543 2,367 2,220 2,473 2,096 1,989 1,893 1,809 1,946 Natural Gas (Mcf/d) 27,301 28,887 27,670 26,527 25,529 22,753 22,005 21,855 20,062 18,677 17,516 19,513 16,536 15,691 14,940 14,270 15,352 Rockies Equivalent (boe/d) 18,646 17,569 16,769 16,039 15,404 13,924 13,447 13,357 12,320 11,470 10,757 11,967 10,155 9,636 9,175 8,763 9,428 Mid-Con Net Production Crude Oil (b/d) 2,412 2,056 2,018 1,972 1,925 1,895 1,854 1,760 1,650 1,561 1,485 1,613 1,420 1,362 1,310 1,262 1,338 NGLs (b/d) 685 651 642 628 612 604 589 554 518 489 464 506 443 424 407 392 416 Natural Gas (Mcf/d) 7,622 7,149 7,043 6,889 6,717 6,622 6,467 6,105 5,705 5,380 5,104 5,570 4,868 4,661 4,473 4,303 4,574 Mid-Con Equivalent (boe/d) 4,367 3,898 3,834 3,749 3,656 3,602 3,520 3,331 3,119 2,947 2,800 3,048 2,674 2,563 2,462 2,371 2,516 Total Net Production (mboe/d) 23,013 21,467 20,603 19,788 19,060 17,526 16,967 16,688 15,440 14,417 13,557 15,015 12,829 12,199 11,637 11,134 11,944 Realized Oil ($/bbl)(2) $43.37 $49.67 $49.55 $49.98 $50.13 $50.49 $50.77 $49.49 $50.35 $50.87 $51.42 $50.49 $51.89 $52.31 $52.71 $53.15 $52.49 NGL ($/bbl)(2) $10.59 $13.23 $13.27 $13.51 $13.69 $14.05 $14.25 $14.44 $14.72 $14.90 $15.08 $14.77 $15.24 $15.38 $15.51 $15.65 $15.44 Gas ($/Mcf)(2) $1.50 $2.20 $2.21 $2.19 $2.22 $2.38 $2.59 $2.67 $2.46 $2.49 $2.57 $2.55 $2.69 $2.31 $2.34 $2.42 $2.45 Realized Prices ($/boe)(2) $28.25 $32.18 $32.09 $32.28 $32.43 $33.14 $33.67 $33.18 $33.38 $33.75 $34.21 $33.60 $34.70 $34.32 $34.60 $35.01 $34.65 Total Revenues $19.7 $21.6 $20.6 $19.3 $19.3 $17.6 $17.8 $50.2 $47.2 $45.1 $43.0 $185.5 $40.3 $38.3 $37.3 $36.0 $152.0 Less: Rockies Lease Operating Expense ($2.6) ($3.2) ($3.1) ($3.0) ($3.0) ($2.8) ($2.8) ($8.3) ($8.1) ($7.9) ($7.7) ($32.0) ($7.5) ($7.4) ($7.3) ($7.2) ($29.5) Less: Mid-Con Lease Operating Expense (1.7) (1.4) (1.4) (1.3) (1.3) (1.3) (1.3) (3.8) (3.7) (3.6) (3.6) (14.7) (3.5) (3.4) (3.4) (3.3) (13.6) Less: Production Tax (1.5) (1.3) (1.3) (1.2) (1.2) (1.1) (1.1) (3.2) (3.0) (2.9) (2.8) (12.0) (2.6) (2.5) (2.4) (2.3) (9.8) Less: G&A - Cash (3.8) (3.1) (3.1) (3.1) (3.1) (3.1) (3.1) (10.5) (10.5) (10.5) (10.5) (42.0) (8.9) (8.9) (8.9) (8.9) (35.6) Less: RMI Operating Expense (0.5) (0.5) (0.5) (0.5) (0.5) (0.5) (0.5) (1.4) (1.4) (1.4) (1.4) (5.4) (1.4) (1.4) (1.4) (1.4) (5.4) Less: Total Operating Expenses ($10.2) ($9.4) ($9.3) ($9.1) ($9.1) ($8.8) ($8.8) ($27.2) ($26.7) ($26.3) ($25.9) ($106.1) ($23.8) ($23.5) ($23.3) ($23.1) ($93.8) EBITDAX $9.5 $12.2 $11.4 $10.2 $10.2 $8.8 $9.1 $23.0 $20.6 $18.8 $17.1 $79.4 $16.5 $14.8 $13.9 $12.9 $58.2 Less: Total Adjustments(3) - 1.6 1.3 (0.9) (0.6) 0.1 (0.8) (8.5) (13.7) 6.5 6.5 (9.1) (0.0) - - - (0.3) Operating Cash Flow $9.5 $13.7 $12.7 $9.4 $9.6 $8.9 $8.3 $14.6 $6.9 $25.3 $23.5 $70.3 $16.5 $14.8 $13.9 $12.9 $57.9 E&P Capex (0.3) (2.0) (2.7) (1.1) (0.6) (1.0) (0.2) (0.4) (0.4) (0.4) (0.4) (1.5) (0.4) (0.4) (0.4) (0.4) (1.5) RMI Capex - (0.2) (0.2) - - - - - - - - - - - - - - Less: Total Capex (0.3) (2.2) (2.9) (1.1) (0.6) (1.0) (0.2) (0.4) (0.4) (0.4) (0.4) (1.5) (0.4) (0.4) (0.4) (0.4) (1.5) Less: (Increase) / Decrease in Working Capital 22.0 3.8 (4.9) 3.8 (13.1) 3.9 3.8 (3.9) (17.8) 10.6 2.4 (8.7) 4.1 (14.7) 9.3 1.0 (0.3) Unlevered FCF $31.2 $15.2 $4.9 $12.1 ($4.1) $11.7 $11.8 $10.3 ($11.3) $35.6 $25.5 $60.1 $20.3 ($0.3) $22.9 $13.6 $56.2 EBITDAX Under Current Pipeline Transport Agreeements $9.5 $9.7 $8.9 $7.9 $7.8 $3.9 $4.0 $7.7 $5.3 $3.3 $1.7 $18.0 $1.6 ($0.0) ($1.0) ($2.1) ($1.5) IMAGE OMITTED
Contents IMAGE OMITTED Corporate Overview IMAGE OMITTED DJ Basin Overview IMAGE OMITTED Business Plan IMAGE OMITTED Acreage IMAGE OMITTED Reserves and Type Curves IMAGE OMITTED Firm Transportation Commitments IMAGE OMITTED Rocky Mountain Infrastructure Assets IMAGE OMITTED
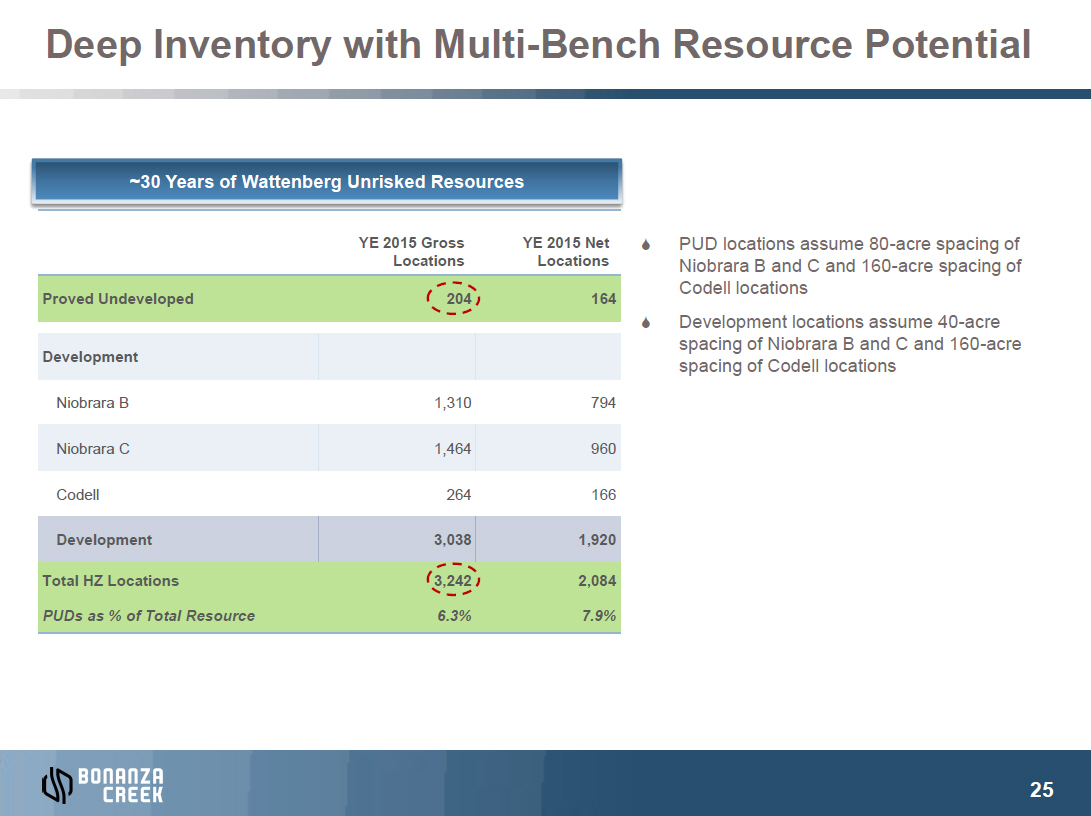
IMAGE OMITTEDDeep Inventory with Multi-Bench Resource Potential ~30 Years of Wattenberg Unrisked Resources
YE
2015 Gross YE 2015 Net Locations Locations Proved Undeveloped 204 164 Development Niobrara
B 1,310 794 Niobrara C 1,464 960 Codell 264 166
S PUD
locations assume 80-acre spacing of Niobrara B and C and 160-acre spacing of Codell locations S Development
locations assume 40-acre spacing of Niobrara B and C and 160-acre spacing of Codell locations
Development 3,038 1,920 Total HZ Locations 3,242 2,084 PUDs as % of Total Resource 6.3% 7.9% IMAGE OMITTED
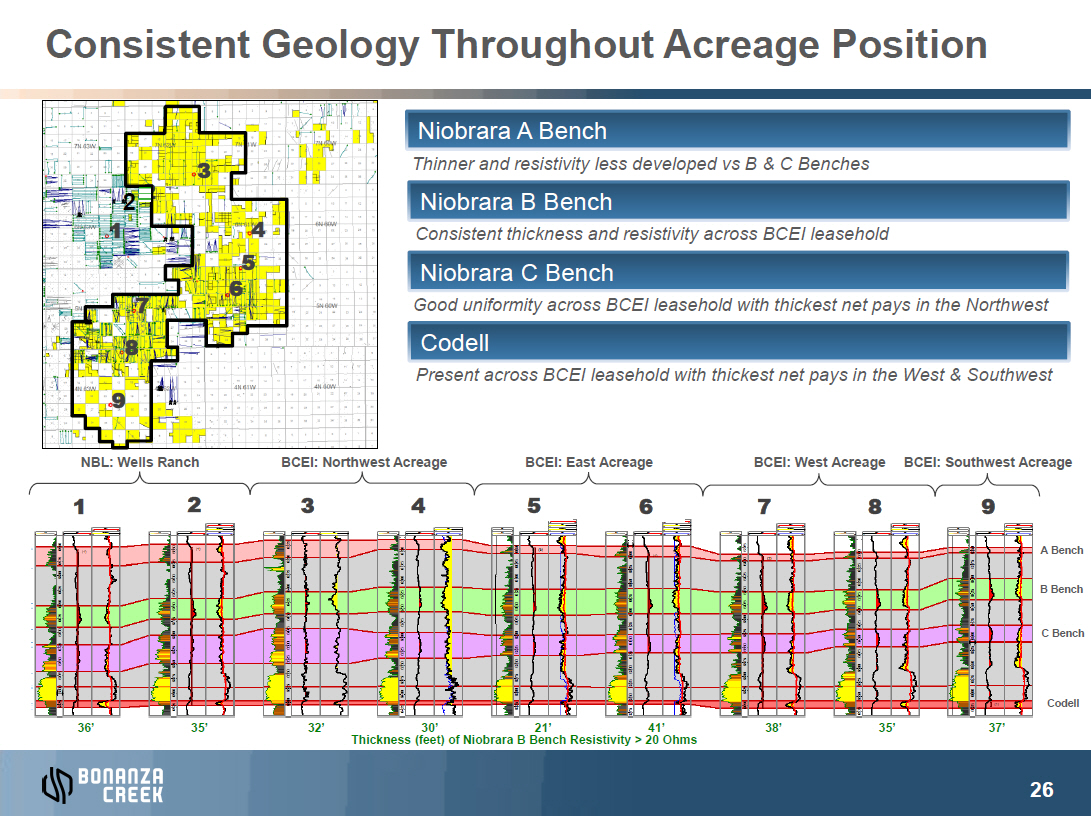
Consistent Geology Throughout Acreage Position Thinner and resistivity less developed vs B & C Benches 3 2 2 4 1 Consistent thickness and resistivity across BCEI leasehold 5 6 7 Good uniformity across BCEI leasehold with thickest net pays in the Northwest 8 Present across BCEI leasehold with thickest net pays in the West & Southwest 9 NBL: Wells Ranch BCEI: Northwest Acreage BCEI: East Acreage BCEI: West Acreage BCEI: Southwest Acreage IMAGE OMITTED
1 2 3 4 5 6 7 8
9 A Bench B Bench C Bench Codell
36’ 35’ 32’ 30’ 21’ 41’ 38’ 35’ 37’ Thickness (feet) of Niobrara B Bench Resistivity > 20 Ohms IMAGE OMITTED
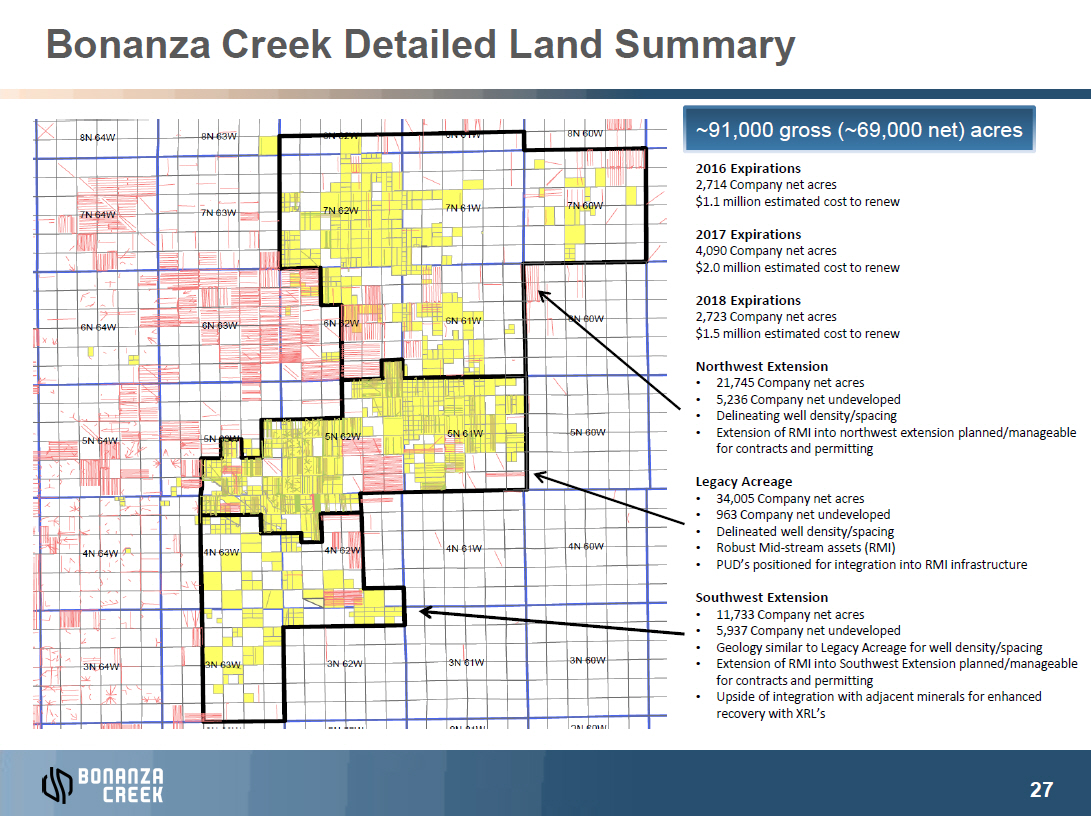
Bonanza Creek Detailed Land Summary IMAGE OMITTED 2016 Expirations 2,714 Company net acres $1.1 million estimated cost to renew 2017 Expirations 4,090 Company net acres $2.0 million estimated cost to renew 2018 Expirations 2,723 Company net acres $1.5 million estimated cost to renew Northwest Extension • 21,745 Company net acres • 5,236 Company net undeveloped • Delineating well density/spacing • Extension of RMI into northwest extension planned/manageable for contracts and permitting Legacy Acreage • 34,005 Company net acres • 963 Company net undeveloped • Delineated well density/spacing • Robust Mid-stream assets (RMI) • PUD’s positioned for integration into RMI infrastructure Southwest Extension • 11,733 Company net acres • 5,937 Company net undeveloped • Geology similar to Legacy Acreage for well density/spacing • Extension of RMI into Southwest Extension planned/manageable for contracts and permitting • Upside of integration with adjacent minerals for enhanced recovery with XRL’s IMAGE OMITTED
Contents IMAGE OMITTED Corporate Overview IMAGE OMITTED DJ Basin Overview IMAGE OMITTED Business Plan IMAGE OMITTED Acreage IMAGE OMITTED Reserves and Type Curves IMAGE OMITTED Firm Transportation Commitments IMAGE OMITTED Rocky Mountain Infrastructure Assets IMAGE OMITTED
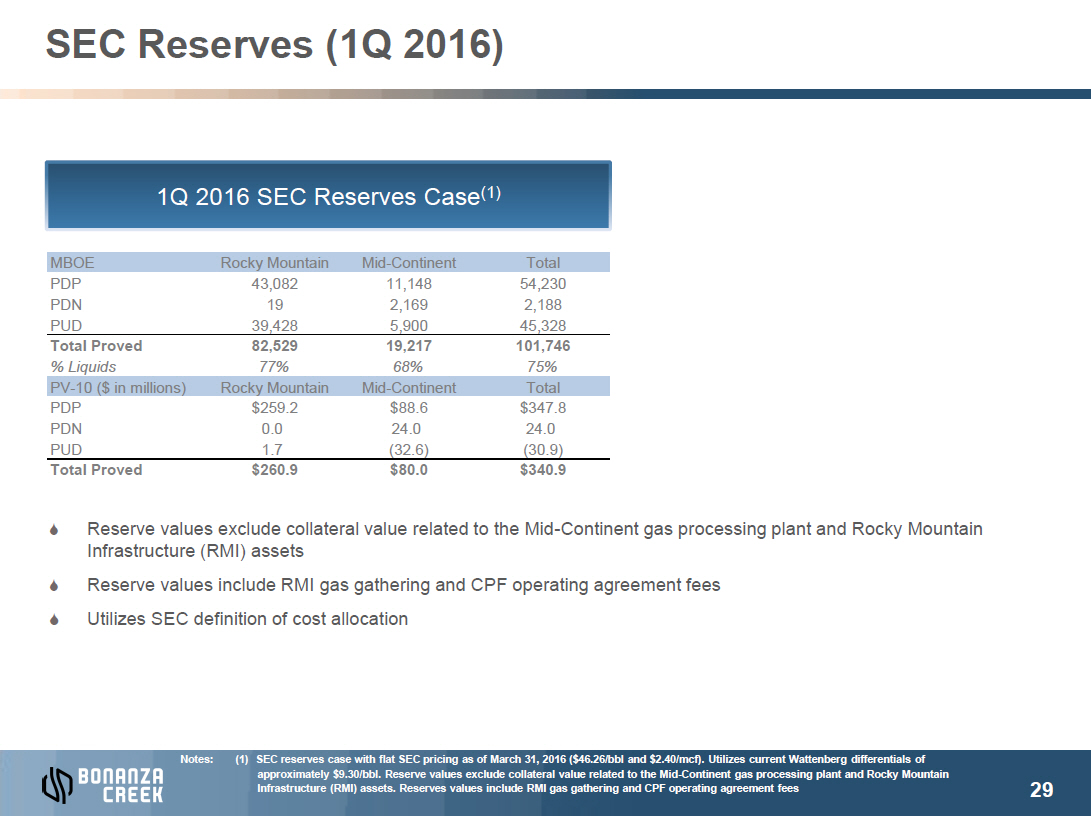
SEC Reserves (1Q 2016) IMAGE OMITTED MBOE Rocky Mountain Mid-Continent Total PDP 43,082 11,148 54,230 PDN 19 2,169 2,188 PUD 39,428 5,900 45,328 Total Proved 82,529 19,217 101,746 % Liquids 77% 68% 75% PV-10 ($ in millions) Rocky Mountain Mid-Continent Total PDP $259.2 $88.6 $347.8 PDN 0.0 24.0 24.0 PUD 1.7 (32.6) (30.9) Total Proved $260.9 $80.0 $340.9 S Reserve values exclude collateral value related to the Mid-Continent gas processing plant and Rocky Mountain Infrastructure (RMI) assets S Reserve values include RMI gas gathering and CPF operating agreement fees S Utilizes SEC definition of cost allocation IMAGE OMITTED
Collateral Reserves – Pricing Sensitivities (Current FT Contracts)
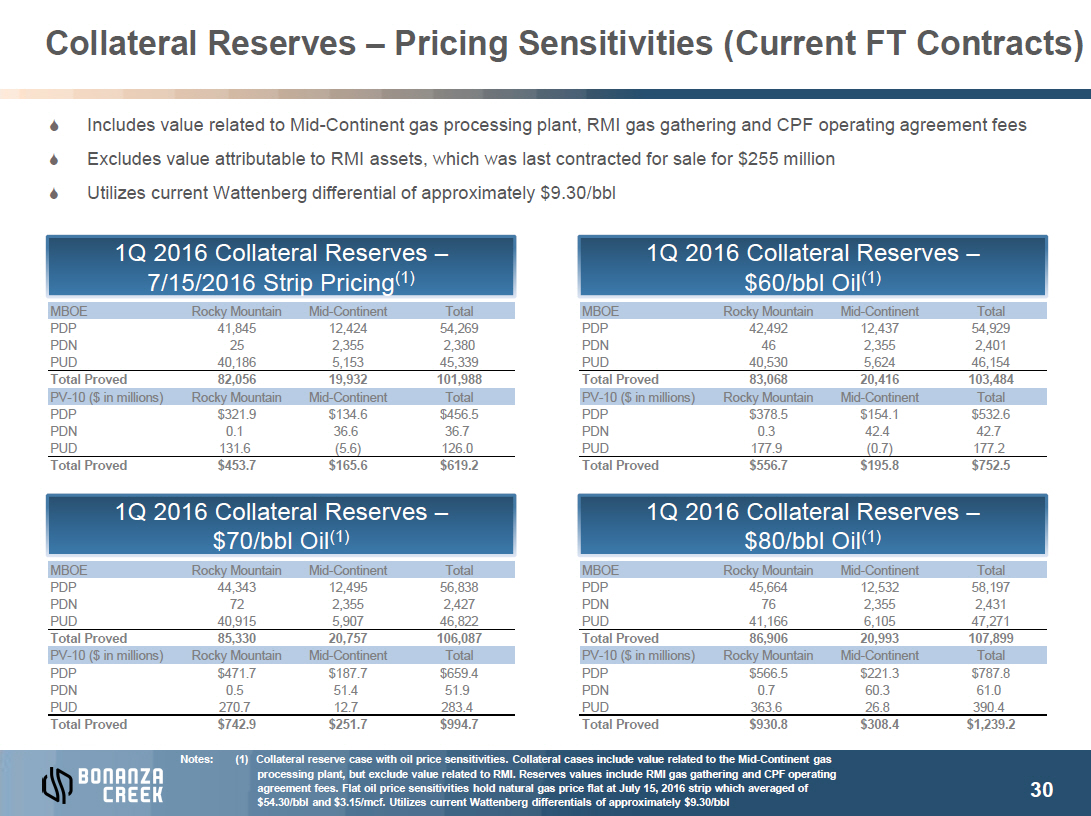
S Includes value related to Mid-Continent gas processing plant, RMI gas gathering and CPF operating agreement fees S Excludes value attributable to RMI assets, which was last contracted for sale for $255 million S Utilizes current Wattenberg differential of approximately $9.30/bbl IMAGE OMITTED
MBOE Rocky
Mountain Mid-Continent Total PDP 41,845 12,424 54,269 PDN 25 2,355 2,380 PUD 40,186 5,153 45,339 Total
Proved 82,056 19,932 101,988 PV-10 ($ in millions) Rocky Mountain Mid-Continent Total PDP $321.9 $134.6 $456.5 PDN 0.1 36.6 36.7 PUD 131.6 (5.6) 126.0 Total
Proved $453.7 $165.6 $619.2 IMAGE
OMITTED MBOE Rocky
Mountain Mid-Continent Total PDP 44,343 12,495 56,838 PDN 72 2,355 2,427 PUD 40,915 5,907 46,822 Total
Proved 85,330 20,757 106,087 PV-10 ($ in millions) Rocky Mountain Mid-Continent Total PDP $471.7 $187.7 $659.4 PDN 0.5 51.4 51.9 PUD 270.7 12.7 283.4 Total
Proved $742.9 $251.7 $994.7 IMAGE
OMITTED
MBOE Rocky Mountain Mid-Continent Total PDP 42,492 12,437 54,929 PDN 46 2,355 2,401 PUD 40,530 5,624 46,154 Total
Proved 83,068 20,416 103,484 PV-10 ($ in millions) Rocky Mountain Mid-Continent Total PDP $378.5 $154.1 $532.6 PDN 0.3 42.4 42.7 PUD 177.9 (0.7) 177.2 Total
Proved $556.7 $195.8 $752.5 IMAGE OMITTED MBOE Rocky
Mountain Mid-Continent Total PDP 45,664 12,532 58,197 PDN 76 2,355 2,431 PUD 41,166 6,105 47,271 Total
Proved 86,906 20,993 107,899 PV-10 ($ in millions) Rocky Mountain Mid-Continent Total PDP $566.5 $221.3 $787.8 PDN 0.7 60.3 61.0 PUD 363.6 26.8 390.4 Total
Proved $930.8 $308.4 $1,239.2
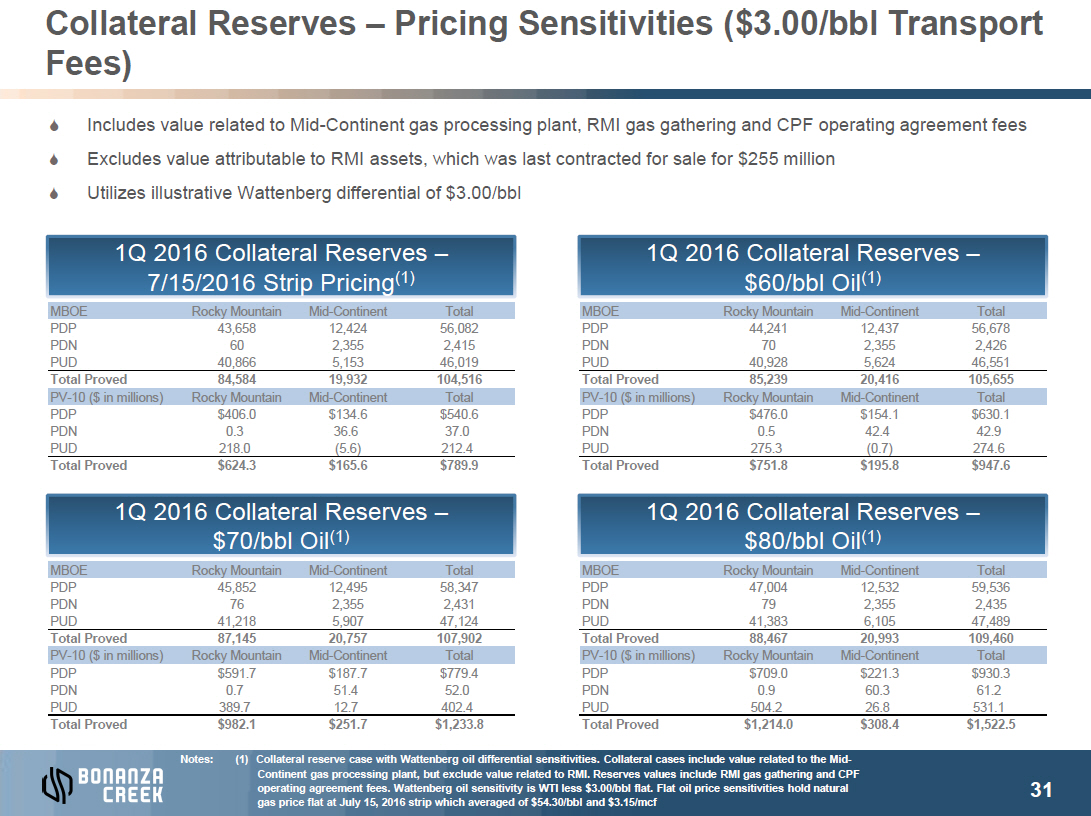
Collateral Reserves – Pricing Sensitivities ($3.00/bbl Transport Fees) S Includes value related to Mid-Continent gas processing plant, RMI gas gathering and CPF operating agreement fees S Excludes value attributable to RMI assets, which was last contracted for sale for $255 million S Utilizes illustrative Wattenberg differential of $3.00/bbl IMAGE OMITTED
MBOE Rocky
Mountain Mid-Continent Total PDP 43,658 12,424 56,082 PDN 60 2,355 2,415 PUD 40,866 5,153 46,019 Total
Proved 84,584 19,932 104,516 PV-10 ($ in millions) Rocky Mountain Mid-Continent Total PDP $406.0 $134.6 $540.6 PDN 0.3 36.6 37.0 PUD 218.0 (5.6) 212.4 Total
Proved $624.3 $165.6 $789.9 IMAGE
OMITTED MBOE Rocky
Mountain Mid-Continent Total PDP 45,852 12,495 58,347 PDN 76 2,355 2,431 PUD 41,218 5,907 47,124 Total
Proved 87,145 20,757 107,902 PV-10 ($ in millions) Rocky Mountain Mid-Continent Total PDP $591.7 $187.7 $779.4 PDN 0.7 51.4 52.0 PUD 389.7 12.7 402.4 Total
Proved $982.1 $251.7 $1,233.8 IMAGE
OMITTED
MBOE Rocky Mountain Mid-Continent Total PDP 44,241 12,437 56,678 PDN 70 2,355 2,426 PUD 40,928 5,624 46,551 Total
Proved 85,239 20,416 105,655 PV-10 ($ in millions) Rocky Mountain Mid-Continent Total PDP $476.0 $154.1 $630.1 PDN 0.5 42.4 42.9 PUD 275.3 (0.7) 274.6 Total
Proved $751.8 $195.8 $947.6 IMAGE OMITTED MBOE Rocky
Mountain Mid-Continent Total PDP 47,004 12,532 59,536 PDN 79 2,355 2,435 PUD 41,383 6,105 47,489 Total
Proved 88,467 20,993 109,460 PV-10 ($ in millions) Rocky Mountain Mid-Continent Total PDP $709.0 $221.3 $930.3 PDN 0.9 60.3 61.2 PUD 504.2 26.8 531.1 Total
Proved $1,214.0 $308.4 $1,522.5
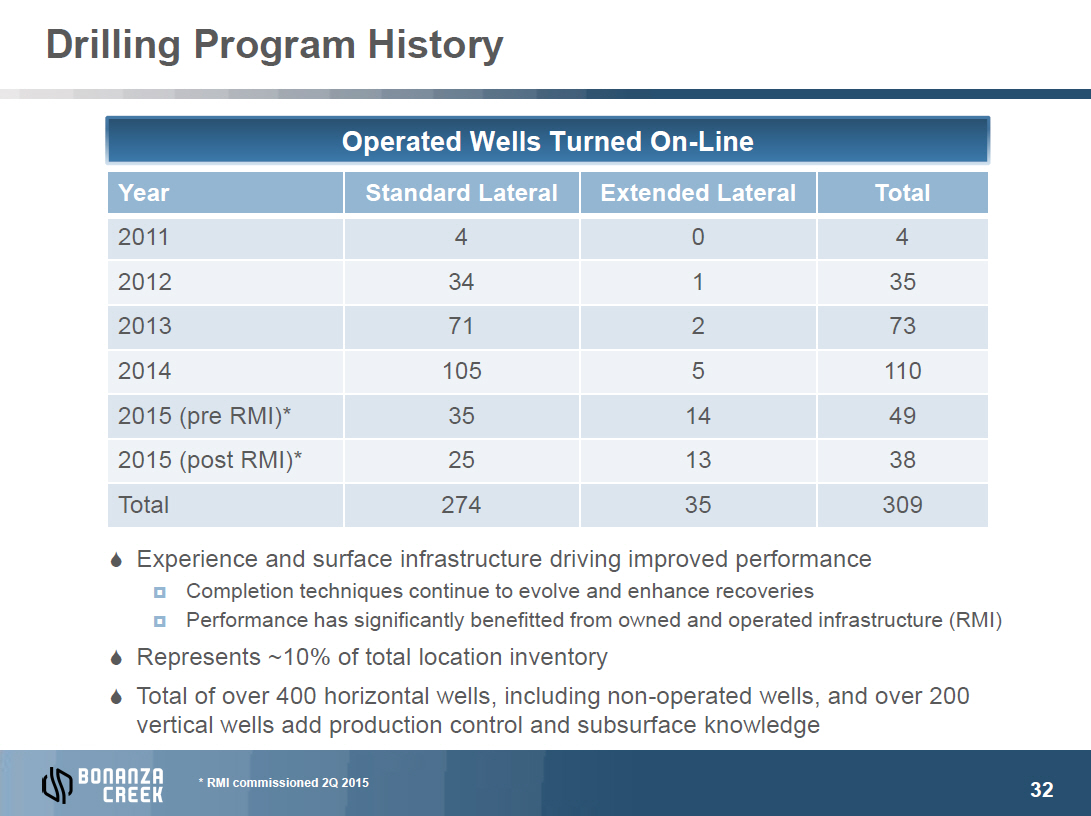
IMAGE OMITTEDDrilling Program History Operated Wells Turned On-Line Year Standard Lateral Extended Lateral Total 2011 4 0 4 2012 34 1 35 2013 71 2 73 2014 105 5 110 2015 (pre RMI)* 35 14 49 2015 (post RMI)* 25 13 38 Total 274 35 309 S Experience and surface infrastructure driving improved performance ¤ Completion techniques continue to evolve and enhance recoveries ¤ Performance has significantly benefitted from owned and operated infrastructure (RMI) S Represents ~10% of total location inventory S Total of over 400 horizontal wells, including non-operated wells, and over 200 vertical wells add production control and subsurface knowledge IMAGE OMITTED
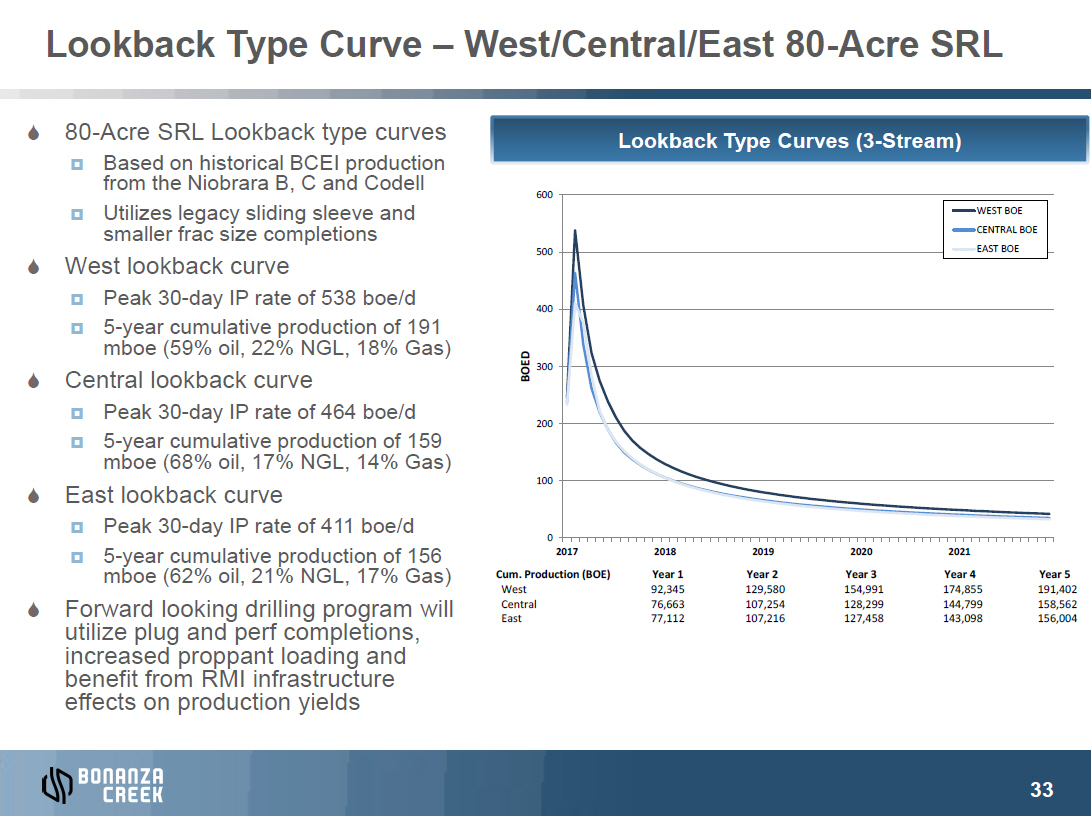
IMAGE OMITTEDLookback Type Curve – West/Central/East 80-Acre SRL S 80-Acre SRL Lookback type curves Lookback Type Curves (3-Stream) ¤ Based on historical BCEI production from the Niobrara B, C and Codell 600 ¤ Utilizes legacy sliding sleeve and WEST BOE smaller frac size completions CENTRAL BOE 500 EAST BOE S West lookback curve ¤ Peak 30-day IP rate of 538 boe/d 400 ¤ 5-year cumulative production of 191 mboe (59% oil, 22% NGL, 18% Gas) BOED S Central lookback curve 300 ¤ Peak 30-day IP rate of 464 boe/d 200 ¤ 5-year cumulative production of 159 mboe (68% oil, 17% NGL, 14% Gas) S East lookback curve 100 ¤ Peak 30-day IP rate of 411 boe/d 0 ¤ 5-year cumulative production of 156 2017 2018 2019 2020 2021 mboe (62% oil, 21% NGL, 17% Gas) Cum. Production (BOE) Year 1 Year 2 Year 3 Year 4 Year 5 West 92,345 129,580 154,991 174,855 191,402 S Forward looking drilling program will Central 76,663 107,254 128,299 144,799 158,562 utilize plug and perf completions, East 77,112 107,216 127,458 143,098 156,004 increased proppant loading and benefit from RMI infrastructure effects on production yields IMAGE OMITTED
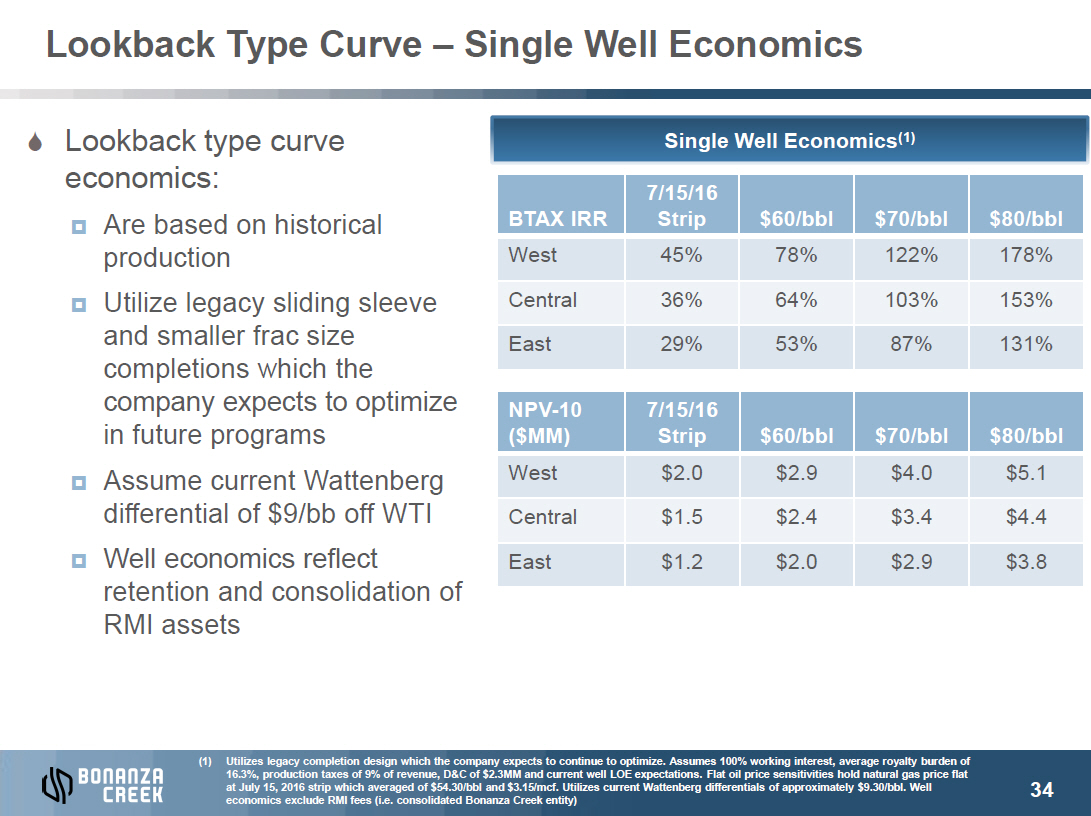
IMAGE OMITTEDLookback Type Curve – Single Well Economics
S
Lookback type curve IMAGE
OMITTED economics: ¤ Are
based on historical production ¤ Utilize
legacy sliding sleeve and smaller frac size completions which the company expects to optimize in future programs ¤ Assume
current Wattenberg differential of $9/bb off WTI ¤ Well
economics reflect retention and consolidation of RMI assets IMAGE
OMITTED
Single Well Economics(1) 7/15/16 BTAX
IRR Strip $60/bbl $70/bbl $80/bbl West 45% 78% 122% 178% Central 36% 64% 103% 153% East 29% 53% 87% 131% NPV-10 7/15/16
($MM) Strip $60/bbl $70/bbl $80/bbl West $2.0 $2.9 $4.0 $5.1 Central $1.5 $2.4 $3.4 $4.4 East $1.2 $2.0 $2.9 $3.8
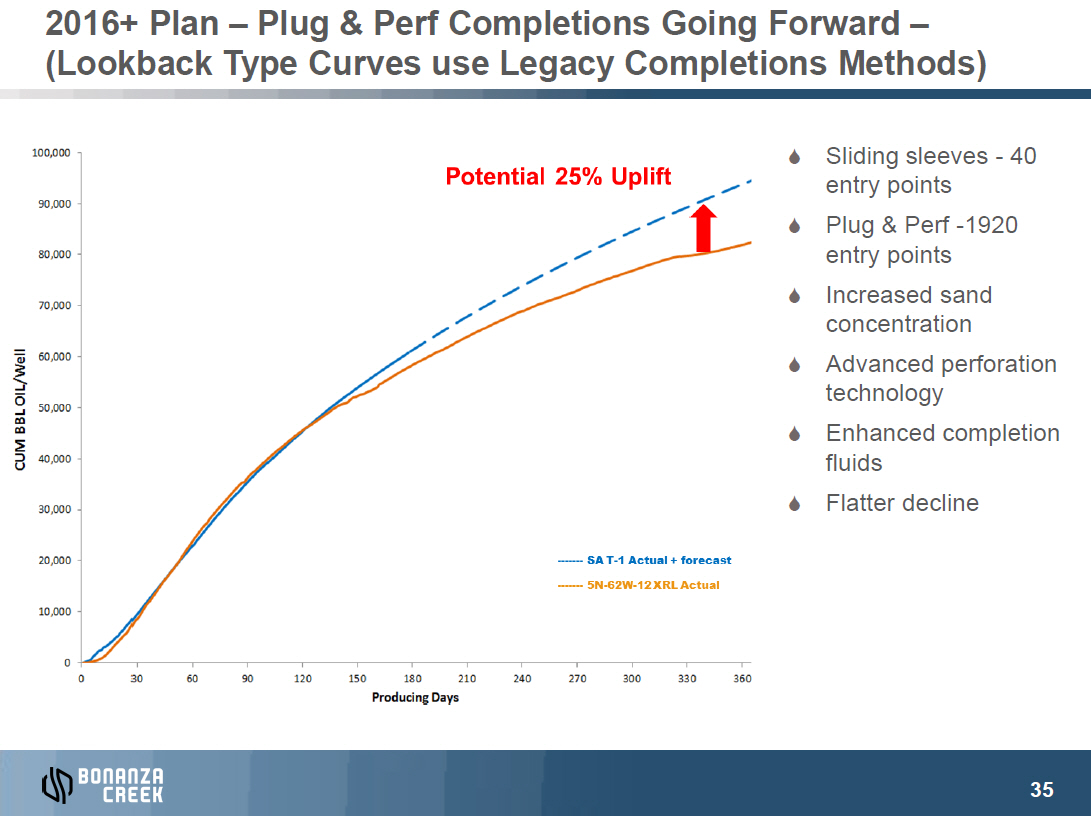
IMAGE OMITTED2016+ Plan – Plug & Perf Completions Going Forward – (Lookback Type Curves use Legacy Completions Methods) S Sliding sleeves - 40 entry points S Plug & Perf -1920 entry points S Increased sand concentration S Advanced perforation technology S Enhanced completion fluids S Flatter decline IMAGE OMITTED

IMAGE OMITTED2016+ Plan – Increased Proppant Loading – (Lookback Type Curves Have Lower Proppant Loadings) Standard Spaced SRL Niobrara Wells Standard vs. Upsized Job Size Cumulative Production (BOE) 100,000 24% Uplift at Day 480 80,000 22% Uplift at Day 300 60,000 40,000 Upsized Frac Job ~ 1,500 Ibs per lateral ft Standard Frac Job ~ 1,000 Ibs per lateral ft 20,000 0 0 30 60 90 120 150 180 210 240 270 300 330 360 390 420 450 480 Time (Days) Standard Spaced, Standard Job Size Standard Spaced, Upsized Job Size IMAGE OMITTED
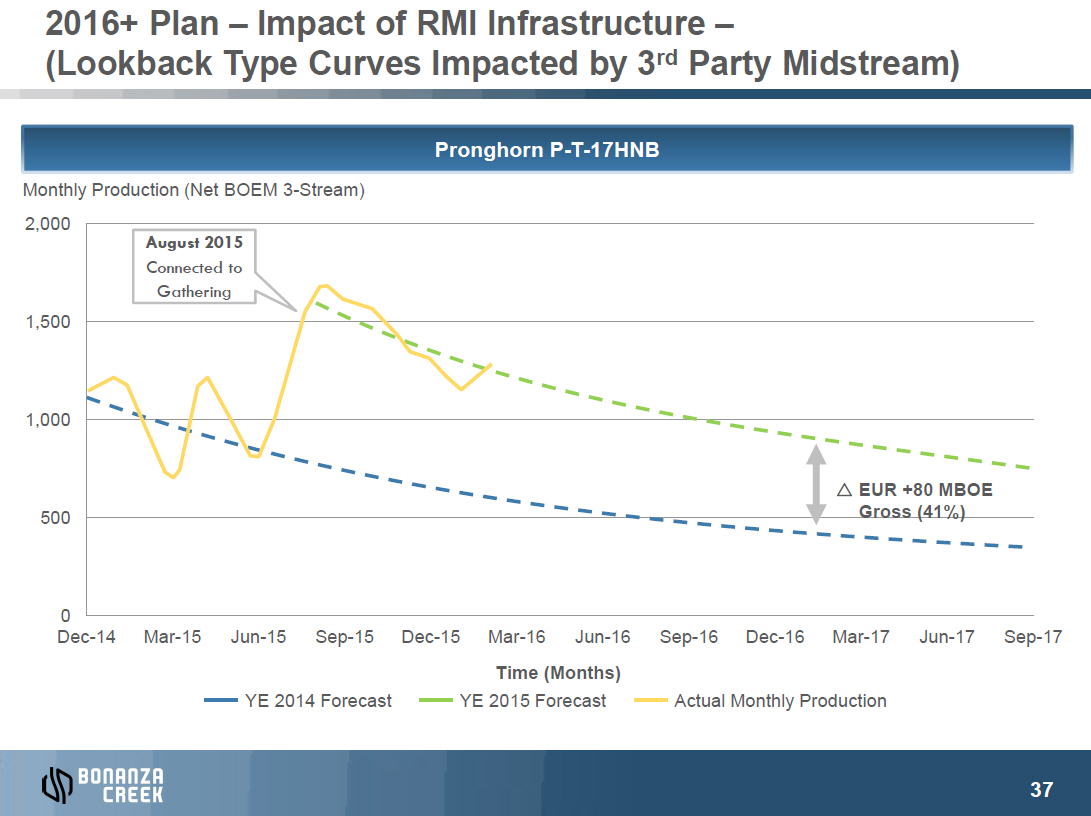
IMAGE OMITTED2016+ Plan – Impact of RMI Infrastructure – (Lookback Type Curves Impacted by 3rd Party Midstream) Pronghorn P-T-17HNB Monthly Production (Net BOEM 3-Stream) 2,000 August 2015 Connected to Gathering 1,500 1,000 r EUR +80 MBOE 500 Gross (41%) 0 Dec-14 Mar-15Jun-15Sep-15 Dec-15 Mar-16Jun-16Sep-16 Dec-16 Mar-17Jun-17Sep-17 Time (Months) YE 2014 Forecast YE 2015 Forecast Actual Monthly Production
IMAGE OMITTEDContents Corporate Overview DJ Basin Overview Business Plan Acreage Reserves and Type Curves Firm Transportation Commitments Rocky Mountain Infrastructure Assets IMAGE OMITTED
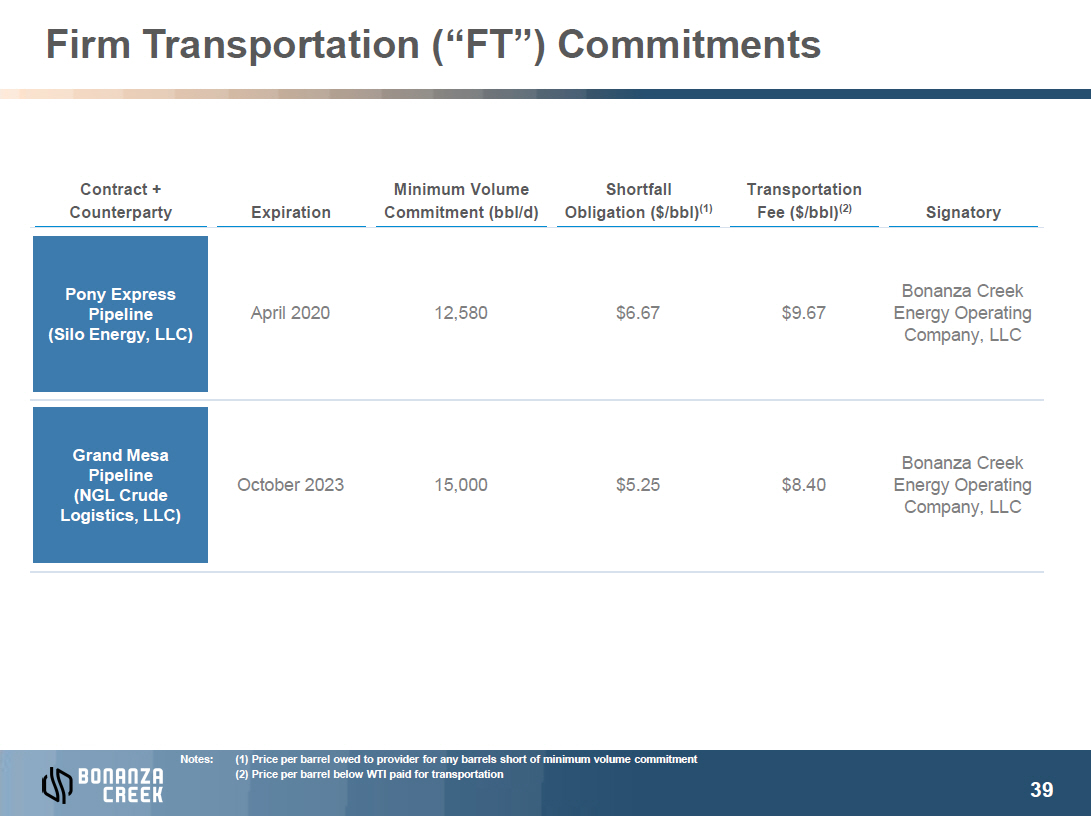
Firm Transportation (“FT”) Commitments Contract + Minimum Volume Shortfall Transportation Counterparty Expiration Commitment (bbl/d) Obligation ($/bbl)(1) Fee ($/bbl)(2) Signatory IMAGE OMITTED Pony Express Bonanza Creek Pipeline April 2020 12,580 $6.67 $9.67 Energy Operating (Silo Energy, LLC) Company, LLC IMAGE OMITTED Grand Mesa Bonanza Creek Pipeline October 2023 15,000 $5.25 $8.40 Energy Operating (NGL Crude Company, LLC Logistics, LLC) IMAGE OMITTED
Contents IMAGE OMITTED Corporate Overview IMAGE OMITTED DJ Basin Overview IMAGE OMITTED Business Plan IMAGE OMITTED Acreage IMAGE OMITTED Reserves and Type Curves IMAGE OMITTED Firm Transportation Commitments IMAGE OMITTED Rocky Mountain Infrastructure Assets IMAGE OMITTED

Summary of Rocky Mountain Infrastructure Assets IMAGE OMITTED
S Pronghorn
Gathering System/Pronghorn Booster Station S 70
Ranch Gathering System/Antelope Sec 19 Booster and Discharge Line S Canal
Road Gathering System /Canal Road Booster and Discharge Line, Canal Road Lift Gas Unit S Booster/Gas
Lift units w/Lift Gas Supply Lines: –
State North Platte 42-26 CPF –
Antelope 13-21 CPF –
State Antelope 41-32 CPF –
State Antelope O-1 CPF S BBC
Meter into 70 Ranch System IMAGE
OMITTED
S State
North Platte CPF 42-26 (Super Section) S State
Pronghorn CPF 41-32 S State
Antelope O-1 CPF S Antelope
13-21 CPF S State
Pronghorn CPF 41-32 wastewater line to NGL’s
C11 disposal facility S North
Platte T-27 wastewater line to NGL’ disposal facility S Other
wastewater infrastructure in progress IMAGE
OMITTED
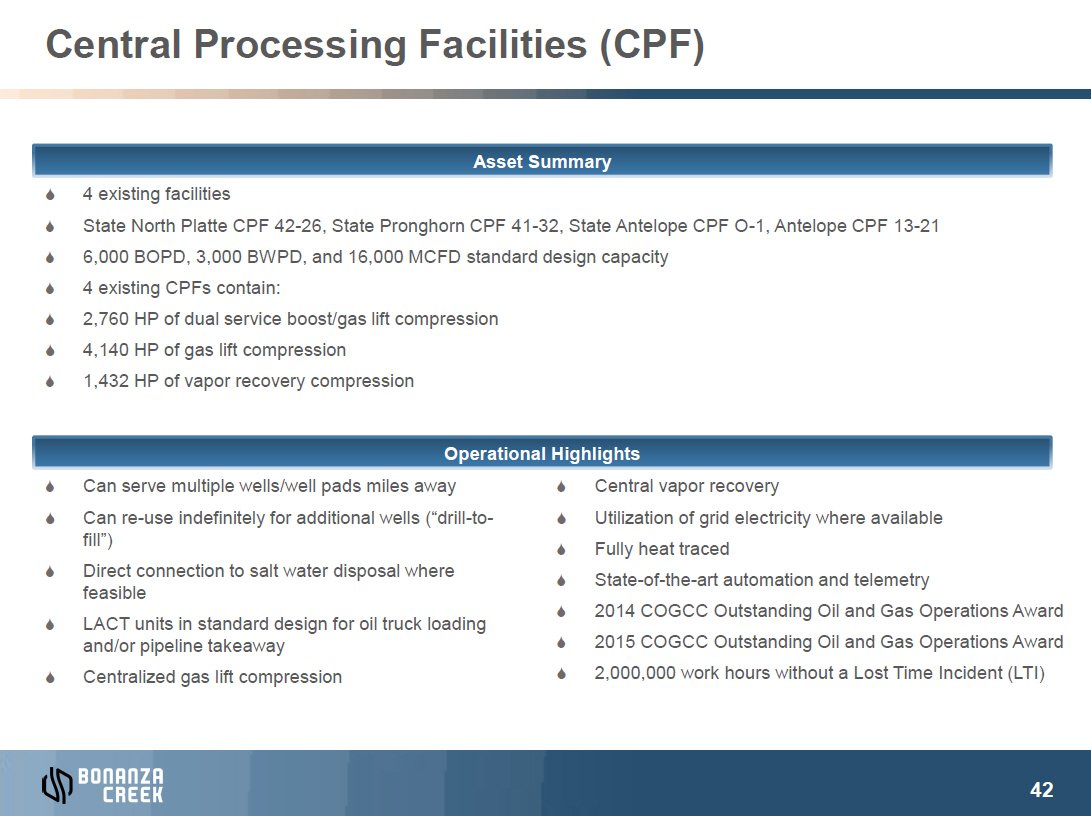
Central Processing Facilities (CPF) IMAGE OMITTED S 4 existing facilities S State North Platte CPF 42-26, State Pronghorn CPF 41-32, State Antelope CPF O-1, Antelope CPF 13-21 S 6,000 BOPD, 3,000 BWPD, and 16,000 MCFD standard design capacity S 4 existing CPFs contain: S 2,760 HP of dual service boost/gas lift compression S 4,140 HP of gas lift compression S 1,432 HP of vapor recovery compression S Can serve multiple wells/well pads miles away S Central vapor recovery S Can re-use indefinitely for additional-to-S wellsUtilization(“drillofgridelectricity where available fill”) S Fully heat traced S Direct connection to salt water disposal where S State-of-the-art automation and telemetry feasible S LACT units in standard design for oil truck loading S 2014 COGCC Outstanding Oil and Gas Operations Award and/or pipeline takeaway S 2015 COGCC Outstanding Oil and Gas Operations Award S Centralized gas lift compression S 2,000,000 work hours without a Lost Time Incident (LTI)
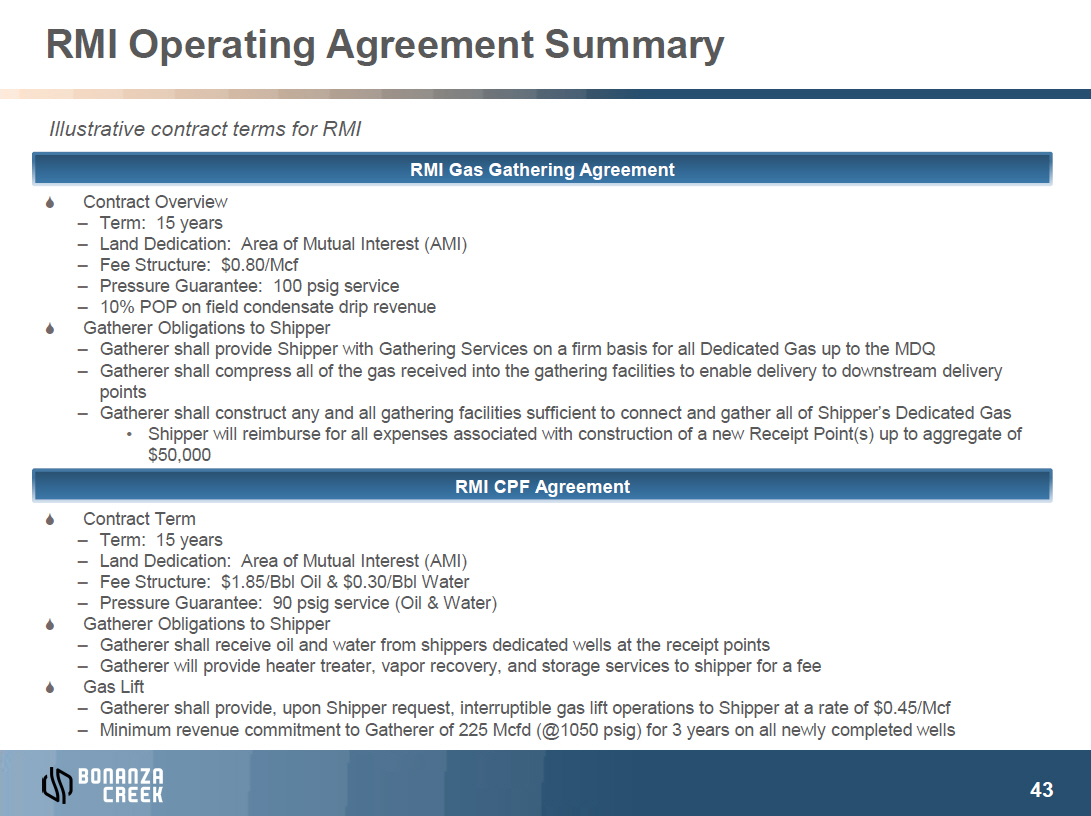
RMI Operating Agreement Summary Illustrative contract terms for RMI S Contract Overview – Term: 15 years – Land Dedication: Area of Mutual Interest (AMI) – Fee Structure: $0.80/Mcf – Pressure Guarantee: 100 psig service – 10% POP on field condensate drip revenue S Gatherer Obligations to Shipper – Gatherer shall provide Shipper with Gathering Services on a firm basis for all Dedicated Gas up to the MDQ – Gatherer shall compress all of the gas received into the gathering facilities to enable delivery to downstream delivery points – Gatherer shall construct any and all gathering facilities sufficient to conn • Shipper will reimburse for all expenses associated with construction of a new Receipt Point(s) up to aggregate of $50,000 S Contract Term – Term: 15 years – Land Dedication: Area of Mutual Interest (AMI) – Fee Structure: $1.85/Bbl Oil & $0.30/Bbl Water – Pressure Guarantee: 90 psig service (Oil & Water) S Gatherer Obligations to Shipper – Gatherer shall receive oil and water from shippers dedicated wells at the receipt points – Gatherer will provide heater treater, vapor recovery, and storage services to shipper for a fee S Gas Lift – Gatherer shall provide, upon Shipper request, interruptible gas lift operations to Shipper at a rate of $0.45/Mcf – Minimum revenue commitment to Gatherer of 225 Mcfd (@1050 psig) for 3 years on all newly completed wells

RMI Projected Gross Volumes 3Q 2016 4Q 2016 2016 1Q 2017 2Q 2017 3Q 2017 4Q 2017 2017 1Q 2018 2Q 2018 3Q 2018 4Q 2018 2018 0-Rig Gross Oil (bbls) - CPF Handling 357,787 294,605 652,392 256,314 229,768 209,532 191,473 887,087 173,080 163,066 154,492 145,515 636,153 Gross Water (bbls) - CPF Handling 78,464 63,299 141,763 54,157 48,033 43,507 39,575 185,272 35,659 33,518 31,700 29,819 130,695 Gross Gas (Mcf) - CPF Gas Lift 1,304,100 1,304,100 2,608,200 1,089,900 1,003,275 987,300 931,500 4,011,975 877,050 805,725 510,975 235,125 2,428,875 Gross Gas (Mcf) - Infield Gathering 3,579,328 3,181,756 6,761,084 2,847,917 2,655,960 2,499,520 2,343,709 10,347,106 2,164,159 2,076,061 1,998,189 1,908,419 8,146,828 Gross Oil (bbls/d) - CPF Handling 3,889 3,202 3,546 2,848 2,525 2,278 2,081 2,430 1,923 1,792 1,679 1,582 1,743 Gross Water (bbls/d) - CPF Handling 853 688 770 602 528 473 430 508 396 368 345 324 358 Gross Gas (Mcf/d) - CPF Gas Lift 14,175 14,175 14,175 12,110 11,025 10,732 10,125 10,992 9,745 8,854 5,554 2,556 6,654 Gross Gas (Mcf/d) - Infield Gathering 38,906 34,584 36,745 31,644 29,186 27,169 25,475 28,348 24,046 22,814 21,719 20,744 22,320 1-Rig Gross Oil (bbls) - CPF Handling 357,787 294,605 652,392 285,335 642,198 856,823 751,842 2,536,197 883,595 836,454 1,059,863 1,051,150 3,831,062 Gross Water (bbls) - CPF Handling 78,464 63,299 141,763 62,282 163,513 224,749 196,478 647,022 234,603 222,066 285,204 283,397 1,025,270 Gross Gas (Mcf) - CPF Gas Lift 1,304,100 1,304,100 2,608,200 1,117,800 1,310,400 1,621,800 1,697,400 5,747,400 1,841,400 1,918,125 1,896,750 1,821,600 7,477,875 Gross Gas (Mcf) - Infield Gathering 3,579,328 3,181,756 6,761,084 2,918,562 3,424,925 3,947,147 4,005,568 14,296,202 4,044,829 4,041,214 4,587,802 4,555,090 17,228,935 Gross Oil (bbls/d) - CPF Handling 3,889 3,202 3,546 3,170 7,057 9,313 8,172 6,948 9,818 9,192 11,520 11,426 10,496 Gross Water (bbls/d) - CPF Handling 853 688 770 692 1,797 2,443 2,136 1,773 2,607 2,440 3,100 3,080 2,809 Gross Gas (Mcf/d) - CPF Gas Lift 14,175 14,175 14,175 12,420 14,400 17,628 18,450 15,746 20,460 21,078 20,617 19,800 20,487 Gross Gas (Mcf/d) - Infield Gathering 38,906 34,584 36,745 32,428 37,637 42,904 43,539 39,168 44,943 44,409 49,867 49,512 47,203 1 Rig 1Q17, 2 Rigs 2Q17, 3 Rigs 4Q17 Gross Oil (bbls) - CPF Handling 357,787 294,605 652,392 256,314 490,594 1,037,348 1,267,003 3,051,260 1,659,238 1,987,177 2,370,573 2,531,063 8,548,051 Gross Water (bbls) - CPF Handling 78,464 63,299 141,763 54,157 121,064 275,296 340,723 791,240 451,783 544,269 652,203 697,772 2,346,027 Gross Gas (Mcf) - CPF Gas Lift 1,304,100 1,304,100 2,608,200 1,089,900 1,214,550 1,703,475 2,083,725 6,091,650 2,578,050 3,269,700 3,820,950 4,166,325 13,835,025 Gross Gas (Mcf) - Infield Gathering 3,579,328 3,181,756 6,761,084 2,847,917 3,072,622 4,086,995 4,983,494 14,991,028 5,912,373 6,771,043 7,937,113 8,424,052 29,044,581 Gross Oil (bbls/d) - CPF Handling 3,889 3,202 3,546 2,848 5,391 11,276 13,772 8,360 18,436 21,837 25,767 27,512 23,419 Gross Water (bbls/d) - CPF Handling 853 688 770 602 1,330 2,992 3,704 2,168 5,020 5,981 7,089 7,584 6,427 Gross Gas (Mcf/d) - CPF Gas Lift 14,175 14,175 14,175 12,110 13,347 18,516 22,649 16,689 28,645 35,931 41,532 45,286 37,904 Gross Gas (Mcf/d) - Infield Gathering 38,906 34,584 36,745 31,644 33,765 44,424 54,168 41,071 65,693 74,407 86,273 91,566 79,574
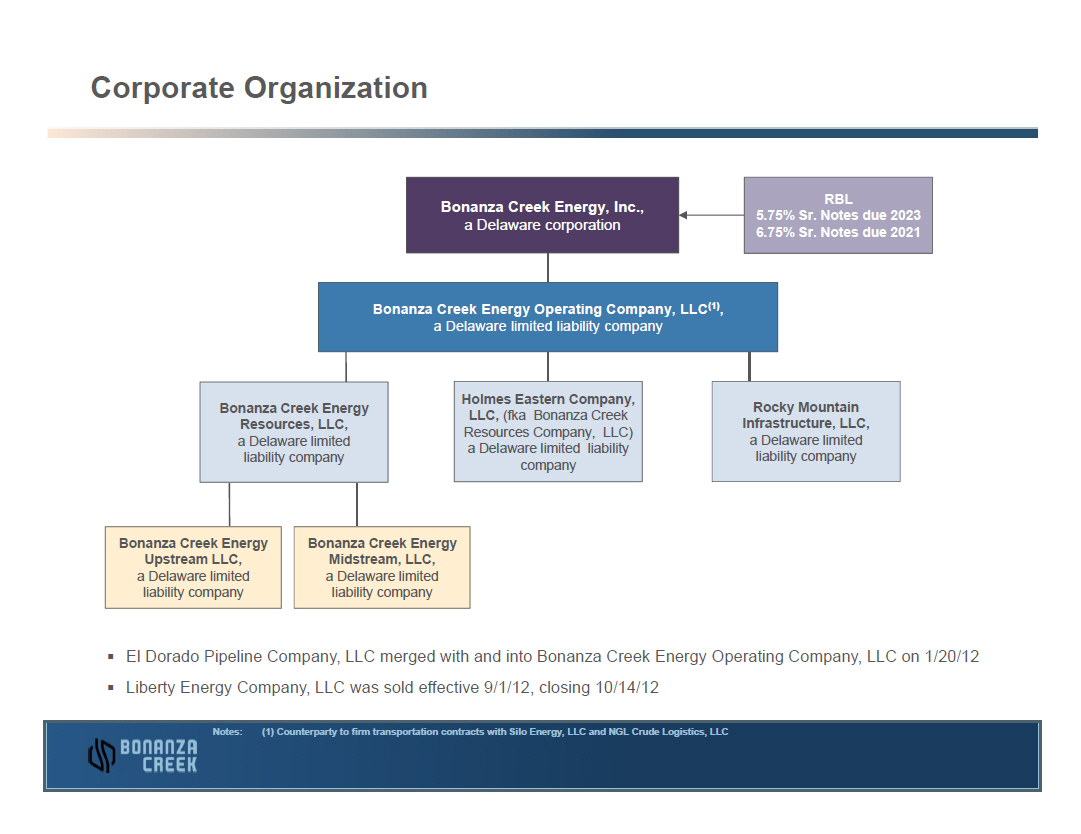
Corporate Organization IMAGE OMITTED
Bonanza Creek Energy, Inc., RBL 5.75% Sr. Notes due 2023 a Delaware corporation 6.75% Sr. Notes due 2021 Bonanza Creek Energy Operating Company, LLC(1), a Delaware limited liability company Bonanza Creek Energy Holmes Eastern Company, Rocky Mountain LLC, (fka Bonanza Creek Resources, LLC, Infrastructure, LLC, Resources Company, LLC) a Delaware limited a Delaware limited a Delaware limited liability liability company liability company company Bonanza Creek Energy Bonanza Creek Energy Upstream LLC, Midstream, LLC, a Delaware limited a Delaware limited liability company liability company § El Dorado Pipeline Company, LLC merged with and into Bonanza Creek Energy Operating Company, LLC on 1/20/12 § Liberty Energy Company, LLC was sold effective 9/1/12, closing 10/14/12 IMAGE OMITTED
Notes: (1) Counterparty to firm transportation contracts with Silo Energy, LLC and NGL Crude Logistics, LLC