FOR IMMEDIATE RELEASE
American Realty Capital Properties Announces Record Earnings and $163.9 Million and AFFO Per Share of $0.86 for 2013
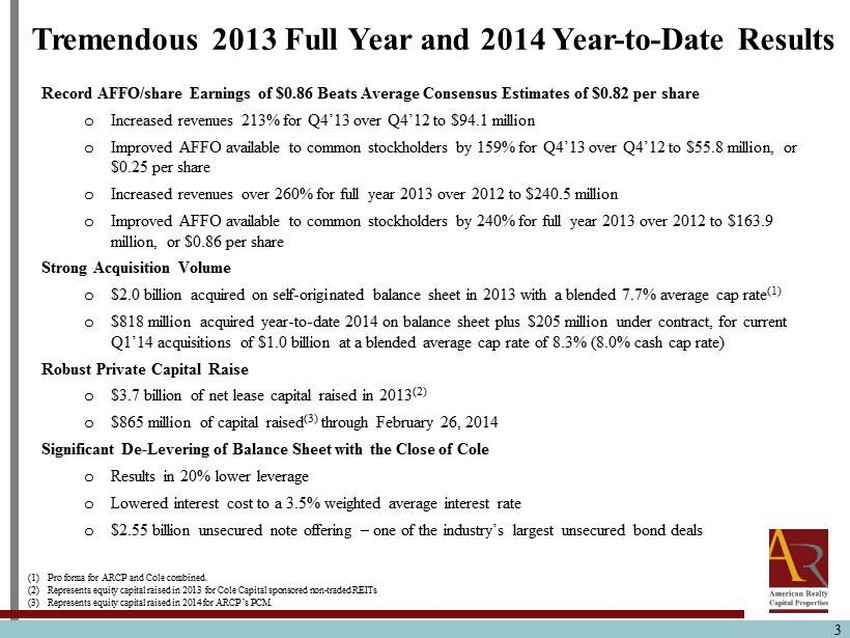
Grows Fourth Quarter 2013 Revenues 213% from Fourth Quarter 2012, Increases AFFO to $0.86 Per Share, Exceeding Consensus AFFO Estimates and Representing Over an 80% Increase Against 2012 Full Year AFFO, Anticipates Closing First Quarter 2014 Acquisitions of $1.0 Billion Comprising 260 properties in 83 Individual Transactions at an Average 8.3% Cap Rate, Lowers Leverage by Approximately 20% Following Cole Merger
New York, New York, February 27, 2014 - American Realty Capital Properties, Inc. (NASDAQ: ARCP) (“ARCP” or the “Company”) today announced record operating results for the full year ended December 31, 2013, as well operating results from the fourth quarter of 2013. Additionally, ARCP, the largest publicly traded net lease REIT, announced that it anticipates closing more than $1.0 billion of self-originated acquisitions during the first quarter of 2014 at an average capitalization rate of 8.3% (8.0% cash cap rate). Additionally its Private Capital Management business is on pace to raise $950.0 million of capital during the same time period. Operating highlights are provided below.
Company Highlights
For the quarter ended December 31, 2013 (as compared to the same quarterly period in 2012):
• | Increased revenues 213% to $94.1 million as compared to $30.1 million. |
• | Improved AFFO available to common stockholders by 153% to $55.8 million. |
• | Increased AFFO per diluted share by 108% to $0.25. |
• | Generated proceeds of $690.0 million in convertible note offerings at an average cost of 3.4%. |
• | Grew the monthly dividend in December to $0.94 per share coincident with the closing of CapLease, Inc. (“CapLease”) and increased again to $1.00 per share upon the closing of Cole. |
• | Expanded credit facility borrowing capacity to $2.4 billion and further extending to $2.97 billion in the first quarter of 2014. |
For the year ended December 31, 2013 (as compared to 2012):
• | Increased revenues over 260% to $240.5 million as compared to $66.8 million. |
• | Improved AFFO available to common stockholders by 240% to $163.9 million. |
• | Increased AFFO per diluted share by over 80% to $0.86. |
• | Invested $3.4 billion in 676 acquired real estate properties. |
• | Closed on (i) $2.3 billion acquisition of American Realty Capital Trust III, Inc. (“ARCT III”), (ii) $2.2 billion acquisition of CapLease and (iii) the $774.0 million acquisition of the GE/Trustreet portfolio, successfully integrating all acquisitions into the Company’s property portfolio. |
• | Hired key executives, David S. Kay, President, Lisa Beeson, Chief Operating Officer and Lisa Pavelka McAlister, Chief Accounting Officer, as well as CapLease key executives including Paul H. McDowell, in a successful transition to self-management. In addition, as recently announced, completed senior management hiring with the addition of Richard A. Silfen as General Counsel. |
Balance Sheet Acquisitions
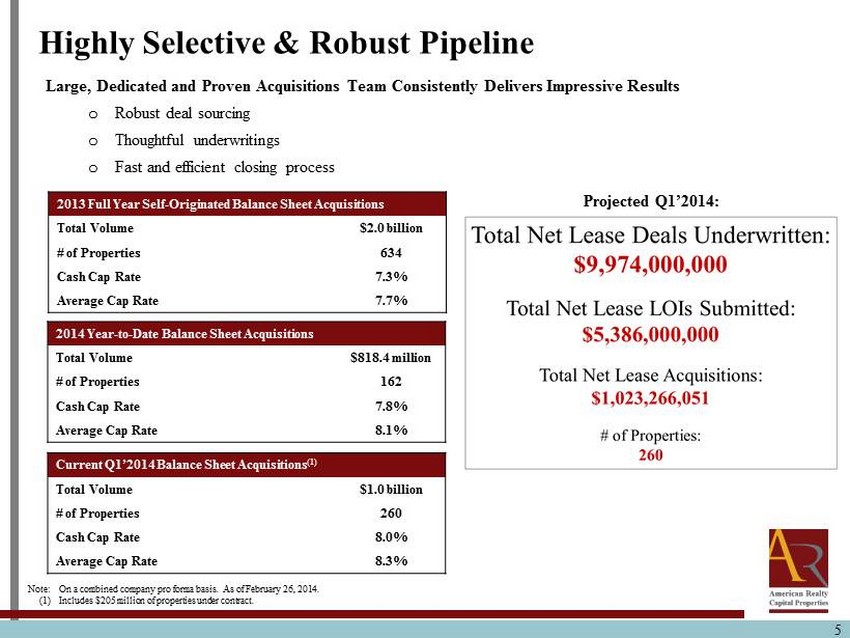
The fully integrated and combined acquisitions teams from ARCP and Cole companies, coming off a record 2013, are well positioned to surpass the high end of the Company’s projected $2.0 to $3.0 billion of self-originated acquisitions targeted for 2014. ARCP’s focus remains on durable cash flows from high-quality investment grade tenants bolstered by the additional earnings accretion provided by a strong pipeline of build-to-suit investment properties.
• | Acquisitions Closed and Under Contract: $1.0 billion already originated in the first quarter of 2014, comprising 260 properties in 83 individual transactions at an average cap rate of 8.3% (8.0% cash cap rate). |
• | Build-to-Suit: $120.0 million completed year-to-date 2014 and approximately $800.0 million of additional assets in the pipeline. |
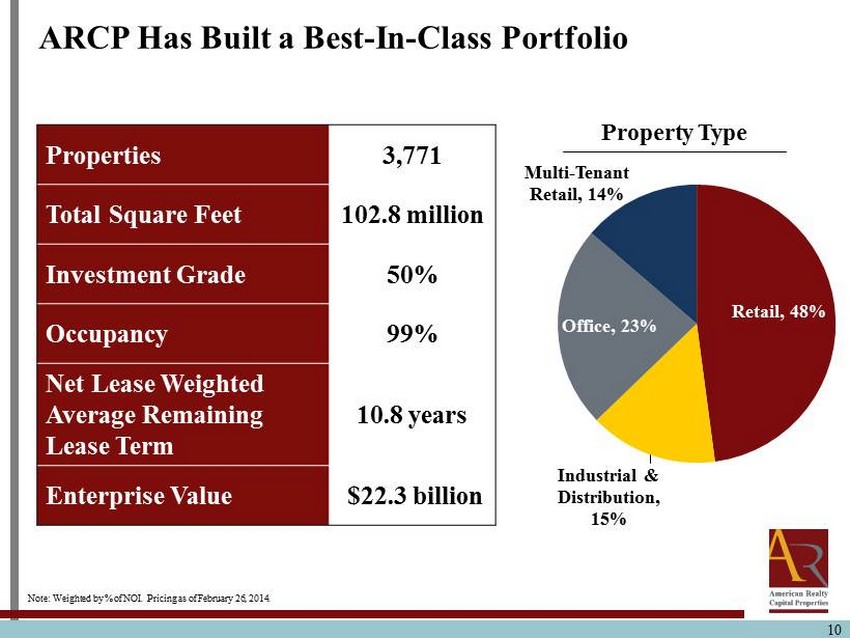
• | Total Portfolio Composition as of February 26, 2014: |
# of Properties | 3,771 | |
Occupancy | 99 | % |
Square Feet | 102.8 million | |
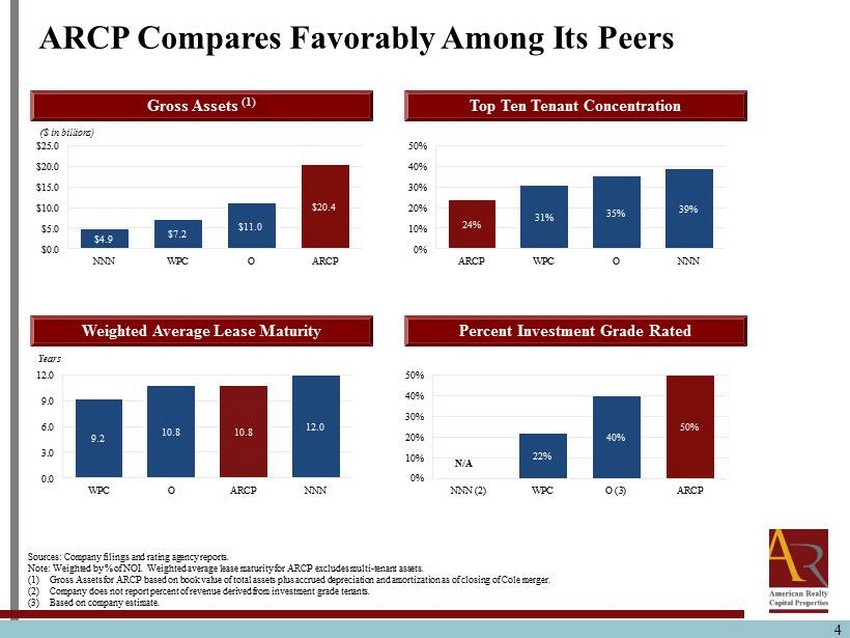
% Investment Grade | 50 | % |
Net Lease Weighted Avg. Remaining Lease Term | 10.8 years | |
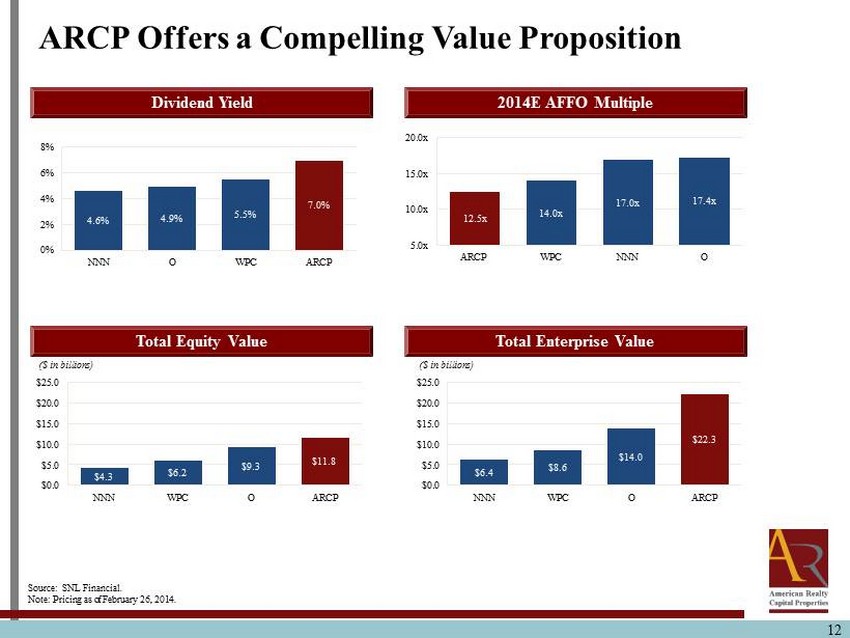
Total Enterprise Value | $22.3 billion | |
Private Capital Management Business
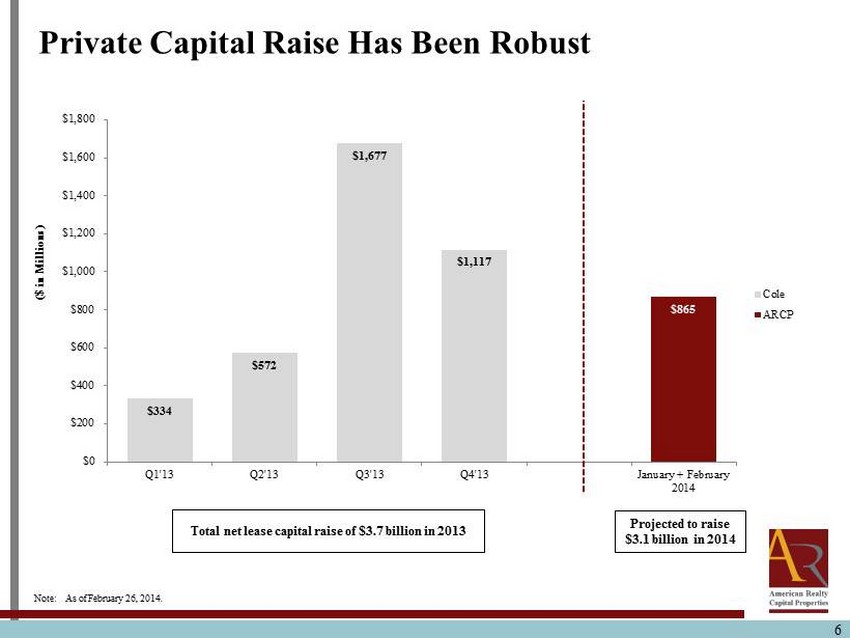
In addition to being highly active on the ARCP balance sheet, Cole CapitalTM, the Company’s private capital management business, has been raising and deploying capital at a record pace, and is on track to exceed its previous annual capital raise target of $3.1 billion.
• | Record Private Capital Raise: Raised a record $3.7 billion in 2013 with $1.1 billion raised in the fourth quarter alone; expected to raise approximately $950.0 million during the first quarter of 2014 with $864.6 million already raised. |
• | Private Capital Acquisitions: The acquisitions team acquired $3.8 billion of real estate assets on behalf of the managed funds in 2013 and has purchased $266.6 million year-to-date. |
• | Portfolio Composition as of February 26, 2014: The managed funds owned 496 properties, comprised of 29 million square feet, occupied by 49% investment grade corporate tenants, with a weighted average remaining lease term of 12.3 years. These properties are located in 46 states and include 464 tenant concepts, operating in 36 distinct industries with a total of $4.9 billion of gross real estate assets. |
Balance Sheet Initiatives
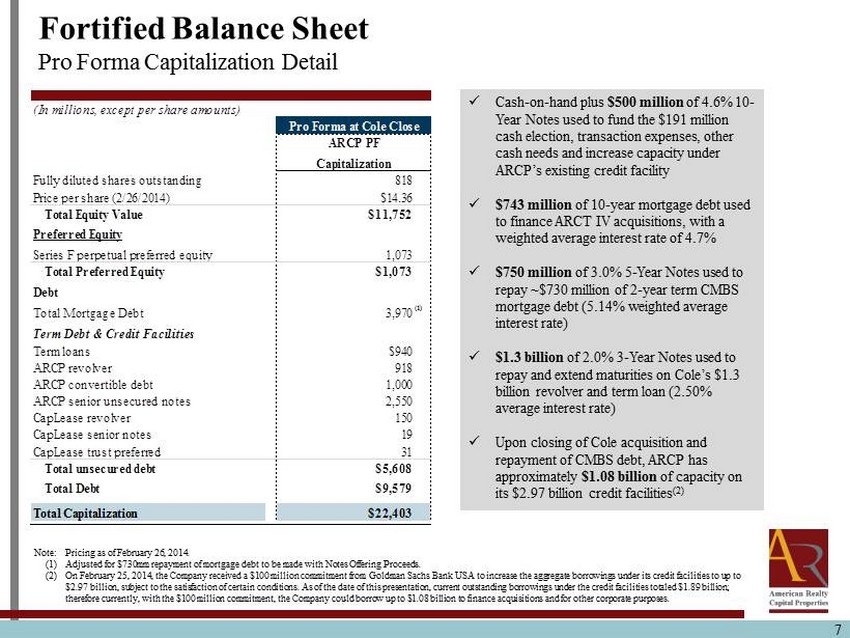
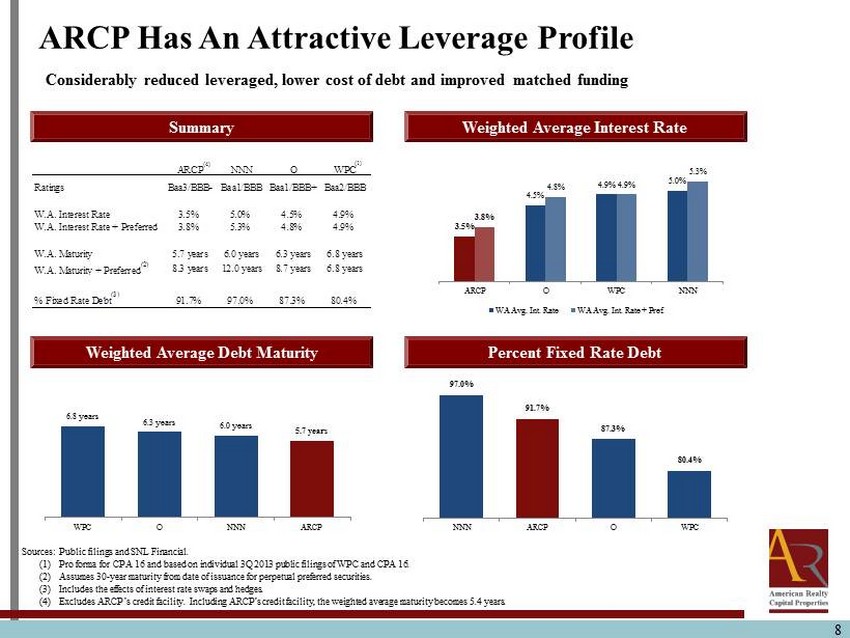
We have significantly de-levered the balance sheet with the close of Cole Real Estate Investments, Inc. (“Cole”) and continue to reduce our cost of borrowings, lengthen our duration and improve flexibility with respect to our capital structure and debt instruments.
• | Investment Grade Balance Sheet: Obtained investment grade ratings from both S&P and Moody’s as of the first quarter of 2014. |
• | Unsecured Bond Issuance: Executed one of the largest unsecured bond deals in REIT history, issuing $2.55 billion of senior unsecured notes with a weighted average interest rate of 2.8% and a blended maturity of five years in the first quarter of 2014. |
• | Extended Debt Maturities: Secured $1.2 billion of 10-year fixed-rate, interest-only debt ($693.0 million of mortgage debt and $500.0 million of 10-year senior unsecured notes); refinanced approximately $730.0 million of defeased mortgages (with a blended near-term maturity of two years) with $750.0 million of 5-year senior unsecured notes; and repaid Cole’s $1.3 billion credit facility (with a one-year maturity) with $1.3 billion of 3-year senior unsecured notes. |
• | Convertible Notes Offering: Arranged $690.0 million of convertible notes with a weighted average interest rate of 3.4% and a blended maturity of six years in the fourth quarter of 2013. |
• | Upsized Corporate Credit Facility: Upsized the senior corporate unsecured credit facility to allow for total current financing capacity of up to $2.97 billion, following the recent $100.0 million new commitment from Goldman Sachs. |
• | Lowered Cost of Borrowing: Reduced interest cost to a weighted average interest rate of 3.5% and a blended maturity of over five years in the first quarter of 2014. |
Integration Synergies
During first quarter of 2014, ARCP closed on the previously announced acquisitions of American Realty Capital Trust IV, Inc., the Fortress portfolio and Cole. These purchases generated immediate and beneficial synergies, which provided a meaningful and unparalleled cost of capital advantage, with approximately $70.0 million of identified savings anticipated to be realized over the course of the year. G&A is expected to run at 40 bps of gross assets.
Management Commentary
Nicholas S. Schorsch, Chairman and CEO, explained “As these results unequivocally demonstrate, we have accomplished an extraordinary amount in a very short time, underscoring our ability to execute key initiatives on every level across the organization. We will complete over $1.0 billion of acquisitions during the first quarter, at a pace ahead of projections and accretive to our earnings. Our robust pipeline of property acquisitions, as well as other corporate opportunities we are privy to, is consistent with our ability to grow impressively, while staying true to our strategy. Complementing our balance sheet operations, our Private Capital Management business will raise at least $950.0 million on behalf of our managed funds in the first quarter, also at a pace exceeding our projections, fueling earnings growth from the high-margin management fee revenue our team is producing. In addition to the strong growth we have seen with our earnings, ARCP’s improved leverage posture and identified G&A synergies from the Cole acquisition are also generating a positive impact to the bottom line. Not only did we beat consensus estimates for the fourth quarter, our first quarter is off to a tremendous start. When you compare these financial results to our peer group valuation metrics, particularly dividend yield and earnings multiple, we believe our Company is undervalued and poised for a share price increase.”
David S. Kay, President, said, “Our acquisition progress in 2014 is a direct result of ARCP having one synergized, cohesive group that is executing our strategy of self-originated acquisitions at attractive yields, delivering on our promises. Because of our tremendous real estate team – both in size and expertise – no one else in the marketplace can execute at the same level in terms of deal sourcing, thoughtful underwriting and efficient closing of property acquisitions. More than $1.0 billion of acquisitions, at an average cap rate of 8.3%, are expected to be completed in the first quarter and are a testimony to the efficiency and effectiveness of our acquisition machine. As a result of our disciplined approach, our current buying pace will clearly exceed our original acquisition target of $2.0 billion for the year. The earnings growth our high-yielding acquisitions will deliver is enhanced by the fee revenue we are generating within the Private Capital Management business. We expect to acquire several billion of additional assets this year on behalf of our managed funds. This should result in a material increase in total fee-generating assets under management. We are determined to be one of the most recognized and admired REITs, regardless of sector, while leading the evolution of net lease real estate.”
Lisa Beeson, Chief Operating Officer, observed, “Our buying activity has further enhanced an already impressive real estate portfolio, not only in terms of earnings, but also diversification and strength. We currently have 3,771 properties on balance sheet with nearly 103 million square feet with a total enterprise value of $22.3 billion. 50% of the portfolio tenancy is rated investment grade and net lease weighted average remaining lease term is 10.8 years. Additionally, our same store sales growth generates percentage rents and CPI-related adjustments. We believe we have the most well-balanced diversification of any net lease portfolio with property type exposure of 48% single tenant retail and restaurant, 23% office, 11% distribution, 4% industrial and 14% multi-tenant retail. This multi-tenant retail consists of high-quality grocery-anchored shopping centers and power centers managed by a dedicated, specialized team. Further, our industry, tenant and geographic diversification is unparalleled. A portfolio of this quality and size could not be managed successfully without having the best, fully integrated team in place to oversee the operational details. On the cost side, we are seeing immediate synergies and benefits from the Cole integration with the $70.0 million of anticipated savings already identified. Further benefits should be realized from our ability to capitalize on best practices from both organizations. Our management team is on the ground in both New York and Phoenix, ensuring that we will maintain a broad national outlook, continuing to allow us to create the best portfolio in the industry.”
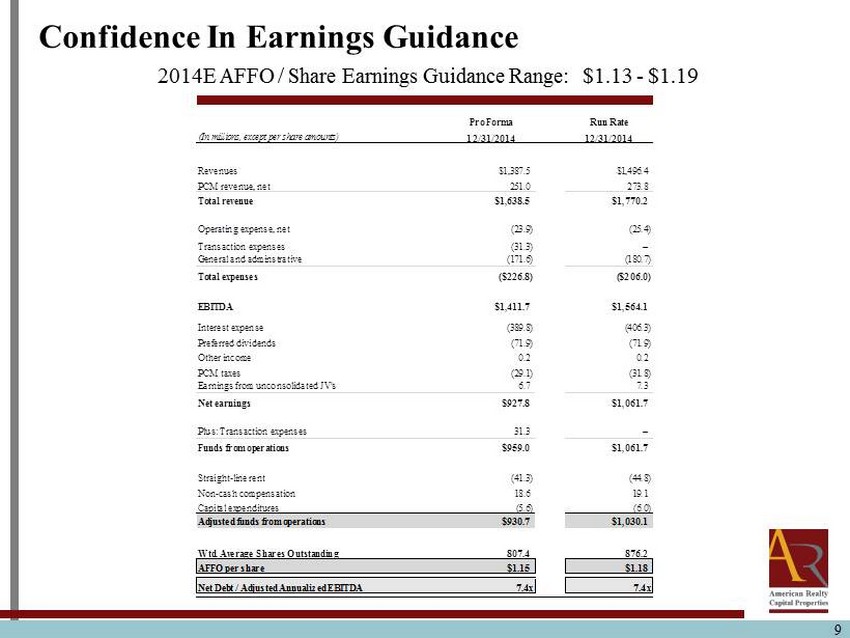
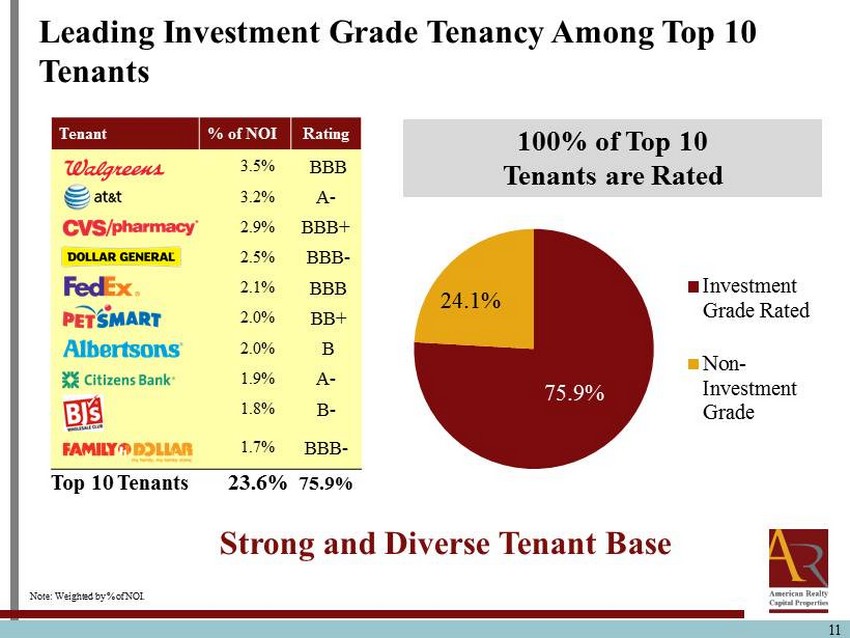
Brian S. Block, Chief Financial Officer, remarked, “2013 proved to be a record-setting year for ARCP both in terms of earnings and growth, allowing us to beat consensus estimates. Based on the strength of our self-originated acquisitions, success in our Private Capital Management business and savings in G&A costs from having true economic scale, we firmly believe that 2014 will be an even more impressive year. These factors should fortify our 2014 AFFO guidance of $1.13 to $1.19 per share. In the last 100 days, we have further strengthened our balance sheet through deleveraging and de-risking by reducing our secured debt exposure, lowering our interest rate profile and extending our maturities. The strength of our balance sheet complements the strength of our real estate portfolio and our high percentage of investment grade tenants in particular. Having high-quality tenants with low probabilities of default creates particularly strong and durable income – income that better supports leverage when compared to lesser quality net lease portfolios. We believe these factors informed Moody’s and S&P to provide investment grade ratings, and further prompted the fixed income investors who participated in our record $2.55 billion unsecured bond deal. With strong AFFO per share growth, an attractive property portfolio, strong credit tenants bounded by long-term net leases and an attractively positioned balance sheet, we believe ARCP has the catalysts to provide long-term shareholder returns.”
Financial Results
Revenues
Total revenues were $94.1 million for the three months ended December 31, 2013, compared to revenues for the three months ended September 30, 2013 of $61.0 million, representing a 54.3% increase. Total revenues were $240.5 million for the 12 months ended December 31, 2013.
Funds from Operations and Adjusted Funds from Operations
Funds from operations (“FFO”) for the three months ended December 31, 2013, totaled $(93.2) million, or $(0.43) per share. FFO for this period includes one-time merger and other transaction related expenses of $111.7 million. FFO for the 12 months ended December 31, 2013 totaled $(249.5) million, or $(1.43) per fully diluted share. FFO for this period includes one-time merger and other transaction related expenses of $280.0 million. Excluding such one-time costs, FFO was $30.4 million, or $0.16 per share fully diluted.
Adjusted funds from operations (“AFFO”) for the three months ended December 31, 2013, totaled $55.8 million, or $0.25 per fully diluted share. AFFO for the 12 months ended December 31, 2013 totaled $163.9 million, or $0.86 per share fully diluted.
Property Level Net Operating Income
Property Level net operating income (“NOI”) was $83.3 million for the three months ended December 31, 2013, compared to NOI for the three months ended September 30, 2013 of $56.9 million, representing a 46.4% increase. NOI was $220.6 million for the 12 months ended December 31, 2013 compared to $63.3 million for the 12 months ended December 31, 2012, representing a 249% increase.
Dividend Increase
Total dividends paid to common stockholders by the Company were $45.1 million for the three months ended December 31, 2013 or $0.92 per share on an annualized basis.
On October 23, 2013, an increase in the annual dividend rate from $0.94 per share to $1.00 per share was declared, contingent upon, and effective with, the closing of the acquisition of Cole. As a result of the closing of the acquisition, ARCP raised its dividend to $1.00, effective with the February 2014 dividend.
2014 Guidance
In connection with the announcement of the Cole merger transaction, ARCP reiterated 2014 AFFO guidance from $1.13 to $1.19 per share.
Fourth Quarter 2013 Conference Call Details
ARCP will be hosting its fourth quarter 2013 conference call on Thursday, February 27, 2014 at 1:00 PM ET. Nicholas S. Schorsch, Chairman and Chief Executive Officer, David S. Kay, President, Lisa Beeson, Chief Operating Officer, and Brian S. Block, Chief Financial Officer, will conduct the call. Conference call details are as follows:
Live Conference Call and Webcast Details*
Domestic Dial-In Number: 1-888-317-6003
International Dial-In Number: 1-412-317-6061
Canada Dial-In Number: 1-866-284-3684
Conference ID: 9196326
Webcast: http://arcpreit.com/Q42013EarningsCall/
*Participants should dial in 10-15 minutes early.
Conference Call Replay Details
Domestic Dial-In Number: 1-877-344-7529
International Dial-In Number: 1-412-317-0088
Canada Dial-In Number: 1-855-669-9658
Conference ID: 10041274
Date Available: February 27, 2014 (one hour after the end of the conference call) to March 14, 2014 at 9:00 a.m. ET
Supplemental Information
Supplemental information on the Company's fourth quarter 2013 operations can be found in the Company's Current Report on Form 8-K filed with the U.S. Securities and Exchange Commission (“SEC”) on February 27, 2014. The supplemental information report is titled “Quarterly Supplemental Information: Fourth Quarter 2013. Information in such report includes the following financial data, in addition to other data: (1) This Consolidated Balance Sheet and Income Statement Details; (2) Funds from Operations and Adjusted Funds from Operations details; (3) a Dividend Summary; and (4) Portfolio Details.
Funds From Operations and Adjusted Funds From Operations
Due to certain unique operating characteristics of real estate companies, as discussed below, the National Association of Real Estate Investment Trusts, Inc. (“NAREIT”), an industry trade group, has promulgated a measure known as funds from operations (“FFO”), which we believe to be an appropriate supplemental measure to reflect the operating performance of a REIT. The use of FFO is recommended by the REIT industry as a supplemental performance measure. FFO is not equivalent to our net income or loss as determined under U.S. GAAP.
We define FFO, a non-GAAP measure, consistent with the standards established by the White Paper on FFO approved by the Board of Governors of NAREIT, as revised in February 2004 (the “White Paper”). The White Paper defines FFO as net income or loss computed in accordance with U.S. GAAP, excluding gains or losses from sales of property but including asset impairment write downs, plus depreciation and amortization, after adjustments for unconsolidated partnerships and joint ventures. Adjustments for unconsolidated partnerships and joint ventures are calculated to reflect FFO. Our FFO calculation complies with NAREIT’s policy described above.
The historical accounting convention used for real estate assets requires straight-line depreciation of buildings and improvements, which implies that the value of real estate assets diminishes predictably over time, especially if such assets are not adequately maintained or repaired and renovated as required by relevant circumstances and/or is requested or required by lessees for operational purposes in order to maintain the value disclosed. We believe that, since real estate values historically rise and fall with market conditions, including inflation, interest rates, the business cycle, unemployment and consumer spending, presentations of operating results for a REIT using historical accounting for depreciation may be less informative. Historical accounting for real estate involves the use of U.S. GAAP. Any other method of accounting for real estate such as the fair value method cannot be construed to be any more accurate or relevant than the comparable methodologies of real estate valuation found in U.S. GAAP. Nevertheless, we believe that the use of FFO, which excludes the impact of real estate related depreciation and amortization, provides a more complete understanding of our performance to investors and to management, and when compared year over year, reflects the impact on our operations from trends in occupancy rates, rental rates, operating costs, general and administrative expenses, and interest costs, which may not be immediately apparent from net income. However, FFO and adjusted funds from operations (“AFFO”), as described below, should not be construed to be more relevant or accurate than the current U.S. GAAP methodology in calculating net income or in its applicability in evaluating our operating performance. The method utilized to evaluate the value and performance of real estate under U.S. GAAP should be construed as a more relevant measure of operational performance and considered more prominently than the non-GAAP FFO and AFFO measures and the adjustments to U.S. GAAP in calculating FFO and AFFO.
We consider FFO and AFFO useful indicators of the performance of a REIT. Because FFO calculations exclude such factors as depreciation and amortization of real estate assets and gains or losses from sales of operating real estate assets (which can vary among owners of identical assets in similar conditions based on historical cost accounting and useful-life estimates), they facilitate comparisons of operating performance between periods and between other REITs in our peer group. Accounting for real estate assets in accordance with U.S. GAAP implicitly assumes that the value of real estate assets diminishes predictably over time. Since real estate values have historically risen or fallen with market conditions, many industry investors and analysts have considered the presentation of operating results for real estate companies that use historical cost accounting to be insufficient by themselves.
Changes in the accounting and reporting promulgations under GAAP (for acquisition fees and expenses from a capitalization/depreciation model to an expensed-as-incurred model) that were put into effect in 2009 and other changes to GAAP accounting for real estate subsequent to the establishment of NAREIT's definition of FFO have prompted an increase in cash-settled expenses, specifically acquisition fees and expenses for all industries as items that are expensed under GAAP, that are typically accounted for as operating expenses. Management believes these fees and expenses do not affect our overall long-term operating performance. While certain companies may experience significant acquisition activity, other companies may not have significant acquisition activity and management believes that excluding costs such as merger and transaction costs and acquisition related costs from property operating results provides useful information to investors and provides information that improves the comparability of operating results with other companies who do not have significant merger or acquisition activities. AFFO is not equivalent to our net income or loss as determined under GAAP, and AFFO may not be a useful measure of the impact of long-term operating performance if we continue to have such activities in the future.
We exclude certain income or expense items from AFFO that we consider more reflective of investing activities, other non-cash income and expense items and the income and expense effects of other activities that are not a fundamental attribute of our business plan. These items include unrealized gains and losses, which may not ultimately be realized, such as gains or losses on derivative instruments, gains or losses on contingent valuation rights, gains and losses on investments and early extinguishment of debt. In addition, by excluding non-cash income and expense items such as amortization of above and below market leases, amortization of deferred financing costs, straight-line rent and non-cash equity compensation from AFFO we believe we provide useful information regarding income and expense items which have no cash impact and do not provide liquidity to the company or require capital resources of the company. By providing AFFO, we believe we are presenting useful information that assists investors and analysts to better assess the sustainability of our ongoing operating performance without the impacts of transactions that are not related to the ongoing profitability of our portfolio of properties. We also believe that AFFO is a recognized measure of sustainable operating performance by the REIT industry. Further, we believe AFFO is useful in comparing the sustainability of our operating performance with the sustainability of the operating performance of other real estate companies that are not as involved activities which are excluded from our calculation. Investors are cautioned that AFFO should only be used to assess the sustainability of our operating performance excluding these activities, as it excludes certain costs that have a negative effect on our operating performance during the periods in which these costs are incurred.
In addition, we exclude certain interest expenses related to securities that are convertible to common stock as the shares are assumed to have converted to common stock in our calculation of weighted average common shares-fully diluted. As the Company’s convertible notes have a cash or stock settlement option and the Company has the ability and intent to settle its convertible notes in cash, the interest expense related to our convertible notes have not been excluded from AFFO, and accordingly, the shares are not assumed to have converted to common stock in our calculation of weighted average common shares-fully diluted.
In calculating AFFO, we exclude expenses, which under GAAP are characterized as operating expenses in determining operating net income. These expenses are paid in cash by us, and therefore such funds will not be available to distribute to investors. All paid and accrued merger and acquisition fees and certain other expenses negatively impact our operating performance during the period in which expenses are incurred or properties are acquired and will have negative effects on returns to investors, the potential for future distributions, and cash flows generated by us, unless earnings from operations or net sales proceeds from the disposition of other properties are generated to cover the purchase price of the property and certain other expenses. Therefore, AFFO may not be an accurate indicator of our operating performance, especially during periods in which mergers are being consummated or properties are being acquired or certain other expense are being incurred. AFFO that excludes such costs and expenses would only be comparable to companies that did not have such activities. Further, under GAAP, certain contemplated non-cash fair value and other non-cash adjustments are considered operating non-cash adjustments to net income in determining cash flow from operating activities. In addition, we view fair value adjustments as items which are unrealized and may not ultimately be realized. We view both gains and losses from fair value adjustments as items which are not reflective of ongoing operations and are therefore typically adjusted for when assessing operating performance. Excluding income and expense items detailed above from our calculation of AFFO provides information consistent with management's analysis of the operating performance of the properties. Additionally, fair value adjustments, which are based on the impact of current market fluctuations and underlying assessments of general market conditions, but can also result from operational factors such as rental and occupancy rates, may not be directly related or attributable to our current operating performance. By excluding such changes that may reflect anticipated and unrealized gains or losses, we believe AFFO provides useful supplemental information.
As a result, we believe that the use of FFO and AFFO, together with the required U.S. GAAP presentations, provide a more complete understanding of our performance relative to our peers and a more informed and appropriate basis on which to make decisions involving operating, financing, and investing activities.
FFO and AFFO are non-GAAP financial measures and do not represent net income as defined by U.S. GAAP. FFO and AFFO do not represent cash flows from operations as defined by U.S. GAAP, are not indicative of cash available to fund all cash flow needs and liquidity, including our ability to pay distributions and should not be considered as alternatives to net income, as determined in accordance with U.S. GAAP, for purposes of evaluating our operating performance. Other REITs may not define FFO in accordance with the current NAREIT definition (as we do) or may interpret the current NAREIT definition differently than we do and/or calculate AFFO differently than we do. Consequently, our presentation of FFO and AFFO may not be comparable to other similarly titled measures presented by other REITs.
About the Company
ARCP is a self-managed publicly traded Maryland corporation listed on The NASDAQ Global Select Market, focused on acquiring and owning single tenant freestanding commercial properties subject to net leases with high credit quality tenants.
Forward-Looking Statements
The statements in this press release that are not historical facts may be forward-looking statements. These forward looking statements involve substantial risks and uncertainties. Actual results or events could differ materially from the plans, intentions and expectations disclosed in the forward-looking statements ARCP makes. Forward-looking statements may include, but are not limited to, statements regarding stockholder liquidity and investment value and returns. The words “anticipates,” “believes,” “expects,” “estimates,” “projects,” “plans,” “intends,” “may,” “will,” “would,” and similar expressions are intended to identify forward-looking statements, although not all forward-looking statements contain these identifying words. Factors that might cause such differences include, but are not limited to: the impact of current and future regulation; the impact of credit rating changes; the effects of competition; the ability to attract, develop and retain executives and other qualified employees; changes in general economic or market conditions; and other factors, many of which are beyond our control, including other factors included in our reports filed with the SEC, particularly in the “Risk Factors” and “Management's Discussion and Analysis of Financial Condition and Results of Operations” sections of ARCP's latest Annual Report on Form 10-K and subsequent quarterly reports on Form 10-Q, each as filed with the SEC, as such Risk Factors may be updated from time to time in subsequent reports. ARCP does not assume any obligation to update any forward-looking statements, whether as a result of new information, future events or otherwise.
Contacts | ||||
Anthony J. DeFazio | Brian S. Block, CFO, Treasurer, Secretary and EVP | |||
DDCworks | American Realty Capital Properties, Inc. | |||
tdefazio@ddcworks.com | bblock@arcpreit.com | |||
Ph: 484-342-3600 | Ph: 212-415-6500 | |||
AMERICAN REALTY CAPITAL PROPERTIES, INC.
CONSOLIDATED BALANCE SHEETS
(In thousands, except for share and per share data)
December 31, | ||||||||
2013 | 2012 | |||||||
ASSETS | ||||||||
Real estate investments, at cost: | ||||||||
Land | $ | 786,542 | $ | 249,541 | ||||
Buildings, fixtures and improvements | 3,881,532 | 1,336,726 | ||||||
Land and construction in progress | 21,839 | — | ||||||
Acquired intangible lease assets | 536,250 | 212,223 | ||||||
Total real estate investments, at cost | 5,226,163 | 1,798,490 | ||||||
Less: accumulated depreciation and amortization | (213,186 | ) | (56,110 | ) | ||||
Total real estate investments, net | 5,012,977 | 1,742,380 | ||||||
Cash and cash equivalents | 36,738 | 156,873 | ||||||
Investment in direct financing leases, net | 55,079 | — | ||||||
Investment securities, at fair value | 62,067 | 41,654 | ||||||
Loans held for investment, net | 26,279 | — | ||||||
Derivative assets, at fair value | 9,152 | — | ||||||
Restricted cash | 29,483 | 1,108 | ||||||
Prepaid expenses and other assets | 175,327 | 7,416 | ||||||
Goodwill | 89,875 | — | ||||||
Deferred costs, net | 80,625 | 15,356 | ||||||
Assets held for sale | 679 | 665 | ||||||
Total assets | $ | 5,578,281 | $ | 1,965,452 | ||||
LIABILITIES AND EQUITY | ||||||||
Mortgage notes payable, net | $ | 1,298,990 | $ | 265,118 | ||||
Convertible debt, net | 972,490 | — | ||||||
Senior secured revolving credit facility | — | 124,604 | ||||||
Senior corporate credit facility | 1,059,800 | — | ||||||
Secured credit facility | 150,000 | — | ||||||
Other debt | 104,804 | — | ||||||
Below-market lease liabilities, net | 60,729 | — | ||||||
Derivative liabilities, at fair value | 18,387 | 3,830 | ||||||
Accounts payable and accrued expenses | 134,601 | 9,459 | ||||||
Deferred rent and other liabilities | 16,874 | 4,336 | ||||||
Distributions payable | 141 | 9,946 | ||||||
Total liabilities | 3,816,816 | 417,293 | ||||||
Series D Preferred Stock, $0.01 par value, 21,735,008 shares (part of 100,000,000 aggregate preferred shares authorized) and zero shares authorized and 21,735,008 and zero shares issued and outstanding at December 31, 2013 and 2012, respectively | 269,299 | — | ||||||
Common stock, $0.01 par value, 750,000,000 and 240,000,000 shares authorized and 202,344,455 and 179,167,112 issued and outstanding at December 31, 2013 and 2012, respectively | 2,023 | 1,792 | ||||||
Additional paid-in capital | 2,034,301 | 1,653,900 | ||||||
Accumulated other comprehensive income (loss) | 7,697 | (3,934 | ) | |||||
Accumulated deficit | (692,449 | ) | (120,072 | ) | ||||
Total stockholders’ equity | 1,351,572 | 1,531,694 | ||||||
Non-controlling interests | 140,594 | 16,465 | ||||||
Total equity | 1,492,166 | 1,548,159 | ||||||
Total liabilities and equity | $ | 5,578,281 | $ | 1,965,452 | ||||
AMERICAN REALTY CAPITAL PROPERTIES, INC.
CONSOLIDATED STATEMENTS OF OPERATIONS AND COMPREHENSIVE LOSS
(In thousands, except for per share data)
Three Months Ended December 31, | Year Ended December 31, | |||||||||||||||
2013 | 2012 | 2013 | 2012 | |||||||||||||
Revenues: | ||||||||||||||||
Rental income | $ | 85,256 | $ | 28,846 | $ | 223,701 | $ | 64,791 | ||||||||
Direct financing lease income | 723 | — | 1,700 | — | ||||||||||||
Operating expense reimbursements | 8,136 | 1,228 | 15,095 | 2,002 | ||||||||||||
Total revenues | 94,115 | 30,074 | 240,496 | 66,793 | ||||||||||||
Operating expenses: | ||||||||||||||||
Acquisition related | 1,334 | 17,979 | 23,295 | 42,761 | ||||||||||||
Merger and other transaction related | 110,422 | — | 256,662 | 2,603 | ||||||||||||
Property operating | 10,830 | 1,828 | 19,890 | 3,484 | ||||||||||||
Operating fees to affiliate | 5,654 | — | 5,654 | 212 | ||||||||||||
General and administrative | 2,640 | 2,377 | 6,658 | 3,901 | ||||||||||||
Equity based compensation | 23,425 | 387 | 34,935 | 1,191 | ||||||||||||
Depreciation and amortization | 64,589 | 18,396 | 156,971 | 40,700 | ||||||||||||
Total operating expenses | 218,894 | 40,967 | 504,065 | 94,852 | ||||||||||||
Operating loss | (124,779 | ) | (10,893 | ) | (263,569 | ) | (28,059 | ) | ||||||||
Other (expense) income: | ||||||||||||||||
Interest expense | (39,211 | ) | (4,351 | ) | (80,800 | ) | (11,856 | ) | ||||||||
Other income, net | 180 | 687 | 569 | 426 | ||||||||||||
Loss on derivative instruments, net | 1,883 | 91 | (67,937 | ) | — | |||||||||||
Loss on sale of investments in affiliates | (411 | ) | — | (411 | ) | — | ||||||||||
Gain on sale of investments | — | — | 451 | 534 | ||||||||||||
Total other expenses, net | (37,559 | ) | (3,573 | ) | (148,128 | ) | (10,896 | ) | ||||||||
Loss from continuing operations | (162,338 | ) | (14,466 | ) | (411,697 | ) | (38,955 | ) | ||||||||
Net loss from continuing operations attributable to non-controlling interests | 4,496 | 121 | 5,211 | 255 | ||||||||||||
Net loss from continuing operations attributable to stockholders | (157,842 | ) | (14,345 | ) | (406,486 | ) | (38,700 | ) | ||||||||
Discontinued operations: | ||||||||||||||||
Loss from operations of held for sale properties | 14 | (132 | ) | (34 | ) | (145 | ) | |||||||||
(Loss) gain on held for sale properties | — | (147 | ) | 14 | (600 | ) | ||||||||||
Net loss from discontinued operations | 14 | (279 | ) | (20 | ) | (745 | ) | |||||||||
Net (loss) income from discontinued operations attributable to non-controlling interest | (1 | ) | 15 | 1 | 46 | |||||||||||
Net loss from discontinued operations attributable to stockholders | 13 | (264 | ) | (19 | ) | (699 | ) | |||||||||
Net loss | (162,324 | ) | (14,745 | ) | (411,717 | ) | (39,700 | ) | ||||||||
Net loss attributable to non-controlling interests | 4,495 | 136 | 5,212 | 301 | ||||||||||||
Net loss attributable to stockholders | $ | (157,829 | ) | $ | (14,609 | ) | $ | (406,505 | ) | $ | (39,399 | ) | ||||
Other comprehensive loss: | ||||||||||||||||
Designated derivatives, fair value adjustments | 2,293 | (1,198 | ) | 11,511 | (3,743 | ) | ||||||||||
Unrealized gain (loss) on investment securities, net | 546 | 34 | 119 | (93 | ) | |||||||||||
Comprehensive loss | $ | (154,990 | ) | $ | (15,773 | ) | $ | (394,875 | ) | $ | (43,235 | ) | ||||
Basic and diluted net loss per share from continuing operations attributable to common stockholders | $ | (0.85 | ) | $ | (0.11 | ) | $ | (2.35 | ) | $ | (0.38 | ) | ||||
Basic and diluted net loss per share attributable to common stockholders | $ | (0.85 | ) | $ | (0.11 | ) | $ | (2.36 | ) | $ | (0.39 | ) | ||||
Funds from Operations and Adjusted Funds from Operations Per Share
(In thousands, except share and per share data)
Three Months Ended December 31, | Year Ended December 31, | |||||||||||||||
2013 | Per Share | 2013 | Per Share | |||||||||||||
Net loss attributable to stockholders (in accordance with U.S. GAAP) | $ | (157,829 | ) | $ | (0.72 | ) | $ | (406,505 | ) | $ | (2.14 | ) | ||||
Loss on held for sale properties | — | — | (14 | ) | — | |||||||||||
Depreciation and amortization | 64,589 | 0.29 | 156,971 | 0.83 | ||||||||||||
FFO | (93,240 | ) | (0.43 | ) | (249,548 | ) | (1.31 | ) | ||||||||
— | ||||||||||||||||
Acquisition related | 1,334 | 0.01 | 23,295 | 0.12 | ||||||||||||
Merger and other transaction related | 110,422 | 0.50 | 256,662 | 1.35 | ||||||||||||
(Gain) loss on investment securities | 412 | — | (40 | ) | — | |||||||||||
Loss (gain) on derivative instruments, net | (1,883 | ) | (0.01 | ) | 67,937 | 0.36 | ||||||||||
Interest on convertible obligation to preferred investors | 2,653 | 0.01 | 10,802 | 0.06 | ||||||||||||
Interest premiums and discounts on debt, net and settlement of convertible obligation to preferred investors | 6,898 | 0.03 | 12,072 | 0.06 | ||||||||||||
Amortization of above- and below-market lease assets and liabilities | (435 | ) | — | (246 | ) | — | ||||||||||
Amortization of deferred financing costs | 4,269 | 0.02 | 11,183 | 0.06 | ||||||||||||
Straight-line rent | (3,754 | ) | (0.02 | ) | (8,791 | ) | (0.05 | ) | ||||||||
Non-cash equity compensation expense | 23,425 | 0.11 | 34,935 | 0.18 | ||||||||||||
Operating fees to affiliate | 5,654 | 0.03 | 5,654 | 0.03 | ||||||||||||
AFFO | $ | 55,755 | $ | 0.25 | $ | 163,915 | $ | 0.86 | ||||||||
Weighted Average Shares - fully diluted | 219,992,167 | 190,133,509 | ||||||||||||||