Table of Contents
Filed pursuant to Rule 424(b)(3)
Registration No. 333-197780
PROSPECTUS

ARC Properties Operating Partnership, L.P.
Offer to Exchange
Up to $1,300,000,000 aggregate principal amount of its 2.000% senior notes due 2017,
which have been registered under the Securities Act of 1933, as amended, for any and all of its
outstanding 2.000% senior notes due 2017
Offer to Exchange
Up to $750,000,000 aggregate principal amount of its 3.000% senior notes due 2019,
which have been registered under the Securities Act of 1933, as amended, for any and all of its
outstanding 3.000% senior notes due 2019
Offer to Exchange
Up to $500,000,000 aggregate principal amount of its 4.600% senior notes due 2024,
which have been registered under the Securities Act of 1933, as amended, for any and all of its
outstanding 4.600% senior notes due 2024
ARC Properties Operating Partnership, L.P. (the “Issuer”) is offering to exchange the following notes, all of which were issued under the indenture dated as of February 6, 2014 (the “Base Indenture”), as supplemented by an officer’s certificate dated as of February 6, 2014 (the “Officer’s Certificate” and, together with the Base Indenture, the “indenture”), among the Issuer, American Realty Capital Properties, Inc., as guarantor (the “guarantor”), and U.S. Bank National Association, as trustee (the “trustee”): all of its outstanding 2.000% senior notes due 2017, in an exchange transaction that is being registered hereby (the “old 2017 notes”) for new 2.000% senior notes due 2017 (the “exchange 2017 notes”); all of its outstanding 3.000% senior notes due 2019 (the “old 2019 notes”) for new 3.000% senior notes due 2019, in an exchange transaction that is being registered hereby (the “exchange 2019 notes”); and all of its outstanding 4.600% senior notes due 2024, in an exchange transaction that is being registered hereby (the “old 2024 notes” and, together with the old 2017 notes and the old 2019 notes, the “old notes”) for new 4.600% senior notes due 2024 (the “exchange 2024 notes” and, together with the exchange 2017 notes and the exchange 2019 notes, the “exchange notes”). In this prospectus, we refer to these exchanges collectively as the “exchange offers.” Unless the context otherwise requires, references to the “notes” include the old notes and the exchange notes.
The terms of the exchange 2017 notes, the exchange 2019 notes and the exchange 2024 notes are substantially similar to the terms of the old 2017 notes, the old 2019 notes and the old 2024 notes, respectively, except that the transaction in which you may elect to receive the exchange notes has been registered under the Securities Act of 1933, as amended (the “Securities Act”), and, therefore, the exchange notes are freely transferable, and the transfer restrictions and registration rights relating to the old notes will not apply to the exchange notes. We will pay interest on the exchange notes on February 6 and August 6 of each year. The first such payment will be made on August 6, 2014. The exchange 2017 notes will mature on February 6, 2017, the exchange 2019 notes will mature on February 6, 2019 and the exchange 2024 notes will mature on February 6, 2024. The exchange notes will be issued only in denominations of $2,000 in exchange for each $2,000 principal amount of old notes validly tendered and integral multiples of $1,000 in excess thereof.
Our obligations under the notes are fully and unconditionally guaranteed on an unsecured and unsubordinated basis by American Realty Capital Properties, Inc., our sole general partner (“ARCP”). See “Description of Exchange Notes.”
The principal features of the exchange offers are as follows:
| • | The exchange offers expire at 5:00 p.m., Eastern time, on October 14, 2014, which is the 21st business day after the commencement of the exchange offers, unless extended. |
| • | All old notes that are validly tendered and not validly withdrawn prior to the expiration of the exchange offers will be exchanged for exchange notes. |
| • | You may withdraw tendered old notes at any time prior to the expiration of the exchange offers. |
| • | Exchanges of old notes for exchange notes pursuant to the exchange offers should not be a taxable event for U.S. federal income tax purposes. |
| • | We will not receive any proceeds from the exchange offers. |
| • | We do not intend to apply for listing of the notes on any securities exchange or for inclusion of the notes in any automated quotation system. |
Broker-dealers receiving exchange notes in exchange for old notes acquired for their own account through market-making or other trading activities must deliver a prospectus in any resale of the exchange notes.
See “Risk Factors” beginning on page 15 to read about important factors you should consider in connection with the exchange offers.
Neither the U.S. Securities and Exchange Commission nor any state securities commission has approved or disapproved of these securities or passed upon the adequacy or accuracy of this prospectus. Any representation to the contrary is a criminal offense.
The date of this prospectus is September 12, 2014.
Table of Contents
Each broker-dealer that receives exchange notes for its own account pursuant to the exchange offers must acknowledge that it will deliver a prospectus in connection with any resale of such exchange notes. The letter of transmittal delivered with this prospectus states that by so acknowledging and by delivering a prospectus, a broker-dealer will not be deemed to admit that it is an “underwriter” within the meaning of the Securities Act. This prospectus, as it may be amended or supplemented from time to time, may be used by a broker-dealer in connection with resales of exchange notes received in exchange for unregistered notes where such unregistered notes were acquired as a result of market-making activities or other trading activities. To the extent any such broker-dealer participates in the exchange offers, we have agreed that, for a period of up to 180 days, we will use commercially reasonable efforts to make this prospectus, as amended or supplemented, available to such broker-dealer for use in connection with any such resale and will deliver as many additional copies of this prospectus and each amendment or supplement to this prospectus and any documents incorporated by reference in this prospectus as such broker-dealer may reasonably request. See “Plan of Distribution” in this prospectus.
We have not authorized any dealer, salesman or other person to give any information or to make any representation other than those contained or incorporated by reference in this prospectus. You must not rely upon any information or representation not contained or incorporated by reference in this prospectus as if we had authorized it. This prospectus does not constitute an offer to sell or a solicitation of an offer to buy any securities other than the registered securities to which it relates, nor does this prospectus constitute an offer to sell or a solicitation of an offer to buy securities in any jurisdiction to any person to whom it is unlawful to make such offer or solicitation in such jurisdiction.
| Page | ||||
| 1 | ||||
| 8 | ||||
| 13 | ||||
| 15 | ||||
| 46 | ||||
| 48 | ||||
| 49 | ||||
| SELECTED CONSOLIDATED HISTORICAL AND PRO FORMA FINANCIAL DATA |
51 | |||
| 54 | ||||
| MANAGEMENT’S DISCUSSION AND ANALYSIS OF FINANCIAL CONDITION AND RESULTS OF OPERATIONS |
67 | |||
| 98 | ||||
| STOCK OWNERSHIP BY DIRECTORS, OFFICERS AND CERTAIN STOCKHOLDERS |
111 | |||
| 113 | ||||
| 119 | ||||
| 131 | ||||
| 138 | ||||
| 141 | ||||
| 152 | ||||
| 169 | ||||
| 170 | ||||
| 170 | ||||
| 170 | ||||
| 171 | ||||
| F-1 | ||||
This prospectus contains summaries of the material terms of certain documents and refers you to certain documents that we have filed with the U.S. Securities and Exchange Commission (the “SEC”). See “Where You
i
Table of Contents
Can Find More Information” in this prospectus. Copies of these documents, except for certain exhibits and schedules, will be made available to you without charge upon written or oral request to:
American Realty Capital Properties, Inc.
Attention: Corporate Secretary
405 Park Avenue, 15th Floor
New York, New York 10022
(212) 415-6500
In order to obtain timely delivery of such materials, you must request information from us no later than October 6, 2014, which is five business days prior to the expiration of the exchange offers, unless extended.
No information in this prospectus constitutes legal, business or tax advice, and you should not consider it as such. You should consult your own attorney, business advisor and tax advisor for legal, business and tax advice regarding the exchange offers.
You should rely only upon the information contained in this prospectus. We have not authorized anyone to provide you with different information. This prospectus is not an offer to sell or a solicitation of an offer to buy the notes in any jurisdiction or under any circumstances in which the offer or sale is unlawful. You should not assume that the information contained in this prospectus is accurate as of any date other than the date on the front of this prospectus.
ii
Table of Contents
CERTAIN TERMS
Unless otherwise noted or unless the context otherwise requires, in this prospectus:
| • | “we,” “us,” “our” or similar references means American Realty Capital Properties, Inc. and its consolidated subsidiaries, including, without limitation, ARC Properties Operating Partnership, L.P., its operating partnership. |
| • | “ARCP” means American Realty Capital Properties, Inc. by itself and not including any of its subsidiaries. |
| • | “ARCP OP,” “Issuer” or “operating partnership” means ARC Properties Operating Partnership, L.P. by itself and not including any of its subsidiaries. |
| • | “annualized base rent” means the annualized fixed base rental amount in effect under existing leases as of the applicable date. Annualized base rent does not include real estate taxes and insurance, common area and other operating expenses, substantially all of which are borne by tenants. Annualized base rent does not reflect amounts attributable to percentage rent increases, where applicable. |
| • | “credit tenant” means a tenant that has entered into a lease and that we determine is creditworthy. The term may include tenants with an investment-grade or below investment-grade credit rating or unrated tenants. To the extent we determine that a tenant is a “credit tenant” even though it does not have an investment-grade credit rating, we do so based on our reasonable determination that a tenant should have the financial wherewithal to honor its obligations under its lease with us. This reasonable determination is based on our experience closing net lease transactions and is made after evaluating all tenant due diligence materials that are made available to us, including financial statements and operating data. |
| • | “long-term leases” means properties that are currently subject to net leases with remaining lease terms of 10 years or longer. |
| • | “medium-term leases” means properties originally leased long-term (10 years or longer) that are currently subject to net leases with remaining lease terms of generally three to eight years, on average. |
| • | “net lease” means that the tenant occupying the leased property (usually as a single tenant) does so in much the same manner as if the tenant were the owner of the property. There are various forms of net leases, most typically classified as triple-net or double-net. Triple-net leases typically require the tenant to pay all costs associated with a property, including real estate taxes, insurance, utilities and routine maintenance, in addition to the base rent. Double-net leases typically require the tenant to pay all the costs of triple-net leases but hold the landlord responsible for certain capital expenditures, which may include the repair or replacement of specific structural or bearing components of a property, such as the roof or structure of the building. Accordingly, the landlord receives the rent “net” of these expenses, rendering the cash flow associated with the lease predictable for the term of the lease. Under a net lease, the tenant generally agrees to lease the property for a significant term and to have either no ability or only limited ability to terminate the lease or abate rent prior to the expiration of the term of the lease as a result of real estate-driven events, such as casualty, condemnation or failure by the landlord to fulfill its obligations under the lease. |
iii
Table of Contents
This summary contains basic information about our company and the exchange offers. This summary highlights selected information contained elsewhere in this prospectus. This summary is not complete and does not contain all of the information that may be important to you or that you should consider before deciding whether or not to participate in the exchange offers. For a more complete understanding of our company and these exchange offers, you should read this entire prospectus, including the information set forth under the heading “Risk Factors” and our consolidated financial statements and the notes thereto included or incorporated by reference herein.
Company
ARC Properties Operating Partnership, L.P.
ARCP OP is a subsidiary and the operating partnership of ARCP, which is its sole general partner. Substantially all of ARCP’s business is conducted through ARCP OP. As of June 30, 2014, ARCP is the holder of approximately 97.3% of the common equity interests (“OP Units”) in ARCP OP, and certain affiliates of ARCP and certain unaffiliated investors are limited partners and owners of approximately 1.7% and 1.0%, respectively, of OP Units.
American Realty Capital Properties, Inc.
ARCP is a self-managed and self-administered real estate company that operates two business segments, net lease real estate investment (“REI”) and private capital management (“Cole Capital”).
Through our REI segment, we acquire, own and operate single-tenant, freestanding commercial real estate properties, primarily subject to net leases with high credit quality tenants. We focus on investing in properties that are net leased to credit tenants. Our long-term business strategy is to continue to invest in net leased assets to further develop our diverse portfolio consisting of approximately 70% long-term leases and 30% medium-term leases, with an average remaining lease term of 10 to 12 years. We seek to acquire net lease assets granularly, by self-originating or purchasing such assets, or executing sale-leaseback transactions, small portfolio acquisitions and in connection with build-to-suit opportunities, to the extent they are appropriate in terms of capitalization rate and scale. We expect this investment strategy to provide for stable income from credit tenants and for growth opportunities from re-leasing of current below market leases. We entered into an agreement pursuant to which we will dispose of the multi-tenant assets comprising the portfolio we previously announced would be spun off into American Realty Capital Centers, Inc., as further described under “—Recent Developments—Disposition of Multi-Tenant Shopping Center Business.” We believe such disposition will bring enhanced focus to our core strategy of developing a strong portfolio of single-tenant net lease assets. We have advanced our investment objectives by growing our net lease portfolio through the self-origination of property acquisitions and strategic mergers and acquisitions. Our total asset base was approximately $22 billion as of June 30, 2014.
As a result of the Cole Merger (as defined below), in addition to operating a diverse portfolio of core commercial real estate investments, we, through Cole Capital Advisors, Inc. (“CCA”), are responsible for managing certain non-traded real estate investment trusts (the “Managed REITs”) on a day-to-day basis, identifying and making acquisitions and investments on the Managed REITs’ behalf and recommending to each of the Managed REITs’ respective board of directors an approach for providing investors with liquidity. We receive compensation and reimbursement for services relating to the Managed REITs’ offerings and investment, management, financing and disposition of their respective assets, as applicable. Cole Capital allows us to
1
Table of Contents
generate earnings without the corresponding need to invest capital in that business or incur debt in order to fund or expand operations. As of June 30, 2014, the Managed REITs’ total assets were approximately $6.6 billion. We own CCA through a wholly owned subsidiary of ARCP OP. We and CCA have jointly elected to treat CCA as a taxable REIT subsidiary (“TRS”) for U.S. federal income tax purposes. In order to avoid a potential adverse impact on ARCP’s status as a REIT, we conduct substantially all of our investment management business through the TRS.
As of June 30, 2014, we owned 3,966 properties consisting of 106.8 million square feet, which properties were 98.8% leased with a weighted average remaining lease term of 9.95 years. In constructing our portfolio, we are committed to diversification by industry, tenant and geography. As of June 30, 2014, rental revenues derived from investment grade tenants and tenants affiliated with investment grade entities as determined by a major rating agency approximated 49%. We have attributed the rating of each parent company to its wholly owned subsidiaries for purposes of the foregoing disclosure. Our core strategy encompasses receiving the majority of our revenue from investment grade tenants as we further acquire properties and enter into (or assume) lease arrangements.
ARCP is a Maryland corporation and has qualified to be taxed as a REIT commencing with its taxable year ended December 31, 2011. ARCP generally will not be subject to U.S. federal income tax on its taxable income to the extent that it annually distributes all of its taxable income to its stockholders and otherwise maintains its qualification as a REIT. We also operate our business in a manner that permits us to maintain our exemption from registration under the Investment Company Act of 1940, as amended.
2
Table of Contents
Organizational Structure
The following chart summarizes our organizational structure. This chart is provided for illustrative purposes only and does not purport to represent all legal entities owned or controlled by us.
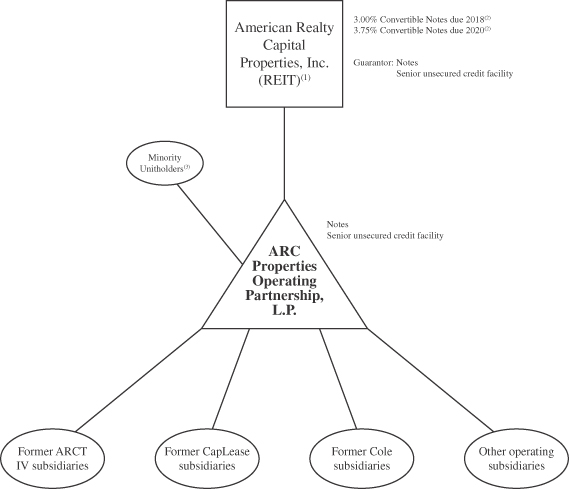
| (1) | ARCP is the sole general partner of ARCP OP and holds, as of June 30, 2014, approximately 97.3% of OP Units. |
| (2) | None of ARCP’s subsidiaries have guaranteed any of ARCP’s obligations with respect to the 3.00% Convertible Notes due 2018 or the 3.75% Convertible Notes due 2020. |
| (3) | Minority unitholders collectively hold approximately 2.7% of OP Units as of June 30, 2014. |
3
Table of Contents
Recent Developments
Equity Offering
On May 28, 2014, ARCP completed an equity offering (the “Equity Offering”) of 138.0 million shares of its common stock, which included the exercise of the underwriters’ option to acquire 18.0 million shares, at a price to the public of $12.00 per share (before underwriting discounts and commissions). We used the net proceeds of approximately $1.6 billion from the Equity Offering to (i) repay $1.3 billion of indebtedness under our prior credit facility and (ii) for other general corporate purposes. The net proceeds were provided to ARCP OP by ARCP as a capital contribution in exchange for 138.0 million OP Units.
Amended and Extended Credit Facility
ARCP OP (as borrower) and ARCP (as guarantor) are parties to a senior unsecured credit facility with Wells Fargo Bank, National Association (“Wells Fargo”) (as administrative agent) and the other lenders party thereto. Effective June 30, 2014, we amended and extended such senior unsecured credit facility to, among other things, increase the amount of revolving commitments (including the addition of a multicurrency sub-facility) and term loan commitments to an aggregate of $4.6 billion. As of June 30, 2014, the senior unsecured credit facility is comprised of a $1.2 billion term loan facility (with a delayed draw component equal to $200.0 million), a $3.15 billion dollar-denominated revolving credit facility and a $250.0 million multi-currency revolving facility (all of which can be borrowed in dollars, at our discretion). The amended facility provides low-cost debt to us and its term has been extended to four years, through June 30, 2018, with the right to extend the term for one additional year. Loans under the revised facility will initially be priced with an applicable margin of 135 basis points in the case of LIBOR revolving loans and 160 basis points in the case of LIBOR term loans. The revised facility allows us to extend our overall debt maturity and reduce our secured, short-term debt, thereby enhancing our long-term balance sheet fundamentals and lowering our total cost of capital. The senior unsecured credit facility includes an accordion feature, which, if exercised in full, allows us to increase the aggregate commitments under the senior unsecured credit facility to $6.0 billion, subject to receipt of such additional commitments and the satisfaction of certain customary conditions. Further detail regarding the revised facility is contained in “Description of Certain Indebtedness—ARCP OP’s Indebtedness—Senior Unsecured Credit Facility.”
Agreement to Acquire Red Lobster Portfolio
On May 16, 2014, we, through a wholly owned subsidiary of ARCP OP, entered into master purchase agreements (the “Purchase Agreements”) to acquire over 500 casual restaurant properties, substantially all of which are operating as Red Lobster® restaurants (the “Red Lobster Portfolio”). The terms of the Purchase Agreements provided that we purchase the Red Lobster Portfolio from a subsidiary of Golden Gate Capital (“Golden Gate”). Prior to its execution of the Purchase Agreements, Golden Gate agreed to acquire the Red Lobster® restaurant chain, including the Red Lobster Portfolio (the “Red Lobster Acquisition”), from Darden Restaurants, Inc. and its affiliates (“Darden”). The transaction was structured as a sale-leaseback in which, in conjunction with Golden Gate’s purchase of the Red Lobster® restaurant chain, including the Red Lobster Portfolio, Golden Gate would cause Darden to transfer the Red Lobster Portfolio to us, which we would then lease to a wholly owned subsidiary of Golden Gate (the “Tenant”) pursuant to the terms of multiple homogenous triple-net master leases (“Master Leases”). Golden Gate, the operator of the Red Lobster Portfolio sites following the acquisition, is an experienced restaurant operator, having successfully invested in numerous, well-recognized brand names and their underlying real estate. Additionally, we expect that the Red Lobster® brand will be guided by numerous returning Red Lobster® executives following the close of the acquisition.
The purchase price of the Red Lobster Portfolio was $1.59 billion, exclusive of closing costs and related expenses (estimated at approximately $10.8 million), representing a capitalization rate of 9.9% under generally accepted accounting principles (“GAAP”) and a cash capitalization rate of 7.9%. Approximately 95% of the Master Leases, based on the total purchase price, are structured with a weighted average 25-year initial term and
4
Table of Contents
approximately 5.0% (constituting leasehold assets) have a weighted average 18.7-year initial term (for an overall weighted average initial lease term of over 24 years). Each Master Lease contains a provision for 2.0% annual rent escalations. The Master Leases are triple-net leases, whereby the Tenant is responsible for paying substantially all operating expenses, including all costs to maintain and repair the roof and structure of the buildings, all capital expenditures and property taxes, in addition to the base rent.
On July 28, 2014, we closed on 492 of the properties constituting the Red Lobster Portfolio and, on July 30, 2014, we closed on the remaining 29 properties.
Overall, we believe that the acquisition of the Red Lobster Portfolio is consistent with our investment strategy of adding high-performing, well-located single-tenant assets to our portfolio following detailed underwriting. After reviewing all of the assets to be sold by Darden to Golden Gate, we are only acquiring those assets that meet our detailed underwriting standards.
Disposition of Multi-Tenant Shopping Center Business
On June 11, 2014, we, through indirect subsidiaries of ARCP (the “Sellers”), entered into an agreement of purchase and sale (the “Agreement”) with BRE DDR Retail Holdings III LLC (the “Purchaser”), an entity indirectly jointly owned by affiliates of Blackstone Real Estate Partners VII L.P. and DDR Corp., by which the Sellers have agreed to sell to the Purchaser and the Purchaser has agreed to purchase from the Sellers 67 multi-tenant properties and nine single-tenant properties and the adjacent land and related property (the “Multi-Tenant Portfolio”). The Multi-Tenant Portfolio constitutes the same assets that we previously announced we would spin off into a new real estate investment trust, American Realty Capital Centers, Inc. The purchase price of the Multi-Tenant Portfolio is $1.975 billion, which may be adjusted for customary real estate adjustments. Properties may be excluded from the transaction in certain circumstances, in which case the purchase price will be reduced by the portion of the purchase price allocated to the excluded properties. In connection with the execution of the Agreement, the Purchaser deposited $50.0 million into escrow.
The Purchaser’s obligation to consummate the transaction is subject to certain customary closing conditions, as well as the following: (i) the initial closing must include no less than $1.775 billion of properties and five particular properties; (ii) the receipt of estoppel certificates from certain tenants with respect to the properties to be purchased at the applicable closing; and (iii) lender consents or loan defeasances with respect to encumbered properties. The transaction is expected to close early in the fourth quarter of 2014. This transaction would, upon consummation, permit us to reduce any complexity added to our portfolio by the multi-tenant assets we assumed in our acquisition of Cole and focus on our core single-tenant net lease investment strategy. We intend to allocate the net proceeds from the sale of the Multi-Tenant Portfolio to cover the purchase price of the Red Lobster Portfolio.
Extended Debt Maturities
During the six months ended June 30, 2014, we borrowed approximately $1.1 billion aggregate principal amount of 10-year fixed-rate, interest-only debt (comprised of approximately $600.0 million aggregate principal amount of mortgage debt and $500.0 million aggregate principal amount of 10-year senior unsecured notes), refinanced over $850.0 million aggregate principal amount of mortgage debt (with a blended near-term maturity of two years) primarily by utilizing the proceeds of $750.0 million aggregate principal amount of five-year senior unsecured notes, and repaid the $1.3 billion credit facility (with a one-year maturity) of Cole (as defined below) with $1.3 billion aggregate principal amount of three-year senior unsecured notes. In addition, on July 14, 2014, we redeemed the CapLease 7.50% Convertible Senior Notes due 2027 and, on July 30, 2014, we redeemed the CapLease Junior Subordinated Notes, each of which were assumed in connection with the CapLease Merger.
5
Table of Contents
Acquisition of Cole Credit Property Trust, Inc.
On May 19, 2014, we completed the acquisition of Cole Credit Property Trust, Inc., a Maryland corporation (“CCPT”), pursuant to an agreement and plan of merger dated as of March 17, 2014 (the “merger agreement”), among ARCP, CCPT and one of ARCP’s wholly owned subsidiaries, Desert Acquisition, Inc. (“Merger Sub”).
Pursuant to the merger agreement, on March 31, 2014, Merger Sub commenced a cash tender offer to purchase all of the outstanding shares of common stock of CCPT (other than shares owned by ARCP, any of its subsidiaries and any wholly owned subsidiaries of CCPT) at a price of $7.25 per share, net to the seller in cash, without interest, less any applicable withholding tax. The offer expired at 5:00 p.m., New York City time, on May 16, 2014. On May 19, 2014, ARCP, through Merger Sub, accepted for payment and paid for all shares of CCPT common stock that were validly tendered in the tender offer, and immediately thereafter exercised its option granted pursuant to the merger agreement (the “Top-Up Option”) to purchase an additional number of shares of CCPT common stock that, when taken together with the shares of CCPT common stock owned, directly or indirectly, by ARCP and Merger Sub, constituted one share more than 90% of the outstanding shares of CCPT common stock, the applicable threshold required to effect a short-form merger under applicable Maryland law without stockholder approval.
Following the consummation of the offer and the exercise of the Top-Up Option, ARCP completed the acquisition of CCPT by effecting a short-form merger under Maryland law, pursuant to which CCPT was merged with and into the Merger Sub, with Merger Sub surviving the merger as a wholly owned subsidiary of ARCP. At the effective time of the merger, each share of CCPT common stock not purchased in the offer (other than shares held by ARCP, any of its subsidiaries or any wholly owned subsidiaries of CCPT, which were automatically canceled and retired and ceased to exist) was converted into the right to receive an amount in cash and without interest equal to $7.25, less any applicable withholding tax.
CCPT’s portfolio of 39 net-leased properties consisting of approximately one million square feet is 100% occupied, diversified across 19 states and 43% investment grade. We acquired these assets for a capitalization rate of 9.29% under GAAP and a cash capitalization rate of 8.16%.
Governance, Management and Board of Directors Changes
On June 20, 2014, ARCP announced that Nicholas S. Schorsch would relinquish his role as chief executive officer of ARCP to David S. Kay, currently the president of ARCP, effective October 1, 2014. The transition was contemplated by Mr. Schorsch’s employment agreement with ARCP and does not constitute a change in control or trigger any accelerated benefits or rights thereunder. On the same date, in a continuing effort to enhance corporate governance, ARCP announced that William M. Kahane and Edward M. Weil, Jr. would be resigning from its board of directors. These resignations became effective on June 24, 2014.
On July 7, 2014, ARCP’s board of directors appointed David S. Kay to serve as a director of ARCP, effective October 1, 2014, the same time that he is to become the chief executive officer of ARCP. On July 7, 2014, ARCP’s board of directors appointed Bruce D. Frank, a former senior partner with the assurance line of the real estate practice of Ernst & Young LLP (“Ernst & Young), to serve as an independent director of ARCP and as a member of the audit committee of the board of directors, effective July 8, 2014.
On July 8, 2014, ARCP announced its efforts to further enhance its corporate governance practices. As part of such announcement, ARCP and RCS Capital Corporation (together with its subsidiaries, “RCAP”) agreed to terminate their investment banking relationship, including the elimination of any remaining fee tails. Such termination will be at no cost to either side. Further, ARCP’s independent directors undertook to eliminate their
6
Table of Contents
presence on the boards of any non-traded REITs sponsored by AR Capital, LLC (together with its subsidiaries, “ARC”) in order to enhance their focus on ARCP. All such resignations will be conducted as soon as possible, in accordance with applicable public company requirements and will provide the other boards sufficient time to find suitable replacements. Finally, as mentioned above, Messrs. Frank and Kay were appointed to ARCP’s board of directors (Mr. Frank’s appointment being effective as of July 8, 2014 and Mr. Kay’s appointment effective as of October 1, 2014) to enhance governance and add strategic leadership, based upon the backgrounds and experience of both individuals.
Additionally, on July 28, 2014, ARCP announced additional enhancements to its corporate governance practices as it remains focused on “best practices”, which it expects will resonate with the governance rating organizations. In this regard, ARCP announced that (i) its board of directors will adopt a resolution opting out of certain portions of the Maryland Unsolicited Takeover Act, thereby prohibiting the creation of a classified board for director voting purposes, unless otherwise approved by holders of a majority of ARCP’s issued and outstanding shares of common stock, (ii) its Nominating and Corporate Governance Committee has commenced a search for a new independent director to replace one of ARCP’s legacy (pre-2014) independent directors, (iii) Nicholas S. Schorsch, ARCP’s Chairman and Chief Executive Officer, David S. Kay, ARCP’s President, and Brian S. Block, ARCP’s Chief Financial Officer and Executive Vice President, have agreed to accept all of their 2014 compensation in excess of base compensation in the form of ARCP’s common stock, (iv) ARCP will adopt stock ownership guidelines for its executive officers and directors, requiring ARCP’s Chairman and Chief Executive Officer and its President to own shares of ARCP’s common stock valued at least six times their respective base salary and for all directors to own shares of ARCP’s common stock valued at least five times their annual cash retainers, each after an appropriate phase-in period and (v) ARCP will establish a pay-for-performance and pay equity compensation arrangements for Mr. Kay in advance of his assumption of the Chief Executive Officer role at ARCP.
Additionally, on September 10, 2014, ARCP announced that (i) Scott J. Bowman, who was one of ARCP’s legacy (pre-2014) independent directors, resigned from the Board of Directors and that it will add a new independent director to replace Mr. Bowman and (ii) Lisa E. Beeson, ARCP’s current Chief Operating Officer, was appointed as President, effective October 1, 2014, simultaneously with David Kay becoming the Chief Executive Officer of ARCP. Ms. Beeson will remain Chief Operating Officer of ARCP as well.
Corporate Information
ARCP OP was organized in January 2011 under the laws of the State of Delaware. ARCP was incorporated in December 2010 under the laws of the State of Maryland. The principal executive offices of ARCP OP and ARCP are located at 405 Park Avenue, 15th Floor, New York, New York 10022. ARCP’s and ARCP OP’s telephone number at that address is (212) 415-6500 and their corporate website is www.arcpreit.com. Information contained on the website is not, and should not be interpreted to be, part of this prospectus.
Additional information about ARCP and its subsidiaries is included in documents incorporated by reference in this prospectus. See “Where You Can Find More Information; Incorporation by Reference.”
7
Table of Contents
SUMMARY OF THE EXCHANGE OFFERS
The summary below describes the principal terms of the exchange offers. The description below is subject to important limitations and exceptions. Please read the section entitled “The Exchange Offers” in this prospectus which contains a more detailed description of the exchange offers.
| The Exchange Offers |
The Issuer is offering to exchange the following notes, all of which were issued under the indenture among the Issuer, the guarantor and the trustee: |
| • | all of its outstanding 2.000% senior notes due 2017 for new 2.000% senior notes due 2017, in an exchange transaction that is being registered hereby; |
| • | all of its outstanding 3.000% senior notes due 2019 for new 3.000% senior notes due 2019, in an exchange transaction that is being registered hereby; and |
| • | all of its outstanding 4.600% senior notes due 2024 for new 4.600% senior notes due 2024, in an exchange transaction that is being registered hereby. |
| Unless the context otherwise requires, references herein to the “notes” include the old notes and the exchange notes. |
| $2,000 principal amount of exchange notes will be issued in exchange for each $2,000 principal amount of old notes validly tendered and integral multiples of $1,000 in excess thereof. |
| Registration Rights Agreement |
The Issuer sold the old notes to Barclays Capital Inc., Citigroup Global Markets Inc., Credit Suisse Securities (USA) LLC, Morgan Stanley & Co. LLC, Capital One Securities, Inc. and Realty Capital Securities, LLC (collectively, the “initial purchasers”) on February 4, 2014. In connection with the sale of the old notes, the Issuer and the guarantor entered into a registration rights agreement (the “registration rights agreement”) with Barclays Capital Inc. and Citigroup Global Markets Inc., as representatives of the initial purchasers, that requires the Issuer to conduct these exchange offers. Under the terms of the registration rights agreement, the Issuer and the guarantor agreed to: |
| • | use commercially reasonable efforts to cause a registration statement relating to offers to exchange notes for an issue of SEC-registered notes with terms identical to the old notes (except that the exchange notes will not be subject to restrictions on transfer or to an increase in annual interest rate) to become effective within 240 days after the date on which the old notes were issued; and |
| • | keep the exchange offers open for a period not less than 20 business days and cause the exchange offers to be consummated within 60 days of the effective date of the registration statement. |
8
Table of Contents
| In addition, the Issuer and the guarantor agreed, in some circumstances, to file and have declared effective a shelf registration statement providing for the sale of all the old notes by the holders thereof. |
| The Issuer and the guarantor will be obligated to pay special interest if the Issuer or the guarantor fail to satisfy our obligations under the registration rights agreement with respect to the old notes under certain circumstances, including if: |
| • | the Issuer and the guarantor fail to consummate the exchange offers on or prior to the 240th day after the date on which the old notes were issued; or |
| • | the shelf registration statement or the exchange offers registration statement is declared effective but thereafter ceases to be effective or usable during the periods specified in the registration rights agreement (each such event referred to in clauses (1) and (2) above, a “registration default”). |
| If there is a registration default, the annual interest rate on the notes will increase by 0.25%. The annual interest rate on the old notes will increase by 0.25% for any subsequent 90-day period during which the registration default continues, up to a maximum additional interest rate of 1.00% per year. If the Issuer cures the registration default, additional interest shall cease to accrue. If the Issuer and the guarantor must pay additional interest on the old notes, the Issuer and the guarantor will pay such interest in cash on the same date that the Issuer makes other interest payments on the old notes. |
| You have the right under the registration rights agreement to exchange your old notes for exchange notes. The exchange offers are intended to satisfy such right. After the exchange offers are complete, you will no longer be entitled to any exchange or registration rights with respect to your old notes. |
| For a description of the procedures for tendering old notes, see “The Exchange Offers—Procedures for Tendering” in this prospectus. |
| Resale of Exchange Notes |
Based on an interpretation by the staff of the SEC set forth in no-action letters issued to unrelated third parties, the Issuer believes that the exchange notes issued pursuant to the exchange offers for old notes may be offered for resale, resold and otherwise transferred by you without compliance with the registration and prospectus delivery provisions of the Securities Act, provided that you: |
| • | are not an “affiliate” of the Issuer or any guarantor within the meaning of Rule 405 under the Securities Act; |
| • | acquired the exchange notes in the ordinary course of your business; and |
9
Table of Contents
| • | are not engaging in, do not intend to engage in, and do not have an arrangement or understanding with any person to participate in, a distribution of the exchange notes. |
| If you are a broker-dealer and receive exchange notes for your own account in exchange for old notes that you acquired as a result of market-making activities or other trading activities, you must acknowledge that you will deliver this prospectus in connection with any resale of the exchange notes. See “Plan of Distribution.” |
| Any holder of old notes that: |
| • | is an affiliate of the Issuer or any guarantor; |
| • | does not acquire exchange notes in the ordinary course of its business; or |
| • | tenders its old notes in the exchange offers with the intention to participate, or for the purpose of participating, in a distribution of exchange notes; |
| cannot rely on the position of the staff of the SEC enunciated in Morgan Stanley & Co. Incorporated (available June 5, 1991) and Exxon Capital Holdings Corporation (available May 13, 1988), as interpreted in the SEC’s letter to Shearman & Sterling, dated available July 2, 1993, or similar no-action letters and, in the absence of an exemption therefrom, must comply with the registration and prospectus delivery requirements of the Securities Act in connection with any resale of the exchange notes. |
| Expiration Date |
The exchange offers will expire at 5:00 p.m., Eastern time, on October 14, 2014 (the “expiration date”), which is the 21st business day after the commencement of the exchange offers, unless the Issuer, in its sole discretion, extends it. |
| Conditions of the Exchange offers |
The exchange offers are subject to certain conditions, some of which may be waived by the Issuer. See “The Exchange Offers—Conditions to the Exchange Offers” in this prospectus. |
| Procedures for Tendering Old Notes |
If you wish to participate in the exchange offers, you must complete, sign and date the accompanying letter of transmittal, or a copy of the letter of transmittal, in accordance with the instructions contained in this prospectus and in the letter of transmittal, and mail or otherwise deliver the letter of transmittal, or the copy, together with the old notes and any other required documentation, to the exchange agent at the address set forth in this prospectus and in the letter of transmittal. |
| If you hold old notes through The Depository Trust Company (“DTC”) and wish to participate in the exchange offers, you must comply with the Automated Tender Offer Program procedures of DTC by which you will agree to be bound by the letter of transmittal. |
10
Table of Contents
| By signing, or agreeing to be bound by, the letter of transmittal, you will represent to the Issuer that, among other things: |
| • | you are not an “affiliate” of the Issuer or any guarantor within the meaning of Rule 405 under the Securities Act; |
| • | you are acquiring the exchange notes in the ordinary course of your business; |
| • | you do not have an arrangement or understanding with any person or entity to engage in the distribution of the exchange notes; |
| • | you are not engaging in or intend to engage in a distribution of the exchange notes; and |
| • | if you are a broker-dealer that will receive exchange notes for your own account in exchange for old notes that were acquired as a result of market-making activities or other trading activities, that you will comply with the applicable provisions of the Securities Act (including, but not limited to, the prospectus delivery requirements thereunder). |
| The Issuer will accept for exchange any and all old notes that are properly tendered in the exchange offers prior to the expiration date. The exchange notes issued in the exchange offers will be delivered promptly following the expiration date. See “The Exchange Offers—Procedures For Tendering” in this prospectus. |
| Special Procedures for Beneficial Owners |
If you are the beneficial owner of old notes registered in the name of a broker, dealer, commercial bank, trust company or other nominee and wish to tender those old notes in the exchange offers, you should contact the person in whose name your notes are registered and instruct the registered holder to tender those old notes on your behalf. If you wish to tender on your own behalf, you must, prior to completing and executing the letter of transmittal and delivering your old notes, either make appropriate arrangements to register ownership of the old notes in your name or obtain a properly completed bond power from the registered holder. The transfer of registered ownership may take considerable time and may not be able to be completed prior to the expiration date. See “The Exchange Offers— Procedures for Tendering” in this prospectus. |
| Guaranteed Delivery Procedures |
If you wish to tender your old notes and your old notes are not immediately available or you cannot deliver your old notes, the letter of transmittal or any other required documents, or you cannot comply with the procedures under DTC’s Automated Tender Offer Program for transfer of book-entry interests, prior to the expiration date, you must tender your old notes according to the guaranteed delivery procedures as described in “The Exchange Offers—Guaranteed Delivery Procedures” in this prospectus. |
11
Table of Contents
| Withdrawal Rights |
The tender of the old notes pursuant to the exchange offers may be withdrawn at any time prior to 5:00 p.m., Eastern time, on the expiration date. See “The Exchange Offers—Withdrawal Rights” in this prospectus. |
| Acceptance of Old Notes and Delivery of Exchange Notes |
Subject to customary conditions, we will accept old notes which are properly tendered in the exchange offers and not withdrawn prior to the expiration date. The exchange notes will be delivered promptly following the expiration date. |
| Effect on Not Tendering |
Any old notes that are not tendered or that are tendered but not accepted will remain subject to the restrictions on transfer. Since the old notes have not been registered under the federal securities laws, they bear a legend restricting their transfer absent registration or the availability of a specific exemption from registration. Upon completion of the exchange offers, the Issuer will have no further obligations, except under limited circumstances, to provide for registration of the old notes under the federal securities laws. See “Risk Factors—Risks Related to the Exchange Offers” in this prospectus. |
| Interest on the Exchange Notes and the Old Notes |
The exchange notes will bear interest from the most recent interest payment date to which interest has been paid on the old notes. Interest on the old notes accepted for exchange will cease to accrue upon the issuance of the exchange notes. |
| Material U.S. Federal Income Tax Considerations |
The exchange of old notes for exchange notes by tendering holders should not be a taxable exchange for U.S. federal income tax purposes. See “Material U.S. Federal Income Tax Considerations” in this prospectus. |
| Exchange Agent |
U.S. Bank National Association, the trustee under the indenture, is serving as exchange agent in connection with the exchange offers. |
| Use of Proceeds |
The Issuer will not receive any proceeds from the issuance of exchange notes pursuant to the exchange offers. See “Use of Proceeds” in this prospectus. |
12
Table of Contents
SUMMARY DESCRIPTION OF EXCHANGE NOTES
The summary below describes the principal terms of the exchange notes. Certain of the terms and conditions described below are subject to important limitations and exceptions. The “Description of Exchange Notes” section of this prospectus contains a more detailed description of the terms and conditions of the exchange notes.
| Issuer |
ARC Properties Operating Partnership, L.P. |
| Notes Offered |
$1,300,000,000 aggregate principal amount of 2.000% senior notes due 2017. |
| $750,000,000 aggregate principal amount of 3.000% senior notes due 2019. |
| $500,000,000 aggregate principal amount of 4.600% senior notes due 2024. |
| The terms of the exchange 2017 notes, the exchange 2019 notes and the exchange 2024 notes are substantially similar to the terms of the old 2017 notes, the old 2019 notes and the old 2024 notes, respectively, except that the transaction in which you may elect to receive the exchange notes has been registered under the Securities Act and, therefore, the exchange notes are freely transferable and the transfer restrictions and registration rights relating to the old notes will not apply to the exchange notes. |
| Maturity Date |
Exchange 2017 notes: February 6, 2017. |
| Exchange 2019 notes: February 6, 2019. |
| Exchange 2024 notes: February 6, 2024. |
| Interest |
Exchange 2017 notes: 2.000% per year, accruing from February 6, 2014, payable semi-annually in arrears on February 6 and August 6 of each year, beginning August 6, 2014. |
| Exchange 2019 notes: 3.000% per year, accruing from February 6, 2014, payable semi-annually in arrears on February 6 and August 6 of each year, beginning August 6, 2014. |
| Exchange 2024 notes: 4.600% per year, accruing from February 6, 2014, payable semi-annually in arrears on February 6 and August 6 of each year, beginning August 6, 2014. |
| Guarantees |
The exchange notes will be guaranteed by ARCP, the general partner of the Issuer. The exchange notes will not be guaranteed by any subsidiaries of the Issuer. |
| Ranking |
The exchange notes and the exchange notes guarantees are the unsecured and unsubordinated obligations of the Issuer and the guarantor and: |
| • | will rank equally with all of the Issuer’s and the guarantor’s existing and future unsecured and unsubordinated indebtedness; |
13
Table of Contents
| • | will be effectively subordinated to all of the Issuer’s and the guarantor’s existing and future secured indebtedness to the extent of the value of the collateral securing such indebtedness; and |
| • | will be structurally subordinated to all existing and future indebtedness and other liabilities of the Issuer’s subsidiaries. |
| In addition, the exchange notes will be structurally senior to all existing and future indebtedness of ARCP that is not guaranteed by the Issuer. |
| As of June 30, 2014, the Issuer had outstanding, on a consolidated basis, $4.1 billion of senior secured indebtedness, $5.5 billion of unsecured senior indebtedness (including the exchange notes offered hereby) and $0.1 billion of unsecured subordinated indebtedness. |
| Optional Redemption |
The Issuer may redeem all or a part of any series of the exchange notes at any time at its option, at the applicable redemption price specified forth under “Description of Exchange Notes—Optional Redemption.” |
| With respect to the exchange 2019 notes and the exchange 2024 notes, if the notes are redeemed on or after January 6, 2019, with respect to the exchange 2019 notes, or November 6, 2023, with respect to the exchange 2024 notes, the redemption price will equal 100% of the principal amount of the notes of the applicable series to be redeemed, plus accrued and unpaid interest on the amount being redeemed to, but excluding, the date of redemption. |
| Covenants |
The indenture governing the exchange notes contains certain covenants that, among other things, limit the Issuer’s and the guarantor’s ability to: |
| • | consummate a merger, consolidation or sale of all or substantially all of its assets; and |
| • | incur or guarantee secured or unsecured indebtedness; |
| The covenants also require subsidiaries of ARCP that (a) own equity interests of the Issuer, or (b) guarantee other indebtedness of the Issuer or any guarantor in the future, to guarantee the exchange notes on an equal and ratable basis. |
| These covenants are subject to a number of important exceptions and qualifications. See “Description of Exchange Notes—Certain Covenants” in this prospectus. |
Risk Factors
Investing in the exchange notes involves substantial risks. You should carefully consider all of the risks described in “Risk Factors” beginning on page 15 of this prospectus in addition to the other information contained or incorporated by reference in this prospectus before tendering any old notes.
14
Table of Contents
You should carefully consider the following risks described below as well as the other information contained in this prospectus before making a decision to participate in the exchange offers. If any of these risks have a material adverse effect on our business, financial condition, results or operations or cash flows, you may lose all or part of your original investment.
Risks Related to Our Properties and Operations
Our growth will partially depend upon our ability to successfully acquire future properties, and we may be unable to enter into and consummate property acquisitions on advantageous terms or our property acquisitions may not perform as we expect due to competitive conditions and other factors.
We acquire and intend to continue to acquire primarily freestanding, single tenant retail properties net leased primarily to investment grade and other credit tenants. The acquisition of properties entails various risks, including the risks that our investments may not perform as we expect, that we may be unable to quickly and efficiently integrate our new acquisitions into our existing operations and that our cost estimates for bringing an acquired property up to market standards may prove inaccurate. Further, we face significant competition for attractive investment opportunities from other well capitalized real estate investors, including both publicly-traded REITs and private institutional investment funds including REITs and funds sponsored by Cole Capital and these competitors may have greater financial resources than us and a greater ability to borrow funds and acquire properties. This competition increases as investments in real estate become increasingly attractive relative to other forms of investment. As a result of competition, we may be unable to acquire additional properties as we desire or the purchase price may be significantly elevated. In addition, we expect to finance future acquisitions through a combination of borrowings under our revolving credit facility, proceeds from equity or debt offerings by ARCP or ARCP OP or our subsidiaries and proceeds from property contributions and divestitures, which may not be available and which could adversely affect our cash flows. Any of the above risks could adversely affect our financial condition, results of operations and cash flows.
In addition, our growth strategy includes the disciplined acquisition of properties as opportunities arise. Our ability to acquire properties on satisfactory terms and successfully integrate and operate them is subject to the following significant risks:
| • | we may be unable to acquire desired properties because of competition from other real estate investors with more capital, including other real estate operating companies, REITs and investment funds; |
| • | we may acquire properties that are not accretive to our results upon acquisition, and we may not successfully manage and lease those properties to meet our expectations; |
| • | competition from other potential acquirers may significantly increase the purchase price of a desired property; |
| • | we may be unable to generate sufficient cash from operations, or obtain the necessary debt or equity financing to consummate an acquisition or, if obtainable, financing may not be on satisfactory terms; |
| • | we may need to spend more than budgeted amounts to make necessary improvements or renovations to acquired properties; |
| • | agreements for the acquisition of properties are typically subject to customary conditions to closing, including satisfactory completion of due diligence investigations, and we may spend significant time and money on potential acquisitions that we do not consummate; |
| • | the process of acquiring or pursuing the acquisition of a new property may divert the attention of our management from our existing business operations; |
| • | we may be unable to quickly and efficiently integrate new acquisitions, particularly acquisitions of portfolios of properties, into our existing operations; |
15
Table of Contents
| • | market conditions may result in future vacancies and lower-than-expected rental rates; and |
| • | we may acquire properties without any recourse, or with only limited recourse, for liabilities, whether known or unknown, such as cleanup of environmental contamination, claims by tenants, vendors or other persons against the former owners of the properties and claims for indemnification by general partners, directors, officers and others indemnified by the former owners of the properties. |
If we cannot complete property acquisitions on favorable terms or operate acquired properties to meet our goals or expectations, our business, financial condition, results of operations and cash flows and our ability to satisfy our debt service obligations could be materially and adversely affected.
We may be unable to renew leases, lease vacant space or re-lease space as leases expire on favorable terms or at all, which could have a material adverse effect on our financial condition, results of operations and cash flow and our ability to satisfy our debt service obligations.
Because we compete with a number of real estate operators in connection with the leasing of our properties, the possibility exists that one or more of our tenants will extend or renew its lease with us when the lease term expires on terms that are less favorable to us than the terms of the then-expiring lease, or that such tenant or tenants will not renew at all. Because we depend, in large part, on rental payments from our tenants, if one or more tenants renews its lease on terms less favorable to us, does not renew its lease or we do not re-lease a significant portion of the space made available due to vacancy, our financial condition, results of operations and cash flows and our ability to satisfy our debt service obligations could be materially adversely affected.
We are dependent on single-tenant leases for our revenue and, accordingly, lease terminations or tenant defaults could have a material adverse effect on our results of operations.
We focus our investment activities on ownership of freestanding, single-tenant commercial properties that are net leased to a single tenant. Therefore, the financial failure of, or other default in payment by, a single tenant under its lease is likely to cause a significant reduction in our operating cash flows from that property and a significant reduction in the value of the property, and could cause a significant reduction in our revenues. If a lease is terminated or defaulted on, we may experience difficulty or significant delay in re-leasing such property, or we may be unable to find a new tenant to re-lease the vacated space, which could result in us incurring a loss. The current economic conditions may put financial pressure on and increase the likelihood of the financial failure of, or other default in payment by, one or more of the tenants to whom we have exposure.
The failure by any major tenant with leases in multiple locations to make rental payments to us, because of a deterioration of its financial condition or otherwise, or the termination or non-renewal of a lease by a major tenant, would have a material adverse effect on us.
Our ability to generate cash from operations is dependent on the rents that we are able to charge and collect from our tenants. While we evaluate the creditworthiness of our tenants by reviewing available financial and other pertinent information, there can be no assurance that any tenant will be able to make timely rental payments or avoid defaulting under its lease. At any time, our tenants may experience an adverse change in their business. For example, the downturn in the global economy that commenced in 2008 may have adversely affected, or may in the future adversely affect, one or more of our tenants. If any of our tenants’ business experience significant adverse changes, they may decline to extend or renew leases upon expiration, fail to make rental payments when due, close a number of stores, exercise early termination rights (to the extent such rights are available to the tenant) or declare bankruptcy. If a tenant defaults, we may experience delays in enforcing our rights as landlord and may incur substantial costs in protecting our investment.
If any of the foregoing were to occur, it could result in the termination of the tenant’s leases and the loss of rental income attributable to the terminated leases. If a lease is terminated or defaulted on, we may be unable to find a new tenant to re-lease the vacated space at attractive rents or at all, which would have a material adverse
16
Table of Contents
effect on our results of operations and our financial condition. Furthermore, the consequences to us would be exacerbated if one of our major tenants were to experience an adverse development in their business that resulted in them being unable to make timely rental payments or to default under their lease. The occurrence of any of the situations described above would have a material adverse effect on our results of operations and our financial condition.
If a sale-leaseback transaction is re-characterized in a tenant’s bankruptcy proceeding, our financial condition could be adversely affected.
We have entered and may continue to enter into sale-leaseback transactions, whereby we would purchase a property and then lease the same property back to the person from whom we purchased it. In the event of the bankruptcy of a tenant, a transaction structured as a sale-leaseback may be re-characterized as either a financing or a joint venture, either of which outcomes could adversely affect our financial condition and cash flow.
If the sale-leaseback were re-characterized as a financing, we might not be considered the owner of the property, and as a result would have the status of a creditor in relation to the tenant. In that event, we would no longer have the right to sell or encumber our ownership interest in the property. Instead, we would have a claim against the tenant for the amounts owed under the lease, with the claim arguably secured by the property. The tenant/debtor might have the ability to propose a plan restructuring the term, interest rate and amortization schedule of its outstanding balance. If confirmed by the bankruptcy court, we could be bound by the new terms and prevented from foreclosing our lien on the property. If the sale-leaseback were re-characterized as a joint venture, our lessee and we could be treated as co-venturers with regard to the property. As a result, we could be held liable, under some circumstances, for debts incurred by the lessee relating to the property.
We are subject to tenant geographic concentrations that make us more susceptible to adverse events with respect to certain geographic areas.
We are subject to geographic concentrations, the most significant of which, as of June 30, 2014, is approximately $168.9 million, or 12.9%, of our annualized rental income that came from properties located in Texas. Any downturn of the economy in the state of Texas or in any other state, in which we may have a significant credit concentration in the future, could result in a material reduction of our cash flows or material losses to us.
Our net leases may require us to pay property-related expenses that are not the obligations of our tenants.
Under the terms of the majority of our net leases, in addition to satisfying their rent obligations, our tenants are responsible for the payment of real estate taxes, insurance and ordinary maintenance and repairs. However, under the provisions of certain leases and leases that we may enter into in the future with our tenants, we may be required to pay some expenses, such as the costs of environmental liabilities, roof and structural repairs, insurance, certain non-structural repairs and maintenance. If our properties incur significant expenses that must be paid by us under the terms of our leases, our business, financial condition and results of operations will be adversely affected and the amount of cash available to meet expenses and to make dividends to holders of our capital stock may be reduced.
Net leases may not result in fair market lease rates over time, which could negatively impact our income and reduce the amount of funds available to make distributions to stockholders.
The vast majority of our rental income comes from net leases, which generally provide the tenant greater discretion in using the leased property than ordinary property leases, such as the right to freely sublease the property, to make alterations in the leased premises and to terminate the lease prior to its expiration under specified circumstances. Furthermore, net leases typically have longer lease terms and, thus, there is an increased risk that contractual rental increases in future years will fail to result in fair market rental rates during those years. As a result, our income could be lower than it would otherwise be if we did not engage in net leases.
17
Table of Contents
Long-term leases with tenants may not result in fair value over time.
Long-term leases do not allow for significant changes in rental payments and do not expire in the near term. If we do not accurately judge the potential for increases in market rental rates when negotiating these long-term leases, significant increases in future property operating costs, to the extent not covered under the net leases could result in us receiving less than fair value from these leases. These circumstances would adversely affect our revenues.
Any of our properties that incurs a vacancy could be difficult to sell or re-lease.
One or more of our properties may incur a vacancy either by the continued default of a tenant under its lease or the expiration of one of our leases. Certain of our properties may be specifically suited to the particular needs of a tenant (e.g., a retail bank branch or distribution warehouse) and major renovations and expenditures may be required in order for us to re- lease vacant space for other uses. We may have difficulty obtaining a new tenant for any vacant space we have in our properties, including our presently vacant property. If the vacancies continue for a long period of time, we may suffer reduced revenues, resulting in less cash available to be distributed to stockholders. In addition, the resale value of a property could be diminished because the market value of a particular property will depend principally upon the value of the leases of such property.
Our properties may be subject to impairment charges.
We periodically evaluate our real estate investments for impairment indicators. The judgment regarding the existence of impairment indicators is based on factors such as market conditions, tenant performance and legal structure. For example, the early termination of, or default under, a lease by a tenant may lead to an impairment charge. Since our investment focus is on properties net leased to a single tenant, the financial failure of, or other default in payment by, a single tenant under its lease may result in a significant impairment loss. If we determine that an impairment has occurred, we would be required to make an adjustment to the net carrying value of the property, which could have a material adverse effect on our results of operations and cash flow in the period in which the impairment charge is recorded.
Our real estate investments are relatively illiquid and therefore we may not be able to dispose of properties when appropriate or on favorable terms.
The real estate investments made, and to be made, by us are relatively difficult to sell quickly. Return of capital and realization of gains, if any, from an investment generally will occur upon disposition or refinancing of a property. In addition, the Internal Revenue Code of 1986, as amended (the “Code”) imposes restrictions on the ability of a REIT to dispose of properties that are not applicable to other types of real estate companies. We may be unable to realize our investment objectives by disposition or refinancing of a property at attractive prices within any given period of time or may otherwise be unable to complete any exit strategy. In particular, these risks could arise from weakness in or even the lack of an established market for a property, changes in the financial condition or prospects of prospective purchasers, changes in national or international economic conditions, and changes in laws, regulations or fiscal policies of jurisdictions in which the property is located.
Our investments in properties backed by below investment grade credits will have a greater risk of default.
As of June 30, 2014, approximately 51% of our annualized rental income is derived from tenants who do not have investment grade credit ratings from a major ratings agency or are not affiliates of companies having an investment grade credit rating. We also may invest in other properties in the future where the tenant is not rated or the tenant’s credit rating is below investment grade. These investments will have a greater risk of default and bankruptcy than investments in properties leased exclusively to investment grade tenants.
18
Table of Contents
Our investments in properties where the underlying tenant does not have a publicly available credit rating will expose us to certain risks.
When we invest in properties where the underlying tenant does not have a publicly available credit rating, we will rely on our own estimates of the tenant’s credit rating. If our lender or a credit rating agency disagrees with our ratings estimates, or our ratings estimates are inaccurate, we may not be able to obtain our desired level of leverage or our financing costs may exceed those that we projected. This outcome could have an adverse impact on our returns on that asset and hence our operating results.
Operating expenses of our properties will reduce our cash flow and funds available for future distributions.
For certain of our properties, we are responsible for some or all of the operating costs of the property. In some of these instances, our leases require the tenant to reimburse us for all or a portion of these costs, either in the form of an expense reimbursement or increased rent. Our reimbursement may be limited to a fixed amount or a specified percentage annually. To the extent operating costs exceed our reimbursement, our returns and net cash flows from the property and hence our overall operating results and cash flows could be materially adversely affected.
We would face potential adverse effects from tenant defaults, bankruptcies or insolvencies.
The bankruptcy of our tenants may adversely affect the income generated by our properties. If our tenant files for bankruptcy, we generally cannot evict the tenant solely because of such bankruptcy. In addition, a bankruptcy court could authorize a bankrupt tenant to reject and terminate its lease with us. In such a case, our claim against the tenant for unpaid and future rent would be subject to a statutory cap that might be substantially less than the remaining rent actually owed under the lease, and it is unlikely that a bankrupt tenant would pay in full amounts it owes us under the lease. Any shortfall resulting from the bankruptcy of one or more of our tenants could adversely affect our cash flow and results of operations.
We have assumed, and expect in the future to continue to assume, liabilities in connection with our property acquisitions, including unknown liabilities.
We have assumed existing liabilities, some of which may have been unknown or unquantifiable at the time of the transaction related to our formation transactions, our Recent Acquisitions and certain other property acquisitions, and expect in the future to continue to assume existing liabilities related to our property acquisitions. Unknown liabilities might include liabilities for cleanup or remediation of undisclosed environmental conditions, claims of tenants or other persons dealing with the sellers prior to our acquisition of the properties, tax liabilities, employment-related issues, and accrued but unpaid liabilities whether incurred in the ordinary course of business or otherwise. If the magnitude of such unknown liabilities is high, either singly or in the aggregate, they could adversely affect our business, financial condition, results of operations, cash flow and ability to satisfy our debt service obligations.
See “Management’s Discussion and Analysis of Financial Condition and Results of Operations—Completed Mergers and Major Acquisitions” for a discussion of the Recent Acquisitions.
We face intense competition, which may decrease or prevent increases in the occupancy and rental rates of our properties.
We compete with numerous developers, owners and operators of retail, industrial and office real estate, many of which own properties similar to ours in the same markets in which our properties are located. If one of our properties becomes vacant and our competitors (which would include funds sponsored by us) offer space at rental rates below current market rates, or below the rental rates we currently charge our tenants, we may lose existing or potential tenants and we may be pressured to reduce our rental rates below those we currently charge
19
Table of Contents
or to offer substantial rent abatements. As a result, our financial condition, results of operations, cash flow and ability to satisfy our debt service obligations may be adversely affected.
Our operating performance and value are subject to risks associated with our real estate assets and with the real estate industry.
Our real estate investments are subject to various risks and fluctuations and cycles in value and demand, many of which are beyond our control. Certain events may decrease cash available for dividends, as well as the value of our properties. These events include, but are not limited to:
| • | adverse changes in international, national or local economic and demographic conditions such as the recent global economic downturn; |
| • | vacancies or our inability to rent space on favorable terms, including possible market pressures to offer tenants rent abatements, tenant improvements, early termination rights or tenant-favorable renewal options; |
| • | adverse changes in financial conditions of buyers, sellers and tenants of properties; |
| • | inability to collect rent from tenants; |
| • | competition from other real estate investors with significant capital, including other real estate operating companies, REITs and institutional investment funds; |
| • | reductions in the level of demand for commercial space generally, and freestanding net leased properties specifically, and changes in the relative popularity of our properties; |
| • | increases in the supply of freestanding single-tenant properties; |
| • | fluctuations in interest rates, which could adversely affect our ability, or the ability of buyers and tenants of our properties, to obtain financing on favorable terms or at all; |
| • | increases in expenses, including, but not limited to, insurance costs, labor costs, energy prices, real estate assessments and other taxes and costs of compliance with laws, regulations and governmental policies, all of which have an adverse impact on the rent a tenant may be willing to pay us in order to lease one or more of our properties; and |
| • | changes in, and changes in enforcement of, laws, regulations and governmental policies, including, without limitation, health, safety, environmental, zoning and tax laws, governmental fiscal policies and the Americans with Disabilities Act of 1990. |
In addition, periods of economic slowdown or recession, such as the recent global economic downturn, rising interest rates or declining demand for real estate, or the public perception that any of these events may occur, could result in a general decline in rents or an increased incidence of defaults under existing leases. If we cannot operate our properties to meet our financial expectations, our business, financial condition, results of operations, cash flow and ability to satisfy our debt service obligations could be materially and adversely affected. We cannot assure you that we will achieve our return objectives.
A potential change in U.S. accounting standards regarding operating leases may make the leasing of our properties less attractive to our potential tenants, which could reduce overall demand for our leasing services.
Under current authoritative accounting guidance for leases, a lease is classified by a tenant as a capital lease if the significant risks and rewards of ownership are considered to reside with the tenant. Under capital lease accounting for a tenant, both the leased asset and liability are reflected on their balance sheet. If the lease does not meet any of the criteria for a capital lease, the lease is considered an operating lease by the tenant, and the
20
Table of Contents
obligation does not appear on the tenant’s balance sheet; rather, the contractual future minimum payment obligations are only disclosed in the footnotes thereto. Thus, entering into an operating lease can appear to enhance a tenant’s balance sheet in comparison to direct ownership. The Financial Accounting Standards Board (the “FASB”) and the International Accounting Standards Board (the “IASB”) conducted a joint project to re-evaluate lease accounting. In August 2010, the FASB and the IASB jointly released exposure drafts of a proposed accounting model that would significantly change lease accounting. Based on comments received, a revised exposure was released in May 2013. Changes to the accounting guidance could affect both our accounting for leases, as well as that of our current and potential tenants. These changes may affect how our real estate leasing business is conducted. For example, if the accounting standards regarding the financial statement classification of operating leases are revised, then companies may be less willing to enter into leases with us in general or desire to enter into leases with us with shorter terms because the apparent benefits to their balance sheets could be reduced or eliminated. This in turn could make it more difficult for us to enter into leases on terms we find favorable.
We will rely on external sources of capital to fund future capital needs, and if we encounter difficulty in obtaining such capital, we may not be able to make future acquisitions necessary to grow our business or meet maturing obligations.
In order to qualify as a REIT under the Code, ARCP will be required, among other things, to distribute annually to its stockholders at least 90% of our REIT taxable income (which does not equal net income as calculated in accordance with GAAP), determined without regard to the deduction for dividends paid and excluding any net capital gain. Because of this dividend requirement, we may not be able to fund, from cash retained from operations, all of our future capital needs, including capital needed to make investments and to satisfy or refinance maturing obligations.
We expect to rely on external sources of capital, including debt and equity financing, to fund future capital needs. However, the U.S. and global economic slowdown that commenced in 2008 has resulted in a capital environment characterized by limited availability, increasing costs and significant volatility. If we are unable to obtain needed capital on satisfactory terms or at all, we may not be able to make the investments needed to expand our business, or to meet our obligations and commitments as they mature.
Any additional debt we incur will increase our leverage. Our access to capital will depend upon a number of factors over which we have little or no control, including:
| • | general market conditions; |
| • | the market’s perception of our growth potential; |
| • | our current debt levels; |
| • | our current and expected future earnings; and |
| • | our cash flows. |
We may not be in a position to take advantage of attractive investment opportunities for growth if we are unable to access the capital markets on a timely basis on favorable terms.
We have substantial amounts of indebtedness outstanding, which may affect ARCP’s ability to make dividends, may expose us to interest rate fluctuation risk and may expose us to the risk of default under our debt obligations.
As of June 30, 2014, our aggregate indebtedness was approximately $9.7 billion. We may incur significant additional debt for various purposes including, without limitation, the funding of future acquisitions, capital improvements and leasing commissions in connection with the repositioning of a property.
21
Table of Contents
We intend to incur additional indebtedness in the future, including borrowings under our newly revised (effective June 30, 2014) $4.6 billion senior unsecured credit facility (under which we have undrawn commitments of $2.7 billion at June 30, 2014 and which contains an “accordion” feature to allow us, under certain circumstances, to increase the commitments thereunder to $6.0 billion). At June 30, 2014, we had approximately $1.9 billion outstanding under the senior unsecured credit facility.
Payments of principal and interest on borrowings may leave us with insufficient cash resources to make the dividends currently contemplated or necessary to maintain ARCP’s REIT qualification. Our substantial outstanding indebtedness, and the limitations imposed on us by our debt agreements, could have other significant adverse consequences, including as follows:
| • | our cash flow may be insufficient to meet our required principal and interest payments; |
| • | we may be unable to borrow additional funds as needed or on satisfactory terms, which could, among other things, adversely affect our ability to capitalize upon emerging acquisition opportunities or meet needs to fund capital improvements and leasing commissions; |
| • | we may be unable to refinance our indebtedness at maturity or the refinancing terms may be less favorable than the terms of our original indebtedness; |
| • | we may be forced to dispose of one or more of our properties, possibly on disadvantageous terms; |
| • | we may violate restrictive covenants in our loan documents, which would entitle the lenders to accelerate our debt obligations; |
| • | certain of the property subsidiaries’ loan documents may include restrictions on such subsidiary’s ability to make dividends to us; |
| • | we may be unable to hedge floating-rate debt, counterparties may fail to honor their obligations under our hedge agreements, these agreements may not effectively hedge interest rate fluctuation risk, and, upon the expiration of any hedge agreements, we would be exposed to then-existing market rates of interest and future interest rate volatility; |
| • | we may default on our obligations and the lenders or mortgagees may foreclose on our properties that secure their loans and receive an assignment of rents and leases; |
| • | increasing our vulnerability to general adverse economic and industry conditions; |
| • | limiting our ability to obtain additional financing to fund future working capital, capital expenditures and other general corporate requirements; |
| • | requiring the use of a substantial portion of our cash flow from operations for the payment of principal and interest on indebtedness, thereby reducing our ability to use our cash flow to fund working capital, acquisitions, capital expenditures and general corporate requirements; |
| • | limiting our flexibility in planning for, or reacting to, changes in our business and industry; and |
| • | putting us at a disadvantage compared to our competitors with less indebtedness. |
If we default under a loan or indenture (including any default in respect of the financial maintenance and negative covenants contained in our senior unsecured credit facility), we may automatically be in default under any other loan or indenture that has cross-default provisions (including our senior unsecured credit facility), and further borrowings under our senior unsecured credit facility will be prohibited, outstanding indebtedness under our senior unsecured credit facility, our indenture or such other loans may be accelerated, and to the extent our senior unsecured credit facility, our indenture or such other loans are secured, directly or indirectly by any properties or assets, lenders or trustees under our senior unsecured credit facility, our indenture or such other loans may foreclose on the collateral securing such indebtedness as a result. In addition, increases in interest rates may impede our operating performance and put us at a competitive disadvantage. Further, payments of required debt service or amounts due at maturity, or creation of additional reserves under loan agreements or indentures, could adversely affect our financial condition and operating results.
22
Table of Contents
If any one of these events were to occur, our business, financial condition, results of operations, cash flows and ability to satisfy our debt service obligations could be materially and adversely affected. In addition, any foreclosure on our properties could create taxable income without accompanying cash proceeds, which could adversely affect our ability to meet the REIT dividend requirements imposed by the Code.
Our organizational documents have no limitation on the amount of indebtedness that we may incur. As a result, we may become highly leveraged in the future, which could adversely affect our financial condition.
Our business strategy contemplates the use of both secured and unsecured debt to finance long-term growth. While the documents governing our credit facility require us to maintain certain leverage ratios, our governing documents contain no limitations on the amount of debt that we may incur, and our board of directors may change our financing policy at any time without stockholder approval. As a result, we may be able to incur substantial additional debt, including secured debt, in the future, which could result in an increase in our debt service and harm our financial condition.
Increases in interest rates would increase our debt service costs, may adversely affect any future refinancing of our debt and our ability to incur additional debt, and could adversely affect our financial condition, cash flow and results of operations.
Certain of our borrowings bear interest at variable rates, and we may incur additional variable-rate debt in the future. Increases in interest rates would result in higher interest expenses on our existing unhedged variable rate debt, and increase the costs of refinancing existing debt or incurring new debt. Additionally, increases in interest rates may result in a decrease in the value of our real estate and decrease the market price of ARCP’s common stock and could accordingly adversely affect our financial condition, cash flow and results of operations.
A downgrade in our credit ratings could materially adversely affect our business and financial condition.
Our notes have been, and we expect will continue to be, rated by nationally recognized credit rating agencies. The credit ratings are based on our operating performance, liquidity and leverage ratios, overall financial position, and other factors viewed by the credit rating agencies as relevant to our industry and the economic outlook in general. Our credit rating can affect the amount of capital we can access, as well as the terms of any financing we obtain. Since we depend in part on debt financing to fund our growth, adverse changes in our credit rating could have a negative effect on our future growth. Credit ratings are not recommendations to purchase, hold or sell the notes. Additionally, credit ratings may not reflect the potential effect of risks relating to the structure or marketing of the notes.
We may not be able to generate sufficient cash flow to meet our debt service obligations.
Our ability to make payments on and to refinance our indebtedness, and to fund our operations, working capital and capital expenditures, depends on our ability to generate cash in the future. To a certain extent, our cash flow is subject to general economic, industry, financial, competitive, operating, legislative, regulatory and other factors, many of which are beyond our control.
We cannot assure you that our business will generate sufficient cash flow from operations or that future sources of cash will be available to us in an amount sufficient to enable us to pay amounts due on our indebtedness or to fund our other liquidity needs.
23
Table of Contents
Additionally, if we incur additional indebtedness in connection with future acquisitions or development projects or for any other purpose, our debt service obligations could increase. We may need to refinance all or a portion of our indebtedness before maturity. Our ability to refinance our indebtedness or obtain additional financing will depend on, among other things:
| • | our financial condition and market conditions at the time; and |
| • | restrictions in the agreements governing our indebtedness. |
As a result, we may not be able to refinance any of our indebtedness on commercially reasonable terms, or at all. If we do not generate sufficient cash flow from operations, and additional borrowings or refinancings or proceeds of asset sales or other sources of cash are not available to us, we may not have sufficient cash to enable us to meet all of our obligations. Accordingly, if we cannot service our indebtedness, we may have to take actions such as seeking additional equity, or delaying strategic acquisitions and alliances or capital expenditures, any of which could have a material adverse effect on our operations. We cannot assure you that we will be able to effect any of these actions on commercially reasonable terms, or at all.
The continued recovery of real estate markets from the recent recession is dependent upon forecasted moderate economic growth which, if significantly slower than expected, could have a negative impact on the performance of our investment portfolio.
The U.S. economy is in its fourth year of recovery from a severe global recession and the commercial real estate markets stabilized and began to recover in 2011. Based on moderate economic growth in the future, and historically low levels of new supply in the commercial real estate pipeline, a stronger recovery is forecasted for all property sectors over the next two years. Nevertheless, this ongoing economic recovery remains fragile, and could be slowed or halted by significant external events. As a result, real estate markets could perform lower than expected as a result of reduced tenant demand. A severe weakening of the economy or a renewed recession could also lead to higher tenancy default and vacancy rates, which could create an oversupply of rentable space, increased property concessions and tenant improvement expenditures and reduced rental rates to maintain occupancies. There can be no assurance that our real estate investments will not be adversely impacted by a severe slowing of the economy or renewed recession. Tenant defaults, fluctuations in interest rates, limited availability of capital and other economic conditions beyond our control could negatively impact our portfolio and decrease the value of your investment.
Uninsured losses or losses in excess of our insurance coverage could adversely affect our financial condition and cash flows, and there can be no assurance as to future costs and the scope of coverage that may be available under insurance policies.
We carry comprehensive liability, fire, extended coverage, business interruption and rental loss insurance covering all of the properties in our portfolio under a blanket insurance policy with policy specifications, limits and deductibles customarily carried for similar properties. In addition, we carry professional liability and directors’ and officers’ insurance. We have selected policy specifications and insured limits that we believe are appropriate and adequate given the relative risk of loss, the cost of the coverage and industry practice. We do not carry insurance for certain losses, including, but not limited to, losses caused by riots or war. Certain types of losses may be either uninsurable or not economically insurable, such as losses due to earthquakes, riots or acts of war. Should an uninsured loss occur, we could lose both our investment in and anticipated profits and cash flow from a property. If any such loss is insured, we may be required to pay a significant deductible on any claim for recovery of such a loss prior to our insurer being obligated to reimburse us for the loss, or the amount of the loss may exceed our coverage for the loss. In addition, future lenders may require such insurance, and our failure to obtain such insurance could constitute a default under our loan agreements. In addition, we may reduce or discontinue terrorism, earthquake, flood or other insurance on some or all of our properties in the future if the cost of premiums for any of these policies exceeds, in our judgment, the value of the coverage discounted for the
24
Table of Contents
risk of loss. Our title insurance policies may not insure for the current aggregate market value of our portfolio, and we do not intend to increase our title insurance coverage as the market value of our portfolio increases. As a result, our business, financial condition, results of operations, cash flows and ability to satisfy our debt service obligations may be materially and adversely affected.
If we or one or more of our tenants experiences a loss that is uninsured or which exceeds policy limits, we could lose the capital invested in the damaged properties as well as the anticipated future cash flows from those properties. In addition, if the damaged properties are subject to recourse indebtedness, we would continue to be liable for the indebtedness, even if these properties were irreparably damaged.
If any of our insurance carriers becomes insolvent, we could be adversely affected.
We carry several different lines of insurance, placed with several large insurance carriers. If any one of these large insurance carriers were to become insolvent, we would be forced to replace the existing insurance coverage with another suitable carrier, and any outstanding claims would be at risk for collection. In such an event, we cannot be certain that we would be able to replace the coverage at similar or otherwise favorable terms. Replacing insurance coverage at unfavorable rates and the potential of uncollectible claims due to carrier insolvency could adversely affect our results of operations and cash flows.
Terrorism and other factors affecting demand for our properties could harm our operating results.
The strength and profitability of our business depends on demand for and the value of our properties. Future terrorist attacks in the United States, such as the attacks that occurred in New York and Washington, D.C. on September 11, 2001, and other acts of terrorism or war could have a negative impact on our operations. Such terrorist attacks could have an adverse impact on our business even if they are not directed at our properties. In addition, the terrorist attacks of September 11, 2001 have substantially affected the availability and price of insurance coverage for certain types of damages or occurrences, and our insurance policies for terrorism include large deductibles and co-payments. The lack of sufficient insurance for these types of acts could expose us to significant losses and could have a negative impact on our operations.
Cybersecurity risks and cyber incidents may adversely affect our business by causing a disruption to our operations, a compromise or corruption of our confidential information, and/or damage to our business relationships, all of which could negatively impact our financial results.
A cyber incident is considered to be any adverse event that threatens the confidentiality, integrity or availability of our information resources. These incidents may be an intentional attack or an unintentional event and could involve gaining unauthorized access to our information systems for purposes of misappropriating assets, stealing confidential information, corrupting data or causing operational disruption. The result of these incidents may include disrupted operations, misstated or unreliable financial data, liability for stolen assets or information, increased cybersecurity protection and insurance costs, litigation and damage to our tenant and investor relationships. As our reliance on technology has increased, so have the risks posed to our information systems, both internal and those we have outsourced. We have implemented processes, procedures and internal controls to help mitigate cybersecurity risks and cyber intrusions, but these measures, as well as our increased awareness of the nature and extent of a risk of a cyber incident, do not guarantee that our financial results, operations, business relationships or confidential information will not be negatively impacted by such an incident.
We may be required to make significant capital expenditures to improve our properties in order to retain and attract tenants, causing a decline in operating revenue and reducing cash available for debt service and distributions to stockholders.
Upon expiration of leases at our properties, we may be required to make rent or other concessions to tenants, or accommodate requests for renovations, build-to-suit remodeling and other improvements. As a result, we may have to make significant capital or other expenditures in order to retain tenants whose leases expire and to attract
25
Table of Contents
new tenants. Additionally, we may need to raise capital to make such expenditures. If we are unable to do so or capital is otherwise unavailable, we may be unable to make the required expenditures. This could result in non-renewals by tenants upon expiration of their leases, which would result in declines in revenue from operations and reduce cash available for debt service and dividends to stockholders.
Difficult conditions in the commercial real estate markets may cause us to experience market losses related to our holdings, and these conditions may not improve in the near future.
Our results of operations are materially affected by conditions in the real estate markets, the financial markets and the economy generally and may cause commercial real estate values, including the values of our properties, and market rental rates, including rental rates that we are able to charge, to decline significantly. Recent economic and credit market conditions have contributed to increased volatility and diminished expectations for real estate markets, as well as adversely impacted inflation, energy costs, geopolitical issues and the availability and cost of credit, and may continue to do so going forward. The further deterioration of the real estate market may cause us to record losses on our assets, reduce the proceeds we receive upon sale or refinance of our assets or adversely impact our ability to lease our properties. Declines in the market values of our properties may adversely affect our results of operations and credit availability. Economic and credit market conditions may also cause one or more of the tenants to whom we have exposure to fail or default in their payment obligations, which could cause us to record material losses or a material reduction in our cash flows.
Because we own real property, we are subject to extensive environmental regulation, which creates uncertainty regarding future environmental expenditures and liabilities.
Environmental laws regulate, and impose liability for, releases of hazardous or toxic substances into the environment. Under various provisions of these laws, an owner or operator of real estate, such as us, is or may be liable for costs related to soil or groundwater contamination on, in, or migrating to or from its property. In addition, persons who arrange for the disposal or treatment of hazardous or toxic substances may be liable for the costs of cleaning up contamination at the disposal site. Such laws often impose liability regardless of whether the person knew of, or was responsible for, the presence of the hazardous or toxic substances that caused the contamination. The presence of, or contamination resulting from, any of these substances, or the failure to properly remediate them, may adversely affect our ability to sell or lease our property or to borrow using such property as collateral. In addition, persons exposed to hazardous or toxic substances may sue us for personal injury damages. For example, certain laws impose liability for release of or exposure to asbestos-containing materials and contamination from past operations or from off-site sources. As a result, in connection with our current or former ownership, operation, management and development of real properties, we may be potentially liable for investigation and cleanup costs, penalties, and damages under environmental laws.
Although all of our properties were, at the time they were acquired by our predecessor, subjected to preliminary environmental assessments, known as Phase I assessments, by independent environmental consultants that identify certain liabilities, Phase I assessments are limited in scope, and may not include or identify all potential environmental liabilities or risks associated with the property. Further, any environmental liabilities that arose since the date the studies were done would not be identified in the assessments. Unless required by applicable laws or regulations, we may not further investigate, remedy or ameliorate the liabilities disclosed in the Phase I assessments.
We cannot assure you that these or other environmental studies identified all potential environmental liabilities, or that we will not incur material environmental liabilities in the future. If we do incur material environmental liabilities in the future, we may face significant remediation costs, and we may find it difficult to sell any affected properties.
26
Table of Contents
Cole Capital is subject to risks that are particular to its role as sponsor and dealer manager for direct investment program offerings.
Cole Capital, which includes a broker-dealer subsidiary that is a wholesale broker-dealer registered with the SEC and a member firm of FINRA, is subject to various risk and uncertainties that are common in the securities industry. Such risks and uncertainties include:
| • | the volatility of financial markets; |
| • | extensive governmental regulation; |
| • | litigation; and |
| • | intense competition. |
Cole Capital sponsors and distributes interests in direct investment programs, and its success depends on a number of factors including its ability to enter into agreements with broker-dealers and independent investment advisors who will sell interests to their clients, its success in investing the proceeds of its offering, managing the properties acquired and generating cash flow to make distributions to investors in its direct investment programs and its success in entering into liquidity events for the direct investment programs. Cole Capital is subject to competition from other sponsors and dealer managers of direct investment programs and other investments, and there can be no assurance that this business will be successful.
Sponsorship of non-traded REITs also involves risks relating to the possibility that such programs will not receive capital at the levels and timing that are anticipated and that sufficient capital will not be raised to repay investments of cash in, and loans to, such non-traded REITs needed to meet up-front costs, the initial breaking of escrow and the acquisition of properties will not be made, as well as risks relating to competition from other sponsors of other similar programs.
In addition, Cole Capital is subject to risks that are particular to its function as a wholesale broker-dealer and sponsor of non-traded REITs. For example, the broker-dealer provides substantial promotional support to broker-dealers selling a particular offering, including by providing sales literature, forums, webinars, press releases and other mass forms of communication. Cole Capital acts as a sponsor of non-traded REITs and creates materials that its broker-dealer may provide throughout the course of an offering, much of which may be scrutinized by regulators. Cole Capital may be exposed to significant liability under federal and state securities laws. Additionally, Cole Capital may be subject to fines and suspension from the SEC and FINRA.
The acquisition of the Red Lobster Portfolio resulted in 10.7% of our pro forma annualized base rent as of June 30, 2014 being derived from a single tenant, which is a non-investment grade tenant that owns a business that has previously reported declines in revenues and other operational difficulties.
The acquisition of the Red Lobster Portfolio resulted in 10.7% of our pro forma annualized base rent as of June 30, 2014 (without giving effect to the sale of the Multi-Tenant Portfolio) being derived from a single tenant. A downturn in the demand for casual restaurant dining generally or casual seafood dining at Red Lobster® restaurants specifically could adversely impact the ability of the Tenant to satisfy its rent obligations in respect of the Red Lobster Portfolio. In addition, the Tenant does not constitute an investment grade tenant and has reported declines in revenue. A default by the Tenant under the Red Lobster Portfolio could result in a material reduction in our cash flows or result in material losses in the value of our property portfolio.
27
Table of Contents
Although we have entered into definitive purchase agreements to sell the Multi-Tenant Portfolio, we may not be able to complete such sale on the terms anticipated or at all.
The completion of the sale of our Multi-Tenant Portfolio is subject to certain closing conditions (some of which are material and beyond our control), including: (i) the initial closing must include no less than $1.775 billion in properties and five particular properties comprising the Multi-Tenant Portfolio; (ii) the receipt of estoppel certificates from certain tenants with respect to the properties to be purchased; and (iii) lender consents or loan defeasances with respect to encumbered properties to be purchased. Accordingly, there can be no assurance that we will be successful in selling the Multi-Tenant Portfolio on the proposed terms or at all. If we are unable to consummate the sale of the Multi-Tenant Portfolio, we will not realize the expected benefits of the proposed sale and will continue to be subject to the risks associated with multi-tenant properties. Additionally, we will compromise our ability to enhance the clarity of our single-tenant, net lease investment strategy and we will not be able to allocate the net proceeds from the sale of the Multi-Tenant Portfolio to cover the purchase of the Red Lobster Portfolio or of other assets that serve our investment objectives.
Failure to comply with the net capital requirements could subject us to sanctions imposed by the SEC or FINRA.
Our broker-dealer subsidiary is required to maintain certain levels of minimum net capital subject to the SEC’s net capital rule. The net capital rule is designed to measure the general financial integrity and liquidity of a broker-dealer. Compliance with the net capital rule limits those operations of broker-dealers that require the intensive use of their capital, such as underwriting commitments and principal trading activities. The rule also limits the ability of securities firms to pay dividends or make payments on certain indebtedness, such as subordinated debt, as it matures. FINRA may enter the offices of a broker-dealer at any time, without notice, and calculate the firm’s net capital. If the calculation reveals a deficiency in net capital, FINRA may immediately restrict or suspend certain or all the activities of a broker-dealer. Our broker-dealer subsidiary may not be able to maintain adequate net capital, or its net capital may fall below requirements established by the SEC, and it may be subject to disciplinary action in the form of fines, censure, suspension, expulsion or the termination of business altogether. In addition, if these net capital rules are changed or expanded, or if there is an unusually large charge against net capital, operations that require the intensive use of capital would be limited. A large operating loss or charge against net capital could adversely affect our broker-dealer’s ability to expand or even maintain its present levels of business, which could have a material adverse effect on its business of sponsoring and distributing interests in direct investment programs. In addition, our broker-dealer subsidiary may become subject to net capital requirements in other foreign jurisdictions in which it operates. We cannot predict its future capital needs or its ability to obtain additional financing.
Broker-dealers and other financial services firms are subject to extensive regulations and increased scrutiny.
The financial services industry is subject to extensive regulation by U.S. federal, state and international government agencies, as well as various self-regulatory agencies. Recent turmoil in the financial markets has contributed to significant rule changes, heightened scrutiny of the conduct of financial services firms and increasing penalties for rule violations. Our broker-dealer subsidiary may be adversely affected by new laws or rules or changes in the interpretation of existing rules or more rigorous enforcement. Significant new rules are developing under the Dodd-Frank Wall Street Reform and Consumer Protection Act of 2010. Some of these rules could impact our broker-dealer subsidiary’s business, including through the potential implementation of a more stringent fiduciary standard for brokers and enhanced regulatory oversight over incentive compensation.
Our broker-dealer subsidiary also may be adversely affected by other evolving regulatory standards, such as those relating to suitability and supervision. Legal claims or regulatory actions against our broker-dealer subsidiary also could have adverse financial effects on us or harm our reputation, which could harm our business prospects.
28
Table of Contents
Our broker-dealer subsidiary, which is registered as a broker-dealer under the Securities Exchange Act of 1934, as amended (the “Exchange Act”), and is a member of FINRA, is subject to regulation, examination and supervision by the SEC, FINRA, other self-regulatory organizations and state securities regulators. Broker-dealers are subject to regulations that cover all aspects of the securities business, including sales practices, use and safekeeping of clients’ funds and securities’ capital adequacy, record-keeping and the conduct and qualification of officers, employees and independent contractors. Failure by our broker-dealers to comply with applicable laws or regulations could result in censures, penalties or fines, the issuance of cease and desist orders, the suspension or expulsion from the securities industry of any such broker-dealer, or its officers, employees or independent contractors or other similar adverse consequences. Additionally, the adverse publicity arising from the imposition of sanctions could harm our reputation and cause us to lose existing clients or fail to gain new clients.
Financial services firms are also subject to rules and regulations relating to the prevention and detection of money laundering. The USA PATRIOT Act of 2001 mandates that financial institutions, including broker-dealers and investment advisors, establish and implement anti-money laundering (“AML”) programs reasonably designed to achieve compliance with the Bank Secrecy Act of 1970 and the rules thereunder. Financial services firms must maintain AML policies, procedures and controls, designate an AML compliance officer to oversee the firm’s AML program, implement appropriate employee training and provide for annual independent testing of the program. Our broker-dealer subsidiary has established AML programs but there can be no assurance of the effectiveness of these programs. Failure to comply with AML requirements could subject our broker-dealer subsidiary to disciplinary sanctions and other penalties. Financial services firms must also comply with applicable privacy and data protection laws and regulations, including SEC Regulation S-P and applicable provisions of the 1999 Gramm-Leach-Bliley Act, the Fair Credit Reporting Act of 1970 and the 2003 Fair and Accurate Credit Transactions Act. Any violations of laws and regulations relating to the safeguarding of private information could subject our broker-dealer subsidiary to fines and penalties, as well as to civil action by affected parties.
We are subject to risks relating to mortgage loans, bridge loans, mezzanine loans, CMBS and real estate-related securities.
In connection with the Cole Merger and the CapLease Merger, we acquired interests in mortgage loans, bridge loans, mezzanine loans, CMBS and other types of real estate-related securities. In addition, we may continue to make similar investments, which will subject us to risks relating to these types of loans and securities.
Risks relating to mortgage, bridge or mezzanine loans.
Investing in mortgage, bridge or mezzanine loans involves risk of defaults on those loans caused by many conditions beyond our control, including local and other economic conditions affecting real estate values, interest rate changes, rezoning, and failure by the borrower to maintain the property. If there are defaults under these loans, we may not be able to repossess and sell quickly any properties securing such loans. An action to foreclose on a property securing a loan is regulated by state statutes and regulations and is subject to many of the delays and expenses of any lawsuit brought in connection with the foreclosure if the defendant raises defenses or counterclaims. In the event of default by a mortgagor, these restrictions, among other things, may impede our ability to foreclose on or sell the mortgaged property or to obtain proceeds sufficient to repay all amounts due to us on the loan, which could reduce the value of our investment in the defaulted loan. In addition, investments in mezzanine loans involve a higher degree of risk than long-term senior mortgage loans secured by income-producing real property because the investment may become unsecured as a result of foreclosure on the underlying real property by the senior lender.
29
Table of Contents
Risks relating to real estate-related securities in general.
Investments in real estate-related securities involve special risks relating to the particular issuer of the securities, including the financial condition and business outlook of the issuer. Issuers of real estate-related equity securities generally invest in real estate or real estate-related assets and are subject to the inherent risks associated with real estate-related investments discussed herein, including risks relating to rising interest rates.
Real estate-related securities are often unsecured and also may be subordinated to other obligations of the issuer. As a result, investments in real estate-related securities are subject to risks of (1) limited liquidity in the secondary trading market in the case of unlisted or thinly traded securities, (2) substantial market price volatility resulting from changes in prevailing interest rates in the case of traded equity securities, (3) subordination to the prior claims of banks and other senior lenders to the issuer, (4) the operation of mandatory sinking fund or call/redemption provisions during periods of declining interest rates that could cause the issuer to reinvest redemption proceeds in lower yielding assets, (5) the possibility that earnings of the issuer may be insufficient to meet its debt service and distribution obligations and (6) the declining creditworthiness and potential for insolvency of the issuer during periods of rising interest rates and economic slowdown or downturn. These risks may adversely affect the value of outstanding real estate-related securities and the ability of the issuers thereof to repay principal and interest or make distribution payments.
We may not have the expertise necessary to maximize the return on our investment in real estate-related securities. If we determine that it is advantageous to us to make the types of investments in which we do not have experience, we intend to employ persons, engage consultants or partner with third parties that have, in our opinion, the relevant expertise necessary to assist us in evaluating, making and administering such investments.
Risks relating to CMBS.
CMBS are securities that evidence interests in, or are secured by, a single commercial mortgage loan or a pool of commercial mortgage loans. Accordingly, these securities are subject to all of the risks of the underlying mortgage loans. In a rising interest rate environment, the value of CMBS may be adversely affected when payments on underlying mortgages do not occur as anticipated, resulting in the extension of the security’s effective maturity and the related increase in interest rate sensitivity of a longer-term instrument. The value of CMBS may also change due to shifts in the market’s perception of issuers and regulatory or tax changes adversely affecting the mortgage securities market as a whole. In addition, CMBS are subject to the credit risk associated with the performance of the underlying mortgage properties. CMBS are issued by investment banks, not financial institutions, and are not insured or guaranteed by the U.S. government.
CMBS are also subject to several risks created through the securitization process. Subordinate CMBS are paid interest only to the extent that there are funds available to make payments. To the extent the collateral pool includes delinquent loans, there is a risk that interest payments on subordinate CMBS will not be fully paid. Subordinate CMBS are also subject to greater credit risk than those CMBS that are more highly rated. In certain instances, third-party guarantees or other forms of credit support can reduce the credit risk.
The value of CMBS can be negatively impacted by any dislocation in the mortgage-backed securities market in general. Currently, the mortgage-backed securities market is suffering from a severe dislocation created by mortgage pools that include sub-prime mortgages secured by residential real estate. Sub-prime loans often have high interest rates and are often made to borrowers with credit scores that would not qualify them for prime conventional loans. In recent years, banks made a great number of the sub-prime residential mortgage loans with high interest rates, floating interest rates, interest rates that reset from time to time, and/or interest-only payment features that expire over time. These terms, coupled with rising interest rates, have caused an increasing number of homeowners to default on their mortgages. Purchasers of mortgage-backed securities collateralized by mortgage pools that include risky sub-prime residential mortgages have experienced severe losses as a result of the defaults and such losses have had a negative impact on the CMBS market.
30
Table of Contents
Our build-to-suit program is subject to additional risks related to properties under development.
In each of the Cole and CapLease Mergers, we acquired businesses that engage in build-to-suit programs and the acquisition of properties under development. In connection with these businesses, we enter into purchase and sale arrangements with sellers or developers of suitable properties under development or construction. In such cases, we are obligated to purchase the property at the completion of construction, provided that the construction conforms to definitive plans, specifications and costs approved by us in advance. We may continue this business.
As a result, we are subject to potential development risks and construction delays and the resultant increased costs and risks. If we engage in development or construction projects, we will be subject to uncertainties associated with re-zoning for development, environmental concerns of governmental entities and/or community groups and the builder’s ability to build in conformity with plans, specifications, budgeted costs and timetables. If a builder fails to perform, we may resort to legal action to rescind the purchase or the construction contract or to compel performance. A builder’s performance may also be affected or delayed by conditions beyond the builder’s control. Delays in completion of construction could also give tenants the right to terminate preconstruction leases. We may incur additional risks if we make periodic progress payments or other advances to builders before they complete construction. These and other such factors can result in increased project costs or loss of our investment. In addition, we will be subject to normal lease-up risks relating to newly constructed projects. We also will rely on rental income and expense projections and estimates of the fair market value of property upon completion of construction when agreeing upon a price at the time we acquire the property. If these projections are inaccurate, we may pay too much for a property, and our return on our investment could suffer. If we contract with a development company for newly developed properties, we anticipate that it will be obligated to pay a substantial earnest money deposit at the time of contracting to acquire such properties. In the case of properties to be developed by a development company, we anticipate that it will be required to close the purchase of the property upon completion of the development of the property. At the time of contracting and the payment of the earnest money deposit, the development company typically will not have acquired title to any real property, and there is a risk that its earnest money deposit made to the development company may not be fully refunded.
Risks Related to Our Organization and Structure
The supermajority voting requirements applicable to ARCP’s board of directors in connection with its consolidation, merger, sale of all or substantially all of its assets or ARCP’s engaging in a share exchange will limit its independent directors’ ability to influence such corporate matters.
ARCP’s charter provides that ARCP may not consolidate, merge, sell all or substantially all of its assets or engage in a share exchange, unless such actions are approved by the affirmative vote of at least two-thirds of its board of directors. This concentrated control limits the ability of ARCP’s independent directors to influence such corporate matters and could delay, deter or prevent a change of control transaction that might otherwise involve a premium for ARCP’s shares of common stock or otherwise be in the best interests of its stockholders and our other securityholders.
Tax protection provisions on certain properties could limit ARCP’s operating flexibility.
ARCP has agreed with ARC Real Estate Partners, LLC (the “Contributor”), an affiliate of ARC, to indemnify it against adverse tax consequences if ARCP were to sell, convey, transfer or otherwise dispose of all or any portion of the interests in the continuing properties acquired by ARCP in the formation transactions, in a taxable transaction. However, ARCP can sell these properties in a taxable transaction if we pay the Contributor cash in the amount of its tax liabilities arising from the transaction and tax payments. These tax protection provisions apply until September 6, 2021, which is the tenth anniversary of the closing of ARCP’s IPO. Although it may be in ARCP’s stockholders’ best interest that ARCP sell a property, it may be economically disadvantageous for ARCP to do so because of these obligations. ARCP has also agreed to make debt available for the Contributor to guarantee. We agreed to these provisions in order to assist the Contributor in preserving its tax position after its contribution of its interests in ARCP’s initial properties. As a result, ARCP may be required to incur and maintain more debt than it would otherwise.
31
Table of Contents
Tax consequences to holders of OP Units upon a sale or refinancing of ARCP’s properties may cause the interests of ARCP’s principals to differ from the interests of ARCP’s other stockholders.
As a result of the unrealized built-in gain that may be attributable to one or more of the contributed properties at the time of contribution in connection with the formation transactions, some holders of OP Units, including the Contributor, an affiliate of ARC, may experience different tax consequences than holders of ARCP’s capital stock upon the sale or refinancing of the properties owned by ARCP OP, including disproportionately greater allocations of items of taxable income and gain upon a realization event. As those holders will not receive a correspondingly greater distribution of cash proceeds, they may have different objectives regarding the appropriate pricing, timing and other material terms of any sale or refinancing of certain properties, or whether to sell or refinance such properties at all, than those that would be in the best interests of ARCP’s stockholders and our other securityholders.
Certain provisions in the partnership agreement of ARCP OP may delay or prevent unsolicited acquisitions of ARCP.
Provisions in the partnership agreement of ARCP OP may delay or make more difficult unsolicited acquisitions of ARCP or changes in its control. These provisions could discourage third parties from making proposals involving an unsolicited acquisition of ARCP or change of its control, although some stockholders and our other securityholders might consider such proposals, if made, desirable. These provisions include, among others:
| • | redemption rights of qualifying parties; |
| • | transfer restrictions on the OP Units; |
| • | the ability of the general partner in some cases to amend the partnership agreement without the consent of the limited partners; |
| • | the right of the limited partners to consent to transfers of the general partnership interest of the general partner and mergers or consolidations of our company under specified limited circumstances; and |
| • | restrictions relating to our qualification as a REIT under the Code. |
ARCP’s charter and bylaws and the partnership agreement of ARCP OP also contain other provisions that may delay, defer or prevent a transaction or a change of control that might involve a premium price for ARCP’s common stock or otherwise be in the best interest of its stockholders and our other securityholders.
Certain rights which are reserved to ARCP’s stockholders may allow third parties to enter into business combinations with ARCP that are not in the best interest of the stockholders and our other securityholders, without negotiating with ARCP’s board of directors.
Certain provisions of the Maryland General Corporation Law (the “MGCL”) may have the effect of requiring a third party seeking to acquire ARCP to negotiate with ARCP’s board of directors, including:
| • | “business combination” provisions that, subject to limitations, prohibit certain business combinations between ARCP and an “interested stockholder” (defined generally as any person who beneficially owns 10% or more of the voting power of ARCP’s outstanding voting stock or an affiliate or associate of ARCP who, at any time within the two-year period prior to the date in question, was the beneficial owner of 10% or more of the voting power of ARCP’s then outstanding stock) or an affiliate of an interested stockholder for five years after the most recent date on which the stockholder becomes an interested stockholder, and thereafter imposes special appraisal rights and stockholder supermajority voting requirements on these combinations; and |
| • | “control share” provisions that provide that “control shares” of ARCP (defined as shares which, when aggregated with other shares controlled by the stockholder (except solely by virtue of a revocable proxy), entitle the stockholder to exercise one of three increasing ranges of voting power in electing |
32
Table of Contents
| directors) acquired in a “control share acquisition” (defined as the direct or indirect acquisition of ownership or control of issued and outstanding “control shares”) have no voting rights except to the extent approved by ARCP’s stockholders by the affirmative vote of at least two-thirds of all the votes entitled to be cast on the matter, excluding all interested shares. |
As permitted by the MGCL, ARCP’s board of directors has by resolution exempted business combinations (1) between ARCP and any person, provided that such business combination is first approved by ARCP’s board of directors (including a majority of directors who are not affiliates or associates of such person) and (2) between ARCP and ARC, the Former Manager, ARCP OP or any of their respective affiliates. Consequently, the five-year prohibition and the supermajority vote requirements will not apply to such business combinations. As a result, any person described above may be able to enter into business combinations with ARCP that may not be in the best interest of ARCP’s stockholders and our other securityholders without compliance by ARCP with the supermajority vote requirements and other provisions of the statute. This resolution, however, may be altered or repealed in whole or in part at any time by ARCP’s board of directors. If this resolution is repealed, or ARCP’s board of directors does not otherwise approve a business combination with a person other than ARC, the Former Manager, ARCP OP or any of their respective affiliates, the statute may discourage others from trying to acquire control of ARCP and increase the difficulty of consummating any offer.
ARCP had never operated as a REIT prior to making its initial REIT election for the year ended December 31, 2011 and has only recently begun operating as a public company and, therefore, ARCP may not be able to successfully and profitably operate its business in compliance with the regulatory requirements applicable to REITs and to public companies.
ARCP had never operated as a REIT prior to making its initial REIT election for the year ended December 31, 2011. Also, ARCP has only operated as a public company beginning the date of the closing of ARCP’s IPO on September 6, 2011. In addition, certain members of ARCP’s board of directors and certain of its executive officers have no experience in operating a publicly traded REIT that is traded on a securities exchange other than in connection with ARCP’s operations. ARCP may not be able to successfully operate ARCP as a REIT or a publicly traded company, including satisfying the requirements to timely meet disclosure requirements and complying with the Sarbanes-Oxley Act, including implementing effective internal controls. Failure to maintain ARCP’s qualification as a REIT or comply with other regulatory requirements would have an adverse effect on its business, financial condition, results of operations, cash flows and ability to satisfy our debt service obligations.
We could incur liability as a result of a lawsuit to which Cole is subject in connection with the merger between Cole and Cole Holdings Corporation (“Cole Holdings”), pursuant to which Cole became a self-managed REIT.
Three outstanding putative class action and/or derivative lawsuits, which were filed earlier this year, assert claims for breach of fiduciary duty, abuse of control, corporate waste, unjust enrichment, aiding and abetting breach of fiduciary duty and other claims relating to the merger between a wholly owned subsidiary of Cole and Cole Holdings, pursuant to which Cole became a self-managed REIT. A court in one of the lawsuits has granted defendants’ motion to dismiss with prejudice, but the plaintiffs have filed a notice of appeal of this dismissal. The other two lawsuits, which also purport to assert claims under the Securities Act, are pending in the United States District Court for the District of Arizona. Defendants filed a motion to dismiss both complaints on January 10, 2014.
Whether or not any plaintiffs’ claims are successful, this type of litigation is often expensive and diverts management’s attention and resources, which could adversely affect our operations.
33
Table of Contents
We could incur liability as a result of an adverse judgment in litigation challenging one or more of our Recent Acquisitions, including the Cole Merger and the Caplease Merger and the ARCT III Merger.
Stockholders of Cole have filed lawsuits and may file additional lawsuits challenging the Cole Merger, which name and may name ARCP as a defendant. To date, eleven such lawsuits have been filed. Two putative class actions have been filed in the U.S. District Court of Arizona, captioned as: (i) Wunsch v. Cole Real Estate Investment, Inc., et al.; and (ii) Sobon v. Cole Real Estate Investments, Inc., et al. Eight other putative stockholder class action lawsuits have been filed in the Circuit Court for Baltimore City, Maryland, captioned as: (i) Operman v. Cole Real Estate Investments, Inc., et al.; (ii) Branham v. Cole Real Estate Investments, Inc., et al.; (iii) Wilfong v. Cole Real Estate Investments, Inc., et al.; (iv) Polage v. Cole Real Estate Investments, Inc., et al.; (v) Flynn v. Cole Real Estate Investments, Inc., et al.; (vi) Corwin v. Cole Real Estate Investments, Inc., et al.; (vii) Green v. Cole Real Estate Investments, Inc., et al.; and (viii) Morgan v. Cole Real Estate Investments, Inc., et al. (collectively, the “Baltimore Actions”). All of these lawsuits name ARCP, Cole and the Cole board of directors as defendants. All of the named plaintiffs claim to be Cole stockholders and purport to represent all holders of Cole’s stock. Each complaint generally alleges that the individual defendants breached fiduciary duties owed to plaintiff, the other public stockholders of Cole and to Cole, and that certain entity defendants aided and abetted those breaches. In addition, certain lawsuits claim that the individual defendants breached their duty of candor to Cole’s stockholders and the Branham, Polage and Flynn lawsuits assert claims derivatively against the individual defendants for their alleged breach of fiduciary duties owed to Cole. The Polage lawsuit also asserts derivative claims for waste of corporate assets and unjust enrichment. The eight Baltimore Actions were consolidated on December 12, 2013. The Wunsch and Sobon lawsuits, which were consolidated by court order on January 17, 2014, also allege that the joint proxy statement filed in relation to the Cole Merger contains materially incomplete and misleading disclosures in violation of Sections 14(a) and 20(a) of the Exchange Act. Among other remedies, the complaints seek money damages, costs and attorneys’ fees.
On January 10, 2014, solely to avoid the costs, risks, and uncertainties inherent in litigation and without admitting any liability or wrongdoing, ARCP, Cole and the other named defendants in the Baltimore Actions entered into a memorandum of understanding with the plaintiffs in the Baltimore Actions to settle the cases. The memorandum of understanding contemplates that the parties will enter into a stipulation of settlement. The stipulation of settlement will be subject to customary conditions, including court approval following notice to ARCP’s and Cole’s stockholders. In the event that the parties enter into a stipulation of settlement, a hearing will be scheduled by the court to consider the fairness, reasonableness, and adequacy of the settlement. In the event the settlement is finally approved by the court, it will resolve and release all claims in all actions that were or could have been brought challenging any aspect of the Cole Merger, the Cole Merger Agreement and any disclosure made in connection therewith, among other claims, pursuant to terms that will be disclosed to stockholders prior to final approval of the settlement. In addition, in connection with the settlement, the parties contemplate that plaintiff’s counsel in the Baltimore Actions will file a petition in the court for an award of attorneys’ fees and expenses to be paid by ARCP up to an agreed upon amount. ARCP will pay or cause to be paid any attorneys’ fees and expenses awarded by the court. There can be no assurance that the parties will ultimately enter into a stipulation of settlement or that the court will approve the settlement even if the parties were to enter into such stipulation. In such event, the proposed settlement as contemplated by the memorandum of understanding may be terminated.
One additional putative class action has been filed in the Supreme Court of New York, captioned as: Realistic Partners v. Schorsch et al. (the “Realistic Partners Action”). This lawsuit names ARCP, the ARCP board of directors and Cole as defendants. The named plaintiff claims to be an ARCP stockholder and purports to represent all holders of ARCP’s stock. The complaint generally alleges that ARCP and the individual defendants breached a fiduciary duty of candor allegedly owed to plaintiff and to the other public stockholders of ARCP, and that Cole aided and abetted those breaches. On January 17, 2014, solely to avoid the costs, risks, and uncertainties inherent in litigation and without admitting any liability or wrongdoing, ARCP, Cole and the other named defendants in the Realistic Partners Action entered into a memorandum of understanding with the plaintiff in the Realistic Partners Action to settle the case. The memorandum of understanding contemplates that the
34
Table of Contents
parties will enter into a stipulation of settlement. The stipulation of settlement will be subject to customary conditions, including court approval following notice to ARCP’s and Cole’s stockholders. In the event that the parties enter into a stipulation of settlement, a hearing will be scheduled by the court to consider the fairness, reasonableness, and adequacy of the settlement. In the event the settlement is finally approved by the court, it will resolve and release all claims in all actions that were or could have been brought challenging any aspect of the Cole Merger, the Cole Merger Agreement, and any disclosure made in connection therewith, among other claims, pursuant to terms that will be disclosed to stockholders prior to final approval of the settlement. In addition, in connection with the settlement, the parties contemplate that plaintiff’s counsel in the Realistic Partners Action will file a petition in the court for an award of attorneys’ fees and expenses to be paid by ARCP up to an agreed upon amount. ARCP will pay or cause to be paid any attorneys’ fees and expenses awarded by the court. There can be no assurance that the parties will ultimately enter into a stipulation of settlement or that the court will approve the settlement even if the parties were to enter into such stipulation. In such event, the proposed settlement as contemplated by the memorandum of understanding may be terminated.
A number of lawsuits by CapLease’s stockholders have been challenging the CapLease Merger, some of which name ARCP and the OP as defendants. Additionally, a lawsuit was commenced on behalf of holders of a series of CapLease’s preferred stock in connection with the CapLease Merger alleging that the conversion of such preferred stock pursuant to the terms of the CapLease Merger Agreement was prohibited by the articles supplementary classifying and designating such preferred stock.
After the announcement of the ARCT III Merger Agreement, Randell Quaal filed a putative class action lawsuit on January 30, 2013 against ARCP, ARCP OP, ARCT III, ARCT III OP, the members of the board of directors of ARCT III and certain subsidiaries of ARCP in the Supreme Court of the State of New York. In February 2013, the parties agreed to a memorandum of understanding regarding settlement of all claims asserted on behalf of the alleged class of ARCT III stockholders. In connection with the settlement contemplated by the memorandum of understanding, the class action and all claims asserted therein will be dismissed, subject to court approval. If the parties enter into a stipulation of settlement, a hearing will be scheduled at which the court will consider the fairness, reasonableness and adequacy of the settlement. There can be no assurance that the parties will ultimately enter into a stipulation of settlement, that the court will approve any proposed settlement, or that any eventual settlement will be under the same terms as those contemplated by the memorandum of understanding, therefore any losses that may be incurred to settle this matter are not determinable.
We cannot assure you as to the outcome of these lawsuits, including the costs associated with defending these claims or any other liabilities that may be incurred in connection with the litigation or settlement of these claims. Whether or not any plaintiffs’ claims are successful, this type of litigation is often expensive and diverts management’s attention and resources, which could adversely affect the operation of our business.
See “Management’s Discussion and Analysis of Financial Condition and Results of Operations—Completed Mergers and Major Acquisitions” for a discussion of the ARCT III Merger Agreement.
Our future results will suffer if we do not effectively manage our expanded portfolio and operations following the Recent Acquisitions.
Following the Recent Acquisitions, we have an expanded portfolio and operations and likely will continue to expand our operations through additional acquisitions and other strategic transactions, some of which may involve complex challenges. Our future success will depend, in part, upon our ability to manage our expansion opportunities, integrate new operations into our existing business in an efficient and timely manner, successfully monitor our operations, costs, regulatory compliance and service quality and maintain other necessary internal controls. We cannot assure you that our expansion or acquisition opportunities will be successful, or that we will realize the expected operating efficiencies, cost savings, revenue enhancements, synergies or other benefits.
See “Management’s Discussion and Analysis of Financial Condition and Results of Operations—Completed Mergers and Major Acquisitions” for a discussion of the Recent Acquisitions.
35
Table of Contents
We have a history of operating losses and cannot assure you that we will achieve profitability.
Since our inception in 2010, we have experienced net losses (calculated in accordance with GAAP) in each fiscal year and for the six months ended June 30, 2014. The extent of our future operating losses and the timing of when we will achieve profitability are uncertain, and depend on the demand for, and value of, our portfolio of properties. We may never achieve or sustain profitability.
We may be unable to integrate the recently acquired GE Capital, Fortress, Inland and Red Lobster Portfolios into our existing portfolio or CapLease’s, ARCT IV’s and Cole’s businesses with our business successfully and realize the anticipated synergies and related benefits of the mergers, and acquisition of the GE Capital Portfolio and other pending acquisitions or do so within the anticipated timeframe.
The CapLease Merger, the ARCT IV Merger and the Cole Merger involved the combination of companies that, prior to the consummation thereof, operated as independent companies. Additionally, we recently acquired the GE Capital, Fortress, Inland and Red Lobster Portfolios. We may be required to devote significant management attention and resources to integrating our business practices and operations with those of CapLease, ARCT IV and Cole and the acquired GE Capital, Inland, Fortress and Red Lobster Portfolios. Potential difficulties we may encounter in the integration process include the following:
| • | the inability to successfully combine our business with CapLease’s, ARCT IV’s or Cole’s business or the GE Capital, Inland, Fortress and Red Lobster Portfolios into ARCP’s portfolio, in each case in a manner that permits the combined company to achieve anticipated cost savings, which would result in the anticipated benefits of the mergers and the acquisition of the GE Capital, Inland, Fortress and Red Lobster Portfolios not being realized in the timeframe anticipated or at all; |
| • | the complexities associated with managing the combined business out of several different locations and integrating personnel from the two companies; |
| • | the additional complexities of combining companies with different histories, cultures, potential regulatory restrictions, markets and tenant bases; |
| • | the failure to retain our key employees or those of CapLease or Cole; |
| • | the inability to divest ourselves of certain CapLease or Cole assets not fundamental to our business; |
| • | potential unknown liabilities and unforeseen increased expenses, delays or regulatory conditions associated with the combinations; and |
| • | performance shortfalls as a result of the diversion of management’s attention caused by completing the mergers and acquisition of the Inland, Fortress and Red Lobster Portfolios and integrating operations. |
For all these reasons, you should be aware that it is possible that the integration process following the Recent Acquisitions could result in the distraction of our management, the disruption of our ongoing business or inconsistencies in our services, standards, controls, procedures and policies, any of which could adversely affect our ability to maintain relationships with tenants, vendors and employees or to achieve the anticipated benefits of such transactions, or could otherwise adversely affect the business and our financial results.
See “Management’s Discussion and Analysis of Financial Condition and Results of Operations—Completed Mergers and Major Acquisitions” for a discussion of the transactions above.
36
Table of Contents
U.S. Federal Income Tax Risks
ARCP’s failure to remain qualified as a REIT would subject it to U.S. federal income tax and potentially state and local tax, would adversely affect our operations and could reduce the amount of cash available for payment on our indebtedness, including the notes.
ARCP has qualified to be taxed as a REIT commencing with the taxable year ended December 31, 2011 and intends to operate in a manner that would allow it to continue to qualify as a REIT. However, ARCP may terminate its REIT qualification if its board of directors determines that not qualifying as a REIT is in its best interests, or inadvertently. ARCP’s qualification as a REIT depends upon its satisfaction of certain asset, income, organizational, distribution, stockholder ownership and other requirements on a continuing basis. ARCP structured its activities in a manner designed to satisfy all requirements for qualification as a REIT. However, the REIT qualification requirements are extremely complex and interpretation of the U.S. federal income tax laws governing qualification as a REIT is limited. Furthermore, any opinion of our counsel, including tax counsel, as to its eligibility to remain qualified as a REIT is not binding on the Internal Revenue Service, or IRS, and is not a guarantee that ARCP will continue to qualify as a REIT. Accordingly, ARCP cannot be certain that it will be successful in operating so it can remain qualified as a REIT. ARCP’s ability to satisfy the asset tests depends on its analysis of the characterization and fair market values of its assets, some of which are not susceptible to a precise determination, and for which ARCP will not obtain independent appraisals. ARCP’s compliance with the REIT income or quarterly asset requirements also depends on its ability to successfully manage the composition of its income and assets on an ongoing basis. Accordingly, if certain of ARCP’s operations were to be recharacterized by the IRS, such recharacterization would jeopardize its ability to satisfy all requirements for qualification as a REIT. Furthermore, future legislative, judicial or administrative changes to the U.S. federal income tax laws could be applied retroactively, which could result in ARCP’s disqualification as a REIT.
If ARCP fails to continue to qualify as a REIT for any taxable year and it does not qualify for certain statutory relief provisions, it will be subject to U.S. federal income tax on its taxable income at corporate rates. In addition, it would generally be disqualified from treatment as a REIT for the four taxable years following the year of losing its REIT qualification. Losing ARCP’s REIT qualification would reduce our net earnings available for investment because of the additional tax liability. In addition, we might be required to borrow funds or liquidate some investments in order to pay the applicable tax.
Even with ARCP’s REIT qualification, in certain circumstances, we may incur tax liabilities that would reduce our cash available for repayment of our indebtedness, including the notes.
Even with ARCP’s REIT qualification, we may be subject to U.S. federal, state and local income taxes. For example, net income from the sale of properties that are “dealer” properties sold by a REIT (a “prohibited transaction” under the Code) will be subject to a 100% tax. In addition, ARCP may not make sufficient distributions to avoid excise taxes applicable to REITs. We also may decide to retain net capital gain we earn from the sale or other disposition of our property and pay U.S. federal income tax directly on such income. We also may be subject to state and local taxes on our income or property, including franchise, payroll and transfer taxes, either directly, at the level of ARCP OP or at the level of the other companies through which we indirectly own our assets, such as taxable REIT subsidiaries, or TRSs, which are subject to full U.S. federal, state, local and foreign corporate-level income taxes. Any taxes we pay directly or indirectly will reduce our cash available for repayment of our indebtedness, including the notes.
37
Table of Contents
To qualify as a REIT, ARCP must meet annual distribution requirements, which may force us to forgo otherwise attractive opportunities or borrow funds during unfavorable market conditions. This could delay or hinder our ability to meet our investment objectives and reduce the amount of cash available for repayment of our indebtedness, including the notes.
In order to qualify as a REIT, ARCP must distribute annually to its stockholders at least 90% of its REIT taxable income (which does not equal net income as calculated in accordance with GAAP), determined without regard to the deduction for dividends paid and excluding any net capital gain. ARCP will be subject to U.S. federal income tax on its undistributed taxable income and net capital gain and to a 4% nondeductible excise tax on any amount by which distributions it pays with respect to any calendar year are less than the sum of (a) 85% of its ordinary income, (b) 95% of its capital gain net income and (c) 100% of its undistributed income from prior years. These requirements could cause us to distribute amounts that otherwise would be spent on investments in real estate assets and it is possible that we might be required to borrow funds, possibly at unfavorable rates, or sell assets to fund these distributions. Although ARCP intends to make distributions sufficient to meet the annual distribution requirements and to avoid U.S. federal income and excise taxes on its earnings while it qualifies as a REIT, this could reduce the amount of cash available for repayment of our indebtedness, including the notes.
Certain of our business activities are potentially subject to the prohibited transaction tax, which could reduce the amount of cash available for repayment of our indebtedness, including the notes.
For so long as ARCP qualifies as a REIT, our ability to dispose of property during the first few years following acquisition may be restricted to a substantial extent as a result of our REIT qualification. Under applicable provisions of the Code regarding prohibited transactions by REITs, while ARCP qualifies as a REIT, we will be subject to a 100% penalty tax on any gain recognized on the sale or other disposition of any property (other than foreclosure property) that we own, directly or through any subsidiary entity, including ARCP OP, but generally excluding our TRSs, that is deemed to be inventory or property held primarily for sale to customers in the ordinary course of a trade or business. Whether property is inventory or otherwise held primarily for sale to customers in the ordinary course of a trade or business depends on the particular facts and circumstances surrounding each property. While ARCP qualifies as a REIT, we intend to avoid the 100% prohibited transaction tax by (a) conducting activities that may otherwise be considered prohibited transactions through a TRS (but such TRS will incur corporate rate income taxes with respect to any income or gain recognized by it), (b) conducting our operations in such a manner so that no sale or other disposition of an asset we own, directly or through any subsidiary, will be treated as a prohibited transaction or (c) structuring certain dispositions of our properties to comply with the requirements of the prohibited transaction safe harbor available under the Code for properties that, among other requirements have been held for at least two years.
However, despite our present intention, no assurance can be given that any particular property we own, directly or through any subsidiary entity, including ARCP OP, but generally excluding our TRSs, will not be treated as inventory or property held primarily for sale to customers in the ordinary course of a trade or business.
Our TRSs are subject to corporate-level taxes and our dealings with our TRSs may be subject to 100% excise tax.
A REIT may own up to 100% of the stock of one or more TRSs. Both the subsidiary and the REIT must jointly elect to treat the subsidiary as a TRS. A corporation of which a TRS directly or indirectly owns more than 35% of the voting power or value of the stock will automatically be treated as a TRS. Overall, no more than 25% of the value of a REIT’s assets may consist of stock or securities of one or more TRSs. A TRS may hold assets and earn income that would not be qualifying assets or income if held or earned directly by a REIT, including gross income from operations pursuant to management contracts. We may use TRSs generally to hold properties for sale in the ordinary course of business or to hold assets or conduct activities that ARCP cannot conduct directly as a REIT. Each of our TRSs will be subject to applicable U.S. federal, state, local and foreign income tax on its taxable income. In addition, the rules which are applicable to ARCP as a REIT, also impose a 100% excise tax on certain transactions between a TRS and its parent REIT that are not conducted on an arm’s-length basis.
38
Table of Contents
If ARCP OP failed to qualify as a partnership or is not otherwise disregarded for U.S. federal income tax purposes, ARCP would cease to qualify as a REIT.
If the IRS were to successfully challenge the status of ARCP OP as a partnership for U.S. federal income tax purposes, it would be taxable as a corporation. In such event, this would reduce the amount of distributions that ARCP OP could make to ARCP. This also would result in ARCP failing to qualify as a REIT, and becoming subject to a corporate level tax on its income. In addition, if any of the partnerships or limited liability companies through which ARCP OP owns its properties, in whole or in part, loses its characterization as a partnership and is otherwise not disregarded for U.S. federal income tax purposes, it would be subject to taxation as a corporation, thereby reducing distributions to ARCP OP. Such a recharacterization of an underlying property owner could also threaten ARCP’s ability to maintain its qualification as a REIT.
If ARCP were considered to actually or constructively pay a “preferential dividend” to certain of its stockholders, its status as a REIT could be adversely affected.
In order to qualify as a REIT, ARCP must distribute annually to its stockholders at least 90% of its REIT taxable income (which does not equal net income as calculated in accordance with GAAP), determined without regard to the deduction for dividends paid and excluding net capital gain. In order for distributions to be counted as satisfying the annual distribution requirements for REITs, and to provide ARCP with a REIT-level tax deduction, the distributions must not be “preferential dividends.” A dividend is not a preferential dividend if the distribution is pro rata among all outstanding shares of stock within a particular class, and in accordance with the preferences among different classes of stock as set forth in ARCP’s organizational documents. Currently, there is uncertainty as to the IRS’s position regarding whether certain arrangements that REITs have with their stockholders could give rise to the inadvertent payment of a preferential dividend (e.g., the pricing methodology for stock purchased under a distribution reinvestment plan inadvertently causing a greater than 5% discount on the price of such stock purchased). While ARCP believes that its operations have been structured in such a manner that ARCP will not be treated as inadvertently paying preferential dividends, there is no de minimis exception with respect to preferential dividends. Therefore, if the IRS were to take the position that ARCP inadvertently paid a preferential dividend, ARCP may be deemed either to (a) have distributed less than 100% of its REIT taxable income and be subject to tax on the undistributed portion, or (b) have distributed less than 90% of its REIT taxable income and its status as a REIT could be terminated for the year in which such determination is made if ARCP were unable to cure such failure.
Complying with REIT requirements may limit our ability to hedge effectively and may cause us to incur tax liabilities.
The REIT provisions of the Code may limit our ability to hedge our liabilities. Any income from a hedging transaction we enter into to manage risk of interest rate changes, price changes or currency fluctuations with respect to borrowings made or to be made to acquire or carry real estate assets, if properly identified under applicable Treasury Regulations, will not constitute “gross income” for purposes of the 75% or 95% gross income tests. To the extent that we enter into other types of hedging transactions, the income from those transactions will likely be treated as non-qualifying income for purposes of both of the gross income tests. As a result of these rules, we may need to limit our use of advantageous hedging techniques or implement those hedges through a TRS. This could increase the cost of our hedging activities because our TRSs would be subject to tax on gains and could expose us to greater risks associated with changes in interest rates than we would otherwise want to bear. In addition, losses in a TRS generally will not provide any tax benefit, except for being carried forward against future taxable income of such TRS. Complying with REIT requirements may force us to forgo or liquidate otherwise attractive investment opportunities.
To qualify as a REIT, ARCP must ensure that it meets the REIT gross income tests annually and that at the end of each calendar quarter, at least 75% of the value of its assets consist of cash, cash items, government securities and qualified REIT real estate assets, including certain mortgage loans and certain kinds of mortgage-
39
Table of Contents
related securities. The remainder of its investment in securities (other than government securities and qualified real estate assets) generally cannot include more than 10% of the outstanding voting securities of any one issuer or more than 10% of the total value of the outstanding securities of any one issuer. In addition, in general, no more than 5% of the value of its assets (other than government securities and qualified real estate assets) can consist of the securities of any one issuer, and no more than 25% of the value of its total assets can be represented by securities of one or more TRSs. If ARCP fails to comply with these requirements at the end of any calendar quarter, it must correct the failure within 30 days after the end of the calendar quarter or qualify for certain statutory relief provisions to avoid losing its REIT qualification and suffering adverse tax consequences. As a result, we may be required to liquidate assets from our portfolio or not make otherwise attractive investments in order to maintain ARCP’s qualification as a REIT. These actions could have the effect of reducing our income and amounts available for repayment of our indebtedness, including the notes.
The ability of ARCP’s board of directors to revoke ARCP’s REIT qualification without stockholder approval may subject ARCP to U.S. federal income tax and reduce dividends to ARCP’s stockholders.
ARCP’s charter provides that ARCP’s board of directors may revoke or otherwise terminate ARCP’s REIT election, without the approval of ARCP’s stockholders, if it determines that it is no longer in ARCP’s best interest to continue to qualify as a REIT. While ARCP elected to be qualified to be taxed as a REIT, ARCP may terminate its REIT election if ARCP determine that qualifying as a REIT is no longer in the best interests of its stockholders. If ARCP ceased to be a REIT, ARCP would become subject to U.S. federal income tax on its taxable income and would no longer be required to distribute most of its taxable income to its stockholders, which may have adverse consequences on its total return to its stockholders and on the market price of its common stock.
We may be subject to adverse legislative or regulatory tax changes that could increase our tax liability and reduce our operating flexibility.
In recent years, numerous legislative, judicial and administrative changes have been made in the provisions of U.S. federal income tax laws applicable to investments similar to an investment in us. Additional changes to the tax laws are likely to continue to occur, and we cannot assure you that any such changes will not adversely affect our investors or us. Although REITs generally receive advantageous tax treatment relative to entities taxed as regular corporations, it is possible that future legislation would result in a REIT having fewer tax advantages, and it could become more advantageous for a company that invests in real estate to elect to be treated for U.S. federal income tax purposes as a corporation. As a result, ARCP’s charter provides its board of directors with the power, under certain circumstances, to revoke or otherwise terminate its REIT election and cause it to be taxed as a regular corporation, without the vote of ARCP’s stockholders. ARCP’s board of directors has fiduciary duties and could only cause such changes in ARCP’s tax treatment if it determines in good faith that such changes are in the best interest of its stockholders.
The share ownership restrictions in the Code for REITs and the 9.8% share ownership limit in ARCP’s charter may restrict our business combination opportunities.
In order for an entity to qualify as a REIT, five or fewer individuals, as defined in the Code, may not own, actually or constructively, more than 50% in value of issued and outstanding shares of stock of such entity at any time during the last half of each taxable year, other than the first year for which a REIT election is made. Attribution rules in the Code determine if any individual or entity actually or constructively owns shares of stock under this requirement. Additionally, at least 100 persons must beneficially own shares of stock during at least 335 days of a taxable year for each taxable year, other than the first year for which a REIT election is made.
40
Table of Contents
To help ensure that ARCP meets these tests, among other purposes, ARCP’s charter restricts the acquisition and ownership of its shares of stock. ARCP’s charter, with certain exceptions, authorizes ARCP’s board of directors to take such actions as are necessary and desirable to preserve ARCP’s qualification as a REIT while it so qualifies. Unless exempted by its board of directors, for as long as ARCP qualifies as a REIT, its charter prohibits, among other limitations on ownership and transfer of shares of its stock, any person from beneficially or constructively owning (applying certain attribution rules under the Code) more than 9.8% in value of the aggregate of its outstanding shares of stock and more than 9.8% (in value or in number of shares, whichever is more restrictive) of any class or series of its shares of stock. ARCP’s board of directors may not grant an exemption from these restrictions to any proposed transferee whose ownership in excess of the 9.8% ownership limit would result in the termination of ARCP’s qualification as a REIT. These restrictions on transferability and ownership will not apply, however, if ARCP’s board of directors determines that it is no longer in ARCP’s best interest to continue to qualify as a REIT or that compliance with the restrictions is no longer required in order for ARCP to continue to so qualify as a REIT. These ownership restrictions could delay or prevent a transaction or a change in control of ARCP that might otherwise be favorable to note holders.
ARCP may incur adverse tax consequences if any of ARCT III, CapLease, ARCT IV or Cole has failed to qualify as a REIT for U.S. federal income tax purposes.
If any of ARCT III, CapLease, ARCT IV or Cole has failed to qualify as a REIT for U.S. federal income tax purposes at any time prior to the ARCT III Merger, the CapLease Merger, the ARCT IV Merger and the Cole Merger, respectively, ARCP may inherit significant tax liabilities and could lose ARCP’s REIT status should disqualifying activities continue after the mergers.
See “Management’s Discussion and Analysis of Financial Condition and Results of Operations—Completed Mergers and Major Acquisitions” for a discussion of the transactions above.
Risks Related to the Exchange Notes
The exchange notes are structurally subordinated to the existing and future liabilities of ARCP OP’s subsidiaries.
ARCP OP’s subsidiaries are separate and distinct legal entities. Such subsidiaries have no obligation to pay any amounts due on the notes. In addition, any payment of dividends, loans or advances by these subsidiaries could be subject to statutory or contractual restrictions. ARCP OP’s right to receive any assets of any of its subsidiaries upon its bankruptcy, liquidation or reorganization, and therefore the right of the holders of the exchange notes to participate in those assets, will be effectively subordinated to the claims of that subsidiary’s creditors, including trade creditors. In addition, even if ARCP OP is a creditor of any of its subsidiaries, its rights as a creditor would be subordinate to any security interest in the assets of its subsidiaries and any debt of its subsidiaries senior to that held by ARCP OP.
The indenture governing the exchange notes offered hereby will contain, and the credit agreement governing the senior unsecured credit facility contains, restrictive covenants that limit our operating flexibility.
The indenture governing notes offered hereby will contain financial and operating covenants that, among other things, restrict our ability to take specific actions, even if we believe them to be in our best interest, including restrictions on our ability to:
| • | consummate a merger, consolidation or sale of all or substantially all of our assets; and |
| • | incur or guarantee additional secured and unsecured indebtedness. |
41
Table of Contents
In addition, the agreement governing the senior unsecured credit facility contains various customary covenants, including financial maintenance covenants with respect to maximum consolidated leverage, minimum fixed charge coverage, maximum secured leverage, maximum unencumbered leverage ratio and minimum total unencumbered interest coverage. Any failure to comply with these financial maintenance covenants would constitute a default under the senior unsecured credit facility and would prevent further borrowings thereunder. In addition, the senior unsecured credit facility contains certain customary negative covenants that restrict the ability of ARCP OP to incur secured indebtedness, and the ability of ARCP OP’s subsidiaries that are party to the senior unsecured credit facility to incur indebtedness. These covenants may restrict our ability to expand or fully pursue our business strategies. Our ability to comply with these and other provisions of the indenture governing the exchange notes and the credit agreement governing the senior unsecured credit facility may be affected by changes in our operating and financial performance, changes in general business and economic conditions, adverse regulatory developments or other events adversely impacting us. Any failure to comply with these financial maintenance covenants and negative covenants would constitute a default under the applicable debt agreement and, in the case of the senior unsecured credit facility, would prevent further borrowings thereunder. Any such default could cause those and other obligations to become due and payable. If any of our indebtedness is accelerated, we may not be able to repay it.
Lenders under our secured debt will have claims with respect to the assets securing that debt that are superior to those of the exchange notes.
The exchange notes are not secured by any of our assets. The indenture governing the exchange notes and our other debt instruments permit us and our subsidiaries to incur a substantial amount of indebtedness that can be secured by our and our subsidiaries’ assets. Any of the Issuer’s and the guarantor’s secured debt will be effectively senior to the exchange notes and the guarantees to the extent of the value of the assets securing that secured debt or the amount of that secured debt outstanding, whichever is less. In the event of a bankruptcy, liquidation, dissolution, reorganization or similar proceeding, the pledged assets would be available to satisfy obligations on the secured debt before any payment could be made on the exchange notes. In that event, we may not have sufficient assets remaining to pay amounts due on any or all of the exchange notes. As of June 30, 2014, we had $4.1 billion of senior secured indebtedness outstanding.
We may incur substantial additional indebtedness.
As of June 30, 2014, our aggregate indebtedness was approximately $9.7 billion. We intend to incur additional indebtedness in the future, including borrowings under our newly revised (effective as of June 30, 2014) $4.6 billion senior unsecured credit facility (which contains an “accordion” feature to allow us, under certain circumstances, to increase the commitments thereunder to $6.0 billion) for various purposes including, without limitation, the funding of future acquisitions, capital improvements and leasing commissions in connection with the repositioning of a property. At June 30, 2014, we had approximately $1.9 billion outstanding under the senior unsecured credit facility.
Our debt agreements permit us and our subsidiaries to incur substantial additional debt. The incurrence of additional debt, whether secured or unsecured, by us or our subsidiaries may have important consequences for you as a holder of the exchange notes, including making it more difficult for us to satisfy our obligations with respect to the exchange notes, a loss in the market value of your notes and a risk that the credit rating of the exchange notes is lowered or withdrawn. We also face the risk that we may be unable to refinance or repay our debt as it comes due.
Our substantial indebtedness and any constraints on credit could also have other important consequences, including:
| • | Increasing our vulnerability to general adverse economic and industry conditions; |
| • | Limiting our ability to obtain additional financing to fund future working capital, capital expenditures and other general corporate requirements; |
42
Table of Contents
| • | Requiring the use of a substantial portion of our cash flow from operations for the payment of principal and interest on indebtedness, thereby reducing our ability to use our cash flow to fund working capital, acquisitions, capital expenditures and general corporate requirements; |
| • | Limiting our flexibility in planning for, or reacting to, changes in our business and industry; and |
| • | Putting us at a disadvantage compared to our competitors with less indebtedness. |
If we default under a loan (including any default in respect of the financial maintenance and negative covenants contained in the senior unsecured credit facility), we may automatically be in default under any other loan that has cross-default provisions (including the senior unsecured credit facility), and further borrowings under the senior unsecured credit facility will be prohibited, outstanding indebtedness under the senior unsecured credit facility or such other loans may be accelerated, and to the extent the senior unsecured credit facility or such other loans are secured, directly or indirectly by any properties or assets, lenders under the senior unsecured credit facility or such other loans may foreclose on the collateral securing such indebtedness as a result. In addition, increases in interest rates may impede our operating performance and put us at a competitive disadvantage. Further, payments of required debt service or amounts due at maturity, or creation of additional reserves under loan agreements, could adversely affect our financial condition and operating results.
Increases in interest rates would increase our debt service costs, may adversely affect any future refinancing of our debt and our ability to incur additional debt, and could adversely affect our financial condition, cash flow and results of operations.
Certain of our borrowings bear interest at variable rates, and we may incur additional variable-rate debt in the future. Increases in interest rates would result in higher interest expenses on our existing unhedged variable rate debt, and increase the costs of refinancing existing debt or incurring new debt. Additionally, increases in interest rates may result in a decrease in the value of our real estate and decrease the market price of ARCP’s common stock and could accordingly adversely affect our financial condition, cash flow and results of operations.
An increase in interest rates could result in a decrease in the relative value of the exchange notes.
In general, as market interest rates rise, notes bearing interest at a fixed rate generally decline in value because the premium, if any, over market interest rates will decline. Consequently, if you purchase these notes and market interest rates increase, the market value of your notes may decline. We cannot predict the future level of market interest rates.
We may not be able to generate sufficient cash flow to meet our debt service obligations.
Our ability to make payments on and to refinance our indebtedness, including the ability of the Issuer and the guarantor to make payments on and refinance the exchange notes, and to fund our operations, working capital and capital expenditures, depends on our ability to generate cash in the future. To a certain extent, our cash flow is subject to general economic, industry, financial, competitive, operating, legislative, regulatory and other factors, many of which are beyond our control.
We cannot assure you that our business will generate sufficient cash flow from operations or that future sources of cash will be available to us in an amount sufficient to enable us to pay amounts due on our indebtedness, including the exchange notes, or to fund our other liquidity needs.
Additionally, if we incur additional indebtedness in connection with future acquisitions or development projects or for any other purpose, our debt service obligations could increase.
43
Table of Contents
We may need to refinance all or a portion of our indebtedness, including the exchange notes, on or before maturity. Our ability to refinance our indebtedness or obtain additional financing will depend on, among other things:
| • | our financial condition and market conditions at the time; and |
| • | restrictions in the agreements governing our indebtedness. |
As a result, we may not be able to refinance any of our indebtedness, including the exchange notes, on commercially reasonable terms, or at all. If we do not generate sufficient cash flow from operations, and additional borrowings or refinancings or proceeds of asset sales or other sources of cash are not available to us, we may not have sufficient cash to enable us to meet all of our obligations, including payments on the exchange notes. Accordingly, if we cannot service our indebtedness, we may have to take actions such as seeking additional equity, or delaying strategic acquisitions and alliances or capital expenditures, any of which could have a material adverse effect on our operations. We cannot assure you that we will be able to effect any of these actions on commercially reasonable terms, or at all.
Risks Related to the Exchange Offers
Your old notes will not be accepted for exchange if you fail to follow the exchange offers procedures.
We will not accept your old notes for exchange if you do not follow the exchange offers procedures. We will issue exchange notes as part of the exchange offers only after a timely receipt of your old notes, a properly completed and duly executed letter of transmittal and all other required documents. If we do not receive your old notes, letter of transmittal and other required documents by the time of expiration of the exchange offers, we will not accept your old notes for exchange. We are under no duty to give notification of defects or irregularities with respect to the tenders of old notes for exchange. If there are defects or irregularities with respect to your tender of old notes, we will not accept your old notes for exchange.
If you do not properly tender your old notes, your ability to transfer your old notes will be adversely affected.
We will only issue exchange notes in exchange for old notes that are timely received by the exchange agent, together with all required documents, including a properly completed and signed letter of transmittal. Therefore, you should allow sufficient time to ensure timely delivery of the old notes and you should carefully follow the instructions on how to tender your old notes. Neither we nor the exchange agent are required to tell you of any defects or irregularities with respect to your tender of the old notes. If you do not tender your old notes or if we do not accept your old notes because you did not tender your old notes properly, then, after we consummate the exchange offers, you may continue to hold old notes that are subject to the existing transfer restrictions. In addition, if you tender your old notes for the purpose of participating in a distribution of the exchange notes, you will be required to comply with the registration and prospectus delivery requirements of the Securities Act in connection with any resale of the exchange notes. If you are a broker-dealer that receives exchange notes for your own account in exchange for old notes that you acquired as a result of market-making activities or any other trading activities, you will be required to acknowledge that you will deliver a prospectus in connection with any resale of such exchange notes in accordance with applicable regulations. After the exchange offers are consummated, if you continue to hold any old notes, you may have difficulty selling them because there will be fewer old notes outstanding. In addition, if a large amount of old notes are not tendered or are tendered improperly, the limited amount of exchange notes that would be issued and outstanding after we consummate the exchange offers could lower the market price of such exchange notes.
44
Table of Contents
Your ability to transfer the exchange notes may be limited by the absence of an active trading market, and there is no assurance that any active trading market will develop for the exchange notes.
The exchange notes are a new issue of securities for which there is no established public market. We do not intend to have the exchange notes listed on a national securities exchange or included in any automated quotation system. Accordingly, an active market for any of the exchange notes may not develop or, if developed, it may not continue. The liquidity of any market for the exchange notes will depend upon the number of holders of the exchange notes, our performance, the market for similar securities, the interest of securities dealers in making a market in the exchange notes and other factors. A liquid trading market may not develop for the exchange notes. If a market develops, the exchange notes could trade at prices that may be lower than the initial offering price of the exchange notes. If an active market does not develop or is not maintained, the price and liquidity of the exchange notes may be adversely affected.
The market price for the exchange notes may be volatile.
Historically, the market for non-investment grade debt has been subject to disruptions that have caused substantial volatility in the prices of securities similar to the exchange notes. The market for the exchange notes, if any, may be subject to similar disruptions. Any such disruptions may adversely affect the value of your exchange notes. In addition, subsequent to their initial issuance, the exchange notes may trade at a discount from their initial offering price, depending upon prevailing interest rates, the market for similar exchange notes, our performance and other factors.
45
Table of Contents
This prospectus supplement contains forward-looking statements. You can identify forward-looking statements by the use of forward-looking terminology such as “believes,” “expects,” “may,” “will,” “would,” “could,” “should,” “seeks,” “intends,” “plans,” “projects,” “estimates,” “anticipates,” “predicts” or “potential” or the negative of these words and phrases or similar words or phrases. You can also identify forward-looking statements by discussions of strategy, plans or intentions. Statements regarding the following subjects may be impacted by a number of risks and uncertainties which may cause our actual results, performance or achievements to be materially different from any future results, performances or achievements expressed or implied by the forward-looking statements:
| • | our use of the proceeds from ARCP’s offerings of securities; |
| • | our business and investment strategy; |
| • | our ability to renew leases as they expire; |
| • | the performance and economic condition of our tenants, including our tenant under the Red Lobster Portfolio, that we recently acquired or expect to acquire; |
| • | our ability to make additional investments in a timely manner or on acceptable terms; |
| • | current credit market conditions and our ability to obtain long-term financing for our property investments in a timely manner and on terms that are consistent with what we project when we invest in the property; |
| • | increases in interest rates; |
| • | the effect of general market, real estate market, economic and political conditions; |
| • | our ability to make scheduled payments on our debt obligations; |
| • | the degree and nature of our competition; |
| • | the availability of qualified personnel; |
| • | ARCP’s ability to maintain our qualification as a REIT; |
| • | our ability to derive the expected benefits from the assumption of certain functions previously performed by the Former Manager and its affiliates, including acquisition, accounting and portfolio management services, which transition to self-management was completed on January 8, 2014; |
| • | risks associated with our recent transition to self-management; |
| • | our ability to integrate the assets and businesses acquired in recent acquisitions (including the Red Lobster Portfolio) and to be acquired in completed and pending acquisitions into our existing portfolio and business successfully, or to realize the anticipated benefits for such acquisitions within the expected timeframe or at all; |
| • | our ability to effectively manage or dispose of assets acquired in connection with recently completed or pending acquisitions that do not fit within our target assets, including our Multi-Tenant Portfolio; |
| • | our ability to effectively manage our expanded portfolio and operations following recently completed acquisitions and the consummation of pending acquisitions; |
| • | risks associated with lease terminations and tenant defaults and tenant credit and geographic concentrations; |
| • | unexpected costs or unexpected liabilities that may arise from the consummated Cole Merger, or other transactions, whether or not consummated; |
46
Table of Contents
| • | risks associated with our ability to consummate the sale of the Multi-Tenant Portfolio on the terms anticipated, or at all; |
| • | the incurrence of uninsured losses or losses in excess of our insurance coverage; and |
| • | the factors included in ARCP’s most recent Annual Report on Form 10-K, including those set forth under the headings “Risk Factors” and “Management’s Discussion and Analysis of Financial Condition and Results of Operations.” |
The forward-looking statements contained in this prospectus reflect our beliefs, assumptions and expectations of our future performance, taking into account all information currently available to us. These beliefs, assumptions and expectations are subject to risks and uncertainties and can change as a result of many possible events or factors, not all of which are known to us. If a change occurs, our business, financial condition, liquidity and results of operations may vary materially from those expressed in our forward-looking statements. You should carefully consider these risks before you make an investment decision with respect to the notes exchange.
For more information regarding risks that may cause our actual results to differ materially from any forward-looking statements, see “Risk Factors.” We disclaim any obligation to publicly update or revise any forward-looking statements to reflect changes in underlying assumptions or factors, new information, future events or other changes, except as required by law.
47
Table of Contents
These exchange offers are intended to satisfy ARCP OP’s obligations under the registration rights agreement. See “Exchange Offers.” Accordingly, ARCP OP will not receive any proceeds from the issuance of the exchange notes in these exchange offers. In consideration for issuing the exchange notes as contemplated in this prospectus, ARCP OP will receive the old notes in like principal amount, all of which it will retire or cancel. Issuance of the exchange notes will not result in any change in ARCP OP’s capitalization.
48
Table of Contents
RATIO OF EARNINGS TO FIXED CHARGES
ARCP OP
ARCP OP’s consolidated ratio of earnings to fixed charges for the six months ended June 30, 2014 and the years ended December 31, 2013, 2012 and 2011 are set forth below:
| Six Months Ended June 30, 2014(1)(2) |
Year Ended December 31, |
|||||||||||||||
| 2013(1) | 2012(1) | 2011(1) | ||||||||||||||
| Ratio of Earnings to Fixed Charges |
-0.93x | -5.54x | -2.50x | -3.12x | ||||||||||||
| (1) | The ratio of earnings to fixed charges was less than one-to-one for the six months ended June 30, 2014 and the years ended December 31, 2013, 2012 and 2011. For the six months ended June 30, 2014, the total fixed charges were approximately $188.6 million and total losses were approximately $175.4 million, resulting in a total deficiency of $364.0 million. For the year ended December 31, 2013, the total fixed charges were approximately $73.4 million and total losses were $407.0 million resulting in a total deficiency of $480.4 million. For the year ended December 31, 2012, the total fixed charges were approximately $11.9 million and the total losses were approximately $29.6 million, resulting in a total deficiency of $41.5 million. For the year ended December 31, 2011, the total fixed charges were approximately $1.0 million and the total losses were approximately $3.0 million, resulting in a total deficiency of approximately $4.0 million. |
| (2) | Net loss used in the calculation of ratio of earnings to fixed charges includes merger and other transaction related expenses of $235.5 million. Excluding this amount the ratio of earnings to fixed charges would be 0.3x. |
ARCP
ARCP’s consolidated ratio of earnings to fixed charges for the six months ended June 30, 2014, the years ended December 31, 2013 and 2012, the period from September 6, 2011 through December 31, 2011, the period from January 1, 2011 through September 5, 2011 and the years ended December 31, 2010 and 2009 are set forth below:
| Post-Mergers | Pre-Mergers | ARC Predecessor Companies(1) |
||||||||||||||||||||||||||
| Six Months Ended June 30, 2014(2)(3)(4) |
Year Ended December 31, |
Period
September 6, 2011 through December 31, 2011(1)(2) |
Period
January 1, 2011 through September 5, 2011(2) |
Year Ended December 31, |
||||||||||||||||||||||||
| 2013(2)(3) | 2012(2)(3) | 2010(2) | 2009(2) | |||||||||||||||||||||||||
| Ratio of Earnings to Fixed Charges |
-0.85x | -5.46x | -2.48x | -0.90x | 0.33x | 0.31x | -0.24x | |||||||||||||||||||||
| (1) | ARCP’s IPO closed on September 6, 2011. |
| (2) | The ratio of earnings to fixed charges was less than one-to-one for the six months ended June 30, 2014, the years ended December 31, 2013 and 2012, the period from September 6, 2011 through December 31, 2011, the period from January 1, 2011 through September 5, 2011 and the years ended December 31, 2010 and 2009. For the six months ended June 30, 2014, the total fixed charges were approximately $188.6 million and total losses were approximately $160.4 million, resulting in a total deficiency of $349.0 million. For the year ended December 31, 2013, the total fixed charges were approximately $73.4 million and total losses were $401.3 million resulting in a total deficiency of $474.7 million. For the year ended December 31, 2012, the total fixed charges were approximately $11.9 million and the total losses were approximately $29.4 million, resulting in a total deficiency of $41.3 million. For the period from September 6, 2011 through December 31, 2011, the total fixed charges were approximately $0.9 million and the total losses were approximately $0.8 million, resulting in a total deficiency of approximately $1.7 million. For the period from January 1, 2011 through September 5, 2011, the total fixed charges were approximately $7.9 million and the total earnings were approximately $2.6 million, resulting in a total deficiency of approximately $5.3 million. For the year ended December 31, 2010, the total fixed charges were |
49
Table of Contents
| approximately $10.8 million and the total earnings were approximately $3.4 million, resulting in a total deficiency of approximately $7.4 million. For the year ended December 31, 2009, the total fixed charges were approximately $7.0 million and the total losses were approximately $1.6 million, resulting in a total deficiency of approximately $8.6 million. |
| (3) | On February 28, 2013, we completed the ARCT III Merger and on January 3, 2014, we completed the ARCT IV Merger. The ratios for this period are presented as if the companies were reporting on a combined basis. |
| (4) | Net loss used in calculation of ratio of earnings to fixed charges includes merger and other transaction related expenses of $235.5 million. Excluding this amount the ratio of earnings to fixed charges would be 0.4x. |
50
Table of Contents
SELECTED CONSOLIDATED HISTORICAL AND PRO FORMA FINANCIAL DATA
The following table sets forth selected consolidated historical financial data for ARCP OP and its respective subsidiaries, as of, and for the periods ended at the dates indicated. The selected consolidated financial data as of June 30, 2014 and for the six months ended June 30, 2014 and 2013 have been derived from ARCP OP’s unaudited consolidated financial statements included elsewhere in this prospectus. The selected consolidated financial data as of December 31, 2013 and 2012 and for the fiscal years ended December 31, 2013, 2012 and 2011 have been derived from ARCP OP’s audited consolidated financial statements included elsewhere in this prospectus.
American Realty Capital Trust IV, Inc. (“ARCT IV”) and American Realty Capital Trust III, Inc. (“ARCT III”) were entities under common control with the Company. GAAP requires that historical financial information be presented as if the mergers had occurred as of the beginning of the earliest period presented. Therefore, the historical financial statements of ARCP and its respective subsidiaries that were previously issued were recast to present the financial information as if these mergers had occurred on January 1, 2011. See “Management’s Discussion and Analysis of Financial Condition and Results of Operations—Completed Mergers and Acquisitions—Accounting Treatment of ARCT III Merger” and “ Management’s Discussion and Analysis of Financial Condition and Results of Operations—Completed Mergers and Acquisitions—Accounting Treatment of ARCT IV Merger.” The historical financial information of ARCP OP and its respective subsidiaries has also been recast on the same basis. There was no impact on the financial statements at and for the six months ended June 30, 2014.
As discussed in “Management’s Discussion and Analysis of Financial Condition and Results of Operations—Completed Mergers and Acquisitions—Accounting Treatment of ARCT IV Merger.”, the Company has retrospectively presented its financial statements as if the Company and ARCT IV were combined from the beginning of each period presented. As such, each of ARCP’s and ARCP OP’s December 31, 2013 and 2012 balance sheets reflect an increase in total assets of $2.2 billion and $0.2 billion, respectively, an increase in total liabilities of $1.5 billion and $0.1 billion, respectively, and an increase in total stockholders’ equity of $0.7 billion and $0.1 billion, respectively, as compared to each of ARCP’s and ARCP OP’s balance sheets before recasting the balance sheets to include ARCT IV. In addition, each of ARCP’s and ARCP OP’s statements of operations for the years ended December 31, 2013 and 2012 reflect an increase in total revenues of $89.3 million and $0.4 million, respectively, an increase in total operating expenses of $139.6 million and $3.0 million, respectively, and an increase in net loss of $71.2 million and $2.5 million, respectively, as compared to each of ARCP’s and ARCP OP’s statements of operations before recasting the statements of operations to include ARCT IV. There was no impact to any of ARCP’s or ARCP OP’s financial statements prior to January 1, 2012. The financial statements of ARCP prior to recasting are included in the Annual Report on Form 10-K for the year ended December 31, 2013 and the financial statements recast to include ARCT IV were included in the Current Report on Form 8-K filed by the Company with the SEC on May 20, 2014. In addition, each of ARCP’s and ARCP OP’s statement of operations for the six months ended June 30, 2013 reflects an increase in total revenues of $12.7 million, an increase in total operating expenses of $38.4 million and an increase in net loss of $23.7 million, as compared to each of ARCP’s and ARCP OP’s statement of operations before recasting the statement of operations to include ARCT IV. The financial statements of ARCP for the six months ended June 30, 2013 are included in the Quarterly Report on Form 10-Q filed with the SEC on August 6, 2013.
In addition, as discussed in “ Management’s Discussion and Analysis of Financial Condition and Results of Operations—Completed Mergers and Acquisitions—Accounting Treatment of ARCT III Merger”, the Company has retrospectively presented its financial statements as if the Company and ARCT III were combined from the beginning of each period presented. As such, each of ARCP’s and ARCP OP’s December 31, 2012 and 2011 balance sheets reflect an increase in total assets of $1.7 billion and $90.0 million, respectively, an increase in total liabilities of $0.3 billion and $6.5 million, respectively, and an increase in total stockholders’ equity of $1.4 billion and $83.5 million, respectively, as compared to each of ARCP’s and ARCP OP’s balance sheets before recasting the balance sheets to include ARCT III. In addition, each of ARCP’s and ARCP OP’s statements of operations for the year ended December 31, 2012 and 2011 reflect an increase in total revenues of $50.0 million
51
Table of Contents
and $0.8 million, respectively, an increase in total operating expenses of $75.6 million and $2.9 million, respectively, and an increase in net loss of $32.1 million and $2.1 million, respectively, as compared to each of ARCP’s and ARCP OP’s statements of operations before recasting the statements of operations to include ARCT III. There was no impact to any of ARCP’s and ARCP OP’s financial statements prior to January 1, 2011. The financial statements of ARCP filed with the SEC prior to the filing of recasted financial statements are included in ARCP’s Annual Report on Form 10-K filed with the SEC on February 28, 2013 and the financial statements recast for ARCT III were included in ARCP’s Current Report on Form 8-K filed with the SEC on May 8, 2013.
The following unaudited selected pro forma consolidated balance sheet data is presented as if ARCP OP had completed (1) the sale of the Multi-Tenant Portfolio and (2) the purchase of the Red Lobster Portfolio as of June 30, 2014. The following unaudited selected pro forma consolidated operating data for the six months ended June 30, 2014 and the year ended December 31, 2013 are presented as if the sale of the Multi-Tenant Portfolio and the purchase of the Red Lobster Portfolio occurred at the beginning of the period presented. In addition, the unaudited selected pro forma consolidated operating data for the six months ended June 30, 2014 is presented to reflect other mergers and acquisitions, including the Cole Merger, the acquisitions of the Fortress and Inland Portfolios and other granular, self-originated acquisitions had occurred at the beginning of the period presented. Additionally, the unaudited selected pro forma consolidated operating data for the year ended December 31, 2013 is presented as if the Cole Merger, the acquisitions of the Fortress and Inland Portfolios, and other mergers and acquisitions that were completed during the year ended December 31, 2013, including the CapLease Merger and the acquisition of the GE Capital Portfolio, are presented in the unaudited selected pro forma consolidated operating data for the year ended December 31, 2013 as if the properties had been acquired at the beginning of the period presented. See “Management’s Discussion and Analysis of Financial Condition and Results of Operations—Completed Mergers and Major Acquisitions” for a discussion of the transactions above.
You should read the following selected consolidated historical and pro forma financial data in conjunction with the information under the captions “Unaudited Pro Forma Consolidated Financial Statements,” “Management’s Discussion and Analysis of Financial Condition and Results of Operations” and our consolidated financial statements and the accompanying notes thereto included elsewhere in this prospectus.
52
Table of Contents
Operating Data (in thousands, except unit and per unit data):
| Pro Forma Results for the Six Months Ended June 30, 2014 |
Historical Results for the Six Months Ended June 30, |
Pro Forma Results for the Year Ended December 31, 2013 |
Historical Results for the Year Ended December 31, |
|||||||||||||||||||||||||
| 2014 | 2013 | 2013 | 2012 | 2011 | ||||||||||||||||||||||||
| Total revenues |
$ | 823,354 | $ | 702,595 | $ | 97,842 | $ | 1,901,263 | $ | 329,878 | $ | 67,207 | $ | 3,970 | ||||||||||||||
|
|
|
|
|
|
|
|
|
|
|
|
|
|
|
|||||||||||||||
| Expenses: |
||||||||||||||||||||||||||||
| Acquisition related |
— | 20,337 | 47,616 | — | 76,136 | 45,070 | 3,898 | |||||||||||||||||||||
| Merger and other transaction related |
— | 235,478 | 144,162 | — | 278,319 | 2,603 | — | |||||||||||||||||||||
| Reallowed fees and commissions |
58,722 | 41,504 | — | 339,217 | — | — | — | |||||||||||||||||||||
| Property operating |
57,267 | 69,030 | 5,635 | 59,962 | 23,616 | 3,522 | 220 | |||||||||||||||||||||
| Operating fees to affiliates |
— | — | — | 68,889 | 5,654 | 212 | — | |||||||||||||||||||||
| General and administrative |
54,293 | 44,748 | 3,815 | 195,565 | 10,645 | 4,215 | 735 | |||||||||||||||||||||
| Equity-based compensation |
31,848 | 31,848 | 4,339 | 34,962 | 34,962 | 1,197 | — | |||||||||||||||||||||
| Depreciation and amortization |
439,532 | 424,356 | 60,505 | 535,846 | 211,372 | 41,003 | 2,111 | |||||||||||||||||||||
|
|
|
|
|
|
|
|
|
|
|
|
|
|
|
|||||||||||||||
| Total operating expenses |
641,662 | 867,301 | 266,072 | 1,234,441 | 640,704 | 97,822 | 6,964 | |||||||||||||||||||||
|
|
|
|
|
|
|
|
|
|
|
|
|
|
|
|||||||||||||||
| Operating income (loss) |
181,692 | (164,706) | (168,230) | 666,822 | (310,826 | ) | (30,615 | ) | (2,994 | ) | ||||||||||||||||||
| Other (expense) income: |
||||||||||||||||||||||||||||
| Interest expense |
$ | (168,866 | ) | $ | (216,347 | ) | $ | (17,124 | ) | $ | (348,342 | ) | $ | (102,305 | ) | $ | (11,856 | ) | $ | (960 | ) | |||||||
| Gain (loss) on derivative instruments, net |
1,729 | 1,729 | (45 | ) | (69,120 | ) | (67,946 | ) | — | — | ||||||||||||||||||
| Other income (expense), net |
15,404 | 15,404 | (28,663 | ) | (13,835 | ) | 641 | 979 | 2 | |||||||||||||||||||
|
|
|
|
|
|
|
|
|
|
|
|
|
|
|
|||||||||||||||
| Total other expenses, net |
(151,733 | ) | (199,214 | ) | (45,832 | ) | (431,297 | ) | (169,610 | ) | (10,877 | ) | (958 | ) | ||||||||||||||
|
|
|
|
|
|
|
|
|
|
|
|
|
|
|
|||||||||||||||
| Income (loss) from continuing operations |
29,959 | (363,920 | ) | (214,062 | ) | 235,525 | (480,436 | ) | (41,492 | ) | (3,952 | ) | ||||||||||||||||
| Income (loss) from discontinued operations |
— | — | 34 | 59,889 | (20 | ) | (745 | ) | (852 | ) | ||||||||||||||||||
|
|
|
|
|
|
|
|
|
|
|
|
|
|
|
|||||||||||||||
| Net income (loss) |
29,959 | (363,920 | ) | (214,028 | ) | 295,414 | (480,456 | ) | (42,237 | ) | (4,804 | ) | ||||||||||||||||
| Net loss attributable to non-controlling interests |
(80 | ) | (80 | ) | — | — | — | — | — | |||||||||||||||||||
|
|
|
|
|
|
|
|
|
|
|
|
|
|
|
|||||||||||||||
| Net income (loss) attributable to the Unitholder |
29,879 | (364,000 | ) | (214,028 | ) | 295,414 | (480,456 | ) | (42,237 | ) | (4,804 | ) | ||||||||||||||||
| Less: dividends declared on preferred units and participating securities |
(46,723 | ) | (46,723 | ) | (425 | ) | (89,055 | ) | (3,631 | ) | (368 | ) | — | |||||||||||||||
|
|
|
|
|
|
|
|
|
|
|
|
|
|
|
|||||||||||||||
| Net (loss) income attributable to common unitholders |
$ | (16,844 | ) | $ | (410,723 | ) | $ | (214,453 | ) | $ | 206,359 | $ | (484,087 | ) | $ | (42,605 | ) | $ | (4,804 | ) | ||||||||
|
|
|
|
|
|
|
|
|
|
|
|
|
|
|
|||||||||||||||
| Basic and diluted net loss per unit attributable to common unitholders |
$ | (0.02 | ) | $ | (0.58 | ) | $ | (1.12 | ) | $ | 0.23 | $ | (2.26 | ) | $ | (0.41 | ) | $ | (1.26 | ) | ||||||||
| Weighted-average number of common units outstanding |
927,551,450 | 708,350,326 | 190,982,367 | 904,554,566 | 214,352,289 | 104,083,222 | 3,818,872 | |||||||||||||||||||||
Balance sheet data (in thousands):
| Pro Forma as of June 30, 2014 |
Historical as of June 30, 2014 |
Historical as of December 31, |
||||||||||||||
| 2013 | 2012 | |||||||||||||||
| Total real estate investments, at cost |
$ | 17,543,771 | $ | 18,101,436 | $ | 7,455,811 | $ | 1,875,268 | ||||||||
| Total assets |
$ | 20,575,850 | $ | 21,315,487 | $ | 7,807,504 | $ | 2,182,195 | ||||||||
| Mortgage notes payable, net |
$ | 3,658,460 | $ | 4,227,494 | $ | 1,301,114 | $ | 265,118 | ||||||||
| Corporate bonds, net |
$ | 2,546,089 | $ | 2,546,089 | $ | — | $ | — | ||||||||
| Credit facilities |
$ | 2,088,379 | $ | 1,896,000 | $ | 1,969,800 | $ | 124,604 | ||||||||
| Convertible debt due to General Partner, net |
$ | 975,003 | $ | 975,003 | $ | 972,490 | $ | — | ||||||||
| Other debt, net |
$ | 146,158 | $ | 146,158 | $ | 104,804 | $ | — | ||||||||
| Total liabilities |
$ | 9,991,879 | $ | 10,451,698 | $ | 5,284,971 | $ | 513,435 | ||||||||
| Total equity and temporary equity |
$ | 10,583,971 | $ | 10,863,789 | $ | 2,522,533 | $ | 1,668,760 | ||||||||
53
Table of Contents
ARC Properties Operating Partnership, L.P.
Unaudited Pro Forma Consolidated Financial Statements
The following unaudited pro forma consolidated financial statements were developed by applying pro forma adjustments to the historical consolidated financial data which reflect the transactions described below. The following unaudited pro forma consolidated balance sheet is presented as if ARCP OP had completed (i) the purchase of the Red Lobster Portfolio and (ii) the sale of the Multi-Tenant Portfolio (as defined below) as of June 30, 2014.
The following unaudited pro forma consolidated statements of operations for the six months ended June 30, 2014 and the year ended December 31, 2013 are presented as if the purchase of the Red Lobster Portfolio and the sale of the Multi-Tenant Portfolio had occurred at the beginning of the period presented. In addition, the unaudited pro forma consolidated statement of operations for the six months ended June 30, 2014 is presented as if other mergers and acquisitions, including the Cole Merger (as defined below), the acquisitions of the Fortress and Inland Portfolios (as defined below), and other organic acquisitions, had occurred at the beginning of the period presented. Additionally, the unaudited pro forma consolidated statement of operations for the year ended December 31, 2013 is presented as if the Cole Merger, the acquisitions of the Fortress and Inland Portfolios, and other mergers and acquisitions that were completed during the year ended December 31, 2013, including the CapLease Merger (as defined below) and the acquisition of the GE Capital Portfolio (as defined below), had been acquired at the beginning of the period presented. Additionally, the unaudited pro forma consolidated statement of operations for the year ended December 31, 2013 is presented as if the Equity Offering (as defined below) and the related use of proceeds had occurred at the beginning of the period presented.
On June 11, 2014, wholly-owned subsidiaries of ARCP OP entered into an Agreement of Purchase and Sale for the sale of 76 properties, consisting of 67 multi-tenant shopping centers and 9 single-tenant retail properties (the “Multi-Tenant Portfolio”) to a third party, subject to certain closing conditions. The contract purchase price for the sale of the Multi-Tenant Portfolio is $1.975 billion.
On May 16, 2014, ARCP OP, through a wholly owned subsidiary, entered into a master purchase agreement to acquire over 500 properties, substantially all of which are operating as Red Lobster® restaurants (the “Red Lobster Portfolio”) from a third party. The transaction is structured as a sale-leaseback in which the ARCP OP will purchase the Red Lobster Portfolio and will immediately lease the portfolio back to the third party pursuant to the terms of multiple master leases. The overall sale-leaseback transaction consists of 521 Red Lobster® restaurants for a purchase price of $1.59 billion. On July 28, 2014, the ARCP OP closed on 492 of the properties and, on July 30, 2014, the ARCP OP closed on the remaining 29 properties.
On October 22, 2013, ARCP OP entered into an agreement and plan of merger (the “Cole Merger Agreement”) with Cole Real Estate Investments, Inc. (“Cole”), a Maryland corporation, and a wholly owned subsidiary of ARCP OP. The Cole Merger Agreement provided for the merger of Cole with and into a wholly owned subsidiary of ARCP OP (the “Cole Merger”). ARCP OP consummated the Cole Merger on February 7, 2014.
On July 24, 2013, ARC and another related entity, on behalf of ARCP OP and certain other entities sponsored directly or indirectly by ARC, entered into a purchase and sale agreement with affiliates of funds managed by Fortress Investment Group LLC (“Fortress”) for the purchase of 196 properties owned by Fortress. Of the 196 properties, 120 properties were allocated to and assigned by ARCP OP (the “Fortress Portfolio”). ARCP OP acquired 41 properties of the Fortress Portfolio on October 1, 2013 and the remaining 79 properties on January 8, 2014.
54
Table of Contents
On August 8, 2013, ARC and another related entity, on behalf of ARCP OP and certain other entities sponsored directly or indirectly by ARC, entered into a purchase and sale agreement with Inland American Real Estate Trust, Inc. (“Inland”) for the purchase of the equity interests of 67 companies owned by Inland. Of the 67 companies, the equity interests of 10 companies (the “Inland Portfolio”) were allocated to ARCP OP. The Inland Portfolio is comprised of 33 properties. ARCP OP closed on five properties of the Inland Portfolio on September 24, 2013 and an additional 27 properties during the six months ended June 30, 2014. ARCP OP will not close on the remaining property and has excluded that property from its pro forma financial statements.
On May 28, 2013, ARCP entered into an Agreement and Plan of Merger (the “CapLease Merger Agreement”) with CapLease, Inc., a Maryland corporation (“CapLease”), and certain subsidiaries of each company. The CapLease Merger Agreement provided for the merger of CapLease with and into a subsidiary of ARCP OP (the “CapLease Merger”). ARCP consummated the CapLease Merger on November 5, 2013.
ARCP OP purchased a portfolio of 447 properties from an affiliate of GE Capital Corp. (“the GE Capital Portfolio”) which closed on June 27, 2013.
The unaudited pro forma consolidated balance sheet and consolidated statement of operations do not include our expected property acquisitions or dispositions, Cole Capital operating performance or interest savings from extinguishment of debt in the second half of 2014.
The unaudited pro forma consolidated financial statements should be read in conjunction with ARCP OP’s historical financial statements and notes thereto for the year ended December 31, 2013 and three and six months ended June 30, 2014 included in this prospectus. The unaudited pro forma financial statements are not necessarily indicative of the results of operations or financial position that would have been reported had the above transactions occurred at the beginning of the period presented or as of June 30, 2014.
55
Table of Contents
ARC Properties Operating Partnership, L.P.
Unaudited Pro Forma Consolidated Balance Sheet
June 30, 2014
(In thousands)
| ARCP OP Historical(1) |
Red Lobster Portfolio(2) |
Multi- Tenant Portfolio(3) |
ARCP OP Pro Forma |
|||||||||||||
| Assets |
||||||||||||||||
| Real estate investments, at cost: |
||||||||||||||||
| Land |
$ | 3,361,195 | $ | 298,239 | (4) | $ | (432,892 | )(7) | $ | 3,226,542 | ||||||
| Buildings, fixtures and improvements |
12,445,972 | 1,291,386 | (4) | (1,417,944 | )(7) | 12,319,414 | ||||||||||
| Land and construction in progress |
62,594 | — | (3,647 | )(7) | 58,947 | |||||||||||
| Acquired intangible lease assets |
2,231,675 | — | (292,807 | )(7) | 1,938,868 | |||||||||||
|
|
|
|
|
|
|
|
|
|||||||||
| Total real estate investments, at cost |
18,101,436 | 1,589,625 | (2,147,290 | ) | 17,543,771 | |||||||||||
| Less: accumulated depreciation and amortization |
(661,005 | ) | — | 49,224 | (7) | (611,781 | ) | |||||||||
|
|
|
|
|
|
|
|
|
|||||||||
| Total real estate investments, net |
17,440,431 | 1,589,625 | (2,098,066 | ) | 16,931,990 | |||||||||||
| Investments in unconsolidated entities |
102,047 | — | — | 102,047 | ||||||||||||
| Investment in direct financing leases, net |
62,094 | — | — | 62,094 | ||||||||||||
| Investment securities, at fair value |
219,204 | — | — | 219,204 | ||||||||||||
| Loans held for investment, net |
97,587 | — | — | 97,587 | ||||||||||||
| Cash and cash equivalents |
193,690 | — | (2,470 | )(7) | 191,220 | |||||||||||
| Restricted cash |
69,544 | — | (4,022 | )(7) | 65,522 | |||||||||||
| Intangible assets, net |
347,618 | — | — | 347,618 | ||||||||||||
| Deferred costs and other assets, net |
405,056 | — | (17,258 | )(7) | 387,798 | |||||||||||
| Goodwill |
2,304,880 | — | (207,446 | )(8) | 2,097,434 | |||||||||||
| Due from affiliates |
73,336 | — | — | 73,336 | ||||||||||||
|
|
|
|
|
|
|
|
|
|||||||||
| Total assets |
$ | 21,315,487 | $ | 1,589,625 | $ | (2,329,262 | ) | $ | 20,575,850 | |||||||
|
|
|
|
|
|
|
|
|
|||||||||
| Liabilities and Equity |
||||||||||||||||
| Mortgage notes payable, net |
$ | 4,227,494 | $ | — | $ | (569,034 | )(7) | $ | 3,658,460 | |||||||
| Corporate bonds, net |
2,546,089 | — | — | 2,546,089 | ||||||||||||
| Convertible debt due to General Partner, net |
975,003 | — | — | 975,003 | ||||||||||||
| Credit facilities |
1,896,000 | 1,600,425 | (5) | (1,408,046 | )(9) | 2,088,379 | ||||||||||
| Other debt, net |
146,158 | — | — | 146,158 | ||||||||||||
| Below-market lease liabilities, net |
283,518 | — | (56,506 | )(7) | 227,012 | |||||||||||
| Accounts payable and accrued expenses |
154,741 | — | (13,614 | )(7) | 141,127 | |||||||||||
| Deferred rent, derivatives and other liabilities |
218,023 | — | (13,035 | )(7) | 204,988 | |||||||||||
| Distributions payable |
3,837 | — | — | 3,837 | ||||||||||||
| Due to affiliates |
835 | — | (9 | )(7) | 826 | |||||||||||
|
|
|
|
|
|
|
|
|
|||||||||
| Total liabilities |
10,451,698 | 1,600,425 | (2,060,244 | ) | 9,991,879 | |||||||||||
|
|
|
|
|
|
|
|
|
|||||||||
| Series D preferred units |
269,299 | — | — | 269,299 | ||||||||||||
|
|
|
|
|
|
|
|
|
|||||||||
| General Partner’s common equity |
9,918,549 | (10,499 | )(6) | (268,201 | )(10) | 9,639,849 | ||||||||||
| General Partner’s preferred equity |
367,514 | — | — | 367,514 | ||||||||||||
| Limited Partners’ common equity |
269,634 | (301 | )(6) | — | 269,333 | |||||||||||
| Limited Partners’ preferred equity |
3,435 | — | — | 3,435 | ||||||||||||
| Accumulated other comprehensive income |
12,392 | — | — | 12,392 | ||||||||||||
|
|
|
|
|
|
|
|
|
|||||||||
| Total partners’ equity |
10,571,524 | (10,800 | ) | (268,201 | ) | 10,292,523 | ||||||||||
| Non-controlling interests |
22,966 | — | (817 | )(7) | 22,149 | |||||||||||
|
|
|
|
|
|
|
|
|
|||||||||
| Total equity |
10,594,490 | (10,800 | ) | (269,018 | ) | 10,314,672 | ||||||||||
|
|
|
|
|
|
|
|
|
|||||||||
| Total liabilities, temporary equity and equity |
$ | 21,315,487 | $ | 1,589,625 | $ | (2,329,262 | ) | $ | 20,575,850 | |||||||
|
|
|
|
|
|
|
|
|
|||||||||
56
Table of Contents
ARC Properties Operating Partnership, L.P.
Notes to Unaudited Pro Forma Consolidated Balance Sheet
| (1) | Reflects the historical Consolidated Balance Sheet of ARC Properties Operating Partnership, L.P. (“ARCP OP”) as of June 30, 2014 as presented within this prospectus. |
| (2) | Adjustments reflect the pro forma impact of assets acquired in the acquisition of the Red Lobster Portfolio and to record the cash considerations of $1.6 billion to be paid to the third party seller of the portfolio and the estimated closing costs of $10.8 million. These amounts are expected to be funded through borrowings on ARCP OP’s existing credit facility, which are further described in note 5. |
| (3) | Adjustments reflect the pro forma impact of the sale of the Multi-Tenant Portfolio as if the sale had occurred on June 30, 2014. |
| (4) | ARCP OP allocates the purchase price of acquired properties to tangible and identifiable intangible assets acquired based on their respective fair values. Tangible assets include land, land improvements, buildings, fixtures and tenant improvements on an as-if vacant basis. ARCP OP utilizes various estimates, processes and information to determine the as-if vacant property value. Estimates of value are made using customary methods, including data from appraisals, comparable sales, discounted cash flow analysis and other methods. Amounts allocated to land, land improvements, buildings, fixtures, and tenant improvements are based on cost segregation studies performed by independent third-parties or ARCP OP’s analysis of comparable properties in its portfolio. Identifiable intangible assets include amounts allocated to acquire leases for above- and below-market lease rates and the value of in-place leases. Depreciation is computed using the straight-line method over the estimated lives of 40 years for buildings, 15 years for land improvements, five years for fixtures and the shorter of the useful life or the remaining lease term for tenant improvements. |
The aggregate value of intangible assets related to in-place leases is primarily the difference between the property valued with existing in-place leases adjusted to market rental rates and the property valued as-if vacant. Factors considered in the analysis of the in-place lease intangibles include an estimate of carrying costs during the expected lease-up period for each property, taking into account current market conditions and costs to execute similar leases. In estimating carrying costs, ARCP OP includes real estate taxes, insurance and other operating expenses and estimates of lost rentals at market rates during the expected lease-up period, which is estimated to be nine months. Estimates of costs to execute similar leases including leasing commissions, legal and other related expenses are also utilized. The value of in-place leases is amortized to expense over the initial term of the respective lease, which generally ranges from two to 25 years. If a tenant terminates its lease, the unamortized portion of the in-place lease value and intangible is charged to expense.
Above-market and below-market in-place lease values, if any, are recorded based on the present value (using an interest rate which reflects the risks associated with the leases acquired) of the difference between the contractual amounts to be paid pursuant to the in-place leases and management’s estimate of fair market lease rates for the corresponding in-place leases, measured over a period equal to the remaining non-cancellable term of the lease. The capitalized above-market lease intangibles are amortized as a decrease to rental income over the remaining term of the lease. The capitalized below-market lease values will be amortized as an increase to rental income over the remaining term and any fixed rate renewal periods provided within the respective leases. In determining the amortization period for below-market lease intangibles, ARCP OP initially will consider, and periodically evaluate on a quarterly basis, the likelihood that a lessee will execute the renewal option. The likelihood that a lessee will execute the renewal option is determined by taking into consideration the tenant’s payment history, the financial condition of the tenant, business conditions in the industry in which the tenant operates and economic conditions in the area in which the property is located.
In making estimates of fair values for purposes of allocating purchase price, ARCP OP utilizes a number of sources, including independent appraisals that may be obtained in connection with the acquisition or
57
Table of Contents
financing of the respective property and other market data. ARCP OP also considers information obtained about each property as a result of pre-acquisition due diligence, as well as subsequent marketing and leasing activities, in estimating the fair value of the tangible and intangible assets acquired and intangible liabilities assumed. The allocations presented in the accompanying Pro Forma Consolidated Balance Sheet are in progress. Certain items will be finalized once additional information is received. Accordingly, these allocations are subject to revision when final information is available, although ARCP OP does not expect future revisions to have a significant impact on its financial position or results of operations.
| (5) | Reflects additional borrowings on ARCP OP’s existing unsecured line of credit at an estimated annualized rate of 1.6% to fund the acquisition of the Red Lobster Portfolio and the estimated closing costs associated with the purchase. ARCP OP has commitments on its unsecured credit facility (including revolving and term loans) for total borrowings of $4.6 billion as of June 30, 2014, with an accordion feature of up to $6.0 billion, subject to borrowing base availability among other conditions. |
| (6) | Reflects the estimated impact to partners’ equity of costs related to the purchase of the Red Lobster Portfolio including title transfer fees, appraisal fees and legal services fees. These fees are estimated based in part on contractual arrangements and in part on estimates derived from similar acquisitions that ARCP OP has completed. The closing costs have been allocated to the General Partner and Limited Partners based on the percentage ownership as of June 30, 2014. |
| (7) | Adjustment reflects the removal of the real estate investments and other assets, such as cash and deferred costs, and the mortgage debt and other liabilities, such as accounts payable and deferred rent, associated with the 76 properties included in the Multi-Tenant Portfolio. |
| (8) | Reflects the allocation, which was estimated from the percentage of ARCP OP’s real estate investments attributable to the Multi-Tenant Portfolio, of goodwill attributed to ARCP OP’s real estate segment which will be written off upon the sale of the Multi-Tenant Portfolio. |
| (9) | Reflects the anticipated cash proceeds from the sale of ARCP OP’s Multi-Tenant Portfolio after accounting for mortgage indebtedness that will be assumed by the buyer. On a pro forma basis, the proceeds will be used to paydown ARCP OP’s existing credit facility. |
| (10) | Reflects the excess of the carrying value, as of June 30, 2014, of the assets associated with the Multi-Tenant Portfolio, net of liabilities, over the expected proceeds from the sale of the Multi-Tenant Portfolio. |
58
Table of Contents
ARC Properties Operating Partnership, L.P.
Unaudited Pro Forma Consolidated Statement of Operations
Six-Months Ended June 30, 2014
(In thousands, except per unit data)
| ARCP OP Historical(1) |
Pro Forma Adjustments(2) |
ARCP OP as Adjusted |
Red Lobster Portfolio(3) |
Multi-Tenant Portfolio(4) |
ARCP OP Pro Forma |
|||||||||||||||||||
| Revenues: |
||||||||||||||||||||||||
| Rental income |
$ | 559,288 | $ | 97,933 | (5) | $ | 657,221 | $ | 78,792 | (5) | $ | (76,145 | )(5) | $ | 659,868 | |||||||||
| Direct financing lease income |
2,187 | — | 2,187 | — | — | 2,187 | ||||||||||||||||||
| Operating expense reimbursements |
49,641 | 8,692 | (6) | 58,333 | — | (15,547 | )(11) | 42,786 | ||||||||||||||||
| Cole Capital revenue |
91,479 | 27,034 | (7) | 118,513 | — | — | 118,513 | |||||||||||||||||
|
|
|
|
|
|
|
|
|
|
|
|
|
|||||||||||||
| Total revenues |
702,595 | 133,659 | 836,254 | 78,792 | (91,692 | ) | 823,354 | |||||||||||||||||
|
|
|
|
|
|
|
|
|
|
|
|
|
|||||||||||||
| Operating expenses: |
||||||||||||||||||||||||
| Acquisition related |
20,337 | (20,337 | )(8) | — | — | — | — | |||||||||||||||||
| Merger and other transaction related |
235,478 | (235,478 | )(8) | — | — | — | — | |||||||||||||||||
| Reallowed fees and commissions |
41,504 | 17,218 | (7) | 58,722 | — | — | 58,722 | |||||||||||||||||
| Property operating |
69,030 | 12,087 | (6) | 81,117 | — | (23,850 | )(11) | 57,267 | ||||||||||||||||
| General and administrative |
44,748 | 9,545 | (7) | 54,293 | — | — | 54,293 | |||||||||||||||||
| Equity-based compensation |
31,848 | — | 31,848 | — | — | 31,848 | ||||||||||||||||||
| Depreciation and amortization |
424,356 | 45,459 | (9) | 469,815 | 20,053 | (9) | (50,336 | )(9) | 439,532 | |||||||||||||||
|
|
|
|
|
|
|
|
|
|
|
|
|
|||||||||||||
| Total operating expenses |
867,301 | (171,506 | ) | 695,795 | 20,053 | (74,186 | ) | 641,662 | ||||||||||||||||
|
|
|
|
|
|
|
|
|
|
|
|
|
|||||||||||||
| Operating (loss) income |
(164,706 | ) | 305,165 | 140,459 | 58,739 | (17,506 | ) | 181,692 | ||||||||||||||||
|
|
|
|
|
|
|
|
|
|
|
|
|
|||||||||||||
| Other (expenses) income: |
||||||||||||||||||||||||
| Interest expense, net |
(216,347 | ) | 34,956 | (10) | (181,391 | ) | (12,803 | )(12) | 25,328 | (12) | (168,866 | ) | ||||||||||||
| Other income, net |
10,915 | — | 10,915 | — | — | 10,915 | ||||||||||||||||||
| Gain on disposition of properties |
4,489 | — | 4,489 | — | — | 4,489 | ||||||||||||||||||
| Gain on derivative instruments, net |
1,729 | — | 1,729 | — | — | 1,729 | ||||||||||||||||||
|
|
|
|
|
|
|
|
|
|
|
|
|
|||||||||||||
| Total other (expenses) income, net |
(199,214 | ) | 34,956 | (164,258 | ) | (12,803 | ) | 25,328 | (151,733 | ) | ||||||||||||||
|
|
|
|
|
|
|
|
|
|
|
|
|
|||||||||||||
| (Loss) income from continuing operations |
(363,920 | ) | 340,121 | (23,799 | ) | 45,936 | 7,822 | 29,959 | ||||||||||||||||
| Net loss attributable to non-controlling interests |
(80 | ) | — | (80 | ) | — | — | (80 | ) | |||||||||||||||
|
|
|
|
|
|
|
|
|
|
|
|
|
|||||||||||||
| Net (loss) income attributable unitholders |
(364,000 | ) | 340,121 | (23,879 | ) | 45,936 | 7,822 | 29,879 | ||||||||||||||||
| Less: Dividends allocable to preferred units |
44,443 | — | 44,443 | — | — | 44,443 | ||||||||||||||||||
| Less: Dividends allocable to participating securities |
2,280 | — | 2,280 | — | — | 2,280 | ||||||||||||||||||
|
|
|
|
|
|
|
|
|
|
|
|
|
|||||||||||||
| Net (loss) income attributable to common unitholders |
$ | (410,723 | ) | $ | 340,121 | $ | (70,602 | ) | $ | 45,936 | $ | 7,822 | $ | (16,844 | ) | |||||||||
|
|
|
|
|
|
|
|
|
|
|
|
|
|||||||||||||
59
Table of Contents
ARC Properties Operating Partnership, L.P.
Notes to Unaudited Pro Forma Consolidated Statement of Operations for the six months ended June 30, 2014
| (1) | Reflects the historical Consolidated Statement of Operations of ARCP OP for the six months ended June 30, 2014, as presented within this prospectus. |
| (2) | Adjustments reflect the annualization of (i) certain lease rental income, lease asset depreciation and amortization and interest expense on additional financing used for property acquisitions made during the six months ended June 30, 2014 and (ii) the revenue and expenses derived from the assets acquired and liabilities assumed from and the interest expensed on the additional financing used for the Cole Merger as if they were acquired at the beginning of the period presented. Additionally, adjustment reflects the impact of the use of proceeds and units issued from the Equity Offering as if the offering had occurred on January 1, 2014. |
| (3) | Reflects the pro forma operations of the Red Lobster Portfolio for the six months ended June 30, 2014 as if the portfolio was acquired on January 1, 2014. |
| (4) | Adjustments reflect the pro forma impact of the sale of the Multi-Tenant Portfolio to record the sale as if it had occurred on January 1, 2014. |
| (5) | Reflects an adjustment to (i) recognize the full six months of rental income for the properties acquired during the six months ended June 30, 2014; (ii) record rental income of the Red Lobster Portfolio and (iii) eliminate the pro forma rental income of the Multi-Tenant Portfolio as if the transactions had occurred as of the beginning of the period presented. |
| (6) | Reflects an adjustment to recognize the full six months of operating expense reimbursements and property operating expenses for the properties acquired during the six months ended June 30, 2014. |
| (7) | Reflects an adjustment for the annualization of Cole Capital revenue, reallowed fees and commissions and Cole Capital-related general and administrative expenses as if the Cole Merger had occurred on January 1, 2014. |
| (8) | Adjustment reflects the elimination of (i) costs recorded for the acquisition of properties and (ii) merger and other transaction related costs incurred during the six months ended June 30, 2014, as these costs are not ongoing costs of ARCP OP and are specifically related to the transactions presented in these pro forma financial statements. |
| (9) | Reflects adjustments to (i) recognize depreciation and amortization expense for the properties acquired during the six months ended June 30, 2014 based on the estimated fair values assigned to each asset class; (ii) record depreciation and amortization expense of the Red Lobster Portfolio based on the estimated fair values assigned to each asset class and (iii) eliminate the pro forma depreciation and amortization expense of the Multi-Tenant Portfolio as if the respective transactions had occurred as of the beginning of the period presented. |
| (10) | Adjustment reflects (i) the interest expense, including the amortization of deferred financing costs and debt premiums and discounts, that would have been recorded had the issuances and assumptions of mortgage notes, corporate bonds and other long-term debt had occurred at the beginning of the period presented; (ii) the interest expense that would have been recorded if the draws and repayments of the credit facility had occurred at the beginning of the period presented; (iii) the reduction of interest expense that would have resulted if the defeasance of $854.5 million of mortgage notes had occurred at the beginning of the period presented; (iv) the elimination of one-time charges and write-offs associated with such defeasances and (v) the interest income from investment securities and loans held for investments that would have been recorded had they been acquired at the beginning of the period presented. The interest rate on ARCP OP’s existing senior credit facility is partially dependent on its credit rating. For every one-eighth of a percent change in interest rates on our existing credit facility, interest expense would increase or decrease by $2.7 million annually. |
60
Table of Contents
| (11) | Reflects the elimination of property operating expenses and reimbursements incurred during the six months ended June 30, 2014 that were attributed to the Multi-Tenant Portfolio. |
| (12) | Adjustments reflect interest expense or savings on ARCP OP’s existing senior credit facility for the (i) borrowing of $1.6 billion to fund the purchase of the Red Lobster Portfolio and (ii) repayment of $1.4 billion from the proceeds of the Multi-Tenant Portfolio at an assumed annual interest rate as described above. The adjustment to interest expense also reflects a reduction in interest expense for any mortgage notes assumed by a third-party in the sale of the Multi-Tenant Portfolio and the elimination of any deferred financing costs associated with those mortgages. |
| (13) | The diluted earnings per unit excludes units that would be antidilutive. |
| (14) | Weighted average units include the pro forma effect of (i) the units issued in connection with the Cole Merger and (ii) the Equity Offering as if they occurred at the beginning of the year presented. |
61
Table of Contents
ARC Properties Operating Partnership, L.P.
Unaudited Pro Forma Consolidated Statement of Operations
Year Ended December 31, 2013
(In thousands, except per unit data)
| ARCP OP Historical(1) |
Pro Forma Adjustments(2) |
ARCP OP as Adjusted |
Fortress Portfolio(3) |
Inland Portfolio(4) |
ARCP OP as Adjusted with Fortress and Inland Pro Forma |
Cole Historical(5) |
Cole Merger Related Adjustments(6) |
ARCP OP as Adjusted with Fortress, Inland and Cole Pro Forma |
Red Lobster Portfolio(7) |
Multi-Tenant Portfolio(8) |
Equity Offering(9) |
ARCP OP Pro Forma |
||||||||||||||||||||||||||||||||||||||||
| Revenues: |
||||||||||||||||||||||||||||||||||||||||||||||||||||
| Rental income |
$ | 309,839 | $ | 236,972 | (10) | $ | 546,811 | $ | 30,215 | (10) | $ | 22,905 | (10) | $ | 599,931 | $ | 565,337 | $ | 56,779 | (10) | $ | 1,222,047 | $ | 157,583 | (10) | $ | (152,290 | )(10) | $ | — | $ | 1,227,340 | ||||||||||||||||||||
| Direct financing lease income |
2,244 | 3,276 | (10) | 5,520 | — | — | 5,520 | — | — | 5,520 | — | — | — | 5,520 | ||||||||||||||||||||||||||||||||||||||
| Operating expense reimbursements |
17,795 | — | 17,795 | — | 2,933 | 20,728 | 56,794 | — | 77,522 | — | (26,809 | )(11) | — | 50,713 | ||||||||||||||||||||||||||||||||||||||
| Cole Capital revenue |
— | — | — | — | — | — | 440,470 | 146,823 | (12) | 587,293 | — | — | — | 587,293 | ||||||||||||||||||||||||||||||||||||||
| Other revenues |
— | — | — | — | 144 | 144 | 30,253 | — | 30,397 | — | — | — | 30,397 | |||||||||||||||||||||||||||||||||||||||
|
|
|
|
|
|
|
|
|
|
|
|
|
|
|
|
|
|
|
|
|
|
|
|
|
|
|
|||||||||||||||||||||||||||
| Total revenues |
329,878 | 240,248 | 570,126 | 30,215 | 25,982 | 626,323 | 1,092,854 | 203,602 | 1,922,779 | 157,583 | (179,099 | ) | — | 1,901,263 | ||||||||||||||||||||||||||||||||||||||
| Operating expenses: |
||||||||||||||||||||||||||||||||||||||||||||||||||||
| Acquisition related |
76,136 | (76,136 | )(13) | — | — | — | — | 4,655 | (4,655 | )(13) | — | — | — | — | — | |||||||||||||||||||||||||||||||||||||
| Merger and other transaction related |
278,319 | (278,319 | )(13) | — | — | — | — | 106,858 | (106,858 | )(13) | — | — | — | — | — | |||||||||||||||||||||||||||||||||||||
| Reallowed fees and commissions |
— | — | — | — | — | — | 254,413 | 84,804 | (12) | 339,217 | — | — | — | 339,217 | ||||||||||||||||||||||||||||||||||||||
| Property operating |
23,616 | — | 23,616 | — | 3,700 | 27,316 | 67,473 | — | 94,789 | — | (34,827 | )(11) | — | 59,962 | ||||||||||||||||||||||||||||||||||||||
| General and administrative |
10,645 | — | 10,645 | — | — | 10,645 | 148,772 | 36,148 | (12) | 195,565 | — | — | — | 195,565 | ||||||||||||||||||||||||||||||||||||||
| Equity-based compensation |
34,962 | — | 34,962 | — | — | 34,962 | 36,792 | (36,792 | )(14) | 34,962 | — | — | — | 34,962 | ||||||||||||||||||||||||||||||||||||||
| Depreciation and amortization |
211,372 | 37,210 | (15) | 248,582 | 17,292 | (15) | 12,888 | (15) | 278,762 | 211,868 | 105,783 | (15) | 596,413 | 40,105 | (15) | (100,672 | )(15) | — | 535,846 | |||||||||||||||||||||||||||||||||
| Operating fees to affiliates |
5,654 | 27,149 | (16) | 32,803 | 1,620 | (16) | 1,028 | (16) | 35,451 | 15,334 | 20,334 | (16) | 71,119 | 6,359 | (16) | (8,589 | )(16) | — | 68,889 | |||||||||||||||||||||||||||||||||
|
|
|
|
|
|
|
|
|
|
|
|
|
|
|
|
|
|
|
|
|
|
|
|
|
|
|
|||||||||||||||||||||||||||
| Total operating expenses |
640,704 | (290,096 | ) | 350,608 | 18,912 | 17,616 | 387,136 | 846,165 | 98,764 | 1,332,065 | 46,464 | (144,088 | ) | — | 1,234,441 | |||||||||||||||||||||||||||||||||||||
|
|
|
|
|
|
|
|
|
|
|
|
|
|
|
|
|
|
|
|
|
|
|
|
|
|
|
|||||||||||||||||||||||||||
| Operating income (loss) |
(310,826 | ) | 530,344 | 219,518 | 11,303 | 8,366 | 239,187 | 246,689 | 104,838 | 590,714 | 111,119 | (35,011 | ) | — | 666,822 | |||||||||||||||||||||||||||||||||||||
|
|
|
|
|
|
|
|
|
|
|
|
|
|
|
|
|
|
|
|
|
|
|
|
|
|
|
|||||||||||||||||||||||||||
62
Table of Contents
| ARCP OP Historical(1) |
Pro Forma Adjustments(2) |
ARCP OP as Adjusted |
Fortress Portfolio(3) |
Inland Portfolio(4) |
ARCP OP as Adjusted with Fortress and Inland Pro Forma |
Cole Historical(5) |
Cole Merger Related Adjustments(6) |
ARCP OP as Adjusted with Fortress, Inland and Cole Pro Forma |
Red Lobster Portfolio(7) |
Multi-Tenant Portfolio(8) |
Equity Offering(9) |
ARCP OP Pro Forma |
||||||||||||||||||||||||||||||||||||||||
| Other (expenses) income: |
||||||||||||||||||||||||||||||||||||||||||||||||||||
| Interest expense, net |
(102,305 | ) | (99,674 | )(17) | (201,979 | ) | (16,370 | )(17) | (13,390 | )(17) | (231,739 | ) | (167,143 | ) | 51 | (17) | (398,831 | ) | (25,607 | )(18) | 50,656 | (18) | 25,440 | (18) | (348,342 | ) | ||||||||||||||||||||||||||
| Other income, net |
2,847 | — | 2,847 | — | — | 2,847 | (13,145 | ) | — | (10,298 | ) | — | — | — | (10,298 | ) | ||||||||||||||||||||||||||||||||||||
| Income from investment securities |
— | — | — | — | — | — | — | — | — | — | — | — | — | |||||||||||||||||||||||||||||||||||||||
| Loss on derivative instruments, net |
(67,946 | ) | — | (67,946 | ) | — | — | (67,946 | ) | (1,174 | ) | — | (69,120 | ) | — | — | — | (69,120 | ) | |||||||||||||||||||||||||||||||||
| Loss on sale of investments in affiliates |
(411 | ) | — | (411 | ) | — | — | (411 | ) | — | — | (411 | ) | — | — | — | (411 | ) | ||||||||||||||||||||||||||||||||||
| Loss on sale of investments |
(1,795 | ) | — | (1,795 | ) | — | — | (1,795 | ) | (1,331 | ) | — | (3,126 | ) | — | — | — | (3,126 | ) | |||||||||||||||||||||||||||||||||
|
|
|
|
|
|
|
|
|
|
|
|
|
|
|
|
|
|
|
|
|
|
|
|
|
|
|
|||||||||||||||||||||||||||
| Total other expenses, net |
(169,610 | ) | (99,674 | ) | (269,284 | ) | (16,370 | ) | (13,390 | ) | (299,044 | ) | (182,793 | ) | 51 | (481,786 | ) | (25,607 | ) | 50,656 | 25,440 | (431,297 | ) | |||||||||||||||||||||||||||||
|
|
|
|
|
|
|
|
|
|
|
|
|
|
|
|
|
|
|
|
|
|
|
|
|
|
|
|||||||||||||||||||||||||||
| (Loss) income from continuing operations |
(480,436 | ) | 430,670 | (49,766 | ) | (5,067 | ) | (5,024 | ) | (59,857 | ) | 63,896 | 104,889 | 108,928 | 85,512 | 15,645 | 25,440 | 235,525 | ||||||||||||||||||||||||||||||||||
| Discontinued operations: |
||||||||||||||||||||||||||||||||||||||||||||||||||||
| (Loss) income from operations of held for sale properties |
(34 | ) | — | (34 | ) | — | — | (34 | ) | 4,882 | — | 4,848 | — | — | — | 4,848 | ||||||||||||||||||||||||||||||||||||
| Gain on held for sale properties |
14 | — | 14 | — | — | 14 | 55,027 | — | 55,041 | — | — | — | 55,041 | |||||||||||||||||||||||||||||||||||||||
|
|
|
|
|
|
|
|
|
|
|
|
|
|
|
|
|
|
|
|
|
|
|
|
|
|
|
|||||||||||||||||||||||||||
| Net (loss) income from discontinued operations |
(20 | ) | — | (20 | ) | — | — | (20 | ) | 59,909 | — | 59,889 | — | — | — | 59,889 | ||||||||||||||||||||||||||||||||||||
| Net (loss) income attributable to unitholders |
(480,456 | ) | 430,670 | (49,786 | ) | (5,067 | ) | (5,024 | ) | (59,877 | ) | 123,805 | 104,889 | 168,817 | 85,512 | 15,645 | 25,440 | 295,414 | ||||||||||||||||||||||||||||||||||
| Dividends allocable to preferred units |
— | (89,055 | )(19) | (89,055 | ) | — | — | (89,055 | ) | — | — | (89,055 | ) | — | — | — | (89,055 | ) | ||||||||||||||||||||||||||||||||||
|
|
|
|
|
|
|
|
|
|
|
|
|
|
|
|
|
|
|
|
|
|
|
|
|
|
|
|||||||||||||||||||||||||||
| Net (loss) income attributable to common unitholders |
$ | (480,456 | ) | $ | 341,615 | $ | (138,841 | ) | $ | (5,067 | ) | $ | (5,024 | ) | $ | (148,932 | ) | $ | 123,805 | $ | 104,889 | $ | 79,762 | $ | 85,512 | $ | 15,645 | $ | 25,440 | $ | 206,359 | |||||||||||||||||||||
|
|
|
|
|
|
|
|
|
|
|
|
|
|
|
|
|
|
|
|
|
|
|
|
|
|
|
|||||||||||||||||||||||||||
63
Table of Contents
ARC Properties Operating Partnership, L.P.
Notes to Unaudited Pro Forma Consolidated Statement of Operations for the year ended December 31, 2013
| (1) | Reflects the historical Consolidated Statement of Operations of ARCP OP for the year ended December 31, 2013, as presented within this prospectus. |
| (2) | Adjustments reflect the annualization of certain lease rental income, lease asset depreciation and amortization and interest expense on additional financing used for property acquisitions made in 2013 as if they were made at the beginning of the fiscal year presented and carried through the period presented. |
| (3) | Reflects the unaudited pro forma unaudited Consolidated Statement of Operations of the Fortress Portfolio for the year ended December 31, 2013. Adjustments reflect the annualization of certain Fortress Portfolio lease rental income, depreciation and amortization and interest expense on financing arrangements as if the properties had been acquired as of the beginning of the fiscal year presented and carried through the period presented. |
| (4) | Reflects the unaudited pro forma unaudited Consolidated Statement of Operations of the Inland Portfolio for the year ended December 31, 2013. Adjustments reflect the annualization of certain Inland Portfolio lease rental income, depreciation and amortization and interest expense on financing arrangements as if the properties had been acquired as of the beginning of the fiscal year presented and carried through the period presented. |
| (5) | Reflects the historical Consolidated Statement of Operations of Cole for the year ended December 31, 2013, as presented in ARCP’s Form 8-K/A filed with the SEC on March 14, 2014. Certain balances reported in Cole’s financial statements have been reclassified to conform to ARCP OP’s presentation. |
| (6) | Adjustments and pro forma balances reflect adjustments related to the acquisition of Cole by ARCP OP. Excludes closing costs of $163.4 million incurred for the Cole Merger, including professional fees for investment banking, legal services and accounting and printing fees. |
| (7) | Reflects the pro forma operations of the Red Lobster Portfolio for the year ended December 31, 2013 as if the portfolio was acquired on January 1, 2013. |
| (8) | Adjustments reflect the pro forma impact of the sale of the Multi-Tenant Portfolio to record the sale as if it had occurred on January 1, 2013. |
| (9) | Adjustments reflect the pro forma impact of the use of proceeds from the Equity Offering as if the offering and concurrent use of proceeds had occurred on January 1, 2013. |
| (10) | Reflects an adjustment to (i) recognize a full year of rental income and direct financing lease income for the properties and portfolios acquired and the mergers consummated during the year ended December 31, 2013; (ii) record rental income of the Red Lobster Portfolio and (iii) eliminate the pro forma rental income of the Multi-Tenant Portfolio as if the transactions had occurred as of the beginning of the period presented. |
| (11) | Reflects the elimination of pro forma property operating expenses and reimbursements incurred during the year ended December 31, 2013 that were attributed to the Multi-Tenant Portfolio. |
| (12) | Reflects an adjustment for the annualization of Cole Capital revenue, reallowed fees and commissions and Cole Capital-related general and administrative expense to reflect the business as if it was acquired on January 1, 2014. |
| (13) | Adjustment reflects the elimination of (i) costs recorded for the acquisition of properties and (ii) merger and other transaction related costs incurred during the year ended December 31, 2013, as these costs are not ongoing costs of ARCP OP and are specifically related to the transactions presented in these pro forma financial statements. |
| (14) | Adjustment represents the elimination of the equity-based compensation for Cole’s equity compensation plan for outstanding restricted units. As part of the Cole Merger agreement, all unamortized restricted units became fully vested and therefore this expense will no longer be recognized. |
64
Table of Contents
| (15) | Adjustments to (i) recognize depreciation and amortization expense for the properties and portfolios acquired during the year ended December 31, 2013 based on the estimated fair values assigned to each asset class; (ii) record depreciation and amortization expense of the Red Lobster Portfolio based on the estimated fair values assigned to each asset class and (iii) eliminate the pro forma depreciation and amortization expense of the Multi-Tenant Portfolio as if the respective transactions had occurred as of the beginning of the period presented. |
| (16) | Adjustment reflects recognition of full contractual asset management fees due to ARCP OP’s former affiliated external manager, as if ARCP OP had owned the properties and the external manager had charged these fees for the entirety of 2013. Fees were 0.50% annually for average unadjusted book value of real estate assets up to $3.0 billion and 0.40% annually for assets in excess of $3.0 billion. ARCP OP terminated this arrangement on January 8, 2014. |
| (17) | Adjustment reflects (i) the interest expense, including the amortization of deferred financing costs and debt premiums and discounts, that would have been recorded had the issuances and assumptions of mortgage notes, corporate bonds and other long-term debt had occurred at the beginning of the period presented; (ii) the interest expense that would have been recorded if the draws and repayments of the credit facility had occurred at the beginning of the period presented and (iii) the interest income from investment securities and loans held for investments that would have been recorded had they been acquired at the beginning of the period presented. In the case of Cole, the increase in interest expense is offset by the reduction in interest expense for the write-off of deferred financing costs of $10.1 million. |
| (18) | Adjustments reflect interest expense or savings on ARCP OP’s existing senior credit facility for the (i) borrowing of $1.6 billion to fund the purchase of the Red Lobster Portfolio; (ii) repayment of $1.4 billion from the proceeds of the Multi-Tenant Portfolio and (iii) repayment of $1.6 billion from the net proceeds of the Equity Offering transaction at an assumed annual interest rate as described above. The adjustment to interest expense also reflects a reduction in interest expense for any mortgage notes assumed by a third-party in the sale of the Multi-Tenant Portfolio and the elimination of any deferred financing costs associated with those mortgages. |
| (19) | Adjustment reflects the dividend expense allocable to the preferred unitholders of the Series D Preferred units and Series F Preferred units as if the preferred units were outstanding for the entire period. |
| (20) | When applicable, the diluted earnings per unit excludes units that would be antidilutive. |
| (21) | Weighted average units include the pro forma effect of certain transactions, including (i) the issues of units via private placements; (ii) the units issued in the Cole Merger and (iii) the Equity Offering, as if they occurred at the beginning of the year presented. |
65
Table of Contents
ARC Properties Operating Partnership, L.P.
EBITDA and Adjusted EBITDA
(In thousands)
EBITDA and Adjusted EBITDA are non-GAAP financial measures we use as performance measures for benchmarking against our peers and as internal measures of business operating performance. We believe EBITDA and Adjusted EBITDA provide a meaningful perspective of the underlying operating performance of our current business. This is especially true since these measures exclude real estate depreciation and we believe that real estate values fluctuate based on market conditions rather than depreciating in value ratably on a straight-line basis over time.
We define EBITDA as net income from continuing operations before interest, taxes, depreciation and amortization. We present EBITDA because we consider it a useful analytical tool for measuring our ability to service our debt and generate cash for other purposes. EBITDA is not a measurement of our financial performance under GAAP and should not be considered as an alternative to net income, operating income or any other performance measures derived in accordance with GAAP or as an alternative to cash flows from operating activities as a measure of our profitability or liquidity. We understand that although EBITDA is frequently used by securities analysts, lenders and others in their evaluation of companies, our calculation of EBITDA may not be comparable to other similarly titled measures of other companies. We define Adjusted EBITDA as earnings before interest, taxes, depreciation and amortization, adjusted to exclude fair value adjustments on derivatives, acquisition related expenses (which relate to purchases of properties), merger and other transaction related fees and expenses, equity-based compensation and other items. We present Adjusted EBITDA because we consider it a useful analytical tool for measuring our ability to service our debt and generate cash for other purposes and we believe it is more indicative of these measures than EBITDA. Adjusted EBITDA does not represent and should not be considered as an alternative to net income, operating income or any other performance measures derived in accordance with GAAP or as an alternative to cash flows from operating activities as a measure of our profitability or liquidity. Our calculations of Adjusted EBITDA are not comparable to similarly titled measures of other companies due to the nature of the adjustments.
ARC Properties Operating Partnership, L.P.
Unaudited Supplementary Information
(In thousands)
| Six Months Ended June 30, 2014 |
Year Ended December 31, 2013 |
|||||||||||||||
| ARCP OP Historical |
ARCP OP Pro Forma |
ARCP OP Historical |
ARCP OP Pro Forma |
|||||||||||||
| Loss from continuing operations |
$ | (363,920 | ) | $ | 29,959 | $ | (480,436 | ) | $ | 235,525 | ||||||
| Interest expense, net and income tax benefit |
201,666 | 154,185 | 102,305 | 348,342 | ||||||||||||
| Depreciation and amortization |
424,356 | 439,532 | 211,372 | 535,846 | ||||||||||||
|
|
|
|
|
|
|
|
|
|||||||||
| EBITDA |
262,102 | 623,676 | (166,759 | ) | 1,119,713 | |||||||||||
| (Gain) loss on derivative instruments, net |
(1,729 | ) | (1,729 | ) | 67,946 | 69,120 | ||||||||||
| Acquisition related expenses |
20,337 | — | 76,136 | — | ||||||||||||
| Merger and other transaction related expenses |
235,478 | — | 278,319 | — | ||||||||||||
| Equity-based compensation |
31,848 | 31,848 | 34,962 | 34,962 | ||||||||||||
| Other non-recurring losses |
(4,489 | ) | (4,489 | ) | — | — | ||||||||||
|
|
|
|
|
|
|
|
|
|||||||||
| Adjusted EBITDA |
$ | 543,547 | $ | 649,306 | $ | 290,604 | $ | 1,223,795 | ||||||||
|
|
|
|
|
|
|
|
|
|||||||||
66
Table of Contents
MANAGEMENT’S DISCUSSION AND ANALYSIS
OF FINANCIAL CONDITION AND RESULTS OF OPERATIONS
As used herein, “ARCP OP” means ARCP OP by itself and not including any of its subsidiaries; “ARCP” mean ARCP by itself and not including any of its subsidiaries; and the terms “we,” “our” and “us” or similar references mean ARCP and its consolidated subsidiaries, including, without limitation ARCP OP.
Overview
ARCP OP is an entity through which ARCP, a self-managed and self-administered REIT, and its sole general partner, conducts substantially all of its business. As of June 30, 2014, ARCP held approximately 97.3% of the common equity interests (“OP Units”) in ARCP OP. The actions of ARCP OP and its relationship with ARCP are governed by that certain Third Amended and Restated Agreement of Limited Partnership (the “LPA”), effective as of January 3, 2014. ARCP does not have any significant assets other than its investment in ARCP OP. Therefore, the assets and liabilities of ARCP and ARCP OP are substantially the same. Additionally, pursuant to the LPA, all administrative expenses and expenses associated with the formation and continuity of existence and operation of ARCP incurred by ARCP on ARCP OP’s behalf shall be treated as expenses of ARCP OP.
Under the LPA, after holding OP Units for a period of one year, a limited partner has the right to require ARCP OP to redeem OP Units for, at ARCP’s option, a certain number of shares of ARCP’s common stock, or the cash value of such number of shares of ARCP’s common stock. For each share, if any, of ARCP’s common stock issued by ARCP in the redemption, ARCP OP will issue a corresponding amount of OP Units to ARCP. The remaining rights of the limited partners are limited and do not include the ability to replace ARCP as general partner or to approve the sale, purchase or refinancing of ARCP OP’s assets.
Our business operates in two business segments, net lease real estate investment (“REI”) and private capital investment management (“Cole Capital”). Through our REI segment, we acquire, own and operate single-tenant, freestanding commercial real estate properties, primarily subject to net leases with high credit quality tenants. We focus on investing in properties that are net leased to credit tenants. Our long-term business strategy is to continue invest in net leased assets to further develop our diverse portfolio consisting of approximately 70% long-term leases and 30% medium-term leases, with an average remaining lease term of 10 to 12 years. We seek to acquire net lease assets granularly, by self-originating or purchasing such assets, or executing sale-leaseback transactions, small portfolio acquisitions and in connection with build-to-suit opportunities, to the extent they are appropriate in terms of capitalization rate and scale. We expect this investment strategy to provide for stable income from credit tenants and for growth opportunities from re-leasing of current below market leases. We entered into an agreement pursuant to which we will dispose of the multi-tenant assets comprising the portfolio we previously announced would be spun off into American Realty Capital Centers, Inc., as further described under “Prospectus Summary—Recent Developments—Disposition of Multi-Tenant Shopping Center Business.” We believe such disposition will bring enhanced focus to our core strategy of developing a strong portfolio of single-tenant net lease assets. We have advanced our investment objectives by growing our net lease portfolio through the self-origination of property acquisitions and strategic mergers and acquisitions. Our total asset base was approximately $22 billion as of June 30, 2014.
As a result of the Cole Merger (as defined below), in addition to operating a diverse portfolio of core commercial real estate investments, we, through Cole Capital Advisors, Inc. (“CCA”), are responsible for managing certain non-traded real estate investment trusts (the “Managed REITs”) on a day-to-day basis, identifying and making acquisitions and investments on the Managed REITs’ behalf and recommending to each of the Managed REITs’ respective board of directors an approach for providing investors with liquidity. We receive compensation and reimbursement for services relating to the Managed REITs’ offerings and investment, management, financing and disposition of their respective assets, as applicable. Cole Capital allows us to
67
Table of Contents
generate earnings without the corresponding need to invest capital in that business or incur debt in order to fund or expand operations. As of June 30, 2014, the Managed REITs’ total assets were approximately $6.6 billion. We own CCA through a wholly owned subsidiary of ARCP OP. We and CCA have jointly elected to treat CCA as a taxable REIT subsidiary (“TRS”) for U.S. federal income tax purposes. In order to avoid a potential adverse impact on ARCP’s status as a REIT, we conduct substantially all of our investment management business through the TRS.
During the year ended December 31, 2013, we retained the Former Manager, a wholly owned subsidiary of AR Capital, LLC (“ARC”), to manage our affairs on a day-to-day basis, and, as a result, we were generally externally managed, with the exception of certain acquisition, accounting and portfolio management services performed by our employees. In August 2013, our board of directors determined that it is in our best interests to become self-managed, and we completed our transition to self-management on January 8, 2014. In connection with becoming self-managed, we terminated the existing management agreement with the Former Manager, entered into employment and incentive compensation arrangements with our executives and acquired from the Former Manager certain assets necessary for our operations.
As of June 30, 2014, we owned 3,966 properties consisting of 106.8 million square feet, which properties were 98.8% leased with a weighted average remaining lease term of 9.95 years. In constructing our portfolio, we are committed to diversification by industry, tenant and geography. As of June 30, 2014, rental revenues derived from investment grade tenants and tenants affiliated with investment grade entities as determined by a major rating agency approximated 49%. We have attributed the rating of each parent company to its wholly owned subsidiary for purposes of this disclosure. Our core strategy encompasses receiving the majority of our REI revenue from investment grade tenants as we further acquire properties and enter into, or assume, lease arrangements.
Completed Mergers and Major Acquisitions
American Realty Capital Trust III, Inc. Merger
On December 14, 2012, ARCP entered into an agreement and plan of merger (the “ARCT III Merger Agreement”) with ARCT III and certain subsidiaries of each company. The ARCT III Merger Agreement provided for the merger of ARCT III with and into a subsidiary of ARCP (the “ARCT III Merger”). The ARCT III Merger was consummated on February 28, 2013.
Pursuant to the terms and subject to the conditions set forth in the ARCT III Merger Agreement, each outstanding share of common stock of ARCT III, including restricted shares that became vested, was converted into the right to receive (i) 0.95 of a share of ARCP’s common stock, or (ii) $12.00 in cash. In addition, each outstanding unit of equity ownership of American Realty Capital Operating Partnership III, L.P. (“ARCT III OP”) was converted into the right to receive 0.95 of the same class of unit of OP Units.
Upon the closing of the ARCT III Merger on February 28, 2013, 29.2 million shares, or 16.5% of the then outstanding shares of ARCT III’s common stock were received in cash consideration at $12.00 per share, the equivalent to 27.7 million shares of ARCP’s common stock based at the exchange ratio. In addition, 148.1 million shares of ARCT III’s common stock were converted to shares of ARCP common stock at the exchange ratio, resulting in an additional 140.7 million shares of ARCP common stock outstanding after the exchange. In accordance with the LPA, ARCP OP issued a corresponding number of OP Units to ARCP when ARCP issued common stock to former common stockholders of ARCT III.
Upon the consummation of the ARCT III Merger, American Realty Capital Trust III Special Limited Partner, LLC, the holder of the special limited partner interest in ARCT III OP, was entitled to subordinated distributions of net sales proceeds from ARCT III OP, which resulted in the issuance of units of limited partner interests in ARCT III OP, which, in turn, after applying the exchange ratio, resulted in the issuance of an additional 7.3 million Limited OP Units to affiliates of the Former Manager. The parties agreed that such OP Units would be subject to a minimum one-year holding period before being exchangeable into ARCP common stock.
68
Table of Contents
Also in connection with the ARCT III Merger, ARCP entered into an agreement with the Former Manager and its affiliates to internalize certain functions performed by them prior to the ARCT III Merger, reduce certain fees paid to affiliates, purchase certain corporate assets and pay certain merger related fees. See Note 18—Related Party Transactions and Arrangements to the audited consolidated financial statements for further discussion.
Accounting Treatment of the ARCT III Merger
ARCP and ARCT III, from inception to the ARCT III Merger date, were considered to be entities under common control. Both entities’ advisors were wholly owned subsidiaries of ARC, the parent of the Former Manager. ARC and its related parties had significant ownership interests in ARCP and ARCT III through the ownership of shares of common stock and other equity interests. In addition, the advisors of both entities were contractually eligible to charge potential fees for their services to both of the companies, including asset management fees, incentive fees and other fees and continue to charge fees to ARCP. Due to the significance of these fees, the advisors, and ultimately ARC, were determined to have a significant economic interest in both companies in addition to having the power to direct the significant activities of the companies through advisory/management agreements, which qualified them as affiliated companies under common control in accordance with GAAP. The acquisition of an entity under common control is accounted for on the carryover basis of accounting whereby the assets and liabilities of the companies are recorded upon the merger on the same basis as they were carried by the companies on the merger date. In addition, GAAP requires that historical financial information be presented as if the merger had occurred as of the beginning of the earliest period presented. Therefore, the accompanying financial statements, including the notes thereto, are presented as if the ARCT III Merger had occurred on January 1, 2011.
See “Selected Financial Information” for additional details concerning the impact of this presentation.
GE Capital Portfolio Acquisition
On June 27, 2013, ARCP, through subsidiaries of ARCP OP, acquired from certain affiliates of GE Capital Corp. (“GE Capital”) the equity interests in entities owning a real estate portfolio comprised of 447 properties (the “GE Capital Portfolio”) for a purchase price of $773.9 million, exclusive of closing costs. The 447 properties are subject to 409 property operating leases, as well as 38 direct financing leases.
During the year ended December 31, 2013, ARCT IV acquired from certain affiliates of GE Capital, the equity interests in entities owning a real estate portfolio comprised of 924 properties for a purchase price of $1.4 billion, exclusive of closing costs, with no liabilities assumed. The 924 properties are subject to 912 property operating leases, as well as 12 direct financing leases.
CapLease, Inc. Merger
On May 28, 2013, ARCP entered into an agreement and plan of merger (the “CapLease Merger Agreement”) with CapLease, Inc., a Maryland corporation (“CapLease”), and certain subsidiaries of each company. The CapLease Merger Agreement provided for the merger of CapLease with and into a subsidiary of ARCP OP (the “CapLease Merger”). ARCP consummated the CapLease Merger on November 5, 2013.
On November 5, 2013, we completed the merger with CapLease based on the terms of the CapLease Merger Agreement. Pursuant to the terms set forth in the CapLease Merger Agreement, at the effective time of the CapLease Merger, each outstanding share of common stock of CapLease, other than shares owned by ARCP, CapLease or any of their respective wholly owned subsidiaries, was converted into the right to receive $8.50. Each outstanding share of preferred stock of CapLease, other than shares owned by ARCP, CapLease or any of their respective wholly owned subsidiaries, was converted into the right to receive an amount in cash, equal to the sum of $25.00 plus all accrued and unpaid dividends on such shares of preferred stock. In addition, in connection with the merger of CapLease, LP with and into ARCP OP (the “CapLease Partnership Merger”), each outstanding unit of equity ownership of CapLease’s operating partnership other than units owned by CapLease or
69
Table of Contents
any wholly owned subsidiary of CapLease was converted into the right to receive $8.50. Shares of CapLease’s outstanding restricted stock were accelerated and became fully vested, and restricted stock and any outstanding performance shares were fully earned and received $8.50 per share. In total, cash consideration of $920.7 million was paid to the common and preferred stockholders of CapLease.
Accounting Treatment for the CapLease Merger
The CapLease Merger has been accounted for under the acquisition method of accounting under GAAP. Under the acquisition method of accounting, the assets acquired and liabilities assumed from CapLease have been recorded as of the acquisition date at their respective fair values. Any excess of purchase price over the fair values will be recorded as goodwill. Results of operations for CapLease will be included in ARCP OP’s consolidated financial statements from the date of acquisition. See Note 5—CapLease Acquisition to the audited consolidated financial statements.
American Realty Capital Trust IV, Inc. Merger
On July 1, 2013, ARCP and ARCP OP entered into an agreement and plan of merger, as amended on October 6, 2013 and October 11, 2013, (the “ARCT IV Merger Agreement”) with ARCT IV and certain subsidiaries of ARCP and ARCT IV. The ARCT IV Merger Agreement provided for the merger of ARCT IV with and into a subsidiary of ARCP OP (the “ARCT IV Merger”). ARCP consummated the ARCT IV Merger on January 3, 2014.
Pursuant to the terms of the ARCT IV Merger Agreement, as amended, each outstanding share of common stock of ARCT IV, including unvested restricted shares that vested in conjunction with the ARCT IV Merger, was exchanged for (i) $9.00 in cash, (ii) 0.5190 of a share of ARCP’s common stock (the “ARCT IV Exchange Ratio”) and (iii) 0.5937 of a share of a new series of preferred stock of ARCP designated as the 6.70% Series F Cumulative Redeemable Preferred Stock (“Series F Preferred Stock”) and each outstanding unit of ARCT IV’s operating partnership (“ARCT IV OP Unit”), other than ARCT IV OP Units held by American Realty Capital Trust IV Special Limited Partner, LLC, (the “ARCT IV Special Limited Partner”) and American Realty Capital Advisors IV, LLC (the “ARCT IV Advisor”) was exchanged for (i) $9.00 in cash, (ii) 0.5190 of a Limited Partner OP Unit and (iii) 0.5937 of a Limited Partner OP Unit designated as Series F Preferred Units (“Limited Partner Series F Preferred Units”). In total, ARCP paid $650.9 million in cash, issued 36.9 million shares of common stock and 42.2 million shares of Series F Preferred Stock, and ARCP OP issued 0.7 million units of Limited Partner Series F Preferred units and 0.7 million Limited Partner OP Units to the former ARCT IV shareholders and ARCT IV OP Unit holders in connection with the consummation of the ARCT IV Merger. In addition, each outstanding ARCT IV Class B Unit (as defined below) and each outstanding ARCT IV OP Unit held by the ARCT IV Special Limited Partner and the ARCT IV Advisor was converted into 2.3961 OP Units, resulting in ARCP OP issuing 1.2 million Limited Partner OP Units. In accordance with the LPA, ARCP OP issued a corresponding number of OP Units and Limited Partner Series F Preferred Units to ARCP when shares of ARCP’s common stock and Series F Preferred Stock were issued to former common stockholders of ARCT IV, respectively.
In connection with the ARCT IV Merger and pursuant to the terms of the agreement of limited partnership of ARCT IV’s operating partnership, ARCT IV’s external advisor received subordinated distributions of net sales proceeds in an approximate amount of $63.2 million. Such subordinated distributions of net sales proceeds were paid in the form of equity units of ARCT IV’s operating partnership that were automatically converted into 6.7 million Limited Partner OP Units upon the consummation of the ARCT IV Merger and are subject to a minimum two-year holding period from the date of issuance before being exchangeable into ARCP’s common stock.
Accounting Treatment of the ARCT IV Merger
ARCP and ARCT IV were considered to be entities under common control. Both entities’ advisors are wholly owned subsidiaries of ARC. The Former Manager and its related parties had ownership interests in ARCP
70
Table of Contents
and ARCT IV through the ownership of shares of common stock and other equity interests. In addition, the advisors of both entities were contractually eligible to charge potential fees for their services to both of the companies including asset management fees, incentive fees and other fees and will continue to charge fees to ARCP following the ARCT IV Merger. Due to the significance of these fees, the advisors and ultimately ARC were determined to have a significant economic interest in both companies in addition to having the power to direct the activities of the companies through advisory/management agreements, which qualified them as affiliated companies under common control in accordance with GAAP. The acquisition of an entity under common control is accounted for on the carryover basis of accounting whereby the assets and liabilities of the companies are recorded upon the merger on the same basis as they were carried by the companies on the merger date. In addition, GAAP requires that historical financial information be presented as if the entities were combined for each period presented. Therefore, the accompanying financial statements including the notes thereto are presented as if the ARCT IV Merger had occurred on January 1, 2011.
See “Selected Financial Information” for additional details concerning the impact of this presentation.
Fortress Portfolio Acquisition
On July 24, 2013, ARC and another related entity, on behalf of ARCP and certain other entities sponsored directly or indirectly by ARC, entered into a purchase and sale agreement with affiliates of funds managed by Fortress Investment Group LLC (“Fortress”) for the purchase of 196 properties owned by Fortress. Of the 196 properties, 120 properties were allocated to and assigned by ARCP (the “Fortress Portfolio”) for an aggregate contract purchase price of $972.5 million, subject to adjustments set forth in the purchase and sale agreement and exclusive of closing costs, which were allocated to ARCP based on the pro rata fair value of the properties acquired by ARCP relative to the fair value of all 196 properties to be acquired from Fortress. On October 1, 2013, we closed on 41 of the 120 properties for a total purchase price of $200.3 million, exclusive of closing costs. During the six months ended June 30, 2014, ARCP closed the acquisition of the remaining 79 properties in the Fortress Portfolio for total purchase price of $400.9 million, exclusive of closing costs. The total purchase price of the Fortress Portfolio was $601.2 million, exclusive of closing costs. During the year ended December 31, 2013, ARCP deposited $72.2 million into escrow in relation to the Fortress Portfolio, which has been included in prepaid expenses and other assets in the consolidated balance sheets.
Inland Portfolio Acquisition
On August 8, 2013, ARC and another related entity, on behalf of ARCP and certain other entities sponsored directly or indirectly by ARC, entered into a purchase and sale agreement with Inland American Real Estate Trust, Inc. (“Inland”) for the purchase of the equity interests of 67 companies owned by Inland for an aggregate contract purchase price of approximately $2.3 billion, subject to adjustments set forth in the purchase and sale agreement and exclusive of closing costs. Of the 67 companies, the equity interests of 10 companies were acquired, in total, by ARCP from Inland for a purchase price of approximately $501.0 million, subject to adjustments set forth in the purchase and sale agreement and exclusive of closing costs, which was allocated to ARCP based on the pro rata fair value of the Inland Portfolio relative to the fair value of all 67 companies to be acquired from Inland by ARCP and the other entities sponsored directly or indirectly by ARC. The Inland Portfolio is comprised of 33 properties. As of June 30, 2014, ARCP had closed on 32 of the 33 properties for a total purchase price of $288.2 million, exclusive of closing costs. ARCP will not close on the remaining one property.
Cole Real Estate Investments, Inc. Merger
On October 22, 2013, ARCP entered into an agreement and plan of merger (the “Cole Merger Agreement”) with Cole Real Estate Investments, Inc. (“Cole”), a Maryland corporation, and a wholly owned subsidiary of ARCP. The Cole Merger Agreement provided for the merger of Cole with and into the wholly owned subsidiary (the “Cole Merger”). ARCP consummated the Cole Merger on February 7, 2014 (the “Cole Acquisition Date”).
Pursuant to the terms of the Cole Merger Agreement, each share of common stock of Cole issued and outstanding immediately prior to the effectiveness of the Cole Merger, including unvested restricted stock units
71
Table of Contents
and performance stock units that vested in conjunction with the Cole Merger was converted into the right to receive either (i) 1.0929 shares of ARCP common stock, par value $0.01 per share, (the “Stock Consideration”), or (ii) $13.82 in cash (the “Cash Consideration” and together with the Stock Consideration, the “Merger Consideration”). Approximately 98% of all outstanding Cole holders received Stock Consideration and approximately 2% of outstanding Cole shares elected to receive Cash Consideration, pursuant to the terms of the Cole Merger Agreement, resulting in ARCP issuing approximately 520.8 million shares of its common stock and paying $181.8 million to holders of Cole shares based on their elections. In accordance with the LPA, ARCP OP issued a corresponding number of OP Units to ARCP when shares of ARCP’s common stock were issued to former common stockholders of Cole.
In addition, ARCP issued approximately 2.8 million shares of its common stock, in the aggregate, to certain executives of Cole pursuant to letter agreements entered into between ARCP and such individuals concurrently with the execution of the Cole Merger Agreement, as previously disclosed. Additionally, effective as of the Cole Acquisition Date, ARCP issued, but has not yet allocated, 0.4 million shares with dividend rights commensurate with those of its common stock. In accordance with the LPA, ARCP OP issued a corresponding number of OP Units to ARCP when shares of ARCP’s common stock were issued to former executives of Cole.
ARCP is in the process of gathering certain additional information in order to finalize its assessment of the fair value of the consideration transferred; thus, the fair values of currently recorded assets and liabilities are subject to change. The estimated fair value of the consideration transferred at the Cole Acquisition Date totaled approximately $7.5 billion and consisted of the following (in thousands):
| As of Cole Acquisition Date (Preliminary) |
||||
| Estimated Fair Value of Consideration Transferred: |
||||
| Cash |
$ | 181,775 | ||
| ARCP Common stock |
7,302,480 | |||
|
|
|
|||
| Total consideration transferred |
$ | 7,484,255 | ||
|
|
|
|||
The fair value of the 520.8 million shares of common stock issued, excluding those common shares transferred to former Cole executives, was determined based on the closing market price of ARCP’s common stock on the Cole Acquisition Date.
Accounting Treatment for the Cole Merger
The Cole Merger will be accounted for under the acquisition method of accounting under GAAP. Under the acquisition method of accounting, the assets acquired and liabilities assumed from Cole will be recorded as of the acquisition date at their respective fair values. Any excess of purchase price over the fair values will be recorded as goodwill. Results of operations for Cole will be included in ARCP OP’s consolidated financial statements from the date of acquisition.
The operating results for the year ended December 31, 2013 do not address the impact of the Cole Merger and the acquisitions of the Fortress and Inland Portfolios, which closed after December 31, 2013, and do not include the other recent organic acquisitions that were acquired subsequent to December 31, 2013. Accordingly, the operating results in 2013 are not indicative of our future operating results.
Cole Credit Property Trust, Inc. Merger
On March 17, 2014, we entered into the CCPT Merger Agreement with CCPT. The CCPT Merger Agreement provided for the merger of CCPT with and into a wholly owned subsidiary the OP. We consummated the CCPT Merger on May 19, 2014.
72
Table of Contents
Accounting Treatment for the CCPT Merger
The CCPT Merger will be accounted for under the acquisition method of accounting under GAAP. Under the acquisition method of accounting, the assets acquired and liabilities assumed from CCPT will be recorded as of the acquisition date at their respective fair values. Any excess of purchase price over the fair values will be recorded as goodwill. Results of operations for CCPT will be included in ARCP OP’s consolidated financial statements from the date of acquisition.
Significant Accounting Estimates and Critical Accounting Policies
Set forth below is a summary of the significant accounting estimates and critical accounting policies that management believes are important to the preparation of our financial statements. Certain of our accounting estimates are particularly important for an understanding of our financial position and results of operations and require the application of significant judgment by our management. As a result, these estimates are subject to a degree of uncertainty. These significant accounting estimates include:
Revenue Recognition
Upon the acquisition of real estate, certain properties will have leases where minimum rent payments increase during the term of the lease. We will record rental revenue for the full term of each lease on a straight-line basis. When we acquire a property, the term of existing leases is considered to commence as of the acquisition date for the purposes of this calculation. Cost recoveries from tenants are included in tenant reimbursement income in the period the related costs are incurred, as applicable.
Our revenues, which are derived primarily from rental income, include rents that each tenant pays in accordance with the terms of each lease reported on a straight-line basis over the initial term of the lease. Since many of the leases provide for rental increases at specified intervals, straight-line basis accounting requires us to record a receivable, and include in revenues, unbilled rent receivables that we will only receive if the tenant makes all rent payments required through the expiration of the initial term of the lease. We defer the revenue related to lease payments received from tenants in advance of their due dates.
We continually review receivables related to rent and unbilled rent receivables and determine collectability by taking into consideration the tenant’s payment history, the financial condition of the tenant, business conditions in the industry in which the tenant operates and economic conditions in the area in which the property is located. In the event that the collectability of a receivable is in doubt, we will record an increase in the allowance for uncollectible accounts or record a direct write-off of the receivable in the consolidated statements of operations and comprehensive loss. As of December 31, 2013 and 2012, we determined that no allowance for uncollectible accounts was necessary.
Real Estate Investments
We record acquired real estate at cost and make assessments as to the useful lives of depreciable assets. We consider the period of future benefit of the asset to determine the appropriate useful lives. Depreciation is computed using a straight-line method over the estimated useful life of 40 years for buildings, five to 15 years for building fixtures and improvements and the remaining lease term for acquired intangible lease assets.
Allocation of Purchase Price of Business Combinations and Acquired Assets
In accordance with the guidance for business combinations, we determine whether a transaction or other event is a business combination. If the transaction is determined to be a business combination, we determine if the transaction is considered to be between entities under common control. The acquisition of an entity under common control is accounted for on the carryover basis of accounting whereby the assets and liabilities of the companies are recorded upon the merger on the same basis as they were carried by the companies on the merger date. All other business combinations are accounted for by applying the acquisition method of accounting. Under the acquisition method, we recognize the identifiable assets acquired, the liabilities assumed and any
73
Table of Contents
noncontrolling interest in the acquired entity. In addition, we evaluate the existence of goodwill or a gain from a bargain purchase. We will immediately expense acquisition-related costs and fees associated with business combinations and asset acquisitions.
We allocate the purchase price of acquired properties and business combinations accounted for under the acquisition method of accounting to tangible and identifiable intangible assets acquired based on their respective fair values to tangible and identifiable intangible assets acquired based on their respective fair values. Tangible assets include land, buildings, equipment and tenant improvements on an as-if vacant basis. We utilize various estimates, processes and information to determine the as-if vacant property value. Estimates of value are made using customary methods, including data from appraisals, comparable sales, discounted cash flow analysis and other methods. Identifiable intangible assets include amounts allocated to acquire leases for above- and below-market lease rates, the value of in-place leases and the value of customer relationships.
Amounts allocated to land, buildings, equipment and fixtures are based on cost segregation studies performed by independent third-parties or on our analysis of comparable properties in its portfolio.
The aggregate value of intangible assets related to in-place leases is primarily the difference between the property valued with existing in-place leases adjusted to market rental rates and the property valued as if vacant. Factors considered by us in our analysis of the in-place lease intangibles include an estimate of carrying costs during the expected lease-up period for each property, taking into account current market conditions and costs to execute similar leases. In estimating carrying costs, we include real estate taxes, insurance and other operating expenses and estimates of lost rentals at market rates during the expected lease-up period, which typically ranges from six to 18 months. We also estimate costs to execute similar leases including leasing commissions, legal and other related expenses.
Above-market and below-market in-place lease values for owned properties are recorded based on the present value (using an interest rate which reflects the risks associated with the leases acquired) of the difference between the contractual amounts to be paid pursuant to the in-place leases and management’s estimate of fair market lease rates for the corresponding in-place leases, measured over a period equal to the remaining non-cancelable term of the lease. The capitalized above-market lease intangibles are amortized as a decrease to rental income over the remaining term of the lease. The capitalized below-market lease values are amortized as an increase to rental income over the remaining term and any fixed rate renewal periods provided within the respective leases. In determining the amortization period for below-market lease intangibles, we initially will consider, and periodically evaluate on a quarterly basis, the likelihood that a lessee will execute the renewal option. The likelihood that a lessee will execute the renewal option is determined by taking into consideration the tenant’s payment history, the financial condition of the tenant, business conditions in the industry in which the tenant operates and economic conditions in the area in which the property is located.
The fair value of investments and debt are valued using techniques consistent with those disclosed in Note 9—Fair Value of Financial Instruments to the audited consolidated financial statements, depending on the nature of the investment or debt. The fair value of all other assumed assets and liabilities based on the best information available.
The aggregate value of intangibles assets related to customer relationships is measured based on our evaluation of the specific characteristics of each tenant’s lease and our overall relationship with the tenant. Characteristics considered by us in determining these values include the nature and extent of our existing business relationships with the tenant, growth prospects for developing new business with the tenant, the tenant’s credit quality and expectations of lease renewals, among other factors.
The value of in-place leases is amortized to expense over the initial term of the respective leases, which range primarily from two to 20 years. The value of customer relationship intangibles is amortized to expense over the initial term and any renewal periods in the respective leases, but in no event does the amortization period for intangible assets exceed the remaining depreciable life of the building. If a tenant terminates its lease, the unamortized portion of the in-place lease value and customer relationship intangibles is charged to expense.
In making estimates of fair values for purposes of allocating purchase price, we utilize a number of sources, including independent appraisals that may be obtained in connection with the acquisition or financing of the
74
Table of Contents
respective property and other market data. We also consider information obtained about each property as a result of its pre-acquisition due diligence, as well as subsequent marketing and leasing activities, in estimating the fair value of the tangible and intangible assets acquired and intangible liabilities assumed.
Derivative Instruments
We may use derivative financial instruments to hedge all or a portion of the interest rate risk associated with our borrowings. Certain of the techniques used to hedge exposure to interest rate fluctuations may also be used to protect against declines in the market value of assets that result from general trends in debt markets. The principal objective of such agreements is to minimize the risks and/or costs associated with our operating and financial structure as well as to hedge specific anticipated transactions.
We record all derivatives on the balance sheet at fair value. The accounting for changes in the fair value of derivatives depends on the intended use of the derivative, whether we have elected to designate a derivative in a hedging relationship and apply hedge accounting and whether the hedging relationship has satisfied the criteria necessary to apply hedge accounting. Derivatives designated and qualifying as a hedge of the exposure to changes in the fair value of an asset, liability, or firm commitment attributable to a particular risk, such as interest rate risk, are considered fair value hedges. Derivatives designated and qualifying as a hedge of the exposure to variability in expected future cash flows, or other types of forecasted transactions, are considered cash flow hedges. Derivatives may also be designated as hedges of the foreign currency exposure of a net investment in a foreign operation. Hedge accounting generally provides for the matching of the timing of gain or loss recognition on the hedging instrument with the recognition of the changes in the fair value of the hedged asset or liability that are attributable to the hedged risk in a fair value hedge or the earnings effect of the hedged forecasted transactions in a cash flow hedge. We may enter into derivative contracts that are intended to economically hedge certain of our risk, even though hedge accounting does not apply or we elect not to apply hedge accounting.
The accounting for subsequent changes in the fair value of these derivatives depends on whether each has been designed and qualifies for hedge accounting treatment. If we elect not to apply hedge accounting treatment, any changes in the fair value of these derivative instruments is recognized immediately in gains (losses) on derivative instruments in the consolidated statements of operations and comprehensive loss. If the derivative is designated and qualifies for hedge accounting treatment the change in the estimated fair value of the derivative is recorded in other comprehensive income (loss) to the extent that it is effective. Any ineffective portion of a derivative’s change in fair value will be immediately recognized in earnings.
Recently Issued Accounting Pronouncements
Recently issued accounting pronouncements are described in Note 3—Summary of Significant Accounting Policies to the audited consolidated financial statements.
Results of Operations
As a result of the Cole Merger, we evaluate our operating results by our two business segments, REI and Cole Capital.
REI Segment
Our results of operations are influenced by the timing of acquisitions and the operating performance of our real estate investments. The following table shows the property statistics of our real estate assets, including consolidated joint ventures, as of June 30, 2014 and 2013:
| June 30, | ||||||||
| 2014 | 2013 | |||||||
| Number of commercial properties(1) |
3,966 | 1,766 | ||||||
| Approximate rentable square feet (in millions)(2) |
106.8 | 25.3 | ||||||
| Percentage of rentable square feet leased |
98.8 | % | 100 | % | ||||
| (1) | Excludes properties owned through the Unconsolidated Joint Ventures. |
| (2) | Includes square feet of the buildings on land that are subject to ground leases. |
75
Table of Contents
Comparison of the Three Months Ended June 30, 2014 to the Three Months Ended June 30, 2013
Total Real Estate Investment Revenue
REI revenue increased approximately $289.7 million to $344.6 million for the three months ended June 30, 2014, compared to $54.9 million for the three months ended June 30, 2013. Our REI revenue consisted primarily of rental income from net leased commercial properties, which accounted for 91% and 96% of total REI revenue during the three months ended June 30, 2014 and 2013, respectively.
Rental Income
Rental income increased approximately $262.1 million to $314.8 million for the three months ended June 30, 2014, compared to $52.7 million for the three months ended June 30, 2013. The increase was primarily due to our net acquisition of 2,153 properties (which excludes 47 properties that are accounted for as direct financing leases) primarily through various mergers and portfolio acquisitions subsequent to June 30, 2013.
Direct Financing Lease Income
Direct financing lease income of $1.2 million was recognized for the three months ended June 30, 2014. Direct financing lease income was primarily driven by our net acquisition of 47 properties comprised of $62.1 million of net investments subject to direct financing leases acquired at the end of or subsequent to the second quarter of 2013. As such, we had no direct financing lease income during the three months ended June 30, 2013.
Operating Expense Reimbursements
Operating expense reimbursements increased by approximately $26.2 million to $28.5 million for the three months ended June 30, 2014 compared to $2.3 million for the three months ended June 30, 2013. Operating expense reimbursements represent reimbursements for taxes, property maintenance and other charges contractually due from the tenant per the respective lease. Operating expense reimbursements increases were driven by our net acquisition of 2,153 properties subsequent to June 30, 2013.
We also review our stabilized operating results from properties that we owned for the entirety of both the current and prior year reporting periods, referred to as “same store.” Cash same store rents on the 815 properties held for the full period in each of the three months ended June 30, 2014 and 2013 increased $0.2 million, or 0.5%, to $44.5 million compared to $44.3 million for the three months ended June 30, 2013, respectively. Same store annualized average rental income per square foot was $9.67 at June 30, 2014 compared to $9.62 at June 30, 2013.
Acquisition Related Expenses
Acquisition related expenses decreased approximately $28.8 million to $8.5 million for the three months ended June 30, 2014, compared to $37.3 million for the three months ended June 30, 2013. During the three months ended June 30, 2014, acquisition costs consisted of legal costs, deed transfer costs and other costs related to real estate purchase transactions. In addition to the costs above, during the three months ended June 30, 2013, we paid acquisition fees to our Former Manager for acquisitions by ARCT IV. In conjunction with the ARCT IV Merger, it was agreed that our Former Manager would no longer charge acquisition fees.
Merger and Other Transaction Related Expenses
Costs related to various mergers, as well as other transaction costs increased approximately $6.9 million to $13.3 million for the three months ended June 30, 2014, compared to $6.4 million for the three months ended June 30, 2013. The increase in merger and other transaction related expenses was primarily associated with costs incurred for the CCPT Merger and the pending disposition of the Multi-Tenant Portfolio.
Property Operating Expenses
Property operating expenses increased approximately $36.3 million to $39.4 million for the three months ended June 30, 2014, compared to $3.1 million for the three months ended June 30, 2013. The increase was primarily due to increased property taxes, utilities, repairs and maintenance and insurance expenses relating to the net acquisition of 2,153 rental income-producing properties subsequent to June 30, 2013. The primary property operating expense items are property taxes and repairs and maintenance.
76
Table of Contents
General and Administrative Expenses
General and administrative expenses increased approximately $4.6 million to $7.0 million for the three months ended June 30, 2014, compared to $2.4 million for the three months ended June 30, 2013. The increase in general and administrative expenses was primarily driven by an increase in the REI segment’s allocation of compensation expense due to becoming self-managed on January 8, 2014. General and administrative expenses primarily included the REI segment’s share of employee compensation and benefits, including legal, accounting and professional fees and escrow and trustee fees.
Equity Based Compensation Expense
Equity based compensation increased approximately $5.8 million to $9.3 million for the three months ended June 30, 2014, compared to $3.5 million for the three months ended June 30, 2013. The increase was primarily due to equity based compensation expenses related to the multi-year outperformance plan (the “New OPP”), which was entered into upon ARCP’s transition to self-management on January 8, 2014, as well as an increase in the amortization of restricted stock for the awards granted subsequent to June 30, 2013.
Depreciation and Amortization Expense
Depreciation and amortization expenses increased approximately $200.4 million to $234.2 million for the three months ended June 30, 2014, compared to $33.8 million for the three months ended June 30, 2013. The increase in depreciation and amortization was primarily driven by our net acquisition 2,153 properties subsequent to June 30, 2013.
Interest Expense, Net
Interest expense, net increased approximately $88.6 million to $99.7 million for the three months ended June 30, 2014, compared to $11.1 million during the three months ended June 30, 2013. The increase in interest expense was due to an increase in the average debt balance of $10.0 billion for the three months ended June 30, 2014 compared to $888.6 million for the three months ended June 30, 2013. The increase in debt was primarily due to the assumption of mortgage notes in connection with the various mergers and portfolio acquisitions and the issuance of the corporate bonds. The average annualized interest rate on all debt, including the effect of derivative instruments used to hedge the effects of interest rate volatility but excluding amortization of deferred financing costs and non-usage fees, for the three months ended June 30, 2014 and 2013 was 3.72% and 3.48%, respectively.
Other Income (Expense), Net
Other income (expense) decreased approximately $4.3 million to an expense of $3.1 million for the three months ended June 30, 2014, compared to income of $1.2 million for the three months ended June 30, 2013. Other income (expense) primarily consisted of state and franchise taxes of $2.8 million for the three months ended June 30, 2014. During the three months ended June 30, 2013, we recorded $1.2 million in income from investments.
Gain (Loss) on Derivative Instruments, Net
Gain on derivative instruments for the three months ended June 30, 2014 was $21.9 million, which primarily related to marking the Series D Preferred Stock embedded derivative to fair value. The gain was partially offset by a loss on derivative instruments resulting from marking our derivative instruments to fair value. We recorded a loss on derivative instruments of $40,000 during the three months ended June 30, 2013 that resulted from marking our derivate instruments to fair value.
Loss on Contingent Value Rights
During the three months ended June 30, 2013, we recorded a loss on contingent value rights of $31.1 million. The loss pertains to the fair value of our obligation to pay certain holders of common stock contingent
77
Table of Contents
value rights and preferred stock contingent value rights for the difference between the value of our shares on certain measurement dates and the value of the shares at the time of issuance as set forth in the respective contingent value rights agreements. We did not have any such loss during the six months ended June 30, 2014 as the contingent value rights were settled in the fourth quarter of 2013.
Gain on Disposition of Properties, Net
During the three months ended June 30, 2014, we recorded a gain on the sale of eight properties of $1.5 million. We did not sell any properties during the three months ended June 30, 2013.
Gain on Sale of Investment Securities
No investment securities were sold during the three months ended June 30, 2013 or 2014.
Comparison of the Six Months Ended June 30, 2014 to the Six Months Ended June 30, 2013
Total Real Estate Investment Revenue
REI revenue increased approximately $513.3 million to $611.1 million for the six months ended June 30, 2014, compared to $97.8 million for the six months ended June 30, 2013. Our REI revenue consisted primarily of rental income from net leased commercial properties, which accounted for 92% and 96% of total REI revenue during the six months ended June 30, 2014 and 2013, respectively.
Rental Income
Rental income increased approximately $465.6 million to $559.3 million for the six months ended June 30, 2014, compared to $93.7 million for the six months ended June 30, 2013. The increase was primarily due to our net acquisition of 2,153 properties (which excludes 47 properties that are accounted for as direct financing leases) primarily through various mergers and portfolio acquisitions subsequent to June 30, 2013.
Direct Financing Lease Income
Direct financing lease income of $2.2 million was recognized for the six months ended June 30, 2014. Direct financing lease income was primarily driven by our net acquisition of 47 properties comprised of $62.1 million of net investments subject to direct financing leases acquired at the end of or subsequent to the second quarter of 2013. As such, we had no direct financing lease income during the six months ended June 30, 2013.
Operating Expense Reimbursements
Operating expense reimbursements increased by approximately $45.4 million to $49.6 million for the six months ended June 30, 2014 compared to $4.2 million for the six months ended June 30, 2013. Operating expense reimbursements represent reimbursements for taxes, property maintenance and other charges contractually due from the tenant per their respective leases. Operating expense reimbursements increases were driven by our net acquisition of 2,153 properties subsequent to June 30, 2013.
We also review our stabilized operating results from properties that we owned for the entirety of both the current and prior year reporting periods, referred to as “same store.” Cash same store rents on the 701 properties held for the full period in each of the six months ended June 30, 2014 and 2013 increased $0.4 million, or 0.6%, to $73.3 million compared to $72.9 million for the six months ended June 30, 2013, respectively. Same store annualized average rental income per square foot was $9.29 at June 30, 2014 compared to $9.24 at June 30, 2013.
Acquisition Related Expenses
Acquisition related expenses decreased approximately $27.3 million to $20.3 million for the six months ended June 30, 2014, compared to $47.6 million for the six months ended June 30, 2013. During the six months ended June 30, 2014, acquisition costs consisted of legal costs, deed transfer costs and other costs related to real
78
Table of Contents
estate purchase transactions. In addition to the costs above, during the six months ended June 30, 2013, we paid acquisition fees to our Former Manager. In conjunction with the ARCT III Merger and ARCT IV Merger, it was agreed that our Former Manager would no longer charge acquisition fees for the respective entities.
Merger and Other Transaction Related Expenses
Costs related to various mergers, as well as other transaction costs increased approximately $91.3 million to $235.5 million for the six months ended June 30, 2014, compared to $144.2 million for the six months ended June 30, 2013. Upon the consummation of the ARCT IV Merger, an affiliate of ARCT IV received a subordinated incentive distribution upon the attainment of certain performance hurdles. For the six months ended June 30, 2014, $78.2 million was recorded for this fee. We issued 6.7 million OP Units to the affiliate as compensation for this fee. In addition, merger and other transaction related expenses consisted of expenses related to the corporate bond issuance and internalization as well as professional fees, printing fees, proxy services, debt assumption fees and other costs associated with entering into and completing the Cole Merger and CCPT Merger, as well as expenses related to the corporate bond issuance and becoming self-managed.
Property Operating Expenses
Property operating expenses increased approximately $63.4 million to $69.0 million for the six months ended June 30, 2014, compared to $5.6 million for the six months ended June 30, 2013. The increase was primarily due to increased property taxes, utilities, repairs and maintenance and insurance expenses relating to the acquisition of 2,153 rental income-producing properties subsequent to June 30, 2013. The primary property operating expense items are property taxes and repairs and maintenance.
General and Administrative Expenses
General and administrative expenses increased approximately $9.8 million to $13.6 million for the six months ended June 30, 2014, compared to $3.8 million for the six months ended June 30, 2013. The increase in general and administrative expenses was primarily driven by an increase in the REI segment’s allocation of compensation expense due to becoming self-managed on January 8, 2014. General and administrative expenses primarily included the REI segment’s share of employee compensation and benefits, including legal, accounting and professional fees and escrow and trustee fees.
Equity Based Compensation Expense
Equity based compensation increased approximately $27.5 million to $31.8 million for the six months ended June 30, 2014, compared to $4.3 million for the six months ended June 30, 2013. The increase was primarily due to equity based compensation expenses related to the New OPP, which was entered into upon ARCP’s transition to self-management on January 8, 2014, as well as an increase in the amortization of restricted stock for the awards granted subsequent to June 30, 2013.
Depreciation and Amortization Expense
Depreciation and amortization expenses increased approximately $324.7 million to $385.2 million for the six months ended June 30, 2014, compared to $60.5 million for the six months ended June 30, 2013. The increase in depreciation and amortization was driven by our net acquisition 2,153 properties subsequent to June 30, 2013.
Interest Expense, Net
Interest expense increased approximately $199.3 million to $216.4 million for the six months ended June 30, 2014, compared to $17.1 million during the six months ended June 30, 2013. The increase in interest expense was due to an increase in the average debt balance of $7.0 billion for the six months ended June 30, 2014 compared to $630.9 million for the six months ended June 30, 2013. The increase in debt was primarily due to the assumption of mortgage notes in connection with the various mergers and portfolio acquisitions and the issuance of the corporate bonds. Additionally, we recorded $32.6 million in interest expense as amortization of
79
Table of Contents
deferred financing costs associated with the termination of the Barclays Facility and recorded prepayment fees in connection with the defeasance of mortgage notes payable of $33.5 million during the six months ended June 30, 2014. The average annualized interest rate on all debt, including the effect of derivative instruments used to hedge the effects of interest rate volatility but excluding amortization of deferred financing costs and non-usage fees, for the six months ended June 30, 2014 and 2013 was 3.72% and 3.51%, respectively.
Other Income, Net
Other income decreased approximately $5.9 million to a loss of $3.9 million for the six months ended June 30, 2014, compared to income of $2.0 million for the six months ended June 30, 2013. Other income primarily consisted of state and franchise taxes of $2.8 million for the six months ended June 30, 2014. During the six months ended June 30, 2013, we recorded $1.2 million in income from investments.
Gain (Loss) on Derivative Instruments, Net
Gain on derivative instruments for the six months ended June 30, 2014 was $1.7 million, which primarily related to the defeasance of mortgage notes payable that were subject to interest rate swap agreements. See Note 11—Mortgage Notes Payable to our consolidated financial statements in this Quarterly Report on Form 10-Q for further discussion. The gain was partially offset by a loss on derivative instruments resulting from marking our derivative instruments to fair value. We recorded a loss on derivative instruments of $45,000 during the six months ended June 30, 2013 that resulted from marking our derivate instruments to fair value.
Gain on Disposition of Properties, Net
During the six months ended June 30, 2014, we recorded a gain on the sale of 25 properties of $4.5 million. We did not sell any properties during the six months ended June 30, 2013.
Gain on Sale of Investment Securities
We recorded a gain on the sale of investment securities of $0.5 million for the six months ended June 30, 2013, which resulted from selling the preferred debt and equity securities that we held. We did not sell any investment securities during the six months ended June 30, 2014.
Cole Capital
Effective February 7, 2014, we consummated the Cole Merger and acquired Cole Capital. As we did not commence operations for Cole Capital until February 7, 2014, comparative financial data is not presented for the three and six months ended June 30, 2013.
Three Months Ended June 30, 2014
Cole Capital Revenue
Cole Capital revenue for the three months ended June 30, 2014 was $37.4 million. Cole Capital revenue primarily consisted of transaction services revenue of $14.4 million, which included acquisition fees related to the acquisition of properties on behalf of certain of the Managed REITs. In addition, we recorded management fees and reimbursements of $13.0 million, which consisted of advisory fees and asset and property management fees of $10.3 million from certain Managed REITs and other programs sponsored by us and reimbursements of $2.7 million for expenses incurred in providing advisory and asset and property management services to certain Managed REITs. We also recorded dealer manager and distribution fees, selling commissions and offering reimbursements of $10.0 million, of which $7.1 million was reallowed to participating broker-dealers as discussed below and $2.0 million related to organization and offering expense reimbursements from the Managed REITs.
80
Table of Contents
Cole Capital Reallowed Fees and Commissions
Cole Capital reallowed fees and commissions totaled $7.1 million for the three months ended June 30, 2014. We reallowed $6.1 million, or 100%, of selling commissions earned by participating broker-dealers related to the sale of securities of the Managed REITs in offering for the three months ended June 30, 2014 and $1.0 million, or 50.2%, related to the payment of all or a portion of our dealer manager fees to participating broker-dealers as a marketing and due diligence expense reimbursement, based on factors such as the volume of shares sold by such participating broker-dealers and the amount of marketing support provided by such participating broker-dealers.
General and Administrative Expenses
General and administrative expenses were $12.0 million for the three months ended June 30, 2014, which primarily consisted of employee compensation and benefits expense. Other general and administrative expenses included insurance, legal, accounting and professional fees and other operating costs (including rent, supplies and facility maintenance).
Depreciation and Amortization Expenses
Depreciation and amortization expenses were $24.8 million for the three months ended June 30, 2014, which primarily consisted of amortization related to the intangible assets acquired in connection with the Cole Merger of $24.0 million. Depreciation and amortization expenses also includes depreciation and amortization related to leasehold improvements and property and equipment.
Other Income
Other income for the three months ended June 30, 2014 was $9.6 million, which primarily consisted of a benefit from income taxes recorded of $9.7 million related to our TRS. While most of the business activities of Cole Capital are conducted through the TRS, revenues and expenses recorded in the TRS for tax purposes are not the same as those included in Cole Capital in accordance with U.S. GAAP.
Six Months Ended June 30, 2014
Cole Capital Revenue
Cole Capital revenue for the six months ended June 30, 2014 was $91.5 million. Cole Capital revenue primarily consisted of dealer manager and distribution fees, selling commissions and offering reimbursements of $52.4 million, of which $41.5 million was reallowed to participating broker-dealers as discussed below and $5.9 million related to organization and offering expense reimbursements from the Managed REITs. In addition, we recorded transaction services revenue of $19.0 million, which included acquisition fees related to the acquisition of properties on behalf of certain of the Managed REITs. We also recorded management fees and reimbursements of $20.1 million, which consisted of advisory fees and asset and property management fees of $15.9 million from certain Managed REITs and other programs sponsored by us and reimbursements of $4.2 million for expenses incurred in providing advisory and asset and property management services to certain Managed REITs.
Cole Capital Reallowed Fees and Commissions
Cole Capital reallowed fees and commissions totaled $41.5 million for the six months ended June 30, 2014. We reallowed $35.6 million, or 100%, of selling commissions earned by participating broker-dealers related to the sale of securities of the Managed REITs in offering for the six months ended June 30, 2014 and $5.9 million, or 50.2%, related to the payment of all or a portion of our dealer manager fees to participating broker-dealers as a marketing and due diligence expense reimbursement, based on factors such as the volume of shares sold by such participating broker-dealers and the amount of marketing support provided by such participating broker-dealers.
81
Table of Contents
General and Administrative Expenses
General and administrative expenses were $31.1 million for the six months ended June 30, 2014, which primarily consisted of employee compensation and benefits expense. Other general and administrative expenses included insurance, legal, accounting and professional fees and other operating costs (including rent, supplies and facility maintenance).
Depreciation and Amortization Expenses
Depreciation and amortization expenses were $39.1 million for the six months ended June 30, 2014, which primarily consisted of amortization related to the intangible assets acquired in connection with the Cole Merger of $38.0 million. Depreciation and amortization expenses also includes depreciation and amortization related to leasehold improvements and property and equipment.
Other Income
Other income for the six months ended June 30, 2014 was $14.8 million, which primarily consisted of a benefit from income taxes recorded of $14.7 million related to our TRS. While most of the business activities of Cole Capital are conducted through the TRS, revenues and expenses recorded in the TRS for tax purposes are not the same as those included in Cole Capital in accordance with U.S. GAAP.
Comparison of the Year Ended December 31, 2013 to Year Ended December 31, 2012
Rental Income
Rental income increased $244.6 million to $309.8 million for the year ended December 31, 2013 compared to $65.2 million for the year ended December 31, 2012. Rental income was driven by our acquisition of 1,807 properties, which excludes 50 properties that are accounted for as direct financing leases, acquired during the year ended December 31, 2013 for an aggregate purchase price of $5.5 billion. The annualized rental income per square foot of the properties at December 31, 2013 was $12.66 with a weighted-average remaining lease term of 9.4 years, compared to $9.59 per square foot at December 31, 2012.
Our properties are generally leased from two to 20 years and 56% are leased to investment grade tenants and affiliates of investment grade tenants, as determined by major credit rating agencies. Cash same store rents on the 129 properties held for the full period in each of the years ended December 31, 2013 and 2012 increased $0.2 million, or 1.3%, to $16.2 million compared to $16.0 million for the years ended December 31, 2013 and 2012, respectively. Same store annualized average rental income per square foot was $11.37 at December 31, 2013 compared to $11.23 at December 31, 2012.
Direct Financing Lease Income
Direct financing lease income of $2.2 million was recognized for the year ended December 31, 2013. Direct financing lease income was primarily driven by our 2013 acquisition of 50 properties comprised of $66.1 million of net investments subject to direct financing leases during the year ended December 31, 2013.
Operating Expense Reimbursements
Operating expense reimbursements increased by $15.8 million to $17.8 million for the year ended December 31, 2013 compared to $2.0 million for the year ended December 31, 2012. Operating expense reimbursements represent reimbursements for taxes, property maintenance and other charges contractually due from tenants per their respective leases. Operating expense reimbursements were driven by our acquisition of 1,807 properties since December 31, 2012.
82
Table of Contents
Acquisition Related Expenses
Acquisition related costs increased by $31.0 million to $76.1 million for the year ended December 31, 2013 compared to $45.1 million for the year ended December 31, 2012. Acquisition expenses mainly consisted of legal costs, deed transfer costs and other costs related to real estate purchase transactions. The increase is driven by our acquisition of 1,807 properties during the year ended December 31, 2013 compared to 573 during the year ended December 31, 2012. This increase was offset by the agreement with the Former Manager in conjunction with the ARCT III Merger, where it was agreed that the Former Manager would no longer charge acquisition fees. Subsequent to December 31, 2013, the management agreement was terminated as a result of our transition to self-management. See Note 23—Subsequent Events to the audited consolidated financial statements for further discussion.
Merger and Other Transaction Related Expenses
Expenses related to various mergers, as well as other transaction expenses, increased by $275.7 million to $278.3 million for the year ended December 31, 2013 compared to $2.6 million for the year ended December 31, 2012. Upon the consummation of the ARCT III Merger, an affiliate of ARCT III received a subordinated incentive distribution upon the attainment of certain performance hurdles. For the year ended December 31, 2013, $98.4 million was recorded for this fee. We issued 7.3 million OP Units to the affiliate as compensation for this fee. In addition, merger and other transaction related expenses for the year ended December 31, 2013 included $109.4 million in legal fees, professional fees, printing fees, proxy services, debt assumption fees and other costs associated with entering into and completing the mergers. During the year ended December 31, 2013, we also recorded one-time equity-based compensation totaling $59.4 million relating to accelerating the vesting of OP Units in relation to our transition to self-management, one-time equity-based compensation of $2.7 million relating to accelerating restricted share amortization resulting from our consummation of the Cole Merger and $8.5 million of other internalization costs. During the year ended December 31, 2012, the $2.6 million of merger and other transaction related expenses primarily related to the merger with ARCT III announced in December 2012. These costs consisted of legal fees, accountants fees and other costs associated with entering into the ARCT III merger agreements.
Property Operating Expenses
Property expenses increased by $20.1 million to $23.6 million for the year ended December 31, 2013 compared to $3.5 million for the year ended December 31, 2012. These costs relate to expenses associated with maintaining certain properties, including real estate taxes, ground lease rent, insurance and repairs and maintenance expenses. The increase in property expenses are mainly due to our acquisition of properties with modified gross leases subsequent to December 31, 2012, and an increased number of properties for which we pay expenses, which are reimbursed by the tenant.
Operating Fees to Affiliate
Prior to the consummation of the ARCT III Merger, we paid the Former Manager an annual base management fee equal to 0.50% per annum of the average unadjusted book value of our real estate assets, calculated and payable monthly in advance, provided that the full amount of the distributions we have declared for the six immediately preceding months is equal to or greater than certain net income thresholds related to our operations. Subsequent to the consummation of the ARCT III Merger, we paid the Former Manager an annual base management fee equal to 0.50% per annum for up to $3.0 billion of unadjusted book value of assets and 0.40% of unadjusted book value of assets greater than $3.0 billion. For the years ended December 31, 2013 and 2012, the Former Manager waived base management fees earned of $6.1 million and $1.8 million, respectively.
We may have been required to pay the Former Manager a quarterly incentive fee, equal to the difference between (1) the product of (a) 20% and (b) the excess our annualized core earnings (as defined in the management agreement with the Former Manager) over the product of (i) the weighted-average number of shares
83
Table of Contents
multiplied by the weighted-average issuance price per share of common stock (ii) 8% and (2) the sum of any incentive compensation paid to the Former Manager with respect to the first three calendar quarters of the previous 12-month period. One half of each quarterly installment of the incentive fee may have been payable in shares of common stock. The remainder of the incentive fee may have been payable in cash. No incentive fees were earned for the years ended December 31, 2013 and 2012, respectively. Subsequent to December 31, 2013, the management agreement was terminated as a result of our transition to self-management. See Note 23—Subsequent Events to the audited consolidated financial statements for further discussion.
Operating fees to affiliate increased by $5.5 million to $5.7 million for the year ended December 31, 2013 compared to $0.2 million for the year ended December 31, 2012. The increase was the result of decisions by the Former Manager to not waive base management fees of $5.7 million in 2012, whereas the Former Manager waived all but $0.2 million in 2012. In addition, we recorded $2.2 million of base management fees during the year ended December 31, 2013 that was included in merger and other transaction related costs.
General and Administrative Expenses
General and administrative expenses increased by $6.4 million to $10.6 million for the year ended December 31, 2013 compared to $4.2 million for the year ended December 31, 2012. General and administrative expenses increased primarily as a result of higher professional fees, such as legal fees, accountant fees and financial printer services fees, insurance expense, salary-related expenses and board member compensation to support our increased real estate portfolio.
Equity-Based Compensation Expense
Equity-based compensation expense was $35.0 million for the year ended December 31, 2013, representing an $33.8 million increase over the year ended December 31, 2012. Equity-based compensation expenses primarily included expenses for the OPP, which was entered into upon consummation of the ARCT III Merger, as well as the amortization of restricted stock. Equity-based compensation expense was $1.2 million for the year ended December 31, 2012, which related to the amortization of restricted stock.
Depreciation and Amortization Expense
Depreciation and amortization expense increased by $170.4 million to $211.4 million for the year ended December 31, 2013 compared to $41.0 million for the year ended December 31, 2012. The increase in depreciation and amortization expense was driven by our acquisition of 1,807 properties since December 31, 2012 for an aggregate purchase price of $5.5 billion.
Interest Expense
Interest expense increased by $90.4 million to $102.3 million for the year ended December 31, 2013 compared to $11.9 million for the year ended December 31, 2012. The increase in interest expense was due to increases in debt balances used to fund portfolio acquisitions, partially offset by a decrease in the weighted-average annualized interest rate on borrowings. The weighted-average debt balances for the years ended December 31, 2013 and 2012 were $1.8 billion and $205.1 million, respectively. The weighted-average annualized interest rate on all debt, including the effect of derivative instruments used to hedge the effects of interest rate volatility but excluding amortization of deferred financing costs and non-usage fees, for the years ended December 31, 2013 and 2012 was 3.40% and 4.16%, respectively.
Our interest expense in future periods will vary based on our level of future borrowings, which will depend on the level of proceeds raised in offerings, our credit rating, the cost of borrowings, and the opportunity to acquire real estate assets which meet our investment objectives.
Other Income, Net
Other income increased by $1.8 million to $2.8 million for the year ended December 31, 2013 compared to other income of $1.0 million for the year ended December 31, 2012. The increase is primarily related to income
84
Table of Contents
earned on investments in redeemable preferred stock, senior notes and common stock, all of which were sold as of December 31, 2013, and investment income on certain assets acquired from CapLease during the fourth quarter of the year ended December 31, 2013.
Loss on Derivative Instruments, Net
Loss on the fair value of derivative instruments for the year ended December 31, 2013 was $67.9 million, which primarily consisted of a loss on contingent value rights. The loss pertains to the fair value of our obligation to pay certain preferred and common stockholders for the difference between the value of our shares on certain measurement dates and the value of the shares at the time of issuance as set forth by the contingent value rights agreement. The obligations were settled in full on during the year ended December 31, 2013. The loss was partially offset by a gain on derivative instruments resulting from marking our derivative instruments to fair value. No gain or loss on derivative instruments was recorded during the year ended December 31, 2012.
Loss on Sale of Investment in Affiliates
Loss on sale of investment in affiliates for the year ended December 31, 2013 was $0.4 million resulting from the sale of our investment in real estate funds sponsored by ARC purchased during the year ended December 31, 2013. No loss on the sale of investment in such funds was recorded during the year ended December 31, 2012.
Loss on Sale of Investments, Net
Loss on sale of investment securities, net for the year ended December 31, 2013 of $1.8 million primarily related to a $2.3 million loss on the sale of investments in redeemable preferred stock, senior notes and common stock, all of which were purchased in 2013 and sold as of December 31, 2013, partially offset by a $0.5 million gain on sale of investments in redeemable preferred stock, all of which were purchased in 2012 and sold as of December 31, 2013. We did not sell any investment securities during the year ended December 31, 2012.
Net Loss from Discontinued Operations
Net loss from discontinued operations decreased by $0.7 million to a net loss of approximately $20,000 for the year ended December 31, 2013 compared to net loss of $0.7 million for the year ended December 31, 2012. As of December 31, 2013 and 2012, we classified one property as held for sale on the consolidated balance sheets and reported in discontinued operations on the consolidated statements of operations and comprehensive loss. The net losses from discontinued operations during each year were primarily due to impairment on the held for sale property representing the difference between the carrying value and estimated proceeds from the sale of the property less estimated selling costs.
Comparison of the Year Ended December 31, 2012 to Year Ended December 31, 2011
Rental Income
Rental income increased by $61.4 million to $65.2 million for the year ended December 31, 2012 compared to $3.8 million for the year ended December 31, 2011. Rental income was driven by our acquisition of 573 properties during the year ended December 31, 2012 for an aggregate purchase price of $1.7 billion, as well as revenue for a full year from the 129 properties held as of December 31, 2011. The annualized rental income per square foot of the properties at December 31, 2012 was $9.59 with a weighted-average remaining lease term of 10.4 years, compared to $11.59 per square foot at December 31, 2011. There were no properties held for sale for the full period in each of the years ended December 31, 2012 and 2011.
Operating Expense Reimbursements
Operating expense reimbursements increased by $1.8 million to $2.0 million for the year ended December 31, 2012 compared to $0.2 million for the year ended December 31, 2011. Operating expense
85
Table of Contents
reimbursements represent reimbursements for taxes, property maintenance and other charges contractually due from tenants per their respective leases. Operating expense reimbursements were driven by our acquisition of 573 properties during the year ended December 31, 2012 as well as reimbursements for a full year from the 129 properties held as of December 31, 2011.
Acquisition Related Expenses
Acquisition related expenses increased by $41.2 million to $45.1 million for the year ended December 31, 2012 compared to $3.9 million for the year ended December 31, 2011. The increase is driven by our acquisition of 573 properties during the year ended December 31, 2012 compared to 71 during the year ended December 31, 2011. Acquisition and related costs represent the costs related to the acquisition of properties. Acquisition costs mainly consisted of legal costs, deed transfer costs and other costs related to real estate purchase transactions.
Merger and Other Transaction Related Expenses
During the year ended December 31, 2012, expenses related to the merger with ARCT III announced in December 2012 and other transaction costs were $2.6 million. These costs primarily consisted of legal fees, accountants fees and other costs associated with entering into the ARCT III merger agreement. There were no such merger expenses incurred during the year ended December 31, 2011.
Property Expenses
Property expenses increased by $3.3 million to $3.5 million for the year ended December 31, 2012 compared to $0.2 million for the year ended December 31, 2011. These expenses relate to costs associated with maintaining certain properties, including real estate taxes, ground lease rent, insurance and repairs and maintenance expenses. The increase in property expenses is mainly due to our acquisition of properties with modified gross leases during the year ended December 31, 2012 and an increased number of properties for which we pay expenses, which are reimbursed by the tenant.
Operating Fees to Affiliate
We paid the Former Manager an annual base management fee equal to 0.50% per annum of the average unadjusted book value of our real estate assets, calculated and payable monthly in advance, provided that the full amount of the distributions we have declared for the six immediately preceding months is equal to or greater than certain net income thresholds related to our operations. The Former Manager waived such portion of its management fee in excess of such thresholds. For the years ended December 31, 2012 and 2011, the Former Manager waived base management fees earned of $1.8 million and $0.3 million, respectively.
We were required to pay the Former Manager a quarterly incentive fee, calculated based on 20% of the excess our annualized core earnings (as defined in the management agreement with the Former Manager) over the weighted-average number of shares multiplied by the weighted-average price per share of common stock. One half of each quarterly installment of the incentive fee would be payable in shares of common stock. The remainder of the incentive fee would be payable in cash. No incentive fees were earned for the years ended December 31, 2012 and 2011, respectively.
Operating fees to affiliate were $0.2 million for the year ended December 31, 2012, compared to no such fees for the year ended December 31, 2011, which was the result of decisions by the Former Manager to not waive base management fees of $0.2 million in 2012 whereas the Former Manager waived all fees in 2011.
General and Administrative Expenses
General and administrative expenses increased by $3.5 million to $4.2 million for the year ended December 31, 2012 compared to $0.7 million for the year ended December 31, 2011. General and administrative expenses
86
Table of Contents
increased primarily as a result of higher professional fees, such as legal fees, accountant fees and financial printer services fees, insurance expense and board member compensation to support our increased real estate portfolio.
Depreciation and Amortization Expense
Depreciation and amortization expense increased by $38.9 million to $41.0 million for the year ended December 31, 2012 compared to $2.1 million for the year ended December 31, 2011. The increase in depreciation and amortization expense was driven by our acquisition of 573 properties during the year ended December 31, 2012 for an aggregate purchase price of $1.7 billion as well as depreciation and amortization expense for a full year from the 129 properties held as of December 31, 2011.
Interest Expense
Interest expense increased by $10.9 million to $11.9 million for the year ended December 31, 2012 compared to $1.0 million for the year ended December 31, 2011. The increase primarily related to the increase in debt balances used to fund portfolio acquisitions as the outstanding balance on our senior secured revolving credit facility increased by $82.2 million during the year ended December 31, 2012. Interest expense also related to outstanding mortgage notes payable, which increased $229.8 million during the year ended December 31, 2012, partially offset by a slightly lower weighted-average effective interest rate during 2012 as compared to 2011.
Our interest expense in future periods will vary based on our level of future borrowings, which will depend on the level of proceeds raised in offerings, our credit ratings, the cost of borrowings, and the opportunity to acquire real estate assets which meet our investment objectives.
Other Income, Net
Other income increased by $1.0 million to $1.0 million for the year ended December 31, 2012 compared to approximately $2,000 for the year ended December 31, 2011. The increase was primarily due to income on investment securities purchased during the year ended December 31, 2012.
Net Loss from Discontinued Operations
Net loss from discontinued operations decreased by $0.2 million to $0.7 million for the year ended December 31, 2012 compared to $0.9 million for the year ended December 31, 2011. As of the year ended December 31, 2012 and 2011, we had one and two vacant properties, respectively, classified as held for sale on the consolidated balance sheets and reported in discontinued operations on the consolidated statements of operations and comprehensive loss. The net losses from discontinued operations during each year were primarily due to impairments on the held for sale properties representing the difference between the carrying value and estimated proceeds from the sale of the properties less estimated selling costs. On July 3, 2012, one of the properties was sold for $0.6 million of net proceeds.
Cash Flows for the Six Months Ended June 30, 2014
During the six months ended June 30, 2014, net cash provided by operating activities was $33.8 million. The level of cash flows used in or provided by operating activities is affected by acquisition and transaction costs, the timing of interest payments, as well as the receipt of scheduled rent payments. Cash flows provided by operating activities during the six months ended June 30, 2014 was mainly due to adjusted net income of $269.8 million (net loss of $363.9 million adjusted for non-cash items including the issuance of operating partnership units, depreciation and amortization, gain on sale of properties, equity-based compensation, gain on derivative instruments and gain on the early extinguishment of debt totaling $633.7 million, in the aggregate), offset by a decrease in accounts payable and accrued expenses of $134.0 million, a decrease in prepaid and other assets of $62.2 million and a decrease in deferred rent, derivative and other liabilities of $35.3 million.
87
Table of Contents
Net cash used in investing activities for the six months ended June 30, 2014 was $1.9 billion, primarily related to the cash considerations of $755.7 million for the ARCT IV Merger, Cole Merger and CCPT Merger and acquisition of 337 properties for total cash considerations of $1.2 billion. The net cash used in investing activities was partially offset by the proceeds from the sale of properties of $95.3 million.
Net cash provided by financing activities was $2.1 billion during the six months ended June 30, 2014 related to proceeds from the issuance of corporate bonds of $2.5 billion, proceeds from mortgage notes payable of $718.3 million and proceeds from the issuance of common units of $1.6 billion. These inflows were partially offset by repayments net of borrowings from our credit facilities of $1.4 billion, payments on mortgage notes payable of $876.9 million, total distributions paid of $427.5 million and $80.5 million of deferred financing cost payments.
Cash Flows for the Six Months Ended June 30, 2013
During the six months ended June 30, 2013, net cash used in operating activities was $7.2 million. The level of cash flows used in or provided by operating activities is affected by acquisition and transaction costs, the timing of interest payments, as well as the receipt of scheduled rent payments. Cash flows used in operating activities during the six months ended June 30, 2013 was mainly due to an adjusted net loss of $4.1 million (net loss of $214.0 million adjusted for non-cash items, including the issuance of common units, depreciation and amortization, amortization of deferred financing costs, equity-based compensation, loss on held for sale properties, loss on derivative instruments, and gain on sale on investments of $209.9 million, in the aggregate), and a decrease in deferred costs and other assets of $10.3 million, partially offset by an increase in accounts payable and accrued expenses of $4.6 million.
Net cash used in investing activities for the six months ended June 30, 2013 was $2.3 billion, primarily related to the acquisition of 1,011 properties with an aggregate purchase price of $2.1 billion, the purchase of investment securities of $81.5 million, and the investment in direct financing leases of $76.4 million, partially offset by the proceeds from the sales of investment securities of $44.2 million.
Net cash provided by financing activities of $2.3 billion during the six months ended June 30, 2013 related to proceeds net of offering-related costs from the issuance of common units of $1.8 billion, proceeds from the issuance of preferred units of $445.0 million, proceeds net of repayments from our credit facilities of $475.4 million and $29.8 million of contributions from our affiliate. These inflows were partially offset by common unit repurchases of $350.4 million, $40.5 million of deferred financing cost payments, total distributions paid of $90.7 million, and distributions to non-controlling interest holders of $3.1 million.
Cash Flows for the Year Ended December 31, 2013
During the year ended December 31, 2013, net cash provided by operating activities was $12.8 million. The level of cash flows used in or provided by operating activities is affected by acquisition and transaction costs, the timing of interest payments, as well as the receipt of scheduled rent payments. Cash flows provided by operating activities during the year ended December 31, 2013 included adjusted net loss of $91.8 million (net loss of $480.5 million adjusted for non-cash items, the most significant of which were the issuance of operating partnership units, depreciation and amortization expense, amortization of deferred financing costs and premiums and discounts on debt, equity-based compensation, and the loss on derivative instruments, which totaled to $388.7 million, in the aggregate). In addition, we incurred a one-time expense related to the loss in the extinguishment of Series C Convertible Preferred Stock of $13.7 million. Cash inflows included an increase in accounts payable and accrued expenses of $100.2 million and in increase in deferred rent and other liabilities of $8.6 million, partially offset by an increase in prepaid and other assets of $20.4 million.
88
Table of Contents
Net cash used in investing activities for the year ended December 31, 2013 of $4.5 billion primarily related to the investment in real estate assets and the CapLease Merger of $4.4 billion, deposits for real estate investments of $101.9 million, the purchase of investment securities of $81.6 million and investments in direct financing leases of $68.6 million, partially offset by the proceeds from the sales of investment securities of $119.5 million.
Net cash provided by financing activities was $4.3 billion during the year ended December 31, 2013. This was primarily driven by the issuance of stock and debt during the year, most notably $2.0 billion of proceeds net of offering-related costs from the issuance of common stock, $1.7 billion of proceeds, net of repayments, from our credit facilities, $967.8 million of proceeds from issuance of convertible debt and $288.0 million of proceeds from the issuance of Series D Preferred Stock and $30.9 million of contributions from non-controlling interest holders. These inflows were partially offset by cash outflows, the most significant of which were common stock repurchases of $359.2 million, total distributions paid of $243.1 million, payments of deferred financing costs of $95.3 million and payments on mortgage notes and other debt of $15.1 million.
Cash Flows for the Year Ended December 31, 2012
During the year ended December 31, 2012, net cash provided by operating activities was $9.4 million. The level of cash flows used in or provided by operating activities is affected by acquisition and transaction costs, the timing of interest payments, as well as the receipt of scheduled rent payments. Cash flows provided by operating activities during the year ended December 31, 2012 was primarily due to an increase in adjusted net income of $2.7 million (net loss of $42.2 million adjusted for non-cash items, the most significant of which were depreciation and amortization expense, amortization of deferred financing costs and share based compensation, which totaled $44.9 million, in the aggregate). Cash inflows included an increase in accounts payable and accrued expenses of $8.3 million and in increase in deferred rent and other liabilities of $3.5 million, partially offset by an increase in prepaid and other assets of $5.1 million.
Net cash used in investing activities for the year ended December 31, 2012 of $1.7 billion, primarily related to an increase in investment in real estate assets paid for with cash of $1.7 billion and the purchase of investment securities of $41.7 million.
Net cash provided by financing activities of $2.0 billion during the year ended December 31, 2012 primarily related cash inflows from the issuances of stock and debt, most notably $1.7 billion of proceeds net of offering-related costs from the issuance of common and preferred stock, $229.8 million of proceeds from mortgage notes payable and $82.2 million of proceeds from our senior secured revolving credit facility. These inflows were partially offset by cash outflows, most notably by total distributions paid of $38.3 million and payments related to deferred financing costs of $14.0 million.
Liquidity and Capital Resources
In the normal course of business, our principal demands for funds will continue to be for property acquisitions, either directly or through investment interests, for the payment of operating expenses, distributions to our investors, and for the payment of principal and interest on our outstanding indebtedness. We expect to meet our future short-term operating liquidity requirements through net cash provided by our current property operations. Management expects that our properties will generate sufficient cash flow to cover all operating expenses and the payment of a monthly distribution. The majority of our net leases contain contractual rent escalations during the primary term of the lease. Other potential future sources of capital include proceeds from secured or unsecured financings from banks or other lenders, proceeds from offerings, including ARCP’s ATM (as defined below) program, proceeds from the sale of properties and undistributed funds from operations. With the stabilization of the investment portfolio, we expect to significantly increase the amount of cash flow generated from operating activities in future periods. Such increased cash flow will positively impact the amount of funds available for dividends.
89
Table of Contents
As of June 30, 2014, we had $193.7 million of cash and cash equivalents. As of December 31, 2013, we had $52.7 million of cash and cash equivalents.
Sources of Funds
EBITDA and Adjusted EBITDA
EBITDA and Adjusted EBITDA are non-GAAP financial measures we use as performance measures for benchmarking against our peers and as internal measures of business operating performance. We believe EBITDA and Adjusted EBITDA provide a meaningful perspective of the underlying operating performance of our current business. This is especially true since these measures exclude real estate depreciation, and we believe that real estate values fluctuate based on market conditions rather than depreciating in value ratably on a straight-line basis over time.
We define EBITDA as net income from continuing operations before interest, taxes, depreciation and amortization. We present EBITDA because we consider it a useful analytical tool for measuring our ability to service our debt and generate cash for other purposes. EBITDA is not a measurement of our financial performance under GAAP and should not be considered as an alternative to net income, operating income or any other performance measures derived in accordance with GAAP or as an alternative to cash flows from operating activities as a measure of our profitability or liquidity. We understand that although EBITDA is frequently used by securities analysts, lenders and others in their evaluation of companies, our calculation of EBITDA may not be comparable to other similarly titled measures of other companies. We define Adjusted EBITDA as earnings before interest, taxes, depreciation and amortization, adjusted to exclude fair value adjustments on derivatives, acquisition related expenses (which represents expenses incurred in connection with purchases of properties), merger and other transaction related fees and expenses, equity-based compensation and other items. We present Adjusted EBITDA because we consider it a useful analytical tool for measuring our ability to service our debt and generate cash for other purposes, and we believe it is more indicative of these measures than EBITDA. Adjusted EBITDA does not represent and should not be considered as an alternative to net income, operating income or any other performance measures derived in accordance with GAAP or as an alternative to cash flows from operating activities as a measure of our profitability or liquidity. Our calculations of Adjusted EBITDA are not comparable to similarly titled measures of other companies due to the nature of the adjustments.
The table below sets forth a reconciliation of EBITDA and Adjusted EBITDA from net loss as determined in accordance with GAAP for the six months ended June 30, 2014 and 2013 (in thousands).
| Six Months Ended June 30, |
||||||||
| 2014 | 2013 | |||||||
| Loss from continuing operations |
$ | (363,920 | ) | $ | (214,062 | ) | ||
| Interest expense, net and income tax benefit |
201,666 | 17,124 | ||||||
| Depreciation and amortization |
424,356 | 60,505 | ||||||
|
|
|
|
|
|||||
| EBITDA |
262,102 | (136,433 | ) | |||||
| Loss on derivative instruments, net |
(1,729 | ) | 31,179 | |||||
| Acquisition related expenses |
20,337 | 47,616 | ||||||
| Merger and other transaction related expenses |
235,478 | 144,162 | ||||||
| Equity-based compensation |
31,848 | 4,339 | ||||||
| Other non-recurring losses |
(4,489 | ) | (451 | ) | ||||
|
|
|
|
|
|||||
| Adjusted EBITDA |
$ | 543,547 | $ | 90,412 | ||||
|
|
|
|
|
|||||
90
Table of Contents
The table below sets forth a reconciliation of EBITDA and Adjusted EBITDA from net loss as determined in accordance with GAAP for the years ended December 31, 2013, 2012 and 2011 (in thousands).
| Year Ended December 31, | ||||||||||||
| 2013 | 2012 | 2011 | ||||||||||
| Loss from continuing operations |
$ | (480,436 | ) | $ | (41,492 | ) | $ | (3,952 | ) | |||
| Interest expense, net |
102,305 | 11,856 | 960 | |||||||||
| Depreciation and amortization |
211,372 | 41,003 | 2,111 | |||||||||
|
|
|
|
|
|
|
|||||||
| EBITDA |
(166,759 | ) | 11,367 | (881 | ) | |||||||
| Loss on derivative instruments, net |
67,946 | — | — | |||||||||
| Acquisition related expenses |
76,136 | 45,070 | 3,898 | |||||||||
| Merger and other transaction related expenses |
278,319 | 2,603 | — | |||||||||
| Equity-based compensation |
34,962 | 1,197 | — | |||||||||
|
|
|
|
|
|
|
|||||||
| Adjusted EBITDA |
$ | 290,604 | $ | 60,237 | $ | 3,017 | ||||||
|
|
|
|
|
|
|
|||||||
Capital Markets
The following are ARCP’s offerings of common stock during the year ended December 31, 2013 (dollars in millions):
| Type of offering |
Closing Date | Number of Shares(1) |
Gross Proceeds |
|||||||
| Registered follow-on offering |
January 29, 2013 | 2,070,000 | $ | 26.7 | ||||||
| ATM |
January 1—September 30, 2013 | 553,300 | 8.9 | |||||||
| Private placement offering |
June 7, 2013 | 29,411,764 | 455.0 | |||||||
| Private placement offering |
November 11, 2013 | 15,126,498 | 186.0 | |||||||
|
|
|
|
|
|||||||
| Total—Year end December 31, 2013(2) |
47,161,562 | $ | 676.6 | |||||||
|
|
|
|
|
|||||||
| (1) | Excludes 140.7 million shares of common stock that were issued to the stockholders of ARCT III’s common stock in conjunction with the ARCT III Merger. |
| (2) | Excludes 31.0 million shares of common stock that were issued by ARCT IV for gross proceeds of $1.5 billion. |
For each common share ARCP issued, ARCP OP issued a corresponding number of OP Units to ARCP in exchange for the contribution of the net proceeds from the stock issuance. The gross proceeds summarized above were contributed to ARCP OP net of offering costs of $165.4 million for the year ended December 31, 2013.
On August 1, 2012, ARCP filed a $500.0 million universal shelf registration statement and a resale registration statement with the SEC. Both registration statements became effective on August 17, 2012. As of December 31, 2013, ARCP had issued a total of approximately 2.1 million shares of common stock through a registered follow-on offering and an ATM offering under such universal shelf registration statement. No preferred stock, debt or equity-linked security have been issued under the universal shelf registration statement. The resale registration statement, as amended, registers the resale of up to 1,882,248 shares of common stock issued in connection with any future conversion of certain currently outstanding restricted shares, convertible preferred stock or limited partnership interests in ARCP OP.
On March 14, 2013, ARCP filed a universal automatic shelf registration statement and achieved well-known seasoned issuer (“WKSI”) status. ARCP intends to maintain both the $500.0 million universal shelf registration statement and the WKSI universal automatic shelf registration statement.
In January 2013, ARCP commenced an “at the market” equity offering program (“ATM”) in which ARCP may from time to time offer and sell shares of ARCP common stock having an aggregate offering proceeds of up
91
Table of Contents
to $60.0 million. The shares will be issued pursuant to ARCP’s $500.0 million universal shelf registration statement. For each share of common stock ARCP sells under the ATM, ARCP OP will issue a corresponding number of OP Units to ARCP.
In addition to its common stock offerings, on June 7, 2013, ARCP issued 28.4 million shares of convertible preferred stock (the “Series C Shares”) for gross proceeds of $445.0 million. Concurrently, ARCP OP issued to ARCP 28.4 million OP Units designated as Series C Convertible Preferred Units underlying the Series C Shares. On November 8, 2013, ARCP elected to convert all outstanding Series C Shares into its common stock. Pursuant to the Series C Articles Supplementary, the number of shares of common stock that could be issued upon conversion of Series C Shares was limited to an exchange cap. Therefore, ARCP converted 1.1 million Series C Shares into 1.4 million shares of its common stock. With respect to the 27.3 million Series C Shares for which ARCP could not issue shares of its common stock upon conversion due to the exchange cap, ARCP paid holders of Series C Shares an aggregate cash amount equal to approximately $441.4 million in exchange for such Series C Shares. Concurrently, ARCP OP issued to ARCP 1.4 million OP Units in respect of the issuances of such common stock upon the conversion of the Series C Shares. Based on ARCP’s share price on the conversion date, the total settlement value was $458.8 million.
On September 15, 2013, ARCP entered into definitive purchase agreements pursuant to which ARCP agreed to issue Series D Preferred Stock and common stock to certain institutional holders promptly following the close of the CapLease Merger. Pursuant to the definitive purchase agreements, ARCP issued approximately 21.7 million shares of Series D Preferred and 15.1 million shares of common stock, for gross proceeds of $288.0 million and $186.0 million, respectively, on November 8, 2013. Concurrently, ARCP OP issued ARCP 21.7 million OP Units designated as Series D Preferred Units and 15.1 OP Units. The Series D Preferred Stock was redeemed in accordance with its terms by ARCP for a redemption price of $315.8 million on September 2, 2014. Simultaneously, ARCP redeemed the Series D Preferred Units.
Upon consummation of the ARCT IV merger on January 3, 2014, ARCP issued 42.2 million shares of Series F Preferred Stock to ARCT IV stockholders. There were no shares issued and outstanding of Series F Preferred Stock as of December 31, 2013. Concurrently, ARCP OP issued ARCP 42.2 million OP Units designated as Series F Preferred Units. See Note 16—Preferred and Common OP Units to the audited consolidated financial statements for a description of the Series D and Series F Preferred Stock.
Upon consummation of the Cole Merger on February 7, 2014, ARCP issued approximately 520.8 million shares of its common stock to Cole stockholders, and approximately 2.8 million shares of its common stock to certain Cole executives pursuant to certain letter agreements between ARCP and such executives. Additionally, on the same date, ARCP issued, but has not yet allocated, 0.4 million shares of common stock with dividend rights commensurate with those of its existing common stock. Concurrently, ARCP OP issued ARCP a corresponding number of OP Units.
On May 28, 2014, ARCP issued 138.0 million shares of common stock at a price of $12.00 per share (before underwriting discounts and commissions). ARCP received total net proceeds of approximately $1.59 billion, after deducting underwriting discounts, commissions and estimated expenses. ARCP used the proceeds primarily to repay $1.3 billion of outstanding borrowings under the senior unsecured credit facility. Concurrently, ARCP OP issued ARCP 138.0 million OP Units.
Availability of Funds from Credit Facilities
On June 30, 2014, ARCP OP (as borrower) and ARCP (as guarantor) amended and restated the senior unsecured credit facility to, among other things, increase the amount of revolving commitments (including the addition of a multi-currency sub-facility) and term loan commitments. The senior unsecured credit facility is comprised of a $1.2 billion term loan facility (with a delayed draw component equal to $200.0 million), a $3.15 billion dollar-denominated revolving credit facility and a $250.0 million multi-currency revolving facility (all of which can be borrowed in dollars, at ARCP OP’s discretion). At June 30, 2014, we had approximately $1.9 billion outstanding, consisting of $1.0 billion outstanding on the term loan and $0.9 billion outstanding on the revolver, and up to $2.7 billion available to us for future borrowings under the senior unsecured credit
92
Table of Contents
facility. The senior unsecured credit facility includes an accordion feature, which, if exercised in full, allows us to increase the aggregate commitments under the senior unsecured credit facility to $6.0 billion, subject to the receipt of such additional commitments and the satisfaction of certain customary conditions.
The revolving credit facility generally bears interest at an annual rate of LIBOR plus 1.00% to 1.80% or Base Rate plus 0.00% to 0.80% (based upon ARCP’s then current credit rating). “Base Rate” is defined as the highest of the prime rate, the federal funds rate plus 0.50% or a floating rate based on one month LIBOR, determined on a daily basis. The term loan facility generally bears interest at an annual rate of LIBOR plus 1.15% to 2.05% or Base Rate plus 0.15% to 1.05% (based upon ARCP’s then current credit rating). Loans will initially be priced with an applicable margin of 1.35% in the case of LIBOR revolving loans and 1.60% in the case of LIBOR term loans. In addition, the senior unsecured credit facility provides the flexibility for interest rate auctions, pursuant to which, at our election, we may request that lenders make competitive bids to provide revolving loans, which competitive bids may be at pricing that differs from the foregoing interest rates.
The senior unsecured credit facility provides for monthly interest payments. In the event of an event of default, at the election of the majority of the lenders (or automatically upon a bankruptcy event of default with respect to ARCP OP or ARCP), the commitments of the lenders under the senior unsecured credit facility terminate, and payment of any unpaid amounts in respect of the senior unsecured credit facility is accelerated. The revolving credit facility and the term loan facility both terminate on June 30, 2018, in each case, unless extended in accordance with the terms of the senior unsecured credit facility. The senior unsecured credit facility provides for a one-year extension option with respect to each of the revolving credit facility and the term loan facility, exercisable at our election and subject to certain customary conditions, as well as certain customary “amend and extend” provisions. At any time, upon timely notice by us and subject to any breakage fees, we may prepay borrowings under the senior unsecured credit facility (subject to certain limitations applicable to the prepayment of any loans obtained through an interest rate auction, as described above). We incur a fee equal to 0.15% to 0.25% per annum (based upon ARCP’s then current credit rating) multiplied by the commitments (whether or not utilized) in respect of the dollar-denominated revolving credit facility and the multi-currency credit facility. We incur an unused fee of 0.25% per annum on the unused amount of the delayed draw term loan commitments. In addition, we incur customary administrative agent, letter of credit issuance, letter of credit fronting, extension and other fees. The senior unsecured credit facility also includes customary restrictions on, among other things, liens, negative pledges, restrictions on intercompany transfers, fundamental changes, investments, transactions with affiliates and restricted payments.
Principal Use of Funds
Acquisitions
Generally, cash needs for property acquisitions will be met through proceeds from the public or private offerings of debt and equity, credit facilities and other financings. We may also from time to time enter into other agreements with third parties whereby third parties will make equity investments in specific properties or groups of properties that we acquire.
We evaluate potential acquisitions of real estate and real estate-related assets and engage in negotiations with sellers and borrowers. Investors and stockholders should be aware that after a purchase contract is executed that contains specific terms the property will not be purchased until the successful completion of due diligence and negotiation of final binding agreements. During this period, we may decide to temporarily invest any unused proceeds from equity offerings in certain investments that could yield lower returns than the properties. These lower returns may affect our ability to make distributions.
We financed the aggregate purchase prices of the recent mergers and acquisitions discussed in Note 2—Mergers and Acquisitions to the audited consolidated financial statements in this prospectus in part through the assumption of outstanding indebtedness, and through a combination of available cash on hand from: (a) a portion of the $896.0 million in net proceeds from the sale of shares of ARCP common stock and convertible preferred
93
Table of Contents
stock in separate previously disclosed private placement transactions, which transactions were completed on June 7, 2013; (b) a portion of the $967.8 million in net proceeds from the sale of the old notes; (c) funds available from the issuance of common stock through ARCP’s current ATM program or any successor program thereto; and (d) financing available under our senior unsecured credit facility and additional alternative financing arrangements, as needed, from the issuance of additional common stock, preferred securities or other debt, equity or equity-linked financings.
Dividends
The amount of dividends payable to ARCP’s stockholders is determined by ARCP’s board of directors and is dependent on a number of factors, including funds available for dividends, financial condition, capital expenditure requirements, as applicable, and annual dividend requirements needed to qualify and maintain ARCP’s status as a REIT under the Internal Revenue Code. Operating cash flows are expected to increase as additional properties are acquired in our investment portfolio. ARCP funds dividend payments primarily with distributions from ARCP OP and ARCP OP funds dividends primarily from cash flows generated from operations by it and its subsidiaries. As our real estate portfolio matures, we expect cash flows from operations to cover our dividends.
Loan Obligations
At June 30, 2014, our leverage ratio (net debt, excluding debt convertible to common stock, divided by enterprise value) was 41.7%.
The payment terms of our loan obligations vary. In general, only interest amounts are payable monthly with all unpaid principal and interest due at maturity. Some of our loan agreements stipulate that we comply with specific reporting and financial covenants mainly related to debt coverage ratios and loan to value ratios. Each loan that has these requirements has specific ratio thresholds that must be met.
As of June 30, 2014, we had non-recourse mortgage indebtedness of $4.1 billion, which was collateralized by 757 properties. Our mortgage indebtedness bore interest at the weighted average rate of 4.90% per annum and had a weighted average maturity of 6.0 years. We may in the future incur additional mortgage debt on the properties we currently own or use long-term non-recourse financing to acquire additional properties in the future.
As of June 30, 2014, we had approximately $1.9 billion outstanding under the senior unsecured credit facility. There is $1.0 billion outstanding in term loans on the Credit Facility which is fixed through the use of derivative instruments used to hedge interest rate volatility. Including the spread, which can vary based on ARCP’s credit rating, the weighted average interest on this portion was 2.84% at June 30, 2014. At June 30, 2014, up to $2.7 billion was available to us for future borrowings, subject to borrowing availability.
Our loan obligations require the maintenance of financial covenants, as well as restrictions on corporate guarantees, the maintenance of certain financial ratios (such as specified debt to equity and debt service coverage ratios), as well as the maintenance of a minimum net worth. At June 30, 2014, March 31, 2014 and December 31, 2013, we were in compliance with the debt covenants under all of our loan obligations.
Convertible Senior Note Offering
On July 29, 2013, ARCP issued $300.0 million of Convertible Senior Notes (the “2018 Notes”) and, pursuant to an over-allotment exercise by the underwriters of such 2018 Notes offering, issued an additional $10.0 million of its 2018 Notes on August 1, 2013. On December 10, 2013, ARCP issued an additional $287.5 million of the 2018 Notes through a reopening of the 2018 Notes indenture agreement. On December 10, 2013, ARCP issued $402.5 million of Convertible Senior Notes (the “2020 Notes”, collectively with the 2018 Notes, the “Convertible Notes”). The 2018 Notes mature August 1, 2018 and the 2020 Notes
94
Table of Contents
mature on December 15, 2020. The Convertible Notes are convertible to cash or shares of ARCP’s common stock at its option. In accordance with GAAP, the notes are accounted for as a liability with a separate equity component recorded for the conversion option. A liability was recorded for the Convertible Notes on the issuance date at fair value based on a discounted cash flow analysis using current market rates for debt instruments with similar terms. The difference between the initial proceeds from the Convertible Notes and the estimated fair value of the debt instruments resulted in a debt discount, with an offset recorded to additional paid-in capital representing the equity component. The debt discount is being amortized to interest expense over the expected lives of the Convertible Notes.
ARCP funds the interest payments on the 2018 and the 2020 notes, respectively, with payments from ARCP OP in accordance with the terms of intercompany notes that have substantially similar terms to the 2018 and 2020 notes, respectively.
Bond Offering
On February 6, 2014, ARCP OP issued, in a private offering, the old notes exchanged hereby, a portion of the net proceeds from which it were to partially fund the cash consideration, fees and expenses relating to Cole Merger and repayment of Cole’s credit facility. ARCP used the remaining portion of the net proceeds from the offering to repay $900.0 million outstanding under its senior unsecured credit facility and for other general corporate purposes.
Contractual Obligations
The following is a summary of ARCP OP’s contractual obligations as of June 30, 2014 (in thousands):
| Total | July 1, - December 31, 2014 |
2015-2016 | 2017-2018 | Thereafter | ||||||||||||||||
| Principal payments due on mortgage notes payable |
$ | 4,125,621 | $ | 104,043 | $ | 521,724 | $ | 774,947 | $ | 2,724,907 | ||||||||||
| Interest payments due on mortgage notes payable |
1,174,482 | 102,150 | 368,120 | 284,221 | 419,991 | |||||||||||||||
| Principal payments due on credit facility |
1,896,000 | — | — | 1,896,000 | — | |||||||||||||||
| Interest payments due on credit facility |
213,190 | 20,984 | 95,698 | 96,508 | — | |||||||||||||||
| Principal payments due on corporate bonds |
2,550,000 | — | — | 1,300,000 | 1,250,000 | |||||||||||||||
| Interest payments due on corporate bonds |
391,702 | 35,750 | 143,000 | 93,528 | 119,424 | |||||||||||||||
| Principal payments due on convertible debt units |
1,000,000 | — | — | 597,500 | 402,500 | |||||||||||||||
| Interest payments due on convertible debt units |
170,633 | 16,509 | 66,038 | 58,569 | 29,517 | |||||||||||||||
| Principal payments due on other debt |
149,804 | 54,339 | 24,378 | 20,947 | 50,140 | |||||||||||||||
| Interest payments due on other debt |
78,154 | 3,438 | 11,621 | 8,721 | 54,374 | |||||||||||||||
| Payments due on lease obligations |
126,397 | 12,922 | 21,823 | 7,918 | 83,734 | |||||||||||||||
|
|
|
|
|
|
|
|
|
|
|
|||||||||||
| Total |
$ | 11,875,983 | $ | 350,135 | $ | 1,252,402 | $ | 5,138,859 | $ | 5,134,587 | ||||||||||
|
|
|
|
|
|
|
|
|
|
|
|||||||||||
95
Table of Contents
The following is a summary of ARCP OP’s contractual obligations as of December 31, 2013 (in thousands):
| Total | 2014 | 2015-2016 | 2017-2018 | Thereafter | ||||||||||||||||
| Principal payments due on mortgage notes payable |
$ | 1,258,661 | $ | 86,933 | $ | 677,200 | $ | 293,869 | $ | 200,659 | ||||||||||
| Interest payments due on mortgage notes payable |
204,982 | 63,581 | 82,666 | 25,064 | 33,671 | |||||||||||||||
| Principal payments due on senior corporate credit facility |
1,819,800 | — | — | 1,819,800 | — | |||||||||||||||
| Interest payments due on senior corporate credit facility |
186,585 | 47,048 | 94,095 | 45,442 | — | |||||||||||||||
| Principal payments due on secured credit facility |
150,000 | 150,000 | — | — | — | |||||||||||||||
| Interest payments due on secured credit facility |
4,410 | 4,410 | — | — | — | |||||||||||||||
| Principal payments due on convertible debt units |
1,000,000 | — | — | 597,500 | 402,500 | |||||||||||||||
| Interest payments due on convertible debt units |
187,235 | 33,019 | 66,038 | 58,619 | 29,559 | |||||||||||||||
| Principal payments due on other debt |
108,316 | 12,851 | 24,378 | 40,157 | 30,930 | |||||||||||||||
| Interest payments due on other debt |
65,659 | 6,808 | 11,469 | 6,802 | 40,580 | |||||||||||||||
| Payments due on lease obligations |
84,441 | 4,541 | 8,657 | 7,456 | 63,787 | |||||||||||||||
|
|
|
|
|
|
|
|
|
|
|
|||||||||||
| Total |
$ | 5,070,089 | $ | 409,191 | $ | 964,503 | $ | 2,894,709 | $ | 801,686 | ||||||||||
|
|
|
|
|
|
|
|
|
|
|
|||||||||||
Election as a REIT
ARCP elected to be taxed as a REIT under Sections 856 through 860 of the Code commencing with the taxable year ended December 31, 2011. If ARCP continues to qualify for taxation as a REIT, it generally will not be subject to federal corporate income tax to the extent it distributes its REIT taxable income to stockholders, and so long as it distributes at least 90% of its REIT taxable income, computed without regard to the dividends paid deduction and excluding net capital gain. REITs are subject to a number of other organizational and operational requirements. Even if ARCP qualifies for taxation as a REIT, it may be subject to certain state and local taxes on its income and property, and federal income and excise taxes on its undistributed income. ARCP believes it is organized and operating in such a manner as to qualify to be taxed as a REIT for the taxable year ending December 31, 2013.
Inflation
We may be adversely impacted by inflation on any leases that do not contain indexed escalation provisions. In addition, our net leases may require the tenant to pay its allocable share of operating expenses, including common area maintenance costs, real estate taxes and insurance. This may reduce our exposure to increases in costs and operating expenses resulting from inflation.
Related-Party Transactions and Agreements
We have entered into agreements with affiliates, whereby we pay or have paid in the past certain fees or reimbursements to ARC or its affiliates for acquisition fees and expenses, organization and offering costs, asset management fees and reimbursement of operating costs and have in the past paid sales commissions and dealer manager fees. See Note 18—Related Party Transactions and Arrangements to the audited consolidated financial statements for a discussion of the various related-party transactions, agreements and fees. In August 2013, ARCP’s board of directors determined that it is in the best interests of ARCP and its stockholders to become self-managed, and ARCP completed its transition to self-management on January 8, 2014. In connection with becoming self-managed, ARCP and ARCP OP terminated the existing management agreement with the Former Manager (subject to the Former Manager’s agreement to continue to provide services, as requested, for a 60 day tail period for a payment of $10.0 million and continuing to provide certain transition services for an hourly charge), enter into appropriate employment and incentive compensation arrangements with our executives and
96
Table of Contents
acquired from the Former Manager certain assets necessary for our operations. See Note 23—Subsequent Events to the audited consolidated financial statements for further discussion.
Off-Balance Sheet Arrangements
We have no off-balance sheet arrangements that have or are reasonably likely to have a current or future effect on our financial condition, changes in financial condition, revenues or expenses, results of operations, liquidity, capital expenditures or capital resources that are material to investors.
Quantitative and Qualitative Disclosures About Market Risk
The market risk associated with financial instruments and derivative financial instruments is the risk of loss from adverse changes in market prices or interest rates. Our market risk arises primarily from interest rate risk relating to variable-rate borrowings. To meet our short and long-term liquidity requirements, we borrow funds at a combination of fixed and variable rates. Our interest rate risk management objectives are to limit the impact of interest rate changes in earnings and cash flows and to lower our overall borrowing costs. To achieve these objectives, from time to time, we may enter into interest rate hedge contracts such as swaps, collars and treasury lock agreements in order to mitigate our interest rate risk with respect to various debt instruments. We would not hold or issue these derivative contracts for trading or speculative purposes. We do not have any foreign operations and thus we are not exposed to foreign currency fluctuations.
As of June 30, 2014, our debt included fixed-rate debt, including debt that has interest rates that are fixed with the use of derivative instruments, with a carrying and fair value of $8.7 billion and $9.0 billion, respectively. Changes in market interest rates on our fixed rate debt impact fair value of the debt, but they have no impact on interest incurred or cash flow. For instance, if interest rates rise 100 basis points and our fixed rate debt balance remains constant, we expect the fair value of our debt to decrease, the same way the price of a bond declines as interest rates rise. The sensitivity analysis related to our fixed-rate debt assumes an immediate 100 basis point move in interest rates from their June 30, 2014 levels, with all other variables held constant. A 100 basis point increase in market interest rates would result in a decrease in the fair value of our fixed rate debt by approximately $233.7 million. A 100 basis point decrease in market interest rates would result in an increase in the fair value of our fixed-rate debt by $241.6 million.
As of June 30, 2014, our debt included variable-rate debt with a carrying and fair value of $1.0 billion. The sensitivity analysis related to our variable-rate debt assumes an immediate 100 basis point move in interest rates from their June 30, 2014 levels, with all other variables held constant. A 100 basis point increase or decrease in variable interest rates on our variable-rate notes payable would increase or decrease our interest expense by approximately $9.8 million annually.
As the information presented above includes only those exposures that existed as of June 30, 2014, it does not consider exposures or positions arising after that date. The information represented herein has limited predictive value. Future actual realized gains or losses with respect to interest rate fluctuations will depend on cumulative exposures, hedging strategies employed and the magnitude of the fluctuations.
These amounts were determined by considering the impact of hypothetical interest rate changes on our borrowing costs, and, assume no other changes in our capital structure.
97
Table of Contents
Overview
We are a self-managed and self-administered real estate company that operates two business segments, REI and Cole Capital. Through the REI segment, we acquire, own and operate single-tenant, freestanding commercial real estate properties, primarily subject to net leases with high credit quality tenants. We focus on investing in properties that are net leased to credit tenants. Our long-term business strategy is to continue to invest in net leased assets to further develop our diverse portfolio consisting of approximately 70% long-term leases and 30% medium-term leases, with an average remaining lease term of 10 to 12 years. We seek to acquire net lease assets granularly, by self-originating or purchasing such assets, or executing sale-leaseback transactions, small portfolio acquisitions and in connection with build-to-suit opportunities, to the extent they are appropriate in terms of capitalization rate and scale. We expect this investment strategy to provide for stable income from credit tenants and for growth opportunities from re-leasing of current below market leases. We entered into an agreement pursuant to which we will dispose of the multi-tenant assets comprising the portfolio we previously announced would be spun off into American Realty Capital Centers, Inc., as further described under “Prospectus Summary—Recent Developments—Disposition of Multi-Tenant Shopping Center Business.” We believe such disposition will bring enhanced focus to our core strategy of developing a strong portfolio of single-tenant net lease assets. We have advanced our investment objectives by growing our net lease portfolio through the self-origination of property acquisitions and strategic mergers and acquisitions. Our total asset base was approximately $22 billion as of June 30, 2014.
As a result of the Cole Merger, in addition to operating a diverse portfolio of core commercial real estate investments, we, through CCA, are responsible for managing the Managed REITs on a day-to-day basis, identifying and making acquisitions and investments on the Managed REITs’ behalf, and recommending to each of the Managed REITs’ respective board of directors an approach for providing investors with liquidity. We receive compensation and reimbursement for services relating to the Managed REITs’ offerings and investment, management, financing and disposition of their respective assets, as applicable. Cole Capital allows us to generate earnings without the corresponding need to invest capital in that business or incur debt in order to fund or expand operations. As of June 30, 2014, the Managed REITs’ total assets were approximately $6.6 billion. We own CCA through a wholly owned subsidiary of ARCP OP. We and CCA have jointly elected to treat CCA as a TRS for U.S. federal income tax purposes. In order to avoid a potential adverse impact on ARCP’s status as a REIT, we conduct substantially all of our investment management business through the TRS.
As of June 30, 2014, we owned 3,966 properties consisting of 106.8 million square feet, which properties were 98.8% leased with a weighted average remaining lease term of 9.95 years. In constructing our portfolio, we are committed to diversification by industry, tenant and geography. As of June 30, 2014, rental revenues derived from investment grade tenants and tenants affiliated with investment grade entities as determined by a major rating agency approximated 49%. We have attributed the rating of each parent company to its wholly owned subsidiaries for purposes of the foregoing disclosure. Our core strategy encompasses receiving the majority of our revenue from investment grade tenants as we further acquire properties and enter into (or assume) lease arrangements.
For a discussion of recently completed mergers and major acquisitions, see “Management’s Discussion and Analysis of Financial Condition and Results of Operations—Completed Mergers and Major Acquisitions.”
Transition to Self-Management
During the year ended December 31, 2013, we retained the Former Manager, a wholly owned subsidiary of ARC, to manage our affairs on a day-to-day basis and, as a result, we were generally externally managed, with the exception of certain acquisition, accounting and portfolio management services performed by our employees. In August 2013, our board of directors determined that it is in the best interests of us and ARCP’s stockholders to
98
Table of Contents
become self-managed, and we completed our transition to self-management on January 8, 2014. In connection with becoming self-managed, we terminated the existing management agreement with the Former Manager, entered into employment and incentive compensation arrangements with our executives and acquired from the Former Manager certain assets necessary for our operations.
Under the termination agreement, the Former Manager agreed to provide services previously provided under the Management Agreement, to the extent required by us, for a tail period of 60 days following January 8, 2014 and received a payment in the amount of $10.0 million for providing such services. In addition, pursuant to a separate transition services agreement, affiliates of the Former Manager have agreed to provide certain transition services, including accounting support, acquisition support, investor relations support, public relations support, human resources and administration, general human resources duties, payroll services, benefits services, treasury, insurance and risk management, information technology, telecommunications and Internet and services relating to office supplies for a 60 day term, which may be extended by us. For additional services that we required, we paid a fee at an hourly rate or flat rate to be agreed on, not to exceed a market rate. An affiliate of the Former Manager also transferred to us furniture, fixtures and equipment used by the Former Manager in connection with our business, and we paid the Former Manager $10.0 million for the furniture, fixtures and equipment and certain unreimbursed expenses. In addition, ARC assigned to us a transaction management services agreement which it had entered into with RCS Advisory Services. Such agreement provides for services relating to offering registration, regulatory advice, transaction management, marketing support, due diligence and related meeting and other related services. See Note 23—Subsequent Events to the audited consolidated financial statements for further discussion.
Investment Policies
Our primary business objective is to generate dependable earnings and cash flow to satisfy debt service and dividend obligations and capital appreciation associated with extending expiring leases or repositioning our properties for lease to new credit tenants upon the expiration of a net lease. Upon consummation of the mergers and acquisitions discussed above, we will own a portfolio that uniquely combines all entities’ portfolio of properties with stable income from high credit quality tenants, with our portfolio, which has substantial growth opportunities. Our long-term business strategy is to acquire a diverse portfolio consisting of approximately 70% long-term leases and 30% medium-term leases, with an average remaining lease term of 10 to 12 years. We seek to acquire granular, self-originated single-tenant net lease assets, which may be purchased through sale-leaseback transactions, small portfolios and build-to-suit opportunities, to the extent they are appropriate in terms of capitalization rate and scale. We expect this investment strategy to provide for stable income from credit tenants and to provide for growth opportunities from the re-leasing of properties that are currently subject to below market leases. We intend to pursue an investment strategy that maximizes current cash flow and achieves sustainable long-term growth. We expect to achieve these objectives by acquiring net leased properties that either (a) have in-place rental rates below current average asking rents in the applicable sub-market and are located in sub-markets with stable or improving market fundamentals or (b) provide an essential location or infrastructure that is essential to the business operations of the tenant, which we believe will give incentive to the existing tenant or a new credit tenant to re-lease the property at a higher rental rate upon the expiration of the existing lease.
Primary Investment Focus
We focus on investing in properties that are net leased to credit tenants, which are generally large public companies with investment grade or below investment grade ratings and other creditworthy tenants. We intend to invest in properties with tenants that reflect a diversity of industries, geographies and sizes. A significant majority of our net lease investments have been and will continue to be in properties net leased to investment grade tenants, although at any particular time our portfolio may not reflect this. Our properties are primarily located in main locations in markets that we believe exhibit demographic trends that will support growth. We believe the diversification of our portfolio reduces the risks associated with potential adverse events that may impact any one tenant, industry, asset type or location. We believe our scale will enable us to continue to make significant acquisitions without exposing ourselves to excessive concentration risk. Our strategy encompasses
99
Table of Contents
receiving the majority of our revenue from investment grade tenants as we further acquire properties and enter into (or assume) lease arrangements.
Under net lease arrangements, tenants enter into long-term leases and pay most of the costs associated with the property and limited day-to-day property management by us is required. As a result, net lease companies are generally able to increase their size and scale with minimal incremental expense. This enables us to take advantage of economies of scale resulting in significant operational efficiencies as we grow. We believe that our focus on net leases has also enabled us to achieve greater tenant and geographic diversification, more stable cash flows, increased liquidity and lower cost of capital.
Investing in Real Property
We invest, and expect to continue to invest, in primarily freestanding, single-tenant retail properties net-leased to investment grade and other creditworthy tenants. When evaluating prospective investments in real property, our management will consider relevant real estate and financial factors, including the location of the property, the leases and other agreements affecting the property, the creditworthiness of major tenants, its income-producing capacity, its physical condition, its prospects for appreciation, its prospects for liquidity, tax considerations and other factors. In this regard, our management will have substantial discretion with respect to the selection of specific investments, subject to approval of our board of directors.
As of June 30, 2014, we owned 3,966 double and triple-net lease assets across property types. As a percentage of rental income, as of June 30, 2014, single-tenant retail properties represented 48.1%, office properties represented 23.5% and industrial properties represented 15.4% of our total portfolio. In addition, approximately 13.0% of our portfolio is comprised of multi-tenant retail assets acquired pursuant to the Cole Merger. Our portfolio is located across 49 states, the District of Columbia and Puerto Rico. As of June 30, 2014, our tenant base is comprised of approximately 1,196 tenants, which include well-known national, as well as regional companies across 98 industries.
As of June 30, 2014 and June 30, 2013, there were no tenants exceeding 10% of consolidated annualized rental income. Annualized rental income for net leases is rental income as of the period reported, which includes the effect of tenant concessions such as free rent, as applicable.
As of June 30, 2014, properties located in Texas represented 12.9% of consolidated annualized rental income determined on a straight-line basis. There were no geographic concentrations exceeding 10% of consolidated annualized rental income at June 30, 2013.
We do not have any specific policy as to the amount or percentage of our assets which will be invested in any specific property, other than the requirements under REIT qualification rules. We currently anticipate that our real estate investments will continue to be diversified in multiple net leased single tenant properties and in multiple geographic markets.
Purchase and Sale of Investments
We may deliberately and strategically dispose of properties in the future and redeploy funds into new acquisitions that align with our strategic objectives. Further, on a limited and opportunistic basis, we intend to acquire and promptly resell medium-term net lease assets for immediate gain. To the extent we engage in these activities, to avoid adverse U.S. federal income tax consequences, we generally must do so through a taxable REIT subsidiary (“TRS”). In general, a TRS is treated as a regular “C corporation” and therefore must pay corporate-level taxes on its taxable income. Thus, our yield on such activities will be reduced by such taxes borne by the TRS. Our one vacant property will be held in a TRS because we are contemplating various strategies including selling it as a means of maximizing our value from that property.
100
Table of Contents
Investments in Real Estate Mortgages
While our current portfolio consists of, and our business objectives emphasize, equity investments in real estate, we may invest in mortgages and other types of real estate interests consistent with our qualification as a REIT. We acquired $97.5 million of mortgage loans and $211.9 million of collateralized mortgage backed securities (“CMBS”) pursuant to the Cole merger and the CapLease Merger investments in real estate mortgages run the risk that one or more borrowers may default under the mortgages and that the collateral securing those mortgages may not be sufficient to enable us to recoup our full investment. Investments in mortgages are also subject to our policy not to be treated as an “investment company” under the Investment Company Act.
Securities of or Interests in Persons Primarily Engaged in Real Estate Activities and Other Issuers
Subject to the asset tests and income tests necessary for ARCP’s REIT qualification, we may invest in securities of other REITs, other entities engaged in real estate activities or securities of other issuers (including partnership interests, limited liability company interests, common stock and preferred stock), where such investment would be consistent with our investment objectives, including for the purpose of exercising control over such entities. There are no limitations on the amount or percentage of our total assets that may be invested in any one issuer, other than those imposed by the gross asset tests ARCP must meet in order to qualify as a REIT under the Code. We do not intend that our investments in securities will require us to register as an “investment company” under the Investment Company Act, and we would generally divest appropriate securities before any such registration would be required.
Build-to-Suit and Properties under Development
We are also expanding our investment activities beyond the traditional investment in completed properties with tenants in occupancy and paying rents by continuing the build-to-suit program and the acquisition of properties under the development of Cole and CapLease. These programs involve acquisition of properties that are not yet developed or are under development. Through the build-to-suit program and the acquisition of properties under development or that require substantial refurbishment or renovation, we seek to source investments at higher rates of return relative to completed projects. We believe that by entering into projects with established developer partners, we can provide the capital needed to get projects built, while at the same time, securing long-term investment assets for us at yields significantly higher than those available for completed properties.
Cole Capital
Cole Capital, which we acquired from Cole, sponsors and manages direct investment programs, which primarily includes five publicly registered, non-traded REITs. Cole Capital is responsible for managing the day-to-day affairs of the non-traded REITs, identifying and making acquisitions and investments on behalf of the non-traded REITs and recommending to each of the respective board of directors of the non-traded REITs an approach for providing investors with liquidity. Cole Capital also develops new non-traded REIT offerings, distributes the shares of common stock for the non-traded REITs and advises them regarding offerings, manages relationships with participating broker-dealers and financial advisors and provides assistance in connection with compliance matters relating to the offerings.
Joint Ventures
We may acquire or enter into joint ventures from time to time, if we determine that doing so would be the most cost-effective and efficient means of raising capital. Equity investments may be subject to existing mortgage financing and other indebtedness or such financing or indebtedness may be incurred in connection with acquiring investments. Any such financing or indebtedness will have priority over our equity interest in such property.
101
Table of Contents
Financing Policies
We rely on leverage to allow us to invest in a greater number of assets and enhance our asset returns. We expect our leverage levels to decrease over time, as a result of one or more of the following factors: scheduled principal amortization on our debt and lower leverage on new asset acquisitions. We expect to continue to strengthen our balance sheet through debt repayment or repurchase and also opportunistically grow our portfolio through new property acquisitions.
We intend to finance future acquisitions with the most advantageous source of capital available to us at the time of the transaction, which may include a combination of public and private offerings of our equity and debt securities, secured and unsecured corporate-level debt, property-level debt and mortgage financing and other public, private or bank debt. In addition, we may acquire properties in exchange for the issuance of common stock or OP Units and in many cases we may acquire properties subject to existing mortgage indebtedness.
In February 2014, we raised $2.55 billion in unsecured senior notes, and simultaneously with that financing, our credit agreement, which previously had been secured by pledges of interests in property-owning entities was modified to eliminate these pledges. We intend to continue to emphasize unsecured corporate- or ARCP OP-level debt in our financing and seek to reduce the percentage of our assets which are secured by mortgage loans.
When we use mortgage financing, we generally seek to finance our properties with, or acquire properties subject to, long-term, fixed-rate, non-recourse debt, effectively locking in the spread we expect to generate on our properties and isolating the default risk to solely the properties financed. Through non-recourse debt, we seek to limit the overall company exposure in the event we default on the debt to the amount we have invested in the asset or assets financed. We seek to finance our assets with “match-funded” or substantially “match-funded” debt, meaning that we seek to obtain debt whose maturity matches as closely as possible the lease maturity of the asset financed. At June 30, 2014, our corporate leverage ratio (total debt outstanding less on-hand cash and cash equivalents divided by base purchase price of acquired properties) was 52.6%.
We also may obtain secured or unsecured debt to acquire properties, and we expect that our financing sources will include banks, institutional investment firms, including asset managers, and life insurance companies. Although we intend to maintain a conservative capital structure, with limited reliance on debt financing, ARCP’s charter does not contain a specific limitation on the amount of debt we may incur and ARCP’s board of directors may implement or change target debt levels at any time without the approval of its stockholders.
Lending Policies
We do not have a policy limiting our ability to make loans to other persons, although we may be so limited by applicable law, such as the Sarbanes-Oxley Act. Subject to REIT qualification rules, we may make loans to unaffiliated third parties. For example, we may consider offering purchase money financing in connection with the disposition of properties in instances where the provision of that financing would increase the value to be received by us for the property sold. We do not expect to engage in any significant lending in the future. We may choose to guarantee debt of certain joint ventures with third parties. Consideration for those guarantees may include, but is not limited to, fees, long-term management contracts, options to acquire additional ownership interests and promoted equity positions. ARCP’s board of directors may, in the future, adopt a formal lending policy without notice to or consent of its stockholders.
Dividend Policy
ARCP intends to pay regular monthly dividends to holders of its common stock, Series F Preferred Stock and the OP Units. U.S. federal income tax law generally requires that a REIT distribute annually at least 90% of its REIT taxable income, without regard to the deduction for dividends paid and excluding net capital gains, and that it pay tax at regular corporate rates to the extent that it annually distributes less than 100% of its REIT taxable income.
102
Table of Contents
In September 2011, ARCP’s board of directors authorized, and in October 2011 ARCP began, the payment of dividends on the fifteenth day of each month to common stockholders of record at the close of business on the eighth day of such month. Since October 2011, ARCP’s board of directors has authorized the following increases in its common stock dividends:
| Declaration date |
Annualized dividend per share |
Distribution date | Record date | |||||||||
| September 7, 2011 |
$ | 0.875 | 10/15/2011 | 10/8/2011 | ||||||||
| February 27, 2012 |
$ | 0.880 | 3/15/2012 | 3/8/2012 | ||||||||
| March 16, 2012 |
$ | 0.885 | 6/15/2012 | 6/8/2012 | ||||||||
| June 27, 2012 |
$ | 0.890 | 9/15/2012 | 9/8/2012 | ||||||||
| September 30, 2012 |
$ | 0.895 | 11/15/2012 | 11/8/2012 | ||||||||
| November 29, 2012 |
$ | 0.900 | 2/15/2013 | 2/8/2013 | ||||||||
| March 17, 2013 |
$ | 0.910 | 6/15/2013 | 6/8/2013 | ||||||||
| May 28, 2013 |
$ | 0.940 | 12/13/2013 | 12/6/2013 | ||||||||
| October 23, 2013* |
$ | 1.000 | 2/15/2014 | 2/7/2014 | ||||||||
| * | The dividend increase was contingent upon, and became effective with, the close of the Cole merger, which was consummated on February 7, 2014. |
Commencing on May 31, 2012, ARCP had been paying cumulative dividends on the Series A convertible preferred stock monthly in arrears at the annualized rate of $0.77 per share. Commencing on August 15, 2012, ARCP had been paying cumulative dividends on the Series B Convertible Preferred Stock monthly in arrears at an annualized rate of $0.74 per share. These dividends were discontinued when the Series A and B convertible preferred stock were converted to common stock in August 2013. Commencing in June 2013, ARCP began paying cumulative dividends on the Series C cumulative convertible preferred stock monthly in arrears at the annualized rate of $0.9104 per share. These dividends were discontinued when the Series C Cumulative Convertible Preferred Stock was converted to common stock and cash in November 2013. Commencing in November 2013 through their redemption on September 2, 2014, ARCP had been paying cumulative dividends on the Series D cumulative preferred stock monthly in arrears at the annualized rate of $0.7896 per share. Commencing in February 2014, ARCP has been paying cumulative dividends on the Series F Cumulative Preferred stock monthly in arrears at an annualized rate of $1.675 per share.
ARCP has the ability to fund dividends from any source, including borrowing funds and using the proceeds of equity and debt offerings. Dividends made by ARCP are authorized by its board of directors in its sole discretion out of funds legally available therefor and are dependent upon a number of factors, including restrictions under applicable law and ARCP’s capital requirements. ARCP funds dividend payments primarily with distributions from ARCP OP and ARCP OP funds dividends primarily from cash flows generated from operations by it and its subsidiaries.
ARCP and its board of directors share a similar philosophy with respect to paying dividends. Dividends should principally be derived from cash flows generated from real estate operations. The management agreement with the Former Manager, prior to the amendment thereof in connection with the ARCT III Merger, provided for payment of the asset management fee only if the full amount of the dividends declared by ARCP in respect of OP Units for the six immediately preceding months is equal to or greater than the amount of its adjusted funds from operations as calculated by ARCP (“AFFO”). This condition has been satisfied. Prior to when it was satisfied, the Former Manager waived such portion of its management fee that, when added to AFFO, without regard to the waiver of the management fee, increased AFFO so that it equaled the dividends declared by ARCP in respect of OP Units for the prior six months. For the year ended December 31, 2013, $14.0 million in asset management fees were incurred by
103
Table of Contents
ARCP, out of which $6.1 million were waived by the Former Manager. Subsequent to December 31, 2013, the management agreement was terminated as a result of ARCP’s transition to self-management. See Note 23—Subsequent Events to the audited consolidated financial statements for further discussion.
As ARCP’s real estate portfolio matures and one-time acquisition and transaction expenses are significantly reduced, ARCP expects cash flows from operations to cover a more significant portion of its dividends and over time to cover dividends.
Tax Status
ARCP elected to be taxed as a REIT under Sections 856 through 860 of the Code, effective for taxable year ended December 31, 2011. ARCP believes that it is organized and operates in such a manner as to qualify for taxation as a REIT under the Code. ARCP intends to continue to operate in such a manner to qualify for taxation as a REIT, but no assurance can be given that it will operate in a manner so as to qualify or remain qualified as a REIT. Pursuant to ARCP’s charter, its board of directors has the authority to make any tax elections on its behalf that, in their sole judgment, are in ARCP’s best interest. This authority includes the ability to elect not to qualify as a REIT for U.S. federal income tax purposes or, after qualifying as a REIT, to revoke or otherwise terminate our status as a REIT. ARCP’s board of directors has the authority under ARCP’s charter to make these elections without the necessity of obtaining the approval of ARCP’s stockholders. In addition, ARCP’s board of directors has the authority to waive any restrictions and limitations contained in ARCP’s charter that are intended to preserve our status as a REIT during any period in which our board of directors has determined not to pursue or preserve our status as a REIT.
Competition
We are subject to competition in the acquisition of properties and intense competition in the leasing of our properties. We compete with a number of developers, owners and operators of retail, restaurant, industrial and office real estate, many of which own properties similar to ours in the same markets in which our properties are located, in the leasing of our properties. We also may face new competitors and, due to our focus on single-tenant properties located throughout the United States, and because many of our competitors are locally or regionally focused, we will not encounter the same competitors in each region of the United States.
Many of our competitors have greater financial and other resources and may have other advantages over our company. Our competitors may be willing to accept lower returns on their investments and may succeed in buying the properties that we have targeted for acquisition. We may also incur costs on unsuccessful acquisitions that we will not be able to recover.
Regulations
Our investments are subject to various federal, state, local and foreign laws, ordinances and regulations, including, among other things, zoning regulations, land use controls, environmental controls relating to air and water quality, noise pollution and indirect environmental impacts such as increased motor vehicle activity. We believe that we have all permits and approvals necessary under current law to operate our investments.
Legal Proceedings
The information contained in Note 16—Commitments and Contingencies to the unaudited consolidated financial statements in this prospectus is incorporated herein. Except as set forth therein, as of June 30, 2014, we are not a party to, and none of our properties are subject to, any material pending legal proceedings.
104
Table of Contents
Environmental Matters
Under various federal, state and local environmental laws, a current owner of real estate may be required to investigate and clean up contaminated property. Under these laws, courts and government agencies have the authority to impose cleanup responsibility and liability even if the owner did not know of and was not responsible for the contamination. For example, liability can be imposed upon us based on the activities of our tenants or a prior owner. In addition to the cost of the cleanup, environmental contamination on a property may adversely affect the value of the property and our ability to sell, rent or finance the property, and may adversely impact our investment in that property.
Prior to acquisition of a property, we will obtain Phase I environmental reports or will rely on recent Phase I environmental reports. These reports will be prepared in accordance with an appropriate level of due diligence based on our standards and generally include a physical site inspection, a review of relevant federal, state and local environmental and health agency database records, one or more interviews with appropriate site-related personnel, review of the property’s chain of title and review of historic aerial photographs and other information on past uses of the property and nearby or adjoining properties. We may also obtain a Phase II investigation which may include limited subsurface investigations and tests for substances of concern where the results of the Phase I environmental reports or other information indicates possible contamination or where our consultants recommend such procedures.
Employees
As of June 30, 2014, we had approximately 400 employees. On January 8, 2014, we successfully completed our transition to self-management. In connection with becoming self-managed, we terminated our management agreement with our external manager and certain former executives and employees of its external manager became our employees.
Properties
General
As of June 30, 2014, we owned 3,966 properties, comprised of approximately 106.8 million square feet and located in 49 states, the District of Columbia and Puerto Rico, which include properties owned through consolidated joint ventures. As of June 30, 2014, the rentable space at these properties was 98.8% leased with a weighted average remaining lease term of 9.95 years.
105
Table of Contents
Industry Distribution
The following table details the industry distribution of our portfolio as of June 30, 2014 (dollars in thousands):
| Industry |
Number of Leases |
Square Feet | Square Feet as a % of Total Portfolio |
Annualized Rental Income (in 000’s) |
Annualized Rental Income as a % of Total Portfolio |
|||||||||||||||
| Accommodation & Food Services—Hotels, Motels & Inns |
1 | 9,513 | — | % | $ | 228 | — | % | ||||||||||||
| Administrative & Support Services—Collection & Credit |
1 | 177,893 | 0.2 | % | 2,696 | 0.2 | % | |||||||||||||
| Administrative & Support Services—Employment & Office Maintenance |
5 | 134,617 | 0.1 | % | 597 | — | % | |||||||||||||
| Agricultural—Crop Farming |
2 | 137,520 | 0.1 | % | 1,245 | 0.1 | % | |||||||||||||
| Construction—Commercial |
1 | 27,115 | — | % | 344 | — | % | |||||||||||||
| Education—Colleges & Universities |
1 | 599,664 | 0.6 | % | 14,951 | 1.1 | % | |||||||||||||
| Education—Other |
9 | 1,309,454 | 1.2 | % | 6,065 | 0.5 | % | |||||||||||||
| Entertainment & Recreation—Fitness |
33 | 1,113,102 | 1.0 | % | 21,434 | 1.6 | % | |||||||||||||
| Finance—Banking |
302 | 1,891,938 | 1.8 | % | 43,638 | 3.3 | % | |||||||||||||
| Finance—Credit Card & Consumer Lending |
32 | 403,772 | 0.4 | % | 7,803 | 0.6 | % | |||||||||||||
| Finance—Investment, Securities & Commodity |
13 | 913,739 | 0.9 | % | 18,510 | 1.4 | % | |||||||||||||
| Finance—Other |
1 | 11,330 | — | % | 198 | — | % | |||||||||||||
| Government & Public Services—Education |
2 | 117,106 | 0.1 | % | 1,157 | 0.1 | % | |||||||||||||
| Government & Public Services—Health |
1 | 65,536 | 0.1 | % | 4,744 | 0.4 | % | |||||||||||||
| Government & Public Services—Legal |
1 | 3,528 | — | % | 120 | — | % | |||||||||||||
| Government & Public Services—National Security |
1 | 4,700 | — | % | 78 | — | % | |||||||||||||
| Government & Public Services—Other |
29 | 1,103,755 | 1.0 | % | 25,518 | 1.9 | % | |||||||||||||
| Government & Public Services—Police & Correctional |
1 | 1,286 | — | % | — | — | % | |||||||||||||
| Healthcare—Childcare & Development |
9 | 69,025 | 0.1 | % | 947 | 0.1 | % | |||||||||||||
| Healthcare—Dental |
27 | 74,877 | 0.1 | % | 1,825 | 0.1 | % | |||||||||||||
| Healthcare—Emergency & Medical Centers |
64 | 836,831 | 0.8 | % | 16,983 | 1.3 | % | |||||||||||||
| Healthcare—Laboratories & Diagnostics |
3 | 245,117 | 0.2 | % | 3,165 | 0.2 | % | |||||||||||||
| Healthcare—Medical |
9 | 42,509 | — | % | 895 | 0.1 | % | |||||||||||||
| Healthcare—Optometry |
18 | 55,278 | 0.1 | % | 1,287 | 0.1 | % | |||||||||||||
| Healthcare—Other |
5 | 544,650 | 0.5 | % | 8,458 | 0.6 | % | |||||||||||||
| Information & Communications—Other |
3 | 130,591 | 0.1 | % | 1,475 | 0.1 | % | |||||||||||||
| Information & Communications—Telecommunications |
49 | 1,481,719 | 1.4 | % | 29,196 | 2.2 | % | |||||||||||||
| Insurance—Life |
4 | 320,562 | 0.3 | % | 6,796 | 0.5 | % | |||||||||||||
| Insurance—Medical |
6 | 865,993 | 0.8 | % | 18,839 | 1.4 | % | |||||||||||||
| Insurance—Other |
1 | 11,502 | — | % | 158 | — | % | |||||||||||||
| Insurance—Property |
14 | 980,793 | 0.9 | % | 15,369 | 1.2 | % | |||||||||||||
| Logistics—Other |
2 | 168,462 | 0.2 | % | 1,383 | 0.1 | % | |||||||||||||
| Logistics—Packaging |
1 | 221,035 | 0.2 | % | 1,480 | 0.1 | % | |||||||||||||
| Logistics—Postal & Delivery Services |
62 | 4,087,784 | 3.8 | % | 36,169 | 2.8 | % | |||||||||||||
| Logistics—Warehousing & Storage |
2 | 326,975 | 0.3 | % | 2,173 | 0.2 | % | |||||||||||||
| Manufacturing—Aircraft & Aerospace |
5 | 1,314,890 | 1.2 | % | 25,449 | 1.9 | % | |||||||||||||
| Manufacturing—Chemicals |
1 | 120,000 | 0.1 | % | 2,510 | 0.2 | % | |||||||||||||
| Manufacturing—Construction Materials |
3 | 737,645 | 0.7 | % | 2,595 | 0.2 | % | |||||||||||||
| Manufacturing—Consumer Products |
15 | 7,044,383 | 6.6 | % | 23,330 | 1.8 | % | |||||||||||||
| Manufacturing—Electronics & Computer |
1 | 121,623 | 0.1 | % | 1,899 | 0.1 | % | |||||||||||||
| Manufacturing—Food |
8 | 4,773,196 | 4.5 | % | 24,969 | 1.9 | % | |||||||||||||
| Manufacturing—Household & Office Equipment & Goods |
2 | 299,766 | 0.3 | % | 2,053 | 0.2 | % | |||||||||||||
| Manufacturing—HVAC |
1 | 105,074 | 0.1 | % | 1,497 | 0.1 | % | |||||||||||||
| Manufacturing—Machinery & Heavy Equipment |
9 | 925,879 | 0.9 | % | 6,151 | 0.5 | % | |||||||||||||
| Manufacturing—Medical |
5 | 719,947 | 0.7 | % | 15,352 | 1.2 | % | |||||||||||||
| Manufacturing—Metals |
1 | 139,000 | 0.1 | % | 637 | — | % | |||||||||||||
| Manufacturing—Motor Vehicle |
3 | 1,150,242 | 1.1 | % | 4,602 | 0.4 | % | |||||||||||||
106
Table of Contents
| Industry |
Number of Leases |
Square Feet | Square Feet as a % of Total Portfolio |
Annualized Rental Income (in 000’s) |
Annualized Rental Income as a % of Total Portfolio |
|||||||||||||||
| Manufacturing—Other |
6 | 655,076 | 0.6 | % | $ | 4,708 | 0.4 | % | ||||||||||||
| Manufacturing—Tools & Hardware |
4 | 382,906 | 0.4 | % | 2,263 | 0.2 | % | |||||||||||||
| Mining & Natural Resources—Petroleum, Gas & Coal |
15 | 758,667 | 0.7 | % | 15,382 | 1.2 | % | |||||||||||||
| Other Services—Automotive |
13 | 4,739,112 | 4.4 | % | 16,824 | 1.3 | % | |||||||||||||
| Other Services—Beauty Salons & Spas |
119 | 198,242 | 0.2 | % | 4,870 | 0.4 | % | |||||||||||||
| Other Services—Consumer Goods Repair |
1 | 980 | — | % | 20 | — | % | |||||||||||||
| Other Services—Diet & Weight |
7 | 12,943 | — | % | 210 | — | % | |||||||||||||
| Other Services—Dry Cleaning, Laundry & Alterations |
11 | 17,841 | — | % | 384 | — | % | |||||||||||||
| Other Services—Non-Profit Organizations |
1 | 8,512 | — | % | 241 | — | % | |||||||||||||
| Other Services—Pet Care |
1 | 3,726 | — | % | 49 | — | % | |||||||||||||
| Other Services—Photography |
2 | 5,011 | — | % | 107 | — | % | |||||||||||||
| Professional Services—Accounting & Tax |
8 | 12,520 | — | % | 302 | — | % | |||||||||||||
| Professional Services—Administrative & Management Consulting |
14 | 1,662,720 | 1.6 | % | 24,739 | 1.9 | % | |||||||||||||
| Professional Services—Advertising |
2 | 24,847 | — | % | 467 | — | % | |||||||||||||
| Professional Services—Architecture & Engineering |
13 | 431,252 | 0.4 | % | 4,754 | 0.4 | % | |||||||||||||
| Professional Services—Computer & Technology |
7 | 815,862 | 0.8 | % | 12,354 | 0.9 | % | |||||||||||||
| Professional Services—Legal & Title |
3 | 25,544 | — | % | 428 | — | % | |||||||||||||
| Professional Services—Media |
3 | 220,006 | 0.2 | % | 2,862 | 0.2 | % | |||||||||||||
| Professional Services—Other |
26 | 964,804 | 0.9 | % | 8,932 | 0.7 | % | |||||||||||||
| Professional Services—Research & Development |
3 | 203,764 | 0.2 | % | 2,411 | 0.2 | % | |||||||||||||
| Real Estate—Other |
2 | 5,400 | — | % | 98 | — | % | |||||||||||||
| Real Estate—Property Management |
2 | 39,859 | — | % | 609 | — | % | |||||||||||||
| Rental—Commercial Equipment Rental |
1 | 6,450 | — | % | 111 | — | % | |||||||||||||
| Rental—Consumer Goods Rental |
41 | 664,800 | 0.6 | % | 5,193 | 0.4 | % | |||||||||||||
| Rental—Motor Vehicle Leasing |
1 | 23,360 | — | % | 1,305 | 0.1 | % | |||||||||||||
| Restaurants—Casual Dining |
380 | 2,318,584 | 2.2 | % | 73,240 | 5.6 | % | |||||||||||||
| Restaurants—Family Dining |
130 | 711,176 | 0.7 | % | 18,707 | 1.4 | % | |||||||||||||
| Restaurants—Other |
42 | 73,834 | 0.1 | % | 1,961 | 0.2 | % | |||||||||||||
| Restaurants—Premium Dining |
6 | 26,616 | — | % | 873 | 0.1 | % | |||||||||||||
| Restaurants—Quick Service |
1,324 | 4,649,072 | 4.4 | % | 129,417 | 9.9 | % | |||||||||||||
| Retail—Apparel & Jewelry |
126 | 2,358,768 | 2.2 | % | 29,730 | 2.3 | % | |||||||||||||
| Retail—Automotive |
147 | 1,156,909 | 1.1 | % | 20,428 | 1.6 | % | |||||||||||||
| Retail—Department Stores |
28 | 2,262,724 | 2.1 | % | 15,104 | 1.2 | % | |||||||||||||
| Retail—Discount |
778 | 10,845,290 | 10.2 | % | 99,028 | 7.6 | % | |||||||||||||
| Retail—Electronics & Appliances |
39 | 1,031,262 | 1.0 | % | 14,634 | 1.1 | % | |||||||||||||
| Retail—Gas & Convenience |
126 | 525,654 | 0.5 | % | 27,200 | 2.1 | % | |||||||||||||
| Retail—Grocery & Supermarket |
106 | 6,562,491 | 6.1 | % | 74,417 | 5.7 | % | |||||||||||||
| Retail—Hobby, Books & Music |
57 | 1,230,151 | 1.2 | % | 12,663 | 1.0 | % | |||||||||||||
| Retail—Home & Garden |
126 | 8,367,957 | 7.8 | % | 62,054 | 4.7 | % | |||||||||||||
| Retail—Home Furnishings |
60 | 567,583 | 0.5 | % | 10,133 | 0.8 | % | |||||||||||||
| Retail—Internet |
3 | 3,048,444 | 2.9 | % | 14,159 | 1.1 | % | |||||||||||||
| Retail—Office Supply |
22 | 395,420 | 0.4 | % | 5,781 | 0.4 | % | |||||||||||||
| Retail—Pet Supply |
54 | 1,446,993 | 1.4 | % | 26,596 | 2.0 | % | |||||||||||||
| Retail—Pharmacy |
277 | 3,866,350 | 3.6 | % | 92,400 | 7.0 | % | |||||||||||||
| Retail—Specialty (Other) |
105 | 1,154,703 | 1.1 | % | 15,272 | 1.2 | % | |||||||||||||
| Retail—Sporting Goods |
40 | 1,977,763 | 1.9 | % | 22,270 | 1.7 | % | |||||||||||||
| Retail—Warehouse Clubs |
19 | 2,998,676 | 2.8 | % | 27,095 | 2.1 | % | |||||||||||||
| Transportation—Freight |
1 | 49,920 | — | % | 6 | — | % | |||||||||||||
| Utilities—Power & Gas Distribution |
1 | 31,381 | — | % | 690 | 0.1 | % | |||||||||||||
| Utilities—Power Generation |
1 | 9,353 | — | % | 241 | — | % | |||||||||||||
| Other(1) |
189 | 1,307,552 | 1.1 | % | 68 | — | % | |||||||||||||
|
|
|
|
|
|
|
|
|
|
|
|||||||||||
| 5,262 | 106,799,746 | 100.0 | % | $ | 1,310,758 | 100.0 | % | |||||||||||||
|
|
|
|
|
|
|
|
|
|
|
|||||||||||
| (1) | Includes billboard, parking and vacant assets. |
107
Table of Contents
Geographical Distribution
The following table details the geographic distribution of our portfolio as of June 30, 2014 (dollars in thousands):
| State/Possession |
Number of Properties |
Square Feet | Leased Square Feet as a % of Total Portfolio |
Annualized Rental Income (in 000’s) |
Annualized Rental Income as a % of Total Portfolio |
|||||||||||||||
| Alabama |
138 | 2,375,864 | 2.2 | % | $ | 38,922 | 3.0 | % | ||||||||||||
| Alaska |
4 | 110,426 | 0.1 | % | 2,140 | 0.2 | % | |||||||||||||
| Arizona |
73 | 3,314,267 | 3.1 | % | 56,636 | 4.3 | % | |||||||||||||
| Arkansas |
95 | 1,069,289 | 1.0 | % | 11,124 | 0.8 | % | |||||||||||||
| California |
79 | 6,442,115 | 6.0 | % | 84,112 | 6.4 | % | |||||||||||||
| Colorado |
51 | 2,329,435 | 2.2 | % | 35,578 | 2.7 | % | |||||||||||||
| Connecticut |
17 | 512,974 | 0.5 | % | 8,495 | 0.6 | % | |||||||||||||
| Delaware |
9 | 373,227 | 0.3 | % | 4,475 | 0.3 | % | |||||||||||||
| District of Columbia |
1 | 3,210 | — | % | 44 | — | % | |||||||||||||
| Florida |
248 | 5,889,900 | 5.5 | % | 77,670 | 5.9 | % | |||||||||||||
| Georgia |
191 | 5,761,633 | 5.4 | % | 73,105 | 5.6 | % | |||||||||||||
| Idaho |
17 | 129,677 | 0.1 | % | 3,993 | 0.3 | % | |||||||||||||
| Illinois |
168 | 6,149,881 | 5.8 | % | 80,129 | 6.1 | % | |||||||||||||
| Indiana |
125 | 5,783,393 | 5.4 | % | 41,151 | 3.1 | % | |||||||||||||
| Iowa |
48 | 1,546,863 | 1.4 | % | 13,421 | 1.0 | % | |||||||||||||
| Kansas |
45 | 2,310,453 | 2.2 | % | 14,774 | 1.1 | % | |||||||||||||
| Kentucky |
81 | 2,036,445 | 1.9 | % | 23,809 | 1.8 | % | |||||||||||||
| Louisiana |
93 | 1,578,707 | 1.5 | % | 21,501 | 1.6 | % | |||||||||||||
| Maine |
25 | 648,410 | 0.6 | % | 8,527 | 0.7 | % | |||||||||||||
| Maryland |
25 | 993,758 | 0.9 | % | 15,571 | 1.2 | % | |||||||||||||
| Massachusetts |
40 | 2,386,857 | 2.2 | % | 27,324 | 2.1 | % | |||||||||||||
| Michigan |
174 | 3,459,758 | 3.2 | % | 45,818 | 3.5 | % | |||||||||||||
| Minnesota |
39 | 557,507 | 0.5 | % | 6,310 | 0.5 | % | |||||||||||||
| Mississippi |
70 | 1,753,631 | 1.6 | % | 14,051 | 1.1 | % | |||||||||||||
| Missouri |
154 | 1,673,945 | 1.6 | % | 21,473 | 1.6 | % | |||||||||||||
| Montana |
8 | 70,901 | 0.1 | % | 1,056 | 0.1 | % | |||||||||||||
| Nebraska |
21 | 647,938 | 0.6 | % | 11,580 | 0.9 | % | |||||||||||||
| Nevada |
31 | 813,352 | 0.8 | % | 10,254 | 0.8 | % | |||||||||||||
| New Hampshire |
19 | 241,460 | 0.2 | % | 4,265 | 0.3 | % | |||||||||||||
| New Jersey |
32 | 1,639,094 | 1.5 | % | 35,573 | 2.7 | % | |||||||||||||
| New Mexico |
51 | 907,969 | 0.9 | % | 12,870 | 1.0 | % | |||||||||||||
| New York |
74 | 1,603,537 | 1.5 | % | 27,645 | 2.1 | % | |||||||||||||
| North Carolina |
164 | 3,818,479 | 3.6 | % | 37,337 | 2.8 | % | |||||||||||||
| North Dakota |
9 | 225,529 | 0.2 | % | 3,773 | 0.3 | % | |||||||||||||
| Ohio |
247 | 5,802,928 | 5.4 | % | 49,920 | 3.8 | % | |||||||||||||
| Oklahoma |
69 | 1,883,732 | 1.8 | % | 21,847 | 1.7 | % | |||||||||||||
| Oregon |
15 | 303,061 | 0.3 | % | 3,796 | 0.3 | % | |||||||||||||
| Pennsylvania |
147 | 5,517,489 | 5.2 | % | 50,442 | 3.8 | % | |||||||||||||
| Puerto Rico |
3 | 87,550 | 0.1 | % | 2,429 | 0.2 | % | |||||||||||||
| Rhode Island |
14 | 214,079 | 0.2 | % | 3,657 | 0.3 | % | |||||||||||||
| South Carolina |
115 | 3,058,405 | 2.9 | % | 29,550 | 2.3 | % | |||||||||||||
| South Dakota |
8 | 106,604 | 0.1 | % | 1,272 | 0.1 | % | |||||||||||||
108
Table of Contents
| State/Possession |
Number of Properties |
Square Feet | Leased Square Feet as a % of Total Portfolio |
Annualized Rental Income (in 000’s) |
Annualized Rental Income as a % of Total Portfolio |
|||||||||||||||
| Tennessee |
117 | 3,542,475 | 3.3 | % | $ | 31,061 | 2.4 | % | ||||||||||||
| Texas |
551 | 12,095,672 | 11.3 | % | 168,894 | 12.9 | % | |||||||||||||
| Utah |
8 | 86,733 | 0.1 | % | 1,195 | 0.1 | % | |||||||||||||
| Vermont |
7 | 23,454 | — | % | 472 | — | % | |||||||||||||
| Virginia |
98 | 2,605,900 | 2.4 | % | 38,410 | 2.9 | % | |||||||||||||
| Washington |
20 | 453,574 | 0.4 | % | 9,816 | 0.7 | % | |||||||||||||
| West Virginia |
37 | 213,563 | 0.2 | % | 4,758 | 0.4 | % | |||||||||||||
| Wisconsin |
82 | 1,586,479 | 1.5 | % | 17,582 | 1.3 | % | |||||||||||||
| Wyoming |
9 | 58,164 | 0.1 | % | 1,151 | 0.1 | % | |||||||||||||
|
|
|
|
|
|
|
|
|
|
|
|||||||||||
| 3,966 | 106,799,746 | 100.0 | % | $ | 1,310,758 | 100.0 | % | |||||||||||||
|
|
|
|
|
|
|
|
|
|
|
|||||||||||
Property Type
The following table details the property type of our portfolio as of June 30, 2014 (dollars in thousands):
| Property Type |
Number of Properties |
Square Feet | Square Feet as a % of Total Portfolio |
Annualized Rental Income (in 000’s) |
Annualized Rental Income as a % of Total Portfolio |
|||||||||||||||
| Owned |
||||||||||||||||||||
| Retail |
3,535 | 37,157,209 | 34.8 | % | $ | 629,961 | 48.1 | % | ||||||||||||
| Office |
158 | 17,096,061 | 16.0 | % | 307,396 | 23.5 | % | |||||||||||||
| Multi-Tenant Retail |
85 | 12,922,792 | 12.1 | % | 170,997 | 13.0 | % | |||||||||||||
| Distribution |
90 | 28,271,027 | 26.5 | % | 141,489 | 10.8 | % | |||||||||||||
| Industrial |
69 | 10,985,833 | 10.3 | % | 60,849 | 4.6 | % | |||||||||||||
| Other(1) |
29 | 366,824 | 0.3 | % | 66 | — | % | |||||||||||||
|
|
|
|
|
|
|
|
|
|
|
|||||||||||
| 3,966 | 106,799,746 | 100.0 | % | $ | 1,310,758 | 100.0 | % | |||||||||||||
|
|
|
|
|
|
|
|
|
|
|
|||||||||||
| (1) | Includes billboard, parking, construction in progress and vacant assets. |
Property Financing
Our mortgage notes payable consist of the following as of June 30, 2014 and December 31, 2013 (dollars in thousands):
| Encumbered Properties |
Outstanding Loan Amount |
Weighted- Average Effective Interest Rate (1) |
Weighted- Average Maturity (2) |
|||||||||||||
| June 30, 2014 |
757 | $ | 4,125,621 | 4.90 | % | 6.00 | ||||||||||
| December 31, 2013 |
177 | $ | 1,258,661 | 3.42 | % | 3.41 | ||||||||||
| (1) | Mortgage notes payable primarily have fixed rates or are fixed by way of interest rate swap arrangements. Effective interest rates range from 2.40% to 7.20% at June 30, 2014 and 1.83% to 6.28% at December 31, 2013. |
| (2) | Weighted average remaining years until maturity as of June 30, 2014 and December 31, 2013, respectively. |
109
Table of Contents
Future Minimum Lease Payments
The following table presents future minimum base rental cash payments due to us over the next five years and thereafter as of June 30, 2014. These amounts exclude contingent rent payments, as applicable, that may be collected from certain tenants based on provisions related to sales thresholds and increases in annual rent based on exceeding certain economic indexes among other items (in thousands):
| Future Minimum Operating Lease Base Rent Payments |
Future Minimum Direct Financing Lease Payments(1) |
|||||||
| July 1, 2014—December 31, 2014 |
$ | 677,188 | $ | 2,485 | ||||
| 2015 |
1,214,297 | 4,757 | ||||||
| 2016 |
1,191,214 | 4,674 | ||||||
| 2017 |
1,142,109 | 4,273 | ||||||
| 2018 |
1,087,444 | 3,183 | ||||||
| Thereafter |
7,706,549 | 10,052 | ||||||
|
|
|
|
|
|||||
| $ | 13,018,801 | $ | 29,424 | |||||
|
|
|
|
|
|||||
| (1) | 47 properties are subject to direct financing leases and, therefore, revenue is recognized as direct financing lease income on the discounted cash flows of the lease payments. Amounts reflected are the cash rent on these respective properties. |
Future Lease Expirations
The following is a summary of lease expirations for the next 10 years at the properties we own as of June 30, 2014 (dollars in thousands):
| Year of Expiration |
Number of Leases Expiring |
Square Feet | Square Feet as a % of Total Portfolio |
Annualized Rental Income Expiring (in 000’s) |
Annualized Rental Income Expiring as a % of Total Portfolio |
|||||||||||||||
| 2014 |
330 | 2,795,120 | 2.6 | % | $ | 14,926 | 1.1 | % | ||||||||||||
| 2015 |
242 | 2,857,586 | 2.7 | % | 30,857 | 2.4 | % | |||||||||||||
| 2016 |
285 | 4,367,620 | 4.1 | % | 49,655 | 3.8 | % | |||||||||||||
| 2017 |
406 | 5,726,767 | 5.4 | % | 69,914 | 5.3 | % | |||||||||||||
| 2018 |
427 | 4,441,093 | 4.2 | % | 63,806 | 5.0 | % | |||||||||||||
| 2019 |
307 | 4,602,835 | 4.3 | % | 74,748 | 5.7 | % | |||||||||||||
| 2020 |
211 | 3,767,190 | 3.5 | % | 49,460 | 3.8 | % | |||||||||||||
| 2021 |
220 | 12,157,201 | 11.4 | % | 93,607 | 7.1 | % | |||||||||||||
| 2022 |
305 | 12,239,490 | 11.5 | % | 95,147 | 7.3 | % | |||||||||||||
| 2023 |
270 | 6,306,861 | 5.9 | % | 92,794 | 7.1 | % | |||||||||||||
|
|
|
|
|
|
|
|
|
|
|
|||||||||||
| 3,003 | 59,261,763 | 55.6 | % | $ | 634,914 | 48.6 | % | |||||||||||||
|
|
|
|
|
|
|
|
|
|
|
|||||||||||
110
Table of Contents
STOCK OWNERSHIP BY DIRECTORS, OFFICERS AND CERTAIN STOCKHOLDERS
ARCP
The following table sets forth information regarding the beneficial ownership of ARCP’s common stock as of September 10, 2014, in each case including shares of common stock which may be acquired by such persons within 60 days, by:
| • | each person known by ARCP to be the beneficial owner of more than 5% of its outstanding shares of common stock based solely upon the amounts and percentages contained in the public filings of such persons; |
| • | each of ARCP’s officers and directors; and |
| • | all of ARCP’s officers and directors as a group. |
| Percentage of Common Stock | ||||||||
| Name of Beneficial Owner(1) |
Shares Owned(2) | Percentage(3) | ||||||
| Nicholas S. Schorsch(4) |
13,744,435 | 1.5 | % | |||||
| David S. Kay(5) |
265,315 | * | ||||||
| Lisa E. Beeson(6) |
68,212 | * | ||||||
| Brian S. Block(7) |
1,438,889 | * | ||||||
| Richard A. Silfen(8) |
34,661 | * | ||||||
| Lisa Pavelka McAlister(9) |
20,000 | * | ||||||
| Leslie D. Michelson(10) |
66,925 | * | ||||||
| Edward G. Rendell(11) |
55,901 | * | ||||||
| William G. Stanley(12) |
102,146 | * | ||||||
| Thomas A. Andruskevich(13) |
138,576 | * | ||||||
| Bruce D. Frank(14) |
4,010 | * | ||||||
|
|
|
|
|
|||||
| All directors and executive officers as a group |
16,029,442 | 1.7 | % | |||||
| * | Represents less than 1% of the shares of common stock outstanding. |
| (1) | The address for each of the persons named in this table is c/o American Realty Capital Properties, Inc., 405 Park Avenue—15th Floor, New York, New York 10022. |
| (2) | Beneficial ownership is determined in accordance with Rule 13d-3 of the Exchange Act. A person is deemed to be the beneficial owner of all shares of common stock with respect to which that person has or shares voting power of investment power, or has the right to acquire beneficial ownership at any time within 60 days of the date of the table. As used herein, “voting power” is the power to vote or direct the voting of shares and “investment power” is the power to dispose or direct the disposition of shares. |
| (3) | Percentage is calculated based on a total of 924,861,107 shares outstanding as of September 10, 2014, which includes (i) 5,547,968 shares of common stock granted to ARCP’s independent directors, employees and certain non-employees who are subject to certain vesting restrictions, (ii) 16,734,391 OP Units that are currently exchangeable for cash or, at ARCP’s option as general partner of ARCP OP, for shares of ARCP’s common stock on a one-to-one basis and (iii) 142,000 shares underlying options exercisable within 60 days of the date of this table. Such total excludes 7,956,105 OP Units that will become exchangeable at a future date. OP Units are exchangeable, except under certain limited circumstances, beginning one year from the date of issuance, which includes the holding period of any units that were converted into OP Units (e.g., LTIP Units) and have no expiration date. |
| (4) | Includes (i) 1,777,778 shares of common stock that are subject to certain vesting restrictions, (ii) 9,987,778 OP Units that are currently exchangeable for cash or, at ARCP’s option as general partner of ARCP OP, shares of ARCP’s common stock on a one-to-one basis and (iii) 142,000 shares underlying options exercisable within 60 days of the date of this table. Excludes (i) 4,963,688 OP Units that will become exchangeable on a future date and (ii) 7,455,504 LTIP Units held by Mr. Schorsch (as defined below in “Compensation of Directors and Executive Officers—Compensation Discussion and Analysis—Long-term |
111
Table of Contents
| Incentive Plan”). OP Units are exchangeable, except under certain limited circumstances, beginning one year from the date of issuance, which includes the holding period of any units that were converted into OP Units (e.g., LTIP Units), and have no expiration date. |
| (5) | Includes 250,315 shares of common stock that are subject to certain vesting restrictions. Excludes 877,118 LTIP Units held by Mr. Kay that are earned and exchangeable as described below under “Compensation of Directors and Executive Officers—Compensation Discussion and Analysis—Long-term Incentive Plan.” |
| (6) | Includes 57,212 shares of common stock that are subject to certain vesting restrictions. Excludes 657,839 LTIP Units held by Ms. Beeson that are earned and exchangeable as described below under “Compensation of Directors and Executive Officers—Compensation Discussion and Analysis—Long-term Incentive Plan.” |
| (7) | Includes (i) 689,577 shares of common stock that are subject to certain vesting restrictions and (ii) 512,510 OP Units that are currently exchangeable for cash or, at ARCP’s option as the general partner of ARCP OP, shares of ARCP’s common stock on a one-to-one basis. Excludes (i) 234,893 OP Units that will become exchangeable on a future date and (ii) 1,754,236 LTIP Units that are earned and exchangeable as described below under “Compensation of Directors and Executive Officers—Compensation Discussion and Analysis — Long-term Incentive Plan.” OP Units are exchangeable, except under certain limited circumstances, beginning one year from the date of issuance, which includes the holding period of any units that were converted into OP Units (e.g., LTIP Units), and have no expiration date. |
| (8) | Includes 22,311 shares of common stock that are subject to certain vesting restrictions. |
| (9) | Includes 20,000 shares of common stock that are subject to certain vesting restrictions. |
| (10) | Includes 53,325 shares of common stock that are subject to certain vesting restrictions. |
| (11) | Includes 43,601 shares of common stock that are subject to certain vesting restrictions. |
| (12) | Includes 45,762 shares of common stock that are subject to certain vesting restrictions. |
| (13) | Includes 3,601 shares of common stock that are subject to certain vesting restrictions. |
| (14) | Includes 4,010 shares of common stock that are subject to certain vesting restrictions. |
ARCP OP
ARCP owns approximately 97.3% of OP Units, which carry substantially all of the economic rights in ARCP OP. Certain affiliates of ARCP and certain unaffiliated investors are limited partners and owners of 1.7% and 1.0% of OP Units, respectively.
112
Table of Contents
This section contains information with respect to the directors and executive officers of ARCP as of the date of this filing. Because ARCP OP is managed by ARCP, and ARCP conducts substantially all of its operations through ARCP OP, ARCP OP refers to ARCP’s executive officers as its executive officers, and, although as a partnership ARCP OP does not have a board of directors, it refers to ARCP’s board of directors as its board of directors.
| Name | Age | Position | ||||
| Nicholas S. Schorsch* |
53 | Chairman and Chief Executive Officer | ||||
| David S. Kay* |
47 | President | ||||
| Lisa E. Beeson* |
49 | Chief Operating Officer | ||||
| Brian S. Block |
42 | Executive Vice President, Chief Financial Officer, Secretary and Treasurer | ||||
| Richard A. Silfen |
51 | Executive Vice President and General Counsel | ||||
| Lisa Pavelka McAlister |
51 | Senior Vice President and Principal Accounting Officer | ||||
| Leslie D. Michelson |
63 | Lead Independent Director | ||||
| Edward G. Rendell |
70 | Independent Director | ||||
| William G. Stanley |
59 | Independent Director | ||||
| Thomas A. Andruskevich |
63 | Independent Director | ||||
| Bruce D. Frank |
60 | Independent Director | ||||
| * | Mr. Kay is scheduled to become Chief Executive Officer and Director of ARCP and Lisa E. Beeson is scheduled to become President of ARCP, in addition to being its Chief Operating Officer, on October 1, 2014. At such time, Mr. Schorsch will retain his role as ARCP’s Chairman. |
Board of Directors
As noted in “Prospectus Summary—Governance, Management and Board of Directors Changes,” we announced on July 8, 2014 that certain of our independent directors would resign from their directorships on the board of any non-traded REITs sponsored by ARC. Each of Messrs. Michelson, Stanley and Rendell will take such necessary actions to complete such resignations as soon as possible, in accordance with public company requirements, providing the other boards sufficient time to find suitable replacements. Additionally, we announced on July 28, 2014 that one of our pre-2014 independent directors would be replaced with a new independent director to promote further board diversity, following a search performed by our Nominating and Corporate Governance Committee. On September 10, 2014, ARCP announced that Scott J. Bowman, who was one of ARCP’s legacy (pre-2014) independent directors, resigned from the Board of Directors and that it would add a new independent director to replace Mr. Bowman.
Nicholas S. Schorsch
Nicholas S. Schorsch currently serves as chairman and chief executive officer of ARCP. Mr. Schorsch previously served as chairman of American Realty Capital Trust, Inc., a publicly traded net lease REIT he co-founded in 2007, which listed on the NASDAQ in March 2012. Mr. Schorsch also serves as chairman and chief executive officer of ARC, which he co-founded in 2007, and as chief executive officer and/or a member of the board of directors of each publicly registered, investment sponsored by ARC. Mr. Schorsch also serves as executive chairman of RCAP. From September 2002 until August 2006, Mr. Schorsch served as chief executive officer of ARFT, which went public in 2003. He served as chief executive officer and president of American Financial Resource Group (“AFRG”), a private equity firm and AFRT’s predecessor, from 1995 to 2002. Through AFRT and AFRG, Mr. Schorsch executed in excess of 1,000 acquisitions of business and real estate property with a transactional value of approximately $5 billion. Mr. Schorsch has over 25 years of real estate experience and was dubbed the “Banker’s Landlord” by the Philadelphia Inquirer. He is a recipient of the Ernst & Young Entrepreneur of the Year 2003 Award for the greater Philadelphia area and of the Ernst & Young Entrepreneur of the Year 2011 Lifetime Achievement Award for real estate. Mr. Schorsch also served on the board of the National Association of Real Estate Investment Trusts (“NAREIT”) from 2005 to 2006.
113
Table of Contents
Leslie D. Michelson
Mr. Michelson is lead independent director and has served as an independent director of ARCP since October 2012. Mr. Michelson also serves as lead independent director of certain REITs sponsored by ARC and as an independent director of a non-traded business development company sponsored by ARC. Since 2007, he has served as the chairman and chief executive officer of Private Health Management, a retainer-based primary care medical practice management company. Mr. Michelson is also a director of Molecular Insight Pharmaceuticals, Inc., a biotechnology company developing innovating diagnostic and therapeutic products related to prostate cancer. He served as vice chairman and chief executive officer of the Prostate Cancer Foundation from April 2002 until December 2006 and currently serves on its board of directors. Mr. Michelson served on the board of directors of Catellus Development Corporation from 1997 until 2004. From April 2001 until April 2002, he invested in, and served as an advisor of, a portfolio of entrepreneurial healthcare, technology and real estate companies. From March 2000 until August 2001, he served as chief executive officer and a director of Acurian Inc. Mr. Michelson has served in various leadership capacities for several other investment, health care and biotechnology companies. He previously served as vice chairman and as a director of ALS-TDI, a philanthropic organization dedicated to curing Amytrophic Lateral Sclerosis.
Edward G. Rendell
Edward G. Rendell has served as an independent director of ARCP since February 2013 and previously served as an independent director of ARCP from July 2011 until October 2012. Governor Rendell also serves as an independent director of two REITs sponsored by ARC and of a non-traded business development company sponsored by ARC. Governor Rendell served as the 45th Governor of the Commonwealth of Pennsylvania from January 2003 to January 2011. As Governor, he served as the chief executive of the nation’s sixth most populous state, overseeing a budget of $28.3 billion. He also served as the Mayor of Philadelphia from January 1992 to January 2000. As Mayor, Governor Rendell eliminated a $250 million deficit, balanced the city’s budget and generated five consecutive budget surpluses. He also served as the general chairperson of the National Democratic Committee from November 1999 to February 2001 and as the district attorney of Philadelphia from January 1978 to January 1986. Governor Rendell is a veteran of the United States Army.
William G. Stanley
William G. Stanley has served as an independent director of ARCP since January 2014. Mr. Stanley also serves as lead independent director of two REITs sponsored by ARC and as an independent director of a non-traded business development company sponsored by ARC. He was appointed as the lead independent director of ARCT IV in January 2013. Mr. Stanley is the founder and has served as managing member of Stanley Laman Securities, LLC (“SLS”), a FINRA member broker-dealer, since 2004. Mr. Stanley is the founder and has served as president of The Stanley-Laman Group, Ltd. (“SLG”), a registered investment advisor for high net worth clients, since 1997. SLG has built a multi-member staff which critically and extensively studies the research of the world’s leading economists and technical analysts to support its tactical approach to portfolio management. Over its history, SLG and SLS have assembled an array of intellectual property in the investment, estate, tax and business planning arena. Mr. Stanley has earned designations as a Chartered Financial Consultant, Chartered Life Underwriter and received his Master of Science in Financial Services from the American College in 1997. Mr. Stanley holds FINRA Series 7, 63 and 24 licenses.
Thomas A. Andruskevich
Mr. Andruskevich has served as an independent director of ARCP since February 2014. Mr. Andruskevich served as an independent director of Cole from October 2008 until February 2014 and as a member of the audit committee of Cole from May 2012 until February 2014. Currently, Mr. Andruskevich is the vice chairman of Birks & Mayors, Inc., a high-end jewelry retailer which is the successor entity of the merger of Henry Birks & Sons Ltd. (“Henry Birks & Sons”) with Mayors Jewelers, Inc. (“Mayors”). Mr. Andruskevich also currently serves as chairman of Mayors, a wholly owned subsidiary of Birks & Mayors, Inc. From November 2005 until
114
Table of Contents
March 2012, Mr. Andruskevich served as president and chief executive officer of Birks & Mayors, Inc. From June 1996 until November 2005, he served as president and chief executive officer of Henry Birks & Sons, and from August 2002, when Henry Birks & Sons acquired a controlling interest in Mayors, until March 2012 he served as president and chief executive officer of Mayors. From 1994 to 1996, Mr. Andruskevich was president and chief executive officer of the clothing retailer Mondi of America. From 1989 to 1994, he was executive vice president of international trade & fragrance of Tiffany & Co., and from 1982 to 1989, Mr. Andruskevich served as senior vice president and chief financial officer of Tiffany & Co. He is a member of the advisory board and of the marketing committee of Brazilian Emeralds, Inc. Mr. Andruskevich also serves as a member of the board of directors of Birks & Mayors, Inc.
Bruce D. Frank
Mr. Frank has served as an independent director of ARCP since July 2014. Mr. Frank worked with Ernst & Young from April 1997 until June 2014 and most recently served as a senior partner with the assurance line of Ernst & Young’s real estate practice. Prior to joining Ernst & Young, Mr. Frank was at KPMG LLP (“KPMG”) from February 1980 until March 1997, where he served as an assurance partner of KPMG’s real estate practice. Mr. Frank has over 35 years of experience providing services to developers, owners and investors in all types of real estate holdings, including domestic and global assets. Mr. Frank currently serves as a member of the Real Estate Advisory Board of the New York University Schack Institute of Real Estate and as a member of NAREIT. Mr. Frank also serves as a member of the Association of Foreign Investors in U.S. Real Estate and previously served on its Legislative Affairs Committee. Mr. Frank holds a Bachelor of Science in Accounting from Bentley College and is a Certified Public Accountant in New York and New Jersey.
Executive Officers
Nicholas S. Schorsch
See “—Board of Directors—Nicholas S. Schorsch.”
David S. Kay
David S. Kay currently serves as president of ARCP. Prior to his appointment, Mr. Kay served as chief investment officer and chief financial officer of Capital Automotive Real Estate Services, Inc. (“Capital Automotive”), a specialty finance company for automotive real estate. He co-founded Capital Automotive REIT, Capital Automotive’s predecessor, in October 1997. As chief financial officer, Mr. Kay directed Capital Automotive’s $370 million initial public offering in 1998 and completed nearly $3 billion of real estate acquisitions during the following seven years. Before forming Capital Automotive REIT, Mr. Kay was employed by the public accounting firm Arthur Andersen LLP (“Arthur Andersen”) for approximately 10 years, where he provided clients with consultation regarding mergers and acquisitions, business planning and strategy and equity financing. Mr. Kay also has extensive experience in capital formation, roll-up transactions and public offerings. He also served as a member of the board of directors of Summit Hotel Properties, Inc., a premium-branded, limited-service and select-service hotel investment company. Mr. Kay has been named the Greater Washington Entrepreneur of the Year by Ernst & Young. He is active in many charitable foundations and organizations and is currently a member of the Executive Advisory Board of the James Madison University College of Business and a member of the board of the university’s Center for Entrepreneurship.
Lisa E. Beeson
Lisa E. Beeson currently serves as chief operating officer of ARCP. Before joining ARCP, Ms. Beeson was managing director and head of Global Real Estate M&A at Barclays, and previously held the same position at Lehman Brothers. Prior to joining Lehman Brothers, Ms. Beeson was a managing director at Morgan Stanley and Wachovia Securities. Ms. Beeson has over 25 years of investment banking experience, during which time she has worked on transactions with an aggregate value exceeding $400 billion, including in excess of $150 billion in the
115
Table of Contents
lodging, gaming and various real estate sectors. Ms. Beeson has been the lead advisor on numerous net lease real estate transactions, including representing Spirit Capital Realty, Inc. in its acquisition of Cole Credit Property Trust II, Inc. and advising Corporate Property Associates 16—Global Incorporated in its sale to W.P. Carey Inc.
Brian S. Block
Brian S. Block currently serves as executive vice president, chief financial officer, secretary and treasurer of ARCP. Until ARCP’s transition to self-management in January 2014, Mr. Block served as executive vice president and chief financial officer of ARC and a number of publicly registered, non-traded direct investments sponsored by ARC. In his role as chief financial officer of these companies, Mr. Block was responsible for accounting, finance and reporting functions. Mr. Block also served as a director of RCAP from February 2013 until July 2014. From 2008 to 2012, he served as chief financial officer of ARCT. Mr. Block served as the senior vice president and chief accounting officer of AFRT from 2002 to 2007. From 2000 to 2002, Mr. Block served as chief financial officer of a venture capital-backed technology company, and from 1994 to 2000, he worked in public accounting at Ernst & Young and Arthur Andersen. Mr. Block has extensive experience in SEC reporting requirements and REIT tax compliance matters and is a certified public accountant and a member of the American Institute of Certified Public Accountants and of the Pennsylvania Institute of Certified Public Accountants. He currently serves on the REIT Committee and Financial Standards Subcommittee of the Investment Program Association.
Richard A. Silfen
Richard A. Silfen currently serves as executive vice president and general counsel of ARCP. Mr. Silfen has more than 25 years of experience in corporate and securities law. Prior to joining ARCP, Mr. Silfen served as global head of the Capital Markets Group of Duane Morris LLP, a global law firm with 26 offices in the United States, Asia, Europe and Latin America, where he practiced law from February 2007 to March 2014. In that role, Mr. Silfen practiced in the area of corporate law, with concentrations in securities and merger and acquisition transactions. Throughout his career, Mr. Silfen has advised publicly traded companies, including several real estate investment trusts, in connection with public and private debt and equity securities offerings. He has also advised numerous companies with regard to complex mergers and acquisition transactions and capital markets transactions. In addition, Mr. Silfen is experienced in assisting emerging and other businesses to develop plans for the growth and development of their businesses and technologies, including private equity and other financing transactions, collaborative and strategic partnerships and joint venture arrangements. Mr. Silfen has also worked with companies to facilitate public reporting and analysis of operating results, advised on internal audit functions and Sarbanes-Oxley compliance and has worked with companies to support and enhance strategies for communication with securities analysts and investors. Mr. Silfen received his Juris Doctor from The University of Alabama School of Law and his Bachelor of Arts in Physics from Baylor University. Mr. Silfen is licensed to practice law in Pennsylvania and Florida.
Lisa Pavelka McAlister
Lisa Pavelka McAlister currently serves as senior vice president and principal accounting officer of ARCP. Prior to joining ARCP in November 2013, Ms. McAlister held the position of managing director at PricewaterhouseCoopers (“PwC”) in its capital markets and accounting advisory services practice from September 2011 until August 2013. Prior to joining PwC, Ms. McAlister worked at BAML Capital Partners, the global private equity business unit of Bank of America Corporation (NYSE: BAC), where she served as chief operating officer from March 2010 until June 2011 and as chief financial officer from March 2008 until March 2010. Ms. McAlister has 25 years’ experience in senior financial roles in all aspects of financial and accounting operations, internal controls, information systems, treasury and investor relations for public companies in the private equity, real estate, financial services, healthcare and technology sectors. Ms. McAlister received her Bachelor of Accountancy from New Mexico State University and Master of Business Administration from Bentley University. Ms. McAlister is a Certified Public Accountant in New York and Arizona.
116
Table of Contents
Director Independence
Our board of directors has affirmatively determined that Leslie D. Michelson, Edward G. Rendell, William G. Stanley, Thomas A. Andruskevich and Bruce D. Frank have no material relationship with ARCP (either directly or as a partner, stockholder or officer of an organization that has a relationship with ARCP) other than as a director of ARCP and are “independent” within the meaning of NASDAQ’s director independence standards and, for Audit Committee members, NASDAQ’s independence standards for members of the audit committee, in each case, as currently in effect. There are no familial relationships between any of our independent directors and executive officers.
Election of Members to the Board of Directors
Directors are elected annually by ARCP’s stockholders, and there is no limit on the number of times a director may be elected to office. Each director serves until the next annual meeting of stockholders or (if longer) until his or her successor is duly elected and qualifies. ARCP’s charter provides that the number of directors shall be not less than the minimum number required by the MGCL nor more than fifteen; provided, however, that the number of directors may be changed from time to time by resolution adopted by the affirmative vote of a majority of the board of directors. The number of directors on our board of directors is currently fixed at eight.
Code of Business Conduct and Ethics and Board Committee Charters
ARCP has adopted a written Code of Ethics for all of the officers, employees and directors of ARCP and its subsidiaries, and charters for the Audit, Compensation, and Nominating and Corporate Governance Committees of our board of directors. The charters of the Audit, Compensation, and Nominating and Corporate Governance Committees give each of these Committees the authority to retain independent legal, accounting and other advisors.
You can find the Code of Ethics and the charters for the Audit, Compensation, and Nominating and Corporate Governance Committees in the Corporate Documents section of ARCP’s website, www.arcpreit.com, or by contacting us at the address or telephone number set forth below. ARCP intends to post on its website any disclosures that are required by law concerning amendments to, or waivers from, the Code of Ethics.
ARC Properties Operating Partnership, L.P.
c/o American Realty Capital Properties, Inc.
405 Park Avenue, 15th Floor
New York, New York 10022
(212) 415-6500
Committees of the Board of Directors
Audit Committee
Our Audit Committee currently consists of Messrs. Michelson, Rendell, Stanley and Frank. Mr. Michelson is currently the chair of the Audit Committee. Each Audit Committee member is an independent director and “financially literate” under the meaning of the applicable NASDAQ rules, as well as under the meaning of the applicable (i) provisions set forth in the Audit Committee charter and (ii) requirements set forth in the Exchange Act and the applicable SEC rules. Our board of directors has determined that Leslie D. Michelson is qualified as an Audit Committee financial expert as defined in Item 407(d)(5) of Regulation S-K and under applicable SEC rules and regulations. The Audit Committee, in performing its duties, monitors: (i) the financial reporting process, auditing and internal control activities, including the integrity of our financial statements; (ii) compliance with legal and regulatory requirements; (iii) the independent auditor’s qualifications and independence; and (iv) the performance of the independent and internal auditors, as applicable. The Audit Committee is also responsible for engaging the independent registered public accounting firm, reviewing with the independent registered public accounting firm the plans and results of the audit engagement, approving
117
Table of Contents
professional services provided by the independent registered public accounting firm, considering the range of audit and non-audit fees, and reviewing the adequacy of the internal accounting controls.
Nominating and Corporate Governance Committee
Our Nominating and Corporate Governance Committee is comprised of Messrs. Michelson, Rendell and Stanley, each of whom is an independent director. Mr. Michelson is currently the chair of our Nominating and Corporate Governance Committee. The Nominating and Corporate Governance Committee was formed to establish and implement corporate governance practices and to nominate individuals for election to our board of directors. The Nominating and Corporate Governance Committee will consider candidates nominated by stockholders, provided that the stockholder submitting a nomination has complied with the procedures set forth in ARCP’s bylaws.
Compensation Committee
Our Compensation Committee is comprised of Messrs. Michelson, Rendell and Stanley, each of whom is an independent director. Mr. Michelson is currently the chair of our Compensation Committee. All of the members of the Compensation Committee are “non-employee directors” within the meaning of Section 16 of the Exchange Act and rules thereunder, and “outside directors” for purposes of Section 162(m) of the Code. The principal functions of the Compensation Committee are to: (i) approve and evaluate all compensation plans, policies and programs as they affect our executive officers; (ii) review and oversee management’s annual process, if any, for evaluating the performance of our senior officers, and review and approve on an annual basis the remuneration of our senior officers; (iii) oversee equity incentive plans, including, without limitation, the issuance of stock options, restricted shares of capital stock, restricted stock units, dividend equivalent shares, the 2014 Multi-Year Outperformance Plan and other equity-based awards; (iv) assist our board of directors and the executive chairman in overseeing the development of executive succession plans; and (v) determine from time to time the remuneration for non-executive directors. In carrying out its responsibilities, the Compensation Committee may delegate any or all of its responsibilities to a subcommittee to the extent consistent with ARCP’s charter, bylaws and any other applicable laws, rules and regulations.
Compensation Committee Interlocks and Insider Participation
None of the members of our Compensation Committee has, at any time, served as one of our officers or employees, or had any relationships with us requiring disclosure under applicable SEC rules and regulations.
118
Table of Contents
COMPENSATION OF DIRECTORS AND EXECUTIVE OFFICERS
Compensation Discussion and Analysis
This section provides both an overall and individual summary of the compensation paid to our named executive officers during the fiscal year ended December 31, 2013 and describes certain arrangements adopted for our named executive officers in connection with our transition to self-management effective January 8, 2014. Our named executive officers for fiscal 2014 are expected to be: Nicholas S. Schorsch, our Executive Chairman and Chief Executive Officer; Brian S. Block, our Chief Financial Officer, Treasurer, Secretary and Executive Vice President; Davis S. Kay, our President; and Lisa E. Beeson, our Chief Operating Officer. All such compensation was approved by the Compensation Committee, following discussions with and presentations from FTI Consulting, Inc. (“FTI”), as described further below in “—Role of Independent Compensation Consultant.” The Compensation Committee has resolved to meet at least quarterly during the fiscal year ending December 31, 2014 in order to evaluate the named executive officers’ performance against certain performance goals and to assess the compensation arrangements for our named executive officers, including consideration of the results of the non-binding advisory vote contained in Proposal 3 contained in ARCP’s definitive proxy statement for its 2014 annual meeting of stockholders.
Our Transition to Self-Management
During the fiscal year ended December 31, 2013, the Former Manager performed our day-to-day management services. During fiscal 2013, Messrs. Schorsch and Block were not employed by us and they received no compensation directly from us for the performance of their duties as executive officers.
In August 2013, the board of directors, in consultation with management, resolved to transition to self-management and eliminate our external management structure. Effective January 8, 2014, such transition to self-management was successfully consummated and our contractual relationship with the Former Manager was terminated. A 60-day tail period was established to finalize our transition toward becoming a self-managed real estate investment trust. A description of the Transition Services Agreement entered into in connection with the transition to self-management can be found below under “—Certain Relationships and Related Party Transactions—Transition to Self Management.”
Our planned transition toward self-management was the result of our successful transformation from a REIT with total assets of $256 million as of December 31, 2012 to the leading publicly traded net lease REIT, following our acquisition of Cole on February 7, 2014, at which time we had total assets exceeding $20 billion. We believe that in order to firmly establish ourselves as the leading publicly traded net lease REIT and a leading publicly traded company, we need a fully dedicated management team to:
| • | achieve general and administrative cost savings that can be passed on to investors; |
| • | have a staff and management team whose compensation is linked directly to our performance; and |
| • | receive market recognition for our growth by eliminating certain conflicts of interest that are unique to externally managed REITs. |
In connection with, and effective upon, our transition to self-management, on January 8, 2014, Mr. Schorsch, our chief executive officer and chairman since inception, became an employee of ours. Also in connection with, and effective upon, our transition to self-management, on January 8, 2014, Mr. Block, our chief financial officer and executive vice president since our inception, became a full-time employee of ours and resigned from all other executive officer positions that he had previously held in non-traded real estate investment programs sponsored by ARC and in RCAP. Mr. Kay and Ms. Beeson were each hired in 2013 by ARCP OP to be our executive officers. Mr. Kay commenced employment effective on December 16, 2013 and Ms. Beeson commenced employment effective on November 7, 2013.
In 2013, we acquired ARCT III and CapLease, as well as the GE Capital, Inland and Fortress Portfolios. Also in 2013, we announced the acquisitions of ARCT IV and Cole, which closed on January 3, 2014 and
119
Table of Contents
February 7, 2014, respectively. These transactions expanded our portfolio and required the coordination of various financings to achieve. We believe that we require strong leadership, motivated by a pay-for-performance compensation structure, to effectively manage our over $20 billion in assets, to incorporate the thousands of new properties acquired through our acquisitions, to use appropriate leverage to foster our continued growth, and in connection with our acquisition of Cole, to integrate over 300 new employees in a second headquarters in Phoenix, Arizona.
Overall Executive Compensation Philosophy
In connection with our transition to self-management, the objective of the compensation program approved by the Compensation Committee was to provide a pay-for-performance compensation package for our named executive officers structured to incentivize the named executive officers following the closing of our then pending transactions, including the agreement to complete our transformative acquisition of Cole. With our transitioning to becoming a leading self-managed REIT, the Compensation Committee also believed that paying a large portion of the named executive officers’ compensation in the form of restricted equity would incentivize the long-term dedication of such named executive officers. This aspect of the philosophy on executive compensation is highlighted in the form of equity inducement awards and annual equity incentive compensation. As discussed below, the resulting executive compensation package was designed to provide that, should our named executive officers meet their target performance thresholds, a substantial portion of each named executive officer’s compensation will be determined based on our performance.
Role of Independent Compensation Consultant
The Compensation Committee engaged FTI, an independent compensation consultant, to provide advice regarding the setting of our executive compensation program. In connection with the executive compensation program developed in connection with our transition to self-management, among other things, FTI provided the following services to the Compensation Committee: (i) providing presentations and making recommendations concerning our executive compensation program; (ii) providing market data; and (iii) assisting in the development of the peer group and performance benchmarking.
The peer group proposed by FTI and approved by the Compensation Committee was comprised of entities with similar size and revenue to us following the completion of our then pending transactions. Specifically, the peer group consisted of the following 12 REITs ranging from $7.4 billion in total assets to $32.0 billion in total assets: Alexandria Real Estate Equities, Inc.; American Tower Corporation; Boston Properties, Inc.; General Growth Properties, Inc.; HCP, Inc.; ProLogis, Inc.; Public Storage; Realty Income Corporation; Simon Property Group, Inc.; SL Green Realty Corp.; and Ventas, Inc. (collectively, the “Peer Group”).
Elements of Compensation
Below are descriptions of the key elements of our compensation program for our named executive officers, as adopted by the Compensation Committee after taking into consideration the information provided by FTI. The key components of our compensation program for named executive officers include: base salary; annual incentive compensation; inducement grants; long-term incentive compensation; severance and change in control payments; and benefits and other perquisites.
Employment Agreements
We have entered into employment agreements with Messrs. Schorsch and Block that became effective January 8, 2014, the date on which we successfully transitioned to self-management. No compensation was awarded or paid to Messrs. Schorsch and Block during the fiscal year ended December 31, 2013. In addition, in 2013, ARCP OP entered into employment agreements with Mr. Kay, which became effective on December 16, 2013, and Ms. Beeson, which became effective on November 7, 2013. The compensation, as contained in each named executive officer’s employment agreement, was based solely on peer group data and a focus on pay-for-performance.
Base Salary
Base salaries for each of Messrs. Schorsch, Kay and Block and Ms. Beeson were determined in light of comparative base salaries for executive officers in similar positions at the Peer Group companies. The terms of the respective employment agreements for each of Messrs. Schorsch, Block and Kay and Ms. Beeson provide for appropriate adjustments to the applicable executive officer’s base salary based upon annual reviews of such officer’s performance.
120
Table of Contents
The below table presents the initial base salaries for 2014 for each of the named executive officers and the responsible party for reviewing and adjusting each executive officer’s salary, as set forth in each executive officer’s employment agreement:
| Named Executive Officer |
2014 Salary (in U.S. dollars) |
Responsible Party | ||||
| Nicholas S. Schorsch |
$ | 1,100,000 | * | Compensation Committee | ||
| David S. Kay |
$ | 600,000 | CEO | |||
| Lisa E. Beeson |
$ | 450,000 | Compensation Committee and CEO | |||
| Brian S. Block |
$ | 500,000 | * | Compensation Committee | ||
| * | Base salary for Messrs. Schorsch and Block is required to be increased annually, at a minimum, by a percentage equivalent to the percentage increase in the Consumer Price Index for such year. |
ARCP OP commenced payment of base salary at the annual rates shown above to Mr. Kay and Ms. Beeson upon the commencement of their employment in 2013.
Annual Incentive Compensation
In order to ensure that the named executive officer’s compensation is tied to their performance, for fiscal 2014, annual incentive compensation will be determined following the Compensation Committee’s review of the named executive officers’ achievement of certain quantitative goals as well as analysis of the officers’ performance in achieving certain qualitative measures.
After review of comparative data, with respect to the annual incentive compensation provided to the Peer Group companies, cash and equity thresholds were established for fiscal 2014 for each of the named executive officers. The Compensation Committee believes that providing incentive compensation in the form of both cash and equity, with an emphasis on equity compensation, ensures that the named executive officers continue to stay incentivized to achieve their performance goals. The equity portion of the annual incentive compensation is designed to achieve our “skin-in-the-game” goals and consists of issuing restricted shares under our Equity Plan (as defined below). Additionally, annual incentive compensation is more heavily weighted toward equity compensation to closely align the named executive officers’ interests with our long-term growth. Overall, our executive compensation program has been structured such that the majority of the compensation is performance-based even at threshold level performance.
The below table presents the fiscal 2014 threshold, target and maximum annual cash and equity bonus amounts (as percentages of base salary) for each of the named executive officers.
| Named Executive Officer |
Threshold Equity Bonus Percentage |
Target Equity Bonus Percentage |
Maximum Equity Bonus Percentage |
Threshold Cash Bonus Percentage |
Target Cash Bonus Percentage |
Maximum Cash Bonus Percentage |
||||||||||||||||||
| Nicholas S. Schorsch |
350 | % | 450 | % | 550 | % | 250 | % | 350 | % | 450 | % | ||||||||||||
| David S. Kay |
250 | % | 350 | % | 450 | % | 150 | % | 250 | % | 350 | % | ||||||||||||
| Lisa E. Beeson |
150 | % | 200 | % | 250 | % | 100 | % | 150 | % | 200 | % | ||||||||||||
| Brian S. Block |
250 | % | 350 | % | 450 | % | 150 | % | 250 | % | 350 | % | ||||||||||||
As discussed above, the Compensation Committee’s evaluation of awards of annual incentive compensation will be based upon a mix of quantitative and qualitative measures where 80% of the evaluation will be tied to quantitative goals tied to company performance and 20% of the evaluation will be tied to the Compensation Committee’s qualitative assessment of the executive officers’ respective performance.
The below matrices provide a summary of the fiscal 2014 goals established for the named executive officers. The first table provides the metrics that will be used to determine the performances of Messrs. Kay and Block and Ms. Beeson and the second table provides the matrix that will be used to determine fiscal 2014 annual incentive compensation for Mr. Schorsch. Each component is comprised of subsets of goals, which are listed below such component. The Compensation Committee will consider each subset goal under each performance
121
Table of Contents
component listed to determine if the named executive officer should receive a threshold, target or maximum award for such performance component. In accordance with each executive officer’s employment agreement, the assignment of an achievement level will remain at the discretion of the Compensation Committee in the case of Messrs. Schorsch and Block, and at the discretion of the Compensation Committee, in consultation with Mr. Schorsch, in the case of Mr. Kay and Ms. Beeson.
Performance Goals for David S. Kay, Lisa E. Beeson and Brian S. Block
| Performance Component |
Subset Goal | Weighting | Threshold | Target | Maximum | |||||||
| Financial |
— | 20 | % | — | — | — | ||||||
| Investment Grade Rating |
— | Maintenance of either Moody’s or S&P |
Maintenance of both Moody’s and S&P |
Maintenance of Moody’s, S&P and Receipt of Fitch | ||||||||
| Meet Adjusted Funds From Operations Earnings |
— | $1.06 per share | $1.13 per share | Above $1.16 per share | ||||||||
| Successful Retention of Analyst |
— | 5 Research Analysts |
7 Research Analysts |
9 Research Analysts | ||||||||
| Private Capital Management (“PCM”) | — | 20 | % | — | — | — | ||||||
| Expand PCM Business |
— | $2.5 Billion Capital Raise |
$3.1 Billion Capital Raise |
$4.0 Billion Capital Raise | ||||||||
| Selling Agreements for New Programs(1) |
— | 75% of Predecessor Programs |
90% of Predecessor Programs |
110% of Predecessor Programs | ||||||||
| Monthly Advisor Meeting Count |
— | Same as 2013 | 15% Increase | 25% Increase | ||||||||
| Acquisitions and Portfolio Management | — | 20 | % | — | — | — | ||||||
| Individual Acquisitions and Sale-Leaseback Transactions |
— | $2.0 Billion | $2.5 Billion | $3.2 Billion | ||||||||
| Portfolio Metrics (Diversification, Investment Grade Tenancy and Occupancy) |
— | + or – 2.5% | + 5% | +7.5% | ||||||||
| Achievement of Post-Cole Merger Integration and Synergies | — | 20 | % | $70 Million in Savings |
$75 Million in Savings |
$85 Million in Savings | ||||||
| Improve Market Perception (Qualitative) | — | 10 | % | — | — | — | ||||||
| Personnel Integration & Synergies (Qualitative) | — | 10 | % | — | — | — | ||||||
122
Table of Contents
| (1) | “New programs” refers to two currently registered Cole Capital non-traded REIT offerings. “Predecessor programs” refers to recently closed Cole Capital non-traded REIT offerings. |
Performance Goals for Nicholas S. Schorsch
| Performance Component |
Subset Goal |
Weighting | Threshold | Target | Maximum | |||||
| Capital Structure | — | 25% | — | — | — | |||||
| Investment Grade Rating | — | Maintenance of either Moody’s or S&P |
Maintenance of both Moody’s and S&P |
Maintenance of Moody’s, S&P and | ||||||
| Earnings | — | 30% | — | — | — | |||||
| Meet Adjusted Funds From Operations Earnings Expectations | — | $1.06 per share |
$1.13 per share |
Above $1.16 per share | ||||||
| Management (Build Out, Hire and Maintain Executive Management Team) | — | 25% | — | — | — | |||||
| Improve Market Perception (Qualitative) | — | 10% | — | — | — | |||||
| Foster Positive Corporate Culture (Qualitative) | — | 10% | — | — | — | |||||
No annual incentive program was established for, and accordingly no annual incentive payments were made to, any of our named executive officers for fiscal 2013.
Inducement Grants
The Compensation Committee determined that it was appropriate to award each of the named executive officers with inducement grants in the form of restricted stock under the American Realty Capital Properties, Inc. Equity Plan (the “Equity Plan”) to make such officers whole for certain compensation forfeited upon leaving previously held positions and incentivize the officers’ long-term interest in our success. FTI provided the Compensation Committee with comparative data for officers serving for other REITs that the Compensation Committee considered when designing the equity awards for each of the named executive officers. Additionally, as an inducement to entering into their employment agreements, Mr. Kay received a $4.6 million cash inducement award as well as a $15,000 signing bonus and Ms. Beeson received a $750,000 cash inducement award, which awards were intended to put them in the same economic position they would have been in had they remained in their previous positions.
The following table provides a summary of the equity inducement awards that each of the named executive officers was entitled to receive pursuant to his or her respective employment agreement as well as the vesting schedule for each such equity award.
| Named Executive Officer |
Dollar Value of Equity Inducement Award |
Vesting Schedule | ||||||
| Nicholas S. Schorsch |
$ | 24,860,000 | 1/9 Each Year for 9 Years | (1) | ||||
| David S. Kay |
$ | 3,200,000 | 1/3 Each Year for 3 Years | (2) | ||||
| Lisa E. Beeson |
$ | 750,000 | 1/3 Each Year for 3 Years | (2) | ||||
| Brian S. Block |
$ | 10,000,000 | 1/7 Each Year for 7 Years | (1) | ||||
123
Table of Contents
| (1) | As described in further detail below in “—Potential Payments on Termination or Change of Control”, each of Messrs. Schorsch’s and Block’s employment agreements provide that the executive’s equity inducement award will vest in full, and all restrictions thereupon will lapse, in the event of the executive’s termination of employment for any reason. In addition, Messrs. Schorsch’s and Block’s equity inducement awards will vest in full in the event of a change of control. |
| (2) | As described in further detail below in “—Potential Payments on Termination or Change of Control”, each of Mr. Kay’s and Ms. Beeson’s employment agreements provide that the executive’s equity inducement award will vest in full, and all restrictions thereupon will lapse, in the event of the following terminations of the officers’ employment: by us without “cause” or for “disability”; due to the executive’s death; or for any reason upon a “change in control” which occurs more than 12 months after the effective date of the employment agreement and results in a negative impact of the executive’s duties or responsibilities. |
Long-term Incentive Compensation
In October 2013, the Compensation Committee approved the adoption of the 2014 Multi-Year Outperformance Plan (the “OPP”), which became effective as of January 8, 2014. The OPP was established to provide an element of incentive compensation to the named executive officers, among other participants, which would be tied directly to our performance in respect of the Absolute Component and Relative Component, described in the table below. Under the OPP, participants (including each of our named executive officers) are issued long term incentive plan units of ARCP OP (“LTIP Units”). The maximum award value of all LTIP Units that may be earned under the OPP will be $218.1 million, which is equal to approximately 5% of our equity market capitalization (the “OPP Cap”) at the time of the Compensation Committee’s approval of the OPP. Each participant in the OPP is granted the right to earn LTIP Units equal to a participation percentage of a portion of the OPP Cap upon the first, second and third anniversaries of October 1, 2013 (the “OPP Performance Commencement Date”). The LTIP Units are structured as profits interests in ARCP OP. The value of LTIP Units earned under the OPP will be determined based on our level of achievement of total return to stockholders, including both share price appreciation and common stock distributions (“Total Return”), as measured against both an absolute hurdle and against a peer group of companies, over the three-year Performance Period that commenced on the OPP Performance Commencement Date (the “Performance Period”), each 12-month period during the Performance Period (each an “Annual Period”) and the initial 24-month period of the Performance Period (the “Interim Period”), as follows:
| Performance Period |
Annual Period |
Interim Period |
||||||||||
| Absolute Component: 4% of any excess Total Return attained above an absolute hurdle measured from the beginning of such period: |
21% | 7% | 14% | |||||||||
| Relative Component: 4% of any excess Total Return attained above the median Total Return for the Performance Period of the Peer Group(1), subject to a ratable sliding scale factor as follows based on achievement of cumulative Total Return measured from the beginning of such period: |
||||||||||||
| • 100% will be earned if cumulative Total Return achieved is at least: |
18% | 6% | 12% | |||||||||
| • 50% will be earned if a cumulative Total Return achieved is: |
0% | 0% | 0% | |||||||||
| • 0% will be earned if cumulative Total Return achieved is less than: |
0% | 0% | 0% | |||||||||
| • a percentage from 50% to 100% calculated by linear interpolation will be earned if cumulative Total Return achieved is between: |
0% – 18% | 0% – 6% | 0% – 12% | |||||||||
| (1) | The “Peer Group” is comprised of the following companies: EPR Properties; Getty Realty Corporation; Lexington Realty Trust; National Retail Properties, Inc.; Realty Income Corporation; and Spirit Realty Capital, Inc. |
124
Table of Contents
The potential outperformance award is calculated at the end of each Annual Period, Interim Period and Performance Period. The award earned for the Performance Period is based on the formula in the table above less any awards earned for the Interim Period and Annual Periods, but not less than zero; the award earned for the Interim Period is based on the formula in the table above less any award earned for the first and second Annual Periods, but not less than zero. Any LTIP Units that are unearned at the end of the Performance Period will be forfeited.
Any incentive-based compensation payable under the OPP will be tied to our overall performance. Because the size of the award that our executives may receive under the OPP is based solely on the level of the applicable achievement of absolute and relative hurdles throughout the Performance Period, our executives must deliver consistent superior performance to earn higher amounts under the OPP. Accordingly, the OPP provides an additional form of incentive-based compensation that increases the weighting of our officers’ overall payout toward performance-based compensation.
LTIP Units were granted to the named executive officers effective on January 8, 2014. Additional LTIP Units may be granted by the Compensation Committee in its discretion. Subject to the participant’s continued service through each vesting date, one third of any earned LTIP Units will vest on each of the third, fourth and fifth anniversaries of the OPP Performance Commencement Date. Until such time as the LTIP Units are fully earned in accordance with the provisions of the OPP, the LTIP Units are entitled to distributions equal to 10% of the distributions made on the units of limited partnership interest in ARCP OP. After the LTIP Units are fully earned, they are entitled to a catch-up distribution and then the same distributions as the OP Units. At the participant’s capital account with respect to their LTIP Units is economically equivalent to the average capital account balance of the OP Units and have been earned and has been vested for 30 days, the applicable LTIP Units will automatically convert into OP Units on a one-to-one basis.
The OPP provides for early calculation and vesting of LTIP Units in the event of a change in control prior to the end of the Performance Period. Under the OPP, treatment of a participant’s award upon a termination of service will be governed by the terms of the participants’ OPP award agreement or service agreement with us. In the event a participant’s OPP award agreement or service agreement does not provide for treatment of the award upon the participant’s termination, then the award will be forfeited upon such termination. The OPP award agreements for Messrs. Schorsch and Block each provide for early calculation and vesting of LTIP Units if the executive’s employment is terminated for any reason other than for cause prior to the end of the Performance Period (but the LTIP Units will remain subject to certain transfer restrictions). In addition, the OPP award agreements for Messrs. Schorsch and Block provide for full vesting of unvested LTIP Units upon a termination of employment for any reason other than for cause following the end of the Performance Period. The employment agreements for Mr. Kay and Ms. Beeson provide that, in the event of termination of employment without cause or upon a change in control that occurs more than 12 months following the effective date of the employment agreement and which results in a negative impact on the executive’s duties and responsibilities, the applicable performance measurement calculations will be performed in accordance with the OPP and resulting awards shall be earned and will vest over the time period set forth in the OPP. Messrs. Schorsch and Block will be entitled to receive a tax gross-up in the event that any amounts paid to the participants under the OPP constitute “parachute payments” as defined in Section 280G of the Code.
Each of the OPP award agreements for the named executive officers was entered into effective January 8, 2014. The below table provides the participation percentage awarded to each named executive officer and the total number of LTIP Units issued to each of the named executive officers which represent the named executive officer’s participation percentage in the maximum potential OPP award pool, which may not ultimately be
earned, multiplied by the initial market cap and divided by $12.43 per LTIP Unit, the five-day trailing average closing price per share price of ARCP’s common stock on the OPP Performance Commencement Date.
| Named Executive Officer |
Participation Percentage |
Number of LTIP Units Issued under the OPP |
||||||
| Nicholas S. Schorsch |
42.50 | % | 7,455,504 | |||||
| David S. Kay |
5.00 | % | 877,118 | |||||
| Lisa E. Beeson |
3.75 | % | 657,839 | |||||
| Brian S. Block |
10.00 | % | 1,754,236 | |||||
125
Table of Contents
Severance and Change in Control Payments
Each of the named executive officer’s employment agreements provide for the payment or provision of certain benefits, bonuses and other compensation should the named executive officer be terminated without cause, due to death or disability, and due to voluntary resignation by the named executive officer under certain circumstances. The employment agreements for Messrs. Schorsch and Block provide for acceleration of certain equity awards upon any termination of employment, and enhanced severance payments if a termination of employment (other than for cause or due to death or disability) occurs following a change in control. In addition, upon a change in control, the employment agreements for Messrs. Schorsch and Block provide for acceleration of equity award vesting.
Please see “—Compensation, Discussion and Analysis—Potential Payments upon Termination or Change-in-Control” for a more comprehensive discussion of the payments, benefits and awards due to each of the named executive officers upon certain terminations.
Benefits and Other Perquisites
Pursuant to each named executive officer’s employment agreement, the named executive officer will be entitled to participate in the employee benefit plans made available to our executives. In addition, for Messrs. Schorsch and Block, we will maintain, at its cost, supplemental renewable long-term disability insurance as agreed to by us and the Executive, pay for an annual medical examination for the executive and pay or reimburse each executive for miscellaneous costs incurred up to a maximum annual amount for tax and financial planning. At the recommendation of the Board, we will cover costs incurred by Mr. Schorsch in connection with his employment of a driver/security personnel or the use of a car service. In the case of driver/security personnel, we will pay the cost of salary and financial benefits, plus such additional amount as necessary to have no federal, state or local tax effect on Mr. Schorsch.
The Compensation Committee found that such benefits were appropriate in that they provided the named executive officer with the same coverage as other full-time employees, as well as certain additional benefits that were appropriate for the particular named executive officer based on the Compensation Committee’s review of the benefits provided to other comparable executive officers in the Peer Group.
Deductibility of Executive Compensation
The Compensation Committee’s policy is to consider the tax treatment of compensation paid to our executive officers while simultaneously seeking to provide our executives with appropriate rewards for their performance. Under Section 162(m) of the Code, a publicly-held corporation may not deduct compensation of more than $1 million paid to any “covered employee” unless certain exceptions are met primarily related to performance-based compensation. Substantially all of the services rendered by our executive officers are performed on behalf of ARCP OP or its subsidiaries. The Internal Revenue Service has issued a series of private letter rulings which indicate that compensation paid by an operating partnership to executive officers of a REIT that serves as its general partner is not subject to limitation under Section 162(m) to the extent such compensation is attributable to services rendered to ARCP OP. ARCP has not obtained a ruling on this issue, but have no reason to believe that the same conclusion would not apply to ARCP. To the extent that compensation paid to our executive officers is subject to and does not qualify for deduction under Section 162(m), our Compensation Committee is prepared to exceed the limit on deductibility under Section 162(m) to the extent necessary to establish compensation programs that we believe provide appropriate incentives and reward our executives relative to their performance. Because ARCP qualifies as a REIT under the Code and generally distributes at least 100% of its net taxable income each year, ARCP does not pay federal income tax. As a result, and based on the level of cash compensation paid to our executive officers, the possible loss of a federal tax deduction would not be expected to have a material impact on us.
126
Table of Contents
Accounting for Stock-Based Compensation
We account for stock-based awards in accordance with the requirements of ASC Topic 718.
Summary Compensation Table
The following table sets forth information with respect to the aggregate compensation for Mr. Kay and Ms. Beeson for the fiscal year ended December 31, 2013, the first year in which compensation was paid to any of our named executive officers. During fiscal year 2013, Messrs. Schorsch and Block were not employed by us and they received no compensation directly from us for the performance of their duties our executive officers.
| Name and Principal Position |
Year | Salary (in dollars) |
Bonus (in dollars)(1) |
Stock Awards (in dollars)(2) |
All Other Compensation (in dollars) |
Total Compensation (in dollars) |
||||||||||||||||||
| David S. Kay—President |
2013 | $ | 25,000 | $ | 4,615,000 | $ | 3,216,548 | — | $ | 7,856,548 | ||||||||||||||
| Lisa E. Beeson—Chief Operating Officer |
2013 | $ | 68,182 | $ | 750,000 | $ | 732,313 | — | $ | 1,550,495 | ||||||||||||||
| (1) | Reflects cash inducement awards paid in connection with the commencement of the named executive officer’s employment and for Mr. Kay, a $15,000 signing bonus. |
| (2) | Reflects the grant date fair value of inducement stock awards granted by us in connection with the commencement of the named executive officer’s employment, computed in accordance with FASB ASC Topic 718. For further information on how we account for stock-based compensation, see Note 17 to the audited consolidated financial statements. These amounts reflect ARCP’s accounting expense for these awards and do not correspond to the actual amounts, if any, that will be recognized by the named executive officers. |
Grants of Plan-Based Awards
The following table sets forth information with respect awards granted to Mr. Kay and Ms. Beeson for the fiscal year ended December 31, 2013 as discussed in “—Compensation, Discussion and Analysis—Inducement Grants.” No other grants of plan-based awards were made to the named executive officers during fiscal 2013.
| Named Executive Officer |
Grant Date | Approval Date |
All Other Stock Awards: Number of Shares of Stock or Units(1) |
Grant Date Fair Value of Stock and Option Awards(2) |
||||||||||||
| David S. Kay |
12/31/2013 | 11/25/2013 | 250,315 | $ | 3,216,548 | |||||||||||
| Lisa E. Beeson |
12/06/2013 | 10/27/2013 | 57,212 | $ | 732,313 | |||||||||||
| (1) | Reflects the number of shares of restricted stock granted to the named executive officer in connection with the commencement of the named executive officer’s employment. These awards will vest in three equal installments on each of the first, second and third anniversaries of the grant date subject to the named executive officer’s continued service through the vesting date except that the shares of restricted stock will vest in the event of certain terminations of employment and in certain circumstances may vest upon a change in control. See “—Compensation, Discussion and Analysis—Potential Payments upon Termination or Change-in Control” for additional information. |
| (2) | Reflects the grant date fair value of inducement stock awards granted by us in connection with the commencement of the named executive officer’s employment, computed in accordance with FASB ASC Topic 718. For further information on how we account for stock-based compensation, see Note 17 to the audited consolidated financial statements. |
127
Table of Contents
Outstanding Equity Awards as of December 31, 2013
The following table provides a summary of the shares of restricted stock issued to Mr. Kay and Ms. Beeson which had not vested as of December 31, 2013. As of December 31, 2013, neither Mr. Schorsch nor Mr. Block held outstanding equity awards. The market value of restricted stock awards is based on the closing price of ARCP’s common stock on December 31, 2013 of $12.85.
| Named Executive Officer |
Number of Shares or Units of Stock That Have not Vested(1) |
Market Value of Shares or Units of Stock That Have not Vested |
||||||
| David S. Kay |
250,315 | $ | 3,216,548 | |||||
| Lisa E. Beeson |
57,212 | $ | 735,174 | |||||
| (1) | These awards will vest in three equal installments on each of the first, second and third anniversaries of the grant date subject to the named executive officer’s continued service through the vesting date except that the shares of restricted stock will vest in the event of certain terminations of employment and in certain circumstances may vest upon a change in control. See “—Compensation, Discussion and Analysis—Payments upon Termination or Change-in-Control” for additional information. |
Potential Payments upon Termination or Change-in-Control
Below are summary provisions with respect to the benefits and payments due to each of the named executive officers pursuant to their respective employment agreements.
Provisions for Nicholas S. Schorsch
| • | Death, Termination without Cause or for Disability or Termination by Mr. Schorsch for Good Reason: (i) Any earned and unpaid Base Salary, annual incentive compensation cash and equity awards, equity awards and expense reimbursements (including accrued but unused vacation) due at the time of such event (the “Accrued Obligations”), plus the fair value of any unvested equity awards; (ii) a prorated annual incentive compensation cash and equity award, each at the maximum level, for the year in which the event occurred; (iii) a lump sum amount equal to the sum of (i) Mr. Schorsch’s then annual base salary and (ii) the sum of his annual cash incentive bonus and annual equity incentive bonus (assuming target level performance) and equity units multiplied by (x) the remaining years in the initial nine-year term of the employment agreement for the first six years of the initial term and (y) 2.99 for each of the remaining years in the initial term and each year of any renewal term (together with items (i) and (ii), the “Severance Payment”); (iv) existing health benefits shall be made available to Mr. Schorsch, (and, in the case of disability or death, his spouse and eligible dependents) for two years thereafter; and (v) all equity awards shall vest immediately. |
| • | Termination for Cause or by Mr. Schorsch without Good Reason: The Accrued Obligations and a prorated portion of any applicable threshold level annual incentive compensation cash and equity awards due for the year in which such termination occurred. In addition, all equity awards vest immediately, unless otherwise provided under any applicable conditions on the award. |
| • | Change of Control: If Mr. Schorsch’s employment is terminated within two years following a change of control for any reason other than Cause, death or disability, he shall be entitled to the greater of: (i) 2.99 multiplied by: (x) the three-year average of Mr. Schorsch’s Base Salary for the three calendar years preceding the termination; plus (y) the average annual incentive compensation cash award actually received for the three full fiscal years preceding such termination; and (ii) the Severance Payment. If Mr. Schorsch is terminated within six months prior to a change of control, he shall be entitled to an additional amount equal to the amount by which item (i) above exceeds item (ii) above. All outstanding equity awards shall vest in full immediately on a change of control, regardless of whether Mr. Schorsch’s employment is terminated. |
128
Table of Contents
Provisions for David S. Kay and Lisa E. Beeson
| • | Termination due to Death or for Disability: Earned and accrued but unpaid Base Salary through the date of termination in accordance with normal payroll practice, unreimbursed business expenses through the date of termination, payments and benefits due under the officer’s employee benefit plan (collectively, the “Accrued Benefits”) and any accrued and unpaid annual incentive compensation cash award for the year prior to the year of termination. In addition, shares issued as part of the officer’s inducement grant and any previously granted annual incentive compensation equity awards shall vest in full. Additionally, life insurance benefits will be allocated to the applicable named executive officer’s heirs. |
| • | Termination without Cause or in certain circumstances upon a Change of Control: The following applies upon a termination by us without cause, or for any reason upon a change of control that occurs more than 12 months after the effective date of the officer’s employment agreement and that results in a negative impact on the executive’s duties and responsibilities. In such circumstances, the officers will be due the Accrued Benefits, any accrued but unpaid annual incentive compensation cash awards for the year prior to the year in which termination occurred, and an amount equal to 12 months of base salary plus a threshold level annual incentive compensation cash award. Additionally, the officer’s inducement grant shall vest in full; any previously granted annual stock bonus will not be forfeited but will continue to vest in accordance with the terms of the Equity Plan; and the applicable performance measurement calculations shall be performed in accordance with the OPP and resulting awards shall be granted to the executive and will vest over the time period set forth in the OPP. |
| • | Termination for Cause or Non-Renewal: Should the officers be terminated for cause or upon the non-renewal of the initial term or any renewal term of his or her employment agreement by either party, we will only pay the officers the Accrued Benefits. |
| • | Voluntary Resignation: Should the officers resign voluntarily in any circumstance other than a change of control or the non-renewal of the initial term or any renewal term of his or her employment agreement, the officers shall receive the Accrued Benefits, an amount equal to 12 months of Base Salary and health benefits for 12 months. |
Provisions for Brian S. Block
| • | Death or Termination for Disability: Such terms are similar to those provided for Mr. Schorsch under the same circumstances. |
| • | Termination without Cause or by Mr. Block for Good Reason: Such terms are similar to those provided for Mr. Schorsch under the same circumstances. |
| • | Termination for Cause or Voluntary Resignation without Good Reason: Such terms are similar to those provided for Mr. Schorsch upon a termination by us for cause or a resignation without good reason. |
| • | Non-Renewal by Us or Mr. Block: No payments shall be due, but all equity awards vest immediately, unless otherwise provided under any applicable conditions on the award. |
| • | Change of Control: Such terms are similar to those provided for Mr. Schorsch under the same circumstances. |
In addition, as described above in “—Compensation, Discussion and Analysis—Long-term Incentive Compensation,” the OPP award agreements for Messrs. Schorsch and Block each provide for early calculation and vesting of LTIP Units if the executive’s employment is terminated for any reason other than for cause prior to the end of the Performance Period (but the LTIP Units will remain subject to certain transfer restrictions). In addition, the OPP award agreements for Messrs. Schorsch and Block provide for full vesting of unvested LTIP Units upon a termination of employment for any reason other than for cause following the end of the
129
Table of Contents
Performance Period. Messrs. Schorsch and Block will be entitled to receive a tax gross-up in the event that any amounts paid to the participants under the OPP constitute “parachute payments” as defined in Section 280G of the Code.
Termination Scenario Table
The table below provides certain estimates of the payments and benefits that would be provided under the following terminations as if they had occurred as of December 31, 2013, prior to the time that annual incentive compensation had been structured. The value of vested equity is based on the closing price of ARCP’s common stock on December 31, 2013 of $12.85. Neither Mr. Schorsch nor Mr. Block had effective employment agreements as of December 31, 2013 and therefore the below table is inapplicable to them (amounts in dollars).
| Named Executive Officer and Termination Scenario |
Severance | Vested Equity | Health Benefits | Total Payout | ||||||||||||
| David S. Kay |
||||||||||||||||
| Death or Disability |
$ | — | $ | 3,216,548 | $ | — | $ | 3,216,548 | ||||||||
| Without Cause |
$ | 1,500,000 | $ | 3,216,548 | $ | — | $ | 4,716,548 | ||||||||
| For Cause or Non-Renewal |
$ | — | $ | — | $ | — | $ | 0 | ||||||||
| Voluntary Resignation |
$ | 600,000 | $ | — | $ | 32,536 | $ | 632,536 | ||||||||
| Lisa E. Beeson |
||||||||||||||||
| Death or Disability |
$ | — | $ | 735,174 | $ | — | $ | 735,174 | ||||||||
| Without Cause |
$ | 900,000 | $ | 735,174 | $ | — | $ | 1,635,174 | ||||||||
| For Cause or Non-Renewal |
$ | — | $ | — | $ | — | $ | 0 | ||||||||
| Voluntary Resignation |
$ | 450,000 | $ | — | $ | — | $ | 450,000 | ||||||||
Risk Management
The Compensation Committee established the named executive officers’ incentive compensation based upon a mix of quantitative and qualitative goals described above in “—Compensation, Discussion and Analysis—Annual Incentive Compensation.” To the extent that the Compensation Committee, at the close of 2014, finds that such measures were inappropriate for the business, represented targets that were too high or were too easily attainable, adjustments will be made. Annual Incentive Compensation will be paid to other executive officers and employees in light of the same quantitative and qualitative goals set forth for the named executive officers. Thus, each member of the organization’s incentives is aligned and any risks posed to us by our annual incentive compensation structure will be reevaluated by the Compensation Committee on an annual basis, as necessary. In addition, the Compensation Committee believes that its compensation policies, plans and programs balance short-term, long-term, guaranteed and performance based compensation in order not to encourage excessive risk-taking. In addition, a significant portion of our compensation policies, plans and programs consist of equity based and long-term performance based compensation. The Compensation Committee believes that its compensation policies, plans and programs have no material adverse effect on us.
130
Table of Contents
CERTAIN RELATIONSHIPS AND RELATED PARTY TRANSACTIONS
Transition to Self-Management
We successfully completed our transition to self management on January 8, 2014. In the process, we also discontinued certain relationships with affiliates and entities under common ownership with the Former Manager, an entity wholly owned by ARC, of which Nicholas S. Schorsch and Brian S. Block, current executive officers and/or directors of ARCP, and William M. Kahane and Edward M. Weil, Jr., former directors of ARCP, are members, and in which Peter M. Budko, a former executive officer of ARCP, owns an interest. Messrs. Schorsch and Kahane are controlling members of ARC. Below is a summary of the relationships and arrangements by which we incurred related party fees and expenses in connection with our transition to self-management.
Termination of Management Agreement
On January 8, 2014, ARCP and ARCP OP terminated the amended and restated management agreement with the Former Manager, whereby the Former Manager managed our day-to-day operations until such date. As part of such termination, effective January 8, 2014, the Former Manager continued to provide services previously provided under the amended and restated management agreement, to the extent required by us, for a tail period of 60 days following January 8, 2014, and received a payment in the amount of $10.0 million for providing such services.
Under the amended and restated management agreement, we had agreed to pay the Former Manager an annual base management fee equal to 0.50% of the average unadjusted book value of our real estate assets for up to $3.0 billion and 0.40% of the average unadjusted book value of our real assets greater than $3.0 billion, in each case, calculated and payable monthly in advance, and to reimburse the Former Manager for all out of pocket costs actually incurred by the Former Manager related to us. We paid $14.0 million in annual base management fee to the Former Manager pursuant to the amended and restated management agreement, $6.1 million of which was waived by the Former Manager.
The Former Manager used the proceeds from its annual base management fee in part to pay compensation to its officers and personnel who, notwithstanding that certain of them also are our officers, receive no cash compensation directly from us. The management fee was payable independent of the performance of our portfolio.
We also agreed to pay the Former Manager an incentive fee with respect to each calendar quarter (or part thereof that the amended and restated management agreement was in effect) in arrears. The incentive fee was an amount, not less than zero, equal to the difference between (1) the product of (x) 20% and (y) the difference between (i) our Core Earnings (as defined below) for the previous 12-month period, and (ii) the product of (x) the weighted average of the issue price per share of ARCP’s common stock of all of ARCP’s public offerings of common stock multiplied by the number of all shares of common stock outstanding (including any restricted shares of common stock and any other shares of common stock underlying awards granted under our equity incentive plans) in the previous 12-month period, and (y) 8% and (2) the sum of any incentive fee paid to the Former Manager with respect to the first three calendar quarters of such previous 12-month period; provided, however, that no incentive fee was payable with respect to any calendar quarter unless Core Earnings for the 12 most recently completed calendar quarters was greater than zero. No incentive fees were paid to the Former Manager from February 28, 2013 until January 8, 2014, pursuant to the terms of the amended and restated management agreement.
“Core Earnings” is a non-GAAP measure and is defined as GAAP net income (loss) excluding non-cash equity compensation expense, the incentive fee, acquisition fees, financing fees, depreciation and amortization, any unrealized gains, losses or other non-cash items recorded in net income for the period, regardless of whether such items are included in other comprehensive income or loss, or in net income. The amount is adjusted to exclude one-time events pursuant to changes in GAAP and certain other non-cash charges after discussions
131
Table of Contents
between the Former Manager and our independent directors and after approval by a majority of our independent directors.
Nicholas S. Schorsch, our chief executive officer and chairman of our board of directors, was the chief executive officer of the Former Manager. Edward M. Weil, Jr., formerly ARCP’s director, president, chief operating officer, treasurer and secretary, was the president, chief operating officer, treasurer and secretary of the Former Manager. Brian S. Block, ARCP’s executive vice president, treasurer, secretary and chief financial officer, was the executive vice president and chief financial officer of the Former Manager. William M. Kahane, one of ARCP’s former directors, owned a controlling interest in the parent of the Former Manager.
Assumption of RCS Advisory Services, LLC Services Agreement
Pursuant to an Assignment and Assumption Agreement dated January 8, 2014, between ARC (the parent of the Former Manager) and RCS Advisory Services, LLC, an entity under common ownership with the Former Manager, ARC assigned to us, and we assumed, the rights and obligations under that certain Services Agreement (the “Services Agreement”), dated as of June 10, 2013, between ARC and RCS Advisory Services, LLC. Under the Services Agreement, RCS Advisory Services, LLC and its affiliates may provide certain transaction management services to us (including, without limitation, offering registration, regulatory advice with respect to the SEC and FINRA, registration maintenance, transaction management, marketing support, due diligence advice, events training and education, and conference management) and other services, employees and other resources. Such services are charged hourly. To date, we incurred $0.8 million of fees under the Services Agreement. See Note 18- Related Party Transactions and Arrangements to the audited consolidated financial statements for further discussion.
Transition Services Agreement
Pursuant to a Transition Services Agreement, dated October 21, 2013, affiliates of the Former Manager agreed to provide certain transition services to us, including accounting support, acquisition support, investor relations support, public relations support, human resources and administration, payroll services, benefits services, insurance and risk management, information technology, telecommunications and internet, and services relating to office supplies. The Transition Services Agreement was in effect for a 60-day term beginning on January 8, 2014. Such services were charged hourly. During the 60-day tail period, we incurred $10.0 million of fees under the Transition Services Agreement.
Purchase of Furniture, Fixtures and Equipment
On January 8, 2014, ARCP, through ARCP OP, entered into an Asset Purchase and Sale Agreement with the Former Manager, pursuant to which the Former Manager transferred to ARCP furniture, fixtures and equipment used by the Former Manager in connection with our business. Under the Asset Purchase and Sale Agreement, we paid the Former Manager $10.0 million for such furniture, fixtures and equipment and certain unreimbursed expenses.
Fees Paid in Connection with the Disposition of the Multi-Tenant Business
Pursuant to an agreement between ARCP and RCS by which RCS would provide to ARCP strategic and financial advisory services in connection with the disposition of the multi-tenant business, we incurred and paid $1.8 million in fees. We do not expect to incur any additional charges under this agreement.
2013 Advisor Multi-Year Performance Plan
In 2013, ARCP entered into an Advisor Multi-Year Outperformance Agreement (the “Advisor OPP”) with ARCP OP and the Former Manager. Under the Advisor OPP, the Former Manager was granted 8,241,101 of target long term incentive plan units of ARCP OP (“LTIP Units”) which, pursuant to the terms of the Advisor OPP, were to be earned or forfeited based on the level of achievement of the performance metrics under the Advisor OPP. The performance period under the Advisor OPP commenced on December 11, 2012 and was scheduled to end on December 31, 2015, with interim measurement periods ending on December 31, 2013 and 2014. Any LTIP Units earned under the Advisor OPP were to vest one third on each of December 31, 2015, 2016 and 2017, and the Former Manager would have been entitled to convert LTIP Units into OP Units within 30 days
132
Table of Contents
following each vesting date. In addition, the Advisor OPP provided for accelerated earning and vesting of LTIP Units if the Former Manager was terminated or if we experienced a change in control. The Former Manager was entitled to receive a tax gross-up in the event that any amounts paid to it under the Advisor OPP constituted “parachute payments” as defined in Section 280G of the Code.
Effective January 8, 2014, in connection with our successful transition to self-management, the Compensation Committee determined that each of the 8,241,101 LTIP Units issued under the Advisor OPP were fully vested and earned. The LTIP Units were converted into OP Units by the Former Manager and distributed to the members of ARC ratably.
The Former Manager is directly wholly owned by ARC. For a description of the ownership interests of our officers and directors in ARC, see “—Transition to Self-Management” above.
Acquisition and Capital Services Agreement
We were a party to an Acquisition and Capital Services Agreement with ARC, which terminated on February 28, 2013. Pursuant to the Acquisition and Capital Services Agreement, the Former Manager was provided with access to, among other things, ARC’s portfolio management, asset valuation, risk management and asset management services, as well as administration services addressing legal, compliance, investor relations and information technologies necessary for the performance of the Former Manager’s duties in exchange for us paying ARC the following fees and expense reimbursements:
| • | an acquisition fee equal to 1.0% of the contract purchase price (including assumed indebtedness) of each property we acquired that was originated by ARC; |
| • | a financing fee equal to 0.75% of the amount available under any secured mortgage financing or refinancing that we obtained and used for the acquisition of properties that was arranged by ARC; and |
| • | reimbursement for all out of pocket costs actually incurred by ARC related to us (such reimbursements were made in cash on a monthly basis following the end of each month). |
Total acquisition and financing fees incurred for the year ended December 31, 2013 under the Acquisition and Capital Services Agreement were $3.1 million and $7.5 million, respectively. Through December 31, 2013, we incurred $16.2 million of other expense reimbursements to ARC.
The Former Manager is directly wholly owned by ARC. For a description of the ownership interests our officers and directors in ARC, see “—Transition to Self-Management” above.
Tax Protection Agreement
We are party to a Tax Protection Agreement with the Contributor, an affiliate of ARC, which contributed its 100% indirect ownership interests in 63 of our properties to ARCP OP in the formation transactions related to ARCP’s IPO. Pursuant to the Tax Protection Agreement, we have agreed to indemnify the Contributor for its tax liabilities (plus an additional amount equal to the taxes incurred as a result of such indemnity payment) attributable to its built-in gain, as of the closing of the formation transactions, with respect to its interests in the contributed properties (other than two vacant properties), if we sell, convey, transfer or otherwise dispose of all or any portion of these interests in a taxable transaction on or prior to September 6, 2021. The sole and exclusive rights and remedies of the Contributor under the Tax Protection Agreement will be a claim against ARCP OP for the Contributor’s tax liabilities as calculated under the Tax Protection Agreement, and the Contributor is not entitled to pursue a claim for specific performance or bring a claim against any person that acquires a protected party (as defined under the Tax Protection Agreement) from ARCP OP in violation of the Tax Protection Agreement. The Contributor is owned and controlled in the same manner as ARC. For a description of the ownership interests of our officers and directors in ARC, see “—Transition to Self-Management” above.
133
Table of Contents
Acquisition of ARCT III
On February 28, 2013, we acquired ARCT III pursuant to the ARCT III Merger Agreement. In addition, pursuant to the ARCT III Merger Agreement, ARCT III OP completed its merger with and into ARCP OP, with ARCP OP being the surviving entity (the “ARCT III Partnership Merger”).
In connection with the consummation of the ARCT III Merger and the ARCT III Partnership Merger, certain entities directly or indirectly owned by ARC and entities under common ownership with ARC at the time received the following amounts from us:
| Recipient |
Description |
Amount | ||||
| American Realty Capital Advisors III, LLC | Sale of certain furniture, fixtures, equipment and other assets and reimbursement of certain costs | $ | 5,800,000 | |||
| ARC Advisory Services, LLC | Provision of legal support services prior to the date of the ARCT III Merger Agreement | $ | 500,000 | |||
| Realty Capital Securities, LLC and ARC Advisory Services, LLC | Retention as non-exclusive financial advisor and information agent, respectively, to us in connection with the ARCT III Merger | $ | 640,000 | |||
| ARC Advisory Services, LLC | Provision of certain transition services in connection with the ARCT III Merger Agreement | $ | 2,000,000 | |||
In addition, on February 28, 2013, ARCP OP entered into a Contribution and Exchange Agreement (the “ARCT III Contribution and Exchange Agreement”) with ARCT III OP and American Realty Capital Trust III Special Limited Partner, LLC (the “ARCT III Special Limited Partner”), the holder of the special limited partner interest (the “ARCT III SLP Interest”) in ARCT III OP. The ARCT III SLP Interest entitled the ARCT III Special Limited Partner to receive certain distributions from ARCT III OP, including a subordinated distribution of net sales proceeds resulting from an “investment liquidity event” (as defined in the agreement of limited partnership of ARCT III OP). The ARCT III Merger constituted an “investment liquidity event,” as a result of which the ARCT III Special Limited Partner, in connection with management’s successful attainment of a 6% performance hurdle and the return to ARCT III’s stockholders of $557.3 million in addition to their initial investment, was entitled to receive a subordinated distribution of net sales proceeds from ARCT III OP in an amount equal to approximately $98.4 million (the “ARCT III Subordinated Distribution Amount”). Pursuant to the ARCT III Contribution and Exchange Agreement, the ARCT III Special Limited Partner contributed its ARCT III SLP Interest (with a value equal to the ARCT III Subordinated Distribution Amount), together with $750,000 in cash, to ARCT III OP in exchange for an amount of common units of equity ownership of ARCT III OP equivalent to 7,318,356 OP Units, which were automatically converted into such OP Units upon consummation of the ARCT III Partnership Merger. ARC directly wholly owned the ARCT III Special Limited Partner. For a description of the ownership interests of our officers and directors in ARC, see “—Transition to Self-Management” above. For a description of the ownership interests of our officers and directors in Realty Capital Securities, LLC, please see “—Provision of Investment Banking Services by RCS” below.
Acquisition of ARCT IV
On January 3, 2014, we acquired ARCT IV pursuant to the ARCT IV Merger Agreement. In addition, pursuant to the ARCT IV Merger Agreement, ARCT IV OP completed its merger with and into ARCP OP, with ARCP OP being the surviving entity (the “ARCT IV Partnership Merger”).
134
Table of Contents
In connection with the consummation of the ARCT IV Merger and the ARCT IV Partnership Merger, certain entities directly or indirectly owned by ARC or under common ownership with ARC at the time received the following amounts from us:
| Recipient |
Description |
Amount | ||||
| American Realty Capital Advisors IV, LLC |
Sale of certain furniture, fixtures, equipment and other assets and reimbursement of certain costs |
$ | 5,800,000 | |||
| Realty Capital Securities, LLC, RCS Advisory Services, LLC and American National Stock Transfer, LLC | Retention as non-exclusive advisor and information agent, respectively, to us in connection with the ARCT IV Merger | $ | 640,000 | |||
| Realty Capital Securities, LLC | Provision of financial advisory and strategic services to us prior to the consummation of the ARCT IV Merger | $ | 7,662,369 | |||
| ARC Advisory Services, LLC and RCS Advisory Services, LLC | Provision of legal support services prior to the date of the ARCT IV Merger Agreement | $ | 500,000 | |||
| Realty Capital Securities, LLC, RCS Advisory Services, LLC and American National Stock Transfer, LLC | Retention as non-exclusive advisor and information agent, respectively, to ARCT IV in connection with the ARCT IV Merger |
$ | 750,000 | |||
| ARC Advisory Services, LLC and RCS Advisory Services, LLC | Provision of certain transition services in connection with the ARCT IV Merger | $ | 2,000,000 | |||
| Realty Capital Securities, LLC | Provision of financial advisory and strategic services to ARCT IV prior to the consummation of the ARCT IV Merger | $ | 7,662,369 | |||
In addition, on January 3, 2014, ARCP OP entered into a Contribution and Exchange Agreement (the “ARCT IV Contribution and Exchange Agreement”) with American Realty Capital Trust IV Special Limited Partner, LLC (the “ARCT IV Special Limited Partner”), the Contributor and ARCT IV OP. In connection with ARCT IV management’s successful attainment of the 6% performance hurdle and the return to the ARCT IV’s stockholders of approximately $358.3 million in addition to their initial investment (determined based on the value of the merger consideration per share of ARCT IV’s common stock of (i) $9.00 in cash, (ii) 0.5190 of a share of the common stock (valued at $6.70 using the common stock closing price of $12.91 on the trading day of the ARCT IV Merger and representing 21.9% of the total nominal consideration), and (iii) 0.5937 of a share of our 6.70% Series F Cumulative Redeemable Preferred Stock (NASDAQ: ARCPP) (valued at $14.84 based on the liquidation preference of $25.00 per share and representing 48.6% of the total nominal consideration), for a fixed nominal consideration, as of January 3, 2014, of $30.54), the ARCT IV Special Limited Partner was entitled to receive a subordinated distribution of net sales proceeds from ARCT IV OP in an amount equal to approximately $63.2 million (the “ARCT IV Subordinated Distribution Amount”). Pursuant to the ARCT IV Contribution and Exchange Agreement, (i) the ARCT IV Special Limited Partner contributed its interest (with a value equal to the ARCT IV Subordinated Distribution Amount) to ARCT IV OP in exchange for an amount of common units of equity ownership of ARCT IV OP equivalent to 6,734,148 OP Units, which were automatically converted into such OP Units upon consummation of the ARCT IV Partnership Merger and (ii) the Contributor, contributed $750,000 in cash to ARCT IV OP, effective prior to the consummation of the ARCT IV Merger and ARCT IV Partnership Merger, in exchange for an amount of common units of equity ownership of ARCT IV OP equivalent to 79,872 OP Units, which were automatically converted into such OP Units upon consummation of the ARCT IV Partnership Merger. For a description of the ownership interests of our officers and directors in ARC, see “—Transition to Self-Management” above. For a description of the ownership interests of our officers and directors in Realty Capital Securities, LLC and RCS Advisory Services, LLC, see “—Provision of Investment Banking Services by RCS” below.
135
Table of Contents
Acquisition of Cole
On February 7, 2014, we acquired Cole pursuant to the Cole Merger Agreement.
In connection with the consummation of the Cole Merger, certain entities directly or indirectly owned by ARC and entities under common ownership with ARC at the time received the following amounts from us (excluding certain fees and arrangements described in “—Transition to Self-Management”):
| Recipient |
Description |
Amount | ||||
| Realty Capital Securities, LLC | Provision of financial advisory and strategic services to us prior to the consummation of the Cole Merger |
$ | 28,000,000 | |||
| Realty Capital Securities, LLC, RCS Advisory Services, LLC and American National Stock Transfer, LLC | Retention as non-exclusive advisor and information agent, respectively, to us in connection with the Cole Merger | $ | 750,000 | |||
| RCS Advisory Services, LLC | Provision of certain transaction management services in connection with the Cole Merger | $ | 2,900,000 | |||
Provision of Investment Banking Services by RCS
To date and throughout the fiscal year ended December 31, 2013, we have engaged RCS Capital (“RCS”), the investment banking and capital markets division of Realty Capital Securities, LLC, to provide investment banking and strategic advisory services to us in connection with several mergers (including the ARCT IV Merger and the Cole Merger described above), large portfolio acquisitions and certain equity and debt offerings. Each engagement provided for a standard success-based fee or structuring fee that was paid or is payable at the closing of a particular transaction. Additionally, such engagements provided for the reimbursement of certain out of pocket expenses to RCS in connection with the provision of services in respect of such engagements. In the aggregate, since January 1, 2013, we have paid $48.9 million of fees and incurred $0.8 million of expenses in connection with such engagements.
In connection with the equity offering on May 28, 2014, we paid RCS a structuring fee of $2.0 million in connection with the structuring services it provided in connection with the Equity Offering. As noted in “Prospectus Summary—Company—Governance, Management and Board of Director Changes,” as of July 8, 2014 ARCP and RCAP, the parent of RCS Capital, mutually agreed to terminate their investment banking relationship.
Realty Capital Securities, LLC, RCS Advisory Services, LLC and American National Stock Transfer, LLC are subsidiaries of RCAP, which is controlled by the same individuals who own and control ARC. Thus, Messrs. Schorsch and Block, current executive officers and/or directors of ARCP, and Messrs. Kahane, Weil and Budko, former executive officers and/or directors of ARCP, control RCAP.
Certain Conflict Resolution Procedures
Establishment of Conflicts Committee
Pursuant to the terms of the Cole Merger Agreement, effective as of February 7, 2014, our board of directors adopted an amendment to the bylaws of ARCP (the “Bylaw Amendment”) relating to the creation of the Conflicts Committee. The Conflicts Committee currently consists of three independent directors: Leslie D. Michelson, William G. Stanley and Thomas A. Andruskevich. Under the Bylaw Amendment, a majority of the Conflicts Committee must approve any material contracts and transactions between ARCP and ARC and its affiliates (subject to certain exceptions) and the Conflicts Committee has the power to monitor compliance with certain self-management requirements specified by the Cole Merger Agreement. The Bylaw Amendment satisfied certain aspects of one of the closing conditions under the Cole Merger Agreement. While the Conflicts Committee does not have a charter, the powers of the Conflicts Committee are contained in the Bylaw Amendment.
136
Table of Contents
Limitations on Personal Investments
Our board of directors has adopted a policy with respect to any proposed investments by our directors or officers, whom we refer to as the “covered persons,” in our target properties. This policy provides that any proposed investment by a covered person for his or her own account in any of our target properties will be permitted only if the capital required for the investment does not exceed the lesser of (i) $5.0 million or (ii) 1% of our total stockholders’ equity as of the most recent month end (the “personal investment limit”). To the extent that a proposed investment exceeds the personal investment limit, our board of directors will only permit the covered person to make the investment (i) upon the approval of disinterested directors or (ii) if the proposed investment otherwise complies with the terms of any other related party transaction policy our board of directors may adopt in the future.
ARCP OP
We have adopted policies that are designed to eliminate or minimize certain potential conflicts of interest, and the limited partners of ARCP OP have agreed that, in the event of a conflict between the duties owed by ARCP’s directors to ARCP and ARCP’s duties, in its capacity as the general partner of ARCP OP, to such limited partners, we are under no obligation to give priority to the interests of such limited partners.
Real Estate Allocation Policy with Cole Non-traded REITs
In connection with the acquisition of Cole, we acquired certain advisory agreements with five current Cole non-traded REITs. The Cole non-traded REITs’ investment strategies focus on the acquisition of net lease real estate, thus overlapping with our investment strategy in certain circumstances. We intend to allocate investment opportunities in light of the following criteria:
| • | the anticipated operating cash flows of each entity and the cash requirements of each entity; |
| • | the effect of the potential acquisition both on diversification of each entity’s investments by type of property, geographic area and tenant concentration; |
| • | the amount of funds available to each entity and the length of time such funds have been available for investment; |
| • | the policy of each entity relating to leverage of properties; |
| • | the income tax effects of the purchase to each entity; and |
| • | the size of the investment. |
We will retain a right of first refusal with respect to all opportunities to acquire real estate and real estate-related assets or portfolios with a purchase price greater than $100.0 million, the majority of whose aggregate asset value is composed of single-tenant real estate and real estate-related assets.
137
Table of Contents
DESCRIPTION OF CERTAIN INDEBTEDNESS
ARCP OP’s Indebtedness
Senior Unsecured Credit Facility
ARCP OP (as borrower) and ARCP (as guarantor) are parties to a senior unsecured credit facility with Wells Fargo, as administrative agent, and the other lenders party thereto. Effective June 30, 2014, we amended and restated the senior unsecured credit facility to, among other things, increase the amount of revolving commitments (including the addition of a multi-currency sub-facility) and term loan commitments.
The senior unsecured credit facility is comprised of a $1.2 billion term loan facility (with a delayed draw component equal to $200.0 million), a $3.15 billion dollar-denominated revolving credit facility and a $250.0 million multi-currency revolving facility (all of which can be borrowed in dollars, at our discretion). The senior unsecured credit facility includes an accordion feature, which, if exercised in full, allows us to increase the aggregate commitments under the senior unsecured credit facility to $6.0 billion, subject to certain customary conditions. At June 30, 2014, we had approximately $1.9 billion outstanding, consisting of $1.0 billion outstanding on the term loan and $0.9 billion outstanding on the revolver, and up to $2.7 billion available to us for future borrowings under the senior unsecured credit facility.
The revolving credit facility generally bears interest at an annual rate of LIBOR plus 1.00% to 1.80% or Base Rate plus 0.00% to 0.80% (based upon ARCP’s then current credit rating). “Base Rate” is defined as the highest of the prime rate, the federal funds rate plus 0.50% or a floating rate based on one month LIBOR, determined on a daily basis. The term loan facility generally bears interest at an annual rate of LIBOR plus 1.15% to 2.05% or Base Rate plus 0.15% to 1.05% (based upon ARCP’s then current credit rating). Loans will initially be priced with an applicable margin of 1.35% in the case of LIBOR revolving loans and 1.60% in the case of LIBOR term loans. In addition, the senior unsecured credit facility provides the flexibility for interest rate auctions, pursuant to which, at our election, we may request that lenders make competitive bids to provide revolving loans, which competitive bids may be at pricing that differs from the foregoing interest rates.
Future borrowings under the senior unsecured credit facility will be subject to customary conditions for these types of financings, including (a) the bring-down of our representations and warranties, (b) no default existing and (c) timely notice by us. The senior unsecured credit facility contains various customary covenants, including financial maintenance covenants with respect to maximum consolidated leverage ratio, minimum fixed charge coverage ratio, maximum secured leverage ratio, maximum unencumbered leverage ratio, and minimum unencumbered interest coverage ratio. Any failure to comply with these financial maintenance covenants constitutes a default under the senior unsecured credit facility and prevents further borrowings thereunder.
The senior unsecured credit facility provides for monthly interest payments. In the event of an event of default, at the election of the majority of the lenders (or automatically upon a bankruptcy event of default with respect to ARCP OP or ARCP), the commitments of the lenders under the senior unsecured credit facility terminate, and payment of any unpaid amounts in respect of the senior unsecured credit facility is accelerated. The revolving credit facility and the term loan facility both terminate on June 30, 2018, in each case, unless extended in accordance with the terms of the senior unsecured credit facility. The senior unsecured credit facility provides for a one-year extension option with respect to each of the revolving credit facility and the term loan facility, exercisable at our election and subject to certain customary conditions, as well as certain customary “amend and extend” provisions. At any time, upon timely notice by us and subject to any breakage fees, we may prepay borrowings under the senior unsecured credit facility (subject to certain limitations applicable to the prepayment of any loans obtained through an interest rate auction, as described above).
We incur a fee equal to 0.15% to 0.25% per annum (based upon ARCP’s then current credit rating) multiplied by the commitments (whether or not utilized) in respect of the dollar-denominated revolving credit facility and the multi-currency facility. We incur an unused fee of 0.25% per annum on the unused amount of the delayed draw term loan commitments. In addition, we incur customary administrative agent, letter of credit issuance, letter of credit fronting, extension and other fees.
138
Table of Contents
The senior unsecured credit facility also includes customary restrictions on, inter alia, liens, negative pledges, restrictions on intercompany transfers, fundamental changes, investments, transactions with affiliates and restricted payments.
Mortgage Indebtedness
As of June 30, 2014, on a pro forma basis after giving effect to the acquisitions closed after June 30, 2014 and assuming completion of pending acquisitions, we had non-recourse mortgage indebtedness of $3.6 billion which was collateralized by 722 properties. Mortgage notes payable have fixed rates or are fixed by way of interest rate swap arrangements. The effective interest rates range from 2.41% to 7.20% at June 30, 2014. Our mortgage indebtedness bore interest at weighted average rate of 4.83% per annum and had a weighted average maturity of 6.0 years. Our mortgage loan agreements generally restrict corporate guarantees and require maintenance of financial covenants including maintenance of certain financial ratios (such as specified debt to equity and debt service coverage ratios). As of June 30, 2014, we were in compliance with the debt covenants under the mortgage loan agreements. We may in the future incur additional mortgage debt on the properties we currently own or use long-term non-recourse financing to acquire additional properties in the future.
ARCP’s Indebtedness
Convertible Notes
2018 Notes
On July 29, 2013, August 1, 2013 and December 10, 2013, ARCP issued $300.0 million, $10.0 million and $287.5 million, respectively, of 2018 notes pursuant to an indenture, dated as of July 29, 2013 (the “Base Indenture”), between ARCP and U.S. Bank National Association, as trustee (the “Trustee”), as supplemented by the first supplemental indenture, dated as of July 29, 2013 (the “First Supplemental Indenture”), between ARCP and the Trustee. The 2018 notes bear interest at a rate equal to 3.00% per year and accruing from July 29, 2013, payable semi-annually in arrears on February 1 and August 1 of each year, beginning on February 1, 2014.
The 2018 notes will mature on August 1, 2018, unless earlier repurchased, redeemed or converted. Holders may convert all or any portion of the 2018 notes, in multiples of $1,000 principal amount, at their option at any time prior to the close of business on the business day immediately preceding February 1, 2018 only under certain circumstances. On or after February 1, 2018, until the close of business on the business day immediately preceding the maturity date of the 2018 notes, holders may convert all or any portion of their 2018 notes, in multiples of $1,000 principal amount, at the option of the holder regardless of the circumstances. The conversion rate for the 2018 notes is initially 59.8050 shares of ARCP’s common stock per $1,000 principal amount of 2018 notes (equivalent to an initial conversion price of approximately $16.72 per share of ARCP’s common stock, representing a 15% conversion premium based on the closing price of ARCP’s common stock of $14.54 per share on July 23, 2013). The initial conversion rate is subject to adjustment upon the occurrence of certain events. Upon conversion, ARCP will pay or deliver, as the case may be, cash, shares of ARCP’s common stock or a combination of cash and shares of ARCP’s common stock, at its election.
ARCP may not redeem the 2018 notes prior to the maturity date except to the extent but only to the extent necessary to preserve its status as a REIT. If ARCP determines that it is necessary to redeem the 2018 notes to preserve its status as a REIT, ARCP may redeem for cash all or part of the 2018 notes prior to the maturity date at a redemption price equal to 100% of the principal amount of the 2018 notes to be redeemed, plus accrued and unpaid interest to, but excluding, the redemption date. No “sinking fund” is provided for the 2018 notes, which means that ARCP is not required to redeem or retire the 2018 notes periodically.
ARCP funds the interest payments on the 2018 notes with payments from ARCP OP in accordance with the terms of intercompany notes that have substantially similar terms to the 2018 notes.
2020 Notes
On December 10, 2013, ARCP issued $402.5 million of 2020 notes pursuant to the Base Indenture, as supplemented by the second supplemental indenture, dated as of December 10, 2013 (the “Second Supplemental
139
Table of Contents
Indenture”), between ARCP and the Trustee. The 2020 notes bear interest at a rate equal to 3.75% per year and accruing from December 10, 2013, payable semiannually in arrears on June 15 and December 15 of each year, beginning on June 15, 2014.
The 2020 notes will mature on December 15, 2020, unless earlier repurchased, redeemed or converted. Holders may convert all or any portion of their 2020 notes, in multiples of $1,000 principal amount, at their option at any time prior to the close of business on the business day immediately preceding June 15, 2020 only under certain circumstances. On or after June 15, 2020, until the close of business on the business day immediately preceding the maturity date of the 2020 notes, holders may convert all or any portion of their 2020 notes, in multiples of $1,000 principal amount, at the option of the holder regardless of the circumstances. The conversion rate for the 2020 notes is initially 66.0262 shares of ARCP’s common stock per $1,000 principal amount of 2020 notes (equivalent to an initial conversion price of approximately $15.15 per share of ARCP’s common stock, representing a 15% conversion premium based on the closing price of ARCP’s common stock of $13.17 per share on December 4, 2013). The initial conversion rate is subject to adjustment upon the occurrence of certain events. Upon conversion, ARCP will pay or deliver, as the case may be, cash, shares of ARCP’s common stock or a combination of cash and shares of ARCP’s common stock, at its election.
ARCP may not redeem the 2020 notes prior to the maturity date except to the extent but only to the extent necessary to preserve its status as a REIT. If ARCP determines that it is necessary to redeem the 2020 notes to preserve its status as a REIT, ARCP may redeem for cash all or part of the 2020 notes prior to the maturity date at a redemption price equal to 100% of the principal amount of the 2020 notes to be redeemed, plus accrued and unpaid interest to, but excluding, the redemption date. No “sinking fund” is provided for the 2020 Notes, which means that ARCP is not required to redeem or retire the 2020 notes periodically.
ARCP funds the interest payments on the 2020 notes with payments from ARCP OP in accordance with the terms of intercompany notes that have substantially similar terms to the 2020 notes.
CapLease Debt Assumed by ARCP
Convertible Notes Supplemental Indenture
In connection with the consummation of the CapLease Merger and pursuant to the terms of the indenture, dated as of October 9, 2007 (the “Original CapLease Convertible Notes Indenture”), by and among CapLease, CapLease, LP, Caplease Debt Funding, LP, Caplease Services Corp., Caplease Credit LLC and Deutsche Bank Trust Company Americas, as trustee (“Deutsche Bank”), with respect to CapLease’s outstanding 7.50% convertible senior notes due 2027 (the “CapLease Convertible Notes”), ARCP, ARCP OP, CapLease, the CapLease, LP and Deutsche Bank entered into a supplemental indenture, dated as of November 5, 2013 (together with the Original CapLease Convertible Notes Indenture, the “CapLease Convertible Notes Indenture”), pursuant to which (i) ARCP assumed, as of the effective time of the CapLease Merger, CapLease’s obligations under the CapLease Convertible Notes and the CapLease Convertible Notes Indenture as the issuer, and (ii) ARCP OP assumed, as of the effective time of the CapLease Partnership Merger, CapLease, LP’s obligations under the CapLease Convertible Notes and the CapLease Convertible Notes Indenture as guarantor.
Pursuant to the terms of the CapLease Convertible Notes Indenture, following the effective time of the CapLease Merger, the CapLease Convertible Notes continued to bear interest at an annual rate of 7.50%, payable semi-annually in arrears on April 1 and October 1. The CapLease Convertible Notes will mature on October 1, 2027, unless earlier converted, redeemed or repurchased. ARCP will have the right to redeem the CapLease Convertible Notes in whole or in part for cash at any time or from time to time at a redemption price equal to 100% of the principal amount of the CapLease Convertible Notes to be redeemed, plus any accrued and unpaid interest. Holders may require ARCP to repurchase their CapLease Convertible Notes, in whole or in part, on October 1, 2017 and October 1, 2022, for a cash price equal to 100% of the principal amount of the CapLease Convertible Notes to be repurchased, plus any accrued and unpaid interest. As of June 30, 2014, CapLease Convertible Notes in an aggregate principal amount of $19.2 million were outstanding.
ARCP redeemed the CapLease Convertible Notes on July 14, 2014.
140
Table of Contents
Purpose and Effect
The old notes were initially offered by ARCP OP and Clark Acquisition, LLC (“Clark”) as “Issuers” and were guaranteed by ARCP, Tiger Acquisition, LLC (“Tiger”) and Safari Acquisition, LLC (“Safari”) as “Guarantors.” In connection with the Cole Merger, Clark merged with and into ARCP OP with ARCP OP as the surviving entity. Following such merger, ARCP became the sole issuer (“Issuer”). On July 3, 2014, Tiger and Safari were dissolved. Tiger and Safari were wholly owned subsidiaries of ARCP and were surviving merger vehicles from the acquisition of ARCT III and CapLease, respectively. Tiger and Safari were holding companies with no operations and collectively held less than 2.0% of the outstanding limited partnership interests of ARCP OP prior to the dissolution. Following such dissolution, ARCP became the sole guarantor (the “guarantor”).
Concurrently with the sale of the old notes on February 6, 2014, the Issuer entered into a registration rights agreement with the purchasers of the old notes, which requires it to file a registration statement under the Securities Act with respect to the exchange notes (the “Exchange Offers Registration Statement”) and, upon the effectiveness of the Exchange Offers Registration Statement, offer to the holders of Entitled Securities (as defined below) who are able to make certain representations the opportunity to exchange their old notes for a like principal amount of exchange notes. The exchange notes will be issued without a restrictive legend and may generally be reoffered and resold without registration under the Securities Act.
For purposes of the preceding, “Entitled Securities” means each old note until the earliest to occur of:
| (1) | the date on which such note has been exchanged by a person other than a broker-dealer for an exchange note in the exchange offers; |
| (2) | following the exchange by a broker-dealer in the exchange offers of a note for an exchange note, the date on which such exchange note is sold to a purchaser who receives from such broker-dealer on or prior to the date of such sale a copy of the prospectus contained in the Exchange Offers Registration Statement; |
| (3) | the date on which such note has been effectively registered under the Securities Act and disposed of in accordance with the shelf registration statement; or |
| (4) | the date on which such note is actually sold pursuant to Rule 144 under the Securities Act; provided that a note will not cease to be an Entitled Security for purposes of the exchange offers by virtue of this clause (4). |
The registration rights agreement provides that the Issuer and the guarantor will agree to use their commercially reasonable efforts to cause a registration statement relating to an offer to exchange the old notes for an issue of SEC-registered notes with terms identical to the old notes (except that the exchange notes will not be subject to restrictions on transfer or to an increase in annual interest rate as described below) to become effective within 240 days after the closing date of the offering of the old notes, to keep the exchange offers open for a period not less than 20 business days, to cause the exchange offers to be consummated within 60 days of such effective date, and, if any holder notifies the Issuer that it is obligated to deliver a prospectus in connection with its participation in the exchange offers, to cause the exchange offers registration statement to remain continuously effective until the earlier of one year following the completion of the exchange offers or such date all such holders are no longer subject to the prospectus delivery requirement. To participate in the exchange offers, each holder must represent that it is not an affiliate of the Issuer, it has no arrangement or understanding with any person to participate in a distribution of the exchange notes that are issued in the exchange offers in violation of the Securities Act, it is acquiring the exchange notes in such exchange offers in the ordinary course of business and, if such holder is a broker-dealer that will receive exchange notes for its own account as a result of market-making or other trading activities, then such holder will deliver a prospectus (or make available a prospectus, to the extent permitted by law) in connection with any resale of the exchange notes.
In the event that (1) the Issuer determines that an exchange offer is not available or may not be completed because it would violate any applicable law or applicable interpretations of the SEC, (2) an exchange offer is not for any other reason completed within 300 days after the closing date of the offering of the old notes or (3) any
141
Table of Contents
holder notifies the Issuer prior to the 20th business day following the consummation of the exchange offers that the notes held by it were not eligible to be exchanged for the new SEC registered notes in the exchange offers, the Issuer and the guarantor shall use their commercially reasonable efforts to cause to be filed as soon as practicable after such determination, date or notice, as the case may be, but in no event later than 30 days after such determination, date or notice, a shelf registration statement providing for the sale of all the notes by the holders thereof and to have such shelf registration statement declared effective by the SEC no later than 90 days after such determination, date or notice. The Issuer and the guarantor shall use their commercially reasonable efforts to keep the shelf registration statement effective until the first anniversary of the effective date or such shorter period that will terminate when all notes covered by the shelf registration statement have been sold.
The registration rights agreement provides that the following events constitutes a registration default:
| • | the exchange offers registration statement is not declared effective within 240 days after the closing date of the offering of the old notes; |
| • | the exchange offers are not consummated within 300 days after the closing date of the offering of the old notes; |
| • | if the Issuer is obligated to file a shelf registration statement and the shelf registration statement is not filed with the SEC within 30 days of the triggering of such obligation or is not declared effective within 90 days after the triggering of such obligation; or |
| • | if the shelf registration statement, if required, is declared effective but thereafter (and before the expiration of the period referred to in Rule 144) ceases to be effective or useable in connection with resales of the notes for more than 60 days within any 12-month period or if the Issuer, through their omission, fail to name as a selling securityholder any holder that had complied timely with its obligations to be named in the shelf registration statement. |
If there is a registration default, then the Issuer will agree to pay each holder of registrable securities affected thereby additional interest in an amount equal to 0.25% per annum for the first 90-day period immediately following the date of such registration default, and an additional 0.25% per annum for each additional 90-day period, until all registration defaults have been cured. In no event will additional interest exceed 1.00% per annum. Following the cure of all of these registration defaults, the accrual of additional interest will cease. The registration rights agreement provides that other than the Issuer’s obligation to pay additional interest in accordance with the registration rights agreement, the Issuer and the Guarantor will not have any liability for damages with respect to a registration default.
If you wish to exchange your old notes for exchange notes in the exchange offers, you will be required to make the following representations:
| (1) | you are not an “affiliate” of the Issuer as defined in Rule 405 of the Securities Act, or if you are such an “affiliate,” you will comply with the registration and prospectus delivery requirements of the Securities Act to the extent applicable, |
| (2) | you are not engaged in, and do not intend to engage in, and have no arrangement or understanding with any person to participate in, a distribution of the exchange notes to be issued in the exchange offers, |
| (3) | you are acquiring exchange notes in the ordinary course of your business, |
| (4) | if you are a broker-dealer that holds notes that were acquired for your own account as a result of market-making activities or other trading activities (other than notes acquired directly from ARCP OP or any of its affiliates), you will deliver a prospectus meeting the requirements of the Securities Act in connection with any resales of the exchange notes you receive in the exchange offers, |
| (5) | if you are a broker-dealer, that you did not purchase the notes to be exchanged in the exchange offers from ARCP OP or any of its affiliates, and |
142
Table of Contents
| (6) | you are not acting on behalf of any person who could not truthfully and completely make the representations contained in the foregoing subclauses (1) through (5). |
This summary of the provisions of the exchange and registration rights agreement does not purport to be complete and is subject to, and is qualified in its entirety by reference to, all the provisions of the registration rights agreement, a copy of which is filed as an exhibit to the registration statement of which this prospectus is a part.
Resale of Exchange Notes
Based on interpretations by the SEC set forth in no-action letters issued to third parties, the Issuer believes that you may resell or otherwise transfer exchange notes issued in the exchange offers without complying with the registration and prospectus delivery provisions of the Securities Act, if:
| • | you are not an “affiliate” of the Issuer or any guarantor within the meaning of Rule 405 under the Securities Act; |
| • | you do not have an arrangement or understanding with any person to participate in a distribution of the exchange notes in violation of the provisions of the Securities Act; |
| • | you are not engaged in, and do not intend to engage in, a distribution of the exchange notes; and |
| • | you are acquiring the exchange notes in the ordinary course of your business. |
If you are an affiliate of the Issuer or an affiliate of any guarantor, or are engaging in, or intend to engage in, or have any arrangement or understanding with any person to participate in, a distribution of the exchange notes, or are not acquiring the exchange notes in the ordinary course of your business:
| • | you cannot rely on the position of the SEC set forth in Morgan Stanley & Co. Incorporated (available June 5, 1991) and Exxon Capital Holdings Corp. (available May 13, 1988), as interpreted in the SEC’s letter to Shearman & Sterling, publicly available July 2, 1993, or similar no-action letters; and |
| • | in the absence of an exception from the position stated immediately above, you must comply with the registration and prospectus delivery requirements of the Securities Act in connection with any resale of the exchange notes. |
This prospectus may be used for an offer to resell, resale or other transfer of exchange notes only as specifically set forth in this prospectus. With regard to broker-dealers, only broker-dealers that acquired the old notes as a result of market-making activities or other trading activities may participate in the exchange offers. Each broker-dealer that receives exchange notes for its own account in exchange for old notes, where such old notes were acquired by such broker-dealer as a result of market-making activities or other trading activities, must acknowledge that it will deliver a prospectus in connection with any resale of the exchange notes. See “Plan of Distribution” in this prospectus for more details regarding the transfer of exchange notes.
Terms of the Exchange Offers
Upon the terms and subject to the conditions set forth in this prospectus and the accompanying letter of transmittal, the Issuer will accept any and all old notes validly tendered and not validly withdrawn prior to 5:00 p.m., Eastern time, on October 14, 2014, which is the 21st business day after the commencement of the exchange offers, or such date and time to which the Issuer extends the offer. Notes may be tendered only in denominations of $2,000 and integral multiples of $1,000 in excess thereof. The Issuer will issue the principal amount of exchange notes in exchange for the principal amount of outstanding notes surrendered in the exchange offers.
The form and terms of the exchange notes will be identical in all material respects to the form and terms of the old notes, except that the exchange notes will be registered under the Securities Act, will not bear legends restricting their transfer and will not provide any additional interest upon the Issuer’s failure to fulfill its
143
Table of Contents
obligations under the registration rights agreement to complete the exchange offers within the specified time period. The exchange notes will evidence the same debt as the old notes and will be issued under the terms of, and be entitled to the benefits of, the indenture relating to the old notes. For a description of the indenture, see “Description of Exchange Notes” in this prospectus.
The exchange offers are not conditioned upon any minimum aggregate principal amount of notes being tendered for exchange. This prospectus and the letter of transmittal are being sent to all registered holders of old notes. There will be no fixed record date for determining registered holders of old notes entitled to participate in the exchange offers. The Issuer intends to conduct the exchange offers in accordance with provisions of the registration rights agreement, the applicable requirements of the Securities Act, the Exchange Act and the rules and regulations of the SEC promulgated under the Exchange Act. Old notes that are not tendered for exchange in the exchange offers will remain outstanding and continue to accrue interest and will be entitled to the rights and benefits such holders have under the indenture relating to such holders’ series of outstanding notes and the registration rights agreement, except the Issuer will not have any further obligation to you to provide the registration of the old notes under the registration rights agreement.
The Issuer will be deemed to have accepted for exchange validly tendered old notes when, as and if the Issuer has given oral or written notice of the acceptance to U.S. Bank National Association, the exchange agent. The exchange agent will act as agent for the tendering holders for the purpose of receiving the exchange notes from the Issuer and delivering the exchange notes to holders. If any tendered old notes are not accepted for exchange because of an invalid tender, the occurrence of certain other events set forth under the heading “—Conditions to the Exchange Offers” or otherwise, such unaccepted old notes will be returned, without expense, to the tendering holder of those old notes promptly after the expiration date unless the exchange offers are extended.
Holders who tender old notes in the exchange offers will not be required to pay brokerage commissions or fees or transfer taxes with respect to the exchange of old notes in the exchange offers. The Issuer will pay all charges and expenses applicable to the exchange offers, other than certain applicable taxes, underwriting discounts, if any, and commissions and transfer taxes, if any, which shall be borne by the holder. See “—Fees and Expenses.”
Expiration Date; Extensions; Amendments
The expiration date for the exchange offers shall be 5:00 p.m., Eastern time, on October 14, 2014, which is the 21st business day after the commencement of the exchange offers, unless the Issuer, in its sole discretion, extends the exchange offers, in which case the expiration date shall be the latest date and time to which the exchange offers is extended. In order to extend the exchange offers, the Issuer will notify the exchange agent of any extension by oral or written notice, followed by notification by press release or other public announcement to the registered holders of the old notes no later than 9:00 a.m., Eastern time, on the next business day after the previously scheduled expiration date. The Issuer reserves the right, in its sole discretion:
| • | to delay accepting for exchange any old notes (if the Issuer amends or extends the exchange offers); |
| • | to extend the exchange offers or, if any of the conditions set forth under “—Conditions to the Exchange Offers” shall not have been satisfied, to terminate the exchange offers, by giving oral or written notice of that delay, extension or termination to the exchange agent; or |
| • | subject to the terms of the registration rights agreement, to amend the terms of the exchange offers in any manner, provided that in event of a material change in the terms of the exchange offers, including the waiver of a material condition, the Issuer will extend the offer period if necessary so that at least five business days remain in the exchange offers following notice of the material change; |
provided that the Issuer will at all times comply with applicable securities laws, including The Issuer’s obligation to issue the exchange notes or return the outstanding notes deposited by or on behalf of security holders promptly after expiration or withdrawal of the exchange offers.
144
Table of Contents
Any delay in acceptance, extension, termination or amendment will be followed as promptly as practicable by oral or written notice to the registered holders of the outstanding notes. If the Issuer amends the exchange offers in a manner that the Issuer determines to constitute a material change, the Issuer will promptly disclose the amendment in a manner reasonably calculated to inform the holders of outstanding notes of that amendment.
Conditions to the Exchange Offers
Notwithstanding any other provision of the exchange offers, the Issuer will not be required to accept for exchange, or to issue exchange notes in exchange for, any old notes and may terminate or amend the exchange offers if at any time before the acceptance of those old notes for exchange or the exchange of the exchange notes for those old notes, the Issuer determines that the exchange offers violate applicable law or any applicable interpretation of the staff of the SEC.
In addition the Issuer will not be obligated to accept for exchange the old notes of any holder that has not made to us:
| • | the representations described under “—Purpose and Effect;” or |
| • | any other representations as may be reasonably necessary under applicable SEC rules, regulations, or interpretations to make available to the Issuer an appropriate form of registration of the exchange notes under the Securities Act. |
The Issuer expressly reserves the right at any time or at various times to extend the period of time during which the exchange offers is open. Consequently, the Issuer may delay acceptance of any old notes by giving oral or written notice of such extension to their holders. The Issuer will return any old notes that the Issuer does not accept for exchange for any reason without expense to their tendering holder promptly after the expiration or termination of the exchange offers.
The Issuer expressly reserves the right to amend or terminate the exchange offers and to reject for exchange any old notes not previously accepted for exchange, upon the occurrence of any of the conditions of the exchange offers specified above. The Issuer will give notice by press release or other public announcement of any extension, amendment, non-acceptance or termination to the holders of the old notes as promptly as practicable. In the case of any extension, such notice will be issued no later than 9:00 a.m., Eastern time, on the next business day after the previously scheduled expiration date.
The foregoing conditions are for the Issuer’s sole benefit and may be asserted by the Issuer regardless of the circumstances giving rise to any such condition or may be waived by the Issuer in whole or in part at any time and from time to time in its sole discretion. The failure by the Issuer at any time to exercise any of the foregoing rights shall not be deemed a waiver of any of those rights and each of those rights shall be deemed an ongoing right which may be asserted at any time and from time to time.
In addition, the Issuer will not accept for exchange any old notes tendered, and no exchange notes will be issued in exchange for those old notes, if at such time any stop order shall be in effect with respect to the registration statement of which this prospectus constitutes a part or the qualification of the indenture under the Trust Indenture Act of 1939. In any of those events the Issuer is required to use every commercially reasonable effort to obtain the withdrawal of any stop order at the earliest practicable date.
Procedures for Tendering
To tender your old notes in the exchange offers, you must comply with either of the following:
| • | complete, sign and date the letter of transmittal, or a facsimile of the letter of transmittal, have the signature(s) on the letter of transmittal guaranteed if required by the letter of transmittal and mail or |
145
Table of Contents
| deliver such letter of transmittal or facsimile thereof to the exchange agent at the address set forth below under “—Exchange Agent” prior to the expiration date; or |
| • | comply with DTC’s Automated Tender Offer Program (“ATOP”) procedures described below. |
In addition, either:
| • | the exchange agent must receive certificates for old notes along with the letter of transmittal prior to the expiration date; |
| • | the exchange agent must receive a timely confirmation of book-entry transfer of old notes into the exchange agent’s account at DTC according to the procedures for book-entry transfer described below or a properly transmitted agent’s message prior to the expiration date; or |
| • | you must comply with the guaranteed delivery procedures described below. |
Your tender, if not withdrawn prior to the expiration date, constitutes an agreement between the Issuer and you upon the terms and subject to the conditions described in this prospectus and in the letter of transmittal.
The method of delivery of old notes, letter of transmittal, and all other required documents to the exchange agent is at your election and risk. The Issuer recommends that instead of delivery by mail, you use an overnight or hand delivery service, properly insured. In all cases, you should allow sufficient time to assure timely delivery to the exchange agent before the expiration date. You should not send letters of transmittal or certificates representing old notes to us. You may request that your broker, dealer, commercial bank, trust company or nominee effect the above transactions for you.
If you are a beneficial owner whose old notes are registered in the name of a broker, dealer, commercial bank, trust company, or other nominee and you wish to tender your old notes, you should promptly contact the registered holder and instruct the registered holder to tender on your behalf. If you wish to tender the old notes yourself, you must, prior to completing and executing the letter of transmittal and delivering your old notes, either:
| • | make appropriate arrangements to register ownership of the old notes in your name; or |
| • | obtain a properly completed bond power from the registered holder of old notes. |
The transfer of registered ownership may take considerable time and may not be able to be completed prior to the expiration date.
Signatures on the letter of transmittal or a notice of withdrawal, as the case may be, must be guaranteed by a member firm of a registered national securities exchange or of the National Association of Securities Dealers, Inc., a commercial bank or trust company having an office or correspondent in the United States or another “eligible guarantor institution” within the meaning of Rule 17A(d)-15 under the Exchange Act unless the old notes surrendered for exchange are tendered:
| • | by a registered holder of the old notes who has not completed the box entitled “Special Issuance Instructions” or “Special Delivery Instructions” on the letter of transmittal; or |
| • | For the account of an eligible guarantor institution. |
If the letter of transmittal is signed by a person other than the registered holder of any old notes listed on the old notes, such old notes must be endorsed or accompanied by a properly completed bond power. The bond power must be signed by the registered holder as the registered holder’s name appears on the old notes and an eligible guarantor institution must guarantee the signature on the bond power.
If the letter of transmittal or any certificates representing old notes, or bond powers are signed by trustees, executors, administrators, guardians, attorneys-in-fact, officers of corporations, or others acting in a fiduciary or
146
Table of Contents
representative capacity, those persons should also indicate when signing and, unless waived by us, they should also submit evidence satisfactory to the Issuer of their authority to so act.
If you are a participant that has old notes which are credited to your DTC account by book-entry and which are held of record by DTC, you may tender your old notes by book-entry transfer as if you were the record holder. Because of this, reference herein to registered or record holders include DTC participants with old notes credited to their accounts. If you are not a DTC participant, you may tender your old notes by book-entry transfer by contacting your broker, dealer or other nominee or by opening an account with a DTC participant.
Participants in DTC’s ATOP program must electronically transmit their acceptance of the exchange by causing DTC to transfer the old notes to the exchange agent in accordance with DTC’s ATOP procedures for transfer. DTC will then send an agent’s message to the exchange agent. The term “agent’s message” means a message transmitted by DTC, received by the exchange agent and forming part of the book-entry confirmation, which states that:
| • | DTC has received an express acknowledgment from a participant in its ATOP that is tendering old notes that are the subject of the book-entry confirmation; |
| • | the participant has received and agrees to be bound by the terms of the letter of transmittal, or in the case of an agent’s message relating to guaranteed delivery, that such participant has received and agrees to be bound by the notice of guaranteed delivery; and |
| • | the Issuer may enforce that agreement against such participant. |
Your tender, if not withdrawn before the expiration date, will constitute an agreement between you and the Issuer in accordance with the terms and subject to the conditions described in this prospectus.
The Issuer reserves the right in its sole discretion to purchase or make offers for any old notes that remain outstanding after the expiration date or, as set forth under “—Conditions to the Exchange Offers,” to terminate the exchange offers and, to the extent permitted by applicable law, purchase old notes in the open market, in privately negotiated transactions, or otherwise. The terms of any such purchases or offers could differ from the terms of the exchange offers.
Subject to and effective upon the acceptance for exchange and exchange of exchange notes, a tendering holder of old notes will be deemed to:
| • | have agreed to irrevocably sell, assign, transfer and exchange, to the Issuer all right, title and interest in, to and under all of the old notes tendered thereby; |
| • | have represented and warranted that when such old notes are accepted for exchange by us, the Issuer will acquire good and marketable title thereto, free and clear of all liens, restrictions, charges and encumbrances and not subject to any adverse claims; and |
| • | have irrevocably appointed the exchange agent the true and lawful agent and attorney-in-fact of the holder with respect to any tendered old notes, with full power of substitution to (1) deliver certificates representing such old notes, or transfer ownership of such old notes on the account books maintained by DTC (together, in any such case, with all accompanying evidences of transfer and authenticity), to us, (2) present and deliver such old notes for transfer on the Issuer’s books and (3) receive all benefits and otherwise exercise all rights and incidents of beneficial ownership with respect to such old notes, all in accordance with the terms of the exchange offers. |
Each broker-dealer that receives exchange notes for its own account in exchange for old notes, where those old notes were acquired by such broker-dealer as a result of market-making activities or other trading activities, must acknowledge that it will deliver a prospectus in connection with any resale of those exchange notes. See “Plan of Distribution” in this prospectus.
147
Table of Contents
Acceptance of Exchange Notes
In all cases, the Issuer will promptly after the expiration of the exchange offers issue exchange notes for old notes that the Issuer has accepted for exchange under the exchange offers only after the exchange agent timely receives:
| • | old notes or a timely book-entry confirmation of such old notes into the exchange agent’s account at the book-entry transfer facility; and |
| • | a properly completed and duly executed letter of transmittal and all other required documents or a properly transmitted agent’s message. |
| • | you are not an affiliate of the Issuer or an affiliate of any guarantor within the meaning of Rule 405 under the Securities Act; |
| • | you are acquiring the exchange notes in the ordinary course of your business; |
| • | you do not have an arrangement or understanding with any person or entity to participate in a distribution of the exchange notes; |
| • | you are not engaging in or intend to engage in a distribution of the exchange notes; and |
| • | if you are a broker that will receive exchange notes for your own account in exchange for old notes that were acquired as a result of market-making activities or other trading activities, that you will comply with the applicable provisions of the Securities Act (including, but not limited to, the prospectus delivery requirements thereunder). |
The letter of transmittal states that by so acknowledging and by delivering a prospectus, a broker-dealer will not be deemed to admit that it is an “underwriter” within the meaning of the Securities Act. See “Plan of Distribution” in this prospectus.
The Issuer will interpret the terms and conditions of the exchange offers, including the letter of transmittal and the instructions to the letter of transmittal, and will resolve all questions as to the validity, form, eligibility, including time of receipt, and acceptance of old notes tendered for exchange. Our determinations in this regard will be final and binding on all parties. The Issuer reserves the absolute right to reject any and all tenders of any particular old notes not properly tendered or to not accept any particular old notes if the acceptance might, in its or its counsel’s judgment, be unlawful. The Issuer also reserves the absolute right to waive any defects or irregularities as to any particular old notes prior to the expiration date.
Unless waived, any defects or irregularities in connection with tenders of old notes for exchange must be cured within such reasonable period of time as the Issuer determines. Neither the Issuer, the trustee, the exchange agent, nor any other person will be under any duty to give notification of any defect or irregularity with respect to any tender of old notes for exchange, nor will any of them incur any liability for any failure to give notification. Any old notes received by the exchange agent that are not properly tendered and as to which the irregularities have not been cured or waived will be returned by the exchange agent to the tendering holder, unless otherwise provided in the letter of transmittal, promptly after the expiration date.
Return of Notes
If the Issuer does not accept any tendered old notes for any reason described in the terms and conditions of the exchange offers or if you withdraw or submit old notes for a greater principal amount than you desire to exchange, the Issuer will return the unaccepted, withdrawn or non-exchanged notes without expense to you as promptly as practicable.
Book-Entry Transfer
Promptly after the date of this prospectus, the exchange agent will establish an account with respect to the old notes at DTC, as the book-entry transfer facility, for purposes of the exchange offers. Any financial institution that
148
Table of Contents
is a participant in the book-entry transfer facility’s system may make book-entry delivery of the old notes by causing the book-entry transfer facility to transfer those old notes into the exchange agent’s account at the facility in accordance with the facility’s procedures for such transfer. To be timely, book-entry delivery of old notes requires receipt of a confirmation of a book-entry transfer, a “book-entry confirmation,” prior to the expiration date. In addition, although delivery of old notes may be effected through book-entry transfer into the exchange agent’s account at the book-entry transfer facility, the letter of transmittal or a manually signed facsimile thereof, together with any required signature guarantees and any other required documents, or an agent’s message in connection with a book-entry transfer, must, in any case, be delivered or transmitted to and received by the exchange agent at its address set forth on the cover page of the letter of transmittal prior to the expiration date to receive exchange notes for tendered old notes, or the guaranteed delivery procedure described below must be complied with. Tender will not be deemed made until such documents are received by the exchange agent. Delivery of documents to the book-entry transfer facility does not constitute delivery to the exchange agent.
Holders of old notes who are unable to deliver confirmation of the book-entry tender of their old notes into the exchange agent’s account at the book-entry transfer facility or all other documents required by the letter of transmittal to the exchange agent on or prior to the expiration date must tender their old notes according to the guaranteed delivery procedures described below.
Guaranteed Delivery Procedures
If you wish to tender your old notes but your old notes are not immediately available or you cannot deliver your old notes, the letter of transmittal or any other required documents to the exchange agent or comply with DTC’s ATOP procedures in the case of old notes, prior to the expiration date, you may still tender if:
| • | the tender is made through an eligible guarantor institution; |
| • | prior to the expiration date, the exchange agent receives from such eligible guarantor institution either a properly completed and duly executed notice of guaranteed delivery, by facsimile transmission, mail or hand delivery or a properly transmitted agent’s message and notice of guaranteed delivery, that (1) sets forth your name and address, the certificate number(s) of such old notes and the principal amount of old notes tendered; (2) states that the tender is being made thereby; and (3) guarantees that, within three New York Stock Exchange trading days after the expiration date, the letter of transmittal, or facsimile thereof, together with the old notes or a book-entry confirmation, and any other documents required by the letter of transmittal, will be deposited by the eligible guarantor institution with the exchange agent; and |
| • | the exchange agent receives the properly completed and executed letter of transmittal or facsimile thereof, as well as certificate(s) representing all tendered old notes in proper form for transfer or a book-entry confirmation of transfer of the old notes into the exchange agent’s account at DTC all other documents required by the letter of transmittal within three New York Stock Exchange trading days after the expiration date. |
Upon request, the exchange agent will send to you a notice of guaranteed delivery if you wish to tender your old notes according to the guaranteed delivery procedures.
Withdrawal Rights
Except as otherwise provided in this prospectus, you may withdraw your tender of old notes at any time prior to 5:00 p.m., Eastern time, on the expiration date.
For a withdrawal to be effective:
| • | the exchange agent must receive a written notice, which may be by facsimile or letter, of withdrawal at its address set forth below under “—Exchange Agent;” or |
| • | you must comply with the DTC’s ATOP procedures. |
149
Table of Contents
Any notice of withdrawal must:
| • | specify the name of the person who tendered the old notes to be withdrawn; |
| • | identify the old notes to be withdrawn, including the certificate numbers and principal amount of the old notes; and |
| • | signed by the holder in the same manner as the original signature on the letter of transmittal by which such old notes are tendered (including any required signature guarantees). |
If old notes have been tendered pursuant to the procedures for book-entry transfer described above, any notice of withdrawal must specify the name and number of the account at the book-entry transfer facility to be credited with the withdrawn old notes and otherwise comply with the procedures of the facility. The Issuer will determine all questions as to the validity, form and eligibility, including time of receipt of notices of withdrawal and its determination will be final and binding on all parties. Any old notes so withdrawn will be deemed not to have been validly tendered for exchange for purposes of the exchange offers. Any old notes that have been tendered for exchange but that are not exchanged for any reason will be returned to their holder, without cost to the holder, or, in the case of book-entry transfer, the old notes will be credited to an account at the book-entry transfer facility, promptly after withdrawal, rejection of tender or termination of the applicable exchange offer. Properly withdrawn old notes may be retendered by following the procedures described under “—Procedures for Tendering” above at any time on or prior to the expiration date.
Exchange Agent
U.S. Bank National Association has been appointed as the exchange agent for the exchange offers. U.S. Bank National Association also acts as Trustee under the indenture. Questions, requests for assistance and requests for additional copies of this prospectus or the letter of transmittal, and requests for notices of guaranteed delivery should be directed to the exchange agent addressed as follows:
| By Registered and Certified Mail: | By Hand Delivery: | |
| U.S. Bank Corporate Trust Services 111 Fillmore Ave. E. Saint Paul, MN 55107-1402 Attn: Specialized Finance |
U.S. Bank Corporate Trust Services 111 Fillmore Ave. E. Saint Paul, MN 55107-1402 Attn: Specialized Finance |
| By Overnight Courier or Regular Mail: | By Facsimile: | |
| U.S. Bank Corporate Trust Services 111 Fillmore Ave. E. Saint Paul, MN 55107-1402 Attn: Specialized Finance |
(For Eligible Institutions Only): (651) 466-7372
For Information or Confirmation by: Telephone: (800) 934-6802 |
If you deliver the letter of transmittal to an address other than the one set forth above or transmit instructions via facsimile other than the one set forth above, that delivery or those instructions will not be effective.
Fees and Expenses
The Issuer will not make any payments to brokers, dealers or others soliciting acceptances of the exchange offers. The principal solicitation is being made by mail; however, additional solicitations may be made in person or by telephone by the Issuer’s officers and employees. The estimated cash expenses to be incurred in connection with the exchange offers will be paid by the Issuer and will include fees and expenses of the exchange agent, accounting, legal, printing and related fees and expenses.
150
Table of Contents
Transfer Taxes
The Issuer will pay all transfer taxes, if any, applicable to the transfer and exchange of old notes to it in the exchange offers. If transfer taxes are imposed for any other reason, the amount of those transfer taxes, whether imposed on the registered holder or any other persons, will be payable by the tendering holder.
Consequences of Failure to Exchange
If you do not exchange your old notes for exchange notes under the exchange offers, your old notes will remain subject to the restrictions on transfer of such old notes:
| • | as set forth in the legend printed on the old notes as a consequence of the issuance of the old notes pursuant to the exemptions from, or in transactions not subject to, the registration requirements of the Securities Act and applicable state securities laws; and |
| • | as otherwise set forth in the prospectus distributed in connection with the private offerings of the old notes. |
In general, you may not offer or sell your old notes unless they are registered under the Securities Act or if the offer or sale is exempt from registration under the Securities Act and applicable state securities laws. Except as required by the registration rights agreement, the Issuer does not intend to register resales of the old notes under the Securities Act.
Other
Participating in the exchange offers is voluntary, and you should carefully consider whether to accept. You are urged to consult your financial and tax advisors in making your own decision on what action to take.
The Issuer may in the future seek to acquire untendered old notes in open market or privately negotiated transactions, through subsequent exchange offers or otherwise. The Issuer has no present plans to acquire any old notes that are not tendered in the exchange offers or to file a registration statement to permit resales of any untendered old notes.
151
Table of Contents
You can find the definitions of certain terms used in this description under “—Certain Definitions.” Certain defined terms used in this description but not defined below under the caption “—Certain Definitions” have the meanings assigned to them in the indenture and/or the registration rights agreement.
In this description, the term “Issuer” refers solely to ARCP OP, and not to any of its Subsidiaries (as defined below). The old notes were initially offered by ARCP OP and Clark as “Issuers” and were guaranteed by ARCP, Tiger and Safari as “Guarantors.” In connection with the Cole Merger, Clark merged with and into ARCP OP with ARCP OP as the surviving entity. Following such merger, ARCP became the sole issuer (“Issuer”). On July 3, 2014, Tiger and Safari were dissolved. Tiger and Safari were wholly owned subsidiaries of ARCP and were surviving merger vehicles from the acquisition of ARCT III and CapLease, respectively. Tiger and Safari were holding companies with no operations and collectively held a minority interest in the outstanding equity interests of ARCP OP prior to their dissolution. Following such dissolution, ARCP became the sole guarantor (the “guarantor”). The term “Parent” refers to American Realty Capital Properties, Inc., and not to any of its Subsidiaries. Parent is the sole general partner of ARCP OP.
On February 6, 2014, the Issuer issued $1,300,000,000 of 2.000% senior notes due 2017 (the “old 2017 notes”), $750,000,000 of 3.000% senior notes due 2019 (the “old 2019 notes”) and $500,000,000 of 4.600% senior notes due 2024 (the “old 2024 notes” and, together with old 2017 notes and the old 2019 notes, the “old notes”) under the indenture dated as of February 6, 2014 (the “Base Indenture”), as supplemented by an officer’s certificate dated as of February 6, 2014 (the “Officers’ Certificate” and, together with the Base Indenture, the “Indenture”), among the Issuer, the guarantors named therein and U.S. Bank National Association, as trustee (the “trustee”). The Issuer is offering to exchange all of the outstanding old 2017 notes for new 2.000% senior notes due 2017 (the “exchange 2017 notes”); all of the outstanding old 2019 notes for new 3.000% senior notes due 2019 (the “exchange 2019 notes”); and all of the outstanding old 2024 notes (the “exchange 2024 notes” and, together with the exchange 2017 notes and the exchange 2019 notes, the “exchange notes”). The form and terms of the exchange 2017 notes, the exchange 2019 notes and the exchange 2024 notes are substantially similar to the form and terms of the old 2017 notes, the old 2019 notes and the old 2024 notes, respectively, except that the exchange notes will be registered under the Securities Act of 1933, as amended (the “Securities Act”) and the transfer restrictions, interest rate increase provisions and related registration rights applicable to the old notes will not apply to the exchange notes. See “The Exchange Offers—Purpose and Effect” in this prospectus. The old notes were issued in a private transaction that was not subject to the registration requirements of the Securities Act. The terms of the exchange notes include those stated in the Indenture and those made part of the Indenture by reference to the Trust Indenture Act of 1939, as amended (the “Trust Indenture Act” or “TIA”). Unless the context otherwise requires, references herein to the “notes” include the old notes and the exchange notes.
The following description is a summary of the material provisions of the Indenture, which does not restate such provisions in their entirety. The Issuer urges you to read the Indenture, the collateral trust agreement and the intercreditor agreement because such documents, and not this description, define your rights as a Holder (as defined below). Anyone who receives this prospectus may obtain a copy of the Indenture, the collateral trust agreement and the intercreditor agreement without charge upon request. See “Where You Can Find More Information” in this prospectus.
The registered holder of a note will be treated as the owner of the note for all purposes. Only registered holders will have rights under the Indenture.
General
The Issuer may, without the consent of the Holders (as defined below), create and issue additional notes in the future having the same terms, other than the date of original issuance, the issue price, the date on which interest begins to accrue and, in some cases, the first interest payment date, so as to form a single series with the applicable series of notes offered hereby. The Issuer may also issue from time to time other series of debt securities under the Indenture. Unless the context requires otherwise, references to “notes” for all purposes of the Indenture and this “Description of Exchange Notes” include any additional notes of any series that are actually
152
Table of Contents
issued; provided that any additional notes will not be issued with the same CUSIP as the notes offered hereby unless such additional notes are fungible with the notes offered hereby for U.S. federal income tax purposes.
Except as described under “—Certain Covenants” and “—Merger, Consolidation or Sale of Assets,” the Indenture does not prohibit Parent or any of its Subsidiaries from incurring additional indebtedness or issuing preferred equity in the future, nor does the Indenture afford holders of the notes protection in the event of (1) a recapitalization transaction or other highly leveraged or similar transaction involving Parent or any of its Subsidiaries, (2) a change of control of Parent or any of its Subsidiaries or (3) a merger, consolidation, reorganization, restructuring or transfer or lease of substantially all of Parent’s or any of its Subsidiaries’ assets or any similar transaction that may adversely affect the holders of the notes. Parent may, in the future, enter into certain transactions such as the sale of all or substantially all of Parent’s, the Issuer’s or any of its other Subsidiaries’ assets or a merger or consolidation that may increase the amount of Parent’s consolidated indebtedness or substantially change Parent’s consolidated assets, which may have an adverse effect on the Issuer’s and its Subsidiaries’ ability to service their indebtedness, including the notes.
Guarantees
The Guarantors (as defined below) unconditionally guarantee, jointly and severally, the due and punctual payment of principal of and interest on the notes, when and as the same become due and payable, whether on the maturity date, by declaration of acceleration, upon redemption, repurchase or otherwise, and all of the Issuer’s other obligations under the Indenture. The notes are guaranteed by Parent. Parent also guarantees ARCP OP’s obligations under the senior unsecured credit facility. None of ARCP OP’s Subsidiaries are initially guaranteeing the notes.
Each guarantee of a Subsidiary Guarantor (as defined below) will be limited as necessary to prevent such guarantee from being rendered voidable under applicable law relating to fraudulent conveyance or fraudulent transfer or similar laws affecting the rights of creditors generally. Each Subsidiary Guarantor that makes a payment under its guarantee will be entitled to a contribution from each other Subsidiary Guarantor in an amount equal to such other Subsidiary Guarantor’s pro rata portion of such payment based on the respective net assets of all the Subsidiary Guarantors at the time of such payment determined in accordance with GAAP. If a guarantee were to be rendered voidable, it could be subordinated by a court to all other indebtedness (including guarantees and other contingent liabilities) of the applicable Guarantor and, depending on the amount of such indebtedness, a Guarantor’s liability on its guarantee could be reduced to zero.
In addition, following the original issue date of the notes, Parent will cause each of its Subsidiaries that (a) owns, directly or indirectly, any Equity Interests issued by the Issuer, or (b) guarantees other Debt of the Issuer or any Guarantor, to execute and deliver to the Trustee a supplemental indenture pursuant to which such Subsidiary will guarantee payment of each series of the notes on the same terms and conditions as the original guarantees from the initial Guarantors; provided, that the Subsidiaries of Parent that guarantee the CapLease Debt on the original issue date shall not be required to guarantee the notes solely by virtue of such guarantees. In addition, the Subsidiaries of Parent that guarantee ARCP OP’s obligations under the senior unsecured credit facility prior to, but not following, the Cole Merger and effectiveness of the amendment to the senior unsecured credit facility, shall not be required to guarantee the notes solely by virtue of such guarantees; provided, that if any such Subsidiaries guarantee any obligations under the senior unsecured credit facility following the Cole Merger, such Subsidiaries will be required to guarantee the notes as set forth above.
A Subsidiary Guarantor will be automatically released and relieved from all its obligations under its guarantee in the following circumstances:
(a) upon the sale or other disposition (including by way of consolidation or merger), in one transaction or a series of related transactions, of at least a majority of the total voting power of the capital stock or other interests of such Subsidiary Guarantor (other than to the Parent or any of its Subsidiaries), as permitted under the Indenture;
153
Table of Contents
(b) upon the sale or disposition of all or substantially all the assets of such Subsidiary Guarantor (other than to the Parent or any of its Subsidiaries), as permitted under the Indenture; or
(c) if at any time when no default has occurred and is continuing with respect to the notes, such Subsidiary Guarantor no longer guarantees (or which guarantee is being simultaneously released or will be immediately released after the release of the Subsidiary Guarantor) any other Debt of the Issuer or any Guarantor.
Parent shall not be released from its guarantee so long as any notes remain outstanding.
Ranking
The notes and the guarantees will be the unsecured and unsubordinated obligations of the Issuer and the Guarantors and will rank equally with all of the other existing and future unsecured and unsubordinated indebtedness of the Issuer and the Guarantors and senior to all of the subordinated indebtedness of the Issuer and the Guarantors. The notes will be structurally subordinated to all existing and future indebtedness and other liabilities (including guarantees) of the Subsidiaries of the Issuer and will be effectively subordinated to all secured indebtedness of the Issuer and the Guarantors to the extent of the value of the assets securing such indebtedness. The notes will be structurally senior to all existing and future indebtedness and other liabilities of Parent from time to time outstanding, to the extent that such indebtedness is not guaranteed by the Issuer.
As of June 30, 2014, the Issuer’s aggregate indebtedness was approximately $9.7 billion. The Issuer may incur additional indebtedness in the future, including borrowings under the newly revised (effective June 30, 2014) $4.6 billion senior unsecured credit facility (under which it has undrawn commitments of $2.7 billion at June 30, 2014 and which contains an “accordion” feature to allow it, under certain circumstances, to increase the commitments thereunder to $6.0 billion). At June 30, 2014, the Issuer had approximately $1.9 billion outstanding under the senior unsecured credit facility.
Interest and Maturity
The 2017 notes will mature on February 6, 2017. The 2019 notes will mature on February 6, 2019. The 2024 notes will mature on February 6, 2024. The notes are not entitled to the benefit of any sinking fund payments. The 2017 notes will bear interest at the rate of 2.000% per annum, the 2019 notes will bear interest at the rate of 3.000% per annum and the 2024 notes will bear interest at the rate of 4.600% per annum, each from February 6, 2014 or from the most recent interest payment date (as defined below) to which interest has been paid on the notes, payable semi-annually in arrears on February 6 and August 6 of each year (the “interest payment dates”), commencing August 6, 2014, to the persons in whose names the notes are registered in the security register applicable to the notes at the close of business on January 22 and July 22 (the “regular record dates”), as the case may be, immediately before the applicable interest payment dates. Interest on the notes will be computed on the basis of a 360-day year of twelve 30-day months. If any interest payment date, the maturity date, any date fixed for redemption or any other day on which the principal of, premium, if any, or interest on a note becomes due and payable falls on a day that is not a Business Day, the required payment shall be made on the next Business Day as if it were made on the date the payment was due and no interest will accrue on the amount so payable for the period from and after such interest payment date, maturity date, redemption date or other date, as the case may be.
The Issuer may make interest payments (1) by wire transfer of funds to the person at an account maintained within the United States, or (2) if no wire transfer is provided, the Issuer may make interest payments by check mailed to the address of the person entitled to the payment as that address appears in the applicable register for those notes.
Additional Interest may accrue on the notes in certain circumstances pursuant to the registration rights agreement. All references in the Indenture, in any context, to any interest or other amount payable on or with
154
Table of Contents
respect to the notes shall be deemed to include any Additional Interest payable pursuant to the registration rights agreement.
Optional Redemption
The Issuer may redeem all or part of any series of the notes at any time at their option at a redemption price equal to the greater of:
(a) 100% of the principal amount of the notes to be redeemed; and
(b) the sum of the present values of the remaining scheduled payments of principal of and interest on the notes to be redeemed (exclusive of interest accrued to the applicable redemption date) discounted to such redemption date on a semiannual basis, assuming a 360-day year consisting of twelve 30-day months, at the Treasury Rate plus 20 basis points, in the case of the 2017 notes, 25 basis points, in the case of the 2019 notes, and 30 basis points, in the case of the 2024 notes, plus, in the case of both clauses (a) and (b) above, accrued and unpaid interest on the principal amount of the notes of such series being redeemed to, but excluding, such redemption date; provided, with respect to the 2019 notes and the 2024 notes, that if the notes are redeemed on or after January 6, 2019, with respect to the 2019 notes, or November 6, 2023, with respect to the 2024 notes, the redemption price will equal 100% of the principal amount of the notes of the applicable series to be redeemed, plus accrued and unpaid interest on the amount being redeemed to, but excluding, the date of redemption.
Notwithstanding the foregoing, installments of interest on notes of any series that are due and payable on an interest payment date falling on or prior to a redemption date will be payable to the persons who were the Holders of the notes (or one or more predecessor notes of such series) registered as such at the close of business on the relevant regular record dates according to their terms and the provisions of the Indenture.
“Comparable Treasury Issue” means, with respect to any redemption date for any series of the notes, the U.S. Treasury security selected by the Independent Investment Banker as having a maturity comparable to the remaining term of such series of notes to be redeemed that would be utilized, at the time of selection and in accordance with customary financial practice, in pricing new issues of corporate debt securities of comparable maturity to the remaining term of such series of notes to be redeemed.
“Comparable Treasury Price” means, with respect to any redemption date for each series of the notes:
(a) if the Issuer obtains four Reference Treasury Dealer Quotations for such redemption date, the average of such Reference Treasury Dealer Quotations, after excluding the highest and lowest such Reference Treasury Dealer Quotations; or
(b) if the Issuer obtains fewer than four but more than one such Reference Treasury Dealer Quotations for such redemption date, the average of all such Reference Treasury Dealer Quotations; or
(c) if the Issuer obtains only one such Reference Treasury Dealer Quotation for such redemption date, that Reference Treasury Dealer Quotation.
“Independent Investment Banker” means one of the Reference Treasury Dealers that the Issuer has appointed to act as the “Independent Investment Banker.”
“Reference Treasury Dealer” means with respect to any redemption date for each series of the notes, each of (i) Barclays Capital Inc. and Citigroup Global Markets, Inc. and their respective successors (provided, however, that if any such firm or any such successor, as the case may be, ceases to be a primary U.S. Government securities dealer in The City of New York (a “Primary Treasury Dealer”), the Issuer shall substitute therefor another nationally recognized investment banking firm that is a Primary Treasury Dealer), and (ii) up to two other Primary Treasury Dealers selected by the Issuer.
155
Table of Contents
“Reference Treasury Dealer Quotations” means, with respect to each Reference Treasury Dealer and any redemption date for each series of the notes, the average, as determined by the Issuer, of the bid and asked prices for the Comparable Treasury Issue (expressed in each case as a percentage of its principal amount) quoted in writing to the Issuer by such Reference Treasury Dealer at 5:00 p.m., New York City time, on the third Business Day preceding such redemption date.
“Treasury Rate” means, with respect to any redemption date for each series of the notes:
(a) the yield, under the heading that represents the average for the immediately preceding week, appearing in the most recently published statistical release designated “H.15(519)” or any successor publication which is published weekly by the Board of Governors of the Federal Reserve System and which establishes yields on actively traded United States Treasury securities adjusted to constant maturity under the caption “Treasury Constant Maturities,” for the maturity corresponding to the Comparable Treasury Issue (if no maturity is within three months before or after the final maturity date of such series, yields for the two published maturities most closely corresponding to the Comparable Treasury Issue shall be determined and the Treasury Rate shall be interpolated or extrapolated from such yields on a straight-line basis, rounding to the nearest month); or
(b) if such release (or any successor release) is not published during the week preceding the calculation date or does not contain such yields, the rate per annum equal to the semiannual equivalent yield to maturity of the Comparable Treasury Issue, calculated using a price for the Comparable Treasury Issue (expressed as a percentage of its principal amount) equal to the Comparable Treasury Price for such redemption date.
The Treasury Rate shall be calculated by the Issuer on the third Business Day preceding the applicable redemption date, on which date the Issuer will provide the Trustee with a calculation of the applicable redemption price.
Notice of any redemption by the Issuer will be mailed at least 30 days but not more than 60 days before any redemption date to each Holder of such series of the notes to be redeemed. If less than all of the outstanding notes of such series are to be redeemed, the notes of such series to be redeemed shall be selected, so long as such notes are in book-entry form, in accordance with the applicable procedures of DTC (as defined below) or, if such notes are issued in definitive certificated form under limited circumstances by such method as the Trustee shall deem fair and appropriate.
Unless the Issuer defaults in payment of the redemption price, on and after any redemption date, interest will cease to accrue on each series of the notes or portions thereof called for redemption.
Paying Agent and Registrar for the Notes
The Issuer will maintain one or more paying agents for purposes of presentment and surrender for payment of the notes in the Borough of Manhattan, City of New York and for all other purposes in St. Paul, Minnesota. The initial paying agent for the notes will be the Trustee. The initial registrar will be the Trustee. The registrar will maintain a register reflecting ownership of the notes outstanding from time to time and will make payments on and facilitate transfer of notes on behalf of the Issuer. The Issuer may change the paying agents or the registrars without prior notice to the Holders. Parent or any of its Subsidiaries, including the Issuer, may act as a paying agent or registrar.
Transfer and Exchange
A Holder may transfer or exchange notes in accordance with the Indenture. The registrar and the Trustee may require a Holder to furnish appropriate endorsements and transfer documents in connection with a transfer of notes. Holders will be required to pay all taxes due on transfer. The Issuer is not required to transfer or exchange any note selected for redemption. Also, the Issuer is not required to issue, transfer or exchange any note for a period of 15 days before the mailing of a notice of redemption of notes to be redeemed.
156
Table of Contents
Certain Covenants
The following covenants will apply to the notes for the benefit of the Holders of the notes.
Limitation on Incurrence of Total Debt. Parent will not, and will not permit any Subsidiary to, incur any Debt (including, without limitation, Acquired Debt) if, immediately after giving effect to the incurrence of such additional Debt and the application of the proceeds therefrom on a pro forma basis, the aggregate principal amount of all outstanding Debt of Parent and its Subsidiaries on a consolidated basis determined in accordance with GAAP is greater than 65% of the sum of (1) the Total Assets of Parent and its Subsidiaries as of the end of the latest fiscal quarter covered in Parent’s Annual Report on Form 10-K or Quarterly Report on Form 10-Q, as the case may be, most recently filed with the Securities and Exchange Commission (the “SEC”) (or, if such filing is not required under the Exchange Act), with the Trustee) prior to the incurrence of such additional Debt, and (2) the aggregate purchase price of any real estate assets or mortgages receivable acquired, and the aggregate amount of any securities offering proceeds received (to the extent such proceeds were not used to acquire real estate assets or mortgages receivable or used to reduce Debt), in each case by Parent or any of its Subsidiaries since the end of such fiscal quarter, including the proceeds obtained from the incurrence of such additional Debt.
Limitation on Incurrence of Secured Debt. Parent will not, and will not permit any Subsidiary to, incur any Secured Debt (including, without limitation, Acquired Debt that is secured by a Lien) if, immediately after giving effect to the incurrence of such Secured Debt and the application of the proceeds therefrom on a pro forma basis, the aggregate principal amount of all outstanding Secured Debt of Parent and its Subsidiaries on a consolidated basis determined in accordance with GAAP is greater than 40% of the sum of (1) the Total Assets of Parent and its Subsidiaries as of the end of the latest fiscal quarter covered in Parent’s Annual Report on Form 10-K or Quarterly Report on Form 10-Q, as the case may be, most recently filed with the SEC (or, if such filing is not required under the Exchange Act, with the Trustee) prior to the incurrence of such additional Debt and (2) the aggregate purchase price of any real estate assets or mortgages receivable acquired, and the aggregate amount of any securities offering proceeds received (to the extent such proceeds were not used to acquire real estate assets or mortgages receivable or used to reduce Debt), in each case by Parent or any of its Subsidiaries since the end of such fiscal quarter, including the proceeds obtained from the incurrence of such additional Debt.
Debt Service Coverage. Parent will not, and will not permit any Subsidiary to, incur any Debt (including, without limitation, Acquired Debt), other than Intercompany Debt, if the ratio of Consolidated Income Available for Debt Service to the Annual Debt Service Charge for the period consisting of the four consecutive fiscal quarters most recently ended prior to the date on which such additional Debt is to be incurred is less than 1.5 to 1.0, on a pro forma basis after giving effect to the incurrence of such Debt and the application of the proceeds therefrom, and calculated on the following assumptions: (1) such Debt and any other Debt (including, without limitation, Acquired Debt) incurred by Parent or any of its Subsidiaries since the first day of such four-quarter period and the application of the proceeds therefrom (including to refinance other Debt since the first day of such four-quarter period) had occurred on the first day of such period; (2) the repayment or retirement of any other Debt of Parent or any of its Subsidiaries since the first day of such four-quarter period had occurred on the first day of such period (except that, in making such computation, the amount of Debt under any revolving credit facility, line of credit or similar facility shall be computed based upon the average daily balance of such Debt during such period); and (3) in the case of any acquisition or disposition by Parent or any Subsidiary of any asset or group of assets since the first day of such four-quarter period, including, without limitation, by merger, stock purchase or sale, or asset purchase or sale, such acquisition or disposition had occurred on the first day of such period with the appropriate adjustments with respect to such acquisition or disposition being included in such pro forma calculation. If the Debt giving rise to the need to make the foregoing calculation or any other Debt incurred after the first day of the relevant four-quarter period bears interest at a floating rate then, for purposes of calculating the Annual Debt Service Charge, the interest rate on such Debt shall be computed on a pro forma basis by applying the average daily rate which would have been in effect during the entire such four-quarter period to the greater of the amount of such Debt outstanding at the end of such period or the average amount of such Debt outstanding during such period.
157
Table of Contents
Maintenance of Total Unencumbered Assets. Parent and its Subsidiaries will not have at any time Total Unencumbered Assets of less than 150% of the aggregate principal amount of all of the outstanding Unsecured Debt of Parent and its Subsidiaries determined on a consolidated basis in accordance with GAAP.
Existence. Except as permitted under the heading entitled “—Merger, Consolidation or Sale of Assets,” each of Parent and the Issuer shall do or cause to be done all things necessary to preserve and keep in full force and effect its legal existence, all material rights (by charter, bylaws or other governing document and statute) and all material franchises; provided, that neither Parent nor the Issuer shall be required to preserve any right or franchise if its board of directors (or similar governing body) determines that the preservation thereof is no longer desirable in the conduct of its business.
Maintenance of Properties. Each of Parent and the Issuer shall cause each of its material properties used or useful in the conduct of its business or the business of any Subsidiary of Parent to be maintained and kept in good condition, repair and working order and supplied with all necessary equipment and will require it to cause to be made all necessary repairs, renewals, replacements, betterments and improvements to those properties, as in its judgment may be necessary so that the business carried on in connection with those properties may be properly and advantageously conducted at all times; provided, that Parent and its Subsidiaries shall not be prevented from selling or otherwise disposing of these properties for value in the ordinary course of business.
Insurance. Parent shall, and shall cause each of its Subsidiaries to, keep in force upon all of its properties and operations policies of insurance with financially sound and reputable carriers in such amounts and covering all risks as shall be customary in the industry, in accordance with prevailing market conditions and availability.
Payment of Taxes and Other Claims. Parent shall pay or discharge (or, if applicable, cause to be transferred to bond or other security) or cause to be paid or discharged, before the same shall become delinquent, (a) all taxes, assessments and governmental charges levied or imposed on each of Parent or any of its Subsidiaries or upon the income, profits or property of each of Parent or any of its Subsidiaries and (b) all lawful claims for labor, materials and supplies that, if unpaid, might by law become a Lien upon its property or the property of any Subsidiary; provided, that Parent shall not be required to pay or discharge (or transfer to bond or other security) or cause to be paid or discharged any tax, assessment, charge or claim the amount, applicability or validity of which it is contesting in good faith through appropriate proceedings and for which it has established adequate reserves in accordance with GAAP.
Provision of Financial Information.
(a) Whether or not the Issuer is subject to Section 13 or 15(d) of the Exchange Act and for so long as any notes are outstanding, the Issuer will furnish to the Trustee (1) all quarterly and annual reports that would be required to be filed with the SEC on Forms 10-Q and 10-K if the Issuer was required to file such reports and (2) all current reports that would be required to be filed with the SEC on Form 8-K if the Issuer was required to file such reports, in each case within 15 days after the Issuer files such reports with the SEC or would be required to file such reports with the SEC pursuant to the applicable rules and regulations of the SEC, whichever is earlier. Reports, information and documents filed with the SEC via the EDGAR system will be deemed to be delivered to the Trustee as of the time of such filing via EDGAR for purposes of this covenant; provided, that the Trustee shall have no obligation whatsoever to determine whether or not such information, documents or reports have been filed via EDGAR. Delivery of such reports, information and documents to the Trustee is for informational purposes only and the Trustee’s receipt of such shall not constitute constructive notice of any information contained therein or determinable from information contained therein.
(b) The Issuers will promptly furnish to the holders, beneficial owners and prospective purchasers of the notes, upon their request, the information required to be delivered pursuant to Rule 144A(d)(4) to facilitate the resale of the notes pursuant to Rule 144A.
158
Table of Contents
Notwithstanding the foregoing, in the event that the rules and regulations of the SEC (including Rule 3-10 of Regulation S-X) permit the Issuer and Parent to report at Parent entity’s level on a consolidated basis, and Parent entity is not engaged in any business in any material respect, other than incidental to its ownership, directly or indirectly of the capital stock of the Issuer, then the information and reports required by this covenant may be those of Parent on a consolidated basis, rather than those of the Issuer. The reporting and filing requirements set forth above for the applicable period may be satisfied by the Issuer prior to the effectiveness of the registration statement relating to the exchange offers for the notes or the shelf registration statement (each as described under “—Exchange Offers; Registration Rights”) by the filing with the SEC of the reports and information required by clause (a) above with respect to Parent, rather than the Issuer.
Future Subsidiary Guarantors. Parent shall cause each of its Subsidiaries that (a) owns, directly or indirectly, any Equity Interests issued by the Issuer or (b) guarantees other Debt of the Issuer or any Guarantor to execute and deliver to the Trustee an officers’ certificate pursuant to which such Subsidiary will unconditionally guarantee, on a joint and several basis, the due and punctual payment of principal of and interest on the notes, when and as the same become due and payable, whether on the maturity date, by declaration of acceleration, upon redemption, repurchase or otherwise, and all of the Issuer’s other obligations under the Indenture; provided, that the Subsidiaries of Parent that guarantee the CapLease Debt on the original issue date shall not be required to guarantee the notes solely by virtue of such guarantees. In addition, the Subsidiaries of Parent that guarantee ARCP OP’s obligations under the senior unsecured credit facility prior to, but not following, the Cole Merger and effectiveness of the amendment to the senior unsecured credit facility, shall not be required to guarantee the notes solely by virtue of such guarantees; provided, that if any such Subsidiaries guarantee any obligations under the senior unsecured credit facility following the Cole Merger, such Subsidiaries will be required to guarantee the notes as set forth above.
Certain Definitions
As used herein:
“Acquired Debt” means Debt of a person: (1) existing at the time such person is merged or consolidated with or into Parent or any of its Subsidiaries or becomes a Subsidiary of Parent; or (2) is assumed by Parent or any of its Subsidiaries in connection with the acquisition of assets from such person. Acquired Debt shall be deemed to be incurred on the date the acquired person is merged or consolidated with or into Parent or any of its Subsidiaries or becomes a Subsidiary of Parent or the date of the related acquisition, as the case may be.
“Additional Interest” means all additional interest then owing pursuant to the registration rights agreement.
“Annual Debt Service Charge” means, for any period, the interest expense of Parent and its Subsidiaries for such period in respect of Debt, determined on a consolidated basis in accordance with GAAP.
“Business Day” means any day, other than a day on which Federal or State banking institutions in the Borough of Manhattan, The City of New York, or in the city in which the Corporate Trust Office is located, are authorized or obligated by law, regulation or executive order to close.
“CapLease Debt” means, collectively, (1) the 7.50% Convertible Senior Notes due 2027 originally issued by CapLease, Inc. and assumed by Parent and (2) the $150 million credit facility originally entered into by CapLease, LP and assumed by ARCP OP.
“Cole Merger” means Parent’s acquisition of Cole Real Estate Investments, Inc. through the merger of Cole Real Estate Investments, Inc. with and into Clark, with Clark surviving as Parent’s wholly owned subsidiary, pursuant to the Agreement and Plan of Merger by and among Parent, Clark and Cole Real Estate Investments, Inc., dated as of October 22, 2013.
“Consolidated Income Available for Debt Service” for any period means Consolidated Net Income of Parent and its Subsidiaries for such period, plus amounts which have been deducted, and minus amounts which have
159
Table of Contents
been added, in determining Consolidated Net Income during such period, for, without duplication: (1) Consolidated Interest Expense; (2) provision for taxes of Parent and its Subsidiaries based on income; (3) amortization of debt discount, premium and deferred financing costs; (4) impairment losses and gains or losses on sales or other dispositions of properties; (5) real estate related depreciation and amortization; (6) the effect of any non-recurring, non-cash items; (7) amortization of deferred charges; (8) gains or losses on early extinguishment of debt; and (9) acquisition expenses, all determined on a consolidated basis in accordance with GAAP.
“Consolidated Interest Expense” for any period, and without duplication, means all interest (including the interest component of rentals on capitalized leases, letter of credit fees, commitment fees and other like financial charges) and all amortization of debt discount on all Debt (including, without limitation, payment-in-kind, zero coupon and other like securities) but excluding legal fees, title insurance charges, other out-of-pocket fees and expenses incurred in connection with the issuance of Debt and the amortization of any such debt issuance costs that are capitalized, all determined for Parent and its Subsidiaries on a consolidated basis in accordance with GAAP.
“Consolidated Net Income” for any period means the amount of consolidated net income (or loss) of Parent and its Subsidiaries for such period, excluding extraordinary items, all determined on a consolidated basis in accordance with GAAP.
“Corporate Trust Office” means the principal office of the Trustee at which at any time its corporate trust office shall be administered, which office at the date hereof is located at EP-MN-WS2N, 60 Livingston Ave., St. Paul, Minnesota 55107, Attention: Corporate Trust Administration Services, Ref: ARC Properties Operating Partnership, L.P., or such other address as the Trustee may designate from time to time by notice to the Holders and the Issuer, or the principal corporate trust office of any successor Trustee (or such other address as such successor Trustee may designate from time to time by notice to the Holders and the Issuer).
“Debt” means any indebtedness of Parent or any Subsidiary, whether or not contingent, in respect of:
(1) money borrowed or evidenced by bonds, notes, debentures or similar instruments, in each case, whether or not such Debt is secured by any Lien existing on any property or assets owned by Parent or any Subsidiary; (2) indebtedness secured by a Lien on any property or assets owned by Parent or any Subsidiary; (3) letters of credit or amounts representing the balance deferred and unpaid of the purchase price of any property except any such balance that constitutes an accrued expense or trade payable; or (4) any lease of property by Parent or any Subsidiary as lessee that is reflected on Parent’s consolidated balance sheet as a capitalized lease in accordance with GAAP, and Debt also includes, to the extent not otherwise included, any obligation of Parent or any Subsidiary to be liable for, or to pay, as obligor, guarantor or otherwise (other than for purposes of collection in the ordinary course of business), indebtedness of another person (other than Parent or any Subsidiary) of the type referred to in (1), (2), (3) or (4) above (it being understood that Debt shall be deemed to be incurred by Parent or any Subsidiary whenever Parent or such Subsidiary shall create, assume, guarantee or otherwise become liable in respect thereof).
“Equity Interests” means, with respect to any Person, all of the shares of capital stock of (or other ownership or profit interests in) such Person, all of the warrants, options or other rights for the purchase or acquisition from such Person of shares of capital stock of (or other ownership or profit interests in) such Person, all of the securities convertible into or exchangeable for shares of capital stock of (or other ownership or profit interests in) such Person or warrants, rights or options for the purchase or acquisition from such Person of such shares (or such other interests), and all of the other ownership or profit interests in such Person (including partnership, member or trust interests therein), whether voting or nonvoting, and whether or not such shares, warrants, options, rights or other interests are outstanding on any date of determination. “GAAP” means generally accepted accounting principles, as in effect as of the date of determination, as used in the United States applied on a consistent basis.
160
Table of Contents
“Guarantors” means, collectively, Parent and each Subsidiary Guarantor, and “Guarantor” means any one of the Guarantors.
“Holder” means the person in whose name a note is registered in the security register maintained by the Trustee.
“Intercompany Debt” means indebtedness owed by Parent or any Subsidiary solely to Parent or any Subsidiary; provided, that with respect to any such Debt of which either Issuer or any Guarantor is the borrower, such Debt is subordinate in right of payment to the notes or such guarantee, as applicable.
“Lien” means any mortgage, lien, charge, encumbrance, trust deed, deed of trust, deed to secure debt, security agreement, pledge, security interest, security agreement or other encumbrance of any kind.
“Person” means any individual, corporation, limited liability company, partnership, joint-venture, joint-stock company, trust, unincorporated organization or government or agency or political subdivision thereof.
“Secured Debt” means Debt secured by a Lien on any property or assets of Parent or any of its Subsidiaries.
“Subsidiary” of a Person means a corporation, partnership, joint venture, limited liability company or other business entity of which a majority of the Equity Interests having ordinary voting power for the election of directors or other governing body (other than Equity Interests having such power only by reason of the happening of a contingency) are at the time beneficially owned, or the management of which is otherwise controlled, directly or indirectly through one or more intermediaries, or both, by such Person. Unless otherwise specified, all references herein to a “Subsidiary” or to “Subsidiaries” shall refer to a Subsidiary or Subsidiaries of Parent.
“Subsidiary Guarantors” means, as of any date, all Subsidiaries of Parent that guarantee the obligations of the Issuer under the Indenture and the notes in accordance with the provisions of the Indenture, and “Subsidiary Guarantor” means any one of the Subsidiary Guarantors; provided that upon the release or discharge of such Subsidiary Guarantor from its guarantee in accordance with the Indenture, such Subsidiary shall cease to be a Subsidiary Guarantor.
“Total Assets” as of any date means the sum of (1) Undepreciated Real Estate Assets and (2) all other assets of Parent and its Subsidiaries determined on a consolidated basis in accordance with GAAP (but excluding accounts receivable and non-real estate intangibles).
“Total Unencumbered Assets” as of any date means Total Assets of Parent and its Subsidiaries that are not subject to a Lien securing Debt, determined on a consolidated basis in accordance with GAAP; provided, that in determining Total Unencumbered Assets as a percentage of outstanding Unsecured Debt for purposes of the covenant set forth above under “—Maintenance of Total Unencumbered Assets,” all investments in any person that is not consolidated with Parent for financial reporting purposes in accordance with GAAP shall be excluded from Total Unencumbered Assets.
“Undepreciated Real Estate Assets” as of any date means the cost (original cost plus capital improvements) of real estate assets and related intangibles of Parent and its Subsidiaries on such date, before depreciation and amortization, determined on a consolidated basis in accordance with GAAP.
“Unsecured Debt” means Debt of Parent or any Subsidiary that is not Secured Debt.
161
Table of Contents
Merger, Consolidation or Sale of Assets
The Indenture will provide that Parent or an Issuer may consolidate with, or sell, lease or convey all or substantially all of its assets to, or merge with or into, any other entity, provided that the following conditions are met:
(a) (1) Parent or such Issuer, as applicable, shall be the continuing entity or (2) the successor entity (if other than Parent or such Issuer, as applicable) formed by or resulting from any consolidation or merger or which shall have received the transfer of assets shall be domiciled in the United States, any state thereof or the District of Columbia and shall expressly assume payment of the principal of and interest on each series of the notes and the due and punctual performance and observance of all of the covenants and conditions in the Indenture;
(b) immediately after giving effect on a pro forma basis to the transaction (including the incurrence of any Debt in connection therewith), no event of default under the Indenture, and no event which, after notice or the lapse of time, or both, would become an event of default, shall have occurred and be continuing; and
(c) an officers’ certificate and legal opinion covering these conditions shall be delivered to the Trustee.
In the event of any transaction described in and complying with the conditions listed in the immediately preceding paragraph in which Parent or an Issuer, as applicable, is not the continuing entity, the successor person formed or remaining shall succeed, and be substituted for, and may exercise every right and power of Parent’s or such Issuer’s, as applicable, and Parent or such Issuer, as applicable, shall be discharged from its obligations under the notes, the Indenture and the registration rights agreement.
The Parent will not permit any Subsidiary Guarantor to consolidate with, or sell, lease or convey all or substantially all of its assets to, or merge with or into, any other entity unless the following conditions are met:
(a) (1) such Subsidiary Guarantor shall be the continuing entity or (2) the successor entity (if not such Subsidiary Guarantor) formed by or resulting from any consolidation or merger or which shall have received the transfer of assets shall be domiciled in the United States, any state thereof or the District of Columbia and shall expressly assume, by a supplemental indenture, all the obligations of such Subsidiary Guarantor, if any, under the notes or its guarantee, as applicable; provided, that the foregoing requirement will not apply in the case of a Subsidiary Guarantor (x) that has been disposed of in its entirety to another person (other than to Parent or an affiliate of Parent), whether through a merger, consolidation or sale of capital stock or has sold, leased or converted all or substantially all of its assets or (y) that, as a result of the disposition of all or a portion of its capital stock, ceases to be a Subsidiary;
(b) immediately after giving effect on a pro forma basis to the transaction (including the incurrence of any Debt in connection therewith), no event of default under the Indenture, and no event which, after notice or the lapse of time, or both, would become an event of default, shall have occurred and be continuing; and
(c) an officers’ certificate and legal opinion covering these conditions shall be delivered to the Trustee. In the event of any transaction described in and complying with the conditions listed in the immediately preceding paragraph in which such Subsidiary Guarantor is not the continuing entity, the successor person formed or remaining shall succeed, and be substituted for, and may exercise every right and power of such Subsidiary Guarantor, and such Subsidiary Guarantor shall be discharged from its obligations under the notes, the Indenture and the registration rights agreement.
162
Table of Contents
Events of Default, Notice and Waiver
The Indenture will provide that the following events are “events of default” with respect to each series of the notes:
(1) default for 30 days in the payment of any installment of interest on any series of the notes;
(2) default in the payment of the principal of (or premium, if any, on) any series of the notes when due, whether at stated maturity or by declaration of acceleration, notice of redemption, notice of option to elect repayment or otherwise;
(3) default in the performance of any of the Issuer’s or any Guarantor’s other covenants contained in the Indenture or in such series of the notes, which continues for 60 days after written notice is given to the Issuer by the Trustee or to the Issuer and the Trustee by the Holders of at least 25% in principal amount of the outstanding notes of that series;
(4) the guarantee of any Guarantor ceases to be in full force and effect or such Guarantor denies or disaffirms in writing its obligations under the Indenture or its guarantee;
(5) default under any bond, debenture, note or other evidence of indebtedness for money borrowed by Parent or any of its Subsidiaries (including obligations under leases required to be capitalized on the balance sheet of the lessee under GAAP, but not including any indebtedness or obligations for which recourse is limited to property purchased) in an aggregate principal amount in excess of $50.0 million or under any mortgage, indenture or instrument under which there may be issued or by which there may be secured or evidenced any indebtedness for money borrowed by Parent or any of its Subsidiaries (including such leases, but not including such indebtedness or obligations for which recourse is limited to property purchased) in an aggregate principal amount in excess of $50.0 million, whether the indebtedness exists at the date of the Indenture or shall thereafter be created, which default shall have resulted in the indebtedness becoming or being declared due and payable prior to the date on which it would otherwise have become due and payable or which default shall have resulted in the obligation being accelerated, without the acceleration having been rescinded or annulled; or
(6) certain events of bankruptcy, insolvency or reorganization with respect to Parent, the Issuer or any Significant Subsidiary of Parent.
The term “Significant Subsidiary” as used above has the meaning ascribed to the term in Rule 1-02 of Regulation S-X promulgated under the Securities Act.
If an event of default under the Indenture occurs and is continuing, then the Trustee or the Holders of not less than 25% in principal amount of the outstanding notes of that series may declare the principal amount of all the notes of that series to be due and payable immediately by written notice thereof to the Issuer (and to the Trustee if given by the Holders); provided that if an Event of Default specified in clause (6) above occurs, the principal amount of all outstanding notes of each series shall become due and payable without any declaration or other act on the part of the Trustee or any Holder. However, at any time after the declaration of acceleration with respect to notes of a series has been made, but before a judgment or decree for payment of the money due has been obtained by the Trustee, the Holders of not less than a majority of the principal amount of the outstanding notes of that series may rescind and annul the declaration and its consequences if:
(a) the Issuer shall have deposited with the Trustee all required payments of the principal of (and premium, if any) and interest on the notes of that series (other than principal that has become due solely as a result of the acceleration), plus certain fees, expenses, disbursements and advances of the Trustee; and
(b) all events of default, other than the nonpayment of accelerated principal (or specified portion thereof), premium, if any, and interest with respect to notes of that series, have been cured or waived as provided in the Indenture.
163
Table of Contents
The Indenture will also provide that the Holders of not less than a majority in principal amount of the outstanding notes of any series may waive any past default with respect to that series and its consequences, except:
(a) a default in the payment of the principal of (or premium, if any) or interest on any note of that series; or
(b) a default in respect of a covenant or provision contained in the Indenture that cannot be modified or amended without the consent of the Holder of each outstanding note of the series affected by the default.
The Indenture will require the Trustee to give notice of a default under the Indenture to the Holders of notes within 90 days unless the default shall have been cured or waived, subject to certain exceptions; provided, that the Trustee may withhold notice to the Holders of any series of notes of any default with respect to that series (except a default in the payment of the principal of (or premium, if any) or interest on any note of that series) if specified Responsible Officers of the Trustee consider a withholding to be in those Holders’ interest.
The Indenture will provide that no Holders of notes of any series may institute any proceedings, judicial or otherwise, with respect to the Indenture or for any remedy thereunder, except in the case of failure of the Trustee, for 60 days, to act after it has received a written request to institute proceedings in respect of an event of default from the Holders of not less than 25% in principal amount of the outstanding notes of that series, as well as an offer of indemnity reasonably satisfactory to it, and no direction inconsistent with the written request has been given to the Trustee during the 60-day period by Holders of a majority in principal amount of the outstanding notes of that series. This provision will not prevent, however, any Holder of notes from instituting suit for the enforcement of payment of the principal of (and premium, if any) and interest on those notes at the respective due dates thereof.
The Indenture will provide that, subject to provisions in the TIA relating to its duties in case of default, the Trustee is under no obligation to exercise any of its rights or powers under the Indenture at the request or direction of any Holders of any series of the notes then outstanding under the Indenture, unless those Holders shall have offered to the Trustee reasonable security or indemnity. The Holders of not less than a majority in principal amount of the outstanding notes of any series shall have the right to direct the time, method and place of conducting any proceeding for any remedy available to the Trustee, or of exercising any trust or power conferred upon the Trustee; provided that the direction shall not conflict with any rule of law or the Indenture; and provided further that the Trustee may refuse to follow any direction that may involve the Trustee in personal liability or that may be unduly prejudicial to the Holders of notes of that series not joining in the direction to the Trustee.
Within 120 days after the close of each fiscal year, the Issuer will be required to deliver to the Trustee a certificate, signed by one of several specified officers, stating whether or not the officer has knowledge of any default under the Indenture and, if so, specifying each default and the nature and status thereof.
Modification of the Indenture
Modifications, amendments, and supplements to, and waivers of, any of the provisions of the Indenture will be permitted with the consent of the Holders of not less than a majority in aggregate principal amount of all outstanding notes of each series issued under the Indenture affected by the modification, amendment supplement or waiver; provided, that no modification, amendment supplement or waiver may, without the consent of the Holder of each series of notes then outstanding affected thereby:
(a) change the stated maturity of the principal of, or any installment of principal of, or interest (or premium, if any) on such series of notes;
(b) reduce the principal amount of, or reduce the rate of interest or extend the time of payment of interest on, or reduce any premium payable upon redemption of such series of notes, or would be provable in bankruptcy, or
164
Table of Contents
adversely affect any right of repayment at the option of the Holder of such series of notes (or reduce the amount of premium payable upon any repayment);
(c) change the place of payment, or the coin or currency, for payment of principal of (or premium, if any) or interest on such series of notes;
(d) impair the right to institute suit for the enforcement of any payment on or with respect to such series of notes when due;
(e) reduce the above-stated percentage amount of the outstanding notes of such series, the consent of whose Holders is required for any such modification or amendment, or the consent of whose Holders is required for any waiver of certain defaults and consequences under the Indenture;
(f) modify any of the foregoing provisions or any of the provisions relating to the waiver of certain past defaults or certain covenants, except to increase the required percentage to effect the action or to provide that certain other provisions of the Indenture may not be modified or waived without the consent of the Holder of each outstanding notes of that series affected thereby; or
(g) release Parent from its guarantee of the notes.
The Issuers, along with the Trustee, shall be permitted to modify and amend the Indenture without the consent of any Holder of notes for any of the following purposes:
(a) to evidence the succession of another person to any Issuer’s or any Guarantor’s obligations under the Indenture;
(b) to add to the Issuer’s or any Guarantor’s covenants for the benefit of the Holders of all or any series of notes or to surrender any right or power conferred upon the Issuer and the Guarantors in the Indenture;
(c) to add events of default for the benefit of the Holders of all or any series of notes;
(d) to change or eliminate any provisions of the Indenture; provided that any such change or elimination does not apply to any outstanding notes of a series that are entitled to the benefit of that provision;
(e) to secure the notes or add a guarantor;
(f) to provide for the acceptance of appointment by a successor trustee or facilitate the administration of the trusts under the Indenture by more than one trustee;
(g) to cure any ambiguity or to correct any defect or inconsistency in the Indenture, or to make any other provisions with respect to matters or questions arising under the Indenture which shall not be inconsistent with the provisions of the Indenture; provided, however, that such action shall not adversely affect the interests of Holders of notes of any series in any material respect;
(h) to supplement any of the provisions of the Indenture to the extent necessary to permit or facilitate defeasance, covenant defeasance and discharge of any series of notes; provided, however, that this action shall not adversely affect the interests of the Holders of the notes of any series in any material respect;
(i) to evidence the release of any Subsidiary Guarantor pursuant to the terms of the Indenture;
(j) to provide for the issuance of additional notes in accordance with the limitations set forth in the Indenture; or
(k) to comply with any requirements of the SEC or any successor in connection with the qualification of the Indenture under the TIA.
165
Table of Contents
The Indenture will provide that in determining whether the Holders of the requisite principal amount of outstanding notes of a series have given any request, demand, authorization, direction, notice, consent or waiver described in the Indenture or whether a quorum is present at a meeting of Holders of a series of notes:
(a) the principal amount of that series of notes that shall be deemed to be outstanding shall be the amount of the principal of that series of notes that would be due and payable as of the date of the determination upon declaration of acceleration of the maturity thereof; and
(b) notes of that series owned by an Issuer or any other obligor upon the notes or any affiliate of an Issuer or of the other obligor shall be disregarded.
The Indenture will contain provisions for convening meetings of the Holders of notes of a series. A meeting may be permitted to be called at any time by the Trustee, and also, upon the Issuer’s request or request of the Holders of at least 10% in principal amount of the outstanding notes of such series, in any case upon notice given as provided in the Indenture. Except for any consent or waiver that must be given by the Holder of each series of notes affected thereby, any resolution presented at a meeting or at an adjourned meeting duly reconvened at which a quorum is present, may be adopted by the affirmative vote of the Holders of a majority in principal amount of the outstanding notes of that series; provided, however, that, except as referred to above, any resolution with respect to any request, demand, authorization, direction, notice, consent, waiver or other action that may be made, given or taken by the Holders of a specified percentage which is less than a majority in principal amount of the outstanding notes of a series may be adopted at a meeting or adjourned meeting duly reconvened at which a quorum is present by the affirmative vote of the Holders of that specified percentage in principal amount of the outstanding notes of that series. Any resolution passed or decision taken at any meeting of Holders of notes of any series duly held in accordance with the Indenture will be binding on all Holders of notes of that series. The persons holding or representing a majority in principal amount of the outstanding notes of a series shall constitute a quorum for a meeting of Holders of that series; provided, however, that if any action is to be taken at such meeting with respect to a consent or waiver that may be given by the Holders of not less than a specified percentage in principal amount of the outstanding notes of that series, the persons holding or representing the specified percentage in principal amount of the outstanding notes of that series will constitute a quorum.
Notwithstanding the foregoing provisions, the Indenture will provide that if any action is to be taken at a meeting of Holders of notes of any series with respect to any request, demand, authorization, direction, notice, consent, waiver or other action that the Indenture expressly provides may be made, given or taken by the Holders of that series and one or more additional series: (a) there shall be no minimum quorum requirement for such meeting, and (b) the principal amount of the outstanding notes of all those series that are entitled to vote in favor of the request, demand, authorization, direction, notice, consent, waiver or other action shall be taken into account in determining whether the request, demand, authorization, direction, notice, consent, waiver or other action has been made, given or taken under the Indenture.
Discharge, Defeasance and Covenant Defeasance
Upon the Issuer’s request, the Indenture shall cease to be of further effect with respect to any series of notes issued under the Indenture specified in such request (except as to certain limited provisions of the Indenture which shall survive) when either (a) all notes of that series have been delivered to the Trustee for cancellation or (b) all notes of that series have become due and payable or will become due and payable within one year (or are scheduled for redemption within one year) and the Issuer have irrevocably deposited with the Trustee, in trust, for the benefit of the Holders, cash in U.S. dollars, in an amount sufficient to pay the entire indebtedness on such series of notes in respect of principal (and premium, if any) and interest to the date of the deposit (if such notes have become due and payable) or to the stated maturity or redemption date, as the case may be.
166
Table of Contents
The Indenture will provide that the Issuer may elect either to:
(a) defease and be discharged from (and have the Guarantors be discharged from) any and all obligations with respect to any series of notes (except for the obligation, if any, to pay additional amounts in respect of certain taxes imposed on non-U.S. Holders of notes and the obligations to register the transfer or exchange of the notes, to replace temporary or mutilated, destroyed, lost or stolen notes, to maintain an office or agency in respect of the notes and to hold money for payment in trust) (“defeasance”); or
(b) be released and to have the Guarantors be released from their obligations with respect to the covenants applicable to such series of the notes under the Indenture, including those described under “—Certain Covenants,” and any omission to comply with these obligations shall not constitute a default or an event of default with respect to such series of notes (“covenant defeasance”), in either case upon the Issuer’s irrevocable deposit with the Trustee, in trust, for the benefit of the Holders of such series, cash in U.S. dollars, or Government Obligations (as defined below), or both, in an amount sufficient to pay the principal of (and premium, if any) and interest on such series of notes on the scheduled due dates.
A trust may only be established if, among other things, the Issuer have delivered to the Trustee an opinion of counsel (as specified in the Indenture) to the effect that the Holders of the applicable series of notes will not recognize income, gain or loss for U.S. federal income tax purposes as a result of the defeasance or covenant defeasance and will be subject to U.S. federal income tax on the same amounts, in the same manner and at the same times as would have been the case if the defeasance or covenant defeasance had not occurred. Additionally, in the case of defeasance, an opinion of counsel must refer to and be based on a ruling of the Internal Revenue Service or a change in applicable U.S. federal income tax law occurring after the date of the Indenture. In the event of defeasance, the Holders of those notes will thereafter be able to look only to the trust fund for payment of principal (and premium, if any) and interest.
“Government Obligations” means, with respect to the notes, securities that are (a) direct obligations (other than obligations subject to variation in principal repayment) of the United States of America for the payment of which its full faith and credit is pledged, or (b) obligations of a person controlled or supervised by and acting as an agency or instrumentality of the United States of America, the payment of which is unconditionally guaranteed as a full faith and credit obligation by the United States of America, which, in either case, are not callable or redeemable prior to maturity at the option of the issuer thereof, and shall also include a depository receipt issued by a bank or trust company as custodian with respect to any such Government Obligation or a specific payment of principal of or interest on any such Government Obligation held by a custodian for the account of the holder of such depository receipt; provided, however, that (except as required by law) such custodian is not authorized to make any deduction from the amount payable to the holder of such depository receipt from any amount received by the custodian in respect of the Government Obligation or the specific payment of or interest on the Government Obligation evidenced by the depository receipt.
If after the Issuer have deposited funds, Government Obligations or a combination of the foregoing to effect defeasance or covenant defeasance with respect to notes of any series:
(a) the Holder of a note of that series is entitled to, and does, elect pursuant to the Indenture or the terms of that note to receive payment in a currency, currency unit or composite currency other than that in which the deposit has been made in respect of that note; or
(b) a Conversion Event (as defined below) occurs in respect of the currency, currency unit or composite currency in which the deposit has been made, then the indebtedness represented by that note will be deemed to have been, and will be, fully discharged and satisfied through the payment of the principal of (and premium, if any) and interest on that note as they become due out of the proceeds yielded by converting the amount so deposited in respect of such note into the currency, currency unit or composite currency in which the note becomes payable as a result of the election or Conversion Event based on the applicable market exchange rate.
167
Table of Contents
“Conversion Event” means the cessation of use of:
(a) a currency, currency unit or composite currency both by the government of the country which issued the currency and for the settlement of transactions by a central bank or other public institution of or within the international banking community; or
(b) any currency unit or composite currency for the purposes for which it was established. In the event the Issuer effect a covenant defeasance with respect to any series of notes and those notes are declared due and payable because of the occurrence of any event of default, other than an event of default due to a breach of any of the covenants as to which there has been covenant defeasance (which covenants would no longer be applicable to such series of notes as a result of such covenant defeasance), the cash and Government Obligations on deposit with the Trustee may not be sufficient to pay amounts due on such notes at the time of the acceleration resulting from the event of default. The Issuers would, however, remain obligated to make payment of the amounts due at the time of acceleration.
Trustee
U.S. Bank National Association will initially act as the trustee, registrar, exchange agent and paying agent for the notes, subject to replacement at the Issuer’s option as provided in the Indenture. If the Trustee becomes a creditor of the Issuer, it will be subject to limitations on its rights to obtain payment of claims or to realize on some property received for any such claim, as security or otherwise. The Trustee is permitted to engage in other transactions with us. If, however, it acquires any conflicting interest, it must eliminate that conflict or resign.
No Conversion or Exchange Rights
The notes will not be convertible into or exchangeable for any shares of beneficial interest in Parent.
Governing Law
The Indenture will be governed by and shall be construed in accordance with the laws of the State of New York.
No Personal Liability
None of an Issuer’s or any Guarantor’s directors, officers, employees, members, partners, incorporators or stockholders will have any liability for any of such Issuer’s or such Guarantor’s obligations under the notes, the Indenture, any guarantees or for any claim based on, in respect of, or by reason of, such obligations or their creation. Each Holder of notes by accepting a note waives and releases all such liability. The waiver and release are part of the consideration for issuance of the notes. The waiver may not be effective to waive liabilities under the federal securities laws.
168
Table of Contents
MATERIAL U.S. FEDERAL INCOME TAX CONSIDERATIONS
The following summary describes U.S. federal income tax considerations relating to the exchange of old notes that were purchased pursuant to their original issue for exchange notes, but does not address any other aspects of U.S. federal income tax consequences to holders of the old notes or exchange notes. This summary is based on the Code, Treasury Regulations, judicial decisions, published positions of the Internal Revenue Service (the “IRS”) and other applicable authorities, all as in effect as of the date hereof and all of which are subject to change or differing interpretations (possibly with retroactive effect). The discussion does not address all of the tax consequences that may be relevant to a particular person or to persons subject to special treatment under U.S. federal income tax laws (such as financial institutions, broker-dealers, insurance companies, regulated investment companies, real estate investment trusts, cooperatives, traders in securities who elect to apply a mark-to-market method of accounting, persons that have a functional currency other than the U.S. dollar, expatriates, tax-exempt organizations, or persons that are, or hold their notes through, partnerships or other pass-through entities), or to persons who hold the notes as part of a straddle, hedge, conversion, synthetic security, or constructive sale transaction for U.S. federal income tax purposes, all of whom may be subject to tax rules that differ from those summarized below. In addition, this discussion does not address the consequences of the alternative minimum tax, or any state, local or foreign tax consequences or any tax consequences other than U.S. federal income tax consequences. This summary deals only with exchange notes held as capital assets within the meaning of the Code (generally, property held for investment).
Exchanges of old notes for exchange notes pursuant to the exchange offers should not constitute taxable events for U.S. federal income tax purposes. As a result, (1) a holder should not recognize a taxable gain or loss as a result of exchanging such holder’s old notes for exchange notes, (2) the holding period of the exchange notes should include the holding period of the old notes exchanged therefor, (3) the adjusted tax basis of the exchange notes should be the same as the adjusted tax basis of the old notes exchanged therefor immediately before such exchange and (4) the adjusted issue price of the exchange notes will be the same as the adjusted issue price of the old notes exchanged therefor immediately before such exchange.
Prospective holders should consult their own tax advisors with regard to the application of the tax consequences discussed below to their particular situations as well as the application of any state, local, foreign or other tax laws, including U.S. federal gift and estate tax laws, and any tax treaties.
169
Table of Contents
Each broker-dealer that receives exchange notes for its own account pursuant to the exchange offers must acknowledge that it will deliver a prospectus in connection with any resale of such exchange notes. This prospectus, as it may be amended or supplemented from time to time, may be used by a broker-dealer in connection with resales of exchange notes received in exchange for old notes where such old notes were acquired as a result of market-making activities or other trading activities. To the extent any such broker-dealer participates in the exchange offers, the Issuer has agreed that for a period of up to 180 days it will use commercially reasonable efforts to make this prospectus, as amended or supplemented, available to such broker-dealer for use in connection with any such resale, and will deliver as many additional copies of this prospectus and each amendment or supplement to this prospectus and any documents incorporated by reference in this prospectus as such broker-dealer may reasonably request.
The Issuer will not receive any proceeds from any sale of exchange notes by broker-dealers. Exchange notes received by broker-dealers for their own accounts pursuant to the exchange offers may be sold from time to time in one or more transactions in the over-the-counter market, in negotiated transactions, through the writing of options on the exchange notes or a combination of these methods of resale, at market prices prevailing at the time of resale, at prices related to such prevailing market prices or negotiated prices. Any such resale may be made directly to purchasers or to or through brokers or dealers who may receive compensation in the form of commissions or concessions from any such broker-dealer or the purchasers of any such exchange notes. Any broker-dealer that resells exchange notes that were received by it for its own account pursuant to the exchange offers and any broker or dealer that participates in a distribution of such exchange notes may be deemed to be an “underwriter” within the meaning of the Securities Act and any profit on any such resale of exchange notes and any commissions or concessions received by any such persons may be deemed to be underwriting compensation under the Securities Act. The letter of transmittal states that by acknowledging that it will deliver and by delivering a prospectus, a broker-dealer will not be deemed to admit that it is an “underwriter” within the meaning of the Securities Act.
Furthermore, any broker-dealer that acquired any of the old notes directly from the Issuer:
| • | cannot rely on the position of the staff of the SEC enunciated in Exxon Capital Holdings Corp., SEC no-action letter (April 13, 1988) and Morgan, Stanley & Co. Inc., SEC no-action letter (June 5, 1991), as interpreted in the SEC’s letter in Shearman & Sterling, SEC no-action letter (July 2, 1983); and |
| • | in the absence of an exemption therefrom, must comply with the registration and prospectus delivery requirements of the Securities Act in connection with any resale of the exchange notes. |
The Issuer has agreed to pay all expenses incident to the exchange offers other than commissions or concessions of any brokers or dealers and will indemnify the holders of the old notes, including any broker-dealers, against certain liabilities, including liabilities under the Securities Act.
The validity and enforceability of the exchange notes and the related guarantees will be passed upon for us by Proskauer Rose LLP, New York, New York, and Venable LLP, Baltimore, Maryland.
The audited financial statements and schedules of ARC Properties Operating Partnership, L.P. included in this prospectus and elsewhere in the registration statement have been so included in reliance upon the report of Grant Thornton LLP, independent registered public accountants, upon the authority of said firm as experts in accounting and auditing.
170
Table of Contents
The audited financial statements and schedules of American Realty Capital Properties, Inc. and management’s assessment of the effectiveness of internal control over financial reporting incorporated by reference in this prospectus and elsewhere in the registration statement have been so incorporated by reference in reliance upon the reports of Grant Thornton LLP, independent registered public accountants, upon the authority of said firm as experts in accounting and auditing.
The consolidated financial statements of Cole Real Estate Investments, Inc. (f/k/a Cole Credit Property Trust III, Inc.), incorporated in this Prospectus by reference from the Current Report on Form 8-K/A filed by American Realty Capital Properties, Inc. on March 14, 2014, have been audited by Deloitte & Touche LLP, independent auditors, as stated in their report (which report expresses an unmodified opinion and includes an emphasis-of-matter paragraph relating to the acquisition of Cole Real Estate Investments, Inc. (f/k/a Cole Credit Property Trust III, Inc.) by American Realty Capital Properties, Inc.), which is incorporated herein by reference. Such consolidated financial statements have been so incorporated in reliance upon the report of such firm given upon their authority as experts in accounting and auditing.
The consolidated financial statements, the related financial statement schedules and the effectiveness of internal control over financial reporting of CapLease, Inc. and Subsidiaries incorporated by reference in this Registration Statement by reference to the Annual Report on Form 10-K for the year ended December 31, 2012, have been audited by McGladrey LLP (formerly McGladrey & Pullen, LLP), an independent registered public accounting firm, as stated in their report incorporated by reference herein, and have been so incorporated in reliance upon such reports and upon the authority of such firm as experts in accounting and auditing.
WHERE YOU CAN FIND MORE INFORMATION
We have filed with the SEC a registration statement on Form S-4 under the Securities Act with respect to the securities we are offering by this prospectus. This prospectus does not contain all of the information included in the registration statement, including its exhibits and schedules. You should refer to the registration statement, including the exhibits and schedules, for further information about us and the securities we are offering. Statements we make in this prospectus about certain contracts or other documents are not necessarily complete. When we make such statements, we refer you to the copies of the contracts or documents that are filed as exhibits to the registration statement because those statements are qualified in all respects by reference to those exhibits.
The SEC allows ARCP to “incorporate by reference” the information ARCP files with them into this prospectus supplement and the accompanying prospectus, which means that ARCP can disclose important information to you by referring you to those documents. The information incorporated by reference is considered to be part of this prospectus supplement and the accompanying prospectus, and later information that ARCP files with the SEC will automatically update and supersede this information. ARCP incorporates by reference the documents listed below and any future filings made with the SEC under Sections 13(a), 13(c), 14, or 15(d) of the Exchange Act, until this offering is complete (other than, in each case, documents or information deemed to have been furnished and not filed in accordance with SEC rules):
| • | ARCP’s Annual Report on Form 10-K for the year ended December 31, 2013 filed with the SEC on February 27, 2014; |
| • | ARCP’s Amendment No. 1 to Form 10-K for the year ended December 31, 2013 filed with the SEC on September 4, 2014; |
| • | ARCP’s Quarterly Reports on Form 10-Q for the quarterly periods ended March 31, 2014 and June 30, 2014 filed with the SEC on May 8, 2014 and July 29, 2014, respectively; |
| • | ARCP’s Current Reports on Form 8-K or Form 8-K/A, as applicable, filed with the SEC on June 14, 2013, November 1, 2013 (the Form 8-K filed on this date), January 3, 2014 (only with respect to Items 1.01, 2.01, 3.03, 5.02 and 8.01 of such Form 8-K filed on this date), January 8, 2014, January 9, 2014 (two Form 8-Ks filed on this date), January 14, 2014 (two Form 8-Ks filed on this date), January 17, |
171
Table of Contents
| 2014, January 23, 2014 (two Form 8-Ks filed on this date), January 24, 2014, February 4, 2014, February 5, 2014, February 6, 2014 (two Form 8-Ks filed on this date), February 7, 2014, February 10, 2014 (two Form 8-Ks filed on this date, but in the first Form 8-K filed on this date, only with respect to Item 8.01), February 13, 2014, February 19, 2014, February 26, 2014, February 27, 2014 (only with respect to the Form 8-K/A filed on that date), March 4, 2014, March 13, 2014 (only with respect to Item 8.01), March 14, 2014 (three Form 8-Ks filed on this date), March 20, 2014, March 21, 2014, April 2, 2014, April 10, 2014, April 18, 2014, April 22, 2014, April 29, 2014, May 16, 2014, May 20, 2014 (two Form 8-Ks filed on this date), May 21, 2014 (the first, third and fifth Form 8-K filed on this date), May 22, 2014, May 28, 2014, May 29, 2014, June 2, 2014, June 3, 2014 (the second and third Form 8-K filed on this date), June 10, 2014, June 12, 2014, June 24, 2014, June 26, 2014, June 30, 2014, July 10, 2014, July 16, 2014, July 22, 2014, July 28, 2014 (two Form 8-Ks filed on this date, but in the first Form 8-K filed on this date, only with respect to Item 5.02), August 20, 2014, September 2, 2014, September 5, 2014 and September 10, 2014 (only with respect to Item 5.02). |
| • | ARCP’s definitive proxy statement filed with the SEC on April 29, 2014 but only to the extent such information was incorporated by reference into ARCP’s Annual Report on Form 10-K for the year ended December 31, 2013; and |
| • | description of ARCP’s common stock included in ARCP’s registration statement on Form 8-A filed with the SEC on August 1, 2011. |
We will provide without charge to each person, including any beneficial owner, to whom this prospectus is delivered, upon his or her written or oral request, a copy of any or all documents referred to above that have been or may be incorporated by reference into this prospectus but not delivered with this prospectus, excluding exhibits to those documents unless they are specifically incorporated by reference into those documents. Requests for those documents should be directed to us as follows: American Realty Capital Properties, Inc., 405 Park Avenue, New York, New York 10022, Attn: Investor Relations, Telephone: (212) 415-6500.
172
Table of Contents
ARC PROPERTIES OPERATING PARTNERSHIP, L.P.
INDEX TO CONSOLIDATED FINANCIAL STATEMENTS
F-1
Table of Contents
REPORT OF INDEPENDENT REGISTERED PUBLIC ACCOUNTING FIRM
Board of Directors of General Partner and Limited Partners
ARC Properties Operating Partnership, L.P. and subsidiaries
We have audited the accompanying consolidated balance sheets of ARC Properties Operating Partnership, L.P. (a Delaware limited partnership) and subsidiaries (collectively the “Operating Partnership”) as of December 31, 2013 and 2012, and the related consolidated statements of operations and comprehensive loss, changes in equity, and cash flows for each of the three years in the period ended December 31, 2013. Our audits of the basic consolidated financial statements included the financial statement schedules listed in the index. These financial statements and financial statement schedules are the responsibility of the Operating Partnership’s management. Our responsibility is to express an opinion on these financial statements and financial statement schedules based on our audits.
We conducted our audits in accordance with the standards of the Public Company Accounting Oversight Board (United States). Those standards require that we plan and perform the audit to obtain reasonable assurance about whether the financial statements are free of material misstatement. An audit also includes examining, on a test basis, evidence supporting the amounts and disclosures in the financial statements, assessing the accounting principles used and significant estimates made by management, as well as evaluating the overall financial statement presentation. We believe that our audits provide a reasonable basis for our opinion.
In our opinion, the consolidated financial statements referred to above present fairly, in all material respects, the financial position of ARC Properties Operating Partnership, L.P. and subsidiaries as of December 31, 2013 and 2012, and the results of their operations and their cash flows for each of the three years in the period ended December 31, 2013 in conformity with accounting principles generally accepted in the United States of America. Also in our opinion, the related financial statement schedules, when considered in relation to the basic consolidated financial statements taken as a whole, presents fairly, in all material respects, the information set forth therein.
/s/ GRANT THORNTON LLP
Philadelphia, Pennsylvania
July 31, 2014
F-2
Table of Contents
ARC PROPERTIES OPERATING PARTNERSHIP, L.P.
(In thousands, except for unit data)
| December 31, | ||||||||
| 2013 | 2012 | |||||||
| ASSETS | ||||||||
| Real estate investments, at cost: |
||||||||
| Land |
$ | 1,379,453 | $ | 262,906 | ||||
| Buildings, fixtures and improvements |
5,294,342 | 1,391,209 | ||||||
| Land and construction in progress |
22,230 | — | ||||||
| Acquired intangible lease assets |
759,786 | 221,153 | ||||||
|
|
|
|
|
|||||
| Total real estate investments, at cost |
7,455,811 | 1,875,268 | ||||||
| Less: accumulated depreciation and amortization |
(267,352 | ) | (56,415 | ) | ||||
|
|
|
|
|
|||||
| Total real estate investments, net |
7,188,459 | 1,818,853 | ||||||
| Cash and cash equivalents |
52,725 | 292,575 | ||||||
| Investment in direct financing leases, net |
66,112 | — | ||||||
| Investment securities, at fair value |
62,067 | 41,654 | ||||||
| Loans held for investment, net |
26,279 | — | ||||||
| Derivative assets, at fair value |
9,189 | — | ||||||
| Restricted cash |
35,881 | 1,108 | ||||||
| Prepaid expenses and other assets |
188,082 | 11,984 | ||||||
| Goodwill |
96,720 | — | ||||||
| Deferred costs, net |
81,311 | 15,356 | ||||||
| Assets held for sale |
679 | 665 | ||||||
|
|
|
|
|
|||||
| Total assets |
$ | 7,807,504 | $ | 2,182,195 | ||||
|
|
|
|
|
|||||
| LIABILITIES AND EQUITY | ||||||||
| Mortgage notes payable, net |
$ | 1,301,114 | $ | 265,118 | ||||
| Convertible debt due to General Partner, net |
972,490 | — | ||||||
| Senior secured revolving credit facility |
— | 124,604 | ||||||
| Senior corporate credit facilities |
1,819,800 | — | ||||||
| Secured credit facility |
150,000 | — | ||||||
| Other debt |
104,804 | — | ||||||
| Below-market lease liabilities, net |
77,789 | — | ||||||
| Derivative liabilities, at fair value |
18,455 | 3,830 | ||||||
| Accounts payable and accrued expenses |
808,489 | 104,384 | ||||||
| Deferred rent and other liabilities |
21,752 | 4,394 | ||||||
| Distributions payable |
10,278 | 11,105 | ||||||
|
|
|
|
|
|||||
| Total liabilities |
5,284,971 | 513,435 | ||||||
|
|
|
|
|
|||||
| General partner’s Series D Preferred equity — 21,735,008 and zero General Partner Preferred Units issued and outstanding at December 31, 2013 and December 31, 2012, respectively |
269,299 | — | ||||||
|
|
|
|
|
|||||
| General partner’s common equity — 239,234,725 and 184,553,676 General Partner OP Units issued and outstanding at December 31, 2013 and December 31, 2012, respectively |
1,686,103 | 1,582,880 | ||||||
| General partner’s preferred equity (excluding Series D Preferred equity) — 42,199,547 and 6,990,328 General Partner Preferred Units issued and outstanding at December 31, 2013 and December 31, 2012, respectively |
391,482 | 73,349 | ||||||
| Limited partners’ common equity — 17,832,273 and 1,621,349 Limited Partner OP Units issued and outstanding at December 31, 2013 and December 31, 2012, respectively |
151,721 | 16,465 | ||||||
| Limited partners’ preferred equity — 721,645 and zero Limited Partner Preferred Units issued and outstanding at December 31, 2013 and December 31, 2012, respectively |
14,614 | — | ||||||
| Accumulated other comprehensive income (loss) |
7,666 | (3,934 | ) | |||||
|
|
|
|
|
|||||
| Total partners’ equity |
2,251,586 | 1,668,760 | ||||||
|
|
|
|
|
|||||
| Non-controlling interests |
1,648 | — | ||||||
|
|
|
|
|
|||||
| Total equity |
2,253,234 | 1,668,760 | ||||||
|
|
|
|
|
|||||
| Total liabilities and equity |
$ | 7,807,504 | $ | 2,182,195 | ||||
|
|
|
|
|
|||||
The accompanying notes are an integral part of these statements.
F-3
Table of Contents
ARC PROPERTIES OPERATING PARTNERSHIP, L.P.
CONSOLIDATED STATEMENTS OF OPERATIONS AND COMPREHENSIVE LOSS
(In thousands, except for per unit data)
| Year Ended December 31, | ||||||||||||
| 2013 | 2012 | 2011 | ||||||||||
| Revenues: |
||||||||||||
| Rental income |
$ | 309,839 | $ | 65,187 | $ | 3,762 | ||||||
| Direct financing lease income |
2,244 | — | — | |||||||||
| Operating expense reimbursements |
17,795 | 2,020 | 208 | |||||||||
|
|
|
|
|
|
|
|||||||
| Total revenues |
329,878 | 67,207 | 3,970 | |||||||||
|
|
|
|
|
|
|
|||||||
| Operating expenses: |
||||||||||||
| Acquisition related |
76,136 | 45,070 | 3,898 | |||||||||
| Merger and other transaction related |
278,319 | 2,603 | — | |||||||||
| Property operating |
23,616 | 3,522 | 220 | |||||||||
| Operating fees to affiliate |
5,654 | 212 | — | |||||||||
| General and administrative |
10,645 | 4,215 | 735 | |||||||||
| Equity based compensation |
34,962 | 1,197 | — | |||||||||
| Depreciation and amortization |
211,372 | 41,003 | 2,111 | |||||||||
|
|
|
|
|
|
|
|||||||
| Total operating expenses |
640,704 | 97,822 | 6,964 | |||||||||
|
|
|
|
|
|
|
|||||||
| Operating loss |
(310,826 | ) | (30,615 | ) | (2,994 | ) | ||||||
|
|
|
|
|
|
|
|||||||
| Other (expense) income: |
||||||||||||
| Interest expense |
(102,305 | ) | (11,856 | ) | (960 | ) | ||||||
| Other income, net |
2,847 | 979 | 2 | |||||||||
| Loss on derivative instruments, net |
(67,946 | ) | — | — | ||||||||
| Loss on sale of investments in affiliates |
(411 | ) | — | — | ||||||||
| Loss on sale of investments |
(1,795 | ) | — | — | ||||||||
|
|
|
|
|
|
|
|||||||
| Total other expenses, net |
(169,610 | ) | (10,877 | ) | (958 | ) | ||||||
|
|
|
|
|
|
|
|||||||
| Loss from continuing operations attributable to unitholders |
(480,436 | ) | (41,492 | ) | (3,952 | ) | ||||||
| Discontinued operations: |
||||||||||||
| Loss from operations of held for sale properties |
(34 | ) | (145 | ) | (37 | ) | ||||||
| Gain (loss) on held for sale properties |
14 | (600 | ) | (815 | ) | |||||||
|
|
|
|
|
|
|
|||||||
| Net loss from discontinued operations attributable to unitholders |
(20 | ) | (745 | ) | (852 | ) | ||||||
|
|
|
|
|
|
|
|||||||
| Net loss attributable to unitholders |
(480,456 | ) | (42,237 | ) | (4,804 | ) | ||||||
|
|
|
|
|
|
|
|||||||
| Other comprehensive loss: |
||||||||||||
| Designated derivatives, fair value adjustments |
11,480 | (3,743 | ) | (98 | ) | |||||||
| Change in unrealized gain/loss on investment securities |
119 | (93 | ) | — | ||||||||
|
|
|
|
|
|
|
|||||||
| Comprehensive loss |
$ | (468,857 | ) | $ | (46,073 | ) | $ | (4,902 | ) | |||
|
|
|
|
|
|
|
|||||||
| Basic and diluted net loss per share from continuing operations attributable to common unitholders |
$ | (2.26 | ) | $ | (0.40 | ) | $ | (1.04 | ) | |||
|
|
|
|
|
|
|
|||||||
| Basic and diluted net loss per share attributable to common unitholders |
$ | (2.26 | ) | $ | (0.41 | ) | $ | (1.26 | ) | |||
|
|
|
|
|
|
|
|||||||
The accompanying notes are an integral part of these statements.
F-4
Table of Contents
ARC PROPERTIES OPERATING PARTNERSHIP, L.P.
CONSOLIDATED STATEMENTS OF CHANGES IN EQUITY
(In thousands, except for unit data)
| Preferred Units | Common Units | Accumulated Other Comprehensive Income (Loss) |
Total Partners’ Equity |
Non- controlling Interest |
Total Equity | |||||||||||||||||||||||||||||||||||||||||||
| Number of General Partner Preferred Units |
General Partner’s Equity |
Number of Limited Partner Preferred Units |
Limited Partners’ Equity |
Number of General Partner OP Units |
General Partner’s Equity |
Number of Limited Partner OP Units |
Limited Partners’ Equity |
|||||||||||||||||||||||||||||||||||||||||
| Balance, January 1, 2011 |
— | $ | — | — | $ | — | 20,000 | $ | 200 | — | $ | — | $ | — | $ | 200 | $ | — | $ | 200 | ||||||||||||||||||||||||||||
| Issuance of OP Units |
— | — | — | — | 16,929,184 | 164,375 | — | — | — | 164,375 | — | 164,375 | ||||||||||||||||||||||||||||||||||||
| OP Units issued in conjunction with applicable distribution reinvestment plans |
— | — | — | — | 27,169 | 271 | — | — | — | 271 | — | 271 | ||||||||||||||||||||||||||||||||||||
| Equity-based compensation |
— | — | — | — | 185,663 | 225 | — | — | — | 225 | — | 225 | ||||||||||||||||||||||||||||||||||||
| Distributions declared to general partner |
— | — | — | — | — | (2,519 | ) | — | — | — | (2,519 | ) | — | (2,519 | ) | |||||||||||||||||||||||||||||||||
| Repurchases of OP Units |
— | — | — | — | — | (25 | ) | — | — | — | (25 | ) | — | (25 | ) | |||||||||||||||||||||||||||||||||
| Contribution transactions |
— | — | — | — | — | (16,769 | ) | — | — | — | (16,769 | ) | — | (16,769 | ) | |||||||||||||||||||||||||||||||||
| Contributions from limited partners |
— | — | — | — | — | (3,875 | ) | 310,000 | 3,875 | — | — | — | — | |||||||||||||||||||||||||||||||||||
| Distributions to limited partners |
— | — | — | — | — | — | — | (68 | ) | — | (68 | ) | — | (68 | ) | |||||||||||||||||||||||||||||||||
| Net loss |
— | — | — | — | — | (4,699 | ) | — | (105 | ) | — | (4,804 | ) | — | (4,804 | ) | ||||||||||||||||||||||||||||||||
| Other comprehensive loss |
— | — | — | — | — | — | — | — | (98 | ) | (98 | ) | — | (98 | ) | |||||||||||||||||||||||||||||||||
|
|
|
|
|
|
|
|
|
|
|
|
|
|
|
|
|
|
|
|
|
|
|
|
|
|||||||||||||||||||||||||
| Balance, December 31, 2011 |
— | — | — | — | 17,162,016 | 137,184 | 310,000 | 3,702 | (98 | ) | 140,788 | — | 140,788 | |||||||||||||||||||||||||||||||||||
| Issuance of preferred units |
6,990,328 | 73,349 | — | — | — | — | — | — | — | 73,349 | — | 73,349 | ||||||||||||||||||||||||||||||||||||
| Issuance of OP Units |
— | — | — | — | 164,775,688 | 1,630,056 | — | — | — | 1,630,056 | — | 1,630,056 | ||||||||||||||||||||||||||||||||||||
| Excess of ARCT IV Merger considerations over historical cost |
— | — | — | — | — | (93,421 | ) | — | — | — | (93,421 | ) | — | (93,421 | ) | |||||||||||||||||||||||||||||||||
| Common units issued through distribution reinvestment plan |
— | — | — | — | 2,686,141 | 27,136 | — | — | — | 27,136 | — | 27,136 | ||||||||||||||||||||||||||||||||||||
| Equity based compensation |
— | — | — | — | 112,950 | 1,230 | — | — | — | 1,230 | — | 1,230 | ||||||||||||||||||||||||||||||||||||
| Distributions declared to general partner |
— | — | — | — | — | (75,416 | ) | — | — | — | (75,416 | ) | — | (75,416 | ) | |||||||||||||||||||||||||||||||||
| Repurchases of OP Units |
— | — | — | — | (183,119 | ) | (1,953 | ) | — | — | — | (1,953 | ) | — | (1,953 | ) | ||||||||||||||||||||||||||||||||
| OP Units issued to acquire real estate investment |
— | — | — | — | — | — | 576,376 | 6,352 | — | 6,352 | — | 6,352 | ||||||||||||||||||||||||||||||||||||
| Contributions from limited partners |
— | — | — | — | — | — | 734,973 | 7,375 | — | 7,375 | — | 7,375 | ||||||||||||||||||||||||||||||||||||
| Distributions to limited partners |
— | — | — | — | — | — | — | (663 | ) | — | (663 | ) | — | (663 | ) | |||||||||||||||||||||||||||||||||
| Designated derivatives, fair value adjustment |
— | — | — | — | — | — | — | — | (3,743 | ) | (3,743 | ) | — | (3,743 | ) | |||||||||||||||||||||||||||||||||
| Net loss |
— | — | — | — | — | (41,936 | ) | — | (301 | ) | — | (42,237 | ) | — | (42,237 | ) | ||||||||||||||||||||||||||||||||
| Other comprehensive loss |
— | — | — | — | — | — | — | — | (93 | ) | (93 | ) | — | (93 | ) | |||||||||||||||||||||||||||||||||
|
|
|
|
|
|
|
|
|
|
|
|
|
|
|
|
|
|
|
|
|
|
|
|
|
|||||||||||||||||||||||||
| Balance, December 31, 2012 |
6,990,328 | 73,349 | — | — | 184,553,676 | 1,582,880 | 1,621,349 | 16,465 | (3,934 | ) | 1,668,760 | — | 1,668,760 | |||||||||||||||||||||||||||||||||||
| Issuance of preferred units |
36,037,691 | 327,133 | — | — | — | — | — | — | — | 327,133 | — | 327,133 | ||||||||||||||||||||||||||||||||||||
| Issuance of OP Units |
— | — | — | — | 78,215,719 | 1,661,783 | — | — | — | 1,661,783 | — | 1,661,783 | ||||||||||||||||||||||||||||||||||||
F-5
Table of Contents
| Preferred Units | Common Units | Accumulated Other Comprehensive Income (Loss) |
Total Partners’ Equity |
Non- controlling Interest |
Total Equity | |||||||||||||||||||||||||||||||||||||||||||
| Number of General Partner Preferred Units |
General Partner’s Equity |
Number of Limited Partner Preferred Units |
Limited Partners’ Equity |
Number of General Partner OP Units |
General Partner’s Equity |
Number of Limited Partner OP Units |
Limited Partners’ Equity |
|||||||||||||||||||||||||||||||||||||||||
| Excess of ARCT IV Merger considerations over historical cost |
— | $ | — | — | $ | — | — | $ | (557,557 | ) | — | $ | — | $ | — | $ | (557,557 | ) | $ | — | $ | (557,557 | ) | |||||||||||||||||||||||||
| OP Units issued through dividend reinvestment plan |
— | — | — | — | 940,737 | 25,564 | — | — | — | 25,564 | — | 25,564 | ||||||||||||||||||||||||||||||||||||
| Repurchases of OP Units |
— | — | — | — | (28,319,972 | ) | (358,041 | ) | — | — | — | (358,041 | ) | — | (358,041 | ) | ||||||||||||||||||||||||||||||||
| Issuance of OP Units in conversion of Series A and Series B Preferred Units |
(828,472 | ) | (9,000 | ) | — | — | 829,629 | 9,000 | — | — | — | — | — | — | ||||||||||||||||||||||||||||||||||
| Issuance of OP Units in conversion of Series C Preferred Units |
— | — | — | — | 1,411,030 | 17,396 | — | — | — | 17,396 | — | 17,396 | ||||||||||||||||||||||||||||||||||||
| Conversion of Limited Partner OP Units to General Partner OP Units |
— | — | — | — | 599,233 | 5,800 | (599,233 | ) | (5,800 | ) | — | — | — | — | ||||||||||||||||||||||||||||||||||
| Equity based compensation |
— | — | — | — | 1,004,673 | 845 | 8,241,100 | 32,900 | — | 33,745 | — | 33,745 | ||||||||||||||||||||||||||||||||||||
| Amortization of restricted units |
— | — | — | — | — | 7,116 | — | — | — | 7,116 | — | 7,116 | ||||||||||||||||||||||||||||||||||||
| Equity component of convertible debt |
— | — | — | — | — | 28,559 | — | — | — | 28,559 | — | 28,559 | ||||||||||||||||||||||||||||||||||||
| Consideration to Former Manager for internalization |
— | — | — | — | — | (3,034 | ) | — | — | — | (3,034 | ) | — | (3,034 | ) | |||||||||||||||||||||||||||||||||
| Distributions declared to general partner |
— | — | — | — | — | (259,468 | ) | — | — | — | (259,468 | ) | — | (259,468 | ) | |||||||||||||||||||||||||||||||||
| Issuance of OP Units to limited partners |
— | — | — | — | — | — | 7,972,748 | 108,247 | — | 108,247 | — | 108,247 | ||||||||||||||||||||||||||||||||||||
| Contributions from limited partners |
— | — | 721,465 | 14,614 | — | — | 687,485 | 15,166 | — | 29,780 | — | 29,780 | ||||||||||||||||||||||||||||||||||||
| Distributions to limited partners |
— | — | — | — | — | — | — | (8,389 | ) | — | (8,389 | ) | — | (8,389 | ) | |||||||||||||||||||||||||||||||||
| Non-controlling interests retained in CapLease Merger |
— | — | — | — | — | — | — | — | — | — | 567 | 567 | ||||||||||||||||||||||||||||||||||||
| Contributions from non-controlling interest holders |
— | — | — | — | — | — | — | — | — | — | 1,081 | 1,081 | ||||||||||||||||||||||||||||||||||||
| Redemption of OP Units |
— | — | — | — | — | — | (91,176 | ) | (1,152 | ) | — | (1,152 | ) | — | (1,152 | ) | ||||||||||||||||||||||||||||||||
| Net loss |
— | — | — | — | — | (474,740 | ) | — | (5,716 | ) | — | (480,456 | ) | — | (480,456 | ) | ||||||||||||||||||||||||||||||||
| Other comprehensive income |
— | — | — | — | — | — | — | — | 11,600 | 11,600 | — | 11,600 | ||||||||||||||||||||||||||||||||||||
|
|
|
|
|
|
|
|
|
|
|
|
|
|
|
|
|
|
|
|
|
|
|
|
|
|||||||||||||||||||||||||
| Balance, December 31, 2013 |
42,199,547 | $ | 391,482 | 721,465 | $ | 14,614 | 239,234,725 | $ | 1,686,103 | 17,832,273 | $ | 151,721 | $ | 7,666 | $ | 2,251,586 | $ | 1,648 | $ | 2,253,234 | ||||||||||||||||||||||||||||
|
|
|
|
|
|
|
|
|
|
|
|
|
|
|
|
|
|
|
|
|
|
|
|
|
|||||||||||||||||||||||||
The accompanying notes are an integral part of this statement.
F-6
Table of Contents
ARC PROPERTIES OPERATING PARTNERSHIP, L.P.
CONSOLIDATED STATEMENTS OF CASH FLOWS (In thousands)
| Year Ended December 31, | ||||||||||||
| 2013 | 2012 | 2011 | ||||||||||
| Cash flows from operating activities: |
||||||||||||
| Net loss |
$ | (480,456 | ) | $ | (42,237 | ) | $ | (4,804 | ) | |||
| Adjustments to reconcile net loss to net cash (used in) provided by operating activities: |
||||||||||||
| Issuance of common units in connection with the ARCT III Merger |
108,247 | — | — | |||||||||
| Depreciation |
162,027 | 33,038 | 1,879 | |||||||||
| Amortization of intangible lease assets |
49,345 | 7,965 | 244 | |||||||||
| Amortization of deferred costs |
26,895 | 2,031 | 200 | |||||||||
| Amortization of above- and below-market lease asset |
(176 | ) | 118 | — | ||||||||
| Amortization of discounts and premiums |
(1,700 | ) | — | — | ||||||||
| (Gain) loss on held for sale properties |
(14 | ) | 600 | 815 | ||||||||
| Equity based compensation |
43,565 | 1,230 | 225 | |||||||||
| Unrealized gain on derivative instruments |
(1,739 | ) | — | — | ||||||||
| Loss on sale of investments, net |
2,206 | — | — | |||||||||
| Loss on extinguishment of Series C Preferred Units |
13,749 | — | — | |||||||||
| Changes in assets and liabilities: |
||||||||||||
| Investment in direct financing leases |
2,505 | — | — | |||||||||
| Prepaid expenses and other assets |
(20,406 | ) | (5,089 | ) | (546 | ) | ||||||
| Accounts payable and accrued expenses |
100,166 | 8,277 | 843 | |||||||||
| Deferred rent and other liabilities |
8,555 | 3,507 | 887 | |||||||||
|
|
|
|
|
|
|
|||||||
| Net cash provided by (used in) operating activities |
12,769 | 9,440 | (257 | ) | ||||||||
|
|
|
|
|
|
|
|||||||
| Cash flows from investing activities: |
||||||||||||
| Investments in real estate and other assets |
(3,520,412 | ) | (1,659,536 | ) | (89,981 | ) | ||||||
| Acquisition of a real estate business, net of cash acquired of $41,779 |
(878,898 | ) | — | — | ||||||||
| Investment in direct financing leases |
(68,617 | ) | — | — | ||||||||
| Capital expenditures |
(9,755 | ) | (54 | ) | — | |||||||
| Principal repayments received from borrowers |
442 | — | — | |||||||||
| Purchase of assets from Manager |
(1,584 | ) | — | — | ||||||||
| Proceeds from sale of property held for sale |
— | 553 | — | |||||||||
| Deposits for real estate investments |
(101,887 | ) | (638 | ) | — | |||||||
| Purchases of investment securities |
(81,590 | ) | (41,747 | ) | — | |||||||
| Proceeds from sale of investment securities |
119,542 | — | — | |||||||||
|
|
|
|
|
|
|
|||||||
| Net cash used in investing activities |
(4,542,759 | ) | (1,701,422 | ) | (89,981 | ) | ||||||
|
|
|
|
|
|
|
|||||||
| Cash flows from financing activities: |
||||||||||||
| Proceeds from mortgage notes payable |
6,924 | 229,798 | 21,470 | |||||||||
| Payments on mortgage notes payable |
(5,711 | ) | — | — | ||||||||
| Payments on other debt |
(9,368 | ) | — | — | ||||||||
| Proceeds from senior secured revolving credit facility |
— | 82,319 | 2,066 | |||||||||
| Payments on senior secured revolving credit facility |
(124,604 | ) | (122 | ) | (11,159 | ) | ||||||
| Proceeds from senior corporate credit facility |
1,889,800 | — | — | |||||||||
| Payments on senior corporate credit facility |
(830,000 | ) | — | — | ||||||||
| Proceeds from secured credit facility |
789,000 | — | — | |||||||||
| Payments of deferred financing costs |
(95,268 | ) | (13,974 | ) | (3,108 | ) | ||||||
| Proceeds from issuance of convertible debt |
967,786 | — | — | |||||||||
| Repurchases of OP units |
(359,193 | ) | (1,534 | ) | — | |||||||
| Proceeds from issuances of preferred units |
— | 9,000 | — | |||||||||
| Proceeds from issuance of Series C Preferred Units |
445,000 | — | — | |||||||||
| Cash payment on settlement of Series C Preferred Units |
(441,353 | ) | — | — | ||||||||
| Proceeds from issuance of Series D Preferred Units |
287,991 | — | — | |||||||||
| Proceeds from issuances of OP Units |
1,993,159 | 1,691,412 | 102,109 | |||||||||
| Consideration to Former Manager for internalization |
(5,738 | ) | — | — | ||||||||
| Contributions from affiliate |
— | — | 2 | |||||||||
| Contributions from limited partners |
29,780 | 7,375 | — | |||||||||
| Distributions to limited partners |
(8,219 | ) | (663 | ) | (68 | ) | ||||||
| Contributions from non-controlling interest holders |
1,081 | — | — | |||||||||
| Distributions paid to general partner |
(234,897 | ) | (37,673 | ) | (1,743 | ) | ||||||
| Advances from affiliates, net |
(376 | ) | 396 | — | ||||||||
| Change in restricted cash |
(5,654 | ) | (1,108 | ) | — | |||||||
|
|
|
|
|
|
|
|||||||
| Net cash provided by financing activities |
4,290,140 | 1,965,226 | 109,569 | |||||||||
|
|
|
|
|
|
|
|||||||
| Net change in cash and cash equivalents |
(239,850 | ) | 273,244 | 19,331 | ||||||||
| Cash and cash equivalents, beginning of period |
292,575 | 19,331 | — | |||||||||
|
|
|
|
|
|
|
|||||||
| Cash and cash equivalents, end of period |
$ | 52,725 | $ | 292,575 | $ | 19,331 | ||||||
|
|
|
|
|
|
|
|||||||
| Supplemental Disclosures: |
||||||||||||
| Cash paid for interest |
$ | 49,549 | $ | 8,983 | $ | 622 | ||||||
| Cash paid for income taxes |
1,711 | 173 | — | |||||||||
| Non-cash investing and financing activities: |
||||||||||||
| OP Units issued to acquire real estate investments |
$ | — | $ | 6,352 | $ | — | ||||||
| Initial proceeds from credit facility used to pay down mortgages assumed at formation |
— | — | 51,500 | |||||||||
| Mortgage note payable contributed in formation |
— | — | 13,850 | |||||||||
The accompanying notes are an integral part of these statements.
F-7
Table of Contents
ARC PROPERTIES OPERATING PARTNERSHIP, L.P.
NOTES TO CONSOLIDATED FINANCIAL STATEMENTS
December 31, 2013
Note 1 — Organization
ARC Properties Operating Partnership, L.P. (together with its subsidiaries the “Operating Partnership”) is a Delaware limited partnership formed by American Realty Capital Properties, Inc. (the “General Partner” or “ARCP”), the Operating Partnership’s general partner, on January 13, 2011 to conduct the business of acquiring, owning and operating single-tenant, freestanding commercial real estate properties. The Operating Partnership is the entity through which substantially all of the General Partner’s operations are conducted. The actions of the Operating Partnership and its relationship with ARCP are governed by that certain Third Amended and Restated Agreement of Limited Partnership (the “LPA”), effective as of January 3, 2014. The General Partner does not have any significant assets other than its investment in the Operating Partnership. Therefore, the assets and liabilities of the General Partner and the Operating Partnership are substantially the same. Additionally, pursuant to the LPA, all administrative expenses and expenses associated with the formation and continuity of existence and operation of the General Partner incurred by the General Partner on the Operating Partnership’s behalf shall be treated as expenses of the Operating Partnership. Further, when the General Partner issues any equity instrument that has been approved by the General Partner’s board of directors to date, the LPA requires the Operating Partnership to issue the General Partner equity instruments with substantially similar terms. The LPA will be amended to provide for the issuance of any additional class of equivalent equity instruments to the extent the General Partner’s board of directors authorizes the issuance of any new class of equity securities.
The General Partner, a self-managed real estate investment trust (“REIT”), holds 96.1% of the common equity interests (“OP Units”) in the Operating Partnership as of December 31, 2013. As of December 31, 2013, certain affiliates of the General Partner and certain unaffiliated investors are limited partners and owners of 3.3% and 0.6%, respectively, of the OP Units in the Operating Partnership. Under the limited partnership agreement, after holding OP Units of limited partner interests in the Operating Partnership (“Limited Partner OP Units”) for a period of one year, unless otherwise consented to by the General Partner, holders of Limited Partner OP Units have the right to redeem the Limited Partner OP Units for the cash value of a corresponding number of shares of the General Partner’s common stock or, at the option of the General Partner, a corresponding number of ARCP common shares. In the event that the Limited Partner OP Units are converted into ARCP common shares, the Operating Partnership will issue ARCP an equivalent number of OP Units with General Partner interests (“General Partner OP Units”). The remaining rights of the holders of Limited Partner OP Units are limited and do not include the ability to replace the General Partner or to approve the sale, purchase or refinancing of the Operating Partnership’s assets.
The Operating Partnership acts on behalf of the General Partner and therefore executes ARCP’s focus on investing in properties that are net leased to credit tenants, which are generally large public companies with investment-grade ratings and other creditworthy tenants. ARCP’s long-term business strategy is to acquire a diverse portfolio consisting of approximately 70% long-term leases and 30% medium-term leases, with an average portfolio remaining lease term of approximately 10 to 12 years. ARCP considers properties that are leased on a “medium-term” basis to mean properties originally leased long-term (10 years or longer) that currently have a primary remaining lease duration of generally three to eight years, on average. ARCP seeks to acquire granular, self-originated single-tenant net lease assets, which may be purchased through sale-leaseback transactions, small portfolio and in connection with build-to-suit opportunities to the extent they are appropriate in terms of capitalization rate and scale. ARCP expects this investment strategy to provide for stable income from credit tenants and for growth opportunities from re-leasing of current below market leases.
On behalf of ARCP, the Operating Partnership has advanced ARCP’s investment objectives by growing ARCP’s net lease portfolio through organic acquisitions and also through strategic mergers and acquisitions. See Note 2 — Mergers and Acquisitions.
F-8
Table of Contents
ARC PROPERTIES OPERATING PARTNERSHIP, L.P.
NOTES TO CONSOLIDATED FINANCIAL STATEMENTS — (Continued)
December 31, 2013
During the year ended December 31, 2013, ARC Properties Advisors, LLC (the General Partner’s “Former Manager”), a wholly owned subsidiary of AR Capital, LLC (“ARC”), managed ARCP’s affairs on a day-to-day basis and, as a result, the Operating Partnership’s actions were generally externally managed, with the exception of certain acquisition, accounting and portfolio management services performed by employees of the Operating Partnership. In August 2013, the General Partner’s board of directors determined that it was in the best interests of ARCP and its stockholders to become self-managed, and ARCP completed its transition to self-management on January 8, 2014 (see Note 23 — Subsequent Events). In connection with becoming self-managed, the General Partner terminated the management agreement with its Former Manager, and the Operating Partnership entered into employment and incentive compensation arrangements with ARCP’s executives and acquired from the Former Manager certain assets necessary for its operations.
On June 11, 2014, the Operating Partnership, through indirect subsidiaries of Operating Partnership (the “Sellers”), entered into an agreement of purchase and sale (the “Agreement”) with BRE DDR Retail Holdings III LLC (the “Purchaser”), an entity indirectly jointly owned by affiliates of Blackstone Real Estate Partners VII L.P. and DDR Corp., by which the Sellers have agreed to sell to the Purchaser and the Purchaser has agreed to purchase from the Sellers 67 multi-tenant properties and nine single-tenant properties and the adjacent land and related property (the “Multi-Tenant Portfolio”). The purchase price of the Multi-Tenant Portfolio is $1.975 billion, subject to customary real estate adjustments. Properties may be excluded from the transaction in certain circumstances, in which case the purchase price will be reduced by the portion of the purchase price allocated to the excluded properties.
As discussed in Note 2 — Mergers and Acquisitions, on January 3, 2014, the General Partner, through a wholly owned subsidiary of the Operating Partnership, acquired American Realty Capital Trust IV, Inc. (“ARCT IV”). The General Partner and ARCT IV, from inception to January 3, 2014, were considered to be entities under common control because the entities’ advisors were wholly owned subsidiaries of ARC. ARC and its related parties had ownership interests in the General Partner, Operating Partnership and ARCT IV through the ownership of OP Units and other equity interests. In addition, the advisors of both ARCP and ARCT IV were contractually eligible to receive potential fees for their services from both of the companies, including asset management fees, incentive fees and other fees and had continued to receive fees from ARCP, paid by the Operating Partnership, prior to the General Partner’s transition to self-management, which was completed on January 8, 2014. Due to the significance of these fees, the entities’ advisors and ultimately ARC were determined to have a significant economic interest in both companies, in addition to having the power to direct the activities of the companies through advisory/management agreements, which qualified them as affiliated companies under common control in accordance with U.S. GAAP.
Note 2 — Mergers and Acquisitions
Completed Mergers and Significant Acquisitions
American Realty Capital Trust III, Inc. Merger
On December 14, 2012, the General Partner entered into an Agreement and Plan of Merger (the “ARCT III Merger Agreement”) with American Realty Capital Trust III, Inc. (“ARCT III”) and certain subsidiaries of each company. The ARCT III Merger Agreement provided for the merger of ARCT III with and into a subsidiary of the General Partner (the “ARCT III Merger”). The ARCT III Merger was consummated on February 28, 2013 (the “ARCT III Merger Date”).
Pursuant to the terms and subject to the conditions set forth in the ARCT III Merger Agreement, each outstanding share of common stock of ARCT III, including restricted shares which became vested, was converted into the right to receive (i) 0.95 of a share of ARCP’s common stock, (the “ARCT III Exchange Ratio”) or (ii) $12.00 in cash. In addition, each outstanding unit of equity ownership of American Realty Capital Operating
F-9
Table of Contents
ARC PROPERTIES OPERATING PARTNERSHIP, L.P.
NOTES TO CONSOLIDATED FINANCIAL STATEMENTS — (Continued)
December 31, 2013
Partnership III, L.P. (the “ARCT III OP”) was converted into the right to receive 0.95 of the same class of unit of equity ownership in the Operating Partnership.
Upon the closing of the ARCT III Merger on February 28, 2013, the Operating Partnership, on ARCP’s behalf, paid an aggregate of $350 million in cash for the 29.2 million shares, or 16.5% of the then outstanding shares of ARCT III’s common stock (which is equivalent to 27.7 million shares of ARCP’s common stock based on the ARCT III Exchange Ratio). In addition, 140.7 million shares of ARCP’s common stock were issued in exchange for 148.1 million shares of ARCT III’s common stock adjusted for the ARCT III Exchange Ratio. In accordance with the LPA, the Operating Partnership issued a corresponding number of General Partner OP Units to ARCP when ARCP issued common stock to former common stockholders of ARCT III.
Upon the consummation of the ARCT III Merger, American Realty Capital Trust III Special Limited Partner, LLC (the “ARCT III Special Limited Partner”), the holder of the special limited partner interest in the ARCT III OP, was entitled to subordinated distributions of net sales proceeds from ARCT III OP which resulted in the issuance of units of limited partner interests in the ARCT III OP, when after applying the ARCT III Exchange Ratio, resulted in the issuance of an additional 7.3 million Limited Partner OP Units to affiliates of the Former Manager. The parties had agreed that such OP Units would be subject to a minimum one-year holding period from the date of issuance before being exchangeable into the General Partner’s common stock.
Also in connection with the ARCT III Merger, the General Partner entered into an agreement with ARC and its affiliates to internalize certain functions performed by them prior to the ARCT III Merger, reduce certain fees paid to affiliates, purchase certain corporate assets and pay certain merger related fees. See Note 18 — Related Party Transactions and Arrangements.
Accounting Treatment for the ARCT III Merger
The General Partner and ARCT III, from inception to the ARCT III Merger Date, were considered to be entities under common control. Both entities’ advisors were wholly owned subsidiaries of ARC. ARC and its related parties had significant ownership interests in the General Partner, Operating Partnership and ARCT III through the ownership of shares, OP Units and other equity interests. In addition, the advisors of both ARCP and ARCT III were contractually eligible to receive potential fees for their services to both of the companies including asset management fees, incentive fees and other fees and continued to receive fees from the Operating Partnership, on behalf of ARCP, prior to ARCP’s transition to self-management. Due to the significance of these fees, the advisors and ultimately ARC were determined to have a significant economic interest in both companies in addition to having the power to direct the significant activities of the companies through advisory/management agreements, which qualified them as affiliated companies under common control in accordance with generally accepted accounting principles in the United States (“U.S. GAAP”). The acquisition of an entity under common control is accounted for on the carryover basis of accounting, whereby the assets and liabilities of the companies are recorded upon the merger on the same basis as they were carried by the companies on the ARCT III Merger Date. In addition, U.S. GAAP requires the Operating Partnership to present historical financial information as if the merger had occurred as of the beginning of the earliest period presented. Therefore, the accompanying financial statements including the notes thereto are presented as if the ARCT III Merger had occurred on January 1, 2011.
GE Capital Portfolio Acquisitions
On June 27, 2013, on behalf of ARCP, the Operating Partnership acquired, through its wholly owned subsidiaries, from certain affiliates of GE Capital Corp., the equity interests in the entities that own a real estate
F-10
Table of Contents
ARC PROPERTIES OPERATING PARTNERSHIP, L.P.
NOTES TO CONSOLIDATED FINANCIAL STATEMENTS — (Continued)
December 31, 2013
portfolio comprised of 447 properties (the “GE Capital Portfolio”) for a purchase price of $773.9 million, exclusive of closing costs, with no liabilities assumed. The 447 properties are subject to 409 property operating leases, as well as 38 direct financing leases.
During the year ended December 31, 2013, ARCT IV acquired, from certain affiliates of GE Capital Corp., the equity interests in the entities that own a real estate portfolio comprised of 924 properties (the “ARCT IV GE Capital Portfolio”) for a purchase price of $1.4 billion, exclusive of closing costs, with no liabilities assumed. The 924 properties are subject to 912 property operating leases, as well as 12 direct financing leases.
CapLease, Inc. Merger
On May 28, 2013, ARCP entered into an Agreement and Plan of Merger (the “CapLease Merger Agreement”) with CapLease, Inc., a Maryland corporation (“CapLease”), and certain subsidiaries of each company. The CapLease Merger Agreement provided for the merger of CapLease with and into a subsidiary of ARCP (the “CapLease Merger”).
On November 5, 2013 (the “CapLease Acquisition Date”), ARCP and the Operating Partnership completed the merger with CapLease pursuant to the CapLease Merger Agreement. Pursuant to the terms of the CapLease Merger Agreement, each outstanding share of common stock of CapLease, other than shares owned by the General Partner, Operating Partnership, CapLease or any of their respective wholly owned subsidiaries, was converted into the right to receive $8.50. Each outstanding share of preferred stock of CapLease, other than shares owned by the General Partner, Operating Partnership, CapLease or any of their respective wholly owned subsidiaries, was converted into the right to receive an amount in cash equal to the sum of $25.00 plus all accrued and unpaid dividends on such shares of preferred stock. In addition, in connection with the merger of CapLease, LP with and into the Operating Partnership (the “CapLease Partnership Merger”), each outstanding unit of equity ownership of CapLease’s operating partnership, other than units owned by CapLease, the Operating Partnership or any of their respective wholly owned subsidiaries, was converted into the right to receive $8.50. Shares of CapLease’s outstanding restricted stock were accelerated and became fully vested, and restricted stock and any outstanding performance shares were fully earned and received $8.50 per share. In total, cash consideration of $920.7 million was paid to the common and preferred shareholders.
Accounting Treatment for the CapLease Merger
The CapLease Merger has been accounted for under the acquisition method of accounting under U.S. GAAP. Under the acquisition method of accounting, the assets acquired and liabilities assumed from CapLease have been recorded as of the acquisition date at their respective fair values. Any excess of purchase price over the fair values is recorded as goodwill. Results of operations for CapLease are included in the Operating Partnership’s consolidated financial statements from the date of acquisition. See Note 5 — CapLease Acquisition.
American Realty Capital Trust IV, Inc. Merger
On July 1, 2013, the General Partner entered into an Agreement and Plan of Merger, as amended on October 6, 2013 and October 11, 2013, (the “ARCT IV Merger Agreement”) with ARCT IV, and certain subsidiaries of each company. The ARCT IV Merger Agreement provided for the merger of ARCT IV with and into a wholly owned subsidiary of the Operating Partnership (the “ARCT IV Merger”). The ARCT IV Merger was consummated on January 3, 2014 (the “ARCT IV Merger Date”).
F-11
Table of Contents
ARC PROPERTIES OPERATING PARTNERSHIP, L.P.
NOTES TO CONSOLIDATED FINANCIAL STATEMENTS — (Continued)
December 31, 2013
Pursuant to the terms of the ARCT IV Merger Agreement, as amended, each outstanding share of common stock of ARCT IV, including unvested restricted shares that vested in conjunction with the ARCT IV Merger, was exchanged for (i) $9.00 in cash, (ii) 0.5190 of a share of ARCP’s common stock (the “ARCT IV Exchange Ratio”) and (iii) 0.5937 of a new series of preferred stock designated as the 6.70% Series F Cumulative Redeemable Preferred Stock (“Series F Preferred Stock”) and each outstanding unit of American Realty Capital Operating Partnership IV, L.P. (“ARCT IV OP” and each unit, an “ARCT IV OP Unit”), other than ARCT IV OP Units held by American Realty Capital Trust IV Special Limited Partner, LLC (the “ARCT IV Special Limited Partner”) and American Realty Capital Advisors IV, LLC (the “ARCT IV Advisor”), was exchanged for (i) $9.00 in cash, (ii) 0.5190 of a Limited Partner OP Unit and (iii) 0.5937 of a Limited Partner OP Unit designated as Series F Preferred Units (“Limited Partner Series F Preferred Units”). In total, the Operating Partnership, on ARCP’s behalf, paid $650.9 million in cash, and ARCP issued 36.9 million shares of common stock and 42.2 million shares of Series F Preferred Stock to former ARCT IV stockholders, and the Operating Partnership issued 0.7 million units of Limited Partner Series F Preferred Units and 0.6 million Limited Partner OP Units to the former ARCT IV OP Unit holders in connection with the consummation of the ARCT IV Merger. In addition, each outstanding ARCT IV Class B Unit (as defined below) and each outstanding ARCT IV OP Unit held by the ARCT IV Special Limited Partner and the ARCT IV Advisor was converted into 2.3961 Limited Partner OP Units, resulting in the Operating Partnership issuing 1.2 million Limited Partner OP Units. In accordance with the LPA, the Operating Partnership issued a corresponding number of General Partner OP Units to ARCP when shares of ARCP’s common stock and Series F Preferred Stock were issued to former common stockholders of ARCT IV, respectively.
On January 3, 2014, the Operating Partnership entered into a Contribution and Exchange Agreement (the “ARCT IV Contribution and Exchange Agreement”) with the ARCT IV OP, ARCT IV Special Limited Partner and ARC Real Estate Partners, LLC, an entity under common ownership with the Former Manager. The ARCT IV Special Limited Partner was entitled to receive certain distributions from the ARCT IV OP, including the subordinated distribution of net sales proceeds resulting from an “investment liquidity event” (as defined in the agreement of limited partnership of the ARCT IV OP). The ARCT IV Merger constituted an “investment liquidity event,” as a result of which the ARCT IV Special Limited Partner, in connection with management’s successful attainment of the 6.0% performance hurdle and the return to ARCT IV’s stockholders of approximately $358.3 million in addition to their initial investment, was entitled to receive a subordinated distribution of net sales proceeds from the ARCT IV OP equal to approximately $63.2 million. Pursuant to the ARCT IV Contribution and Exchange Agreement, the ARCT IV Special Limited Partner contributed its interest in the ARCT IV OP, inclusive of the subordinated distribution proceeds received, to the ARCT IV OP in exchange for 2.8 million equity units of the ARCT IV OP, based on an agreed upon price per share of $22.50. The fair value of these units at the date of issuance was $78.2 million and has been included in merger and other transaction costs in the accompanying consolidated statement of operations for the three months ended March 31, 2014. Upon consummation of the ARCT IV Merger, these equity units were immediately converted to 6.7 million Limited Partner OP Units after application of the exchange ratio of 2.3961 per share. In conjunction with the ARCT IV Merger Agreement, the ARCT IV Special Limited Partner agreed to a minimum two-year holding period for these Limited Partner OP Units before having the right to convert them to common stock of ARCP.
In addition, as part of the ARCT IV Contribution and Exchange Agreement, ARC Real Estate Partners, LLC, contributed $750,000 in cash to the ARCT IV OP, effective prior to the consummation of the ARCT IV Merger, in exchange for ARCT IV OP Units. Upon the consummation of the ARCT IV Merger, these equity units converted at an exchange ratio of 2.3961 Limited Partner OP Units per ARCT IV OP Unit, resulting in the Operating Partnership issuing 0.1 million Limited Partner OP Units to ARC Real Estate Partners, LLC.
F-12
Table of Contents
ARC PROPERTIES OPERATING PARTNERSHIP, L.P.
NOTES TO CONSOLIDATED FINANCIAL STATEMENTS — (Continued)
December 31, 2013
Accounting Treatment for the ARCT IV Merger
The General Partner and ARCT IV, from inception to the ARCT IV Merger Date, were considered to be entities under common control. Both entities’ advisors were wholly owned subsidiaries of ARC. ARC and its related parties had ownership interests in the General Partner, Operating Partnership and ARCT IV through the ownership of shares, OP Units and other equity interests. In addition, the advisors of both ARCP and ARCT IV were contractually eligible to receive potential fees for their services to both of the companies including asset management fees, incentive fees and other fees and had continued to receive fees from the Operating Partnership prior to ARCP’s transition to self-management. Due to the significance of these fees, the advisors and ultimately ARC were determined to have a significant economic interest in both companies in addition to having the power to direct the activities of the companies through advisory/management agreements, which qualified them as affiliated companies under common control in accordance with U.S. GAAP. The acquisition of an entity under common control is accounted for on the carryover basis of accounting, whereby the assets and liabilities of the companies are recorded upon the merger on the same basis as they were carried by the companies on the ARCT IV Merger Date. In addition, U.S. GAAP requires the Operating Partnership to present historical financial information as if the entities were combined for each period presented. Therefore, the accompanying financial statements including the notes thereto are presented as if the ARCT IV Merger, including the impact of the equity transactions entered to consummate the merger, had occurred on January 1, 2011.
Fortress Portfolio Acquisition
On July 24, 2013, ARC and another related entity, on behalf of the General Partner and certain other entities sponsored directly or indirectly by ARC, entered into a purchase and sale agreement with affiliates of funds managed by Fortress Investment Group LLC (“Fortress”) for the purchase of 196 properties owned by Fortress, for an aggregate contract purchase price of $972.5 million, subject to adjustments set forth in the purchase and sale agreement and exclusive of closing costs, which were allocated to ARCP based on the pro rata fair value of the properties acquired by ARCP relative to the fair value of all 196 properties to be acquired from Fortress. Of the 196 properties, 120 properties were allocated to ARCP (the “Fortress Portfolio”). On October 1, 2013, ARCP, through wholly owned subsidiaries of the Operating Partnership, closed on 41 of the 120 properties with a total purchase price of $200.3 million, exclusive of closing costs. Those Operating Partnership subsidiaries closed the acquisition of the remaining 79 properties in the Fortress Portfolio on January 8, 2014, for an aggregate contract purchase price of $400.9 million, exclusive of closing costs. The total purchase price of the Fortress Portfolio was $601.2 million, exclusive of closing costs. During the year ended December 31, 2013, the Operating Partnership deposited $72.2 million into escrow in relation to the Fortress Portfolio, which has been included in prepaid expenses and other assets in the consolidated balance sheets.
Cole Real Estate Investments, Inc. Merger
On October 22, 2013, the General Partner entered into an agreement and plan of merger (the “Cole Merger Agreement”) with Cole Real Estate Investments, Inc. (“Cole”), a Maryland corporation, and a wholly owned subsidiary of the General Partner. The Cole Merger Agreement provided for the merger of Cole with and into a wholly owned subsidiary of the General Partner (the “Cole Merger”). The Operating Partnership consummated the Cole Merger on February 7, 2014 (the “Cole Acquisition Date”).
Pursuant to the terms of the Cole Merger Agreement, each share of common stock of Cole issued and outstanding immediately prior to the effectiveness of the Cole Merger, including unvested restricted stock units (“RSUs”) and performance stock units that vested in conjunction with the Cole Merger, other than shares owned by the General Partner, Cole or any of their respective subsidiaries, was converted into the right to receive either
F-13
Table of Contents
ARC PROPERTIES OPERATING PARTNERSHIP, L.P.
NOTES TO CONSOLIDATED FINANCIAL STATEMENTS — (Continued)
December 31, 2013
(i) 1.0929 shares of ARCP’s common stock (the “Stock Consideration”) or (ii) $13.82 in cash (the “Cash Consideration” and together with the Stock Consideration, the “Merger Consideration”). Approximately 98% of all outstanding Cole holders received Stock Consideration and approximately 2% of outstanding Cole shares elected to receive Cash Consideration, pursuant to the terms of the Cole Merger Agreement, resulting in ARCP issuing approximately 520.8 million shares of common stock and the Operating Partnership, on ARCP’s behalf, paying $181.8 million to holders of Cole shares based on their elections. In accordance with the LPA, the Operating Partnership issued a corresponding number of General Partner OP Units to ARCP when shares of ARCP’s common stock were issued to former common stockholders of Cole.
In addition, ARCP issued approximately 2.8 million shares of common stock, in the aggregate, to certain executives of Cole pursuant to letter agreements entered into between the General Partner and such individuals, concurrently with the execution of the Cole Merger Agreement, as previously disclosed by the General Partner. Additionally, effective as of the Cole Acquisition Date, ARCP issued, but has not yet allocated, 0.4 million shares with dividend equivalent rights commensurate with ARCP’s common stock. In accordance with the LPA, the Operating Partnership issued a corresponding number of General Partner OP Units to ARCP when shares of ARCP’s common stock were issued to former executives of Cole.
The Operating Partnership is in the process of gathering certain additional information in order to finalize its assessment of the fair value of the consideration transferred; thus, the fair values of currently recorded assets and liabilities are subject to change. The estimated fair value of the consideration transferred at the Cole Acquisition Date totaled approximately $7.5 billion and consisted of the following (in thousands):
| As of Cole Acquisition Date (Preliminary) |
||||
| Estimated Fair Value of Consideration Transferred: |
||||
| Cash |
$ | 181,775 | ||
| ARCP Common stock |
7,285,868 | |||
|
|
|
|||
| Total consideration transferred |
$ | 7,467,643 | ||
|
|
|
|||
The fair value of the 520.8 million shares of ARCP’s common stock issued, excluding those transferred to former Cole executives, was determined based on the closing market price of the ARCP’s common stock on the Cole Acquisition Date.
Accounting Treatment for the Cole Merger
The Cole Merger will be accounted for under the acquisition method of accounting under U.S. GAAP. Under the acquisition method of accounting, the assets acquired and liabilities assumed from Cole will be recorded as of the acquisition date at their respective fair values. Any excess of purchase price over the fair values will be recorded as goodwill. Results of operations for Cole will be included in the Operating Partnership’s consolidated financial statements subsequent to the Cole Acquisition Date. The initial accounting for the business combination has not been completed due to the significant judgments and time necessary to complete third-party valuation of real estate and other assets.
F-14
Table of Contents
ARC PROPERTIES OPERATING PARTNERSHIP, L.P.
NOTES TO CONSOLIDATED FINANCIAL STATEMENTS — (Continued)
December 31, 2013
Pending Significant Acquisition
Inland Portfolio Acquisition
On August 8, 2013, ARC and another related entity, on behalf of the General Partner and certain other entities sponsored directly or indirectly by ARC, entered into a purchase and sale agreement with Inland American Real Estate Trust, Inc. (“Inland”) for the purchase of the equity interests of 67 companies owned by Inland for an aggregate contract purchase price of approximately $2.3 billion, subject to adjustments set forth in the purchase and sale agreement and exclusive of closing costs. Of the 67 companies, the equity interests of 10 companies (the “Inland Portfolio”) will be acquired, in total, by the Operating Partnership, on behalf of ARCP, from Inland for a purchase price of approximately $501.0 million, subject to adjustments set forth in the purchase and sale agreement and exclusive of closing costs, which was allocated to the ARCP based on the pro rata fair value of the Inland Portfolio relative to the fair value of all 67 companies to be acquired from Inland by the Operating Partnership, on ARCP’s behalf, and the other entities sponsored directly or indirectly by ARC. The Inland Portfolio is comprised of 33 properties. As of December 31, 2013, ARCP had closed on five of the 33 properties for a total purchase price of $56.4 million, exclusive of closing costs. ARCP closed the acquisition of 27 additional properties in the Inland Portfolio subsequent to December 31, 2013. The General Partner will not close on the remaining property. During the year ended December 31, 2013, the Operating Partnership, on ARCP’s behalf, deposited $28.6 million into escrow in relation to the Inland Portfolio, which has been included in prepaid expenses and other assets in the consolidated balance sheets.
Purchase Agreement for Red Lobster Portfolio
On May 16, 2014, the Operating Partnership, through a wholly owned subsidiary, entered into a master purchase agreement to acquire 521 properties, substantially all of which are operating as Red Lobster® restaurants (the “Red Lobster Portfolio”) from a third party. The transaction is structured as a sale-leaseback in which the Operating Partnership will purchase the Red Lobster Portfolio and will immediately lease the portfolio back to the third party pursuant to the terms of multiple master leases (the “Master Leases”). The purchase price of the Red Lobster Portfolio is approximately $1.59 billion, exclusive of closing costs and related expenses. The Master Leases will provide annual rental income of $152.0 million. Approximately 95.0% of the Master Leases will be structured with a 25-year initial term and approximately 5.0% will have a weighted average 18.7-year initial term.
On July 28, 2014 the Operating Partnership closed on 492 of the properties constituting the Red Lobster Portfolio and on July 30, 2014 closed on the remaining 29 properties.
Note 3 — Summary of Significant Accounting Policies
Basis of Accounting
The accompanying consolidated financial statements are prepared on the accrual basis of accounting in accordance with U.S. GAAP.
Principles of Consolidation and Basis of Presentation
The consolidated financial statements include the accounts of the Operating Partnership, its subsidiaries and consolidated joint venture arrangements. The portions of the consolidated joint venture arrangement not owned by the Operating Partnership are presented as noncontrolling interests. In addition, as discussed in Note 2 — Mergers and Acquisitions, the historical information of ARCT III and ARCT IV has been presented as if the mergers had occurred as of the beginning of the earliest period presented.
All intercompany accounts and transactions have been eliminated in consolidation. In determining whether the Operating Partnership has a controlling financial interest in a joint venture and the requirement to consolidate the accounts of that entity, management considers factors such as ownership interest, authority to make decisions
F-15
Table of Contents
ARC PROPERTIES OPERATING PARTNERSHIP, L.P.
NOTES TO CONSOLIDATED FINANCIAL STATEMENTS — (Continued)
December 31, 2013
and contractual and substantive participating rights of the other partners or members as well as whether the entity is a variable interest entity of which the Operating Partnership is the primary beneficiary.
Use of Estimates
The preparation of financial statements in conformity with U.S. GAAP requires management to make estimates and assumptions that affect the reported amounts of assets and liabilities and disclosure of contingent assets and liabilities at the date of the financial statements and the reported amounts of revenues and expenses during the reporting period. Actual results could differ from those estimates. Management makes significant estimates regarding revenue recognition, investments in real estate, business combinations, and derivative financial instruments and hedging activities, as applicable.
Real Estate Investments
The Operating Partnership records acquired real estate at cost and makes assessments as to the useful lives of depreciable assets. The Operating Partnership considers the period of future benefit of the asset to determine the appropriate useful lives. Depreciation is computed using a straight-line method over the estimated useful life of 40 years for buildings, five to 15 years for building fixtures and improvements and the remaining lease term for acquired intangible lease assets.
Assets Held for Sale
The Operating Partnership classifies real estate investments as held for sale when the Operating Partnership has entered into a contract to sell the property, all material due diligence requirements have been satisfied, and the Operating Partnership believes it is probable that the disposition will occur, or the Operating Partnership is actively marketing the property and management has the intent to sell the property, among other conditions. Assets held for sale are recorded at the lower of carrying value or estimated fair value, less estimated cost to dispose of the asset. The results of operations and the related gain or loss on sale of properties that have been sold or that are classified as held for sale are included in discontinued operations in the consolidated statements of operations and comprehensive loss for all periods presented. At December 31, 2013 and 2012, the Operating Partnership had one and two properties, respectively, that were classified as properties held for sale. See Note 21 — Discontinued Operations and Properties Held for Sale.
If circumstances arise that the Operating Partnership previously considered unlikely and, as a result, the Operating Partnership decides not to sell a property previously classified as held for sale, the Operating Partnership will reclassify the property as held and used. The Operating Partnership measures and records a property that is reclassified as held and used at the lower of (i) its carrying amount before the property was classified as held for sale, adjusted for any depreciation expense that would have been recognized had the property been continuously classified as held and used or (ii) the estimated fair value at the date of the subsequent decision not to sell.
Development Activities
Project costs and expenses, which include interest expense, associated with the development, construction and lease-up of a real estate project are capitalized as construction in progress. Once the development and construction of the building is substantially completed, the amounts capitalized to construction in progress are transferred to (i) land and (ii) buildings and improvements. As required by U.S. GAAP, the Operating Partnership computes interest expense on the full amount it has invested in the project, whether or not such investment is externally financed.
F-16
Table of Contents
ARC PROPERTIES OPERATING PARTNERSHIP, L.P.
NOTES TO CONSOLIDATED FINANCIAL STATEMENTS — (Continued)
December 31, 2013
Impairment of Long Lived Assets
Periodically, or when circumstances indicate the carrying value of a property may not be recoverable, the Operating Partnership assesses real estate investments for impairment. This review is based on an estimate of the future undiscounted cash flows, excluding interest charges, expected to result from the property’s use and eventual disposition. These estimates consider factors such as expected future operating income, market and other applicable trends and residual value, as well as the effects of leasing demand, competition and other factors. If impairment exists due to the inability to recover the carrying value of a property, an impairment loss is recorded to the extent that the carrying value exceeds the estimated fair value of the property. The Operating Partnership has determined that the significant inputs used to estimate the fair value of the property full within Level 2 or Level 3 of fair value hierarchy. The Operating Partnership did not record any impairment charges on real estate investments from continuing operations during the years ended December 31, 2013, 2012 and 2011. The Operating Partnership did not record any impairment charges on real estate investments from discontinued operations during the year ended December 31, 2013. For the years ended December 31, 2012 and 2011, the Operating Partnership recorded $0.6 million and $0.8 million as impairment charges from discontinued operations.
The Operating Partnership reviews its direct financing leases at least annually to determine whether there has been an other-than-temporary decline in the current estimate of residual value of the property. The Operating Partnership has determined that the significant inputs used to value these investments fall within Level 3 for fair value accounting. The residual value is an estimate of what the Operating Partnership could realize upon the sale of the property at the end of the lease term, based on market information. If this review indicates that a decline in residual value has occurred that is other-than-temporary, the Operating Partnership recognizes an impairment charge equal to the difference between the fair value and carrying value, which is discounted at the internal rate of return of the direct financing lease. The Operating Partnership did not record any impairment charges on direct financing leases during the years ended December 31, 2013, 2012 and 2011.
Allocation of Purchase Price of Business Combinations including Acquired Properties
In accordance with the guidance for business combinations, the Operating Partnership determines whether a transaction or other event is a business combination. If the transaction is determined to be a business combination, the Operating Partnership determines if the transaction is considered to be between entities under common control. The acquisition of an entity under common control is accounted for on the carryover basis of accounting whereby the assets and liabilities of the companies are recorded upon the merger on the same basis as they were carried by the companies on the merger date. All other business combinations are accounted for by applying the acquisition method of accounting. Under the acquisition method, the Operating Partnership recognizes the identifiable assets acquired, the liabilities assumed and any noncontrolling interest in the acquired entity. In addition, the Operating Partnership evaluates the existence of goodwill or a gain from a bargain purchase. The Operating Partnership will immediately expense acquisition-related costs and fees associated with business combinations and asset acquisitions.
The Operating Partnership allocates the purchase price of acquired properties and businesses accounted for under the acquisition method of accounting to tangible and identifiable intangible assets acquired based on their respective fair values to tangible and identifiable intangible assets acquired based on their respective fair values. Tangible assets include land, buildings, equipment and tenant improvements on an as-if vacant basis. The Operating Partnership utilizes various estimates, processes and information to determine the as-if vacant property value. Estimates of value are made using customary methods, including data from appraisals, comparable sales, discounted cash flow analysis and other methods. Identifiable intangible assets include amounts allocated to acquire leases for above- and below-market lease rates, the value of in-place leases, and the value of customer relationships.
F-17
Table of Contents
ARC PROPERTIES OPERATING PARTNERSHIP, L.P.
NOTES TO CONSOLIDATED FINANCIAL STATEMENTS — (Continued)
December 31, 2013
Amounts allocated to land, buildings, equipment and fixtures are based on cost segregation studies performed by independent third parties or on the Operating Partnership’s analysis of comparable properties in its portfolio.
The aggregate value of intangible assets related to in-place leases is primarily the difference between the property valued with existing in-place leases adjusted to market rental rates and the property valued as if vacant. Factors considered by the Operating Partnership in its analysis of the in-place lease intangibles include an estimate of carrying costs during the expected lease-up period for each property, taking into account current market conditions and costs to execute similar leases. In estimating carrying costs, the Operating Partnership includes real estate taxes, insurance and other operating expenses and estimates of lost rentals at market rates during the expected lease-up period, which typically ranges from six to 18 months. The Operating Partnership also estimates costs to execute similar leases including leasing commissions, legal and other related expenses.
Above-market and below-market in-place lease values for owned properties are recorded based on the present value (using an interest rate which reflects the risks associated with the leases acquired) of the difference between the contractual amounts to be paid pursuant to the in-place leases and management’s estimate of fair market lease rates for the corresponding in-place leases, measured over a period equal to the remaining non-cancelable term of the lease. The capitalized above-market lease intangibles are amortized as a decrease to rental income over the remaining term of the lease. The capitalized below-market lease values will be amortized as an increase to rental income over the remaining term of the lease and any fixed rate renewal periods provided within the respective leases. In determining the amortization period for below-market lease intangibles, the Operating Partnership initially will consider, and periodically evaluate on a quarterly basis, the likelihood that a lessee will execute the renewal option. The likelihood that a lessee will execute the renewal option is determined by taking into consideration the tenant’s payment history, the financial condition of the tenant, business conditions in the industry in which the tenant operates and economic conditions in the area in which the property is located.
The fair value of investments and debt are valued using techniques consistent with those disclosed in Note 9 — Fair Value of Financial Instruments, depending on the nature of the investment or debt. The fair value of all other assumed assets and liabilities based on the best information available.
The aggregate value of intangibles assets related to customer relationships is measured based on the Operating Partnership’s evaluation of the specific characteristics of each tenant’s lease and the Operating Partnership’s overall relationship with the tenant. Characteristics considered by the Operating Partnership in determining these values include the nature and extent of the Operating Partnership’s existing business relationships with the tenant, growth prospects for developing new business with the tenant, the tenant’s credit quality and expectations of lease renewals, among other factors.
The value of in-place leases is amortized to expense over the initial term of the respective leases, which range primarily from two to 20 years. The value of customer relationship intangibles is amortized to expense over the initial term and any renewal periods in the respective leases, but in no event does the amortization period for intangible assets exceed the remaining depreciable life of the building. If a tenant terminates its lease, the unamortized portion of the in-place lease value and customer relationship intangibles is charged to expense.
In making estimates of fair values for purposes of allocating purchase price, the Operating Partnership utilizes a number of sources, including independent appraisals that may be obtained in connection with the acquisition or financing of the respective property and other market data. The Operating Partnership also considers information obtained about each property as a result of its pre-acquisition due diligence, as well as subsequent marketing and leasing activities, in estimating the fair value of the tangible and intangible assets acquired and intangible liabilities assumed.
F-18
Table of Contents
ARC PROPERTIES OPERATING PARTNERSHIP, L.P.
NOTES TO CONSOLIDATED FINANCIAL STATEMENTS — (Continued)
December 31, 2013
Intangible lease assets and liabilities of the Operating Partnership consist of the following as of December 31, 2013 and 2012 (amounts in thousands):
| December 31, | ||||||||
| 2013 | 2012 | |||||||
| Intangible Lease Assets: |
||||||||
| In-place leases, gross |
$ | 742,253 | $ | 219,650 | ||||
| Accumulated amortization on in-place leases |
(60,754 | ) | (11,247 | ) | ||||
|
|
|
|
|
|||||
| In-place leases, net of accumulated amortization |
681,499 | 208,403 | ||||||
|
|
|
|
|
|||||
| Above market leases, gross |
16,123 | 1,503 | ||||||
| Accumulated amortization on above market leases |
(657 | ) | (118 | ) | ||||
|
|
|
|
|
|||||
| Above market leases, net of accumulated amortization |
15,466 | 1,385 | ||||||
|
|
|
|
|
|||||
| Total intangible lease assets, net |
$ | 696,965 | $ | 209,788 | ||||
|
|
|
|
|
|||||
| Intangible Lease Liabilities: |
||||||||
| Below market leases, gross |
$ | (78,504 | ) | $ | — | |||
| Accumulated amortization on below market leases |
715 | — | ||||||
|
|
|
|
|
|||||
| Below market leases, net of accumulated amortization |
(77,789 | ) | — | |||||
|
|
|
|
|
|||||
| Total intangible lease liabilities, net |
$ | (77,789 | ) | $ | — | |||
|
|
|
|
|
|||||
The following table provides the remaining weighted-average amortization period as of December 31, 2013 for intangible assets and liabilities and the projected amortization expense and adjustments to rental income for the next five years (amounts in thousands):
| Remaining Weighted-Average Amortization Period in Years |
2014 | 2015 | 2016 | 2017 | 2018 | |||||||||||||||||||
| In-place leases: |
||||||||||||||||||||||||
| Total to be included in amortization expense |
10.17 | $ | 104,066 | $ | 94,656 | $ | 86,460 | $ | 78,172 | $ | 70,558 | |||||||||||||
| Above market lease assets: |
||||||||||||||||||||||||
| Total to be deducted from rental income |
11.88 | $ | 1,525 | $ | 1,525 | $ | 1,416 | $ | 1,388 | $ | 1,359 | |||||||||||||
| Below market lease liabilities: |
||||||||||||||||||||||||
| Total to be included in rental income |
22.68 | $ | (4,173 | ) | $ | (4,169 | ) | $ | (4,151 | ) | $ | (4,151 | ) | $ | (4,144 | ) | ||||||||
Goodwill
For business combinations accounted for under the acquisition method, after identifying all tangible assets and intangible assets and liabilities, the excess consideration paid for the fair value of the assets acquired and liabilities assumed represents goodwill. The Operating Partnership allocates goodwill to the respective reporting units in which such goodwill arose. Goodwill acquired in the CapLease Merger comprises one reporting unit.
F-19
Table of Contents
ARC PROPERTIES OPERATING PARTNERSHIP, L.P.
NOTES TO CONSOLIDATED FINANCIAL STATEMENTS — (Continued)
December 31, 2013
Cash and Cash Equivalents
Cash and cash equivalents include cash in bank accounts, as well as investments in highly-liquid money market funds with original maturities of three months or less.
The Operating Partnership deposits cash with high quality financial institutions. These deposits are guaranteed by the Federal Deposit Insurance Company (“FDIC”) up to an insurance limit. At December 31, 2013 and 2012, the Operating Partnership had deposits of $52.7 million and $292.6 million, respectively, of which $44.3 million and $288.9 million were in excess of the amount insured by the FDIC. Although the Operating Partnership bears risk to amounts in excess of those insured by the FDIC, it does not anticipate any losses as a result due to the high quality of the institutions.
Restricted Cash
Restricted cash primarily consists of reserves related to lease expirations, as well as maintenance, structural and debt service reserves.
Investment in Direct Financing Leases
The Operating Partnership has acquired certain properties that are subject to leases that qualify as direct financing leases in accordance with U.S. GAAP due to the significance of the lease payments from the inception of the leases compared to the fair value of the property. Investments in direct financing leases represent the fair value of the remaining lease payments on the leases and the estimated fair value of any expected residual property value at the end of the lease term. The fair value of the remaining lease payments is estimated using a discounted cash flow based on interest rates that would represent the Operating Partnership’s incremental borrowing rate for similar types of debt. The expected residual property value at the end of the lease term is estimated using market data and assessments of the remaining useful lives of the properties at the end of the lease terms, among other factors. Income from direct financing leases is calculated using the effective interest method over the remaining term of the lease.
As part of the update to the provisional allocation of the purchase price for the GE Capital Portfolio during the measurement period, the Operating Partnership reclassified approximately $13.4 million from investment in direct financing leases receivables to investments in real estate, at cost.
Loans Held for Investments
The Operating Partnership classifies its loans as long-term investments, as the Operating Partnership intends to hold the loans for the foreseeable future or until maturity. Loan investments are carried on the Operating Partnership’s consolidated balance sheets at amortized cost (unpaid principal balance adjusted for unearned discount or premium and loan origination fees), net of any allowance for loan losses. Unearned discounts or premiums and loan origination fees are amortized as a component of interest income using the effective interest method over the life of the loan.
From time to time, the Operating Partnership may determine to sell a loan in which case it must reclassify the asset as held for sale. Loans held for sale are carried at lower of cost or estimated fair value. From the period the Operating Partnership acquired the loan investments through December 31, 2013, the Operating Partnership has not sold or reclassified any loans as held for sale.
F-20
Table of Contents
ARC PROPERTIES OPERATING PARTNERSHIP, L.P.
NOTES TO CONSOLIDATED FINANCIAL STATEMENTS — (Continued)
December 31, 2013
The Operating Partnership evaluates its loan investments for possible impairment on a quarterly basis. Refer to Note 6 — Investment Securities, at Fair Value.
Commercial Mortgage-Backed Securities
The Operating Partnership classifies all of its commercial mortgage-backed securities (“CMBS”) as available for sale for financial accounting purposes. Under U.S. GAAP, securities classified as available for sale are carried on the consolidated balance sheet at fair value with the net unrealized gains or losses included in Accumulated Other Comprehensive Income (Loss), a component of Partners’ Capital.
Any premiums or discounts on securities are amortized as a component of interest income using the effective interest method.
The Operating Partnership estimates fair value on all securities investments quarterly based on a variety of inputs. Under applicable accounting guidance, securities where the fair value is less than the Operating Partnership’s cost are deemed impaired, and, therefore, must be measured for other-than-temporary impairment. If an impaired security (i.e., fair value below cost) is intended to be sold or required to be sold prior to expected recovery of the impairment loss, the full amount of the loss must be charged to earnings as other-than-temporary impairment. Otherwise, temporary impairment losses are charged to other comprehensive income (loss).
In estimating credit or other-than-temporary impairment losses, management considers a variety of factors including (1) the financial condition and near-term prospects of the credit, including credit rating of the security and the underlying tenant and an estimate of the likelihood, amount and expected timing of any default, (2) whether the Operating Partnership expects to hold the investment for a period of time sufficient to allow for anticipated recovery in fair value, (3) the length of time and the extent to which the fair value has been below cost, (4) current market conditions, (5) expected cash flows from the underlying collateral and an estimate of underlying collateral values and (6) subordination levels within the securitization pool. These estimates are highly subjective and could differ materially from actual results. From the period the Operating Partnership acquired the CMBS through December 31, 2013, the Operating Partnership had no other-than-temporary impairment losses.
Deferred Costs, Net
Deferred costs, net consists of deferred financing costs net of accumulated amortization and deferred leasing costs net of accumulated amortization.
Deferred financing costs represent commitment fees, legal fees and other costs associated with obtaining commitments for financing. These costs are amortized to interest expense over the terms of the respective financing agreements using the effective interest method. Unamortized deferred financing costs are expensed when the associated debt is refinanced or repaid before maturity. Costs incurred in seeking financial transactions that do not close are expensed in the period in which it is determined the financing will not close. At December 31, 2013 and 2012, the Operating Partnership had $81.1 million and $15.1 million, respectively, of deferred financing costs net of accumulated amortization.
Deferred leasing costs, consisting primarily of lease commissions and payments made to assume existing leases, are deferred and amortized over the term of the lease. At December 31, 2013 and 2012, the Operating Partnership had $0.2 million and $0.2 million, respectively, of deferred leasing costs, net of accumulated amortization.
F-21
Table of Contents
ARC PROPERTIES OPERATING PARTNERSHIP, L.P.
NOTES TO CONSOLIDATED FINANCIAL STATEMENTS — (Continued)
December 31, 2013
Convertible Obligation to Series C Convertible Preferred Stockholders
On June 7, 2013, the General Partner issued 28.4 million shares of Series C Convertible Preferred Stock (“Series C Preferred Stock”) for gross proceeds of $445.0 million. Concurrently, the Operating Partnership issued to the General Partner 28.4 million OP Units designated as Series C Convertible Preferred Units underlying the Series C Preferred Stock. Due to an unconditional obligation to either redeem or convert the Series C Preferred Stock into a variable number of shares of common stock that was predominantly based on a fixed monetary amount, the preferred securities were classified as an obligation under U.S. GAAP and were presented in the consolidated balance sheet as a liability prior to their settlement in November 2013. Promptly following the CapLease Merger Date, ARCP converted the Series C Preferred Stock in accordance with the terms of the original agreement and the Series C Preferred Stock were converted into 1.4 million shares of common stock, with the remaining balance of Series C Preferred Stock settled in cash consideration of $441.4 million. Concurrently, the Operating Partnership issued to the General Partner 1.4 million General Partner OP Units in respect of such common stock.
Contingent Valuation Rights
On June 7, 2013, the General Partner issued 29.4 million common stock contingent value rights (“Common Stock CVRs”) and 28.4 million preferred stock contingent value rights (“Preferred Stock CVRs”). Concurrently, the Operating Partnership issued the General Partner contingent value rights with identical terms. In September 2013, a portion of the Common Stock CVR holders received $20.4 million representing the maximum payment of $1.50 per share as defined in the agreement. The remaining Common Stock CVR holders received settlement of the amount owed to them of $23.7 million promptly following the CapLease Merger, which consummated on November 5, 2013, representing the maximum payment of $1.50 per share. Concurrently with the settlement of the Common Stock CVRs, the General Partner settled its contingent value rights with the Operating Partnership for the identical considerations.
ARCP settled the Preferred Stock CVRs promptly following the CapLease Merger Date. ARCP settled the Preferred Stock CVRs for $0.90 per Preferred Stock CVR for total cash consideration of $25.6 million. Concurrently with the settlement of the Preferred Stock CVRs, the Operating Partnership settled its contingent value rights with the General Partner for identical considerations.
Changes in the fair value of the contingent valuation rights obligation subsequent to issuance date were recorded in the consolidated statements of operations and comprehensive loss within gain/loss on derivatives, net in the period incurred. For the year ended December 31, 2013, the Operating Partnership recorded a loss on the CVRs of $69.7 million, representing the settled value.
Convertible Debt
On July 29, 2013, ARCP issued $300.0 million of Convertible Senior Notes due 2018 (the “2018 Notes”) and issued an additional $10.0 million of its 2018 Notes on August 1, 2013 to various purchasers. On December 10, 2013, ARCP issued an additional $287.5 million of the 2018 Notes through a reopening of the “2018 Notes” indenture agreement. Also on December 10, 2013, ARCP issued $402.5 million of Convertible Senior Notes due 2020 (the 2020 Notes, collectively with the 2018 Notes, the “Convertible Notes”). Concurrently, the Operating Partnership issued the General Partner convertible senior notes with identical terms (the “General Partner Convertible Notes”). The 2018 Notes mature August 1, 2018 and the 2020 Notes mature on December 15, 2020. The Convertible Notes are convertible to cash or common stock of ARCP, and the General Partner Convertible Notes are convertible upon identical terms. In accordance with U.S GAAP, the notes are
F-22
Table of Contents
ARC PROPERTIES OPERATING PARTNERSHIP, L.P.
NOTES TO CONSOLIDATED FINANCIAL STATEMENTS — (Continued)
December 31, 2013
accounted for as a liability with a separate equity component recorded for the conversion option. A liability was recorded for the General Partner Convertible Notes on the issuance date at fair value based on a discounted cash flow analysis using current market rates for debt instruments with similar terms. The difference between the initial proceeds from the General Partner Convertible Notes and the estimated fair value of the debt instruments resulted in a debt discount, with an offset recorded to General Partner’s capital representing the equity component. The debt discount is being amortized to interest expense over the expected lives of the General Partner Convertible Notes.
Derivative Instruments
The Operating Partnership may use derivative financial instruments to hedge all or a portion of the interest rate risk associated with its borrowings. Certain of the techniques used to hedge exposure to interest rate fluctuations may also be used to protect against declines in the market value of assets that result from general trends in debt markets. The principal objective of such agreements is to minimize the risks and/or costs associated with the Operating Partnership’s operating and financial structure as well as to hedge specific anticipated transactions.
The Operating Partnership records all derivatives on the consolidated balance sheets at fair value. The accounting for changes in the fair value of derivatives depends on the intended use of the derivative, whether the Operating Partnership has elected to designate a derivative in a hedging relationship and apply hedge accounting and whether the hedging relationship has satisfied the criteria necessary to apply hedge accounting. Derivatives designated and qualifying as a hedge of the exposure to changes in the fair value of an asset, liability, or firm commitment attributable to a particular risk, such as interest rate risk, are considered fair value hedges. Derivatives designated and qualifying as a hedge of the exposure to variability in expected future cash flows, or other types of forecasted transactions, are considered cash flow hedges. Derivatives may also be designated as hedges of the foreign currency exposure of a net investment in a foreign operation. Hedge accounting generally provides for the matching of the timing of gain or loss recognition on the hedging instrument with the recognition of the changes in the fair value of the hedged asset or liability that are attributable to the hedged risk in a fair value hedge or the earnings effect of the hedged forecasted transactions in a cash flow hedge. The Operating Partnership may enter into derivative contracts that are intended to economically hedge certain of its risk, even though hedge accounting does not apply or the Operating Partnership elects not to apply hedge accounting.
The accounting for subsequent changes in the fair value of these derivatives depends on whether each has been designed and qualifies for hedge accounting treatment. If the Operating Partnership elects not to apply hedge accounting treatment, any changes in the fair value of these derivative instruments is recognized immediately in gains (losses) on derivative instruments in the consolidated statements of operations and comprehensive loss. If the derivative is designated and qualifies for hedge accounting treatment the change in the estimated fair value of the derivative is recorded in other comprehensive income (loss) to the extent that it is effective. Any ineffective portion of a derivative’s change in fair value will be immediately recognized in earnings.
Share Repurchase Programs
ARCT III’s and ARCT IV’s boards of directors had adopted Share Repurchase Programs (the “ARCT III SRP” and the “ARCT IV SRP”, respectively, and collectively the “SRPs”) that enabled stockholders to sell their shares to ARCT III and ARCT IV, respectively, in limited circumstances. The SRPs permitted investors to sell their shares back to ARCT III or ARCT IV, as applicable, after they had held them for at least one year, in most circumstances, subject to the significant conditions and limitations described below.
F-23
Table of Contents
ARC PROPERTIES OPERATING PARTNERSHIP, L.P.
NOTES TO CONSOLIDATED FINANCIAL STATEMENTS — (Continued)
December 31, 2013
The purchase price per share of the ARCT III SRP depended on the length of time investors had held such shares as follows: after one year from the purchase date — the lower of $9.25 and 92.5% of the amount they actually paid for each share; after two years from the purchase date — the lower of $9.50 and 95.0% of the amount they actually paid for each share; after three years from the purchase date — the lower of $9.75 and 97.5% of the amount they actually paid for each share; and after four years from the purchase date — the lower of $10.00 and 100% of the amount they actually paid for each share.
The purchase price per share of the ARCT IV SRP depended on the length of time investors had held such shares as follows: after one year from the purchase date — the lower of $23.13 and 92.5% of the amount they actually paid for each share; after two years from the purchase date — the lower of $23.75 and 95.0% of the amount they actually paid for each share; after three years from the purchase date — the lower of $24.38 and 97.5% of the amount they actually paid for each share; and after four years from the purchase date — the lower of $25.00 and 100.0% of the amount they actually paid for each share.
Both ARCT III and ARCT IV were only authorized to repurchase shares pursuant to the SRPs up to the value of shares issued under their respective DRIPs (as defined below) and limited the amount spent to repurchase shares in a given quarter to the value of the shares issued under their DRIPs in that same quarter.
When a stockholder requested repurchases and the repurchases were approved by ARCT III’s or ARCT IV’s board of directors, as applicable, such action reclassified such obligation from equity to a liability based on the settlement value of the obligation. The following table reflects the number of shares repurchased for the years ended December 31, 2013, 2012 and 2011.
| Number of Requests |
Number of Shares |
Average Price per Share |
||||||||||
| 2011 |
1 | 2,375 | $ | 10.00 | ||||||||
| 2012 |
75 | 180,744 | 10.07 | |||||||||
| 2013 |
11 | 4,956 | 24.98 | |||||||||
|
|
|
|
|
|
|
|||||||
| Cumulative repurchase requests as of December 31, 2013 |
87 | 188,075 | $ | 10.46 | ||||||||
|
|
|
|
|
|
|
|||||||
In accordance with the LPA, the Operating Partnership repurchased a corresponding number of General Partner OP Units from the General Partner when shares were repurchased from stockholders on the same terms as the shares were repurchased pursuant to the SRPs.
Upon the ARCT III Merger, the ARCT III SRP was terminated. Upon the ARCT IV Merger, the ARCT IV SRP was terminated.
Upon the closing of the ARCT III Merger on February 28, 2013, pursuant to the terms of the ARCT III Merger Agreement, 29.2 million shares, or 16.5% of the then outstanding shares of ARCT III’s common stock, were paid in cash at $12.00 per share, which is equivalent to 27.7 million shares of ARCP’s common stock based on the ARCT III Exchange Ratio. Concurrently, the Operating Partnership repurchased an equivalent number of General Partner OP Units at the same rate. See Note 2 — Mergers and Acquisitions.
On August 20, 2013, the General Partner’s board of directors reauthorized its $250 million share repurchase program which was originally authorized in February 2013. During the year ended December 31, 2013, the General Partner repurchased approximately 0.6 million shares of common stock at an average price of $13.06 per share or $7.5 million in total. Concurrently, the Operating Partnership repurchased an equivalent number of General Partner OP Units at the same rate.
F-24
Table of Contents
ARC PROPERTIES OPERATING PARTNERSHIP, L.P.
NOTES TO CONSOLIDATED FINANCIAL STATEMENTS — (Continued)
December 31, 2013
Distribution Reinvestment Plans
Pursuant to the ARCT III distribution reinvestment plan (“ARCT III DRIP”), stockholders could have elected to receive shares of ARCT III common stock in lieu of receiving cash distributions. No dealer manager fees or selling commissions were paid with respect to shares issued pursuant to the ARCT III DRIP. Shares issued pursuant to the ARCT III DRIP had the same rights and were treated in the same manner as if such shares were issued pursuant to ARCT III’s initial public offering (the “ARCT III IPO”). Shares issued pursuant to the ARCT III DRIP were recorded within partners’ equity in the accompanying consolidated balance sheets in the period distributions were declared. During the years ended December 31, 2013, 2012 and 2011, ARCT III issued 0.5 million, 2.7 million and 27,169 shares of common stock, respectively, with a value of $4.9 million, $26.8 million and $0.3 million, respectively, in each case with a par value per share of $0.01, pursuant to the DRIP. Concurrently, the Operating Partnership issued the General Partner an equivalent number of General Partner OP Units. Upon the closing of the ARCT III Merger, the DRIP was terminated.
Pursuant to the ARCT IV distribution reinvestment plan (“ARCT IV DRIP”), stockholders could have elected to receive shares of ARCT IV common stock in lieu of receiving cash distributions. No dealer manager fees or selling commissions were paid with respect to shares purchased pursuant to the ARCT IV DRIP. Participants purchasing shares pursuant to the ARCT IV DRIP had the same rights and were treated in the same manner as if such shares were issued pursuant to ARCT IV’s initial public offering (the “ARCT IV IPO”). Shares issued pursuant to the ARCT IV DRIP were recorded within partners’ equity in the accompanying consolidated balance sheet in the period distributions are declared. During the years ended December 31, 2013 and 2012, ARCT IV issued 0.5 million and 7,690 shares of common stock with a value of $20.7 million and $0.4 million, respectively, and a par value per share of $0.01 pursuant to the ARCT IV DRIP. Concurrently, the Operating Partnership issued the General Partner an equivalent number of General Partner OP Units.
Revenue Recognition
Upon the acquisition of real estate, certain properties will have leases where minimum rent payments increase during the term of the lease. The Operating Partnership will record rental revenue for the full term of each lease on a straight-line basis. When the Operating Partnership acquires a property, the term of existing leases is considered to commence as of the acquisition date for the purposes of this calculation. Cost recoveries from tenants are included in tenant reimbursement income in the period the related costs are incurred, as applicable.
The Operating Partnership’s revenues, which are derived primarily from rental income, include rents that each tenant pays in accordance with the terms of each lease reported on a straight-line basis over the initial term of the lease. Since many of the leases provide for rental increases at specified intervals, straight-line basis accounting requires the Operating Partnership to record a receivable, and include in revenues, unbilled rent receivables that the Operating Partnership will only receive if the tenant makes all rent payments required through the expiration of the initial term of the lease. Straight-line rent receivables are included in prepaid expenses and other assets on the consolidated balance sheets. See Note 7 — Prepaid Expenses and Other Assets. The Operating Partnership defers the revenue related to lease payments received from tenants in advance of their due dates. As of December 31, 2013 and 2012, the Operating Partnership had $20.3 million and $4.3 million, respectively, of deferred rental income, which is included in deferred rent and other liabilities on the consolidated balance sheets.
The Operating Partnership continually reviews receivables related to rent and unbilled rent receivables and determines collectability by taking into consideration the tenant’s payment history, the financial condition of the
F-25
Table of Contents
ARC PROPERTIES OPERATING PARTNERSHIP, L.P.
NOTES TO CONSOLIDATED FINANCIAL STATEMENTS — (Continued)
December 31, 2013
tenant, business conditions in the industry in which the tenant operates and economic conditions in the area in which the property is located. In the event that the collectability of a receivable is in doubt, the Operating Partnership will record an increase in the allowance for uncollectible accounts or record a direct write-off of the receivable in the consolidated statements of operations and comprehensive loss. As of December 31, 2013 and 2012, the Operating Partnership determined that no allowance for uncollectible accounts was necessary.
Contingent Rental Income
The Operating Partnership owns certain properties that have associated leases that require the tenant to pay contingent rental income based on a percentage of the tenant’s sales after the achievement of certain sales thresholds, which may be monthly, quarterly or annual targets. As a lessor, the Operating Partnership defers the recognition of contingent rental income until the specified target that triggered the contingent rental income is achieved, or until such sales upon which percentage rent is based are known.
Offering and Related Costs
Offering and related costs include costs incurred in connection with the General Partner’s issuance of common stock. These costs include, but are not limited to, (i) legal, accounting, printing, mailing and filing fees; (ii) escrow related fees, and (iii) reimbursement to the dealer manager for amounts they paid to reimburse the bonified due diligence expenses of broker-dealers.
Acquisition Related Expenses and Merger and Other Transaction Related Expenses
Acquisition related expenses include legal and other transaction related costs incurred in connection with self-originated acquisitions including purchases of portfolios. Merger and other transaction related expenses include the following costs (amounts in thousands):
| Year Ended December 31, | ||||||||
| 2013 | 2012 | |||||||
| Incentive fee paid to a subsidiary of the Former Sponsor in connection with the ARCT III Merger |
$ | 98,360 | $ | — | ||||
| Legal and other transaction related costs incurred in connection with mergers |
109,428 | 2,603 | ||||||
| Accelerated vesting of operating partnership units due to internalization |
59,400 | — | ||||||
| Acceleration of restricted share amortization resulting from the consummation of the Cole Merger |
2,657 | — | ||||||
| Other internalization costs |
8,474 | — | ||||||
|
|
|
|
|
|||||
| Total |
$ | 278,319 | $ | 2,603 | ||||
|
|
|
|
|
|||||
Equity Based Compensation
The General Partner has an equity based incentive award plan for its affiliated Manager, non-executive directors, officers, other employees and independent contractors who are providing services to the General Partner, as applicable, and a non-executive director restricted share plan, which are accounted for under the guidance for share-based payments. The expense for such awards is recognized over the vesting period or when
F-26
Table of Contents
ARC PROPERTIES OPERATING PARTNERSHIP, L.P.
NOTES TO CONSOLIDATED FINANCIAL STATEMENTS — (Continued)
December 31, 2013
the requirements for exercise of the award have been met. See Note 17 — Equity Based Compensation for additional information on these plans.
Per Unit Data
Income (loss) per basic common partnership unit is calculated by dividing net income (loss) less dividends on unvested restricted stock and dividends on preferred shares by the weighted-average number of common partnership units issued and outstanding during such period. Diluted income (loss) per common partnership unit considers the effect of potentially dilutive common partnership units during the period. As the Operating Partnership has the ability and intent to settle all outstanding convertible debt in cash, the Operating Partnership has excluded the if-converted shares from its calculation of diluted shares.
Income Taxes
The Operating Partnership is classified as a partnership for federal income tax purposes. As a partnership, the Operating Partnership is not a taxable entity for federal income tax purposes. Instead, each partner in the Operating Partnership is required to take into account its allocable share of the Operating Partnership’s income, gains, losses, deductions, and credits for each taxable year. However, the Operating Partnership may be subject to certain state and local taxes on its income and property.
The General Partner and ARCT III qualified as REITs under Sections 856 through 860 of the Internal Revenue Code (the “Code”) commencing with the taxable year ended December 31, 2011. ARCT IV qualified as a REIT under Sections 856 through 860 of the Internal Revenue Code (the “Code”) commencing with the taxable year ended December 31, 2012. As REITs, each of the General Partner, ARCT III and ARCT IV generally will not be subject to federal corporate income tax to the extent it distributes its REIT taxable income to its stockholders, and so long as it distributes at least 90% of its REIT taxable income, computed without regard to the dividends paid deduction and excluding net capital gain. REITs are subject to a number of other organizational and operational requirements. Each of the General Partner, ARCT IV and ARCT III may still be subject to certain state and local taxes on its income and property, and federal income and excise taxes on its undistributed income.
As of December 31, 2013, the Operating Partnership, General Partner, ARCT III and ARCT IV had no material uncertain income tax positions. The tax years subsequent to and including the fiscal year ended December 31, 2010 remain open to examination by the major taxing jurisdictions to which the Operating Partnership, General Partner, ARCT III and ARCT IV are subject.
Under the partnership agreement, the Operating Partnership is to conduct business in such a manner as to permit the General Partner at all times to qualify as a REIT.
Reportable Segments
The Operating Partnership has determined that it has one reportable segment with activities related to investing in real estate and real estate-related assets. The Operating Partnership’s investments in real estate generate rental revenue and other income through the leasing of properties, which comprised 100% of its total consolidated revenues. Although the Operating Partnership’s investments in real estate will be geographically diversified throughout the United States, management evaluates operating performance on an individual property level. The Operating Partnership’s properties have been aggregated into one reportable segment.
F-27
Table of Contents
ARC PROPERTIES OPERATING PARTNERSHIP, L.P.
NOTES TO CONSOLIDATED FINANCIAL STATEMENTS — (Continued)
December 31, 2013
Reclassification
Certain reclassifications have been made to the historical financial statements of the Operating Partnership to conform to this presentation.
As discussed in Note 2 — Mergers and Acquisitions, the Company has retrospectively presented its financial statements as if the Operating Partnership and ARCT IV were combined from the beginning of each period presented. As such, the Operating Partnership’s December 31, 2013 and 2012 balance sheets reflect an increase in total assets of $2.2 billion and $0.2 billion, respectively, an increase in total liabilities of $1.5 billion and $0.1 billion, respectively, and an increase in total stockholders’ equity of $0.7 billion and $0.1 billion, respectively, as compared to the Operating Partnership’s balance sheets before recasting the balance sheets to include ARCT IV. In addition, the Operating Partnership’s statements of operations for the years ended December 31, 2013 and 2012 reflect an increase in total revenues of $89.3 million and $0.4 million, respectively, an increase in total operating expenses of $139.6 million and $3.0 million, respectively, and an increase in net loss of $71.2 million and $2.5 million, respectively, as compared to the Operating Partnership’s statements of operations before recasting the statements of operations to include ARCT IV. There was no impact to any of our financial statements prior to January 1, 2012.
In addition, as discussed in Note 2 — Mergers and Acquisitions, the Operating Partnership has retrospectively presented its financial statements as if the Operating Partnership and ARCT III were combined from the beginning of each period presented. As such, the Operating Partnership’s December 31, 2012 balance sheets reflect an increase in total assets of $1.7 billion, an increase in total liabilities of $0.3 billion and an increase in total stockholders’ equity of $1.4 billion, as compared to the Operating Partnership’s balance sheets before recasting the balance sheets to include ARCT III. In addition, the Operating Partnership’s statements of operations for the year ended December 31, 2012 and 2011 reflect an increase in total revenues of $50.0 million and $0.8 million, respectively, an increase in total operating expenses of $75.6 million and $2.9 million, respectively, and an increase in net loss of $32.1 million and $2.1 million, respectively, as compared to the Operating Partnership’s statements of operations before recasting the statements of operations to include ARCT III.
Recent Accounting Pronouncements
In December 2011, the Financial Accounting Standards Board (“FASB”) issued guidance regarding disclosures about offsetting assets and liabilities, which requires entities to disclose information about offsetting and related arrangements to enable users of its financial statements to understand the effect of those arrangements on its financial position. The guidance was effective for fiscal years and interim periods beginning on or after January 1, 2013 with retrospective application for all comparative periods presented. The adoption of this guidance, which is related to disclosure only, did not have a material impact on the Operating Partnership’s consolidated financial position, results of operations or cash flows. Refer to Note 6 — Derivatives and Hedging Activities for the Operating Partnership’s disclosure of information about offsetting and related arrangements.
In July 2012, the FASB issued revised guidance intended to simplify how an entity tests indefinite-lived intangible assets for impairment. The amendments allow an entity to initially assess qualitative factors to determine whether it is necessary to perform a quantitative impairment test. An entity is no longer required to calculate the fair value of an indefinite-lived intangible asset and perform the quantitative test unless the entity determines, based on a qualitative assessment, that it is more likely than not that its fair value is less than its carrying amount. The amendments were effective for annual and interim indefinite-lived intangible asset impairment tests performed for fiscal years beginning after September 15, 2012. The adoption of this guidance did not have a material impact on the Operating Partnership’s consolidated financial position, results of operations or cash flows.
F-28
Table of Contents
ARC PROPERTIES OPERATING PARTNERSHIP, L.P.
NOTES TO CONSOLIDATED FINANCIAL STATEMENTS — (Continued)
December 31, 2013
In February 2013, the FASB issued guidance which requires an entity to provide information about the amounts reclassified out of accumulated other comprehensive income by component. The guidance was effective for annual and interim periods beginning after December 15, 2012. The adoption of this guidance, which is related to disclosure only, did not have a material impact on the Operating Partnership’s consolidated financial position, results of operations or cash flows. Refer to Note 14 — Derivatives and Hedging Activities for the Operating Partnership’s disclosure of the information about the amounts reclassified out of accumulated other comprehensive income by component.
In February 2013, the FASB issued new accounting guidance clarifying the accounting and disclosure requirements for obligations resulting from joint and several liability arrangements for which the total amount under the arrangement is fixed at the reporting date. The new guidance is effective for fiscal years, and interim periods within those fiscal years, beginning on or after December 15, 2013. The Operating Partnership does not expect the adoption of this guidance to have a material impact on the Operating Partnership’s consolidated financial position, results of operations or cash flows.
In April 2014, the FASB issued Accounting Standards Update, 2014-08 Presentation of Financial Statements (Topic 205) and Property, Plant, and Equipment (Topic 360): Reporting Discontinued Operations and Disclosures of Disposals of Components of an Entity (“ASU 2014-08”), which amends the reporting requirements for discontinued operations by updating the definition of a discontinued operation to be a component of an entity that represents a strategic shift that has (or will have) a major effect on an entity’s operations and financial results, resulting in fewer disposals that qualify for discontinued operations reporting yet the pronouncement also requires expanded disclosures for discontinued operations. The Operating Partnership adopted ASU 2014-08 effective January 1, 2014. Starting with the first quarter of 2014, the results of operations for all qualifying disposals and properties classified as held for sale that were not previously reported in discontinued operations will be presented within income from continuing operations on the accompanying consolidated statements of income.
In May 2014, FASB issued ASU No. 2014-09, “Revenue from Contracts with Customers,” which supersedes the revenue recognition requirements in “Revenue Recognition (Topic 605),” and requires an entity to recognize revenue in a way that depicts the transfer of promised goods or services to customers in an amount that reflects the consideration to which the entity expects to be entitled to in exchange for those goods or services. ASU 2014-09 is effective for fiscal years, and interim periods within those years, beginning after December 15, 2016, and is to be applied retrospectively, with early application not permitted. The Operating Partnership is currently evaluating the impact of the new standard on its financial statements.
F-29
Table of Contents
ARC PROPERTIES OPERATING PARTNERSHIP, L.P.
NOTES TO CONSOLIDATED FINANCIAL STATEMENTS — (Continued)
December 31, 2013
Note 4 — Real Estate Investments
Excluding the CapLease Merger, the following table presents the allocation of the assets acquired and liabilities assumed during the periods presented (dollar amounts in thousands):
| Year Ended December 31, | ||||||||
| 2013 (1) | 2012 | |||||||
| Real estate investments, at cost: |
||||||||
| Land |
$ | 883,491 | $ | 237,282 | ||||
| Buildings, fixtures and improvements |
2,311,211 | 1,229,230 | ||||||
|
|
|
|
|
|||||
| Total tangible assets |
3,194,702 | 1,466,512 | ||||||
|
|
|
|
|
|||||
| Acquired intangible assets: |
||||||||
| In-place leases |
334,839 | 197,873 | ||||||
| Above market leases |
12,317 | 1,503 | ||||||
|
|
|
|
|
|||||
| Total assets acquired, net |
3,541,858 | 1,665,888 | ||||||
|
|
|
|
|
|||||
| Assumed intangible liabilities: |
||||||||
| Below market leases |
(21,446 | ) | — | |||||
|
|
|
|
|
|||||
| Total liabilities acquired, net |
(21,446 | ) | — | |||||
| OP Units issued to acquire real estate investments |
— | (6,352 | ) | |||||
|
|
|
|
|
|||||
| Cash paid for acquired real estate investments |
$ | 3,520,412 | $ | 1,659,536 | ||||
|
|
|
|
|
|||||
| Number of properties acquired |
1,739 | 573 | ||||||
|
|
|
|
|
|||||
| (1) | Excludes 50 properties comprised of $66.1 million of net investments subject to direct financing leases. |
The following table presents unaudited pro forma information as if the acquisitions, including the CapLease Merger discussed in Note 5 — CapLease Acquisition, during the year ended December 31, 2013 had been consummated on January 1, 2012. These amounts have been calculated after applying the Operating Partnership’s accounting policies and adjusting the results of acquisitions to reflect the additional depreciation and amortization and interest expense that would have been charged had the acquisitions occurred on January 1, 2012. Additionally, the unaudited pro forma net loss attributable to unitholders was adjusted to exclude acquisition related expenses of $76.1 million and $45.1 million for the years ended December 31, 2013 and 2012, respectively, and merger and other transaction related expenses of $278.3 million and $2.6 million for the years ended December 31, 2013 and 2012, respectively (amounts in thousands).
| Year Ended December 31, | ||||||||
| 2013 | 2012 | |||||||
| Pro forma revenues |
$ | 574,058 | $ | 467,434 | ||||
| Pro forma net loss attributable to unitholders |
$ | (75,132 | ) | $ | (15,708 | ) | ||
F-30
Table of Contents
ARC PROPERTIES OPERATING PARTNERSHIP, L.P.
NOTES TO CONSOLIDATED FINANCIAL STATEMENTS — (Continued)
December 31, 2013
Future Lease Payments
The following table presents future minimum base rental cash payments due to the Operating Partnership, to be received on ARCP’s behalf, over the next five years and thereafter. These amounts exclude contingent rent payments, as applicable, that may be collected from certain tenants based on provisions related to sales thresholds and increases in annual rent based on exceeding certain economic indexes among other items (amounts in thousands):
| Future Minimum Operating Lease Base Rent Payments |
Future Minimum Direct Financing Lease Payments (1) |
|||||||
| 2014 |
$ | 522,563 | $ | 5,402 | ||||
| 2015 |
512,833 | 5,028 | ||||||
| 2016 |
496,691 | 4,946 | ||||||
| 2017 |
460,070 | 4,545 | ||||||
| 2018 |
424,934 | 3,455 | ||||||
| Thereafter |
2,734,499 | 10,352 | ||||||
|
|
|
|
|
|||||
| Total |
$ | 5,151,590 | $ | 33,728 | ||||
|
|
|
|
|
|||||
| (1) | 50 properties are subject to direct financing leases and, therefore, revenue with respect to such properties is recognized as direct financing lease income on the discounted cash flows of the lease payments. Amounts reflected are the cash rent on these respective properties. |
Net Investment in Direct Financing Leases
The components of the Operating Partnership’s net investment in direct financing leases as of December 31, 2013 are as follows (amounts in thousands):
| December 31, 2013 |
||||
| Future minimum lease payments receivable |
$ | 33,729 | ||
| Unguaranteed residual value of property |
46,172 | |||
| Unearned income |
(13,789 | ) | ||
|
|
|
|||
| Net investment in direct financing leases |
$ | 66,112 | ||
|
|
|
|||
The Operating Partnership had no investments in direct financing leases as of December 31, 2012.
Development Activities
Prior to the CapLease Acquisition Date (as defined below), Caplease entered into an agreement to construct a distribution warehouse in Columbia, South Carolina on a build-to-suit basis for a large private company tenant. The new build-to-suit project has an estimated total investment of $22.0 million. Construction activity and funding of the project commenced during June 2013.
Also prior to the CapLease Acquisition Date, CapLease entered into an agreement with a major Texas-based developer to develop a 150,000 square foot speculative office building in The Woodlands, Texas, adjacent to and part of the same development as an existing office building owned by CapLease and purchased in 2012. Costs of the project which are budgeted to be $34.0 million are scheduled to be funded by equity contributions from the
F-31
Table of Contents
ARC PROPERTIES OPERATING PARTNERSHIP, L.P.
NOTES TO CONSOLIDATED FINANCIAL STATEMENTS — (Continued)
December 31, 2013
Operating Partnership and its developer partner, and $17.0 million of advances during the construction period under a development loan entered into with Amegy Bank. All equity contributions are scheduled to be borne as follows: the Operating Partnership, on ARCP’s behalf, 90%; and the developer, 10%; except for cost overruns, which will be borne 50% by each. Because the Operating Partnership has a controlling financial interest in the investment, it consolidates the investment for financial accounting purposes. ARCP has an option to purchase, and the developer the option to sell to ARCP, in each case at fair market value, the developer’s interest in the project upon (i) substantial completion of the project and (ii) leases being entered into for 95% of the square footage of the project. Construction activity and funding of the project commenced during the quarter ended September 30, 2013.
The table below details the Operating Partnership’s investment in its pending development projects as of December 31, 2013. The information included in the table below represents management’s estimates and expectations at December 31, 2013 which are subject to change. The Operating Partnership’s disclosures regarding certain projections or estimates of completion dates for the Operating Partnership’s projects may not reflect actual results (dollar amounts in thousands).
| Location |
Tenant |
Property |
Approximate Square Feet |
Lease Term (years) |
Percent Owned |
Investment through 12/31/13 |
Estimated Remaining Investment |
Estimated Total Investment |
Estimated Completion Date |
|||||||||||||||||||||||
| Columbia, South Carolina |
Large private company | Warehouse | 450,000 | 10.5 | (1) | 100 | % | $ | 14,745 | $ | 7,325 | $ | 22,033 | Q1 2014 | ||||||||||||||||||
| The Woodlands, Texas |
N/A — speculative development | Office building | 150,000 | N/A | 90 | % | $ | 7,257 | $ | 26,775 | $ | 33,987 | Q3 2014 | |||||||||||||||||||
| (1) | The lease is in force and the 10.5-year lease term will commence upon substantial completion of the building. |
The amount of the “Investment” as of December 31, 2013 includes capitalized interest of approximately $37,000 for the Columbia, South Carolina project and approximately $45,000 for The Woodlands, Texas project. The amount of capitalized interest subsequent to the CapLease Acquisition Date through December 31, 2013 was not significant.
Tenant Concentration
The following table lists tenants whose annualized rental income on a straight-line basis represented greater than 10% of consolidated annualized rental income on a straight-line basis as of December 31, 2013. Annualized rental income for net leases is rental income on a straight-line basis as of the period reported, which includes the effect of tenant concessions such as free rent, as applicable. There were no tenants exceeding 10% of consolidated annualized rental income on a straight-line basis at December 31, 2013.
| Year Ended December 31, | ||||||||
| 2013 | 2012 | |||||||
| Citizens Bank |
* | 13.8 | % | |||||
| Dollar General |
* | 12.3 | % | |||||
| FedEx |
* | 10.2 | % | |||||
| * | The tenants’ annualized rental income was not greater than 10% of total consolidated annualized rental income for all portfolio properties as of the end of the period specified. |
No other tenant represents more than 10% of total consolidated annualized rental income on a straight-line basis for the periods presented.
F-32
Table of Contents
ARC PROPERTIES OPERATING PARTNERSHIP, L.P.
NOTES TO CONSOLIDATED FINANCIAL STATEMENTS — (Continued)
December 31, 2013
Geographic Concentration
The following table lists the states where the Operating Partnership has concentrations of properties where annual rental income on a straight-line basis represented greater than 10% of consolidated annualized rental income on a straight-line basis as of December 31, 2013 and 2012:
| Year Ended December 31, | ||||||||
| 2013 | 2012 | |||||||
| Texas |
10.7 | % | * | |||||
| Illinois |
* | 11.2 | % | |||||
| * | The geographical concentration’s annualized rental income was not greater than 10% of total consolidated annualized rental income for all portfolio properties as of the end of the periods specified. |
Note 5 — CapLease Acquisition
On the CapLease Acquisition Date, ARCP completed its acquisition of CapLease, a real estate investment trust that primarily owned and managed a diversified portfolio of single tenant commercial real estate properties subject to long-term leases, the majority of which were net leases, to high credit quality tenants, by acquiring 100% of the outstanding common shares and voting interests of CapLease. The acquisition was accounted for using the acquisition method of accounting in accordance with ASC 805, Business Combinations. The Operating Partnership’s consolidated financial statements include the results of operations of CapLease subsequent to the CapLease Acquisition Date.
The purchase price includes a cash payment of $920.7 million, which was funded by the Operating Partnership, on ARCP’s behalf, through additional borrowings under its revolving credit facility and the credit facility assumed from CapLease, see Note 11 — Other Debt and Note 12 — Credit Facilities.
The purchase price allocation for the CapLease Merger is considered preliminary, and additional adjustments may be recorded during the measurement period in accordance with U.S. GAAP. The purchase price allocation will be finalized as the Operating Partnership receives additional information relevant to the acquisition, including a final valuation of the assets purchased and liabilities assumed.
F-33
Table of Contents
ARC PROPERTIES OPERATING PARTNERSHIP, L.P.
NOTES TO CONSOLIDATED FINANCIAL STATEMENTS — (Continued)
December 31, 2013
The preliminary purchase price for the acquisition was allocated to assets acquired and liabilities assumed based on their estimated fair value. The following table presents the allocation of the purchase price to the estimated fair value of the assets acquired and liabilities assumed at the CapLease Acquisition Date (in thousands):
| Fair value of consideration given |
$ | 920,697 | ||
|
|
|
|||
| Assets purchased, at fair value: |
||||
| Land |
$ | 233,065 | ||
| Buildings, fixtures and improvements |
1,591,645 | |||
| Land and construction in process |
12,743 | |||
| Acquired intangible lease assets |
192,272 | |||
|
|
|
|||
| Total real estate investments |
2,029,871 | |||
|
|
|
|||
| Cash and cash equivalents |
41,799 | |||
| Investment securities |
60,730 | |||
| Loans held for investment |
26,457 | |||
| Restricted cash |
29,119 | |||
| Prepaid expenses and other assets |
21,716 | |||
| Deferred costs |
325 | |||
|
|
|
|||
| Total identifiable assets purchased |
2,209,871 | |||
|
|
|
| Liabilities assumed, at fair value: |
||||
| Mortgage notes payable |
$ | 1,037,510 | ||
| Secured credit facility |
121,000 | |||
| Other debt |
114,208 | |||
| Below-market leases |
57,058 | |||
| Derivative liabilities |
158 | |||
| Accounts payable and accrued expenses |
46,590 | |||
| Deferred rent and other liabilities |
8,803 | |||
|
|
|
|||
| Total liabilities assumed |
1,385,327 | |||
|
|
|
|||
| Non-controlling interest retained by third party |
567 | |||
|
|
|
|||
| Net identifiable assets acquired |
823,977 | |||
|
|
|
|||
| Goodwill |
$ | 96,720 | ||
|
|
|
Management is in the process of further evaluating the purchase price accounting. The fair value of real estate investments and below-market leases have been estimated by the Operating Partnership with the assistance of third-party valuation firms. Based on analyses received to date, the estimated fair value of these assets and liabilities total $2.0 billion and $57.1 million, respectively. The recorded values represent the estimated fair values related to such assets and liabilities. Upon completion of the analyses, including a review of the appraisals and assessment of current market rates, changes to the estimated fair values may result.
The fair value of the noncontrolling interest has been estimated based on the fair value of the percentage ownership of The Woodlands, Texas development activity not held by the Operating Partnership on ARCP’s behalf. Refer to Note 4 — Real Estate Investments.
The fair value of the remaining CapLease assets and liabilities have been calculated in accordance with the Operating Partnership’s policy on purchase price allocation, as disclosed in Note 3 — Summary of Significant Accounting Policies.
F-34
Table of Contents
ARC PROPERTIES OPERATING PARTNERSHIP, L.P.
NOTES TO CONSOLIDATED FINANCIAL STATEMENTS — (Continued)
December 31, 2013
The $102.4 million of goodwill is expected to be assigned to the real estate segment upon completion of the external valuation. The goodwill recognized is attributed to the enhancement of the Operating Partnership’s year-round rental revenue stream, expected synergies and the assembled work force at CapLease.
The amounts of revenue and net loss of CapLease included in the Operating Partnership’s consolidated statements of operations and comprehensive loss from the CapLease Acquisition Date to the period ended December 31, 2013 was $28.5 million and $5.8 million, respectively.
The pro forma consolidated statement of operation as if CapLease had been included in the consolidated results of the Operating Partnership for the entire years ended December 31, 2013 and 2012 have been reflected in Note 4 — Real Estate Investments.
Note 6 — Investment Securities, at Fair Value
Investment securities are considered available-for-sale and, therefore, increases or decreases in the fair value of these investments are recorded in accumulated other comprehensive income (loss) as a component of equity on the consolidated balance sheets unless the securities are considered to be other than temporarily impaired at which time the losses are reclassified to expense.
The following table details the unrealized gains and losses on investment securities as of December 31, 2013 and 2012 (amounts in thousands):
| Cost | Gross Unrealized Gains |
Gross Unrealized Losses |
Fair Value | |||||||||||||
| As of December 31, 2013 |
||||||||||||||||
| Investments in real estate fund |
$ | 1,589 | $ | — | $ | (105 | ) | $ | 1,484 | |||||||
| CMBS |
60,452 | 498 | (367 | ) | 60,583 | |||||||||||
|
|
|
|
|
|
|
|
|
|||||||||
| $ | 62,041 | $ | 498 | $ | (472 | ) | $ | 62,067 | ||||||||
|
|
|
|
|
|
|
|
|
|||||||||
| As of December 31, 2012 |
||||||||||||||||
| Preferred securities |
$ | 41,747 | $ | 223 | $ | (316 | ) | $ | 41,654 | |||||||
|
|
|
|
|
|
|
|
|
|||||||||
Investment in Real Estate Fund
On June 4, 2013, the Operating Partnership invested $10.0 million in a real estate fund that is sponsored by an affiliate of the Former Manager of ARCP and which invests primarily in equity securities of other publicly traded REITs. During the year ended December 31, 2013, the Operating Partnership reinvested distributions totaling $0.1 million into the real estate fund. During the fourth quarter of 2013, the Operating Partnership sold such investments with an original cost of $8.5 million for total proceeds of $8.1 million. The realized loss of $0.4 million has been recorded to losses on investments in affiliates within the consolidated statements of operations and comprehensive loss. Refer to Note 18 — Related Party Transactions and Arrangements.
Commercial Mortgage-Backed Securities (“CMBS”)
In connection with ARCP’s merger with CapLease, the Operating Partnership acquired 10 CMBS, with a fair value of $60.7 million. At December 31, 2013, the CMBS had a carrying value of $60.6 million and carried interest rates ranging from 5.88% to 8.95%. The Operating Partnership had no CMBS as of December 31, 2012.
F-35
Table of Contents
ARC PROPERTIES OPERATING PARTNERSHIP, L.P.
NOTES TO CONSOLIDATED FINANCIAL STATEMENTS — (Continued)
December 31, 2013
As of December 31, 2013, the fair value of four CMBS was below its carrying value. The Operating Partnership evaluated each of its securities for other-than-temporary impairment at December 31, 2013, and determined that no other-than-temporary impairment charges on its securities were appropriate. The Operating Partnership believes that none of the unrealized losses on investment securities are other-than-temporary because management expects the Operating Partnership will receive all contractual principal and interest related to these investments. In addition, the Operating Partnership did not have the intent to sell the securities or believe it would be required to sell them as of December 31, 2013.
Redeemable Preferred Stock, Senior Notes and Common Stock
At December 31, 2012, the Operating Partnership had investments in redeemable preferred stock, accounted for as debt securities by the Operating Partnership, with a fair value of $41.7 million. These investment securities were sold during the year ended December 31, 2013, resulting in a gain on sale of investments of $0.5 million.
During 2013, the Operating Partnership acquired additional investments in redeemable preferred stock, as well as investments in senior notes and common stock, with an aggregate cost basis of $69.5 million. The Operating Partnership sold all of these investment securities during 2013 for $67.2 million, resulting in a loss on sale of $2.3 million. As of December 31, 2013, the Operating Partnership had no remaining investments in redeemable preferred stock, senior notes or common stock.
Note 7 — Prepaid Expenses and Other Assets
Prepaid expenses and other assets consisted of the following as of December 31, 2013 and 2012 (amounts in thousands):
| Year Ended December 31, | ||||||||
| 2013 | 2012 | |||||||
| Restricted escrow deposits |
$ | 101,814 | $ | 138 | ||||
| Accounts receivable |
14,595 | 2,471 | ||||||
| Straight line rent receivable |
19,009 | 3,738 | ||||||
| Prepaid expenses |
43,799 | 856 | ||||||
| Other assets |
8,713 | 4,781 | ||||||
|
|
|
|
|
|||||
| $ | 187,930 | $ | 11,984 | |||||
|
|
|
|
|
|||||
Note 8 — Loans Held for Investment
Loans Held for Investment
In connection with ARCP’s merger with CapLease, the Operating Partnership acquired 12 loans held for investment, which consist predominantly of mortgage loans on properties subject to leases to investment grade tenants, with a fair value of $26.5 million at the CapLease Merger Date. At December 31, 2013, the loans held for investment had a carrying value of $26.3 million and carried interest rates ranging from 5.28% to 7.24%. The fair value adjustment is being amortized to interest expense in the consolidated statements of operations and comprehensive loss over the life of the Secured Term. The Operating Partnership, had no loans held for investment as of December 31, 2012.
The Operating Partnership’s loan portfolio is comprised primarily of fully amortizing or nearly fully amortizing first mortgage loans on commercial real estate leased to a single tenant. Payments of debt service on
F-36
Table of Contents
ARC PROPERTIES OPERATING PARTNERSHIP, L.P.
NOTES TO CONSOLIDATED FINANCIAL STATEMENTS — (Continued)
December 31, 2013
such loans is, in substantially all cases, funded directly by rent payments paid into a lockbox account by the underlying tenant. Therefore, the Operating Partnership’s monitoring of the credit quality of its loans held for investment is focused primarily on an analysis of the tenant, including review of tenant credit ratings (including changes in ratings) and other measures of tenant credit quality, trends in the tenant’s industry and general economic conditions, and an analysis of measures of collateral coverage, such as an estimate of the loan’s loan-to-value (“LTV”) ratio (principal amount outstanding divided by estimated value of the property) and its remaining term until maturity. As of December 31, 2013, the Operating Partnership did not record a reserve for loan loss.
Note 9 — Fair Value of Financial Instruments
The Operating Partnership determines fair value based on quoted prices when available or through the use of alternative approaches, such as discounting the expected cash flows using market interest rates commensurate with the credit quality and duration of the investment. The guidance defines three levels of inputs that may be used to measure fair value:
Level 1 — Quoted prices in active markets for identical assets and liabilities that the reporting entity has the ability to access at the measurement date.
Level 2 — Inputs other than quoted prices included within Level 1 that are observable for the asset and liability or can be corroborated with observable market data for substantially the entire contractual term of the asset or liability.
Level 3 — Unobservable inputs that reflect the entity’s own assumptions about the assumptions that market participants would use in the pricing of the asset or liability and are consequently not based on market activity, but rather through particular valuation techniques.
The determination of where an asset or liability falls in the hierarchy requires significant judgment and considers factors specific to the asset or liability. In instances where the determination of the fair value measurement is based on inputs from different levels of the fair value hierarchy, the level in the fair value hierarchy within which the entire fair value measurement falls is based on the lowest level input that is significant to the fair value measurement in its entirety. The Operating Partnership evaluates its hierarchy disclosures each quarter and depending on various factors, it is possible that an asset or liability may be classified differently from quarter to quarter. However, the Operating Partnership expects that changes in classifications between levels will be rare.
Although the Operating Partnership has determined that the majority of the inputs used to value its derivatives fall within Level 2 of the fair value hierarchy, the credit valuation adjustments associated with those derivatives utilize Level 3 inputs, such as estimates of current credit spreads to evaluate the likelihood of default by the Operating Partnership and its counterparties. However, as of December 31, 2013, the Operating Partnership has assessed the significance of the impact of the credit valuation adjustments on the overall valuation of its derivative positions and has determined that the credit valuation adjustments are not significant to the overall valuation of the Operating Partnership’s derivatives. As a result, the Operating Partnership has determined that its derivative valuations in their entirety are classified in Level 2 of the fair value hierarchy. As of December 31, 2013, the Operating Partnership’s interest rate cap derivative measured at fair value on a recurring basis was zero and was classified in Level 2 of the fair value hierarchy.
F-37
Table of Contents
ARC PROPERTIES OPERATING PARTNERSHIP, L.P.
NOTES TO CONSOLIDATED FINANCIAL STATEMENTS — (Continued)
December 31, 2013
The following table presents information about the Operating Partnership’s assets and liabilities (including derivatives that are presented net) measured at fair value on a recurring basis as of December 31, 2013 and 2012, aggregated by the level in the fair value hierarchy within which those instruments fall (amounts in thousands):
| Quoted Prices in Active Markets Level 1 |
Significant Other Observable Inputs Level 2 |
Significant Unobservable Inputs Level 3 |
Total | |||||||||||||
| December 31, 2013 |
||||||||||||||||
| Investments in real estate fund |
$ | — | $ | 1,484 | $ | — | $ | 1,484 | ||||||||
| CMBS |
— | — | 60,583 | 60,583 | ||||||||||||
| Interest rate swap assets |
— | 9,189 | — | 9,189 | ||||||||||||
| Interest rate swap liabilities |
— | (1,719 | ) | — | (1,719 | ) | ||||||||||
| Series D Preferred Units embedded derivative (1) |
— | — | (16,736 | ) | (16,736 | ) | ||||||||||
|
|
|
|
|
|
|
|
|
|||||||||
| Total |
$ | — | $ | 8,954 | $ | 43,847 | $ | 52,801 | ||||||||
|
|
|
|
|
|
|
|
|
|||||||||
| December 31, 2012 |
||||||||||||||||
| Investment securities |
$ | 41,654 | $ | — | $ | — | $ | 41,654 | ||||||||
| Interest rate swaps |
— | (3,830 | ) | — | (3,830 | ) | ||||||||||
|
|
|
|
|
|
|
|
|
|||||||||
| Total |
$ | 41,654 | $ | (3,830 | ) | $ | — | $ | 37,824 | |||||||
|
|
|
|
|
|
|
|
|
|||||||||
| (1) | Corresponding Series D Preferred Stock issued by ARCP. |
Investment in real estate fund — The fair value of the Operating Partnership’s investment in real estate fund is based on published pricing.
Commercial mortgage-backed securities — The fair values of the Operating Partnership’s CMBS are valued using broker quotations, collateral values, subordination levels, and liquidity of the individual securities.
Derivatives — The valuation of derivative instruments is determined using a discounted cash flow analysis on the expected cash flows of each derivative. This analysis reflects the contractual terms of the derivatives, including the period to maturity, as well as observable market-based inputs, including interest rate curves and implied volatilities. In addition, credit valuation adjustments are incorporated into the fair values to account for the Operating Partnership’s potential nonperformance risk and the performance risk of the counterparties.
Series D Preferred Units embedded derivative — The valuation of this derivative instrument is determined using a binomial option pricing model. Key inputs in the model include the expected term, risk-free interest rate, volatility, and dividend yield.
The fair value of short-term financial instruments such as cash and cash equivalents, restricted cash, due to affiliates and accounts payable approximate their carrying value on the accompanying consolidated balance sheets due to their short-term nature and are classified as Level 1 under the fair value hierarchy.
A review of the fair value hierarchy classification is conducted on a quarterly basis. Changes in the type of inputs may result in a reclassification for certain assets. There were no transfers between Level 1 and Level 2 or Level 3 of the fair value hierarchy during the year ended December 31, 2013.
F-38
Table of Contents
ARC PROPERTIES OPERATING PARTNERSHIP, L.P.
NOTES TO CONSOLIDATED FINANCIAL STATEMENTS — (Continued)
December 31, 2013
The following is a reconciliation of the beginning and ending balance for the changes in instruments with Level 3 inputs in the fair value hierarchy for the year ended December 31, 2013 (amounts in thousands):
| CMBS | Series D Preferred Units Embedded Derivative |
Total | ||||||||||
| Beginning balance |
$ | — | $ | — | $ | — | ||||||
| Fair value at purchase/issuance |
60,730 | (18,692 | ) | 42,038 | ||||||||
| Sales of CMBS |
(278 | ) | — | (278 | ) | |||||||
| Fair value adjustment (1) |
131 | 1,956 | 2,087 | |||||||||
|
|
|
|
|
|
|
|||||||
| Ending balance |
$ | 60,583 | $ | (16,736 | ) | $ | 43,847 | |||||
|
|
|
|
|
|
|
|||||||
| (1) | The change in fair value in the CMBS and Series D Preferred Units embedded derivative is recorded in unrealized gain (loss) on investment securities, net and loss on derivative instruments, net, respectively, on the consolidated statement of operations and comprehensive loss. |
The fair values of the Operating Partnership’s financial instruments that are not reported at fair value on the consolidated balance sheets are reported below (amounts in thousands):
| Level | Carrying Amount at December 31, 2013 |
Fair Value at December 31, 2013 |
Carrying Amount at December 31, 2012 |
Fair Value at December 31, 2012 |
||||||||||||||||
| Assets: |
||||||||||||||||||||
| Loans held for investment |
3 | $ | 26,279 | $ | 26,435 | $ | — | $ | — | |||||||||||
|
|
|
|
|
|
|
|
|
|||||||||||||
| Liabilities: |
||||||||||||||||||||
| Convertible debt |
3 | $ | 972,490 | $ | 977,373 | $ | — | $ | — | |||||||||||
| Mortgage notes payable |
3 | 1,301,114 | 1,305,016 | 265,118 | 271,056 | |||||||||||||||
| Senior secured revolving credit facility |
3 | — | — | 124,604 | 124,604 | |||||||||||||||
| Senior corporate credit facilities |
3 | 1,819,800 | 1,819,800 | — | — | |||||||||||||||
| Secured credit facility |
3 | 150,000 | 150,000 | — | — | |||||||||||||||
| Trust preferred notes |
3 | 26,548 | 23,345 | — | — | |||||||||||||||
| Secured term loan |
3 | 58,979 | 59,049 | — | — | |||||||||||||||
| Other debt |
3 | 19,277 | 19,350 | — | — | |||||||||||||||
|
|
|
|
|
|
|
|
|
|||||||||||||
| Total liabilities |
$ | 4,348,208 | $ | 4,353,933 | $ | 389,722 | $ | 395,660 | ||||||||||||
|
|
|
|
|
|
|
|
|
|||||||||||||
Loans held for investment — The fair value of the Operating Partnership’s fixed-rate loan portfolio is estimated with a discounted cash flow analysis, utilizing scheduled cash flows and discount rates estimated by management to approximate those that a willing buyer and seller might use.
Credit facilities — Management believes that the stated interest rates (which float based on short-term interest rates) approximates market rates. As such, the fair values of these obligations is estimated to be equal to the outstanding principal amounts.
Convertible debt, mortgage notes payable and secured term loan — The fair value of mortgages payable on real estate investments and the secured term loan is estimated using a discounted cash flow analysis, based on management’s estimates of market interest rates. For mortgages where the Operating Partnership has an early prepayment right, management also considers the prepayment amount to evaluate the fair value.
F-39
Table of Contents
ARC PROPERTIES OPERATING PARTNERSHIP, L.P.
NOTES TO CONSOLIDATED FINANCIAL STATEMENTS — (Continued)
December 31, 2013
Trust preferred notes — The fair value of the Operating Partnership’s other long-term debt is estimated using a discounted cash flow analysis, based on management’s estimates of market interest rates.
Note 10 — Mortgage Notes Payable
The Operating Partnership’s mortgage notes payable consist of the following as of December 31, 2013 and 2012 (dollar amounts in thousands):
| Encumbered Properties |
Outstanding Loan Amount |
Weighted-Average Effective Interest Rate (1) |
Weighted-Average Maturity (2) |
|||||||||||||
| December 31, 2013 |
177 | $ | 1,258,661 | 3.42 | % | 3.41 | ||||||||||
| December 31, 2012 |
164 | $ | 265,118 | 4.28 | % | 5.51 | ||||||||||
| (1) | Mortgage notes payable have fixed rates or are fixed by way of interest rate swap arrangements. Effective interest rates range from 1.83% to 6.28% at December 31, 2013 and 3.32% to 6.13% at December 31, 2012. |
| (2) | Weighted-average remaining years until maturity as of December 31, 2013 and 2012, respectively. |
In conjunction with the CapLease Merger, aggregate net premiums totaling $45.2 million were recorded upon assumption of the mortgages for above-market interest rates. Amortization of these net premiums is recorded as a reduction to interest expense over the remaining term of the respective mortgages using a method that approximates the effective-interest method. As of December 31, 2013, there was $42.5 million in unamortized net premiums included in mortgage notes payable, net on the consolidated balance sheets.
The following table summarizes the scheduled aggregate principal repayments subsequent to December 31, 2013 (amounts in thousands):
| Principal Repayment | ||||
| 2014 |
$ | 86,933 | ||
| 2015 |
381,574 | |||
| 2016 |
295,627 | |||
| 2017 |
257,658 | |||
| 2018 |
36,210 | |||
| Thereafter |
200,659 | |||
|
|
|
|||
| $ | 1,258,661 | |||
|
|
|
|||
The Operating Partnership’s mortgage loan agreements generally require restrictions on corporate guarantees and the maintenance of financial covenants including maintenance of certain financial ratios (such as specified debt to equity and debt service coverage ratios). As of December 31, 2013, the Operating Partnership was in compliance with the debt covenants under the mortgage loan agreements.
Note 11 — Other Debt
Convertible Obligation to Series C Convertible Preferred Stockholders
On June 7, 2013, ARCP issued 28.4 million shares of Series C Stock through a private placement for gross proceeds of $445.0 million. Concurrently, the Operating Partnership issued to the General Partner 28.4 million OP Units designated as Series C Convertible Preferred Units underlying the Series C Preferred Stock. Due to an unconditional obligation to either redeem or convert the Series C Stock into a variable number of shares of common stock that is predominantly based on a fixed monetary amount, the preferred securities were classified
F-40
Table of Contents
ARC PROPERTIES OPERATING PARTNERSHIP, L.P.
NOTES TO CONSOLIDATED FINANCIAL STATEMENTS — (Continued)
December 31, 2013
as an obligation under U.S. GAAP and were presented in the consolidated balance sheets as a liability prior to their conversion on November 8, 2013. On November 8, 2013, ARCP converted all outstanding Series C Stock into common shares of ARCP. Pursuant to the Series C Articles Supplementary, the number of common shares that could be issued upon conversion of Series C Stock was limited by the exchange cap. Therefore, ARCP converted 1.1 million shares of Series C Stock into 1.4 million common shares of ARCP and, concurrently, the Operating Partnership converted 1.1 million Series C Convertible Preferred Units into 1.4 million General Partner OP Units. With respect to the 27.3 million shares of Series C Stock for which Common Shares could not be issued upon conversion due to the exchange cap, ARCP, through the Operating Partnership, paid holders of Series C Stock an aggregate cash amount equal to approximately $441.4 million in exchange for such Series C Stock. Based on ARCP’s share price on the conversion date, the total settlement value was $458.8 million. Settlement of the Series C Stock resulted in a loss of $13.8 million, which is recorded as interest expense in the consolidated statements of operations and comprehensive loss.
Convertible Senior Note Offering
Effective July 29, 2013, the Operating Partnership issued to the General Partner $300.0 million of the 2018 Notes and issued an additional $10.0 million of its 2018 Notes on August 1, 2013 (collectively, the “Original 2018 Notes”). Effective December 10, 2013, the Operating Partnership issued an additional $287.5 million through a reopening of the 2018 Notes indenture agreement (the “Reopened 2018 Notes,” together with the Original 2018 Notes, the “2018 Notes”). The 2018 Notes mature on August 1, 2018. Such issuances were identical to ARCP’s registered issuances of the same amount of notes to various purchasers in a public offering. The fair value of the Original 2018 Notes and Reopened 2018 Notes was determined at issuance to be $299.6 million and $282.1 million, respectively, resulting in a debt discount of $10.4 million and $5.4 million, respectively, with an offset recorded to partners’ equity representing the equity component of the notes for the conversion options. The discount is being amortized to interest expense over the expected lives of the 2018 Notes. As of December 31, 2013, the carrying value of the Original 2018 Notes and Reopened 2018 Notes was $300.5 million and $282.2 million, respectively. In connection with any permissible conversion election made by the holders of the convertible notes issued by ARCP, the General Partner may make the same election to convert the 2018 Notes into cash, General Partner OP Units or a combination thereof, in limited circumstances prior to February 1, 2018 and may convert the 2018 Notes at any time into such consideration on or after February 1, 2018. The initial conversion rate is 59.805 General Partner OP Units per $1,000 principal amount of 2018 Notes.
Effective December 10, 2013, the Operating Partnership issued to the General Partner $402.5 million of 3.75% Convertible Senior Notes (the “2020 Notes”). The 2020 Notes mature on December 15, 2020. Such issuance was identical to ARCP’s registered issuance of the same amount of notes to various purchasers in a public offering. The fair value of the 2020 Notes was determined at issuance to be $389.7 million, resulting in a debt discount of $12.8 million with an offset recorded to partners’ equity representing the equity component of the notes for the conversion options. The discount is being amortized to interest expense over the expected life of the 2020 Notes. As of December 31, 2013, the carrying value of the 2020 Notes was $389.8 million. The General Partner may elect to convert the 2020 Notes into cash, General Partner OP Units or a combination thereof in limited circumstances prior to June 15, 2020 and may convert the 2020 Notes at any time into such consideration on or after June 15, 2020. The initial conversion rate is 66.0262 General Partner OP Units per $1,000 principal amount of 2020 Notes.
In connection with the 2018 Notes and 2020 Notes, the remaining unamortized discount totaled $27.5 million.
Trust Preferred Notes
As part of the CapLease Merger, the Operating Partnership assumed $30.9 million in aggregate principal amount of fixed/floating rate preferred notes with a fair value of $26.5 million at the CapLease Acquisition Date.
F-41
Table of Contents
ARC PROPERTIES OPERATING PARTNERSHIP, L.P.
NOTES TO CONSOLIDATED FINANCIAL STATEMENTS — (Continued)
December 31, 2013
The trust preferred securities represent an unsecured subordinated recourse debt obligation of the Operating Partnership and require quarterly interest payments calculated at a fixed interest rate equal to 7.68% per annum through January 30, 2016, and subsequently at a variable interest rate equal to LIBOR plus 2.60% per annum. The notes must be redeemed on January 30, 2036, and may be redeemed, in whole or in part, at par, at the Operating Partnership’s option, at any time. The discount recorded on the notes is being amortized to interest expense on the consolidated statements of operations and comprehensive loss over the life of the preferred notes. As of December 31, 2013, the carrying value of the preferred securities was $26.5 million.
Secured Term Loan
As part of the CapLease Merger, the Operating Partnership assumed a secured term loan with KBC Bank, N.V. with a principal balance of $59.8 million and a fair value of $60.7 million at the CapLease Acquisition Date. The interest coupon on the loan is fixed at 5.81% annually until the loan matures in January 2018. The loan is non-recourse to the Operating Partnership, subject to limited non-recourse exceptions. During the period between the CapLease Acquisition Date and December 31, 2013, the Operating Partnership made principal payments of $1.7 million. The premium is being amortized to interest expense on the consolidated statements of operations and comprehensive loss over the life of the secured term loan. As of December 31, 2013, the carrying value of the secured term loan was $58.2 million.
Amounts related to the secured term loan as of December 31, 2013 were as follows (amounts in thousands):
| Borrowings | Collateral Carrying Value |
|||||||
| Loans held for investment |
$ | 14,065 | $ | 22,496 | ||||
| Intercompany mortgage loans on CapLease properties |
9,195 | 21,114 | ||||||
| CMBS |
34,915 | 46,054 | ||||||
|
|
|
|
|
|||||
| $ | 58,175 | $ | 89,664 | |||||
|
|
|
|
|
|||||
Other Debt
As part of the CapLease Merger, ARCP assumed $19.2 million of senior notes (the “Senior Notes”) that bear interest at an annual interest rate of 7.50%, payable semi-annually on April 1 and October 1, with a fair value of $19.3 million at the CapLease Acquisition Date. The Senior Notes mature on October 1, 2027. ARCP has the right to redeem the Senior Notes in whole or in part for cash at any time or from time to time at a redemption price equal to 100% of the principal amount of the Senior Notes to be redeemed, plus any accrued and unpaid interest. The holder of the Senior Notes may require ARCP to repurchase their Senior Notes, in whole or in part, on October 1, 2017 and October 1, 2022, for a cash price equal to 100% of the principal amount of the Senior Notes to be repurchased, plus any accrued and unpaid interest. On the CapLease Acquisition Date, the Operating Partnership issued the General Partner notes that had identical terms as the Senior Notes (“General Partner Senior Notes”). The discount is being amortized to interest expense on the consolidated statements of operations and comprehensive loss over the life of the General Partner Senior Notes. As of December 31, 2013, the carrying value of the General Partner Senior Notes was $19.3 million.
In conjunction with the CapLease Merger, aggregate net discounts totaling $3.5 million were recorded upon assumption of the trust preferred notes, secured term loan and senior notes. As of December 31, 2013, unamortized net discounts were $3.5 million in unamortized net discounts included in other debt on the consolidated balance sheets.
F-42
Table of Contents
ARC PROPERTIES OPERATING PARTNERSHIP, L.P.
NOTES TO CONSOLIDATED FINANCIAL STATEMENTS — (Continued)
December 31, 2013
Future Minimum Repayments
The following table summarizes the scheduled aggregate principal repayments of our convertible debt, trust preferred notes, secured term loan and other debt subsequent to December 31, 2013 (amounts in thousands):
| Principal Repayment | ||||
| 2014 |
$ | 12,851 | ||
| 2015 |
11,862 | |||
| 2016 |
12,516 | |||
| 2017 |
26,890 | |||
| 2018 |
610,767 | |||
| Thereafter |
433,430 | |||
|
|
|
|||
| $ | 1,108,316 | |||
|
|
|
|||
Barclay’s Facility
As of December 31, 2013, the Operating Partnership had available commitments from Barclays Bank PLC, and other committed parties, for up to $2.1 billion in senior secured term loans (the “Barclays Facility”) in order to fund cash amounts payable in connection with the Cole Merger, which were subject to certain conditions, including the absence of a material adverse effect in respect of Cole, the negotiation of definitive documentation and pro forma compliance with financial covenants. Any other long-term debt obtained by the Operating Partnership would have reduced the commitments under the Barclays Facility. The Barclays Facility contained an accordion feature to allow the Operating Partnership, under certain circumstances, to increase commitments thereunder by up to $350.0 million.
The Operating Partnership could have elected to use the Barclays Facility to fund a portion of the consideration to be paid pursuant to the Cole Merger, to refinance existing indebtedness of Cole and to pay related fees and expenses. The commitments received in the Barclays Facility were schedule to terminate upon the occurrence of certain customary events, and in any event on April 22, 2014, which date may be extended by an additional three months under certain circumstances. The Barclays Facility was terminated upon the issuance of the senior unsecured notes in February 2014, as discussed below.
Bond Offering
On February 6, 2014, the Operating Partnership issued, in a private offering, $2.55 billion aggregate principal amount of senior unsecured notes consisting of $1.3 billion aggregate principal amount of 2.00% senior notes due 2017 (the “2017 Notes”), $750.0 million aggregate principal amount of 3.00% senior notes due 2019 (the “2019 Notes”) and $500.0 million aggregate principal amount of 4.60% senior notes due 2024 (the “2024 Notes”, and, together with the 2017 Notes and 2019 Notes, the “Notes”). The Notes are guaranteed by the General Partner. The Operating Partnership may redeem all or a part of any series of the Notes at any time at its option at the redemption prices set forth in the indenture governing the Notes, plus accrued and unpaid interest on the principal amount of the Notes of such series being redeemed to, but excluding, the applicable redemption date. With respect to the 2019 Notes and the 2024 Notes, if such Notes are redeemed on or after January 6, 2019, with respect to the 2019 Notes, or November 6, 2023, with respect to the 2024 Notes, the redemption price will equal 100% of the principal amount of the Notes of the applicable series to be redeemed, plus accrued and unpaid interest on the amount being redeemed to, but excluding, the applicable redemption date.
F-43
Table of Contents
ARC PROPERTIES OPERATING PARTNERSHIP, L.P.
NOTES TO CONSOLIDATED FINANCIAL STATEMENTS — (Continued)
December 31, 2013
Note 12 — Credit Facilities
Senior Corporate Credit Facility
The Operating Partnership and the General Partner are parties to a senior corporate credit facility with Wells Fargo, National Association (the “Credit Facility”), as administrative agent and other lenders party thereto.
At December 31, 2013, the Credit Facility had commitments of $2.4 billion. The Credit Facility has an accordion feature, which, if exercised in full, would allow the Operating Partnership to increase borrowings under the Credit Facility to $3.0 billion, subject to additional lender commitments, borrowing base availability and other conditions.
At December 31, 2013, the Credit Facility contained a $940.0 million term loan facility and a $1.5 billion revolving credit facility, of which $940.0 million and $119.8 million was outstanding, respectively. In November 2013, the Credit Facility was amended and certain modifications were made to the terms of the agreement. Loans under the Credit Facility are priced at the applicable rate (at the Operating Partnership’s election, either a floating interest rate based on one month LIBOR, determined on a daily basis) plus 2.25% to 3.00%, or a prime-based interest rate, based upon the Operating Partnership’s current leverage. From the amendment date until the first completed fiscal quarter, the applicable LIBOR rate is increased by 3.00%. To the extent that ARCP receives an investment grade credit rating as determined by a major credit rating agency, at the Operating Partnership’s election, advances under the revolving credit facility will be priced at their applicable rate plus 0.90% to 1.75% and term loans will be priced at a floating interest rate of LIBOR plus 1.15% to 2.00%, based upon ARCP’s then current investment grade credit rating. The Operating Partnership may also make fixed rate borrowings under the Credit Facility. At December 31, 2013, the Operating Partnership had undrawn commitments of $1.4 billion under the Credit Facility.
The Credit Facility provides for monthly interest payments. In event of a default, each lender has the right to terminate its obligations under the Credit Facility, and to accelerate the payment on any unpaid principal amount of all outstanding loans. The General Partner has guaranteed the obligations under the Credit Facility. The revolving credit facility will terminate on February 14, 2017, unless extended for an additional year pursuant to the terms of the agreement. The Operating Partnership may prepay borrowings under the Credit Facility and the Operating Partnership may incur an unused fee of 0.15% to 0.25% per annum on the unused amount depending on the unused balance as a percentage of the total facility and the type of funding. As of December 31, 2013, the Credit Facility also required the Operating Partnership to maintain certain property available for collateral as a condition to funding.
As of December 31, 2013, the outstanding balance on the Credit Facility was $1.1 billion, of which $544.8 million bore interest at a floating rate of 3.17%. $515.0 million outstanding on the Credit Facility is fixed through the use of derivative instruments used to hedge interest rate volatility. Including the spread, which can vary based on the Operating Partnership’s leverage, interest on this portion was 4.02% at December 31, 2013. At December 31, 2013, there was up to $1.9 billion available to the Operating Partnership for future borrowings, subject to additional lender commitments and borrowing availability.
The Credit Facility requires restrictions on corporate guarantees as well as the maintenance of financial covenants including the maintenance of certain financial ratios (such as specified debt to equity and debt service coverage ratios) and the maintenance of a minimum net worth. At December 31, 2013, the Operating Partnership was in compliance with the debt covenants under the Credit Facility.
On June 30, 2014, the Operating Partnership amended and restated the Credit Facility to, among other things, increase the amount of revolving commitments (including the addition of a multicurrency sub-facility)
F-44
Table of Contents
ARC PROPERTIES OPERATING PARTNERSHIP, L.P.
NOTES TO CONSOLIDATED FINANCIAL STATEMENTS — (Continued)
December 31, 2013
and term loan commitments. The amended Credit Facility is comprised of a $1.2 billion term loan facility, a $3.15 billion dollar-denominated revolving credit facility and a $250.0 million multi-current facility (from which the Operating Partnership may borrow in dollars). The amended Credit Facility includes an accordion feature, which, if exercised in full, allows the Operating Partnership to increase the aggregate commitments under the amended Credit Facility to $6.0 billion, subject to certain customary conditions.
ARCT IV Senior Secured Credit Facility
On June 18, 2013, the Operating Partnership obtained a credit agreement (the “Credit Agreement”) with Regions Bank, JPMorgan Chase Bank, N.A., Bank of America, N.A., Wells Fargo Bank, National Association and RBS Citizens, N.A (collectively, the “Lenders”) relating to a $750.0 million senior secured credit facility (the “Senior Secured Credit Facility”).
Initially, the Senior Secured Credit Facility contained a $300.0 million term loan facility and a $450.0 million revolving credit facility. The Senior Secured Credit Facility contained an “accordion” feature to allow the Operating Partnership, under certain circumstances, to increase the aggregate commitments under the Senior Secured Credit Facility to up to $1.5 billion. On October 16, 2013, the Operating Partnership entered into agreements that amended the Credit Agreement, increasing the maximum principal amount under the revolving credit facility to $500.0 million and the aggregate commitment under the Senior Secured Credit Facility to $800.0 million.
As of December 31, 2013, the Operating Partnership had $760.0 million outstanding under the Credit Agreement. The effective annualized interest rate on the Credit Agreement was 1.71% as of December 31, 2013. The Operating Partnership had $40.0 million of unused borrowing capacity under the Credit Agreement as of December 31, 2013.
The Senior Secured Credit Facility required the Operating Partnership to meet certain financial covenants, including the maintenance of certain financial ratios (such as specified debt to equity and debt service coverage ratios) as well as the maintenance of a minimum net worth. As of December 31, 2013, the Operating Partnership was in compliance with the financial covenants under the Credit Agreement.
In connection with the ARCT IV Merger, the Operating Partnership notified the Administrative Agent in December 2013 and on January 3, 2014, prepaid all of its loans pursuant to, and terminated all commitments available under, the Credit Agreement.
Secured Credit Facility
As part of the CapLease Merger, the Operating Partnership assumed a secured credit facility with Wells Fargo, National Association (the “Secured Credit Facility”), which had commitments of up to $150.0 million at December 31, 2013. The Secured Credit Facility was fully drawn with $150.0 million outstanding at December 31, 2013.
The borrowings under the Secured Credit Facility bear interest at an annual rate of one-month LIBOR or LIBOR based on an interest period of one, three or six months, at the Operating Partnership’s election, plus an applicable margin of 2.75%, payable quarterly in arrears. The Secured Credit Facility matures on December 31, 2014 and may be prepaid, in whole or in part, without premium or penalty, at the Operating Partnership’s option, at any time.
F-45
Table of Contents
ARC PROPERTIES OPERATING PARTNERSHIP, L.P.
NOTES TO CONSOLIDATED FINANCIAL STATEMENTS — (Continued)
December 31, 2013
The obligations under the Secured Credit Facility are secured by mortgages on certain real property assets acquired from CapLease comprising the borrowing base. The Secured Credit Facility includes affirmative and negative covenants and financial performance covenants. At December 31, 2013, the Operating Partnership was in compliance with the debt covenants under the Secured Credit Facility.
Repayment of Previous Credit Facilities
On February 28, 2013, the Operating Partnership repaid all of the outstanding borrowings under its previous senior secured revolving credit facility in the amount of $124.6 million, and the credit agreement for such facility was terminated. The average interest rate on the borrowings outstanding during the period was 3.11%. On February 14, 2013, simultaneous with entering into the Credit Facility, the Operating Partnership terminated its secured credit facility agreement, which had been unused.
Note 13 — Accounts Payable and Accrued Expenses
Accounts payable and accrued expenses consisted of the following as of December 31, 2013 and 2012 (amounts in thousands):
| Year Ended December 31, | ||||||||
| 2013 | 2012 | |||||||
| Accounts payable |
$ | 7,566 | $ | 2,691 | ||||
| Accrued interest |
14,189 | 1,032 | ||||||
| Accrued real estate taxes |
15,510 | 899 | ||||||
| Accrued OPP obligation |
59,400 | — | ||||||
| Accrued merger costs |
673,990 | 93,409 | ||||||
| Accrued other |
38,245 | 6,353 | ||||||
|
|
|
|
|
|||||
| $ | 808,900 | $ | 104,384 | |||||
|
|
|
|
|
|||||
Note 14 — Derivatives and Hedging Activities
Risk Management Objective of Using Derivatives
The Operating Partnership may use derivative financial instruments, including interest rate swaps, caps, options, floors and other interest rate derivative contracts, to hedge all or a portion of the interest rate risk associated with its borrowings. The principal objective of such arrangements is to minimize the risks and/or costs associated with the Operating Partnership’s operating and financial structure as well as to hedge specific anticipated transactions. The Operating Partnership does not intend to utilize derivatives for speculative or other purposes other than interest rate risk management. The use of derivative financial instruments carries certain risks, including the risk that the counterparties to these contractual arrangements are not able to perform under the agreements. To mitigate this risk, the Operating Partnership only enters into derivative financial instruments with counterparties with high credit ratings and with major financial institutions with which the Operating Partnership and its affiliates may also have other financial relationships. The Operating Partnership does not anticipate that any of the counterparties will fail to meet their obligations.
Cash Flow Hedges of Interest Rate Risk
The Operating Partnership’s objectives in using interest rate derivatives are to add stability to interest expense and to manage its exposure to interest rate movements. To accomplish this objective, the Operating Partnership primarily uses interest rate swaps and collars as part of its interest rate risk management strategy.
F-46
Table of Contents
ARC PROPERTIES OPERATING PARTNERSHIP, L.P.
NOTES TO CONSOLIDATED FINANCIAL STATEMENTS — (Continued)
December 31, 2013
Interest rate swaps designated as cash flow hedges involve the receipt of variable-rate amounts from a counterparty in exchange for the Operating Partnership making fixed-rate payments over the life of the agreements without exchange of the underlying notional amount. Interest rate collars designated as cash flow hedges involve the receipt of variable-rate amounts if interest rates rise above the cap strike rate on the contract and payments of variable-rate amounts if interest rates fall below the floor strike rate on the contract.
The effective portion of changes in the fair value of derivatives designated and that qualify as cash flow hedges is recorded in accumulated other comprehensive income and is subsequently reclassified into earnings in the period that the hedged forecasted transaction affects earnings. During 2013, such derivatives were used to hedge the variable cash flows associated with variable-rate debt. The ineffective portion of the change in fair value of the derivatives is recognized directly in earnings.
Amounts reported in accumulated other comprehensive income related to derivatives that will be reclassified to interest expense as interest payments are made on the Operating Partnership’s variable-rate debt. During the next 12 months, the Operating Partnership estimates that an additional $5.8 million will be reclassified from other comprehensive income as an increase to interest expense. During the year ended December 31, 2013, the Operating Partnership accelerated the reclassification of amounts in other comprehensive income to earnings as a result of the hedged forecasted transactions becoming probable not to occur. The accelerated amounts were a loss of less than $27,000.
As of December 31, 2013, the Operating Partnership had the following outstanding interest rate derivatives that were designated as cash flow hedges of interest rate risk (dollar amounts in thousands):
| Interest Rate Derivative |
Number of Instruments |
Notional Amount | ||||||
| Interest rate swaps |
16 | $ | 700,390 | |||||
The table below presents the fair value of the Operating Partnership’s derivative financial instruments as well as their classification on the consolidated balance sheets as of the years ended December 31, 2013 and 2012 (dollar amounts in thousands):
| Year Ended December 31, | ||||||||||
| Derivatives Designated as Hedging Instruments |
Balance Sheet Location |
2013 | 2012 | |||||||
| Interest rate products |
Derivative assets, at fair value | $ | 9,189 | $ | — | |||||
| Interest rate products |
Derivative liabilities, at fair value | $ | (1,719 | ) | $ | (3,830 | ) | |||
The table below details the location in the financial statements of the gain or loss recognized on interest rate derivatives designated as cash flow hedges for the years ended December 31, 2013 and 2012, respectively (amounts in thousands):
| Year Ended December 31, | ||||||||
| Derivatives in Cash Flow Hedging Relationships |
2013 | 2012 | ||||||
| Amount of gain (loss) recognized in accumulated other comprehensive income on interest rate derivatives (effective portion) |
$ | 6,946 | $ | (4,684 | ) | |||
|
|
|
|
|
|||||
| Amount of loss reclassified from accumulated other comprehensive income into income as interest expense (effective portion) |
$ | (4,535 | ) | $ | (941 | ) | ||
|
|
|
|
|
|||||
| Amount of loss recognized in income on derivative (ineffective portion, reclassifications of missed forecasted transactions and amounts excluded from effectiveness testing) |
$ | (79 | ) | $ | (1 | ) | ||
|
|
|
|
|
|||||
F-47
Table of Contents
ARC PROPERTIES OPERATING PARTNERSHIP, L.P.
NOTES TO CONSOLIDATED FINANCIAL STATEMENTS — (Continued)
December 31, 2013
Derivatives Not Designated as Hedging Instruments
Derivatives not designated as hedges are not speculative and are used to manage the Operating Partnership’s exposure to interest rate movements and other identified risks but do not meet the strict hedge accounting requirements to be classified as hedging instruments. Changes in the fair value of derivatives not designated in hedging relationships are recorded directly in earnings and were approximately $19,000 for the year ended December 31, 2013. The Operating Partnership did not have any derivatives that were not designated as of December 31, 2012.
As of December 31, 2013, the Operating Partnership had the following outstanding interest rate derivatives that were not designated as hedges of in qualifying hedging relationships:
| Interest Rate Derivative |
Number of Instruments |
Notional Amount | ||||||
| Interest Rate Cap |
1 | $ | 500,000 | |||||
The table below presents the fair value of the Operating Partnership’s derivate financial instruments not designated as hedges as well as their classification as liabilities on the consolidated balance sheets as of December 31, 2013 and 2012. There were no derivatives classified as not hedging instruments as assets as of December 31, 2013 and 2012:
| Year Ended December 31, | ||||||||||
| Derivatives Not Designated as Hedging Instruments |
Balance Sheet Location |
2013 | 2012 | |||||||
| Series D Preferred Units embedded derivative |
Derivative liabilities, at fair value | $ | (16,736 | ) | $ | — | ||||
Tabular Disclosure Offsetting Derivatives
The table below presents a gross presentation, the effects of offsetting, and a net presentation of the Operating Partnership’s derivatives as of December 31, 2013 and 2012. The net amounts of derivative assets or liabilities can be reconciled to the tabular disclosure of fair value. The tabular disclosure of fair value provides the location that derivative assets and liabilities are presented on the consolidated balance sheets.
| Offsetting of Derivative Assets and Liabilities |
||||||||||||||||||||||||||||||||
| Gross Amounts of Recognized Assets |
Gross Amounts of Recognized Liabilities |
Gross Amounts Offset in the Consolidated Balance Sheets |
Net Amounts of Assets Presented in the Consolidated Balance Sheets |
Net Amounts of Liabilities Presented in the Consolidated Balance Sheets |
Financial Instruments |
Cash Collateral Received |
Net Amount | |||||||||||||||||||||||||
| December 31, 2013 |
$ | 9,189 | $ | (18,455 | ) | $ | — | $ | 9,189 | $ | (18,455 | ) | $ | — | $ | — | $ | (9,266 | ) | |||||||||||||
| December 31, 2012 |
$ | — | $ | (3,830 | ) | $ | — | $ | — | $ | (3,830 | ) | $ | — | $ | — | $ | (3,830 | ) | |||||||||||||
Credit-risk-related Contingent Features
The Operating Partnership has agreements with each of its derivative counterparties that contain a provision where if the Operating Partnership either defaults or is capable of being declared in default on any of its indebtedness, then the Operating Partnership could also be declared in default on its derivative obligations.
F-48
Table of Contents
ARC PROPERTIES OPERATING PARTNERSHIP, L.P.
NOTES TO CONSOLIDATED FINANCIAL STATEMENTS — (Continued)
December 31, 2013
As of December 31, 2013, the fair value of the interest rate derivatives in a net liability position, including accrued interest but excluding any adjustment for nonperformance risk related to these agreements, was $1.7 million. As of December 31, 2013, the Operating Partnership has not posted any collateral related to these agreements and was not in breach of any agreement provisions. If the Operating Partnership had breached any of these provisions, it could have been required to settle its obligations under the agreements at their aggregate termination value of $1.7 million at December 31, 2013.
Note 15 — Commitments and Contingencies
Contractual Lease Obligations
The following table reflects the minimum base rental cash payments due from the Operating Partnership over the next five years and thereafter for certain ground and office lease obligations (amounts in thousands):
| Future Minimum Lease Payments |
||||
| 2014 |
$ | 4,541 | ||
| 2015 |
4,443 | |||
| 2016 |
4,214 | |||
| 2017 |
4,244 | |||
| 2018 |
3,212 | |||
| Thereafter |
63,787 | |||
|
|
|
|||
| $ | 84,441 | |||
|
|
|
|||
Litigation
In the ordinary course of business, the Operating Partnership may become subject to litigation or claims. There are no material legal proceedings pending or known to be contemplated against the Operating Partnership, except as follows:
ARCT III Litigation Matters
After the announcement of the ARCT III Merger Agreement on December 17, 2012, Randell Quaal filed a putative class action lawsuit filed on January 30, 2013 against the General Partner, the Operating Partnership, ARCT III, ARCT III OP, the members of the board of directors of ARCT III and certain subsidiaries of the General Partner in the Supreme Court of the State of New York. The plaintiff alleges, among other things, that the board of ARCT III breached its fiduciary duties in connection with the transactions contemplated under the ARCT III Merger Agreement. In February 2013, the parties agreed to a memorandum of understanding regarding settlement of all claims asserted on behalf of the alleged class of ARCT III stockholders. In connection with the settlement contemplated by that memorandum of understanding, the class action and all claims asserted therein will be dismissed, subject to court approval. The proposed settlement terms required ARCT III to make certain additional disclosures related to the ARCT III Merger, which were included in a Current Report on Form 8-K filed by ARCT III with the SEC on February 21, 2013. The memorandum of understanding also added that the parties will enter into a stipulation of settlement, which will be subject to customary conditions, including confirmatory discovery and court approval following notice to ARCT III’s stockholders. If the parties enter into a stipulation of settlement, a hearing will be scheduled at which the court will consider the fairness, reasonableness and adequacy of the settlement. There can be no assurance that the parties will ultimately enter into a stipulation of settlement, that the court will approve any proposed settlement, or that any eventual settlement will be under the same terms as those contemplated by the memorandum of understanding, therefore any losses that may be incurred to settle this matter are not determinable.
F-49
Table of Contents
ARC PROPERTIES OPERATING PARTNERSHIP, L.P.
NOTES TO CONSOLIDATED FINANCIAL STATEMENTS — (Continued)
December 31, 2013
CapLease Litigation Matters
Since the announcement of the CapLease Merger Agreement on May 28, 2013, the following lawsuits have been filed:
On May 28, 2013, Jacquelyn Mizani filed a putative class action lawsuit in the Supreme Court for the State of New York against the General Partner, the Operating Partnership, Safari Acquisition LLC, CapLease, CapLease LP, CLF OP General Partner, LLC and the members of the CapLease board of directors (the “Mizani Action”). The complaint alleges, among other things, that the merger agreement at issue was the product of breaches of fiduciary duty by the CapLease directors because the proposed merger transaction (the “CapLease Transaction”) purportedly does not provide for full and fair value for the CapLease shareholders, the CapLease Transaction allegedly was not the result of a competitive bidding process, the merger agreement allegedly contains coercive deal protection measures and the merger agreement and the CapLease Transaction purportedly were approved as a result of improper self-dealing by certain defendants who would receive certain alleged employment compensation benefits and continued employment pursuant to the merger agreement. The complaint also alleges that CapLease, the General Partner, the Operating Partnership and Safari Acquisition LLC aided and abetted the CapLease directors’ alleged breaches of fiduciary duty.
On July 3, 2013, Fred Carach filed a putative class action and derivative lawsuit in the Supreme Court for the State of New York against the General Partner, the Operating Partnership, Safari Acquisition LLC, CapLease, CapLease LP, CLF OP General Partner, LLC and the members of the CapLease board of directors (the “Carach Action”). The complaint alleges, among other things, that the merger agreement was the product of breaches of fiduciary duty by the CapLease directors because the merger purportedly does not provide for full and fair value for the CapLease shareholders, the CapLease Transaction allegedly was not the result of a competitive bidding process, the merger agreement allegedly contains coercive deal protection measures and the merger agreement and the CapLease Transaction purportedly were approved as a result of improper self-dealing by certain defendants who would receive certain alleged employment compensation benefits and continued employment pursuant to the merger agreement. The complaint also alleges that with respect to the Registration Statement and draft joint proxy statement issued in connection with the proposed CapLease Transaction on July 2, 2013, that disclosures made therein were insufficient or otherwise improper. The complaint also alleges that CapLease, the General Partner, the Operating Partnership and Safari Acquisition LLC aided and abetted the CapLease directors’ alleged breaches of fiduciary duty.
On June 25, 2013, Dewey Tarver filed a putative class action and derivative lawsuit in the Circuit Court for Baltimore City against the General Partner, the Operating Partnership, Safari Acquisition LLC, CapLease, CapLease LP, CLF OP General Partner, LLC and the members of the CapLease board of directors (the “Tarver Action”). The complaint alleges, among other things, that the merger agreement was the product of breaches of fiduciary duty by the CapLease directors because the CapLease Transaction purportedly does not provide for full and fair value for the CapLease shareholders, the CapLease Transaction allegedly was not the result of a competitive bidding process, the merger agreement allegedly contains coercive deal protection measures and the merger agreement and the CapLease Transaction purportedly were approved as a result of improper self-dealing by certain defendants who would receive certain alleged employment compensation benefits and continued employment pursuant to the merger agreement. The complaint also alleges that CapLease, CapLease LP, CLF OP General Partner, LLC, the General Partner, the Operating Partnership and Safari Acquisition, LLC aided and abetted the CapLease directors’ alleged breaches of fiduciary duty.
Counsel who filed each of these three cases reached an agreement with each other as to who will serve as lead plaintiff and lead plaintiffs’ counsel in the cases and where they will be prosecuted. Thus, on August 9, 2013, counsel in the Tarver Action filed a motion for stay in the Baltimore Court, informing the court that they
F-50
Table of Contents
ARC PROPERTIES OPERATING PARTNERSHIP, L.P.
NOTES TO CONSOLIDATED FINANCIAL STATEMENTS — (Continued)
December 31, 2013
had agreed to join and participate in the prosecution of the Mizani and Carach Actions in the New York Court. The Defendants consented to the stay of the Tarver Action in the Baltimore Court, and on September 5, 2013, Judge Pamela J. White issued an order granting that stay. Consequently, there has been no subsequent activity in the Baltimore Court in the Tarver Action. Also on August 9, 2013, all counsel involved in the Mizani and Carach Actions filed a joint stipulation in the New York Court, reflecting agreement among all parties that the Mizani and Carach Actions should be consolidated (jointly, “the Consolidated Actions”) and setting out a schedule for early motion practice in response to the complaints filed (the “Consolidation Stipulation”). Pursuant to the Consolidation Stipulation, an amended complaint was also filed in the New York court on August 9, 2013 and was designated as the operative complaint in the Consolidated Actions (“Operative Complaint”). Pursuant to the Consolidation Stipulation, all Defendants filed a motion to dismiss all claims asserted in the Operative Complaint on September 23, 2013. Plaintiffs’ response was due on or before November 7, 2013. On November 7, 2013, Plaintiffs filed a motion seeking leave to file a second amended complaint, which the Defendants have opposed. On March 24, 2014, Plaintiffs’ counsel in the Consolidated Actions dismissed those claims without prejudice. Consequently, only the Tarver Action currently remains pending among these cases, although it remains stayed.
On October 8, 2013, John Poling filed a putative class action lawsuit in the Circuit Court for Baltimore City against the General Partner, the Operating Partnership, Safari Acquisition LLC, CapLease, CapLease LP, CLF OP General Partner, LLC and the members of the CapLease board of directors (the “Poling Action”). The complaint alleges that the merger agreement breaches the terms of the CapLease’ 8.375% Series B Cumulative Redeemable Preferred Stock (“Series B”) and the terms of the 7.25% Series C Cumulative Redeemable Preferred Stock (“Series C”) and is in violation of the Series B Articles Supplementary and the Series C Articles Supplementary. The Complaint alleges claims for breach of contract and breach of fiduciary duty against the CapLease entities and the CapLease board of directors. The complaint also alleges that the General Partner, the Operating Partnership and Safari Acquisition, LLC aided and abetted CapLease and the CapLease directors’ alleged breach of contract and breach of fiduciary duty.
On November 13, 2013, all counsel involved in the Poling Action filed a joint stipulation, reflecting agreement among all parties concerning a schedule for early motion practice in response to the complaint filed (the “Scheduling Stipulation”). Pursuant to the Scheduling Stipulation, all Defendants filed a motion to dismiss all claims asserted in the Operative Complaint on December 20, 2013. Plaintiff has filed an opposition to that motion, which remains pending.
Cole Litigation Matters
Three putative class action and/or derivative lawsuits, which were filed earlier this year, assert claims for breach of fiduciary duty, abuse of control, corporate waste, unjust enrichment, aiding and abetting breach of fiduciary duty and other claims relating to the merger between a wholly owned subsidiary of Cole and Cole Holdings Corporation, pursuant to which Cole became a self-managed REIT. On October 22, 2013, the Circuit Court for Baltimore City granted all defendants’ motion to dismiss with prejudice the action pending before the court, but the plaintiffs have appealed that dismissal. The other two lawsuits, which also purport to assert shareholder class action claims under the Securities Act of 1933, as amended (the “Securities Act”), are pending in the United States District Court for the District of Arizona. Defendants filed a motion to dismiss both complaints on January 10, 2014. Subsequently, both of those lawsuits have been stayed by the Court pursuant to a joint request made by all parties pending final approval of the consolidated Baltimore Cole Merger Actions described below.
To date, eleven lawsuits have been filed in connection with the Cole Merger. Two of these suits — Wunsch v. Cole, et al (“Wunsch”), No. 13-CV-2186, and Sobon v. Cole, et al (“Sobon”) — were filed as putative class
F-51
Table of Contents
ARC PROPERTIES OPERATING PARTNERSHIP, L.P.
NOTES TO CONSOLIDATED FINANCIAL STATEMENTS — (Continued)
December 31, 2013
actions on October 25, 2013 and November 18, 2013, respectively, in the U.S. District Court for the District of Arizona. Between October 30, 2013 and November 14, 2013, eight other putative stockholder class action or derivative lawsuits were filed in the Circuit Court for Baltimore City, Maryland, captioned as: (i) Operman v. Cole, et al (“Operman”); (ii) Branham v. Cole, et al (“Branham”); (iii) Wilfong v. Cole, et al. (“Wilfong”); (iv) Polage v. Cole, et al. (“Polage”); (v) Corwin v. Cole, et al (“Corwin”); (vi) Green v. Cole, et al (“Green”); (vii) Flynn v. Cole, et al (“Flynn”) and (viii) Morgan v. Cole, et al. (“Morgan”). All of these lawsuits name the General Partner, Cole and Cole’s board of directors as defendants; Wunsch, Sobon, Branham, Wilfong, Flynn, Green, Morgan and Polage also name CREInvestments, LLC, a Maryland limited liability company and a wholly owned subsidiary of the Cole, as a defendant. All of the named plaintiffs claim to be Cole stockholders and purport to represent all holders of Cole’s stock. Each complaint generally alleges that the individual defendants breached fiduciary duties owed to plaintiff and the other public stockholders of Cole in connection with the Cole Merger, and that certain entity defendants aided and abetted those breaches. The breach of fiduciary duty claims asserted include claims that the Cole Merger does not provide for full and fair value for the Cole shareholders, that the Cole Merger was the product of an “inadequate sale process,” that the Cole Merger Agreement contains coercive deal protection measures and the Cole Merger Agreement and that the Cole Merger were approved as a result of or in a manner which facilitates improper self-dealing by certain defendants. In addition, the Flynn, Corwin, Green, Wilfong, Polage and Branham lawsuits claim that the individual defendants breached their duty of candor to shareholders and the Branham and Polage lawsuits assert claims derivatively against the individual defendants for their alleged breach of fiduciary duties owed to Cole. The Polage lawsuit also asserts derivative claims for waste of corporate assets and unjust enrichment. The Wunsch and Sobon lawsuits also assert claims against Cole and the individual defendants under Section 14(a) of the Securities Exchange Act of 1934, as amended (the “Exchange Act”), based on allegations that the proxy materials omitted to disclose allegedly material information, and a claim against the individual defendants under Section 20(a) of the Exchange Act based on the same allegations. Among other remedies, the complaints seek unspecified money damages, costs and attorneys’ fees.
In January 2014, the parties to the eight lawsuits filed in the Circuit Court for Baltimore City, Maryland (the “consolidated Baltimore Cole Merger Actions”) entered into a memorandum of understanding regarding settlement of all claims asserted on behalf of the alleged class of Cole stockholders. In connection with the settlement contemplated by that memorandum of understanding, the class action and all claims asserted therein will be dismissed, subject to court approval. The proposed settlement terms required Cole to make certain additional disclosures related to the Cole Merger, which were included in a Current Report on Form 8-K filed by Cole with the SEC on January 14, 2014. The memorandum of understanding also contemplated that the parties will enter into a stipulation of settlement, which will be subject to customary conditions, including confirmatory discovery and court approval following notice to Cole’s stockholders. If the parties enter into a stipulation of settlement, a hearing will be scheduled at which the court will consider the fairness, reasonableness and adequacy of the settlement. There can be no assurance that the parties will ultimately enter into a stipulation of settlement, that the court will approve any proposed settlement, or that any eventual settlement will be under the same terms as those contemplated by the memorandum of understanding, therefore any losses that may be incurred to settle this matter are not determinable.
The Sobon lawsuit was voluntarily dismissed on February 3, 2014. The General Partner believes that the Wunsch lawsuit in connection with the Cole Merger is without merit and that it has substantial meritorious defenses to the claims set forth in the complaint.
On December 27, 2013, Realistic Partners filed a putative class action lawsuit against the General Partner and the members of its board of directors in the Supreme Court for the State of New York. Cole was later added as a defendant also. The plaintiff alleges, among other things, that the board of the General Partner breached its
F-52
Table of Contents
ARC PROPERTIES OPERATING PARTNERSHIP, L.P.
NOTES TO CONSOLIDATED FINANCIAL STATEMENTS — (Continued)
December 31, 2013
fiduciary duties in connection with the transactions contemplated under the Cole Merger Agreement and that Cole aided and abetted those breaches. In January 2014, the parties entered into a memorandum of understanding regarding settlement of all claims asserted on behalf of the alleged class of the General Partner’s stockholders. In connection with the settlement contemplated by that memorandum of understanding, the class action and all claims asserted therein will be dismissed, subject to court approval. The proposed settlement terms required the General Partner to make certain additional disclosures related to the Cole Merger, which were included in a Current Report on Form 8-K filed by the General Partner with the SEC on January 17, 2014. The memorandum of understanding also contemplated that the parties will enter into a stipulation of settlement, which will be subject to customary conditions, including confirmatory discovery and court approval following notice to the General Partner’s stockholders. If the parties enter into a stipulation of settlement, a hearing will be scheduled at which the court will consider the fairness, reasonableness and adequacy of the settlement. There can be no assurance that the parties will ultimately enter into a stipulation of settlement, that the court will approve any proposed settlement, or that any eventual settlement will be under the same terms as those contemplated by the memorandum of understanding, therefore any losses that may be incurred to settle this matter are not determinable.
The General Partner maintains directors and officers liability insurance, which the General Partner believes should provide coverage to the General Partner and its officers and directors for most or all of any costs, settlements or judgments resulting from the lawsuits.
Environmental Matters
In connection with the ownership and operation of real estate, the Operating Partnership may potentially be liable for costs and damages related to environmental matters. The Operating Partnership has not been notified by any governmental authority of any non-compliance, liability or other claim, and is not aware of any other environmental condition, in each case, that it believes will have a material adverse effect on the results of operations.
Note 16 — Preferred and Common OP Units
Series A and Series B Convertible Preferred Units
During the year ended December 31, 2013, the General Partner converted all 545,454 shares of Series A Convertible Preferred Stock and all 283,018 shares of Series B Convertible Preferred Stock into 829,629 shares of ARCP common stock, which included dividends on the Series A Convertible Preferred Stock. Concurrently, the Operating Partnership converted all 545,454 Series A Convertible Preferred Units and all 283,018 Series B Convertible Preferred Units into 829,629 General Partner OP Units.
Series D and Series E Preferred Units
On September 16, 2013, the General Partner’s board of directors unanimously approved the issuance of Series D Cumulative Convertible Preferred Stock (“Series D Preferred Stock”) and the issuance of Series E Cumulative Preferred Stock (“Series E Preferred Stock”). Concurrently, the Operating Partnership was approved to issue to the General Partner Series D Cumulative Convertible Preferred Units (“Series D Preferred Units”) and Series E Cumulative Preferred Units (“Series E Preferred Units”), if applicable.
On September 15, 2013, the General Partner entered into definitive purchase agreements to issue Series D Preferred Stock and common stock, necessitating that the Operating Partnership concurrently issue to the General
F-53
Table of Contents
ARC PROPERTIES OPERATING PARTNERSHIP, L.P.
NOTES TO CONSOLIDATED FINANCIAL STATEMENTS — (Continued)
December 31, 2013
Partner Series D Preferred Units and General Partner OP Units, promptly following the close of the CapLease Merger. Pursuant to the definitive purchase agreements, the General Partner issued approximately 21.7 million Series D Preferred Stock and 15.1 million shares of ARCP common stock, for proceeds of $288.0 million and $186.0 million, respectively, on November 8, 2013. The Operating Partnership concurrently issued 21.7 million Series D Preferred Units and 15.1 million General Partner OP Units to the General Partner. The Series D Preferred Stock and Series D Preferred Units pay dividends at the rate of 5.81% per annum on its face amount of $13.59 per share (equivalent to $0.79 per share on an annualized basis). The Series D Preferred Stock is redeemable on August 31, 2014 (the “Redemption Date”). If redeemed, corresponding Series D Preferred Units will be redeemed. Subsequent to that date, or in certain other circumstances, the Series D Preferred Stock is convertible into ARCP common stock or Series E Preferred Stock or redeemable into cash, at the discretion of the General Partner upon such request for conversion of the Series D Preferred Stock.
In the event of a liquidation, the Series D Preferred Stock holder is entitled to receive the greater of (a) $13.59 per share plus accrued and unpaid dividends (the "Liquidation Preference") plus a 20% premium and (b) an amount the Series D Preferred Stock holder would have received had they converted into ARCP common stock immediately prior to the liquidation event.
If the General Partner elects to redeem on the Redemption Date, the General Partner shall pay the greater of (a) the product of the number of Series D Preferred Stock and the 102% of the Liquidation Preference and (b) product of the number of ARCP common stock that would be issued if the Series D Preferred Stock converted immediately prior to the Redemption Date and 102% of the one-day VWAP.
At any time after the Redemption Date, the holder of Series D Preferred Stock may convert some or all of their outstanding Series D Preferred Stock into ARCP common stock. Upon such an election to convert, the General Partner may elect the following settlement options (1) convert the Series D Preferred Stock into the number of fully paid and non-assessable ARCP common stock obtained by dividing the aggregate Liquidation Preference of such Series D Preferred Stock by the Conversion Price, as defined below, (2) convert the Series D Preferred Stock into an equal number of Series E Preferred Stock, additional units of Series E Preferred Stock may be issued under certain circumstances, or (3) an amount equal to the product of the number of shares of Series D Preferred Stock and the Cash Conversion Price, as defined below.
The Conversion Price shall be the lowest of (i) a 2% discount to the VWAP of ARCP’s common stock for the 10 Trading Days prior to the Conversion Election Date, (ii) a 2% discount to the closing price on the Conversion Election Date, and (iii) $13.59. The Cash Conversion Price shall be the greater of (i) 102% of the Liquidation Preference and (ii) the one day VWAP of ARCP’s common stock on the date of the election.
The General Partner has concluded that the conversion option qualifies as a derivative and should be bifurcated from the host instrument. At issuance, the conversion option had a fair value of $18.7 million. As of December 31, 2013, the fair value of the conversion option had a fair value of $16.7 million. The Operating Partnership recorded the change in fair value of $2.0 million in gain (loss) on derivative instruments in the consolidated statements of operations and comprehensive loss for the year ended December 31, 2013.
As the holder of Series D Preferred Stock is entitled to receive liquidation preferences that other equity holders are not entitled to, the General Partner determined the Series D Preferred Stock meets the definition of a deemed liquidation event and therefore should be classified as temporary equity under U.S. GAAP. At the date of issuance, the fair value of the Series D Preferred stock was $269.3 million. As of December 31, 2013, the General Partner has determined that a liquidation event is not probable; therefore, the General Partner has concluded that the Series D Preferred Units are not currently redeemable or likely to become redeemable. As such, the Operating Partnership has not accreted the initial value of the Series D Preferred Units.
F-54
Table of Contents
ARC PROPERTIES OPERATING PARTNERSHIP, L.P.
NOTES TO CONSOLIDATED FINANCIAL STATEMENTS — (Continued)
December 31, 2013
As of December 31, 2013, there were 21,735,008 units of Series D Preferred Units issued and no units of Series E Preferred Units issued.
Series F Preferred Units
On October 6, 2013, in connection with the modification to the ARCT IV Merger, the General Partner’s board of directors unanimously approved the issuance of Series F Preferred Stock. Upon consummation of the ARCT IV Merger on January 3, 2014, 42.2 million shares of Series F Preferred Stock were issued to ARCT IV shareholders, resulting in the Operating Partnership concurrently issued 42.2 million General Partner Series F Preferred Units to the General Partner, and 0.7 million Limited Partner Series F Preferred Units were issued to the ARCT IV OP Unit holders. To comply with the carryover basis of accounting required in relation to an acquisition of an entity under common control, the financial statements reflect the ARCT IV Merger as if it occurred at the beginning of the periods presented. As such, the accompanying consolidated balance sheet depicts that 42.2 million and 7.0 million Series F Preferred Units were outstanding as of December 31, 2013 and 2012, respectively.
The Series F Preferred Units contain the same terms as the Series F Preferred Stock. Therefore, the Series F Preferred Units will pay cumulative cash dividends at the rate of 6.70% per annum on its liquidation preference of $25.00 per unit (equivalent to $1.675 per unit on an annual basis). The Series F Preferred Units will not be redeemable by the Operating Partnership before the fifth anniversary of the date on which such Series F Preferred Units were issued (the “Initial Redemption Date”), except under circumstances intended to preserve the General Partner’s status as a real estate investment trust for federal and/or state income tax purposes and except upon the occurrence of a change of control. On and after the Initial Redemption Date, the Operating Partnership may redeem units of the Series F Preferred Units, in whole or from time to time in part, at a redemption price of $25.00 per unit plus, subject to exceptions, any accrued and unpaid dividends thereon to the date fixed for redemption. The Series F Preferred Units have no stated maturity, are not subject to any sinking fund or mandatory redemption and will remain outstanding indefinitely unless the Operating Partnership redeems or otherwise repurchases them or they become convertible and are converted into General Partner OP Units (or, if applicable, alternative consideration).
Offerings
On August 1, 2012, the General Partner filed a $500.0 million universal shelf registration statement and a resale registration statement with the SEC. Both registration statements became effective on August 17, 2012. As of December 31, 2013, the General Partner had issued a total of approximately 2.1 million shares of ARCP common stock under the universal shelf registration statement. Concurrently, the Operating Partnership issued 2.1 million General OP Units to the General Partner. The resale registration statement, as amended, registers the resale of up to 1,882,248 shares of ARCP’s common stock issued in connection with any future conversion of certain currently outstanding restricted shares, convertible preferred stock or Limited Partner OP Units.
In January 2013, the General Partner commenced its “at the market” equity offering program (“ATM”) in which it may from time to time offer and sell shares of its common stock having an aggregate offering proceeds of up to $60.0 million. The shares will be issued pursuant to the General Partner’s universal shelf registration statement. For each share of common stock the General Partner sells under the ATM, the Operating Partnership will issue a corresponding number of General Partner OP Units to the General Partner.
On March 13, 2013, the General Partner filed a universal automatic shelf registration statement that was automatically declared effective and achieved well-known seasoned issuer ("WKSI") status. The General Partner intends to maintain both the universal shelf registration statement and the WKSI universal automatic shelf registration statement.
F-55
Table of Contents
ARC PROPERTIES OPERATING PARTNERSHIP, L.P.
NOTES TO CONSOLIDATED FINANCIAL STATEMENTS — (Continued)
December 31, 2013
The following are ARCP’s equity offerings of common stock and gross proceeds of the equity offering for the years ended December 31, 2013, 2012 and 2011 (dollar amounts in millions):
| Type of offering |
Closing Date |
Number of ARCP Common Shares (1) |
Gross Proceeds |
|||||||
| IPO |
September 7, 2011 | 5,574,131 | $ | 67.4 | ||||||
| Follow-on offering |
November 2, 2011 | 1,497,924 | 15.8 | |||||||
| Underwriters’ over allotment |
November 7, 2011 | 74,979 | 0.8 | |||||||
|
|
|
|
|
|||||||
| Total — Year end December 31, 2011 (2) |
7,147,034 | 84.0 | ||||||||
|
|
|
|
|
|||||||
| Follow-on offering |
June 18, 2012 | 3,250,000 | 30.3 | |||||||
| Underwriters’ over allotment |
July 9, 2012 | 487,500 | 4.6 | |||||||
|
|
|
|
|
|||||||
| Total — Year end December 31, 2012 (3) |
3,737,500 | 34.9 | ||||||||
|
|
|
|
|
|||||||
| Registered follow-on offering |
January 29, 2013 | 2,070,000 | 26.7 | |||||||
| ATM |
January 1 — September 30, 2013 | 553,300 | 8.9 | |||||||
| Private placement offering |
June 7, 2013 | 29,411,764 | 455.0 | |||||||
| Private placement offering |
November 11, 2013 | 15,126,498 | 186.0 | |||||||
|
|
|
|
|
|||||||
| Total — Year end December 31, 2013 (4) |
47,161,562 | $ | 676.6 | |||||||
|
|
|
|
|
|||||||
| (1) | Excludes 140.7 million shares of common stock that were issued to the stockholders of ARCT III’s common stock in conjunction with the ARCT III Merger and any shares issued upon the conversion of OP Units or preferred stock. |
| (2) | Excludes 9.8 million shares of common stock that were issued by ARCT III for gross proceeds of $102.2 million. |
| (3) | Excludes 155.7 million and 5.4 million shares of common stock that were issued by ARCT III and ARCT IV, respectively, for gross proceeds of $1.6 billion and $255.0 million, respectively. |
| (4) | Excludes 31.0 million shares of common shares that were issued by ARCT IV for gross proceeds of $1.5 billion. |
For each common share the General Partner issued, the Operating Partnership issued a corresponding General Partner OP Unit to the General Partner in exchange for the contribution of the net proceeds from the stock issuance. The gross proceeds summarized above were contributed to the Operating Partnership net of offering costs of $165.4 million, $218.4 million and $21.8 million for the years ended December 31, 2013, 2012 and 2011, respectively.
On May 28, 2014, the General Partner closed on an underwriting agreement relating to a public offering of 138.0 million shares of ARCP common stock, par value $0.01 per share. The offering price to public was $12.00 per share. The net proceeds to ARCP were approximately $1.59 billion after deducting underwriting discounts and commissions, but excluding expenses which include a $2.0 million structuring fee paid to RCS.
F-56
Table of Contents
ARC PROPERTIES OPERATING PARTNERSHIP, L.P.
NOTES TO CONSOLIDATED FINANCIAL STATEMENTS — (Continued)
December 31, 2013
Dividends
In October 2011, in connection with the same action by ARCP, the Operating Partnership began paying dividends on the fifteenth day of each month to unitholders of record on the eighth day of such month. Since inception, the board of directors of the General Partner has authorized the following increases in ARCP’s dividend which, accordingly, was implemented by the Operating Partnership.
| Dividend increase declaration date |
Annualized dividend per share |
Effective date | ||||
| September 7, 2011 |
$ | 0.875 | October 9, 2011 | |||
| February 27, 2012 |
$ | 0.880 | March 9, 2012 | |||
| March 16, 2012 |
$ | 0.885 | June 9, 2012 | |||
| June 27, 2012 |
$ | 0.890 | September 9, 2012 | |||
| September 30, 2012 |
$ | 0.895 | November 9, 2012 | |||
| November 29, 2012 |
$ | 0.900 | February 9, 2013 | |||
| March 17, 2013 |
$ | 0.910 | June 8, 2013 | |||
| May 28, 2013 |
$ | 0.940 | December 8, 2013 * | |||
| October 23, 2013 |
$ | 1.000 | February 10, 2014 ** | |||
| * | The dividend increase became effective at the close of the CapLease Merger, which was consummated on November 5, 2013. |
| ** | The dividend increase was contingent upon, and became effective with, the close of the Cole Merger, which was consummated on February 7, 2014. |
The annualized dividend rate at December 31, 2013 was $0.940 per share.
Note 17 — Equity Based Compensation
Equity Plan
The General Partner has adopted the American Realty Capital Properties, Inc. Equity Plan (the “Equity Plan”), which provides for the grant of stock options, restricted shares of common stock, restricted stock units, dividend equivalent rights and other equity-based awards to the General Partner’s and its affiliates’ non-executive directors, officers and other employees and advisors and consultants who are providing services to the General Partner or its affiliates. For each share awarded under the Equity Plan, the Operating Partnership issues a General Partner OP Unit to the General Partner with similar terms.
The General Partner authorized and reserved a total number of shares equal to 10.0% of the total number of issued and outstanding shares of its common stock (on a fully diluted basis assuming the redemption of all Limited Partner OP Units for shares of common stock) to be issued at any time under the Equity Plan for equity incentive awards excluding an initial grant of 167,400 shares to its Former Manager in connection with the IPO, all of which were vested as of December 31, 2013.
Director Stock Plan
The General Partner has adopted the American Realty Capital Properties, Inc. Non-Executive Director Stock Plan (the “Director Stock Plan”), which provides for the grant of restricted shares of common stock to each of the General Partner’s independent directors, each of whom is a non-executive director. For each share awarded under the Director Stock Plan, the Operating Partnership issues a General Partner OP Unit to the General Partner with identical terms. Awards of restricted stock will vest ratably over a five-year period following the date of grant in
F-57
Table of Contents
ARC PROPERTIES OPERATING PARTNERSHIP, L.P.
NOTES TO CONSOLIDATED FINANCIAL STATEMENTS — (Continued)
December 31, 2013
increments of 20.0% per annum, subject to the director’s continued service on the board of directors, and shall provide for “distribution equivalents” with respect to this restricted stock, whether or not vested, at the same time and in the same amounts as distributions are paid to the stockholders. At December 31, 2013, a total of 99,000 shares of ARCP common stock are reserved for issuance under the Director Stock Plan.
The fair value of restricted common stock awards, as well as the underlying General Partner OP Units, issued under the Equity Plan and Director Stock Plan is determined on the grant date using the closing stock price on NASDAQ that day. The fair value of restricted common stock awarded to the non-employees under the Equity Plan, as well as the underlying General Partner OP Units issued in respect thereof, are remeasured at the end of each quarter based on the current quarter end closing stock price through the final vesting date.
ARCT III Restricted Share Plan
ARCT III had an employee and director incentive restricted share plan (the “ARCT III RSP”) which provided for the automatic grant of 3,000 restricted shares of common stock to each of its independent directors, without any further action by ARCT III’s board of directors or its stockholders, on the date of initial election to the board of directors and on the date of each annual stockholder’s meeting thereafter. Restricted stock issued to independent directors vested over a five-year period following the date of grant in increments of 20.0% per annum. The ARCT III RSP provided ARCT III with the ability to grant awards of restricted shares to its directors, officers and employees (if ARCT III ever had employees), employees of ARCT III’s advisor and its affiliates, employees of entities that provided services to ARCT III, directors of the ARCT III Advisor or of entities that provided services to ARCT III, certain consultants to ARCT III and the ARCT III Advisor and its affiliates or to entities that provided services to ARCT III. For each share awarded under the ARCT III RSP, the Operating Partnership issued a General Partner OP Unit to the General Partner with similar terms.
Immediately prior to the effective time of the ARCT III Merger, each then-outstanding share of ARCT III restricted stock fully vested. All shares of ARCT III common stock then-outstanding as a result of the full vesting of shares of ARCT III restricted stock, and the satisfaction of any applicable withholding taxes, had the right to receive a number of shares of the ARCP’s common stock based on the ARCT III Exchange Ratio.
The following table details the General Partner OP Units granted in respect of the restricted share awards under the Equity Plan, Director Stock Plan and ARCT III RSP during the years ended December 31, 2013, 2012 and 2011:
| General Partner OP Units | Equity Plan | ARCT III RSP & Director Stock Plan | ||||||||||||||
| Number of General Partner OP Units |
Weighted-Average Issue Price |
Number of General Partner OP Units |
Weighted-Average Issue Price |
|||||||||||||
| Awarded, January 1, 2011 |
— | $ | — | — | $ | — | ||||||||||
| Granted |
167,400 | 12.50 | 14,700 | 11.50 | ||||||||||||
|
|
|
|
|
|
|
|
|
|||||||||
| Awarded December 31, 2011 |
167,400 | 12.50 | 14,700 | 11.50 | ||||||||||||
| Granted |
93,683 | 10.65 | 23,250 | 10.45 | ||||||||||||
| Forfeited |
(1,174 | ) | 10.65 | (7,650 | ) | 11.54 | ||||||||||
|
|
|
|
|
|
|
|
|
|||||||||
| Awarded December 31, 2012 |
259,909 | 11.84 | 30,300 | 10.68 | ||||||||||||
| Granted |
932,527 | 13.82 | 18,000 | 14.58 | ||||||||||||
| Forfeited |
(1,085 | ) | 12.85 | — | — | |||||||||||
|
|
|
|
|
|
|
|
|
|||||||||
| Awarded December 31, 2013 |
1,191,351 | $ | 13.39 | 48,300 | $ | 12.13 | ||||||||||
|
|
|
|
|
|
|
|
|
|||||||||
F-58
Table of Contents
ARC PROPERTIES OPERATING PARTNERSHIP, L.P.
NOTES TO CONSOLIDATED FINANCIAL STATEMENTS — (Continued)
December 31, 2013
The following table details the status of unvested General Partner OP Units granted in respect of the restricted share awards under the Equity Plan, Director Stock Plan and ARCT III RSP during the years ended December 31, 2013, 2012 and 2011:
| Unvested General Partner OP Unit | Equity Plan | ARCT III RSP & Director Stock Plan | ||||||||||||||
| Number of General Partner OP Units |
Weighted-Average Issue Price |
Number of General Partner OP Units |
Weighted-Average Issue Price |
|||||||||||||
| Unvested, January 1, 2011 |
— | $ | — | — | $ | — | ||||||||||
| Granted |
167,400 | 12.50 | 14,700 | 11.50 | ||||||||||||
| Vested |
(13,950 | ) | 12.50 | — | — | |||||||||||
|
|
|
|
|
|
|
|
|
|||||||||
| Unvested, December 31, 2011 |
153,450 | 12.50 | 14,700 | 11.50 | ||||||||||||
| Granted |
93,683 | 10.65 | 23,250 | 10.45 | ||||||||||||
| Vested |
(59,556 | ) | 12.42 | (2,370 | ) | 11.88 | ||||||||||
| Forfeited |
(1,174 | ) | 10.65 | (7,650 | ) | 11.54 | ||||||||||
|
|
|
|
|
|
|
|
|
|||||||||
| Unvested, December 31, 2012 |
186,403 | 11.62 | 27,930 | 10.58 | ||||||||||||
| Granted |
932,527 | 13.82 | 18,000 | 14.58 | ||||||||||||
| Vested |
(186,403 | ) | 11.62 | (30,930 | ) | 11.03 | ||||||||||
| Forfeited |
(1,085 | ) | 12.85 | — | — | |||||||||||
|
|
|
|
|
|
|
|
|
|||||||||
| Unvested, December 31, 2013 |
931,442 | $ | 13.82 | 15,000 | $ | 14.45 | ||||||||||
|
|
|
|
|
|
|
|
|
|||||||||
For the years ended December 31, 2013, 2012 and 2011, compensation expense for restricted shares under the above plans was $2.0 million, $1.2 million and $0.2 million, respectively. For the year ended December 31, 2013, merger and other transaction related costs includes compensation expense of $2.7 million due to the Operating Partnership’s pending Cole Merger, compensation expense of $2.2 million for the accelerated vesting of restricted shares in conjunction with the ARCT III Merger and compensation expense of $0.7 million from the issuance of 52.5 thousand fully vested shares to certain employees of the Operating Partnership’s Former Manager. In addition, the Operating Partnership recognized $2.7 million as a distribution to its Former Manager, which is included in consideration to Former Manager for internalization in the accompanying consolidated statements of changes in equity.
ARCT IV Restricted Share Plan
ARCT IV had an employee and director incentive restricted share plan (the “ARCT IV RSP”) which provided for the automatic grant of 1,333 restricted shares of common stock to each of its independent directors without any further action by ARCT IV’s board of directors or its stockholders on the date of initial election to the board of directors and on the date of each annual stockholder’s meeting thereafter. Restricted stock issued to independent directors vested over a five-year period following the date of grant in increments of 20% per annum. ARCT IV issued 5,333 and 2,667 restricted shares under the ARCT IV RSP during the year ended December 31, 2013 and 2012, respectively. All restricted shares issued under the ARCT IV RSP had an issue price of $22.50. The ARCT IV RSP provided ARCT IV with the ability to grant awards of restricted shares to its directors, officers and employees, employees of the ARCT IV Advisor and its affiliates, employees of entities that provided services to ARCT IV, directors of the ARCT IV Advisor or of entities that provided services to ARCT IV, certain consultants to ARCT IV and the ARCT IV Advisor and its affiliates or to entities that provided services to ARCT IV. For each share awarded under the ARCT IV RSP, the Operating Partnership issued a General Partner OP Unit to the General Partner with similar terms
F-59
Table of Contents
ARC PROPERTIES OPERATING PARTNERSHIP, L.P.
NOTES TO CONSOLIDATED FINANCIAL STATEMENTS — (Continued)
December 31, 2013
Immediately prior to the effective time of the ARCT IV Merger, each then-outstanding share of ARCT IV restricted stock fully vested. All shares of ARCT IV common stock then-outstanding as a result of the full vesting of shares of ARCT IV restricted stock, and the satisfaction of any applicable withholding taxes, received shares of ARCP’s common stock based on the ARCT IV Exchange Ratio.
Compensation expense related to ARCT IV RSP restricted shares was $0.2 million, of which $0.1 million was included in merger and other transaction related costs due to the accelerated vesting of the restricted shares, and $6,000 for the year ended December 31, 2013 and 2012, respectively.
Multi-Year Performance Plan
Upon consummation of the ARCT III Merger, the General Partner entered into the 2013 Advisor Multi-Year Outperformance Agreement (the “OPP”) with the Former Manager, whereby the Former Manager was able to potentially earn compensation upon the attainment of stockholder value creation targets.
Under the OPP, the Former Manager was granted 8,241,101 long term incentive plan units (“LTIP Units”) of the Operating Partnership, which are earned or forfeited based on the General Partner’s total return to stockholders (including both share price appreciation and common stock distributions) (“Total Return”), for the three-year period consisting of:
| • | Absolute Component: 4% of any excess Total Return attained above an absolute hurdle of 7% for each annual measurement period, non-compounded, 14% for the interim measurement period and 21% for the full performance period; and |
| • | Relative Component: 4% of any excess Total Return attained above the Total Return for the performance period of a peer group comprised of the following companies: EPR Properties; Getty Realty Corporation; Lexington Realty Trust; National Retail Properties, Inc.; and Realty Income Corporation. |
The award was funded (“OPP Pool”) up to a maximum award opportunity equal to 5% of the General Partner’s equity market capitalization at the ARCT III Merger date of $2.1 billion (the “OPP Cap”). Awards under the OPP are dependent on achieving an annual hurdle that commenced December 11, 2012, an interim (two-year) hurdle and then the aforementioned three-year hurdle ending on December 31, 2015, the final valuation date.
In order to further ensure that the interests of the Former Manager are aligned with its investors, the Relative Component is subject to a ratable sliding scale factor as follows:
| • | 100% will be earned if the General Partner attains a median Total Return of at least 6% for each annual measurement period, non-compounded, at least 12% for the interim measurement period and at least 18% for the full performance period; |
| • | 50% will be earned if the General Partner attains a median Total Return of at least 0% for each measurement period; |
| • | 0% will be earned if the General Partner attains a median Total Return of less than 0% for each measurement period; and |
| • | A percentage from 50% to 100% calculated by linear interpolation will be earned if the General Partner’s median Total Return is between 0% and the percentage set for each measurement period. |
F-60
Table of Contents
ARC PROPERTIES OPERATING PARTNERSHIP, L.P.
NOTES TO CONSOLIDATED FINANCIAL STATEMENTS — (Continued)
December 31, 2013
For each year during the performance period, a portion of the OPP Cap equal to a maximum of up to 1.25% of the General Partner’s equity market capitalization of $2.1 billion will be “locked-in” based upon the attainment of the performance hurdles set forth above for each annual measurement period. In addition, a portion of the OPP Cap equal to a maximum of up to 3% of the General Partner’s equity market capitalization will be “locked-in” based upon the attainment of the performance hurdles set forth above for the interim measurement period, which if achieved, will supersede and negate any prior “locked-in” portion based upon annual performance through the first and second valuation dates on December 31, 2013 and 2014, respectively (i.e., a maximum award opportunity equal to a maximum of up to 3% of the General Partner’s equity market capitalization may be “locked-in” through December 31, 2014). Since certain awards under the OPP plan are dependent on the comparison of the General Partner’s current market capitalization to the General Partner’s market capitalization at the inception of plan, the issuance of additional common shares by the General Partner may result in higher awards.
Following the performance period, the Absolute Component and the Relative Component will be calculated separately and then added together to determine the aggregate award earned under the OPP, which in no event may exceed the OPP Cap. The OPP Pool will be used to determine the number of LTIP Units that vest. Any unvested LTIP Units will be immediately forfeited on December 31, 2015. At December 31, 2013, 100% of the OPP Pool has been allocated.
Pursuant to previous authorization of the General Partner’s board of directors, as a result of the termination of the Management Agreement, all 8,241,101 LTIP Units vested upon the consummation of the General Partner’s transition to self-management on January 8, 2014. However, such LTIP Units are earned as of each respective valuation date according to the terms of the OPP and shall be forfeited if not earned through December 31, 2015.
The Former Manager is generally entitled to convert any of the LTIP Units earned on a valuation date into OP Units within 30 days following the date on which the calculations are performed following the applicable valuation date. In addition, the OPP provides for accelerated earning and vesting of LTIP Units and redemption of vested LTIP Units for cash if the Former Manager is terminated or if the General Partner experiences a change in control. The Former Manager is entitled to receive a tax gross-up in the event that any amounts paid to it under the OPP constitute “parachute payments” as defined in Section 280G of the Code.
During the year ended December 31, 2013, the Operating Partnership has recorded expenses of $92.3 million for the OPP, of which $32.9 million and $59.4 million is recorded in restricted equity based compensation and merger and other transaction expense on the consolidated statements of operations and comprehensive loss. As of December 31, 2013, 2.3 million LTIP Units were earned and $32.9 million of the expense was locked-in and has been included in non-controlling interest on the consolidated balance sheets. The remaining $59.4 million is included in accounts payable and accrued expenses.
New Multi-Year Outperformance Plan
On October 21, 2013, the General Partner approved a multi-year outperformance plan (the “New OPP”) to be effective as of the General Partner’s transition to self-management, which occurred on January 8, 2014. Under the New OPP, individual agreements will be entered into between the General Partner and the participants selected by the General Partner’s board of directors (the “Participants”) that set forth the Participant’s participation percentage in the New OPP and the number of LTIP Units subject to the award (“OPP Agreements”). Under the OPP Agreements, the Participants will be eligible to earn performance-based bonus awards equal to the Participant’s participation percentage of a pool that will be funded up to a maximum award opportunity (the “New OPP Cap”) of $222.1 million, which is equal to approximately 5% of the General
F-61
Table of Contents
ARC PROPERTIES OPERATING PARTNERSHIP, L.P.
NOTES TO CONSOLIDATED FINANCIAL STATEMENTS — (Continued)
December 31, 2013
Partner’s equity market capitalization (the “Initial Market Cap”). Subject to the New OPP Cap, the pool will equal an amount to be determined based on the General Partner’s achievement of total return to its stockholders, including both share price appreciation and common stock distributions (“Total Return”), for a three-year performance period (the “Performance Period”); each 12-month period during the Performance Period (each an “Annual Period”) and the initial 24-month period of the Performance Period (the “Interim Period”), as follows:
| Performance Period |
Annual Period |
Interim Period |
||||||||||
| Absolute Component: 4% of any excess Total Return attained above an absolute hurdle measured from the beginning of such period: |
21 | % | 7 | % | 14 | % | ||||||
| Relative Component: 4% of any excess Total Return attained above the median Total Return for the performance period of the Peer Group(1), subject to a ratable sliding scale factor as follows based on achievement of cumulative Total Return measured from the beginning of such period: |
||||||||||||
| • 100% will be earned if cumulative Total Return achieved is at least: |
18 | % | 6 | % | 12 | % | ||||||
| • 50% will be earned if a cumulative Total Return achieved is: |
— | % | — | % | — | % | ||||||
| • 0% will be earned if cumulative Total Return achieved is less than: |
— | % | — | % | — | % | ||||||
| • a percentage from 50% to 100% calculated by linear interpolation will be earned if cumulative Total Return achieved is if between: |
0% — 18 | % | 0% — 6 | % | 0% — 12 | % | ||||||
| (1) | The “Peer Group” is comprised of the following companies: EPR Properties; Getty Realty Corporation; Lexington Realty Trust; National Retail Properties, Inc.; Realty Income Corporation; and Spirit Realty Capital, Inc. |
The New OPP provides for early calculation and vesting of the award in the event of a change in control of the General Partner, prior to the end of the Performance Period. Under the New OPP, treatment of a Participant’s award upon a termination of service will be governed by the terms of the Participants’ OPP Agreement or service agreement. In the event a Participant’s OPP Agreement or service agreement does not provide for treatment of the award upon the Participant’s termination, then the award will be forfeited upon such termination. The Participant’s will be entitled to receive a tax gross-up in the event that any amounts paid to the Participant under the OPP constitute “parachute payments” as defined in Section 280G of the Code. The LTIP Units granted under the New OPP represent units of equity ownership in the Operating Partnership that are structured as a profits interest therein. Subject to the Participant’s continued service through each vesting date, 1/3 of any earned LTIP Units will vest on each of the third, fourth and fifth anniversaries of October 1, 2013. The Participant will be entitled to receive distributions on their LTIP Units to the extent provided for in the limited partnership agreement of the Operating Partnership, as amended from time to time.
Note 18 — Related Party Transactions and Arrangements
In addition to the General Partner Convertible Notes discussed in Note 11 — Other Debt, the following related party transactions and arrangements occurred during the periods presented:
Ownership by Affiliates
Certain affiliates of the Operating Partnership have ownership in the Operating Partnership through ownership of shares of OP Units. As of December 31, 2013 and 2012, 4.37% and 1.35%, respectively, of the total OP units issued by the Operating Partnership were owned by affiliates.
F-62
Table of Contents
ARC PROPERTIES OPERATING PARTNERSHIP, L.P.
NOTES TO CONSOLIDATED FINANCIAL STATEMENTS — (Continued)
December 31, 2013
Fees Paid in Connection with Common Stock Offerings
RCS served as the dealer manager of the ARCT III and ARCT IV IPOs. RCS received fees and compensation in connection with the sale of ARCT III and ARCT IV’s common stock in the respective IPOs. RCS received a selling commission of up to 7% of gross offering proceeds before reallowance of commissions earned by participating broker-dealers in each of the IPOs. In addition, RCS received up to 3% of the gross proceeds from the sale of common stock, before reallowance to participating broker-dealers, as a dealer manager fee in each of the IPOs. RCS was permitted to reallow its dealer manager fee to such participating broker-dealers, based on such factors as the volume of shares sold by respective participating broker-dealers and marketing support incurred as compared to those of other participating broker-dealers. RCS has also received compensation for various other General Partner equity transactions.
The following table details the results of such activities related to RCS, which are recorded as offering costs on the consolidated statement of changes in equity (amounts in thousands):
| Year Ended December 31, | Payable as of December 31, | |||||||||||||||||||||||
| 2013 | 2012 | 2011 | 2013 | 2012 | 2011 | |||||||||||||||||||
| Total commissions and fees paid to RCS |
$ | 147,755 | $ | 184,398 | $ | 11,434 | $ | — | $ | 455 | $ | 92 | ||||||||||||
The Operating Partnership, ARCT III and ARCT IV reimbursed the Former Manager, the ARCT III Advisor, the ARCT IV Advisor and RCS, as applicable, for services relating to the ARCT III IPO, the ARCT IV IPO and other significant transactions such as the General Partner’s ATM. The following table details the results of such activities related to offering and other significant transactions costs reimbursed to the Former Manager, the ARCT III Advisor, the ARCT IV Advisor and RCS (amounts in thousands):
| Year Ended December 31, | Payable as of December 31, | |||||||||||||||||||||||
| 2013 | 2012 | 2011 | 2013 | 2012 | 2011 | |||||||||||||||||||
| Offering expense and other significant transactions reimbursements |
$ | 13,564 | $ | 27,202 | $ | 4,383 | $ | — | $ | 88 | $ | 220 | ||||||||||||
Fees Paid in Connection with the Operations of the Operating Partnership
Each of the Operating Partnership, ARCT III and ARCT IV paid the Former Manager, the ARCT III Advisor and the ARCT IV Advisor, as applicable, an acquisition fee equal to 1.0% of the contract purchase price, inclusive of assumed indebtedness, of each property the Operating Partnership (on behalf of the General Partner), ARCT III or ARCT IV, as applicable, acquired. The acquisition fee was payable in cash at the closing of each acquisition. In conjunction with the ARCT III Merger, it was agreed that these fees would no longer be paid by either the Operating Partnership or ARCT III. In conjunction with the ARCT IV Merger, it was agreed that these fees would no longer be paid by ARCT IV. Acquisition fees are recorded in Acquisition related costs in the accompanying consolidated statements of operations and comprehensive loss.
Each of the Operating Partnership, ARCT III and ARCT IV paid the Former Manager, the ARCT III Advisor and the ARCT IV Advisor, as applicable, a financing coordination fee equal to 0.75% of the amount available under any secured mortgage financing or refinancing that the Operating Partnership (on behalf of the General Partner), ARCT III or ARCT IV, as applicable, obtained and used for the acquisition of properties that was arranged by the Former Manager, ARCT III Advisor or ARCT IV Advisor, as applicable. The financing coordination fee was payable in cash at the closing of each financing. In conjunction with the ARCT III Merger, it was agreed that these fees would no longer be paid to either the Operating Partnership or ARCT III. In conjunction with the ARCT IV Merger, it was agreed that these fees would no longer be paid by ARCT IV.
F-63
Table of Contents
ARC PROPERTIES OPERATING PARTNERSHIP, L.P.
NOTES TO CONSOLIDATED FINANCIAL STATEMENTS — (Continued)
December 31, 2013
Prior to the termination of the amended and restated management agreement, the General Partner was required to pay its Former Manager a quarterly incentive fee, calculated based on 20% of the excess General Partner annualized core earnings (as defined in the management agreement with its Former Manager) over the weighted-average number of shares multiplied by the weighted-average price per share of common stock. One half of each quarterly installment of the incentive fee was payable in shares of common stock. The remainder of the incentive fee was payable in cash. No such incentive fees have been incurred or paid to the General Partner’s Former Manager since inception.
Prior to the termination of the amended and restated management agreement, the General Partner paid its Former Manager an annual base management fee equal to 0.50% per annum of the average unadjusted book value of the General Partner’s real estate assets, calculated and payable monthly in advance. The management fee was payable in cash. In conjunction with the ARCT III Merger, the base management fee was reduced to 0.40% per annum for the unadjusted book value of assets over $3.0 billion. The General Partner’s Former Manager waived such portion of its management fee in excess of certain net income thresholds related to the General Partner’s operations during the first three fiscal quarters of 2013. Management fees, if accrued, were recorded in Operating fees to affiliates in the consolidated statements of operations and comprehensive loss.
The General Partner, and therefore he Operating Partnership through the LPA, also pays fees for transfer agent services to an affiliate of the Former Manager, American National Stock Transfer, LLC.
Until July 1, 2012, ARCT III paid the ARCT III Advisor an asset management fee of 0.75% per annum of the cost of its assets (cost includes the purchase price, acquisition expenses, capital expenditures and other customarily capitalized costs, but excludes acquisition fees) plus costs and expenses incurred by the ARCT III Advisor in providing asset management services; provided, however, that the asset management fee was reduced by any amounts payable to ARCT III’s property manager as an oversight fee, such that the aggregate of the asset management fee and the oversight fee did not exceed 0.75% per annum of the cost of ARCT III’s assets plus costs and expenses incurred by the ARCT III Advisor in providing asset management services. Prior to July 1, 2012, this fee was payable in monthly installments at the discretion of ARCT III’s board of directors in cash, common stock or restricted stock grants, or any combination thereof. Asset management fees, if accrued, were recorded in Operating fees to affiliates in the consolidated statements of operations and comprehensive loss.
Effective July 1, 2012, the payment of asset management fees in monthly installments in cash, shares or restricted stock grants, or any combination thereof to the ARCT III Advisor was eliminated. Instead, ARCT III issued (subject to periodic approval by its board of directors) to the ARCT III Advisor performance-based restricted partnership units of the ARCT III OP designated as “ARCT III Class B units,” which were intended to be profits interests and to vest, and no longer be subject to forfeiture, at such time as: (x) the value of the ARCT III OP’s assets plus all distributions made equal or exceeded the total amount of capital contributed by investors plus a 6.0% cumulative, pre-tax, non-compounded annual return thereon (the “economic hurdle”); and (y) a liquidity event has occurred.
The ARCT III Advisor received distributions on unvested ARCT III Class B units equal to the distribution rate received on ARCT III common stock. Such distributions on issued ARCT III Class B units were included as general and administrative expense in the consolidated statements of operations and comprehensive loss until the performance condition is considered probable to occur. 145,022 ARCT III Class B units were approved by ARCT III’s board of directors as of December 31, 2012. During January and February 2013, ARCT III’s board of directors approved, and ARCT III issued, 603,599 ARCT III Class B units to the ARCT III Advisor for its asset management services provided. As of December 31, 2012, ARCT III did not consider achievement of the performance condition to be probable as the shareholder vote for the ARCT III Merger, which would allow
F-64
Table of Contents
ARC PROPERTIES OPERATING PARTNERSHIP, L.P.
NOTES TO CONSOLIDATED FINANCIAL STATEMENTS — (Continued)
December 31, 2013
vesting of these ARCT III Class B Units, was not completed. The performance condition related to these ARCT III Class B units was satisfied upon the completion of the ARCT III Merger and expense of $9.9 million was recorded at that time. The ARCT III Class B units then converted to ARCT III OP Units which converted to 711,190 OP Units after the application of the ARCT III Exchange Ratio. These expenses were recorded in merger and other transaction related in the consolidated statements of operations and comprehensive loss.
In connection with the asset management services provided by the ARCT IV Advisor, ARCT IV issued (subject to periodic approval by the board of directors) to the ARCT IV Advisor performance-based restricted partnership units of the ARCT IV OP designated as “ARCT IV Class B Units,” which were intended to be profit interests and to vest, and no longer be subject to forfeiture, at such time as: (x) the value of the ARCT IV OP’s assets plus all distributions made equals or exceeds the total amount of capital contributed by investors plus a 6.0% cumulative, pre-tax, non-compounded annual return thereon (the “economic hurdle”); (y) any one of the following occurs: (1) the termination of the advisory agreement by an affirmative vote of a majority of the General Partner’s independent directors without cause; (2) a listing; or (3) another liquidity event; and (z) the ARCT IV Advisor was still providing advisory services to ARCT IV.
The calculation of the ARCT IV asset management fees was equal to: (i) 0.1875% of the cost of ARCT IV’s assets; divided by (ii) the value of one share of ARCT IV common stock as of the last day of such calendar quarter. When approved by the board of directors, the ARCT IV Class B Units were issued to the ARCT IV Advisor quarterly in arrears pursuant to the terms of the ARCT IV OP agreement.
During the year ended December 31, 2013, the board of directors approved the issuance of 492,483 ARCT IV Class B Units to the ARCT IV Advisor in connection with this arrangement. As of December 31, 2013, ARCT IV did not consider achievement of the performance condition to be probable and no expense was recorded at that time. The ARCT IV Advisor received distributions on unvested ARCT IV Class B Units equal to the distribution rate received on the ARCT IV common stock. Such distributions on ARCT IV Class B Units were included in general and administrative expense in the consolidated statements of operations and comprehensive loss until the performance condition was considered probable to occur. The performance condition related to the 498,857 ARCT IV Class B Units, which includes units issued for the period of January 1, 2014 through the ARCT IV Merger Date, was satisfied upon the completion of the ARCT IV Merger. These ARCT IV Class B Units immediately converted into OP Units at the 2.3961 exchange ratio discussed in Note 2 — Mergers and Acquisitions and the Operating Partnership recorded an expense of $13.9 million based on the fair value of the ARCT IV Class B Units at that time.
ARCT III paid an affiliate of ARC, unless it contracted with a third party, a property management fee of up to 2% of gross revenues from ARCT III’s stand-alone single-tenant net leased properties and 4% of gross revenues from its multi-tenant properties, plus, in each case, market-based leasing commissions applicable to the geographic location of the property. ARCT III also reimbursed the affiliate for property level expenses. If ARCT III contracted directly with third parties for such services, it paid them customary market fees and paid the affiliated property manager, an oversight fee of up to 1% of the gross revenues of the property managed. Property management fees are recorded in Operating fees to affiliates in the consolidated statements of operations and comprehensive loss.
Effective March 1, 2013, ARCT IV entered into an agreement with RCS to provide strategic advisory services and investment banking services required in the ordinary course of ARCT IV’s business, such as performing financial analysis, evaluating publicly traded comparable companies and assisting in developing a portfolio composition strategy, a capitalization structure to optimize future liquidity options and structuring operations. Strategic advisory fees were amortized over the term of the ARCT IV IPO and included in acquisition
F-65
Table of Contents
ARC PROPERTIES OPERATING PARTNERSHIP, L.P.
NOTES TO CONSOLIDATED FINANCIAL STATEMENTS — (Continued)
December 31, 2013
and transaction related expense on the consolidated statements of operations and comprehensive loss. RCS and its affiliates also provided transfer agent services, as well as transaction management and other professional services. Those fees are included in general and administrative expenses on the consolidated statement of operations during the period the service was provided.
The General Partner and the Operating Partnership reimburse certain affiliates for out-of-pocket costs actually incurred by those affiliates, including without limitation, legal fees and expenses, due diligence fees and expenses, other third party fees and expenses, costs of appraisals, travel expenses, nonrefundable option payments and deposits on properties not acquired, accounting fees and expenses, title insurance premiums and other closing costs, personnel costs and miscellaneous expenses relating to the selection, acquisition and due diligence of properties. The General Partner’s and Operating Partnership’s reimbursement obligation is not subject to any dollar limitation. Expenses are typically reimbursed in cash on a monthly basis following the end of each month. Reimbursements are recorded based on the related activity to which the expense relates.
In order to facilitate the smooth transition of property management services following the consummation of the ARCT III Merger, the General Partner, the Operating Partnership and ARC agreed that the Property Management and Leasing Agreement will be extended for a 60-day period following the consummation of the ARCT III Merger for which the Operating Partnership (on behalf of the General Partner) paid ARC $2.3 million. These fees were recorded in merger and transaction related in the consolidated statements of operations and comprehensive loss.
The General Partner receives financial advisory and strategic services prior to the consummation of certain of its mergers and acquisitions pursuant to an investment banking services agreement, to which the General Partner and RCS are parties. Under this agreement, during the year ended December 31, 2013, the General Partner has incurred $17.8 million for the various mergers and transactions that were completed.
The following table details amounts incurred by the Operating Partnership (on behalf of the General Partner), ARCT III or ARCT IV and contractually due to ARC, ARCT III Advisor, ARCT IV Merger or the Former Manager and forgiven in connection with the operations related services described above (amounts in thousands):
| Year Ended December 31, | ||||||||||||||||||||||||||||||||||||
| 2013 | 2012 | 2011 | Payable as of December 31, | |||||||||||||||||||||||||||||||||
| Incurred | Forgiven | Incurred | Forgiven | Incurred | Forgiven | 2013 | 2012 | 2011 | ||||||||||||||||||||||||||||
| One-time fees: |
||||||||||||||||||||||||||||||||||||
| Acquisition fees (1) |
$ | 24,088 | $ | — | $ | 28,656 | $ | — | $ | 1,692 | $ | — | $ | — | $ | 376 | $ | 37 | ||||||||||||||||||
| Financing fees and related cost reimbursements |
13,637 | — | 3,350 | — | 182 | — | — | — | — | |||||||||||||||||||||||||||
| Other expense reimbursements |
16,230 | — | 592 | — | 148 | — | — | 18 | — | |||||||||||||||||||||||||||
| Transaction fees |
3,455 | — | — | — | — | — | 3,455 | — | — | |||||||||||||||||||||||||||
| On-going fees: |
||||||||||||||||||||||||||||||||||||
| Base management fees (2) |
13,978 | 6,109 | 2,035 | 1,823 | 274 | 274 | 5,654 | — | — | |||||||||||||||||||||||||||
| Transfer agent fees |
1,874 | — | — | — | — | — | 274 | — | — | |||||||||||||||||||||||||||
| Property management and leasing fees (2) |
799 | 799 | 918 | 918 | 15 | 15 | — | — | — | |||||||||||||||||||||||||||
| Strategic advisory fees |
920 | — | — | — | — | — | — | — | — | |||||||||||||||||||||||||||
| Distributions on ARCT IV Class B Units |
155 | — | — | — | — | — | — | — | — | |||||||||||||||||||||||||||
|
|
|
|
|
|
|
|
|
|
|
|
|
|
|
|
|
|
|
|||||||||||||||||||
| Total operational fees and reimbursements |
$ | 75,136 | $ | 6,908 | $ | 35,551 | $ | 2,741 | $ | 2,311 | $ | 289 | $ | 9,383 | $ | 394 | $ | 37 | ||||||||||||||||||
|
|
|
|
|
|
|
|
|
|
|
|
|
|
|
|
|
|
|
|||||||||||||||||||
F-66
Table of Contents
ARC PROPERTIES OPERATING PARTNERSHIP, L.P.
NOTES TO CONSOLIDATED FINANCIAL STATEMENTS — (Continued)
December 31, 2013
| (1) | In conjunction with the ARCT III Merger, the payment of acquisition fees was terminated, however for properties that were in the Operating Partnership’s or ARCT III’s pipeline at the ARCT III Merger date, the fees were paid as the Former Manager had sourced and negotiated the purchase price prior to the ARCT III Merger. |
| (2) | The amounts incurred and paid were recognized in merger and other transaction related costs during the year ended December 31, 2013 as they relate to the ARCT III Merger. The amounts incurred during the quarter ended December 31, 2013 and payable as of December 31, 2013 were accrued through January 7, 2014, the date prior to transition to self management. |
Under an administrative support agreement between the General Partner and ARC, ARC was to pay or reimburse the General Partner for its general administrative expenses, including, without limitation, legal fees, audit fees, board of directors fees, insurance, marketing and investor relation fees, until September 6, 2012, which was one year after the closing of the IPO of the General Partner, to the extent the amount of certain net earnings from operations thresholds, as specified in the agreement, were less than the amount of the distributions declared by the General Partner during this one-year period. To the extent these amounts were paid by ARC, they would not be subject to reimbursement by the General Partner. These costs are presented net in the accompanying consolidated statements of operations and comprehensive loss. In addition, the ARCT III Advisor provided expense support to ARCT III from time to time to assist ARCT III with operating cash flow, distributions or other operational purposes.
The following table details general and administrative expenses absorbed by ARC and the ARCT III Advisor and paid to the General Partner or ARCT III during the years ended December 31, 2013, 2012 and 2011(amounts in thousands):
| Year Ended December 31, | Receivable as of December 31, | |||||||||||||||||||||||
| 2013 | 2012 | 2011 | 2013 | 2012 | 2011 | |||||||||||||||||||
| General and administrative expenses absorbed |
$ | — | $ | 234 | $ | 20 | $ | — | $ | — | $ | — | ||||||||||||
Upon consummation of the ARCT III Merger, the General Partner entered into the OPP with its Former Manager, whereby its Former Manager was able to potentially earn compensation upon the attainment of stockholder value creation targets. Pursuant to previous authorization of the General Partner’s board of directors, as a result of the termination of the Management Agreement, all LTIP Units vested upon the consummation of the General Partner’s transition to self-management on January 8, 2014. On October 21, 2013, the General Partner approved the New OPP, to be effective as of the General Partner’s transition to self-management. Under the New OPP, individual agreements will be entered into between the General Partner and the participants selected by the Participants that set forth the Participant’s participation percentage in the New OPP and the number of LTIP Units subject to the award. Under the OPP Agreements, the Participants will be eligible to earn performance-based bonus awards equal to the Participant’s participation percentage of a pool that will be funded up to a maximum award opportunity. See Note 17 — Equity Based Compensation for a more detailed description of these plans.
Fees Paid in Connection with the ARCT III Merger
ARCT III entered into an agreement with an affiliate, ARC Advisory Services, LLC, to provide legal support services up to the date that ARCT III entered into the ARCT III Merger Agreement and until the ARCT III Merger was consummated for $0.5 million. This amount was fully accrued as of December 31, 2012 and was paid in February 2013 in conjunction with the consummation of the ARCT III Merger.
F-67
Table of Contents
ARC PROPERTIES OPERATING PARTNERSHIP, L.P.
NOTES TO CONSOLIDATED FINANCIAL STATEMENTS — (Continued)
December 31, 2013
ARCT III entered into an agreement with an affiliate, ARC Advisory Services, LLC, to provide support services including legal, accounting, marketing, human resources and information technology, among other services, until the earlier of the ARCT III Merger closing date or one year for $2.0 million pursuant to this contract. As of December 31, 2012, $0.3 million was accrued and the remaining $1.7 million was paid in February 2013 in conjunction with the consummation of the ARCT III Merger.
ARCT III entered into an agreement with affiliates RCS and ARC Advisory Services, LLC, to provide financial advisory and information agent services related to the proxy solicitation seeking approval of the ARCT III Merger by ARCT III’s stockholders for $0.6 million. Services provided include facilitation of the preparation, distribution and accumulation and tabulation of proxy materials, stockholder, analyst and financial advisor communications and consultation on materials and communications made to the public and regulatory agencies regarding the ARCT III Merger. The Operating Partnership recorded $0.5 million for the year ended December 31, 2013 in addition to the $0.1 million that was accrued in the prior year and paid the full amount in conjunction with the consummation of the ARCT III Merger.
The Operating Partnership entered into an Asset Purchase and Sale Agreement with ARC pursuant to which, concurrently with the closing of the ARCT III Merger and in connection with the internalization by the Operating Partnership of certain property level management and accounting activities, ARC sold to the Operating Partnership certain furniture, fixtures, equipment and other assets used by ARC in connection with managing the property level business and operations and accounting functions of the General Partner and the Operating Partnership, and included at the cost of such assets, for an aggregate price of $5.8 million, which includes the reimbursement of certain costs and expenses incurred by ARC in connection with the ARCT III Merger. Fees paid in connection with the ARCT III Merger were recorded in merger and transaction related in the consolidated statements of operations and comprehensive loss. Additionally, the Operating Partnership acquired fixed assets with a carryover basis of $1.0 million from the Advisor; the consideration paid to the Advisor in excess of the carryover basis was approximately $3.0 million.
On February 28, 2013, the Operating Partnership entered into a Contribution and Exchange Agreement (the “Contribution and Exchange Agreement”) with the ARCT III OP and American Realty Capital Trust III Special Limited Partner, LLC (the “ARCT III Special Limited Partner”), the holder of the special limited partner interest in the ARCT III OP. The ARCT III Special Limited Partner was entitled to receive certain distributions from the ARCT III OP, including the subordinated distribution of net sales proceeds resulting from an “investment liquidity event” (as defined in the agreement of limited partnership of the ARCT III OP). The ARCT III Merger constituted an “investment liquidity event,” as a result of which the ARCT III Special Limited Partner, in connection with management’s successful attainment of the 6.0% performance hurdle and the return to ARCT III’s stockholders of approximately $557.3 million in addition to their initial investment, was entitled to receive a subordinated distribution of net sales proceeds from the ARCT III OP equal to approximately $98.4 million. Pursuant to the Contribution and Exchange Agreement, the ARCT III Special Limited Partner contributed its interest in the ARCT III OP, inclusive of the subordinated distribution proceeds received, to the ARCT III OP in exchange for 7.6 million ARCT III OP Units. Upon consummation of the ARCT III Merger, these ARCT III OP Units were immediately converted to 7.3 million OP Units after application of the ARCT III Exchange Ratio. In conjunction with the ARCT III Merger Agreement, the ARCT III Special Limited Partner agreed to a minimum one-year holding period for these OP Units before converting them to shares of General Partner common stock.
Fees Paid in Connection with the ARCT IV Merger
The General Partner entered into an agreement with an entity under common ownership with the Former Manager, Realty Capital Securities, LLC (“RCS”), to provide strategic and financial advisory services to the
F-68
Table of Contents
ARC PROPERTIES OPERATING PARTNERSHIP, L.P.
NOTES TO CONSOLIDATED FINANCIAL STATEMENTS — (Continued)
December 31, 2013
General Partner in connection with the ARCT IV Merger. The General Partner agreed to pay a fee equal to 0.25% of the transaction value upon the consummation of the transaction and reimburse out of pocket expenses. The Operating Partnership accrued $7.7 million of such fees and $0.6 million of such expense reimbursements as of December 31, 2013.
The General Partner entered into an agreement with entities under common ownership with the Former Manager, RCS, RCS Advisory Services, LLC, and American National Stock Transfer, LLC (“ANST”), to provide financial advisory and information agent services in connection with the ARCT IV Merger and the related proxy solicitation seeking approval of such merger by the General Partner’s stockholders. Services provided include facilitation of the preparation, distribution and accumulation and tabulation of proxy materials, stockholder, analyst and financial advisor communications and consultation on materials and communications made to the public and regulatory agencies regarding the ARCT IV Merger. The General Partner agreed to pay $0.6 million in fees and reimburse out of pocket expenses pursuant to this agreement. This amount was fully accrued as of December 31, 2013 and paid in January 2014 by the Operating Partnership.
ARCT IV entered into an agreement with an entity under common ownership with the Former Manager, RCS, to provide strategic and financial advisory services to assist ARCT IV with its alternatives for a potential liquidity event. ARCT IV agreed to pay a fee equal to 0.25% of the transaction value upon the consummation of the transaction, but not less than $2.5 million, and reimburse out of pocket expenses. ARCT IV accrued $7.7 million of such fees and $0.6 million of such expense reimbursements as of December 31, 2013.
The General Partner and ARCT IV entered into agreements with entities under common ownership with the Former Manager, ARC Advisory Services, LLC and RCS Advisory Services, LLC, to provide legal support services, up to the date that ARCT IV entered into the ARCT IV Merger Agreement. In total, the General Partner and ARCT IV agreed to pay $0.5 million pursuant to this agreement. This amount was fully accrued as of December 31, 2013 by the Operating Partnership.
ARCT IV entered into an agreement with entities under common ownership with the Former Manager, RCS, RCS Advisory Services, LLC, and ANST, to provide advisory and information agent services in connection with the ARCT IV Merger and the related proxy solicitation seeking approval of such merger by ARCT IV’s stockholders. Services provided include facilitation of the preparation, distribution and accumulation and tabulation of proxy materials, stockholder, analyst and financial advisor communications and consultation on materials and communications made to the public and regulatory agencies regarding the ARCT IV Merger. ARCT IV agreed to pay $0.8 million in fees and reimburse out of pocket expenses pursuant to this agreement. As of December 31, 2013, $0.8 million of such fees and $0.2 million of such expense reimbursements were accrued.
ARCT IV entered into an agreement with entities under common ownership with the Former Manager, ARC Advisory Services, LLC and RCS Advisory Services, LLC, to provide support services including legal, accounting, marketing, human resources and information technology, among other services, until the earlier of the potential merger closing date or one year from the effective date of the agreement of July 1, 2013. ARCT IV agreed to pay $2.0 million in fees and reimburse out of pocket expenses pursuant to this agreement. As of December 31, 2013, $2.0 million of such fees and $0.4 million of such expense reimbursements were accrued.
ARCT IV entered into the Asset Purchase and Sale Agreement with the ARCT IV Advisor, pursuant to which the ARCT IV Advisor transferred to the Operating Partnership furniture, fixtures and equipment used by the ARCT IV Advisor and ARCT IV reimbursed the ARCT IV Advisor for certain unreimbursed expenses. No fees were incurred or paid under this agreement during the year ended December 31, 2013.
F-69
Table of Contents
ARC PROPERTIES OPERATING PARTNERSHIP, L.P.
NOTES TO CONSOLIDATED FINANCIAL STATEMENTS — (Continued)
December 31, 2013
Pursuant to ARCT IV’s advisory agreement with the ARCT IV Advisor, ARCT IV agreed to pay the ARCT IV Advisor a brokerage commission on the sale of property in connection with the ARCT IV Merger. At the time of the ARCT IV Merger, ARCT IV paid $8.4 million to the ARCT IV Advisor in connection with such agreement. These commissions were included in merger and other transaction related costs in the consolidated statement of operations. No fees were incurred under this agreement during the year ended December 31, 2013.
Investment by Affiliate
In connection with the ARCT III Merger, the ARCT III Special Limited Partner invested $0.8 million in exchange for 56,797 OP Units after the effect of the ARCT III Exchange Ratio.
Investment in Affiliate
During the year ended December 31, 2013, the Operating Partnership invested $10.0 million in an affiliated real estate fund, American Real Estate Income Fund, which invests primarily in equity securities of other publicly traded REITs, and subsequently reinvested dividends totaling $0.1 million. During the fourth quarter of 2013, the Operating Partnership sold investments with an original cost of $8.5 million. The fair value of the investment at December 31, 2013 was $1.5 million.
Note 19 — Economic Dependency
Prior to transitioning to self-management on January 8, 2014, the General Partner engaged, under various agreements, the Former Manager and its affiliates to provide certain services that are essential to the Operating Partnership, including asset management services and supervision of the management and leasing of properties owned by the Operating Partnership, as well as other administrative responsibilities for the Operating Partnership including information technology, legal services and investor relations. See Note 23 — Subsequent Events for additional information on the General Partner’s transition to self-management.
As a result of these relationships, the Operating Partnership was dependent upon the Former Manager, ARC and their affiliates. In the event that these companies were unable to provide the Operating Partnership with the respective services, the Operating Partnership would have been required to find alternative providers of these services. As a result of the ARCT III Merger, ARCP internalized certain accounting and property acquisition services previously performed by the Former Manager and its affiliates. ARCP may from time to time engage the Former Manager for legal, information technology or other support services for which it will pay a fee.
F-70
Table of Contents
ARC PROPERTIES OPERATING PARTNERSHIP, L.P.
NOTES TO CONSOLIDATED FINANCIAL STATEMENTS — (Continued)
December 31, 2013
Note 20 — Net Loss Per Unit
The following is a summary of the basic and diluted net loss per unit computation for the years ended December 31, 2013, 2012 and 2011 (amounts in thousands, expect for units and per unit data):
| Year Ended December 31, | ||||||||||||
| 2013 | 2012 | 2011 | ||||||||||
| Net loss from continuing operations attributable to unitholders |
$ | (480,436 | ) | $ | (41,492 | ) | $ | (3,952 | ) | |||
| Net loss from discontinued operations attributable to common unitholders |
(20 | ) | (745 | ) | (852 | ) | ||||||
|
|
|
|
|
|
|
|||||||
| Net loss attributable to common unitholders |
(480,456 | ) | (42,237 | ) | (4,804 | ) | ||||||
| Less: dividends declared on preferred units and RSUs |
(3,631 | ) | (368 | ) | — | |||||||
|
|
|
|
|
|
|
|||||||
| Net loss attributable to common unitholders, net of dividends on preferred unit and RSUs |
$ | (484,087 | ) | $ | (42,605 | ) | $ | (4,804 | ) | |||
|
|
|
|
|
|
|
|||||||
| Weighted-average common units outstanding (1) |
214,352,289 | 104,083,222 | 3,818,872 | |||||||||
|
|
|
|
|
|
|
|||||||
| Basic and diluted net loss per share from continuing operations attributable to common unitholders |
$ | (2.26 | ) | $ | (0.40 | ) | $ | (1.04 | ) | |||
|
|
|
|
|
|
|
|||||||
| Basic and diluted net loss per share from discontinued operations attributable to common unitholders |
$ | (0.00 | ) | $ | (0.01 | ) | $ | (0.22 | ) | |||
|
|
|
|
|
|
|
|||||||
| Basic and diluted net loss per share attributable to common unitholders |
$ | (2.26 | ) | $ | (0.41 | ) | $ | (1.26 | ) | |||
|
|
|
|
|
|
|
|||||||
| (1) | Weighted-average units for the year ended December 31, 2013 are adjusted on a pro forma basis as if the purchase of 27.7 million shares of ARCT III common stock for cash, purchased in conjunction with the ARCT III Merger, had been completed at the beginning of the period. Weighted-average units for the year ended December 31, 2013, excluding this pro forma adjustment, were 218,711,185 and net loss was $2.21 per unit, basic and diluted. |
For the year ended December 31, 2013, the Operating Partnership excluded 946,442 shares of unvested restricted units outstanding and 21,735,008 Series D Convertible Preferred Units outstanding as of December 31, 2013 from the calculation of diluted net loss per share as the effect would have been antidilutive.
Note 21 — Discontinued Operations and Properties Held for Sale
The Operating Partnership separately classifies properties held for sale in the accompanying consolidated balance sheets and operating results for those properties as discontinued operations in the accompanying consolidated statements of operations and comprehensive loss. In the normal course of business, changes in the market or changes in credit risk of certain tenants, among other factors, may compel the Operating Partnership to decide to classify a property as held for sale or reclassify a property that is designated as held for sale back to held for investment. In these situations, the property is transferred to held for sale or back to held for investment at the lesser of fair value or depreciated cost. As of December 31, 2013 and 2012, the Operating Partnership held one and two properties, respectively, classified as held for sale on the accompanying respective consolidated balance sheets.
F-71
Table of Contents
ARC PROPERTIES OPERATING PARTNERSHIP, L.P.
NOTES TO CONSOLIDATED FINANCIAL STATEMENTS — (Continued)
December 31, 2013
On March 5, 2013, the Operating Partnership executed a purchase and sale agreement to sell a Citizens Bank branch in Worth, IL classified as held for sale as of December 31, 2013. The sale price of the asset is $0.7 million in cash, which approximates the carrying value of the property.
Note 22 — Quarterly Results (Unaudited)
Presented below is a summary of the unaudited quarterly financial information for the years ended December 31, 2013 and 2012 (in thousands, except unit and per unit amounts):
| Quarters Ended (1) | ||||||||||||||||
| March 31, 2013 |
June 30, 2013 |
September 30, 2013 |
December 31, 2013 |
|||||||||||||
| Revenues |
$ | 42,897 | $ | 54,945 | $ | 95,255 | $ | 136,781 | ||||||||
| Net loss from continuing operations attributable to unitholders |
(141,593 | ) | (72,469 | ) | (82,998 | ) | (183,376 | ) | ||||||||
| Net income (loss) from discontinued operations attributable to common unitholders |
(2 | ) | 36 | 96 | (150 | ) | ||||||||||
|
|
|
|
|
|
|
|
|
|||||||||
| Net loss attributable to common unitholders |
(141,595 | ) | (72,433 | ) | (82,902 | ) | (183,526 | ) | ||||||||
|
|
|
|
|
|
|
|
|
|||||||||
| Less: dividends declared on preferred units and RSUs |
(193 | ) | (233 | ) | (199 | ) | (3,006 | ) | ||||||||
|
|
|
|
|
|
|
|
|
|||||||||
| Net loss attributable to common unitholders, net of dividends on preferred units and RSUs |
$ | (141,788 | ) | $ | (72,666 | ) | $ | (83,101 | ) | $ | (186,532 | ) | ||||
|
|
|
|
|
|
|
|
|
|||||||||
| Weighted-average units outstanding |
172,351,898 | 209,408,106 | 232,214,393 | 242,467,964 | ||||||||||||
|
|
|
|
|
|
|
|
|
|||||||||
| Basic and diluted loss per share from continuing operations attributable to common unitholders |
$ | (0.82 | ) | $ | (0.35 | ) | $ | (0.36 | ) | $ | (0.76 | ) | ||||
|
|
|
|
|
|
|
|
|
|||||||||
| Basic and diluted loss per share from discontinued operations attributable to common unitholders |
$ | — | $ | — | $ | — | $ | — | ||||||||
|
|
|
|
|
|
|
|
|
|||||||||
| Basic and diluted loss per share attributable to common unitholders |
$ | (0.82 | ) | $ | (0.35 | ) | $ | (0.36 | ) | $ | (0.76 | ) | ||||
|
|
|
|
|
|
|
|
|
|||||||||
| (1) | Certain historical balances have been restated for discontinue operations. |
F-72
Table of Contents
ARC PROPERTIES OPERATING PARTNERSHIP, L.P.
NOTES TO CONSOLIDATED FINANCIAL STATEMENTS — (Continued)
December 31, 2013
| Quarters Ended (1) | ||||||||||||||||
| March 31, 2012 |
June 30, 2012 |
September 30, 2012 |
December 31, 2012 |
|||||||||||||
| Revenues |
$ | 6,240 | $ | 11,534 | $ | 18,945 | $ | 30,488 | ||||||||
| Net loss from continuing operations attributable to unitholders |
(5,154 | ) | (7,084 | ) | (12,833 | ) | (16,421 | ) | ||||||||
| Net income (loss) from discontinued operations attributable to common unitholders |
(336 | ) | (166 | ) | (3 | ) | (240 | ) | ||||||||
|
|
|
|
|
|
|
|
|
|||||||||
| Net loss attributable to common unitholders |
(5,490 | ) | (7,250 | ) | (12,836 | ) | (16,661 | ) | ||||||||
|
|
|
|
|
|
|
|
|
|||||||||
| Less: dividends declared on preferred units and RSUs |
— | (70 | ) | (140 | ) | (158 | ) | |||||||||
|
|
|
|
|
|
|
|
|
|||||||||
| Net loss attributable to common unitholders, net of dividends on preferred units and RSUs |
$ | (5,490 | ) | $ | (7,320 | ) | $ | (12,976 | ) | $ | (16,819 | ) | ||||
|
|
|
|
|
|
|
|
|
|||||||||
| Weighted-average shares outstanding |
23,924,122 | 68,819,321 | 139,241,957 | 182,324,209 | ||||||||||||
|
|
|
|
|
|
|
|
|
|||||||||
| Basic and diluted loss per share from continuing operations attributable to common unitholders |
$ | (0.22 | ) | $ | (0.10 | ) | $ | (0.09 | ) | $ | (0.09 | ) | ||||
|
|
|
|
|
|
|
|
|
|||||||||
| Basic and diluted loss per share from discontinued operations attributable to common unitholders |
$ | (0.01 | ) | $ | — | $ | — | $ | — | |||||||
|
|
|
|
|
|
|
|
|
|||||||||
| Basic and diluted loss per share attributable to common unitholders |
$ | (0.23 | ) | $ | (0.11 | ) | $ | (0.09 | ) | $ | (0.09 | ) | ||||
|
|
|
|
|
|
|
|
|
|||||||||
| (1) | Certain historical balances have been restated for discontinue operations. |
Note 23 — Subsequent Events
In addition to those items discussed in Note 2 —Mergers and Acquisitions, Note 11 — Other Debt, Note 16 — Preferred and Common OP Units and Note 17 — Equity Based Compensation, the following events occurred subsequent to December 31, 2013 that require adjustments to the disclosures in the consolidated financial statements:
Completion of Acquisition of Assets
The following table presents certain information about the properties that the Operating Partnership (on behalf of ARCP) acquired from January 1, 2014 to July 29, 2014 (dollar amounts in millions):
| No. of Buildings | Square Feet (in millions) |
Base Purchase Price (1) |
||||||||||
| Total Portfolio — December 31, 2013 (2) |
2,559 | 43.8 | $ | 7,393 | ||||||||
| Acquisitions, net of disposals |
1,993 | 68.2 | 12,377 | |||||||||
|
|
|
|
|
|
|
|||||||
| Total Portfolio — July 29, 2014 |
4,552 | 112.0 | $ | 19,770 | ||||||||
|
|
|
|
|
|
|
|||||||
F-73
Table of Contents
ARC PROPERTIES OPERATING PARTNERSHIP, L.P.
NOTES TO CONSOLIDATED FINANCIAL STATEMENTS — (Continued)
December 31, 2013
| (1) | Contract purchase price, excluding acquisition and transaction related costs. |
| (2) | Total portfolio excludes one vacant property contributed in September 2011, which was classified as held for sale as of December 31, 2013. |
Transition to Self-Management
On January 8, 2014, the General Partner completed its transition to self-management. In connection with becoming self-managed, the General Partner terminated its management agreement with the Former Manager and certain former executives and employees of the Former Manager became employees of the Operating Partnership.
Termination of Management Agreement
In connection with the transition by the General Partner to self-management, on January 8, 2014, the General Partner and the Former Manager entered into an Amendment and Acknowledgment of Termination of Amended and Restated Management Agreement (the “Termination Agreement”), dated January 8, 2014. The Termination Agreement provided for termination of the Amended and Restated Management Agreement, dated February 28, 2013, between the General Partner and the Former Manager, effective January 8, 2014. Pursuant to the Termination Agreement, the Former Manager agreed to continue to provide services previously provided under the Management Agreement, to the extent required by the Operating Partnership, for a period of 60 days following January 8, 2014 and received a payment in the amount of $10.0 million for providing such services.
Pursuant to an Assignment and Assumption Agreement (the “Assignment”) dated January 8, 2014 between ARC, an affiliate of the General Partner’s Former Manager and RCS Advisory Services, LLC, ARC assigned to the General Partner, and the General Partner assumed, certain of the rights and obligations under that certain Services Agreement dated as of June 10, 2013 between ARC and RCS Advisory Services, LLC (the “Services Agreement”). Under the Services Agreement, RCS Advisory Services, LLC and its affiliates had been providing to the General Partner and Operating Partnership certain transaction management services and other services, employees and other resources. The Assignment enables the General Partner and Operating Partnership to continue to receive the services and resources contemplated under the Services Agreement, at the General Partner’s discretion.
In addition, pursuant to a separate Transition Services Agreement (the “Transition Services Agreement”), dated October 21, 2013, affiliates of the Former Manager agreed to provide certain transition services, including accounting support, acquisition support, investor relations support, public relations support, human resources and administration, general human resources duties, payroll services, benefits services, insurance and risk management, information technology, telecommunications and Internet and services relating to office supplies. The Transition Services Agreement will be in effect for a 60-day term beginning on the date the General Partner became self-managed, and may be extended by the General Partner at its discretion. Should the General Partner or the Operating Partnership request any services, the General Partner and Operating Partnership will pay a fee at an hourly rate or flat rate to be agreed on, not to exceed a market rate for the services to be provided pursuant to the Transition Services Agreement.
Purchase of Furniture, Fixtures and Equipment
On January 8, 2014, the Operating Partnership entered into the Asset Purchase and Sale Agreement with the Former Manager (the “Purchase Agreement”), pursuant to which the Former Manager transferred to the
F-74
Table of Contents
ARC PROPERTIES OPERATING PARTNERSHIP, L.P.
NOTES TO CONSOLIDATED FINANCIAL STATEMENTS — (Continued)
December 31, 2013
Operating Partnership furniture, fixtures and equipment used by the Former Manager in connection with the business of the Operating Partnership. Under the Purchase Agreement, the Operating Partnership paid the Former Manager $10.0 million for the furniture, fixtures and equipment and certain unreimbursed expenses.
Repayment of Debt
On July 14, 2014, the Operating Partnership repaid in full $19.2 million of the Senior Notes and, on July 30, 2014, the Operating Partnership repaid in full $30.9 million of the Trust Preferred Notes, both of which were assumed as part of the CapLease Merger. In addition, on June 6, 2014 the Operating Partnership repaid in full $150.0 million of the Secured Credit Facility assumed as part of the CapLease Merger.
F-75
Table of Contents
ARC PROPERTIES OPERATING PARTNERSHIP, L.P.
REAL ESTATE AND ACCUMULATED DEPRECIATION
SCHEDULE III
December 31, 2013
(in thousands)
| Initial Costs | ||||||||||||||||||||||||||||||||||||
| Property |
City |
State |
Encumbrances at December 31, 2013 |
Land | Buildings, Fixtures and Improvements |
Costs Capitalized Subsequent to Acquisition |
Gross Amount Carried at December 31, 2013 (10) (11) |
Accumulated Depreciation (12) (13) |
Date Acquired |
Date of Construction |
||||||||||||||||||||||||||
| 24 Hour Fitness |
Woodlands | TX | $ | — | (1) | $ | 2,690 | $ | 8,312 | $ | — | $ | 11,002 | $ | 146 | 9/24/2013 | 2001 | |||||||||||||||||||
| 7-Eleven |
Sarasota | FL | — | (1) | 1,312 | 1,312 | — | 2,624 | 80 | 11/19/2012 | 2000 | |||||||||||||||||||||||||
| 7-Eleven |
Gloucester | VA | — | (1) | 144 | 578 | — | 722 | 32 | 12/24/2012 | 1985 | |||||||||||||||||||||||||
| 7-Eleven |
Hampton | VA | — | (1) | 69 | 624 | — | 693 | 35 | 12/24/2012 | 1986 | |||||||||||||||||||||||||
| 7-Eleven |
Hampton | VA | — | (1) | 161 | 644 | — | 805 | 36 | 12/24/2012 | 1959 | |||||||||||||||||||||||||
| Abbott Laboratories |
Waukegan | IL | 13,649 | 4,734 | 21,319 | — | 26,053 | 193 | 11/5/2013 | 2000 | ||||||||||||||||||||||||||
| Abbott Laboratories |
Columbus | OH | — | (2) | 800 | 11,385 | — | 12,185 | 122 | 11/5/2013 | 2004 | |||||||||||||||||||||||||
| Academy Sports |
Fayetteville | AR | — | 1,900 | 7,601 | — | 9,501 | 534 | 12/28/2012 | 2012 | ||||||||||||||||||||||||||
| Academy Sports |
Dalton | GA | — | 998 | 5,656 | — | 6,654 | 331 | 2/20/2013 | 2012 | ||||||||||||||||||||||||||
| Advance Auto |
Birmingham | AL | — | (1) | 330 | 494 | — | 824 | 23 | 2/28/2013 | 1999 | |||||||||||||||||||||||||
| Advance Auto |
Birmingham | AL | — | (1) | 455 | 373 | — | 828 | 17 | 2/28/2013 | 1997 | |||||||||||||||||||||||||
| Advance Auto |
Calera | AL | — | (1) | 723 | 723 | — | 1,446 | 41 | 12/27/2012 | 2008 | |||||||||||||||||||||||||
| Advance Auto |
Dothan | AL | — | (1) | 326 | 326 | — | 652 | 18 | 12/31/2012 | 1997 | |||||||||||||||||||||||||
| Advance Auto |
Enterprise | AL | — | (1) | 280 | 420 | — | 700 | 24 | 12/31/2012 | 1995 | |||||||||||||||||||||||||
| Advance Auto |
Albany | GA | — | (1) | 210 | 629 | — | 839 | 35 | 12/31/2012 | 1995 | |||||||||||||||||||||||||
| Advance Auto |
Cairo | GA | — | (1) | 140 | 326 | — | 466 | 18 | 12/31/2012 | 1993 | |||||||||||||||||||||||||
| Advance Auto |
Hazlehurst | GA | — | (1) | 113 | 451 | — | 564 | 25 | 12/31/2012 | 1998 | |||||||||||||||||||||||||
| Advance Auto |
Hinesville | GA | — | (1) | 352 | 430 | — | 782 | 24 | 12/31/2012 | 1994 | |||||||||||||||||||||||||
| Advance Auto |
Perry | GA | — | (1) | 209 | 487 | — | 696 | 27 | 12/31/2012 | 1994 | |||||||||||||||||||||||||
| Advance Auto |
Thomasville | GA | — | (1) | 251 | 377 | — | 628 | 21 | 12/31/2012 | 1997 | |||||||||||||||||||||||||
| Advance Auto |
Auburn | IN | — | 337 | 1,347 | — | 1,684 | 132 | 3/29/2012 | 2007 | ||||||||||||||||||||||||||
| Advance Auto |
Clinton | IN | — | (1) | 182 | 729 | — | 911 | 24 | 6/5/2013 | 2004 | |||||||||||||||||||||||||
| Advance Auto |
Fort Wayne | IN | — | (1) | 193 | 450 | — | 643 | 21 | 2/28/2013 | 1998 | |||||||||||||||||||||||||
| Advance Auto |
Fort Wayne | IN | — | (1) | 200 | 371 | — | 571 | 17 | 2/28/2013 | 1998 | |||||||||||||||||||||||||
| Advance Auto |
Salina | KS | — | (1) | 195 | 782 | — | 977 | 29 | 4/30/2013 | 2006 | |||||||||||||||||||||||||
| Advance Auto |
Barbournville | KY | — | (1) | 194 | 1,098 | — | 1,292 | 46 | 4/15/2013 | 2006 | |||||||||||||||||||||||||
| Advance Auto |
Bardstown | KY | — | (1) | 272 | 1,090 | — | 1,362 | 66 | 12/10/2012 | 2005 | |||||||||||||||||||||||||
| Advance Auto |
Brandenburg | KY | — | (1) | 186 | 742 | — | 928 | 45 | 12/10/2012 | 2005 | |||||||||||||||||||||||||
| Advance Auto |
Hardinsburg | KY | — | (1) | 94 | 845 | — | 939 | 51 | 12/10/2012 | 2007 | |||||||||||||||||||||||||
| Advance Auto |
Inez | KY | — | (1) | 130 | 1,174 | — | 1,304 | 88 | 8/22/2012 | 2010 | |||||||||||||||||||||||||
| Advance Auto |
Leitchfield | KY | — | (1) | 104 | 939 | — | 1,043 | 57 | 12/10/2012 | 2005 | |||||||||||||||||||||||||
| Advance Auto |
West Liberty | KY | — | (1) | 249 | 996 | — | 1,245 | 42 | 4/15/2013 | 2006 | |||||||||||||||||||||||||
| Advance Auto |
Rayne | LA | — | (1) | 122 | 490 | — | 612 | 16 | 5/21/2013 | 2000 | |||||||||||||||||||||||||
| Advance Auto |
Caro | MI | — | (8) | 117 | 665 | — | 782 | 78 | 11/23/2011 | 2002 | |||||||||||||||||||||||||
| Advance Auto |
Charlotte | MI | — | (8) | 123 | 697 | — | 820 | 82 | 11/23/2011 | 2002 | |||||||||||||||||||||||||
| Advance Auto |
Flint | MI | — | (1) | 133 | 534 | — | 667 | 62 | 11/23/2011 | 2002 | |||||||||||||||||||||||||
| Advance Auto |
Livonia | MI | — | (8) | 210 | 629 | 14 | 853 | 74 | 12/12/2011 | 2003 | |||||||||||||||||||||||||
| Advance Auto |
Manistee | MI | — | (1) | 348 | 1,043 | — | 1,391 | 44 | 4/15/2013 | 2007 | |||||||||||||||||||||||||
| Advance Auto |
Sault Ste. Marie | MI | — | (8) | 75 | 671 | — | 746 | 78 | 11/23/2011 | 2003 | |||||||||||||||||||||||||
| Advance Auto |
Ypsilanti | MI | — | (1) | 85 | 483 | — | 568 | 57 | 11/23/2011 | 2002 | |||||||||||||||||||||||||
| Advance Auto |
Eden | NC | — | (1) | 320 | 746 | — | 1,066 | 17 | 7/16/2013 | 2004 | |||||||||||||||||||||||||
| Advance Auto |
Granite Falls | NC | — | (1) | 251 | 1,005 | — | 1,256 | 80 | 8/9/2012 | 2010 | |||||||||||||||||||||||||
| Advance Auto |
Lakewood | NJ | — | (1) | 750 | 1,750 | — | 2,500 | 131 | 8/22/2012 | 2010 | |||||||||||||||||||||||||
| Advance Auto |
Woodbury | NJ | — | (1) | 446 | 1,784 | — | 2,230 | 150 | 6/20/2012 | 2007 | |||||||||||||||||||||||||
| Advance Auto |
Eaton | OH | — | (1) | 157 | 471 | — | 628 | 15 | 6/13/2013 | 1987 | |||||||||||||||||||||||||
| Advance Auto |
Franklin | OH | — | (1) | 218 | 873 | — | 1,091 | 69 | 8/9/2012 | 1984 | |||||||||||||||||||||||||
| Advance Auto |
Springfield | OH | — | (1) | 461 | 1,075 | — | 1,536 | 60 | 12/31/2012 | 2005 | |||||||||||||||||||||||||
| Advance Auto |
Van Wert | OH | — | (1) | 33 | 630 | — | 663 | 21 | 6/13/2013 | 1998 | |||||||||||||||||||||||||
| Advance Auto |
Warren | OH | — | 83 | 745 | — | 828 | 73 | 4/12/2012 | 2003 | ||||||||||||||||||||||||||
F-76
Table of Contents
| Initial Costs | ||||||||||||||||||||||||||||||||||||
| Property |
City |
State |
Encumbrances at December 31, 2013 |
Land | Buildings, Fixtures and Improvements |
Costs Capitalized Subsequent to Acquisition |
Gross Amount Carried at December 31, 2013 (10) (11) |
Accumulated Depreciation (12) (13) |
Date Acquired |
Date of Construction |
||||||||||||||||||||||||||
| Advance Auto |
Oklahoma City | OK | $ | — | (1) | $ | 208 | $ | 1,178 | $ | — | $ | 1,386 | $ | 94 | 8/9/2012 | 2007 | |||||||||||||||||||
| Advance Auto |
Chambersburg | PA | — | (1) | 553 | 830 | — | 1,383 | 39 | 2/28/2013 | 1997 | |||||||||||||||||||||||||
| Advance Auto |
Selinsgrove | PA | — | (1) | 99 | 891 | — | 990 | 29 | 6/3/2013 | 2003 | |||||||||||||||||||||||||
| Advance Auto |
Titusville | PA | — | (1) | 207 | 1,172 | — | 1,379 | 71 | 12/12/2012 | 2010 | |||||||||||||||||||||||||
| Advance Auto |
Chapin | SC | — | (1) | 395 | 922 | — | 1,317 | 78 | 6/20/2012 | 2007 | |||||||||||||||||||||||||
| Advance Auto |
Chesterfield | SC | — | (1) | 131 | 745 | — | 876 | 63 | 6/27/2012 | 2008 | |||||||||||||||||||||||||
| Advance Auto |
Greenwood | SC | — | 210 | 630 | — | 840 | 65 | 3/9/2012 | 1995 | ||||||||||||||||||||||||||
| Advance Auto |
Sweetwater | TN | — | (1) | 360 | 839 | — | 1,199 | 51 | 11/29/2012 | 2006 | |||||||||||||||||||||||||
| Advance Auto |
Alton | TX | — | (1) | 169 | 958 | — | 1,127 | 63 | 10/18/2012 | 2006 | |||||||||||||||||||||||||
| Advance Auto |
Houston | TX | — | (3) | 248 | 991 | — | 1,239 | 125 | 9/30/2011 | 2006 | |||||||||||||||||||||||||
| Advance Auto |
Houston | TX | — | (3) | 343 | 1,029 | — | 1,372 | 130 | 9/30/2011 | 2006 | |||||||||||||||||||||||||
| Advance Auto |
Houston | TX | — | (1) | 837 | 685 | — | 1,522 | 51 | 8/21/2012 | 2007 | |||||||||||||||||||||||||
| Advance Auto |
Pasadena | TX | — | (1) | 382 | 1,146 | — | 1,528 | 97 | 7/6/2012 | 2008 | |||||||||||||||||||||||||
| Advance Auto |
Fort Atkinson | WI | — | (1) | 353 | 824 | — | 1,177 | 15 | 8/26/2013 | 2004 | |||||||||||||||||||||||||
| Advance Auto |
Kenosha | WI | — | (1) | 569 | 465 | — | 1,034 | 22 | 3/13/2013 | 2004 | |||||||||||||||||||||||||
| Advance Auto |
St. Marys | WY | — | (1) | 309 | 928 | — | 1,237 | 52 | 12/28/2012 | 2007 | |||||||||||||||||||||||||
| Aetna Life Insurance Company |
Fresno | CA | 16,043 | 3,405 | 22,343 | — | 25,748 | 207 | 11/5/2013 | 2008 | ||||||||||||||||||||||||||
| Ale House |
Orlando | FL | — | (1) | 290 | 3,647 | — | 3,937 | 105 | 6/27/2013 | 1994 | |||||||||||||||||||||||||
| Ale House |
Orlando | FL | — | (1) | 270 | 3,668 | — | 3,938 | 105 | 6/27/2013 | 1993 | |||||||||||||||||||||||||
| Ale House |
Saint Petersburg | FL | — | 930 | 3,116 | — | 4,046 | 89 | 6/27/2013 | 1998 | ||||||||||||||||||||||||||
| Allstate Insurance Company |
Charlotte | NC | 18,846 | 8,320 | 23,409 | — | 31,729 | 265 | 11/5/2013 | 1990 | ||||||||||||||||||||||||||
| Allstate Insurance Company |
Roanoke | VA | 20,064 | 6,176 | 27,085 | — | 33,261 | 281 | 11/5/2013 | 1981 | ||||||||||||||||||||||||||
| AMCOR |
Alhambra | MI | — | (1) | 7,143 | 8,730 | — | 15,873 | 488 | 1/24/2013 | 1966 | |||||||||||||||||||||||||
| AMEC plc |
Houston | TX | 15,765 | 2,524 | 30,398 | — | 32,922 | 255 | 11/5/2013 | 2003 | ||||||||||||||||||||||||||
| Ameriprise |
Ashwaubenon | WI | — | 751 | 14,260 | — | 15,011 | 631 | 1/25/2013 | 2000 | ||||||||||||||||||||||||||
| AON Corporation |
Lincolnshire | IL | — | 5,337 | 124,776 | — | 130,113 | 7,297 | 11/16/2012 | 1998 | ||||||||||||||||||||||||||
| Applebee’s |
Clinton | IA | — | (1) | 490 | 1,184 | — | 1,674 | 34 | 6/27/2013 | 1997 | |||||||||||||||||||||||||
| Applebee’s |
Fort Dodge | IA | — | (1) | — | 1,363 | — | 1,363 | 39 | 6/27/2013 | 1997 | |||||||||||||||||||||||||
| Applebee’s |
Marshalltown | IA | — | (1) | 660 | 1,175 | — | 1,835 | 34 | 6/27/2013 | 1997 | |||||||||||||||||||||||||
| Applebee’s |
Mason City | IA | — | (1) | 340 | 1,495 | — | 1,835 | 43 | 6/27/2013 | 1997 | |||||||||||||||||||||||||
| Applebee’s |
Muscatine | IA | — | (1) | 330 | 1,266 | — | 1,596 | 36 | 6/27/2013 | 1996 | |||||||||||||||||||||||||
| Applebee’s |
Sterling | IL | — | (1) | 390 | 1,291 | — | 1,681 | 37 | 6/27/2013 | 1996 | |||||||||||||||||||||||||
| Applebee’s |
Hopkinsville | KY | — | (1) | 460 | 1,265 | — | 1,725 | 36 | 6/27/2013 | 1997 | |||||||||||||||||||||||||
| Applebee’s |
Greenville | SC | — | (1) | 600 | 2,166 | — | 2,766 | 62 | 6/27/2013 | 1999 | |||||||||||||||||||||||||
| Applebee’s |
Antioch | TN | — | (1) | 470 | 878 | — | 1,348 | 25 | 6/27/2013 | 1991 | |||||||||||||||||||||||||
| Applebee’s |
Clarksville | TN | — | (1) | 570 | 1,729 | — | 2,299 | 50 | 6/27/2013 | 1995 | |||||||||||||||||||||||||
| Applebee’s |
Columbia | TN | — | (1) | 590 | 1,823 | — | 2,413 | 52 | 6/27/2013 | 1996 | |||||||||||||||||||||||||
| Applebee’s |
Cookeville | TN | — | (1) | 410 | 1,128 | — | 1,538 | 32 | 6/27/2013 | 1993 | |||||||||||||||||||||||||
| Applebee’s |
Hermitage | TN | — | (1) | 530 | 1,491 | — | 2,021 | 43 | 6/27/2013 | 1992 | |||||||||||||||||||||||||
| Applebee’s |
Lebanon | TN | — | (1) | 460 | 1,120 | — | 1,580 | 32 | 6/27/2013 | 1998 | |||||||||||||||||||||||||
| Applebee’s |
Madison | TN | — | (1) | 460 | 772 | — | 1,232 | 22 | 6/27/2013 | 1995 | |||||||||||||||||||||||||
| Arby’s |
Arab | AL | — | (1) | 40 | 887 | — | 927 | 25 | 6/27/2013 | 1988 | |||||||||||||||||||||||||
| Arby’s |
Hampton Cove | AL | — | (1) | 310 | 986 | — | 1,296 | 27 | 6/27/2013 | 2007 | |||||||||||||||||||||||||
| Arby’s |
Sacramento | CA | — | (1) | 520 | 195 | — | 715 | 5 | 6/27/2013 | 1981 | |||||||||||||||||||||||||
| Arby’s |
Arvada | CO | — | (1) | 190 | 1,465 | — | 1,655 | 41 | 6/27/2013 | 1994 | |||||||||||||||||||||||||
| Arby’s |
Orange Park | FL | — | (1) | 420 | 1,256 | — | 1,676 | 35 | 6/27/2013 | 1998 | |||||||||||||||||||||||||
| Arby’s |
Canton | GA | — | (1) | 370 | 1,200 | — | 1,570 | 33 | 6/27/2013 | 1998 | |||||||||||||||||||||||||
| Arby’s |
Douglasville | GA | — | (1) | 370 | 1,692 | — | 2,062 | 47 | 6/27/2013 | 1999 | |||||||||||||||||||||||||
| Arby’s |
Suwanee | GA | — | (1) | 370 | 1,561 | — | 1,931 | 43 | 6/27/2013 | 1998 | |||||||||||||||||||||||||
| Arby’s |
Avon | IN | — | (1) | 500 | 812 | — | 1,312 | 22 | 6/27/2013 | 1996 | |||||||||||||||||||||||||
| Arby’s |
Indianapolis | IN | — | (1) | 530 | 1,236 | — | 1,766 | 34 | 6/27/2013 | 2000 | |||||||||||||||||||||||||
| Arby’s |
Indianapolis | IN | — | (1) | 370 | 1,130 | — | 1,500 | 31 | 6/27/2013 | 1978 | |||||||||||||||||||||||||
| Arby’s |
Kansas City | KS | — | (1) | 280 | 364 | — | 644 | 10 | 6/27/2013 | 1970 | |||||||||||||||||||||||||
| Arby’s |
Salina | KS | — | (1) | 540 | 300 | — | 840 | 8 | 6/27/2013 | 1980 | |||||||||||||||||||||||||
F-77
Table of Contents
| Initial Costs | ||||||||||||||||||||||||||||||||||||
| Property |
City |
State |
Encumbrances at December 31, 2013 |
Land | Buildings, Fixtures and Improvements |
Costs Capitalized Subsequent to Acquisition |
Gross Amount Carried at December 31, 2013 (10) (11) |
Accumulated Depreciation (12) (13) |
Date Acquired |
Date of Construction |
||||||||||||||||||||||||||
| Arby’s |
Topeka | KS | $ | — | (1) | $ | 240 | $ | 291 | $ | — | $ | 531 | $ | 8 | 6/27/2013 | 1979 | |||||||||||||||||||
| Arby’s |
Topeka | KS | — | (1) | 270 | 433 | — | 703 | 12 | 6/27/2013 | 1979 | |||||||||||||||||||||||||
| Arby’s |
Alma | MI | — | (1) | 380 | 408 | — | 788 | 11 | 6/27/2013 | 1994 | |||||||||||||||||||||||||
| Arby’s |
Chesterfield | MI | — | (1) | 210 | 841 | — | 1,051 | 23 | 6/27/2013 | 1990 | |||||||||||||||||||||||||
| Arby’s |
Davison | MI | — | (1) | 420 | 631 | — | 1,051 | 17 | 6/27/2013 | 1980 | |||||||||||||||||||||||||
| Arby’s |
Flint | MI | — | (1) | 110 | 1,422 | — | 1,532 | 39 | 6/27/2013 | 1979 | |||||||||||||||||||||||||
| Arby’s |
Flint | MI | — | (1) | 230 | 1,428 | — | 1,658 | 40 | 6/27/2013 | 1962 | |||||||||||||||||||||||||
| Arby’s |
Midland | MI | — | (1) | 340 | 753 | — | 1,093 | 21 | 6/27/2013 | 1994 | |||||||||||||||||||||||||
| Arby’s |
Pontiac | MI | — | (1) | 180 | 962 | — | 1,142 | 27 | 6/27/2013 | 1968 | |||||||||||||||||||||||||
| Arby’s |
Port Huron | MI | — | (1) | 210 | 868 | — | 1,078 | 24 | 6/27/2013 | 1975 | |||||||||||||||||||||||||
| Arby’s |
Saginaw | MI | — | (1) | 310 | 1,110 | — | 1,420 | 31 | 6/27/2013 | 1970 | |||||||||||||||||||||||||
| Arby’s |
South Haven | MI | — | (1) | 260 | 573 | — | 833 | 16 | 6/27/2013 | 1988 | |||||||||||||||||||||||||
| Arby’s |
Walker | MI | — | (1) | 360 | 1,002 | — | 1,362 | 28 | 6/27/2013 | 1999 | |||||||||||||||||||||||||
| Arby’s |
Fayetteville | NC | — | (1) | 420 | 2,001 | — | 2,421 | 55 | 6/27/2013 | 2006 | |||||||||||||||||||||||||
| Arby’s |
Greensboro | NC | — | (1) | 300 | 906 | — | 1,206 | 25 | 6/27/2013 | 1990 | |||||||||||||||||||||||||
| Arby’s |
Greenville | NC | — | (1) | 310 | 681 | — | 991 | 19 | 6/27/2013 | 1995 | |||||||||||||||||||||||||
| Arby’s |
Jonesville | NC | — | (1) | 350 | 908 | — | 1,258 | 25 | 6/27/2013 | 1995 | |||||||||||||||||||||||||
| Arby’s |
Kernersville | NC | — | (1) | 280 | 774 | — | 1,054 | 21 | 6/27/2013 | 1994 | |||||||||||||||||||||||||
| Arby’s |
Kinston | NC | — | (1) | 350 | 832 | — | 1,182 | 23 | 6/27/2013 | 1995 | |||||||||||||||||||||||||
| Arby’s |
Lexington | NC | — | (1) | 360 | 873 | — | 1,233 | 24 | 6/27/2013 | 1992 | |||||||||||||||||||||||||
| Arby’s |
Columbus | OH | — | (1) | 400 | 1,155 | — | 1,555 | 32 | 6/27/2013 | 1999 | |||||||||||||||||||||||||
| Arby’s |
Reynoldsburg | OH | — | (1) | 370 | 945 | — | 1,315 | 26 | 6/27/2013 | 1998 | |||||||||||||||||||||||||
| Arby’s |
Willard | OH | — | (1) | 230 | 599 | — | 829 | 17 | 6/27/2013 | 2005 | |||||||||||||||||||||||||
| Arby’s |
Allentown | PA | — | (1) | 600 | 1,652 | — | 2,252 | 46 | 6/27/2013 | 1978 | |||||||||||||||||||||||||
| Arby’s |
Carlisle | PA | — | (1) | 200 | 472 | — | 672 | 13 | 6/27/2013 | 1992 | |||||||||||||||||||||||||
| Arby’s |
Hanover | PA | — | (1) | 400 | 921 | — | 1,321 | 26 | 6/27/2013 | 1994 | |||||||||||||||||||||||||
| Arby’s |
Myrtle Beach | SC | — | (1) | 370 | 1,132 | — | 1,502 | 31 | 6/27/2013 | 1999 | |||||||||||||||||||||||||
| Arby’s |
Amarillo | TX | — | (1) | 260 | 627 | — | 887 | 17 | 6/27/2013 | 1992 | |||||||||||||||||||||||||
| AT&T |
Richardson | TX | 20,224 | 1,891 | 31,118 | — | 33,009 | 262 | 11/5/2013 | 1987 | ||||||||||||||||||||||||||
| Auto Zone |
Chicago | IL | — | (1) | 698 | 1,047 | — | 1,745 | 39 | 4/30/2013 | 2007 | |||||||||||||||||||||||||
| Bandana’s Bar-B-Q Restaurant |
Collinsville | IL | — | (1) | 340 | 627 | — | 967 | 18 | 6/27/2013 | 1987 | |||||||||||||||||||||||||
| Bandana’s Bar-B-Q Restaurant |
Arnold | MO | — | (1) | 460 | 433 | — | 893 | 12 | 6/27/2013 | 1999 | |||||||||||||||||||||||||
| Baxter International, Inc. |
Bloomington | IN | — | (2) | 1,310 | 8,216 | — | 9,526 | 84 | 11/5/2013 | 2004 | |||||||||||||||||||||||||
| Bed Bath & Beyond |
Stockton | CA | — | 2,761 | 52,454 | — | 55,215 | 4,266 | 8/17/2012 | 2003 | ||||||||||||||||||||||||||
| Big O Tires |
Los Lunas | NM | — | (1) | 316 | 1,265 | — | 1,581 | 116 | 6/1/2012 | 2006 | |||||||||||||||||||||||||
| BJ’s Wholesale Club |
Canton | OH | — | 456 | 8,668 | — | 9,124 | 507 | 2/20/2013 | 1998 | ||||||||||||||||||||||||||
| Black Angus |
Dublin | CA | — | (1) | 620 | 2,467 | — | 3,087 | 71 | 6/27/2013 | 1999 | |||||||||||||||||||||||||
| Bojangles |
Winder | GA | — | (1) | 645 | 1,198 | — | 1,843 | 120 | 7/30/2012 | 2011 | |||||||||||||||||||||||||
| Bojangles |
Biscoe | NC | — | (1) | 247 | 986 | — | 1,233 | 75 | 11/29/2012 | 2010 | |||||||||||||||||||||||||
| Bojangles |
Boone | NC | — | (1) | 278 | 833 | — | 1,111 | 83 | 7/27/2012 | 1980 | |||||||||||||||||||||||||
| Bojangles |
Dobson | NC | — | (1) | 251 | 1,004 | — | 1,255 | 100 | 7/30/2012 | 2010 | |||||||||||||||||||||||||
| Bojangles |
Indian Trail | NC | — | (1) | 655 | 1,217 | — | 1,872 | 121 | 7/27/2012 | 2011 | |||||||||||||||||||||||||
| Bojangles |
Morganton | NC | — | 566 | 1,321 | — | 1,887 | 132 | 7/27/2012 | 2010 | ||||||||||||||||||||||||||
| Bojangles |
Roanoke Rapids | NC | — | (1) | 442 | 1,032 | — | 1,474 | 103 | 7/27/2012 | 2011 | |||||||||||||||||||||||||
| Bojangles |
Southport | NC | — | (1) | 505 | 1,179 | — | 1,684 | 118 | 7/30/2012 | 2011 | |||||||||||||||||||||||||
| Bojangles |
Chapin | SC | — | (1) | 577 | 1,071 | — | 1,648 | 107 | 8/9/2012 | 2009 | |||||||||||||||||||||||||
| Bojangles |
Clinton | SC | — | (1) | 397 | 926 | — | 1,323 | 92 | 7/27/2012 | 2009 | |||||||||||||||||||||||||
| Bojangles |
Greenwood | SC | — | (1) | 440 | 1,320 | — | 1,760 | 77 | 2/28/2013 | 2011 | |||||||||||||||||||||||||
| Bojangles |
Moncks Corner | SC | — | (1) | 505 | 1,179 | — | 1,684 | 90 | 11/29/2012 | 2010 | |||||||||||||||||||||||||
| Bojangles |
Walterboro | SC | — | (1) | 454 | 1,363 | — | 1,817 | 104 | 11/29/2012 | 2010 | |||||||||||||||||||||||||
| Boston Market |
Indianapolis | IN | — | (1) | 930 | — | — | 930 | — | 6/27/2013 | 1997 | |||||||||||||||||||||||||
| Boston Market |
Indianapolis | IN | — | (1) | 410 | 1,070 | — | 1,480 | 30 | 6/27/2013 | 1997 | |||||||||||||||||||||||||
| Boston Market |
Fayetteville | NC | — | (1) | 460 | 1,520 | — | 1,980 | 42 | 6/27/2013 | 1996 | |||||||||||||||||||||||||
| Boston Market |
Raleigh | NC | — | (1) | 280 | 1,015 | — | 1,295 | 28 | 6/27/2013 | 1994 | |||||||||||||||||||||||||
F-78
Table of Contents
| Initial Costs | ||||||||||||||||||||||||||||||||||||
| Property |
City |
State |
Encumbrances at December 31, 2013 |
Land | Buildings, Fixtures and Improvements |
Costs Capitalized Subsequent to Acquisition |
Gross Amount Carried at December 31, 2013 (10) (11) |
Accumulated Depreciation (12) (13) |
Date Acquired |
Date of Construction |
||||||||||||||||||||||||||
| Brangus Steakhouse |
Jasper | AL | $ | — | (1) | $ | 140 | $ | 219 | $ | — | $ | 359 | $ | 6 | 6/27/2013 | 1986 | |||||||||||||||||||
| Bruegger’s Bagels |
Iowa City | IA | — | (1) | 40 | 379 | — | 419 | 10 | 6/27/2013 | 2013 | |||||||||||||||||||||||||
| Bruegger’s Bagels |
Raleigh | NC | — | (1) | 230 | 654 | — | 884 | 18 | 6/27/2013 | 1997 | |||||||||||||||||||||||||
| Buca di Beppo Italian |
Wheeling | IL | — | (1) | 450 | 1,272 | — | 1,722 | 36 | 6/27/2013 | 1975 | |||||||||||||||||||||||||
| Buca di Beppo Italian |
Westlake | OH | — | (1) | 370 | 887 | — | 1,257 | 25 | 6/27/2013 | 1900 | |||||||||||||||||||||||||
| Bunge North America, Inc. |
Fort Worth | TX | 6,262 | 1,100 | 8,433 | — | 9,533 | 76 | 11/5/2013 | 2005 | ||||||||||||||||||||||||||
| Burger King |
Tucson | AZ | — | (1) | 300 | 1,307 | — | 1,607 | 36 | 6/27/2013 | 1980 | |||||||||||||||||||||||||
| Burger King |
Atlanta | GA | — | (1) | 380 | 499 | — | 879 | 14 | 6/27/2013 | 1984 | |||||||||||||||||||||||||
| Burger King |
Fort Oglethorpe | GA | — | (1) | 170 | 2,175 | — | 2,345 | 60 | 6/27/2013 | 1979 | |||||||||||||||||||||||||
| Burger King |
Marietta | GA | — | (1) | 350 | 916 | — | 1,266 | 25 | 6/27/2013 | 1983 | |||||||||||||||||||||||||
| Burger King |
Chicago | IL | — | (1) | 580 | 1,413 | — | 1,993 | 39 | 6/27/2013 | 1996 | |||||||||||||||||||||||||
| Burger King |
Highland | IN | — | (1) | 410 | 992 | — | 1,402 | 27 | 6/27/2013 | 1996 | |||||||||||||||||||||||||
| Burger King |
Madisonville | KY | — | (1) | 550 | 1,067 | — | 1,617 | 30 | 6/27/2013 | 1980 | |||||||||||||||||||||||||
| Burger King |
Caribou | ME | — | (1) | 770 | 440 | — | 1,210 | 12 | 6/27/2013 | 1978 | |||||||||||||||||||||||||
| Burger King |
Grand Rapids | MI | — | (1) | 490 | 545 | — | 1,035 | 15 | 6/27/2013 | 1968 | |||||||||||||||||||||||||
| Burger King |
Grand Rapids | MI | — | (1) | 260 | 780 | — | 1,040 | 22 | 6/27/2013 | 1993 | |||||||||||||||||||||||||
| Burger King |
Holland | MI | — | (1) | 420 | 707 | — | 1,127 | 20 | 6/27/2013 | 1978 | |||||||||||||||||||||||||
| Burger King |
Sparta | MI | — | (1) | 640 | 570 | — | 1,210 | 16 | 6/27/2013 | 1992 | |||||||||||||||||||||||||
| Burger King |
Walled Lake | MI | — | (1) | 470 | 433 | — | 903 | 12 | 6/27/2013 | 1982 | |||||||||||||||||||||||||
| Burger King |
Durham | NC | — | (1) | 170 | 352 | — | 522 | 10 | 6/27/2013 | 1990 | |||||||||||||||||||||||||
| Burger King |
Rockingham | NC | — | 430 | 1,171 | — | 1,601 | 32 | 6/27/2013 | 1980 | ||||||||||||||||||||||||||
| Burger King |
Edison | NJ | — | (1) | 480 | 1,075 | — | 1,555 | 30 | 6/27/2013 | 1985 | |||||||||||||||||||||||||
| Burger King |
Manahawkin | NJ | — | (1) | 310 | 748 | — | 1,058 | 21 | 6/27/2013 | 1980 | |||||||||||||||||||||||||
| Burger King |
Elko | NV | — | (1) | 260 | 1,001 | — | 1,261 | 28 | 6/27/2013 | 1982 | |||||||||||||||||||||||||
| Burger King |
Albany | NY | — | (1) | 330 | 850 | — | 1,180 | 24 | 6/27/2013 | 1980 | |||||||||||||||||||||||||
| Burger King |
Central Square | NY | — | (1) | 500 | 1,189 | — | 1,689 | 33 | 6/27/2013 | 1992 | |||||||||||||||||||||||||
| Burger King |
Cohoes | NY | — | (1) | 270 | 563 | — | 833 | 16 | 6/27/2013 | 1989 | |||||||||||||||||||||||||
| Burger King |
Montgomery | NY | — | (1) | 480 | 1,042 | — | 1,522 | 29 | 6/27/2013 | 1981 | |||||||||||||||||||||||||
| Burger King |
Schenectady | NY | — | (1) | 380 | 936 | — | 1,316 | 26 | 6/27/2013 | 1984 | |||||||||||||||||||||||||
| Burger King |
Willoughby | OH | — | (1) | 410 | 1,005 | — | 1,415 | 28 | 6/27/2013 | 1980 | |||||||||||||||||||||||||
| Burger King |
Ardmore | OK | — | (1) | 270 | 1,023 | — | 1,293 | 28 | 6/27/2013 | 1979 | |||||||||||||||||||||||||
| Burger King |
Corvallis | OR | — | (1) | 170 | 195 | — | 365 | 5 | 6/27/2013 | 1977 | |||||||||||||||||||||||||
| Burger King |
Roseburg | OR | — | (1) | 350 | 886 | — | 1,236 | 25 | 6/27/2013 | 1981 | |||||||||||||||||||||||||
| Burger King |
Old Forge | PA | — | (1) | 390 | 905 | — | 1,295 | 25 | 6/27/2013 | 1977 | |||||||||||||||||||||||||
| Burger King |
Gaffney | SC | — | (1) | 370 | 880 | — | 1,250 | 24 | 6/27/2013 | 1979 | |||||||||||||||||||||||||
| Burger King |
Greenville | SC | — | (1) | 420 | 571 | — | 991 | 16 | 6/27/2013 | 1982 | |||||||||||||||||||||||||
| Burger King |
Chattanooga | TN | — | (1) | 740 | 1,591 | — | 2,331 | 44 | 6/27/2013 | 1997 | |||||||||||||||||||||||||
| Burger King |
Cleburne | TX | — | (1) | 300 | 603 | — | 903 | 17 | 6/27/2013 | 1985 | |||||||||||||||||||||||||
| Burger King |
Bluefield | WV | — | (1) | 210 | 1,163 | — | 1,373 | 32 | 6/27/2013 | 1982 | |||||||||||||||||||||||||
| Cadbury Holdings Limited |
Whippany | NJ | 31,793 | 2,767 | 38,018 | — | 40,785 | 304 | 11/5/2013 | 2005 | ||||||||||||||||||||||||||
| Capital One Financial Corporation |
Plano | TX | — | (2) | 5,175 | 14,234 | 191 | 19,600 | 298 | 11/5/2013 | 2005 | |||||||||||||||||||||||||
| Captain D’s |
Statesboro | GA | — | (1) | 350 | 401 | — | 751 | 11 | 6/27/2013 | 1974 | |||||||||||||||||||||||||
| Captain D’s |
Southaven | MS | — | (1) | 270 | 564 | — | 834 | 16 | 6/27/2013 | 1992 | |||||||||||||||||||||||||
| Captain D’s |
Memphis | TN | — | (1) | 230 | 338 | — | 568 | 9 | 6/27/2013 | 2000 | |||||||||||||||||||||||||
| Captain D’s |
Dallas | TX | — | (1) | 160 | 535 | — | 695 | 15 | 6/27/2013 | 1979 | |||||||||||||||||||||||||
| Captain D’s |
Grand Prairie | TX | — | (1) | 260 | 338 | — | 598 | 9 | 6/27/2013 | 1987 | |||||||||||||||||||||||||
| Caribou Coffee |
Grosse Pointe Woods | MI | — | (1) | 140 | 1,046 | — | 1,186 | 29 | 6/27/2013 | 1982 | |||||||||||||||||||||||||
| Carlos O’Kelly’s |
Mason City | IA | — | (1) | 290 | 1,255 | — | 1,545 | 36 | 6/27/2013 | 1955 | |||||||||||||||||||||||||
| Carlos O’Kelly’s |
Bloomington | IL | — | (1) | 270 | 1,375 | — | 1,645 | 39 | 6/27/2013 | 1990 | |||||||||||||||||||||||||
| Carlos O’Kelly’s |
Springfield | MO | — | (1) | 840 | 730 | — | 1,570 | 21 | 6/27/2013 | 1992 | |||||||||||||||||||||||||
| Charleston’s |
Carmel | IN | — | (1) | 140 | 3,016 | — | 3,156 | 86 | 6/27/2013 | 1999 | |||||||||||||||||||||||||
| Check City |
Taylorsville | UT | — | (1) | 180 | 953 | — | 1,133 | 27 | 6/27/2013 | 1997 | |||||||||||||||||||||||||
| Checkers |
Huntsville | AL | — | (1) | 689 | — | — | 689 | — | 6/27/2013 | 1993 | |||||||||||||||||||||||||
| Checkers |
Hollywood | FL | — | (1) | 160 | 2,220 | — | 2,380 | 64 | 6/27/2013 | 1993 | |||||||||||||||||||||||||
F-79
Table of Contents
| Initial Costs | ||||||||||||||||||||||||||||||||||||
| Property |
City |
State |
Encumbrances at December 31, 2013 |
Land | Buildings, Fixtures and Improvements |
Costs Capitalized Subsequent to Acquisition |
Gross Amount Carried at December 31, 2013 (10) (11) |
Accumulated Depreciation (12) (13) |
Date Acquired |
Date of Construction |
||||||||||||||||||||||||||
| Checkers |
Lauderhill | FL | $ | — | (1) | $ | 280 | $ | 1,951 | $ | — | $ | 2,231 | $ | 56 | 6/27/2013 | 1996 | |||||||||||||||||||
| Checkers |
Plantation | FL | — | (1) | 220 | 1,461 | — | 1,681 | 42 | 6/27/2013 | 1994 | |||||||||||||||||||||||||
| Checkers |
Fayetteville | GA | — | (1) | 681 | — | — | 681 | — | 6/27/2013 | 1992 | |||||||||||||||||||||||||
| Chevys |
Greenbelt | MD | — | (1) | 530 | 2,399 | — | 2,929 | 69 | 6/27/2013 | 1994 | |||||||||||||||||||||||||
| Chevys |
Lake Oswego | OR | — | (1) | 590 | 1,693 | — | 2,283 | 49 | 6/27/2013 | 1995 | |||||||||||||||||||||||||
| Chili’s |
Fayetteville | AR | — | (1) | 1,370 | 1,714 | — | 3,084 | 49 | 6/27/2013 | 1991 | |||||||||||||||||||||||||
| Chili’s |
Boise | ID | — | (1) | 400 | 751 | — | 1,151 | 22 | 6/27/2013 | 1992 | |||||||||||||||||||||||||
| Chili’s |
Riverdale | UT | — | (1) | 800 | 899 | — | 1,699 | 26 | 6/27/2013 | 1993 | |||||||||||||||||||||||||
| Chili’s |
Cheyenne | WY | — | (1) | 270 | 815 | — | 1,085 | 23 | 6/27/2013 | 1994 | |||||||||||||||||||||||||
| Chipper’s Grill |
Streator | IL | — | (1) | 190 | 255 | — | 445 | 7 | 6/27/2013 | 1988 | |||||||||||||||||||||||||
| Cimarex Energy Company |
Tulsa | OK | 30,676 | 2,802 | 68,732 | — | 71,534 | 550 | 11/5/2013 | In process | ||||||||||||||||||||||||||
| Circle K |
Phoenix | AZ | — | (1) | 344 | 1,377 | — | 1,721 | 129 | 5/4/2012 | 1986 | |||||||||||||||||||||||||
| Circle K |
Martinez | GA | — | (1) | 348 | 813 | — | 1,161 | 61 | 8/28/2012 | 2003 | |||||||||||||||||||||||||
| Circle K |
Akron | OH | — | (1) | 675 | 1,254 | — | 1,929 | 88 | 9/27/2012 | 1996 | |||||||||||||||||||||||||
| Citizens Bank |
Colchester | CT | — | (1) | 185 | 1,049 | — | 1,234 | 70 | 9/26/2012 | 1981 | |||||||||||||||||||||||||
| Citizens Bank |
Deep River | CT | — | (1) | 453 | 1,812 | — | 2,265 | 121 | 9/26/2012 | 1851 | |||||||||||||||||||||||||
| Citizens Bank |
East Hampton | CT | — | (7) | 312 | 935 | — | 1,247 | 84 | 4/26/2012 | 1984 | |||||||||||||||||||||||||
| Citizens Bank |
East Lyme | CT | — | (1) | 258 | 1,032 | — | 1,290 | 69 | 9/26/2012 | 1972 | |||||||||||||||||||||||||
| Citizens Bank |
Hamden | CT | — | (1) | 581 | 475 | — | 1,056 | 32 | 9/26/2012 | 1893 | |||||||||||||||||||||||||
| Citizens Bank |
Higganum | CT | — | (9) | 171 | 971 | — | 1,142 | 219 | 10/1/2008 | 1983 | |||||||||||||||||||||||||
| Citizens Bank |
Montville | CT | — | (1) | 413 | 2,342 | — | 2,755 | 157 | 9/26/2012 | 1984 | |||||||||||||||||||||||||
| Citizens Bank |
New London | CT | — | (1) | 94 | 534 | — | 628 | 121 | 10/1/2008 | 1900 | |||||||||||||||||||||||||
| Citizens Bank |
Stonington | CT | — | (1) | 104 | 937 | — | 1,041 | 54 | 12/14/2012 | 1982 | |||||||||||||||||||||||||
| Citizens Bank |
Stonington | CT | — | (1) | 190 | 1,079 | — | 1,269 | 72 | 9/26/2012 | 1960 | |||||||||||||||||||||||||
| Citizens Bank |
Lewes | DE | — | (1) | 102 | 916 | — | 1,018 | 41 | 2/22/2013 | 1968 | |||||||||||||||||||||||||
| Citizens Bank |
Smyrna | DE | — | (9) | 183 | 1,036 | — | 1,219 | 215 | 3/1/2009 | 1940 | |||||||||||||||||||||||||
| Citizens Bank |
Wilmington | DE | — | (7) | 250 | 464 | — | 714 | 41 | 4/26/2012 | 1950 | |||||||||||||||||||||||||
| Citizens Bank |
Wilmington | DE | — | (7) | 299 | 299 | — | 598 | 27 | 4/26/2012 | 1981 | |||||||||||||||||||||||||
| Citizens Bank |
Alsip | IL | — | (1) | 226 | 1,280 | — | 1,506 | 289 | 10/1/2008 | 1981 | |||||||||||||||||||||||||
| Citizens Bank |
Calumet City | IL | — | (7) | 168 | 393 | — | 561 | 35 | 4/26/2012 | 1975 | |||||||||||||||||||||||||
| Citizens Bank |
Chicago | IL | — | (7) | 189 | 81 | — | 270 | 7 | 4/26/2012 | 1990 | |||||||||||||||||||||||||
| Citizens Bank |
Chicago | IL | — | (1) | 267 | 1,511 | — | 1,778 | 341 | 10/1/2008 | 1923 | |||||||||||||||||||||||||
| Citizens Bank |
Chicago | IL | — | (1) | 191 | 1,082 | — | 1,273 | 244 | 10/1/2008 | 1979 | |||||||||||||||||||||||||
| Citizens Bank |
Elmwood Park | IL | — | (1) | 431 | 2,441 | — | 2,872 | 481 | 6/1/2009 | 1977 | |||||||||||||||||||||||||
| Citizens Bank |
Evergreen Park | IL | — | (1) | 167 | 944 | — | 1,111 | 213 | 10/1/2008 | 1982 | |||||||||||||||||||||||||
| Citizens Bank |
Lyons | IL | — | (1) | 214 | 1,212 | — | 1,426 | 274 | 10/1/2008 | 1957 | |||||||||||||||||||||||||
| Citizens Bank |
Olympia Fields | IL | — | (7) | 426 | 1,704 | — | 2,130 | 152 | 4/26/2012 | 1974 | |||||||||||||||||||||||||
| Citizens Bank |
Wilmington | IL | — | (1) | 330 | 1,872 | — | 2,202 | 349 | 9/1/2009 | 1964 | |||||||||||||||||||||||||
| Citizens Bank |
Dorchester | MA | — | 386 | 386 | — | 772 | 34 | 4/26/2012 | 1960 | ||||||||||||||||||||||||||
| Citizens Bank |
Ludlow | MA | — | (1) | 810 | 540 | — | 1,350 | 36 | 9/26/2012 | 1948 | |||||||||||||||||||||||||
| Citizens Bank |
Malden | MA | — | (1) | 488 | 596 | — | 1,084 | 40 | 9/26/2012 | 1920 | |||||||||||||||||||||||||
| Citizens Bank |
Malden | MA | — | 484 | 1,935 | — | 2,419 | 130 | 9/26/2012 | 1988 | ||||||||||||||||||||||||||
| Citizens Bank |
Medford | MA | — | 589 | 1,094 | — | 1,683 | 73 | 9/26/2012 | 1938 | ||||||||||||||||||||||||||
| Citizens Bank |
New Bedford | MA | — | (1) | 297 | 694 | — | 991 | 46 | 9/26/2012 | 1983 | |||||||||||||||||||||||||
| Citizens Bank |
Randolph | MA | — | 480 | 1,439 | — | 1,919 | 96 | 9/26/2012 | 1979 | ||||||||||||||||||||||||||
| Citizens Bank |
Somerville | MA | — | (1) | 561 | 561 | — | 1,122 | 38 | 9/26/2012 | 1940 | |||||||||||||||||||||||||
| Citizens Bank |
South Dennis | MA | — | (1) | — | 1,294 | — | 1,294 | 75 | 12/14/2012 | 1986 | |||||||||||||||||||||||||
| Citizens Bank |
Springfield | MA | — | (1) | 187 | 747 | — | 934 | 27 | 5/10/2013 | 1975 | |||||||||||||||||||||||||
| Citizens Bank |
Tewksbury | MA | — | (7) | 266 | 1,063 | — | 1,329 | 95 | 4/26/2012 | 1998 | |||||||||||||||||||||||||
| Citizens Bank |
Watertown | MA | — | (1) | 443 | 542 | — | 985 | 36 | 9/26/2012 | 1950 | |||||||||||||||||||||||||
| Citizens Bank |
Wilbraham | MA | — | (7) | 148 | 591 | — | 739 | 53 | 4/26/2012 | 1967 | |||||||||||||||||||||||||
| Citizens Bank |
Winthrop | MA | — | (1) | 390 | 724 | — | 1,114 | 48 | 9/26/2012 | 1974 | |||||||||||||||||||||||||
| Citizens Bank |
Woburn | MA | — | (1) | 350 | 816 | — | 1,166 | 47 | 12/14/2012 | 1991 | |||||||||||||||||||||||||
| Citizens Bank |
Clinton Township | MI | — | (1) | 574 | 3,250 | — | 3,824 | 746 | 9/1/2008 | 1970 | |||||||||||||||||||||||||
| Citizens Bank |
Dearborn | MI | — | (1) | 434 | 2,461 | — | 2,895 | 459 | 9/1/2009 | 1977 | |||||||||||||||||||||||||
| Citizens Bank |
Dearborn | MI | — | (1) | 385 | 2,184 | — | 2,569 | 407 | 9/1/2009 | 1974 | |||||||||||||||||||||||||
F-80
Table of Contents
| Initial Costs | ||||||||||||||||||||||||||||||||||||
| Property |
City |
State |
Encumbrances at December 31, 2013 |
Land | Buildings, Fixtures and Improvements |
Costs Capitalized Subsequent to Acquisition |
Gross Amount Carried at December 31, 2013 (10) (11) |
Accumulated Depreciation (12) (13) |
Date Acquired |
Date of Construction |
||||||||||||||||||||||||||
| Citizens Bank |
Detroit | MI | $ | — | (1) | $ | 112 | $ | 636 | $ | — | $ | 748 | $ | 148 | 8/1/2008 | 1958 | |||||||||||||||||||
| Citizens Bank |
Detroit | MI | — | (1) | 204 | 1,159 | — | 1,363 | 270 | 8/1/2008 | 1956 | |||||||||||||||||||||||||
| Citizens Bank |
Grosse Pointe | MI | — | (1) | 410 | 2,322 | — | 2,732 | 508 | 12/1/2008 | 1975 | |||||||||||||||||||||||||
| Citizens Bank |
Harper Woods | MI | — | (1) | 207 | 1,171 | — | 1,378 | 273 | 8/1/2008 | 1983 | |||||||||||||||||||||||||
| Citizens Bank |
Highland Park | MI | — | (1) | 150 | 848 | — | 998 | 198 | 8/1/2008 | 1967 | |||||||||||||||||||||||||
| Citizens Bank |
Lathrup Village | MI | — | (1) | 283 | 1,602 | — | 1,885 | 362 | 10/1/2008 | 1980 | |||||||||||||||||||||||||
| Citizens Bank |
Livonia | MI | — | (1) | 261 | 1,476 | — | 1,737 | 344 | 8/1/2008 | 1959 | |||||||||||||||||||||||||
| Citizens Bank |
Richmond | MI | — | (1) | 168 | 951 | — | 1,119 | 222 | 8/1/2008 | 1980 | |||||||||||||||||||||||||
| Citizens Bank |
Southfield | MI | — | (1) | 283 | 1,605 | — | 1,888 | 368 | 9/1/2008 | 1975 | |||||||||||||||||||||||||
| Citizens Bank |
St. Clair Shores | MI | — | (1) | 309 | 1,748 | — | 2,057 | 407 | 8/1/2008 | 1961 | |||||||||||||||||||||||||
| Citizens Bank |
Utica | MI | — | (1) | 376 | 2,133 | — | 2,509 | 466 | 12/1/2008 | 1982 | |||||||||||||||||||||||||
| Citizens Bank |
Warren | MI | — | (1) | 178 | 1,009 | — | 1,187 | 228 | 10/1/2008 | 1963 | |||||||||||||||||||||||||
| Citizens Bank |
Keene | NH | — | 132 | 2,511 | — | 2,643 | 146 | 12/14/2012 | 1900 | ||||||||||||||||||||||||||
| Citizens Bank |
Manchester | NH | — | (1) | — | 1,568 | — | 1,568 | 91 | 12/14/2012 | 1985 | |||||||||||||||||||||||||
| Citizens Bank |
Manchester | NH | — | (1) | 640 | 782 | — | 1,422 | 52 | 9/26/2012 | 1941 | |||||||||||||||||||||||||
| Citizens Bank |
Ossipee | NH | — | (7) | 176 | 264 | — | 440 | 24 | 4/26/2012 | 1980 | |||||||||||||||||||||||||
| Citizens Bank |
Pelham | NH | — | (7) | 113 | 340 | — | 453 | 30 | 4/26/2012 | 1983 | |||||||||||||||||||||||||
| Citizens Bank |
Pittsfield | NH | — | (1) | 160 | 908 | — | 1,068 | 205 | 10/1/2008 | 1976 | |||||||||||||||||||||||||
| Citizens Bank |
Rollinsford | NH | — | (1) | 78 | 444 | — | 522 | 100 | 10/1/2008 | 1977 | |||||||||||||||||||||||||
| Citizens Bank |
Salem | NH | — | (1) | 328 | 1,312 | — | 1,640 | 76 | 12/14/2012 | 1980 | |||||||||||||||||||||||||
| Citizens Bank |
Haddon Heights | NJ | — | (1) | 316 | 948 | — | 1,264 | 21 | 7/23/2013 | 1960 | |||||||||||||||||||||||||
| Citizens Bank |
Marlton | NJ | — | (7) | 444 | 825 | — | 1,269 | 74 | 4/26/2012 | 1988 | |||||||||||||||||||||||||
| Citizens Bank |
Albany | NY | — | (9) | 232 | 1,315 | — | 1,547 | 245 | 9/1/2009 | 1994 | |||||||||||||||||||||||||
| Citizens Bank |
Amherst (Buffalo) | NY | — | (9) | 238 | 1,348 | — | 1,586 | 266 | 6/1/2009 | 1995 | |||||||||||||||||||||||||
| Citizens Bank |
East Aurora | NY | — | (9) | 162 | 919 | — | 1,081 | 181 | 6/1/2009 | 1996 | |||||||||||||||||||||||||
| Citizens Bank |
Greene | NY | — | (9) | 216 | 1,227 | — | 1,443 | 229 | 9/1/2009 | 1994 | |||||||||||||||||||||||||
| Citizens Bank |
Johnstown | NY | — | (9) | 163 | 923 | — | 1,086 | 172 | 9/1/2009 | 1994 | |||||||||||||||||||||||||
| Citizens Bank |
Port Jervis | NY | — | (9) | 143 | 811 | — | 954 | 169 | 3/1/2009 | 1964 | |||||||||||||||||||||||||
| Citizens Bank |
Rochester | NY | — | (9) | 166 | 943 | — | 1,109 | 186 | 6/1/2009 | 1962 | |||||||||||||||||||||||||
| Citizens Bank |
Schenectady | NY | — | (9) | 292 | 1,655 | — | 1,947 | 309 | 9/1/2009 | 1994 | |||||||||||||||||||||||||
| Citizens Bank |
Vails Gate | NY | — | (9) | 284 | 1,610 | — | 1,894 | 300 | 9/1/2009 | 1968 | |||||||||||||||||||||||||
| Citizens Bank |
Whitesboro | NY | — | (9) | 130 | 739 | — | 869 | 138 | 9/1/2009 | 1994 | |||||||||||||||||||||||||
| Citizens Bank |
Alliance | OH | — | (1) | 204 | 1,156 | — | 1,360 | 274 | 7/1/2008 | 1972 | |||||||||||||||||||||||||
| Citizens Bank |
Bedford | OH | — | (7) | 175 | 699 | — | 874 | 62 | 4/26/2012 | 2005 | |||||||||||||||||||||||||
| Citizens Bank |
Boardman | OH | — | (1) | 280 | 1,589 | — | 1,869 | 376 | 7/1/2008 | 1984 | |||||||||||||||||||||||||
| Citizens Bank |
Broadview Heights | OH | — | (1) | 201 | 1,140 | — | 1,341 | 237 | 3/1/2009 | 2000 | |||||||||||||||||||||||||
| Citizens Bank |
Brunswick | OH | — | (1) | 186 | 1,057 | — | 1,243 | 250 | 7/1/2008 | 2004 | |||||||||||||||||||||||||
| Citizens Bank |
Cleveland | OH | — | (1) | 239 | 1,357 | — | 1,596 | 321 | 7/1/2008 | 2003 | |||||||||||||||||||||||||
| Citizens Bank |
Cleveland | OH | — | (1) | 210 | 1,190 | — | 1,400 | 282 | 7/1/2008 | 1950 | |||||||||||||||||||||||||
| Citizens Bank |
Cleveland | OH | — | (1) | 182 | 1,031 | — | 1,213 | 244 | 7/1/2008 | 1960 | |||||||||||||||||||||||||
| Citizens Bank |
Fairlawn | OH | — | 511 | 2,045 | — | 2,556 | 119 | 12/14/2012 | 1979 | ||||||||||||||||||||||||||
| Citizens Bank |
Lakewood | OH | — | (1) | 196 | 1,111 | — | 1,307 | 207 | 9/1/2009 | 1965 | |||||||||||||||||||||||||
| Citizens Bank |
Louisville | OH | — | (1) | 191 | 1,080 | — | 1,271 | 255 | 7/1/2008 | 1960 | |||||||||||||||||||||||||
| Citizens Bank |
Massillon | OH | — | (1) | 287 | 1,624 | — | 1,911 | 384 | 7/1/2008 | 1976 | |||||||||||||||||||||||||
| Citizens Bank |
Massillon | OH | — | (1) | 212 | 1,202 | — | 1,414 | 284 | 7/1/2008 | 1958 | |||||||||||||||||||||||||
| Citizens Bank |
Mentor | OH | — | (1) | 178 | 1,011 | — | 1,189 | 228 | 10/1/2008 | 1976 | |||||||||||||||||||||||||
| Citizens Bank |
Northfield | OH | — | (1) | 317 | 1,797 | — | 2,114 | 406 | 10/1/2008 | 1960 | |||||||||||||||||||||||||
| Citizens Bank |
Parma | OH | — | (7) | 248 | 744 | — | 992 | 66 | 4/26/2012 | 1972 | |||||||||||||||||||||||||
| Citizens Bank |
Parma | OH | — | (1) | 475 | 581 | — | 1,056 | 34 | 12/14/2012 | 1971 | |||||||||||||||||||||||||
| Citizens Bank |
Rocky River | OH | — | (1) | 283 | 1,602 | — | 1,885 | 299 | 9/1/2009 | 1965 | |||||||||||||||||||||||||
| Citizens Bank |
South Russell | OH | — | (1) | 106 | 957 | — | 1,063 | 56 | 12/14/2012 | 1981 | |||||||||||||||||||||||||
| Citizens Bank |
Wadsworth | OH | — | (1) | 158 | 893 | — | 1,051 | 211 | 7/1/2008 | 1994 | |||||||||||||||||||||||||
| Citizens Bank |
Willoughby | OH | — | (1) | 395 | 2,239 | — | 2,634 | 506 | 10/1/2008 | 1920 | |||||||||||||||||||||||||
| Citizens Bank |
Allison Park | PA | — | (1) | 314 | 733 | — | 1,047 | 49 | 9/26/2012 | 1972 | |||||||||||||||||||||||||
| Citizens Bank |
Altoona | PA | — | (1) | 153 | 459 | — | 612 | 27 | 12/14/2012 | 1971 | |||||||||||||||||||||||||
| Citizens Bank |
Ambridge | PA | — | (9) | 215 | 1,217 | — | 1,432 | 227 | 9/1/2009 | 1925 | |||||||||||||||||||||||||
| Citizens Bank |
Ashley | PA | — | (1) | 225 | 675 | — | 900 | 39 | 12/14/2012 | 1928 | |||||||||||||||||||||||||
F-81
Table of Contents
| Initial Costs | ||||||||||||||||||||||||||||||||||||
| Property |
City |
State |
Encumbrances at December 31, 2013 |
Land | Buildings, Fixtures and Improvements |
Costs Capitalized Subsequent to Acquisition |
Gross Amount Carried at December 31, 2013 (10) (11) |
Accumulated Depreciation (12) (13) |
Date Acquired |
Date of Construction |
||||||||||||||||||||||||||
| Citizens Bank |
Beaver Falls | PA | $ | — | (1) | $ | 138 | $ | 553 | $ | — | $ | 691 | $ | 37 | 9/26/2012 | 1968 | |||||||||||||||||||
| Citizens Bank |
Carlisle | PA | — | (7) | 234 | 546 | — | 780 | 49 | 4/26/2012 | 1960+ | |||||||||||||||||||||||||
| Citizens Bank |
Dallas | PA | — | (1) | 213 | 1,205 | — | 1,418 | 81 | 9/26/2012 | 1949 | |||||||||||||||||||||||||
| Citizens Bank |
Dillsburg | PA | — | (1) | 232 | 926 | — | 1,158 | 54 | 12/14/2012 | 1935 | |||||||||||||||||||||||||
| Citizens Bank |
Drexel Hill | PA | — | (1) | 266 | 1,064 | — | 1,330 | 62 | 12/14/2012 | 1950 | |||||||||||||||||||||||||
| Citizens Bank |
Erie | PA | — | (1) | 168 | 671 | — | 839 | 39 | 12/14/2012 | 1954 | |||||||||||||||||||||||||
| Citizens Bank |
Glenside | PA | — | 343 | 1,370 | — | 1,713 | 43 | 5/22/2013 | 1958 | ||||||||||||||||||||||||||
| Citizens Bank |
Grove City | PA | — | (7) | 292 | 239 | — | 531 | 21 | 4/26/2012 | 1977 | |||||||||||||||||||||||||
| Citizens Bank |
Grove City | PA | — | (7) | 41 | 782 | — | 823 | 70 | 4/26/2012 | 1920 | |||||||||||||||||||||||||
| Citizens Bank |
Harrisburg | PA | — | (7) | 512 | 419 | — | 931 | 37 | 4/26/2012 | 1967 | |||||||||||||||||||||||||
| Citizens Bank |
Havertown | PA | — | (1) | 219 | 875 | — | 1,094 | 59 | 9/26/2012 | 2003 | |||||||||||||||||||||||||
| Citizens Bank |
Homestead | PA | — | (1) | 202 | 807 | — | 1,009 | 54 | 9/26/2012 | 1960 | |||||||||||||||||||||||||
| Citizens Bank |
Kingston | PA | — | (1) | 404 | 943 | — | 1,347 | 55 | 12/14/2012 | 1977 | |||||||||||||||||||||||||
| Citizens Bank |
Kutztown | PA | — | (7) | 81 | 725 | — | 806 | 65 | 5/11/2012 | 1974 | |||||||||||||||||||||||||
| Citizens Bank |
Lancaster | PA | — | (7) | 368 | 552 | — | 920 | 49 | 4/26/2012 | 1965 | |||||||||||||||||||||||||
| Citizens Bank |
Lancaster | PA | — | (1) | 383 | 468 | — | 851 | 31 | 9/26/2012 | 1967 | |||||||||||||||||||||||||
| Citizens Bank |
Latrobe | PA | — | (1) | 148 | 591 | — | 739 | 34 | 12/14/2012 | 1969 | |||||||||||||||||||||||||
| Citizens Bank |
Lititz | PA | — | (7) | 37 | 708 | — | 745 | 63 | 4/26/2012 | 1964 | |||||||||||||||||||||||||
| Citizens Bank |
Lower Burrell | PA | — | (1) | 180 | 722 | — | 902 | 42 | 12/14/2012 | 1980 | |||||||||||||||||||||||||
| Citizens Bank |
Mechanicsburg | PA | — | 288 | 2,590 | — | 2,878 | 174 | 9/26/2012 | 1900 | ||||||||||||||||||||||||||
| Citizens Bank |
Mercer | PA | — | (1) | 105 | 314 | — | 419 | 18 | 12/14/2012 | 1964 | |||||||||||||||||||||||||
| Citizens Bank |
Metamoras | PA | — | (1) | 509 | 946 | — | 1,455 | 55 | 12/14/2012 | 1920 | |||||||||||||||||||||||||
| Citizens Bank |
Milford | PA | — | (1) | 513 | 769 | — | 1,282 | 45 | 12/14/2012 | 1981 | |||||||||||||||||||||||||
| Citizens Bank |
Monesson | PA | — | (9) | 198 | 1,123 | — | 1,321 | 209 | 9/1/2009 | 1930 | |||||||||||||||||||||||||
| Citizens Bank |
Mount Lebanon | PA | — | 215 | 1,939 | — | 2,154 | 130 | 9/26/2012 | 1960 | ||||||||||||||||||||||||||
| Citizens Bank |
Mountain Top | PA | — | (1) | 111 | 631 | — | 742 | 37 | 12/14/2012 | 1980 | |||||||||||||||||||||||||
| Citizens Bank |
Munhall | PA | — | (7) | 191 | 191 | — | 382 | 17 | 4/26/2012 | 1973 | |||||||||||||||||||||||||
| Citizens Bank |
Narberth | PA | — | (9) | 420 | 2,381 | — | 2,801 | 548 | 9/1/2009 | 1935 | |||||||||||||||||||||||||
| Citizens Bank |
New Stanton | PA | — | (7) | 330 | 612 | — | 942 | 55 | 4/26/2012 | 1975 | |||||||||||||||||||||||||
| Citizens Bank |
Oakmont | PA | — | (1) | 199 | 1,127 | — | 1,326 | 65 | 12/14/2012 | 1967 | |||||||||||||||||||||||||
| Citizens Bank |
Philadelphia | PA | — | (7) | 184 | 735 | — | 919 | 66 | 4/26/2012 | 1904 | |||||||||||||||||||||||||
| Citizens Bank |
Philadelphia | PA | — | (1) | 127 | 722 | — | 849 | 42 | 12/14/2012 | 1920 | |||||||||||||||||||||||||
| Citizens Bank |
Pittsburgh | PA | — | (1) | 185 | 1,051 | — | 1,236 | 61 | 12/14/2012 | 1960 | |||||||||||||||||||||||||
| Citizens Bank |
Pittsburgh | PA | — | (1) | 389 | 1,168 | — | 1,557 | 68 | 12/14/2012 | 1940 | |||||||||||||||||||||||||
| Citizens Bank |
Pittsburgh | PA | — | (1) | 146 | 2,770 | — | 2,916 | 161 | 12/14/2012 | 1900 | |||||||||||||||||||||||||
| Citizens Bank |
Pittsburgh | PA | — | 470 | 2,661 | — | 3,131 | 154 | 12/14/2012 | 1980 | ||||||||||||||||||||||||||
| Citizens Bank |
Pittsburgh | PA | — | (1) | 215 | 1,219 | — | 1,434 | 82 | 9/26/2012 | 1970 | |||||||||||||||||||||||||
| Citizens Bank |
Pittsburgh | PA | — | (1) | 256 | 767 | — | 1,023 | 51 | 9/26/2012 | 1970 | |||||||||||||||||||||||||
| Citizens Bank |
Shippensburg | PA | — | (7) | 143 | 429 | — | 572 | 38 | 4/26/2012 | 1985 | |||||||||||||||||||||||||
| Citizens Bank |
Slovan | PA | — | (7) | 217 | 117 | — | 334 | 10 | 4/26/2012 | 1975 | |||||||||||||||||||||||||
| Citizens Bank |
State College | PA | — | (7) | 256 | 475 | — | 731 | 42 | 4/26/2012 | 1966 | |||||||||||||||||||||||||
| Citizens Bank |
Temple | PA | — | (1) | 268 | 626 | — | 894 | 42 | 9/26/2012 | 1936 | |||||||||||||||||||||||||
| Citizens Bank |
Turtle Creek | PA | — | (1) | 308 | 923 | — | 1,231 | 62 | 9/26/2012 | 1970 | |||||||||||||||||||||||||
| Citizens Bank |
Tyrone | PA | — | (1) | 146 | 583 | — | 729 | 34 | 12/14/2012 | 1967 | |||||||||||||||||||||||||
| Citizens Bank |
Upper Darby | PA | — | (1) | 411 | 617 | — | 1,028 | 36 | 12/14/2012 | 1966 | |||||||||||||||||||||||||
| Citizens Bank |
Verona | PA | — | (7) | 264 | 616 | — | 880 | 55 | 4/26/2012 | 1972 | |||||||||||||||||||||||||
| Citizens Bank |
West Grove | PA | — | (7) | 181 | 725 | — | 906 | 65 | 4/26/2012 | 1980 | |||||||||||||||||||||||||
| Citizens Bank |
West Hazelton | PA | — | (1) | 279 | 2,509 | — | 2,788 | 168 | 9/26/2012 | 1900 | |||||||||||||||||||||||||
| Citizens Bank |
York | PA | — | (7) | 337 | 626 | — | 963 | 56 | 4/26/2012 | 1955 | |||||||||||||||||||||||||
| Citizens Bank |
Coventry | RI | — | (1) | 559 | 559 | — | 1,118 | 37 | 9/26/2012 | 1968 | |||||||||||||||||||||||||
| Citizens Bank |
Johnston | RI | — | (1) | 343 | 1,030 | — | 1,373 | 69 | 9/26/2012 | 1972 | |||||||||||||||||||||||||
| Citizens Bank |
North Providence | RI | — | 200 | 1,800 | — | 2,000 | 96 | 12/31/2012 | 1971 | ||||||||||||||||||||||||||
| Citizens Bank |
Wakefield | RI | — | (1) | 517 | 959 | — | 1,476 | 64 | 9/26/2012 | 1976 | |||||||||||||||||||||||||
| Citizens Bank |
Warren | RI | — | (1) | 328 | 609 | — | 937 | 41 | 9/26/2012 | 1980 | |||||||||||||||||||||||||
| Citizens Bank |
Warwick | RI | — | (1) | 1,570 | 5,544 | — | 7,114 | 67 | 9/24/2013 | 1996 | |||||||||||||||||||||||||
| Citizens Bank |
Warwick | RI | — | (1) | 1,870 | 9,662 | — | 11,532 | 117 | 9/24/2013 | 1995 | |||||||||||||||||||||||||
| Citizens Bank |
Middlebury | VT | — | (1) | 363 | 544 | — | 907 | 32 | 12/14/2012 | 1969 | |||||||||||||||||||||||||
F-82
Table of Contents
| Initial Costs | ||||||||||||||||||||||||||||||||||||
| Property |
City |
State |
Encumbrances at December 31, 2013 |
Land | Buildings, Fixtures and Improvements |
Costs Capitalized Subsequent to Acquisition |
Gross Amount Carried at December 31, 2013 (10) (11) |
Accumulated Depreciation (12) (13) |
Date Acquired |
Date of Construction |
||||||||||||||||||||||||||
| Citizens Bank |
Poultney | VT | $ | — | (1) | $ | 149 | $ | 847 | $ | — | $ | 996 | $ | 176 | 3/1/2009 | 1860 | |||||||||||||||||||
| Citizens Bank |
St. Albans | VT | — | (1) | 141 | 798 | — | 939 | 166 | 3/1/2009 | 1989 | |||||||||||||||||||||||||
| Citizens Bank |
White River Junction | VT | — | (1) | 183 | 1,039 | — | 1,222 | 216 | 3/1/2009 | 1975 | |||||||||||||||||||||||||
| Comcast Corporation |
Englewood | CO | — | 1,490 | 5,060 | — | 6,550 | 45 | 11/5/2013 | 2011 | ||||||||||||||||||||||||||
| Community Bank |
Whitehall | NY | — | (9) | 106 | 600 | — | 706 | 112 | 9/1/2009 | 1950 | |||||||||||||||||||||||||
| Community National Bank |
Lake Mary | FL | — | 1,230 | 1,504 | — | 2,734 | 20 | 10/1/2013 | 1990 | ||||||||||||||||||||||||||
| Cooper Tire & Rubber Company |
Franklin | IN | 16.998 | 4,438 | 33,994 | — | 38,432 | 346 | 11/5/2013 | 2009 | ||||||||||||||||||||||||||
| County of Yolo, California |
Woodland | CA | 10.332 | 2,640 | 13,681 | — | 16,321 | 108 | 11/5/2013 | 2001 | ||||||||||||||||||||||||||
| Cracker Barrel |
Braselton | GA | — | 1,294 | 2,403 | — | 3,697 | 197 | 11/13/2012 | 2005 | ||||||||||||||||||||||||||
| Cracker Barrel |
Bremen | GA | — | 1,012 | 2,361 | — | 3,373 | 194 | 11/13/2012 | 2006 | ||||||||||||||||||||||||||
| Cracker Barrel |
Mebane | NC | — | 1,106 | 2,054 | — | 3,160 | 169 | 11/13/2012 | 2004 | ||||||||||||||||||||||||||
| Cracker Barrel |
Emporia | VA | — | 972 | 2,267 | — | 3,239 | 186 | 11/13/2012 | 2004 | ||||||||||||||||||||||||||
| Cracker Barrel |
Woodstock | VA | — | 928 | 2,164 | — | 3,092 | 178 | 11/13/2012 | 2005 | ||||||||||||||||||||||||||
| Crozer-Keystone Health System |
Ridley Park | PA | 2.332 | — | 6,114 | — | 6,114 | 51 | 11/5/2013 | 2004 | ||||||||||||||||||||||||||
| CVS |
Phoenix | AZ | — | 1,511 | 4,533 | — | 6,044 | 68 | 10/1/2013 | 2012 | ||||||||||||||||||||||||||
| CVS |
Phoenix | AZ | — | 901 | 2,704 | — | 3,605 | 41 | 10/1/2013 | 2012 | ||||||||||||||||||||||||||
| CVS |
Fresno | CA | — | 1,890 | 4,409 | — | 6,299 | 66 | 10/1/2013 | 2012 | ||||||||||||||||||||||||||
| CVS |
Palmdale | CA | — | 2,493 | 4,630 | — | 7,123 | 69 | 10/1/2013 | 2012 | ||||||||||||||||||||||||||
| CVS |
Sacramento | CA | — | 2,163 | 4,016 | — | 6,179 | 60 | 10/1/2013 | 2012 | ||||||||||||||||||||||||||
| CVS |
Norwich | CT | — | 1,998 | 5,995 | — | 7,993 | 90 | 10/1/2013 | 2011 | ||||||||||||||||||||||||||
| CVS |
Lakeland | FL | — | 587 | 2,347 | — | 2,934 | 35 | 10/1/2013 | 2012 | ||||||||||||||||||||||||||
| CVS |
St. Cloud | FL | — | 1,534 | 1,875 | — | 3,409 | 84 | 4/12/2013 | 2002 | ||||||||||||||||||||||||||
| CVS |
Alpharetta | GA | — | (1) | 572 | 858 | — | 1,430 | 64 | 9/28/2012 | 1994 | |||||||||||||||||||||||||
| CVS |
Stockbridge | GA | — | (1) | 855 | 1,283 | — | 2,138 | 64 | 2/28/2013 | 1998 | |||||||||||||||||||||||||
| CVS |
Vidalia | GA | — | (1) | 368 | 1,105 | — | 1,473 | 83 | 9/28/2012 | 2000 | |||||||||||||||||||||||||
| CVS |
Franklin | IN | — | (1) | 310 | 2,787 | — | 3,097 | 293 | 3/29/2012 | 1999 | |||||||||||||||||||||||||
| CVS |
Mandeville | LA | — | 2,385 | 2,915 | — | 5,300 | 44 | 10/1/2013 | 2012 | ||||||||||||||||||||||||||
| CVS |
Metairie | LA | — | 1,895 | 3,519 | — | 5,414 | 53 | 10/1/2013 | 2012 | ||||||||||||||||||||||||||
| CVS |
New Orleans | LA | — | 2,439 | 2,439 | — | 4,878 | 37 | 10/1/2013 | 2012 | ||||||||||||||||||||||||||
| CVS |
Slidell | LA | — | 1,142 | 4,568 | — | 5,710 | 69 | 10/1/2013 | 2012 | ||||||||||||||||||||||||||
| CVS |
Hingham | MA | — | 1,873 | 5,619 | — | 7,492 | 84 | 10/1/2013 | 2012 | ||||||||||||||||||||||||||
| CVS |
Malden | MA | — | 1,757 | 5,271 | — | 7,028 | 79 | 10/1/2013 | 2012 | ||||||||||||||||||||||||||
| CVS |
Detroit | MI | — | (1) | 270 | 2,427 | — | 2,697 | 121 | 2/28/2013 | 1999 | |||||||||||||||||||||||||
| CVS |
Harper Woods | MI | — | (1) | 499 | 2,829 | — | 3,328 | 141 | 2/28/2013 | 1999 | |||||||||||||||||||||||||
| CVS |
St. Joseph | MO | — | 1,022 | 3,067 | — | 4,089 | 46 | 10/1/2013 | 2012 | ||||||||||||||||||||||||||
| CVS |
Beaufort | NC | — | 378 | 3,404 | — | 3,782 | 51 | 10/1/2013 | 2011 | ||||||||||||||||||||||||||
| CVS |
Albuquerque | NM | — | 975 | 3,899 | — | 4,874 | 58 | 10/1/2013 | 2011 | ||||||||||||||||||||||||||
| CVS |
Albuquerque | NM | — | 1,029 | 4,118 | — | 5,147 | 62 | 10/1/2013 | 2011 | ||||||||||||||||||||||||||
| CVS |
Las Cruces | NM | — | 1,295 | 5,178 | — | 6,473 | 78 | 10/1/2013 | 2012 | ||||||||||||||||||||||||||
| CVS |
Las Vegas | NV | — | 1,374 | 3,207 | — | 4,581 | 257 | 8/22/2012 | 2004 | ||||||||||||||||||||||||||
| CVS |
Rochester | NY | — | (1) | 965 | 1,180 | — | 2,145 | 83 | 11/8/2012 | 1997 | |||||||||||||||||||||||||
| CVS |
Tulsa | OK | — | 950 | 2,216 | — | 3,166 | 33 | 10/1/2013 | 2010 | ||||||||||||||||||||||||||
| CVS |
Freeland | PA | — | 122 | 1,096 | — | 1,218 | 93 | 8/8/2012 | 2004 | ||||||||||||||||||||||||||
| CVS |
Mechanicsburg | PA | — | 1,155 | 3,465 | — | 4,620 | 225 | 11/29/2012 | 2008 | ||||||||||||||||||||||||||
| CVS |
Shippensburg | PA | — | 351 | 1,988 | — | 2,339 | 109 | 2/8/2013 | 2002 | ||||||||||||||||||||||||||
| CVS |
Greenville | SC | — | (1) | 169 | 1,520 | — | 1,689 | 76 | 2/28/2013 | 1997 | |||||||||||||||||||||||||
| CVS |
Jackson | TN | — | 1,209 | 2,822 | — | 4,031 | 42 | 10/1/2013 | 2012 | ||||||||||||||||||||||||||
| CVS |
Knoxville | TN | — | 1,190 | 2,210 | — | 3,400 | 33 | 10/1/2013 | 2011 | ||||||||||||||||||||||||||
| CVS |
Nashville | TN | — | (1) | 203 | 1,148 | — | 1,351 | 86 | 9/28/2012 | 1996 | |||||||||||||||||||||||||
| CVS |
Converse | TX | — | 1,390 | 3,243 | — | 4,633 | 49 | 10/1/2013 | 2011 | ||||||||||||||||||||||||||
| CVS |
Dumas | TX | — | 846 | 2,537 | — | 3,383 | 38 | 10/1/2013 | 2011 | ||||||||||||||||||||||||||
| CVS |
Elsa | TX | — | 915 | 2,744 | — | 3,659 | 41 | 10/1/2013 | 2011 | ||||||||||||||||||||||||||
| CVS |
Fort Worth | TX | — | 2,453 | 3,679 | — | 6,132 | 55 | 10/1/2013 | 2011 | ||||||||||||||||||||||||||
F-83
Table of Contents
| Initial Costs | ||||||||||||||||||||||||||||||||||||
| Property |
City |
State |
Encumbrances at December 31, 2013 |
Land | Buildings, Fixtures and Improvements |
Costs Capitalized Subsequent to Acquisition |
Gross Amount Carried at December 31, 2013 (10) (11) |
Accumulated Depreciation (12) (13) |
Date Acquired |
Date of Construction |
||||||||||||||||||||||||||
| CVS |
San Antonio | TX | $ | — | $ | 1,996 | $ | 2,993 | $ | — | $ | 4,989 | $ | 45 | 10/1/2013 | 2011 | ||||||||||||||||||||
| CVS |
San Antonio | TX | — | 2,034 | 3,778 | — | 5,812 | 57 | 10/1/2013 | 2011 | ||||||||||||||||||||||||||
| CVS |
San Antonio | TX | — | 868 | 2,605 | — | 3,473 | 39 | 10/1/2013 | 2012 | ||||||||||||||||||||||||||
| CVS |
San Juan | TX | — | 610 | 2,441 | — | 3,051 | 37 | 10/1/2013 | 2012 | ||||||||||||||||||||||||||
| CVS |
Norfolk | VA | — | 697 | 2,789 | — | 3,486 | 42 | 10/1/2013 | 2011 | ||||||||||||||||||||||||||
| CVS |
Portsmouth | VA | — | 1,230 | 3,690 | — | 4,920 | 55 | 10/1/2013 | 2012 | ||||||||||||||||||||||||||
| CVS |
Roanoke | VA | — | 825 | 2,474 | — | 3,299 | 37 | 10/1/2013 | 2011 | ||||||||||||||||||||||||||
| CVS |
Virginia Beach | VA | — | 683 | 3,868 | — | 4,551 | 58 | 10/1/2013 | 2012 | ||||||||||||||||||||||||||
| CVS |
Williamsburg | VA | — | 907 | 5,137 | — | 6,044 | 77 | 10/1/2013 | 2011 | ||||||||||||||||||||||||||
| Dairy Queen |
Mauldin | SC | — | (1) | 133 | — | — | 133 | — | 6/27/2013 | 1979 | |||||||||||||||||||||||||
| Dairy Queen |
Alto | TX | — | (1) | 50 | 110 | — | 160 | 3 | 6/27/2013 | 1972 | |||||||||||||||||||||||||
| Dairy Queen |
Pineland | TX | — | (1) | 40 | 120 | — | 160 | 3 | 6/27/2013 | 1989 | |||||||||||||||||||||||||
| Dairy Queen |
Silsbee | TX | — | (1) | 60 | 100 | — | 160 | 3 | 6/27/2013 | 1988 | |||||||||||||||||||||||||
| DaVita Dialysis |
Osceola | AR | — | (1) | 137 | 1,232 | — | 1,369 | 43 | 3/28/2013 | 2009 | |||||||||||||||||||||||||
| DaVita Dialysis |
Allen Park | MI | — | (1) | 209 | 1,885 | — | 2,094 | 102 | 12/31/2012 | 1955 | |||||||||||||||||||||||||
| DaVita Dialysis |
St. Pauls | NC | — | (1) | 138 | 1,246 | — | 1,384 | 24 | 8/2/2013 | 2006 | |||||||||||||||||||||||||
| DaVita Dialysis |
Beeville | TX | — | (1) | 99 | 1,879 | — | 1,978 | 102 | 12/31/2012 | 2002 | |||||||||||||||||||||||||
| DaVita Dialysis |
Federal Way | WA | — | 1,929 | 22,357 | — | 24,286 | 1,509 | 11/21/2012 | 2000 | ||||||||||||||||||||||||||
| DC Sports Bar & Steakhouse |
Eunice | LA | — | (1) | 500 | 262 | — | 762 | 8 | 6/27/2013 | 1987 | |||||||||||||||||||||||||
| Del Monte Corporation |
Lathrop | CA | 32,694 | — | 41,318 | — | 41,318 | 420 | 11/5/2013 | 1994 | ||||||||||||||||||||||||||
| Denny’s |
Winter Springs | FL | — | (1) | 550 | 1,668 | — | 2,218 | 48 | 6/27/2013 | 1994 | |||||||||||||||||||||||||
| Denny’s |
Merriam | KS | — | (1) | 390 | 1,150 | — | 1,540 | 33 | 6/27/2013 | 1981 | |||||||||||||||||||||||||
| Denny’s |
Topeka | KS | — | (1) | 630 | 446 | — | 1,076 | 13 | 6/27/2013 | 1989 | |||||||||||||||||||||||||
| Denny’s |
Branson | MO | — | (1) | 620 | 2,209 | — | 2,829 | 63 | 6/27/2013 | 1995 | |||||||||||||||||||||||||
| Denny’s |
Kansas City | MO | — | (1) | 750 | 686 | — | 1,436 | 20 | 6/27/2013 | 1997 | |||||||||||||||||||||||||
| Denny’s |
North Kansas City | MO | — | (1) | 630 | 937 | — | 1,567 | 27 | 6/27/2013 | 1979 | |||||||||||||||||||||||||
| Denny’s |
Sedalia | MO | — | (1) | 500 | 783 | — | 1,283 | 22 | 6/27/2013 | 1985 | |||||||||||||||||||||||||
| Denny’s |
Black Mountain | NC | — | (1) | 210 | 505 | — | 715 | 14 | 6/27/2013 | 1992 | |||||||||||||||||||||||||
| Denny’s |
Mooresville | NC | — | (1) | 250 | 841 | — | 1,091 | 24 | 6/27/2013 | 1992 | |||||||||||||||||||||||||
| Denny’s |
Watertown | NY | — | (1) | 330 | 1,107 | — | 1,437 | 32 | 6/27/2013 | 1987 | |||||||||||||||||||||||||
| Denny’s |
Fremont | OH | — | (1) | 320 | 975 | — | 1,295 | 28 | 6/27/2013 | 1992 | |||||||||||||||||||||||||
| Denny’s |
Ontario | OR | — | (1) | 240 | 1,067 | — | 1,307 | 31 | 6/27/2013 | 1978 | |||||||||||||||||||||||||
| Denny’s |
Columbia | SC | — | (1) | 490 | 1,115 | — | 1,605 | 32 | 6/27/2013 | 1998 | |||||||||||||||||||||||||
| Denny’s |
Greenville | SC | — | (1) | 570 | 554 | — | 1,124 | 16 | 6/27/2013 | 1985 | |||||||||||||||||||||||||
| Denny’s |
Pasadena | TX | — | (1) | 500 | 1,316 | — | 1,816 | 38 | 6/27/2013 | 1981 | |||||||||||||||||||||||||
| Dollar General |
Birmingham | AL | — | (1) | 156 | 882 | — | 1,038 | 78 | 6/6/2012 | 2012 | |||||||||||||||||||||||||
| Dollar General |
Chunchula | AL | — | (1) | 174 | 697 | — | 871 | 65 | 4/25/2012 | 2012 | |||||||||||||||||||||||||
| Dollar General |
Moulton | AL | — | (1) | 517 | 1,207 | — | 1,724 | 113 | 4/26/2012 | 2012 | |||||||||||||||||||||||||
| Dollar General |
Gardendale | AL | — | (1) | 142 | 805 | — | 947 | 64 | 8/9/2012 | 2012 | |||||||||||||||||||||||||
| Dollar General |
Red Level | AL | — | 120 | 680 | — | 800 | 83 | 10/31/2011 | 2010 | ||||||||||||||||||||||||||
| Dollar General |
Tarrant | AL | — | (5) | 217 | 869 | — | 1,086 | 102 | 12/12/2011 | 2011 | |||||||||||||||||||||||||
| Dollar General |
Tuscaloosa | AL | — | 133 | 756 | — | 889 | 85 | 12/30/2011 | 2011 | ||||||||||||||||||||||||||
| Dollar General |
Ash Flat | AR | — | (1) | 44 | 132 | — | 176 | 11 | 6/19/2012 | 1997 | |||||||||||||||||||||||||
| Dollar General |
Batesville | AR | — | (1) | 32 | 285 | — | 317 | 7 | 7/25/2013 | 1998 | |||||||||||||||||||||||||
| Dollar General |
Batesville | AR | — | (1) | 42 | 374 | — | 416 | 9 | 7/25/2013 | 1999 | |||||||||||||||||||||||||
| Dollar General |
Beebe | AR | — | (1) | 51 | 458 | — | 509 | 11 | 7/25/2013 | 1999 | |||||||||||||||||||||||||
| Dollar General |
Bella Vista | AR | — | (1) | 129 | 302 | — | 431 | 37 | 11/10/2011 | 2005 | |||||||||||||||||||||||||
| Dollar General |
Bergman | AR | — | (1) | 113 | 639 | — | 752 | 54 | 7/2/2012 | 2011 | |||||||||||||||||||||||||
| Dollar General |
Blytheville | AR | — | (1) | 30 | 274 | — | 304 | 6 | 7/25/2013 | 2000 | |||||||||||||||||||||||||
| Dollar General |
Carlisle | AR | — | (1) | 13 | 245 | — | 258 | 30 | 11/10/2011 | 2005 | |||||||||||||||||||||||||
| Dollar General |
Des Arc | AR | — | (1) | 56 | 508 | — | 564 | 12 | 7/25/2013 | 1999 | |||||||||||||||||||||||||
| Dollar General |
Dumas | AR | — | (1) | 46 | 412 | — | 458 | 10 | 7/25/2013 | 1998 | |||||||||||||||||||||||||
| Dollar General |
Flippin | AR | — | (1) | 53 | 64 | — | 117 | 5 | 6/19/2012 | 1994 | |||||||||||||||||||||||||
| Dollar General |
Gassville | AR | — | (1) | 54 | 305 | — | 359 | 7 | 7/25/2013 | 1999 | |||||||||||||||||||||||||
| Dollar General |
Green Forest | AR | — | (1) | 52 | 293 | — | 345 | 36 | 11/10/2011 | 2005 | |||||||||||||||||||||||||
| Dollar General |
Higdon | AR | — | (1) | 52 | 469 | — | 521 | 11 | 7/25/2013 | 1999 | |||||||||||||||||||||||||
F-84
Table of Contents
| Initial Costs | ||||||||||||||||||||||||||||||||||||
| Property |
City |
State |
Encumbrances at December 31, 2013 |
Land | Buildings, Fixtures and Improvements |
Costs Capitalized Subsequent to Acquisition |
Gross Amount Carried at December 31, 2013 (10) (11) |
Accumulated Depreciation (12) (13) |
Date Acquired |
Date of Construction |
||||||||||||||||||||||||||
| Dollar General |
Lake Village | AR | $ | — | (1) | $ | 64 | $ | 362 | $ | — | $ | 426 | $ | 8 | 7/25/2013 | 1998 | |||||||||||||||||||
| Dollar General |
Lepanto | AR | — | (1) | 43 | 389 | — | 432 | 9 | 7/25/2013 | 1998 | |||||||||||||||||||||||||
| Dollar General |
Little Rock | AR | — | (1) | 73 | 412 | — | 485 | 10 | 7/25/2013 | 1999 | |||||||||||||||||||||||||
| Dollar General |
Marvell | AR | — | (1) | 40 | 358 | — | 398 | 8 | 7/25/2013 | 1999 | |||||||||||||||||||||||||
| Dollar General |
Maynard | AR | — | (1) | 73 | 654 | — | 727 | 40 | 12/4/2012 | 2011 | |||||||||||||||||||||||||
| Dollar General |
McGehee | AR | — | (1) | 25 | 228 | — | 253 | 5 | 7/25/2013 | 1998 | |||||||||||||||||||||||||
| Dollar General |
Quitman | AR | — | (1) | 45 | 405 | — | 450 | 9 | 7/25/2013 | 2001 | |||||||||||||||||||||||||
| Dollar General |
Searcy | AR | — | (1) | 29 | 263 | — | 292 | 6 | 7/25/2013 | 1998 | |||||||||||||||||||||||||
| Dollar General |
Tuckerman | AR | — | (1) | 49 | 280 | — | 329 | 7 | 7/25/2013 | 1999 | |||||||||||||||||||||||||
| Dollar General |
Whitehall | AR | — | (1) | 43 | 388 | — | 431 | 9 | 7/25/2013 | 1999 | |||||||||||||||||||||||||
| Dollar General |
Wooster | AR | — | (1) | 74 | 664 | — | 738 | 40 | 12/4/2012 | 2011 | |||||||||||||||||||||||||
| Dollar General |
Grand Ridge | FL | — | 76 | 684 | — | 760 | 77 | 12/30/2011 | 2010 | ||||||||||||||||||||||||||
| Dollar General |
Molina | FL | — | 178 | 1,007 | — | 1,185 | 123 | 10/31/2011 | 2010 | ||||||||||||||||||||||||||
| Dollar General |
Panama City | FL | — | (1) | 139 | 312 | — | 451 | 23 | 6/19/2012 | 1987 | |||||||||||||||||||||||||
| Dollar General |
Chariton | IA | — | (1) | 165 | 934 | — | 1,099 | 70 | 8/31/2012 | 2012 | |||||||||||||||||||||||||
| Dollar General |
Estherville | IA | — | (1) | 226 | 903 | — | 1,129 | 59 | 10/25/2012 | 2012 | |||||||||||||||||||||||||
| Dollar General |
Hampton | IA | — | (5) | 188 | 751 | — | 939 | 81 | 2/1/2012 | 2012 | |||||||||||||||||||||||||
| Dollar General |
Lake Milles | IA | — | (5) | 81 | 728 | — | 809 | 78 | 2/1/2012 | 2012 | |||||||||||||||||||||||||
| Dollar General |
Nashua | IA | — | (1) | 136 | 768 | — | 904 | 58 | 9/6/2012 | 2012 | |||||||||||||||||||||||||
| Dollar General |
Ottumwa | IA | — | (1) | 143 | 812 | — | 955 | 42 | 1/31/2013 | 2012 | |||||||||||||||||||||||||
| Dollar General |
Altamont | IL | — | (6) | 211 | 844 | — | 1,055 | 87 | 3/9/2012 | 2012 | |||||||||||||||||||||||||
| Dollar General |
Carthage | IL | — | (1) | 48 | 908 | — | 956 | 68 | 8/31/2012 | 2012 | |||||||||||||||||||||||||
| Dollar General |
Jacksonville | IL | — | (1) | 145 | 823 | — | 968 | 62 | 8/31/2012 | 2012 | |||||||||||||||||||||||||
| Dollar General |
Jonesboro | IL | — | (1) | 77 | 309 | — | 386 | 38 | 11/10/2011 | 2007 | |||||||||||||||||||||||||
| Dollar General |
Lexington | IL | — | (1) | 100 | 899 | — | 999 | 63 | 9/21/2012 | 2012 | |||||||||||||||||||||||||
| Dollar General |
Marion | IL | — | (1) | 153 | 867 | — | 1,020 | 61 | 9/24/2012 | 2012 | |||||||||||||||||||||||||
| Dollar General |
Mt Morris | IL | — | (1) | 97 | 877 | — | 974 | 49 | 12/17/2012 | 2012 | |||||||||||||||||||||||||
| Dollar General |
Monroeville | IN | — | (5) | 112 | 636 | — | 748 | 71 | 12/22/2011 | 2011 | |||||||||||||||||||||||||
| Dollar General |
Auburn | KS | — | (1) | 42 | 801 | — | 843 | 60 | 8/31/2012 | 2009 | |||||||||||||||||||||||||
| Dollar General |
Caney | KS | — | (1) | 31 | 178 | — | 209 | 15 | 6/19/2012 | 2002 | |||||||||||||||||||||||||
| Dollar General |
Cottonwood Falls | KS | — | (1) | 89 | 802 | — | 891 | 60 | 8/31/2012 | 2009 | |||||||||||||||||||||||||
| Dollar General |
Erie | KS | — | (1) | 42 | 790 | — | 832 | 59 | 8/31/2012 | 2009 | |||||||||||||||||||||||||
| Dollar General |
Garden City | KS | — | (1) | 136 | 771 | — | 907 | 58 | 8/31/2012 | 2010 | |||||||||||||||||||||||||
| Dollar General |
Harper | KS | — | (1) | 91 | 818 | — | 909 | 61 | 8/31/2012 | 2009 | |||||||||||||||||||||||||
| Dollar General |
Humboldt | KS | — | (1) | 44 | 828 | — | 872 | 62 | 8/31/2012 | 2009 | |||||||||||||||||||||||||
| Dollar General |
Kingman | KS | — | (1) | 142 | 804 | — | 946 | 60 | 8/31/2012 | 2010 | |||||||||||||||||||||||||
| Dollar General |
Medicine Lodge | KS | — | (1) | 40 | 765 | — | 805 | 57 | 8/31/2012 | 2010 | |||||||||||||||||||||||||
| Dollar General |
Minneapolis | KS | — | (1) | 43 | 816 | — | 859 | 61 | 8/31/2012 | 2010 | |||||||||||||||||||||||||
| Dollar General |
Pomona | KS | — | (1) | 42 | 796 | — | 838 | 60 | 8/31/2012 | 2009 | |||||||||||||||||||||||||
| Dollar General |
Sedan | KS | — | (1) | 42 | 792 | — | 834 | 59 | 8/31/2012 | 2009 | |||||||||||||||||||||||||
| Dollar General |
Syracuse | KS | — | (1) | 43 | 817 | — | 860 | 61 | 8/31/2012 | 2010 | |||||||||||||||||||||||||
| Dollar General |
Nancy | KY | — | (1) | 81 | 733 | — | 814 | 69 | 4/26/2012 | 2011 | |||||||||||||||||||||||||
| Dollar General |
Choudrant | LA | — | 83 | 745 | — | 828 | 80 | 2/6/2012 | 2011 | ||||||||||||||||||||||||||
| Dollar General |
Converse | LA | — | (1) | 84 | 756 | — | 840 | 53 | 9/26/2012 | 2012 | |||||||||||||||||||||||||
| Dollar General |
Doyline | LA | — | (1) | 88 | 793 | — | 881 | 48 | 11/27/2012 | 2012 | |||||||||||||||||||||||||
| Dollar General |
Gardner | LA | — | (6) | 138 | 784 | — | 922 | 81 | 3/8/2012 | 2012 | |||||||||||||||||||||||||
| Dollar General |
Jonesville | LA | — | (1) | 103 | 929 | — | 1,032 | 65 | 9/27/2012 | 2012 | |||||||||||||||||||||||||
| Dollar General |
Keithville | LA | — | (1) | 83 | 750 | — | 833 | 60 | 7/26/2012 | 2012 | |||||||||||||||||||||||||
| Dollar General |
Lake Charles | LA | — | 102 | 919 | — | 1,021 | 95 | 2/29/2012 | 2012 | ||||||||||||||||||||||||||
| Dollar General |
Mangham | LA | — | 40 | 759 | — | 799 | 82 | 2/6/2012 | 2011 | ||||||||||||||||||||||||||
| Dollar General |
Mt. Hermon | LA | — | (1) | 94 | 842 | — | 936 | 91 | 2/6/2012 | 2011 | |||||||||||||||||||||||||
| Dollar General |
New Iberia | LA | — | (1) | 315 | 736 | — | 1,051 | 69 | 4/26/2012 | 2011 | |||||||||||||||||||||||||
| Dollar General |
Patterson | LA | — | 259 | 1,035 | — | 1,294 | 97 | 4/26/2012 | 2011 | ||||||||||||||||||||||||||
| Dollar General |
Richwood | LA | — | (1) | 97 | 869 | — | 966 | 94 | 2/6/2012 | 2011 | |||||||||||||||||||||||||
| Dollar General |
Sarepta | LA | — | (1) | 131 | 743 | — | 874 | 59 | 8/9/2012 | 2011 | |||||||||||||||||||||||||
| Dollar General |
West Monroe | LA | — | (1) | 153 | 869 | — | 1,022 | 89 | 3/9/2012 | 2012 | |||||||||||||||||||||||||
| Dollar General |
Zachary | LA | — | (1) | 248 | 743 | — | 991 | 70 | 4/26/2012 | 2011 | |||||||||||||||||||||||||
F-85
Table of Contents
| Initial Costs | ||||||||||||||||||||||||||||||||||||
| Property |
City |
State |
Encumbrances at December 31, 2013 |
Land | Buildings, Fixtures and Improvements |
Costs Capitalized Subsequent to Acquisition |
Gross Amount Carried at December 31, 2013 (10) (11) |
Accumulated Depreciation (12) (13) |
Date Acquired |
Date of Construction |
||||||||||||||||||||||||||
| Dollar General |
Bangor | MI | $ | — | (1) | $ | 173 | $ | 691 | $ | — | $ | 864 | $ | 58 | 7/10/2012 | 2012 | |||||||||||||||||||
| Dollar General |
Cadillac | MI | — | (6) | 187 | 747 | — | 934 | 73 | 3/16/2012 | 2012 | |||||||||||||||||||||||||
| Dollar General |
Carleton | MI | — | (6) | 222 | 666 | — | 888 | 65 | 3/16/2012 | 2011 | |||||||||||||||||||||||||
| Dollar General |
Covert | MI | — | (1) | 37 | 704 | — | 741 | 53 | 8/30/2012 | 2012 | |||||||||||||||||||||||||
| Dollar General |
Durand | MI | — | (1) | 181 | 726 | — | 907 | 65 | 5/18/2012 | 2012 | |||||||||||||||||||||||||
| Dollar General |
East Jordan | MI | — | (1) | 125 | 709 | — | 834 | 60 | 7/10/2012 | 2012 | |||||||||||||||||||||||||
| Dollar General |
Flint | MI | — | (6) | 83 | 743 | — | 826 | 66 | 5/18/2012 | 2012 | |||||||||||||||||||||||||
| Dollar General |
Flint | MI | — | (1) | 91 | 820 | — | 911 | 54 | 10/31/2012 | 2012 | |||||||||||||||||||||||||
| Dollar General |
Gaylord | MI | — | (1) | 172 | 687 | — | 859 | 58 | 7/10/2012 | 2012 | |||||||||||||||||||||||||
| Dollar General |
Iron River | MI | — | (1) | 86 | 777 | — | 863 | 58 | 8/30/2012 | 2012 | |||||||||||||||||||||||||
| Dollar General |
Melvindale | MI | — | (1) | 242 | 967 | — | 1,209 | 81 | 6/26/2012 | 2012 | |||||||||||||||||||||||||
| Dollar General |
Negaunee | MI | — | (1) | 87 | 779 | — | 866 | 58 | 8/30/2012 | 2012 | |||||||||||||||||||||||||
| Dollar General |
Roscommon | MI | — | (1) | 87 | 781 | — | 868 | 58 | 8/30/2012 | 2012 | |||||||||||||||||||||||||
| Dollar General |
Melrose | MN | — | (1) | 96 | 863 | — | 959 | 48 | 12/17/2012 | 2012 | |||||||||||||||||||||||||
| Dollar General |
Montgomery | MN | — | (1) | 87 | 783 | — | 870 | 44 | 12/17/2012 | 2012 | |||||||||||||||||||||||||
| Dollar General |
Olivia | MN | — | (1) | 98 | 884 | — | 982 | 46 | 1/31/2013 | 2012 | |||||||||||||||||||||||||
| Dollar General |
Rush City | MN | — | (1) | 126 | 716 | — | 842 | 57 | 7/25/2012 | 2012 | |||||||||||||||||||||||||
| Dollar General |
Springfield | MN | — | (1) | 88 | 795 | — | 883 | 45 | 12/26/2012 | 2012 | |||||||||||||||||||||||||
| Dollar General |
Virginia | MN | — | (1) | 147 | 831 | — | 978 | 47 | 1/14/2013 | 2012 | |||||||||||||||||||||||||
| Dollar General |
Appleton City | MO | — | (1) | 22 | 124 | — | 146 | 15 | 11/10/2011 | 2004 | |||||||||||||||||||||||||
| Dollar General |
Ash Grove | MO | — | (1) | 35 | 315 | — | 350 | 38 | 11/10/2011 | 2006 | |||||||||||||||||||||||||
| Dollar General |
Ashland | MO | — | (1) | 70 | 398 | — | 468 | 48 | 11/10/2011 | 2006 | |||||||||||||||||||||||||
| Dollar General |
Auxvasse | MO | — | (2) | 72 | 650 | — | 722 | 76 | 11/22/2011 | 2011 | |||||||||||||||||||||||||
| Dollar General |
Belton | MO | — | (1) | 105 | 948 | — | 1,053 | 75 | 8/3/2012 | 2012 | |||||||||||||||||||||||||
| Dollar General |
Berkeley | MO | — | (1) | 132 | 748 | — | 880 | 53 | 10/9/2012 | 2012 | |||||||||||||||||||||||||
| Dollar General |
Bernie | MO | — | (1) | 35 | 314 | — | 349 | 38 | 11/10/2011 | 2007 | |||||||||||||||||||||||||
| Dollar General |
Bloomfield | MO | — | (1) | 23 | 209 | — | 232 | 25 | 11/10/2011 | 2005 | |||||||||||||||||||||||||
| Dollar General |
Cardwell | MO | — | (1) | 89 | 805 | — | 894 | 60 | 8/24/2012 | 2012 | |||||||||||||||||||||||||
| Dollar General |
Carterville | MO | — | (8) | 10 | 192 | — | 202 | 23 | 11/10/2011 | 2004 | |||||||||||||||||||||||||
| Dollar General |
Caruthersville | MO | — | (1) | 98 | 878 | — | 976 | 62 | 9/27/2012 | 2012 | |||||||||||||||||||||||||
| Dollar General |
Clarkton | MO | — | (1) | 19 | 354 | — | 373 | 43 | 11/10/2011 | 2007 | |||||||||||||||||||||||||
| Dollar General |
Clever | MO | — | (1) | 136 | 542 | — | 678 | 46 | 6/19/2012 | 2010 | |||||||||||||||||||||||||
| Dollar General |
Concordia | MO | — | (1) | 40 | 161 | — | 201 | 14 | 6/19/2012 | 1998 | |||||||||||||||||||||||||
| Dollar General |
Conway | MO | — | (2) | 37 | 694 | — | 731 | 81 | 11/22/2011 | 2011 | |||||||||||||||||||||||||
| Dollar General |
Diamond | MO | — | (1) | 44 | 175 | — | 219 | 21 | 11/10/2011 | 2005 | |||||||||||||||||||||||||
| Dollar General |
Edina | MO | — | (1) | 127 | 722 | — | 849 | 54 | 9/13/2012 | 2012 | |||||||||||||||||||||||||
| Dollar General |
Ellsinore | MO | — | (8) | 30 | 579 | — | 609 | 70 | 11/10/2011 | 2010 | |||||||||||||||||||||||||
| Dollar General |
Gower | MO | — | (1) | 118 | 668 | — | 786 | 50 | 8/31/2012 | 2012 | |||||||||||||||||||||||||
| Dollar General |
Greenfield | MO | — | (1) | 42 | 378 | — | 420 | 32 | 6/19/2012 | 2000 | |||||||||||||||||||||||||
| Dollar General |
Hallsville | MO | — | (8) | 29 | 263 | — | 292 | 32 | 11/10/2011 | 2004 | |||||||||||||||||||||||||
| Dollar General |
Hawk Point | MO | — | (1) | 177 | 709 | — | 886 | 53 | 8/24/2012 | 2012 | |||||||||||||||||||||||||
| Dollar General |
Humansville | MO | — | (1) | 69 | 277 | — | 346 | 23 | 6/19/2012 | 2007 | |||||||||||||||||||||||||
| Dollar General |
Jennings | MO | — | (1) | 445 | 826 | — | 1,271 | 70 | 7/13/2012 | 2012 | |||||||||||||||||||||||||
| Dollar General |
Kansas City | MO | — | (1) | 313 | 731 | — | 1,044 | 51 | 9/21/2012 | 2012 | |||||||||||||||||||||||||
| Dollar General |
King City | MO | — | (2) | 33 | 625 | — | 658 | 73 | 11/22/2011 | 2010 | |||||||||||||||||||||||||
| Dollar General |
Lawson | MO | — | (1) | 29 | 162 | — | 191 | 20 | 11/10/2011 | 2003 | |||||||||||||||||||||||||
| Dollar General |
Lebanon | MO | — | (1) | 278 | 835 | — | 1,113 | 59 | 9/26/2012 | 2012 | |||||||||||||||||||||||||
| Dollar General |
Lebanon | MO | — | (1) | 177 | 708 | — | 885 | 50 | 9/24/2012 | 2012 | |||||||||||||||||||||||||
| Dollar General |
Licking | MO | — | (2) | 76 | 688 | — | 764 | 80 | 11/22/2011 | 2010 | |||||||||||||||||||||||||
| Dollar General |
Lilbourne | MO | — | (8) | 62 | 554 | — | 616 | 67 | 11/10/2011 | 2010 | |||||||||||||||||||||||||
| Dollar General |
Marble Hill | MO | — | (1) | 104 | 935 | — | 1,039 | 70 | 9/11/2012 | 2012 | |||||||||||||||||||||||||
| Dollar General |
Marionville | MO | — | (1) | 89 | 797 | — | 886 | 52 | 10/31/2012 | 2012 | |||||||||||||||||||||||||
| Dollar General |
Marthasville | MO | — | 41 | 782 | — | 823 | 84 | 2/1/2012 | 2011 | ||||||||||||||||||||||||||
| Dollar General |
Maysville | MO | — | (2) | 107 | 607 | — | 714 | 74 | 10/31/2011 | 2010 | |||||||||||||||||||||||||
| Dollar General |
Morehouse | MO | — | (1) | 87 | 783 | — | 870 | 59 | 9/7/2012 | 2012 | |||||||||||||||||||||||||
| Dollar General |
New Haven | MO | — | (1) | 176 | 702 | — | 878 | 66 | 4/27/2012 | 2012 | |||||||||||||||||||||||||
| Dollar General |
Oak Grove | MO | — | (1) | 27 | 106 | — | 133 | 9 | 6/19/2012 | 1999 | |||||||||||||||||||||||||
F-86
Table of Contents
| Initial Costs | ||||||||||||||||||||||||||||||||||||
| Property |
City |
State |
Encumbrances at December 31, 2013 |
Land | Buildings, Fixtures and Improvements |
Costs Capitalized Subsequent to Acquisition |
Gross Amount Carried at December 31, 2013 (10) (11) |
Accumulated Depreciation (12) (13) |
Date Acquired |
Date of Construction |
||||||||||||||||||||||||||
| Dollar General |
Oran | MO | $ | — | (6) | $ | 83 | $ | 747 | $ | — | $ | 830 | $ | 73 | 3/30/2012 | 2012 | |||||||||||||||||||
| Dollar General |
Osceola | MO | — | (1) | 93 | 835 | — | 928 | 39 | 2/19/2013 | 2012 | |||||||||||||||||||||||||
| Dollar General |
Ozark | MO | — | (6) | 190 | 758 | — | 948 | 71 | 4/27/2012 | 2012 | |||||||||||||||||||||||||
| Dollar General |
Ozark | MO | — | (1) | 149 | 842 | — | 991 | 59 | 9/24/2012 | 2012 | |||||||||||||||||||||||||
| Dollar General |
Pacific | MO | — | (1) | 151 | 853 | — | 1,004 | 76 | 6/6/2012 | 2012 | |||||||||||||||||||||||||
| Dollar General |
Palmyra | MO | — | (1) | 40 | 225 | — | 265 | 19 | 6/19/2012 | 2003 | |||||||||||||||||||||||||
| Dollar General |
Plattsburg | MO | — | (1) | 44 | 843 | — | 887 | 67 | 8/9/2012 | 2012 | |||||||||||||||||||||||||
| Dollar General |
Qulin | MO | — | (8) | 30 | 573 | — | 603 | 70 | 11/10/2011 | 2009 | |||||||||||||||||||||||||
| Dollar General |
Robertsville | MO | — | (1) | 131 | 744 | — | 875 | 56 | 8/24/2012 | 2011 | |||||||||||||||||||||||||
| Dollar General |
Rocky Mount | MO | — | (1) | 88 | 789 | — | 877 | 59 | 8/31/2012 | 2012 | |||||||||||||||||||||||||
| Dollar General |
Sedalia | MO | — | (1) | 273 | 637 | — | 910 | 48 | 9/7/2012 | 2012 | |||||||||||||||||||||||||
| Dollar General |
Senath | MO | — | (1) | 61 | 552 | — | 613 | 47 | 6/19/2012 | 2010 | |||||||||||||||||||||||||
| Dollar General |
Seneca | MO | — | (1) | 47 | 189 | — | 236 | 16 | 6/19/2012 | 1962 | |||||||||||||||||||||||||
| Dollar General |
Sikeston | MO | — | (6) | 56 | 1,056 | — | 1,112 | 109 | 2/24/2012 | 2011 | |||||||||||||||||||||||||
| Dollar General |
Sikeston | MO | — | (1) | 144 | 819 | — | 963 | 61 | 8/24/2012 | 2012 | |||||||||||||||||||||||||
| Dollar General |
Springfield | MO | — | (1) | 378 | 702 | — | 1,080 | 62 | 6/14/2012 | 2012 | |||||||||||||||||||||||||
| Dollar General |
St James | MO | — | (1) | 81 | 244 | — | 325 | 21 | 6/19/2012 | 1999 | |||||||||||||||||||||||||
| Dollar General |
St. Clair | MO | — | 220 | 879 | — | 1,099 | 99 | 12/30/2011 | 2011 | ||||||||||||||||||||||||||
| Dollar General |
St. Louis | MO | — | (1) | 372 | 692 | — | 1,064 | 52 | 8/31/2012 | 2012 | |||||||||||||||||||||||||
| Dollar General |
St. Louis | MO | — | (1) | 260 | 606 | — | 866 | 43 | 9/26/2012 | 2012 | |||||||||||||||||||||||||
| Dollar General |
Stanberry | MO | — | (3) | 111 | 629 | — | 740 | 74 | 11/22/2011 | 2010 | |||||||||||||||||||||||||
| Dollar General |
Steele | MO | — | (8) | 31 | 598 | — | 629 | 73 | 11/10/2011 | 2009 | |||||||||||||||||||||||||
| Dollar General |
Strafford | MO | — | (8) | 51 | 461 | 10 | 522 | 56 | 11/10/2011 | 2009 | |||||||||||||||||||||||||
| Dollar General |
Vienna | MO | — | (6) | 78 | 704 | — | 782 | 72 | 2/24/2012 | 2011 | |||||||||||||||||||||||||
| Dollar General |
Willow Springs | MO | — | (1) | 24 | 213 | — | 237 | 18 | 6/19/2012 | 2002 | |||||||||||||||||||||||||
| Dollar General |
Winona | MO | — | (1) | 52 | 155 | — | 207 | 13 | 6/19/2012 | 2001 | |||||||||||||||||||||||||
| Dollar General |
Edwards | MS | — | 75 | 671 | — | 746 | 75 | 12/30/2011 | 2011 | ||||||||||||||||||||||||||
| Dollar General |
Greensville | MS | — | 82 | 739 | — | 821 | 83 | 12/30/2011 | 2011 | ||||||||||||||||||||||||||
| Dollar General |
Hickory | MS | — | (1) | 77 | 692 | — | 769 | 58 | 7/2/2012 | 2011 | |||||||||||||||||||||||||
| Dollar General |
Jackson | MS | — | (1) | 198 | 793 | — | 991 | 56 | 9/27/2012 | 2011 | |||||||||||||||||||||||||
| Dollar General |
Meridian | MS | — | (1) | 178 | 713 | — | 891 | 53 | 9/13/2012 | 2011 | |||||||||||||||||||||||||
| Dollar General |
Meridian | MS | — | (1) | 40 | 754 | — | 794 | 56 | 9/13/2012 | 2011 | |||||||||||||||||||||||||
| Dollar General |
Moorhead | MS | — | (6) | 107 | 606 | — | 713 | 57 | 5/1/2012 | 2011 | |||||||||||||||||||||||||
| Dollar General |
Natchez | MS | — | (1) | 166 | 664 | — | 830 | 59 | 6/11/2012 | 2012 | |||||||||||||||||||||||||
| Dollar General |
Soso | MS | — | (6) | 116 | 658 | — | 774 | 65 | 4/12/2012 | 2011 | |||||||||||||||||||||||||
| Dollar General |
Stonewall | MS | — | (1) | 116 | 655 | — | 771 | 55 | 7/2/2012 | 2011 | |||||||||||||||||||||||||
| Dollar General |
Stringer | MS | — | (1) | 116 | 655 | — | 771 | 55 | 7/2/2012 | 2011 | |||||||||||||||||||||||||
| Dollar General |
Walmut Grove | MS | — | 71 | 641 | — | 712 | 72 | 12/30/2011 | 2011 | ||||||||||||||||||||||||||
| Dollar General |
Fayetteville | NC | — | 216 | 647 | — | 863 | 70 | 2/6/2012 | 2011 | ||||||||||||||||||||||||||
| Dollar General |
Hickory | NC | — | (1) | 89 | 804 | — | 893 | 64 | 8/13/2012 | 2012 | |||||||||||||||||||||||||
| Dollar General |
Ocean Isle Beach | NC | — | 341 | 633 | — | 974 | 68 | 2/6/2012 | 2011 | ||||||||||||||||||||||||||
| Dollar General |
Tryon | NC | — | (1) | 139 | 789 | — | 928 | 63 | 8/13/2012 | 2012 | |||||||||||||||||||||||||
| Dollar General |
Vass | NC | — | 226 | 528 | — | 754 | 57 | 2/6/2012 | 2011 | ||||||||||||||||||||||||||
| Dollar General |
Farmington | NM | — | (1) | 269 | 807 | — | 1,076 | 60 | 9/6/2012 | 2012 | |||||||||||||||||||||||||
| Dollar General |
Forest | OH | — | 76 | 681 | — | 757 | 83 | 10/31/2011 | 2010 | ||||||||||||||||||||||||||
| Dollar General |
Greenfield | OH | — | 110 | 986 | — | 1,096 | 102 | 2/23/2012 | 2011 | ||||||||||||||||||||||||||
| Dollar General |
Loudonville | OH | — | (1) | 236 | 945 | — | 1,181 | 84 | 6/6/2012 | 2012 | |||||||||||||||||||||||||
| Dollar General |
Lucasville | OH | — | (1) | 223 | 893 | — | 1,116 | 79 | 5/16/2012 | 2012 | |||||||||||||||||||||||||
| Dollar General |
New Carlisle | OH | — | (1) | 215 | 860 | — | 1,075 | 72 | 7/10/2012 | 2012 | |||||||||||||||||||||||||
| Dollar General |
New Matamoras | OH | — | 123 | 696 | — | 819 | 85 | 10/31/2011 | 2010 | ||||||||||||||||||||||||||
| Dollar General |
Payne | OH | — | (3) | 81 | 729 | — | 810 | 89 | 10/31/2011 | 2010 | |||||||||||||||||||||||||
| Dollar General |
Pleasant City | OH | — | (3) | 131 | 740 | — | 871 | 90 | 10/31/2011 | 2010 | |||||||||||||||||||||||||
| Dollar General |
Calera | OK | — | (1) | 136 | 770 | — | 906 | 58 | 8/31/2012 | 2010 | |||||||||||||||||||||||||
| Dollar General |
Commerce | OK | — | (1) | 38 | 341 | — | 379 | 41 | 11/10/2011 | 2006 | |||||||||||||||||||||||||
| Dollar General |
Hartshorne | OK | — | (1) | 100 | 898 | — | 998 | 67 | 8/31/2012 | 2010 | |||||||||||||||||||||||||
| Dollar General |
Lexington | OK | — | (1) | 85 | 761 | — | 846 | 57 | 8/31/2012 | 2010 | |||||||||||||||||||||||||
| Dollar General |
Maud | OK | — | (1) | 76 | 688 | — | 764 | 51 | 8/31/2012 | 2010 | |||||||||||||||||||||||||
F-87
Table of Contents
| Initial Costs | ||||||||||||||||||||||||||||||||||||
| Property |
City |
State |
Encumbrances at December 31, 2013 |
Land | Buildings, Fixtures and Improvements |
Costs Capitalized Subsequent to Acquisition |
Gross Amount Carried at December 31, 2013 (10) (11) |
Accumulated Depreciation (12) (13) |
Date Acquired |
Date of Construction |
||||||||||||||||||||||||||
| Dollar General |
Maysville | OK | $ | — | (1) | $ | 41 | $ | 785 | $ | — | $ | 826 | $ | 59 | 8/31/2012 | 2010 | |||||||||||||||||||
| Dollar General |
Nowata | OK | — | (1) | 43 | 128 | — | 171 | 11 | 6/19/2012 | 1998 | |||||||||||||||||||||||||
| Dollar General |
Rush Spring | OK | — | (1) | 87 | 779 | — | 866 | 58 | 8/31/2012 | 2010 | |||||||||||||||||||||||||
| Dollar General |
Doyle | TN | — | (1) | 75 | 679 | — | 754 | 51 | 8/22/2012 | 2012 | |||||||||||||||||||||||||
| Dollar General |
Manchester | TN | — | (1) | 114 | 646 | — | 760 | 51 | 7/26/2012 | 2012 | |||||||||||||||||||||||||
| Dollar General |
McMinnville | TN | — | (1) | 120 | 679 | — | 799 | 57 | 7/12/2012 | 2012 | |||||||||||||||||||||||||
| Dollar General |
Pleasant Hill | TN | — | 39 | 747 | — | 786 | 84 | 12/30/2011 | 2011 | ||||||||||||||||||||||||||
| Dollar General |
Academy | TX | — | (1) | 122 | 693 | — | 815 | 65 | 4/27/2012 | 2012 | |||||||||||||||||||||||||
| Dollar General |
Alto Bonito | TX | — | (5) | 163 | 652 | — | 815 | 70 | 2/1/2012 | 2011 | |||||||||||||||||||||||||
| Dollar General |
Blessing | TX | — | (1) | 83 | 745 | — | 828 | 42 | 12/18/2012 | 2012 | |||||||||||||||||||||||||
| Dollar General |
Bryan | TX | — | (1) | 148 | 840 | — | 988 | 63 | 9/14/2012 | 2012 | |||||||||||||||||||||||||
| Dollar General |
Bryan | TX | — | (1) | 193 | 772 | — | 965 | 58 | 9/14/2012 | 2012 | |||||||||||||||||||||||||
| Dollar General |
Bryan | TX | — | (1) | 185 | 740 | — | 925 | 55 | 8/31/2012 | 2009 | |||||||||||||||||||||||||
| Dollar General |
Canyon Lake | TX | — | (1) | 149 | 843 | — | 992 | 59 | 10/12/2012 | 2012 | |||||||||||||||||||||||||
| Dollar General |
Como | TX | — | (6) | 76 | 683 | — | 759 | 64 | 4/20/2012 | 2012 | |||||||||||||||||||||||||
| Dollar General |
Corpus Christi | TX | — | (1) | 270 | 809 | — | 1,079 | 45 | 12/26/2012 | 2012 | |||||||||||||||||||||||||
| Dollar General |
Dickinson | TX | — | (1) | 87 | 786 | — | 873 | 55 | 9/25/2012 | 2012 | |||||||||||||||||||||||||
| Dollar General |
Donna | TX | — | (1) | 136 | 768 | — | 904 | 58 | 9/11/2012 | 2012 | |||||||||||||||||||||||||
| Dollar General |
Donna | TX | — | (1) | 200 | 799 | — | 999 | 56 | 10/12/2012 | 2012 | |||||||||||||||||||||||||
| Dollar General |
Donna | TX | — | (1) | 145 | 820 | — | 965 | 42 | 1/31/2013 | 2012 | |||||||||||||||||||||||||
| Dollar General |
Edinburg | TX | — | (1) | 136 | 769 | — | 905 | 58 | 9/7/2012 | 2012 | |||||||||||||||||||||||||
| Dollar General |
Elemdorf | TX | — | (1) | 94 | 847 | — | 941 | 56 | 10/23/2012 | 2012 | |||||||||||||||||||||||||
| Dollar General |
Gladewater | TX | — | (1) | 184 | 736 | — | 920 | 55 | 8/31/2012 | 2009 | |||||||||||||||||||||||||
| Dollar General |
Gordonville | TX | — | (6) | 38 | 717 | — | 755 | 67 | 4/20/2012 | 2012 | |||||||||||||||||||||||||
| Dollar General |
Kyle | TX | — | (1) | 132 | 747 | — | 879 | 52 | 9/26/2012 | 2012 | |||||||||||||||||||||||||
| Dollar General |
LaMarque | TX | — | (1) | 102 | 917 | — | 1,019 | 69 | 8/31/2012 | 2010 | |||||||||||||||||||||||||
| Dollar General |
Laredo | TX | — | (1) | 253 | 758 | — | 1,011 | 60 | 7/31/2012 | 2012 | |||||||||||||||||||||||||
| Dollar General |
Lubbock | TX | — | (1) | 267 | 801 | — | 1,068 | 60 | 8/31/2012 | 2010 | |||||||||||||||||||||||||
| Dollar General |
Lyford | TX | — | 80 | 724 | — | 804 | 81 | 12/30/2011 | 2010 | ||||||||||||||||||||||||||
| Dollar General |
Morgans Point | TX | — | (1) | 145 | 821 | — | 966 | 61 | 9/13/2012 | 2012 | |||||||||||||||||||||||||
| Dollar General |
Mount Pleasant | TX | — | (1) | 214 | 858 | — | 1,072 | 64 | 8/31/2012 | 2010 | |||||||||||||||||||||||||
| Dollar General |
New Braunfels | TX | — | (1) | 205 | 818 | — | 1,023 | 61 | 8/31/2012 | 2012 | |||||||||||||||||||||||||
| Dollar General |
Poteet | TX | — | (3) | 96 | 864 | — | 960 | 105 | 10/31/2011 | 2010 | |||||||||||||||||||||||||
| Dollar General |
Progreso | TX | — | (3) | 169 | 957 | — | 1,126 | 116 | 10/31/2011 | 2009 | |||||||||||||||||||||||||
| Dollar General |
Rio Grande City | TX | — | (3) | 137 | 779 | — | 916 | 95 | 10/31/2011 | 2010 | |||||||||||||||||||||||||
| Dollar General |
Roma | TX | — | (3) | 253 | 1,010 | — | 1,263 | 123 | 10/31/2011 | 2010 | |||||||||||||||||||||||||
| Dollar General |
San Antonio | TX | — | (1) | 252 | 756 | — | 1,008 | 50 | 10/22/2012 | 2012 | |||||||||||||||||||||||||
| Dollar General |
San Antonio | TX | — | (1) | 222 | 888 | — | 1,110 | 58 | 10/22/2012 | 2012 | |||||||||||||||||||||||||
| Dollar General |
Silsbee | TX | — | (1) | 43 | 810 | — | 853 | 68 | 7/6/2012 | 2012 | |||||||||||||||||||||||||
| Dollar General |
Troy | TX | — | (1) | 93 | 841 | — | 934 | 63 | 9/12/2012 | 2012 | |||||||||||||||||||||||||
| Dollar General |
Tyler | TX | — | (1) | 219 | 875 | — | 1,094 | 66 | 8/31/2012 | 2010 | |||||||||||||||||||||||||
| Dollar General |
Victoria | TX | — | (1) | 91 | 817 | — | 908 | 42 | 1/31/2013 | 2013 | |||||||||||||||||||||||||
| Dollar General |
Waco | TX | — | (1) | 192 | 767 | — | 959 | 57 | 8/31/2012 | 2012 | |||||||||||||||||||||||||
| Dollar General |
Weslaco | TX | — | (1) | 215 | 862 | — | 1,077 | 61 | 9/24/2012 | 2012 | |||||||||||||||||||||||||
| Dollar General |
Burkeville | VA | — | (1) | 160 | 906 | — | 1,066 | 85 | 5/8/2012 | 2012 | |||||||||||||||||||||||||
| Dollar General |
Chesterfield | VA | — | 242 | 726 | — | 968 | 78 | 2/6/2012 | 2011 | ||||||||||||||||||||||||||
| Dollar General |
Danville | VA | — | 155 | 621 | — | 776 | 67 | 2/6/2012 | 2011 | ||||||||||||||||||||||||||
| Dollar General |
Hopewell | VA | — | 584 | 713 | — | 1,297 | 77 | 2/6/2012 | 2011 | ||||||||||||||||||||||||||
| Dollar General |
Hot Springs | VA | — | 283 | 661 | — | 944 | 71 | 2/6/2012 | 2011 | ||||||||||||||||||||||||||
| Dollar General |
Mellen | WI | — | 79 | 711 | — | 790 | 80 | 12/30/2011 | 2011 | ||||||||||||||||||||||||||
| Dollar General |
Minong | WI | — | 38 | 727 | — | 765 | 82 | 12/30/2011 | 2011 | ||||||||||||||||||||||||||
| Dollar General |
Solon Springs | WI | — | 76 | 685 | — | 761 | 77 | 12/30/2011 | 2011 | ||||||||||||||||||||||||||
| Dunkin’ Donuts/Baskin — Robbins |
Dearborn Heights | MI | — | (1) | 230 | 846 | — | 1,076 | 23 | 6/27/2013 | 1998 | |||||||||||||||||||||||||
| Einstein Bros. Bagels |
Dearborn | MI | — | (1) | 190 | 724 | — | 914 | 20 | 6/27/2013 | 1997 | |||||||||||||||||||||||||
| Exelis |
Herndon | VA | 39,519 | 1,384 | 53,584 | — | 54,968 | 434 | 11/5/2013 | 2006 | ||||||||||||||||||||||||||
| Express Scripts |
St. Louis | MO | — | (4) | 5,706 | 32,333 | — | 38,039 | 3,661 | 1/25/2012 | 2011 | |||||||||||||||||||||||||
F-88
Table of Contents
| Initial Costs | ||||||||||||||||||||||||||||||||||||
| Property |
City |
State |
Encumbrances at December 31, 2013 |
Land | Buildings, Fixtures and Improvements |
Costs Capitalized Subsequent to Acquisition |
Gross Amount Carried at December 31, 2013 (10) (11) |
Accumulated Depreciation (12) (13) |
Date Acquired |
Date of Construction |
||||||||||||||||||||||||||
| Family Dollar |
Rangeley | CO | $ | — | (6) | $ | 66 | $ | 593 | $ | — | $ | 659 | $ | 56 | 5/4/2012 | 2010 | |||||||||||||||||||
| Family Dollar |
Middleburg | FL | — | (1) | 274 | 822 | — | 1,096 | 27 | 6/4/2013 | 2008 | |||||||||||||||||||||||||
| Family Dollar |
Ormond Beach | FL | — | 573 | 860 | — | 1,433 | 28 | 6/4/2013 | 2008 | ||||||||||||||||||||||||||
| Family Dollar |
Lenox | GA | — | (1) | 90 | 809 | — | 899 | 53 | 11/9/2012 | 2012 | |||||||||||||||||||||||||
| Family Dollar |
Arco | ID | — | (1) | 76 | 684 | — | 760 | 48 | 9/18/2012 | 2012 | |||||||||||||||||||||||||
| Family Dollar |
Kimberly | ID | — | (1) | 219 | 657 | — | 876 | 28 | 4/10/2013 | 2013 | |||||||||||||||||||||||||
| Family Dollar |
Brookston | IN | — | (1) | 126 | 715 | — | 841 | 50 | 10/1/2012 | 2012 | |||||||||||||||||||||||||
| Family Dollar |
Greensburg | KS | — | (1) | 80 | 718 | — | 798 | 13 | 9/9/2013 | 2012 | |||||||||||||||||||||||||
| Family Dollar |
Chalmette | LA | — | (1) | 751 | 615 | — | 1,366 | 58 | 5/3/2012 | 2011 | |||||||||||||||||||||||||
| Family Dollar |
Tickfaw | LA | — | (1) | 181 | 543 | — | 724 | 53 | 3/30/2012 | 2011 | |||||||||||||||||||||||||
| Family Dollar |
Detroit | MI | — | (1) | 130 | 1,169 | — | 1,299 | 71 | 11/27/2012 | 2011 | |||||||||||||||||||||||||
| Family Dollar |
Detroit | MI | — | (1) | 106 | 956 | — | 1,062 | 36 | 5/2/2013 | 1964 | |||||||||||||||||||||||||
| Family Dollar |
Jackson | MI | — | (1) | 93 | 525 | — | 618 | 10 | 9/12/2013 | 2007 | |||||||||||||||||||||||||
| Family Dollar |
St Louis | MO | — | (1) | 445 | 1,038 | — | 1,483 | 68 | 12/14/2012 | 2012 | |||||||||||||||||||||||||
| Family Dollar |
St. Louis | MO | — | (1) | 168 | 671 | — | 839 | 66 | 4/2/2012 | 2006 | |||||||||||||||||||||||||
| Family Dollar |
St. Louis | MO | — | (1) | 445 | 1,039 | — | 1,484 | 63 | 10/23/2012 | 2012 | |||||||||||||||||||||||||
| Family Dollar |
St. Louis | MO | — | (1) | 215 | 1,219 | — | 1,434 | 46 | 4/30/2013 | 2013 | |||||||||||||||||||||||||
| Family Dollar |
Biloxi | MS | — | (6) | 310 | 575 | — | 885 | 57 | 3/30/2012 | 2012 | |||||||||||||||||||||||||
| Family Dollar |
Carriere | MS | — | (6) | 200 | 599 | — | 799 | 59 | 3/30/2012 | 2012 | |||||||||||||||||||||||||
| Family Dollar |
D’Iberville | MS | — | (1) | 241 | 561 | — | 802 | 50 | 5/21/2012 | 2011 | |||||||||||||||||||||||||
| Family Dollar |
Gulfport | MS | — | (6) | 209 | 626 | — | 835 | 56 | 5/21/2012 | 2012 | |||||||||||||||||||||||||
| Family Dollar |
Gulfport | MS | — | (1) | 270 | 629 | — | 899 | 44 | 9/20/2012 | 2012 | |||||||||||||||||||||||||
| Family Dollar |
Gulfport | MS | — | (1) | 218 | 654 | — | 872 | 43 | 11/15/2012 | 2012 | |||||||||||||||||||||||||
| Family Dollar |
Hattiesburg | MS | — | (1) | 225 | 674 | — | 899 | 35 | 1/30/2013 | 2012 | |||||||||||||||||||||||||
| Family Dollar |
Horn Lake | MS | — | (1) | 225 | 676 | — | 901 | 51 | 8/22/2012 | 2012 | |||||||||||||||||||||||||
| Family Dollar |
Kiln | MS | — | (1) | 106 | 650 | — | 756 | 43 | 11/14/2012 | 2012 | |||||||||||||||||||||||||
| Family Dollar |
Okolona | MS | — | (1) | 64 | 578 | — | 642 | 46 | 7/31/2012 | 2012 | |||||||||||||||||||||||||
| Family Dollar |
Winona | MS | — | (1) | 146 | 585 | — | 731 | 47 | 7/31/2012 | 2012 | |||||||||||||||||||||||||
| Family Dollar |
Lumberton | NC | — | 151 | 603 | — | 754 | 11 | 9/11/2013 | 2006 | ||||||||||||||||||||||||||
| Family Dollar |
Fort Yates | ND | — | (5) | 126 | 715 | — | 841 | 77 | 1/31/2012 | 2010 | |||||||||||||||||||||||||
| Family Dollar |
New Town | ND | — | (5) | 105 | 942 | — | 1,047 | 101 | 1/31/2012 | 2011 | |||||||||||||||||||||||||
| Family Dollar |
Rolla | ND | — | (5) | 83 | 749 | — | 832 | 81 | 1/31/2012 | 2010 | |||||||||||||||||||||||||
| Family Dollar |
Madison | NE | — | (5) | 37 | 703 | — | 740 | 79 | 12/30/2011 | 2011 | |||||||||||||||||||||||||
| Family Dollar |
Chimayo | NM | — | (1) | 158 | 632 | — | 790 | 33 | 1/30/2013 | 2009 | |||||||||||||||||||||||||
| Family Dollar |
Mountainair | NM | — | (1) | 84 | 752 | — | 836 | 63 | 7/6/2012 | 2011 | |||||||||||||||||||||||||
| Family Dollar |
Hawthorne | NV | — | (6) | 191 | 764 | — | 955 | 68 | 6/1/2012 | 2012 | |||||||||||||||||||||||||
| Family Dollar |
Lovelock | NV | — | (6) | 185 | 742 | — | 927 | 69 | 5/4/2012 | 2012 | |||||||||||||||||||||||||
| Family Dollar |
Silver Spring | NV | — | (1) | 202 | 808 | — | 1,010 | 57 | 9/21/2012 | 2012 | |||||||||||||||||||||||||
| Family Dollar |
Wells | NV | — | (6) | 84 | 755 | — | 839 | 71 | 5/11/2012 | 2011 | |||||||||||||||||||||||||
| Family Dollar |
Toledo | OH | — | (1) | 306 | 917 | — | 1,223 | 43 | 2/25/2013 | 2012 | |||||||||||||||||||||||||
| Family Dollar |
Warren | OH | — | (1) | 170 | 681 | — | 851 | 51 | 9/11/2012 | 2012 | |||||||||||||||||||||||||
| Family Dollar |
Stillwell | OK | — | (5) | 40 | 768 | — | 808 | 86 | 1/6/2012 | 2011 | |||||||||||||||||||||||||
| Family Dollar |
Tulsa | OK | — | (6) | 220 | 878 | — | 1,098 | 70 | 7/30/2012 | 2012 | |||||||||||||||||||||||||
| Family Dollar |
Martin | SD | — | (5) | 85 | 764 | — | 849 | 82 | 1/31/2012 | 2009 | |||||||||||||||||||||||||
| Family Dollar |
Harrison | TN | — | (1) | 74 | 420 | — | 494 | 10 | 7/23/2013 | 2006 | |||||||||||||||||||||||||
| Family Dollar |
Avinger | TX | — | (1) | 40 | 761 | — | 801 | 50 | 10/22/2012 | 2012 | |||||||||||||||||||||||||
| Family Dollar |
Caldwell | TX | — | (1) | 138 | 552 | — | 690 | 49 | 5/29/2012 | 2012 | |||||||||||||||||||||||||
| Family Dollar |
Chireno | TX | — | (1) | 50 | 943 | — | 993 | 57 | 12/10/2012 | 2012 | |||||||||||||||||||||||||
| Family Dollar |
Eagle Lake | TX | — | (1) | 100 | 566 | — | 666 | 48 | 7/6/2012 | 2012 | |||||||||||||||||||||||||
| Family Dollar |
Floydada | TX | — | (5) | 36 | 681 | — | 717 | 77 | 12/30/2011 | 2010 | |||||||||||||||||||||||||
| Family Dollar |
Kerens | TX | — | (6) | 73 | 658 | — | 731 | 68 | 2/29/2012 | 2011 | |||||||||||||||||||||||||
| Family Dollar |
Oakhurst | TX | — | (1) | 36 | 683 | — | 719 | 42 | 12/12/2012 | 2012 | |||||||||||||||||||||||||
| Family Dollar |
Plano | TX | — | (1) | 468 | 869 | — | 1,337 | 20 | 8/1/2013 | 2013 | |||||||||||||||||||||||||
| Family Dollar |
Kemmerer | WY | — | (1) | 45 | 853 | — | 898 | 40 | 2/22/2013 | 2013 | |||||||||||||||||||||||||
| Famous Dave’s |
Independence | MO | — | (1) | 620 | 422 | — | 1,042 | 12 | 6/27/2013 | 1999 | |||||||||||||||||||||||||
| Farmers Group, Inc. |
Simi Valley | CA | 25,620 | 11,851 | 31,096 | — | 42,947 | 314 | 11/5/2013 | 1982 | ||||||||||||||||||||||||||
F-89
Table of Contents
| Initial Costs | ||||||||||||||||||||||||||||||||||||
| Property |
City |
State |
Encumbrances at December 31, 2013 |
Land | Buildings, Fixtures and Improvements |
Costs Capitalized Subsequent to Acquisition |
Gross Amount Carried at December 31, 2013 (10) (11) |
Accumulated Depreciation (12) (13) |
Date Acquired |
Date of Construction |
||||||||||||||||||||||||||
| Farmers New World Life Insurance Company |
Mercer Island | WA | $ | 29,161 | $ | 24,287 | $ | 28,210 | $ | — | $ | 52,497 | $ | 231 | 11/5/2013 | 1982 | ||||||||||||||||||||
| FedEx |
Lowell | AR | — | (1) | 396 | 7,521 | — | 7,917 | 382 | 3/15/2013 | 2012 | |||||||||||||||||||||||||
| FedEx |
Yuma | AZ | — | — | 2,076 | — | 2,076 | 148 | 10/17/2012 | 2011 | ||||||||||||||||||||||||||
| FedEx |
Chico | CA | — | (1) | 308 | 2,776 | — | 3,084 | 198 | 11/9/2012 | 2006 | |||||||||||||||||||||||||
| FedEx |
Commerce City | CO | — | (4) | 6,556 | 26,224 | — | 32,780 | 2,799 | 3/20/2012 | 2007 | |||||||||||||||||||||||||
| FedEx |
Melbourne | FL | — | (1) | 159 | 1,433 | — | 1,592 | 36 | 7/26/2013 | 1989 | |||||||||||||||||||||||||
| FedEx |
Kankakee | IL | — | (1) | 195 | 1,103 | — | 1,298 | 107 | 5/31/2012 | 2003 | |||||||||||||||||||||||||
| FedEx |
Mt. Vernon | IL | — | (1) | 222 | 1,259 | — | 1,481 | 122 | 5/31/2012 | 2009 | |||||||||||||||||||||||||
| FedEx |
Quincy | IL | — | 371 | 2,101 | — | 2,472 | 160 | 9/28/2012 | 2012 | ||||||||||||||||||||||||||
| FedEx |
Evansville | IN | — | (1) | 665 | 2,661 | — | 3,326 | 257 | 5/31/2012 | 2003 | |||||||||||||||||||||||||
| FedEx |
Kokomo | IN | — | 186 | 3,541 | — | 3,727 | 378 | 3/16/2012 | 2012 | ||||||||||||||||||||||||||
| FedEx |
Hazard | KY | — | 215 | 4,085 | — | 4,300 | 312 | 9/28/2012 | 2012 | ||||||||||||||||||||||||||
| FedEx |
London | KY | — | (1) | 191 | 1,081 | — | 1,272 | 104 | 5/31/2012 | 2000 | |||||||||||||||||||||||||
| FedEx |
Grand Rapids | MI | 4,800 | 1,797 | 7,189 | — | 8,986 | 694 | 6/14/2012 | 2012 | ||||||||||||||||||||||||||
| FedEx |
Port Huron | MI | — | (1) | 125 | 1,121 | — | 1,246 | 40 | 5/31/2013 | 2003 | |||||||||||||||||||||||||
| FedEx |
Roseville | MN | — | 1,462 | 8,282 | — | 9,744 | 547 | 11/30/2012 | 2012 | ||||||||||||||||||||||||||
| FedEx |
Butte | MT | 5,060 | 403 | 7,653 | — | 8,056 | 1,050 | 9/27/2011 | 2011 | ||||||||||||||||||||||||||
| FedEx |
Belmont | NH | — | (4) | 265 | 2,386 | — | 2,651 | 291 | 12/29/2011 | 2011 | |||||||||||||||||||||||||
| FedEx |
Wendover | NV | — | (1) | 262 | 1,483 | — | 1,745 | 75 | 2/25/2013 | 2012 | |||||||||||||||||||||||||
| FedEx |
Winnemucca | NV | — | (1) | 280 | 1,585 | — | 1,865 | 81 | 2/25/2013 | 2012 | |||||||||||||||||||||||||
| FedEx |
Blauvelt | NY | — | 14,420 | 26,779 | — | 41,199 | 2,859 | 4/5/2012 | 2012 | ||||||||||||||||||||||||||
| FedEx |
Chillicothe | OH | — | (1) | 143 | 1,284 | — | 1,427 | 124 | 5/31/2012 | 2000 | |||||||||||||||||||||||||
| FedEx |
Mt. Pleasant | PA | — | (1) | 454 | 1,814 | 98 | 2,366 | 179 | 5/31/2012 | 2001 | |||||||||||||||||||||||||
| FedEx |
Blountville | TN | — | (4) | 562 | 5,056 | — | 5,618 | 591 | 2/3/2012 | 2009 | |||||||||||||||||||||||||
| FedEx |
Humboldt | TN | — | 239 | 4,543 | — | 4,782 | 416 | 7/11/2012 | 2008 | ||||||||||||||||||||||||||
| FedEx |
Bryan | TX | — | (1) | 1,422 | 3,318 | — | 4,740 | 320 | 6/15/2012 | 2011 | |||||||||||||||||||||||||
| FedEx |
Omak | WA | — | 252 | 1,425 | — | 1,677 | 109 | 9/27/2012 | 2012 | ||||||||||||||||||||||||||
| FedEx |
Wenatchee | WA | — | 266 | 2,393 | — | 2,659 | 183 | 9/28/2012 | 2012 | ||||||||||||||||||||||||||
| FedEx |
Parkersburg | WV | — | 193 | 3,671 | — | 3,864 | 280 | 9/20/2012 | 2012 | ||||||||||||||||||||||||||
| FedEx Ground |
Greenville | NC | — | (5) | 363 | 6,903 | — | 7,266 | 772 | 2/22/2012 | 2011 | |||||||||||||||||||||||||
| FedEx Ground |
Tulsa | OK | — | (5) | 458 | 8,695 | — | 9,153 | 972 | 2/22/2012 | 2011 | |||||||||||||||||||||||||
| First Bank |
Pinellas Park | FL | — | 630 | 1,470 | — | 2,100 | 20 | 10/1/2013 | 1981 | ||||||||||||||||||||||||||
| Fresenius |
Aurora | IL | — | 287 | 2,584 | — | 2,871 | 182 | 7/13/2012 | 2009 | ||||||||||||||||||||||||||
| Fresenius |
Chicago | IL | — | 588 | 1,764 | — | 2,352 | 117 | 7/31/2012 | 2009 | ||||||||||||||||||||||||||
| Fresenius |
Waukegan | IL | — | 94 | 1,792 | — | 1,886 | 119 | 7/31/2012 | 2011 | ||||||||||||||||||||||||||
| Fresenius |
Peru | IN | — | 69 | 1,305 | — | 1,374 | 92 | 6/27/2012 | 1982 | ||||||||||||||||||||||||||
| Fresenius |
Bossier City | LA | — | (1) | 120 | 682 | — | 802 | 29 | 1/30/2013 | 2008 | |||||||||||||||||||||||||
| Fresenius |
Caro | MI | — | (1) | 92 | 1,744 | — | 1,836 | 130 | 6/5/2012 | 2009 | |||||||||||||||||||||||||
| Fresenius |
Jackson | MI | — | 137 | 2,603 | — | 2,740 | 194 | 6/5/2012 | 2008 | ||||||||||||||||||||||||||
| Fresenius |
Albermarle | NC | — | (1) | 139 | 1,253 | — | 1,392 | 39 | 4/30/2013 | 2008 | |||||||||||||||||||||||||
| Fresenius |
Angier | NC | — | (1) | 203 | 1,152 | — | 1,355 | 36 | 4/30/2013 | 2012 | |||||||||||||||||||||||||
| Fresenius |
Asheboro | NC | — | 323 | 2,903 | — | 3,226 | 91 | 4/30/2013 | 2012 | ||||||||||||||||||||||||||
| Fresenius |
Taylorsville | NC | — | (1) | 275 | 1,099 | — | 1,374 | 34 | 4/30/2013 | 2011 | |||||||||||||||||||||||||
| Fresenius |
Warsaw | NC | — | (1) | 75 | 1,428 | — | 1,503 | 78 | 11/13/2012 | 2003 | |||||||||||||||||||||||||
| Fresenius |
Kings Mills | OH | — | (1) | 399 | 598 | — | 997 | 45 | 6/5/2012 | 2007 | |||||||||||||||||||||||||
| Fresenius |
Dallas | TX | — | (1) | 377 | 1,132 | — | 1,509 | 44 | 2/28/2013 | 1958 | |||||||||||||||||||||||||
| GE Aviation |
Auburn | AL | — | 1,627 | 30,920 | — | 32,547 | 1,767 | 11/21/2012 | 2012 | ||||||||||||||||||||||||||
| General Mills |
Geneva | IL | 16,555 | 7,457 | 22,371 | — | 29,828 | 2,161 | 5/23/2012 | 1998 | ||||||||||||||||||||||||||
| General Mills |
Fort Wayne | IN | — | (1) | 2,533 | 48,130 | — | 50,663 | 3,425 | 10/18/2012 | 2012 | |||||||||||||||||||||||||
| General Motors Financial Company |
Arlington | TX | 25,552 | 7,901 | 35,553 | — | 43,454 | 328 | 11/5/2013 | 1999 | ||||||||||||||||||||||||||
| Golden Corral |
Albany | GA | — | (1) | 460 | 1,863 | — | 2,323 | 53 | 6/27/2013 | 1998 | |||||||||||||||||||||||||
| Golden Corral |
Brunswick | GA | — | (1) | 390 | 2,093 | — | 2,483 | 60 | 6/27/2013 | 1998 | |||||||||||||||||||||||||
| Golden Corral |
McDonough | GA | — | (1) | 930 | 3,936 | — | 4,866 | 113 | 6/27/2013 | 2004 | |||||||||||||||||||||||||
| Golden Corral |
Council Bluffs | IA | — | (1) | 1,140 | 1,460 | — | 2,600 | 42 | 6/27/2013 | 1998 | |||||||||||||||||||||||||
F-90
Table of Contents
| Initial Costs | ||||||||||||||||||||||||||||||||||||
| Property |
City |
State |
Encumbrances at December 31, 2013 |
Land | Buildings, Fixtures and Improvements |
Costs Capitalized Subsequent to Acquisition |
Gross Amount Carried at December 31, 2013 (10) (11) |
Accumulated Depreciation (12) (13) |
Date Acquired |
Date of Construction |
||||||||||||||||||||||||||
| Golden Corral |
Evansville | IN | $ | — | (1) | $ | 670 | $ | 2,707 | $ | — | $ | 3,377 | $ | 78 | 6/27/2013 | 1999 | |||||||||||||||||||
| Golden Corral |
Evansville | IN | — | (1) | 640 | 944 | — | 1,584 | 27 | 6/27/2013 | 1999 | |||||||||||||||||||||||||
| Golden Corral |
Fort Wayne | IN | — | (1) | 820 | 1,935 | — | 2,755 | 55 | 6/27/2013 | 1999 | |||||||||||||||||||||||||
| Golden Corral |
Kokomo | IN | — | (1) | 780 | 2,107 | — | 2,887 | 60 | 6/27/2013 | 2000 | |||||||||||||||||||||||||
| Golden Corral |
Elizabethtown | KY | — | (1) | 760 | 2,753 | — | 3,513 | 79 | 6/27/2013 | 1997 | |||||||||||||||||||||||||
| Golden Corral |
Henderson | KY | — | (1) | 600 | 1,586 | — | 2,186 | 45 | 6/27/2013 | 1999 | |||||||||||||||||||||||||
| Golden Corral |
Blue Springs | MO | — | (1) | 810 | 1,346 | — | 2,156 | 39 | 6/27/2013 | 2000 | |||||||||||||||||||||||||
| Golden Corral |
Flowood | MS | — | (1) | 680 | 2,730 | — | 3,410 | 78 | 6/27/2013 | 1999 | |||||||||||||||||||||||||
| Golden Corral |
Aberdeen | NC | — | (1) | 690 | 1,566 | — | 2,256 | 45 | 6/27/2013 | 1994 | |||||||||||||||||||||||||
| Golden Corral |
Burlington | NC | — | (1) | 840 | 2,319 | — | 3,159 | 66 | 6/27/2013 | 1993 | |||||||||||||||||||||||||
| Golden Corral |
Hickory | NC | — | (1) | 260 | 2,658 | — | 2,918 | 76 | 6/27/2013 | 1994 | |||||||||||||||||||||||||
| Golden Corral |
Bellevue | NE | — | (1) | 520 | 1,433 | — | 1,953 | 41 | 6/27/2013 | 1999 | |||||||||||||||||||||||||
| Golden Corral |
Lincoln | NE | — | (1) | 300 | 2,930 | — | 3,230 | 84 | 6/27/2013 | 2000 | |||||||||||||||||||||||||
| Golden Corral |
Farmington | NM | — | (1) | 270 | 3,174 | — | 3,444 | 91 | 6/27/2013 | 1996 | |||||||||||||||||||||||||
| Golden Corral |
Columbus | OH | — | (1) | 770 | 2,476 | — | 3,246 | 71 | 6/27/2013 | 1995 | |||||||||||||||||||||||||
| Golden Corral |
Tulsa | OK | — | (1) | 280 | 3,890 | — | 4,170 | 112 | 6/27/2013 | 1999 | |||||||||||||||||||||||||
| Golden Corral |
Rock Hill | SC | — | (1) | 320 | 2,130 | — | 2,450 | 61 | 6/27/2013 | 1999 | |||||||||||||||||||||||||
| Golden Corral |
Cookeville | TN | — | (1) | 800 | 1,937 | — | 2,737 | 56 | 6/27/2013 | 1999 | |||||||||||||||||||||||||
| Golden Corral |
Bristol | VA | — | (1) | 750 | 2,276 | — | 3,026 | 65 | 6/27/2013 | 2000 | |||||||||||||||||||||||||
| Goodfire BBQ |
San Antonio | TX | — | (1) | 350 | 341 | — | 691 | 10 | 6/27/2013 | 1983 | |||||||||||||||||||||||||
| Grandy’s |
Hobbs | NM | — | (1) | 815 | — | — | 815 | — | 6/27/2013 | 1984 | |||||||||||||||||||||||||
| Grandy’s |
Ardmore | OK | — | (1) | 454 | — | — | 454 | — | 6/27/2013 | 1983 | |||||||||||||||||||||||||
| Grandy’s |
Moore | OK | — | (1) | 320 | 428 | — | 748 | 12 | 6/27/2013 | 1987 | |||||||||||||||||||||||||
| Grandy’s |
Oklahoma City | OK | — | (1) | 260 | 380 | — | 640 | 11 | 6/27/2013 | 1985 | |||||||||||||||||||||||||
| Grandy’s |
Oklahoma City | OK | — | (1) | 320 | 289 | — | 609 | 8 | 6/27/2013 | 1984 | |||||||||||||||||||||||||
| GSA |
Birmingham | AL | 10,568 | 1,400 | 8,830 | — | 10,230 | 84 | 11/5/2013 | 2005 | ||||||||||||||||||||||||||
| GSA |
Mobile | AL | — | (1) | 268 | 5,095 | — | 5,363 | 420 | 6/19/2012 | 1995 | |||||||||||||||||||||||||
| GSA |
Birmingham | AL | 17,640 | 2,982 | 19,982 | — | 22,964 | 193 | 11/5/2013 | 2007 | ||||||||||||||||||||||||||
| GSA |
Springerville | AZ | — | (1) | 148 | 2,810 | — | 2,958 | 232 | 7/2/2012 | 2006 | |||||||||||||||||||||||||
| GSA |
Craig | CO | — | (5) | 129 | 1,159 | — | 1,288 | 128 | 12/30/2011 | 2011 | |||||||||||||||||||||||||
| GSA |
Cocoa | FL | — | 253 | 1,435 | — | 1,688 | 164 | 12/13/2011 | 2009 | ||||||||||||||||||||||||||
| GSA |
Stuart | FL | — | (1) | 900 | 3,600 | — | 4,500 | 363 | 3/5/2012 | 2011 | |||||||||||||||||||||||||
| GSA |
Grangeville | ID | — | 317 | 6,023 | — | 6,340 | 607 | 3/5/2012 | 2007 | ||||||||||||||||||||||||||
| GSA |
Kansas City | KS | 16,872 | 4,264 | 29,678 | — | 33,942 | 276 | 11/5/2013 | 2003 | ||||||||||||||||||||||||||
| GSA |
Springfield | MO | — | (1) | 131 | 2,489 | — | 2,620 | 228 | 5/15/2012 | 2011 | |||||||||||||||||||||||||
| GSA |
Albany | NY | 10,137 | 2,470 | 11,836 | — | 14,306 | 124 | 11/5/2013 | 2008 | ||||||||||||||||||||||||||
| GSA |
Freeport | NY | — | (1) | 843 | 3,372 | — | 4,215 | 371 | 1/10/2012 | 1960 | |||||||||||||||||||||||||
| GSA |
Plattsburg | NY | — | (1) | 508 | 4,572 | — | 5,080 | 377 | 6/19/2012 | 2008 | |||||||||||||||||||||||||
| GSA |
Warren | PA | — | (1) | 341 | 3,114 | — | 3,455 | 268 | 6/19/2012 | 2008 | |||||||||||||||||||||||||
| GSA |
Ponce | PR | — | 1,780 | 9,297 | — | 11,077 | 128 | 11/5/2013 | 2000 | ||||||||||||||||||||||||||
| GSA |
Austin | TX | 5,046 | 1,570 | 3,057 | — | 4,627 | 37 | 11/5/2013 | 2005 | ||||||||||||||||||||||||||
| GSA |
Fort Worth | TX | — | (1) | 477 | 4,290 | — | 4,767 | 393 | 5/9/2012 | 2010 | |||||||||||||||||||||||||
| GSA |
Gloucester | VA | — | (1) | 287 | 1,628 | — | 1,915 | 134 | 6/19/2012 | 1997 | |||||||||||||||||||||||||
| Habanero’s Mexican Grill |
Hueytown | AL | — | (1) | 60 | 639 | — | 699 | 18 | 6/27/2013 | 1987 | |||||||||||||||||||||||||
| Hanesbrands |
Rural Hall | NC | — | 1,082 | 22,565 | — | 23,647 | 1,426 | 12/21/2012 | 1989 | ||||||||||||||||||||||||||
| Hardee’s |
Alma | GA | — | (1) | 80 | 502 | — | 582 | 14 | 6/27/2013 | 1992 | |||||||||||||||||||||||||
| Hardee’s |
Brunswick | GA | — | (1) | 200 | 494 | — | 694 | 14 | 6/27/2013 | 1992 | |||||||||||||||||||||||||
| Hardee’s |
Claxton | GA | — | (1) | 170 | 469 | — | 639 | 13 | 6/27/2013 | 1986 | |||||||||||||||||||||||||
| Hardee’s |
Glennville | GA | — | (1) | 170 | 450 | — | 620 | 12 | 6/27/2013 | 1986 | |||||||||||||||||||||||||
| Hardee’s |
Hazlehurst | GA | — | (1) | 300 | 263 | — | 563 | 7 | 6/27/2013 | 1982 | |||||||||||||||||||||||||
| Hardee’s |
Metter | GA | — | (1) | 230 | 369 | — | 599 | 10 | 6/27/2013 | 1984 | |||||||||||||||||||||||||
| Hardee’s |
Richmond Hill | GA | — | (1) | 390 | 149 | — | 539 | 4 | 6/27/2013 | 1990 | |||||||||||||||||||||||||
| Hardee’s |
Savannah | GA | — | (1) | 130 | 456 | — | 586 | 13 | 6/27/2013 | 1987 | |||||||||||||||||||||||||
| Hardee’s |
Swainsboro | GA | — | (1) | 470 | 107 | — | 577 | 3 | 6/27/2013 | 1992 | |||||||||||||||||||||||||
| Hardee’s |
Vidalia | GA | — | (1) | 220 | 377 | — | 597 | 10 | 6/27/2013 | 1990 | |||||||||||||||||||||||||
| Hardee’s |
Old Fort | NC | — | (1) | 300 | 904 | — | 1,204 | 25 | 6/27/2013 | 1992 | |||||||||||||||||||||||||
F-91
Table of Contents
| Initial Costs | ||||||||||||||||||||||||||||||||||||
| Property |
City |
State |
Encumbrances at December 31, 2013 |
Land | Buildings, Fixtures and Improvements |
Costs Capitalized Subsequent to Acquisition |
Gross Amount Carried at December 31, 2013 (10) (11) |
Accumulated Depreciation (12) (13) |
Date Acquired |
Date of Construction |
||||||||||||||||||||||||||
| Hardee’s |
Aiken | SC | $ | — | (1) | $ | 220 | $ | 450 | $ | — | $ | 670 | $ | 12 | 6/27/2013 | 1977 | |||||||||||||||||||
| Hardee’s |
Chapin | SC | — | (1) | 380 | 741 | — | 1,121 | 21 | 6/27/2013 | 1993 | |||||||||||||||||||||||||
| Hardee’s |
Bloomingdale | TN | — | (1) | 270 | 844 | — | 1,114 | 23 | 6/27/2013 | 1992 | |||||||||||||||||||||||||
| Hardee’s |
Clinton | TN | — | (1) | 390 | 893 | — | 1,283 | 25 | 6/27/2013 | 1992 | |||||||||||||||||||||||||
| Hardee’s |
Crossville | TN | — | (1) | 300 | 689 | — | 989 | 19 | 6/27/2013 | 1992 | |||||||||||||||||||||||||
| Hardee’s Red Burrito |
Attalla | AL | — | (1) | 220 | 896 | — | 1,116 | 25 | 6/27/2013 | 1993 | |||||||||||||||||||||||||
| Hash House A-Go-Go Restaurant |
Las Vegas | NV | — | (1) | 580 | 1,347 | — | 1,927 | 39 | 6/27/2013 | 1997 | |||||||||||||||||||||||||
| Home Depot |
Columbia | SC | 13,776 | 2,911 | 15,463 | — | 18,374 | 2,748 | 11/1/2009 | 2009 | ||||||||||||||||||||||||||
| Houlihan’s |
Plymouth Meeting | PA | — | (1) | 870 | 2,015 | — | 2,885 | 58 | 6/27/2013 | 1974 | |||||||||||||||||||||||||
| Huntington National Bank |
Conneaut | OH | — | 205 | 477 | — | 682 | 6 | 10/1/2013 | 1971 | ||||||||||||||||||||||||||
| Huntington National Bank |
Jefferson | OH | — | 255 | 765 | — | 1,020 | 10 | 10/1/2013 | 1963 | ||||||||||||||||||||||||||
| Hy-Vee |
Vermillion | SD | — | 409 | 3,684 | — | 4,093 | 194 | 4/8/2013 | 2003 | ||||||||||||||||||||||||||
| IHOP |
Homewood | AL | — | (1) | 610 | 1,762 | — | 2,372 | 50 | 6/27/2013 | 1996 | |||||||||||||||||||||||||
| IHOP |
Castle Rock | CO | — | (1) | 320 | 2,334 | — | 2,654 | 67 | 6/27/2013 | 1999 | |||||||||||||||||||||||||
| IHOP |
Greeley | CO | — | (1) | 120 | 1,538 | — | 1,658 | 44 | 6/27/2013 | 1998 | |||||||||||||||||||||||||
| IHOP |
Pueblo | CO | — | (1) | 330 | 1,589 | — | 1,919 | 46 | 6/27/2013 | 1997 | |||||||||||||||||||||||||
| IHOP |
Stockbridge | GA | — | (1) | 580 | 2,091 | — | 2,671 | 60 | 6/27/2013 | 1997 | |||||||||||||||||||||||||
| IHOP |
Natchitoches | LA | — | 750 | 89 | — | 839 | 3 | 6/27/2013 | 1990 | ||||||||||||||||||||||||||
| IHOP |
Roseville | MI | — | (1) | 340 | 1,071 | — | 1,411 | 31 | 6/27/2013 | 1997 | |||||||||||||||||||||||||
| IHOP |
Kansas City | MO | — | (1) | 630 | 1,002 | — | 1,632 | 29 | 6/27/2013 | 1998 | |||||||||||||||||||||||||
| IHOP |
Southaven | MS | — | (1) | 350 | 2,108 | — | 2,458 | 60 | 6/27/2013 | 1997 | |||||||||||||||||||||||||
| IHOP |
Poughkeepsie | NY | — | (1) | 430 | 1,129 | — | 1,559 | 32 | 6/27/2013 | 1996 | |||||||||||||||||||||||||
| IHOP |
Greenville | SC | — | (1) | 610 | 1,551 | — | 2,161 | 44 | 6/27/2013 | 1998 | |||||||||||||||||||||||||
| IHOP |
Clarksville | TN | — | (1) | 530 | 1,346 | — | 1,876 | 39 | 6/27/2013 | 1997 | |||||||||||||||||||||||||
| IHOP |
Memphis | TN | — | (1) | 750 | 2,009 | — | 2,759 | 58 | 6/27/2013 | 1997 | |||||||||||||||||||||||||
| IHOP |
Murfreesboro | TN | — | (1) | 600 | 1,687 | — | 2,287 | 48 | 6/27/2013 | 1998 | |||||||||||||||||||||||||
| IHOP |
Fort Worth | TX | — | (1) | 560 | 1,879 | — | 2,439 | 54 | 6/27/2013 | 1994 | |||||||||||||||||||||||||
| IHOP |
Houston | TX | — | (1) | 760 | 2,462 | — | 3,222 | 71 | 6/27/2013 | 1996 | |||||||||||||||||||||||||
| IHOP |
Killeen | TX | — | (1) | 380 | 1,028 | — | 1,408 | 29 | 6/27/2013 | 1997 | |||||||||||||||||||||||||
| IHOP |
Lake Jackson | TX | — | (1) | 370 | 2,018 | — | 2,388 | 58 | 6/27/2013 | 1997 | |||||||||||||||||||||||||
| IHOP |
Leon Valley | TX | — | (1) | 650 | 2,055 | — | 2,705 | 59 | 6/27/2013 | 1997 | |||||||||||||||||||||||||
| IHOP |
Auburn | WA | — | (1) | 780 | 1,878 | — | 2,658 | 54 | 6/27/2013 | 1997 | |||||||||||||||||||||||||
| Invesco Holding Co. Ltd. |
Denver | CO | 43,700 | 12,650 | 66,398 | — | 79,048 | 607 | 11/5/2013 | 2008 | ||||||||||||||||||||||||||
| Iron Mountain |
Columbus | OH | — | (1) | 405 | 3,642 | — | 4,047 | 278 | 9/28/2012 | 1954 | |||||||||||||||||||||||||
| Jack in the Box |
Avondale | AZ | — | (1) | 110 | 2,237 | — | 2,347 | 62 | 6/27/2013 | 1998 | |||||||||||||||||||||||||
| Jack in the Box |
Chandler | AZ | — | (1) | 450 | 1,447 | — | 1,897 | 40 | 6/27/2013 | 1998 | |||||||||||||||||||||||||
| Jack in the Box |
Folsom | CA | — | (1) | 280 | 2,423 | — | 2,703 | 67 | 6/27/2013 | 1997 | |||||||||||||||||||||||||
| Jack in the Box |
Fresno | CA | — | (1) | 190 | 1,810 | — | 2,000 | 50 | 6/27/2013 | 1997 | |||||||||||||||||||||||||
| Jack in the Box |
West Sacramento | CA | — | (1) | 590 | 1,710 | — | 2,300 | 47 | 6/27/2013 | 1997 | |||||||||||||||||||||||||
| Jack in the Box |
Burley | ID | — | (1) | 240 | 1,430 | — | 1,670 | 40 | 6/27/2013 | 2000 | |||||||||||||||||||||||||
| Jack in the Box |
Moscow | ID | — | (1) | 350 | 1,110 | — | 1,460 | 31 | 6/27/2013 | 1992 | |||||||||||||||||||||||||
| Jack in the Box |
Belleville | IL | — | (1) | 200 | 966 | — | 1,166 | 27 | 6/27/2013 | 1987 | |||||||||||||||||||||||||
| Jack in the Box |
Florissant | MO | — | (1) | 502 | 1,515 | — | 2,045 | 42 | 6/27/2013 | 1997 | |||||||||||||||||||||||||
| Jack in the Box |
St. Louis | MO | — | (1) | 420 | 1,494 | — | 1,914 | 41 | 6/27/2013 | 1998 | |||||||||||||||||||||||||
| Jack in the Box |
Las Vegas | NV | — | (1) | 680 | 1,533 | — | 2,213 | 42 | 6/27/2013 | 1997 | |||||||||||||||||||||||||
| Jack in the Box |
Salem | OR | — | (1) | 580 | 1,301 | — | 1,881 | 36 | 6/27/2013 | 1999 | |||||||||||||||||||||||||
| Jack in the Box |
Tigard | OR | — | (1) | 620 | 1,361 | — | 1,981 | 38 | 6/27/2013 | 1999 | |||||||||||||||||||||||||
| Jack in the Box |
Arlington | TX | — | (1) | 420 | 1,325 | — | 1,745 | 37 | 6/27/2013 | 1993 | |||||||||||||||||||||||||
| Jack in the Box |
Arlington | TX | — | (1) | 420 | 1,365 | — | 1,785 | 38 | 6/27/2013 | 1995 | |||||||||||||||||||||||||
| Jack in the Box |
Corinth | TX | — | (1) | 400 | 1,416 | — | 1,816 | 39 | 6/27/2013 | 1997 | |||||||||||||||||||||||||
| Jack in the Box |
Farmers Branch | TX | — | (1) | 460 | 1,640 | — | 2,100 | 45 | 6/27/2013 | 1988 | |||||||||||||||||||||||||
| Jack in the Box |
Fort Worth | TX | — | (1) | 490 | 1,702 | — | 2,192 | 47 | 6/27/2013 | 1991 | |||||||||||||||||||||||||
| Jack in the Box |
Georgetown | TX | — | (1) | 600 | 1,508 | — | 2,108 | 42 | 6/27/2013 | 1999 | |||||||||||||||||||||||||
F-92
Table of Contents
| Initial Costs | ||||||||||||||||||||||||||||||||||||
| Property |
City |
State |
Encumbrances at December 31, 2013 |
Land | Buildings, Fixtures and Improvements |
Costs Capitalized Subsequent to Acquisition |
Gross Amount Carried at December 31, 2013 (10) (11) |
Accumulated Depreciation (12) (13) |
Date Acquired |
Date of Construction |
||||||||||||||||||||||||||
| Jack in the Box |
Granbury | TX | $ | — | (1) | $ | 380 | $ | 1,449 | $ | — | $ | 1,829 | $ | 40 | 6/27/2013 | 1999 | |||||||||||||||||||
| Jack in the Box |
Grand Prairie | TX | — | (1) | 600 | 1,856 | — | 2,456 | 51 | 6/27/2013 | 1995 | |||||||||||||||||||||||||
| Jack in the Box |
Grapevine | TX | — | (1) | 470 | 1,344 | — | 1,814 | 37 | 6/27/2013 | 1992 | |||||||||||||||||||||||||
| Jack in the Box |
Gun Barrel City | TX | — | (1) | 300 | 961 | — | 1,261 | 27 | 6/27/2013 | 1998 | |||||||||||||||||||||||||
| Jack in the Box |
Houston | TX | — | (1) | 460 | 1,437 | — | 1,897 | 40 | 6/27/2013 | 1993 | |||||||||||||||||||||||||
| Jack in the Box |
Houston | TX | — | (1) | 390 | 1,172 | — | 1,562 | 32 | 6/27/2013 | 1993 | |||||||||||||||||||||||||
| Jack in the Box |
Houston | TX | — | (1) | 330 | 1,845 | — | 2,175 | 51 | 6/27/2013 | 1996 | |||||||||||||||||||||||||
| Jack in the Box |
Houston | TX | — | (1) | 410 | 1,621 | — | 2,031 | 45 | 6/27/2013 | 1992 | |||||||||||||||||||||||||
| Jack in the Box |
Houston | TX | — | (1) | 450 | 1,396 | — | 1,846 | 39 | 6/27/2013 | 1992 | |||||||||||||||||||||||||
| Jack in the Box |
Hutchins | TX | — | (1) | 330 | 1,363 | — | 1,693 | 38 | 6/27/2013 | 1998 | |||||||||||||||||||||||||
| Jack in the Box |
Kingswood | TX | — | (1) | 430 | 955 | — | 1,385 | 26 | 6/27/2013 | 1992 | |||||||||||||||||||||||||
| Jack in the Box |
Lufkin | TX | — | (1) | 440 | 1,544 | — | 1,984 | 43 | 6/27/2013 | 1999 | |||||||||||||||||||||||||
| Jack in the Box |
Lufkin | TX | — | (1) | 450 | 1,563 | — | 2,013 | 43 | 6/27/2013 | 1998 | |||||||||||||||||||||||||
| Jack in the Box |
Mesquite | TX | — | (1) | 560 | 1,652 | — | 2,212 | 46 | 6/27/2013 | 1992 | |||||||||||||||||||||||||
| Jack in the Box |
Nacogdoches | TX | — | (1) | 340 | 1,320 | — | 1,660 | 37 | 6/27/2013 | 1998 | |||||||||||||||||||||||||
| Jack in the Box |
Orange | TX | — | (1) | 270 | 1,661 | — | 1,931 | 46 | 6/27/2013 | 1999 | |||||||||||||||||||||||||
| Jack in the Box |
Port Arthur | TX | — | (1) | 460 | 1,405 | — | 1,865 | 39 | 6/27/2013 | 1994 | |||||||||||||||||||||||||
| Jack in the Box |
Rockwall | TX | — | (1) | 450 | 1,275 | — | 1,725 | 35 | 6/27/2013 | 1992 | |||||||||||||||||||||||||
| Jack in the Box |
San Antonio | TX | — | (1) | 400 | 1,244 | — | 1,644 | 34 | 6/27/2013 | 1999 | |||||||||||||||||||||||||
| Jack in the Box |
San Antonio | TX | — | (1) | 470 | 1,256 | — | 1,726 | 35 | 6/27/2013 | 1999 | |||||||||||||||||||||||||
| Jack in the Box |
San Antonio | TX | — | (1) | 350 | 1,249 | — | 1,599 | 35 | 6/27/2013 | 1992 | |||||||||||||||||||||||||
| Jack in the Box |
Spring | TX | — | (1) | 450 | 1,487 | — | 1,937 | 41 | 6/27/2013 | 1993 | |||||||||||||||||||||||||
| Jack in the Box |
Spring | TX | — | (1) | 570 | 1,340 | — | 1,910 | 37 | 6/27/2013 | 1999 | |||||||||||||||||||||||||
| Jack in the Box |
Tyler | TX | — | (1) | 450 | 1,025 | — | 1,475 | 28 | 6/27/2013 | 1999 | |||||||||||||||||||||||||
| Jack in the Box |
Weatherford | TX | — | (1) | 480 | 1,329 | — | 1,809 | 37 | 6/27/2013 | 1999 | |||||||||||||||||||||||||
| Jack in the Box |
Enumclaw | WA | — | (1) | 380 | 1,238 | — | 1,618 | 34 | 6/27/2013 | 1997 | |||||||||||||||||||||||||
| Joe’s Crab Shack |
Lilburn | GA | — | (1) | 800 | 1,917 | — | 2,717 | 55 | 6/27/2013 | 1999 | |||||||||||||||||||||||||
| Joe’s Crab Shack |
Houston | TX | — | (1) | 900 | 1,749 | — | 2,649 | 50 | 6/27/2013 | 1994 | |||||||||||||||||||||||||
| John Deere |
Davenport | IA | — | (1) | 1,161 | 22,052 | — | 23,213 | 2,130 | 5/31/2012 | 2003 | |||||||||||||||||||||||||
| Johnson Controls, Inc. |
Pinellas Park | FL | 16,200 | 4,538 | 23,842 | — | 28,380 | 242 | 11/5/2013 | 2001 | ||||||||||||||||||||||||||
| Kaiser Foundation |
Cupertino | CA | — | (1) | 14,236 | 42,708 | — | 56,944 | 1,848 | 2/20/2013 | 2005 | |||||||||||||||||||||||||
| Ker’s WingHouse Bar and Grill |
Brandon | FL | — | (1) | 340 | 654 | — | 994 | 19 | 6/27/2013 | 1999 | |||||||||||||||||||||||||
| Ker’s WingHouse Bar and Grill |
Clearwater | FL | — | (1) | 550 | 627 | — | 1,177 | 18 | 6/27/2013 | 1979 | |||||||||||||||||||||||||
| Key Bank |
Spencerport | NY | — | (1) | 59 | 1,112 | — | 1,171 | 35 | 6/5/2013 | 1960 | |||||||||||||||||||||||||
| Key Bank |
Berea | OH | — | 234 | 1,326 | — | 1,560 | 18 | 10/1/2013 | 1958 | ||||||||||||||||||||||||||
| KFC |
Deming | NM | — | (1) | 220 | 691 | — | 911 | 19 | 6/27/2013 | 1992 | |||||||||||||||||||||||||
| KFC |
Las Cruces | NM | — | (1) | 270 | 498 | — | 768 | 14 | 6/27/2013 | 1990 | |||||||||||||||||||||||||
| KFC |
Appleton | WI | — | (1) | 350 | 874 | — | 1,224 | 24 | 6/27/2013 | 1988 | |||||||||||||||||||||||||
| Kohl’s |
Howell | MI | — | 547 | 10,399 | — | 10,946 | 548 | 3/28/2013 | 2003 | ||||||||||||||||||||||||||
| Koninklijke |
Levittown | PA | 13,340 | 4,716 | 9,955 | — | 14,671 | 83 | 11/5/2013 | 2006 | ||||||||||||||||||||||||||
| Krystal |
Greenville | AL | — | (1) | 195 | 1,147 | — | 1,367 | 32 | 6/27/2013 | 2000 | |||||||||||||||||||||||||
| Krystal |
Montgomery | AL | — | (1) | 259 | 1,036 | — | 1,295 | 91 | 9/21/2012 | 1964 | |||||||||||||||||||||||||
| Krystal |
Montgomery | AL | — | (1) | 560 | 829 | — | 1,389 | 23 | 6/27/2013 | 2000 | |||||||||||||||||||||||||
| Krystal |
Phoenix City | AL | — | (1) | 366 | 1,465 | — | 1,831 | 129 | 9/21/2012 | 1980 | |||||||||||||||||||||||||
| Krystal |
Scottsboro | AL | — | (1) | 20 | 1,157 | — | 1,177 | 32 | 6/27/2013 | 1999 | |||||||||||||||||||||||||
| Krystal |
Tuscaloosa | AL | — | (1) | 206 | 1,165 | — | 1,371 | 103 | 9/21/2012 | 1976 | |||||||||||||||||||||||||
| Krystal |
Jacksonville | FL | — | (1) | 574 | 574 | — | 1,148 | 51 | 9/21/2012 | 1990 | |||||||||||||||||||||||||
| Krystal |
Orlando | FL | — | (1) | 372 | 372 | — | 744 | 33 | 9/21/2012 | 1994 | |||||||||||||||||||||||||
| Krystal |
Orlando | FL | — | (1) | 669 | 446 | — | 1,115 | 39 | 9/21/2012 | 1995 | |||||||||||||||||||||||||
| Krystal |
Plant City | FL | — | (1) | 355 | 533 | — | 888 | 47 | 9/21/2012 | 2012 | |||||||||||||||||||||||||
| Krystal |
St. Augustine | FL | — | (1) | 411 | 411 | — | 822 | 36 | 9/21/2012 | 2012 | |||||||||||||||||||||||||
| Krystal |
Albany | GA | — | (1) | 309 | 721 | — | 1,030 | 63 | 9/21/2012 | 1962 | |||||||||||||||||||||||||
| Krystal |
Atlanta | GA | — | (1) | 166 | 664 | — | 830 | 58 | 9/21/2012 | 1973 | |||||||||||||||||||||||||
| Krystal |
Augusta | GA | — | (1) | 365 | 851 | — | 1,216 | 75 | 9/21/2012 | 1979 | |||||||||||||||||||||||||
F-93
Table of Contents
| Initial Costs | ||||||||||||||||||||||||||||||||||||
| Property |
City |
State |
Encumbrances at December 31, 2013 |
Land | Buildings, Fixtures and Improvements |
Costs Capitalized Subsequent to Acquisition |
Gross Amount Carried at December 31, 2013 (10) (11) |
Accumulated Depreciation (12) (13) |
Date Acquired |
Date of Construction |
||||||||||||||||||||||||||
| Krystal |
Columbus | GA | $ | — | (1) | $ | 622 | $ | 934 | $ | — | $ | 1,556 | $ | 82 | 9/21/2012 | 1977 | |||||||||||||||||||
| Krystal |
Decatur | GA | — | (1) | 94 | 533 | — | 627 | 47 | 9/21/2012 | 1965 | |||||||||||||||||||||||||
| Krystal |
East Point | GA | — | (1) | 221 | 664 | — | 885 | 55 | 10/26/2012 | 1984 | |||||||||||||||||||||||||
| Krystal |
Macon | GA | — | (1) | 325 | 759 | — | 1,084 | 67 | 9/21/2012 | 1962 | |||||||||||||||||||||||||
| Krystal |
Milledgeville | GA | — | (1) | 261 | 609 | — | 870 | 54 | 9/21/2012 | 2011 | |||||||||||||||||||||||||
| Krystal |
Snellville | GA | — | (1) | 466 | 466 | — | 932 | 41 | 9/21/2012 | 1981 | |||||||||||||||||||||||||
| Krystal |
Gulfport | MS | — | (1) | 215 | 861 | — | 1,076 | 76 | 9/21/2012 | 2011 | |||||||||||||||||||||||||
| Krystal |
Jackson | MS | — | (1) | 285 | 1,140 | — | 1,425 | 100 | 9/21/2012 | 1978 | |||||||||||||||||||||||||
| Krystal |
Jackson | MS | — | (1) | 198 | 1,120 | — | 1,318 | 99 | 9/21/2012 | 1983 | |||||||||||||||||||||||||
| Krystal |
Pearl | MS | — | (1) | 426 | 638 | — | 1,064 | 56 | 9/21/2012 | 1976 | |||||||||||||||||||||||||
| Krystal |
Chattanooga | TN | — | (1) | 336 | 784 | — | 1,120 | 69 | 9/21/2012 | 2010 | |||||||||||||||||||||||||
| Krystal |
Chattanooga | TN | — | (1) | 500 | 947 | — | 1,447 | 26 | 6/27/2013 | 1994 | |||||||||||||||||||||||||
| Krystal |
Knoxville | TN | — | (1) | 369 | 246 | — | 615 | 22 | 9/21/2012 | 1970 | |||||||||||||||||||||||||
| Kum & Go |
Bentonville | AR | — | (1) | 587 | 1,370 | — | 1,957 | 83 | 11/20/2012 | 2009 | |||||||||||||||||||||||||
| Kum & Go |
Lowell | AR | — | (1) | 774 | 1,437 | — | 2,211 | 87 | 11/20/2012 | 2009 | |||||||||||||||||||||||||
| Kum & Go |
Paragould | AR | — | (1) | 708 | 2,123 | — | 2,831 | 149 | 9/28/2012 | 2012 | |||||||||||||||||||||||||
| Kum & Go |
Rogers | AR | — | (1) | 668 | 1,559 | — | 2,227 | 95 | 11/20/2012 | 2008 | |||||||||||||||||||||||||
| Kum & Go |
Sherwood | AR | — | (1) | 866 | 1,609 | — | 2,475 | 113 | 9/28/2012 | 2012 | |||||||||||||||||||||||||
| Kum & Go |
Fountain | CO | — | (1) | 1,131 | 1,696 | — | 2,827 | 95 | 12/24/2012 | 2012 | |||||||||||||||||||||||||
| Kum & Go |
Monument | CO | — | (1) | 1,192 | 1,457 | — | 2,649 | 82 | 12/24/2012 | 2012 | |||||||||||||||||||||||||
| Kum & Go |
Muscatine | IA | — | (1) | 794 | 1,853 | — | 2,647 | 104 | 12/31/2012 | 2012 | |||||||||||||||||||||||||
| Kum & Go |
Ottumwa | IA | — | (1) | 586 | 1,368 | — | 1,954 | 83 | 11/20/2012 | 1998 | |||||||||||||||||||||||||
| Kum & Go |
Waukee | IA | — | (1) | 1,280 | 1,280 | — | 2,560 | 54 | 3/28/2013 | 2012 | |||||||||||||||||||||||||
| Kum & Go |
Tioga | ND | — | (1) | 318 | 2,863 | — | 3,181 | 188 | 11/8/2012 | 2012 | |||||||||||||||||||||||||
| Kum & Go |
Muskogee | OK | — | (1) | 423 | 1,691 | — | 2,114 | 40 | 7/22/2013 | 2013 | |||||||||||||||||||||||||
| Kum & Go |
Cheyenne | WY | — | (1) | 411 | 2,327 | — | 2,738 | 131 | 12/27/2012 | 2012 | |||||||||||||||||||||||||
| Leeann Chin |
Blaine | MN | — | (1) | 480 | 528 | — | 1,008 | 15 | 6/27/2013 | 1996 | |||||||||||||||||||||||||
| Leeann Chin |
Chanhassen | MN | — | (1) | 450 | 763 | — | 1,213 | 21 | 6/27/2013 | 1995 | |||||||||||||||||||||||||
| Leeann Chin |
Golden Valley | MN | — | (1) | 270 | 776 | — | 1,046 | 21 | 6/27/2013 | 1996 | |||||||||||||||||||||||||
| Logan’s Roadhouse |
Huntsville | AL | — | (1) | 520 | 4,797 | — | 5,317 | 138 | 6/27/2013 | 2003 | |||||||||||||||||||||||||
| Logan’s Roadhouse |
Fayetteville | AR | — | (1) | 1,570 | 2,182 | — | 3,752 | 63 | 6/27/2013 | 2004 | |||||||||||||||||||||||||
| Logan’s Roadhouse |
Hattiesburg | MS | — | (1) | 890 | 4,012 | — | 4,902 | 115 | 6/27/2013 | 2006 | |||||||||||||||||||||||||
| Logan’s Roadhouse |
Clarksville | TN | — | (1) | 1,010 | 4,424 | — | 5,434 | 127 | 6/27/2013 | 1994 | |||||||||||||||||||||||||
| Logan’s Roadhouse |
Cleveland | TN | — | (1) | 890 | 3,902 | — | 4,792 | 112 | 6/27/2013 | 2003 | |||||||||||||||||||||||||
| Logan’s Roadhouse |
El Paso | TX | — | (1) | 320 | 4,731 | — | 5,051 | 136 | 6/27/2013 | 1999 | |||||||||||||||||||||||||
| Long John Silver’s |
Alamogordo | NM | — | (1) | 160 | 574 | — | 734 | 16 | 6/27/2013 | 1977 | |||||||||||||||||||||||||
| LongHorn Steakhouse |
Tampa | FL | — | (1) | 370 | 1,852 | — | 2,222 | 53 | 6/27/2013 | 1999 | |||||||||||||||||||||||||
| Lowe’s |
New Orleans | LA | 15,643 | 10,317 | 20,728 | — | 31,045 | 172 | 11/5/2013 | 2005 | ||||||||||||||||||||||||||
| Mattress Firm |
Boise | ID | — | (1) | 335 | 1,339 | — | 1,674 | 63 | 2/22/2013 | 2013 | |||||||||||||||||||||||||
| Mattress Firm |
Columbus | IN | — | (1) | 157 | 891 | — | 1,048 | 58 | 11/6/2012 | 2012 | |||||||||||||||||||||||||
| Mattress Firm |
Raleigh | NC | — | (1) | 1,091 | 1,091 | — | 2,182 | 77 | 9/28/2012 | 2012 | |||||||||||||||||||||||||
| Mattress Firm |
Wilson | NC | — | (1) | 373 | 692 | — | 1,065 | 49 | 9/28/2012 | 2012 | |||||||||||||||||||||||||
| Mattress Firm |
Florence | SC | — | (1) | 398 | 929 | — | 1,327 | 57 | 12/7/2012 | 2012 | |||||||||||||||||||||||||
| Mattress Firm |
Rock Hill | SC | — | (1) | 385 | 898 | — | 1,283 | 17 | 8/21/2013 | 2008 | |||||||||||||||||||||||||
| Mattress Firm |
Nederland | TX | — | (1) | 311 | 1,245 | — | 1,556 | 87 | 9/26/2012 | 2012 | |||||||||||||||||||||||||
| McAlister’s |
Murfreesboro | TN | — | (1) | 310 | 720 | — | 1,030 | 21 | 6/27/2013 | 1985 | |||||||||||||||||||||||||
| MetroPCS Wireless |
Richardson | TX | — | 1,292 | 19,606 | — | 20,898 | 168 | 11/5/2013 | 1987 | ||||||||||||||||||||||||||
| Michelin North America |
Louisville | KY | — | (2) | 1,120 | 7,763 | — | 8,883 | 79 | 11/5/2013 | 2011 | |||||||||||||||||||||||||
| Monro Muffler |
Waukesha | WI | — | (1) | 228 | 684 | — | 912 | 17 | 7/23/2013 | 2002 | |||||||||||||||||||||||||
| Morgan’s Food’s |
Pittsburgh | PA | — | 180 | 269 | — | 449 | 4 | 10/1/2013 | 1985 | ||||||||||||||||||||||||||
| Morgan’s Food’s |
Benwood | WV | — | 123 | 287 | — | 410 | 4 | 10/1/2013 | 2006 | ||||||||||||||||||||||||||
| Mo’s Irish Pub Restaurant |
Wauwatosa | WI | — | (1) | 550 | 818 | — | 1,368 | 23 | 6/27/2013 | 1977 | |||||||||||||||||||||||||
| Mrs Baird’s |
Dallas | TX | — | (1) | 453 | 4,077 | — | 4,530 | 373 | 7/11/2012 | 2002 | |||||||||||||||||||||||||
F-94
Table of Contents
| Initial Costs | ||||||||||||||||||||||||||||||||||||
| Property |
City |
State |
Encumbrances at December 31, 2013 |
Land | Buildings, Fixtures and Improvements |
Costs Capitalized Subsequent to Acquisition |
Gross Amount Carried at December 31, 2013 (10) (11) |
Accumulated Depreciation (12) (13) |
Date Acquired |
Date of Construction |
||||||||||||||||||||||||||
| Multi tenant (1000 Milwaukee Avenue) |
Glenview | IL | $ | 55,523 | $ | 14,016 | $ | 73,313 | $ | — | $ | 87,329 | $ | 665 | 11/5/2013 | 2001 | ||||||||||||||||||||
| Multi tenant (15721 Park Row Boulevard) |
Houston | TX | 19,525 | 2,356 | 36,347 | — | 38,703 | 295 | 11/5/2013 | 2009 | ||||||||||||||||||||||||||
| Multi tenant (1585 Sawdust Road) |
The Woodlands | TX | 22,440 | 4,724 | 40,332 | — | 45,056 | 321 | 11/5/2013 | 2009 | ||||||||||||||||||||||||||
| Multi tenant (2211 Old Earhart Road) |
AnnArbor | MI | 29,356 | 3,520 | 39,594 | — | 43,114 | 314 | 11/5/2013 | 2013 | ||||||||||||||||||||||||||
| Multi tenant (26501 Aliso Creek Road) |
Aliso Viejo | CA | 40,024 | 18,726 | 31,970 | — | 50,696 | 266 | 11/5/2013 | 2005 | ||||||||||||||||||||||||||
| Multi tenant (5859 Farinon Drive) |
San Antonio | TX | 10,000 | 1,666 | 19,092 | — | 20,758 | 155 | 11/5/2013 | 2008 | ||||||||||||||||||||||||||
| Multi tenant (Columbia Pike) |
Silver Spring | MD | — | 2,190 | 26,635 | 766 | 29,591 | 203 | 11/5/2013 | 1986 | ||||||||||||||||||||||||||
| Multi tenant (Dodge Building) |
Omaha | NE | — | (2) | — | 7,358 | — | 7,358 | 112 | 11/5/2013 | 2011 | |||||||||||||||||||||||||
| Multi tenant (Landmark Building) |
Omaha | NE | — | (2) | — | 10,156 | 4 | 10,160 | 253 | 11/5/2013 | 1991 | |||||||||||||||||||||||||
| My Dentist |
Chickasha | OK | — | (1) | 100 | 186 | — | 286 | 6 | 6/27/2013 | 2001 | |||||||||||||||||||||||||
| National Tire & Battery |
Morrow | GA | — | (1) | 397 | 1,586 | — | 1,983 | 146 | 6/5/2012 | 1992 | |||||||||||||||||||||||||
| National Tire & Battery |
St. Louis | MO | — | (1) | 756 | 924 | — | 1,680 | 63 | 10/31/2012 | 1998 | |||||||||||||||||||||||||
| Nestle Holdings |
Breinigsville | PA | 46,494 | — | 66,948 | — | 66,948 | 681 | 11/5/2013 | 1994 | ||||||||||||||||||||||||||
| O’Reilly Auto Parts |
Oneonta | AL | — | (1) | 81 | 460 | — | 541 | 37 | 8/2/2012 | 2000 | |||||||||||||||||||||||||
| O’Reilly Auto Parts |
Laramie | WY | — | (1) | 144 | 1,297 | — | 1,441 | 91 | 10/12/2012 | 1999 | |||||||||||||||||||||||||
| Pearson |
Lawrence | KS | 15,177 | 2,548 | 18,057 | — | 20,605 | 156 | 11/5/2013 | 1997 | ||||||||||||||||||||||||||
| Pilot Flying J |
Carnesville | GA | — | (1) | 1,867 | 7,466 | — | 9,333 | 494 | 1/31/2013 | 2000 | |||||||||||||||||||||||||
| Pizza Hut |
Cooper City | FL | — | (1) | 320 | 466 | — | 786 | 13 | 6/27/2013 | 1998 | |||||||||||||||||||||||||
| Pizza Hut |
Marathon | FL | — | (1) | 530 | 187 | — | 717 | 5 | 6/27/2013 | 1980 | |||||||||||||||||||||||||
| Pizza Hut |
Bozeman | MT | — | (1) | 150 | 343 | — | 493 | 10 | 6/27/2013 | 1976 | |||||||||||||||||||||||||
| Pizza Hut |
Glasgow | MT | — | (1) | 120 | 217 | — | 337 | 6 | 6/27/2013 | 1985 | |||||||||||||||||||||||||
| Pizza Hut |
Laurel | MT | — | (1) | 170 | 621 | — | 791 | 18 | 6/27/2013 | 1985 | |||||||||||||||||||||||||
| Pizza Hut |
Livingston | MT | — | (1) | 130 | 245 | — | 375 | 7 | 6/27/2013 | 1979 | |||||||||||||||||||||||||
| Pizza Hut |
Knoxville | TN | — | (1) | 300 | 546 | — | 846 | 16 | 6/27/2013 | 1992 | |||||||||||||||||||||||||
| Pollo Tropical |
Davie | FL | — | (1) | 280 | 1,490 | — | 1,770 | 41 | 6/27/2013 | 1993 | |||||||||||||||||||||||||
| Pollo Tropical |
Fort Lauderdale | FL | — | (1) | 190 | 1,242 | — | 1,432 | 34 | 6/27/2013 | 1996 | |||||||||||||||||||||||||
| Pollo Tropical |
Lake Worth | FL | — | (1) | 280 | 1,182 | — | 1,462 | 33 | 6/27/2013 | 1994 | |||||||||||||||||||||||||
| Popeyes |
Starke | FL | — | (1) | 380 | — | — | 380 | — | 6/27/2013 | 1997 | |||||||||||||||||||||||||
| Popeyes |
Thomasville | GA | — | (1) | 110 | 705 | — | 815 | 20 | 6/27/2013 | 1998 | |||||||||||||||||||||||||
| Popeyes |
Valdosta | GA | — | (1) | 240 | 599 | — | 839 | 17 | 6/27/2013 | 1998 | |||||||||||||||||||||||||
| Popeyes |
New Orleans | LA | — | (1) | 60 | 390 | — | 450 | 11 | 6/27/2013 | 1975 | |||||||||||||||||||||||||
| Popeyes |
Channelview | TX | — | (1) | 220 | 401 | — | 621 | 11 | 6/27/2013 | 1980 | |||||||||||||||||||||||||
| Popeyes |
Houston | TX | — | (1) | 300 | 244 | — | 544 | 7 | 6/27/2013 | 1978 | |||||||||||||||||||||||||
| Popeyes |
Houston | TX | — | (1) | 190 | 452 | — | 642 | 13 | 6/27/2013 | 1978 | |||||||||||||||||||||||||
| PriceRite |
Rochester | NY | — | 569 | 3,222 | — | 3,791 | 285 | 9/27/2012 | 2007 | ||||||||||||||||||||||||||
| Pulte Mortgage LLC |
Englewood | CO | — | 2,563 | 22,026 | — | 24,589 | 185 | 11/5/2013 | 2009 | ||||||||||||||||||||||||||
| Qdoba |
Flint | MI | — | (1) | 110 | 990 | — | 1,100 | 52 | 3/29/2013 | 2006 | |||||||||||||||||||||||||
| Qdoba |
Grand Blanc | MI | — | (1) | 165 | 935 | — | 1,100 | 49 | 3/29/2013 | 2006 | |||||||||||||||||||||||||
| Rally’s |
Indianapolis | IN | — | (1) | 210 | 1,514 | — | 1,724 | 42 | 6/27/2013 | 1990 | |||||||||||||||||||||||||
| Rally’s |
Kokomo | IN | — | (1) | 290 | 548 | — | 838 | 15 | 6/27/2013 | 1989 | |||||||||||||||||||||||||
| Rally’s |
Muncie | IN | — | (1) | 310 | 1,196 | — | 1,506 | 33 | 6/27/2013 | 1989 | |||||||||||||||||||||||||
| Rally’s |
Harvey | LA | — | (1) | 420 | 870 | — | 1,290 | 24 | 6/27/2013 | 2004 | |||||||||||||||||||||||||
| Rally’s |
New Orleans | LA | — | (1) | 450 | 1,691 | — | 2,141 | 47 | 6/27/2013 | 1990 | |||||||||||||||||||||||||
| Rally’s |
New Orleans | LA | — | (1) | 220 | 1,018 | — | 1,238 | 28 | 6/27/2013 | 2004 | |||||||||||||||||||||||||
| Rally’s |
Hamtramck | MI | — | (1) | 230 | 1,020 | — | 1,250 | 28 | 6/27/2013 | 1993 | |||||||||||||||||||||||||
F-95
Table of Contents
| Initial Costs | ||||||||||||||||||||||||||||||||||||
| Property |
City |
State |
Encumbrances at December 31, 2013 |
Land | Buildings, Fixtures and Improvements |
Costs Capitalized Subsequent to Acquisition |
Gross Amount Carried at December 31, 2013 (10) (11) |
Accumulated Depreciation (12) (13) |
Date Acquired |
Date of Construction |
||||||||||||||||||||||||||
| Razzoos |
Lewisville | TX | $ | — | (1) | $ | 780 | $ | 1,503 | $ | — | $ | 2,283 | $ | 43 | 6/27/2013 | 1997 | |||||||||||||||||||
| Reckitt Benckiser |
Chester | NJ | 5,500 | 886 | 7,972 | — | 8,858 | 513 | 8/16/2012 | 2006 | ||||||||||||||||||||||||||
| Rite Aid |
Jeffersonville | IN | — | (1) | 824 | 2,472 | — | 3,296 | 161 | 11/30/2012 | 2008 | |||||||||||||||||||||||||
| Rite Aid |
Lawrenceburg | KY | — | (1) | 567 | 2,267 | — | 2,834 | 147 | 11/30/2012 | 2008 | |||||||||||||||||||||||||
| Rite Aid |
Lexington | KY | — | (1) | — | 1,943 | — | 1,943 | 126 | 11/30/2012 | 2007 | |||||||||||||||||||||||||
| Rite Aid |
Paris | KY | — | (1) | 743 | 2,228 | — | 2,971 | 145 | 11/30/2012 | 2008 | |||||||||||||||||||||||||
| Rite Aid |
Scottsville | KY | — | (1) | 153 | 2,904 | — | 3,057 | 189 | 11/30/2012 | 2007 | |||||||||||||||||||||||||
| Rite Aid |
Stanford | KY | — | (1) | 152 | 2,886 | — | 3,038 | 188 | 11/30/2012 | 2009 | |||||||||||||||||||||||||
| Rite Aid |
Lima | OH | — | (1) | 576 | 2,304 | — | 2,880 | 161 | 11/13/2012 | 2006 | |||||||||||||||||||||||||
| Rite Aid |
Louisville | OH | — | (1) | 576 | 3,266 | — | 3,842 | 229 | 10/31/2012 | 2008 | |||||||||||||||||||||||||
| Rite Aid |
Marion | OH | — | (1) | 508 | 2,877 | — | 3,385 | 201 | 11/13/2012 | 2006 | |||||||||||||||||||||||||
| Rite Aid |
Huntington | WV | — | (1) | 964 | 2,250 | — | 3,214 | 146 | 11/30/2012 | 2008 | |||||||||||||||||||||||||
| Rubbermaid |
Winfield | KS | 12,725 | 1,056 | 20,060 | — | 21,116 | 2,039 | 4/25/2012 | 2008 | ||||||||||||||||||||||||||
| Rubbermaid |
Winfield | KS | — | (1) | 819 | 15,555 | — | 16,374 | 1,028 | 11/28/2012 | 2012 | |||||||||||||||||||||||||
| Ruby Tuesday |
Colorado Springs | CO | — | (1) | 480 | 809 | — | 1,289 | 23 | 6/27/2013 | 1999 | |||||||||||||||||||||||||
| Ruby Tuesday |
Dillon | CO | — | (1) | 400 | 1,628 | — | 2,028 | 47 | 6/27/2013 | 1999 | |||||||||||||||||||||||||
| Ruby Tuesday |
Bartow | FL | — | (1) | 270 | 1,916 | — | 2,186 | 55 | 6/27/2013 | 1999 | |||||||||||||||||||||||||
| Ruby Tuesday |
London | KY | — | (1) | 370 | 1,493 | — | 1,863 | 43 | 6/27/2013 | 1997 | |||||||||||||||||||||||||
| Ruby Tuesday |
Somerset | KY | — | (1) | 480 | 1,120 | — | 1,600 | 32 | 6/27/2013 | 1998 | |||||||||||||||||||||||||
| Sakura Tepanyaki Steakhouse |
Orem | UT | — | (1) | 340 | 658 | — | 998 | 19 | 6/27/2013 | 1999 | |||||||||||||||||||||||||
| Sam’s Southern Eatery |
Kennesaw | GA | — | (1) | 210 | 46 | — | 256 | 1 | 6/27/2013 | 1976 | |||||||||||||||||||||||||
| Scotts Company |
Orrville | OH | — | (1) | 611 | 1,134 | — | 1,745 | 98 | 7/30/2012 | 2008 | |||||||||||||||||||||||||
| Scotts Company |
Orrville | OH | — | (1) | 609 | 11,576 | — | 12,185 | 1,000 | 7/30/2012 | 2008 | |||||||||||||||||||||||||
| Scotts Company |
Orrville | OH | — | (1) | 278 | 2,502 | — | 2,780 | 191 | 9/28/2012 | 2008 | |||||||||||||||||||||||||
| Shaw’s Supermarkets |
Plymouth | MA | — | (1) | 1,440 | 3,361 | — | 4,801 | 394 | 4/18/2012 | 2000 | |||||||||||||||||||||||||
| Shoney’s |
Athens | AL | — | 560 | 110 | — | 670 | 3 | 6/27/2013 | 1982 | ||||||||||||||||||||||||||
| Shoney’s |
Florence | AL | — | 100 | 484 | — | 584 | 14 | 6/27/2013 | 1966 | ||||||||||||||||||||||||||
| Shoney’s |
Gadsden | AL | — | (1) | 220 | 707 | — | 927 | 20 | 6/27/2013 | 1982 | |||||||||||||||||||||||||
| Shoney’s |
Oxford | AL | — | (1) | 670 | 25 | — | 695 | 1 | 6/27/2013 | 1977 | |||||||||||||||||||||||||
| Shoney’s |
Valdosta | GA | — | 420 | 440 | — | 860 | 13 | 6/27/2013 | 2000 | ||||||||||||||||||||||||||
| Shoney’s |
Elizabethtown | KY | — | (1) | 450 | 465 | — | 915 | 13 | 6/27/2013 | 1986 | |||||||||||||||||||||||||
| Shoney’s |
Grayson | KY | — | (1) | 420 | 406 | — | 826 | 12 | 6/27/2013 | 1994 | |||||||||||||||||||||||||
| Shoney’s |
Owensboro | KY | — | 390 | 129 | — | 519 | 4 | 6/27/2013 | 1988 | ||||||||||||||||||||||||||
| Shoney’s |
Lafayette | LA | — | 530 | 138 | — | 668 | 4 | 6/27/2013 | 1989 | ||||||||||||||||||||||||||
| Shoney’s |
Osage Beach | MO | — | 453 | 113 | — | 566 | 3 | 6/27/2013 | 1992 | ||||||||||||||||||||||||||
| Shoney’s |
Hattiesburg | MS | — | (1) | 730 | 618 | — | 1,348 | 18 | 6/27/2013 | 1989 | |||||||||||||||||||||||||
| Shoney’s |
Jackson | MS | — | (1) | 360 | 572 | — | 932 | 16 | 6/27/2013 | 1989 | |||||||||||||||||||||||||
| Shoney’s |
Summerville | SC | — | (1) | 350 | 800 | — | 1,150 | 23 | 6/27/2013 | 1995 | |||||||||||||||||||||||||
| Shoney’s |
Cookeville | TN | — | (1) | 510 | 760 | — | 1,270 | 22 | 6/27/2013 | 1995 | |||||||||||||||||||||||||
| Shoney’s |
Lawrenceburg | TN | — | (1) | 330 | 873 | — | 1,203 | 25 | 6/27/2013 | 1983 | |||||||||||||||||||||||||
| Shoney’s |
Charleston | WV | — | (1) | 190 | 543 | — | 733 | 16 | 6/27/2013 | 1981 | |||||||||||||||||||||||||
| Shoney’s |
Lewisburg | WV | — | (1) | 110 | 642 | — | 752 | 18 | 6/27/2013 | 1981 | |||||||||||||||||||||||||
| Shoney’s |
Princeton | WV | — | (1) | 90 | 593 | — | 683 | 17 | 6/27/2013 | 1975 | |||||||||||||||||||||||||
| Shoney’s |
Ripley | WV | — | (1) | 200 | 599 | — | 799 | 17 | 6/27/2013 | 1981 | |||||||||||||||||||||||||
| Smokey Bones BBQ |
Morrow | GA | — | 390 | 2,184 | — | 2,574 | 63 | 6/27/2013 | 1999 | ||||||||||||||||||||||||||
| Sonny’s Real Pit Bar-B-Q |
Athens | GA | — | (1) | 460 | 1,280 | — | 1,740 | 37 | 6/27/2013 | 1981 | |||||||||||||||||||||||||
| Sonny’s Real Pit Bar-B-Q |
Conyers | GA | — | (1) | 450 | 663 | — | 1,113 | 19 | 6/27/2013 | 1994 | |||||||||||||||||||||||||
| Sonny’s Real Pit Bar-B-Q |
Marietta | GA | — | (1) | 290 | 1,772 | — | 2,062 | 51 | 6/27/2013 | 1988 | |||||||||||||||||||||||||
| Spaghetti Warehouse |
Marietta | GA | — | (1) | 800 | 276 | — | 1,076 | 8 | 6/27/2013 | 1986 | |||||||||||||||||||||||||
| Spaghetti Warehouse |
Aurora | IL | — | (1) | 480 | 805 | — | 1,285 | 23 | 6/27/2013 | 1993 | |||||||||||||||||||||||||
| Spaghetti Warehouse |
Elk Grove Village |
IL |
— | (1) | 550 | 299 | — | 849 | 9 | 6/27/2013 | 1995 | |||||||||||||||||||||||||
| Spaghetti Warehouse |
Oklahoma City |
OK |
— | (1) | 570 | 1,193 | — | 1,763 | 34 | 6/27/2013 | 1905 | |||||||||||||||||||||||||
| Spaghetti Warehouse |
Tulsa |
OK |
— | (1) | 530 | 1,174 | — | 1,704 | 34 | 6/27/2013 | 1917 | |||||||||||||||||||||||||
F-96
Table of Contents
| Initial Costs | ||||||||||||||||||||||||||||||||||||
| Property |
City |
State |
Encumbrances at December 31, 2013 |
Land | Buildings, Fixtures and Improvements |
Costs Capitalized Subsequent to Acquisition |
Gross Amount Carried at December 31, 2013 (10) (11) |
Accumulated Depreciation (12) (13) |
Date Acquired |
Date of Construction |
||||||||||||||||||||||||||
| Spaghetti Warehouse |
Memphis |
TN |
$ | — | (1) | $ | 100 | $ | 283 | $ | — | $ | 383 | $ | 8 | 6/27/2013 | 1905 | |||||||||||||||||||
| Spaghetti Warehouse |
Arlington |
TX |
— | (1) | 630 | 1,400 | — | 2,030 | 40 | 6/27/2013 | 1994 | |||||||||||||||||||||||||
| Spaghetti Warehouse |
Dallas |
TX |
— | (1) | 810 | 1,656 | — | 2,466 | 47 | 6/27/2013 | 1990 | |||||||||||||||||||||||||
| Spaghetti Warehouse |
Houston |
TX |
— | (1) | 980 | 2,284 | — | 3,264 | 65 | 6/27/2013 | 1906 | |||||||||||||||||||||||||
| Spaghetti Warehouse |
Plano |
TX |
— | (1) | 540 | 1,060 | — | 1,600 | 30 | 6/27/2013 | 1993 | |||||||||||||||||||||||||
| Spaghetti Warehouse |
San Antonio |
TX |
— | (1) | 1,140 | 1,434 | — | 2,574 | 41 | 6/27/2013 | 1907 | |||||||||||||||||||||||||
| Subway |
Knoxville |
TN |
— | (1) | 160 | 349 | — | 509 | 10 | 6/27/2013 | 1990 | |||||||||||||||||||||||||
| Sweet Tomatoes |
Coral Springs |
FL |
— | (1) | 790 | 1,625 | — | 2,415 | 47 | 6/27/2013 | 1997 | |||||||||||||||||||||||||
| Synovus Bank |
Tampa |
FL |
— | (1) | 985 | 2,298 | — | 3,283 | 123 | 12/31/2012 | 1959 | |||||||||||||||||||||||||
| T.G.I. Friday’s |
Homestead |
PA |
— | (1) | 970 | 3,455 | — | 4,425 | 99 | 6/27/2013 | 2000 | |||||||||||||||||||||||||
| Taco Bell |
Daphne |
AL |
— | (1) | 180 | 1,278 | — | 1,458 | 35 | 6/27/2013 | 1984 | |||||||||||||||||||||||||
| Taco Bell |
Foley |
AL |
— | (1) | 360 | 1,460 | — | 1,820 | 40 | 6/27/2013 | 1992 | |||||||||||||||||||||||||
| Taco Bell |
Mobile |
AL |
— | (1) | 160 | 1,973 | — | 2,133 | 55 | 6/27/2013 | 1994 | |||||||||||||||||||||||||
| Taco Bell |
SaraLand |
AL |
— | (1) | 150 | 1,063 | — | 1,213 | 29 | 6/27/2013 | 1991 | |||||||||||||||||||||||||
| Taco Bell |
Jacksonville |
FL |
— | (1) | 440 | 1,167 | — | 1,607 | 32 | 6/27/2013 | 1985 | |||||||||||||||||||||||||
| Taco Bell |
Jacksonville |
FL |
— | (1) | 340 | 1,383 | — | 1,723 | 38 | 6/27/2013 | 1991 | |||||||||||||||||||||||||
| Taco Bell |
Pensacola |
FL |
— | (1) | 140 | 1,897 | — | 2,037 | 53 | 6/27/2013 | 1986 | |||||||||||||||||||||||||
| Taco Bell |
Augusta |
GA |
— | (1) | 220 | 1,292 | — | 1,512 | 36 | 6/27/2013 | 1979 | |||||||||||||||||||||||||
| Taco Bell |
Hephzibah |
GA |
— | (1) | 330 | 930 | — | 1,260 | 26 | 6/27/2013 | 1998 | |||||||||||||||||||||||||
| Taco Bell |
Jesup |
GA |
— | (1) | 230 | 715 | — | 945 | 20 | 6/27/2013 | 1998 | |||||||||||||||||||||||||
| Taco Bell |
Waycross |
GA |
— | (1) | 170 | 1,115 | — | 1,285 | 31 | 6/27/2013 | 1994 | |||||||||||||||||||||||||
| Taco Bell |
St. Louis |
MO |
— | (1) | 190 | 1,951 | — | 1,541 | 44 | 6/27/2013 | 1991 | |||||||||||||||||||||||||
| Taco Bell |
Wentzville |
MO |
— | (1) | 410 | 1,168 | — | 1,578 | 32 | 6/27/2013 | 2000 | |||||||||||||||||||||||||
| Taco Bell |
Brunswick |
OH |
— | (1) | 400 | 1,267 | — | 1,667 | 35 | 6/27/2013 | 1992 | |||||||||||||||||||||||||
| Taco Bell |
North Olmstead |
OH |
— | (1) | 390 | 904 | — | 1,294 | 25 | 6/27/2013 | 1979 | |||||||||||||||||||||||||
| Taco Bell |
Kingston |
TN |
— | (1) | 280 | 714 | — | 994 | 20 | 6/27/2013 | 1997 | |||||||||||||||||||||||||
| Taco Bell |
Dallas |
TX |
— | (1) | 400 | 1,225 | — | 1,625 | 34 | 6/27/2013 | 1997 | |||||||||||||||||||||||||
| Taco Bell |
Colonial Heights |
VA |
— | (1) | 450 | 1,144 | — | 1,594 | 32 | 6/27/2013 | 1994 | |||||||||||||||||||||||||
| Taco Bell |
Hayes |
VA |
— | (1) | 350 | — | — | 350 | — | 6/27/2013 | 1994 | |||||||||||||||||||||||||
| Taco Bell |
Portsmouth |
VA |
— | 350 | — | — | 350 | — | 6/27/2013 | 1997 | ||||||||||||||||||||||||||
| Taco Bell |
Richmond |
VA |
— | (1) | 500 | 1,061 | — | 1,561 | 29 | 6/27/2013 | 1994 | |||||||||||||||||||||||||
| Taco Bell |
Richmond |
VA |
— | (1) | 510 | 1,321 | — | 1,831 | 37 | 6/27/2013 | 1994 | |||||||||||||||||||||||||
| Taco Bell/Long John Silvers |
Ashtabula |
OH |
— | (1) | 440 | 1,640 | — | 2,080 | 45 | 6/27/2013 | 2004 | |||||||||||||||||||||||||
| Taco Bell/Pizza Hut |
Dallas |
TX |
— | (1) | 420 | 1,582 | — | 2,002 | 44 | 6/27/2013 | 2000 | |||||||||||||||||||||||||
| Taco Cabana |
Austin |
TX |
— | (1) | 700 | 2,105 | — | 2,805 | 58 | 6/27/2013 | 1980 | |||||||||||||||||||||||||
| Taco Cabana |
Pasadena |
TX |
— | (1) | 420 | 1,420 | — | 1,840 | 39 | 6/27/2013 | 1994 | |||||||||||||||||||||||||
| Taco Cabana |
San Antonio |
TX |
— | (1) | 600 | 1,955 | — | 2,555 | 54 | 6/27/2013 | 1994 | |||||||||||||||||||||||||
| Taco Cabana |
San Antonio |
TX |
— | (1) | 500 | 1,740 | — | 2,240 | 48 | 6/27/2013 | 1985 | |||||||||||||||||||||||||
| Taco Cabana |
San Antonio |
TX |
— | (1) | 280 | 1,695 | — | 1,975 | 47 | 6/27/2013 | 1986 | |||||||||||||||||||||||||
| Taco Cabana |
San Antonio |
TX |
— | (1) | 500 | 1,766 | — | 2,266 | 49 | 6/27/2013 | 1984 | |||||||||||||||||||||||||
| Taco Cabana |
Schertz |
TX |
— | (1) | 520 | 1,408 | — | 1,928 | 39 | 6/27/2013 | 1998 | |||||||||||||||||||||||||
| Talbots HQ |
Hingham |
MA |
— | 3,009 | 27,080 | — | 30,089 | 762 | 5/24/2013 | 1980 | ||||||||||||||||||||||||||
| TCF National Bank |
Crystal |
MN |
— | (1) | 640 | 642 | — | 1,282 | 17 | 6/27/2013 | 1981 | |||||||||||||||||||||||||
| TD Bank |
Falmouth |
ME |
— | 4,057 | 23,489 | — | 27,046 | 864 | 3/18/2013 | 2002 | ||||||||||||||||||||||||||
| Teva Pharmaceuticals Industries Limited |
Malvern |
PA |
— | (2) | 2,666 | 40,981 | — | 43,647 | 326 | 11/5/2013 | 2013 | |||||||||||||||||||||||||
| Texas Roadhouse |
Cedar Rapids |
IA |
— | (1) | 430 | 2,194 | — | 2,624 | 63 | 6/27/2013 | 2000 | |||||||||||||||||||||||||
| Texas Roadhouse |
Ammon |
ID |
— | (1) | 490 | 1,206 | — | 1,696 | 35 | 6/27/2013 | 1999 | |||||||||||||||||||||||||
| Texas Roadhouse |
Shively |
KY |
— | (1) | 540 | 2,055 | — | 2,595 | 59 | 6/27/2013 | 1998 | |||||||||||||||||||||||||
| Texas Roadhouse |
Concord |
NC |
— | (1) | 650 | 2,130 | — | 2,780 | 61 | 6/27/2013 | 2000 | |||||||||||||||||||||||||
| Texas Roadhouse |
Gastonia |
NC |
— | (1) | 570 | 1,544 | — | 2,114 | 44 | 6/27/2013 | 1999 | |||||||||||||||||||||||||
| Texas Roadhouse |
Hickory |
NC |
— | (1) | 580 | 1,831 | — | 2,411 | 53 | 6/27/2013 | 1999 | |||||||||||||||||||||||||
| Texas Roadhouse |
Dickson City |
PA |
— | (1) | 640 | 1,897 | — | 2,537 | 54 | 6/27/2013 | 2000 | |||||||||||||||||||||||||
| Texas Roadhouse |
College Station |
TX |
— | (1) | 670 | 2,299 | — | 2,969 | 66 | 6/27/2013 | 2000 | |||||||||||||||||||||||||
| Texas Roadhouse |
Grand Prairie |
TX |
— | (1) | 780 | 1,867 | — | 2,647 | 54 | 6/27/2013 | 1997 | |||||||||||||||||||||||||
| The Kroger Co. |
Calhoun |
GA |
— | (2) | — | 6,279 | — | 6,279 | 52 | 11/5/2013 | 1996 | |||||||||||||||||||||||||
F-97
Table of Contents
| Initial Costs | ||||||||||||||||||||||||||||||||||||
| Property |
City |
State |
Encumbrances at December 31, 2013 |
Land | Buildings, Fixtures and Improvements |
Costs Capitalized Subsequent to Acquisition |
Gross Amount Carried at December 31, 2013 (10) (11) |
Accumulated Depreciation (12) (13) |
Date Acquired |
Date of Construction |
||||||||||||||||||||||||||
| The Kroger Co. |
Lithonia |
GA |
$ | — | (2) | $ | — | $ | 6,250 | $ | — | $ | 6,250 | $ | 52 | 11/5/2013 | 1996 | |||||||||||||||||||
| The Kroger Co. |
Suwanee |
GA |
— | (2) | — | 7,574 | — | 7,574 | 63 | 11/5/2013 | 1996 | |||||||||||||||||||||||||
| The Kroger Co. |
Suwanee |
GA |
— | (2) | — | 7,691 | — | 7,691 | 64 | 11/5/2013 | 1996 | |||||||||||||||||||||||||
| The Kroger Co. |
Frankfort |
KY |
— | (2) | — | 5,794 | — | 5,794 | 48 | 11/5/2013 | 1996 | |||||||||||||||||||||||||
| The Kroger Co. |
Georgetown |
KY |
— | (2) | — | 6,742 | — | 6,742 | 56 | 11/5/2013 | 1996 | |||||||||||||||||||||||||
| The Kroger Co. |
Madisonville |
KY |
— | (2) | — | 5,715 | — | 5,715 | 48 | 11/5/2013 | 1996 | |||||||||||||||||||||||||
| The Kroger Co. |
Murray |
KY |
— | (2) | — | 6,165 | — | 6,165 | 51 | 11/5/2013 | 1996 | |||||||||||||||||||||||||
| The Kroger Co. |
Owensboro |
KY |
— | (2) | — | 6,073 | — | 6,073 | 51 | 11/5/2013 | 1996 | |||||||||||||||||||||||||
| The Kroger Co. |
Franklin |
TN |
— | (2) | — | 7,782 | — | 7,782 | 65 | 11/5/2013 | 1996 | |||||||||||||||||||||||||
| The Kroger Co. |
Knoxville |
TN |
— | (2) | — | 7,642 | — | 7,642 | 64 | 11/5/2013 | 1996 | |||||||||||||||||||||||||
| The Pantry, Inc. |
Montgomery |
AL |
— | (1) | 526 | 1,228 | — | 1,754 | 69 | 12/31/2012 | 1998 | |||||||||||||||||||||||||
| The Pantry, Inc. |
Charlotte |
NC |
— | (1) | 1,332 | 1,332 | — | 2,664 | 75 | 12/31/2012 | 2004 | |||||||||||||||||||||||||
| The Pantry, Inc. |
Charlotte |
NC |
— | (1) | 1,667 | 417 | — | 2,084 | 23 | 12/31/2012 | 1982 | |||||||||||||||||||||||||
| The Pantry, Inc. |
Charlotte |
NC |
— | (1) | 1,191 | 1,787 | — | 2,978 | 100 | 12/31/2012 | 1987 | |||||||||||||||||||||||||
| The Pantry, Inc. |
Charlotte |
NC |
— | (1) | 1,070 | 1,308 | — | 2,378 | 73 | 12/31/2012 | 1997 | |||||||||||||||||||||||||
| The Pantry, Inc. |
Conover |
NC |
— | (1) | 1,144 | 936 | — | 2,080 | 53 | 12/31/2012 | 1998 | |||||||||||||||||||||||||
| The Pantry, Inc. |
Cornelius |
NC |
— | (1) | 1,847 | 2,258 | — | 4,105 | 127 | 12/31/2012 | 1999 | |||||||||||||||||||||||||
| The Pantry, Inc. |
Lincolnton |
NC |
— | (1) | 1,766 | 2,159 | — | 3,925 | 121 | 12/31/2012 | 2000 | |||||||||||||||||||||||||
| The Pantry, Inc. |
Matthews |
NC |
— | (1) | 980 | 1,819 | — | 2,799 | 102 | 12/31/2012 | 1987 | |||||||||||||||||||||||||
| The Pantry, Inc. |
Thomasville |
NC |
— | (1) | 1,175 | 1,436 | — | 2,611 | 81 | 12/31/2012 | 2000 | |||||||||||||||||||||||||
| The Pantry, Inc. |
Fort Mill |
SC |
— | (1) | 1,311 | 1,967 | — | 3,278 | 110 | 12/31/2012 | 1988 | |||||||||||||||||||||||||
| The Procter & Gamble Co. |
FortWayne |
IN |
25,904 | — | 26,400 | — | 26,400 | 268 | 11/5/2013 | 1994 | ||||||||||||||||||||||||||
| Thermo Process Systems |
Sugarland |
TX |
— | (1) | 1,680 | 7,778 | — | 9,458 | 94 | 9/24/2013 | 2005 | |||||||||||||||||||||||||
| Tiffany & Co. |
Parsippany |
NJ |
55,773 | 2,248 | 81,083 | — | 83,331 | 824 | 11/5/2013 | 2002 | ||||||||||||||||||||||||||
| Tilted Kilt |
Hendersonville |
TN |
— | (1) | 310 | 763 | — | 1,073 | 22 | 6/27/2013 | 1994 | |||||||||||||||||||||||||
| Time Warner Cable |
Milwaukee |
WI |
20,570 | 3,081 | 22,512 | — | 25,593 | 217 | 11/5/2013 | 2001 | ||||||||||||||||||||||||||
| Tire Kingdom |
Dublin |
OH |
— | (6) | 373 | 1,119 | — | 1,492 | 108 | 4/27/2012 | 2003 | |||||||||||||||||||||||||
| TJX Companies, Inc. |
Philadelphia |
PA |
67,335 | 9,890 | 84,955 | — | 94,845 | 864 | 11/5/2013 | 2001 | ||||||||||||||||||||||||||
| T-Mobile USA, Inc. |
Nashville |
TN |
10,295 | 1,190 | 15,847 | — | 17,037 | 140 | 11/5/2013 | 2002 | ||||||||||||||||||||||||||
| Tractor Supply |
Oneonta |
AL |
— | (1) | 359 | 1,438 | — | 1,797 | 46 | 4/18/2013 | 2012 | |||||||||||||||||||||||||
| Tractor Supply |
Gray |
LA |
— | 550 | 2,202 | — | 2,752 | 149 | 8/7/2012 | 2011 | ||||||||||||||||||||||||||
| Tractor Supply |
Negaunee |
MI |
— | (1) | 488 | 1,953 | — | 2,441 | 147 | 6/12/2012 | 2010 | |||||||||||||||||||||||||
| Tractor Supply |
Plymouth |
NH |
— | 424 | 2,402 | — | 2,826 | 124 | 11/29/2012 | 2011 | ||||||||||||||||||||||||||
| Tractor Supply |
Allentown |
NJ |
— | (5) | 697 | 3,949 | — | 4,646 | 361 | 1/27/2012 | 2011 | |||||||||||||||||||||||||
| Tractor Supply |
Rio Grande City |
TX |
— | (1) | 469 | 1,095 | — | 1,564 | 78 | 6/19/2012 | 2008 | |||||||||||||||||||||||||
| UPS e-Logistics |
Elizabethtown |
KY |
— | (1) | 1,460 | 10,923 | — | 12,383 | 167 | 9/24/2013 | 2001 | |||||||||||||||||||||||||
| Bob’s Stores |
Randolph |
MA |
6,929 | 2,840 | 6,826 | — | 9,666 | 68 | 11/5/2013 | 1993 | ||||||||||||||||||||||||||
| Vacant |
Bethesda |
MD |
54,554 | 8,538 | 31,879 | — | 40,417 | 292 | 11/5/2013 | 2012 | ||||||||||||||||||||||||||
| Vacant |
Irving |
TX |
— | 3,096 | 5,302 | — | 8,398 | 34 | 11/5/2013 | 1997 | ||||||||||||||||||||||||||
| Vacant (Development property) |
Columbia |
SC |
— | — | 6,941 | 7,006 | 13,947 | — | 11/5/2013 | in progress | ||||||||||||||||||||||||||
| Vacant (Development property) |
The Woodlands |
TX |
— | — | 5,411 | 1,521 | 6,932 | — | 11/5/2013 | in progress | ||||||||||||||||||||||||||
| Vitamin Shoppe |
Evergreen Park |
IL |
— | (1) | 476 | 1,427 | — | 1,903 | 53 | 4/19/2013 | 2012 | |||||||||||||||||||||||||
| Vitamin Shoppe |
Ashland |
VA |
— | 2,400 | 19,663 | — | 22,063 | 200 | 11/5/2013 | 2013 | ||||||||||||||||||||||||||
| Walgreens |
Wetumpka |
AL |
— | (5) | 547 | 3,102 | — | 3,649 | 341 | 2/22/2012 | 2007 | |||||||||||||||||||||||||
| Walgreens |
Peoria |
AZ |
— | (1) | 837 | 1,953 | — | 2,790 | 98 | 2/28/2013 | 1996 | |||||||||||||||||||||||||
| Walgreens |
Phoenix |
AZ |
— | (1) | 1,037 | 1,927 | — | 2,964 | 87 | 3/26/2013 | 1999 | |||||||||||||||||||||||||
| Walgreens |
Coalings |
CA |
— | (3) | 396 | 3,568 | — | 3,964 | 482 | 10/11/2011 | 2008 | |||||||||||||||||||||||||
| Walgreens |
Acworth |
GA |
— | (1) | 1,583 | 2,940 | — | 4,523 | 162 | 1/25/2013 | 2012 | |||||||||||||||||||||||||
| Walgreens |
Chicago |
IL |
— | (1) | 1,212 | 2,829 | — | 4,041 | 156 | 1/30/2013 | 1999 | |||||||||||||||||||||||||
| Walgreens |
Chicago |
IL |
— | (1) | 1,617 | 3,003 | — | 4,620 | 165 | 1/30/2013 | 2007 | |||||||||||||||||||||||||
| Walgreens |
Anderson |
IN |
— | 807 | 3,227 | — | 4,034 | 274 | 7/31/2012 | 2001 | ||||||||||||||||||||||||||
| Walgreens |
Orlando |
FL |
— | (1) | 1,007 | 1,869 | — | 2,876 | 28 | 9/30/2013 | 1996 | |||||||||||||||||||||||||
| Walgreens |
Olathe |
KS |
— | (1) | 1,258 | 3,774 | — | 5,032 | 94 | 7/25/2013 | 2002 | |||||||||||||||||||||||||
F-98
Table of Contents
| Initial Costs | ||||||||||||||||||||||||||||||||||||
| Property |
City |
State |
Encumbrances at December 31, 2013 |
Land | Buildings, Fixtures and Improvements |
Costs Capitalized Subsequent to Acquisition |
Gross Amount Carried at December 31, 2013 (10) (11) |
Accumulated Depreciation (12) (13) |
Date Acquired |
Date of Construction |
||||||||||||||||||||||||||
| Walgreens |
Frankfort |
KY |
$ | — | (5) | $ | 911 | $ | 3,643 | $ | — | $ | 4,554 | $ | 419 | 2/8/2012 | 2006 | |||||||||||||||||||
| Walgreens |
Shreveport |
LA |
— | (5) | 619 | 3,509 | — | 4,128 | 386 | 2/22/2012 | 2003 | |||||||||||||||||||||||||
| Walgreens |
Baltimore |
MD |
— | (1) | 1,185 | 2,764 | — | 3,949 | 69 | 8/6/2013 | 2000 | |||||||||||||||||||||||||
| Walgreens |
Clinton |
MI |
— | (1) | 1,463 | 3,413 | — | 4,876 | 239 | 11/13/2012 | 2002 | |||||||||||||||||||||||||
| Walgreens |
Dearborn |
MI |
— | (1) | 190 | 3,605 | — | 3,795 | 162 | 4/1/2013 | 1998 | |||||||||||||||||||||||||
| Walgreens |
Eastpointe |
MI |
— | (1) | 668 | 2,672 | — | 3,340 | 307 | 1/19/2012 | 1998 | |||||||||||||||||||||||||
| Walgreens |
Lincoln Park |
MI |
— | 1,041 | 5,896 | — | 6,937 | 501 | 7/31/2012 | 2007 | ||||||||||||||||||||||||||
| Walgreens |
Livonia |
MI |
— | (1) | 261 | 2,350 | — | 2,611 | 106 | 4/1/2013 | 1998 | |||||||||||||||||||||||||
| Walgreens |
Stevensville |
MI |
— | (3) | 855 | 3,420 | — | 4,275 | 428 | 11/28/2011 | 2007 | |||||||||||||||||||||||||
| Walgreens |
Troy |
MI |
— | (1) | — | 1,896 | — | 1,896 | 123 | 12/12/2012 | 2000 | |||||||||||||||||||||||||
| Walgreens |
Warren |
MI |
— | (1) | 748 | 2,991 | — | 3,739 | 194 | 11/21/2012 | 1999 | |||||||||||||||||||||||||
| Walgreens |
Columbia |
MS |
— | 452 | 4,072 | — | 4,524 | 244 | 12/21/2012 | 2011 | ||||||||||||||||||||||||||
| Walgreens |
Greenwood |
MS |
— | (5) | 561 | 3,181 | — | 3,742 | 350 | 2/22/2012 | 2007 | |||||||||||||||||||||||||
| Walgreens |
Maplewood |
NJ |
— | (3) | 1,071 | 6,071 | — | 7,142 | 759 | 11/18/2011 | 2011 | |||||||||||||||||||||||||
| Walgreens |
Las Vegas |
NV |
— | 1,528 | 6,114 | — | 7,642 | 581 | 5/30/2012 | 2009 | ||||||||||||||||||||||||||
| Walgreens |
Las Vegas |
NV |
— | (1) | 700 | 2,801 | — | 3,501 | 112 | 4/30/2013 | 2001 | |||||||||||||||||||||||||
| Walgreens |
Staten Island |
NY |
— | — | 3,984 | — | 3,984 | 538 | 10/5/2011 | 2007 | ||||||||||||||||||||||||||
| Walgreens |
Akron |
OH |
— | 664 | 1,548 | — | 2,212 | 54 | 5/31/2013 | 1994 | ||||||||||||||||||||||||||
| Walgreens |
Bryan |
OH |
— | (5) | 219 | 4,154 | — | 4,373 | 457 | 2/22/2012 | 2007 | |||||||||||||||||||||||||
| Walgreens |
Eaton |
OH |
— | 398 | 3,586 | — | 3,984 | 323 | 6/27/2012 | 2008 | ||||||||||||||||||||||||||
| Walgreens |
Tahlequah |
OK |
— | 647 | 3,664 | — | 4,311 | 220 | 1/2/2013 | 2008 | ||||||||||||||||||||||||||
| Walgreens |
Aibonito Pueblo |
PR |
— | 1,855 | 5,566 | — | 7,421 | 278 | 3/5/2013 | 2012 | ||||||||||||||||||||||||||
| Walgreens |
Las Piedras |
PR |
— | 1,726 | 5,179 | — | 6,905 | 233 | 4/3/2013 | 2012 | ||||||||||||||||||||||||||
| Walgreens |
Anderson |
SC |
— | (5) | 835 | 3,342 | — | 4,177 | 384 | 2/8/2012 | 2006 | |||||||||||||||||||||||||
| Walgreens |
Easley |
SC |
— | 1,206 | 3,617 | — | 4,823 | 326 | 6/27/2012 | 2007 | ||||||||||||||||||||||||||
| Walgreens |
Greenville |
SC |
— | 1,313 | 3,940 | — | 5,253 | 355 | 6/27/2012 | 2006 | ||||||||||||||||||||||||||
| Walgreens |
Myrtle Beach |
SC |
— | (1) | — | 2,077 | — | 2,077 | 249 | 12/29/2011 | 2001 | |||||||||||||||||||||||||
| Walgreens |
North Charleston |
SC |
— | 1,320 | 3,081 | — | 4,401 | 277 | 6/27/2012 | 2008 | ||||||||||||||||||||||||||
| Walgreens |
Cordova |
TN |
— | 1,005 | 2,345 | — | 3,350 | 164 | 11/9/2012 | 2002 | ||||||||||||||||||||||||||
| Walgreens |
Memphis |
TN |
— | 896 | 2,687 | — | 3,583 | 201 | 10/2/2012 | 2003 | ||||||||||||||||||||||||||
| Walgreens |
Portsmouth |
VA |
2,118 | 730 | 3,311 | — | 4,041 | 33 | 11/5/2013 | 1998 | ||||||||||||||||||||||||||
| Wendy’s |
Atascadero |
CA |
— | (1) | 230 | 1,009 | — | 1,239 | 28 | 6/27/2013 | 2000 | |||||||||||||||||||||||||
| Wendy’s |
Camarillo |
CA |
— | (1) | 320 | 2,253 | — | 2,573 | 62 | 6/27/2013 | 1996 | |||||||||||||||||||||||||
| Wendy’s |
Paso Robles |
CA |
— | (1) | 150 | 1,603 | — | 1,753 | 44 | 6/27/2013 | 1999 | |||||||||||||||||||||||||
| Wendy’s |
Worcester |
MA |
— | (1) | 370 | 1,288 | — | 1,658 | 36 | 6/27/2013 | 1996 | |||||||||||||||||||||||||
| Wendy’s |
Salisbury |
MD |
— | (1) | 370 | 1,299 | — | 1,669 | 36 | 6/27/2013 | 1993 | |||||||||||||||||||||||||
| Wendy’s |
Swanton |
OH |
— | (1) | 430 | 1,233 | — | 1,663 | 34 | 6/27/2013 | 1999 | |||||||||||||||||||||||||
| Wendy’s |
Sylvania |
OH |
— | (1) | 300 | 799 | — | 1,099 | 22 | 6/27/2013 | 1999 | |||||||||||||||||||||||||
| Wendy’s |
Knoxville |
TN |
— | (1) | 330 | 1,161 | — | 1,491 | 32 | 6/27/2013 | 1998 | |||||||||||||||||||||||||
| Wendy’s |
Knoxville |
TN |
— | (1) | 330 | 1,132 | — | 1,462 | 31 | 6/27/2013 | 1996 | |||||||||||||||||||||||||
| Wendy’s |
Millington |
TN |
— | (1) | 380 | 1,208 | — | 1,588 | 33 | 6/27/2013 | 1976 | |||||||||||||||||||||||||
| Wendy’s |
Bluefield |
VA |
— | (1) | 450 | 1,927 | — | 2,377 | 53 | 6/27/2013 | 1992 | |||||||||||||||||||||||||
| Wendy’s |
Midlothian |
VA |
— | (1) | 230 | 1,300 | — | 1,530 | 36 | 6/27/2013 | 1991 | |||||||||||||||||||||||||
| Wendy’s |
Beaver |
WV |
— | (1) | 290 | 1,156 | — | 1,446 | 32 | 6/27/2013 | 1982 | |||||||||||||||||||||||||
| West Marine |
Deltaville |
VA |
— | (1) | 425 | 2,409 | — | 2,834 | 192 | 7/31/2012 | 2012 | |||||||||||||||||||||||||
| Williams Sonoma |
Olive Branch |
MS |
28,350 | 2,330 | 44,266 | — | 46,596 | 3,825 | 8/10/2012 | 2001 | ||||||||||||||||||||||||||
| Abuelo’s |
Rogers |
AR |
— | (14) | 825 | 2,296 | — | 3,121 | 66 | 6/27/2013 | 2003 | |||||||||||||||||||||||||
| Academy Sports |
Smyrna |
TN |
— | 2,109 | 8,434 | — | 10,543 | 68 | 11/1/2013 | 2012 | ||||||||||||||||||||||||||
| Academy Sports |
Mobile |
AL |
— | 1,311 | 7,431 | — | 8,742 | 60 | 11/1/2013 | 2012 | ||||||||||||||||||||||||||
| Advance Auto |
Opelika |
AL |
— | (14) | 289 | 1,156 | — | 1,445 | 43 | 4/24/2013 | 2013 | |||||||||||||||||||||||||
| Aliberto’s Mexican Food |
Holbrook |
AZ |
— | (14) | 32 | 96 | — | 128 | 3 | 6/27/2013 | 1981 | |||||||||||||||||||||||||
| Applebee’s |
Davenport |
FL |
— | (14) | 1,506 | 4,517 | — | 6,023 | 112 | 7/31/2013 | 2007 | |||||||||||||||||||||||||
| Applebee’s |
Bradenton |
FL |
— | (14) | 2,475 | 3,713 | — | 6,188 | 92 | 7/31/2013 | 1994 | |||||||||||||||||||||||||
| Applebee’s |
Rio Rancho |
NM |
— | (14) | 645 | 3,654 | — | 4,299 | 91 | 7/31/2013 | 1995 | |||||||||||||||||||||||||
| Applebee’s |
Brandon |
FL |
— | (14) | 2,453 | 3,647 | — | 6,100 | 105 | 6/27/2013 | 1997 | |||||||||||||||||||||||||
| Applebee’s |
Lakeland |
FL |
— | (14) | 1,959 | 3,638 | — | 5,597 | 90 | 7/31/2013 | 2000 | |||||||||||||||||||||||||
F-99
Table of Contents
| Initial Costs | ||||||||||||||||||||||||||||||||||||
| Property |
City |
State |
Encumbrances at December 31, 2013 |
Land | Buildings, Fixtures and Improvements |
Costs Capitalized Subsequent to Acquisition |
Gross Amount Carried at December 31, 2013 (10) (11) |
Accumulated Depreciation (12) (13) |
Date Acquired |
Date of Construction |
||||||||||||||||||||||||||
| Applebee’s |
Temple Terrace |
FL |
$ | — | (14) | $ | 2,396 | $ | 3,594 | $ | — | $ | 5,990 | $ | 89 | 7/31/2013 | 1993 | |||||||||||||||||||
| Applebee’s |
Largo |
FL |
— | (14) | 2,334 | 3,501 | — | 5,835 | 87 | 7/31/2013 | 1995 | |||||||||||||||||||||||||
| Applebee’s |
St. Petersburg |
FL |
— | (14) | 2,329 | 3,493 | — | 5,822 | 87 | 7/31/2013 | 1994 | |||||||||||||||||||||||||
| Applebee’s |
Riverview |
FL |
— | (14) | 1,849 | 3,434 | — | 5,283 | 85 | 7/31/2013 | 2006 | |||||||||||||||||||||||||
| Applebee’s |
Hobbs |
NM |
— | (14) | 600 | 3,401 | — | 4,001 | 84 | 7/31/2013 | 2002 | |||||||||||||||||||||||||
| Applebee’s |
Valrico |
FL |
— | (14) | 1,202 | 3,274 | — | 4,476 | 94 | 6/27/2013 | 1998 | |||||||||||||||||||||||||
| Applebee’s |
Wesley Chapel |
FL |
— | (14) | 3,272 | 3,272 | — | 6,544 | 81 | 7/31/2013 | 2000 | |||||||||||||||||||||||||
| Applebee’s |
New Port Richey |
FL |
— | (14) | 1,695 | 3,147 | — | 4,842 | 78 | 7/31/2013 | 1998 | |||||||||||||||||||||||||
| Applebee’s |
Inverness |
FL |
— | (14) | 1,977 | 2,965 | — | 4,942 | 74 | 7/31/2013 | 2000 | |||||||||||||||||||||||||
| Applebee’s |
Corpus Christi |
TX |
— | (14) | 563 | 2,926 | — | 3,489 | 84 | 6/27/2013 | 2000 | |||||||||||||||||||||||||
| Applebee’s |
Nampa |
ID |
— | (14) | 729 | 2,915 | — | 3,644 | 72 | 7/31/2013 | 2000 | |||||||||||||||||||||||||
| Applebee’s |
Pueblo |
CO |
— | (14) | 960 | 2,879 | — | 3,839 | 71 | 7/31/2013 | 1998 | |||||||||||||||||||||||||
| Applebee’s |
Plant City |
FL |
— | (14) | 2,079 | 2,869 | — | 4,948 | 82 | 6/27/2013 | 2001 | |||||||||||||||||||||||||
| Applebee’s |
Evans |
GA |
— | (14) | 1,426 | 2,649 | — | 4,075 | 66 | 7/31/2013 | 2004 | |||||||||||||||||||||||||
| Applebee’s |
Winter Haven |
FL |
— | (14) | 2,130 | 2,603 | — | 4,733 | 65 | 7/31/2013 | 1999 | |||||||||||||||||||||||||
| Applebee’s |
Gresham |
OR |
— | 853 | 2,560 | — | 3,413 | 49 | 8/30/2013 | 2004 | ||||||||||||||||||||||||||
| Applebee’s |
Garden City |
ID |
— | 628 | 2,512 | — | 3,140 | 48 | 8/30/2013 | 2003 | ||||||||||||||||||||||||||
| Applebee’s |
Savannah |
GA |
— | (14) | 1,329 | 2,468 | — | 3,797 | 61 | 7/31/2013 | 1994 | |||||||||||||||||||||||||
| Applebee’s |
Crystal River |
FL |
— | (14) | 1,328 | 2,467 | — | 3,795 | 61 | 7/31/2013 | 2001 | |||||||||||||||||||||||||
| Applebee’s |
Alamogordo |
NM |
— | 271 | 2,438 | — | 2,709 | 47 | 8/30/2013 | 2000 | ||||||||||||||||||||||||||
| Applebee’s |
Lakeland |
FL |
— | (14) | 1,283 | 2,383 | — | 3,666 | 59 | 7/31/2013 | 1997 | |||||||||||||||||||||||||
| Applebee’s |
Augusta |
GA |
— | (14) | 1,254 | 2,329 | — | 3,583 | 58 | 7/31/2013 | 1987 | |||||||||||||||||||||||||
| Applebee’s |
Roswell |
NM |
— | (14) | 405 | 2,295 | — | 2,700 | 57 | 7/31/2013 | 1998 | |||||||||||||||||||||||||
| Applebee’s |
Pueblo |
CO |
— | 752 | 2,257 | — | 3,009 | 43 | 8/30/2013 | 1998 | ||||||||||||||||||||||||||
| Applebee’s |
Greeley |
CO |
— | (14) | 559 | 2,235 | — | 2,794 | 55 | 7/31/2013 | 1995 | |||||||||||||||||||||||||
| Applebee’s |
Phenix City |
AL |
— | (14) | 1,488 | 2,232 | — | 3,720 | 55 | 7/31/2013 | 1999 | |||||||||||||||||||||||||
| Applebee’s |
Oxford |
AL |
— | 1,162 | 2,157 | — | 3,319 | 41 | 8/30/2013 | 1995 | ||||||||||||||||||||||||||
| Applebee’s |
Clackamas |
OR |
— | (14) | 901 | 2,103 | — | 3,004 | 52 | 7/31/2013 | 1997 | |||||||||||||||||||||||||
| Applebee’s |
Tualatin |
OR |
— | (14) | 1,116 | 2,072 | — | 3,188 | 51 | 7/31/2013 | 2002 | |||||||||||||||||||||||||
| Applebee’s |
Richland |
WA |
— | (14) | 1,112 | 2,064 | — | 3,176 | 51 | 7/31/2013 | 2003 | |||||||||||||||||||||||||
| Applebee’s |
Edinburg |
TX |
— | (14) | 898 | 2,058 | — | 2,956 | 59 | 6/27/2013 | 2006 | |||||||||||||||||||||||||
| Applebee’s |
Thornton |
CO |
— | 681 | 2,043 | — | 2,724 | 39 | 8/30/2013 | 1994 | ||||||||||||||||||||||||||
| Applebee’s |
Colorado Springs |
CO |
— | (14) | 499 | 1,996 | — | 2,495 | 49 | 7/31/2013 | 1995 | |||||||||||||||||||||||||
| Applebee’s |
McAllen |
TX |
— | (14) | 1,114 | 1,988 | — | 3,102 | 57 | 6/27/2013 | 1993 | |||||||||||||||||||||||||
| Applebee’s |
Brighton |
CO |
— | (14) | 657 | 1,972 | — | 2,629 | 49 | 7/31/2013 | 1998 | |||||||||||||||||||||||||
| Applebee’s |
Colorado Springs |
CO |
— | (14) | 629 | 1,888 | — | 2,517 | 47 | 7/31/2013 | 1994 | |||||||||||||||||||||||||
| Applebee’s |
Vancouver |
WA |
— | 791 | 1,846 | — | 2,637 | 35 | 8/30/2013 | 2001 | ||||||||||||||||||||||||||
| Applebee’s |
Pocatello |
ID |
— | (14) | 612 | 1,837 | — | 2,449 | 46 | 7/31/2013 | 1998 | |||||||||||||||||||||||||
| Applebee’s |
San Antonio |
TX |
— | (14) | 732 | 1,796 | — | 2,528 | 51 | 6/27/2013 | 2003 | |||||||||||||||||||||||||
| Applebee’s |
Milledgeville |
GA |
— | (14) | 1,174 | 1,761 | — | 2,935 | 44 | 7/31/2013 | 1999 | |||||||||||||||||||||||||
| Applebee’s |
Boise |
ID |
— | (14) | 948 | 1,761 | — | 2,709 | 44 | 7/31/2013 | 1998 | |||||||||||||||||||||||||
| Applebee’s |
Arvada |
CO |
— | (14) | 754 | 1,760 | — | 2,514 | 44 | 7/31/2013 | 1996 | |||||||||||||||||||||||||
| Applebee’s |
Crestview |
FL |
— | (14) | 943 | 1,752 | — | 2,695 | 43 | 7/31/2013 | 2000 | |||||||||||||||||||||||||
| Applebee’s |
Northglenn |
CO |
— | (14) | 578 | 1,734 | — | 2,312 | 43 | 7/31/2013 | 1993 | |||||||||||||||||||||||||
| Applebee’s |
Auburn |
AL |
— | (14) | 1,155 | 1,732 | — | 2,887 | 43 | 7/31/2013 | 1993 | |||||||||||||||||||||||||
| Applebee’s |
Ocean Springs |
MS |
— | (14) | 673 | 1,708 | — | 2,381 | 49 | 6/27/2013 | 2000 | |||||||||||||||||||||||||
| Applebee’s |
Vancouver |
WA |
— | (14) | 718 | 1,675 | — | 2,393 | 42 | 7/31/2013 | 2001 | |||||||||||||||||||||||||
| Applebee’s |
Roseburg |
OR |
— | 717 | 1,673 | — | 2,390 | 32 | 8/30/2013 | 2000 | ||||||||||||||||||||||||||
| Applebee’s |
Lake Oswego |
OR |
— | (14) | 1,352 | 1,652 | — | 3,004 | 41 | 7/31/2013 | 1993 | |||||||||||||||||||||||||
| Applebee’s |
Newton |
KS |
— | (14) | 504 | 1,569 | — | 2,073 | 45 | 6/27/2013 | 1998 | |||||||||||||||||||||||||
| Applebee’s |
Fall River |
MA |
— | 275 | 1,558 | — | 1,833 | 39 | 7/31/2013 | 1994 | ||||||||||||||||||||||||||
| Applebee’s |
New Braunfels |
TX |
— | (14) | 566 | 1,486 | — | 2,052 | 43 | 6/27/2013 | 1995 | |||||||||||||||||||||||||
| Applebee’s |
Dublin |
GA |
— | (14) | 1,171 | 1,431 | — | 2,602 | 35 | 7/31/2013 | 1998 | |||||||||||||||||||||||||
| Applebee’s |
North Canton |
OH |
— | 152 | 838 | — | 990 | 24 | 6/27/2013 | 1992 | ||||||||||||||||||||||||||
| Arby’s |
Atlanta |
GA |
— | (14) | 1,207 | 987 | — | 2,194 | 22 | 7/31/2013 | 1984 | |||||||||||||||||||||||||
| Arby’s |
Kennesaw |
GA |
— | (14) | 583 | 840 | — | 1,423 | 23 | 6/27/2013 | 1984 | |||||||||||||||||||||||||
| Arby’s |
Memphis |
TN |
— | (14) | 449 | 835 | — | 1,284 | 18 | 7/31/2013 | 1998 | |||||||||||||||||||||||||
F-100
Table of Contents
| Initial Costs | ||||||||||||||||||||||||||||||||||||
| Property |
City |
State |
Encumbrances at December 31, 2013 |
Land | Buildings, Fixtures and Improvements |
Costs Capitalized Subsequent to Acquisition |
Gross Amount Carried at December 31, 2013 (10) (11) |
Accumulated Depreciation (12) (13) |
Date Acquired |
Date of Construction |
||||||||||||||||||||||||||
| Arby’s |
Mount Vernon |
IL |
$ | — | (14) | $ | 911 | $ | 764 | $ | — | $ | 1,675 | $ | 21 | 6/27/2013 | 1999 | |||||||||||||||||||
| Arby’s |
Richmond Hill |
GA |
— | (14) | 430 | 755 | — | 1,185 | 21 | 6/27/2013 | 1984 | |||||||||||||||||||||||||
| Arby’s |
Grandville |
MI |
— | (14) | 1,133 | 755 | — | 1,888 | 17 | 7/31/2013 | 1982 | |||||||||||||||||||||||||
| Arby’s |
Prescott |
AZ |
— | 404 | 750 | — | 1,154 | 16 | 7/31/2013 | 1986 | ||||||||||||||||||||||||||
| Arby’s |
Schertz |
TX |
— | 499 | 748 | — | 1,247 | 16 | 7/31/2013 | 1996 | ||||||||||||||||||||||||||
| Arby’s |
Apopka |
FL |
— | (14) | 464 | 697 | — | 1,161 | 15 | 7/31/2013 | 1985 | |||||||||||||||||||||||||
| Arby’s |
Mobile |
AL |
— | 460 | 685 | — | 1,145 | 19 | 6/27/2013 | 1986 | ||||||||||||||||||||||||||
| Arby’s |
Wyoming |
MI |
— | (14) | 1,513 | 648 | — | 2,161 | 14 | 7/31/2013 | 1970 | |||||||||||||||||||||||||
| Arby’s |
Fort Wayne |
IN |
— | 529 | 647 | — | 1,176 | 14 | 7/31/2013 | 1987 | ||||||||||||||||||||||||||
| Arby’s |
Louisville |
KY |
— | 336 | 625 | — | 961 | 26 | 5/30/2013 | 1979 | ||||||||||||||||||||||||||
| Arby’s |
Phoenix |
AZ |
— | 559 | 618 | — | 1,177 | 17 | 6/27/2013 | 1995 | ||||||||||||||||||||||||||
| Arby’s |
Fountain Hills |
AZ |
— | 241 | 597 | — | 838 | 17 | 6/27/2013 | 1994 | ||||||||||||||||||||||||||
| Arby’s |
Orlando |
FL |
— | 251 | 585 | — | 836 | 13 | 7/31/2013 | 1985 | ||||||||||||||||||||||||||
| Arby’s |
Rockledge |
FL |
— | 381 | 571 | — | 952 | 13 | 7/31/2013 | 1984 | ||||||||||||||||||||||||||
| Arby’s |
Erie |
PA |
— | 188 | 552 | — | 740 | 15 | 6/27/2013 | 1966 | ||||||||||||||||||||||||||
| Arby’s |
Merritt Island |
FL |
— | 297 | 552 | — | 849 | 12 | 7/31/2013 | 1984 | ||||||||||||||||||||||||||
| Arby’s |
Hopkinsville |
KY |
— | (14) | 432 | 528 | — | 960 | 12 | 7/31/2013 | 1994 | |||||||||||||||||||||||||
| Arby’s |
Clovis |
NM |
— | 91 | 518 | — | 609 | 14 | 6/27/2013 | 1982 | ||||||||||||||||||||||||||
| Arby’s |
Winchester |
IN |
— | 341 | 511 | — | 852 | 11 | 7/31/2013 | 1988 | ||||||||||||||||||||||||||
| Arby’s |
Lexington |
NC |
— | 484 | 504 | — | 988 | 14 | 6/27/2013 | 1987 | ||||||||||||||||||||||||||
| Arby’s |
Guntersville |
AL |
— | 142 | 503 | — | 645 | 14 | 6/27/2013 | 1986 | ||||||||||||||||||||||||||
| Arby’s |
New Albany |
IN |
— | (14) | 456 | 470 | — | 926 | 13 | 6/27/2013 | 2005 | |||||||||||||||||||||||||
| Arby’s |
Chattanooga |
TN |
— | (14) | 201 | 469 | — | 670 | 10 | 7/31/2013 | 1998 | |||||||||||||||||||||||||
| Arby’s |
New Albany |
IN |
— | (14) | 325 | 465 | — | 790 | 13 | 6/27/2013 | 1995 | |||||||||||||||||||||||||
| Arby’s |
Scottsburg |
IN |
— | (14) | 526 | 445 | — | 971 | 12 | 6/27/2013 | 1989 | |||||||||||||||||||||||||
| Arby’s |
Corinth |
MS |
— | (14) | 753 | 429 | — | 1,182 | 12 | 6/27/2013 | 1984 | |||||||||||||||||||||||||
| Arby’s |
Alexander City |
AL |
— | (14) | 527 | 401 | — | 928 | 11 | 6/27/2013 | 1999 | |||||||||||||||||||||||||
| Arby’s |
Middlefield |
OH |
— | 379 | 388 | — | 767 | 11 | 6/27/2013 | 1988 | ||||||||||||||||||||||||||
| Arby’s |
Rochester |
NY |
— | 128 | 384 | — | 512 | 8 | 7/31/2013 | 1985 | ||||||||||||||||||||||||||
| Arby’s |
Savannah |
GA |
— | 293 | 293 | — | 586 | 6 | 7/31/2013 | 1985 | ||||||||||||||||||||||||||
| Arby’s |
Albuquerque |
NM |
— | 217 | 246 | — | 463 | 7 | 6/27/2013 | 1987 | ||||||||||||||||||||||||||
| Arby’s |
Alexandria |
LA |
— | 82 | 245 | — | 327 | 5 | 7/31/2013 | 1985 | ||||||||||||||||||||||||||
| Arby’s |
Las Vegas |
NM |
— | 236 | 236 | — | 472 | 5 | 7/31/2013 | 1985 | ||||||||||||||||||||||||||
| Arby’s |
Toccoa |
GA |
— | 185 | 227 | — | 412 | 5 | 7/31/2013 | 1998 | ||||||||||||||||||||||||||
| Arby’s |
Bullhead City |
AZ |
— | 550 | — | — | 550 | — | 6/27/2013 | 1999 | ||||||||||||||||||||||||||
| Arby’s |
Omaha |
NE |
— | 359 | — | — | 359 | — | 7/31/2013 | 1984 | ||||||||||||||||||||||||||
| Auto Pawn |
Columbus |
GA |
— | 170 | — | — | 170 | — | 6/27/2013 | 1987 | ||||||||||||||||||||||||||
| Bandana’s Bar-B-Q Restaurant |
Fenton |
MO |
— | 470 | 314 | — | 784 | 6 | 8/30/2013 | 1986 | ||||||||||||||||||||||||||
| Billboard |
Memphis |
TN |
— | 33 | — | — | 33 | — | 7/31/2013 | N/A | ||||||||||||||||||||||||||
| Billboard |
Memphis |
TN |
— | 63 | — | — | 63 | — | 7/31/2013 | N/A | ||||||||||||||||||||||||||
| Billboard |
Memphis |
TN |
— | 73 | — | — | 73 | — | 7/31/2013 | N/A | ||||||||||||||||||||||||||
| Billboard |
Memphis |
TN |
— | 90 | — | — | 90 | — | 7/31/2013 | N/A | ||||||||||||||||||||||||||
| Billboard |
Memphis |
TN |
— | 69 | — | — | 69 | — | 7/31/2013 | N/A | ||||||||||||||||||||||||||
| Black Meg 43 |
Copperas Cove |
TX |
— | (14) | 151 | 151 | — | 302 | 4 | 6/27/2013 | 1969 | |||||||||||||||||||||||||
| Bojangles |
Statesville |
NC |
— | (14) | 646 | 1,937 | — | 2,583 | 43 | 7/31/2013 | 1988 | |||||||||||||||||||||||||
| Bojangles |
Denver |
NC |
— | (14) | 1,013 | 1,881 | — | 2,894 | 41 | 7/31/2013 | 1997 | |||||||||||||||||||||||||
| Bojangles |
Hickory |
NC |
— | (14) | 749 | 1,789 | — | 2,538 | 50 | 6/27/2013 | 1973 | |||||||||||||||||||||||||
| Bojangles |
Fountain Inn |
SC |
— | 287 | 1,150 | — | 1,437 | 20 | 10/10/2013 | 2012 | ||||||||||||||||||||||||||
| Bojangles |
Taylorsville |
NC |
— | (14) | 436 | 1,108 | — | 1,544 | 31 | 6/27/2013 | 1987 | |||||||||||||||||||||||||
| Bojangles |
Troutman |
NC |
— | 718 | 1,077 | — | 1,795 | 19 | 10/10/2013 | 2012 | ||||||||||||||||||||||||||
| Bridgestone Firestone |
Kansas City |
MO |
— | (14) | 651 | 1,954 | — | 2,605 | 66 | 5/31/2013 | 2008 | |||||||||||||||||||||||||
| Bruegger’s Bagels |
Durham |
NC |
— | (14) | 312 | 728 | — | 1,040 | 16 | 7/31/2013 | 1926 | |||||||||||||||||||||||||
| Bucho’s Mexican Food |
Bolingbrook |
IL |
— | (14) | 470 | 137 | — | 607 | 4 | 6/27/2013 | 1992 | |||||||||||||||||||||||||
| Buffalo Wild Wings |
Langhorne |
PA |
— | (14) | 815 | 815 | — | 1,630 | 20 | 7/31/2013 | 1999 | |||||||||||||||||||||||||
| Burger King |
Augusta |
GA |
— | (14) | 693 | 2,080 | — | 2,773 | 46 | 7/31/2013 | 1986 | |||||||||||||||||||||||||
| Burger King |
Spanaway |
WA |
— | 509 | 1,628 | — | 2,137 | 45 | 6/27/2013 | 1997 | ||||||||||||||||||||||||||
F-101
Table of Contents
| Initial Costs | ||||||||||||||||||||||||||||||||||||
| Property |
City |
State |
Encumbrances at December 31, 2013 |
Land | Buildings, Fixtures and Improvements |
Costs Capitalized Subsequent to Acquisition |
Gross Amount Carried at December 31, 2013 (10) (11) |
Accumulated Depreciation (12) (13) |
Date Acquired |
Date of Construction |
||||||||||||||||||||||||||
| Burger King |
Cleveland |
MS |
$ | — | (14) | $ | 688 | $ | 1,606 | $ | — | $ | 2,294 | $ | 35 | 7/31/2013 | 1985 | |||||||||||||||||||
| Burger King |
Brandon |
MS |
— | (14) | 649 | 1,513 | — | 2,162 | 42 | 6/27/2013 | 1981 | |||||||||||||||||||||||||
| Burger King |
North Augusta |
SC |
— | (14) | 256 | 1,451 | — | 1,707 | 32 | 7/31/2013 | 1985 | |||||||||||||||||||||||||
| Burger King |
Troy |
AL |
— | (14) | 461 | 1,383 | — | 1,844 | 30 | 7/31/2013 | 1984 | |||||||||||||||||||||||||
| Burger King |
Charlotte |
NC |
— | 1,105 | 1,372 | — | 2,477 | 38 | 6/27/2013 | 1997 | ||||||||||||||||||||||||||
| Burger King |
Martinez |
GA |
— | (14) | 909 | 1,350 | — | 2,259 | 37 | 6/27/2013 | 1998 | |||||||||||||||||||||||||
| Burger King |
Greenville |
MS |
— | (14) | 573 | 1,337 | — | 1,910 | 29 | 7/31/2013 | 2004 | |||||||||||||||||||||||||
| Burger King |
Germantown |
WI |
— | (14) | 644 | 1,300 | — | 1,944 | 36 | 6/27/2013 | 1986 | |||||||||||||||||||||||||
| Burger King |
Denver |
CO |
— | (14) | 872 | 1,242 | — | 2,114 | 34 | 6/27/2013 | 1994 | |||||||||||||||||||||||||
| Burger King |
Alpharetta |
GA |
— | (14) | 501 | 1,219 | — | 1,720 | 34 | 6/27/2013 | 2001 | |||||||||||||||||||||||||
| Burger King |
Amesbury |
MA |
— | (14) | 835 | 1,217 | — | 2,052 | 34 | 6/27/2013 | 1977 | |||||||||||||||||||||||||
| Burger King |
Dothan |
AL |
— | (14) | 628 | 1,167 | — | 1,795 | 26 | 7/31/2013 | 1983 | |||||||||||||||||||||||||
| Burger King |
Roswell |
GA |
— | (14) | 495 | 1,156 | — | 1,651 | 25 | 7/31/2013 | 1998 | |||||||||||||||||||||||||
| Burger King |
Wahoo |
NE |
— | (14) | 196 | 1,109 | — | 1,305 | 24 | 7/31/2013 | 1990 | |||||||||||||||||||||||||
| Burger King |
Dothan |
AL |
— | (14) | 594 | 1,104 | — | 1,698 | 24 | 7/31/2013 | 1999 | |||||||||||||||||||||||||
| Burger King |
Cut Off |
LA |
— | 726 | 1,088 | — | 1,814 | 24 | 7/31/2013 | 1990 | ||||||||||||||||||||||||||
| Burger King |
Defuniak Springs |
FL |
— | (14) | 362 | 1,087 | — | 1,449 | 24 | 7/31/2013 | 1989 | |||||||||||||||||||||||||
| Burger King |
Blair |
NE |
— | (14) | 272 | 1,087 | — | 1,359 | 24 | 7/31/2013 | 1987 | |||||||||||||||||||||||||
| Burger King |
Maywood |
IL |
— | (14) | 860 | 1,051 | — | 1,911 | 23 | 7/31/2013 | 2003 | |||||||||||||||||||||||||
| Burger King |
North Augusta |
SC |
— | (14) | 450 | 1,050 | — | 1,500 | 23 | 7/31/2013 | 1985 | |||||||||||||||||||||||||
| Burger King |
Bainbridge |
GA |
— | (14) | 347 | 1,042 | — | 1,389 | 23 | 7/31/2013 | 1998 | |||||||||||||||||||||||||
| Burger King |
Sierra Vista |
AZ |
— | 260 | 1,041 | — | 1,301 | 23 | 7/31/2013 | 1994 | ||||||||||||||||||||||||||
| Burger King |
Greenwood |
MS |
— | (14) | 692 | 1,038 | — | 1,730 | 23 | 7/31/2013 | 1988 | |||||||||||||||||||||||||
| Burger King |
Kansas CIty |
MO |
— | 444 | 1,036 | — | 1,480 | 23 | 7/31/2013 | 1984 | ||||||||||||||||||||||||||
| Burger King |
Laredo |
TX |
— | (14) | 684 | 1,026 | — | 1,710 | 23 | 7/31/2013 | 2002 | |||||||||||||||||||||||||
| Burger King |
Andalusia |
AL |
— | (14) | 181 | 1,025 | — | 1,206 | 23 | 7/31/2013 | 2000 | |||||||||||||||||||||||||
| Burger King |
Kingsford |
MI |
— | (14) | 53 | 1,015 | — | 1,068 | 22 | 7/31/2013 | 1983 | |||||||||||||||||||||||||
| Burger King |
Red Oak |
IA |
— | (14) | 334 | 1,002 | — | 1,336 | 22 | 7/31/2013 | 1988 | |||||||||||||||||||||||||
| Burger King |
Austin |
TX |
— | (14) | 666 | 999 | — | 1,665 | 28 | 6/27/2013 | 1998 | |||||||||||||||||||||||||
| Burger King |
Cairo |
GA |
— | (14) | 245 | 981 | — | 1,226 | 22 | 7/31/2013 | 1997 | |||||||||||||||||||||||||
| Burger King |
Alpharetta |
GA |
— | (14) | 1,128 | 977 | — | 2,105 | 27 | 6/27/2013 | 1993 | |||||||||||||||||||||||||
| Burger King |
Springfield |
FL |
— | (14) | 324 | 971 | — | 1,295 | 21 | 7/31/2013 | 1999 | |||||||||||||||||||||||||
| Burger King |
Opelousas |
LA |
— | 964 | 964 | — | 1,928 | 21 | 7/31/2013 | 1998 | ||||||||||||||||||||||||||
| Burger King |
Panama City |
FL |
— | (14) | 319 | 956 | — | 1,275 | 21 | 7/31/2013 | 1998 | |||||||||||||||||||||||||
| Burger King |
Chattanooga |
TN |
— | (14) | 637 | 955 | — | 1,592 | 21 | 7/31/2013 | 1985 | |||||||||||||||||||||||||
| Burger King |
Dover |
NH |
— | (14) | 1,159 | 952 | — | 2,111 | 26 | 6/27/2013 | 1970 | |||||||||||||||||||||||||
| Burger King |
Des Moines |
IA |
— | (14) | 1,160 | 949 | — | 2,109 | 21 | 7/31/2013 | 1987 | |||||||||||||||||||||||||
| Burger King |
Alpharetta |
GA |
— | (14) | 795 | 943 | — | 1,738 | 26 | 6/27/2013 | 1997 | |||||||||||||||||||||||||
| Burger King |
Philadelphia |
MS |
— | (14) | 402 | 939 | — | 1,341 | 21 | 7/31/2013 | 1993 | |||||||||||||||||||||||||
| Burger King |
Brewton |
AL |
— | (14) | 307 | 920 | — | 1,227 | 20 | 7/31/2013 | 1993 | |||||||||||||||||||||||||
| Burger King |
Stuart |
IA |
— | (14) | 607 | 911 | — | 1,518 | 20 | 7/31/2013 | 1997 | |||||||||||||||||||||||||
| Burger King |
Yazoo City |
MS |
— | (14) | 489 | 909 | — | 1,398 | 20 | 7/31/2013 | 1993 | |||||||||||||||||||||||||
| Burger King |
Marshfield |
WI |
— | (14) | 232 | 885 | — | 1,117 | 25 | 6/27/2013 | 1986 | |||||||||||||||||||||||||
| Burger King |
Thomson |
GA |
— | (14) | 748 | 876 | — | 1,624 | 24 | 6/27/2013 | 1988 | |||||||||||||||||||||||||
| Burger King |
Wilmington |
NC |
— | (14) | 573 | 870 | — | 1,443 | 24 | 6/27/2013 | 1999 | |||||||||||||||||||||||||
| Burger King |
Alpharetta |
GA |
— | (14) | 635 | 865 | — | 1,500 | 24 | 6/27/2013 | 1998 | |||||||||||||||||||||||||
| Burger King |
Clarksdale |
MS |
— | (14) | 865 | 865 | — | 1,730 | 19 | 7/31/2013 | 1988 | |||||||||||||||||||||||||
| Burger King |
Opp |
AL |
— | (14) | 214 | 857 | — | 1,071 | 19 | 7/31/2013 | 1994 | |||||||||||||||||||||||||
| Burger King |
Cincinnati |
OH |
— | 353 | 824 | — | 1,177 | 18 | 7/31/2013 | 1974 | ||||||||||||||||||||||||||
| Burger King |
Greenville |
MS |
— | (14) | 351 | 820 | — | 1,171 | 18 | 7/31/2013 | 1993 | |||||||||||||||||||||||||
| Burger King |
Grand Rapids |
MI |
— | (14) | 346 | 807 | — | 1,153 | 18 | 7/31/2013 | 1985 | |||||||||||||||||||||||||
| Burger King |
Grenada |
MS |
— | (14) | 536 | 805 | — | 1,341 | 18 | 7/31/2013 | 1989 | |||||||||||||||||||||||||
| Burger King |
Clinton |
NC |
— | (14) | 494 | 801 | — | 1,295 | 22 | 6/27/2013 | 1999 | |||||||||||||||||||||||||
| Burger King |
Chadbourn |
NC |
— | (14) | 353 | 797 | — | 1,150 | 22 | 6/27/2013 | 1999 | |||||||||||||||||||||||||
| Burger King |
Texas City |
TX |
— | (14) | 421 | 782 | — | 1,203 | 17 | 7/31/2013 | 1984 | |||||||||||||||||||||||||
| Burger King |
New Philadelphia |
OH |
— | 419 | 779 | — | 1,198 | 17 | 7/31/2013 | 1986 | ||||||||||||||||||||||||||
| Burger King |
Mansfield |
OH |
— | 191 | 766 | — | 957 | 17 | 7/31/2013 | 1985 | ||||||||||||||||||||||||||
F-102
Table of Contents
| Initial Costs | ||||||||||||||||||||||||||||||||||||
| Property |
City |
State |
Encumbrances at December 31, 2013 |
Land | Buildings, Fixtures and Improvements |
Costs Capitalized Subsequent to Acquisition |
Gross Amount Carried at December 31, 2013 (10) (11) |
Accumulated Depreciation (12) (13) |
Date Acquired |
Date of Construction |
||||||||||||||||||||||||||
| Burger King |
Lake Charles |
LA |
$ | — | $ | 610 | $ | 746 | $ | — | $ | 1,356 | $ | 16 | 7/31/2013 | 1990 | ||||||||||||||||||||
| Burger King |
Warren |
MI |
— | 248 | 745 | — | 993 | 16 | 7/31/2013 | 1987 | ||||||||||||||||||||||||||
| Burger King |
Atmore |
AL |
— | (14) | 181 | 723 | — | 904 | 16 | 7/31/2013 | 2000 | |||||||||||||||||||||||||
| Burger King |
Tallahassee |
FL |
— | (14) | 720 | 720 | — | 1,440 | 16 | 7/31/2013 | 1998 | |||||||||||||||||||||||||
| Burger King |
Weston |
WI |
— | (14) | 329 | 718 | — | 1,047 | 20 | 6/27/2013 | 1987 | |||||||||||||||||||||||||
| Burger King |
Walker |
MI |
— | (14) | 305 | 711 | — | 1,016 | 16 | 7/31/2013 | 1975 | |||||||||||||||||||||||||
| Burger King |
Evergreen |
AL |
— | (14) | 172 | 689 | — | 861 | 15 | 7/31/2013 | 1997 | |||||||||||||||||||||||||
| Burger King |
Chicago Ridge |
IL |
— | (14) | 431 | 684 | — | 1,115 | 19 | 6/27/2013 | 1998 | |||||||||||||||||||||||||
| Burger King |
Perry |
IA |
— | (14) | 557 | 680 | — | 1,237 | 15 | 7/31/2013 | 1997 | |||||||||||||||||||||||||
| Burger King |
Springfield |
IL |
— | (14) | 354 | 677 | — | 1,031 | 19 | 6/27/2013 | 1995 | |||||||||||||||||||||||||
| Burger King |
Hudsonville |
MI |
— | (14) | 451 | 676 | — | 1,127 | 15 | 7/31/2013 | 1988 | |||||||||||||||||||||||||
| Burger King |
Natchez |
MS |
— | 225 | 674 | — | 899 | 15 | 7/31/2013 | 1973 | ||||||||||||||||||||||||||
| Burger King |
Irondequoit |
NY |
— | 988 | 659 | — | 1,647 | 14 | 7/31/2013 | 1980 | ||||||||||||||||||||||||||
| Burger King |
Enterprise |
AL |
— | (14) | 437 | 655 | — | 1,092 | 14 | 7/31/2013 | 1985 | |||||||||||||||||||||||||
| Burger King |
Nashua |
NH |
— | (14) | 655 | 655 | — | 1,310 | 14 | 7/31/2013 | 2008 | |||||||||||||||||||||||||
| Burger King |
Claremont |
NC |
— | (14) | 646 | 646 | — | 1,292 | 18 | 6/27/2013 | 2000 | |||||||||||||||||||||||||
| Burger King |
Pontiac |
IL |
— | 151 | 616 | — | 767 | 17 | 6/27/2013 | 1991 | ||||||||||||||||||||||||||
| Burger King |
L’Anse |
MI |
— | (14) | 32 | 616 | — | 648 | 14 | 7/31/2013 | 1999 | |||||||||||||||||||||||||
| Burger King |
Hastings |
MN |
— | (14) | 328 | 608 | — | 936 | 13 | 7/31/2013 | 1990 | |||||||||||||||||||||||||
| Burger King |
Gary |
IN |
— | (14) | 544 | 606 | — | 1,150 | 17 | 6/27/2013 | 1987 | |||||||||||||||||||||||||
| Burger King |
Syracuse |
NY |
— | 606 | 606 | — | 1,212 | 13 | 7/31/2013 | 1986 | ||||||||||||||||||||||||||
| Burger King |
Rhinelander |
WI |
— | (14) | 260 | 606 | — | 866 | 13 | 7/31/2013 | 1986 | |||||||||||||||||||||||||
| Burger King |
Monroeville |
AL |
— | (14) | 325 | 604 | — | 929 | 13 | 7/31/2013 | 1997 | |||||||||||||||||||||||||
| Burger King |
Menominee |
MI |
— | (14) | 494 | 604 | — | 1,098 | 13 | 7/31/2013 | 1986 | |||||||||||||||||||||||||
| Burger King |
Asheville |
NC |
— | 728 | 595 | — | 1,323 | 13 | 7/31/2013 | 1982 | ||||||||||||||||||||||||||
| Burger King |
Clearwater |
FL |
— | (14) | 981 | 591 | — | 1,572 | 16 | 6/27/2013 | 1980 | |||||||||||||||||||||||||
| Burger King |
Shenandoah |
IA |
— | (14) | 313 | 582 | — | 895 | 13 | 7/31/2013 | 1988 | |||||||||||||||||||||||||
| Burger King |
Raceland |
LA |
— | 356 | 533 | — | 889 | 12 | 7/31/2013 | 1991 | ||||||||||||||||||||||||||
| Burger King |
Springfield |
MA |
— | 983 | 516 | — | 1,499 | 14 | 6/27/2013 | 1974 | ||||||||||||||||||||||||||
| Burger King |
Spring Lake |
MI |
— | 341 | 512 | — | 853 | 11 | 7/31/2013 | 1995 | ||||||||||||||||||||||||||
| Burger King |
Harvey |
IL |
— | 403 | 507 | — | 910 | 14 | 6/27/2013 | 1997 | ||||||||||||||||||||||||||
| Burger King |
Anchorage |
AK |
— | 427 | 489 | — | 916 | 14 | 6/27/2013 | 1982 | ||||||||||||||||||||||||||
| Burger King |
Dayton |
OH |
— | (14) | 569 | 466 | — | 1,035 | 10 | 7/31/2013 | 1990 | |||||||||||||||||||||||||
| Burger King |
Gonzales |
LA |
— | 380 | 465 | — | 845 | 10 | 7/31/2013 | 1990 | ||||||||||||||||||||||||||
| Burger King |
Gallatin |
TN |
— | (14) | 199 | 463 | — | 662 | 10 | 7/31/2013 | 1984 | |||||||||||||||||||||||||
| Burger King |
Lake Charles |
LA |
— | 456 | 456 | — | 912 | 10 | 7/31/2013 | 1985 | ||||||||||||||||||||||||||
| Burger King |
Tallahassee |
FL |
— | (14) | 843 | 454 | — | 1,297 | 10 | 7/31/2013 | 1980 | |||||||||||||||||||||||||
| Burger King |
Palatine |
IL |
— | 352 | 426 | — | 778 | 12 | 6/27/2013 | 1995 | ||||||||||||||||||||||||||
| Burger King |
Largo |
FL |
— | 683 | 412 | — | 1,095 | 11 | 6/27/2013 | 1984 | ||||||||||||||||||||||||||
| Burger King |
Harrisburg |
PA |
— | (14) | 619 | 412 | — | 1,031 | 9 | 7/31/2013 | 1985 | |||||||||||||||||||||||||
| Burger King |
Belding |
MI |
— | 221 | 411 | — | 632 | 9 | 7/31/2013 | 1994 | ||||||||||||||||||||||||||
| Burger King |
Niceville |
FL |
— | (14) | 598 | 399 | — | 997 | 9 | 7/31/2013 | 1994 | |||||||||||||||||||||||||
| Burger King |
Metairie |
LA |
— | 728 | 392 | — | 1,120 | 9 | 7/31/2013 | 1992 | ||||||||||||||||||||||||||
| Burger King |
Hamburg |
NY |
— | (14) | 403 | 383 | — | 786 | 11 | 6/27/2013 | 1974 | |||||||||||||||||||||||||
| Burger King |
Valdosta |
GA |
— | (14) | 564 | 376 | — | 940 | 8 | 7/31/2013 | 1987 | |||||||||||||||||||||||||
| Burger King |
Cedar Lake |
IN |
— | 327 | 374 | — | 701 | 10 | 6/27/2013 | 1986 | ||||||||||||||||||||||||||
| Burger King |
Jenison |
MI |
— | 233 | 349 | — | 582 | 8 | 7/31/2013 | 1994 | ||||||||||||||||||||||||||
| Burger King |
Detroit |
MI |
— | (14) | 614 | 331 | — | 945 | 7 | 7/31/2013 | 1988 | |||||||||||||||||||||||||
| Burger King |
Apex |
NC |
— | 366 | 324 | — | 690 | 9 | 6/27/2013 | 1992 | ||||||||||||||||||||||||||
| Burger King |
East Greenbush |
NY |
— | 404 | 269 | — | 673 | 7 | 6/27/2013 | 1980 | ||||||||||||||||||||||||||
| Burger King |
Dunn |
NC |
— | 328 | 268 | — | 596 | 6 | 7/31/2013 | 1989 | ||||||||||||||||||||||||||
| Burnie Bistro’s |
Clearwater |
FL |
— | (14) | 25 | 14 | — | 39 | — | 7/31/2013 | 1987 | |||||||||||||||||||||||||
| Captain D’s |
Florence |
KY |
— | (14) | 248 | 325 | — | 573 | 9 | 6/27/2013 | 1981 | |||||||||||||||||||||||||
| Captain D’s |
Duncanville |
TX |
— | 295 | 246 | — | 541 | 7 | 6/27/2013 | 1982 | ||||||||||||||||||||||||||
| Carl’s Jr. |
Purcell |
OK |
— | (14) | 77 | 513 | — | 590 | 14 | 6/27/2013 | 1980 | |||||||||||||||||||||||||
| Casa Del Rio |
Wadsworth |
OH |
— | 130 | 389 | — | 519 | 10 | 7/31/2013 | 1971 | ||||||||||||||||||||||||||
| Cashland |
Celina |
OH |
— | 108 | 132 | — | 240 | 3 | 7/31/2013 | 1995 | ||||||||||||||||||||||||||
F-103
Table of Contents
| Initial Costs | ||||||||||||||||||||||||||||||||||||
| Property |
City |
State |
Encumbrances at December 31, 2013 |
Land | Buildings, Fixtures and Improvements |
Costs Capitalized Subsequent to Acquisition |
Gross Amount Carried at December 31, 2013 (10) (11) |
Accumulated Depreciation (12) (13) |
Date Acquired |
Date of Construction |
||||||||||||||||||||||||||
| Castle Dental |
Murfreesboro |
TN |
$ | — | (14) | $ | 256 | $ | 256 | $ | — | $ | 512 | $ | 6 | 7/31/2013 | 1996 | |||||||||||||||||||
| Chappala Mexican Restaurant |
Nampa |
ID |
— | 473 | 692 | — | 1,165 | 20 | 6/27/2013 | 1998 | ||||||||||||||||||||||||||
| Checkers |
Jacksonville |
FL |
— | (14) | 731 | 1,096 | — | 1,827 | 24 | 7/31/2013 | 1993 | |||||||||||||||||||||||||
| Checkers |
Tampa |
FL |
— | 736 | — | — | 736 | — | 6/27/2013 | N/A | ||||||||||||||||||||||||||
| Checkers |
Miami |
FL |
— | 621 | — | — | 621 | — | 7/31/2013 | 1993 | ||||||||||||||||||||||||||
| Checkers |
Orlando |
FL |
— | 1,033 | — | — | 1,033 | — | 7/31/2013 | N/A | ||||||||||||||||||||||||||
| Checkers |
Winter Springs |
FL |
— | 734 | — | — | 734 | — | 7/31/2013 | N/A | ||||||||||||||||||||||||||
| Cheddar’s Casual Cafe’ |
Brandon |
FL |
— | (14) | 860 | 3,071 | — | 3,931 | 88 | 6/27/2013 | 2003 | |||||||||||||||||||||||||
| Cheddar’s Casual Cafe’ |
Lubbock |
TX |
— | (14) | 1,053 | 2,345 | — | 3,398 | 67 | 6/27/2013 | 1997 | |||||||||||||||||||||||||
| Cheddar’s Casual Cafe’ |
Bolingbrook |
IL |
— | (14) | 1,344 | 1,760 | — | 3,104 | 50 | 6/27/2013 | 1997 | |||||||||||||||||||||||||
| Chevys Fresh Mex |
Miami |
FL |
— | (14) | 1,455 | 783 | — | 2,238 | 19 | 7/31/2013 | 1995 | |||||||||||||||||||||||||
| Chicago Steak & Lemonade |
Louisville |
KY |
— | 195 | 18 | — | 213 | 1 | 6/27/2013 | 1980 | ||||||||||||||||||||||||||
| Chicago Style Gyros |
Nashville |
TN |
— | 201 | 134 | — | 335 | 3 | 7/31/2013 | 1986 | ||||||||||||||||||||||||||
| Chili’s |
East Peoria |
IL |
— | (14) | 1,023 | 2,347 | — | 3,370 | 67 | 6/27/2013 | 2003 | |||||||||||||||||||||||||
| Chili’s |
Amarillo |
TX |
— | 811 | 1,893 | — | 2,704 | 47 | 7/31/2013 | 1984 | ||||||||||||||||||||||||||
| China Buffet |
Alvin |
TX |
— | (14) | 110 | 299 | — | 409 | 9 | 6/27/2013 | 1982 | |||||||||||||||||||||||||
| China Buffet |
Angleton |
TX |
— | (14) | 127 | 272 | — | 399 | 8 | 6/27/2013 | 1982 | |||||||||||||||||||||||||
| China King |
Belen |
NM |
— | (14) | 94 | 94 | — | 188 | 3 | 6/27/2013 | 1980 | |||||||||||||||||||||||||
| China One |
Bay City |
TX |
— | (14) | 229 | 124 | — | 353 | 3 | 7/31/2013 | 1985 | |||||||||||||||||||||||||
| Church’s Chicken |
Bay Minette |
AL |
— | (14) | 134 | 757 | — | 891 | 17 | 7/31/2013 | 2003 | |||||||||||||||||||||||||
| Church’s Chicken |
Jackson |
AL |
— | (14) | 127 | 719 | — | 846 | 16 | 7/31/2013 | 1982 | |||||||||||||||||||||||||
| Church’s Chicken |
Augusta |
GA |
— | (14) | 256 | 597 | — | 853 | 13 | 7/31/2013 | 1976 | |||||||||||||||||||||||||
| Church’s Chicken |
Atmore |
AL |
— | (14) | 144 | 574 | — | 718 | 13 | 7/31/2013 | 1976 | |||||||||||||||||||||||||
| Church’s Chicken |
Augusta |
GA |
— | (14) | 178 | 533 | — | 711 | 12 | 7/31/2013 | 1981 | |||||||||||||||||||||||||
| Church’s Chicken |
Spartanburg |
SC |
— | (14) | 350 | 525 | — | 875 | 12 | 7/31/2013 | 1972 | |||||||||||||||||||||||||
| Church’s Chicken |
Flomaton |
AL |
— | (14) | 173 | 518 | — | 691 | 11 | 7/31/2013 | 1981 | |||||||||||||||||||||||||
| Church’s Chicken |
Greenville |
SC |
— | (14) | 325 | 487 | — | 812 | 11 | 7/31/2013 | 1984 | |||||||||||||||||||||||||
| Church’s Chicken |
Greenville |
SC |
— | (14) | 254 | 472 | — | 726 | 10 | 7/31/2013 | 2009 | |||||||||||||||||||||||||
| Church’s Chicken |
Augusta |
GA |
— | (14) | 196 | 458 | — | 654 | 10 | 7/31/2013 | 1984 | |||||||||||||||||||||||||
| Church’s Chicken |
Columbia |
SC |
— | (14) | 437 | 437 | — | 874 | 10 | 7/31/2013 | 1978 | |||||||||||||||||||||||||
| Church’s Chicken |
Columbia |
SC |
— | (14) | 231 | 428 | — | 659 | 9 | 7/31/2013 | 1977 | |||||||||||||||||||||||||
| Church’s Chicken |
Augusta |
GA |
— | (14) | 178 | 414 | — | 592 | 9 | 7/31/2013 | 1978 | |||||||||||||||||||||||||
| Church’s Chicken |
North Charleston |
SC |
— | (14) | 407 | 407 | — | 814 | 9 | 7/31/2013 | 1977 | |||||||||||||||||||||||||
| Church’s Chicken |
Orlando |
FL |
— | (14) | 254 | 380 | — | 634 | 8 | 7/31/2013 | 1984 | |||||||||||||||||||||||||
| Church’s Chicken |
Greenwood |
SC |
— | (14) | 188 | 349 | — | 537 | 8 | 7/31/2013 | 2002 | |||||||||||||||||||||||||
| Church’s Chicken |
Charleston |
SC |
— | (14) | 421 | 344 | — | 765 | 8 | 7/31/2013 | 1973 | |||||||||||||||||||||||||
| Church’s Chicken |
Greenville |
SC |
— | (14) | 280 | 342 | — | 622 | 8 | 7/31/2013 | 1970 | |||||||||||||||||||||||||
| Church’s Chicken |
North Charleston |
SC |
— | (14) | 302 | 302 | — | 604 | 7 | 7/31/2013 | 1976 | |||||||||||||||||||||||||
| Church’s Chicken |
Anderson |
SC |
— | (14) | 647 | 277 | — | 924 | 6 | 7/31/2013 | 1981 | |||||||||||||||||||||||||
| Church’s Chicken |
Spartanburg |
SC |
— | (14) | 411 | 274 | — | 685 | 6 | 7/31/2013 | 1978 | |||||||||||||||||||||||||
| Church’s Chicken |
Orangeburg |
SC |
— | (14) | 407 | 271 | — | 678 | 6 | 7/31/2013 | 1985 | |||||||||||||||||||||||||
| Church’s Chicken |
Nashville |
TN |
— | (14) | 186 | 186 | — | 372 | 4 | 7/31/2013 | 1980 | |||||||||||||||||||||||||
| Church’s Chicken |
Charleston |
SC |
— | (14) | 500 | 167 | — | 667 | 4 | 7/31/2013 | 1979 | |||||||||||||||||||||||||
| Church’s Chicken |
Bowling Green |
KY |
— | (14) | 100 | 156 | — | 256 | 4 | 6/27/2013 | 1984 | |||||||||||||||||||||||||
| Citizens Bank |
Milton |
MA |
— | (14) | 619 | 2,476 | — | 3,095 | 144 | 12/14/2012 | 1968 | |||||||||||||||||||||||||
| Citizens Bank |
Pittsburgh |
PA |
— | (14) | 268 | 2,413 | — | 2,681 | 140 | 12/14/2012 | 1970 | |||||||||||||||||||||||||
| Citizens Bank |
Orland Hills |
IL |
— | (14) | 1,253 | 2,327 | — | 3,580 | 135 | 12/14/2012 | 1988 | |||||||||||||||||||||||||
| Citizens Bank |
Pittsburgh |
PA |
— | (14) | 206 | 1,852 | — | 2,058 | 107 | 12/14/2012 | 1923 | |||||||||||||||||||||||||
| Citizens Bank |
Chicago Heights |
IL |
— | (14) | 182 | 1,637 | — | 1,819 | 80 | 1/24/2013 | 1996 | |||||||||||||||||||||||||
| Citizens Bank |
Reading |
PA |
— | (14) | 269 | 1,524 | — | 1,793 | 61 | 4/12/2013 | 1919 | |||||||||||||||||||||||||
| Citizens Bank |
Carnegie |
PA |
— | (14) | 73 | 1,396 | — | 1,469 | 81 | 12/14/2012 | 1920 | |||||||||||||||||||||||||
| Citizens Bank |
Cranston |
RI |
— | (14) | 411 | 1,234 | — | 1,645 | 72 | 12/14/2012 | 1967 | |||||||||||||||||||||||||
| Citizens Bank |
Pittsburgh |
PA |
— | (14) | 516 | 1,204 | — | 1,720 | 70 | 12/14/2012 | 1970 | |||||||||||||||||||||||||
| Citizens Bank |
Butler |
PA |
— | (14) | 286 | 1,144 | — | 1,430 | 66 | 12/14/2012 | 1966 | |||||||||||||||||||||||||
| Citizens Bank |
Pittsburgh |
PA |
— | (14) | 196 | 1,110 | — | 1,306 | 64 | 12/14/2012 | 1980 | |||||||||||||||||||||||||
F-104
Table of Contents
| Initial Costs | ||||||||||||||||||||||||||||||||||||
| Property |
City |
State |
Encumbrances at December 31, 2013 |
Land | Buildings, Fixtures and Improvements |
Costs Capitalized Subsequent to Acquisition |
Gross Amount Carried at December 31, 2013 (10) (11) |
Accumulated Depreciation (12) (13) |
Date Acquired |
Date of Construction |
||||||||||||||||||||||||||
| Citizens Bank |
Philadelphia |
PA |
$ | — | (14) | $ | 266 | $ | 1,065 | $ | — | $ | 1,331 | $ | 62 | 12/14/2012 | 1971 | |||||||||||||||||||
| Citizens Bank |
Kittanning |
PA |
— | (14) | 56 | 1,060 | — | 1,116 | 62 | 12/14/2012 | 1889 | |||||||||||||||||||||||||
| Citizens Bank |
Pittsburgh |
PA |
— | (14) | 255 | 1,019 | — | 1,274 | 59 | 12/14/2012 | 1970 | |||||||||||||||||||||||||
| Citizens Bank |
Troy |
MI |
— | (14) | 312 | 935 | — | 1,247 | 54 | 12/14/2012 | 1980 | |||||||||||||||||||||||||
| Citizens Bank |
Warrendale |
PA |
— | (14) | 611 | 916 | — | 1,527 | 53 | 12/14/2012 | 1981 | |||||||||||||||||||||||||
| Citizens Bank |
Providence |
RI |
— | (14) | 300 | 899 | — | 1,199 | 52 | 12/14/2012 | 1960 | |||||||||||||||||||||||||
| Citizens Bank |
N. Providence |
RI |
— | (14) | 223 | 892 | — | 1,115 | 52 | 12/14/2012 | 1971 | |||||||||||||||||||||||||
| Citizens Bank |
Pitcairn |
PA |
— | (14) | 46 | 867 | — | 913 | 50 | 12/14/2012 | 1985 | |||||||||||||||||||||||||
| Citizens Bank |
Greensburg |
PA |
— | (14) | 45 | 861 | — | 906 | 50 | 12/14/2012 | 1957 | |||||||||||||||||||||||||
| Citizens Bank |
Westchester |
IL |
— | (14) | 366 | 853 | — | 1,219 | 38 | 2/22/2013 | 1986 | |||||||||||||||||||||||||
| Citizens Bank |
Ford City |
PA |
— | (14) | 89 | 802 | — | 891 | 47 | 12/14/2012 | 1975 | |||||||||||||||||||||||||
| Citizens Bank |
Reading |
PA |
— | (14) | 267 | 802 | — | 1,069 | 47 | 12/14/2012 | 1970 | |||||||||||||||||||||||||
| Citizens Bank |
Aliquippa |
PA |
— | (14) | 138 | 782 | — | 920 | 45 | 12/14/2012 | 1953 | |||||||||||||||||||||||||
| Citizens Bank |
Wexford |
PA |
— | (14) | 180 | 719 | — | 899 | 42 | 12/14/2012 | 1975 | |||||||||||||||||||||||||
| Citizens Bank |
Farmington |
MI |
— | (14) | 303 | 707 | — | 1,010 | 41 | 12/14/2012 | 1962 | |||||||||||||||||||||||||
| Citizens Bank |
East Greenwich |
RI |
— | (14) | 227 | 680 | — | 907 | 39 | 12/14/2012 | 1959 | |||||||||||||||||||||||||
| Citizens Bank |
Rumford |
RI |
— | (14) | 352 | 654 | — | 1,006 | 38 | 12/14/2012 | 1977 | |||||||||||||||||||||||||
| Citizens Bank |
Highspire |
PA |
— | (14) | 216 | 649 | — | 865 | 38 | 12/14/2012 | 1974 | |||||||||||||||||||||||||
| Citizens Bank |
Camp Hill |
PA |
— | (14) | 430 | 645 | — | 1,075 | 37 | 12/14/2012 | 1971 | |||||||||||||||||||||||||
| Citizens Bank |
Parma Heights |
OH |
— | (14) | 426 | 638 | — | 1,064 | 37 | 12/14/2012 | 1957 | |||||||||||||||||||||||||
| Citizens Bank |
Oil City |
PA |
— | (14) | 110 | 623 | — | 733 | 36 | 12/14/2012 | 1965 | |||||||||||||||||||||||||
| City Buffet |
Alexander City |
AL |
— | (14) | 292 | 301 | — | 593 | 9 | 6/27/2013 | 1988 | |||||||||||||||||||||||||
| Cowboy’s Express |
Monticello |
AR |
— | (14) | 43 | 36 | — | 79 | 1 | 6/27/2013 | 1982 | |||||||||||||||||||||||||
| Cuco Mexican |
Circleville |
OH |
— | 149 | 164 | — | 313 | 5 | 6/27/2013 | 1986 | ||||||||||||||||||||||||||
| CVS |
Hoover |
AL |
— | (14) | 1,239 | 2,890 | — | 4,129 | 101 | 5/31/2013 | 2003 | |||||||||||||||||||||||||
| CVS |
Columbia |
SC |
— | — | 2,811 | — | 2,811 | 84 | 7/2/2013 | 2006 | ||||||||||||||||||||||||||
| CVS |
New Castle |
PA |
1,562 | 412 | 2,337 | — | 2,749 | 164 | 10/31/2012 | 1999 | ||||||||||||||||||||||||||
| CVS |
Hardy |
VA |
— | (14) | 686 | 2,059 | — | 2,745 | 72 | 5/16/2013 | 2005 | |||||||||||||||||||||||||
| CVS |
Towanda |
PA |
— | (14) | — | 877 | — | 877 | 35 | 4/24/2013 | 2003 | |||||||||||||||||||||||||
| Dairy Queen |
Woodville |
TX |
— | (14) | 98 | 65 | — | 163 | 1 | 7/31/2013 | 1980 | |||||||||||||||||||||||||
| DaVita Dialysis |
Hiawatha |
KS |
— | (14) | 69 | 1,302 | — | 1,371 | 36 | 5/30/2013 | 2012 | |||||||||||||||||||||||||
| DaVita Dialysis |
Palatka |
FL |
— | 207 | 1,173 | — | 1,380 | 32 | 6/5/2013 | 2013 | ||||||||||||||||||||||||||
| DaVita Dialysis |
Hartsville |
SC |
— | (14) | 126 | 1,136 | — | 1,262 | 31 | 5/30/2013 | 2013 | |||||||||||||||||||||||||
| DaVita Dialysis |
Cincinnati |
OH |
— | (14) | 219 | 878 | — | 1,097 | 31 | 3/28/2013 | 2008 | |||||||||||||||||||||||||
| DaVita Dialysis |
Georgetown |
OH |
— | (14) | 125 | 706 | — | 831 | 25 | 3/28/2013 | 2009 | |||||||||||||||||||||||||
| Denny’s |
Tempe |
AZ |
— | 1,960 | 1,273 | — | 3,233 | 36 | 6/27/2013 | 1980 | ||||||||||||||||||||||||||
| Denny’s |
Phoenix |
AZ |
— | 825 | 1,237 | — | 2,062 | 31 | 7/31/2013 | 2005 | ||||||||||||||||||||||||||
| Denny’s |
Idaho Falls |
ID |
— | 538 | 1,183 | — | 1,721 | 34 | 6/27/2013 | 1995 | ||||||||||||||||||||||||||
| Denny’s |
Mesa |
AZ |
— | 1,089 | 891 | — | 1,980 | 22 | 7/31/2013 | 1994 | ||||||||||||||||||||||||||
| Denny’s |
Tempe |
AZ |
— | 1,567 | 844 | — | 2,411 | 21 | 7/31/2013 | 1994 | ||||||||||||||||||||||||||
| Denny’s |
Scottsdale |
AZ |
— | (14) | 736 | 491 | — | 1,227 | 12 | 7/31/2013 | 1985 | |||||||||||||||||||||||||
| Denny’s |
Peoria |
AZ |
— | 310 | 457 | — | 767 | 13 | 6/27/2013 | 1987 | ||||||||||||||||||||||||||
| Denny’s |
Marion |
OH |
— | (14) | 115 | 390 | — | 505 | 11 | 6/27/2013 | 1989 | |||||||||||||||||||||||||
| Denny’s |
Spartanburg |
SC |
— | 656 | 353 | — | 1,009 | 9 | 7/31/2013 | 1991 | ||||||||||||||||||||||||||
| Denny’s |
Henrietta |
NY |
— | 361 | 241 | — | 602 | 6 | 7/31/2013 | 1970 | ||||||||||||||||||||||||||
| Denny’s |
Bloomington |
MN |
— | 1,184 | — | — | 1,184 | — | 7/31/2013 | N/A | ||||||||||||||||||||||||||
| Dollar General |
Holly Hill |
SC |
— | (14) | 259 | 2,333 | — | 2,592 | 109 | 3/6/2013 | 2013 | |||||||||||||||||||||||||
| Dollar General |
Presidio |
TX |
— | (14) | 72 | 1,370 | — | 1,442 | 58 | 3/28/2013 | 2013 | |||||||||||||||||||||||||
| Dollar General |
Savanna |
IL |
— | (14) | 273 | 1,093 | — | 1,366 | 61 | 12/31/2012 | 2012 | |||||||||||||||||||||||||
| Dollar General |
Chelyan |
WV |
— | 273 | 1,092 | — | 1,365 | 15 | 9/27/2013 | 2013 | ||||||||||||||||||||||||||
| Dollar General |
Adams |
MA |
— | 254 | 1,016 | — | 1,270 | 14 | 10/10/2013 | 2012 | ||||||||||||||||||||||||||
| Dollar General |
Modena |
NY |
— | 249 | 996 | — | 1,245 | 14 | 10/10/2013 | 2012 | ||||||||||||||||||||||||||
| Dollar General |
Mount Morris |
MI |
— | (14) | 110 | 988 | — | 1,098 | 46 | 2/27/2013 | 2012 | |||||||||||||||||||||||||
| Dollar General |
Eldon |
MO |
— | (14) | 52 | 986 | — | 1,038 | 51 | 2/14/2013 | 2013 | |||||||||||||||||||||||||
| Dollar General |
Malden |
MO |
— | 108 | 974 | — | 1,082 | 23 | 8/2/2013 | 2013 | ||||||||||||||||||||||||||
| Dollar General |
Lytle |
TX |
— | 243 | 971 | — | 1,214 | 9 | 10/30/2013 | 2013 | ||||||||||||||||||||||||||
| Dollar General |
San Antonio |
TX |
— | (14) | 239 | 956 | — | 1,195 | 45 | 3/11/2013 | 2013 | |||||||||||||||||||||||||
F-105
Table of Contents
| Initial Costs | ||||||||||||||||||||||||||||||||||||
| Property |
City |
State |
Encumbrances at December 31, 2013 |
Land | Buildings, Fixtures and Improvements |
Costs Capitalized Subsequent to Acquisition |
Gross Amount Carried at December 31, 2013 (10) (11) |
Accumulated Depreciation (12) (13) |
Date Acquired |
Date of Construction |
||||||||||||||||||||||||||
| Dollar General |
San Juan |
TX |
$ | — | $ | 169 | $ | 956 | $ | — | $ | 1,125 | $ | 9 | 11/15/2013 | 2013 | ||||||||||||||||||||
| Dollar General |
Henry |
IL |
— | (14) | 104 | 934 | — | 1,038 | 31 | 5/23/2013 | 2013 | |||||||||||||||||||||||||
| Dollar General |
South Pekin |
IL |
— | 104 | 933 | — | 1,037 | 22 | 8/14/2013 | 2013 | ||||||||||||||||||||||||||
| Dollar General |
San Antonio |
TX |
— | (14) | 163 | 926 | — | 1,089 | 48 | 2/14/2013 | 2012 | |||||||||||||||||||||||||
| Dollar General |
Laurie |
MO |
— | 102 | 918 | — | 1,020 | 9 | 11/15/2013 | 2013 | ||||||||||||||||||||||||||
| Dollar General |
Milaca |
MN |
— | 102 | 916 | — | 1,018 | 13 | 9/24/2013 | 2013 | ||||||||||||||||||||||||||
| Dollar General |
Edinburg |
TX |
— | 102 | 914 | — | 1,016 | 21 | 7/16/2013 | 2013 | ||||||||||||||||||||||||||
| Dollar General |
De Soto |
MO |
— | (14) | 101 | 912 | — | 1,013 | 47 | 2/14/2013 | 2013 | |||||||||||||||||||||||||
| Dollar General |
Shelbina |
MO |
— | (14) | 101 | 911 | — | 1,012 | 30 | 5/22/2013 | 2013 | |||||||||||||||||||||||||
| Dollar General |
Kyle |
TX |
— | 101 | 910 | — | 1,011 | 4 | 12/6/2013 | 2013 | ||||||||||||||||||||||||||
| Dollar General |
Eagle Grove |
IA |
— | 100 | 902 | — | 1,002 | 25 | 7/9/2013 | 2013 | ||||||||||||||||||||||||||
| Dollar General |
Farmington |
NM |
— | 224 | 898 | — | 1,122 | 25 | 7/11/2013 | 2013 | ||||||||||||||||||||||||||
| Dollar General |
Mission |
TX |
— | (14) | 158 | 894 | — | 1,052 | 38 | 3/27/2013 | 2013 | |||||||||||||||||||||||||
| Dollar General |
Adkins |
TX |
— | (14) | 157 | 889 | — | 1,046 | 50 | 12/31/2012 | 2012 | |||||||||||||||||||||||||
| Dollar General |
New Braunfels |
TX |
— | 156 | 883 | — | 1,039 | 8 | 10/30/2013 | 2013 | ||||||||||||||||||||||||||
| Dollar General |
Aurora |
MO |
— | (14) | 98 | 881 | — | 979 | 41 | 2/28/2013 | 2013 | |||||||||||||||||||||||||
| Dollar General |
Millwood |
WV |
— | 98 | 881 | — | 979 | 25 | 7/2/2013 | 2013 | ||||||||||||||||||||||||||
| Dollar General |
San Antonio |
TX |
— | 220 | 880 | — | 1,100 | 25 | 7/9/2013 | 2013 | ||||||||||||||||||||||||||
| Dollar General |
Pequot Lakes |
MN |
— | 155 | 880 | — | 1,035 | 16 | 8/22/2013 | 2013 | ||||||||||||||||||||||||||
| Dollar General |
Amarillo |
TX |
— | 97 | 877 | — | 974 | 21 | 8/13/2013 | 2013 | ||||||||||||||||||||||||||
| Dollar General |
Mahomet |
IL |
— | 292 | 877 | — | 1,169 | 16 | 8/22/2013 | 2013 | ||||||||||||||||||||||||||
| Dollar General |
Manistique |
MI |
— | (14) | 155 | 876 | — | 1,031 | 41 | 2/27/2013 | 2012 | |||||||||||||||||||||||||
| Dollar General |
West Union |
SC |
— | 46 | 868 | — | 914 | 24 | 7/3/2013 | 2011 | ||||||||||||||||||||||||||
| Dollar General |
Fairbury |
IL |
— | 96 | 867 | — | 963 | 28 | 6/7/2013 | 2013 | ||||||||||||||||||||||||||
| Dollar General |
Amarillo |
TX |
— | 153 | 866 | — | 1,019 | 20 | 8/2/2013 | 2013 | ||||||||||||||||||||||||||
| Dollar General |
Cedar Falls |
IA |
— | 96 | 862 | — | 958 | 16 | 8/28/2013 | 2013 | ||||||||||||||||||||||||||
| Dollar General |
Mercedes |
TX |
— | 215 | 859 | — | 1,074 | 20 | 8/2/2013 | 2013 | ||||||||||||||||||||||||||
| Dollar General |
Ganado |
TX |
— | 95 | 857 | — | 952 | 20 | 8/13/2013 | 2013 | ||||||||||||||||||||||||||
| Dollar General |
New Braunfels |
TX |
— | (14) | 95 | 855 | — | 950 | 44 | 2/14/2013 | 2013 | |||||||||||||||||||||||||
| Dollar General |
Manchester |
MI |
— | (14) | 213 | 853 | — | 1,066 | 40 | 2/27/2013 | 2013 | |||||||||||||||||||||||||
| Dollar General |
Guyton |
GA |
— | (14) | 213 | 852 | — | 1,065 | 28 | 6/3/2013 | 2011 | |||||||||||||||||||||||||
| Dollar General |
Annandale |
MN |
— | 212 | 848 | — | 1,060 | 20 | 8/2/2013 | 2013 | ||||||||||||||||||||||||||
| Dollar General |
Staples |
MN |
— | 150 | 848 | — | 998 | 16 | 9/4/2013 | 2013 | ||||||||||||||||||||||||||
| Dollar General |
Lexington |
MO |
— | 149 | 846 | — | 995 | 16 | 9/13/2013 | 2013 | ||||||||||||||||||||||||||
| Dollar General |
Whitesburg |
KY |
— | (14) | 211 | 845 | — | 1,056 | 28 | 5/30/2013 | 2012 | |||||||||||||||||||||||||
| Dollar General |
Lubbock |
TX |
— | (14) | 148 | 841 | — | 989 | 28 | 5/16/2013 | 2013 | |||||||||||||||||||||||||
| Dollar General |
Brookeland |
TX |
— | 93 | 840 | — | 933 | 20 | 8/15/2013 | 2013 | ||||||||||||||||||||||||||
| Dollar General |
Bastrop |
LA |
— | 148 | 838 | — | 986 | 24 | 7/1/2013 | 2013 | ||||||||||||||||||||||||||
| Dollar General |
Rolla |
MO |
— | 209 | 835 | — | 1,044 | 16 | 8/21/2013 | 2013 | ||||||||||||||||||||||||||
| Dollar General |
Lonedell |
MO |
— | (14) | 208 | 833 | — | 1,041 | 31 | 4/26/2013 | 2013 | |||||||||||||||||||||||||
| Dollar General |
Boling |
TX |
— | 92 | 831 | — | 923 | 19 | 8/13/2013 | 2013 | ||||||||||||||||||||||||||
| Dollar General |
Avinger |
TX |
— | 44 | 830 | — | 874 | 19 | 8/8/2013 | 2013 | ||||||||||||||||||||||||||
| Dollar General |
Roodhouse |
IL |
— | (14) | 207 | 829 | — | 1,036 | 47 | 12/31/2012 | 2012 | |||||||||||||||||||||||||
| Dollar General |
Lacy Lakeview |
TX |
— | (14) | 146 | 826 | — | 972 | 50 | 11/16/2012 | 2012 | |||||||||||||||||||||||||
| Dollar General |
Elkview |
WV |
— | 274 | 823 | — | 1,097 | 19 | 8/2/2013 | 2013 | ||||||||||||||||||||||||||
| Dollar General |
Weslaco |
TX |
— | 205 | 822 | — | 1,027 | 8 | 10/16/2013 | 2013 | ||||||||||||||||||||||||||
| Dollar General |
Buchanan Dam |
TX |
562 | 145 | 820 | — | 965 | 58 | 9/28/2012 | 2012 | ||||||||||||||||||||||||||
| Dollar General |
McMechen |
WV |
— | (14) | 91 | 819 | — | 910 | 46 | 1/9/2013 | 2012 | |||||||||||||||||||||||||
| Dollar General |
Sand Springs |
OK |
— | 43 | 819 | — | 862 | 15 | 9/3/2013 | 2013 | ||||||||||||||||||||||||||
| Dollar General |
Joplin |
MO |
— | 144 | 816 | — | 960 | 8 | 11/12/2013 | 2013 | ||||||||||||||||||||||||||
| Dollar General |
San Antonio |
TX |
— | (14) | 271 | 812 | — | 1,083 | 27 | 5/23/2013 | 2013 | |||||||||||||||||||||||||
| Dollar General |
Skidmore |
TX |
— | (14) | 90 | 811 | — | 901 | 42 | 2/14/2013 | 2013 | |||||||||||||||||||||||||
| Dollar General |
Savannah |
MO |
— | 270 | 811 | — | 1,081 | 15 | 8/23/2013 | 2013 | ||||||||||||||||||||||||||
| Dollar General |
Sand Springs |
OK |
— | 143 | 811 | — | 954 | 15 | 9/3/2013 | 2013 | ||||||||||||||||||||||||||
| Dollar General |
Beeville |
TX |
— | (14) | 90 | 810 | — | 900 | 49 | 11/19/2012 | 2012 | |||||||||||||||||||||||||
| Dollar General |
Roseau |
MN |
— | 143 | 808 | — | 951 | 8 | 10/30/2013 | 2013 | ||||||||||||||||||||||||||
| Dollar General |
San Benito |
TX |
— | 202 | 807 | — | 1,009 | 15 | 8/23/2013 | 2013 | ||||||||||||||||||||||||||
F-106
Table of Contents
| Initial Costs | ||||||||||||||||||||||||||||||||||||
| Property |
City |
State |
Encumbrances at December 31, 2013 |
Land | Buildings, Fixtures and Improvements |
Costs Capitalized Subsequent to Acquisition |
Gross Amount Carried at December 31, 2013 (10) (11) |
Accumulated Depreciation (12) (13) |
Date Acquired |
Date of Construction |
||||||||||||||||||||||||||
| Dollar General |
Belton |
TX |
$ | — | (14) | $ | 89 | $ | 804 | $ | — | $ | 893 | $ | 38 | 2/28/2013 | 2013 | |||||||||||||||||||
| Dollar General |
Hawley |
MN |
— | 89 | 803 | — | 892 | 8 | 10/16/2013 | 2013 | ||||||||||||||||||||||||||
| Dollar General |
East Bernstadt |
KY |
— | (14) | 141 | 799 | — | 940 | 26 | 5/30/2013 | 2012 | |||||||||||||||||||||||||
| Dollar General |
Lubbock |
TX |
— | 199 | 796 | — | 995 | 15 | 8/28/2013 | 2013 | ||||||||||||||||||||||||||
| Dollar General |
Wakefield |
MI |
— | (14) | 88 | 794 | — | 882 | 45 | 12/19/2012 | 2012 | |||||||||||||||||||||||||
| Dollar General |
Romulus |
MI |
— | (14) | 199 | 794 | — | 993 | 37 | 2/27/2013 | 2011 | |||||||||||||||||||||||||
| Dollar General |
Amarillo |
TX |
— | 198 | 794 | — | 992 | 22 | 7/11/2013 | 2013 | ||||||||||||||||||||||||||
| Dollar General |
Sand Springs |
OK |
— | 198 | 791 | — | 989 | 15 | 9/3/2013 | 2012 | ||||||||||||||||||||||||||
| Dollar General |
Billings |
MO |
— | 139 | 790 | — | 929 | 7 | 10/17/2013 | 2013 | ||||||||||||||||||||||||||
| Dollar General |
Caulfield |
MO |
— | (14) | 139 | 789 | — | 928 | 44 | 12/31/2012 | 2012 | |||||||||||||||||||||||||
| Dollar General |
DeSoto |
IL |
— | (14) | 138 | 784 | — | 922 | 33 | 3/26/2013 | 2013 | |||||||||||||||||||||||||
| Dollar General |
Powhatan Point |
WV |
— | 138 | 784 | — | 922 | 22 | 7/2/2013 | 2013 | ||||||||||||||||||||||||||
| Dollar General |
Cowen |
WV |
— | (14) | 196 | 783 | — | 979 | 40 | 1/16/2013 | 2012 | |||||||||||||||||||||||||
| Dollar General |
Camden |
MI |
— | (14) | 138 | 781 | — | 919 | 37 | 2/27/2013 | 2013 | |||||||||||||||||||||||||
| Dollar General |
Berea |
KY |
— | (14) | 138 | 781 | — | 919 | 26 | 5/30/2013 | 2012 | |||||||||||||||||||||||||
| Dollar General |
Moody |
TX |
— | 41 | 781 | — | 822 | 26 | 6/11/2013 | 2013 | ||||||||||||||||||||||||||
| Dollar General |
Doolittle |
MO |
— | 137 | 778 | — | 915 | 18 | 8/2/2013 | 2013 | ||||||||||||||||||||||||||
| Dollar General |
San Antonio |
TX |
— | 333 | 776 | — | 1,109 | 18 | 8/13/2013 | 2013 | ||||||||||||||||||||||||||
| Dollar General |
Eubank |
KY |
— | (14) | 137 | 775 | — | 912 | 25 | 5/30/2013 | 2013 | |||||||||||||||||||||||||
| Dollar General |
Center Point |
IA |
— | (14) | 136 | 772 | — | 908 | 43 | 12/31/2012 | 2012 | |||||||||||||||||||||||||
| Dollar General |
Texarkana |
TX |
— | 136 | 772 | — | 908 | 7 | 10/25/2013 | 2013 | ||||||||||||||||||||||||||
| Dollar General |
Coldiron |
KY |
— | (14) | 187 | 747 | — | 934 | 24 | 5/30/2013 | 2013 | |||||||||||||||||||||||||
| Dollar General |
Diana |
TX |
— | 186 | 743 | — | 929 | 14 | 8/27/2013 | 2013 | ||||||||||||||||||||||||||
| Dollar General |
Rapid City |
MI |
— | (14) | 179 | 716 | — | 895 | 34 | 2/27/2013 | 2012 | |||||||||||||||||||||||||
| Dollar General |
Cedar Creek |
TX |
— | (14) | 291 | 680 | — | 971 | 41 | 11/16/2012 | 2012 | |||||||||||||||||||||||||
| Dragon China Buffet |
Carlsbad |
NM |
— | (14) | 208 | 104 | — | 312 | 3 | 6/27/2013 | 1995 | |||||||||||||||||||||||||
| East Supreme Buffet |
Whitehall |
PA |
— | (14) | 492 | 505 | — | 997 | 14 | 6/27/2013 | 1997 | |||||||||||||||||||||||||
| Eegee’s |
Tucson |
AZ |
— | 357 | 436 | — | 793 | 10 | 7/31/2013 | 1990 | ||||||||||||||||||||||||||
| El Chico |
Killeen |
TX |
— | 534 | 992 | — | 1,526 | 25 | 7/31/2013 | 1993 | ||||||||||||||||||||||||||
| El Tapatio Mexican Restaurant |
Page |
AZ |
— | (14) | 170 | 133 | — | 303 | 4 | 6/27/2013 | 1988 | |||||||||||||||||||||||||
| Family Dollar |
Mount Vernon |
IL |
— | 117 | 1,050 | — | 1,167 | 30 | 7/11/2013 | 2012 | ||||||||||||||||||||||||||
| Family Dollar |
Crosby |
MN |
— | 49 | 928 | — | 977 | 26 | 7/11/2013 | 1985 | ||||||||||||||||||||||||||
| Family Dollar |
Toledo |
OH |
— | 226 | 905 | — | 1,131 | 25 | 7/11/2013 | 1942 | ||||||||||||||||||||||||||
| Family Dollar |
Carlin |
NV |
— | 99 | 895 | — | 994 | 17 | 9/13/2013 | 2012 | ||||||||||||||||||||||||||
| Family Dollar |
Cold Springs |
NV |
— | 217 | 869 | — | 1,086 | 16 | 9/13/2013 | 2013 | ||||||||||||||||||||||||||
| Family Dollar |
Des Moines |
IA |
— | 152 | 863 | — | 1,015 | 16 | 8/30/2013 | 2013 | ||||||||||||||||||||||||||
| Family Dollar |
Cincinnatus |
NY |
— | 287 | 862 | — | 1,149 | — | 12/30/2013 | 2013 | ||||||||||||||||||||||||||
| Family Dollar |
Etoile |
TX |
— | 45 | 850 | — | 895 | 20 | 8/6/2013 | 2013 | ||||||||||||||||||||||||||
| Family Dollar |
Mountain View |
WY |
— | 44 | 838 | — | 882 | 16 | 9/13/2013 | 2013 | ||||||||||||||||||||||||||
| Family Dollar |
Markesan |
WI |
— | 92 | 831 | — | 923 | 4 | 12/12/2013 | 2013 | ||||||||||||||||||||||||||
| Family Dollar |
Thorp |
WI |
— | 90 | 810 | — | 900 | 15 | 8/30/2013 | 2013 | ||||||||||||||||||||||||||
| Family Dollar |
Webster |
WI |
— | 43 | 808 | — | 851 | 23 | 7/11/2013 | 2013 | ||||||||||||||||||||||||||
| Family Dollar |
Oakwood |
TX |
— | 133 | 752 | — | 885 | 4 | 11/20/2013 | 2013 | ||||||||||||||||||||||||||
| Family Dollar |
Clarendon |
TX |
— | 83 | 749 | — | 832 | 11 | 9/17/2013 | 2013 | ||||||||||||||||||||||||||
| Family Dollar |
Gretna |
VA |
— | 131 | 744 | — | 875 | 21 | 7/2/2013 | 2012 | ||||||||||||||||||||||||||
| Family Dollar |
Somerville |
TX |
— | (14) | 131 | 743 | — | 874 | 42 | 12/31/2012 | 2012 | |||||||||||||||||||||||||
| Family Dollar |
Lovelady |
TX |
— | (14) | 82 | 740 | — | 822 | 31 | 3/27/2013 | 2012 | |||||||||||||||||||||||||
| Family Dollar |
Birch Run |
MI |
— | 81 | 729 | — | 810 | 20 | 7/11/2013 | 1950 | ||||||||||||||||||||||||||
| Family Dollar |
Hoosick Falls |
NY |
— | (14) | 181 | 724 | — | 905 | 27 | 4/26/2013 | 2013 | |||||||||||||||||||||||||
| Family Dollar |
Marble Hill |
MO |
— | 38 | 719 | — | 757 | 13 | 8/29/2013 | 2013 | ||||||||||||||||||||||||||
| Family Dollar |
Houston |
TX |
— | (14) | 174 | 696 | — | 870 | 26 | 4/26/2013 | 1985 | |||||||||||||||||||||||||
| Family Dollar |
University Park |
IL |
— | 295 | 688 | — | 983 | 6 | 10/29/2013 | 2013 | ||||||||||||||||||||||||||
| Family Dollar |
Centerville |
TX |
— | 226 | 679 | — | 905 | 13 | 9/10/2013 | 2013 | ||||||||||||||||||||||||||
| Family Dollar |
Alderson |
WV |
— | 166 | 663 | — | 829 | 19 | 7/11/2013 | 2012 | ||||||||||||||||||||||||||
| Family Dollar |
Torrington |
WY |
— | (14) | 72 | 645 | — | 717 | 24 | 5/9/2013 | 2007 | |||||||||||||||||||||||||
| Family Dollar |
Tustin |
MI |
— | (14) | 33 | 633 | — | 666 | 36 | 12/18/2012 | 2012 | |||||||||||||||||||||||||
F-107
Table of Contents
| Initial Costs | ||||||||||||||||||||||||||||||||||||
| Property |
City |
State |
Encumbrances at December 31, 2013 |
Land | Buildings, Fixtures and Improvements |
Costs Capitalized Subsequent to Acquisition |
Gross Amount Carried at December 31, 2013 (10) (11) |
Accumulated Depreciation (12) (13) |
Date Acquired |
Date of Construction |
||||||||||||||||||||||||||
| Family Dollar |
Custer |
SD |
$ | — | $ | 32 | $ | 617 | $ | — | $ | 649 | $ | 20 | 6/14/2013 | 2006 | ||||||||||||||||||||
| Family Dollar |
International Falls |
MN |
— | 32 | 608 | — | 640 | 9 | 9/30/2013 | 1966 | ||||||||||||||||||||||||||
| Family Dollar |
Barryton |
MI |
— | (14) | 32 | 599 | — | 631 | 34 | 12/18/2012 | 2012 | |||||||||||||||||||||||||
| Family Dollar |
Pulaski |
IL |
— | (14) | 31 | 588 | — | 619 | 33 | 12/31/2012 | 2012 | |||||||||||||||||||||||||
| Family Dollar |
Lombard |
IL |
— | 1,008 | 543 | — | 1,551 | 3 | 12/12/2013 | 2013 | ||||||||||||||||||||||||||
| Family Dollar |
Rushville |
NE |
— | (14) | 125 | 499 | — | 624 | 19 | 4/26/2013 | 2007 | |||||||||||||||||||||||||
| Famous Dave’s |
Eden Prairie |
MN |
— | (14) | 824 | 549 | — | 1,373 | 14 | 7/31/2013 | 1995 | |||||||||||||||||||||||||
| Fazoli’s |
Carmel |
IN |
— | (14) | 427 | 522 | — | 949 | 11 | 7/31/2013 | 1986 | |||||||||||||||||||||||||
| Fazoli’s |
Appleton |
WI |
— | 705 | — | — | 705 | — | 7/31/2013 | N/A | ||||||||||||||||||||||||||
| FedEx |
Tinicum |
PA |
— | — | 32,170 | — | 32,170 | 818 | 8/15/2013 | 2013 | ||||||||||||||||||||||||||
| FedEx |
Lebanon |
OH |
— | 1,492 | 8,452 | — | 9,944 | 172 | 8/26/2013 | 2013 | ||||||||||||||||||||||||||
| FedEx |
Albany |
GA |
— | 195 | 3,711 | — | 3,906 | 57 | 10/11/2013 | 2013 | ||||||||||||||||||||||||||
| FedEx |
London |
KY |
— | 350 | 3,151 | — | 3,501 | 48 | 10/11/2013 | 2013 | ||||||||||||||||||||||||||
| FedEx |
Waterloo |
IA |
— | (14) | 152 | 2,882 | — | 3,034 | 132 | 3/22/2013 | 2012 | |||||||||||||||||||||||||
| FedEx |
Rapid City |
SD |
— | (14) | 305 | 2,741 | — | 3,046 | 167 | 12/21/2012 | 2012 | |||||||||||||||||||||||||
| FedEx |
Ottumwa |
IA |
— | (14) | 134 | 2,552 | — | 2,686 | 182 | 10/30/2012 | 2012 | |||||||||||||||||||||||||
| FedEx |
Independence |
KS |
— | (14) | 114 | 2,166 | — | 2,280 | 154 | 10/30/2012 | 2012 | |||||||||||||||||||||||||
| FedEx |
Des Moines |
IA |
— | (14) | 733 | 1,361 | — | 2,094 | 55 | 4/18/2013 | 1986 | |||||||||||||||||||||||||
| FedEx |
Riverton |
WY |
— | 431 | 1,006 | — | 1,437 | 10 | 10/23/2013 | 2013 | ||||||||||||||||||||||||||
| FedEx |
Homewood |
AL |
— | 522 | 779 | — | 1,301 | 22 | 6/27/2013 | 2000 | ||||||||||||||||||||||||||
| Flip It Bakery & Deli |
Washington |
DC |
— | (14) | 338 | 84 | — | 422 | 2 | 7/31/2013 | 1985 | |||||||||||||||||||||||||
| Fresenius |
Fayetteville |
NC |
— | 178 | 3,379 | — | 3,557 | 79 | 6/28/2013 | 1999 | ||||||||||||||||||||||||||
| Fresenius |
Clinton |
NC |
— | 139 | 2,647 | — | 2,786 | 62 | 6/28/2013 | 2003 | ||||||||||||||||||||||||||
| Fresenius |
Foley |
AL |
— | 287 | 2,580 | — | 2,867 | 61 | 7/8/2013 | 2009 | ||||||||||||||||||||||||||
| Fresenius |
Fayetteville |
NC |
— | 134 | 2,551 | — | 2,685 | 60 | 6/28/2013 | 2004 | ||||||||||||||||||||||||||
| Fresenius |
Mobile |
AL |
— | 278 | 2,505 | — | 2,783 | 59 | 7/8/2013 | 1987 | ||||||||||||||||||||||||||
| Fresenius |
Fayetteville |
NC |
— | 420 | 2,379 | — | 2,799 | 56 | 6/28/2013 | 1998 | ||||||||||||||||||||||||||
| Fresenius |
Lumberton |
NC |
— | 117 | 2,216 | — | 2,333 | 52 | 6/28/2013 | 1986 | ||||||||||||||||||||||||||
| Fresenius |
DeFuniak Springs |
FL |
— | 115 | 2,180 | — | 2,295 | 51 | 7/8/2013 | 2008 | ||||||||||||||||||||||||||
| Fresenius |
Fairhope |
AL |
— | — | 2,035 | — | 2,035 | 48 | 7/8/2013 | 2006 | ||||||||||||||||||||||||||
| Fresenius |
Red Springs |
NC |
— | 101 | 1,913 | — | 2,014 | 45 | 6/28/2013 | 2000 | ||||||||||||||||||||||||||
| Fresenius |
Fairmont |
NC |
— | 201 | 1,812 | — | 2,013 | 43 | 6/28/2013 | 2002 | ||||||||||||||||||||||||||
| Fresenius |
Pembroke |
NC |
— | 81 | 1,547 | — | 1,628 | 36 | 6/28/2013 | 2009 | ||||||||||||||||||||||||||
| Fresenius |
Roseboro |
NC |
— | 74 | 1,404 | — | 1,478 | 33 | 6/28/2013 | 2011 | ||||||||||||||||||||||||||
| Fresenius |
St. Pauls |
NC |
— | 73 | 1,389 | — | 1,462 | 33 | 6/28/2013 | 2008 | ||||||||||||||||||||||||||
| Furr’s |
Garland |
TX |
— | (14) | 1,529 | 3,715 | — | 5,244 | 107 | 6/27/2013 | 2008 | |||||||||||||||||||||||||
| Golden Corral |
Surprise |
AZ |
— | (14) | 1,258 | 4,068 | — | 5,326 | 117 | 6/27/2013 | 2007 | |||||||||||||||||||||||||
| Golden Corral |
Harlingen |
TX |
— | 832 | 3,037 | — | 3,869 | 87 | 6/27/2013 | 1990 | ||||||||||||||||||||||||||
| Golden Corral |
Texarkana |
TX |
— | 758 | 3,031 | — | 3,789 | 67 | 7/31/2013 | 2001 | ||||||||||||||||||||||||||
| Golden Corral |
Gilbert |
AZ |
— | (14) | 871 | 2,910 | — | 3,781 | 83 | 6/27/2013 | 2006 | |||||||||||||||||||||||||
| Golden Corral |
Jacksonville |
FL |
— | 1,721 | 2,629 | — | 4,350 | 75 | 6/27/2013 | 1999 | ||||||||||||||||||||||||||
| Golden Corral |
Houston |
TX |
— | 1,147 | 2,447 | — | 3,594 | 70 | 6/27/2013 | 1995 | ||||||||||||||||||||||||||
| Golden Corral |
Stockbridge |
GA |
— | 422 | 2,391 | — | 2,813 | 53 | 7/31/2013 | 1987 | ||||||||||||||||||||||||||
| Golden Corral |
Brownsville |
TX |
— | 604 | 2,302 | — | 2,906 | 66 | 6/27/2013 | 1990 | ||||||||||||||||||||||||||
| Golden Corral |
Norman |
OK |
— | 345 | 2,107 | — | 2,452 | 60 | 6/27/2013 | 1994 | ||||||||||||||||||||||||||
| Golden Corral |
Zanesville |
OH |
— | (14) | 487 | 2,030 | — | 2,517 | 58 | 6/27/2013 | 2002 | |||||||||||||||||||||||||
| Golden Corral |
Goodyear |
AZ |
— | (14) | 686 | 1,939 | — | 2,625 | 56 | 6/27/2013 | 2006 | |||||||||||||||||||||||||
| Golden Corral |
Baytown |
TX |
— | (14) | 596 | 1,788 | — | 2,384 | 39 | 7/31/2013 | 1995 | |||||||||||||||||||||||||
| Golden Corral |
College Station |
TX |
— | 1,265 | 1,718 | — | 2,983 | 49 | 6/27/2013 | 1990 | ||||||||||||||||||||||||||
| Golden Corral |
Midwest City |
OK |
— | 1,175 | 1,708 | — | 2,883 | 49 | 6/27/2013 | 1991 | ||||||||||||||||||||||||||
| Golden Corral |
Wichita |
KS |
— | (14) | 560 | 1,306 | — | 1,866 | 29 | 7/31/2013 | 2000 | |||||||||||||||||||||||||
| Golden Corral |
Jacksonville |
FL |
— | 1,033 | 1,084 | — | 2,117 | 31 | 6/27/2013 | 1997 | ||||||||||||||||||||||||||
| Golden Corral |
Palatka |
FL |
— | (14) | 853 | 1,048 | — | 1,901 | 30 | 6/27/2013 | 1997 | |||||||||||||||||||||||||
| Golden Corral |
Emporia |
KS |
— | (14) | 403 | 941 | — | 1,344 | 21 | 7/31/2013 | 1997 | |||||||||||||||||||||||||
| Golden Corral |
Roswell |
NM |
— | 203 | 600 | — | 803 | 17 | 6/27/2013 | 2000 | ||||||||||||||||||||||||||
| Golden Corral |
Rock Springs |
WY |
— | (14) | 354 | 90 | — | 444 | 3 | 6/27/2013 | 1986 | |||||||||||||||||||||||||
| Grandy’s |
Abilene |
TX |
— | 803 | — | — | 803 | — | 6/27/2013 | N/A | ||||||||||||||||||||||||||
F-108
Table of Contents
| Initial Costs | ||||||||||||||||||||||||||||||||||||
| Property |
City |
State |
Encumbrances at December 31, 2013 |
Land | Buildings, Fixtures and Improvements |
Costs Capitalized Subsequent to Acquisition |
Gross Amount Carried at December 31, 2013 (10) (11) |
Accumulated Depreciation (12) (13) |
Date Acquired |
Date of Construction |
||||||||||||||||||||||||||
| Grandy’s |
Arlington |
TX |
$ | — | $ | 734 | $ | — | $ | — | $ | 734 | $ | — | 6/27/2013 | N/A | ||||||||||||||||||||
| Grandy’s |
Carrollton |
TX |
— | 773 | — | — | 773 | — | 6/27/2013 | N/A | ||||||||||||||||||||||||||
| Grandy’s |
Carrollton |
TX |
— | 847 | — | — | 847 | — | 6/27/2013 | N/A | ||||||||||||||||||||||||||
| Grandy’s |
Fort Worth |
TX |
— | 777 | — | — | 777 | — | 6/27/2013 | N/A | ||||||||||||||||||||||||||
| Grandy’s |
Fort Worth |
TX |
— | 811 | — | — | 811 | — | 6/27/2013 | N/A | ||||||||||||||||||||||||||
| Grandy’s |
Garland |
TX |
— | 623 | — | — | 623 | — | 6/27/2013 | N/A | ||||||||||||||||||||||||||
| Grandy’s |
Garland |
TX |
— | 859 | — | — | 859 | — | 6/27/2013 | N/A | ||||||||||||||||||||||||||
| Grandy’s |
Grapevine |
TX |
— | 618 | — | — | 618 | — | 6/27/2013 | 1988 | ||||||||||||||||||||||||||
| Grandy’s |
Irving |
TX |
— | 871 | — | — | 871 | — | 6/27/2013 | N/A | ||||||||||||||||||||||||||
| Grandy’s |
Lancaster |
TX |
— | 780 | — | — | 780 | — | 6/27/2013 | N/A | ||||||||||||||||||||||||||
| Grandy’s |
Lubbock |
TX |
— | 694 | — | — | 694 | — | 6/27/2013 | 1979 | ||||||||||||||||||||||||||
| Grandy’s |
Mesquite |
TX |
— | 871 | — | — | 871 | — | 6/27/2013 | N/A | ||||||||||||||||||||||||||
| Grandy’s |
Plano |
TX |
— | 871 | — | — | 871 | — | 6/27/2013 | N/A | ||||||||||||||||||||||||||
| Grandy’s |
Dallas |
TX |
— | 725 | — | — | 725 | — | 7/31/2013 | N/A | ||||||||||||||||||||||||||
| Grandy’s |
Dallas |
TX |
— | 357 | — | — | 357 | — | 7/31/2013 | N/A | ||||||||||||||||||||||||||
| Grandy’s |
Greenville |
TX |
— | 847 | — | — | 847 | — | 7/31/2013 | N/A | ||||||||||||||||||||||||||
| Great Clips |
Lombard |
IL |
— | 84 | 100 | — | 184 | 3 | 6/27/2013 | 1973 | ||||||||||||||||||||||||||
| Hardee’s |
Jacksonville |
FL |
— | 875 | 583 | — | 1,458 | 13 | 7/31/2013 | 1993 | ||||||||||||||||||||||||||
| Hardee’s |
Williston |
FL |
— | (14) | 395 | 553 | — | 948 | 15 | 6/27/2013 | 1992 | |||||||||||||||||||||||||
| Hardee’s |
Canton |
GA |
— | 488 | 539 | — | 1,027 | 15 | 6/27/2013 | 1983 | ||||||||||||||||||||||||||
| Hardee’s |
Bremen |
GA |
— | (14) | 129 | 518 | — | 647 | 11 | 7/31/2013 | 1980 | |||||||||||||||||||||||||
| Hardee’s |
Springfield |
TN |
— | (14) | 343 | 515 | — | 858 | 11 | 7/31/2013 | 1990 | |||||||||||||||||||||||||
| Hardee’s |
Akron |
OH |
— | (14) | 207 | 483 | — | 690 | 11 | 7/31/2013 | 1990 | |||||||||||||||||||||||||
| Hardee’s |
Mount Vernon |
IA |
— | 320 | 480 | — | 800 | 13 | 6/27/2013 | 1987 | ||||||||||||||||||||||||||
| Hardee’s |
Belleville |
IL |
— | 269 | 467 | — | 736 | 13 | 6/27/2013 | 1987 | ||||||||||||||||||||||||||
| Hardee’s |
Seville |
OH |
— | (14) | 151 | 454 | — | 605 | 10 | 7/31/2013 | 1989 | |||||||||||||||||||||||||
| Hardee’s |
Pace |
FL |
— | (14) | 419 | 435 | — | 854 | 12 | 6/27/2013 | 1991 | |||||||||||||||||||||||||
| Hardee’s |
Morristown |
TN |
— | (14) | 353 | 431 | — | 784 | 9 | 7/31/2013 | 1991 | |||||||||||||||||||||||||
| Hardee’s |
Erwin |
TN |
— | (14) | 346 | 406 | — | 752 | 11 | 6/27/2013 | 1982 | |||||||||||||||||||||||||
| Hardee’s |
Jefferson |
OH |
— | (14) | 242 | 363 | — | 605 | 8 | 7/31/2013 | 1989 | |||||||||||||||||||||||||
| Hardee’s |
Sparta |
NC |
— | (14) | 372 | 346 | — | 718 | 10 | 6/27/2013 | 1983 | |||||||||||||||||||||||||
| Hardee’s |
Minerva |
OH |
— | (14) | 214 | 321 | — | 535 | 7 | 7/31/2013 | 1990 | |||||||||||||||||||||||||
| Hardee’s |
Beaver |
WV |
— | 217 | 318 | — | 535 | 9 | 6/27/2013 | 1983 | ||||||||||||||||||||||||||
| Harley Davidson |
Round Rock |
TX |
— | (14) | 1,688 | 9,563 | — | 11,251 | 237 | 7/31/2013 | 2008 | |||||||||||||||||||||||||
| Harvey’s Grill & Bar |
Saginaw |
MI |
— | (14) | 230 | 647 | — | 877 | 19 | 6/27/2013 | 1997 | |||||||||||||||||||||||||
| Hayden’s Grill & Bar |
Canton |
MI |
— | (14) | 160 | 693 | — | 853 | 20 | 6/27/2013 | 1995 | |||||||||||||||||||||||||
| Hooley House Sports Pub & Grille |
Brooklyn |
OH |
— | (14) | 291 | 321 | — | 612 | 9 | 6/27/2013 | 2000 | |||||||||||||||||||||||||
| IHOP |
Bossier City |
LA |
— | (14) | 541 | 1,342 | — | 1,883 | 38 | 6/27/2013 | 1998 | |||||||||||||||||||||||||
| IHOP |
Baytown |
TX |
— | (14) | 698 | 1,297 | — | 1,995 | 29 | 7/31/2013 | 1998 | |||||||||||||||||||||||||
| IHOP |
Auburn |
AL |
— | (14) | 1,111 | 933 | — | 2,044 | 27 | 6/27/2013 | 1998 | |||||||||||||||||||||||||
| IHOP |
Warren |
MI |
— | (14) | 605 | 830 | — | 1,435 | 24 | 6/27/2013 | 1996 | |||||||||||||||||||||||||
| IHOP |
Corpus Christi |
TX |
— | 1,176 | — | — | 1,176 | — | 7/31/2013 | N/A | ||||||||||||||||||||||||||
| Indi's Fast Food |
Louisville |
KY |
— | 292 | 157 | — | 449 | 3 | 7/31/2013 | 1972 | ||||||||||||||||||||||||||
| Iron Chef Super Buffet |
Kissimmee |
FL |
— | (14) | 297 | 127 | — | 424 | 3 | 7/31/2013 | 1989 | |||||||||||||||||||||||||
| Italian Villa, The |
Grand Island |
NY |
— | (14) | 38 | 101 | — | 139 | 3 | 6/27/2013 | 1979 | |||||||||||||||||||||||||
| Jack in the Box |
Cleburne |
TX |
— | (14) | 291 | 1,647 | — | 1,938 | 36 | 7/31/2013 | 2000 | |||||||||||||||||||||||||
| Jack in the Box |
Walker |
LA |
— | (14) | 543 | 1,196 | — | 1,739 | 33 | 6/27/2013 | 2001 | |||||||||||||||||||||||||
| Jack in the Box |
Sacramento |
CA |
— | 476 | 1,110 | — | 1,586 | 24 | 7/31/2013 | 1991 | ||||||||||||||||||||||||||
| Jack in the Box |
Texas City |
TX |
— | 454 | 844 | — | 1,298 | 23 | 6/27/2013 | 1991 | ||||||||||||||||||||||||||
| Jack in the Box |
Missouri City |
TX |
— | (14) | 451 | 837 | — | 1,288 | 18 | 7/31/2013 | 1991 | |||||||||||||||||||||||||
| Johnny Carino’s |
Houston |
TX |
— | (14) | 1,328 | 2,656 | — | 3,984 | 76 | 6/27/2013 | 2002 | |||||||||||||||||||||||||
| Johnny Carino’s |
Rogers |
AR |
— | (14) | 997 | 2,540 | — | 3,537 | 73 | 6/27/2013 | 2001 | |||||||||||||||||||||||||
| Johnny Carino’s |
Midland |
TX |
— | (14) | 998 | 2,329 | — | 3,327 | 58 | 7/31/2013 | 2000 | |||||||||||||||||||||||||
| Johnny Carino’s |
Grand Prairie |
TX |
— | (14) | 997 | 2,327 | — | 3,324 | 58 | 7/31/2013 | 2001 | |||||||||||||||||||||||||
| Johnny Carino’s |
Amarillo |
TX |
— | (14) | 993 | 2,317 | — | 3,310 | 57 | 7/31/2013 | 2001 | |||||||||||||||||||||||||
| Johnny Carino’s |
San Angelo |
TX |
— | (14) | 769 | 2,306 | — | 3,075 | 57 | 7/31/2013 | 2005 | |||||||||||||||||||||||||
F-109
Table of Contents
| Initial Costs | ||||||||||||||||||||||||||||||||||||
| Property |
City |
State |
Encumbrances at December 31, 2013 |
Land | Buildings, Fixtures and Improvements |
Costs Capitalized Subsequent to Acquisition |
Gross Amount Carried at December 31, 2013 (10) (11) |
Accumulated Depreciation (12) (13) |
Date Acquired |
Date of Construction |
||||||||||||||||||||||||||
| Johnny Carino’s |
Muncie |
IN |
$ | — | $ | 540 | $ | 2,160 | $ | — | $ | 2,700 | $ | 41 | 8/30/2013 | 2003 | ||||||||||||||||||||
| Johnny Carino’s |
Columbus |
IN |
— | 809 | 1,888 | — | 2,697 | 36 | 8/30/2013 | 2004 | ||||||||||||||||||||||||||
| Kentucky Fried Chicken |
Matteson |
IL |
— | (14) | 399 | 2,259 | — | 2,658 | 50 | 7/31/2013 | 1973 | |||||||||||||||||||||||||
| Kentucky Fried Chicken |
Decatur |
IL |
— | (14) | 276 | 1,619 | — | 1,895 | 45 | 6/27/2013 | 2001 | |||||||||||||||||||||||||
| Kentucky Fried Chicken |
Homewood |
IL |
— | (14) | 660 | 1,541 | — | 2,201 | 34 | 7/31/2013 | 1992 | |||||||||||||||||||||||||
| Kentucky Fried Chicken |
Bloomington |
IL |
— | (14) | 576 | 1,466 | — | 2,042 | 41 | 6/27/2013 | 2004 | |||||||||||||||||||||||||
| Kentucky Fried Chicken |
Greenwood |
IN |
— | (14) | 339 | 1,405 | — | 1,744 | 39 | 6/27/2013 | 1976 | |||||||||||||||||||||||||
| Kentucky Fried Chicken |
Hazel Crest |
IL |
— | (14) | 153 | 1,376 | — | 1,529 | 30 | 7/31/2013 | 1982 | |||||||||||||||||||||||||
| Kentucky Fried Chicken |
Franklin |
IN |
— | (14) | 205 | 1,375 | — | 1,580 | 38 | 6/27/2013 | 1976 | |||||||||||||||||||||||||
| Kentucky Fried Chicken |
Lebanon |
IN |
— | (14) | 337 | 1,348 | — | 1,685 | 30 | 7/31/2013 | 1983 | |||||||||||||||||||||||||
| Kentucky Fried Chicken |
Springfield |
IL |
— | (14) | 212 | 1,203 | — | 1,415 | 26 | 7/31/2013 | 1987 | |||||||||||||||||||||||||
| Kentucky Fried Chicken |
Rockford |
IL |
— | (14) | 201 | 1,142 | — | 1,343 | 25 | 7/31/2013 | 1995 | |||||||||||||||||||||||||
| Kentucky Fried Chicken |
New Boston |
TX |
— | (14) | 125 | 1,127 | — | 1,252 | 25 | 7/31/2013 | 1995 | |||||||||||||||||||||||||
| Kentucky Fried Chicken |
Granite City |
IL |
— | (14) | 102 | 1,083 | — | 1,185 | 30 | 6/27/2013 | 1987 | |||||||||||||||||||||||||
| Kentucky Fried Chicken |
Crawfordsville |
IN |
— | (14) | 159 | 1,068 | — | 1,227 | 30 | 6/27/2013 | 1979 | |||||||||||||||||||||||||
| Kentucky Fried Chicken |
Springfield |
IL |
— | (14) | 267 | 1,068 | — | 1,335 | 23 | 7/31/2013 | 1987 | |||||||||||||||||||||||||
| Kentucky Fried Chicken |
Oak Forest |
IL |
— | (14) | 185 | 1,047 | — | 1,232 | 23 | 7/31/2013 | 1955 | |||||||||||||||||||||||||
| Kentucky Fried Chicken |
Green Bay |
WI |
— | (14) | 208 | 1,022 | — | 1,230 | 28 | 6/27/2013 | 1986 | |||||||||||||||||||||||||
| Kentucky Fried Chicken |
Mattoon |
IL |
— | (14) | 113 | 1,019 | — | 1,132 | 22 | 7/31/2013 | 1990 | |||||||||||||||||||||||||
| Kentucky Fried Chicken |
Milwaukee |
WI |
— | (14) | 197 | 975 | — | 1,172 | 27 | 6/27/2013 | 1991 | |||||||||||||||||||||||||
| Kentucky Fried Chicken |
Elmhurst |
IL |
— | (14) | 242 | 969 | — | 1,211 | 21 | 7/31/2013 | 1990 | |||||||||||||||||||||||||
| Kentucky Fried Chicken |
Westchester |
IL |
— | (14) | 238 | 952 | — | 1,190 | 21 | 7/31/2013 | 1973 | |||||||||||||||||||||||||
| Kentucky Fried Chicken |
Mount Pleasant |
TX |
— | (14) | 106 | 952 | — | 1,058 | 21 | 7/31/2013 | 1992 | |||||||||||||||||||||||||
| Kentucky Fried Chicken |
Dolton |
IL |
— | (14) | 167 | 946 | — | 1,113 | 21 | 7/31/2013 | 1975 | |||||||||||||||||||||||||
| Kentucky Fried Chicken |
Tipton |
IN |
— | (14) | 104 | 936 | — | 1,040 | 21 | 7/31/2013 | 1998 | |||||||||||||||||||||||||
| Kentucky Fried Chicken |
Crawfordsville |
IN |
— | (14) | 234 | 934 | — | 1,168 | 21 | 7/31/2013 | 1991 | |||||||||||||||||||||||||
| Kentucky Fried Chicken |
Milwaukee |
WI |
— | (14) | 138 | 924 | — | 1,062 | 26 | 6/27/2013 | 1992 | |||||||||||||||||||||||||
| Kentucky Fried Chicken |
Germantown |
WI |
— | (14) | 368 | 913 | — | 1,281 | 25 | 6/27/2013 | 1992 | |||||||||||||||||||||||||
| Kentucky Fried Chicken |
Lafayette |
IN |
— | (14) | 304 | 912 | — | 1,216 | 20 | 7/31/2013 | 1990 | |||||||||||||||||||||||||
F-110
Table of Contents
| Initial Costs | ||||||||||||||||||||||||||||||||||||
| Property |
City |
State |
Encumbrances at December 31, 2013 |
Land | Buildings, Fixtures and Improvements |
Costs Capitalized Subsequent to Acquisition |
Gross Amount Carried at December 31, 2013 (10) (11) |
Accumulated Depreciation (12) (13) |
Date Acquired |
Date of Construction |
||||||||||||||||||||||||||
| Kentucky Fried Chicken |
Frankfort |
IN |
$ | — | (14) | $ | 99 | $ | 893 | $ | — | $ | 992 | $ | 20 | 7/31/2013 | 1985 | |||||||||||||||||||
| Kentucky Fried Chicken |
Hartford City |
IN |
— | (14) | 99 | 889 | — | 988 | 20 | 7/31/2013 | 1978 | |||||||||||||||||||||||||
| Kentucky Fried Chicken |
Kokomo |
IN |
— | (14) | 199 | 798 | — | 997 | 18 | 7/31/2013 | 1993 | |||||||||||||||||||||||||
| Kentucky Fried Chicken |
Milwaukee |
WI |
— | (14) | 281 | 795 | — | 1,076 | 22 | 6/27/2013 | 1992 | |||||||||||||||||||||||||
| Kentucky Fried Chicken |
Milwaukee |
WI |
— | (14) | 396 | 773 | — | 1,169 | 21 | 6/27/2013 | 1991 | |||||||||||||||||||||||||
| Kentucky Fried Chicken |
Shreveport |
LA |
— | (14) | 616 | 753 | — | 1,369 | 17 | 7/31/2013 | 1995 | |||||||||||||||||||||||||
| Kentucky Fried Chicken |
Milwaukee |
WI |
— | (14) | 89 | 750 | — | 839 | 21 | 6/27/2013 | 1989 | |||||||||||||||||||||||||
| Kentucky Fried Chicken |
West Bend |
WI |
— | (14) | 185 | 705 | — | 890 | 20 | 6/27/2013 | 1972 | |||||||||||||||||||||||||
| Kentucky Fried Chicken |
South Milwaukee |
WI |
— | (14) | 197 | 695 | — | 892 | 19 | 6/27/2013 | 1993 | |||||||||||||||||||||||||
| Kentucky Fried Chicken |
Allison Park |
PA |
— | (14) | 246 | 683 | — | 929 | 19 | 6/27/2013 | 1978 | |||||||||||||||||||||||||
| Kentucky Fried Chicken |
Warren |
OH |
— | (14) | 426 | 640 | — | 1,066 | 14 | 7/31/2013 | 1987 | |||||||||||||||||||||||||
| Kentucky Fried Chicken |
Minden |
LA |
— | (14) | 274 | 639 | — | 913 | 14 | 7/31/2013 | 1995 | |||||||||||||||||||||||||
| Kentucky Fried Chicken |
Texarkana |
AR |
— | (14) | 111 | 630 | — | 741 | 14 | 7/31/2013 | 1980 | |||||||||||||||||||||||||
| Kentucky Fried Chicken |
Wauwatosa |
WI |
— | (14) | 135 | 615 | — | 750 | 17 | 6/27/2013 | 1992 | |||||||||||||||||||||||||
| Kentucky Fried Chicken |
Greenville |
TX |
— | 119 | 585 | — | 704 | 16 | 6/27/2013 | 1988 | ||||||||||||||||||||||||||
| Kentucky Fried Chicken |
Green Bay |
WI |
— | (14) | 470 | 574 | — | 1,044 | 13 | 7/31/2013 | 1986 | |||||||||||||||||||||||||
| Kentucky Fried Chicken |
Noblesville |
IN |
— | (14) | 363 | 545 | — | 908 | 12 | 7/31/2013 | 2005 | |||||||||||||||||||||||||
| Kentucky Fried Chicken |
Shreveport |
LA |
— | (14) | 352 | 528 | — | 880 | 12 | 7/31/2013 | 1998 | |||||||||||||||||||||||||
| Kentucky Fried Chicken |
Shreveport |
LA |
— | (14) | 427 | 522 | — | 949 | 11 | 7/31/2013 | 1997 | |||||||||||||||||||||||||
| Kentucky Fried Chicken |
Shreveport |
LA |
— | (14) | 343 | 514 | — | 857 | 11 | 7/31/2013 | 1995 | |||||||||||||||||||||||||
| Kentucky Fried Chicken |
New Kensington |
PA |
— | (14) | 324 | 487 | — | 811 | 11 | 7/31/2013 | 1967 | |||||||||||||||||||||||||
| Kentucky Fried Chicken |
Burnsville |
MN |
— | 267 | 267 | — | 534 | 6 | 7/31/2013 | 1988 | ||||||||||||||||||||||||||
| Kentucky Fried Chicken / A&W |
Charleston |
IL |
— | (14) | 282 | 1,514 | — | 1,796 | 42 | 6/27/2013 | 2003 | |||||||||||||||||||||||||
| Kentucky Fried Chicken / Taco Bell |
Canonsburg |
PA |
— | (14) | 176 | 1,586 | — | 1,762 | 35 | 7/31/2013 | 1996 | |||||||||||||||||||||||||
| Kentucky Fried Chicken / Taco Bell |
Dunkirk |
NY |
— | (14) | 800 | 978 | — | 1,778 | 21 | 7/31/2013 | 2000 | |||||||||||||||||||||||||
| Kentucky Fried Chicken / Taco Bell |
Geneva |
NY |
— | (14) | 569 | 695 | — | 1,264 | 15 | 7/31/2013 | 1999 | |||||||||||||||||||||||||
| Kettle Restaurant |
College Station |
TX |
— | 225 | 249 | — | 474 | 7 | 6/27/2013 | 1981 | ||||||||||||||||||||||||||
| Kettle Restaurant |
San Antonio |
TX |
— | 168 | 206 | — | 374 | 5 | 7/31/2013 | 1965 | ||||||||||||||||||||||||||
| Krystal |
Memphis |
TN |
— | (14) | 257 | 1,029 | — | 1,286 | 48 | 4/23/2013 | 1975 | |||||||||||||||||||||||||
| Krystal |
Huntsville |
AL |
— | (14) | 348 | 811 | — | 1,159 | 38 | 4/23/2013 | 1960 | |||||||||||||||||||||||||
| Krystal |
Memphis |
TN |
— | (14) | 181 | 723 | — | 904 | 34 | 4/23/2013 | 1972 | |||||||||||||||||||||||||
F-111
Table of Contents
| Initial Costs | ||||||||||||||||||||||||||||||||||||
| Property |
City |
State |
Encumbrances at December 31, 2013 |
Land | Buildings, Fixtures and Improvements |
Costs Capitalized Subsequent to Acquisition |
Gross Amount Carried at December 31, 2013 (10) (11) |
Accumulated Depreciation (12) (13) |
Date Acquired |
Date of Construction |
||||||||||||||||||||||||||
| Krystal |
Huntsville |
AL |
$ | — | $ | 305 | $ | 712 | $ | — | $ | 1,017 | $ | 29 | 6/10/2013 | 1985 | ||||||||||||||||||||
| Krystal |
Lawrenceburg |
TN |
— | (14) | 304 | 709 | — | 1,013 | 33 | 4/23/2013 | 1980 | |||||||||||||||||||||||||
| Krystal |
Murfreesboro |
TN |
— | (14) | 465 | 698 | — | 1,163 | 33 | 4/23/2013 | 2008 | |||||||||||||||||||||||||
| Krystal |
Valley |
AL |
— | (14) | 297 | 694 | — | 991 | 33 | 4/23/2013 | 1979 | |||||||||||||||||||||||||
| Krystal |
Chattanooga |
TN |
— | (14) | 440 | 659 | — | 1,099 | 31 | 4/23/2013 | 1983 | |||||||||||||||||||||||||
| Krystal |
Huntsville |
AL |
— | (14) | 352 | 654 | — | 1,006 | 31 | 4/23/2013 | 1971 | |||||||||||||||||||||||||
| Krystal |
Corinth |
MS |
— | (14) | 279 | 652 | — | 931 | 31 | 4/23/2013 | 2007 | |||||||||||||||||||||||||
| Krystal |
Montgomery |
AL |
— | (14) | 502 | 613 | — | 1,115 | 29 | 4/23/2013 | 1962 | |||||||||||||||||||||||||
| Krystal |
Montgomery |
AL |
— | (14) | 303 | 562 | — | 865 | 26 | 4/23/2013 | 1962 | |||||||||||||||||||||||||
| Krystal |
Vestavia Hills |
AL |
— | (14) | 342 | 513 | — | 855 | 24 | 4/23/2013 | 1979 | |||||||||||||||||||||||||
| Kum & Go |
Gillette |
WY |
— | 878 | 2,048 | — | 2,926 | 58 | 6/28/2013 | 2013 | ||||||||||||||||||||||||||
| Lee’s Famous Recipe Chicken |
Saint Louis |
MO |
— | 107 | 874 | — | 981 | 24 | 6/27/2013 | 1984 | ||||||||||||||||||||||||||
| Lee’s Famous Recipe Chicken |
Saint Ann |
MO |
— | 187 | 571 | — | 758 | 16 | 6/27/2013 | 1984 | ||||||||||||||||||||||||||
| Lee’s Famous Recipe Chicken |
Florissant |
MO |
— | 306 | 560 | — | 866 | 16 | 6/27/2013 | 1984 | ||||||||||||||||||||||||||
| Logan’s Roadhouse |
Mt. Juliet |
TN |
— | (14) | 1,366 | 2,538 | — | 3,904 | 63 | 7/31/2013 | 2006 | |||||||||||||||||||||||||
| Logan’s Roadhouse |
Owasso |
OK |
— | (14) | 1,449 | 2,173 | — | 3,622 | 54 | 7/31/2013 | 2006 | |||||||||||||||||||||||||
| Long John Silver’s |
Marion |
IL |
— | (14) | 305 | 1,059 | — | 1,364 | 29 | 6/27/2013 | 1983 | |||||||||||||||||||||||||
| Long John Silver’s |
Litchfield |
IL |
— | (14) | 194 | 996 | — | 1,190 | 28 | 6/27/2013 | 1986 | |||||||||||||||||||||||||
| Long John Silver’s |
West Frankfort |
IL |
— | (14) | 244 | 996 | — | 1,240 | 28 | 6/27/2013 | 1976 | |||||||||||||||||||||||||
| Long John Silver’s |
Collinsville |
IL |
— | (14) | 220 | 940 | — | 1,160 | 26 | 6/27/2013 | 2006 | |||||||||||||||||||||||||
| Long John Silver’s |
Merced |
CA |
— | (14) | 174 | 695 | — | 869 | 15 | 7/31/2013 | 1982 | |||||||||||||||||||||||||
| Long John Silver’s |
Asheville |
NC |
— | (14) | 586 | 693 | — | 1,279 | 19 | 6/27/2013 | 1992 | |||||||||||||||||||||||||
| Long John Silver’s |
Albuquerque |
NM |
— | 227 | 680 | — | 907 | 15 | 7/31/2013 | 1975 | ||||||||||||||||||||||||||
| Long John Silver’s |
Penn Hills |
PA |
— | 438 | 656 | — | 1,094 | 14 | 7/31/2013 | 1993 | ||||||||||||||||||||||||||
| Long John Silver’s |
Hays |
KS |
— | (14) | 160 | 624 | — | 784 | 17 | 6/27/2013 | 1994 | |||||||||||||||||||||||||
| Long John Silver’s |
Las Cruces |
NM |
— | (14) | 242 | 565 | — | 807 | 12 | 7/31/2013 | 1975 | |||||||||||||||||||||||||
| Long John Silver’s |
Arlington |
TX |
— | 365 | 537 | — | 902 | 15 | 6/27/2013 | 1993 | ||||||||||||||||||||||||||
| Long John Silver’s |
Garden City |
KS |
— | (14) | 120 | 530 | — | 650 | 15 | 6/27/2013 | 1978 | |||||||||||||||||||||||||
| Long John Silver’s |
Fairview Heights |
IL |
— | (14) | 258 | 525 | — | 783 | 15 | 6/27/2013 | 1976 | |||||||||||||||||||||||||
| Long John Silver’s |
Mount Carmel |
IL |
— | (14) | 105 | 484 | — | 589 | 13 | 6/27/2013 | 1977 | |||||||||||||||||||||||||
| Long John Silver’s |
Vandalia |
IL |
— | (14) | 101 | 484 | — | 585 | 13 | 6/27/2013 | 1976 | |||||||||||||||||||||||||
| Long John Silver’s |
Jacksonville |
IL |
— | (14) | 171 | 431 | — | 602 | 12 | 6/27/2013 | 1978 | |||||||||||||||||||||||||
| Long John Silver’s |
Cleburne |
TX |
— | 205 | 380 | — | 585 | 8 | 7/31/2013 | 1986 | ||||||||||||||||||||||||||
| Long John Silver’s |
Clarksville |
TN |
— | 339 | 339 | — | 678 | 7 | 7/31/2013 | 1993 | ||||||||||||||||||||||||||
| Long John Silver’s |
Jackson |
TN |
— | (14) | 264 | 323 | — | 587 | 7 | 7/31/2013 | 1995 | |||||||||||||||||||||||||
| Long John Silver’s |
Wood River |
IL |
— | (14) | 251 | 314 | — | 565 | 9 | 6/27/2013 | 1975 | |||||||||||||||||||||||||
| Long John Silver’s |
Fairborn |
OH |
— | (14) | 103 | 300 | — | 403 | 8 | 6/27/2013 | 1976 | |||||||||||||||||||||||||
| Long John Silver’s |
Englewood |
OH |
— | (14) | 547 | — | — | 547 | — | 6/27/2013 | 1974 | |||||||||||||||||||||||||
| Long John Silver’s / A&W |
Kansas City |
MO |
— | 389 | 722 | — | 1,111 | 16 | 7/31/2013 | 1995 | ||||||||||||||||||||||||||
| Long John Silver’s / A&W |
Houston |
TX |
— | 480 | 495 | — | 975 | 14 | 6/27/2013 | 1993 | ||||||||||||||||||||||||||
| Long John Silver’s / A&W |
Austin |
TX |
— | (14) | 459 | 477 | — | 936 | 13 | 6/27/2013 | 1993 | |||||||||||||||||||||||||
| Long John Silver’s / A&W |
Murfreesboro |
TN |
— | 219 | 219 | — | 438 | 5 | 7/31/2013 | 1985 | ||||||||||||||||||||||||||
| Long John Silver’s / KFC |
Green Bay |
WI |
— | (14) | 748 | 563 | — | 1,311 | 16 | 6/27/2013 | 1978 | |||||||||||||||||||||||||
| Los Tios Mexican Restaurant |
Dalton |
OH |
— | (14) | 18 | 30 | — | 48 | 1 | 6/27/2013 | 1990 | |||||||||||||||||||||||||
| Lowe’s |
Windham |
ME |
— | (14) | 12,640 | — | — | 12,640 | — | 6/3/2013 | 2006 | |||||||||||||||||||||||||
| Mattress Firm |
Evansville |
IN |
— | (14) | 117 | 2,227 | — | 2,344 | 115 | 2/11/2013 | 2012 | |||||||||||||||||||||||||
| Mattress Firm |
Spokane |
WA |
— | (14) | 409 | 1,685 | — | 2,094 | 72 | 4/4/2013 | 2013 | |||||||||||||||||||||||||
| Mattress Firm |
Spokane |
WA |
— | (14) | 511 | 1,582 | — | 2,093 | 68 | 3/28/2013 | 2013 | |||||||||||||||||||||||||
F-112
Table of Contents
| Initial Costs | ||||||||||||||||||||||||||||||||||||
| Property |
City |
State |
Encumbrances at December 31, 2013 |
Land | Buildings, Fixtures and Improvements |
Costs Capitalized Subsequent to Acquisition |
Gross Amount Carried at December 31, 2013 (10) (11) |
Accumulated Depreciation (12) (13) |
Date Acquired |
Date of Construction |
||||||||||||||||||||||||||
| Mattress Firm |
Mishawaka |
IN |
$ | — | $ | 375 | $ | 1,500 | $ | — | $ | 1,875 | $ | 35 | 7/30/2013 | 2013 | ||||||||||||||||||||
| Mattress Firm |
Tallahassee |
FL |
— | (14) | 924 | 1,386 | — | 2,310 | 52 | 5/14/2013 | 2013 | |||||||||||||||||||||||||
| Mattress Firm |
Bountiful |
UT |
— | (14) | 736 | 1,367 | — | 2,103 | 77 | 12/31/2012 | 2012 | |||||||||||||||||||||||||
| Mattress Firm |
Destin |
FL |
— | 693 | 1,287 | — | 1,980 | 42 | 6/5/2013 | 2013 | ||||||||||||||||||||||||||
| Mattress Firm |
Rogers |
AR |
— | (14) | 321 | 1,284 | — | 1,605 | 66 | 2/6/2013 | 2012 | |||||||||||||||||||||||||
| Mattress Firm |
Wilmington |
NC |
— | 412 | 1,257 | — | 1,669 | 53 | 3/29/2013 | 2013 | ||||||||||||||||||||||||||
| Mattress Firm |
Lafayette |
LA |
— | (14) | — | 1,251 | — | 1,251 | 47 | 5/2/2013 | 2013 | |||||||||||||||||||||||||
| Mattress Firm |
Daphne |
AL |
— | 528 | 1,233 | — | 1,761 | 17 | 10/1/2013 | 2013 | ||||||||||||||||||||||||||
| Mattress Firm |
Dothan |
AL |
— | (14) | 406 | 1,217 | — | 1,623 | 46 | 5/14/2013 | 2013 | |||||||||||||||||||||||||
| Mattress Firm |
Knoxville |
TN |
— | (14) | 586 | 1,088 | — | 1,674 | 46 | 3/19/2013 | 2012 | |||||||||||||||||||||||||
| Mattress Firm |
Greenville |
NC |
— | (14) | 1,085 | 1,085 | — | 2,170 | 66 | 12/12/2012 | 2012 | |||||||||||||||||||||||||
| Mattress Firm |
Bowling Green |
KY |
— | (14) | 648 | 973 | — | 1,621 | 36 | 4/25/2013 | 2012 | |||||||||||||||||||||||||
| McDonald’s |
Scotland Neck |
NC |
— | (14) | 320 | — | — | 320 | — | 6/27/2013 | N/A | |||||||||||||||||||||||||
| Mezcal Mexican Restaurant |
Grafton |
OH |
— | 64 | 191 | — | 255 | 5 | 7/31/2013 | 1990 | ||||||||||||||||||||||||||
| Monro Muffler |
Lewiston |
ME |
— | (14) | 279 | 1,115 | — | 1,394 | 43 | 5/10/2013 | 1976 | |||||||||||||||||||||||||
| Monterey’s Tex Mex |
Tulsa |
OK |
— | 135 | 406 | — | 541 | 10 | 7/31/2013 | 2001 | ||||||||||||||||||||||||||
| Native New Yorker |
Glendale |
AZ |
— | (14) | 254 | 420 | — | 674 | 12 | 6/27/2013 | 1998 | |||||||||||||||||||||||||
| O’Charley’s |
Dalton |
GA |
— | (14) | 406 | 1,817 | — | 2,223 | 52 | 6/27/2013 | 1993 | |||||||||||||||||||||||||
| O’Charley’s |
Tucker |
GA |
— | (14) | 1,037 | 866 | — | 1,903 | 25 | 6/27/2013 | 1993 | |||||||||||||||||||||||||
| Parking Lot |
Kingston |
PA |
— | (14) | 29 | — | — | 29 | — | 6/27/2013 | N/A | |||||||||||||||||||||||||
| Pizza Hut |
Chester |
VA |
— | (14) | 473 | 1,104 | — | 1,577 | 24 | 7/31/2013 | 1983 | |||||||||||||||||||||||||
| Pizza Hut |
Ashland |
VA |
— | (14) | 589 | 1,093 | — | 1,682 | 24 | 7/31/2013 | 1989 | |||||||||||||||||||||||||
| Pizza Hut |
Amarillo |
TX |
— | (14) | 339 | 1,016 | — | 1,355 | 22 | 7/31/2013 | 1976 | |||||||||||||||||||||||||
| Pizza Hut |
Amarillo |
TX |
— | (14) | 254 | 1,015 | — | 1,269 | 22 | 7/31/2013 | 1980 | |||||||||||||||||||||||||
| Pizza Hut |
Fort Stockton |
TX |
— | (14) | 252 | 1,007 | — | 1,259 | 22 | 7/31/2013 | 2008 | |||||||||||||||||||||||||
| Pizza Hut |
Christiansburg |
VA |
— | (14) | 494 | 918 | — | 1,412 | 20 | 7/31/2013 | 1982 | |||||||||||||||||||||||||
| Pizza Hut |
Odessa |
TX |
— | (14) | 588 | 882 | — | 1,470 | 19 | 7/31/2013 | 1972 | |||||||||||||||||||||||||
| Pizza Hut |
Hopewell |
VA |
— | (14) | 707 | 864 | — | 1,571 | 19 | 7/31/2013 | 1985 | |||||||||||||||||||||||||
| Pizza Hut |
Clifton Forge |
VA |
— | (14) | 287 | 861 | — | 1,148 | 19 | 7/31/2013 | 1978 | |||||||||||||||||||||||||
| Pizza Hut |
Odessa |
TX |
— | (14) | 456 | 847 | — | 1,303 | 19 | 7/31/2013 | 1976 | |||||||||||||||||||||||||
| Pizza Hut |
Richmond |
VA |
— | (14) | 666 | 814 | — | 1,480 | 18 | 7/31/2013 | 1978 | |||||||||||||||||||||||||
| Pizza Hut |
Odessa |
TX |
— | (14) | 627 | 766 | — | 1,393 | 17 | 7/31/2013 | 1979 | |||||||||||||||||||||||||
| Pizza Hut |
JACKSON |
GA |
— | (14) | 673 | 735 | — | 1,408 | 20 | 6/27/2013 | 1987 | |||||||||||||||||||||||||
| Pizza Hut |
Salisbury |
MD |
— | (14) | 245 | 734 | — | 979 | 16 | 7/31/2013 | 1983 | |||||||||||||||||||||||||
| Pizza Hut |
Delaware |
OH |
— | (14) | 270 | 721 | — | 991 | 20 | 6/27/2013 | 1975 | |||||||||||||||||||||||||
| Pizza Hut |
Pecos |
TX |
— | (14) | 387 | 719 | — | 1,106 | 16 | 7/31/2013 | 1974 | |||||||||||||||||||||||||
| Pizza Hut |
Petersburg |
VA |
— | (14) | 378 | 701 | — | 1,079 | 15 | 7/31/2013 | 1979 | |||||||||||||||||||||||||
| Pizza Hut |
Odessa |
TX |
— | (14) | 457 | 685 | — | 1,142 | 15 | 7/31/2013 | 1976 | |||||||||||||||||||||||||
| Pizza Hut |
Monahans |
TX |
— | (14) | 361 | 671 | — | 1,032 | 15 | 7/31/2013 | 1979 | |||||||||||||||||||||||||
| Pizza Hut |
Bedford |
VA |
— | (14) | 548 | 670 | — | 1,218 | 15 | 7/31/2013 | 1977 | |||||||||||||||||||||||||
| Pizza Hut |
San Angelo |
TX |
— | (14) | 214 | 641 | — | 855 | 14 | 7/31/2013 | 1977 | |||||||||||||||||||||||||
| Pizza Hut |
San Angelo |
TX |
— | (14) | 268 | 624 | — | 892 | 14 | 7/31/2013 | 1980 | |||||||||||||||||||||||||
| Pizza Hut |
Midland |
TX |
— | (14) | 506 | 619 | — | 1,125 | 14 | 7/31/2013 | 1978 | |||||||||||||||||||||||||
| Pizza Hut |
Downers Grove |
IL |
— | 504 | 616 | — | 1,120 | 14 | 7/31/2013 | 1985 | ||||||||||||||||||||||||||
| Pizza Hut |
Detroit |
MI |
— | 501 | 612 | — | 1,113 | 13 | 7/31/2013 | 1984 | ||||||||||||||||||||||||||
| Pizza Hut |
Newport News |
VA |
— | (14) | 394 | 591 | — | 985 | 13 | 7/31/2013 | 1969 | |||||||||||||||||||||||||
| Pizza Hut |
Newport News |
VA |
— | (14) | 394 | 591 | — | 985 | 13 | 7/31/2013 | 1970 | |||||||||||||||||||||||||
| Pizza Hut |
Columbia |
SC |
— | (14) | 881 | 588 | — | 1,469 | 13 | 7/31/2013 | 1977 | |||||||||||||||||||||||||
| Pizza Hut |
Odessa |
TX |
— | (14) | 572 | 572 | — | 1,144 | 13 | 7/31/2013 | 1976 | |||||||||||||||||||||||||
| Pizza Hut |
Tyler |
TX |
— | 238 | 555 | — | 793 | 15 | 6/27/2013 | 1981 | ||||||||||||||||||||||||||
| Pizza Hut |
San Angelo |
TX |
— | (14) | 237 | 552 | — | 789 | 12 | 7/31/2013 | 1975 | |||||||||||||||||||||||||
| Pizza Hut |
Dearborn |
MI |
— | 284 | 528 | — | 812 | 12 | 7/31/2013 | 1977 | ||||||||||||||||||||||||||
| Pizza Hut |
Aurora |
IL |
— | (14) | 281 | 522 | — | 803 | 11 | 7/31/2013 | 1986 | |||||||||||||||||||||||||
| Pizza Hut |
Cheraw |
SC |
— | (14) | 415 | 507 | — | 922 | 11 | 7/31/2013 | 1984 | |||||||||||||||||||||||||
| Pizza Hut |
Midland |
TX |
— | (14) | 414 | 506 | — | 920 | 11 | 7/31/2013 | 1975 | |||||||||||||||||||||||||
| Pizza Hut |
Louisville |
KY |
— | (14) | 539 | 499 | — | 1,038 | 14 | 6/27/2013 | 1975 | |||||||||||||||||||||||||
F-113
Table of Contents
| Initial Costs | ||||||||||||||||||||||||||||||||||||
| Property |
City |
State |
Encumbrances at December 31, 2013 |
Land | Buildings, Fixtures and Improvements |
Costs Capitalized Subsequent to Acquisition |
Gross Amount Carried at December 31, 2013 (10) (11) |
Accumulated Depreciation (12) (13) |
Date Acquired |
Date of Construction |
||||||||||||||||||||||||||
| Pizza Hut |
Batesburg |
SC |
$ | — | (14) | $ | 261 | $ | 484 | $ | — | $ | 745 | $ | 11 | 7/31/2013 | 1987 | |||||||||||||||||||
| Pizza Hut |
Greensboro |
GA |
— | (14) | 569 | 465 | — | 1,034 | 10 | 7/31/2013 | 1989 | |||||||||||||||||||||||||
| Pizza Hut |
Crystal City |
TX |
— | (14) | 148 | 453 | — | 601 | 13 | 6/27/2013 | 1981 | |||||||||||||||||||||||||
| Pizza Hut |
Abilene |
TX |
— | (14) | 549 | 449 | — | 998 | 10 | 7/31/2013 | 1980 | |||||||||||||||||||||||||
| Pizza Hut |
Sweetwater |
TX |
— | 77 | 435 | — | 512 | 10 | 7/31/2013 | 1975 | ||||||||||||||||||||||||||
| Pizza Hut |
Detroit |
MI |
— | 105 | 421 | — | 526 | 9 | 7/31/2013 | 1986 | ||||||||||||||||||||||||||
| Pizza Hut |
Pageland |
SC |
— | (14) | 344 | 420 | — | 764 | 9 | 7/31/2013 | 1999 | |||||||||||||||||||||||||
| Pizza Hut |
West Columbia |
SC |
— | (14) | 507 | 415 | — | 922 | 9 | 7/31/2013 | 1980 | |||||||||||||||||||||||||
| Pizza Hut |
Edgefield |
SC |
— | (14) | 221 | 410 | — | 631 | 9 | 7/31/2013 | 1986 | |||||||||||||||||||||||||
| Pizza Hut |
Coleman |
TX |
— | 69 | 391 | — | 460 | 9 | 7/31/2013 | 1975 | ||||||||||||||||||||||||||
| Pizza Hut |
Stevens Point |
WI |
— | 130 | 390 | — | 520 | 9 | 7/31/2013 | 1989 | ||||||||||||||||||||||||||
| Pizza Hut |
Laurens |
SC |
— | (14) | 454 | 371 | — | 825 | 8 | 7/31/2013 | 1989 | |||||||||||||||||||||||||
| Pizza Hut |
Elmira |
NY |
— | 199 | 370 | — | 569 | 8 | 7/31/2013 | 1975 | ||||||||||||||||||||||||||
| Pizza Hut |
Wellsville |
NY |
— | 123 | 368 | — | 491 | 8 | 7/31/2013 | 1978 | ||||||||||||||||||||||||||
| Pizza Hut |
Ann Arbor |
MI |
— | 119 | 367 | — | 486 | 10 | 6/27/2013 | 1991 | ||||||||||||||||||||||||||
| Pizza Hut |
Bishopville |
SC |
— | (14) | 365 | 365 | — | 730 | 8 | 7/31/2013 | 1987 | |||||||||||||||||||||||||
| Pizza Hut |
Cedar City |
UT |
— | 52 | 361 | — | 413 | 10 | 6/27/2013 | 1978 | ||||||||||||||||||||||||||
| Pizza Hut |
Eatonton |
GA |
— | (14) | 353 | 353 | — | 706 | 8 | 7/31/2013 | 1988 | |||||||||||||||||||||||||
| Pizza Hut |
Saluda |
SC |
— | (14) | 346 | 346 | — | 692 | 8 | 7/31/2013 | 1995 | |||||||||||||||||||||||||
| Pizza Hut |
Hampton |
VA |
— | (14) | 641 | 345 | — | 986 | 8 | 7/31/2013 | 1977 | |||||||||||||||||||||||||
| Pizza Hut |
Merrill |
WI |
— | 83 | 331 | — | 414 | 7 | 7/31/2013 | 1980 | ||||||||||||||||||||||||||
| Pizza Hut |
Red Bank |
TN |
— | (14) | 215 | 323 | — | 538 | 7 | 7/31/2013 | 1975 | |||||||||||||||||||||||||
| Pizza Hut |
Colonial Heights |
VA |
— | (14) | 311 | 311 | — | 622 | 7 | 7/31/2013 | 1991 | |||||||||||||||||||||||||
| Pizza Hut |
Richmond |
VA |
— | (14) | 311 | 311 | — | 622 | 7 | 7/31/2013 | 1991 | |||||||||||||||||||||||||
| Pizza Hut |
Seminole |
TX |
— | 53 | 301 | — | 354 | 7 | 7/31/2013 | 1977 | ||||||||||||||||||||||||||
| Pizza Hut |
Tucker |
GA |
— | 192 | 288 | — | 480 | 6 | 7/31/2013 | 1974 | ||||||||||||||||||||||||||
| Pizza Hut |
Front Royal |
VA |
— | (14) | 191 | 287 | — | 478 | 6 | 7/31/2013 | 1973 | |||||||||||||||||||||||||
| Pizza Hut |
Mobile |
AL |
— | 127 | 276 | — | 403 | 8 | 6/27/2013 | 1974 | ||||||||||||||||||||||||||
| Pizza Hut |
Dawson |
GA |
— | 131 | 274 | — | 405 | 8 | 6/27/2013 | 1987 | ||||||||||||||||||||||||||
| Pizza Hut |
Lafayette |
LA |
— | 68 | 271 | — | 339 | 8 | 6/27/2013 | 1990 | ||||||||||||||||||||||||||
| Pizza Hut |
Oklahoma City |
OK |
— | (14) | 268 | 268 | — | 536 | 6 | 7/31/2013 | 1984 | |||||||||||||||||||||||||
| Pizza Hut |
Page |
AZ |
— | 66 | 263 | — | 329 | 6 | 7/31/2013 | 1977 | ||||||||||||||||||||||||||
| Pizza Hut |
Bowling Green |
OH |
— | 141 | 262 | — | 403 | 6 | 7/31/2013 | 1979 | ||||||||||||||||||||||||||
| Pizza Hut |
Antigo |
WI |
— | 45 | 252 | — | 297 | 6 | 7/31/2013 | 1997 | ||||||||||||||||||||||||||
| Pizza Hut |
Santee |
SC |
— | (14) | 371 | 248 | — | 619 | 5 | 7/31/2013 | 1972 | |||||||||||||||||||||||||
| Pizza Hut |
Saint George |
SC |
— | (14) | 367 | 245 | — | 612 | 5 | 7/31/2013 | 1980 | |||||||||||||||||||||||||
| Pizza Hut |
Ashburn |
GA |
— | 102 | 233 | — | 335 | 6 | 6/27/2013 | 1988 | ||||||||||||||||||||||||||
| Pizza Hut |
Box Elder |
SD |
— | (14) | 68 | 217 | — | 285 | 6 | 6/27/2013 | 1985 | |||||||||||||||||||||||||
| Pizza Hut |
Shamokin |
PA |
— | 54 | 217 | — | 271 | 5 | 7/31/2013 | 1976 | ||||||||||||||||||||||||||
| Pizza Hut |
Kanab |
UT |
— | 52 | 210 | — | 262 | 5 | 7/31/2013 | 1989 | ||||||||||||||||||||||||||
| Pizza Hut |
Hayward |
WI |
— | 51 | 205 | — | 256 | 5 | 7/31/2013 | 1993 | ||||||||||||||||||||||||||
| Pizza Hut |
Plover |
WI |
— | 85 | 199 | — | 284 | 4 | 7/31/2013 | 1994 | ||||||||||||||||||||||||||
| Pizza Hut |
Defiance |
OH |
— | 114 | 197 | — | 311 | 5 | 6/27/2013 | 1977 | ||||||||||||||||||||||||||
| Pizza Hut |
Schofield |
WI |
— | 106 | 196 | — | 302 | 4 | 7/31/2013 | 1987 | ||||||||||||||||||||||||||
| Pizza Hut |
Monticello |
FL |
— | 115 | 195 | — | 310 | 5 | 6/27/2013 | 1987 | ||||||||||||||||||||||||||
| Pizza Hut |
Abbotsford |
WI |
— | 159 | 195 | — | 354 | 4 | 7/31/2013 | 1980 | ||||||||||||||||||||||||||
| Pizza Hut |
Marietta |
OH |
— | 104 | 193 | — | 297 | 4 | 7/31/2013 | 1986 | ||||||||||||||||||||||||||
| Pizza Hut |
Hurricane |
WV |
— | 126 | 188 | — | 314 | 4 | 7/31/2013 | 1978 | ||||||||||||||||||||||||||
| Pizza Hut |
East Syracuse |
NY |
— | 137 | 185 | — | 322 | 5 | 6/27/2013 | 1978 | ||||||||||||||||||||||||||
| Pizza Hut |
Cleveland |
OH |
— | 87 | 175 | — | 262 | 5 | 6/27/2013 | 1985 | ||||||||||||||||||||||||||
| Pizza Hut |
Toledo |
OH |
— | 58 | 173 | — | 231 | 5 | 6/27/2013 | 1978 | ||||||||||||||||||||||||||
| Pizza Hut |
Sandusky |
OH |
— | 140 | 171 | — | 311 | 4 | 7/31/2013 | 1982 | ||||||||||||||||||||||||||
| Pizza Hut |
Abilene |
TX |
— | (14) | 397 | 170 | — | 567 | 4 | 7/31/2013 | 1976 | |||||||||||||||||||||||||
| Pizza Hut |
Ronceverte |
WV |
— | 66 | 162 | — | 228 | 4 | 6/27/2013 | 1978 | ||||||||||||||||||||||||||
| Pizza Hut |
Eagle River |
WI |
— | 28 | 159 | — | 187 | 3 | 7/31/2013 | 1991 | ||||||||||||||||||||||||||
| Pizza Hut |
Middleburg Heights |
OH |
— | 128 | 156 | — | 284 | 3 | 7/31/2013 | 1985 | ||||||||||||||||||||||||||
| Pizza Hut |
North Olmsted |
OH |
— | 122 | 153 | — | 275 | 4 | 6/27/2013 | 1977 | ||||||||||||||||||||||||||
F-114
Table of Contents
| Initial Costs | ||||||||||||||||||||||||||||||||||||
| Property |
City |
State |
Encumbrances at December 31, 2013 |
Land | Buildings, Fixtures and Improvements |
Costs Capitalized Subsequent to Acquisition |
Gross Amount Carried at December 31, 2013 (10) (11) |
Accumulated Depreciation (12) (13) |
Date Acquired |
Date of Construction |
||||||||||||||||||||||||||
| Pizza Hut |
Cross Lanes |
WV |
$ | — | $ | 122 | $ | 149 | $ | — | $ | 271 | $ | 3 | 7/31/2013 | 1977 | ||||||||||||||||||||
| Pizza Hut |
Beckley |
WV |
— | 160 | 131 | — | 291 | 3 | 7/31/2013 | 1977 | ||||||||||||||||||||||||||
| Pizza Hut |
Stamford |
TX |
— | 38 | 115 | — | 153 | 3 | 7/31/2013 | 1970 | ||||||||||||||||||||||||||
| Pizza Hut |
Norwalk |
OH |
— | (14) | 77 | 115 | — | 192 | 3 | 7/31/2013 | 1977 | |||||||||||||||||||||||||
| Pizza Hut |
Ballinger |
TX |
— | 34 | 109 | — | 143 | 3 | 6/27/2013 | 1978 | ||||||||||||||||||||||||||
| Pizza Hut |
Strongsville |
OH |
— | 74 | 108 | — | 182 | 3 | 6/27/2013 | 1977 | ||||||||||||||||||||||||||
| Pizza Hut |
Neillsville |
WI |
— | 35 | 106 | — | 141 | 2 | 7/31/2013 | 1995 | ||||||||||||||||||||||||||
| Pizza Hut |
Milton |
WV |
— | 24 | 96 | — | 120 | 2 | 7/31/2013 | 1978 | ||||||||||||||||||||||||||
| Pizza Hut |
Waupaca |
WI |
— | 61 | 91 | — | 152 | 2 | 7/31/2013 | 1991 | ||||||||||||||||||||||||||
| Pizza Hut |
Tomahawk |
WI |
— | 35 | 81 | — | 116 | 2 | 7/31/2013 | 1986 | ||||||||||||||||||||||||||
| Pizza Hut |
Nedrow |
NY |
— | 55 | 80 | — | 135 | 2 | 6/27/2013 | 1979 | ||||||||||||||||||||||||||
| Pizza Hut |
Clintonville |
WI |
— | 208 | 69 | — | 277 | 2 | 7/31/2013 | 1978 | ||||||||||||||||||||||||||
| Pizza Hut |
Rochester |
NY |
— | 62 | 62 | — | 124 | 1 | 7/31/2013 | 1989 | ||||||||||||||||||||||||||
| Pizza Hut |
Lambertville |
MI |
— | 110 | 6 | — | 116 | — | 7/31/2013 | 1995 | ||||||||||||||||||||||||||
| Pizza Hut |
Huntington |
WV |
— | 190 | 4 | — | 194 | — | 7/31/2013 | 1979 | ||||||||||||||||||||||||||
| Pizza Hut |
Adrian |
MI |
— | 265 | — | — | 265 | — | 6/27/2013 | N/A | ||||||||||||||||||||||||||
| Pizza Hut |
Monroe |
MI |
— | 220 | — | — | 220 | — | 6/27/2013 | 1977 | ||||||||||||||||||||||||||
| Pizza Hut |
Bedford |
OH |
— | 183 | — | — | 183 | — | 6/27/2013 | N/A | ||||||||||||||||||||||||||
| Ponderosa |
Indiana |
PA |
— | 676 | 1,255 | — | 1,931 | 31 | 7/31/2013 | 2000 | ||||||||||||||||||||||||||
| Ponderosa |
Massena |
NY |
— | 190 | 570 | — | 760 | 14 | 7/31/2013 | 1988 | ||||||||||||||||||||||||||
| Ponderosa |
Scottsburg |
IN |
— | (14) | 430 | 141 | — | 571 | 4 | 6/27/2013 | 1985 | |||||||||||||||||||||||||
| Popeyes |
Marksville |
LA |
— | (14) | 487 | 1,129 | — | 1,616 | 31 | 6/27/2013 | 1987 | |||||||||||||||||||||||||
| Popeyes |
Tampa |
FL |
— | (14) | 673 | 1,065 | — | 1,738 | 30 | 6/27/2013 | 2000 | |||||||||||||||||||||||||
| Popeyes |
Winter Haven |
FL |
— | (14) | 484 | 1,001 | — | 1,485 | 28 | 6/27/2013 | 1976 | |||||||||||||||||||||||||
| Popeyes |
Greenville |
MS |
— | (14) | 513 | 977 | — | 1,490 | 27 | 6/27/2013 | 1984 | |||||||||||||||||||||||||
| Popeyes |
Brandon |
FL |
— | (14) | 776 | 961 | — | 1,737 | 27 | 6/27/2013 | 1978 | |||||||||||||||||||||||||
| Popeyes |
Jacksonville |
FL |
— | (14) | 781 | 955 | — | 1,736 | 21 | 7/31/2013 | 1955 | |||||||||||||||||||||||||
| Popeyes |
Orlando |
FL |
— | (14) | 782 | 955 | — | 1,737 | 21 | 7/31/2013 | 2004 | |||||||||||||||||||||||||
| Popeyes |
Lafayette |
LA |
— | (14) | 473 | 901 | — | 1,374 | 25 | 6/27/2013 | 1996 | |||||||||||||||||||||||||
| Popeyes |
Lafayette |
LA |
— | (14) | 434 | 899 | — | 1,333 | 25 | 6/27/2013 | 1993 | |||||||||||||||||||||||||
| Popeyes |
Eunice |
LA |
— | (14) | 382 | 891 | — | 1,273 | 20 | 7/31/2013 | 1986 | |||||||||||||||||||||||||
| Popeyes |
Orange |
TX |
— | (14) | 456 | 847 | — | 1,303 | 19 | 7/31/2013 | 2004 | |||||||||||||||||||||||||
| Popeyes |
Lakeland |
FL |
— | (14) | 830 | 830 | — | 1,660 | 18 | 7/31/2013 | 1999 | |||||||||||||||||||||||||
| Popeyes |
Bayou Vista |
LA |
— | (14) | 375 | 709 | — | 1,084 | 20 | 6/27/2013 | 1985 | |||||||||||||||||||||||||
| Popeyes |
Nederland |
TX |
— | (14) | 445 | 668 | — | 1,113 | 15 | 7/31/2013 | 1988 | |||||||||||||||||||||||||
| Popeyes |
Omaha |
NE |
— | (14) | 264 | 615 | — | 879 | 14 | 7/31/2013 | 1985 | |||||||||||||||||||||||||
| Popeyes |
Port Arthur |
TX |
— | (14) | 408 | 589 | — | 997 | 16 | 6/27/2013 | 1984 | |||||||||||||||||||||||||
| Popeyes |
Franklin |
LA |
— | (14) | 283 | 538 | — | 821 | 15 | 6/27/2013 | 1985 | |||||||||||||||||||||||||
| Popeyes |
Austin |
TX |
— | 1,216 | 533 | — | 1,749 | 15 | 6/27/2013 | 1996 | ||||||||||||||||||||||||||
| Popeyes |
Omaha |
NE |
— | (14) | 343 | 515 | — | 858 | 11 | 7/31/2013 | 1996 | |||||||||||||||||||||||||
| Popeyes |
Saint Louis |
MO |
— | (14) | 248 | 460 | — | 708 | 13 | 6/27/2013 | 1959 | |||||||||||||||||||||||||
| Popeyes |
Saint Louis |
MO |
— | (14) | 288 | 431 | — | 719 | 9 | 7/31/2013 | 1978 | |||||||||||||||||||||||||
| Popeyes |
Baton Rouge |
LA |
— | (14) | 323 | 394 | — | 717 | 9 | 7/31/2013 | 1999 | |||||||||||||||||||||||||
| Popeyes |
Ferguson |
MO |
— | (14) | 128 | 383 | — | 511 | 8 | 7/31/2013 | 1984 | |||||||||||||||||||||||||
| Popeyes |
Miami |
FL |
— | 220 | 330 | — | 550 | 7 | 7/31/2013 | 1962 | ||||||||||||||||||||||||||
| Popeyes |
Houston |
TX |
— | 295 | 241 | — | 536 | 5 | 7/31/2013 | 1976 | ||||||||||||||||||||||||||
| Popeyes |
Portsmouth |
VA |
— | (14) | 369 | 230 | — | 599 | 6 | 6/27/2013 | 2002 | |||||||||||||||||||||||||
| Popeyes |
Houston |
TX |
— | 278 | 227 | — | 505 | 5 | 7/31/2013 | 1978 | ||||||||||||||||||||||||||
| Popeyes |
Newport News |
VA |
— | (14) | 381 | 217 | — | 598 | 6 | 6/27/2013 | 2002 | |||||||||||||||||||||||||
| Popeyes |
Houston |
TX |
— | 111 | 166 | — | 277 | 4 | 7/31/2013 | 1976 | ||||||||||||||||||||||||||
| Quincy’s Family Steakhouse |
Monroe |
NC |
— | 560 | 458 | — | 1,018 | 11 | 7/31/2013 | 1978 | ||||||||||||||||||||||||||
| Rally’s |
Indianapolis |
IN |
— | (14) | 1,168 | — | — | 1,168 | — | 7/31/2013 | N/A | |||||||||||||||||||||||||
| Rally’s |
Indianapolis |
IN |
— | (14) | 1,168 | — | — | 1,168 | — | 7/31/2013 | N/A | |||||||||||||||||||||||||
| Rancho Grande Grill |
Andalusia |
AL |
— | 94 | 251 | — | 345 | 7 | 6/27/2013 | 2004 | ||||||||||||||||||||||||||
| Rite Aid |
Burton |
MI |
— | 128 | 2,541 | — | 2,669 | 63 | 7/26/2013 | 1999 | ||||||||||||||||||||||||||
| Rite Aid |
Wilson |
NC |
— | 573 | 1,337 | — | 1,910 | 33 | 7/30/2013 | 2002 | ||||||||||||||||||||||||||
F-115
Table of Contents
| Initial Costs | ||||||||||||||||||||||||||||||||||||
| Property |
City |
State |
Encumbrances at December 31, 2013 |
Land | Buildings, Fixtures and Improvements |
Costs Capitalized Subsequent to Acquisition |
Gross Amount Carried at December 31, 2013 (10) (11) |
Accumulated Depreciation (12) (13) |
Date Acquired |
Date of Construction |
||||||||||||||||||||||||||
| Rite Aid |
Adams |
MA |
$ | — | $ | 300 | $ | 1,200 | $ | — | $ | 1,500 | $ | 30 | 7/30/2013 | 2000 | ||||||||||||||||||||
| Rolls-Royce Corporation |
Indianapolis |
IN |
— | (14) | 5,770 | 64,063 | — | 69,833 | 2,100 | 5/9/2013 | 2000 | |||||||||||||||||||||||||
| Rubbermaid |
Brimfield |
OH |
— | (14) | 1,552 | 29,485 | — | 31,037 | 1,650 | 1/31/2013 | 2012 | |||||||||||||||||||||||||
| Rubbermaid |
Bowling Green |
OH |
— | 714 | 13,560 | — | 14,274 | 345 | 7/29/2013 | 2013 | ||||||||||||||||||||||||||
| Saltwater Willy’s |
Grapevine |
TX |
— | (14) | 572 | 868 | — | 1,440 | 25 | 6/27/2013 | 1999 | |||||||||||||||||||||||||
| Schlotzsky’s Deli |
Colorado Springs |
CO |
— | (14) | 530 | 530 | — | 1,060 | 15 | 6/27/2013 | 1997 | |||||||||||||||||||||||||
| Schlotzsky’s Deli |
Louisville |
KY |
— | (14) | 321 | 342 | — | 663 | 9 | 6/27/2013 | 1998 | |||||||||||||||||||||||||
| Senor Panchos |
Orrville |
OH |
— | (14) | 99 | 176 | — | 275 | 5 | 6/27/2013 | 1990 | |||||||||||||||||||||||||
| Shoney’s |
Grenada |
MS |
— | 270 | 809 | — | 1,079 | 18 | 7/31/2013 | 1991 | ||||||||||||||||||||||||||
| Shoney’s |
Columbia |
SC |
— | (14) | 446 | 545 | — | 991 | 12 | 7/31/2013 | 1985 | |||||||||||||||||||||||||
| Shoney’s |
West Columbia |
SC |
— | (14) | 392 | 262 | — | 654 | 6 | 7/31/2013 | 1977 | |||||||||||||||||||||||||
| Snowflake Donut Shop |
Gun Barrel City |
TX |
— | 241 | 383 | — | 624 | 11 | 6/27/2013 | 2008 | ||||||||||||||||||||||||||
| Sonic Drive-In |
Crystal River |
FL |
— | (14) | 107 | 322 | — | 429 | 7 | 7/31/2013 | 2008 | |||||||||||||||||||||||||
| Sonic Drive-In |
Mulberry |
FL |
— | (14) | 165 | 298 | — | 463 | 8 | 6/27/2013 | 2004 | |||||||||||||||||||||||||
| Sonic Drive-In |
Wadesboro |
NC |
— | (14) | 137 | 266 | — | 403 | 7 | 6/27/2013 | 2007 | |||||||||||||||||||||||||
| Sonic Drive-In |
Spring Hill |
FL |
— | (14) | 79 | 252 | — | 331 | 7 | 6/27/2013 | 2003 | |||||||||||||||||||||||||
| Sonny’s BBQ |
Venice |
FL |
— | (14) | 338 | 507 | — | 845 | 13 | 7/31/2013 | 1978 | |||||||||||||||||||||||||
| Sports Wings |
Sumter |
SC |
— | (14) | 73 | 109 | — | 182 | 2 | 7/31/2013 | 1988 | |||||||||||||||||||||||||
| Stripes Gas & Convenience |
Rio Hondo |
TX |
— | (14) | 293 | 2,640 | — | 2,933 | 136 | 2/15/2013 | 2008 | |||||||||||||||||||||||||
| Stripes Gas & Convenience |
Pharr |
TX |
— | (14) | 281 | 2,531 | — | 2,812 | 130 | 2/15/2013 | 1995 | |||||||||||||||||||||||||
| Stripes Gas & Convenience |
Andrews |
TX |
— | (14) | 406 | 2,302 | — | 2,708 | 119 | 2/15/2013 | 2008 | |||||||||||||||||||||||||
| Stripes Gas & Convenience |
La Feria |
TX |
— | (14) | 219 | 1,970 | — | 2,189 | 101 | 2/15/2013 | 2008 | |||||||||||||||||||||||||
| Sun Trust Bank |
Waldorf |
MD |
— | (14) | 523 | 2,962 | — | 3,485 | 119 | 3/22/2013 | 1964 | |||||||||||||||||||||||||
| Sun Trust Bank |
Mocksville |
NC |
— | (14) | 978 | 2,933 | — | 3,911 | 118 | 3/22/2013 | 2000 | |||||||||||||||||||||||||
| Sun Trust Bank |
Annapolis |
MD |
— | 2,653 | 2,170 | — | 4,823 | 48 | 7/23/2013 | 1976 | ||||||||||||||||||||||||||
| Sun Trust Bank |
Richmond |
VA |
— | (14) | 224 | 2,012 | — | 2,236 | 81 | 4/12/2013 | 1909 | |||||||||||||||||||||||||
| Sun Trust Bank |
Tallahassee |
FL |
— | (14) | 828 | 1,933 | — | 2,761 | 78 | 4/12/2013 | 1991 | |||||||||||||||||||||||||
| Sun Trust Bank |
Dunedin |
FL |
— | (14) | 479 | 1,917 | — | 2,396 | 77 | 3/22/2013 | 1995 | |||||||||||||||||||||||||
| Sun Trust Bank |
Monroe |
NC |
— | (14) | 204 | 1,837 | — | 2,041 | 74 | 4/12/2013 | 1920 | |||||||||||||||||||||||||
| Sun Trust Bank |
Plant City |
FL |
— | (14) | 751 | 1,753 | — | 2,504 | 70 | 3/22/2013 | 2000 | |||||||||||||||||||||||||
| Sun Trust Bank |
Destin |
FL |
— | (14) | 572 | 1,717 | — | 2,289 | 69 | 4/12/2013 | 1998 | |||||||||||||||||||||||||
| Sun Trust Bank |
Jesup |
GA |
— | (14) | 184 | 1,657 | — | 1,841 | 67 | 3/22/2013 | 1964 | |||||||||||||||||||||||||
| Sun Trust Bank |
Atlanta |
GA |
— | (14) | 1,018 | 1,527 | — | 2,545 | 61 | 4/12/2013 | 1965 | |||||||||||||||||||||||||
| Sun Trust Bank |
Coral Springs |
FL |
— | (14) | 654 | 1,525 | — | 2,179 | 61 | 4/12/2013 | 1996 | |||||||||||||||||||||||||
| Sun Trust Bank |
Rocky Mount |
VA |
— | (14) | 265 | 1,504 | — | 1,769 | 47 | 5/22/2013 | 1961 | |||||||||||||||||||||||||
| Sun Trust Bank |
Dunwoody |
GA |
— | (14) | 1,784 | 1,460 | — | 3,244 | 59 | 3/22/2013 | 1972 | |||||||||||||||||||||||||
| Sun Trust Bank |
Melbourne |
FL |
— | (14) | 464 | 1,392 | — | 1,856 | 56 | 4/12/2013 | 1987 | |||||||||||||||||||||||||
| Sun Trust Bank |
Durham |
NC |
— | (14) | 747 | 1,388 | — | 2,135 | 56 | 4/12/2013 | 1973 | |||||||||||||||||||||||||
| Sun Trust Bank |
North Port |
FL |
— | (14) | 460 | 1,381 | — | 1,841 | 55 | 3/22/2013 | 1982 | |||||||||||||||||||||||||
| Sun Trust Bank |
Hudson |
FL |
— | (14) | 448 | 1,345 | — | 1,793 | 54 | 3/22/2013 | 1979 | |||||||||||||||||||||||||
| Sun Trust Bank |
Port Orange |
FL |
— | (14) | 563 | 1,314 | — | 1,877 | 53 | 3/22/2013 | 1982 | |||||||||||||||||||||||||
| Sun Trust Bank |
Nashville |
TN |
— | (14) | 1,598 | 1,308 | — | 2,906 | 53 | 4/12/2013 | 1992 | |||||||||||||||||||||||||
| Sun Trust Bank |
Chattanooga |
TN |
— | (14) | 223 | 1,263 | — | 1,486 | 51 | 3/22/2013 | 1953 | |||||||||||||||||||||||||
| Sun Trust Bank |
Palm Harbor |
FL |
— | (14) | 535 | 1,249 | — | 1,784 | 50 | 4/12/2013 | 1994 | |||||||||||||||||||||||||
| Sun Trust Bank |
Bowdon |
GA |
— | (14) | 416 | 1,247 | — | 1,663 | 50 | 3/22/2013 | 1900 | |||||||||||||||||||||||||
| Sun Trust Bank |
Orlando |
FL |
— | (14) | 805 | 1,208 | — | 2,013 | 49 | 4/12/2013 | 1988 | |||||||||||||||||||||||||
| Sun Trust Bank |
Madison |
TN |
— | (14) | 286 | 1,143 | — | 1,429 | 46 | 3/22/2013 | 1953 | |||||||||||||||||||||||||
| Sun Trust Bank |
Miami |
FL |
— | (14) | 1,393 | 1,140 | — | 2,533 | 46 | 4/12/2013 | 1982 | |||||||||||||||||||||||||
| Sun Trust Bank |
Lakeland |
FL |
— | (14) | 598 | 1,110 | — | 1,708 | 45 | 4/12/2013 | 1988 | |||||||||||||||||||||||||
| Sun Trust Bank |
South Daytona Beach |
FL |
— | (14) | 592 | 1,099 | — | 1,691 | 44 | 4/12/2013 | 1985 | |||||||||||||||||||||||||
| Sun Trust Bank |
Port Orange |
FL |
— | (14) | 590 | 1,095 | — | 1,685 | 44 | 3/22/2013 | 1989 | |||||||||||||||||||||||||
| Sun Trust Bank |
Anderson |
SC |
— | (14) | 574 | 1,065 | — | 1,639 | 43 | 3/22/2013 | 1998 | |||||||||||||||||||||||||
F-116
Table of Contents
| Initial Costs | ||||||||||||||||||||||||||||||||||||
| Property |
City |
State |
Encumbrances at December 31, 2013 |
Land | Buildings, Fixtures and Improvements |
Costs Capitalized Subsequent to Acquisition |
Gross Amount Carried at December 31, 2013 (10) (11) |
Accumulated Depreciation (12) (13) |
Date Acquired |
Date of Construction |
||||||||||||||||||||||||||
| Sun Trust Bank |
West Palm Beach |
FL |
$ | — | (14) | $ | 1,026 | $ | 1,026 | $ | — | $ | 2,052 | $ | 41 | 3/22/2013 | 1981 | |||||||||||||||||||
| Sun Trust Bank |
Frederick |
MD |
— | (14) | 991 | 991 | — | 1,982 | 35 | 4/26/2013 | 1880 | |||||||||||||||||||||||||
| Sun Trust Bank |
Roswell |
GA |
— | (14) | 1,425 | 950 | — | 2,375 | 38 | 4/12/2013 | 1988 | |||||||||||||||||||||||||
| Sun Trust Bank |
Ellicott City |
MD |
— | (14) | 1,728 | 931 | — | 2,659 | 37 | 3/22/2013 | 1975 | |||||||||||||||||||||||||
| Sun Trust Bank |
Belmont |
NC |
— | (14) | 616 | 924 | — | 1,540 | 37 | 3/22/2013 | 1970 | |||||||||||||||||||||||||
| Sun Trust Bank |
Lexington |
NC |
— | (14) | 447 | 831 | — | 1,278 | 33 | 4/12/2013 | 2001 | |||||||||||||||||||||||||
| Sun Trust Bank |
Kissimmee |
FL |
— | (14) | 1,167 | 778 | — | 1,945 | 31 | 4/12/2013 | 1981 | |||||||||||||||||||||||||
| Sun Trust Bank |
Greensboro |
NC |
— | (14) | 403 | 748 | — | 1,151 | 30 | 4/12/2013 | 1962 | |||||||||||||||||||||||||
| Sun Trust Bank |
Travelers Rest |
SC |
— | (14) | 746 | 746 | — | 1,492 | 30 | 4/12/2013 | 1995 | |||||||||||||||||||||||||
| Sun Trust Bank |
St. Simons Island |
GA |
— | (14) | 1,363 | 734 | — | 2,097 | 29 | 3/22/2013 | 1975 | |||||||||||||||||||||||||
| Sun Trust Bank |
Pensacola |
FL |
— | (14) | 886 | 725 | — | 1,611 | 29 | 4/12/2013 | 1979 | |||||||||||||||||||||||||
| Sun Trust Bank |
Concord |
NC |
— | (14) | 707 | 707 | — | 1,414 | 28 | 4/12/2013 | 1988 | |||||||||||||||||||||||||
| Sun Trust Bank |
Lake Wales |
FL |
— | (14) | 671 | 671 | — | 1,342 | 27 | 3/22/2013 | 1988 | |||||||||||||||||||||||||
| Sun Trust Bank |
Raleigh |
NC |
— | (14) | 658 | 658 | — | 1,316 | 26 | 3/22/2013 | 1997 | |||||||||||||||||||||||||
| Sun Trust Bank |
Zebulon |
NC |
— | (14) | 515 | 630 | — | 1,145 | 25 | 3/22/2013 | 1972 | |||||||||||||||||||||||||
| Sun Trust Bank |
Nashville |
TN |
— | (14) | 613 | 613 | — | 1,226 | 25 | 4/12/2013 | 1970 | |||||||||||||||||||||||||
| Sun Trust Bank |
Belton |
SC |
— | (14) | 473 | 578 | — | 1,051 | 23 | 4/12/2013 | 1967 | |||||||||||||||||||||||||
| Sun Trust Bank |
Burlington |
NC |
— | (14) | 446 | 545 | — | 991 | 22 | 4/12/2013 | 1995 | |||||||||||||||||||||||||
| Sun Trust Bank |
Oakboro |
NC |
— | 360 | 540 | — | 900 | 12 | 7/23/2013 | 1970 | ||||||||||||||||||||||||||
| Sun Trust Bank |
Carrboro |
NC |
— | (14) | 512 | 512 | — | 1,024 | 21 | 4/12/2013 | 1980 | |||||||||||||||||||||||||
| Sun Trust Bank |
Cheriton |
VA |
— | (14) | 90 | 510 | — | 600 | 21 | 3/22/2013 | 1975 | |||||||||||||||||||||||||
| Sun Trust Bank |
Atlanta |
GA |
— | (14) | 1,435 | 478 | — | 1,913 | 19 | 4/12/2013 | 1970 | |||||||||||||||||||||||||
| Sun Trust Bank |
Lynchburg |
VA |
— | (14) | 251 | 466 | — | 717 | 19 | 3/22/2013 | 1973 | |||||||||||||||||||||||||
| Sun Trust Bank |
Dunnellon |
FL |
— | (14) | 82 | 463 | — | 545 | 19 | 3/22/2013 | 1980 | |||||||||||||||||||||||||
| Sun Trust Bank |
Norfolk |
VA |
— | (14) | 656 | 437 | — | 1,093 | 18 | 4/12/2013 | 1990 | |||||||||||||||||||||||||
| Sun Trust Bank |
Richmond |
VA |
— | (14) | 277 | 416 | — | 693 | 17 | 3/22/2013 | 1959 | |||||||||||||||||||||||||
| Sun Trust Bank |
Matthews |
NC |
— | (14) | 382 | 382 | — | 764 | 15 | 3/22/2013 | 1971 | |||||||||||||||||||||||||
| Sun Trust Bank |
Yadkinville |
NC |
— | (14) | 200 | 371 | — | 571 | 15 | 4/12/2013 | 1975 | |||||||||||||||||||||||||
| Sun Trust Bank |
Petersburg |
VA |
— | (14) | 102 | 306 | — | 408 | 12 | 4/12/2013 | 1975 | |||||||||||||||||||||||||
| Sun Trust Bank |
Nashville |
TN |
— | 567 | 305 | — | 872 | 7 | 7/23/2013 | 1954 | ||||||||||||||||||||||||||
| Sun Trust Bank |
La Vergne |
TN |
— | (14) | 171 | 209 | — | 380 | 8 | 3/22/2013 | 1985 | |||||||||||||||||||||||||
| T.G.I. Friday’s |
Warwick |
RI |
— | 1,228 | 2,775 | — | 4,003 | 80 | 6/27/2013 | 1983 | ||||||||||||||||||||||||||
| T.G.I. Friday’s |
Kentwood |
MI |
— | (14) | 281 | 2,533 | — | 2,814 | 63 | 7/31/2013 | 1983 | |||||||||||||||||||||||||
| T.G.I. Friday’s |
Bismarck |
ND |
— | (14) | 1,038 | 1,928 | — | 2,966 | 48 | 7/31/2013 | 2000 | |||||||||||||||||||||||||
| T.G.I. Friday’s |
Blasdell |
NY |
— | (14) | 1,215 | 1,913 | — | 3,128 | 55 | 6/27/2013 | 2000 | |||||||||||||||||||||||||
| T.G.I. Friday’s |
Ann Arbor |
MI |
— | (14) | 547 | 1,640 | — | 2,187 | 41 | 7/31/2013 | 1998 | |||||||||||||||||||||||||
| T.G.I. Friday’s |
Royal Palm Beach |
FL |
— | (14) | 1,530 | 1,530 | — | 3,060 | 38 | 7/31/2013 | 2001 | |||||||||||||||||||||||||
| T.G.I. Friday’s |
Rochester |
MN |
— | (14) | 1,347 | 1,102 | — | 2,449 | 27 | 7/31/2013 | 1993 | |||||||||||||||||||||||||
| T.G.I. Friday’s |
Novi |
MI |
— | (14) | 1,042 | 1,042 | — | 2,084 | 26 | 7/31/2013 | 1994 | |||||||||||||||||||||||||
| Taco Bell |
Vacaville |
CA |
— | (14) | 522 | 1,513 | — | 2,035 | 42 | 6/27/2013 | 1985 | |||||||||||||||||||||||||
| Taco Bell |
Suisun City |
CA |
— | (14) | 355 | 1,419 | — | 1,774 | 31 | 7/31/2013 | 1986 | |||||||||||||||||||||||||
| Taco Bell |
Vacaville |
CA |
— | (14) | 1,184 | 1,375 | — | 2,559 | 38 | 6/27/2013 | 1994 | |||||||||||||||||||||||||
| Taco Bell |
Fairfield |
CA |
— | (14) | 500 | 1,327 | — | 1,827 | 37 | 6/27/2013 | 1985 | |||||||||||||||||||||||||
| Taco Bell |
Rancho Cucamonga |
CA |
— | (14) | 415 | 1,210 | — | 1,625 | 34 | 6/27/2013 | 1992 | |||||||||||||||||||||||||
| Taco Bell |
Corona |
CA |
— | (14) | 306 | 1,138 | — | 1,444 | 32 | 6/27/2013 | 1990 | |||||||||||||||||||||||||
| Taco Bell |
North Corbin |
KY |
— | (14) | 139 | 1,082 | — | 1,221 | 30 | 6/27/2013 | 1986 | |||||||||||||||||||||||||
| Taco Bell |
Cullman |
AL |
— | (14) | 375 | 1,053 | — | 1,428 | 29 | 6/27/2013 | 1988 | |||||||||||||||||||||||||
| Taco Bell |
Fontana |
CA |
— | (14) | 524 | 1,016 | — | 1,540 | 28 | 6/27/2013 | 1992 | |||||||||||||||||||||||||
| Taco Bell |
Moreno Valley |
CA |
— | (14) | 367 | 998 | — | 1,365 | 28 | 6/27/2013 | 1988 | |||||||||||||||||||||||||
| Taco Bell |
Marion |
IN |
— | (14) | 496 | 921 | — | 1,417 | 20 | 7/31/2013 | 1994 | |||||||||||||||||||||||||
| Taco Bell |
Winfield |
AL |
— | (14) | 278 | 834 | — | 1,112 | 18 | 7/31/2013 | 2008 | |||||||||||||||||||||||||
| Taco Bell |
Westerville |
OH |
— | (14) | 354 | 827 | — | 1,181 | 18 | 7/31/2013 | 1992 | |||||||||||||||||||||||||
| Taco Bell |
Jasper |
AL |
— | (14) | 445 | 814 | — | 1,259 | 23 | 6/27/2013 | 1987 | |||||||||||||||||||||||||
| Taco Bell |
Dora |
AL |
— | (14) | 348 | 813 | — | 1,161 | 18 | 7/31/2013 | 1995 | |||||||||||||||||||||||||
| Taco Bell |
Hilliard |
OH |
— | (14) | 424 | 787 | — | 1,211 | 17 | 7/31/2013 | 1991 | |||||||||||||||||||||||||
| Taco Bell |
Hartselle |
AL |
— | (14) | 378 | 781 | — | 1,159 | 22 | 6/27/2013 | 1996 | |||||||||||||||||||||||||
| Taco Bell |
Albertville |
AL |
— | (14) | 419 | 778 | — | 1,197 | 17 | 7/31/2013 | 2000 | |||||||||||||||||||||||||
F-117
Table of Contents
| Initial Costs | ||||||||||||||||||||||||||||||||||||
| Property |
City |
State |
Encumbrances at December 31, 2013 |
Land | Buildings, Fixtures and Improvements |
Costs Capitalized Subsequent to Acquisition |
Gross Amount Carried at December 31, 2013 (10) (11) |
Accumulated Depreciation (12) (13) |
Date Acquired |
Date of Construction |
||||||||||||||||||||||||||
| Taco Bell |
Dayton |
OH |
$ | — | (14) | $ | 129 | $ | 732 | $ | — | $ | 861 | $ | 16 | 7/31/2013 | 1995 | |||||||||||||||||||
| Taco Bell |
Pickerington |
OH |
— | (14) | 470 | 705 | — | 1,175 | 15 | 7/31/2013 | 1991 | |||||||||||||||||||||||||
| Taco Bell |
Detroit |
MI |
— | 124 | 704 | — | 828 | 15 | 7/31/2013 | 1989 | ||||||||||||||||||||||||||
| Taco Bell |
Warrior |
AL |
— | (14) | 364 | 675 | — | 1,039 | 15 | 7/31/2013 | 1996 | |||||||||||||||||||||||||
| Taco Bell |
Marysville |
OH |
— | (14) | 412 | 618 | — | 1,030 | 14 | 7/31/2013 | 1992 | |||||||||||||||||||||||||
| Taco Bell |
Anniston |
AL |
— | 80 | 609 | — | 689 | 17 | 6/27/2013 | 2000 | ||||||||||||||||||||||||||
| Taco Bell |
Kennesaw |
GA |
— | (14) | 162 | 601 | — | 763 | 17 | 6/27/2013 | 1984 | |||||||||||||||||||||||||
| Taco Bell |
Moraine |
OH |
— | 280 | 505 | — | 785 | 14 | 6/27/2013 | 1985 | ||||||||||||||||||||||||||
| Taco Bell / KFC |
Milwaukee |
WI |
— | (14) | 533 | 1,055 | — | 1,588 | 29 | 6/27/2013 | 1978 | |||||||||||||||||||||||||
| Taco Bell / Pizza Hut |
Rubidoux |
CA |
— | (14) | 415 | 1,223 | — | 1,638 | 34 | 6/27/2013 | 1992 | |||||||||||||||||||||||||
| Taco Bell / Pizza Hut |
Montclair |
CA |
— | (14) | 322 | 900 | — | 1,222 | 25 | 6/27/2013 | 1996 | |||||||||||||||||||||||||
| Taco Bueno |
Arlington |
TX |
— | (14) | 597 | 895 | — | 1,492 | 20 | 7/31/2013 | 2000 | |||||||||||||||||||||||||
| Taco Bueno |
Waco |
TX |
— | (14) | 595 | 893 | — | 1,488 | 20 | 7/31/2013 | 2000 | |||||||||||||||||||||||||
| Taco Bueno |
Waco |
TX |
— | (14) | 595 | 892 | — | 1,487 | 20 | 7/31/2013 | 2000 | |||||||||||||||||||||||||
| Taco Bueno |
Hutchinson |
KS |
— | (14) | 561 | 841 | — | 1,402 | 18 | 7/31/2013 | 2000 | |||||||||||||||||||||||||
| Taco Bueno |
Springfield |
MO |
— | (14) | 753 | 753 | — | 1,506 | 17 | 7/31/2013 | 2006 | |||||||||||||||||||||||||
| Taco Bueno |
Belton |
MO |
— | (14) | 476 | 701 | — | 1,177 | 19 | 6/27/2013 | 2006 | |||||||||||||||||||||||||
| Taco Bueno |
Frisco |
TX |
— | (14) | 601 | 577 | — | 1,178 | 16 | 6/27/2013 | 2000 | |||||||||||||||||||||||||
| Taco Bueno |
North Richland Hills |
TX |
— | (14) | 423 | 567 | — | 990 | 16 | 6/27/2013 | 2000 | |||||||||||||||||||||||||
| Taco Bueno |
Lubbock |
TX |
— | (14) | 228 | 561 | — | 789 | 16 | 6/27/2013 | 2000 | |||||||||||||||||||||||||
| Talbots |
Lakeville |
MA |
— | (14) | 6,302 | 25,199 | — | 31,501 | 897 | 5/17/2013 | 1987 | |||||||||||||||||||||||||
| Texas Roadhouse |
Kenosha |
WI |
— | (14) | 1,061 | 1,835 | — | 2,896 | 53 | 6/27/2013 | 2001 | |||||||||||||||||||||||||
| Tire Warehouse |
Bangor |
ME |
— | (14) | 289 | 1,400 | — | 1,689 | 39 | 6/27/2013 | 1977 | |||||||||||||||||||||||||
| Tire Warehouse |
Fitchburg |
MA |
— | (14) | 203 | 704 | — | 907 | 20 | 6/27/2013 | 1982 | |||||||||||||||||||||||||
| TitleMax |
Gainesville |
GA |
— | (14) | 221 | 270 | — | 491 | 7 | 7/31/2013 | 2007 | |||||||||||||||||||||||||
| Tommy Addison’s |
Edgewood |
FL |
— | (14) | 366 | 447 | — | 813 | 11 | 7/31/2013 | 2003 | |||||||||||||||||||||||||
| Tractor Supply |
Los Banos |
CA |
— | (14) | 1,213 | 3,638 | — | 4,851 | 145 | 2/28/2013 | 2009 | |||||||||||||||||||||||||
| Tractor Supply |
Mims |
FL |
— | 310 | 2,787 | — | 3,097 | 33 | 10/10/2013 | 2012 | ||||||||||||||||||||||||||
| Tractor Supply |
Plaistow |
NH |
— | 638 | 2,552 | — | 3,190 | 30 | 10/10/2013 | 2012 | ||||||||||||||||||||||||||
| Tracy’s Seafood |
Port Arthur |
TX |
— | 43 | 72 | — | 115 | 2 | 6/27/2013 | 1998 | ||||||||||||||||||||||||||
| Tumbleweed |
Zanesville |
OH |
— | (14) | 639 | 1,491 | — | 2,130 | 37 | 7/31/2013 | 1998 | |||||||||||||||||||||||||
| Tumbleweed |
Owensboro |
KY |
— | (14) | 355 | 1,420 | — | 1,775 | 35 | 7/31/2013 | 1997 | |||||||||||||||||||||||||
| Tumbleweed |
Louisville |
KY |
— | (14) | 468 | 1,404 | — | 1,872 | 35 | 7/31/2013 | 2001 | |||||||||||||||||||||||||
| Tumbleweed |
Terre Haute |
IN |
— | (14) | 434 | 1,303 | — | 1,737 | 32 | 7/31/2013 | 1997 | |||||||||||||||||||||||||
| Tumbleweed |
Springfield |
OH |
— | (14) | 549 | 1,280 | — | 1,829 | 32 | 7/31/2013 | 1998 | |||||||||||||||||||||||||
| Tumbleweed |
Bellefontaine |
OH |
— | (14) | 234 | 938 | — | 1,172 | 23 | 7/31/2013 | 1999 | |||||||||||||||||||||||||
| Tumbleweed |
Mayesville |
KY |
— | (14) | 353 | 823 | — | 1,176 | 20 | 7/31/2013 | 2000 | |||||||||||||||||||||||||
| Tumbleweed |
Wooster |
OH |
— | (14) | 342 | 799 | — | 1,141 | 20 | 7/31/2013 | 1997 | |||||||||||||||||||||||||
| Vacant |
Albemarle |
NC |
— | 483 | 457 | — | 940 | 13 | 6/27/2013 | 1992 | ||||||||||||||||||||||||||
| Velox Insurance |
Woodstock |
GA |
— | 155 | 127 | — | 282 | 3 | 7/31/2013 | 1988 | ||||||||||||||||||||||||||
| Verizon Wireless |
Statesville |
NC |
— | 207 | 459 | — | 666 | 13 | 6/27/2013 | 1993 | ||||||||||||||||||||||||||
| Waffle House |
Roanoke |
VA |
— | 176 | 327 | — | 503 | 7 | 7/31/2013 | 1987 | ||||||||||||||||||||||||||
| Waffle House |
Cocoa |
FL |
— | 150 | 279 | — | 429 | 6 | 7/31/2013 | 1986 | ||||||||||||||||||||||||||
| Walgreens |
Denver |
CO |
— | — | 4,050 | — | 4,050 | 122 | 7/2/2013 | 2008 | ||||||||||||||||||||||||||
| Walgreens |
Castle Rock |
CO |
— | 1,581 | 3,689 | — | 5,270 | 111 | 7/11/2013 | 2002 | ||||||||||||||||||||||||||
| Wendy’s |
Columbus |
GA |
— | (14) | 478 | 2,209 | — | 2,687 | 61 | 6/27/2013 | 2003 | |||||||||||||||||||||||||
| Wendy’s |
Owego |
NY |
— | (14) | 101 | 1,915 | — | 2,016 | 42 | 7/31/2013 | 1989 | |||||||||||||||||||||||||
| Wendy’s |
Pasadena |
MD |
— | (14) | 1,049 | 1,902 | — | 2,951 | 53 | 6/27/2013 | 1997 | |||||||||||||||||||||||||
| Wendy’s |
El Paso |
TX |
— | (14) | 630 | 1,889 | — | 2,519 | 42 | 7/31/2013 | 1996 | |||||||||||||||||||||||||
| Wendy’s |
Hamilton |
OH |
— | (14) | 655 | 1,848 | — | 2,503 | 51 | 6/27/2013 | 2001 | |||||||||||||||||||||||||
| Wendy’s |
Columbus |
GA |
— | (14) | 701 | 1,787 | — | 2,488 | 50 | 6/27/2013 | 1999 | |||||||||||||||||||||||||
| Wendy’s |
Kingwood |
TX |
— | (14) | 304 | 1,724 | — | 2,028 | 38 | 7/31/2013 | 2001 | |||||||||||||||||||||||||
| Wendy’s |
Corning |
NY |
— | (14) | 191 | 1,717 | — | 1,908 | 38 | 7/31/2013 | 1996 | |||||||||||||||||||||||||
| Wendy’s |
Richmond |
IN |
— | (14) | 735 | 1,716 | — | 2,451 | 38 | 7/31/2013 | 1989 | |||||||||||||||||||||||||
| Wendy’s |
Albany |
GA |
— | (14) | 414 | 1,656 | — | 2,070 | 36 | 7/31/2013 | 2000 | |||||||||||||||||||||||||
| Wendy’s |
Orange |
CT |
— | (14) | 1,343 | 1,641 | — | 2,984 | 36 | 7/31/2013 | 2003 | |||||||||||||||||||||||||
| Wendy’s |
Woodbridge |
VA |
— | (14) | 1,193 | 1,598 | — | 2,791 | 44 | 6/27/2013 | 1996 | |||||||||||||||||||||||||
F-118
Table of Contents
| Initial Costs | ||||||||||||||||||||||||||||||||||||
| Property |
City |
State |
Encumbrances at December 31, 2013 |
Land | Buildings, Fixtures and Improvements |
Costs Capitalized Subsequent to Acquisition |
Gross Amount Carried at December 31, 2013 (10) (11) |
Accumulated Depreciation (12) (13) |
Date Acquired |
Date of Construction |
||||||||||||||||||||||||||
| Wendy’s |
Arlington |
TX |
$ | — | (14) | $ | 1,322 | $ | 1,546 | $ | — | $ | 2,868 | $ | 43 | 6/27/2013 | 1994 | |||||||||||||||||||
| Wendy’s |
Middletown |
OH |
— | (14) | 494 | 1,481 | — | 1,975 | 33 | 7/31/2013 | 1977 | |||||||||||||||||||||||||
| Wendy’s |
Fairborn |
OH |
— | (14) | 629 | 1,468 | — | 2,097 | 32 | 7/31/2013 | 1999 | |||||||||||||||||||||||||
| Wendy’s |
Lake Wales |
FL |
— | (14) | 975 | 1,462 | — | 2,437 | 32 | 7/31/2013 | 1999 | |||||||||||||||||||||||||
| Wendy’s |
Wintersville |
OH |
— | (14) | 621 | 1,450 | — | 2,071 | 32 | 7/31/2013 | 1977 | |||||||||||||||||||||||||
| Wendy’s |
Kenosha |
WI |
— | (14) | 965 | 1,447 | — | 2,412 | 32 | 7/31/2013 | 1986 | |||||||||||||||||||||||||
| Wendy’s |
Mcminnville |
TN |
— | (14) | 255 | 1,443 | — | 1,698 | 32 | 7/31/2013 | 1984 | |||||||||||||||||||||||||
| Wendy’s |
Centerville |
OH |
— | (14) | 615 | 1,434 | — | 2,049 | 32 | 7/31/2013 | 1997 | |||||||||||||||||||||||||
| Wendy’s |
Emporia |
VA |
— | (14) | 631 | 1,424 | — | 2,055 | 39 | 6/27/2013 | 1994 | |||||||||||||||||||||||||
| Wendy’s |
Louisville |
KY |
— | (14) | 857 | 1,421 | — | 2,278 | 39 | 6/27/2013 | 2000 | |||||||||||||||||||||||||
| Wendy’s |
Kankakee |
IL |
— | (14) | 250 | 1,419 | — | 1,669 | 31 | 7/31/2013 | 2005 | |||||||||||||||||||||||||
| Wendy’s |
Hillsboro |
OH |
— | (14) | 291 | 1,408 | — | 1,699 | 39 | 6/27/2013 | 1985 | |||||||||||||||||||||||||
| Wendy’s |
Cincinnati |
OH |
— | (14) | 939 | 1,408 | — | 2,347 | 31 | 7/31/2013 | 1980 | |||||||||||||||||||||||||
| Wendy’s |
Fairborn |
OH |
— | (14) | 604 | 1,408 | — | 2,012 | 31 | 7/31/2013 | 1992 | |||||||||||||||||||||||||
| Wendy’s |
Pounding Mill |
VA |
— | (14) | 296 | 1,404 | — | 1,700 | 39 | 6/27/2013 | 2004 | |||||||||||||||||||||||||
| Wendy’s |
Dublin |
VA |
— | (14) | 384 | 1,402 | — | 1,786 | 39 | 6/27/2013 | 1993 | |||||||||||||||||||||||||
| Wendy’s |
Manchester |
TN |
— | (14) | 245 | 1,390 | — | 1,635 | 31 | 7/31/2013 | 1984 | |||||||||||||||||||||||||
| Wendy’s |
Louisville |
KY |
— | (14) | 834 | 1,379 | — | 2,213 | 38 | 6/27/2013 | 2001 | |||||||||||||||||||||||||
| Wendy’s |
Horseheads |
NY |
— | (14) | 72 | 1,369 | — | 1,441 | 30 | 7/31/2013 | 1982 | |||||||||||||||||||||||||
| Wendy’s |
Hamilton |
OH |
— | (14) | 908 | 1,362 | — | 2,270 | 30 | 7/31/2013 | 2002 | |||||||||||||||||||||||||
| Wendy’s |
Madison |
WI |
— | (14) | 454 | 1,362 | — | 1,816 | 30 | 7/31/2013 | 1998 | |||||||||||||||||||||||||
| Wendy’s |
Hogansville |
GA |
— | (14) | 240 | 1,359 | — | 1,599 | 30 | 7/31/2013 | 1985 | |||||||||||||||||||||||||
| Wendy’s |
Brentwood |
TN |
— | (14) | 339 | 1,356 | — | 1,695 | 30 | 7/31/2013 | 1982 | |||||||||||||||||||||||||
| Wendy’s |
Milwaukee |
WI |
— | (14) | 338 | 1,351 | — | 1,689 | 30 | 7/31/2013 | 1985 | |||||||||||||||||||||||||
| Wendy’s |
Oak Creek |
WI |
— | (14) | 577 | 1,347 | — | 1,924 | 30 | 7/31/2013 | 1999 | |||||||||||||||||||||||||
| Wendy’s |
Dayton |
OH |
— | (14) | 723 | 1,343 | — | 2,066 | 30 | 7/31/2013 | 1977 | |||||||||||||||||||||||||
| Wendy’s |
Springboro |
OH |
— | (14) | 891 | 1,336 | — | 2,227 | 29 | 7/31/2013 | 1979 | |||||||||||||||||||||||||
| Wendy’s |
Auburn |
AL |
— | (14) | 718 | 1,334 | — | 2,052 | 29 | 7/31/2013 | 2000 | |||||||||||||||||||||||||
| Wendy’s |
Saint Marys |
WV |
— | (14) | 70 | 1,322 | — | 1,392 | 29 | 7/31/2013 | 2001 | |||||||||||||||||||||||||
| Wendy’s |
Fairburn |
GA |
— | (14) | 1,076 | 1,316 | — | 2,392 | 29 | 7/31/2013 | 2002 | |||||||||||||||||||||||||
| Wendy’s |
Nashville |
TN |
— | (14) | 328 | 1,313 | — | 1,641 | 29 | 7/31/2013 | 1983 | |||||||||||||||||||||||||
| Wendy’s |
Sharpsburg |
GA |
— | (14) | 649 | 1,299 | — | 1,948 | 36 | 6/27/2013 | 2002 | |||||||||||||||||||||||||
| Wendy’s |
Connersville |
IN |
— | (14) | 324 | 1,298 | — | 1,622 | 29 | 7/31/2013 | 1989 | |||||||||||||||||||||||||
| Wendy’s |
Hamilton |
OH |
— | (14) | 697 | 1,295 | — | 1,992 | 28 | 7/31/2013 | 1974 | |||||||||||||||||||||||||
| Wendy’s |
Kenosha |
WI |
— | (14) | 322 | 1,290 | — | 1,612 | 28 | 7/31/2013 | 1984 | |||||||||||||||||||||||||
| Wendy’s |
Germantown |
WI |
— | (14) | 419 | 1,257 | — | 1,676 | 28 | 7/31/2013 | 1989 | |||||||||||||||||||||||||
| Wendy’s |
Endicott |
NY |
— | (14) | 313 | 1,253 | — | 1,566 | 28 | 7/31/2013 | 1987 | |||||||||||||||||||||||||
| Wendy’s |
Parkersburg |
WV |
— | (14) | 311 | 1,243 | — | 1,554 | 27 | 7/31/2013 | 1977 | |||||||||||||||||||||||||
| Wendy’s |
Fitchburg |
WI |
— | (14) | 662 | 1,230 | — | 1,892 | 27 | 7/31/2013 | 2003 | |||||||||||||||||||||||||
| Wendy’s |
Louisville |
KY |
— | (14) | 532 | 1,221 | — | 1,753 | 34 | 6/27/2013 | 1998 | |||||||||||||||||||||||||
| Wendy’s |
Corpus Christi |
TX |
— | (14) | 646 | 1,199 | — | 1,845 | 26 | 7/31/2013 | 1987 | |||||||||||||||||||||||||
| Wendy’s |
Fort Smith |
AR |
— | 195 | 1,186 | — | 1,381 | 33 | 6/27/2013 | 1995 | ||||||||||||||||||||||||||
| Wendy’s |
Columbus |
GA |
— | (14) | 743 | 1,185 | — | 1,928 | 33 | 6/27/2013 | 1988 | |||||||||||||||||||||||||
| Wendy’s |
Phenix City |
AL |
— | (14) | 529 | 1,178 | — | 1,707 | 33 | 6/27/2013 | 2005 | |||||||||||||||||||||||||
| Wendy’s |
Millville |
NJ |
— | 373 | 1,169 | — | 1,542 | 32 | 6/27/2013 | 1994 | ||||||||||||||||||||||||||
| Wendy’s |
El Dorado |
AR |
— | 413 | 1,151 | — | 1,564 | 32 | 6/27/2013 | 1975 | ||||||||||||||||||||||||||
| Wendy’s |
Greenfield |
WI |
— | (14) | 487 | 1,137 | — | 1,624 | 25 | 7/31/2013 | 2001 | |||||||||||||||||||||||||
| Wendy’s |
Middletown |
OH |
— | (14) | 755 | 1,133 | — | 1,888 | 25 | 7/31/2013 | 1976 | |||||||||||||||||||||||||
| Wendy’s |
Fairmont |
WV |
— | (14) | 224 | 1,119 | — | 1,343 | 31 | 6/27/2013 | 1983 | |||||||||||||||||||||||||
| Wendy’s |
Sayre |
PA |
— | (14) | 372 | 1,115 | — | 1,487 | 25 | 7/31/2013 | 1994 | |||||||||||||||||||||||||
| Wendy’s |
Nashville |
TN |
— | (14) | 592 | 1,100 | — | 1,692 | 24 | 7/31/2013 | 1983 | |||||||||||||||||||||||||
| Wendy’s |
Murfreesboro |
TN |
— | (14) | 586 | 1,088 | — | 1,674 | 24 | 7/31/2013 | 1983 | |||||||||||||||||||||||||
| Wendy’s |
Miamisburg |
OH |
— | (14) | 888 | 1,086 | — | 1,974 | 24 | 7/31/2013 | 1995 | |||||||||||||||||||||||||
| Wendy’s |
Auburn |
NY |
— | (14) | 465 | 1,085 | — | 1,550 | 24 | 7/31/2013 | 1977 | |||||||||||||||||||||||||
| Wendy’s |
West Allis |
WI |
— | (14) | 583 | 1,083 | — | 1,666 | 24 | 7/31/2013 | 1984 | |||||||||||||||||||||||||
| Wendy’s |
Bourbonnais |
IL |
— | (14) | 346 | 1,039 | — | 1,385 | 23 | 7/31/2013 | 1993 | |||||||||||||||||||||||||
| Wendy’s |
Stuttgart |
AR |
— | (14) | 67 | 1,038 | — | 1,105 | 29 | 6/27/2013 | 2001 | |||||||||||||||||||||||||
F-119
Table of Contents
| Initial Costs | ||||||||||||||||||||||||||||||||||||
| Property |
City |
State |
Encumbrances at December 31, 2013 |
Land | Buildings, Fixtures and Improvements |
Costs Capitalized Subsequent to Acquisition |
Gross Amount Carried at December 31, 2013 (10) (11) |
Accumulated Depreciation (12) (13) |
Date Acquired |
Date of Construction |
||||||||||||||||||||||||||
| Wendy’s |
Baltimore |
MD |
$ | — | (14) | $ | 904 | $ | 1,036 | $ | — | $ | 1,940 | $ | 29 | 6/27/2013 | 1986 | |||||||||||||||||||
| Wendy’s |
Lancaster |
OH |
— | (14) | 552 | 1,025 | — | 1,577 | 23 | 7/31/2013 | 1984 | |||||||||||||||||||||||||
| Wendy’s |
Pine Bluff |
AR |
— | (14) | 221 | 1,022 | — | 1,243 | 28 | 6/27/2013 | 1989 | |||||||||||||||||||||||||
| Wendy’s |
Benton |
AR |
— | 478 | 1,018 | — | 1,496 | 28 | 6/27/2013 | 1993 | ||||||||||||||||||||||||||
| Wendy’s |
Fort Smith |
AR |
— | 63 | 1,016 | — | 1,079 | 28 | 6/27/2013 | 1995 | ||||||||||||||||||||||||||
| Wendy’s |
Milwaukee |
WI |
— | (14) | 436 | 1,016 | — | 1,452 | 22 | 7/31/2013 | 1983 | |||||||||||||||||||||||||
| Wendy’s |
Sheboygan |
WI |
— | (14) | 676 | 1,014 | — | 1,690 | 22 | 7/31/2013 | 1995 | |||||||||||||||||||||||||
| Wendy’s |
Saint Bernard |
OH |
— | (14) | 432 | 1,009 | — | 1,441 | 22 | 7/31/2013 | 1985 | |||||||||||||||||||||||||
| Wendy’s |
Lebanon |
VA |
— | (14) | 431 | 1,006 | — | 1,437 | 22 | 7/31/2013 | 1983 | |||||||||||||||||||||||||
| Wendy’s |
Mokena |
IL |
— | (14) | 665 | 997 | — | 1,662 | 22 | 7/31/2013 | 1992 | |||||||||||||||||||||||||
| Wendy’s |
Richmond |
IN |
— | (14) | 661 | 992 | — | 1,653 | 22 | 7/31/2013 | 1989 | |||||||||||||||||||||||||
| Wendy’s |
Birmingham |
AL |
— | (14) | 562 | 990 | — | 1,552 | 27 | 6/27/2013 | 2005 | |||||||||||||||||||||||||
| Wendy’s |
Ponca City |
OK |
— | (14) | 529 | 983 | — | 1,512 | 22 | 7/31/2013 | 1979 | |||||||||||||||||||||||||
| Wendy’s |
South Hill |
VA |
— | 313 | 976 | — | 1,289 | 27 | 6/27/2013 | 1984 | ||||||||||||||||||||||||||
| Wendy’s |
Hillsville |
VA |
— | (14) | 324 | 973 | — | 1,297 | 21 | 7/31/2013 | 2001 | |||||||||||||||||||||||||
| Wendy’s |
Fairfield |
OH |
— | (14) | 794 | 971 | — | 1,765 | 21 | 7/31/2013 | 1981 | |||||||||||||||||||||||||
| Wendy’s |
Janesville |
WI |
— | (14) | 647 | 971 | — | 1,618 | 21 | 7/31/2013 | 1991 | |||||||||||||||||||||||||
| Wendy’s |
Parkersburg |
WV |
— | (14) | 241 | 964 | — | 1,205 | 21 | 7/31/2013 | 1996 | |||||||||||||||||||||||||
| Wendy’s |
Joliet |
IL |
— | (14) | 642 | 963 | — | 1,605 | 21 | 7/31/2013 | 1977 | |||||||||||||||||||||||||
| Wendy’s |
Cortland |
NY |
— | (14) | 635 | 952 | — | 1,587 | 21 | 7/31/2013 | 1984 | |||||||||||||||||||||||||
| Wendy’s |
Norwich |
CT |
— | 703 | 937 | — | 1,640 | 26 | 6/27/2013 | 1980 | ||||||||||||||||||||||||||
| Wendy’s |
Minden |
LA |
— | (14) | 182 | 936 | — | 1,118 | 26 | 6/27/2013 | 2001 | |||||||||||||||||||||||||
| Wendy’s |
Bowling Green |
OH |
— | 502 | 932 | — | 1,434 | 20 | 7/31/2013 | 1994 | ||||||||||||||||||||||||||
| Wendy’s |
Beloit |
WI |
— | (14) | 1,138 | 931 | — | 2,069 | 20 | 7/31/2013 | 2002 | |||||||||||||||||||||||||
| Wendy’s |
West Chester |
OH |
— | (14) | 616 | 924 | — | 1,540 | 20 | 7/31/2013 | 2005 | |||||||||||||||||||||||||
| Wendy’s |
Morrow |
GA |
— | (14) | 755 | 922 | — | 1,677 | 20 | 7/31/2013 | 1990 | |||||||||||||||||||||||||
| Wendy’s |
Middletown |
OH |
— | (14) | 752 | 920 | — | 1,672 | 20 | 7/31/2013 | 1994 | |||||||||||||||||||||||||
| Wendy’s |
Rogers |
AR |
— | 579 | 912 | — | 1,491 | 25 | 6/27/2013 | 1995 | ||||||||||||||||||||||||||
| Wendy’s |
Searcy |
AR |
— | 247 | 905 | — | 1,152 | 25 | 6/27/2013 | 1978 | ||||||||||||||||||||||||||
| Wendy’s |
Groton |
CT |
— | 1,099 | 900 | — | 1,999 | 20 | 7/31/2013 | 1978 | ||||||||||||||||||||||||||
| Wendy’s |
Anderson |
SC |
— | 734 | 897 | — | 1,631 | 20 | 7/31/2013 | 1979 | ||||||||||||||||||||||||||
| Wendy’s |
Wytheville |
VA |
— | (14) | 598 | 897 | — | 1,495 | 20 | 7/31/2013 | 2003 | |||||||||||||||||||||||||
| Wendy’s |
Springdale |
AR |
— | 323 | 896 | — | 1,219 | 25 | 6/27/2013 | 1994 | ||||||||||||||||||||||||||
| Wendy’s |
Pendleton |
IN |
— | (14) | 448 | 895 | — | 1,343 | 25 | 6/27/2013 | 2005 | |||||||||||||||||||||||||
| Wendy’s |
Enid |
OK |
— | (14) | 158 | 893 | — | 1,051 | 20 | 7/31/2013 | 2003 | |||||||||||||||||||||||||
| Wendy’s |
Buckhannon |
WV |
— | (14) | 157 | 890 | — | 1,047 | 20 | 7/31/2013 | 1987 | |||||||||||||||||||||||||
| Wendy’s |
Parkersburg |
WV |
— | (14) | 295 | 885 | — | 1,180 | 19 | 7/31/2013 | 1979 | |||||||||||||||||||||||||
| Wendy’s |
Binghamton |
NY |
— | (14) | 293 | 879 | — | 1,172 | 19 | 7/31/2013 | 1978 | |||||||||||||||||||||||||
| Wendy’s |
Little Rock |
AR |
— | 278 | 878 | — | 1,156 | 24 | 6/27/2013 | 1976 | ||||||||||||||||||||||||||
| Wendy’s |
Batesville |
AR |
— | 155 | 878 | — | 1,033 | 19 | 7/31/2013 | 1995 | ||||||||||||||||||||||||||
| Wendy’s |
Buckeye Lake |
OH |
— | (14) | 864 | 877 | — | 1,741 | 24 | 6/27/2013 | 2000 | |||||||||||||||||||||||||
| Wendy’s |
Ripley |
WV |
— | (14) | 273 | 871 | — | 1,144 | 24 | 6/27/2013 | 1984 | |||||||||||||||||||||||||
| Wendy’s |
West Carrollton |
OH |
— | (14) | 708 | 865 | — | 1,573 | 19 | 7/31/2013 | 1979 | |||||||||||||||||||||||||
| Wendy’s |
Whitehall |
OH |
— | (14) | 716 | 863 | — | 1,579 | 24 | 6/27/2013 | 1983 | |||||||||||||||||||||||||
| Wendy’s |
North Myrtle Beach |
SC |
— | 464 | 861 | — | 1,325 | 19 | 7/31/2013 | 1983 | ||||||||||||||||||||||||||
| Wendy’s |
Hayes |
VA |
— | (14) | 304 | 859 | — | 1,163 | 24 | 6/27/2013 | 1992 | |||||||||||||||||||||||||
| Wendy’s |
Lynn Haven |
FL |
— | (14) | 446 | 852 | — | 1,298 | 24 | 6/27/2013 | 2005 | |||||||||||||||||||||||||
| Wendy’s |
Panama City |
FL |
— | (14) | 445 | 837 | — | 1,282 | 23 | 6/27/2013 | 1987 | |||||||||||||||||||||||||
| Wendy’s |
Conway |
AR |
— | 482 | 833 | — | 1,315 | 23 | 6/27/2013 | 1994 | ||||||||||||||||||||||||||
| Wendy’s |
Fayetteville |
AR |
— | 408 | 830 | — | 1,238 | 23 | 6/27/2013 | 1994 | ||||||||||||||||||||||||||
| Wendy’s |
Payson |
AZ |
— | 679 | 829 | — | 1,508 | 18 | 7/31/2013 | 1986 | ||||||||||||||||||||||||||
| Wendy’s |
Springdale |
AR |
— | 410 | 821 | — | 1,231 | 23 | 6/27/2013 | 1995 | ||||||||||||||||||||||||||
| Wendy’s |
Bridgeport |
WV |
— | (14) | 273 | 818 | — | 1,091 | 18 | 7/31/2013 | 1984 | |||||||||||||||||||||||||
| Wendy’s |
Milwaukee |
WI |
— | (14) | 810 | 810 | — | 1,620 | 18 | 7/31/2013 | 1979 | |||||||||||||||||||||||||
| Wendy’s |
Burlington |
WA |
— | 425 | 806 | — | 1,231 | 22 | 6/27/2013 | 1994 | ||||||||||||||||||||||||||
| Wendy’s |
Baltimore |
MD |
— | (14) | 760 | 802 | — | 1,562 | 22 | 6/27/2013 | 1995 | |||||||||||||||||||||||||
| Wendy’s |
The Dalles |
OR |
— | 201 | 802 | — | 1,003 | 18 | 7/31/2013 | 1994 | ||||||||||||||||||||||||||
F-120
Table of Contents
| Initial Costs | ||||||||||||||||||||||||||||||||||||
| Property |
City |
State |
Encumbrances at December 31, 2013 |
Land | Buildings, Fixtures and Improvements |
Costs Capitalized Subsequent to Acquisition |
Gross Amount Carried at December 31, 2013 (10) (11) |
Accumulated Depreciation (12) (13) |
Date Acquired |
Date of Construction |
||||||||||||||||||||||||||
| Wendy’s |
Eatontown |
NJ |
$ | — | (14) | $ | 651 | $ | 796 | $ | — | $ | 1,447 | $ | 17 | 7/31/2013 | 1987 | |||||||||||||||||||
| Wendy’s |
Baton Rouge |
LA |
— | 316 | 782 | — | 1,098 | 22 | 6/27/2013 | 1998 | ||||||||||||||||||||||||||
| Wendy’s |
Douglasville |
GA |
— | 605 | 776 | — | 1,381 | 21 | 6/27/2013 | 1993 | ||||||||||||||||||||||||||
| Wendy’s |
Lithia Springs |
GA |
— | (14) | 668 | 774 | — | 1,442 | 21 | 6/27/2013 | 1998 | |||||||||||||||||||||||||
| Wendy’s |
Little Rock |
AR |
— | 773 | 773 | — | 1,546 | 17 | 7/31/2013 | 1994 | ||||||||||||||||||||||||||
| Wendy’s |
West Chester |
OH |
— | (14) | 944 | 772 | — | 1,716 | 17 | 7/31/2013 | 1982 | |||||||||||||||||||||||||
| Wendy’s |
Titusville |
FL |
— | 414 | 770 | — | 1,184 | 17 | 7/31/2013 | 1996 | ||||||||||||||||||||||||||
| Wendy’s |
Titusville |
FL |
— | (14) | 415 | 761 | — | 1,176 | 21 | 6/27/2013 | 1984 | |||||||||||||||||||||||||
| Wendy’s |
Crossville |
TN |
— | (14) | 190 | 760 | — | 950 | 17 | 7/31/2013 | 1978 | |||||||||||||||||||||||||
| Wendy’s |
Anderson |
IN |
— | (14) | 505 | 757 | — | 1,262 | 17 | 7/31/2013 | 1995 | |||||||||||||||||||||||||
| Wendy’s |
Van Buren |
AR |
— | 197 | 748 | — | 945 | 21 | 6/27/2013 | 1994 | ||||||||||||||||||||||||||
| Wendy’s |
New Berlin |
WI |
— | (14) | 903 | 739 | — | 1,642 | 16 | 7/31/2013 | 1983 | |||||||||||||||||||||||||
| Wendy’s |
Anderson |
IN |
— | (14) | 872 | 736 | — | 1,608 | 20 | 6/27/2013 | 1978 | |||||||||||||||||||||||||
| Wendy’s |
Madison Heights |
MI |
— | (14) | 198 | 725 | — | 923 | 20 | 6/27/2013 | 1998 | |||||||||||||||||||||||||
| Wendy’s |
Savannah |
GA |
— | (14) | 720 | 720 | — | 1,440 | 16 | 7/31/2013 | 2001 | |||||||||||||||||||||||||
| Wendy’s |
Anderson |
IN |
— | (14) | 584 | 713 | — | 1,297 | 16 | 7/31/2013 | 1976 | |||||||||||||||||||||||||
| Wendy’s |
Bentonville |
AR |
— | 648 | 708 | — | 1,356 | 20 | 6/27/2013 | 1993 | ||||||||||||||||||||||||||
| Wendy’s |
Anderson |
IN |
— | (14) | 859 | 708 | — | 1,567 | 20 | 6/27/2013 | 1978 | |||||||||||||||||||||||||
| Wendy’s |
Cabot |
AR |
— | 524 | 707 | — | 1,231 | 20 | 6/27/2013 | 1991 | ||||||||||||||||||||||||||
| Wendy’s |
Mechanicsville |
VA |
— | (14) | 521 | 704 | — | 1,225 | 20 | 6/27/2013 | 1988 | |||||||||||||||||||||||||
| Wendy’s |
Vienna |
WV |
— | (14) | 301 | 702 | — | 1,003 | 15 | 7/31/2013 | 1976 | |||||||||||||||||||||||||
| Wendy’s |
Melbourne |
FL |
— | (14) | 550 | 681 | — | 1,231 | 19 | 6/27/2013 | 1993 | |||||||||||||||||||||||||
| Wendy’s |
Tinton Falls |
NJ |
— | 874 | 671 | — | 1,545 | 19 | 6/27/2013 | 1977 | ||||||||||||||||||||||||||
| Wendy’s |
Creedmoor |
NC |
— | 533 | 663 | — | 1,196 | 18 | 6/27/2013 | 1986 | ||||||||||||||||||||||||||
| Wendy’s |
Little Rock |
AR |
— | (14) | 532 | 650 | — | 1,182 | 14 | 7/31/2013 | 1978 | |||||||||||||||||||||||||
| Wendy’s |
Russellville |
AR |
— | 356 | 638 | — | 994 | 18 | 6/27/2013 | 1985 | ||||||||||||||||||||||||||
| Wendy’s |
Arkadelphia |
AR |
— | 225 | 633 | — | 858 | 18 | 6/27/2013 | 1990 | ||||||||||||||||||||||||||
| Wendy’s |
Greenville |
SC |
— | 516 | 631 | — | 1,147 | 14 | 7/31/2013 | 1975 | ||||||||||||||||||||||||||
| Wendy’s |
San Antonio |
TX |
— | 268 | 630 | — | 898 | 17 | 6/27/2013 | 1985 | ||||||||||||||||||||||||||
| Wendy’s |
Christiansburg |
VA |
— | (14) | 416 | 624 | — | 1,040 | 14 | 7/31/2013 | 1980 | |||||||||||||||||||||||||
| Wendy’s |
Little Rock |
AR |
— | 990 | 623 | — | 1,613 | 17 | 6/27/2013 | 1982 | ||||||||||||||||||||||||||
| Wendy’s |
Woodbridge |
VA |
— | (14) | 521 | 615 | — | 1,136 | 17 | 6/27/2013 | 1978 | |||||||||||||||||||||||||
| Wendy’s |
Indialantic |
FL |
— | (14) | 592 | 614 | — | 1,206 | 17 | 6/27/2013 | 1985 | |||||||||||||||||||||||||
| Wendy’s |
North Haven |
CT |
— | 729 | 610 | — | 1,339 | 17 | 6/27/2013 | 1980 | ||||||||||||||||||||||||||
| Wendy’s |
Conway |
AR |
— | 478 | 594 | — | 1,072 | 16 | 6/27/2013 | 1985 | ||||||||||||||||||||||||||
| Wendy’s |
Anniston |
AL |
— | (14) | 454 | 591 | — | 1,045 | 16 | 6/27/2013 | 1976 | |||||||||||||||||||||||||
| Wendy’s |
Merritt Island |
FL |
— | 720 | 589 | — | 1,309 | 13 | 7/31/2013 | 1990 | ||||||||||||||||||||||||||
| Wendy’s |
Bryant |
AR |
— | 529 | 575 | — | 1,104 | 16 | 6/27/2013 | 1995 | ||||||||||||||||||||||||||
| Wendy’s |
Spartanburg |
SC |
— | 699 | 572 | — | 1,271 | 13 | 7/31/2013 | 1977 | ||||||||||||||||||||||||||
| Wendy’s |
Port Orange |
FL |
— | (14) | 695 | 569 | — | 1,264 | 13 | 7/31/2013 | 1996 | |||||||||||||||||||||||||
| Wendy’s |
Cocoa |
FL |
— | (14) | 249 | 567 | — | 816 | 16 | 6/27/2013 | 1979 | |||||||||||||||||||||||||
| Wendy’s |
Ormond Beach |
FL |
— | (14) | 626 | 561 | — | 1,187 | 16 | 6/27/2013 | 1994 | |||||||||||||||||||||||||
| Wendy’s |
North Tazewell |
VA |
— | 124 | 560 | — | 684 | 16 | 6/27/2013 | 1980 | ||||||||||||||||||||||||||
| Wendy’s |
Stockbridge |
GA |
— | 480 | 558 | — | 1,038 | 15 | 6/27/2013 | 1897 | ||||||||||||||||||||||||||
| Wendy’s |
North Little Rock |
AR |
— | 420 | 551 | — | 971 | 15 | 6/27/2013 | 1978 | ||||||||||||||||||||||||||
| Wendy’s |
Memphis |
TN |
— | 227 | 530 | — | 757 | 12 | 7/31/2013 | 1980 | ||||||||||||||||||||||||||
| Wendy’s |
Panama City |
FL |
— | (14) | 461 | 529 | — | 990 | 15 | 6/27/2013 | 1984 | |||||||||||||||||||||||||
| Wendy’s |
Tallahassee |
FL |
— | (14) | 952 | 514 | — | 1,466 | 14 | 6/27/2013 | 1986 | |||||||||||||||||||||||||
| Wendy’s |
Austell |
GA |
— | (14) | 383 | 506 | — | 889 | 14 | 6/27/2013 | 1994 | |||||||||||||||||||||||||
| Wendy’s |
Indianapolis |
IN |
— | 214 | 505 | — | 719 | 14 | 6/27/2013 | 1985 | ||||||||||||||||||||||||||
| Wendy’s |
Tallahassee |
FL |
— | (14) | 855 | 505 | — | 1,360 | 14 | 6/27/2013 | 1986 | |||||||||||||||||||||||||
| Wendy’s |
Ormond Beach |
FL |
— | (14) | 503 | 503 | — | 1,006 | 11 | 7/31/2013 | 1984 | |||||||||||||||||||||||||
| Wendy’s |
Little Rock |
AR |
— | 501 | 501 | — | 1,002 | 11 | 7/31/2013 | 1983 | ||||||||||||||||||||||||||
| Wendy’s |
Bellevue |
NE |
— | (14) | 338 | 484 | — | 822 | 13 | 6/27/2013 | 1981 | |||||||||||||||||||||||||
| Wendy’s |
Eastman |
GA |
— | (14) | 258 | 473 | — | 731 | 13 | 6/27/2013 | 1996 | |||||||||||||||||||||||||
| Wendy’s |
Little Rock |
AR |
— | 605 | 463 | — | 1,068 | 13 | 6/27/2013 | 1987 | ||||||||||||||||||||||||||
| Wendy’s |
Fayetteville |
AR |
— | (14) | 463 | 463 | — | 926 | 10 | 7/31/2013 | 1989 | |||||||||||||||||||||||||
F-121
Table of Contents
| Initial Costs | ||||||||||||||||||||||||||||||||||||
| Property |
City |
State |
Encumbrances at December 31, 2013 |
Land | Buildings, Fixtures and Improvements |
Costs Capitalized Subsequent to Acquisition |
Gross Amount Carried at December 31, 2013 (10) (11) |
Accumulated Depreciation (12) (13) |
Date Acquired |
Date of Construction |
||||||||||||||||||||||||||
| Wendy’s |
San Antonio |
TX |
$ | — | $ | 410 | $ | 451 | $ | — | $ | 861 | $ | 13 | 6/27/2013 | 1987 | ||||||||||||||||||||
| Wendy’s |
Columbia |
SC |
— | 425 | 438 | — | 863 | 12 | 6/27/2013 | 1993 | ||||||||||||||||||||||||||
| Wendy’s |
Brunswick |
GA |
— | (14) | 306 | 435 | — | 741 | 12 | 6/27/2013 | 1985 | |||||||||||||||||||||||||
| Wendy’s |
Pine Bluff |
AR |
— | 105 | 433 | — | 538 | 12 | 6/27/2013 | 1978 | ||||||||||||||||||||||||||
| Wendy’s |
South Daytona |
FL |
— | (14) | 531 | 432 | — | 963 | 12 | 6/27/2013 | 1980 | |||||||||||||||||||||||||
| Wendy’s |
Starke |
FL |
— | 383 | 419 | — | 802 | 12 | 6/27/2013 | 1979 | ||||||||||||||||||||||||||
| Wendy’s |
Smyrna |
GA |
— | 693 | 416 | — | 1,109 | 12 | 6/27/2013 | 1990 | ||||||||||||||||||||||||||
| Wendy’s |
Hot Springs |
AR |
— | 593 | 395 | — | 988 | 9 | 7/31/2013 | 1974 | ||||||||||||||||||||||||||
| Wendy’s |
New Smyrna Beach |
FL |
— | (14) | 476 | 394 | — | 870 | 11 | 6/27/2013 | 1982 | |||||||||||||||||||||||||
| Wendy’s |
San Antonio |
TX |
— | 320 | 320 | — | 640 | 9 | 6/27/2013 | 1985 | ||||||||||||||||||||||||||
| Wendy’s |
Suitland |
MD |
— | (14) | 332 | 275 | — | 607 | 8 | 6/27/2013 | 1979 | |||||||||||||||||||||||||
| Wendy’s |
Landover |
MD |
— | (14) | 340 | 267 | — | 607 | 7 | 6/27/2013 | 1978 | |||||||||||||||||||||||||
| Wendy’s |
Springs |
TX |
— | 217 | 266 | — | 483 | 6 | 7/31/2013 | 1987 | ||||||||||||||||||||||||||
| Wendy’s |
Little Rock |
AR |
— | 762 | 258 | — | 1,020 | 7 | 6/27/2013 | 1977 | ||||||||||||||||||||||||||
| Wendy’s |
Titusville |
FL |
— | (14) | 528 | 239 | — | 767 | 7 | 6/27/2013 | 1978 | |||||||||||||||||||||||||
| Wendy’s |
Homewood |
AL |
— | 995 | — | — | 995 | — | 6/27/2013 | N/A | ||||||||||||||||||||||||||
| Wendy’s |
Columbia |
SC |
— | 1,368 | — | — | 1,368 | — | 6/27/2013 | N/A | ||||||||||||||||||||||||||
| Wendy’s |
Edmond |
OK |
— | 791 | — | — | 791 | — | 7/31/2013 | 1979 | ||||||||||||||||||||||||||
| West Fork Roadhouse |
Youngstown |
OH |
— | 139 | 232 | — | 371 | 7 | 6/27/2013 | 1976 | ||||||||||||||||||||||||||
| Whataburger |
El Campo |
TX |
— | 693 | 1,013 | — | 1,706 | 28 | 6/27/2013 | 1986 | ||||||||||||||||||||||||||
| Whataburger |
Edna |
TX |
— | (14) | 290 | 869 | — | 1,159 | 19 | 7/31/2013 | 1986 | |||||||||||||||||||||||||
| Whataburger |
Lubbock |
TX |
— | (14) | 432 | 647 | — | 1,079 | 14 | 7/31/2013 | 1992 | |||||||||||||||||||||||||
| Whataburger |
Ingleside |
TX |
— | 1,106 | 474 | — | 1,580 | 10 | 7/31/2013 | 1986 | ||||||||||||||||||||||||||
| Williams Fried Chicken |
Garland |
TX |
— | 265 | 137 | — | 402 | 4 | 6/27/2013 | 1983 | ||||||||||||||||||||||||||
| Winn Dixie |
Jacksonville |
FL |
— | (14) | 4,360 | 82,825 | — | 87,185 | 2,736 | 4/24/2013 | 2000 | |||||||||||||||||||||||||
| Zebb’s |
Amherst |
NY |
— | (14) | 150 | 1,347 | — | 1,497 | 33 | 7/31/2013 | 1994 | |||||||||||||||||||||||||
| Zebb’s |
Orchard Park |
NY |
— | (14) | 69 | 1,320 | — | 1,389 | 33 | 7/31/2013 | 2000 | |||||||||||||||||||||||||
| Zebb’s |
Rochester |
NY |
— | (14) | 126 | 1,137 | — | 1,263 | 28 | 7/31/2013 | 1990 | |||||||||||||||||||||||||
| Zebb’s |
New Hartford |
NY |
— | (14) | 122 | 1,095 | — | 1,217 | 27 | 7/31/2013 | 1970 | |||||||||||||||||||||||||
| Z’Tejas Grill |
Austin |
TX |
— | (14) | 837 | 1,797 | — | 2,634 | 52 | 6/27/2013 | 2007 | |||||||||||||||||||||||||
| Capitalized land value on DFLs |
— | 6,932 | — | — | 6,932 | — | ||||||||||||||||||||||||||||||
| Encumbrances allocated based on notes below |
2,152,878 | |||||||||||||||||||||||||||||||||||
|
|
|
|
|
|
|
|
|
|
|
|
|
|||||||||||||||||||||||||
| Total |
$ | 3,228,461 | $ | 1,379,453 | $ | 5,303,260 | $ | 9,610 | $ | 6,692,323 | $ | 205,941 | ||||||||||||||||||||||||
|
|
|
|
|
|
|
|
|
|
|
|
|
|||||||||||||||||||||||||
| (1) | These properties collateralize a senior corporate credit facility of up to $2.42 billion, which had $1.06 billion outstanding as of December 31, 2013. |
| (2) | These properties collateralize a $150.0 million secured credit facility, which had $150.0 million outstanding as of December 31, 2013. |
| (3) | These properties collateralize a $54.3 million mortgage note payable of which $54.3 million was outstanding as of December 31, 2013. |
| (4) | These properties collateralize a $48.5 million mortgage note payable of which $48.5 million was outstanding as of December 31, 2013. |
| (5) | These properties collateralize a $36.6 million mortgage note payable of which $36.6 million was outstanding as of December 31, 2013. |
| (6) | These properties collateralize a $12.3 million mortgage note payable of which $12.3 million was outstanding as of December 31, 2013. |
| (7) | These properties collateralize a $15.0 million mortgage note payable of which $15.0 million was outstanding as of December 31, 2013. |
| (8) | These properties collateralize a $4.5 million mortgage note payable of which $4.5 million was outstanding as of December 31, 2013. |
| (9) | These properties collateralize a $11.9 million mortgage note payable of which $11.9 million was outstanding as of December 31, 2013. |
| (10) | Acquired intangible lease assets allocated to individual properties in the amount of $758.4 million are not reflected in the table above. |
| (11) | The tax basis of aggregate land, buildings and improvements as of December 31, 2013 was $5.1 million. |
| (12) | The accumulated depreciation column excludes $48.1 million of amortization associated with acquired intangible lease assets. |
| (13) | Depreciation is computed using the straight-line method over the estimated useful lives of up to forty years for buildings, five to fifteen years for building fixtures and improvements. |
| (14) | These properties collateralize a senior corporate facility of up to $800.0 million, which had $760.0 million outstanding as of December 31, 2013. |
F-122
Table of Contents
A summary of activity for real estate and accumulated depreciation for the year ended December 31, 2013 (amounts in thousands):
| Year ended December 31, 2013 | ||||
| Real estate investments, at cost: |
||||
| Balance at beginning of year |
$ | 1,684,115 | ||
| Additions — acquisitions and improvements |
5,008,208 | |||
|
|
|
|||
| Balance at end of the year |
$ | 6,692,323 | ||
|
|
|
|||
| Accumulated depreciation: |
||||
| Balance at beginning of year |
$ | 45,050 | ||
| Depreciation expense |
160,891 | |||
|
|
|
|||
| Balance at end of the year |
$ | 205,941 | ||
|
|
|
|||
F-123
Table of Contents
ARC PROPERTIES OPERATING PARTNERSHIP, L.P.
SCHEDULE IV
December 31, 2013
(In thousands)
| Description |
Location | Interest Rate |
Final Maturity Date |
Periodic Payment Terms |
Prior Liens |
Face Amount of Mortgages |
Carrying Amount of Mortgages |
Principal Amount of Loans Subject to Delinquent Principal or Interest |
||||||||||||||||||
| Long-Term Mortgage Loans |
||||||||||||||||||||||||||
| Bank Of America, N.A. |
Mt. Airy, MD | 6.42 | % | Dec 2026 | Principal and interest are payable monthly at a varying amount over the life to maturity | $ | 2,973 | $ | 3,329 | $ | — | |||||||||||||||
| CVS Caremark Corporation |
Evansville, IN | 6.22 | % | Jan 2033 | Principal and interest are payable monthly at a level amount over the life to maturity | 2,932 | 3,268 | — | ||||||||||||||||||
| CVS Caremark Corporation |
Greensboro, GA | 6.52 | % | Jan 2030 | Principal and interest are payable monthly at a level amount over the life to maturity | 1,133 | 1,289 | — | ||||||||||||||||||
| CVS Caremark Corporation |
Shelby Twp., MI | 5.98 | % | Jan 2031 | Principal and interest are payable monthly at a varying amount over the life to maturity | 2,237 | 2,443 | — | ||||||||||||||||||
| Koninklijke Ahold, N.V. |
Bensalem, PA | 7.24 | % | May 2020 | Principal and interest are payable monthly at a varying amount over the life to maturity | 2,083 | 2,384 | — | ||||||||||||||||||
| Lowes Companies, Inc. |
Framingham, MA | N/A | Sep 2031 | Principal and interest are payable monthly at a varying amount over the life to maturity | 5,692 | 1,399 | — | |||||||||||||||||||
| Walgreen Co. |
Dallas, TX | 6.46 | % | Dec 2029 | Principal and interest are payable monthly at a level amount over the life to maturity | 2,851 | 3,231 | — | ||||||||||||||||||
| Walgreen Co. |
Nacogdoches, TX | 6.8 | % | Sep 2030 | Principal and interest are payable monthly at a level amount over the life to maturity | 3,084 | 3,561 | — | ||||||||||||||||||
| Walgreen Co. |
Rosemead, CA | 6.26 | % | Dec 2029 | Principal and interest are payable monthly at a level amount over the life to maturity | 4,369 | 4,888 | — | ||||||||||||||||||
|
|
|
|
|
|
|
|||||||||||||||||||||
| $ | 27,354 | $ | 25,792 | $ | — | |||||||||||||||||||||
| Corporate Credit Notes |
||||||||||||||||||||||||||
| Federal Express Corporation |
Bellingham, WA | 5.78 | % | Mar 2015 | Principal and interest are payable monthly at a level amount over the life to maturity | $ | 81 | $ | 83 | $ | — | |||||||||||||||
| Lowes Companies, Inc. |
N. Windham, ME | 5.28 | % | Sep 2015 | Principal and interest are payable monthly at a level amount over the life to maturity | 256 | 261 | — | ||||||||||||||||||
| Walgreen Co. |
Jefferson City, TN | 5.49 | % | May 2015 | Principal and interest are payable monthly at a level amount over the life to maturity | 140 | 143 | — | ||||||||||||||||||
|
|
|
|
|
|
|
|||||||||||||||||||||
| $ | 477 | $ | 487 | $ | — | |||||||||||||||||||||
|
|
|
|
|
|
|
|||||||||||||||||||||
| Total |
$ | 27,831 | $ | 26,279 | $ | — | ||||||||||||||||||||
|
|
|
|
|
|
|
|||||||||||||||||||||
F-124
Table of Contents
| Carrying Amount of Mortgages |
||||
| Balance — November 5, 2013 |
$ | 26,457 | ||
| Additions during the year: |
||||
| New Loan Investments |
— | |||
| Deductions during the year: |
||||
| Principal received |
(164 | ) | ||
| Allowance for loan losses |
— | |||
| Amortization of unearned discounts and premiums |
(14 | ) | ||
|
|
|
|||
| Balance — December 31, 2013 |
$ | 26,279 | ||
|
|
|
|||
F-125
Table of Contents
ARC PROPERTIES OPERATING PARTNERSHIP, L.P.
(In thousands, except for unit data)
(Unaudited)
| June 30, 2014 |
December 31, 2013 |
|||||||
| ASSETS | ||||||||
| Real estate investments, at cost: |
||||||||
| Land |
$ | 3,361,195 | $ | 1,379,453 | ||||
| Buildings, fixtures and improvements |
12,445,972 | 5,294,342 | ||||||
| Land and construction in progress |
62,594 | 22,230 | ||||||
| Acquired intangible lease assets |
2,231,675 | 759,786 | ||||||
|
|
|
|
|
|||||
| Total real estate investments, at cost |
18,101,436 | 7,455,811 | ||||||
| Less: accumulated depreciation and amortization |
(661,005 | ) | (267,352 | ) | ||||
|
|
|
|
|
|||||
| Total real estate investments, net |
17,440,431 | 7,188,459 | ||||||
| Investment in unconsolidated entities |
102,047 | — | ||||||
| Investment in direct financing leases, net |
62,094 | 66,112 | ||||||
| Investment securities, at fair value |
219,204 | 62,067 | ||||||
| Loans held for investment, net |
97,587 | 26,279 | ||||||
| Cash and cash equivalents |
193,690 | 52,725 | ||||||
| Restricted cash |
69,544 | 35,881 | ||||||
| Intangible assets, net |
347,618 | — | ||||||
| Deferred costs and other assets, net |
405,056 | 279,261 | ||||||
| Goodwill |
2,304,880 | 96,720 | ||||||
| Due from affiliates |
73,336 | — | ||||||
|
|
|
|
|
|||||
| Total assets |
$ | 21,315,487 | $ | 7,807,504 | ||||
|
|
|
|
|
|||||
| LIABILITIES AND EQUITY | ||||||||
| Mortgage notes payable, net |
$ | 4,227,494 | $ | 1,301,114 | ||||
| Corporate bonds, net |
2,546,089 | — | ||||||
| Convertible debt due to General Partner, net |
975,003 | 972,490 | ||||||
| Credit facilities |
1,896,000 | 1,969,800 | ||||||
| Other debt, net |
146,158 | 104,804 | ||||||
| Below-market lease liabilities, net |
283,518 | 77,789 | ||||||
| Accounts payable and accrued expenses |
154,741 | 808,489 | ||||||
| Deferred rent, derivative and other liabilities |
218,023 | 40,207 | ||||||
| Distributions payable |
3,837 | 10,278 | ||||||
| Due to affiliates |
835 | — | ||||||
|
|
|
|
|
|||||
| Total liabilities |
10,451,698 | 5,284,971 | ||||||
|
|
|
|
|
|||||
| General partner’s Series D Preferred equity—21,735,008 General Partner Preferred Units issued and outstanding at June 30, 2014 and December 31, 2013, respectively |
269,299 | 269,299 | ||||||
|
|
|
|
|
|||||
| General partner’s common equity—907,920,494 and 239,234,725 General Partner OP Units issued and outstanding at June 30, 2014 and December 31, 2013, respectively |
9,918,549 | 1,686,103 | ||||||
| General partner’s preferred equity (excluding Series D Preferred equity)—42,730,013 and 42,199,547 General Partner Preferred Units issued and outstanding at June 30, 2014 and December 31, 2013, respectively |
367,514 | 391,482 | ||||||
| Limited partners’ common equity—35,515,912 and 17,832,273 Limited Partner OP Units issued and outstanding at June 30, 2014 and December 31, 2013, respectively |
269,634 | 151,721 | ||||||
| Limited partners’ preferred equity—190,999 and 721,645 Limited Partner Preferred Units issued and outstanding at June 30, 2014 and December 31, 2013, respectively |
3,435 | 14,614 | ||||||
| Accumulated other comprehensive income |
12,392 | 7,666 | ||||||
|
|
|
|
|
|||||
| Total partners’ equity |
10,571,524 | 2,251,586 | ||||||
| Non-controlling interests |
22,966 | 1,648 | ||||||
|
|
|
|
|
|||||
| Total equity |
10,594,490 | 2,253,234 | ||||||
|
|
|
|
|
|||||
| Total liabilities and equity |
$ | 21,315,487 | $ | 7,807,504 | ||||
|
|
|
|
|
|||||
The accompanying notes are an integral part of these statements.
F-126
Table of Contents
ARC PROPERTIES OPERATING PARTNERSHIP, L.P.
CONSOLIDATED STATEMENTS OF OPERATIONS
(In thousands, except for per unit data)
(Unaudited)
| Three Months Ended June 30, |
Six Months Ended June 30, |
|||||||||||||||
| 2014 | 2013 | 2014 | 2013 | |||||||||||||
| Revenues: |
||||||||||||||||
| Rental income |
$ | 314,843 | $ | 52,664 | $ | 559,288 | $ | 93,651 | ||||||||
| Direct financing lease income |
1,181 | — | 2,187 | — | ||||||||||||
| Operating expense reimbursements |
28,545 | 2,281 | 49,641 | 4,191 | ||||||||||||
| Cole Capital revenue |
37,412 | — | 91,479 | — | ||||||||||||
|
|
|
|
|
|
|
|
|
|||||||||
| Total revenues |
381,981 | 54,945 | 702,595 | 97,842 | ||||||||||||
|
|
|
|
|
|
|
|
|
|||||||||
| Operating expenses: |
||||||||||||||||
| Cole Capital reallowed fees and commissions |
7,068 | — | 41,504 | — | ||||||||||||
| Acquisition related |
8,453 | 37,289 | 20,337 | 47,616 | ||||||||||||
| Merger and other transaction related |
13,286 | 6,393 | 235,478 | 144,162 | ||||||||||||
| Property operating |
39,372 | 3,086 | 69,030 | 5,635 | ||||||||||||
| General and administrative |
19,063 | 2,361 | 44,748 | 3,815 | ||||||||||||
| Equity-based compensation |
9,338 | 3,458 | 31,848 | 4,339 | ||||||||||||
| Depreciation and amortization |
258,993 | 33,752 | 424,356 | 60,505 | ||||||||||||
|
|
|
|
|
|
|
|
|
|||||||||
| Total operating expenses |
355,573 | 86,339 | 867,301 | 266,072 | ||||||||||||
|
|
|
|
|
|
|
|
|
|||||||||
| Operating income (loss) |
26,408 | (31,394 | ) | (164,706 | ) | (168,230 | ) | |||||||||
|
|
|
|
|
|
|
|
|
|||||||||
| Other (expense) income: |
||||||||||||||||
| Interest expense, net |
(99,635 | ) | (11,068 | ) | (216,347 | ) | (17,124 | ) | ||||||||
| Other income, net |
6,526 | 1,167 | 10,915 | 2,020 | ||||||||||||
| Gain (loss) on derivative instruments, net |
21,926 | (40 | ) | 1,729 | (45 | ) | ||||||||||
| Loss on contingent value rights |
— | (31,134 | ) | — | (31,134 | ) | ||||||||||
| Gain on disposition of properties, net |
1,510 | — | 4,489 | — | ||||||||||||
| Gain on sale of investments |
— | — | — | 451 | ||||||||||||
|
|
|
|
|
|
|
|
|
|||||||||
| Total other expenses, net |
(69,673 | ) | (41,075 | ) | (199,214 | ) | (45,832 | ) | ||||||||
|
|
|
|
|
|
|
|
|
|||||||||
| Net loss from continuing operations |
(43,265 | ) | (72,469 | ) | (363,920 | ) | (214,062 | ) | ||||||||
|
|
|
|
|
|
|
|
|
|||||||||
| Discontinued operations: |
||||||||||||||||
| Income from operations of held for sale properties |
— | 36 | — | 20 | ||||||||||||
| Gain on held for sale properties |
— | — | — | 14 | ||||||||||||
|
|
|
|
|
|
|
|
|
|||||||||
| Net income from discontinued operations |
— | 36 | — | 34 | ||||||||||||
|
|
|
|
|
|
|
|
|
|||||||||
| Net loss |
(43,265 | ) | (72,433 | ) | (363,920 | ) | (214,028 | ) | ||||||||
| Net loss attributable to non-controlling interests |
(272 | ) | — | (80 | ) | — | ||||||||||
|
|
|
|
|
|
|
|
|
|||||||||
| Net loss attributable to the unitholders |
(43,537 | ) | (72,433 | ) | (364,000 | ) | (214,028 | ) | ||||||||
| Less: Dividends attributable to preferred units |
22,016 | 158 | 44,443 | 315 | ||||||||||||
| Less: Dividends attributable to participating securities |
1,075 | 75 | 2,280 | 110 | ||||||||||||
|
|
|
|
|
|
|
|
|
|||||||||
| Net loss attributable to common unitholders |
$ | (66,628 | ) | $ | (72,666 | ) | $ | (410,723 | ) | $ | (214,453 | ) | ||||
|
|
|
|
|
|
|
|
|
|||||||||
| Basic and diluted net loss per share attributable to common unitholders |
$ | (0.08 | ) | $ | (0.35 | ) | $ | (0.58 | ) | $ | (1.12 | ) | ||||
The accompanying notes are an integral part of these statements.
F-127
Table of Contents
ARC PROPERTIES OPERATING PARTNERSHIP, L.P.
CONSOLIDATED STATEMENTS OF COMPREHENSIVE LOSS
(In thousands)
(Unaudited)
| Three Months Ended June 30, |
Six Months Ended June 30, |
|||||||||||||||
| 2014 | 2013 | 2014 | 2013 | |||||||||||||
| Net loss attributable to unitholders |
$ | (42,993 | ) | $ | (72,433 | ) | $ | (363,840 | ) | $ | (214,028 | ) | ||||
|
|
|
|
|
|
|
|
|
|||||||||
| Other comprehensive (loss) income: |
||||||||||||||||
| Designated derivatives, fair value adjustments |
(6,883 | ) | 14,058 | (4,247 | ) | 12,881 | ||||||||||
| Unrealized gain (loss) on investment securities, net |
5,878 | (1,793 | ) | 8,973 | (1,365 | ) | ||||||||||
|
|
|
|
|
|
|
|
|
|||||||||
| Total other comprehensive (loss) income |
(1,005 | ) | 12,265 | 4,726 | 11,516 | |||||||||||
|
|
|
|
|
|
|
|
|
|||||||||
| Total comprehensive loss attributable to unitholders |
$ | (43,998 | ) | $ | (60,168 | ) | $ | (359,114 | ) | $ | (202,512 | ) | ||||
|
|
|
|
|
|
|
|
|
|||||||||
The accompanying notes are an integral part of these statements.
F-128
Table of Contents
ARC PROPERTIES OPERATING PARTNERSHIP, L.P.
CONSOLIDATED STATEMENT OF CHANGES IN EQUITY
(In thousands, except for unit data)
(Unaudited)
| Preferred Units | Common Units | |||||||||||||||||||||||||||||||||||||||||||||||
| Number of General Partner Preferred Units |
General Partner’s Equity |
Number of Limited Partner Preferred Units |
Limited Partners’ Equity |
Number of General Partner OP Units |
General Partner’s Equity |
Number of Limited Partner OP Units |
Limited Partners’ Equity |
Accumulated Other Comprehensive Income |
Total Partners’ Equity |
Non- Controlling Interests |
Total Equity |
|||||||||||||||||||||||||||||||||||||
| Balance, December 31, 2013 |
42,199,547 | $ | 391,482 | 721,465 | $ | 14,614 | 239,234,725 | $ | 1,686,103 | 17,832,273 | $ | 151,721 | $ | 7,666 | $ | 2,251,586 | $ | 1,648 | $ | 2,253,234 | ||||||||||||||||||||||||||||
| Issuance of OP Units, net |
— | — | — | — | 662,305,318 | 8,925,207 | — | — | — | 8,925,207 | — | 8,925,207 | ||||||||||||||||||||||||||||||||||||
| Conversion of Limited Partner Common Units to General Partner Common Units |
— | — | — | — | 1,017,355 | 14,725 | (1,017,355 | ) | (14,725 | ) | — | — | — | — | ||||||||||||||||||||||||||||||||||
| Conversion of Limited Partner Preferred Units to General Partner Preferred Units |
530,466 | 10,805 | (530,466 | ) | (10,805 | ) | — | — | — | — | — | — | — | — | ||||||||||||||||||||||||||||||||||
| Issuance of restricted units and LTIPs, net |
— | — | — | — | 5,363,096 | (1,282 | ) | 10,744,697 | — | — | (1,282 | ) | — | (1,282 | ) | |||||||||||||||||||||||||||||||||
| Equity-based compensation |
— | — | — | — | — | 22,487 | — | 9,361 | — | 31,848 | — | 31,848 | ||||||||||||||||||||||||||||||||||||
| Distributions declared on General Partner OP Units |
— | — | — | — | — | (368,106 | ) | — | — | — | (368,106 | ) | — | (368,106 | ) | |||||||||||||||||||||||||||||||||
| Issuance of Limited Partner OP Units, net |
— | — | — | — | — | — | 7,956,297 | 153,885 | — | 153,885 | — | 153,885 | ||||||||||||||||||||||||||||||||||||
| Distributions to Limited Partner OP Units. LTIPs and noncontrolling interest holders |
— | — | — | — | — | — | — | (15,617 | ) | — | (15,617 | ) | (801 | ) | (16,418 | ) | ||||||||||||||||||||||||||||||||
| Distributions to restricted units |
— | — | — | — | — | (2,280 | ) | — | — | — | (2,280 | ) | — | (2,280 | ) | |||||||||||||||||||||||||||||||||
| Distributions to preferred units |
— | (34,773 | ) | — | (374 | ) | — | (9,296 | ) | — | — | — | (44,443 | ) | — | (44,443 | ) | |||||||||||||||||||||||||||||||
| Contributions from non-controlling interest holders |
— | — | — | — | — | — | — | — | — | — | 1,043 | 1,043 | ||||||||||||||||||||||||||||||||||||
| Non-controlling interests retained in Cole Merger |
— | — | — | — | — | — | — | — | — | — | 20,996 | 20,996 | ||||||||||||||||||||||||||||||||||||
| Net loss |
— | — | — | — | — | (349,009 | ) | — | (14,991 | ) | — | (364,000 | ) | 80 | (363,920 | ) | ||||||||||||||||||||||||||||||||
| Other comprehensive income |
— | — | — | — | — | — | — | — | 4,726 | 4,726 | — | 4,726 | ||||||||||||||||||||||||||||||||||||
|
|
|
|
|
|
|
|
|
|
|
|
|
|
|
|
|
|
|
|
|
|
|
|
|
|||||||||||||||||||||||||
| Balance, June 30, 2014 |
42,730,013 | $ | 367,514 | 190,999 | $ | 3,435 | 907,920,494 | $ | 9,918,549 | 35,515,912 | $ | 269,634 | $ | 12,392 | $ | 10,571,524 | $ | 22,966 | $ | 10,594,490 | ||||||||||||||||||||||||||||
|
|
|
|
|
|
|
|
|
|
|
|
|
|
|
|
|
|
|
|
|
|
|
|
|
|||||||||||||||||||||||||
The accompanying notes are an integral part of these statements.
F-129
Table of Contents
ARC PROPERTIES OPERATING PARTNERSHIP, L.P.
CONSOLIDATED STATEMENTS OF CASH FLOWS
(In thousands) (Unaudited)
| Six Months Ended June 30, |
||||||||
| 2014 | 2013 | |||||||
| Cash flows from operating activities: |
||||||||
| Net loss |
$ | (363,920 | ) | $ | (214,028 | ) | ||
| Adjustments to reconcile net loss to net cash provided by (used in) operating activities: |
||||||||
| Issuance of common units in connection with the ARCT III and ARCT IV mergers |
153,885 | 108,247 | ||||||
| Depreciation and amortization |
452,446 | 64,243 | ||||||
| Gain on disposition of properties |
(4,489 | ) | (14 | ) | ||||
| Equity-based compensation |
31,848 | 6,717 | ||||||
| Equity in income of unconsolidated entities |
385 | — | ||||||
| Loss on derivative instruments |
8,048 | 45 | ||||||
| Gain on sale of investments, net |
— | (451 | ) | |||||
| Unrealized loss on contingent value rights obligations, net of settlement payments |
— | 31,134 | ||||||
| Gain on extinguishment of debt |
(8,398 | ) | — | |||||
| Changes in assets and liabilities: |
||||||||
| Investment in direct financing leases |
525 | — | ||||||
| Deferred costs and other assets, net |
(62,175 | ) | (10,300 | ) | ||||
| Due from affiliates |
(5,335 | ) | — | |||||
| Accounts payable and accrued expenses |
(133,960 | ) | 4,554 | |||||
| Deferred rent, derivative and other liabilities |
(35,298 | ) | 2,676 | |||||
| Due to affiliates |
223 | — | ||||||
|
|
|
|
|
|||||
| Net cash provided by (used in) operating activities |
33,785 | (7,177 | ) | |||||
|
|
|
|
|
|||||
| Cash flows from investing activities: |
||||||||
| Investments in real estate and other assets |
(1,246,588 | ) | (2,129,677 | ) | ||||
| Acquisition of a real estate business, net of cash acquired |
(755,701 | ) | — | |||||
| Investment in direct financing leases |
— | (76,410 | ) | |||||
| Capital expenditures and investments in build-to-suit properties |
(46,649 | ) | (30 | ) | ||||
| Principal repayments received from borrowers |
4,155 | — | ||||||
| Investments in unconsolidated entities |
(2,500 | ) | — | |||||
| Return of investment from unconsolidated entities |
4,033 | — | ||||||
| Proceeds from disposition of properties |
95,321 | — | ||||||
| Investment in intangible assets |
(266 | ) | — | |||||
| Investment in other assets |
— | (1,041 | ) | |||||
| Deposits for real estate investments |
(129,602 | ) | (47,086 | ) | ||||
| Uses and refunds of deposits for real estate investments |
196,075 | — | ||||||
| Purchases of investment securities |
— | (81,460 | ) | |||||
| Line of credit advances to affiliates |
(80,300 | ) | — | |||||
| Line of credit repayments from affiliates |
15,600 | — | ||||||
| Proceeds from sale of investment securities |
— | 44,188 | ||||||
|
|
|
|
|
|||||
| Net cash used in investing activities |
(1,946,422 | ) | (2,291,516 | ) | ||||
|
|
|
|
|
|||||
| Cash flows from financing activities: |
||||||||
| Proceeds from mortgage notes payable |
718,275 | 6,924 | ||||||
| Payments on mortgage notes payable |
(876,874 | ) | — | |||||
| Payments on other debt |
(7,524 | ) | — | |||||
| Proceeds from credit facilities |
3,246,000 | 825,000 | ||||||
| Payments on credit facilities |
(4,628,800 | ) | (349,604 | ) | ||||
| Proceeds from corporate bonds |
2,545,760 | — | ||||||
| Payments of deferred financing costs |
(80,515 | ) | (40,488 | ) | ||||
| Repurchases of OP Units |
— | (350,396 | ) | |||||
| Proceeds from issuances of preferred units |
— | 445,000 | ||||||
| Proceeds from issuances of OP Units, net of offering costs |
1,595,735 | 1,810,116 | ||||||
| Consideration to Former Manager for internalization |
— | (3,035 | ) | |||||
| Contributions from non-controlling interest holders |
1,043 | 29,758 | ||||||
| Distributions to non-controlling interest holders |
(16,418 | ) | (3,111 | ) | ||||
| Distributions paid |
(427,541 | ) | (90,740 | ) | ||||
| Change in restricted cash |
(15,539 | ) | (844 | ) | ||||
|
|
|
|
|
|||||
| Net cash provided by financing activities |
2,053,602 | 2,278,580 | ||||||
|
|
|
|
|
|||||
| Net change in cash and cash equivalents |
140,965 | (20,113 | ) | |||||
| Cash and cash equivalents, beginning of period |
52,725 | 292,575 | ||||||
|
|
|
|
|
|||||
| Cash and cash equivalents, end of period |
$ | 193,690 | $ | 272,462 | ||||
|
|
|
|
|
|||||
| Supplemental Disclosures: |
||||||||
| Cash paid for interest |
$ | 139,478 | $ | 11,004 | ||||
| Cash paid for income taxes |
$ | 7,622 | $ | 382 | ||||
| Non-cash investing and financing activities: |
||||||||
| Common stock issued through distribution reinvestment plan |
$ | — | $ | 20,619 | ||||
The accompanying notes are an integral part of these statements.
F-130
Table of Contents
ARC PROPERTIES OPERATING PARTNERSHIP, L.P.
NOTES TO CONSOLIDATED FINANCIAL STATEMENTS
June 30, 2014
(Unaudited)
Note 1—Organization
ARC Properties Operating Partnership, L.P. (together with its subsidiaries, the “Operating Partnership”) is a Delaware limited partnership formed by American Realty Capital Properties, Inc. (the “General Partner” or “ARCP”), the Operating Partnership’s general partner, on January 13, 2011 to conduct the business of acquiring, owning and operating single-tenant, freestanding commercial real estate properties. The Operating Partnership is the entity through which substantially all of the General Partner’s operations are conducted. The actions of the Operating Partnership and its relationship with ARCP are governed by that certain Third Amended and Restated Agreement of Limited Partnership (the “LPA”), effective as of January 3, 2014. The General Partner does not have any significant assets other than its investment in the Operating Partnership. Therefore, the assets and liabilities of the General Partner and the Operating Partnership are substantially the same. Additionally, pursuant to the LPA, all administrative expenses and expenses associated with the formation and continuity of existence and operation of the General Partner incurred by the General Partner on the Operating Partnership’s behalf shall be treated as expenses of the Operating Partnership. Further, when the General Partner issues any equity instrument that has been approved by the General Partner’s board of directors to date, the LPA requires the Operating Partnership to issue the General Partner equity instruments with substantially similar terms. The LPA will be amended to provide for the issuance of any additional class of equivalent equity instruments to the extent the General Partner’s board of directors authorizes the issuance of any new class of equity securities.
The General Partner, a self-managed real estate investment trust (“REIT”), holds 97.3% of the common equity interests (“OP Units”) in the Operating Partnership as of June 30, 2014. As of June 30, 2014, certain affiliates of the General Partner and certain unaffiliated investors are limited partners and owners of 1.7% and 1.0%, respectively, of the OP units in the Operating Partnership. Under the limited partnership agreement, after holding OP Units of limited partner interests in the Operating Partnership (“Limited Partner OP Units”) for a period of one year, unless otherwise consented to by the General Partner, holders of Limited Partner OP Units have the right to redeem the Limited Partner OP Units for the cash value of a corresponding number of shares of the General Partner’s common stock or, at the option of the General Partner, a corresponding number of ARCP common shares. In the event that the Limited Partner OP Units are converted into ARCP common shares, the Operating Partnership will issue ARCP an equivalent number of OP Units with General Partner interests (“General Partner OP Units”). The remaining rights of the holders of Limited Partner OP Units are limited and do not include the ability to replace the General Partner or to approve the sale, purchase or refinancing of the Operating Partnership’s assets.
The Operating Partnership acts on behalf of the General Partner and therefore executes ARCP’s focus on investing in properties that are net leased to credit tenants, which are generally large public companies with investment-grade ratings and other creditworthy tenants. ARCP’s long-term business strategy is to acquire a diverse portfolio consisting of approximately 70% long-term leases and 30% medium-term leases, with an average portfolio remaining lease term of approximately 10 to 12 years. ARCP considers properties that are leased on a “medium-term” basis to mean properties originally leased long-term (ten years or longer) that currently have a primary remaining lease duration of generally three to eight years, on average. ARCP seeks to acquire granular, self-originated single-tenant net lease assets, which may be purchased through sale-leaseback transactions, small portfolios and build-to-suit opportunities, to the extent they are appropriate in terms of capitalization rate and scale. ARCP expects this investment strategy to provide for stable income from credit tenants and to provide for growth opportunities from re-leasing of current below market leases.
F-131
Table of Contents
ARC PROPERTIES OPERATING PARTNERSHIP, L.P.
NOTES TO CONSOLIDATED FINANCIAL STATEMENTS
June 30, 2014
(Unaudited)
On behalf of ARCP, the Operating Partnership has advanced ARCP’s investment objectives by growing ARCP’s net lease portfolio through organic acquisitions and also through strategic mergers and acquisitions. See Note 2—Mergers and Acquisitions.
During the year ended December 31, 2013, ARC Properties Advisors, LLC (the General Partner’s “Former Manager”), a wholly owned subsidiary of AR Capital, LLC (“ARC”), managed ARCP’s affairs on a day-to-day basis and, as a result, the Operating Partnership’s actions were generally externally managed, with the exception of certain acquisition, accounting and portfolio management services performed by employees of the Operating Partnership. In August 2013, the General Partner’s board of directors determined that it was in the best interests of ARCP and its stockholders to become self-managed, and ARCP completed its transition to self-management on January 8, 2014. In connection with becoming self-managed, the General Partner terminated the management agreement with the Former Manager, and the Operating Partnership entered into employment and incentive compensation arrangements with ARCP’s executives and acquired from the Former Manager certain assets necessary for its operations.
On June 11, 2014, the Operating Partnership, through indirect subsidiaries of the Operating Partnership (the “Sellers”), entered into an agreement of purchase and sale with BRE DDR Retail Holdings III LLC (the “Purchaser”), an entity indirectly jointly owned by affiliates of Blackstone Real Estate Partners VII L.P. and DDR Corp., by which the Sellers have agreed to sell to the Purchaser and the Purchaser has agreed to purchase from the Sellers 67 multi-tenant properties and nine single-tenant properties and the adjacent land and related property (the “Multi-Tenant Portfolio”). The purchase price of the Multi-Tenant Portfolio is $1.975 billion, subject to customary real estate adjustments. Properties may be excluded from the transaction in certain circumstances, in which case the purchase price will be reduced by the portion of the purchase price allocated to the excluded properties.
Note 2—Mergers and Acquisitions
Completed Mergers and Significant Acquisitions
American Realty Capital Trust III, Inc. Merger
On December 14, 2012, the General Partner entered into an Agreement and Plan of Merger (the “ARCT III Merger Agreement”) with American Realty Capital Trust III, Inc. (“ARCT III”) and certain subsidiaries of each company. The ARCT III Merger Agreement provided for the merger of ARCT III with and into a subsidiary of the General Partner (the “ARCT III Merger”). The ARCT III Merger was consummated on February 28, 2013 (the “ARCT III Merger Date”).
Pursuant to the terms and subject to the conditions set forth in the ARCT III Merger Agreement, each outstanding share of common stock of ARCT III, including restricted shares which became vested, was converted into the right to receive (i) 0.95 of a unit of ARCP’s common stock (the “ARCT III Exchange Ratio”) or (ii) $12.00 in cash. In addition, each outstanding unit of equity ownership of American Realty Capital Operating Partnership III, L.P. (the “ARCT III OP”) was converted into the right to receive 0.95 of the same class of unit of equity ownership in the Operating Partnership.
Upon the closing of the ARCT III Merger on February 28, 2013, the Operating Partnership, on ARCP’s behalf, paid an aggregate of $350 million in cash for 29.2 million shares, or 16.5% of the then outstanding shares of ARCT III’s common stock (which is equivalent to 27.7 million shares of ARCP’s common stock based on the
F-132
Table of Contents
ARC PROPERTIES OPERATING PARTNERSHIP, L.P.
NOTES TO CONSOLIDATED FINANCIAL STATEMENTS
June 30, 2014
(Unaudited)
ARCT III Exchange Ratio). In addition, 140.7 million shares of ARCP’s common stock were issued in exchange for 148.1 million shares of ARCT III’s common stock adjusted for the ARCT III Exchange Ratio. In accordance with the LPA, the Operating Partnership issued a corresponding number of General Partner OP Units to ARCP when ARCP issued common stock to former common stockholders of ARCT III.
Upon the consummation of the ARCT III Merger, American Realty Capital Trust III Special Limited Partner, LLC (the “ARCT III Special Limited Partner”), the holder of the special limited partner interest in the ARCT III OP, was entitled to subordinated distributions of net sales proceeds from the ARCT III OP which resulted in the issuance of units of limited partner interests in the ARCT III OP, when after applying the ARCT III Exchange Ratio, resulted in the issuance of an additional 7.3 million Limited Partner OP Units to affiliates of the Former Manager. The parties had agreed that such OP Units would be subject to a minimum one-year holding period from the date of issuance before being redeemable by the holder for cash, or at the option of the General Partner, common stock of ARCP.
Also in connection with the ARCT III Merger, the General Partner entered into an agreement with ARC and its affiliates to internalize certain functions performed by them prior to the ARCT III Merger, reduce certain fees paid to affiliates, purchase certain corporate assets and pay certain merger related fees. See Note 19—Related Party Transactions and Arrangements.
Accounting Treatment for the ARCT III Merger
The General Partner and ARCT III, from inception to the ARCT III Merger Date, were considered to be entities under common control. Both entities’ advisors were wholly owned subsidiaries of ARC. ARC and its related parties had significant ownership interests in the General Partner, Operating Partnership and ARCT III through the ownership of shares, OP Units and other equity interests. In addition, the advisors of both ARCP and ARCT III were contractually eligible to receive potential fees for their services to both of the companies including asset management fees, incentive fees and other fees and continued to receive fees from the Operating Partnership, on behalf of ARCP, prior to ARCP’s transition to self-management. Due to the significance of these fees, the advisors and ultimately ARC were determined to have a significant economic interest in both companies in addition to having the power to direct the significant activities of the companies through advisory/management agreements, which qualified them as affiliated companies under common control in accordance with generally accepted accounting principles in the United States (“U.S. GAAP”). The acquisition of an entity under common control is accounted for on the carryover basis of accounting, whereby the assets and liabilities of the companies are recorded upon the merger on the same basis as they were carried by the companies on the ARCT III Merger Date. In addition, U.S. GAAP requires the Operating Partnership to present historical financial information as if the merger had occurred as of the beginning of the earliest period presented. Therefore, the accompanying financial statements including the notes thereto are presented as if the ARCT III Merger had occurred on January 1, 2013.
CapLease, Inc. Merger
On May 28, 2013, ARCP entered into an Agreement and Plan of Merger (the “CapLease Merger Agreement”) with CapLease, Inc., a Maryland corporation (“CapLease”), and certain subsidiaries of each company. The CapLease Merger Agreement provided for the merger of CapLease with and into a subsidiary of ARCP (the “CapLease Merger”).
F-133
Table of Contents
ARC PROPERTIES OPERATING PARTNERSHIP, L.P.
NOTES TO CONSOLIDATED FINANCIAL STATEMENTS
June 30, 2014
(Unaudited)
On November 5, 2013 (the “CapLease Acquisition Date”), ARCP and the Operating Partnership completed the merger with CapLease pursuant to the CapLease Merger Agreement. Pursuant to the terms of the CapLease Merger Agreement, each outstanding share of common stock of CapLease, other than shares owned by the General Partner, Operating Partnership, CapLease or any of their respective wholly owned subsidiaries, was converted into the right to receive $8.50. Each outstanding share of preferred stock of CapLease, other than shares owned by the General Partner, Operating Partnership, CapLease or any of their respective wholly owned subsidiaries, was converted into the right to receive an amount in cash equal to the sum of $25.00 plus all accrued and unpaid dividends on such shares of preferred stock. In addition, in connection with the merger of Caplease, LP with and into the Operating Partnership (the “CapLease Partnership Merger”), each outstanding unit of equity ownership of CapLease’s operating partnership, other than units owned by CapLease, the Operating Partnership or any of their respective wholly owned subsidiaries, was converted into the right to receive $8.50. Shares of CapLease’s outstanding restricted stock was accelerated and became fully vested, and restricted stock and any outstanding performance shares were fully earned and received $8.50 per share. In total, cash consideration of $920.7 million was paid to the common and preferred shareholders.
Accounting Treatment for the CapLease Merger
The CapLease Merger has been accounted for under the acquisition method of accounting under U.S. GAAP. Under the acquisition method of accounting, the assets acquired and liabilities assumed from CapLease have been recorded as of the acquisition date at their respective fair values. Any excess of purchase price over the fair values is recorded as goodwill. Results of operations for CapLease are included in the Operating Partnership’s consolidated financial statements from the date of acquisition. See Note 4—Acquisitions of CapLease, Cole and CCPT.
American Realty Capital Trust IV, Inc. Merger
On July 1, 2013, the General Partner entered into an Agreement and Plan of Merger, as amended on October 6, 2013 and October 11, 2013, (the “ARCT IV Merger Agreement”) with ARCT IV, and certain subsidiaries of each company. The ARCT IV Merger Agreement provided for the merger of ARCT IV with and into a wholly owned subsidiary of the Operating Partnership (the “ARCT IV Merger”). The ARCT IV Merger was consummated on January 3, 2014 (the “ARCT IV Merger Date”).
Pursuant to the terms of the ARCT IV Merger Agreement, as amended, each outstanding share of common stock of ARCT IV, including unvested restricted shares that vested in conjunction with the ARCT IV Merger, was exchanged for (i) $9.00 in cash, (ii) 0.5190 of a share of ARCP’s common stock (the “ARCT IV Exchange Ratio”) and (iii) 0.5937 of a share of a new series of preferred stock designated as the 6.70% Series F Cumulative Redeemable Preferred Stock (“Series F Preferred Stock”) and each outstanding unit of American Realty Capital Operating Partnership IV, L.P. (“ARCT IV OP” and each unit, an “ARCT IV OP Unit”), other than ARCT IV OP Units held by American Realty Capital Trust IV Special Limited Partner, LLC, (the “ARCT IV Special Limited Partner”) and American Realty Capital Advisors IV, LLC (the “ARCT IV Advisor”) was exchanged for (i) $9.00 in cash, (ii) 0.5190 of a Limited Partner OP Unit and (iii) 0.5937 of a Limited Partner OP Unit designated as Series F Preferred Units (“Limited Partner Series F OP Units”). In total, the Operating Partnership, on ARCP’s behalf, paid $650.9 million in cash, ARCP issued 36.9 million shares of common stock and 42.2 million shares of Series F Preferred Stock to former ARCT IV stockholders, and the Operating Partnership issued 0.7 million units of Limited Partner Series F OP units and 0.6 million Limited Partner OP Units to the former ARCT IV OP Unit holders in connection with the consummation of the ARCT IV Merger. In addition, each outstanding ARCT IV
F-134
Table of Contents
ARC PROPERTIES OPERATING PARTNERSHIP, L.P.
NOTES TO CONSOLIDATED FINANCIAL STATEMENTS
June 30, 2014
(Unaudited)
Class B Unit (as defined below) and each outstanding ARCT IV OP Unit held by the ARCT IV Special Limited Partner and the ARCT IV Advisor was converted into 2.3961 Limited Partner OP Units, resulting in the Operating Partnership issuing 1.2 million Limited Partner OP Units. In accordance with the LPA, the Operating Partnership issued a corresponding number of General Partner OP Units and Series F Preferred Units to ARCP when shares of ARCP’s common stock and Series F Preferred Stock were issued to former common stockholders of ARCT IV, respectively.
On January 3, 2014, the Operating Partnership entered into a Contribution and Exchange Agreement (the “ARCT IV Contribution and Exchange Agreement”) with the ARCT IV OP, the ARCT IV Special Limited Partner and ARC Real Estate Partners, LLC, an entity under common ownership with the Former Manager. The ARCT IV Special Limited Partner was entitled to receive certain distributions from the ARCT IV OP, including the subordinated distribution of net sales proceeds resulting from an “investment liquidity event” (as defined in the agreement of limited partnership of the ARCT IV OP). The ARCT IV Merger constituted an “investment liquidity event,” as a result of which the ARCT IV Special Limited Partner, in connection with management’s successful attainment of the 6.0% performance hurdle and the return to ARCT IV’s stockholders of approximately $358.3 million in addition to their initial investment, was entitled to receive a subordinated distribution of net sales proceeds from the ARCT IV OP equal to approximately $63.2 million. Pursuant to the ARCT IV Contribution and Exchange Agreement, the ARCT IV Special Limited Partner contributed its interest in the ARCT IV OP, inclusive of the subordinated distribution proceeds received, to the ARCT IV OP in exchange for 2.8 million equity units of the ARCT IV OP, based on agreed upon price per share of $22.50. The fair value of these units at date of issuance was $78.2 million and has been included in merger and other transaction costs in the accompanying consolidated statements of operations for the six months ended June 30, 2014. Upon consummation of the ARCT IV Merger, these equity units were immediately converted to 6.7 million Limited Partner OP Units after application of the exchange ratio of 2.3961 per share. In conjunction with the ARCT IV Merger Agreement, the ARCT IV Special Limited Partner agreed to a minimum two-year holding period for these Limited Partner OP Units before having the right to redeem in cash, or at the option of the General Partner, convert them to common stock of ARCP.
In addition, as part of the ARCT IV Contribution and Exchange Agreement, ARC Real Estate Partners, LLC, contributed $750,000 in cash to the ARCT IV OP, effective prior to the consummation of the ARCT IV Merger, in exchange for ARCT IV OP Units. Upon the consummation of the ARCT IV Merger, these equity units converted at an exchange ratio of 2.3961 Limited Partner OP Units per ARCT IV OP Unit, resulting in the Operating Partnership issuing 0.1 million Limited Partner OP Units to ARC Real Estate Partners, LLC.
Accounting Treatment for the ARCT IV Merger
The General Partner and ARCT IV, from inception to the ARCT IV Merger Date, were considered to be entities under common control. Both entities’ advisors were wholly owned subsidiaries of ARC. ARC and its related parties had ownership interests in the General Partner, Operating Partnership and ARCT IV through the ownership of shares, OP Units and other equity interests. In addition, the advisors of both ARCP and ARCT IV were contractually eligible to receive potential fees for their services to both of the companies including asset management fees, incentive fees and other fees and had continued to receive fees from the Operating Partnership prior to ARCP’s transition to self-management. Due to the significance of these fees, the advisors and ultimately ARC were determined to have a significant economic interest in both companies in addition to having the power to direct the activities of the companies through advisory/management agreements, which qualified them as affiliated companies under common control in accordance with U.S. GAAP. The acquisition of an entity under
F-135
Table of Contents
ARC PROPERTIES OPERATING PARTNERSHIP, L.P.
NOTES TO CONSOLIDATED FINANCIAL STATEMENTS
June 30, 2014
(Unaudited)
common control is accounted for on the carryover basis of accounting, whereby the assets and liabilities of the companies are recorded upon the merger on the same basis as they were carried by the companies on the ARCT IV Merger Date. In addition, U.S. GAAP requires the Operating Partnership to present historical financial information as if the entities were combined for each period presented. Therefore, the accompanying financial statements including the notes thereto are presented as if the ARCT IV Merger, including the impact of the equity transactions entered to consummate the merger, had occurred on January 1, 2013.
Fortress Portfolio Acquisition
On July 24, 2013, ARC and another related entity, on behalf of the General Partner and certain other entities sponsored directly or indirectly by ARC, entered into a purchase and sale agreement with affiliates of funds managed by Fortress Investment Group LLC (“Fortress”) for the purchase of 196 properties owned by Fortress, for an aggregate contract purchase price of $972.5 million, subject to adjustments set forth in the purchase and sale agreement and exclusive of closing costs, which were allocated to ARCP based on the pro rata fair value of the properties acquired by ARCP relative to the fair value of all 196 properties to be acquired from Fortress. Of the 196 properties, 120 properties were allocated to ARCP (the “Fortress Portfolio”). On October 1, 2013, ARCP, through wholly owned subsidiaries of the Operating Partnership, closed on 41 of the 120 properties with a total purchase price of $200.3 million, exclusive of closing costs. Those Operating Partnership subsidiaries closed the acquisition of the remaining 79 properties in the Fortress Portfolio on January 8, 2014, for an aggregate contract purchase price of $400.9 million, exclusive of closing costs. The total purchase price of the Fortress Portfolio was $601.2 million, exclusive of closing costs.
Cole Real Estate Investments, Inc. Merger
On October 22, 2013, the General Partner entered into an agreement and plan of merger (the “Cole Merger Agreement”) with Cole Real Estate Investments, Inc. (“Cole”), a Maryland corporation, and a wholly owned subsidiary of the General Partner. The Cole Merger Agreement provided for the merger of Cole with and into a wholly owned subsidiary of the General Partner (the “Cole Merger”). The Operating Partnership consummated the Cole Merger on February 7, 2014 (the “Cole Acquisition Date”).
Pursuant to the terms of the Cole Merger Agreement, each share of common stock of Cole issued and outstanding immediately prior to the effectiveness of the Cole Merger, including unvested restricted stock units (“RSUs”) and performance stock units that vested in conjunction with the Cole Merger, other than shares owned by the General Partner, Cole or any of their respective subsidiaries, was converted into the right to receive either (i) 1.0929 shares of ARCP’s common stock (the “Stock Consideration”) or (ii) $13.82 in cash (the “Cash Consideration” and together with the Stock Consideration, the “Merger Consideration”). Approximately 98% of all outstanding Cole shareholders received Stock Consideration and approximately 2% of outstanding Cole shareholders elected to receive Cash Consideration, pursuant to the terms of the Cole Merger Agreement, resulting in ARCP issuing approximately 520.8 million shares of common stock and the Operating Partnership, on ARCP’s behalf, paying $181.8 million in cash to holders of Cole shares based on their elections. In accordance with the LPA, the Operating Partnership issued a corresponding number of General Partner OP Units to ARCP when shares of ARCP’s common stock were issued to former common stockholders of Cole.
In addition, ARCP issued approximately 2.8 million shares of common stock, in the aggregate, to certain executives of Cole pursuant to letter agreements entered into between the General Partner and such individuals, concurrently with the execution of the Cole Merger Agreement, as previously disclosed by the General Partner.
F-136
Table of Contents
ARC PROPERTIES OPERATING PARTNERSHIP, L.P.
NOTES TO CONSOLIDATED FINANCIAL STATEMENTS
June 30, 2014
(Unaudited)
Additionally, effective as of the Cole Acquisition Date, ARCP issued, but has not yet allocated, 0.4 million shares with dividend equivalent rights commensurate with the ARCP’s common stock. In accordance with the LPA, the Operating Partnership issued a corresponding number of General Partner OP Units to ARCP when shares of ARCP’s common stock were issued to former executives of Cole.
Accounting Treatment for the Cole Merger
The Cole Merger has been accounted for under the acquisition method of accounting under U.S. GAAP. Under the acquisition method of accounting, the assets acquired and liabilities assumed from Cole have been recorded as of the acquisition date at their respective fair values. Any excess of purchase price over the fair values is recorded as goodwill. Results of operations for Cole are included in the Operating Partnership’s consolidated financial statements subsequent to the Cole Acquisition Date.
Inland Portfolio Acquisition
On August 8, 2013, ARC and another related entity, on behalf of the General Partner and certain other entities sponsored directly or indirectly by ARC, entered into a purchase and sale agreement with Inland American Real Estate Trust, Inc. (“Inland”) for the purchase of the equity interests of 67 companies owned by Inland for an aggregate contract purchase price of approximately $2.3 billion, subject to adjustments set forth in the purchase and sale agreement and exclusive of closing costs. Of the 67 companies, the equity interests of 10 companies (the “Inland Portfolio”) were allocated to ARCP for a purchase price of approximately $501.0 million, subject to adjustments set forth in the purchase and sale agreement and exclusive of closing costs, which was allocated to ARCP based on the pro rata fair value of the Inland Portfolio relative to the fair value of all 67 companies to be acquired from Inland by the Operating Partnership, on ARCP’s behalf, and the other entities sponsored directly or indirectly by ARC. The Inland Portfolio is comprised of 33 properties. As of June 30, 2014, the Operating Partnership had closed on 32 of the 33 properties for a total purchase price of $288.2 million, exclusive of closing costs. The General Partner will not close on the remaining one property.
Cole Credit Property Trust, Inc. Merger
On March 17, 2014, the General Partner and a wholly owned subsidiary of the General Partner entered into an Agreement and Plan of Merger (the “CCPT Merger Agreement”) with Cole Credit Property Trust, Inc., a Maryland corporation (“CCPT”). The CCPT Merger Agreement provided for the merger of CCPT with and into a subsidiary of the General Partner (the “CCPT Merger”). The General Partner consummated the CCPT Merger on May 19, 2014 (the “CCPT Acquisition Date”). The estimated fair value of the consideration transferred at the CCPT Acquisition Date totaled approximately $73.2 million, which was paid in cash.
Pursuant to the CCPT Merger Agreement, the General Partner commenced a cash tender offer to purchase all of the outstanding shares of common stock of CCPT (the “CCPT Common Stock”) (other than shares owned by CCPT, the General Partner or any subsidiary of the General Partner), upon the terms and subject to the conditions set forth in the Offer to Purchase, dated March 31, 2014, and the related Letter of Transmittal (together with any amendments or supplements to the foregoing, the “Offer”), at a price of $7.25 per share (the “Offer Price”), net to the seller in cash, without interest, less any applicable withholding tax. On May 19, 2014, the General Partner accepted for payment and paid for all shares of CCPT Common Stock that were validly tendered in the Offer. As of the expiration of the Offer, a total of 7,735,069 shares of CCPT Common Stock were validly tendered and not withdrawn, representing approximately 77% of the shares of CCPT Common Stock outstanding.
F-137
Table of Contents
ARC PROPERTIES OPERATING PARTNERSHIP, L.P.
NOTES TO CONSOLIDATED FINANCIAL STATEMENTS
June 30, 2014
(Unaudited)
Immediately following the acceptance for payment and payment for the shares of CCPT Common Stock that were validly tendered in the Offer, the General Partner exercised its option (the “Top-Up Option”), granted pursuant to the CCPT Merger Agreement, to purchase, at a price per share equal to the Offer Price, 13,457,874 newly issued shares of CCPT Common Stock (collectively, the “Top-Up Shares”). The Top-Up Shares, taken together with the shares of CCPT Common Stock owned, directly or indirectly, by the General Partner and its subsidiaries immediately following the acceptance for payment and payment for the shares of CCPT Common Stock that were validly tendered in the Offer, constituted one share more than 90% of the outstanding shares of CCPT Common Stock (after giving effect to the issuance of all shares subject to the Top-Up Option), the applicable threshold required to effect a short-form merger under applicable Maryland law without stockholder approval.
Following the consummation of the Offer and the exercise of the Top-Up Option, in accordance with the CCPT Merger Agreement, the General Partner completed its acquisition of CCPT by effecting of a short-form merger under Maryland law, pursuant to which CCPT was merged with and into a subsidiary of the General Partner, with the subsidiary surviving the merger as a wholly owned subsidiary of the General Partner. The CCPT Merger became effective following the filing of the Articles of Merger with the State Department of Assessments and Taxation of Maryland and the filing of the Certificate of Merger with the Secretary of State of the State of Delaware with an effective date of May 19, 2014 (the “Effective Time”).
At the Effective Time, each share of CCPT Common Stock not purchased in the Offer (other than shares held by the CCPT, the General Partner or any subsidiary of the General Partner, which were automatically canceled and retired and ceased to exist) was converted into the right to receive an amount, in cash and without interest, equal to the Offer Price.
Accounting Treatment for the CCPT Merger
The CCPT Merger has been accounted for under the acquisition method of accounting under U.S. GAAP. Under the acquisition method of accounting, the assets acquired and liabilities assumed from CCPT have been recorded as of the acquisition date at their respective fair values. Any excess of purchase price over the fair values is recorded as goodwill. Results of operations for CCPT are included in the Operating Partnership’s consolidated financial statements subsequent to the CCPT Acquisition Date.
Purchase Agreement for Red Lobster Portfolio
On May 16, 2014, the Operating Partnership, through a wholly owned subsidiary, entered into a master purchase agreement to acquire 521 properties, substantially all of which are operating as Red Lobster® restaurants (the “Red Lobster Portfolio”) from a third party. The transaction is structured as a sale-leaseback in which the Operating Partnership will purchase the Red Lobster Portfolio and will immediately lease the portfolio back to the third party pursuant to the terms of multiple master leases (the “Master Leases”). The purchase price of the Red Lobster Portfolio is approximately $1.59 billion, exclusive of closing costs and related expenses. The Master Leases will provide annual rental income of $152.0 million. Approximately 95.0% of the Master Leases will be structured with a 25-year initial term and approximately 5.0% will have a weighted average 18.7-year initial term.
On July 28, 2014, the Operating Partnership closed on 492 of the properties constituting the Red Lobster Portfolio and on July 30, 2014, closed on the remaining 29 properties.
F-138
Table of Contents
ARC PROPERTIES OPERATING PARTNERSHIP, L.P.
NOTES TO CONSOLIDATED FINANCIAL STATEMENTS
June 30, 2014
(Unaudited)
Note 3—Summary of Significant Accounting Policies
The consolidated financial statements of the Operating Partnership included herein were prepared in conformity with U.S. GAAP for interim financial information and with the instructions to Form 10-Q and Article 10 of Regulation S-X. Accordingly, they do not include all of the information and footnotes required by U.S. GAAP for complete financial statements. The information furnished includes all adjustments and accruals of a normal recurring nature, which, in the opinion of management, are necessary for a fair presentation of results for the interim periods. The results of operations for the three and six months ended June 30, 2014 are not necessarily indicative of the results for the entire year or any subsequent interim period.
These consolidated financial statements should be read in conjunction with the audited consolidated financial statements and notes thereto as of and for the year ended December 31, 2013 of the Operating Partnership. There have been no significant changes to these policies during the six months ended June 30, 2014, other than the updates described below.
Investment in Unconsolidated Entities
Investment in Unconsolidated Joint Ventures
Investment in unconsolidated joint ventures as of June 30, 2014 consisted of the Operating Partnership’s interest in six joint ventures that owned six properties (the “Unconsolidated Joint Ventures”). As of June 30, 2014, the Operating Partnership owned aggregate equity investments of $98.1 million in the Unconsolidated Joint Ventures. The Operating Partnership accounts for the Unconsolidated Joint Ventures using the equity method of accounting as the Operating Partnership has the ability to exercise significant influence, but not control, over operating and financial policies of these investments. The equity method of accounting requires the investment to be initially recorded at cost and subsequently adjusted for the Operating Partnership’s share of equity in the joint ventures’ earnings and distributions.
Investment in Managed REITs
As of June 30, 2014, the Operating Partnership owned aggregate equity investments of $3.9 million in the following publicly registered, non-traded REITs: Cole Credit Property Trust IV, Inc. (“CCPT IV”); Cole Corporate Income Trust, Inc. (“CCIT”); Cole Real Estate Income Strategy (Daily NAV), Inc. (“INAV”); Cole Office & Industrial REIT (CCIT II), Inc. (“CCIT II”); and Cole Credit Property Trust V, Inc. (“CCPT V,” and collectively with CCPT IV, CCIT, INAV and CCIT II, the “Managed REITs”). Prior to the CCPT Acquisition Date, CCPT was a Managed REIT and accounted for using the equity method. As of the CCPT Acquisition Date, the Operating Partnership had an approximately $5,000 equity investment in CCPT. The Operating Partnership accounts for these investments using the equity method of accounting as the Operating Partnership has the ability to exercise significant influence, but not control, over the Managed REITs’ operating and financial policies through its advisory and property management agreements with the respective Managed REITs. The equity method of accounting requires the investment to be initially recorded at cost and subsequently adjusted for the Operating Partnership’s share of equity in the respective Managed REIT’s earnings and distributions.
Leasehold Improvements and Property and Equipment
The Operating Partnership leases its office facilities under operating leases. Leasehold improvements related to these are recorded at cost less accumulated amortization. Leasehold improvements are amortized over the lesser of the estimated useful life or remaining lease term.
F-139
Table of Contents
ARC PROPERTIES OPERATING PARTNERSHIP, L.P.
NOTES TO CONSOLIDATED FINANCIAL STATEMENTS
June 30, 2014
(Unaudited)
Property and equipment, which primarily include office furniture, fixtures and equipment and computer hardware and software, are stated at cost less accumulated depreciation. Property and equipment are depreciated on a straight-line method over the estimated useful lives of the assets, which range from five to seven years. The Operating Partnership reassesses the useful lives of its property and equipment and adjusts the future monthly depreciation expense based on the new useful life, as applicable. If the Operating Partnership disposes of an asset, the asset and related accumulated depreciation are written off upon disposal.
Impairments
Investment in Unconsolidated Entities
The Operating Partnership is required to determine whether an event or change in circumstances has occurred that may have a significant adverse effect on the fair value of any of its investment in the unconsolidated entities. If an event or change in circumstance has occurred, the Operating Partnership is required to evaluate its investment in the unconsolidated entity for potential impairment and determine if the carrying amount of its investment exceeds its fair value. An impairment charge is recorded when an impairment is deemed to be other-than-temporary. To determine whether an impairment is other-than-temporary, the Operating Partnership considers whether it has the ability and intent to hold the investment until the carrying amount is fully recovered. The evaluation of an investment in an unconsolidated entity for potential impairment requires the Operating Partnership’s management to exercise significant judgment and to make certain assumptions. The use of different judgments and assumptions could result in different conclusions. No impairment indicators were identified, and no impairment losses were recorded related to the Operating Partnership’s unconsolidated entities for the period from the Cole Acquisition Date to June 30, 2014.
Leasehold Improvements and Property and Equipment
Leasehold improvements and property and equipment are reviewed for impairment when events or changes in circumstances indicate that the carrying amount of such assets may not be recoverable. If this review indicates that the carrying amount of the asset is not recoverable, the Operating Partnership records an impairment loss, measured at fair value by estimated discounted cash flows or market appraisals. No impairments of leasehold improvements or property or equipment were identified during the six months ended June 30, 2014.
Program Development Costs
The Operating Partnership pays for organization, registration and offering expenses associated with the sale of common stock of the Managed REITs. The reimbursement of these expenses by the Managed REITs is limited to a certain percentage of the proceeds raised from their offerings, in accordance with their respective advisory agreements and charters. Such expenses paid by the Operating Partnership on behalf of the Managed REITs in excess of these limits that are expected to be collected are recorded as program development costs. The Operating Partnership assesses the collectability of the program development costs, considering the offering period and historical and forecasted sales of shares under the Managed REITs’ respective offering and reserves for any balances considered not collectible. No reserves were recorded as of June 30, 2014, as the Operating Partnership expects to be reimbursed for all of the program development costs by the Managed REITs as additional proceeds from their respective offerings are raised. Program development costs are included in deferred costs and other assets, net in the accompanying consolidated balance sheets.
F-140
Table of Contents
ARC PROPERTIES OPERATING PARTNERSHIP, L.P.
NOTES TO CONSOLIDATED FINANCIAL STATEMENTS
June 30, 2014
(Unaudited)
Due from Affiliates
The Operating Partnership receives or may be entitled to receive compensation and reimbursement for services primarily relating to the Managed REITs’ offerings and the investment, management, financing and disposition of their respective assets. Refer to Note 19—Related Party Transactions and Arrangements for further explanation.
Reportable Segments
The Operating Partnership has concluded that it has two reportable segments as it has organized its operations into two segments for management and internal financial reporting purposes, REI and Cole Capital. The identification and aggregation of reportable segments requires the Operating Partnership’s management to exercise certain judgments. Refer to Note 5—Segment Reporting for further information.
Revenue Recognition—Cole Capital
Revenue consists of securities sales commissions and dealer manager fees, real estate acquisition fees, property management fees, advisory fees, asset management fees and performance fees for services relating to the Managed REITs’ offerings and the investment and management of their respective assets, in accordance with the respective advisory and dealer manager agreements. The Operating Partnership records revenue related to acquisition fees, securities sales commissions and dealer manager fees upon completion of a transaction and advisory, asset and property management fees as services are performed. The Operating Partnership is also reimbursed for certain costs incurred in providing these services. Securities sales commission and dealer manager reimbursements are recorded as revenue as the expenses are incurred. Other reimbursements are recorded as revenue when reimbursements are reasonably assured.
Income Taxes
The Operating Partnership is classified as a partnership for federal income tax purposes. As a partnership, the Operating Partnership is not a taxable entity for federal income tax purposes. Instead, each partner in the Operating Partnership is required to take into account its allocable share of the Operating Partnership’s income, gains, losses, deductions, and credits for each taxable year. However, the Operating Partnership may be subject to certain state and local taxes on its income and property.
The General Partner and ARCT III qualified as REITs under Sections 856 through 860 of the Internal Revenue Code (the “Code”) commencing with the taxable year ended December 31, 2011. ARCT IV qualified as a REIT under Sections 856 through 860 of the Code commencing with the taxable year ended December 31, 2012. As REITs, each of the General Partner, ARCT IV and ARCT III generally will not be subject to federal corporate income tax to the extent it distributes its REIT taxable income to its stockholders, and so long as it distributes at least 90% of its REIT taxable income, computed without regard to the dividends paid deduction and excluding net capital gain. REITs are subject to a number of other organizational and operational requirements. Each of the General Partner, ARCT III and ARCT IV may still be subject to certain state and local taxes on its income and property, and federal income and excise taxes on its undistributed income.
As of June 30, 2014, the Operating Partnership, General Partner, ARCT III and ARCT IV had no material uncertain income tax positions. The tax years subsequent to and including the fiscal year ended December 31, 2010 remain open to examination by the major taxing jurisdictions to which the Operating Partnership, General Partner, ARCT III and ARCT IV are subject.
F-141
Table of Contents
ARC PROPERTIES OPERATING PARTNERSHIP, L.P.
NOTES TO CONSOLIDATED FINANCIAL STATEMENTS
June 30, 2014
(Unaudited)
Under the partnership agreement, the Operating Partnership is to conduct business in such a manner as to permit the General Partner at all times to qualify as a REIT.
The Operating Partnership conducts substantially all of its Cole Capital business operations through a taxable REIT subsidiary (“TRS”). A TRS is a subsidiary of a REIT that is subject to corporate federal, state and local income taxes, as applicable. The Operating Partnership’s use of a TRS enables it to engage in certain business activities that does not preclude the General Partner from complying with the REIT qualification requirements, and allows the Operating Partnership to retain any income generated by these businesses for reinvestment without the requirement to distribute those earnings. The General Partner conducts all of its business in the United States, and as a result, the General Partner files income tax returns in the U.S. federal jurisdiction and various state and local jurisdictions. Certain inter-company transactions that have been eliminated in consolidation for financial accounting purposes are also subject to taxation.
The Operating Partnership provides for income taxes in accordance with current authoritative accounting and tax guidance. The tax expense or benefit related to significant, unusual or extraordinary items is recognized in the quarter in which those items occur. In addition, the effect of changes in enacted tax laws, rates or tax status is recognized in the quarter in which the change occurs. The accounting estimates used to compute the provision for income taxes may change as new events occur, additional information is obtained or the tax environment changes.
Repurchase Agreements
In certain circumstances, the Operating Partnership may obtain financing through a repurchase agreement. The Operating Partnership evaluates the initial transfer of a financial instrument and the related repurchase agreement for sale accounting treatment. In instances where the Operating Partnership maintains effective control over the transferred securities, the Operating Partnership accounts for the transaction as a secured borrowing, and accordingly, both the securities and related repurchase agreement payable are recorded separately in the accompanying consolidated balance sheets in investment securities, at fair value and other debt, net, respectively. In instances where the Operating Partnership does not maintain effective control over the transferred securities, the Operating Partnership accounts for the transaction as a sale of securities for proceeds consisting of cash and a forward purchase contract.
Reclassification
Certain reclassifications have been made to the historical financial statements of the Operating Partnership to conform to this presentation.
As discussed in Note 2 — Mergers and Acquisitions, the Operating Partnership has retrospectively presented its financial statements as if the Company and American Realty Capital Trust IV, Inc. (“ARCT IV”) were combined from the beginning of each period presented. As such, the Operating Partnership’s December 31, 2013 balance sheet reflect an increase in total assets of $2.2 billion, an increase in total liabilities of $1.5 billion and an increase in total stockholders’ equity of $0.7 billion, as compared to the Operating Partnership’s balance sheet before recasting the balance sheets to include ARCT IV. In addition, the Operating Partnership’s statement of operations for the three and six months ended June 30, 2013 reflects an increase in total revenues of $10.0 million and $12.7 million, respectively, an increase in total operating expenses of $31.7 million and $38.4 million, respectively, and an increase in net loss of $20.4 million and $23.7 million, respectively, as compared to the Operating Partnership’s statement of operations before recasting the statement of operations to include ARCT IV.
F-142
Table of Contents
ARC PROPERTIES OPERATING PARTNERSHIP, L.P.
NOTES TO CONSOLIDATED FINANCIAL STATEMENTS
June 30, 2014
(Unaudited)
Recent Accounting Pronouncements
In April 2014, the U.S. Financial Accounting Standards Board issued Accounting Standards Update, 2014-08 Presentation of Financial Statements (Topic 205) and Property, Plant, and Equipment (Topic 360): Reporting Discontinued Operations and Disclosures of Disposals of Components of an Entity (“ASU 2014-08”), which amends the reporting requirements for discontinued operations by updating the definition of a discontinued operation to be a component of an entity that represents a strategic shift that has (or will have) a major effect on an entity’s operations and financial results, resulting in fewer disposals that qualify for discontinued operations reporting yet the pronouncement also requires expanded disclosures for discontinued operations. The Operating Partnership adopted ASU 2014-08 effective January 1, 2014. Starting with the first quarter of 2014, the results of operations for all qualifying disposals and properties classified as held for sale that were not previously reported in discontinued operations in ARCP’s Annual Report on Form 10-K for the year ended December 31, 2013 will be presented within income from continuing operations on the accompanying consolidated statements of income.
In May 2014, FASB issued ASU No. 2014-09, “Revenue from Contracts with Customers,” which supersedes the revenue recognition requirements in “Revenue Recognition (Topic 605),” and requires an entity to recognize revenue in a way that depicts the transfer of promised goods or services to customers in an amount that reflects the consideration to which the entity expects to be entitled to in exchange for those goods or services. ASU 2014-09 is effective for fiscal years, and interim periods within those years, beginning after December 15, 2016, and is to be applied retrospectively, with early application not permitted. The Operating Partnership is currently evaluating the impact of the new standard on its financial statements.
Note 4—Acquisitions of CapLease, Cole and CCPT
CapLease Acquisition
On November 5, 2013 (the “CapLease Acquisition Date”), the Operating Partnership completed the CapLease Merger, an acquisition of a real estate investment trust that primarily owned and managed a diversified portfolio of single tenant commercial real estate properties subject to long-term leases, the majority of which were net leases, to high credit quality tenants, by acquiring 100% of the outstanding common stock and voting interests of CapLease. The acquisition was accounted for using the acquisition method of accounting in accordance with ASC 805, Business Combinations. The Operating Partnership’s consolidated financial statements include the results of operations of CapLease subsequent to the CapLease Acquisition Date.
The purchase price includes a cash payment of $920.7 million, which was funded by the Operating Partnership through additional borrowings under its revolving credit facility and the credit facility assumed from CapLease. See Note 12—Other Debt and Note 13—Credit Facilities.
The purchase price allocation for the CapLease Merger is considered preliminary, and additional adjustments may be recorded during the measurement period in accordance with U.S. GAAP. The purchase price allocation will be finalized as the Operating Partnership receives additional information relevant to the acquisition, including a final valuation of the assets purchased and liabilities assumed.
F-143
Table of Contents
ARC PROPERTIES OPERATING PARTNERSHIP, L.P.
NOTES TO CONSOLIDATED FINANCIAL STATEMENTS
June 30, 2014
(Unaudited)
The preliminary purchase price for the acquisition was allocated to assets acquired and liabilities assumed based on their estimated fair value. The following table summarizes the estimated fair values of the assets acquired and liabilities assumed at the CapLease Acquisition Date initially recorded, as well as measurement period adjustments made and the revised estimated fair values of the assets acquired and liabilities assumed at the CapLease Acquisition Date (in thousands):
| Preliminary | ||||||||||||
| Amounts Previously Recognized as of the CapLease Acquisition Date |
Measurement Period Adjustments |
Adjusted Amounts Recognized as of the CapLease Acquisition Date |
||||||||||
| Fair value of consideration given |
$ | 920,697 | $ | — | $ | 920,697 | ||||||
|
|
|
|
|
|
|
|||||||
| Assets purchased, at fair value: |
||||||||||||
| Land |
235,843 | (2,778 | ) | 233,065 | ||||||||
| Buildings, fixtures and improvements |
1,596,481 | (4,836 | ) | 1,591,645 | ||||||||
| Land and construction in process |
12,352 | 391 | 12,743 | |||||||||
| Acquired intangible lease assets |
191,964 | 308 | 192,272 | |||||||||
|
|
|
|
|
|
|
|||||||
| Total real estate investments |
2,036,640 | (6,915 | ) | 2,029,725 | ||||||||
| Cash and cash equivalents |
41,799 | — | 41,799 | |||||||||
| Investment securities |
60,730 | — | 60,730 | |||||||||
| Loans held for investment |
26,457 | — | 26,457 | |||||||||
| Restricted cash |
29,159 | (40 | ) | 29,119 | ||||||||
| Deferred costs and other assets, net |
21,564 | 152 | 21,716 | |||||||||
| Deferred costs |
325 | — | 325 | |||||||||
|
|
|
|
|
|
|
|||||||
| Total identifiable assets purchased |
2,216,674 | (6,803 | ) | 2,209,871 | ||||||||
|
|
|
|
|
|
|
|||||||
| Liabilities assumed, at fair value: |
||||||||||||
| Mortgage notes payable |
1,037,510 | — | 1,037,510 | |||||||||
| Secured credit facility |
121,000 | — | 121,000 | |||||||||
| Other debt |
114,208 | — | 114,208 | |||||||||
| Below-market leases |
57,058 | — | 57,058 | |||||||||
| Derivative liabilities |
158 | — | 158 | |||||||||
| Accounts payable and accrued expenses |
46,484 | 106 | 46,590 | |||||||||
| Deferred rent, derivative and other liabilities |
8,867 | (64 | ) | 8,803 | ||||||||
|
|
|
|
|
|
|
|||||||
| Total liabilities assumed |
1,385,285 | 42 | 1,385,327 | |||||||||
|
|
|
|
|
|
|
|||||||
| Non-controlling interest retained by third party |
567 | — | 567 | |||||||||
|
|
|
|
|
|
|
|||||||
| Net identifiable assets acquired by the Operating Partnership |
830,822 | (6,845 | ) | 823,977 | ||||||||
|
|
|
|
|
|
|
|||||||
| Goodwill |
$ | 89,875 | $ | 6,845 | $ | 96,720 | ||||||
|
|
|
|
|
|
|
|||||||
After the December 31, 2013 financial statements were issued, the Operating Partnership received final purchase and sale agreements for three properties that were sold to third parties during the six months ended June 30, 2014. After giving consideration to the sales price of these properties, the Operating Partnership has estimated that the fair value of these properties originally acquired as part of the CapLease Merger to be $6.9
F-144
Table of Contents
ARC PROPERTIES OPERATING PARTNERSHIP, L.P.
NOTES TO CONSOLIDATED FINANCIAL STATEMENTS
June 30, 2014
(Unaudited)
million lower than originally valued. As a result of the sale, the carrying amount of real estate investments was retrospectively decreased by $6.9 million as of the CapLease Acquisition Date, with a corresponding increase to goodwill in the accompanying consolidated balance sheet as of December 31, 2013. The impact to depreciation expense recognized during the year ended December 31, 2013 was not significant, and, therefore, the Operating Partnership has not retrospectively adjusted its consolidated statements of operations. In addition to the adjustment above, the Operating Partnership identified other minor adjustments primarily relating to additional accounts receivables and accrued expenses as of the CapLease Acquisition Date.
Management is in the process of further evaluating the purchase price accounting. The fair value of real estate investments and below-market leases have been estimated by the Operating Partnership with the assistance of third-party valuation firms. Based on a preliminary analysis received to-date, the estimated fair value of these assets and liabilities total $2.0 billion and $57.1 million, respectively. The recorded values represent the estimated fair values related to such assets and liabilities. Upon completion of the analysis, including a review of the appraisals and assessment of current market rates, changes to the estimated fair values may result. Such post-closing adjustments are customary in nature in accordance with ASC 805, Business Combinations.
The ascribed value of the noncontrolling interest has been estimated based on the fair value of the percentage ownership of The Woodlands, Texas development activity not held by the Operating Partnership. See Note 6—Real Estate Investments for further information on this development project.
The fair value of the remaining CapLease assets and liabilities have been calculated in accordance with the Operating Partnership’s policy on purchase price allocation, as disclosed in ARCP’s Annual Report on Form 10-K for the year ended December 31, 2013.
Goodwill of approximately $96.7 million is expected to be assigned to the REI segment upon completion of the valuation. The goodwill recognized is attributed to the enhancement of the Operating Partnership’s year-round rental revenue stream, expected synergies and the assembled work force at CapLease.
The pro forma consolidated statements of operations in Note 6—Real Estate Investments are presented as if CapLease had been included in the consolidated results of the Operating Partnership for the entire periods ended June 30, 2014 and 2013.
Cole Acquisition
On February 7, 2014, the Operating Partnership completed its acquisition of Cole, as discussed in Note 2—Mergers and Acquisitions. The Operating Partnership accounted for the Cole Merger as a business combination under the acquisition method of accounting. Therefore, the consolidated financial statements include the results of operations of Cole subsequent to the Cole Acquisition Date.
F-145
Table of Contents
ARC PROPERTIES OPERATING PARTNERSHIP, L.P.
NOTES TO CONSOLIDATED FINANCIAL STATEMENTS
June 30, 2014
(Unaudited)
Fair Value of Consideration Transferred
The Operating Partnership is in the process of gathering certain additional information in order to finalize its assessment of the fair value of the consideration transferred; thus, the fair values of currently recorded assets and liabilities are subject to change. The estimated fair value of the consideration transferred at the Cole Acquisition Date totaled approximately $7.5 billion and consisted of the following (in thousands):
| As of Cole Acquisition Date (Preliminary) |
||||
| Estimated Fair Value of Consideration Transferred: |
||||
| Cash |
$ | 181,775 | ||
| Common stock |
7,302,480 | |||
|
|
|
|||
| Total consideration transferred |
$ | 7,484,255 | ||
|
|
|
|||
The fair value of the 520.8 million shares of ARCP’s common stock issued, excluding those common shares transferred to former Cole executives, was determined based on the closing market price of ARCP’s common stock on the Cole Acquisition Date. In accordance with the LPA, the Operating Partnership issued a corresponding number of General Partner OP Units to ARCP when shares of ARCP’s common stock were issued to former stockholders of Cole.
Allocation of Consideration
The consideration transferred pursuant to the Cole Merger Agreement was allocated to the assets acquired and liabilities assumed for the REI segment and Cole Capital, based upon their preliminary estimated fair values as of the Cole Acquisition Date. The Operating Partnership is in the process of gathering certain additional information in order to finalize its assessment of the fair value of certain intangible assets; thus, the provisional measurements of intangible assets and goodwill are subject to change. Such post-closing adjustments are customary in nature in accordance with ASC 805, Business Combinations. The measurement periods recorded for the period from the Cole Acquisition Date to June 30, 2014 are presented consolidated and by segments in the tables below.
F-146
Table of Contents
ARC PROPERTIES OPERATING PARTNERSHIP, L.P.
NOTES TO CONSOLIDATED FINANCIAL STATEMENTS
June 30, 2014
(Unaudited)
The following table summarizes the estimated fair values of the assets acquired and liabilities assumed, including all measurement period adjustments, at the Cole Acquisition Date (in thousands):
| Preliminary | ||||||||||||
| Amount Previously Recorded as of the Cole Acquisition Date |
Measurement Period Adjustments |
Adjusted Total as of Cole Acquisition Date |
||||||||||
| Identifiable Assets Acquired at Fair Value: |
||||||||||||
| Land |
$ | 1,737,390 | $ | (609 | ) | $ | 1,736,781 | |||||
| Buildings, fixtures and improvements |
5,898,895 | (1,609 | ) | 5,897,286 | ||||||||
| Acquired intangible lease assets |
1,323,614 | (315 | ) | 1,323,299 | ||||||||
|
|
|
|
|
|
|
|||||||
| Total real estate investments |
8,959,899 | (2,533 | ) | 8,957,366 | ||||||||
| Investment in unconsolidated entities |
103,966 | — | 103,966 | |||||||||
| Investment securities, at fair value |
151,197 | — | 151,197 | |||||||||
| Loans held for investment, net |
72,326 | — | 72,326 | |||||||||
| Cash and cash equivalents |
151,160 | (1,195 | ) | 149,965 | ||||||||
| Restricted cash |
15,704 | — | 15,704 | |||||||||
| Intangible assets |
385,368 | — | 385,368 | |||||||||
| Deferred costs and other assets |
95,974 | 1,615 | 97,589 | |||||||||
| Due from affiliates |
3,301 | — | 3,301 | |||||||||
|
|
|
|
|
|
|
|||||||
| Total identifiable assets acquired |
9,938,895 | (2,113 | ) | 9,936,782 | ||||||||
|
|
|
|
|
|
|
|||||||
| Identifiable Liabilities Assumed at Fair Value: |
||||||||||||
| Mortgage notes payable, net |
2,719,072 | (12,487 | ) | 2,706,585 | ||||||||
| Credit facilities |
1,309,000 | — | 1,309,000 | |||||||||
| Other debt |
49,013 | — | 49,013 | |||||||||
| Below-market lease liabilities |
212,377 | 14 | 212,391 | |||||||||
| Accounts payable and accrued expenses |
133,909 | (3,243 | ) | 130,666 | ||||||||
| Deferred rent, derivative and other liabilities |
153,293 | 20,449 | 173,742 | |||||||||
| Dividends payable |
6,271 | — | 6,271 | |||||||||
| Contingent consideration |
51,979 | — | 51,979 | |||||||||
| Due to affiliates |
44 | — | 44 | |||||||||
|
|
|
|
|
|
|
|||||||
| Total liabilities assumed |
4,634,958 | 4,733 | 4,639,691 | |||||||||
|
|
|
|
|
|
|
|||||||
| Noncontrolling interests |
20,996 | — | 20,996 | |||||||||
|
|
|
|
|
|
|
|||||||
| Net identifiable assets acquired |
5,282,941 | (6,846 | ) | 5,276,095 | ||||||||
| Goodwill |
2,184,703 | 23,457 | 2,208,160 | |||||||||
|
|
|
|
|
|
|
|||||||
| Net assets acquired |
$ | 7,467,644 | $ | 16,611 | $ | 7,484,255 | ||||||
|
|
|
|
|
|
|
|||||||
F-147
Table of Contents
ARC PROPERTIES OPERATING PARTNERSHIP, L.P.
NOTES TO CONSOLIDATED FINANCIAL STATEMENTS
June 30, 2014
(Unaudited)
The following table summarizes the estimated fair values of the assets acquired and liabilities assumed for the REI segment as initially recorded at the Cole Acquisition Date, as well as measurement period adjustments made and the revised estimated fair values of the assets acquired and liabilities assumed at the Cole Acquisition Date (in thousands):
| Preliminary | ||||||||||||
| REI Segment (As initially recorded) |
Measurement Period Adjustments |
REI Segment (Adjusted) |
||||||||||
| Identifiable Assets Acquired at Fair Value: |
||||||||||||
| Land |
$ | 1,737,390 | $ | (609 | ) | $ | 1,736,781 | |||||
| Buildings, fixtures and improvements |
5,898,895 | (1,609 | ) | 5,897,286 | ||||||||
| Acquired intangible lease assets |
1,323,614 | (315 | ) | 1,323,299 | ||||||||
|
|
|
|
|
|
|
|||||||
| Total real estate investments |
8,959,899 | (2,533 | ) | 8,957,366 | ||||||||
| Investment in unconsolidated entities |
100,659 | — | 100,659 | |||||||||
| Investment securities, at fair value |
151,197 | — | 151,197 | |||||||||
| Loans held for investment, net |
72,326 | — | 72,326 | |||||||||
| Cash and cash equivalents |
130,747 | (1,195 | ) | 129,552 | ||||||||
| Restricted cash |
15,704 | — | 15,704 | |||||||||
| Deferred costs and other assets |
45,081 | 1,615 | 46,696 | |||||||||
|
|
|
|
|
|
|
|||||||
| Total identifiable assets acquired |
9,475,613 | (2,113 | ) | 9,473,500 | ||||||||
|
|
|
|
|
|
|
|||||||
| Identifiable Liabilities Assumed at Fair Value: |
||||||||||||
| Mortgage notes payable, net |
2,719,072 | (12,487 | ) | 2,706,585 | ||||||||
| Credit facilities |
1,309,000 | — | 1,309,000 | |||||||||
| Other debt |
49,013 | — | 49,013 | |||||||||
| Below-market lease liabilities |
212,377 | 14 | 212,391 | |||||||||
| Accounts payable and accrued expenses |
73,441 | 13,059 | 86,500 | |||||||||
| Deferred rent, derivative and other liabilities |
42,764 | 12,164 | 54,928 | |||||||||
| Dividends payable |
6,271 | — | 6,271 | |||||||||
| Contingent consideration |
3,606 | — | 3,606 | |||||||||
|
|
|
|
|
|
|
|||||||
| Total liabilities assumed |
4,415,544 | 12,750 | 4,428,294 | |||||||||
|
|
|
|
|
|
|
|||||||
| Noncontrolling interests |
20,996 | — | 20,996 | |||||||||
|
|
|
|
|
|
|
|||||||
| Net identifiable assets acquired |
5,039,073 | (14,863 | ) | 5,024,210 | ||||||||
| Goodwill |
1,628,571 | 31,474 | 1,660,045 | |||||||||
|
|
|
|
|
|
|
|||||||
| Net assets acquired |
$ | 6,667,644 | $ | 16,611 | $ | 6,684,255 | ||||||
|
|
|
|
|
|
|
|||||||
F-148
Table of Contents
ARC PROPERTIES OPERATING PARTNERSHIP, L.P.
NOTES TO CONSOLIDATED FINANCIAL STATEMENTS
June 30, 2014
(Unaudited)
The following table summarizes the estimated fair values of the assets acquired and liabilities assumed for Cole Capital as initially recorded at the Cole Acquisition Date, as well as measurement period adjustments made and the revised estimated fair values of the assets acquired and liabilities assumed at the Cole Acquisition Date (in thousands):
| Preliminary | ||||||||||||
| Cole Capital (As initially recorded) |
Measurement Period Adjustments |
Cole Capital (Adjusted) |
||||||||||
| Identifiable Assets Acquired at Fair Value: |
||||||||||||
| Investment in unconsolidated entities |
$ | 3,307 | $ | — | $ | 3,307 | ||||||
| Cash and cash equivalents |
20,413 | — | 20,413 | |||||||||
| Intangible assets |
385,368 | — | 385,368 | |||||||||
| Deferred costs and other assets |
50,893 | — | 50,893 | |||||||||
| Due from affiliates |
3,301 | — | 3,301 | |||||||||
|
|
|
|
|
|
|
|||||||
| Total identifiable assets acquired |
463,282 | — | 463,282 | |||||||||
|
|
|
|
|
|
|
|||||||
| Identifiable Liabilities Assumed at Fair Value: |
||||||||||||
| Accounts payable and accrued expenses |
60,468 | (16,302 | ) | 44,166 | ||||||||
| Deferred rent, derivative and other liabilities |
110,529 | 8,285 | 118,814 | |||||||||
| Contingent consideration |
48,373 | 48,373 | ||||||||||
| Due to affiliates |
44 | 44 | ||||||||||
|
|
|
|
|
|
|
|||||||
| Total liabilities assumed |
219,414 | (8,017 | ) | 211,397 | ||||||||
|
|
|
|
|
|
|
|||||||
| Net identifiable assets acquired |
243,868 | 8,017 | 251,885 | |||||||||
| Goodwill |
556,132 | (8,017 | ) | 548,115 | ||||||||
|
|
|
|
|
|
|
|||||||
| Net assets acquired |
$ | 800,000 | $ | — | $ | 800,000 | ||||||
|
|
|
|
|
|
|
|||||||
The fair value of real estate investments, including acquired lease intangibles, and below-market lease liabilities allocated to the REI segment have been estimated by the Operating Partnership with the assistance of a third-party valuation firm. Based on a preliminary analysis received to date, the estimated fair value of these assets and liabilities total $9.0 billion and $212.4 million, respectively. The recorded values represent the estimated fair values related to such assets and liabilities. Upon completion of the analysis, including a review of the appraisals and assessment of current market rates, changes to the estimated fair values may result.
The intangible assets acquired primarily consist of management and advisory contracts that the Operating Partnership has with the Managed REITs and are subject to an estimated useful life of approximately four years. The Operating Partnership recorded $38.0 million of amortization expense for the period from the Cole Acquisition Date to June 30, 2014. The estimated amortization expense for the remainder of the year ending December 31, 2014 is $48.6 million. The estimated amortization expense for each of the years ending December 31, 2015, 2016 and 2017 is $96.3 million and the estimated amortization expense for the year ending December 31, 2018 is $9.8 million.
Goodwill of approximately $1.7 billion is expected to be assigned to the REI segment upon completion of the external valuation. The goodwill recognized is attributed to the enhancement of the Operating Partnership’s year-round rental revenue stream, realized and expected synergies, the impact of the merger on lowering the
F-149
Table of Contents
ARC PROPERTIES OPERATING PARTNERSHIP, L.P.
NOTES TO CONSOLIDATED FINANCIAL STATEMENTS
June 30, 2014
(Unaudited)
Operating Partnership’s cost of capital, as well as the benefits of critical mass, improved portfolio diversification, and enhanced access to capital markets. Goodwill of approximately $548.1 million is expected to be assigned to Cole Capital upon completion of the external valuation. The goodwill is primarily supported by management’s belief that Cole Capital brings an established management platform with numerous strategic benefits including growth from new income streams and the ability to offer new products. None of the goodwill is expected to be deductible for income tax purposes.
The fair value of the remaining Cole assets and liabilities have been calculated in accordance with the Operating Partnership’s policy on purchase price allocation, as disclosed in the Operating Partnership’s financial statements for the year ended December 31, 2013.
The amounts of revenue and net income related to Cole property acquisitions and Cole Capital included in the accompanying consolidated statements of operations from the Cole Acquisition Date to the period ended June 30, 2014 was $366.2 million and $32.0 million, respectively.
The pro forma consolidated statements of operations in Note 6—Real Estate Investments are presented as if Cole had been included in the consolidated results of the Operating Partnership for the entire periods ended June 30, 2014 and 2013.
CCPT Acquisition
On May 19, 2014, the General Partner completed its acquisition of CCPT, as discussed in Note 2—Mergers and Acquisitions. The Operating Partnership accounted for the CCPT Merger as a business combination under the acquisition method of accounting. Therefore, the Operating Partnership’s consolidated financial statements include the results of operations of CCPT subsequent to the CCPT Acquisition Date.
Fair Value of Consideration Transferred
The Operating Partnership is in the process of gathering certain additional information in order to finalize its assessment of the fair value of the consideration transferred; thus, the fair values of currently recorded assets and liabilities are subject to change. The estimated fair value of the consideration transferred at the CCPT Acquisition Date totaled approximately $73.2 million, which was paid in cash. The acquisition was funded by the Operating Partnership through additional borrowings under its revolving credit facility.
F-150
Table of Contents
ARC PROPERTIES OPERATING PARTNERSHIP, L.P.
NOTES TO CONSOLIDATED FINANCIAL STATEMENTS
June 30, 2014
(Unaudited)
Allocation of Consideration
The consideration transferred pursuant to the CCPT Merger Agreement was allocated to the assets acquired and liabilities assumed based upon their preliminary estimated fair values as of the CCPT Acquisition Date. The Operating Partnership is in the process of gathering certain additional information in order to finalize its assessment of the fair value of certain intangible assets; thus, the provisional measurements of intangible assets and goodwill are subject to change. Such post-closing adjustments are customary in nature in accordance with ASC 805, Business Combinations. The following table summarizes the estimated fair values of the assets acquired and liabilities assumed by segment at the CCPT Acquisition Date (in thousands):
| Preliminary May 19, 2014 |
||||
| Identifiable Assets Acquired at Fair Value: |
||||
| Land |
$ | 28,258 | ||
| Buildings, fixtures and improvements |
113,296 | |||
| Acquired intangible lease assets |
17,960 | |||
|
|
|
|||
| Total real estate investments |
159,514 | |||
| Cash and cash equivalents |
167 | |||
| Restricted cash |
2,420 | |||
| Prepaid expenses and other assets |
297 | |||
|
|
|
|||
| Total identifiable assets acquired |
162,398 | |||
|
|
|
|||
| Identifiable Liabilities Assumed at Fair Value: |
||||
| Mortgage notes payable |
85,286 | |||
| Unsecured credit facility |
800 | |||
| Accounts payable and accrued expenses |
443 | |||
| Below-market lease liability |
1,752 | |||
| Due to affiliates |
568 | |||
| Deferred rent and other liabilities |
390 | |||
|
|
|
|||
| Total liabilities assumed |
89,239 | |||
|
|
|
|||
| Net identifiable assets acquired |
$ | 73,159 | ||
|
|
|
|||
The fair value of real estate investments, including acquired lease intangibles, and below-market lease liabilities have been estimated by the Operating Partnership with the assistance of a third-party valuation firm. Based on a preliminary analysis received to date, the estimated fair value of these assets and liabilities total $159.5 million and $1.8 million, respectively. The recorded values represent the estimated fair values related to such assets and liabilities. Upon completion of the analysis, including a review of the appraisals and assessment of current market rates, changes to the estimated fair values may result.
The fair value of the remaining CCPT assets and liabilities have been calculated in accordance with the Operating Partnership’s policy on purchase price allocation, as disclosed in the Operating Partnership financial statements for the year ended December 31, 2013.
The amounts of revenue and net loss related to CCPT property acquisitions included in the accompanying consolidated statements of operations from the Cole Acquisition Date to the period ended June 30, 2014 was $1.5 million and $0.3 million, respectively.
F-151
Table of Contents
ARC PROPERTIES OPERATING PARTNERSHIP, L.P.
NOTES TO CONSOLIDATED FINANCIAL STATEMENTS
June 30, 2014
(Unaudited)
Note 5—Segment Reporting
The Operating Partnership operates under two segments, REI and Cole Capital.
REI—Through its REI segment, the Operating Partnership acquires, owns and operates primarily single-tenant, freestanding commercial real estate properties primarily subject to net leases with high credit quality tenants. The Operating Partnership focuses on investing in properties that are net leased to credit tenants, which are generally large public companies with investment-grade ratings and other creditworthy tenants. The Operating Partnership’s long-term business strategy is to continue to acquire a diverse portfolio consisting of approximately 70% long-term leases and 30% medium-term leases, with an average remaining primary lease term of approximately 10 to 12 years. The Operating Partnership considers properties that are leased on a “medium-term” basis to mean properties originally leased long-term (10 years or longer) that currently have a primary remaining lease duration of generally three to eight years, on average. The Operating Partnership seeks to acquire granular, self-originated single-tenant net lease assets, which may be purchased through sale-leaseback transactions, small portfolio acquisitions and in connection with build-to-suit opportunities, to the extent they are appropriate in terms of capitalization rate and scale. The Operating Partnership expects this investment strategy to provide for stable income from credit tenants and for growth opportunities from re-leasing of current below market leases. As of June 30, 2014, the Operating Partnership owned 3,966 properties comprising 106.8 million square feet of single and multi-tenant retail and commercial space located in 49 states, which include properties owned through consolidated joint ventures. As of June 30, 2014, the rentable space at these properties was 98.8% leased with a weighted average remaining lease term of 9.9 years. As of June 30, 2014, the Operating Partnership also owned 25 commercial mortgage-backed securities (“CMBS”), 14 loans held for investment and, through the Unconsolidated Joint Ventures, had interests in six properties comprising 1.6 million rentable square feet of commercial and retail space.
Cole Capital—Cole Capital is contractually responsible for managing the Managed REITs’ affairs on a day-to-day basis, identifying and making acquisitions and investments on the Managed REITs’ behalf and recommending to each of the Managed REIT’s respective board of directors an approach for providing investors with liquidity. Cole Capital serves as the dealer manager and distributes shares of common stock for certain Managed REITs and advises them regarding offerings, manages relationships with participating broker-dealers and financial advisors and provides assistance in connection with compliance matters relating to the offerings. Cole Capital receives compensation and reimbursement for services relating to the Managed REITs’ offerings and the investment, management, financing and disposition of their respective assets, as applicable. Cole Capital also develops new REIT offerings, including obtaining regulatory approvals from the SEC, the Financial Industry Regulatory Authority, Inc. (“FINRA”) and various blue sky jurisdictions for such offerings.
F-152
Table of Contents
ARC PROPERTIES OPERATING PARTNERSHIP, L.P.
NOTES TO CONSOLIDATED FINANCIAL STATEMENTS
June 30, 2014
(Unaudited)
The Operating Partnership allocates certain operating expenses, such as audit and legal fees, board of director fees, employee related costs and benefits and general overhead expenses between its two segments. The following tables present a summary of the comparative financial results and total assets for each business segment (in thousands):
| Three Months Ended June 30, |
Six Months Ended June 30, |
|||||||||||||||
| 2014 | 2013 | 2014 | 2013 | |||||||||||||
| REI: |
||||||||||||||||
| Rental income |
$ | 314,843 | $ | 52,664 | $ | 559,288 | $ | 93,651 | ||||||||
| Direct financing lease income |
1,181 | — | 2,187 | — | ||||||||||||
| Operating expense reimbursements |
28,545 | 2,281 | 49,641 | 4,191 | ||||||||||||
|
|
|
|
|
|
|
|
|
|||||||||
| Total real estate investment revenues |
344,569 | 54,945 | 611,116 | 97,842 | ||||||||||||
|
|
|
|
|
|
|
|
|
|||||||||
| Acquisition related |
8,453 | 37,289 | 20,337 | 47,616 | ||||||||||||
| Merger and other transaction related |
13,286 | 6,393 | 235,478 | 144,162 | ||||||||||||
| Property operating expenses |
39,372 | 3,086 | 69,030 | 5,635 | ||||||||||||
| General and administrative expenses |
7,033 | 2,361 | 13,629 | 3,815 | ||||||||||||
| Equity based compensation |
9,338 | 3,458 | 31,848 | 4,339 | ||||||||||||
| Depreciation and amortization |
234,219 | 33,752 | 385,223 | 60,505 | ||||||||||||
|
|
|
|
|
|
|
|
|
|||||||||
| Total operating expenses |
311,701 | 86,339 | 755,545 | 266,072 | ||||||||||||
|
|
|
|
|
|
|
|
|
|||||||||
| Operating income (loss) |
32,868 | (31,394 | ) | (144,429 | ) | (168,230 | ) | |||||||||
|
|
|
|
|
|
|
|
|
|||||||||
| Interest expense, net |
(99,661 | ) | (11,068 | ) | (216,378 | ) | (17,124 | ) | ||||||||
| Other (expense) income, net |
(3,057 | ) | 1,167 | (3,858 | ) | 2,020 | ||||||||||
| Gain (loss) on derivative instruments, net |
21,926 | (40 | ) | 1,729 | (45 | ) | ||||||||||
| Loss on contingent value rights |
— | (31,134 | ) | (31,134 | ) | |||||||||||
| Gain on disposition of properties, net |
1,510 | — | 4,489 | — | ||||||||||||
| Gain on sale of investments |
— | — | — | 451 | ||||||||||||
|
|
|
|
|
|
|
|
|
|||||||||
| Total other expenses, net |
(79,282 | ) | (41,075 | ) | (214,018 | ) | (45,832 | ) | ||||||||
|
|
|
|
|
|
|
|
|
|||||||||
| Net loss from continuing operations |
(46,414 | ) | (72,469 | ) | (358,447 | ) | (214,062 | ) | ||||||||
|
|
|
|
|
|
|
|
|
|||||||||
| Discontinued operations: |
||||||||||||||||
| Income from operations of held for sale properties |
— | 36 | — | 20 | ||||||||||||
| Gain on held for sale properties |
— | — | — | 14 | ||||||||||||
|
|
|
|
|
|
|
|
|
|||||||||
| Net income from discontinued operations |
— | 36 | — | 34 | ||||||||||||
|
|
|
|
|
|
|
|
|
|||||||||
| Net loss |
$ | (46,414 | ) | $ | (72,433 | ) | $ | (358,447 | ) | $ | (214,028 | ) | ||||
|
|
|
|
|
|
|
|
|
|||||||||
F-153
Table of Contents
ARC PROPERTIES OPERATING PARTNERSHIP, L.P.
NOTES TO CONSOLIDATED FINANCIAL STATEMENTS
June 30, 2014
(Unaudited)
| Three Months Ended June 30, |
Six Months Ended June 30, |
|||||||||||||||
| 2014 | 2013 | 2014 | 2013 | |||||||||||||
| Cole Capital: |
||||||||||||||||
| Dealer manager and distribution fees, selling commissions and offering reimbursements |
$ | 9,969 | $ | — | $ | 52,422 | $ | — | ||||||||
| Transaction service fees |
14,411 | — | 18,970 | — | ||||||||||||
| Management fees and reimbursements |
13,032 | — | 20,087 | — | ||||||||||||
|
|
|
|
|
|
|
|
|
|||||||||
| Total Cole Capital revenues |
37,412 | — | 91,479 | — | ||||||||||||
|
|
|
|
|
|
|
|
|
|||||||||
| Cole Capital reallowed fees and commissions |
7,068 | — | 41,504 | — | ||||||||||||
| General and administrative expenses |
12,030 | — | 31,119 | — | ||||||||||||
| Depreciation and amortization |
24,774 | — | 39,133 | — | ||||||||||||
|
|
|
|
|
|
|
|
|
|||||||||
| Total operating expenses |
43,872 | — | 111,756 | — | ||||||||||||
|
|
|
|
|
|
|
|
|
|||||||||
| Total other income |
9,609 | — | 14,804 | — | ||||||||||||
|
|
|
|
|
|
|
|
|
|||||||||
| Net income (loss) |
$ | 3,149 | $ | — | $ | (5,473 | ) | $ | — | |||||||
|
|
|
|
|
|
|
|
|
|||||||||
| Total: |
||||||||||||||||
| Total revenues |
$ | 381,981 | $ | 54,945 | $ | 702,595 | $ | 97,842 | ||||||||
| Total operating expenses |
$ | 355,573 | $ | 86,339 | $ | 867,301 | $ | 266,072 | ||||||||
| Total other expense |
$ | (69,673 | ) | $ | (41,075 | ) | $ | (199,214 | ) | $ | (45,832 | ) | ||||
| Loss from continuing operations |
$ | (43,265 | ) | $ | (72,469 | ) | $ | (363,920 | ) | $ | (214,062 | ) | ||||
| Income from discontinued operations |
$ | — | $ | 36 | $ | — | $ | 34 | ||||||||
| Net loss |
$ | (43,265 | ) | $ | (72,433 | ) | $ | (363,920 | ) | $ | (214,028 | ) | ||||
| Total Assets | ||||||||
| June 30, 2014 |
December 31, 2013 |
|||||||
| REI |
$ | 20,197,707 | $ | 7,807,504 | ||||
| Cole Capital |
1,117,780 | — | ||||||
|
|
|
|
|
|||||
| Total |
$ | 21,315,487 | $ | 7,807,504 | ||||
|
|
|
|
|
|||||
F-154
Table of Contents
ARC PROPERTIES OPERATING PARTNERSHIP, L.P.
NOTES TO CONSOLIDATED FINANCIAL STATEMENTS
June 30, 2014
(Unaudited)
Note 6—Real Estate Investments
Excluding the Cole Merger, the ARCT IV Merger and the CCPT Merger, the Operating Partnership acquired interests in 337 commercial properties, including 18 land parcels, for an aggregate purchase price of $1.5 billion during the six months ended June 30, 2014 (the “2014 Acquisitions”). The Operating Partnership is in the process of obtaining and reviewing the final third-party appraisals for some of the 2014 Acquisitions, and as such, the fair value of the related asset acquired and liabilities assumed during the six months ended June 30, 2014 are provisionally allocated. The following table presents the allocation of the fair value of the assets acquired and liabilities assumed during the periods presented (dollar amounts in thousands):
| Three Months Ended June 30, |
Six Months Ended June 30, |
|||||||||||||||
| 2014 | 2013 | 2014 | 2013 | |||||||||||||
| Real estate investments, at cost: |
||||||||||||||||
| Land |
$ | 109,075 | $ | 416,887 | $ | 239,663 | $ | 493,029 | ||||||||
| Buildings, fixtures and improvements |
482,074 | 1,129,906 | 1,185,641 | 1,424,900 | ||||||||||||
|
|
|
|
|
|
|
|
|
|||||||||
| Total tangible assets |
591,149 | 1,546,793 | 1,425,304 | 1,917,929 | ||||||||||||
|
|
|
|
|
|
|
|
|
|||||||||
| Acquired intangible assets: |
||||||||||||||||
| In-place leases |
30,801 | 165,576 | 128,581 | 211,748 | ||||||||||||
| Above-market leases |
5,511 | — | 21,145 | — | ||||||||||||
| Assumed intangible liabilities: |
||||||||||||||||
| Below-market leases |
(1,869 | ) | — | (3,321 | ) | — | ||||||||||
| Fair value adjustment of assumed notes payable |
— | — | (23,589 | ) | — | |||||||||||
|
|
|
|
|
|
|
|
|
|||||||||
| Total purchase price of assets acquired, net |
625,592 | 1,712,369 | 1,548,120 | 2,129,677 | ||||||||||||
| Notes payable assumed |
— | — | 301,532 | — | ||||||||||||
|
|
|
|
|
|
|
|
|
|||||||||
| Cash paid for acquired real estate investments |
$ | 625,592 | $ | 1,712,369 | $ | 1,246,588 | $ | 2,129,677 | ||||||||
|
|
|
|
|
|
|
|
|
|||||||||
| Number of properties acquired |
122 | 899 | 337 | 1,011 | ||||||||||||
|
|
|
|
|
|
|
|
|
|||||||||
The following table presents unaudited pro forma information as if all of the 2014 Acquisitions and the Cole Merger, ARCT IV Merger and CCPT Merger, as discussed in Note 2—Mergers and Acquisitions, were completed on January 1, 2013 for each period presented below. These amounts have been calculated after applying the Operating Partnership’s accounting policies and adjusting the results of acquisitions to reflect the additional depreciation and amortization and interest expense that would have been charged had the acquisitions occurred on January 1, 2013. Additionally, the unaudited pro forma net loss attributable to unitholders was adjusted to exclude acquisition related expenses of $20.3 million and $47.6 million for the six months ended June 30, 2014 and 2013, respectively and merger and other transaction related expenses of $235.5 million and $144.2 million for the six months ended June 30, 2014 and 2013, respectively.
| (in thousands) | Six Months Ended June 30, |
|||||||
| 2014 | 2013 | |||||||
| Pro forma revenues |
$ | 827,562 | $ | 155,269 | ||||
| Pro forma net (loss) income attributable to unitholders |
$ | (67,207 | ) | $ | 2,386 | |||
F-155
Table of Contents
ARC PROPERTIES OPERATING PARTNERSHIP, L.P.
NOTES TO CONSOLIDATED FINANCIAL STATEMENTS
June 30, 2014
(Unaudited)
ARCT IV GE Capital Portfolio
After the ARCT IV December 31, 2013 financial statements were issued, ARCT IV completed its review of the final appraisals received from third party firms for certain properties included in the ARCT IV GE Capital Portfolio. After giving consideration to the appraisals of these properties, the Operating Partnership has estimated that the fair value of the land, building, fixtures and improvements, acquired leases assets and acquired lease liabilities to be $183.2 million, $300.4 million, $47.0 million, and $7.8 million, respectively. Additionally, as part of the review of the final appraisals, assets that were classified as direct financing leases were reclassified into real estate investments. As a result of these adjustments, the carrying amount of land, acquired lease assets and acquired lease liabilities were retrospectively increased by $40.7 million, $2.7 million, and $7.8 million, respectively, as of the date ARCT IV acquired the ARCT IV GE Capital Portfolio. In addition, the carrying amount of buildings, fixtures and improvements and investments in direct financing leases was decreased by $32.1 million and $3.5 million, respectively as of the same date. These adjustments to carrying value are reflected in the accompanying consolidated balance sheet as of December 31, 2013. The impact to depreciation expense recognized during the year ended December 31, 2013 was not significant, and therefore, the Operating Partnership has not retrospectively adjusted its consolidated statements of operations.
Future Lease Payments
The following table presents future minimum base rental cash payments due to the Operating Partnership over the next five years and thereafter. These amounts exclude contingent rent payments, as applicable, that may be collected from certain tenants based on provisions related to sales thresholds and increases in annual rent based on exceeding certain economic indexes among other items (in thousands):
| Future Minimum Operating Lease Base Rent Payments |
Future Minimum Direct Financing Lease Payments(1) |
|||||||
| July 1, 2014—December 31, 2014 |
$ | 677,188 | $ | 2,485 | ||||
| 2015 |
1,214,297 | 4,757 | ||||||
| 2016 |
1,191,214 | 4,674 | ||||||
| 2017 |
1,142,109 | 4,273 | ||||||
| 2018 |
1,087,444 | 3,183 | ||||||
| Thereafter |
7,706,549 | 10,052 | ||||||
|
|
|
|
|
|||||
| Total |
$ | 13,018,801 | $ | 29,424 | ||||
|
|
|
|
|
|||||
| (1) | 47 properties are subject to direct financing leases and, therefore, revenue is recognized as direct financing lease income on the discounted cash flows of the lease payments. Amounts reflected are the cash rent on these respective properties. |
F-156
Table of Contents
ARC PROPERTIES OPERATING PARTNERSHIP, L.P.
NOTES TO CONSOLIDATED FINANCIAL STATEMENTS
June 30, 2014
(Unaudited)
Investment in Direct Financing Leases, Net
The components of the Operating Partnership’s net investment in direct financing leases as of June 30, 2014 and December 31, 2013 are as follows (in thousands):
| June 30, 2014 |
December 31, 2013 |
|||||||
| Future minimum lease payments receivable |
$ | 29,685 | $ | 33,729 | ||||
| Unguaranteed residual value of property |
43,884 | 46,172 | ||||||
| Unearned income |
(11,475 | ) | (13,789 | ) | ||||
|
|
|
|
|
|||||
| Net investment in direct financing leases |
$ | 62,094 | $ | 66,112 | ||||
|
|
|
|
|
|||||
Development Activities
During the six months ended June 30, 2014, the Operating Partnership acquired 18 land parcels, upon which single tenant commercial properties will be developed. Based on budgeted construction costs, the remaining costs to complete the buildings is estimated to be $15.3 million in aggregate. The land acquired for an aggregate amount of $8.2 million is included in land in the accompanying consolidated balance sheet. In addition, during the six months ended June 30, 2014, the Operating Partnership substantially completed the development of a 450,000 square foot distribution warehouse in Columbia, South Carolina. The build-to-suit project has an estimated total investment of $22.0 million. As of June 30, 2014, the Operating Partnership had a total investment of $20.4 million, including capitalized interest of $37,000, and an estimated remaining investment of $1.7 million related to the development project.
Prior to the CapLease Acquisition Date, CapLease entered into an agreement with a major Texas-based developer to develop a 150,000 square foot speculative office building in The Woodlands, Texas, adjacent to and part of the same development as an existing office building owned by CapLease since 2012. Costs of the project, which are budgeted to be $34.0 million, are scheduled to be funded by equity contributions from the Operating Partnership and its developer partner, and $17.0 million of advances during the construction period under a development loan entered into with Amegy Bank. All equity contributions are scheduled to be borne as follows: the Operating Partnership, 90%; and the developer, 10%; except for cost overruns, which will be borne 50% by each. Because the Operating Partnership has a controlling financial interest in the investment, the Operating Partnership consolidates the investment for financial accounting purposes. The Operating Partnership has an option to purchase, and the developer the option to sell to the Operating Partnership, in each case at fair market value, the developer’s interest in the project upon (i) substantial completion of the project and (ii) leases being entered into for 95% of the square footage of the project. Construction activity and funding of the project commenced during the quarter ended September 30, 2013 and is expected to be completed during the second half of 2014. As of June 30, 2014, the Operating Partnership had a total investment of $20.0 million, including capitalized interest of $68,000, and estimated remaining investment of $14.0 million related to the development project.
Tenant Concentration
As of June 30, 2014 and June 30, 2013, there were no tenants exceeding 10% of consolidated annualized rental income. Annualized rental income for net leases is rental income as of the period reported, which includes the effect of tenant concessions such as free rent, as applicable.
F-157
Table of Contents
ARC PROPERTIES OPERATING PARTNERSHIP, L.P.
NOTES TO CONSOLIDATED FINANCIAL STATEMENTS
June 30, 2014
(Unaudited)
Geographic Concentration
As of June 30, 2014, properties located in Texas represented 12.9% of consolidated annualized rental income determined on a straight-line basis. There were no geographic concentrations exceeding 10% of consolidated annualized rental income at June 30, 2013.
Note 7—Investment Securities, at Fair Value
Investment securities are considered available-for-sale and, therefore, increases or decreases in the fair value of these investments are recorded in accumulated other comprehensive income (loss) as a component of equity on the consolidated balance sheets unless the securities are considered to be other-than-temporarily impaired at which time the losses are reclassified to expense.
The following tables detail the unrealized gains and losses on investment securities as of June 30, 2014 and December 31, 2013 (in thousands):
| June 30, 2014 | ||||||||||||||||
| Amortized Cost | Gross Unrealized Gains |
Gross Unrealized Losses |
Fair Value | |||||||||||||
| Investments in real estate fund |
$ | 1,621 | $ | 270 | $ | — | $ | 1,891 | ||||||||
| CMBS |
208,584 | 8,775 | (46 | ) | 217,313 | |||||||||||
|
|
|
|
|
|
|
|
|
|||||||||
| Total |
$ | 210,205 | $ | 9,045 | $ | (46 | ) | $ | 219,204 | |||||||
|
|
|
|
|
|
|
|
|
|||||||||
| December 31, 2013 | ||||||||||||||||
| Amortized Cost | Gross Unrealized Gains |
Gross Unrealized Losses |
Fair Value | |||||||||||||
| Investments in real estate fund |
$ | 1,589 | $ | — | $ | (105 | ) | $ | 1,484 | |||||||
| CMBS |
60,452 | 498 | (367 | ) | 60,583 | |||||||||||
|
|
|
|
|
|
|
|
|
|||||||||
| Total |
$ | 62,041 | $ | 498 | $ | (472 | ) | $ | 62,067 | |||||||
|
|
|
|
|
|
|
|
|
|||||||||
CMBS
In connection with the Cole Merger, the Operating Partnership acquired 15 CMBS with an estimated aggregate fair value of $151.2 million as of the Cole Acquisition Date. As of June 30, 2014, the Operating Partnership owned 25 CMBS with an estimated aggregate fair value of $217.3 million. As of June 30, 2014, certain of these securities were pledged as collateral under repurchase agreements (the “Repurchase Agreements”), as discussed in Note 12—Other Debt. As of December 31, 2013, the Operating Partnership owned 10 CMBS with an estimated aggregate fair value of $60.6 million.
As of June 30, 2014, the fair value of one CMBS was below its amortized cost by approximately $46,000. The Operating Partnership evaluated each of the securities for other-than-temporary impairment at June 30, 2014, and determined that no other-than-temporary impairment charges on its securities were appropriate. The Operating Partnership believes that none of the unrealized losses on investment securities are other-than-temporary because management expects the Operating Partnership will receive all contractual principal and interest related to these investments. In addition, the Operating Partnership is not required, and does not intend, to sell these securities.
F-158
Table of Contents
ARC PROPERTIES OPERATING PARTNERSHIP, L.P.
NOTES TO CONSOLIDATED FINANCIAL STATEMENTS
June 30, 2014
(Unaudited)
The scheduled maturity of the Operating Partnership’s CMBS as of June 30, 2014 is as follows (in thousands):
| June 30, 2014 | ||||||||
| Amortized Cost | Fair Value | |||||||
| Due within one year |
$ | — | $ | — | ||||
| Due after one year through five years |
1,202 | 1,237 | ||||||
| Due after five years through ten years |
178,922 | 186,042 | ||||||
| Due after ten years |
28,460 | 30,034 | ||||||
|
|
|
|
|
|||||
| $ | 208,584 | $ | 217,313 | |||||
|
|
|
|
|
|||||
Investment in Real Estate Fund
As of June 30, 2014, the Operating Partnership had investments in a real estate fund that is sponsored by an affiliate of the Former Manager of the Operating Partnership and which invests primarily in equity securities of other publicly traded REITs. This investment is accounted for under the equity method of accounting because the Operating Partnership has significant influence but not control.
Note 8—Loans Held for Investment
Loans Held for Investment
During the six months ended June 30, 2014, in connection with the Cole Merger, the Operating Partnership acquired two mortgage notes receivable, each of which is secured by an office building. The mortgage notes had a fair value of $72.3 million as of the Cole Acquisition Date. As of December 31, 2013, the Operating Partnership owned 12 loans held for investment, which were acquired in connection with the CapLease Merger and consist predominantly of mortgage loans on properties subject to leases to investment grade tenants. The loans had a fair value of $26.5 million at the CapLease Merger Date. At June 30, 2014, the Operating Partnership owned 14 loans held for investment, which had a carrying value of $97.6 million and carried interest rates ranging from 5.28% to 7.24%. As of December 31, 2013, the loans held for investment had a carrying value of $26.3 million and carried interest rates ranging from 5.28% to 7.24%. The fair value adjustment is being amortized to interest expense in the consolidated statements of operations over the term of the loan, using the effective interest method.
The Operating Partnership’s loan portfolio is comprised primarily of fully amortizing or nearly fully amortizing first mortgage loans on commercial real estate leased to a single tenant. Therefore, the Operating Partnership’s monitoring of the credit quality of its loans held for investment is focused primarily on an analysis of the tenant, including review of tenant credit ratings (including changes in ratings) and other measures of tenant credit quality, trends in the tenant’s industry and general economic conditions, and an analysis of measures of collateral coverage, such as an estimate of the loan’s loan-to-value (“LTV”) ratio (principal amount outstanding divided by estimated value of the property) and its remaining term until maturity. As of June 30, 2014 and December 31, 2013, the Operating Partnership had no reserve for loan loss.
F-159
Table of Contents
ARC PROPERTIES OPERATING PARTNERSHIP, L.P.
NOTES TO CONSOLIDATED FINANCIAL STATEMENTS
June 30, 2014
(Unaudited)
Note 9—Deferred Costs and Other Assets, Net
Deferred costs and other assets, net consisted of the following as of June 30, 2014 and December 31, 2013 (in thousands):
| June 30, 2014 |
December 31, 2013 |
|||||||
| Deferred costs, net |
$ | 145,305 | $ | 119,731 | ||||
| Accounts receivable, net(1) |
64,791 | 16,690 | ||||||
| Straight-line rent receivable |
43,892 | 19,009 | ||||||
| Prepaid expenses |
17,369 | 5,379 | ||||||
| Leasehold improvements, property and equipment, net(2) |
19,923 | 1,451 | ||||||
| Restricted escrow deposits |
49,656 | 101,814 | ||||||
| Derivative assets, at fair value |
5,522 | 9,189 | ||||||
| Other assets |
58,598 | 5,998 | ||||||
|
|
|
|
|
|||||
| $ | 405,056 | $ | 279,261 | |||||
|
|
|
|
|
|||||
| (1) | Allowance for doubtful accounts was $1.8 million and $0.2 million as of June 30, 2014 and December 31, 2013, respectively. |
| (2) | Amortization expense for leasehold improvements totaled $0.2 million and $0.6 million for the three and six months ended June 30, 2014, respectively. Accumulated amortization was $0.6 million and $0.1 million as of June 30, 2014 and December 31, 2013, respectively. Depreciation expense for property and equipment totaled $0.3 million and $0.8 million for the three and six months ended June 30, 2014, respectively. Accumulated depreciation was $0.9 million and $0.1 million as of June 30, 2014 and December 31, 2013, respectively. |
Note 10—Fair Value of Financial Instruments
The Operating Partnership determines fair value based on quoted prices when available or through the use of alternative approaches, such as discounting the expected cash flows using market interest rates commensurate with the credit quality and duration of the investment. The guidance defines three levels of inputs that may be used to measure fair value:
Level 1—Quoted prices in active markets for identical assets and liabilities that the reporting entity has the ability to access at the measurement date.
Level 2—Inputs other than quoted prices included within Level 1 that are observable for the asset and liability or can be corroborated with observable market data for substantially the entire contractual term of the asset or liability.
Level 3—Unobservable inputs that reflect the entity’s own assumptions about the assumptions that market participants would use in the pricing of the asset or liability and are consequently not based on market activity, but rather through particular valuation techniques.
The determination of where an asset or liability falls in the hierarchy requires significant judgment and considers factors specific to the asset or liability. In instances where the determination of the fair value
F-160
Table of Contents
ARC PROPERTIES OPERATING PARTNERSHIP, L.P.
NOTES TO CONSOLIDATED FINANCIAL STATEMENTS
June 30, 2014
(Unaudited)
measurement is based on inputs from different levels of the fair value hierarchy, the level in the fair value hierarchy within which the entire fair value measurement falls is based on the lowest level input that is significant to the fair value measurement in its entirety. The Operating Partnership evaluates its hierarchy disclosures each quarter and depending on various factors, it is possible that an asset or liability may be classified differently from quarter to quarter. However, the Operating Partnership expects that changes in classifications between levels will be infrequent.
Although the Operating Partnership has determined that the majority of the inputs used to value its derivatives fall within Level 2 of the fair value hierarchy, the credit valuation adjustments associated with those derivatives utilize Level 3 inputs, such as estimates of current credit spreads to evaluate the likelihood of default by the Operating Partnership and its counterparties. However, as of June 30, 2014, the Operating Partnership has assessed the significance of the impact of the credit valuation adjustments on the overall valuation of its derivative positions and has determined that the credit valuation adjustments are not significant to the overall valuation of the Operating Partnership’s derivatives. As a result, the Operating Partnership has determined that its derivative valuations in their entirety are classified in Level 2 of the fair value hierarchy.
The following tables present information about the Operating Partnership’s assets and liabilities (including derivatives that are presented net) measured at fair value on a recurring basis as of June 30, 2014 and December 31, 2013, aggregated by the level in the fair value hierarchy within which those instruments fall (in thousands):
| Level 1 | Level 2 | Level 3 | Balance as of June 30, 2014 |
|||||||||||||
| Assets: |
||||||||||||||||
| Investments in real estate fund |
$ | — | $ | 1,891 | $ | — | $ | 1,891 | ||||||||
| CMBS |
— | — | 217,313 | 217,313 | ||||||||||||
| Interest rate swap assets |
— | 5,522 | — | 5,522 | ||||||||||||
|
|
|
|
|
|
|
|
|
|||||||||
| Total assets |
$ | — | $ | 7,413 | $ | 217,313 | $ | 224,726 | ||||||||
|
|
|
|
|
|
|
|
|
|||||||||
| Liabilities: |
||||||||||||||||
| Interest rate swap liabilities |
$ | — | $ | (12,811 | ) | $ | — | $ | (12,811 | ) | ||||||
| Series D Preferred Stock embedded derivative |
— | — | (11,520 | ) | (11,520 | ) | ||||||||||
| Contingent consideration arrangements |
— | — | (4,818 | ) | (4,818 | ) | ||||||||||
|
|
|
|
|
|
|
|
|
|||||||||
| Total liabilities |
$ | — | $ | (12,811 | ) | $ | (16,338 | ) | $ | (29,149 | ) | |||||
|
|
|
|
|
|
|
|
|
|||||||||
| Level 1 | Level 2 | Level 3 | Balance as of December 31, 2013 |
|||||||||||||
| Assets: |
||||||||||||||||
| Investments in real estate fund |
$ | — | $ | 1,484 | $ | — | $ | 1,484 | ||||||||
| CMBS |
— | — | 60,583 | 60,583 | ||||||||||||
| Interest rate swap assets |
— | 9,189 | — | 9,189 | ||||||||||||
|
|
|
|
|
|
|
|
|
|||||||||
| Total assets |
$ | — | $ | 10,673 | $ | 60,583 | $ | 71,256 | ||||||||
|
|
|
|
|
|
|
|
|
|||||||||
| Liabilities: |
||||||||||||||||
| Interest rate swap liabilities |
$ | — | $ | (1,719 | ) | $ | — | $ | (1,719 | ) | ||||||
| Series D Preferred Stock embedded derivative |
— | — | (16,736 | ) | (16,736 | ) | ||||||||||
|
|
|
|
|
|
|
|
|
|||||||||
| Total liabilities |
$ | — | $ | (1,719 | ) | $ | (16,736 | ) | $ | (18,455 | ) | |||||
|
|
|
|
|
|
|
|
|
|||||||||
F-161
Table of Contents
ARC PROPERTIES OPERATING PARTNERSHIP, L.P.
NOTES TO CONSOLIDATED FINANCIAL STATEMENTS
June 30, 2014
(Unaudited)
Investments in real estate fund—The fair value of the Operating Partnership’s investments in real estate fund is based on published pricing.
CMBS—The fair values of the Operating Partnership’s CMBS are valued using broker quotations, collateral values, subordination levels and liquidity of the individual securities.
Derivatives—The valuation of derivative instruments is determined using a discounted cash flow analysis on the expected cash flows of each derivative. This analysis reflects the contractual terms of the derivatives, including the period to maturity, as well as observable market-based inputs, including interest rate curves and implied volatilities. In addition, credit valuation adjustments are incorporated into the fair values to account for the Operating Partnership’s potential nonperformance risk and the performance risk of the counterparties.
Series D Preferred Stock embedded derivative—The valuation of this derivative instrument is determined using a binomial option pricing model. Key inputs in the model include the expected term, risk-free interest rate, volatility and dividend yield.
Contingent consideration arrangements—The contingent consideration arrangements are carried at fair value. The fair value of the contingent payments related to property acquisitions is determined based on the estimated timing and probability of successfully leasing vacant space subsequent to the Operating Partnership’s acquisition of certain properties. The estimated fair value of the property-related contingent consideration arrangements totaled $4.8 million as of June 30, 2014 and is included in the accompanying consolidated balance sheet in deferred rent, derivative and other liabilities. There were no property related contingent consideration arrangements as of December 31, 2013.
The fair value of short-term financial instruments such as cash and cash equivalents, restricted cash, due to affiliates and accounts payable approximate their carrying value on the accompanying consolidated balance sheets due to their short-term nature and are classified as Level 1 under the fair value hierarchy.
A review of the fair value hierarchy classification is conducted on a quarterly basis. Changes in the type of inputs may result in a reclassification for certain assets. There were no transfers between Level 1 and Level 2 or Level 3 of the fair value hierarchy during the six months ended June 30, 2014.
The following is a reconciliation of the changes in instruments with Level 3 inputs in the fair value hierarchy for the six months ended June 30, 2014 (in thousands):
| CMBS | Series D Preferred Stock Embedded Derivative |
Contingent Consideration Arrangements |
Total | |||||||||||||
| Beginning balance as of December 31, 2013 |
$ | 60,583 | $ | (16,736 | ) | $ | — | $ | 43,847 | |||||||
| Total gains and losses: |
||||||||||||||||
| Unrealized gain included in other comprehensive income, net |
8,598 | — | — | 8,598 | ||||||||||||
| Changes in fair value included in net income, net |
— | 5,216 | (1,212 | ) | 4,004 | |||||||||||
| Purchases, issuances, settlements and amortization: |
||||||||||||||||
| Purchases/issuances |
151,197 | — | (3,606 | ) | 147,591 | |||||||||||
| Amortization included in net income, net |
(3,065 | ) | — | — | (3,065 | ) | ||||||||||
|
|
|
|
|
|
|
|
|
|||||||||
| Ending balance as of June 30, 2014 |
$ | 217,313 | $ | (11,520 | ) | $ | (4,818 | ) | $ | 200,975 | ||||||
|
|
|
|
|
|
|
|
|
|||||||||
F-162
Table of Contents
ARC PROPERTIES OPERATING PARTNERSHIP, L.P.
NOTES TO CONSOLIDATED FINANCIAL STATEMENTS
June 30, 2014
(Unaudited)
The fair values of the Operating Partnership’s financial instruments that are not reported at fair value on the consolidated balance sheets are reported below (dollar amounts in thousands):
| Level | Carrying Amount at June 30, 2014 |
Fair Value at June 30, 2014 |
Carrying Amount at December 31, 2013 |
Fair Value at December 31, 2013 |
||||||||||||||||
| Assets: |
||||||||||||||||||||
| Loans held for investment |
3 | $ | 97,587 | $ | 98,902 | $ | 26,279 | $ | 26,435 | |||||||||||
|
|
|
|
|
|
|
|
|
|||||||||||||
| Liabilities: |
||||||||||||||||||||
| Mortgage notes payable, net |
3 | $ | 4,227,494 | $ | 4,328,230 | $ | 1,301,114 | $ | 1,305,823 | |||||||||||
| Corporate bonds, net |
3 | 2,546,089 | 2,568,117 | — | — | |||||||||||||||
| Convertible debt, net |
3 | 975,003 | 1,035,581 | 972,490 | 976,629 | |||||||||||||||
| Credit facilities |
3 | 1,896,000 | 1,896,000 | 1,819,800 | 1,819,800 | |||||||||||||||
| Secured term loan |
3 | 51,296 | 51,411 | 58,979 | 59,049 | |||||||||||||||
| Trust preferred notes |
3 | 26,579 | 23,485 | 26,548 | 23,345 | |||||||||||||||
| Other debt |
3 | 68,283 | 68,414 | 19,278 | 19,350 | |||||||||||||||
|
|
|
|
|
|
|
|
|
|||||||||||||
| Total liabilities |
$ | 9,790,744 | $ | 9,971,238 | $ | 4,198,209 | $ | 4,203,996 | ||||||||||||
|
|
|
|
|
|
|
|
|
|||||||||||||
Loans held for investment—The fair value of the Operating Partnership’s fixed-rate loan portfolio is estimated with a discounted cash flow analysis, utilizing scheduled cash flows and discount rates estimated by management to approximate those that a willing buyer and seller might use.
Credit facilities—Management believes that the stated interest rates (which float based on short-term interest rates) approximates market rates. As such, the fair values of these obligations is estimated to be equal to the outstanding principal amounts.
Convertible notes and Corporate bonds—The fair value of the convertible notes and corporate bonds is estimated by an independent third party using market comps from regularly traded bonds with similar terms.
Mortgage notes payable, Trust preferred notes, Other debt and Secured term loan—The fair value of mortgages payable on real estate investments and the secured term loan is estimated by an independent third party using a discounted cash flow analysis, based on management’s estimates of market interest rates.
Note 11—Mortgage Notes Payable
The Operating Partnership’s mortgage notes payable consist of the following as of June 30, 2014 and December 31, 2013 (dollar amounts in thousands):
| Encumbered Properties |
Outstanding Loan Amount |
Weighted Average Effective Interest Rate(1) |
Weighted Average Maturity(2) |
|||||||||||||
| June 30, 2014 |
757 | $ | 4,125,621 | 4.90 | % | 6.00 | ||||||||||
| December 31, 2013 |
177 | $ | 1,258,661 | 3.42 | % | 3.41 | ||||||||||
| (1) | Mortgage notes payable primarily have fixed rates or are fixed by way of interest rate swap arrangements. Effective interest rates range from 2.40% to 7.20% at June 30, 2014 and 1.83% to 6.28% at December 31, 2013. |
| (2) | Weighted average remaining years until maturity as of June 30, 2014 and December 31, 2013, respectively. |
F-163
Table of Contents
ARC PROPERTIES OPERATING PARTNERSHIP, L.P.
NOTES TO CONSOLIDATED FINANCIAL STATEMENTS
June 30, 2014
(Unaudited)
In conjunction with the various mergers and portfolio acquisitions, as described in Note 2—Mergers and Acquisitions, aggregate net premiums totaling $137.4 million were recorded upon the assumption of the mortgages for above-market interest rates. Amortization of these net premiums is recorded as a reduction to interest expense over the remaining term of the respective mortgages using the effective-interest method. As of June 30, 2014, there was $101.9 million in unamortized net premiums included in mortgage notes payable, net on the consolidated balance sheet.
The following table summarizes the scheduled aggregate principal repayments subsequent to June 30, 2014 (in thousands):
| Year |
Total | |||
| July 1, 2014—December 31, 2014 |
$ | 104,043 | ||
| 2015 |
270,843 | |||
| 2016 |
250,881 | |||
| 2017 |
522,655 | |||
| 2018 |
252,292 | |||
| Thereafter |
2,724,907 | |||
|
|
|
|||
| Total |
$ | 4,125,621 | ||
|
|
|
|||
The Operating Partnership’s mortgage loan agreements generally require restrictions on corporate guarantees and the maintenance of financial covenants including maintenance of certain financial ratios (such as specified debt to equity and debt service coverage ratios). As of June 30, 2014, the Operating Partnership was in compliance with the debt covenants under the mortgage loan agreements.
During the three and six months ended June 30, 2014, the Operating Partnership paid off $132.8 million and $854.5 million, respectively, of mortgage notes payable, including notes that were subject to interest rate swap agreements. In connection with the debt repayments, the Operating Partnership paid prepayment fees totaling $3.7 million and $33.5 million for the three and six months ended June 30, 2014, respectively. In addition, the Operating Partnership paid $9.9 million during the six months ended June 30, 2014 for the settlement of interest rate swaps that were associated with certain of the mortgage notes, which approximated the fair value of the interest rate swaps. Both the prepayment fees and interest rate swap settlements are included in interest expense, net in the accompanying consolidated statements of operations. No such swap settlements were paid during the three months ended June 30, 2014. In addition, the Operating Partnership wrote off the deferred financing costs and premiums and discounts associated with these mortgages, which resulted in a reduction to interest expense of $1.6 million and $23.6 million during the three and six months ended June 30, 2014, respectively. The recently paid off mortgages had a weighted average remaining interest rate of 4.86% and a weighted average remaining term of 2.5 years.
Note 12—Other Debt
Corporate Bond Offering
On February 6, 2014, the Operating Partnership issued, in a private offering, $2.55 billion aggregate principal amount of senior unsecured notes consisting of $1.3 billion aggregate principal amount of 2.00% senior notes due 2017 (the “2017 Notes”), $750.0 million aggregate principal amount of 3.00% senior notes due 2019 (the “2019 Notes”) and $500.0 million aggregate principal amount of 4.60% senior notes due 2024 (the “2024
F-164
Table of Contents
ARC PROPERTIES OPERATING PARTNERSHIP, L.P.
NOTES TO CONSOLIDATED FINANCIAL STATEMENTS
June 30, 2014
(Unaudited)
Notes,” and, together with the 2017 Notes and 2019 Notes, the “Notes”). The Notes are guaranteed by the General Partner. The Operating Partnership may redeem all or a part of any series of the Notes at any time at its option at the redemption prices set forth in the indenture governing the Notes, plus accrued and unpaid interest on the principal amount of the Notes of such series being redeemed to, but excluding, the applicable redemption date. With respect to the 2019 Notes and the 2024 Notes, if such Notes are redeemed on or after January 6, 2019 with respect to the 2019 Notes, or November 6, 2023 with respect to the 2024 Notes, the redemption price will equal 100% of the principal amount of the Notes of the applicable series to be redeemed, plus accrued and unpaid interest on the amount being redeemed to, but excluding, the applicable redemption date. In conjunction with this corporate bond offering, aggregate discounts totaling $4.2 million were recorded. As of June 30, 2014, the unamortized net discount totaled $3.9 million.
Convertible Senior Note Offering
Effective July 29, 2013, the Operating Partnership issued to the General Partner $300.0 million of the 2018 Notes and issued an additional $10.0 million of its 2018 Notes on August 1, 2013 (collectively, the “Original 2018 Notes”). Effective December 10, 2013, the Operating Partnership issued an additional $287.5 million through a reopening of the 2018 Notes indenture agreement (the “Reopened 2018 Notes,” together with the Original 2018 Notes, the “2018 Notes”). The 2018 Notes mature on August 1, 2018. Such issuances were identical to ARCP’s registered issuances of the same amount of notes to various purchasers in a public offering. The fair value of the Original 2018 Notes and Reopened 2018 Notes was determined at issuance to be $299.6 million and $282.1 million, respectively, resulting in a debt discount of $10.4 million and $5.4 million, respectively, with an offset recorded to partners’ equity representing the equity component of the notes for the conversion options. The discount is being amortized to interest expense over the expected lives of the 2018 Notes. As of June 30, 2014, the carrying value of the Original 2018 Notes and Reopened 2018 Notes was $301.5 million and $282.7 million, respectively. In connection with any permissible conversion election made by the holders of the identical convertible notes issued by ARCP, the General Partner may elect to convert the 2018 Notes into cash, General Partner OP Units or a combination thereof, in limited circumstances prior to February 1, 2018 and may convert the 2018 Notes at any time into such consideration on or after February 1, 2018. The initial conversion rate is 59.805 General Partner OP Units per $1,000 principal amount of 2018 Notes.
Effective December 10, 2013, the Operating Partnership issued to the General Partner $402.5 million of 3.75% Convertible Senior Notes (the “2020 Notes”). The 2020 Notes mature on December 15, 2020. Such issuance was identical to ARCP’s registered issuance of the same amount of notes to various purchasers in a public offering. The fair value of the 2020 Notes was determined at issuance to be $389.7 million, resulting in a debt discount of $12.8 million with an offset recorded to partners’ equity representing the equity component of the notes for the conversion options. The discount is being amortized to interest expense over the expected life of the 2020 Notes. As of June 30, 2014, the carrying value of the 2020 Notes was $390.7 million. In connection with any permissible conversion election made by the holders of the identical convertible notes issued by ARCP, the General Partner may elect to convert the 2020 Notes into cash, General Partner OP Units or a combination thereof, in limited circumstances prior to June 15, 2020 and may convert the 2020 Notes at any time into such consideration on or after June 15, 2020. The initial conversion rate is 66.0262 General Partner OP Units per $1,000 principal amount of 2020 Notes.
In connection with the 2018 Notes and 2020 Notes, the remaining unamortized discount totaled $25.0 million as of June 30, 2014.
F-165
Table of Contents
ARC PROPERTIES OPERATING PARTNERSHIP, L.P.
NOTES TO CONSOLIDATED FINANCIAL STATEMENTS
June 30, 2014
(Unaudited)
Trust Preferred Notes
As part of the CapLease Merger, the Operating Partnership assumed $30.9 million in aggregate principal amount of fixed/floating rate preferred notes with a fair value of $26.5 million at the CapLease Acquisition Date. The trust preferred securities represent an unsecured subordinated recourse debt obligation of the Operating Partnership and require quarterly interest payments calculated at a fixed interest rate equal to 7.68% per annum through January 30, 2016, and subsequently at a variable interest rate equal to LIBOR plus 2.60% per annum. The notes must be redeemed on January 30, 2036, and may be redeemed, in whole or in part, at par, at the Operating Partnership’s option, at any time. The discount recorded on the notes is being amortized to interest expense on the consolidated statements of operations over the life of the preferred notes. As of June 30, 2014, the carrying value of the preferred securities was $26.6 million, which is included in other debt, net in the accompanying consolidated balance sheets.
Subsequent to June 30, 2014, the Operating Partnership redeemed the Trust Preferred Notes at par.
Secured Term Loan
As part of the CapLease Merger, the Operating Partnership assumed a secured term loan with KBC Bank, N.V. with a principal balance of $59.8 million and a fair value of $60.7 million at the CapLease Acquisition Date. The interest coupon on the loan is fixed at 5.81% annually until the loan matures in January 2018. The loan is non-recourse to the Operating Partnership, subject to limited non-recourse exceptions. During the six months ended June 30, 2014, the Operating Partnership made principal payments of $7.5 million. The premium is being amortized to interest expense on the consolidated statements of operations over the life of the secured term loan. As of June 30, 2014, the carrying value of the secured term loan was $51.3 million, which is included in other debt, net in the accompanying consolidated balance sheets.
Amounts related to the secured term loan as of June 30, 2014 were as follows (in thousands):
| Borrowings | Collateral Carrying Value |
|||||||
| Loans held for investment |
$ | 31,597 | $ | 44,670 | ||||
| Intercompany mortgage loans on CapLease properties |
5,525 | 17,124 | ||||||
| CMBS |
13,529 | 21,900 | ||||||
|
|
|
|
|
|||||
| $ | 50,651 | $ | 83,694 | |||||
|
|
|
|
|
|||||
Other Debt
As part of the CapLease Merger, ARCP assumed $19.2 million of senior notes (the “Senior Notes”) that bear interest at an annual interest rate of 7.50%, payable semi-annually on April 1 and October 1, with a fair value of $19.3 million at the CapLease Acquisition Date. The Senior Notes mature on October 1, 2027. ARCP has the right to redeem the Senior Notes in whole or in part for cash at any time or from time to time at a redemption price equal to 100% of the principal amount of the Senior Notes to be redeemed, plus any accrued and unpaid interest. Holders of the Senior Notes may require ARCP to repurchase their Senior Notes, in whole or in part, on October 1, 2017 and October 1, 2022, for a cash price equal to 100% of the principal amount of the Senior Notes to be repurchased, plus any accrued and unpaid interest. On the CapLease Acquisition Date, the Operating Partnership issued the General Partner notes that had identical terms as the Senior Notes (“General
F-166
Table of Contents
ARC PROPERTIES OPERATING PARTNERSHIP, L.P.
NOTES TO CONSOLIDATED FINANCIAL STATEMENTS
June 30, 2014
(Unaudited)
Partner Senior Notes”). The discount is being amortized to interest expense on the consolidated statements of operations over the life of the General Partner Senior Notes. As of June 30, 2014, the carrying value of the Senior Notes was $19.3 million, which is included in other debt, net in the accompanying consolidated balance sheets.
In conjunction with the CapLease Merger, aggregate net discounts totaling $3.5 million were recorded upon assumption of the trust preferred notes, secured term loan and Senior Notes. As of June 30, 2014, unamortized net discounts were $3.6 million in unamortized net discounts included in other debt, net on the consolidated balance sheets.
Subsequent to June 30, 2014, ARCP repaid the $19.2 million outstanding on the Senior Notes at par. In conjunction with ARCP’s repayment, the Operating Partnership repaid the $19.2 million General Partner Senior Notes at par.
Future Minimum Repayments
The following table summarizes the scheduled aggregate principal repayments on Other Debt subsequent to June 30, 2014 (in thousands):
| Principal Repayment | ||||
| July 1, 2014—December 31, 2014 |
$ | 54,339 | ||
| 2015 |
11,862 | |||
| 2016 |
12,516 | |||
| 2017 |
7,680 | |||
| 2018 |
13,267 | |||
| Thereafter |
50,140 | |||
|
|
|
|||
| $ | 149,804 | |||
|
|
|
|||
Barclay’s Facility
As of December 31, 2013, the Operating Partnership had available commitments from Barclays Bank PLC, and other committed parties, for up to $2.1 billion in senior secured term loans (the “Barclays Facility”) which, if funded, would have been available to fund cash amounts payable in connection with the Cole Merger. The Barclays Facility was terminated upon the issuance of the senior unsecured notes in February 2014. In connection with the termination, the Operating Partnership recorded $32.6 million as amortization of deferred financing costs associated with the Barclays Facility, which is included in interest expense, net in the accompanying consolidated statements of operations.
Repurchase Agreements
As part of the Cole Merger, the Operating Partnership assumed $49.0 million of repurchase agreements secured by a portion of the Operating Partnership’s CMBS portfolio. The Repurchase Agreements have interest rates ranging from LIBOR plus 1.35% to 1.75% and mature on various dates from July 2014 through September 2014. Upon maturity, the Operating Partnership may elect to renew the Repurchase Agreements for 90 day periods until the CMBS mature. The CMBS have a weighted average remaining term of 7.72 years. Under the Repurchase Agreements, the lender retains the right to mark the underlying collateral to fair value. A reduction in the value of the pledged assets would require the Operating Partnership to provide additional collateral to fund
F-167
Table of Contents
ARC PROPERTIES OPERATING PARTNERSHIP, L.P.
NOTES TO CONSOLIDATED FINANCIAL STATEMENTS
June 30, 2014
(Unaudited)
margin calls. As of June 30, 2014, the securities held as collateral had a fair value of $144.8 million and an amortized cost of $139.3 million. There was no cash collateral held by the counterparty as of June 30, 2014. The Repurchase Agreements are being accounted for as secured borrowings because the Operating Partnership maintains effective control of the financed assets. The Repurchase Agreements are non-recourse to the Operating Partnership and the OP and are included in other debt, net in the accompanying consolidated balance sheets.
Note 13—Credit Facilities
Senior Unsecured Credit Facility
The Operating Partnership, as borrower, and the General Partner, as guarantor, are parties to a senior corporate credit facility with Wells Fargo, National Association, as administrative agent and other lenders party thereto (the “Credit Facility”).
On June 30, 2014, the Operating Partnership, as borrower, and the General Partner, as guarantor, entered into an amended and restated credit agreement (the “Agreement”), which increased the available borrowings, extended the term and decreased the interest rates associated with the prior credit facility. The Operating Partnership and the General Partner accepted commitments from 20 financial institutions totaling $4.6 billion for the Credit Facility in advance of the execution of the Agreement. As of June 30, 2014, the Credit Facility is comprised of a $1.2 billion term loan facility (with a delayed draw component equal to $200.0 million), a $3.15 billion dollar-denominated revolving credit facility and a $250.0 million multi-currency revolving facility (all of which can be borrowed in dollars, at the Operating Partnership’s discretion). The Credit Facility includes an accordion feature, which, if exercised in full, allows the Operating Partnership to increase the aggregate commitments under the Credit Facility to $6.0 billion, subject to the receipt of such additional commitments and the satisfaction of certain customary conditions.
The revolving credit facility generally bears interest at an annual rate of LIBOR plus from 1.00% to 1.80% or Base Rate plus 0.00% to 0.80% (based upon ARCP’s then current credit rating). “Base Rate” is defined as the highest of the prime rate, the federal funds rate plus 0.50% or a floating rate based on one month LIBOR, determined on a daily basis. The term loan facility generally bears interest at an annual rate of LIBOR plus 1.15% to 2.05%, or Base Rate plus 0.15% to 1.05% (based upon ARCP’s then current credit rating). The Loans will initially be priced with an applicable margin of 1.35% in the case of LIBOR revolving loans and 1.60% in the case of LIBOR term loans. In addition, the Agreement provides the flexibility for interest rate auctions, pursuant to which, at the Operating Partnership’s election, the Operating Partnership may request that lenders make competitive bids to provide revolving loans, which competitive bids may be at pricing levels that differ from the foregoing interest rates.
The Agreement provides for monthly interest payments under the Credit Facility. In the event of default, at the election of the majority of the lenders (or automatically upon a bankruptcy event of default with respect to the Operating Partnership or ARCP), the commitments of the lenders under the Credit Facility terminate, and payment of any unpaid amounts in respect of the Credit Facility is accelerated. The revolving credit facility and the term loan facility both terminate on June 30, 2018, in each case, unless extended in accordance with the terms of the Agreement. The Agreement provides for a one-year extension option with respect to each of the revolving credit facility and the term loan facility, exercisable at the Operating Partnership’s election and subject to certain customary conditions, as well as certain customary “amend and extend” provisions. At any time, upon timely notice by the Operating Partnership and subject to any breakage fees, the Operating Partnership may prepay borrowings under the Credit Facility (subject to certain limitations applicable to the prepayment of any loans
F-168
Table of Contents
ARC PROPERTIES OPERATING PARTNERSHIP, L.P.
NOTES TO CONSOLIDATED FINANCIAL STATEMENTS
June 30, 2014
(Unaudited)
obtained through an interest rate auction, as described above). The Operating Partnership incurs a fee equal to 0.15% to 0.25% per annum (based upon ARCP’s then current credit rating) multiplied by the commitments (whether or not utilized) in respect of the dollar revolving credit facility and the multi-currency credit facility. The Operating Partnership incurs an unused fee of 0.25% per annum on the unused amount of the delayed draw term loan commitments. In addition, the Operating Partnership incurs customary administrative agent, letter of credit issuance, letter of credit fronting, extension and other fees.
The Credit Facility requires restrictions on corporate guarantees, as well as the maintenance of financial covenants, including the maintenance of certain financial ratios (such as specified debt to equity and debt service coverage ratios) and the maintenance of a minimum net worth. At June 30, 2014, the Operating Partnership was in compliance with the debt covenants under the Credit Facility.
In connection with the Agreement, the Operating Partnership expensed $3.9 million of unamortized deferred financing costs incurred in connection with the original Credit Facility, which is included in interest expense, net in the accompanying consolidated unaudited statements of operations.
As of June 30, 2014, the outstanding balance on the Credit Facility was $1.9 billion, of which $881.0 million bore a floating interest rate of 1.50%. The remaining outstanding balance on the Credit Facility of $1.0 billion is fixed through the use of derivative instruments used to hedge interest rate volatility. Including the spread, which can vary based on ARCP’s credit rating, the interest rate on this portion was 2.84% at June 30, 2014. At June 30, 2014, a maximum of $2.7 billion was available to the Operating Partnership for future borrowings, subject to borrowing availability.
Repayment of Previous Credit Facilities
As part of the ARCT IV Merger, the Operating Partnership assumed a $800.0 million senior unsecured credit facility with various lenders, with Regions Bank acting as the administrative agent (the “ARCT IV Credit Facility”). As of the date of the ARCT IV Merger, there was $760.0 million outstanding under the ARCT IV Credit Facility, which consisted of a $300.0 million term loan facility and $460.0 million under the revolving credit facility. In connection with the ARCT IV Merger, the Operating Partnership prepaid all of its loans pursuant to, and terminated all commitments available under, the ARCT IV Credit Facility.
As part of the CapLease Merger, the Operating Partnership assumed an unsecured credit facility with Wells Fargo, National Association, which had commitments of up to $150.0 million. In February 2014, such credit facility was amended and certain modifications were made to the terms of the agreement (the “CapLease Credit Facility”). On June 6, 2014, the Operating Partnership repaid the outstanding balance of $150.0 million and terminated the credit facility agreement. No prepayment premium or penalty was paid in connection with the termination of the CapLease Credit Facility.
On February 28, 2013, the Operating Partnership repaid all of the outstanding borrowings under its previous senior secured revolving credit facility in the amount of $124.6 million and the credit agreement for such facility was terminated. The average interest rate on the borrowings during the period the balance was outstanding was 3.11%. On February 14, 2013, simultaneous with entering into the Credit Facility, the Operating Partnership terminated its then effective unsecured credit facility agreement, which had been unused.
F-169
Table of Contents
ARC PROPERTIES OPERATING PARTNERSHIP, L.P.
NOTES TO CONSOLIDATED FINANCIAL STATEMENTS
June 30, 2014
(Unaudited)
Note 14—Derivatives and Hedging Activities
Risk Management Objective of Using Derivatives
The Operating Partnership may use derivative financial instruments, including interest rate swaps, caps, options, floors and other interest rate derivative contracts, to hedge all or a portion of the interest rate risk associated with its borrowings. The principal objective of such arrangements is to minimize the risks and/or costs associated with the Operating Partnership’s operating and financial structure as well as to hedge specific anticipated transactions. The Operating Partnership does not intend to utilize derivatives for speculative or other purposes other than interest rate risk management. The use of derivative financial instruments carries certain risks, including the risk that the counterparties to these contractual arrangements are not able to perform under the agreements. To mitigate this risk, the Operating Partnership only enters into derivative financial instruments with counterparties with high credit ratings and with major financial institutions with which the Operating Partnership and its affiliates may also have other financial relationships. The Operating Partnership does not anticipate that any of the counterparties will fail to meet their obligations.
Cash Flow Hedges of Interest Rate Risk
The Operating Partnership’s objectives in using interest rate derivatives are to add stability to interest expense and to manage its exposure to interest rate movements. To accomplish this objective, the Operating Partnership primarily uses interest rate swaps and collars as part of its interest rate risk management strategy. Interest rate swaps designated as cash flow hedges involve the receipt of variable-rate amounts from a counterparty in exchange for the Operating Partnership making fixed-rate payments over the life of the agreements without exchange of the underlying notional amount. Interest rate collars designated as cash flow hedges involve the receipt of variable-rate amounts if interest rates rise above the cap strike rate on the contract and payments of variable-rate amounts if interest rates fall below the floor strike rate on the contract.
The effective portion of changes in the fair value of derivatives designated and that qualify as cash flow hedges is recorded in accumulated other comprehensive income and is subsequently reclassified into earnings in the period that the hedged forecasted transaction affects earnings. During the six months ended June 30, 2014, such derivatives were used to hedge the variable cash flows associated with variable-rate debt. The ineffective portion of the change in fair value of the derivatives is recognized directly in earnings.
Amounts reported in accumulated other comprehensive income related to derivatives will be reclassified to interest expense as interest payments are made on the Operating Partnership’s variable-rate debt. During the next twelve months, the Operating Partnership estimates that an additional $10.5 million will be reclassified from other comprehensive income as an increase to interest expense. During the three and six months ended ended June 30, 2014, the Operating Partnership accelerated the reclassification of amounts in other comprehensive income to earnings as a result of the hedged forecasted transactions becoming probable not to occur.
As of June 30, 2014, the Operating Partnership had the following outstanding interest rate derivatives that were designated as cash flow hedges of interest rate risk (dollar amounts in thousands):
| Interest Rate Derivative |
Number of Instruments |
Notional Amount |
||||||
| Interest rate swaps |
17 | $ | 1,174,367 | |||||
F-170
Table of Contents
ARC PROPERTIES OPERATING PARTNERSHIP, L.P.
NOTES TO CONSOLIDATED FINANCIAL STATEMENTS
June 30, 2014
(Unaudited)
The table below presents the fair value of the Operating Partnership’s derivative financial instruments as well as their classification on the consolidated balance sheets as of June 30, 2014 and December 31, 2013 (in thousands):
| Derivatives Designated |
Balance Sheet Location |
June 30, 2014 | December 31, 2013 | |||||||
| Interest rate products |
Deferred costs and other assets, net | $ | 4,665 | $ | 9,189 | |||||
| Interest rate products |
Deferred rent, derivative and other liabilities | $ | (9,190 | ) | $ | (1,719 | ) | |||
The table below details the location in the financial statements of the gain or loss recognized on interest rate derivatives designated as cash flow hedges for the three and six months ended ended June 30, 2014 and 2013, respectively (in thousands):
| Three Months Ended June 30, |
Six Months Ended June 30, |
|||||||||||||||
| Derivatives in Cash Flow Hedging Relationships |
2014 | 2013 | 2014 | 2013 | ||||||||||||
| Amount of (loss) gain recognized in accumulated other comprehensive income on interest rate derivatives (effective portion) |
$ | (6,883 | ) | $ | 14,058 | $ | (4,247 | ) | $ | 12,881 | ||||||
| Amount of loss reclassified from accumulated other comprehensive income into income as interest expense (effective portion) |
$ | — | $ | (1,272 | ) | $ | — | $ | (1,955 | ) | ||||||
Derivatives Not Designated as Hedging Instruments
Derivatives not designated as hedges are not speculative and are used to manage the Operating Partnership’s exposure to interest rate movements and other identified risks but do not meet the requirements to be classified as hedging instruments. Changes in the fair value of derivatives not designated in hedging relationships are recorded directly in earnings and were approximately a gain of $13.7 million and a gain of $5.7 million for the three and six months ended June 30, 2014, respectively. The Operating Partnership did not have any derivatives that were not designated during the six months ended June 30, 2013.
As of June 30, 2014, the Operating Partnership had the following outstanding interest rate derivatives that were not designated as qualifying hedging relationships (in thousands):
| Interest Rate Derivative |
Number of Instruments |
Notional Amount |
||||||
| Interest rate swaps |
6 | $ | 234,316 | |||||
The table below presents the fair value of the Operating Partnership’s derivate financial instruments not designated as hedges as well as their classification on the consolidated balance sheets as of June 30, 2014 and December 31, 2013 (in thousands):
| Derivatives Not Designated as Hedging |
Balance Sheet Location | June 30, 2014 |
December 31, 2013 |
|||||||
| Series D Preferred Units embedded derivative |
Deferred rent, derivative and other liabilities |
$ | (11,520 | ) | $ | (16,736 | ) | |||
| Interest rate products |
Deferred rent, derivative and other liabilities |
$ | (3,621 | ) | $ | — | ||||
| Interest rate products |
Deferred costs and other assets, net | $ | 857 | $ | — | |||||
F-171
Table of Contents
ARC PROPERTIES OPERATING PARTNERSHIP, L.P.
NOTES TO CONSOLIDATED FINANCIAL STATEMENTS
June 30, 2014
(Unaudited)
Tabular Disclosure Offsetting Derivatives
The table below details a gross presentation, the effects of offsetting and a net presentation of the Operating Partnership’s derivatives as of June 30, 2014 and December 31, 2013. The net amounts of derivative assets or liabilities can be reconciled to the tabular disclosure of fair value. The tabular disclosure of fair value provides the location that derivative assets and liabilities are presented on the consolidated balance sheets.
| Offsetting of Derivative Assets and Liabilities |
||||||||||||||||||||||||||||||||
| Gross Amounts of Recognized Assets |
Gross Amounts of Recognized Liabilities |
Gross Amounts Offset in the Consolidated Balance Sheets |
Net Amounts of Assets Presented in the Consolidated Balance Sheets |
Net Amounts of Liabilities Presented in the Consolidated Balance Sheets |
Financial Instruments |
Cash Collateral Received |
Net Amount |
|||||||||||||||||||||||||
| June 30, 2014 |
$ | 5,522 | $ | (24,331 | ) | $ | — | $ | 5,522 | $ | (24,331 | ) | $ | — | $ | — | $ | (18,809 | ) | |||||||||||||
| December 31, 2013 |
$ | 9,189 | $ | (18,455 | ) | $ | — | $ | 9,189 | $ | (18,455 | ) | $ | — | $ | — | $ | (9,266 | ) | |||||||||||||
Credit-risk-related Contingent Features
The Operating Partnership has agreements with each of its derivative counterparties that contain a provision where if the Operating Partnership either defaults or is capable of being declared in default on any of its indebtedness, then the Operating Partnership could also be declared in default on its derivative obligations.
As of June 30, 2014, the fair value of the interest rate derivatives in a net liability position, including accrued interest but excluding any adjustment for nonperformance risk related to these agreements, was $14.6 million. As of June 30, 2014, the Operating Partnership has not posted any collateral related to these agreements and was not in breach of any agreement provisions. If the Operating Partnership had breached any of these provisions, it could have been required to settle its obligations under the agreements at their aggregate termination value of $14.6 million at June 30, 2014.
Note 15—Accounts Payable and Accrued Expenses
Accounts payable and accrued expenses consisted of the following as of June 30, 2014 and December 31, 2013 (in thousands):
| June 30, 2014 | December 31, 2013 | |||||||
| Accrued other |
$ | 52,317 | $ | 38,028 | ||||
| Accrued interest |
53,353 | 14,189 | ||||||
| Accrued real estate taxes |
43,830 | 15,727 | ||||||
| Accounts payable |
5,241 | 7,155 | ||||||
| Accrued merger costs |
— | 673,990 | ||||||
| Accrued Outperformance Plan (OPP) obligation |
— | 59,400 | ||||||
|
|
|
|
|
|||||
| $ | 154,741 | $ | 808,489 | |||||
|
|
|
|
|
|||||
F-172
Table of Contents
ARC PROPERTIES OPERATING PARTNERSHIP, L.P.
NOTES TO CONSOLIDATED FINANCIAL STATEMENTS
June 30, 2014
(Unaudited)
Note 16—Commitments and Contingencies
Litigation
In the ordinary course of business, the Operating Partnership may become subject to litigation or claims. There are no material legal proceedings pending or known to be contemplated against the Operating Partnership, except as follows:
ARCT III Litigation Matters
After the announcement of the ARCT III Merger Agreement on December 17, 2012, Randell Quaal filed a putative class action lawsuit filed on January 30, 2013 against the General Partner, the Operating Partnership, ARCT III, ARCT III OP, the members of the board of directors of ARCT III and certain subsidiaries of the General Partner in the Supreme Court of the State of New York. The plaintiff alleges, among other things, that the board of ARCT III breached its fiduciary duties in connection with the transactions contemplated under the ARCT III Merger Agreement. In February 2013, the parties agreed to a memorandum of understanding regarding settlement of all claims asserted on behalf of the alleged class of ARCT III stockholders. In connection with the settlement contemplated by that memorandum of understanding, the class action and all claims asserted therein will be dismissed, subject to court approval. The proposed settlement terms required ARCT III to make certain additional disclosures related to the ARCT III Merger, which were included in a Current Report on Form 8-K filed by ARCT III with the SEC on February 21, 2013. The memorandum of understanding also added that the parties will enter into a stipulation of settlement, which will be subject to customary conditions, including confirmatory discovery and court approval following notice to ARCT III’s stockholders. If the parties enter into a stipulation of settlement, a hearing will be scheduled at which the court will consider the fairness, reasonableness and adequacy of the settlement. There can be no assurance that the parties will ultimately enter into a stipulation of settlement, that the court will approve any proposed settlement, or that any eventual settlement will be under the same terms as those contemplated by the memorandum of understanding, therefore any losses that may be incurred to settle this matter are not determinable.
CapLease Litigation Matters
Since the announcement of the CapLease Merger Agreement on May 28, 2013, the following lawsuits have been filed:
On May 28, 2013, Jacquelyn Mizani filed a putative class action lawsuit in the Supreme Court for the State of New York against the General Partner, the Operating Partnership, Safari Acquisition LLC, CapLease, CapLease LP, CLF OP General Partner, LLC and the members of the CapLease board of directors (the “Mizani Action”). The complaint alleges, among other things, that the merger agreement at issue was the product of breaches of fiduciary duty by the CapLease directors because the proposed merger transaction (the “CapLease Transaction”) purportedly does not provide for full and fair value for the CapLease shareholders, the CapLease Transaction allegedly was not the result of a competitive bidding process, the merger agreement allegedly contains coercive deal protection measures and the merger agreement and the CapLease Transaction purportedly were approved as a result of improper self-dealing by certain defendants who would receive certain alleged employment compensation benefits and continued employment pursuant to the merger agreement. The complaint also alleges that CapLease, the General Partner, the Operating Partnership and Safari Acquisition LLC aided and abetted the CapLease directors’ alleged breaches of fiduciary duty.
On July 3, 2013, Fred Carach filed a putative class action and derivative lawsuit in the Supreme Court for the State of New York against the General Partner, the Operating Partnership, Safari Acquisition LLC, CapLease,
F-173
Table of Contents
ARC PROPERTIES OPERATING PARTNERSHIP, L.P.
NOTES TO CONSOLIDATED FINANCIAL STATEMENTS
June 30, 2014
(Unaudited)
CapLease LP, CLF OP General Partner, LLC and the members of the CapLease board of directors (the “Carach Action”). The complaint alleges, among other things, that the merger agreement was the product of breaches of fiduciary duty by the CapLease directors because the merger purportedly does not provide for full and fair value for the CapLease shareholders, the CapLease Transaction allegedly was not the result of a competitive bidding process, the merger agreement allegedly contains coercive deal protection measures and the merger agreement and the CapLease Transaction purportedly were approved as a result of improper self-dealing by certain defendants who would receive certain alleged employment compensation benefits and continued employment pursuant to the merger agreement. The complaint also alleges that with respect to the Registration Statement and draft joint proxy statement issued in connection with the proposed CapLease Transaction on July 2, 2013, that disclosures made therein were insufficient or otherwise improper. The complaint also alleges that CapLease LP, CLF OP General Partner, LLC, the General Partner, the Operating Partnership and Safari Acquisition LLC aided and abetted the CapLease directors’ alleged breaches of fiduciary duty.
On June 25, 2013, Dewey Tarver filed a putative class action and derivative lawsuit in the Circuit Court for Baltimore City against the General Partner, the Operating Partnership, Safari Acquisition LLC, CapLease, CapLease LP, CLF OP General Partner, LLC and the members of the CapLease board of directors (the “Tarver Action”). The complaint alleges, among other things, that the merger agreement was the product of breaches of fiduciary duty by the CapLease directors because the CapLease Transaction purportedly does not provide for full and fair value for the CapLease shareholders, the CapLease Transaction allegedly was not the result of a competitive bidding process, the merger agreement allegedly contains coercive deal protection measures and the merger agreement and the CapLease Transaction purportedly were approved as a result of improper self-dealing by certain defendants who would receive certain alleged employment compensation benefits and continued employment pursuant to the merger agreement. The complaint also alleges that CapLease, CapLease LP, CLF OP General Partner, LLC, the General Partner, the Operating Partnership and Safari Acquisition, LLC aided and abetted the CapLease directors’ alleged breaches of fiduciary duty.
Counsel who filed each of these three cases reached an agreement with each other as to who will serve as lead plaintiff and lead plaintiffs’ counsel in the cases and where they will be prosecuted. Thus, on August 9, 2013, counsel in the Tarver Action filed a motion for stay in the Baltimore Court, informing the court that they had agreed to join and participate in the prosecution of the Mizani and Carach Actions in the New York Court. The Defendants consented to the stay of the Tarver Action in the Baltimore Court, and on September 5, 2013, Judge Pamela J. White issued an order granting that stay. Consequently, there has been no subsequent activity in the Baltimore Court in the Tarver Action. Also on August 9, 2013, all counsel involved in the Mizani and Carach Actions filed a joint stipulation in the New York Court, reflecting agreement among all parties that the Mizani and Carach Actions should be consolidated (jointly, “the Consolidated Actions”) and setting out a schedule for early motion practice in response to the complaints filed (the “Consolidation Stipulation”). Pursuant to the Consolidation Stipulation, an amended complaint was also filed in the New York court on August 9, 2013 and was designated as the operative complaint in the Consolidated Actions (“Operative Complaint”). Pursuant to the Consolidation Stipulation, all Defendants filed a motion to dismiss all claims asserted in the Operative Complaint on September 23, 2013. Plaintiffs’ response was due on or before November 7, 2013. On November 7, 2013, Plaintiffs filed a motion seeking leave to file a second amended complaint, which the Defendants have opposed. On March 24, 2014, Plaintiffs’ counsel in the Consolidated Actions dismissed those claims without prejudice. Consequently, only the Tarver Action currently remains pending among these cases, although it remains stayed.
On October 8, 2013, John Poling filed a putative class action lawsuit in the Circuit Court for Baltimore City against the General Partner, the Operating Partnership, Safari Acquisition LLC, CapLease, CapLease LP, CLF
F-174
Table of Contents
ARC PROPERTIES OPERATING PARTNERSHIP, L.P.
NOTES TO CONSOLIDATED FINANCIAL STATEMENTS
June 30, 2014
(Unaudited)
OP General Partner, LLC and the members of the CapLease board of directors (the “Poling Action”). The complaint alleges that the merger agreement breaches the terms of the CapLease’ 8.375% Series B Cumulative Redeemable Preferred Stock (“Series B”) and the terms of the 7.25% Series C Cumulative Redeemable Preferred Stock (“Series C”) and is in violation of the Series B Articles Supplementary and the Series C Articles Supplementary. The Complaint alleges claims for breach of contract and breach of fiduciary duty against the CapLease entities and the CapLease board of directors. The complaint also alleges that the General Partner, the Operating Partnership and Safari Acquisition, LLC aided and abetted CapLease and the CapLease directors’ alleged breach of contract and breach of fiduciary duty.
On November 13, 2013, all counsel involved in the Poling Action filed a joint stipulation, reflecting agreement among all parties concerning a schedule for early motion practice in response to the complaint filed (the “Scheduling Stipulation”). Pursuant to the Scheduling Stipulation, all Defendants filed a motion to dismiss all claims asserted in the Operative Complaint on December 20, 2013. Plaintiff has filed an opposition to that motion, which remains pending.
Cole Litigation Matters
Three putative class action and/or derivative lawsuits, which were filed in March and April 2013, assert claims for breach of fiduciary duty, abuse of control, corporate waste, unjust enrichment, aiding and abetting breach of fiduciary duty and other claims relating to the merger between a wholly owned subsidiary of Cole and Cole Holdings Corporation, pursuant to which Cole became a self-managed REIT. On October 22, 2013, the Circuit Court for Baltimore City granted all defendants’ motion to dismiss with prejudice the action pending before the court, but the plaintiffs have appealed that dismissal. The other two lawsuits, which also purport to assert shareholder class action claims under the Securities Act of 1933, as amended (the “Securities Act”), are pending in the United States District Court for the District of Arizona. Defendants filed a motion to dismiss both complaints on January 10, 2014. Subsequently, both of those lawsuits have been stayed by the Court pursuant to a joint request made by all parties pending final approval of the consolidated Baltimore Cole Merger Actions described below.
To date, eleven lawsuits have been filed in connection with the Cole Merger. Two of these suits—Wunsch v. Cole, et al (“Wunsch”), No. 13-CV-2186, and Sobon v. Cole, et al (“Sobon”)—were filed as putative class actions on October 25, 2013 and November 18, 2013, respectively, in the U.S. District Court for the District of Arizona. Between October 30, 2013 and November 14, 2013, eight other putative stockholder class action or derivative lawsuits were filed in the Circuit Court for Baltimore City, Maryland, captioned as: (i) Operman v. Cole, et al (“Operman”); (ii) Branham v. Cole, et al (“Branham”); (iii) Wilfong v. Cole, et al. (“Wilfong”); (iv) Polage v. Cole, et al. (“Polage”); (v) Corwin v. Cole, et al (“Corwin”); (vi) Green v. Cole, et al (“Green”); (vii) Flynn v. Cole, et al (“Flynn”) and (viii) Morgan v. Cole, et al. (“Morgan”). All of these lawsuits name ARCP, Cole and Cole’s board of directors as defendants; Wunsch, Sobon, Branham, Wilfong, Flynn, Green, Morgan and Polage also name CREInvestments, LLC, a Maryland limited liability company and a wholly-owned subsidiary of the Cole, as a defendant. All of the named plaintiffs claim to be Cole stockholders and purport to represent all holders of Cole’s stock. Each complaint generally alleges that the individual defendants breached fiduciary duties owed to plaintiff and the other public stockholders of Cole in connection with the Cole Merger, and that certain entity defendants aided and abetted those breaches. The breach of fiduciary duty claims asserted include claims that the Cole Merger does not provide for full and fair value for the Cole shareholders, that the Cole Merger was the product of an “inadequate sale process,” that the Cole Merger Agreement contains coercive deal protection measures and the Cole Merger Agreement and that the Cole Merger were approved as a result of or in a manner which facilitates improper self-dealing by certain defendants. In addition, the Flynn, Corwin, Green, Wilfong, Polage and Branham lawsuits
F-175
Table of Contents
ARC PROPERTIES OPERATING PARTNERSHIP, L.P.
NOTES TO CONSOLIDATED FINANCIAL STATEMENTS
June 30, 2014
(Unaudited)
claim that the individual defendants breached their duty of candor to shareholders and the Branham and Polage lawsuits assert claims derivatively against the individual defendants for their alleged breach of fiduciary duties owed to Cole. The Polage lawsuit also asserts derivative claims for waste of corporate assets and unjust enrichment. The Wunsch and Sobon lawsuits also assert claims against Cole and the individual defendants under Section 14(a) of the Securities Exchange Act of 1934, as amended (the “Exchange Act”), based on allegations that the proxy materials omitted to disclose allegedly material information, and a claim against the individual defendants under Section 20(a) of the Exchange Act based on the same allegations. Among other remedies, the complaints seek unspecified money damages, costs and attorneys’ fees.
In January 2014, the parties to the eight lawsuits filed in the Circuit Court for Baltimore City, Maryland (“the consolidated Baltimore Cole Merger Actions”) entered into a memorandum of understanding regarding settlement of all claims asserted on behalf of the alleged class of Cole stockholders. In connection with the settlement contemplated by that memorandum of understanding, the class action and all claims asserted therein will be dismissed, subject to court approval. The proposed settlement terms required Cole to make certain additional disclosures related to the Cole Merger, which were included in a Current Report on Form 8-K filed by Cole with the SEC on January 14, 2014. The memorandum of understanding also contemplated that the parties will enter into a stipulation of settlement, which will be subject to customary conditions, including confirmatory discovery and court approval following notice to Cole’s stockholders. If the parties enter into a stipulation of settlement, a hearing will be scheduled at which the court will consider the fairness, reasonableness and adequacy of the settlement. There can be no assurance that the parties will ultimately enter into a stipulation of settlement, that the court will approve any proposed settlement, or that any eventual settlement will be under the same terms as those contemplated by the memorandum of understanding, therefore any losses that may be incurred to settle this matter are not determinable.
The Sobon lawsuit was voluntarily dismissed on February 3, 2014. The General Partner believes that the Wunsch lawsuit in connection with the Cole Merger is without merit and that it has substantial meritorious defenses to the claims set forth in the complaint.
On December 27, 2013, Realistic Partners filed a putative class action lawsuit against the General Partner and the members of its board of directors in the Supreme Court for the State of New York. Cole was later added as a defendant also. The plaintiff alleges, among other things, that the board of the General Partner breached its fiduciary duties in connection with the transactions contemplated under the Cole Merger Agreement and that Cole aided and abetted those breaches. In January 2014, the parties entered into a memorandum of understanding regarding settlement of all claims asserted on behalf of the alleged class of the General Partner’s stockholders. In connection with the settlement contemplated by that memorandum of understanding, the class action and all claims asserted therein will be dismissed, subject to court approval. The proposed settlement terms required the General Partner to make certain additional disclosures related to the Cole Merger, which were included in a Current Report on Form 8-K filed by the General Partner with the SEC on January 17, 2014. The memorandum of understanding also contemplated that the parties will enter into a stipulation of settlement, which will be subject to customary conditions, including confirmatory discovery and court approval following notice to the General Partner’s stockholders. If the parties enter into a stipulation of settlement, a hearing will be scheduled at which the court will consider the fairness, reasonableness and adequacy of the settlement. There can be no assurance that the parties will ultimately enter into a stipulation of settlement, that the court will approve any proposed settlement, or that any eventual settlement will be under the same terms as those contemplated by the memorandum of understanding, therefore any losses that may be incurred to settle this matter are not determinable.
F-176
Table of Contents
ARC PROPERTIES OPERATING PARTNERSHIP, L.P.
NOTES TO CONSOLIDATED FINANCIAL STATEMENTS
June 30, 2014
(Unaudited)
The General Partner maintains directors and officers liability insurance, which the Operating Partnership believes should provide coverage to the Operating Partnership and its officers and directors for most or all of any costs, settlements or judgments resulting from the above mentioned lawsuits.
Contractual Lease Obligations
The following table reflects the minimum base rental cash payments due from the Operating Partnership over the next five years and thereafter for certain ground and office lease obligations (in thousands):
| Future Minimum Base Rent Payments |
||||
| July 1, 2014—December 31, 2014 |
$ | 6,845 | ||
| 2015 |
12,922 | |||
| 2016 |
11,575 | |||
| 2017 |
10,248 | |||
| 2018 |
7,918 | |||
| Thereafter |
83,734 | |||
|
|
|
|||
| Total |
$ | 133,242 | ||
|
|
|
|||
Purchase Commitments
The Operating Partnership enters into purchase and sale agreements and deposits funds into escrow towards the purchase of such acquisitions, some of which are expected to be assigned to one of the Managed REITs at or prior to the closing of the respective acquisition. As of June 30, 2014, the Operating Partnership was a party to 70 purchase and sale agreements with unaffiliated third-party sellers to purchase a 100% interest in 416 properties, subject to meeting certain criteria, for an aggregate purchase price of $1.5 billion, exclusive of closing costs. As of June 30, 2014, the Operating Partnership had $41.8 million of property escrow deposits held by escrow agents in connection with these future property acquisitions, which may be forfeited if the transactions are not completed under certain circumstances. The Operating Partnership will be reimbursed by the assigned Managed REIT for amounts escrowed when it acquires a property.
Environmental Matters
In connection with the ownership and operation of real estate, the Operating Partnership may potentially be liable for costs and damages related to environmental matters. The Operating Partnership has not been notified by any governmental authority of any non-compliance, liability or other claim, and is not aware of any other environmental condition, in each case, that it believes will have a material adverse effect on the results of operations.
Note 17—Preferred and Common OP Units
Series D and Series E Preferred Units
On September 16, 2013, the General Partner’s board of directors unanimously approved the issuance of Series D Cumulative Convertible Preferred Stock (“Series D Preferred Stock”) and the issuance of Series E Cumulative Preferred Stock (“Series E Preferred Stock”). Concurrently, the Operating Partnership was approved to issue to the General Partner Series D Cumulative Convertible Preferred Units (“Series D Preferred Units”) and Series E Cumulative Preferred Units (“Series E Preferred Units”), if applicable.
F-177
Table of Contents
ARC PROPERTIES OPERATING PARTNERSHIP, L.P.
NOTES TO CONSOLIDATED FINANCIAL STATEMENTS
June 30, 2014
(Unaudited)
On September 15, 2013, the General Partner entered into definitive purchase agreements to issue Series D Preferred Stock and common stock, necessitating that the Operating Partnership concurrently issue to the General Partner Series D Preferred Units and General Partner OP Units, promptly following the close of the CapLease Merger. Pursuant to the definitive purchase agreements, the General Partner issued approximately 21.7 million shares of Series D Preferred Stock and 15.1 million shares of ARCP common stock, for gross proceeds of $288.0 million and $186.0 million, respectively, on November 8, 2013. The Operating Partnership concurrently issued 21.7 million shares of Series D Preferred Units and 15.1 million General Partner OP Units to the General Partner. The Series D Preferred Stock and Series D Preferred Units pays dividends at the rate of 5.81% per annum on its face amount of $13.59 per share (equivalent to $0.79 per share on an annualized basis). The Series D Preferred Stock is redeemable on August 31, 2014 (the “Redemption Date”). If redeemed, corresponding Series D Preferred Units will be redeemed. Subsequent to that date, or in certain other circumstances, the Series D Preferred Stock are convertible into ARCP common stock or Series E Preferred Stock or redeemable into cash, at the discretion of the General Partner upon such request for conversion by the holders of Series D Preferred Stock.
In the event of a liquidation, the Series D Preferred Stock holder is entitled to receive the greater of (a) $13.59 per share plus accrued and unpaid dividends (the “Liquidation Preference”) plus a 20% premium and (b) an amount the Series D Preferred Stock holder would have received had they converted into ARCP common stock immediately prior to the liquidation event.
If the General Partner elects to redeem on the Redemption Date, the General Partner shall pay the greater of (a) the product of the number of Series D Preferred Stock and the 102% of the Liquidation Preference and (b) the product of the number of ARCP common stock that would be issued if the Series D Preferred Stock converted immediately prior to the Redemption Date and 102% of the one-day VWAP.
At any time after the Redemption Date, the holder of Series D Preferred Stock may convert some or all of their outstanding Series D Preferred Stock into ARCP common stock. Upon such an election to convert, the General Partner may elect the following settlement options (1) convert the Series D Preferred Stock into the number of fully paid and non-assessable ARCP common stock obtained by dividing the aggregate Liquidation Preference of such Series D Preferred Stock by the Conversion Price, as defined below, (2) convert the Series D Preferred Stock into an equal number of Series E Preferred Stock, additional units of Series E Preferred Stock may be issued under certain circumstances or (3) an amount equal to the product of the number of shares of Series D Preferred Stock and the Cash Conversion Price, as defined below.
The Conversion Price shall be the lowest of (i) a 2% discount to the VWAP of ARCP’s common stock for the 10 Trading Days prior to the Conversion Election Date, (ii) a 2% discount to the closing price on the Conversion Election Date and (iii) $13.59. The Cash Conversion Price shall be the greater of (i) 102% of the Liquidation Preference and (ii) the one day VWAP of the ARCP’s common stock on the date of the election.
The General Partner has concluded that the conversion option qualifies as a derivative and should be bifurcated from the host instrument. At issuance, the conversion option had a fair value of $18.7 million. As of June 30, 2014, the fair value of the conversion option had a fair value of $11.5 million, compared to a fair value of $16.7 million as of December 31, 2013. The Operating Partnership recorded a gain of $5.2 million due to the change in fair value of the conversion option in gain (loss) on derivative instruments, net in the consolidated statements of operations for the six months ended June 30, 2014.
As the holder of Series D Preferred Stock is entitled to receive liquidation preferences that other equity holders are not entitled to, the General Partner determined the Series D Preferred Stock meets the definition of a
F-178
Table of Contents
ARC PROPERTIES OPERATING PARTNERSHIP, L.P.
NOTES TO CONSOLIDATED FINANCIAL STATEMENTS
June 30, 2014
(Unaudited)
deemed liquidation event and therefore should be classified as temporary equity under U.S. GAAP. At the date of issuance, the fair value of the Series D Preferred Stock was $269.3 million. As of June 30, 2014, the General Partner has determined that a liquidation event is not probable; therefore, the General Partner has concluded that the Series D Preferred Stock is not currently redeemable or likely to become redeemable pursuant to a liquidation event. As such, the Operating Partnership has not accreted the initial value of the Series D Preferred Units.
As of June 30, 2014, there were 21,735,008 authorized and issued Series D Preferred Units and no authorized and issued Series E Preferred Units, respectively. The Series D Preferred Stock was redeemed by the General Partner in accordance with its terms for a redemption price of $315.8 million on September 2, 2014. Simultaneously, the General Partner redeemed the Series D Preferred Units.
Series F Preferred Stock
On October 6, 2013, in connection with the modification to the ARCT IV Merger, the General Partner’s board of directors unanimously approved the issuance of Series F Preferred Stock. Upon consummation of the ARCT IV Merger on January 3, 2014, 42.2 million shares of Series F Preferred Stock were issued to ARCT IV shareholders, resulting in the Operating Partnership concurrently issuing 42.2 million General Partner Series F Preferred Units to the General Partner, and the Operating Partnership issued 0.7 million Limited Partner Series F Preferred Units to the ARCT IV OP Unit holders. Subsequent to original issuance and through June 30, 2014, 0.5 million Limited Partner Series F Preferred Units were converted to an equivalent number of the General Partner’s Series F Preferred Stock. Concurrently, 0.5 million General Partner Series F Preferred Units were issued to the General Partner. As of June 30, 2014, there were 42.7 million shares of General Partner Series F Preferred Units and 0.2 million Limited Partner Series F Preferred Units issued and outstanding.
The Series F Preferred Units contain the same terms as the Series F Preferred Stock. Therefore, the Series F Preferred Units will pay cumulative cash dividends at the rate of 6.70% per annum on its liquidation preference of $25.00 per unit (equivalent to $1.675 per unit on an annual basis). The Series F Preferred Units will not be redeemable by the Operating Partnership before the fifth anniversary of the date on which such Series F Preferred Units were issued (the “Initial Redemption Date”), except under circumstances intended to preserve the General Partner’s status as a real estate investment trust for federal and/or state income tax purposes and except upon the occurrence of a change of control. On and after the Initial Redemption Date, the Operating Partnership may, at its option, redeem units of the Series F Preferred Units, in whole or from time to time in part, at a redemption price of $25.00 per unit plus, subject to exceptions, any accrued and unpaid dividends thereon to the date fixed for redemption. The Series F Preferred Units have no stated maturity, are not subject to any sinking fund or mandatory redemption and will remain outstanding indefinitely unless the Operating Partnership redeems or otherwise repurchases them or they become convertible and are converted into General Partner OP Units (or, if applicable, alternative consideration).
Offerings
On August 1, 2012, the General Partner filed a $500 million universal shelf registration statement and a resale registration statement with the SEC. Both registration statements became effective on August 17, 2012. As of June 30, 2014, the General Partner had issued a total of approximately 2.1 million shares of ARCP common stock under the universal shelf registration statement. Concurrently, the Operating Partnership issued 2.1 million General Partner OP Units to the General Partner. The resale registration statement, as amended, registers the resale of up to 1,882,248 shares of ARCP’s common stock issued in connection with any future conversion of certain currently outstanding restricted shares, convertible preferred units or Limited Partner OP Units.
F-179
Table of Contents
ARC PROPERTIES OPERATING PARTNERSHIP, L.P.
NOTES TO CONSOLIDATED FINANCIAL STATEMENTS
June 30, 2014
(Unaudited)
In January 2013, the General Partner commenced its “at the market” equity offering program (“ATM”) in which it may from time to time offer and sell shares of its common stock having aggregate offering proceeds of up to $60.0 million. The shares will be issued pursuant to the General Partner’s universal shelf registration statement. For each share of common stock the General Partner Sells under the ATM, the Operating Partnership will issue a corresponding number of General Partner OP Units to the General Partner.
On March 13, 2013, the General Partner filed a universal automatic shelf registration statement that was automatically declared effective and achieved well-known seasoned issuer (“WKSI”) status. The General Partner intends to maintain both the universal shelf registration statement and the WKSI universal automatic shelf registration statement.
On May 28, 2014, the General Partner closed on an underwriting agreement relating to a public offering of 138.0 million shares of ARCP common stock, par value $0.01 per share. The offering price to public was $12.00 per share. The net proceeds to ARCP were approximately $1.59 billion after deducting underwriting discounts and commissions, but excluding expenses which included a $2.0 million structuring fee paid to RCS. Concurrently, the Operating Partnership issued the General Partner 138.0 million General Partner OP Units.
Dividends
In October 2011, in connection with the same action by ARCP, the Operating Partnership began paying dividends on the fifteenth day of each month to unitholders of record on the eighth day of such month. On October 23, 2013, the board of directors of the ARCP authorized an annualized dividend per share of $1.00, effective February 10, 2014. The per unit annualized dividend of $1.00 reflects an increase of $0.06 per share from an annualized dividend of $0.94 per unit. The annualized dividend rate at June 30, 2014 was $1.00 per unit.
Common Stock Repurchases
Upon the closing of the ARCT III Merger, on February 28, 2013, 29.2 million shares, or 16.5% of the then-outstanding shares of ARCT III’s common stock, were paid in cash at $12.00 per share, which is equivalent to 27.7 million General Partner OP Units based on the ARCT III Exchange Ratio. In addition, 148.1 million shares of ARCT III’s common stock were converted into ARCP common stock at the ARCT III Exchange Ratio, resulting in an additional 140.7 million General Partner OP Units outstanding after the exchange.
Note 18—Equity Based Compensation
Equity Plan
The General Partner has adopted the American Realty Capital Properties, Inc. Equity Plan (the “Equity Plan”), which provides for the grant of stock options, stock appreciation rights, restricted shares of common stock, restricted stock units, dividend equivalent rights and other stock-based awards to the General Partner’s and its affiliates’ non-executive directors, officers and other employees and advisors or consultants who are providing services to the General Partner or its affiliates. For each share awarded under the Equity Plan, the Operating Partnership issues a General Partner OP Unit to the General Partner with similar terms.
The General Partner authorized and reserved a total number of shares equal to 10.0% of the total number of issued and outstanding shares of common stock (on a fully diluted basis assuming the redemption of all Limited Partner OP Units for shares of common stock) to be issued at any time under the Equity Plan for equity incentive
F-180
Table of Contents
ARC PROPERTIES OPERATING PARTNERSHIP, L.P.
NOTES TO CONSOLIDATED FINANCIAL STATEMENTS
June 30, 2014
(Unaudited)
awards excluding an initial grant of 167,400 shares to its Former Manager in connection with the IPO, all of which were vested as of June 30, 2014. As of June 30, 2014, the Operating Partnership has issued 6,715,197 General Partner OP Units to the General Partner in connection with the Equity Plan.
Director Stock Plan
The General Partner has adopted the American Realty Capital Properties, Inc. Non-Executive Director Stock Plan (the “Director Stock Plan”), which provides for the grant of restricted shares of common stock to each of the General Partner’s independent directors, each of whom is a non-executive director. For each share awarded under the Director Stock Plan, the Operating Partnership issues a General Partner OP Unit to the General Partner with identical terms. Awards of restricted stock will vest ratably over a three-year period following the date of grant in increments of 34%, 33% and 33%, respectively, per annum, subject to the director’s continued service on the board of directors, and shall provide for “distribution equivalents” with respect to this restricted stock, whether or not vested, at the same time and in the same amounts as distributions are paid to the stockholders. At June 30, 2014, a total of 99,000 shares of ARCP common stock are reserved for issuance under the Director Stock Plan. As of June 30, 2014, the Operating Partnership has issued 60,854 General Partner OP Units to the General Partner in connection with the Director Stock Plan.
The fair value of restricted common stock awards, as well as the underlying General Partner OP Units, issued under the Equity Plan and Director Stock Plan is determined on the grant date using the closing stock price on NASDAQ that day. The fair value of restricted common stock awarded to the non-employees under the Equity Plan, as well as the underlying General Partner OP Units issued in respect thereof, are remeasured at the end of each quarter based on the current quarter end closing stock price through the final vesting date.
ARCT IV Restricted Share Plan
ARCT IV had an employee and director incentive restricted share plan (the “ARCT IV RSP”) which provided for the automatic grant of 1,333 restricted shares of common stock to each of its independent directors without any further action by ARCT IV’s board of directors or its stockholders on the date of initial election to the board of directors and on the date of each annual stockholder’s meeting thereafter. Restricted stock issued to independent directors vested over a five-year period following the date of grant in increments of 20% per annum. The ARCT IV RSP provided ARCT IV with the ability to grant awards of restricted shares to its directors, officers and employees (if ARCT IV ever had employees), employees of the ARCT IV Advisor and its affiliates, employees of entities that provided services to ARCT IV, directors of the ARCT IV Advisor or of entities that provided services to ARCT IV, certain consultants to ARCT IV and the ARCT IV Advisor and its affiliates or to entities that provided services to ARCT IV.
Immediately prior to the effective time of the ARCT IV Merger, each then-outstanding share of ARCT IV restricted stock fully vested. All shares of ARCT IV common stock then-outstanding as a result of the full vesting of shares of ARCT IV restricted stock, and the satisfaction of any applicable withholding taxes, received shares of ARCP’s common stock based on the ARCT IV Exchange Ratio. Concurrently, for each share of ARCP common stock issued, the Operating Partnership issued a General Partner OP Unit to the General Partner.
Multi-Year Performance Plan
Upon consummation of the ARCT III Merger, the Operating Partnership entered into the 2013 Advisor Multi-Year Outperformance Agreement (the “OPP”) with its Former Manager, whereby its Former Manager was able to potentially earn compensation upon the attainment of stockholder value creation targets.
F-181
Table of Contents
ARC PROPERTIES OPERATING PARTNERSHIP, L.P.
NOTES TO CONSOLIDATED FINANCIAL STATEMENTS
June 30, 2014
(Unaudited)
Under the OPP, the Former Manager was granted 8,241,101 long-term incentive plan units (“LTIP Units”) of the Operating Partnership, which were to be earned or forfeited based on the General Partner’s total return to stockholders (including both share price appreciation and common stock distributions) (“Total Return”), for the three-year period that commenced on December 11, 2012.
Pursuant to previous authorization of the General Partner’s board of directors, as a result of the termination of the Management Agreement, all 8,241,101 LTIP Units became fully earned, vested and convertible into Limited Partner units upon the consummation of ARCP’s transition to self-management on January 8, 2014. During the six months ended June 30, 2014, the Operating Partnership recorded expenses of $1.6 million for the LTIP Units under the OPP, which is recorded in merger and other transaction related expenses in the accompanying consolidated statements of operations.
New Multi-Year Outperformance Plan
On October 21, 2013, the General Partner approved a multi-year outperformance plan (the “New OPP”) which became effective upon the General Partner’s transition to self-management, which occurred on January 8, 2014. Under the New OPP, individual agreements were entered into between the General Partner and the participants selected by the General Partner’s board of directors (the “Participants”) that set forth the Participant’s participation percentage in the New OPP and the number of LTIP Units subject to the award (“OPP Agreements”). Under the New OPP and OPP Agreements, the Participants are eligible to earn performance-based bonus awards equal to the Participant’s participation percentage of a pool that is funded up to a maximum award opportunity (the “New OPP Cap”) of $218.1 million, which is equal to approximately 5% of the General Partner’s equity market capitalization at the time of the approval of the New OPP (“the Initial Market Cap”). Subject to the New OPP Cap, the pool will equal an amount to be determined based on the General Partner’s level of achievement of total return to stockholders, including both share price appreciation and common stock distributions (“Total Return”), as measured against an absolute hurdle and against a peer group of companies for a three-year performance period that commenced on October 1, 2013 (the “Performance Period”); with valuation dates on which a portion of the LTIP Units up to a specified amount of the New OPP Cap could be earned on the last day of each 12-month period during the Performance Period (each an “Annual Period”) and the initial 24-month period of the Performance Period (the “Interim Period”), as follows:
| Performance Period |
Annual Period |
Interim Period | ||||
| Absolute Component: 4% of any excess Total Return attained above an absolute hurdle measured from the beginning of such period: |
21% | 7% | 14% | |||
| Relative Component: 4% of any excess Total Return attained above the median Total Return for the performance period of the Peer Group(1), subject to a ratable sliding scale factor as follows based on achievement of cumulative Total Return measured from the beginning of such period: |
||||||
| • 100% will be earned if cumulative Total Return achieved is at least: |
18% | 6% | 12% | |||
| • 50% will be earned if a cumulative Total Return achieved is: |
0% | 0% | 0% | |||
| • 0% will be earned if cumulative Total Return achieved is less than: |
0% | 0% | 0% | |||
| • a percentage from 50% to 100% calculated by linear interpolation will be earned if cumulative Total Return achieved is if between: |
0% - 18% | 0% - 6% | 0% - 12% | |||
F-182
Table of Contents
ARC PROPERTIES OPERATING PARTNERSHIP, L.P.
NOTES TO CONSOLIDATED FINANCIAL STATEMENTS
June 30, 2014
(Unaudited)
| (1) | The “Peer Group” is comprised of the following companies: EPR Properties; Getty Realty Corporation; Lexington Realty Trust; National Retail Properties, Inc.; Realty Income Corporation; and Spirit Realty Capital, Inc. |
The New OPP provides for early calculation and vesting of the award in the event of a change in control of the General Partner, prior to the end of the Performance Period. Under the New OPP, treatment of a Participant’s award upon a termination of service will be governed by the terms of the Participant’s OPP Agreement or service agreement. In the event a Participant’s OPP Agreement or service agreement does not provide for treatment of the award upon the Participant’s termination, then the award will be forfeited upon such termination. The Participants are entitled to receive a tax gross-up in the event that any amounts paid to the Participant under the New OPP constitute “parachute payments” as defined in Section 280G of the Code. The LTIP Units granted under the New OPP represent units of equity ownership in the Operating Partnership that are structured as a profits interest therein. Subject to the Participant’s continued service through each vesting date, one-third of any earned LTIP Units will vest on October 1, 2016, October 1, 2017 and October 1, 2018, respectively. The Participants are entitled to receive distributions on their LTIP Units to the extent provided for in the limited partnership agreement of the Operating Partnership, as amended from time to time. During the three months ended March 31, 2014, the Operating Partnership recorded expenses of $4.4 million for the New OPP, which is recorded in equity based compensation on the consolidated statements of operations. During the three and six months ended June 30, 2014, the Operating Partnership recorded expenses of $4.9 million and $9.4 million, respectively, for the New OPP, which is recorded in equity based compensation on the consolidated statements of operations.
Note 19—Related Party Transactions and Arrangements
REI Segment
In addition to the General Partner Convertible Notes discussed in Note 12—Other Debt, the following related party transactions and arrangements occurred during the periods presented:
Transition to Self-Management
In its transition toward self-management, the General Partner discontinued certain relationships with affiliates and entities under common ownership with the Former Manager, an entity wholly owned by ARC, of which certain current officers and/or directors of the General Partner, are members.
Termination of Management Agreement
In connection with its transition to self-management, on January 8, 2014, the General Partner terminated the amended and restated management agreement with the Former Manager, pursuant to which the Former Manager managed the General Partner’s and Operating Partnership’s day-to-day operations until such date.
Assumption of RCS Advisory Services, LLC Services Agreement
Pursuant to an Assignment and Assumption Agreement, dated January 8, 2014, between ARC, the parent of the Former Manager, and RCS Advisory Services, LLC, an entity under common ownership with the Former Manager, ARC assigned to the General Partner, and the General Partner assumed, the rights and obligation under a Services Agreement (the “Services Agreement”), dated as of June 10, 2013, between ARC and RCS Advisory Services, LLC. Under the Services Agreement, RCS Advisory Services, LLC and its affiliates may provide
F-183
Table of Contents
ARC PROPERTIES OPERATING PARTNERSHIP, L.P.
NOTES TO CONSOLIDATED FINANCIAL STATEMENTS
June 30, 2014
(Unaudited)
certain transaction management services to the General Partner (including, without limitation, offering registration, regulatory advice with respect to the SEC and FINRA registration maintenance, transaction management, marketing support, due diligence advice and related meetings, events training and education and conference management) and other services, employees and other resources. These services are charged hourly. The Operating Partnership incurred $0.1 million with respect of the Services Agreement during the six months ended June 30, 2014. No fees were incurred under this agreement during the three months ended June 30, 2014. These expenses are included in merger and other transaction related costs in the consolidated statements of operations.
Transition Services Agreement
Pursuant to a Transition Services Agreement dated October 21, 2013 (the “Transition Services Agreement”), affiliates of the Former Manager agreed to provide certain transition services to the General Partner, including accounting support, acquisition support, investor relations support, public relations support, human resources and administration, general human resources duties, payroll services, benefits services, insurance and risk management, information technology, telecommunications and Internet and services relating to office supplies. The Transition Services Agreement was in effect for a 60-day term beginning on January 8, 2014. Fees under the Transition Services Agreement were charged at an hourly rate and, during the 60-day tail period, the Operating Partnership incurred and paid $10.0 million of fees under the Transition Services Agreement. These fees were incurred during the six months ended June 30, 2014 and are included in merger and other transaction related costs in the consolidated statements of operations. No fees were incurred under this agreement during the three months ended June 30, 2014.
Purchase of Furniture, Fixtures and Equipment
On January 8, 2014, the Operating Partnership entered into the Asset Purchase and Sale Agreement with the Former Manager (the “Purchase Agreement”), pursuant to which the Former Manager transferred to the Operating Partnership furniture, fixtures and equipment used by the Former Manager in connection with the business of the General Partner, as well as reimbursed the Former Manager for certain unreimbursed expenses. During the six months ended June 30, 2014, pursuant to the Purchase Agreement, the Operating Partnership paid the Former Manager $10.0 million for the furniture, fixtures and equipment and for certain unreimbursed expenses. The Operating Partnership paid the full amount under the Purchase Agreement, which substantially related to employee-related expenses, during the six months ended June 30, 2014. These fees were included in merger and other transaction related costs in the consolidated statements of operations.
Fees Paid in Connection with the ARCT IV Merger
The General Partner entered into an agreement with an entity under common ownership with the Former Manager, Realty Capital Securities, LLC (“RCS”), to provide strategic and financial advisory services to the General Partner in connection with the ARCT IV Merger. The General Partner agreed to pay a fee equal to 0.25% of the transaction value upon the consummation of the transaction and reimburse out of pocket expenses. The Operating Partnership accrued $7.7 million of fees and $0.6 million of expense reimbursements pursuant to this agreement as of December 31, 2013 and paid the outstanding balance in January of 2014. No fees were incurred under this agreement during the six months ended June 30, 2014 or 2013.
The General Partner entered into an agreement with entities under common ownership with the Former Manager, RCS, RCS Advisory Services, LLC, and American National Stock Transfer, LLC (“ANST”), to provide financial advisory and information agent services in connection with the ARCT IV Merger and the
F-184
Table of Contents
ARC PROPERTIES OPERATING PARTNERSHIP, L.P.
NOTES TO CONSOLIDATED FINANCIAL STATEMENTS
June 30, 2014
(Unaudited)
related proxy solicitation seeking approval of the merger by the General Partner’s stockholders. Services provided include facilitation of the preparation, distribution and accumulation and tabulation of proxy materials, stockholder, analyst and financial advisor communications and consultation on materials and communications made to the public and regulatory agencies regarding the ARCT IV Merger. The General Partner agreed to pay $0.6 million in fees and reimburse out of pocket expenses pursuant to this agreement. This fee was accrued as of December 31, 2013 and paid in January 2014 by the Operating Partnership. No fees were incurred pursuant to this agreement during the six months ended June 30, 2014 or 2013.
During the six months ended June 30, 2014, the Operating Partnership reimbursed out of pocket expenses of $0.6 million to ARC Advisory Services, LLC, an affiliate of the Former Manager, in connection with services provided for the ARCT IV Merger. There were no reimbursements incurred during the three months ended June 30, 2014 or during the six months ended June 30, 2013.
ARCT IV entered into an agreement with an entity under common ownership with the Former Manager, RCS, to provide strategic and financial advisory services to assist ARCT IV with its alternatives for a potential liquidity event. ARCT IV agreed to pay a fee equal to 0.25% of the transaction value upon the consummation of the transaction, but not less than $2.5 million, and reimburse out of pocket expenses. ARCT IV accrued $7.7 million of fees and $0.6 million of expense reimbursements pursuant to this agreement as of December 31, 2013 and paid the outstanding balance in January 2014. No fees were incurred pursuant to this agreement during the six months ended June 30, 2014 or 2013.
The General Partner and ARCT IV entered into agreements with entities under common ownership with the Former Manager, ARC Advisory Services, LLC and RCS Advisory Services, LLC, to provide legal support services, up to the date that ARCT IV entered into the ARCT IV Merger Agreement. In total, the General Partner and ARCT IV agreed to pay $0.5 million pursuant to this agreement. This amount was fully accrued as of December 31, 2013 and paid in January of 2014 by the Operating Partnership. No fees were incurred pursuant to this agreement during the six months ended June 30, 2014 or 2013.
ARCT IV entered into an agreement with entities under common ownership with the Former Manager, RCS, RCS Advisory Services, LLC, and ANST, to provide advisory and information agent services in connection with the ARCT IV Merger and the related proxy solicitation seeking approval of such merger by ARCT IV’s stockholders. Services provided include facilitation of the preparation, distribution and accumulation and tabulation of proxy materials, stockholder, analyst and financial advisor communications and consultation on materials and communications made to the public and regulatory agencies regarding the ARCT IV Merger. ARCT IV agreed to pay $0.8 million in fees and reimburse out of pocket expenses pursuant to this agreement. As of December 31, 2013, $0.8 million of fees and $0.2 million of expense reimbursements were accrued pursuant to this agreement and were paid in January of 2014 by the Operating Partnership. No fees were incurred pursuant to this agreement during the six months ended June 30, 2014 or 2013.
ARCT IV entered into an agreement with entities under common ownership with the Former Manager, ARC Advisory Services, LLC and RCS Advisory Services, LLC, to provide support services including legal, accounting, marketing, human resources and information technology, among other services, until the earlier of the potential merger closing date or one year from the effective date of the agreement of July 1, 2013. ARCT IV agreed to pay $2.0 million in fees and reimburse out of pocket expenses pursuant to this agreement. As of December 31, 2013, $2.0 million of fees and $0.4 million of expense reimbursements were accrued pursuant to this agreement and were paid in January of 2014 by the Operating Partnership. No fees were incurred pursuant to this agreement during the six months ended June 30, 2014 or 2013.
F-185
Table of Contents
ARC PROPERTIES OPERATING PARTNERSHIP, L.P.
NOTES TO CONSOLIDATED FINANCIAL STATEMENTS
June 30, 2014
(Unaudited)
ARCT IV entered into the Asset Purchase and Sale Agreement with the ARCT IV Advisor, pursuant to which the ARCT IV Advisor transferred to the Operating Partnership furniture, fixtures and equipment used by the ARCT IV Advisor and ARCT IV reimbursed the ARCT IV Advisor for certain unreimbursed expenses. In connection with the agreement, during the six months ended June 30, 2014, the Operating Partnership paid $2.1 million for furniture, fixtures and equipment and other capitalized costs, $1.7 million for offering costs, which were recorded as a reduction to partners’ equity on the consolidated balance sheet and $2.0 million for certain unreimbursed expenses, which were recorded in merger and other transaction related costs on the consolidated statements of operations. No costs were incurred pursuant to this agreement during the three months ended June 30, 2014 or during the six months ended June 30, 2013.
Pursuant to ARCT IV’s advisory agreement with the ARCT IV Advisor, ARCT IV agreed to pay the ARCT IV Advisor a brokerage commission on the sale of property in connection with the ARCT IV Merger. At the time of the ARCT IV Merger, ARCT IV paid $8.4 million to the ARCT IV Advisor in connection with this agreement. These commissions were incurred during the six months ended June 30, 2014 and are included in merger and other transaction related costs in the consolidated statements of operations. No fees were incurred pursuant to this agreement during the three months ended June 30, 2014 or during the six months ended June 30, 2013.
Fees Paid in Connection with the Cole Merger
The General Partner entered into an agreement with an entity under common ownership with the Former Manager, RCS, to provide strategic and financial advisory services to the General Partner in connection with the Cole Merger. The General Partner agreed to pay a fee equal to 0.25% of the transaction value upon the consummation of the transaction and reimburse out of pocket expenses. During the six months ended June 30, 2014, the Operating Partnership incurred and paid $28.4 million of fees pursuant to this agreement. These fees were included in merger and other transaction related costs in the consolidated statements of operations. No fees were incurred pursuant to this agreement during the six months ended June 30, 2013.
The General Partner entered into an agreement with entities under common ownership with the Former Manager, RCS, RCS Advisory Services, LLC and ANST, to provide advisory and information agent services in connection with the proposed merger and the related proxy solicitation seeking approval of such merger by the General Partner’s stockholders. The General Partner agreed to pay $0.8 million in fees and reimburse out of pocket expenses pursuant to this agreement. During the six months ended June 30, 2014, the Operating Partnership incurred and paid $0.8 million of fees and $0.4 million of expense reimbursements pursuant to this agreement. These fees are included in merger and other transaction related costs in the consolidated statements of operations. No fees were incurred pursuant to this agreement during the six months ended June 30, 2013.
The General Partner entered into an agreement with an entity under common ownership with the Former Manager, RCS Advisory Services, LLC, to provide support services, including legal, accounting, marketing, human resources and information technology. The General Partner agreed to pay $2.9 million in fees and reimburse out of pocket expenses pursuant to this agreement. During the six months ended June 30, 2014, the Operating Partnership incurred and paid $2.9 million of fees and $1.3 million of expense reimbursements pursuant to this agreement. These fees are included in merger and other transaction related costs in the consolidated statements of operations. No fees were incurred pursuant to this agreement during the six months ended June 30, 2013.
Also in connection with the Cole Merger, during the six months ended June 30, 2014, the Operating Partnership reimbursed an entity under common ownership with the Former Manager, ARC Advisory Services,
F-186
Table of Contents
ARC PROPERTIES OPERATING PARTNERSHIP, L.P.
NOTES TO CONSOLIDATED FINANCIAL STATEMENTS
June 30, 2014
(Unaudited)
LLC, $0.7 million for services and out of pocket expenses incurred in relation to the Cole Merger. These fees are included in merger and other transaction related costs in the consolidated statements of operations. There were no reimbursements paid during the six months ended June 30, 2013.
Fees Paid in Connection with the ARCT III Merger
ARCT III entered into an agreement with an entity under common ownership with the Former Manager, ARC Advisory Services, LLC, to provide legal support services up to the date that ARCT III entered into the ARCT III Merger Agreement and until the ARCT III Merger was consummated for $0.5 million. This amount was fully accrued as of December 31, 2012 and was paid in February 2013 in conjunction with the consummation of the ARCT III Merger.
ARCT III entered into an agreement with an entity under common ownership with the Former Manager, ARC Advisory Services, LLC, to provide support services including legal, accounting, marketing, human resources and information technology, among other services, until the earlier of the ARCT III Merger closing date or one year from the date of the agreement for $2.0 million. The Operating Partnership recorded $1.7 million in expense for the six months ended June 30, 2013, in addition to the $0.3 million that was accrued as of December 31, 2012, and paid the full amount in conjunction with the consummation of the ARCT III Merger in February 2013.
ARCT III entered into an agreement with entities under common ownership with the Former Manager, RCS and ARC Advisory Services, LLC, to provide financial advisory and information agent services related to the proxy solicitation seeking approval of the ARCT III Merger by ARCT III’s stockholders for $0.6 million. Services provided included facilitation of the preparation, distribution and accumulation and tabulation of proxy materials, stockholder, analyst and financial advisor communications and consultation on materials and communications made to the public and regulatory agencies regarding the ARCT III Merger. The Operating Partnership recorded $0.5 million in expense for the six months ended June 30, 2013 in addition to the $0.1 million that was accrued as of December 31, 2012 and paid the full amount in conjunction with the consummation of the ARCT III Merger in February of 2013.
The Operating Partnership entered into an Asset Purchase and Sale Agreement with American Realty Capital Advisors III, LLC (the “ARCT III Advisor”) pursuant to which, concurrently with the closing of the ARCT III Merger and in connection with the internalization by the Operating Partnership of certain property level management and accounting activities, the ARCT III Advisor sold to the Operating Partnership certain furniture, fixtures, equipment and other assets used by the ARCT III Advisor in connection with managing the property level business and operations and accounting functions of the General Partner and the Operating Partnership, included at the cost of such assets, for an aggregate price of $5.8 million, which included the reimbursement of certain costs and expenses incurred by the ARCT III Advisor in connection with the ARCT III Merger. The Operating Partnership paid the full amount due under the agreement during the three months ended March 31, 2013. In relation to the agreement, the Operating Partnership acquired fixed assets with a carryover basis of $1.0 million from the the ARCT III Advisor; the consideration paid to the ARCT III Advisor in excess of the carryover basis was approximately $3.0 million.
On February 28, 2013, the Operating Partnership entered into a Contribution and Exchange Agreement (the “ARCT III Contribution and Exchange Agreement”) with the ARCT III OP and ARCT III Special Limited Partner, the holder of the special limited partner interest in the ARCT III OP. The ARCT III Special Limited Partner was entitled to receive certain distributions from the ARCT III OP, including the subordinated
F-187
Table of Contents
ARC PROPERTIES OPERATING PARTNERSHIP, L.P.
NOTES TO CONSOLIDATED FINANCIAL STATEMENTS
June 30, 2014
(Unaudited)
distribution of net sales proceeds resulting from an “investment liquidity event” (as defined in the agreement of limited partnership of the ARCT III OP). The ARCT III Merger constituted an “investment liquidity event,” as a result of which the ARCT III Special Limited Partner, in connection with management’s successful attainment of the 6.0% performance hurdle and the return to ARCT III’s stockholders of approximately $557.3 million in addition to their initial investment, was entitled to receive a subordinated distribution of net sales proceeds from the ARCT III OP equal to approximately $98.4 million. Pursuant to the ARCT III Contribution and Exchange Agreement, the ARCT III Special Limited Partner contributed its interest in the ARCT III OP, inclusive of the subordinated distribution proceeds received, to the ARCT III OP in exchange for 7.6 million ARCT III OP Units. Upon consummation of the ARCT III Merger on February 28, 2013, these ARCT III OP Units were immediately converted to 7.3 million OP Units after application of the ARCT III Exchange Ratio. In conjunction with the ARCT III Merger Agreement, the ARCT III Special Limited Partner agreed to a minimum one-year holding period for these OP Units before converting them to shares of General Partner common stock.
Fees Paid in Connection with the Disposition of the Multi-Tenant Portfolio
The General Partner entered into an agreement with an entity under common ownership with the Former Manager, RCS, to provide strategic and financial advisory services to the General Partner in connection with the disposition of the Multi-Tenant Portfolio. During the six months ended June 30, 2014, the Operating Partnership incurred and paid $1.8 million of fees pursuant to this agreement. No fees were incurred under this agreement during the three months ended June 30, 2014 or the six months ended June 30, 2013.
Fees Paid in Connection with the Operations of the Operating Partnership
Each of the Operating Partnership, ARCT III and ARCT IV paid the Former Manager, the ARCT III Advisor and the ARCT IV Advisor, as applicable, an acquisition fee equal to 1.0% of the contract purchase price, inclusive of assumed indebtedness, of each property the Operating Partnership (on behalf of the General Partner), ARCT III or ARCT IV, as applicable, acquired. The acquisition fee was payable in cash at the closing of each acquisition. In conjunction with the ARCT III Merger, it was agreed that these fees would no longer be paid by either the Operating Partnership or ARCT III. In conjunction with the ARCT IV Merger, it was agreed that these fees would no longer be paid by ARCT IV. Acquisition fees are recorded in Acquisition related costs in the accompanying consolidated statements of operations.
Each of the Operating Partnership, ARCT III and ARCT IV paid the Former Manager, the ARCT III Advisor and the ARCT IV Advisor, as applicable, a financing coordination fee equal to 0.75% of the amount available under any secured mortgage financing or refinancing that the Operating Partnership (on behalf of the General Partner), ARCT III or ARCT IV, as applicable, obtained and used for the acquisition of properties that was arranged by the Former Manager, ARCT III Advisor or ARCT IV Advisor, as applicable. The financing coordination fee was payable in cash at the closing of each financing. In conjunction with the ARCT III Merger, it was agreed that these fees would no longer be paid to either the Operating Partnership or ARCT III. In conjunction with the ARCT IV Merger, it was agreed that these fees would no longer be paid by ARCT IV.
Prior to the termination of the amended and restated management agreement, the General Partner was required to pay its Former Manager a quarterly incentive fee, calculated based on 20% of the excess General Partner annualized core earnings (as defined in the management agreement with its Former Manager) over the weighted average number of shares multiplied by the weighted average price per share of common stock. One
F-188
Table of Contents
ARC PROPERTIES OPERATING PARTNERSHIP, L.P.
NOTES TO CONSOLIDATED FINANCIAL STATEMENTS
June 30, 2014
(Unaudited)
half of each quarterly installment of the incentive fee will be payable in shares of common stock. The remainder of the incentive fee was payable in cash. No incentive fees were incurred or paid to the General Partner’s Former Manager since inception through January 8, 2014.
Prior to January 8, 2014, the General Partner paid its Former Manager an annual base management fee equal to 0.50% per annum of the average unadjusted book value of the General Partner’s real estate assets, calculated and payable monthly in advance. The management fee was payable in cash. In conjunction with the ARCT III Merger, the base management fee was reduced to 0.40% per annum for the unadjusted book value of assets over $3.0 billion. The amount of base management fee incurred by the Operating Partnership during the period ended March 31, 2014 prior to the terminating the amended and restated management agreement was not significant. In addition, as of December 31, 2013, the Operating Partnership had accrued $5.0 million in base management fees. In lieu of cash, on January 21, 2014, the Former Manager agreed to settle all outstanding balances in stock, resulting in the Operating Partnership issuing 388,461 General Partner OP Units to the General Partner, in conjunction with General Partner issuing 388,461 shares of common stock to our Former Manager. The fair value of the shares issued approximated the amount of accrued asset management fees at the date of settlement.
The General Partner also pays fees for transfer agent services to an entity under common ownership with the Former Manager, ANST. During the six months ended June 30, 2014, the Operating Partnership incurred and paid $0.3 million in relation to transfer agent services. No fees were incurred during the three months ended June 30, 2014 or during the six months ended June 30, 2013.
Until July 1, 2012, ARCT III paid the ARCT III Advisor an asset management fee of 0.75% per annum of the cost of its assets (cost includes the purchase price, acquisition expenses, capital expenditures and other customarily capitalized costs, but excludes acquisition fees) plus costs and expenses incurred by the ARCT III Advisor in providing asset management services; provided, however, that the asset management fee was reduced by any amounts payable to ARCT III’s property manager as an oversight fee, such that the aggregate of the asset management fee and the oversight fee did not exceed 0.75% per annum of the cost of ARCT III’s assets plus costs and expenses incurred by the ARCT III Advisor in providing asset management services. Prior to July 1, 2012, this fee was payable in monthly installments at the discretion of ARCT III’s board of directors in cash, common stock or restricted stock grants, or any combination thereof. Asset management fees, if accrued, are recorded in operating fees to affiliates in the consolidated statements of operations.
Effective July 1, 2012, the payment of asset management fees in monthly installments in cash, shares or restricted stock grants, or any combination thereof to the ARCT III Advisor was eliminated. Instead, ARCT III issued (subject to periodic approval by its board of directors) to the ARCT III Advisor performance-based restricted partnership units of the ARCT III OP designated as “ARCT III Class B units,” which were intended to be profits interests and to vest, and no longer be subject to forfeiture, at such time as: (x) the value of the ARCT III OP’s assets plus all distributions made equal or exceeded the total amount of capital contributed by investors plus a 6.0% cumulative, pre-tax, non-compounded annual return thereon (the “economic hurdle”); and (y) a liquidity event has occurred.
The ARCT III Advisor received distributions on unvested ARCT III Class B units equal to the distribution rate received on ARCT III common stock. Such distributions on issued ARCT III Class B units were included as general and administrative expense in the consolidated statements of operations and comprehensive loss until the performance condition is considered probable to occur. 145,022 ARCT III Class B units were approved by ARCT III’s board of directors as of December 31, 2012. During January and February 2013, ARCT III’s board of directors approved, and ARCT III issued, 603,599 ARCT III Class B units to the ARCT III Advisor for its asset
F-189
Table of Contents
ARC PROPERTIES OPERATING PARTNERSHIP, L.P.
NOTES TO CONSOLIDATED FINANCIAL STATEMENTS
June 30, 2014
(Unaudited)
management services provided. As of December 31, 2012, ARCT III did not consider achievement of the performance condition to be probable as the shareholder vote for the ARCT III Merger, which would allow vesting of these ARCT III Class B Units, was not completed. The performance condition related to these ARCT III Class B units was satisfied upon the completion of the ARCT III Merger and expense of $9.9 million was recorded at that time. The ARCT III Class B units then converted to ARCT III OP units which converted to 711,190 OP Units after the application of the ARCT III Exchange Ratio. These expenses were recorded in merger and other transaction related in the consolidated statements of operations.
In connection with the asset management services provided by the ARCT IV Advisor, ARCT IV issued (subject to periodic approval by the board of directors) to the ARCT IV Advisor performance-based restricted partnership units of the ARCT IV OP designated as “ARCT IV Class B Units,” which were intended to be profit interests and to vest, and no longer be subject to forfeiture, at such time as: (x) the value of the ARCT IV OP’s assets plus all distributions made equals or exceeds the total amount of capital contributed by investors plus a 6.0% cumulative, pre-tax, non-compounded annual return thereon (the “economic hurdle”); (y) any one of the following occurs: (1) the termination of the advisory agreement by an affirmative vote of a majority of ARCT’s independent directors without cause; (2) a listing; or (3) another liquidity event; and (z) the ARCT IV Advisor was still providing advisory services to ARCT IV.
The calculation of the ARCT IV asset management fees was equal to: (i) 0.1875% of the cost of ARCT IV’s assets; divided by (ii) the value of one share of ARCT IV common stock as of the last day of such calendar quarter. When approved by the board of directors, the ARCT IV Class B Units were issued to the ARCT IV Advisor quarterly in arrears pursuant to the terms of the ARCT IV OP agreement.
During the year ended December 31, 2013, the board of directors approved the issuance of 492,483 ARCT IV Class B Units to the ARCT IV Advisor in connection with this arrangement. As of December 31, 2013, ARCT IV did not consider achievement of the performance condition to be probable and no expense was recorded at that time. The ARCT IV Advisor received distributions on unvested ARCT IV Class B Units equal to the distribution rate received on the ARCT IV common stock. Such distributions on ARCT IV Class B Units were included in general and administrative expense in the consolidated statements of operations until the performance condition was considered probable to occur. The performance condition related to the 498,857 ARCT IV Class B Units, which includes units issued for the period of January 1, 2014 through the ARCT IV Merger Date, was satisfied upon the completion of the ARCT IV Merger. These ARCT IV Class B Units immediately converted into OP Units at the 2.3961 exchange ratio discussed in Note 2—Mergers and Acquisitions and the Operating Partnership recorded an expense of $13.9 million based on the fair value of the ARCT IV Class B Units at that time.
ARCT III paid an affiliate of ARC, unless it contracted with a third party, a property management fee of up to 2% of gross revenues from ARCT III’s stand-alone single-tenant net leased properties and 4% of gross revenues from its multi-tenant properties, plus, in each case, market-based leasing commissions applicable to the geographic location of the property. ARCT III also reimbursed the affiliate for property level expenses. If ARCT III contracted directly with third parties for such services, it paid them customary market fees and paid the affiliated property manager, an oversight fee of up to 1% of the gross revenues of the property managed. Property management fees are recorded in Operating fees to affiliates in the accompanying consolidated statements of operations.
Effective March 1, 2013, ARCT IV entered into an agreement with RCS to provide strategic advisory services and investment banking services required in the ordinary course of ARCT IV’s business, such as
F-190
Table of Contents
ARC PROPERTIES OPERATING PARTNERSHIP, L.P.
NOTES TO CONSOLIDATED FINANCIAL STATEMENTS
June 30, 2014
(Unaudited)
performing financial analysis, evaluating publicly traded comparable companies and assisting in developing a portfolio composition strategy, a capitalization structure to optimize future liquidity options and structuring operations. Strategic advisory fees were amortized over the term of the ARCT IV IPO and included in acquisition and transaction related expense on the consolidated statements of operations. RCS and its affiliates also provide transfer agent services, as well as transaction management and other professional services. Those fees are included in general and administrative expenses on the consolidated statements of operations during the period the service was provided.
The General Partner and the Operating Partnership reimburse certain affiliates for out-of-pocket costs actually incurred by those affiliates, including without limitation, legal fees and expenses, due diligence fees and expenses, other third party fees and expenses, costs of appraisals, travel expenses, nonrefundable option payments and deposits on properties not acquired, accounting fees and expenses, title insurance premiums and other closing costs, personnel costs and miscellaneous expenses relating to the selection, acquisition and due diligence of properties. The General Partner’s and Operating Partnership’s reimbursement obligation is not subject to any dollar limitation. Expenses are typically reimbursed in cash on a monthly basis following the end of each month. Reimbursements are recorded based on the related activity to which the expense relates. Other than those reimbursements incurred and discussed above, the Operating Partnership incurred reimbursement expenses of $0.5 million during the three months and six months ended June 30, 2014. No reimbursements were incurred during the three months and the six months ended June 30, 2013.
The Operating Partnership leases certain office space from an affiliate of the Former Manager. Rent expense of $0.1 million and $0.2 million was incurred during the three and six months ended June 30, 2014, respectively, and is included in general and administrative expenses in the accompanying statements of operations. No rent expense was incurred during the six months ended June 30, 2013.
In order to facilitate the smooth transition of property management services following the consummation of the ARCT III Merger, the General Partner, the Operating Partnership and ARC agreed that the Property Management and Leasing Agreement would be extended for a 60-day period following the consummation of the ARCT III Merger for which the Operating Partnership (on behalf of the General Partner) paid ARC $2.3 million. These fees were recorded in merger and transaction related in the consolidated statements of operations and comprehensive loss.
In connection with providing strategic advisory services related to certain portfolio acquisitions, from time to time, ARCT IV entered into arrangements in which the investment banking division of RCS receives a transaction fee of 0.25% of the transaction value for such portfolio acquisition transactions. No such arrangements were entered into during the six months ended June 30, 2014.
F-191
Table of Contents
ARC PROPERTIES OPERATING PARTNERSHIP, L.P.
NOTES TO CONSOLIDATED FINANCIAL STATEMENTS
June 30, 2014
(Unaudited)
The following table details amounts incurred by the Operating Partnership (on behalf of the General Partner), ARCT III or ARCT IV, other than those incurred for the ARCT IV Merger, the Cole Merger, the ARCT III Merger and the sale of the multi-tenant business, and contractually due to ARC, the ARCT III Advisor, the ARCT IV Advisor or the Former Manager and forgiven in connection with the operations related services described above (in thousands):
| Three Months Ended June 30, | Six Months Ended June 30, | Payable as of | ||||||||||||||||||||||||||||||||||||||
| 2014 | 2013 | 2014 | 2013 | June 30, | December 31, | |||||||||||||||||||||||||||||||||||
| Incurred | Forgiven | Incurred | Forgiven | Incurred | Forgiven | Incurred | Forgiven | 2014 | 2013 | |||||||||||||||||||||||||||||||
| One-time fees: |
||||||||||||||||||||||||||||||||||||||||
| Acquisition fees(1) |
$ | — | $ | — | $ | 11,515 | $ | — | $ | — | $ | — | $ | 16,851 | $ | — | $ | — | $ | — | ||||||||||||||||||||
| Financing fees and related cost reimbursements |
— | — | 5,656 | — | — | — | 13,156 | — | — | — | ||||||||||||||||||||||||||||||
| Other expense reimbursements |
549 | — | 6,545 | — | 549 | — | 8,317 | — | 391 | — | ||||||||||||||||||||||||||||||
| Transaction fees |
— | — | — | — | — | — | — | — | — | 3,455 | ||||||||||||||||||||||||||||||
| On-going fees: |
||||||||||||||||||||||||||||||||||||||||
| Base management fees(2) |
— | — | 2,000 | 2,000 | — | — | 4,654 | 2,370 | — | 5,654 | ||||||||||||||||||||||||||||||
| Transfer agent fees |
— | — | 535 | — | 344 | — | 648 | — | — | 57 | ||||||||||||||||||||||||||||||
| Property management and leasing fees(2) |
— | — | — | — | — | — | 799 | 799 | — | 217 | ||||||||||||||||||||||||||||||
| Strategic advisory fees |
— | — | — | — | — | — | 920 | — | — | — | ||||||||||||||||||||||||||||||
| Distributions on Class B Units |
— | — | 7 | — | — | — | 9 | — | — | — | ||||||||||||||||||||||||||||||
|
|
|
|
|
|
|
|
|
|
|
|
|
|
|
|
|
|
|
|
|
|||||||||||||||||||||
| Total operational fees and reimbursements |
$ | 549 | $ | — | $ | 26,258 | $ | 2,000 | $ | 893 | $ | — | $ | 45,354 | $ | 3,169 | $ | 391 | $ | 9,383 | ||||||||||||||||||||
|
|
|
|
|
|
|
|
|
|
|
|
|
|
|
|
|
|
|
|
|
|||||||||||||||||||||
| (1) | In conjunction with the ARCT III Merger, the payment of acquisition fees was terminated, except with respect to properties that were in ARCP’s or ARCT III’s pipeline at the ARCT III Merger date; any fees that were paid because the Former Manager or the ARCT III Advisor had sourced and negotiated the purchase price prior to the ARCT III Merger. |
| (2) | The amounts incurred and paid were recognized in merger and other transaction related costs during the six months ended June 30, 2013 as they relate to the ARCT III Merger. The amounts incurred during the six months ended June 30, 2013 and payable as of June 30, 2013 were accrued through January 7, 2014, the date prior to transition to self-management. |
Upon consummation of the ARCT III Merger, the General Partner entered into the OPP with its Former Manager, whereby its Former Manager was able to potentially earn compensation upon the attainment of stockholder value creation targets. Pursuant to previous authorization of the General Partner’s board of directors, as a result of the termination of the Management Agreement, all LTIP Units issued to the Former Manager under the OPP became fully earned and vested and were earned upon the consummation of the General Partner’s transition to self-management on January 8, 2014. On October 21, 2013, the General Partner approved the New OPP, to be effective as of the General Partner’s transition to self-management. Under the New OPP, individual agreements are entered into between the General Partner and selected participants that set forth the participant’s participation percentage in the New OPP and the number of LTIP Units subject to the participant’s award. Under
F-192
Table of Contents
ARC PROPERTIES OPERATING PARTNERSHIP, L.P.
NOTES TO CONSOLIDATED FINANCIAL STATEMENTS
June 30, 2014
(Unaudited)
the OPP Agreements, the participants will be eligible to earn performance-based bonus awards equal to the Participant’s participation percentage of a pool that will be funded up to a maximum award opportunity. See Note 18—Equity Based Compensation for a more detailed description of these plans.
Fees Paid in Connection with Common Stock Offerings
RCS served as the dealer manager of the ARCT III and ARCT IV IPOs. RCS received fees and compensation in connection with the sale of ARCT III’s and ARCT IV’s common stock in the respective IPOs. RCS received a selling commission of up to 7% of gross offering proceeds before reallowance of commissions earned by participating broker-dealers in each of the IPOs. In addition, RCS received up to 3% of the gross proceeds from the sale of common stock, before reallowance to participating broker-dealers, as a dealer-manager fee in each of the IPOs. RCS was permitted to reallow its dealer-manager fee to such participating broker-dealers, based on such factors as the volume of shares sold by respective participating broker-dealers and marketing support incurred as compared to those of other participating broker-dealers. RCS has also received compensation for various other General Partner equity transactions.
The following table details the results of such activities related to RCS, which are recorded as offering costs on the consolidated statement of changes in equity (amounts in thousands):
| Three Months Ended June 30, |
Six Months Ended June 30, |
Payable as of | ||||||||||||||||||||||
| 2014 | 2013 | 2014 | 2013 | June 30, 2014 | December 31, 2013 | |||||||||||||||||||
| Total commissions and fees paid to RCS |
$ | 2,000 | $ | 7,345 | $ | 2,000 | $ | 147,306 | $ | — | $ | — | ||||||||||||
The Operating Partnership, ARCT III and ARCT IV reimbursed the Former Manager, the ARCT III Advisor, the ARCT IV Advisor and RCS, as applicable, for services relating to the ARCT III IPO, the ARCT IV IPO and other significant transactions such as the General Partner’s at-the-market equity program. The following table details the results of such activities related to offering and other significant transactions costs reimbursed to the Former Manager, the ARCT III Advisor, the ARCT IV Advisor and RCS (amounts in thousands):
| Three Months Ended June 30, |
Six Months Ended June 30, |
Payable as of | ||||||||||||||||||||||
| 2014 | 2013 | 2014 | 2013 | June 30, 2014 | December 31, 2013 | |||||||||||||||||||
| Offering expense and other significant transactions reimbursements |
$ | — | $ | 746 | $ | 1,865 | $ | 12,710 | $ | — | $ | — | ||||||||||||
Cole Capital
Cole Capital is contractually responsible for managing the Managed REITs’ affairs on a day-to-day basis, identifying and making acquisitions and investments on the Managed REITs’ behalf, and recommending to each of the Managed REIT’s respective board of directors an approach for providing investors with liquidity. In addition, the Operating Partnership distributes the shares of common stock for certain Managed REITs and advises them regarding offerings, manages relationships with participating broker-dealers and financial advisors and provides assistance in connection with compliance matters relating to the offerings. The Operating Partnership receives compensation and reimbursement for services relating to the Managed REITs’ offerings and the investment, management and disposition of their respective assets, as applicable.
F-193
Table of Contents
ARC PROPERTIES OPERATING PARTNERSHIP, L.P.
NOTES TO CONSOLIDATED FINANCIAL STATEMENTS
June 30, 2014
(Unaudited)
Offerings
The Operating Partnership generally receives a selling commission of up to 7.0% of gross offering proceeds related to the sale of shares of CCPT IV, CCIT II and CCPT V common stock in their primary offerings, before reallowance of commissions earned by participating broker-dealers. The Operating Partnership has and intends to continue to reallow 100% of selling commissions earned to participating broker-dealers. In addition, the Operating Partnership generally receives 2.0% of gross offering proceeds in the primary offerings, before reallowance to participating broker-dealers, as a dealer manager fee in connection with the sale of CCPT IV, CCIT II and CCPT V shares of common stock. The Operating Partnership, in its sole discretion, may reallow all or a portion of its dealer manager fee to such participating broker-dealers as a marketing and due diligence expense reimbursement, based on factors such as the volume of shares sold by such participating broker-dealers and the amount of marketing support provided by such participating broker-dealers. No selling commissions or dealer manager fees are paid to the Operating Partnership or other broker-dealers with respect to shares sold under the respective Managed REIT’s distribution reinvestment plans, under which the stockholders may elect to have distributions reinvested in additional shares.
In connection with the sale of INAV shares of common stock, the Operating Partnership receives an asset-based dealer manager fee that is payable in arrears on a monthly basis and accrues daily in an amount equal to (i) 1/365th of 0.55% of the net asset value (“NAV”) for Wrap Class shares of common stock (“W Shares”) for such day, (ii) 1/365th of 0.55% of the NAV for Advisor Class shares of common stock (“A Shares”) for such day and (iii) 1/365th of 0.25% of the NAV for Institutional Class shares of common stock (“I Shares”) for such day. The Operating Partnership, in its sole discretion, may reallow a portion of its dealer manager fee received on W Shares, A Shares and I Shares to participating broker-dealers. In addition, the Operating Partnership receives a selling commission on A Shares sold in the primary offering of up to 3.75% of the offering price per share for A Shares. The Operating Partnership has and intends to continue to reallow 100% of selling commissions earned to participating broker-dealers. The Operating Partnership also receives an asset-based distribution fee for A Shares that is payable in arrears on a monthly basis and accrues daily in an amount equal to 1/365th of 0.50% of the NAV for A Shares for such day. The Operating Partnership, in its sole discretion, may reallow a portion of the distribution fee to participating broker-dealers. No selling commissions are paid to the Operating Partnership or other broker-dealers with respect to W Shares or I Shares or on shares of any class of INAV common stock sold pursuant to INAV’s distribution reinvestment plan, under which the stockholders may elect to have distributions reinvested in additional shares, and no distribution fees are paid to the Operating Partnership or other broker-dealers with respect to W Shares or I Shares.
All other organization and offering expenses associated with the sale of the Managed REITs’ common stock (excluding selling commissions, if applicable, and the dealer manager fee) are paid for in advance by the Operating Partnership and subject to reimbursement by the Managed REITs, up to certain limits per the respective advisory agreement. As these costs are incurred, they are recorded as reimbursement revenue, up to the respective limit, and are included in dealer manager fees, selling commissions and offering reimbursements in the financial results for Cole Capital in Note 5—Segment Reporting. Expenses paid on behalf of the Managed REITs in excess of these limits that are expected to be collected are recorded as program development costs. As of June 30, 2014, the Operating Partnership had $7.0 million of organization and offering costs paid on behalf of the Managed REITs in excess of the limits that have not been reimbursed, which are expected to be reimbursed by the Managed REITs as they raise additional proceeds from the respective offering. The program development costs are included in deferred costs and other assets, net in the accompanying consolidated unaudited balance sheets. Subsequent to June 30, 2014, the Operating Partnership had incurred $114.8 thousand of additional organization and offering costs, and $445.8 thousand costs had been reimbursed from the Managed REITs.
F-194
Table of Contents
ARC PROPERTIES OPERATING PARTNERSHIP, L.P.
NOTES TO CONSOLIDATED FINANCIAL STATEMENTS
June 30, 2014
(Unaudited)
The Operating Partnership recorded commissions, fees and expense reimbursements as shown in the table below for services provided to the Managed REITs (as described above) during the three months ended June 30, 2014 and the period from the Cole Acquisition Date to June 30, 2014 (in thousands). As the Operating Partnership did not commence operations for Cole Capital until the Cole Acquisition Date, comparative financial data is not presented for the three and six months ended June 30, 2013.
| Three Months Ended June 30, 2014 | ||||||||||||||||||||
| CCPT IV(1) | CCPT V | CCIT II | INAV | Total | ||||||||||||||||
| Offering: |
||||||||||||||||||||
| Selling commission revenue |
$ | (12 | ) | $ | 1,347 | $ | 4,579 | $ | 195 | $ | 6,109 | |||||||||
| Selling commissions reallowance expense |
(12 | ) | 1,347 | 4,579 | 195 | 6,109 | ||||||||||||||
| Dealer manager fee revenue |
(2 | ) | 416 | 1,372 | 123 | 1,909 | ||||||||||||||
| Dealer manager fees reallowance expense |
107 | 178 | 668 | 6 | 959 | |||||||||||||||
| Other expense reimbursement revenue |
(18 | ) | 415 | 1,372 | 182 | 1,951 | ||||||||||||||
| (1) | Due to net cancellations during the quarter, related to shares sold prior to the fund closing on February 25, 2014. |
| Period from the Cole Acquisition Date to June 30, 2014 | ||||||||||||||||||||
| CCPT IV | CCPT V | CCIT II | INAV | Total | ||||||||||||||||
| Offering: |
||||||||||||||||||||
| Selling commission revenue |
$ | 29,113 | $ | 1,347 | $ | 4,950 | $ | 216 | $ | 35,626 | ||||||||||
| Selling commissions reallowance expense |
29,113 | 1,347 | 4,950 | 216 | 35,626 | |||||||||||||||
| Dealer manager and distribution fee revenue |
8,771 | 416 | 1,486 | 188 | 10,861 | |||||||||||||||
| Dealer manager fees reallowance expense |
4,971 | 178 | 721 | 8 | 5,878 | |||||||||||||||
| Other expense reimbursement revenue |
3,749 | 465 | 1,486 | 235 | 5,935 | |||||||||||||||
Operations
The Operating Partnership earns acquisition fees related to the acquisition, development or construction of properties on behalf of certain of the Managed REITs. In addition, the Operating Partnership is reimbursed for acquisition expenses incurred in the process of acquiring properties up to certain limits per the respective advisory agreement. The Operating Partnership is not reimbursed for personnel costs in connection with services for which it receives acquisition fees or real estate commissions. In addition, the Operating Partnership may earn disposition fees related to the sale of one or more properties, including those held indirectly through joint ventures, on behalf of a Managed REIT. Acquisition and disposition fees and reimbursements, as applicable, are included in transaction service fees in the financial results for Cole Capital in Note 5—Segment Reporting.
The Operating Partnership earns advisory and asset and property management fees from certain Managed REITs and other affiliates. In addition, the Operating Partnership may be reimbursed for expenses incurred in providing advisory and asset and property management services, subject to certain limitations. In connection with services provided by the Operating Partnership related to the origination or refinancing of any debt financing obtained by certain Managed REITs that is used to acquire properties or to make other permitted investments, or that is assumed, directly or indirectly, in connection with the acquisition of properties, the Operating Partnership is reimbursed for financing expenses incurred, subject to certain limitations. Advisory fees, asset and property management fees and reimbursements of expenses are included in management fees and reimbursements in the financial results for Cole Capital in Note 5—Segment Reporting.
F-195
Table of Contents
ARC PROPERTIES OPERATING PARTNERSHIP, L.P.
NOTES TO CONSOLIDATED FINANCIAL STATEMENTS
June 30, 2014
(Unaudited)
The Operating Partnership recorded fees and expense reimbursements as shown in the tables below for services provided primarily to the Managed REITs (as described above) during the three months ended June 30, 2014 and the period from the Cole Acquisition Date to June 30, 2014 (in thousands). As the Operating Partnership did not commence operations for Cole Capital until the Cole Acquisition Date, comparative financial data is not presented for the three and six months ended June 30, 2013.
| Three Months Ended June 30, 2014 | ||||||||||||||||||||||||
| CCPT IV | CCPT V | CCIT | CCIT II | INAV | Other | |||||||||||||||||||
| Operations: |
||||||||||||||||||||||||
| Acquisition fee revenue |
$ | 6,786 | $ | 519 | $ | 3,232 | $ | 3,874 | $ | — | $ | — | ||||||||||||
| Asset management fee revenue |
$ | — | $ | — | $ | — | $ | — | $ | — | $ | 253 | ||||||||||||
| Property management and leasing fee revenue |
$ | — | $ | — | $ | — | $ | — | $ | — | $ | 474 | ||||||||||||
| Operating expense reimbursement revenue |
$ | 1,538 | $ | 167 | $ | 756 | $ | 79 | $ | 135 | $ | — | ||||||||||||
| Advisory and performance fee revenue |
$ | 4,747 | $ | 9 | $ | 4,561 | $ | 115 | $ | 198 | $ | — | ||||||||||||
| Period from the Cole Acquisition Date to June 30, 2014 | ||||||||||||||||||||||||
| CCPT IV | CCPT V | CCIT | CCIT II | INAV | Other | |||||||||||||||||||
| Operations: |
||||||||||||||||||||||||
| Acquisition fee revenue |
$ | 10,784 | $ | 585 | $ | 3,727 | $ | 3,874 | $ | — | $ | — | ||||||||||||
| Asset management fee revenue |
— | — | — | — | — | 404 | ||||||||||||||||||
| Property management and leasing fee revenue |
— | — | — | — | — | 574 | ||||||||||||||||||
| Operating expense reimbursement revenue |
2,603 | 184 | 1,185 | 79 | 135 | — | ||||||||||||||||||
| Advisory and performance fee revenue |
7,311 | 9 | 7,156 | 141 | 306 | — | ||||||||||||||||||
Investment in the Managed REITs
As of June 30, 2014, the Operating Partnership owned aggregate equity investments of $3.9 million in the Managed REITs, which is included in investment in unconsolidated entities in the accompanying consolidated balance sheet. The table below presents certain information related to the Operating Partnership’s investments in the Managed REITs as of June 30, 2014 (carrying amount in thousands):
| June 30, 2014 | ||||||||
| Managed REIT |
% of Outstanding Shares Owned | Carrying Amount of Investment | ||||||
| CCPT IV |
0.01 | % | $ | 137 | ||||
| CCPT V |
12.39 | % | 1,732 | |||||
| CCIT |
0.01 | % | 79 | |||||
| CCIT II |
3.79 | % | 1,809 | |||||
| INAV |
0.22 | % | 160 | |||||
|
|
|
|||||||
| $ | 3,917 | |||||||
|
|
|
|||||||
Due from Affiliates
As of June 30, 2014, $8.6 million was expected to be collected from the Managed REITs for services provided by the Operating Partnership and expenses subject to reimbursement by the Managed REITs in accordance with their respective advisory and property management agreements and was included in due from affiliates on the accompanying consolidated balance sheet. In connection with the Cole Merger, the Operating Partnership acquired a revolving line of credit agreement that provides for $100.0 million of available
F-196
Table of Contents
ARC PROPERTIES OPERATING PARTNERSHIP, L.P.
NOTES TO CONSOLIDATED FINANCIAL STATEMENTS
June 30, 2014
(Unaudited)
borrowings to CCIT II. In addition, during the six months ended June 30, 2014, the Operating Partnership entered into a revolving line of credit agreement that provides for $10.0 million of available borrowings to CCPT V. The CCIT II and CCPT V line of credit agreements each bear an interest rate equal to the one-month LIBOR plus 2.20% and mature in January 2015 and March 2015, respectively. During the six months ended June 30, 2014, CCIT II and CCPT V borrowed on their lines of credit, net of repayments, $55.0 million and $9.7 million, respectively. These borrowings are included in due from affiliates in the accompanying consolidated balance sheet.
Note 20—Economic Dependency
Prior to transitioning to self-management on January 8, 2014, the General Partner engaged, under various agreements, the Former Manager, and entities under common ownership with the Former Manager to provide certain services that are essential to the Operating Partnership, including asset management services and supervision of the management and leasing of properties owned by the Operating Partnership, as well as other administrative responsibilities for the Operating Partnership including information technology, legal services and investor relations.
As a result of these relationships, the Operating Partnership was dependent upon the Former Manager, ARC and their affiliates. In the event that these companies were unable to provide the Operating Partnership with the respective services, the Operating Partnership would have been required to find alternative providers of these services. As a result of the ARCT III Merger, ARCP internalized certain accounting and property acquisition services previously performed by the Former Manager and its affiliates. ARCP may from time to time engage entities under common control with the Former Manager for legal, information technology or other support services for which it will pay a fee, subject to approval by ARCP’s independent directors. No such engagements are in place between ARCP and the Former Manager and its affiliates.
Note 21—Net Loss Per Unit
The following is a summary of the basic and diluted net loss per unit computation for the three and six months ended June 30, 2014 and 2013 (dollar amounts in thousands, except for unit and per unit data):
| Three Months Ended June 30, | Six Months Ended June 30, | |||||||||||||||
| 2014 | 2013 | 2014 | 2013 | |||||||||||||
| Net loss attributable to the Operating Partnership |
$ | (43,537 | ) | $ | (72,433 | ) | $ | (364,000 | ) | $ | (214,028 | ) | ||||
| Less: dividends declared on preferred units and participating securities |
23,091 | 233 | 46,723 | 425 | ||||||||||||
|
|
|
|
|
|
|
|
|
|||||||||
| Net loss attributable to common unitholders |
$ | (66,628 | ) | $ | (72,666 | ) | $ | (410,723 | ) | $ | (214,453 | ) | ||||
|
|
|
|
|
|
|
|
|
|||||||||
| Weighted average common units outstanding: |
841,593,360 | 209,408,106 | 708,315,455 | 190,982,367 | ||||||||||||
|
|
|
|
|
|
|
|
|
|||||||||
| Basic and diluted net loss per unit attributable to common unitholders |
$ | (0.08 | ) | $ | (0.35 | ) | $ | (0.58 | ) | $ | (1.12 | ) | ||||
|
|
|
|
|
|
|
|
|
|||||||||
As of June 30, 2014, the Operating Partnership excluded 5,649,968 shares of unvested restricted stock outstanding and 21,735,008 Series D Convertible Preferred Units outstanding from the calculation of diluted net loss per share as the effect would have been antidilutive.
F-197
Table of Contents
ARC PROPERTIES OPERATING PARTNERSHIP, L.P.
NOTES TO CONSOLIDATED FINANCIAL STATEMENTS
June 30, 2014
(Unaudited)
Note 22—Property Dispositions
During the six months ended June 30, 2014, the Operating Partnership disposed of 24 single-tenant properties and one multi-tenant property for an aggregate gross sales price of $96.4 million (the “2014 Property Dispositions”). There were no properties disposed of during the six months ended June 30, 2013. No disposition fees were paid in connection with the sale of the 2014 Property Dispositions and the Operating Partnership has no continuing involvement with these properties. As of June 30, 2014, there were no properties classified as held for sale.
Note 23—Income Taxes
As a REIT, the General Partner generally is not subject to federal income tax, with the exception of its TRS. However, the General Partner, including its TRS, and the Operating Partnership are still subject to certain state and local income taxes in the various jurisdictions in which the entities operate.
Based on the above, Cole Capital, substantially all of which is conducted through a TRS, recognized a benefit from federal and state income taxes of $9.7 million and $14.7 million for the three and six months ended June 30, 2014, respectively, which is included in other income, net in the accompanying consolidated statements of operations. No provision for income taxes was recognized for the three and six months ended June 30, 2013 as the Operating Partnership did not commence operations for Cole Capital until the Cole Acquisition Date. The difference in the benefit from income taxes reflected in the consolidated statements of operations as compared to the benefit calculated at the statutory federal income tax rate is primarily attributable to various permanent differences and state and local income taxes.
The REI segment recognized state income and franchise taxes of $2.8 million and $3.9 million during the three and six months ended June 30, 2014, respectively, and $0.2 million and $0.4 million during the three and six months ended June 30, 2013, respectively, which are included in other income, net in the accompanying consolidated statements of operations.
The Operating Partnership had no unrecognized tax benefits as of or during the six months ended June 30, 2014 and 2013. Any interest and penalties related to unrecognized tax benefits would be recognized within the provision for income taxes in the accompanying consolidated statements of operations. The Operating Partnership files income tax returns in the U.S. federal jurisdiction, as well as various state jurisdictions, and is subject to routine examinations by the respective tax authorities. With few exceptions, the Operating Partnership is no longer subject to federal or state examinations by tax authorities for years before 2010.
F-198
Table of Contents
ARC PROPERTIES OPERATING PARTNERSHIP, L.P.
NOTES TO CONSOLIDATED FINANCIAL STATEMENTS
June 30, 2014
(Unaudited)
Note 24—Subsequent Events
In addition to the items discussed in Note 12—Other Debt and Note 2—Mergers and Acquisitions, the following events occurred subsequent to June 30, 2014 that require adjustments to the disclosures in the consolidated financial statements:
Completion of Acquisition of Assets
The following table presents certain information about the properties that the Operating Partnership acquired from July 1, 2014 to July 29, 2014 (dollar amounts in millions):
| No. of Buildings |
Square Feet (in millions) |
Base Purchase Price(1) |
||||||||||
| Total Portfolio—June 30, 2014 |
3,966 | 106.8 | $ | 17,831 | ||||||||
| Acquisitions |
586 | 5.2 | 1,939 | |||||||||
|
|
|
|
|
|
|
|||||||
| Total portfolio—July 29, 2014 |
4,552 | 112.0 | $ | 19,770 | ||||||||
|
|
|
|
|
|
|
|||||||
| (1) | Contract purchase price, excluding acquisition and transaction related costs. |
F-199
Table of Contents
ARC Properties Operating Partnership, L.P.
$1,300,000,000 2.000% Senior Notes due 2017
$750,000,000 3.000% Senior Notes due 2019
$500,000,000 4.600% Senior Notes due 2024
PROSPECTUS
Until the date that is 90 days from the date of this prospectus, all dealers that effect transactions in these securities, whether or not participating in this offering, may be required to deliver a prospectus. This is in addition to the dealers’ obligation to deliver a prospectus when acting as underwriters with respect to their unsold allotments or subscriptions.