0001504461false--03-312024FYhttp://fasb.org/us-gaap/2023#GainLossOnDispositionOfAssets1http://fasb.org/us-gaap/2023#GainLossOnDispositionOfAssets1http://fasb.org/us-gaap/2023#GainLossOnDispositionOfAssets1http://fasb.org/us-gaap/2023#AccruedLiabilitiesCurrentP1YP1YP1YP1YP1YP4Y9Mhttp://fasb.org/us-gaap/2023#AccountsPayableAndAccruedLiabilitiesCurrentAndNoncurrent http://fasb.org/us-gaap/2023#OtherLiabilitieshttp://fasb.org/us-gaap/2023#Revenueshttp://fasb.org/us-gaap/2023#Revenueshttp://fasb.org/us-gaap/2023#Revenueshttp://fasb.org/us-gaap/2023#OperatingCostsAndExpensesiso4217:USDxbrli:sharesiso4217:USDxbrli:sharesxbrli:pureutr:bblutr:gal00015044612023-04-012024-03-310001504461exch:XNYSus-gaap:LimitedPartnerMember2023-04-012024-03-310001504461us-gaap:SeriesBPreferredStockMemberexch:XNYS2023-04-012024-03-310001504461us-gaap:SeriesCPreferredStockMemberexch:XNYS2023-04-012024-03-3100015044612023-09-3000015044612024-06-0400015044612024-01-012024-03-310001504461ngl:LiquidsLogisticsSegmentMember2023-04-012024-03-3100015044612024-03-3100015044612023-03-310001504461us-gaap:NonrelatedPartyMember2024-03-310001504461us-gaap:NonrelatedPartyMember2023-03-310001504461us-gaap:RelatedPartyMember2024-03-310001504461us-gaap:RelatedPartyMember2023-03-310001504461us-gaap:SeriesDPreferredStockMember2023-04-012024-03-310001504461us-gaap:SeriesDPreferredStockMember2024-03-310001504461us-gaap:SeriesDPreferredStockMember2023-03-310001504461ngl:NGLEnergyHoldingsLLCMemberngl:NGLEnergyPartnersLPMember2023-04-012024-03-310001504461us-gaap:GeneralPartnerMember2024-03-310001504461us-gaap:GeneralPartnerMember2023-03-310001504461ngl:NGLLimitedPartnersMemberngl:NGLEnergyPartnersLPMember2023-04-012024-03-310001504461us-gaap:LimitedPartnerMember2024-03-310001504461us-gaap:LimitedPartnerMember2023-03-310001504461us-gaap:SeriesBPreferredStockMember2024-03-310001504461us-gaap:SeriesBPreferredStockMember2023-03-310001504461us-gaap:SeriesCPreferredStockMember2024-03-310001504461us-gaap:SeriesCPreferredStockMember2023-03-310001504461ngl:WaterSolutionsSegmentMemberus-gaap:OperatingSegmentsMember2023-04-012024-03-310001504461ngl:WaterSolutionsSegmentMemberus-gaap:OperatingSegmentsMember2022-04-012023-03-310001504461ngl:WaterSolutionsSegmentMemberus-gaap:OperatingSegmentsMember2021-04-012022-03-310001504461ngl:CrudeOilLogisticsSegmentMemberus-gaap:OperatingSegmentsMember2023-04-012024-03-310001504461ngl:CrudeOilLogisticsSegmentMemberus-gaap:OperatingSegmentsMember2022-04-012023-03-310001504461ngl:CrudeOilLogisticsSegmentMemberus-gaap:OperatingSegmentsMember2021-04-012022-03-310001504461ngl:LiquidsLogisticsSegmentMemberus-gaap:OperatingSegmentsMember2023-04-012024-03-310001504461ngl:LiquidsLogisticsSegmentMemberus-gaap:OperatingSegmentsMember2022-04-012023-03-310001504461ngl:LiquidsLogisticsSegmentMemberus-gaap:OperatingSegmentsMember2021-04-012022-03-3100015044612022-04-012023-03-3100015044612021-04-012022-03-310001504461us-gaap:CorporateNonSegmentMember2023-04-012024-03-310001504461us-gaap:CorporateNonSegmentMember2022-04-012023-03-310001504461us-gaap:CorporateNonSegmentMember2021-04-012022-03-310001504461us-gaap:LimitedPartnerMember2023-04-012024-03-310001504461us-gaap:LimitedPartnerMember2022-04-012023-03-310001504461us-gaap:LimitedPartnerMember2021-04-012022-03-310001504461us-gaap:LimitedPartnerMember2023-04-012024-03-310001504461us-gaap:LimitedPartnerMember2022-04-012023-03-310001504461us-gaap:LimitedPartnerMember2021-04-012022-03-310001504461us-gaap:GeneralPartnerMember2021-03-310001504461us-gaap:PreferredPartnerMember2021-03-310001504461us-gaap:LimitedPartnerMember2021-03-310001504461us-gaap:AccumulatedOtherComprehensiveIncomeMember2021-03-310001504461us-gaap:NoncontrollingInterestMember2021-03-3100015044612021-03-310001504461us-gaap:NoncontrollingInterestMember2021-04-012022-03-310001504461us-gaap:GeneralPartnerMember2021-04-012022-03-310001504461us-gaap:AccumulatedOtherComprehensiveIncomeMember2021-04-012022-03-310001504461us-gaap:GeneralPartnerMember2022-03-310001504461us-gaap:PreferredPartnerMember2022-03-310001504461us-gaap:LimitedPartnerMember2022-03-310001504461us-gaap:AccumulatedOtherComprehensiveIncomeMember2022-03-310001504461us-gaap:NoncontrollingInterestMember2022-03-3100015044612022-03-310001504461us-gaap:NoncontrollingInterestMember2022-04-012023-03-310001504461us-gaap:GeneralPartnerMember2022-04-012023-03-310001504461us-gaap:AccumulatedOtherComprehensiveIncomeMember2022-04-012023-03-310001504461us-gaap:GeneralPartnerMember2023-03-310001504461us-gaap:PreferredPartnerMember2023-03-310001504461us-gaap:LimitedPartnerMember2023-03-310001504461us-gaap:AccumulatedOtherComprehensiveIncomeMember2023-03-310001504461us-gaap:NoncontrollingInterestMember2023-03-310001504461us-gaap:NoncontrollingInterestMember2023-04-012024-03-310001504461us-gaap:GeneralPartnerMember2023-04-012024-03-310001504461us-gaap:AccumulatedOtherComprehensiveIncomeMember2023-04-012024-03-310001504461us-gaap:GeneralPartnerMember2024-03-310001504461us-gaap:PreferredPartnerMember2024-03-310001504461us-gaap:LimitedPartnerMember2024-03-310001504461us-gaap:AccumulatedOtherComprehensiveIncomeMember2024-03-310001504461us-gaap:NoncontrollingInterestMember2024-03-310001504461ngl:LiquidsLogisticsSegmentMember2024-03-310001504461ngl:NetSalesRevenueMemberngl:CITGOPetroleumCorporationMemberus-gaap:CustomerConcentrationRiskMember2021-04-012022-03-310001504461ngl:ButaneInventoryMember2024-03-310001504461ngl:ButaneInventoryMember2023-03-310001504461ngl:BiodieselInventoryMember2024-03-310001504461ngl:BiodieselInventoryMember2023-03-310001504461ngl:DieselInventoryMember2024-03-310001504461ngl:DieselInventoryMember2023-03-310001504461ngl:OtherNaturalGasLiquidsMember2024-03-310001504461ngl:OtherNaturalGasLiquidsMember2023-03-310001504461ngl:EthanolInventoryMember2023-03-310001504461ngl:WaterSolutionsSegmentMemberngl:WaterServicesAndLandCompanyNo.1Member2024-03-310001504461ngl:WaterSolutionsSegmentMemberngl:WaterServicesAndLandCompanyNo.1Member2023-03-310001504461ngl:WaterSolutionsSegmentMemberngl:WaterServicesAndLandCompanyNo2Member2024-03-310001504461ngl:WaterSolutionsSegmentMemberngl:WaterServicesAndLandCompanyNo2Member2023-03-310001504461ngl:WaterSolutionsSegmentMemberngl:WaterServicesAndLandCompanyNo3Member2024-03-310001504461ngl:WaterSolutionsSegmentMemberngl:WaterServicesAndLandCompanyNo3Member2023-03-310001504461ngl:LiquidsLogisticsSegmentMemberngl:NaturalGasLiquidsTerminalCompanyMember2024-03-310001504461ngl:LiquidsLogisticsSegmentMemberngl:NaturalGasLiquidsTerminalCompanyMember2023-03-310001504461us-gaap:CorporateNonSegmentMemberngl:AircraftCompanyMemberus-gaap:RelatedPartyMember2024-03-310001504461us-gaap:CorporateNonSegmentMemberngl:AircraftCompanyMemberus-gaap:RelatedPartyMember2023-03-310001504461us-gaap:OtherNoncurrentAssetsMember2024-03-310001504461us-gaap:OtherNoncurrentAssetsMember2023-03-310001504461srt:CrudeOilMember2023-03-310001504461srt:CrudeOilMember2024-03-310001504461us-gaap:PrepaidExpensesAndOtherCurrentAssetsMember2024-03-310001504461us-gaap:PrepaidExpensesAndOtherCurrentAssetsMember2023-03-310001504461srt:MinimumMemberngl:WaterTreatmentFacilitiesAndEquipmentMember2024-03-310001504461srt:MaximumMemberngl:WaterTreatmentFacilitiesAndEquipmentMember2024-03-310001504461ngl:WaterTreatmentFacilitiesAndEquipmentMember2024-03-310001504461ngl:WaterTreatmentFacilitiesAndEquipmentMember2023-03-310001504461srt:MinimumMemberngl:PipelineandRelatedFacilitiesMember2024-03-310001504461ngl:PipelineandRelatedFacilitiesMembersrt:MaximumMember2024-03-310001504461ngl:PipelineandRelatedFacilitiesMember2024-03-310001504461ngl:PipelineandRelatedFacilitiesMember2023-03-310001504461srt:MinimumMemberngl:CrudeOilTanksAndRelatedEquipmentMember2024-03-310001504461ngl:CrudeOilTanksAndRelatedEquipmentMembersrt:MaximumMember2024-03-310001504461ngl:CrudeOilTanksAndRelatedEquipmentMember2024-03-310001504461ngl:CrudeOilTanksAndRelatedEquipmentMember2023-03-310001504461ngl:NaturalGasLiquidsTerminalAssetsMembersrt:MinimumMember2024-03-310001504461ngl:NaturalGasLiquidsTerminalAssetsMembersrt:MaximumMember2024-03-310001504461ngl:NaturalGasLiquidsTerminalAssetsMember2024-03-310001504461ngl:NaturalGasLiquidsTerminalAssetsMember2023-03-310001504461srt:MinimumMemberus-gaap:LeaseholdsAndLeaseholdImprovementsMember2024-03-310001504461us-gaap:LeaseholdsAndLeaseholdImprovementsMembersrt:MaximumMember2024-03-310001504461us-gaap:LeaseholdsAndLeaseholdImprovementsMember2024-03-310001504461us-gaap:LeaseholdsAndLeaseholdImprovementsMember2023-03-310001504461us-gaap:TransportationEquipmentMembersrt:MinimumMember2024-03-310001504461us-gaap:TransportationEquipmentMembersrt:MaximumMember2024-03-310001504461us-gaap:TransportationEquipmentMember2024-03-310001504461us-gaap:TransportationEquipmentMember2023-03-310001504461us-gaap:LandMember2024-03-310001504461us-gaap:LandMember2023-03-310001504461us-gaap:TechnologyEquipmentMembersrt:MinimumMember2024-03-310001504461us-gaap:TechnologyEquipmentMembersrt:MaximumMember2024-03-310001504461us-gaap:TechnologyEquipmentMember2024-03-310001504461us-gaap:TechnologyEquipmentMember2023-03-310001504461ngl:TankBottomsAndLinefillMember2024-03-310001504461ngl:TankBottomsAndLinefillMember2023-03-310001504461srt:MinimumMemberus-gaap:OtherMachineryAndEquipmentMember2024-03-310001504461us-gaap:OtherMachineryAndEquipmentMembersrt:MaximumMember2024-03-310001504461us-gaap:OtherMachineryAndEquipmentMember2024-03-310001504461us-gaap:OtherMachineryAndEquipmentMember2023-03-310001504461us-gaap:ConstructionInProgressMember2024-03-310001504461us-gaap:ConstructionInProgressMember2023-03-310001504461ngl:WaterSolutionsSegmentMember2023-04-012024-03-310001504461ngl:WaterSolutionsSegmentMember2022-04-012023-03-310001504461ngl:WaterSolutionsSegmentMember2021-04-012022-03-310001504461ngl:CrudeOilLogisticsSegmentMember2023-04-012024-03-310001504461ngl:CrudeOilLogisticsSegmentMember2022-04-012023-03-310001504461ngl:CrudeOilLogisticsSegmentMember2021-04-012022-03-310001504461ngl:LiquidsLogisticsSegmentMember2022-04-012023-03-310001504461ngl:LiquidsLogisticsSegmentMember2021-04-012022-03-310001504461ngl:NaturalGasLiquidsTerminalsMember2023-04-012024-03-310001504461ngl:WaterSolutionsSegmentMemberngl:InactiveSaltwaterDisposalFacilitiesMember2021-04-012022-03-310001504461ngl:WriteDownOfCertainCrudeAssetsMemberngl:CrudeOilLogisticsSegmentMember2021-04-012022-03-310001504461ngl:WaterSolutionsSegmentMember2022-03-310001504461ngl:CrudeOilLogisticsSegmentMember2022-03-310001504461ngl:LiquidsLogisticsSegmentMember2022-03-310001504461ngl:WaterSolutionsSegmentMember2023-03-310001504461ngl:CrudeOilLogisticsSegmentMember2023-03-310001504461ngl:LiquidsLogisticsSegmentMember2023-03-310001504461ngl:WaterSolutionsSegmentMember2024-03-310001504461ngl:CrudeOilLogisticsSegmentMember2024-03-310001504461ngl:PacificNorthwestNaturalGasLiquidsTerminalsMember2023-07-242023-07-240001504461ngl:CrudeOilLogisticsSegmentMember2024-01-010001504461ngl:LiquidsLogisticsSegmentMember2024-01-010001504461ngl:CrudeOilLogisticsSegmentMember2023-01-010001504461ngl:LiquidsLogisticsSegmentMember2023-01-010001504461ngl:CrudeOilLogisticsSegmentMember2022-01-010001504461us-gaap:CustomerRelationshipsMember2024-03-310001504461us-gaap:CustomerRelationshipsMember2023-03-310001504461us-gaap:CustomerContractsMember2024-03-310001504461us-gaap:CustomerContractsMember2023-03-310001504461us-gaap:ContractBasedIntangibleAssetsMember2024-03-310001504461us-gaap:ContractBasedIntangibleAssetsMember2023-03-310001504461us-gaap:UseRightsMember2024-03-310001504461us-gaap:UseRightsMember2023-03-310001504461ngl:DebtIssuanceCostsMember2024-03-310001504461ngl:DebtIssuanceCostsMember2023-03-310001504461ngl:ExecutoryContractsAndOtherAgreementsMember2024-03-310001504461ngl:ExecutoryContractsAndOtherAgreementsMember2023-03-310001504461us-gaap:ServiceAgreementsMember2024-03-310001504461us-gaap:ServiceAgreementsMember2023-03-310001504461us-gaap:NoncompeteAgreementsMember2024-03-310001504461us-gaap:NoncompeteAgreementsMember2023-03-310001504461us-gaap:TradeNamesMember2024-03-310001504461us-gaap:TradeNamesMember2023-03-310001504461ngl:WaterSolutionsSegmentMemberus-gaap:TradeNamesMember2023-04-012024-03-310001504461ngl:GainLossOnDispositionOfAssetsMember2023-04-012024-03-310001504461us-gaap:CustomerRelationshipsMemberngl:CrudeOilLogisticsSegmentMember2022-04-012023-03-310001504461ngl:GainLossOnDispositionOfAssetsMember2022-04-012023-03-310001504461ngl:WaterSolutionsSegmentMemberus-gaap:UseRightsMember2021-04-012022-03-310001504461ngl:GainLossOnDispositionOfAssetsMember2021-04-012022-03-310001504461us-gaap:CorporateNonSegmentMemberngl:DebtIssuanceCostsMemberngl:SawtoothCreditFacilityMember2021-04-012022-03-310001504461ngl:DepreciationAndAmortizationMember2023-04-012024-03-310001504461ngl:DepreciationAndAmortizationMember2022-04-012023-03-310001504461ngl:DepreciationAndAmortizationMember2021-04-012022-03-310001504461us-gaap:CostOfSalesMember2023-04-012024-03-310001504461us-gaap:CostOfSalesMember2022-04-012023-03-310001504461us-gaap:CostOfSalesMember2021-04-012022-03-310001504461us-gaap:InterestExpenseMember2023-04-012024-03-310001504461us-gaap:InterestExpenseMember2022-04-012023-03-310001504461us-gaap:InterestExpenseMember2021-04-012022-03-310001504461us-gaap:OperatingExpenseMember2023-04-012024-03-310001504461us-gaap:OperatingExpenseMember2022-04-012023-03-310001504461us-gaap:OperatingExpenseMember2021-04-012022-03-310001504461us-gaap:RevolvingCreditFacilityMember2024-03-310001504461us-gaap:RevolvingCreditFacilityMember2023-03-310001504461ngl:TermLoanBCreditFacilityMember2024-03-310001504461ngl:TermLoanBCreditFacilityMember2023-03-310001504461ngl:SeniorSecuredNotes75PercentDue2026Member2024-03-310001504461ngl:SeniorSecuredNotes75PercentDue2026Member2023-03-310001504461ngl:SeniorSecuredNotes8.125PercentDue2029Member2024-03-310001504461ngl:SeniorSecuredNotes8.125PercentDue2029Member2023-03-310001504461ngl:SeniorSecuredNotes8.375PercentDue2032Member2024-03-310001504461ngl:SeniorSecuredNotes8.375PercentDue2032Member2023-03-310001504461ngl:SeniorNotes6125PercentDue2025Member2024-03-310001504461ngl:SeniorNotes6125PercentDue2025Member2023-03-310001504461ngl:SeniorNotes75PercentDue2026Member2024-03-310001504461ngl:SeniorNotes75PercentDue2026Member2023-03-3100015044612024-02-020001504461ngl:NewSeniorSecuredNotesDomain2024-02-020001504461ngl:SeniorSecuredNotes8.125PercentDue2029Member2024-02-020001504461ngl:SeniorSecuredNotes8.375PercentDue2032Member2024-02-020001504461ngl:TermLoanBCreditFacilityMember2024-02-020001504461us-gaap:RevolvingCreditFacilityMember2024-02-022024-02-020001504461us-gaap:RevolvingCreditFacilityMemberus-gaap:LetterOfCreditMember2024-03-310001504461us-gaap:RevolvingCreditFacilityMemberus-gaap:PrimeRateMember2023-04-012024-03-310001504461ngl:TermLoanBCreditFacilityMember2024-02-022024-02-020001504461ngl:TermLoanBCreditFacilityMemberus-gaap:SecuredOvernightFinancingRateSofrOvernightIndexSwapRateMember2023-04-012024-03-310001504461ngl:SeniorSecuredNotes75PercentDue2026Member2021-02-040001504461ngl:SeniorSecuredNotes75PercentDue2026Member2021-02-042021-02-040001504461ngl:RedemptionsMemberngl:SeniorSecuredNotesMember2023-04-012024-03-310001504461ngl:RedemptionsMemberngl:SeniorSecuredNotes75PercentDue2026Member2024-03-310001504461ngl:RedemptionsMemberngl:SeniorSecuredNotes75PercentDue2026Member2023-04-012024-03-310001504461ngl:SeniorSecuredNotesMember2024-02-022024-02-020001504461ngl:SeniorNotes75PercentDue2023Member2016-10-240001504461ngl:SeniorNotes6125PercentDue2025Member2017-02-220001504461ngl:SeniorNotes75PercentDue2026Member2019-04-090001504461ngl:RedemptionsMemberngl:SeniorNotes75PercentDue2026Member2024-02-020001504461ngl:RepurchasesMemberus-gaap:SeniorSubordinatedNotesMember2023-04-012024-03-310001504461ngl:RepurchasesMemberngl:SeniorNotes75PercentDue2023Member2023-04-012024-03-310001504461ngl:RepurchasesMemberngl:SeniorNotes75PercentDue2023Member2022-04-012023-03-310001504461ngl:RepurchasesMemberngl:SeniorNotes75PercentDue2023Member2021-04-012022-03-310001504461ngl:SeniorNotes6125PercentDue2025Memberngl:RepurchasesMember2023-04-012024-03-310001504461ngl:SeniorNotes6125PercentDue2025Memberngl:RepurchasesMember2022-04-012023-03-310001504461ngl:SeniorNotes6125PercentDue2025Memberngl:RepurchasesMember2021-04-012022-03-310001504461ngl:RepurchasesMemberngl:SeniorNotes75PercentDue2026Member2023-04-012024-03-310001504461ngl:RepurchasesMemberngl:SeniorNotes75PercentDue2026Member2022-04-012023-03-310001504461ngl:RepurchasesMemberngl:SeniorNotes75PercentDue2026Member2021-04-012022-03-310001504461ngl:RedemptionsMemberus-gaap:SeniorSubordinatedNotesMember2023-04-012024-03-310001504461ngl:RedemptionsMemberngl:SeniorNotes75PercentDue2023Member2024-03-310001504461ngl:RedemptionsMemberngl:SeniorNotes75PercentDue2023Member2023-03-310001504461ngl:RedemptionsMemberngl:SeniorNotes75PercentDue2023Member2023-04-012024-03-310001504461ngl:RedemptionsMemberngl:SeniorNotes75PercentDue2023Member2022-04-012023-03-310001504461ngl:SeniorNotes6125PercentDue2025Memberngl:RedemptionsMember2024-03-310001504461ngl:SeniorNotes6125PercentDue2025Memberngl:RedemptionsMember2023-03-310001504461ngl:SeniorNotes6125PercentDue2025Memberngl:RedemptionsMember2023-04-012024-03-310001504461ngl:SeniorNotes6125PercentDue2025Memberngl:RedemptionsMember2022-04-012023-03-310001504461ngl:RedemptionsMemberngl:SeniorNotes75PercentDue2026Member2024-03-310001504461ngl:RedemptionsMemberngl:SeniorNotes75PercentDue2026Member2023-03-310001504461ngl:RedemptionsMemberngl:SeniorNotes75PercentDue2026Member2023-04-012024-03-310001504461ngl:RedemptionsMemberngl:SeniorNotes75PercentDue2026Member2022-04-012023-03-310001504461us-gaap:SeniorNotesMember2024-03-310001504461ngl:ServicesRenderedMember2018-07-232018-08-010001504461ngl:FraudulentMisrepresentationMember2018-07-232018-08-0100015044612023-02-062023-02-1500015044612023-04-012023-06-300001504461us-gaap:AccruedLiabilitiesMember2024-03-310001504461us-gaap:CustomerContractsMember2023-04-012024-03-310001504461ngl:PipelineCapacityAgreementsMember2024-03-310001504461srt:CrudeOilMemberngl:FixedPriceMember2024-03-310001504461srt:NaturalGasLiquidsReservesMemberngl:FixedPriceMember2024-03-310001504461ngl:IndexPriceMembersrt:CrudeOilMember2024-03-310001504461ngl:IndexPriceMembersrt:NaturalGasLiquidsReservesMember2024-03-310001504461srt:CrudeOilMemberngl:FixedPriceMember2024-03-310001504461ngl:FixedPriceMembersrt:NaturalGasLiquidsReservesMember2024-03-310001504461srt:CrudeOilMemberngl:IndexPriceMember2024-03-310001504461ngl:IndexPriceMembersrt:NaturalGasLiquidsReservesMember2024-03-310001504461us-gaap:PrepaidExpensesAndOtherCurrentAssetsMember2024-03-310001504461ngl:HillstoneSubsidyPaymentMember2022-04-012023-03-310001504461ngl:HillstoneSubsidyPaymentMember2021-04-012022-03-310001504461us-gaap:LimitedPartnerMemberngl:NGLEnergyPartnersLPMember2024-03-310001504461us-gaap:GeneralPartnerMember2021-04-012022-03-310001504461us-gaap:GeneralPartnerMember2022-04-012023-03-310001504461us-gaap:GeneralPartnerMember2023-04-012024-03-3100015044612019-08-300001504461ngl:SeriesBPreferredStockSeriesCPreferredStockAndSeriesDPreferredStock.Member2024-02-060001504461us-gaap:SeriesBPreferredStockMember2024-03-310001504461us-gaap:SeriesBPreferredStockMember2023-04-012024-03-310001504461us-gaap:SeriesBPreferredStockMember2024-02-272024-02-270001504461us-gaap:SeriesBPreferredStockMember2024-01-012024-03-310001504461us-gaap:SeriesBPreferredStockMember2021-01-162024-03-310001504461us-gaap:SeriesCPreferredStockMember2024-03-310001504461us-gaap:SeriesCPreferredStockMember2023-04-012024-03-310001504461us-gaap:SeriesCPreferredStockMember2024-02-272024-02-270001504461us-gaap:SeriesCPreferredStockMember2024-01-012024-03-310001504461us-gaap:SeriesCPreferredStockMember2021-01-162024-03-310001504461us-gaap:SeriesCPreferredStockMemberus-gaap:SubsequentEventMember2024-04-152024-04-150001504461ngl:ClassDPreferredUnitsFirstIssuanceMemberngl:PremiumWarrantsMember2019-07-020001504461ngl:ParWarrantsMemberngl:ClassDPreferredUnitsFirstIssuanceMember2019-07-020001504461ngl:ClassDPreferredUnitsSecondIssuanceMemberngl:PremiumWarrantsMember2019-10-310001504461ngl:ParWarrantsMemberngl:ClassDPreferredUnitsSecondIssuanceMember2019-10-310001504461us-gaap:SeriesDPreferredStockMember2023-04-012024-03-310001504461us-gaap:SeriesDPreferredStockMember2024-02-272024-02-270001504461us-gaap:SeriesDPreferredStockMember2024-01-012024-03-310001504461us-gaap:SeriesDPreferredStockMember2021-01-162024-03-310001504461us-gaap:SubsequentEventMemberus-gaap:SeriesDPreferredStockMember2024-07-012024-07-010001504461us-gaap:SeriesDPreferredStockMember2019-07-022019-10-310001504461us-gaap:SubsequentEventMemberus-gaap:PreferredStockMember2024-04-040001504461us-gaap:SeriesBPreferredStockMemberus-gaap:SubsequentEventMember2024-04-182024-04-180001504461us-gaap:SeriesCPreferredStockMemberus-gaap:SubsequentEventMember2024-04-182024-04-180001504461us-gaap:SubsequentEventMemberus-gaap:SeriesDPreferredStockMember2024-04-040001504461us-gaap:SubsequentEventMemberus-gaap:SeriesDPreferredStockMember2024-04-182024-04-180001504461us-gaap:SeriesBPreferredStockMemberus-gaap:SubsequentEventMember2024-04-252024-04-250001504461us-gaap:SeriesCPreferredStockMemberus-gaap:SubsequentEventMember2024-04-252024-04-250001504461us-gaap:SubsequentEventMemberus-gaap:SeriesDPreferredStockMember2024-04-252024-04-250001504461us-gaap:RestrictedStockUnitsRSUMember2023-04-012024-03-310001504461us-gaap:RestrictedStockUnitsRSUMember2024-03-310001504461us-gaap:RestrictedStockUnitsRSUMember2023-03-310001504461us-gaap:RestrictedStockUnitsRSUMember2022-04-012023-03-310001504461us-gaap:RestrictedStockUnitsRSUMember2021-04-012022-03-310001504461us-gaap:FairValueInputsLevel1Memberus-gaap:CommodityContractMember2024-03-310001504461us-gaap:FairValueInputsLevel1Memberus-gaap:CommodityContractMember2023-03-310001504461us-gaap:CommodityContractMemberus-gaap:FairValueInputsLevel2Member2024-03-310001504461us-gaap:CommodityContractMemberus-gaap:FairValueInputsLevel2Member2023-03-310001504461us-gaap:CommodityContractMember2024-03-310001504461us-gaap:CommodityContractMember2023-03-310001504461us-gaap:CommodityContractMemberus-gaap:PrepaidExpensesAndOtherCurrentAssetsMember2024-03-310001504461us-gaap:CommodityContractMemberus-gaap:PrepaidExpensesAndOtherCurrentAssetsMember2023-03-310001504461us-gaap:CommodityContractMemberus-gaap:OtherNoncurrentAssetsMember2024-03-310001504461us-gaap:CommodityContractMemberus-gaap:OtherNoncurrentAssetsMember2023-03-310001504461us-gaap:CommodityContractMemberus-gaap:AccruedLiabilitiesMember2024-03-310001504461us-gaap:CommodityContractMemberus-gaap:AccruedLiabilitiesMember2023-03-310001504461us-gaap:CommodityContractMemberus-gaap:OtherNoncurrentLiabilitiesMember2024-03-310001504461us-gaap:CommodityContractMemberus-gaap:OtherNoncurrentLiabilitiesMember2023-03-310001504461us-gaap:FixedPriceContractMemberus-gaap:ShortMembersrt:CrudeOilMember2024-03-310001504461us-gaap:FixedPriceContractMembersrt:CrudeOilMember2024-03-310001504461us-gaap:FixedPriceContractMemberus-gaap:LongMemberus-gaap:PublicUtilitiesInventoryPropaneMember2024-03-310001504461us-gaap:FixedPriceContractMemberus-gaap:PublicUtilitiesInventoryPropaneMember2024-03-310001504461us-gaap:FixedPriceContractMemberus-gaap:ShortMemberngl:RefinedProductsMember2024-03-310001504461us-gaap:FixedPriceContractMemberngl:RefinedProductsMember2024-03-310001504461us-gaap:FixedPriceContractMemberus-gaap:ShortMemberngl:ButaneMember2024-03-310001504461us-gaap:FixedPriceContractMemberngl:ButaneMember2024-03-310001504461us-gaap:InterestRateSwapMember2024-03-310001504461us-gaap:OtherContractMember2024-03-310001504461us-gaap:FixedPriceContractMemberus-gaap:LongMembersrt:CrudeOilMember2023-03-310001504461us-gaap:FixedPriceContractMembersrt:CrudeOilMember2023-03-310001504461us-gaap:FixedPriceContractMemberus-gaap:ShortMemberus-gaap:PublicUtilitiesInventoryPropaneMember2023-03-310001504461us-gaap:FixedPriceContractMemberus-gaap:PublicUtilitiesInventoryPropaneMember2023-03-310001504461us-gaap:FixedPriceContractMemberus-gaap:ShortMemberngl:RefinedProductsMember2023-03-310001504461us-gaap:FixedPriceContractMemberngl:RefinedProductsMember2023-03-310001504461us-gaap:FixedPriceContractMemberus-gaap:ShortMemberngl:ButaneMember2023-03-310001504461us-gaap:FixedPriceContractMemberngl:ButaneMember2023-03-310001504461us-gaap:OtherContractMember2023-03-310001504461us-gaap:InterestRateSwapMember2023-04-012024-03-310001504461us-gaap:CommodityContractMember2023-04-012024-03-310001504461us-gaap:CommodityContractMember2022-04-012023-03-310001504461us-gaap:CommodityContractMember2021-04-012022-03-310001504461us-gaap:SeriesBPreferredStockMemberus-gaap:SecuredOvernightFinancingRateSofrOvernightIndexSwapRateMember2023-04-012024-03-310001504461us-gaap:SubsequentEventMemberus-gaap:SecuredOvernightFinancingRateSofrOvernightIndexSwapRateMemberus-gaap:SeriesCPreferredStockMember2024-04-152024-04-150001504461us-gaap:SubsequentEventMemberus-gaap:SecuredOvernightFinancingRateSofrOvernightIndexSwapRateMemberus-gaap:SeriesDPreferredStockMember2024-07-012024-07-010001504461ngl:WaterSolutionsSegmentMemberus-gaap:OperatingSegmentsMemberngl:ServiceFeesMember2023-04-012024-03-310001504461ngl:WaterSolutionsSegmentMemberus-gaap:OperatingSegmentsMemberngl:ServiceFeesMember2022-04-012023-03-310001504461ngl:WaterSolutionsSegmentMemberus-gaap:OperatingSegmentsMemberngl:ServiceFeesMember2021-04-012022-03-310001504461ngl:WaterSolutionsSegmentMemberus-gaap:OperatingSegmentsMembersrt:CrudeOilMember2023-04-012024-03-310001504461ngl:WaterSolutionsSegmentMemberus-gaap:OperatingSegmentsMembersrt:CrudeOilMember2022-04-012023-03-310001504461ngl:WaterSolutionsSegmentMemberus-gaap:OperatingSegmentsMembersrt:CrudeOilMember2021-04-012022-03-310001504461ngl:WaterSolutionsSegmentMemberus-gaap:OperatingSegmentsMemberngl:WaterRevenuesMember2023-04-012024-03-310001504461ngl:WaterSolutionsSegmentMemberus-gaap:OperatingSegmentsMemberngl:WaterRevenuesMember2022-04-012023-03-310001504461ngl:WaterSolutionsSegmentMemberus-gaap:OperatingSegmentsMemberngl:WaterRevenuesMember2021-04-012022-03-310001504461ngl:WaterSolutionsSegmentMemberngl:OtherRevenuesMemberus-gaap:OperatingSegmentsMember2023-04-012024-03-310001504461ngl:WaterSolutionsSegmentMemberngl:OtherRevenuesMemberus-gaap:OperatingSegmentsMember2022-04-012023-03-310001504461ngl:WaterSolutionsSegmentMemberngl:OtherRevenuesMemberus-gaap:OperatingSegmentsMember2021-04-012022-03-310001504461ngl:CrudeOilLogisticsSegmentMemberus-gaap:OperatingSegmentsMembersrt:CrudeOilMember2023-04-012024-03-310001504461ngl:CrudeOilLogisticsSegmentMemberus-gaap:OperatingSegmentsMembersrt:CrudeOilMember2022-04-012023-03-310001504461ngl:CrudeOilLogisticsSegmentMemberus-gaap:OperatingSegmentsMembersrt:CrudeOilMember2021-04-012022-03-310001504461ngl:CrudeOilTransportationAndOtherMemberngl:CrudeOilLogisticsSegmentMemberus-gaap:OperatingSegmentsMember2023-04-012024-03-310001504461ngl:CrudeOilTransportationAndOtherMemberngl:CrudeOilLogisticsSegmentMemberus-gaap:OperatingSegmentsMember2022-04-012023-03-310001504461ngl:CrudeOilTransportationAndOtherMemberngl:CrudeOilLogisticsSegmentMemberus-gaap:OperatingSegmentsMember2021-04-012022-03-310001504461us-gaap:IntersegmentEliminationMemberngl:CrudeOilLogisticsSegmentMember2023-04-012024-03-310001504461us-gaap:IntersegmentEliminationMemberngl:CrudeOilLogisticsSegmentMember2022-04-012023-03-310001504461us-gaap:IntersegmentEliminationMemberngl:CrudeOilLogisticsSegmentMember2021-04-012022-03-310001504461ngl:LiquidsLogisticsSegmentMemberus-gaap:OperatingSegmentsMemberngl:RefinedProductsMember2023-04-012024-03-310001504461ngl:LiquidsLogisticsSegmentMemberus-gaap:OperatingSegmentsMemberngl:RefinedProductsMember2022-04-012023-03-310001504461ngl:LiquidsLogisticsSegmentMemberus-gaap:OperatingSegmentsMemberngl:RefinedProductsMember2021-04-012022-03-310001504461ngl:LiquidsLogisticsSegmentMemberus-gaap:OperatingSegmentsMemberus-gaap:PublicUtilitiesInventoryPropaneMember2023-04-012024-03-310001504461ngl:LiquidsLogisticsSegmentMemberus-gaap:OperatingSegmentsMemberus-gaap:PublicUtilitiesInventoryPropaneMember2022-04-012023-03-310001504461ngl:LiquidsLogisticsSegmentMemberus-gaap:OperatingSegmentsMemberus-gaap:PublicUtilitiesInventoryPropaneMember2021-04-012022-03-310001504461ngl:LiquidsLogisticsSegmentMemberus-gaap:OperatingSegmentsMemberngl:ButaneMember2023-04-012024-03-310001504461ngl:LiquidsLogisticsSegmentMemberus-gaap:OperatingSegmentsMemberngl:ButaneMember2022-04-012023-03-310001504461ngl:LiquidsLogisticsSegmentMemberus-gaap:OperatingSegmentsMemberngl:ButaneMember2021-04-012022-03-310001504461ngl:LiquidsLogisticsSegmentMemberus-gaap:OperatingSegmentsMemberngl:OtherProductsOrServicesMember2023-04-012024-03-310001504461ngl:LiquidsLogisticsSegmentMemberus-gaap:OperatingSegmentsMemberngl:OtherProductsOrServicesMember2022-04-012023-03-310001504461ngl:LiquidsLogisticsSegmentMemberus-gaap:OperatingSegmentsMemberngl:OtherProductsOrServicesMember2021-04-012022-03-310001504461ngl:LiquidsLogisticsSegmentMemberngl:OtherRevenuesMemberus-gaap:OperatingSegmentsMember2023-04-012024-03-310001504461ngl:LiquidsLogisticsSegmentMemberngl:OtherRevenuesMemberus-gaap:OperatingSegmentsMember2022-04-012023-03-310001504461ngl:LiquidsLogisticsSegmentMemberngl:OtherRevenuesMemberus-gaap:OperatingSegmentsMember2021-04-012022-03-310001504461us-gaap:IntersegmentEliminationMemberngl:LiquidsLogisticsSegmentMember2023-04-012024-03-310001504461us-gaap:IntersegmentEliminationMemberngl:LiquidsLogisticsSegmentMember2022-04-012023-03-310001504461us-gaap:IntersegmentEliminationMemberngl:LiquidsLogisticsSegmentMember2021-04-012022-03-310001504461us-gaap:NonUsMemberngl:LiquidsLogisticsSegmentMember2023-04-012024-03-310001504461us-gaap:NonUsMemberngl:LiquidsLogisticsSegmentMember2022-04-012023-03-310001504461us-gaap:NonUsMemberngl:LiquidsLogisticsSegmentMember2021-04-012022-03-310001504461ngl:WaterSolutionsSegmentMemberus-gaap:OperatingSegmentsMember2024-03-310001504461ngl:WaterSolutionsSegmentMemberus-gaap:OperatingSegmentsMember2023-03-310001504461ngl:CrudeOilLogisticsSegmentMemberus-gaap:OperatingSegmentsMember2024-03-310001504461ngl:CrudeOilLogisticsSegmentMemberus-gaap:OperatingSegmentsMember2023-03-310001504461ngl:LiquidsLogisticsSegmentMemberus-gaap:OperatingSegmentsMember2024-03-310001504461ngl:LiquidsLogisticsSegmentMemberus-gaap:OperatingSegmentsMember2023-03-310001504461us-gaap:CorporateNonSegmentMember2024-03-310001504461us-gaap:CorporateNonSegmentMember2023-03-310001504461us-gaap:NonUsMemberngl:LiquidsLogisticsSegmentMember2024-03-310001504461us-gaap:NonUsMemberngl:LiquidsLogisticsSegmentMember2023-03-310001504461us-gaap:RelatedPartyMemberngl:EquityMethodInvestmentMember2023-04-012024-03-310001504461us-gaap:RelatedPartyMemberngl:EquityMethodInvestmentMember2022-04-012023-03-310001504461us-gaap:RelatedPartyMemberngl:EquityMethodInvestmentMember2021-04-012022-03-310001504461us-gaap:RelatedPartyMembersrt:AffiliatedEntityMember2023-04-012024-03-310001504461us-gaap:RelatedPartyMembersrt:AffiliatedEntityMember2022-04-012023-03-310001504461us-gaap:RelatedPartyMembersrt:AffiliatedEntityMember2021-04-012022-03-310001504461us-gaap:RelatedPartyMemberngl:EquityMethodInvestmentMember2024-03-310001504461us-gaap:RelatedPartyMemberngl:EquityMethodInvestmentMember2023-03-310001504461us-gaap:GeneralPartnerMemberus-gaap:RelatedPartyMember2024-03-310001504461us-gaap:GeneralPartnerMemberus-gaap:RelatedPartyMember2023-03-310001504461us-gaap:RelatedPartyMembersrt:AffiliatedEntityMember2024-03-310001504461us-gaap:RelatedPartyMembersrt:AffiliatedEntityMember2023-03-310001504461us-gaap:RelatedPartyMember2023-12-3100015044612024-04-012024-03-3100015044612025-04-012024-03-3100015044612026-04-012024-03-3100015044612027-04-012024-03-3100015044612028-04-012024-03-3100015044612029-04-012024-03-310001504461srt:MinimumMember2024-03-310001504461srt:MaximumMember2024-03-310001504461ngl:WaterSolutionsSegmentMemberus-gaap:LandMember2023-04-012024-03-310001504461us-gaap:LandMemberngl:CrudeOilLogisticsSegmentMember2022-04-012023-03-310001504461us-gaap:LandMemberngl:LiquidsLogisticsSegmentMember2022-04-012023-03-310001504461us-gaap:BuildingMemberngl:CrudeOilLogisticsSegmentMember2022-04-012023-03-3100015044612022-10-012022-12-3100015044612022-04-012022-06-300001504461ngl:EagleFordAssetsMember2023-06-210001504461ngl:EagleFordAssetsMember2023-06-212023-06-210001504461ngl:ParentCoMember2024-03-0600015044612024-03-062024-03-060001504461ngl:MidlandAssetsMember2023-03-310001504461ngl:MidlandAssetsMember2023-03-312023-03-310001504461ngl:AnticlineAssetsMember2023-07-250001504461ngl:AnticlineAssetsMember2023-07-252023-07-250001504461ngl:PermianAssetsMember2023-12-080001504461ngl:PermianAssetsMember2023-12-082023-12-080001504461ngl:PacificNorthwestNaturalGasLiquidsTerminalsMember2023-07-240001504461ngl:OtherNaturalGasLiquidsTerminalsMember2023-11-150001504461ngl:OtherNaturalGasLiquidsTerminalsMember2023-11-152023-11-150001504461ngl:MarineAssetsMember2023-03-302023-03-300001504461ngl:SawtoothMemberngl:SawtoothMember2021-06-180001504461ngl:SawtoothMember2021-06-182021-06-1800015044612021-06-182021-06-180001504461us-gaap:SubsequentEventMember2024-04-052024-04-050001504461us-gaap:SubsequentEventMemberngl:PermianAssetsMember2024-04-150001504461us-gaap:SubsequentEventMember2024-05-142024-05-140001504461us-gaap:SubsequentEventMember2024-05-140001504461us-gaap:SubsequentEventMember2024-04-182024-04-180001504461us-gaap:SubsequentEventMember2024-04-252024-04-250001504461us-gaap:InterestRateSwapMemberus-gaap:SubsequentEventMember2024-04-300001504461us-gaap:SubsequentEventMember2024-06-05
UNITED STATES
SECURITIES AND EXCHANGE COMMISSION
Washington, D.C. 20549
Form 10-K
(Mark One)
| | | | | |
| ☒ | ANNUAL REPORT PURSUANT TO SECTION 13 OR 15(d) OF THE SECURITIES EXCHANGE ACT OF 1934 |
For the fiscal year ended March 31, 2024
OR
| | | | | |
| ☐ | TRANSITION REPORT PURSUANT TO SECTION 13 OR 15(d) OF THE SECURITIES EXCHANGE ACT OF 1934 |
For the transition period from __________ to __________
Commission File Number: 001-35172
NGL Energy Partners LP
(Exact Name of Registrant as Specified in Its Charter)
| | | | | | | | | | | |
| Delaware | | 27-3427920 |
| (State or Other Jurisdiction of Incorporation or Organization) | | (I.R.S. Employer Identification No.) |
| | | |
| 6120 South Yale Avenue, Suite 1300 | | |
| Tulsa, | Oklahoma | | 74136 |
| (Address of Principal Executive Offices) | | (Zip Code) |
(918) 481-1119
(Registrant’s Telephone Number, Including Area Code)
Securities registered pursuant to Section 12(b) of the Act:
| | | | | | | | | | | | | | |
| Title of Each Class | | Trading Symbol(s) | | Name of Each Exchange on Which Registered |
| Common units representing Limited Partner Interests | | NGL | | New York Stock Exchange |
| Fixed-to-floating rate cumulative redeemable perpetual preferred units | | NGL-PB | | New York Stock Exchange |
| Fixed-to-floating rate cumulative redeemable perpetual preferred units | | NGL-PC | | New York Stock Exchange |
Securities registered pursuant to Section 12(g) of the Act: None
Indicate by check mark if the registrant is a well-known seasoned issuer, as defined in Rule 405 of the Securities Act. Yes ☒ No ☐
Indicate by check mark if the registrant is not required to file reports pursuant to Section 13 or Section 15(d) of the Act. Yes ☐ No ☒
Indicate by check mark whether the registrant (1) has filed all reports required to be filed by Section 13 or 15(d) of the Securities Exchange Act of 1934 during the preceding 12 months (or for such shorter period that the registrant was required to file such reports), and (2) has been subject to such filing requirements for the past 90 days. Yes ☒ No ☐
Indicate by check mark whether the registrant has submitted electronically every Interactive Data File required to be submitted pursuant to Rule 405 of Regulation S-T (§232.405 of this chapter) during the preceding 12 months (or for such shorter period that the registrant was required to submit such files). Yes ☒ No ☐
Indicate by check mark whether the registrant is a large accelerated filer, an accelerated filer, a non-accelerated filer, a smaller reporting company, or an emerging growth company. See the definitions of “large accelerated filer,” “accelerated filer,” “smaller reporting company,” and “emerging growth company” in Rule 12b-2 of the Exchange Act.
| | | | | | | | | | | | | | |
| Large accelerated filer | o | | Accelerated filer | x |
| Non-accelerated filer | o | | Smaller reporting company | ☐ |
| | | Emerging growth company | ☐ |
If an emerging growth company, indicate by check mark if the registrant has elected not to use the extended transition period for complying with any new or revised financial accounting standards provided pursuant to Section 13(a) of the Exchange Act. ☐
Indicate by check mark whether the registrant has filed a report on and attestation to its management’s assessment of the effectiveness of its internal control over financial reporting under Section 404(b) of the Sarbanes-Oxley Act (15 U.S.C. 7262(b)) by the registered public accounting firm that prepared or issued its audit report. ☒
If securities are registered pursuant to Section 12(b) of the Act, indicate by check mark whether the financial statements of the registrant included in the filing reflect the correction of an error to previously issued financial statements. ☒
Indicate by check mark whether any of those error corrections are restatements that required a recovery analysis of incentive-based compensation received by any of the registrant’s executive officers during the relevant recovery period pursuant to §240.10D-1(b). ☐
Indicate by check mark whether the registrant is a shell company (as defined in Rule 12b-2 of the Act). Yes ☐ No ☒
The aggregate market value at September 30, 2023 of the Common Units held by non-affiliates of the registrant, based on the reported closing price of the Common Units on the New York Stock Exchange on such date ($3.87 per Common Unit) was $400.6 million. For purposes of this computation, all executive officers, directors and 10% beneficial owners of the registrant are deemed to be affiliates. Such a determination should not be deemed an admission that such executive officers, directors and 10% beneficial owners are affiliates.
At June 4, 2024, there were 132,512,766 common units issued and outstanding.
TABLE OF CONTENTS
Forward-Looking Statements
This Annual Report on Form 10-K (“Annual Report”) contains various forward-looking statements and information that are based on NGL Energy Partners LP’s (“we,” “us,” “our,” or the “Partnership”) beliefs and those of our general partner (“GP”), as well as assumptions made by and information currently available to us. These forward-looking statements are identified as any statement that does not relate strictly to historical or current facts. Certain words in this Annual Report such as “anticipate,” “believe,” “could,” “estimate,” “expect,” “forecast,” “goal,” “intend,” “may,” “plan,” “project,” “will,” and similar expressions and statements regarding our plans and objectives for future operations, identify forward-looking statements. Although we and our GP believe such forward-looking statements are reasonable, neither we nor our GP can assure they will prove to be correct. Forward-looking statements are subject to a variety of risks, uncertainties and assumptions. If one or more of these risks or uncertainties materialize, or if underlying assumptions prove incorrect, our actual results may vary materially from those expected. Among the key risk factors that may affect our consolidated financial position and results of operations are:
•the prices of crude oil, natural gas liquids, gasoline, diesel, biodiesel, and energy prices generally;
•the general level of demand, and the availability of supply, for crude oil, natural gas liquids, gasoline, diesel, and biodiesel;
•the level of crude oil and natural gas drilling and production in areas where we have operations and facilities;
•the ability to obtain adequate supplies of products if an interruption in supply or transportation occurs and the availability of capacity to transport products to market areas;
•the effect of weather conditions on supply and demand for crude oil, natural gas liquids, gasoline, diesel, and biodiesel;
•the effect of natural disasters, earthquakes, hurricanes, tornados, lightning strikes, or other significant weather events;
•the availability of local, intrastate, and interstate transportation infrastructure with respect to our transportation services;
•the availability, price, and marketing of competing fuels;
•the effect of energy conservation efforts on product demand;
•energy efficiencies and technological trends;
•the issuance of executive orders, changes in applicable laws, regulations and policies, including tax, environmental, transportation, and employment regulations, or new interpretations by regulatory agencies concerning such laws and regulations and the effect of such laws, regulations and policies (now existing or in the future) on our business operations;
•the effect of executive orders and legislative and regulatory actions on hydraulic fracturing, water disposal and transportation, the treatment of flowback and produced water, seismic activity, and drilling and right-of-way access on federal and state lands;
•delays or restrictions in obtaining, utilizing or maintaining permits and/or rights-of-way by us or our customers;
•hazards or operating risks related to transporting and distributing petroleum products that may not be fully covered by insurance;
•the maturity of the crude oil, natural gas liquids, and refined products industries and competition from other markets;
•loss of key personnel;
•the impact of competition on our operations, including our ability to renew contracts with key customers;
•the ability to maintain or increase the margins we realize for our services;
•the ability to renew leases for our leased equipment and storage facilities;
•inflation, interest rates, and general economic conditions (including recessions and other future disruptions and volatility in the global credit markets, as well as the impact of these events on customers and suppliers);
•the nonpayment, nonperformance or bankruptcy by our counterparties;
•the availability and cost of capital and our ability to access certain capital sources;
•a deterioration of the credit and capital markets;
•the ability to successfully identify and complete accretive acquisitions and organic growth projects, and integrate acquired assets and businesses;
•the costs and effects of legal and administrative proceedings;
•changes in general economic conditions, including market and macroeconomic disruptions resulting from global pandemics and related governmental responses, and international military conflicts (such as the war in Ukraine and the conflict between Israel and Hamas);
•political pressure and influence of environmental groups upon policies and decisions related to the production, gathering, refining, processing, fractionation, transportation and sale of crude oil, refined products, natural gas, natural gas liquids, gasoline, diesel or biodiesel; and
•other risks and uncertainties, including those discussed under Part I, Item 1A–“Risk Factors.”
You should not put undue reliance on any forward-looking statements. All forward-looking statements speak only as of the date of this Annual Report. Except as may be required by state and federal securities laws, we undertake no obligation to publicly update or revise any forward-looking statements as a result of new information, future events, or otherwise. When considering forward-looking statements, please review the risks discussed under Part I, Item 1A–“Risk Factors.”
PART I
References in this Annual Report to (i) “NGL Energy Partners LP,” “we,” “us,” “our,” or the “Partnership” or similar terms refer to NGL Energy Partners LP and its operating subsidiaries, (ii) “NGL Energy Holdings LLC” or “general partner” refers to NGL Energy Holdings LLC, our general partner (“GP”), (iii) “NGL Energy Operating LLC” refers to NGL Energy Operating LLC, the direct operating subsidiary of NGL Energy Partners LP, and (iv) the “NGL Energy GP Investor Group” refers to, collectively, the 43 individuals and entities that own all of the outstanding membership interests in our GP.
We have presented operational data in Part I, Item 1–“Business” for the year ended March 31, 2024. Unless otherwise indicated, this data is as of March 31, 2024.
Item 1. Business
Overview
We are a diversified midstream energy partnership that transports, treats, recycles and disposes of produced and flowback water generated as part of the energy production process as well as transports, stores, markets and provides other logistics services for crude oil and liquid hydrocarbons. Originally formed in September 2010, we are a Delaware master limited partnership and our business is currently organized into the following three segments:
•Our Water Solutions segment transports, treats, recycles and disposes of produced and flowback water generated from crude oil and natural gas production. We also sell produced water for reuse and recycle and brackish non-potable water to our producer customers to be used in their crude oil exploration and production activities. As part of processing water, we aggregate and sell recovered crude oil, also known as skim oil. We also dispose of solids such as tank bottoms, drilling fluids and drilling muds and perform other ancillary services such as truck and frac tank washouts. Our activities in this segment are underpinned by long-term, fixed fee contracts and acreage dedications, some of which contain minimum volume commitments with leading oil and gas companies including large, investment grade producer customers.
•Our Crude Oil Logistics segment purchases crude oil from producers and marketers and transports it to refineries or for resale at pipeline injection stations, storage terminals, barge loading facilities, rail facilities, refineries, and other trade hubs, and provides storage, terminaling and transportation services through its owned assets. Our activities in this segment are supported by certain long-term, fixed rate contracts which include minimum volume commitments on our owned and leased pipelines and storage tanks.
•Our Liquids Logistics segment conducts supply operations for natural gas liquids, refined petroleum products and biodiesel to a broad range of commercial, retail and industrial customers across the United States and Canada. These operations are conducted through our 23 owned terminals, third-party storage and terminal facilities, nine common carrier pipelines and a fleet of leased railcars. We also provide services for marine exports of butane through our facility located in Chesapeake, Virginia, and we also own a propane pipeline in Michigan. We attempt to reduce our exposure to price fluctuations by using back-to-back physical contracts and pre-sale agreements that allow us to lock in a margin on a percentage of our winter volumes. We also enter into financially settled derivative contracts as economic hedges of our physical inventory, physical sales and physical purchase contracts.
Business Repositioning
Over the past several years, we have undertaken a number of important strategic actions in an effort to leverage the Partnership’s core areas of competitive strength and focus on generating stable, growing and predictable cash flows, while improving our credit profile. We believe our actions have substantially simplified our business mix and have allowed us to focus on what we believe are the core areas of our business and improved our overall financial position. These actions are expected to position us for sustained growth in the future.
For more information regarding our results of operations and reportable segments, see Part II, Item 7–“Management’s Discussion and Analysis of Financial Condition and Results of Operations” and Note 11 to our consolidated financial statements included in this Annual Report. For more information regarding our dispositions and acquisitions transactions and the impact to our operations, see Note 17 to our consolidated financial statements included in this current Annual Report and our Annual Reports on Form 10-K for the years ended March 31, 2023 and 2022.
Debt Refinancing
On February 2, 2024, we closed a debt refinancing transaction of $2.9 billion. The refinancing consisted of a private offering of $2.2 billion of senior secured notes, which includes $900.0 million of 8.125% senior secured notes due 2029 (“2029 Senior Secured Notes”) and $1.3 billion of 8.375% senior secured notes due 2032 (“2032 Senior Secured Notes”). We also entered into a new seven-year $700.0 million senior secured term loan “B” credit facility (“Term Loan B”).
In addition, in connection with the closing of the refinancing, our $600.0 million asset-based revolving credit facility (“ABL Facility”) was amended to extend the maturity and to make certain other changes to the terms thereof. No changes were made to the aggregate amount of commitments under the ABL Facility.
For additional information related to the 2029 Senior Secured Notes, 2032 Senior Secured Notes, Term Loan B and ABL Facility, see Note 7 to our consolidated financial statements included in this Annual Report.
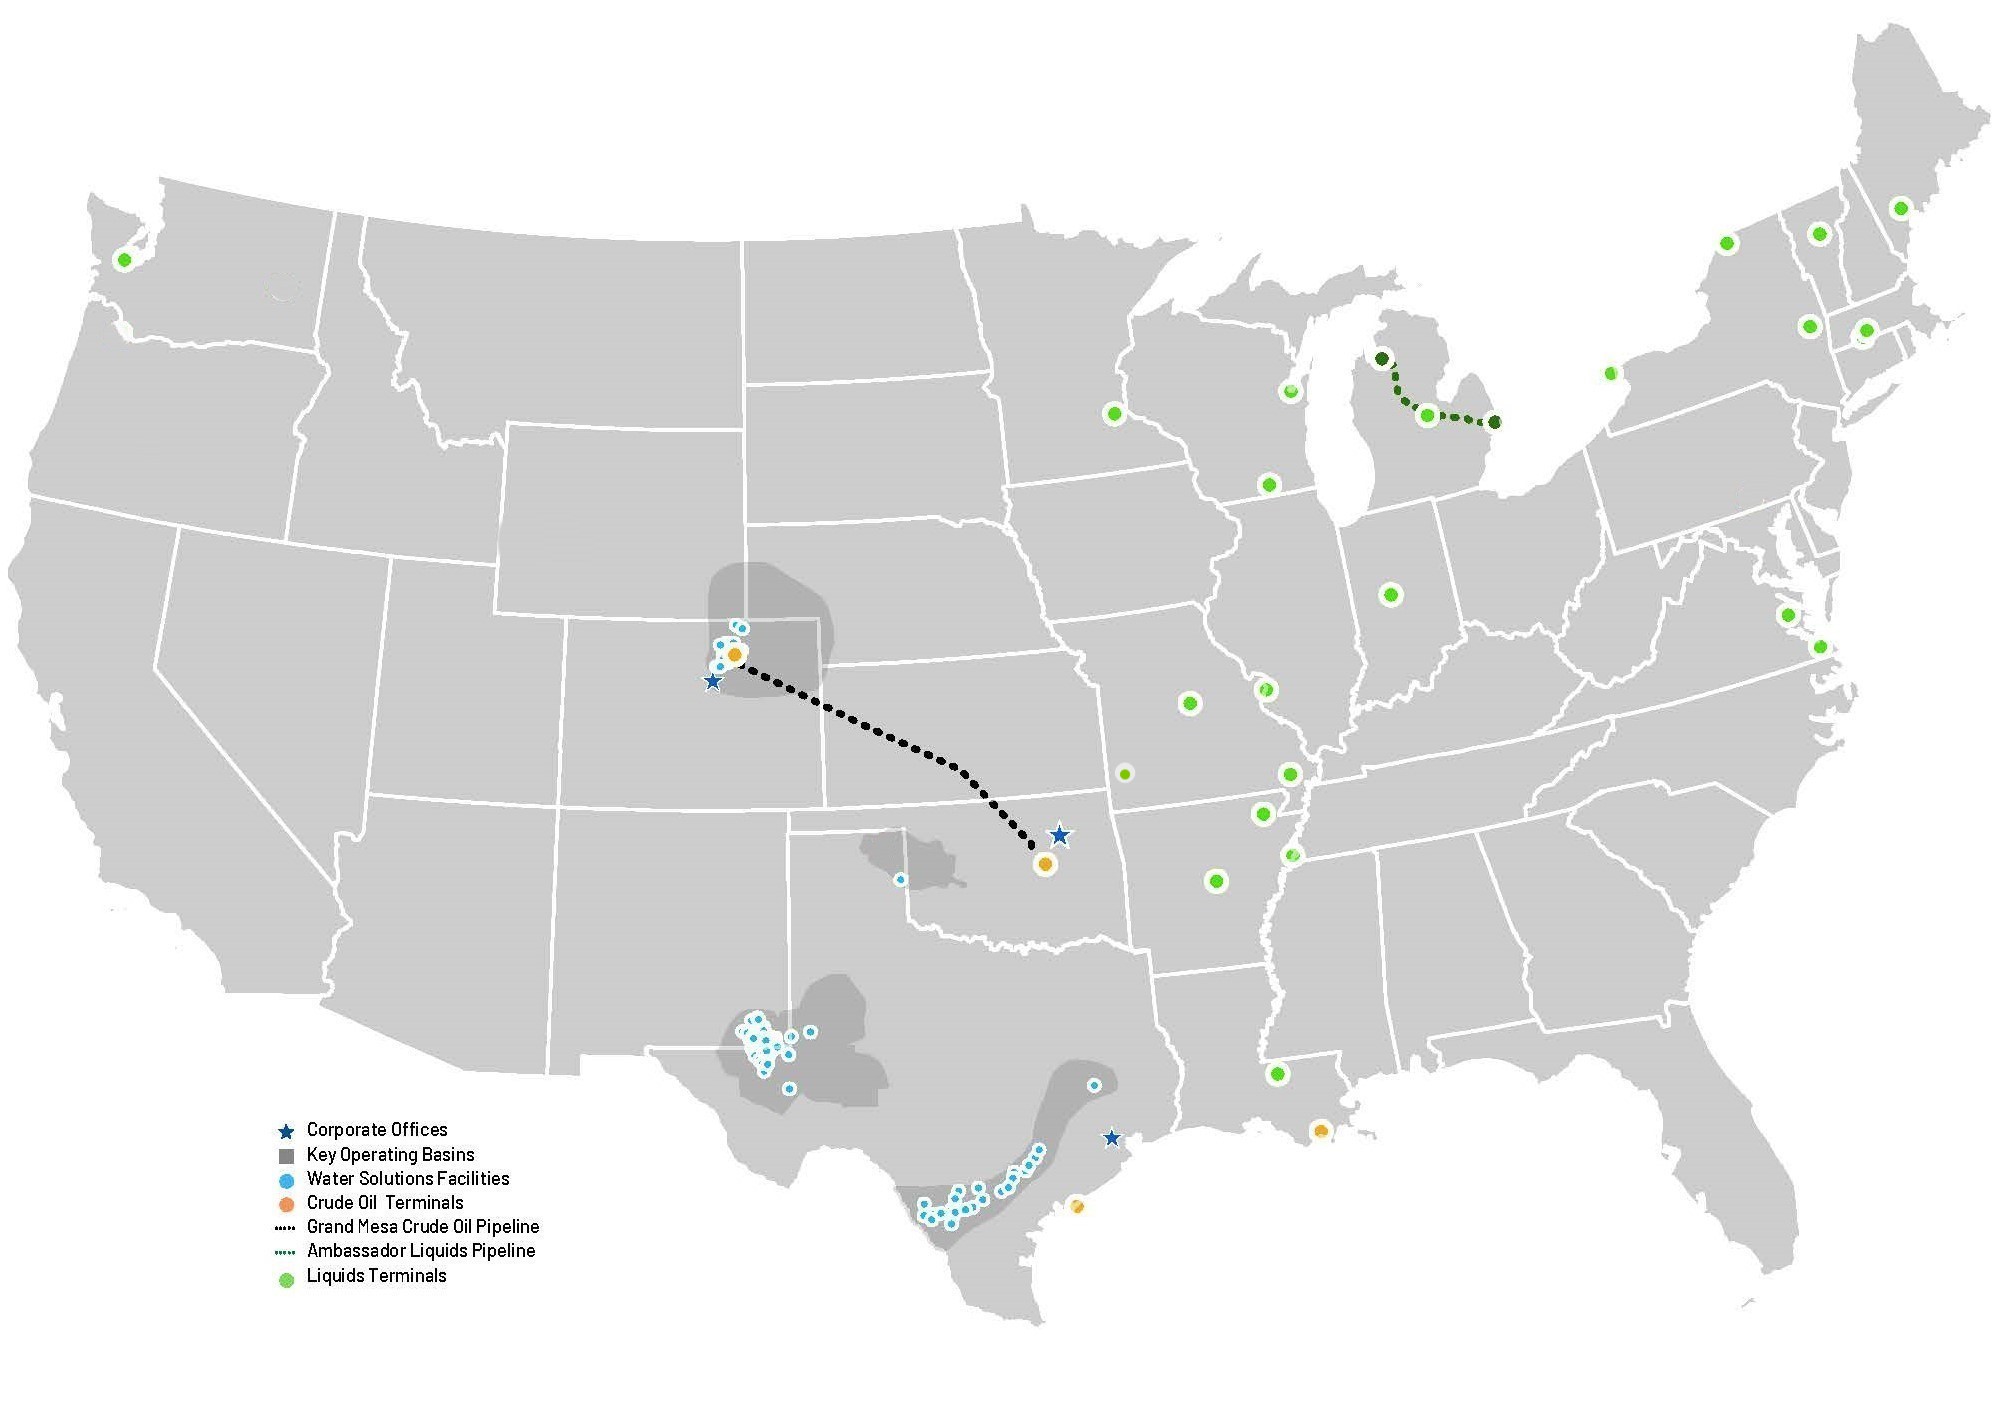
Primary Service Areas
The following map shows the primary service areas of our businesses at March 31, 2024:
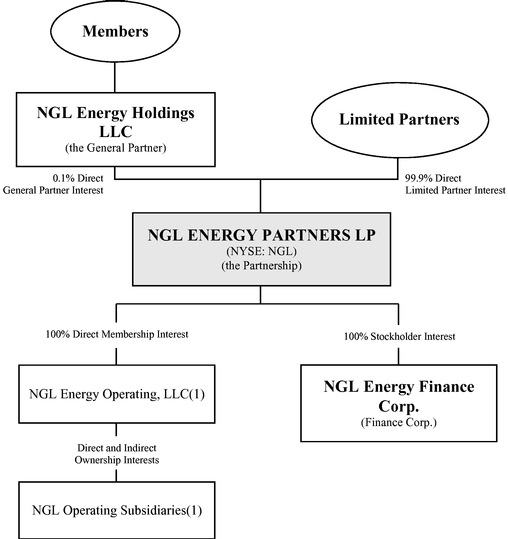
Organizational Chart
The following chart provides a summarized overview of our legal entity structure at March 31, 2024:
(1) Includes (i) NGL Water Solutions, LLC, which includes the operations of our Water Solutions segment, (ii) NGL Crude Logistics, LLC, which includes the operations of our Crude Oil Logistics segment and certain of our businesses within our Liquids Logistics segment and (iii) NGL Liquids, LLC, which includes the operations of certain of our businesses within our Liquids Logistics segment.
Our Business Strategies
Our principal business objectives are to maximize the profitability and stability of our businesses, grow our businesses in an accretive and prudent manner, and maintain a strong balance sheet. We intend to accomplish these business objectives by executing the following strategies:
•Prudently managing our balance sheet to provide us with maximum financial flexibility for funding our operations, capital projects and strategic acquisitions. Our primary focus is to reduce our absolute debt and leverage and maintain sufficient liquidity to continue to reduce our overall leverage and reinstate the payment of common unit distributions. We are also focused on maintaining credit metrics to manage existing and future capital requirements as well as to take advantage of market opportunities. We expect to continue to evaluate the capital markets and may opportunistically pursue financing transactions to optimize our capital structure.
•Building a midstream master limited partnership focusing on providing water solutions to upstream customers. We continue to enhance our ability to transport produced water from the wellhead to treatment for disposal, recycle, or discharge. To a lesser extent, we move crude oil from the wellhead to refineries, and natural gas liquids from processing plants and supply hubs to end users.
•Operating in a safe and environmentally responsible manner. We seek to operate our business in a safe and environmentally responsible manner by working with our employees, customers, vendors and local communities to minimize our environmental impact and comply with local, state and federal environmental laws and regulations.
•Focusing on consistent annual cash flows from operations under multi-year contracts that minimize commodity price risk and generate fee-based revenues. We intend to focus on generating revenues under long-term fixed fee contracts in addition to back-to-back contracts which minimize commodity price exposure. We seek to continue to increase cash flows that are supported by certain fixed fee, multi-year contracts, some of which include acreage dedications from producers or minimum volume commitments.
•Achieving growth by utilizing our existing footprint of assets, investing in new assets, customers and ventures that increase volume and enhance our operations, and generate attractive rates of return. We have available capacity in many of the assets that we own and operate that can be utilized to increase cash flows with minimal incremental capital investment. We have invested and expect to continue to invest within our existing businesses to capitalize on accretive, organic growth opportunities. We also continue to pursue strategic transactions and ventures that complement and enhance our existing footprint.
Our Competitive Strengths
We believe that we are well positioned to successfully execute our business strategies and achieve our principal business objectives because of the following competitive strengths:
•Our water processing facilities, which are strategically located near areas of high crude oil and natural gas production. Our water processing facilities are located among the most prolific crude oil and natural gas producing areas in the United States, including the Delaware Basin, the Denver-Julesburg (“DJ”) Basin and the Eagle Ford Basin. These assets are underpinned by long-term, fixed fee contracts and acreage dedications, some of which contain minimum volume commitments. Additionally, we believe that the technological capabilities of our Water Solutions business can be quickly implemented at new facilities and locations as needed. Our system located in the Northern Delaware Basin is an integrated network of large diameter produced water pipelines, recycling facilities and disposal wells that collectively provides reliable service to producer customers and would be difficult for competitors to replicate at this time.
•Our network of crude oil transportation and storage assets, which allows us to serve customers over a wide geographic area and optimize sales. Our strategically deployed terminals, as well as our owned and contracted pipeline capacity, provide access to a wide range of customers and markets. We use this expansive network of transportation assets to deliver crude oil to optimal markets. These operations are supported by certain long-term, fixed rate contracts with producers, refiners and marketers and include minimum volume commitments on our owned and leased pipelines and storage tanks.
•Our network of natural gas liquids transportation, terminal, and storage assets, which allows us to provide multiple services across the United States and Canada. Our strategically located terminals, propane pipeline in Michigan, large leased railcar fleet, shipper status on common carrier pipelines, and substantial leased storage
enable us to be a preferred purchaser and seller of natural gas liquids. We have a diverse base of long-standing customers and believe that our performance metrics allow us to reliably supply, store and transport products throughout the United States and Canada.
•Our diversified operations allow us to generate more predictable and stable cash flows on a year-to-year basis. Our ability to provide multiple services to customers in numerous geographic areas enhances our competitive position. Our three business segments are diversified by geography, customer base and commodity sensitivities, which we believe provides us with more stable cash flows through the typical commodity cycles.
•Our seasoned management team with extensive midstream industry experience and a track record of acquiring, integrating, operating and growing successful businesses. Our management team has significant experience managing companies in the energy industry, including master limited partnerships. In addition, through decades of experience, our management team has developed strong business relationships with key industry participants throughout the United States. We believe that our management’s knowledge of the industry, relationships within the industry, and experience provide us with the opportunities to optimize our existing assets. Our management team also has experience in identifying, evaluating and completing acquisitions and other ventures that provide us with additional opportunities to complement, grow and expand our existing operations.
Our Businesses
Water Solutions
Overview. Our Water Solutions segment transports, treats, recycles and disposes of produced and flowback water generated from crude oil and natural gas production. We also sell produced water for reuse and recycle and brackish non-potable water to our producer customers to be used in their crude oil exploration and production activities. As part of processing water, we aggregate and sell recovered crude oil, also known as skim oil. We also dispose of solids such as tank bottoms, drilling fluids and drilling muds and perform other ancillary services such as truck and frac tank washouts. Our activities in this segment are underpinned by long-term, fixed fee contracts and acreage dedications, some of which contain minimum volume commitments with leading oil and gas companies including large, investment grade producer customers.
We operate in a number of the most prolific crude oil and natural gas producing areas in the United States including the Delaware Basin in New Mexico and Texas, the DJ Basin in Colorado and the Eagle Ford Basin in Texas. With a system that handled approximately 884.6 million barrels of produced water across its areas of operation during the year ended March 31, 2024, we believe that we are the largest independent produced water transportation and disposal company in the United States. We currently have approximately 664,000 acres dedicated to our system under long-term agreements in the Northern Delaware Basin. In addition, we have several minimum volume commitments and other commercial agreements covering the Delaware, DJ and Eagle Ford Basins. Our focus in building our Water Solutions business has been to secure long-term, fixed fee contracts that contain minimum volume commitments, acreage dedications or similarly strong contractual relationships with large, well-capitalized producer customers.
Our core asset in the Water Solutions segment is our system located in the Northern Delaware Basin, where we own and operate the largest integrated network of large diameter produced water pipelines, recycling facilities and disposal wells. This system spans six counties in New Mexico and Texas that represent one of the most prolific crude oil producing regions in the United States with some of the most economic hydrocarbon resources and lowest break-even economics for producers. Our system has over 750 miles of newly-built, in-service large diameter produced water pipelines connected to 56 active saltwater disposal facilities and 127 active disposal wells. We currently have approximately 664,000 acres dedicated to the Northern Delaware system providing a multi-decade drilling inventory and significant growth opportunity.
On January 22, 2024, we announced that our Water Solutions business is commencing expansion of its Lea County Express Pipeline System from a capacity of 140,000 barrels of water per day to 340,000 barrels per day in 2024 (“LEX II Expansion”). We expect the LEX II Expansion to be completed during the second half of fiscal year 2025. The addition of a second large-diameter pipeline, disposal wells, and facilities will greatly expand the capabilities of our existing produced water super-system and create a significantly larger outlet for produced water disposal within the Delaware Basin. The construction of the 27-mile, 30-inch produced water pipeline will transport water to areas outside the core of the basin thereby further diversifying the geographic location of our disposal operations. The LEX II Expansion is fully underwritten by a recently executed minimum volume commitment contract that includes an acreage dedication extension with an investment grade oil and gas producer. The LEX II Expansion includes an incremental increase in committed acreage and volumes under dedication from the producer. Additionally, the LEX II Expansion is expandable up to 500,000 barrels per day.
As part of our operations, we also recycle water, which includes the sale of produced water and recycled water for use in our customers’ completion activities. During the year ended March 31, 2024, we sold approximately 30.8 million barrels of recycled water.
Operations. We own 89 water treatment and disposal facilities, including 193 injection wells. The location and permitted processing capacities of these facilities are summarized below.
| | | | | | | | | | | | | | | | | | | | | | | | | | | | | | | | |
| | Number of | | Number of | | Permitted Processing Capacity (barrels per day) |
| Location | | Facilities | | Wells | | Own (1) | | Lease (2) | | Total |
| Delaware Basin (3) - Texas and New Mexico | | 56 | | | 127 | | | 1,429,000 | | | 3,582,300 | | | 5,011,300 | |
| Eagle Ford Basin (3)(4) - Texas | | 18 | | | 32 | | | 449,000 | | | 362,000 | | | 811,000 | |
| DJ Basin - Colorado | | 13 | | | 31 | | | 373,000 | | | 162,500 | | | 535,500 | |
| Other Basins - Texas | | 2 | | | 3 | | | 55,000 | | | — | | | 55,000 | |
| Total - All Facilities | | 89 | | | 193 | | | 2,306,000 | | | 4,106,800 | | | 6,412,800 | |
(1) These facilities are located on lands we own.
(2) These facilities are located on lands we lease.
(3) Certain facilities can dispose of both produced water and solids such as tank bottoms, drilling fluids and drilling muds.
(4) Includes one facility with a permitted processing capacity of 40,000 barrels per day in which we own a 75% interest and one facility with a permitted processing capacity of 65,000 barrels per day in which we own a 50% interest.
We own the land on which 39 of the 89 water treatment and disposal facilities are located and we either have easements or lease the land on which the remaining water treatment and disposal facilities are located.
On March 31, 2023, we sold certain saltwater disposal assets in the Midland Basin (see Note 17 to our consolidated financial statements included in this Annual Report).
On July 25, 2023, we entered into an agreement in which we terminated a minimum volume water disposal contract and sold certain saltwater disposal assets and intangible assets in the Pinedale Anticline Basin (see Note 17 to our consolidated financial statements included in this Annual Report).
On April 5, 2024, we sold approximately 122,250 acres of real estate on two ranches located in Eddy and Lea Counties, New Mexico (see Note 18 to our consolidated financial statements included in this Annual Report). In addition, the assets and liabilities related to these ranches have been classified as held for sale within our March 31, 2024 consolidated balance sheet (see Note 17 to our consolidated financial statements included in this Annual Report).
Our customers bring produced and flowback water generated by crude oil and natural gas exploration and production operations to our facilities for treatment through pipeline gathering systems and by truck. During the year ended March 31, 2024, in the Delaware Basin, we received approximately 98% of produced and flowback water via pipelines. Once we take delivery of the water, the level of processing is determined by the ultimate disposition of the water.
Our facilities dispose of produced water primarily into deep underground formations via injection wells. At our disposal facilities, we use proprietary well maintenance programs to enhance injection rates and extend the service lives of the wells.
Customers. The primary customers of our operations consist mainly of large publicly traded, oil and gas companies with diversified acreage positions across multiple leading oil and gas plays. During the year ended March 31, 2024, 69% of the revenues of our Water Solutions segment were generated from our ten largest customers of the segment. Additionally, certain key customers of the Water Solutions segment contribute significantly to the cash flows and profitability of the organization. Any loss of those customers or their contracts could have an adverse impact on our financial results.
Competition. The principal elements of competition are system reliability, project execution capability and reputation, system capacity and flexibility, rates for services and system location relative to the producer’s operations. Our competitors include independent produced water transportation and disposal companies and the water transportation and disposal operations owned by oil and gas production companies themselves. Location can be an important consideration for our customers, who seek to minimize the cost of transporting the produced water to disposal facilities. Many of our facilities are strategically located near areas of high crude oil and natural gas production which provides us with a distinct advantage over a competitor that must build a system that can compete with our assets.
Pricing Policy. We charge customers a fee per barrel of produced water received. Our contractual agreements can consist of: (a) minimum volume commitments requiring the customer to deliver a specified minimum volume of produced water over a specified period of time; (b) acreage dedications requiring the customer to deliver all volumes produced from the dedicated acreage with us; and (c) produced water pipeline and trucked disposal agreements providing interruptible service in exchange for a fee per barrel of produced water received. We also generate revenue from the sale of crude oil we recover in processing the produced water. In addition, we may charge fees for the sale of produced water for reuse by our customers, pipeline transportation fees, pipeline interconnection fees and solids disposal fees.
Trade Names. Our Water Solutions segment operates under the NGL Water Solutions trade name.
Technology. We hold multiple patents for processing technologies. We believe that the technological capabilities of our Water Solutions business can be quickly implemented at new facilities and locations.
Crude Oil Logistics
Overview. Our Crude Oil Logistics segment purchases crude oil from producers and marketers and transports it to refineries or for resale at pipeline injection stations, storage terminals, barge loading facilities, rail facilities, refineries, and other trade hubs, and provides storage, terminaling and transportation services through its owned assets. Our activities in this segment are supported by certain long-term, fixed rate contracts which include minimum volume commitments on our owned and leased pipelines and storage tanks. Our operations are concentrated in and around four prolific crude oil producing regions in the United States, including the DJ Basin in Colorado, the Permian Basin in Texas and New Mexico, the Eagle Ford Basin in Texas and the United States Gulf Coast.
Our foundational asset in this segment is the Grand Mesa Pipeline, a 550-mile pipeline that transports crude oil from its origin in Weld County, Colorado to our terminal in Cushing, Oklahoma. The Grand Mesa Pipeline commenced operations on November 1, 2016 and has operated continuously since then. The main line portion of this pipeline is comprised of an undivided interest with Saddlehorn Pipeline Company, LLC (“Saddlehorn”) in which we have ownership of 150,000 barrels per day of capacity of the pipeline. During the year ended March 31, 2024, approximately 25.6 million barrels of crude oil were transported on the Grand Mesa Pipeline. Operating costs associated with the Grand Mesa Pipeline are allocated to us based on our proportionate ownership interest and throughput. We also own and operate origin terminals at Lucerne and Riverside, Colorado, where we aggregate crude oil volumes of different types and grades and store them until they are ready for transfer to the Grand Mesa Pipeline. The Lucerne terminal has 950,000 barrels of storage and a 12 bay truck loading facility. The Riverside terminal has 20,000 barrels of storage and a four bay truck loading facility.
Through our ownership in the Grand Mesa Pipeline, we have sufficient capacity to service our customer contracts at the same origin and termination points with the ability to accept additional volume commitments. We retained ownership of our previously acquired easements for the potential future development of transportation projects involving petroleum commodities other than crude oil and condensate. With the consent and participation of Saddlehorn, we and Saddlehorn may consider future opportunities using these easements, to the extent such easements remain in effect, for projects involving the transportation of crude oil and condensate. On December 6, 2023, we announced an open season for the Grand Mesa Pipeline. This open season ended at the close of business on January 5, 2024, and resulted in a new shipper with a five-year minimum volume commitment contract commencing on January 6, 2024.
We own and operate a large scale crude oil terminal located in Cushing, Oklahoma with 3,626,000 barrels of storage capacity, seven off-loading lease automatic custody transfer units (“LACTs”), a full control room, on-site quality management building, and three 24-inch bi-directional pipelines each capable of moving 360,000 barrels per day. The terminal features advantaged connectivity to other terminals and pipelines including important connections to the Grand Mesa Pipeline and to TC Energy’s terminal with access to the United States Gulf Coast via Marketlink. Our terminal is situated on 200 acres and is designed to be expanded based on customer demand. Cushing is one of the most liquid crude oil trading hubs in the world and is the delivery point for West Texas Intermediate futures contracts.
We own and operate a crude oil marine terminal in Point Comfort, Texas with 355,000 barrels of storage capacity and six off-loading LACTs. Our tanks connect to three docks at the port (two for ocean-going barges and ships and one for inland barges).
We own and operate a crude oil pipeline and marine terminal in Houma, Louisiana with 288,000 barrels of storage capacity, two off-loading LACTs, a brown water barge dock and two 12-inch bi-directional pipelines each capable of moving 120,000 barrels per day with connectivity to Shell’s Zydeco System.
Operations. We purchase crude oil from producers and marketers and transport it to refineries or for resale. Our strategically deployed terminals, as well as our owned and contracted pipeline capacity, provide access to a wide range of customers and markets. We use this expansive network of transportation assets to deliver crude oil to optimal markets.
We currently transport crude oil using the following assets:
•The Grand Mesa Pipeline, which is described above, and 19 other common carrier pipelines owned by third parties; and
•396 owned railcars (all of which are leased to third parties).
We are in the process of requalifying our 396 owned railcars to be compliant with the standards for railcars for the commodities they are transporting. As of March 31, 2024, 130 railcars have been requalified (see “–Government Regulation”).
We also own 27 strategically located pipeline injection stations, the locations of which are summarized below.
| | | | | | | | |
| State | | Number of Pipeline Injection Stations |
| Texas | | 13 | |
| New Mexico | | 6 | |
| Oklahoma | | 5 | |
| Kansas | | 3 | |
| Total | | 27 | |
On March 30, 2023, we sold our marine assets (see Note 17 to our consolidated financial statements included in this Annual Report).
Customers. Our customers include crude oil refiners, producers, and marketers. During the year ended March 31, 2024, 86% of the revenues of our Crude Oil Logistics segment were generated from our ten largest customers of the segment. Additionally, certain key customers of the Crude Oil Logistics segment contribute significantly to the cash flows and profitability of the organization. Any loss of those customers or their contracts could have an adverse impact on our financial results.
Competition. Our Crude Oil Logistics segment faces significant competition, as many entities are engaged in the crude oil logistics business, some of which are larger and have greater financial resources than we do. The primary factors on which we compete are:
•price;
•availability of supply and refinery demand;
•reliability of service;
•open credit;
•logistics capabilities, including the availability of railcars, proprietary terminals, and owned pipeline and railcars; and
•long-term customer relationships.
Supply. We obtain crude oil from a large base of suppliers, which consists primarily of crude oil producers. We currently purchase crude oil from 241 producers at 2,217 leases.
Pricing Policy. Most of our contracts to purchase or sell crude oil are at floating prices that are indexed to published rates in active markets such as Cushing, Oklahoma, St. James, Louisiana, and Magellan East Houston. We seek to manage price risk by entering into purchase and sale contracts of similar volumes based on similar indexes and by hedging exposure due to fluctuations in actual volumes and scheduled volumes.
Our profitability is impacted by forward crude oil prices. Crude oil markets can either be in contango (a condition in which forward crude oil prices are higher than spot prices) or can be in backwardation (a condition in which forward crude oil prices are lower than spot prices). Our Crude Oil Logistics segment benefits when the market is in contango, as increasing
prices result in inventory value gains during the time between when we purchase the inventory and when we sell it. In addition, we are able to better utilize our storage assets when contango markets justify storing barrels. When markets are in backwardation, our inventory values decrease during the time period between when we purchase inventory and when we sell it and the declining prices also typically have an unfavorable impact on our storage tank lease rates. To help mitigate the impact of changing prices, we enter into derivative instruments to hedge our inventory.
Trade Names. Our Crude Oil Logistics segment operates primarily under the NGL Crude Logistics, NGL Crude Transportation, NGL Crude Terminals and NGL Crude Cushing trade names.
Liquids Logistics
Overview. Our Liquids Logistics segment conducts supply operations for natural gas liquids, refined petroleum products and biodiesel to a broad range of commercial, retail and industrial customers across the United States and Canada. These operations are conducted through our 23 owned terminals, third-party storage and terminal facilities, nine common carrier pipelines and a fleet of leased railcars. We also provide services for marine exports of butane through our facility located in Chesapeake, Virginia, and we also own a propane pipeline in Michigan. We attempt to reduce our exposure to price fluctuations by using back-to-back physical contracts and pre-sale agreements that allow us to lock in a margin on a percentage of our winter volumes. We also enter into financially settled derivative contracts as economic hedges of our physical inventory, physical sales and physical purchase contracts. We employ a number of contractual and hedging strategies to minimize commodity exposure and maximize earnings stability of this segment. During the year ended March 31, 2024, we sold approximately 2.5 billion gallons of natural gas liquids, refined products and renewables products, or 6.97 million gallons (approximately 166,000 barrels) per day.
Operations. We procure natural gas liquids from refiners, natural gas processing plants, producers and other resellers for delivery to leased or owned storage space, common carrier pipelines, railcar terminals, and direct to certain customers. Our customers take delivery by loading natural gas liquids into transport vehicles from common carrier pipeline terminals, private terminals, our terminals, directly from refineries and rail terminals, and by railcar.
A portion of our wholesale propane gallons are presold to third-party retailers and wholesalers at a fixed price under back-to-back contracts. Back-to-back contracts, in which we balance our contractual portfolio by buying physical propane supply or derivatives when we have a matching purchase commitment from our wholesale customers, protect our margins and mitigate commodity price risk. Presales also reduce the impact of warm weather because the customer is required to take delivery of the propane regardless of the weather or any other factors. We generally require cash deposits from these customers. In addition, on a daily basis we have the ability to balance our inventory by buying or selling propane, butanes, and natural gasoline to refiners, resellers, and propane producers through pipeline inventory transfers at major storage hubs.
In order to secure consistent supply during the heating season, we are often required to purchase volumes of propane during the entire fiscal year. In order to mitigate storage costs and price risk, we may sell those volumes at a lesser margin in lower demand months than we earn in our other wholesale operations.
We purchase butane from refiners during the summer months, when refiners have a greater butane supply than they need, and sell butane to refiners during the winter blending season, when demand for butane is higher. We utilize a portion of our railcar fleet and a portion of our leased underground storage to store butane for this purpose. We also transport customer-owned natural gas liquids on our leased railcars and charge the customers a transportation service fee as well as sublease railcars to certain customers. Our owned and leased terminals and railcar fleet give us the opportunity to access markets throughout the United States, and to move product to locations where demand is highest. We provide transportation, storage, and throughput services to third parties at our facilities in Port Hudson, Louisiana, Chesapeake, Virginia and Shelton, Washington.
We purchase refined petroleum and renewable products primarily in the Gulf Coast, West Coast and Midwest regions of the United States and schedule them for delivery at various locations throughout the country. We conduct just-in-time sales at a nationwide network of terminals owned by third parties via rack spot sales or delivered sales that do not involve continuing contractual obligations to purchase or deliver product. Rack spot sales are priced and delivered on a daily basis through truck loading racks. At the end of each day for each of the terminals that we market from, we establish the next day selling price for each product for each of our delivery locations. We announce or “post” to customers via website, e-mail, and telephone communications the rack spot sale price of various products for the following morning. When customers decide to purchase product from us, we purchase the same volume of product from a supplier at a previously agreed-upon price. For these just-in-time transactions, our purchase from the supplier occurs at the same time as our sale to our customer. Typical rack spot sale purchasers include commercial and industrial end users, independent retailers and small, independent marketers who resell
product to retail gasoline stations or other end users. Our selling price of a particular product on a particular day is a function of our supply at that delivery location or terminal, our estimate of the costs to replenish the product at that delivery location, and our desire to reduce product volume at that particular location that day. A significant percentage of our business is priced on a back-to-back basis which minimizes our commodity price exposure.
The following table summarizes the location of our facilities and respective storage capacity and interconnects to those facilities.
| | | | | | | | | | | | | | | | | | | | | | | | | | | | | | | | |
| | | | Storage Capacity (in gallons) | | |
| Location | | Number of Facilities | | Own (1) | | Lease (2) | | Total | | Terminal Interconnects |
| Virginia | | 2 | | | 20,888,000 | | | — | | | 20,888,000 | | | Rail Facility; Marine Facility |
| Arkansas | | 3 | | | 3,765,000 | | | 90,000 | | | 3,855,000 | | | Connected to Enterprise Texas Eastern Products Pipeline; Rail Facility |
| Missouri | | 3 | | | 2,124,000 | | | — | | | 2,124,000 | | | Connected to Enterprise Texas Eastern Products Pipeline, Phillips66 Blue Line Pipeline and Magellan (OKE) #6 Pipeline |
| Minnesota | | 1 | | | 1,829,000 | | | — | | | 1,829,000 | | | Connected to Enterprise Mid-America Pipeline; Rail Facility |
| Indiana | | 1 | | | 1,530,000 | | | — | | | 1,530,000 | | | Connected to Enterprise Texas Eastern Products Pipeline; Rail Facility |
| Wisconsin | | 2 | | | 696,000 | | | 390,000 | | | 1,086,000 | | | Connected to Enterprise Mid-America Pipeline; Rail Facility |
| Massachusetts | | 2 | | | 788,400 | | | — | | | 788,400 | | | Rail Facility |
| Louisiana | | 1 | | | 720,000 | | | — | | | 720,000 | | | Truck Facility |
| Illinois | | 1 | | | 480,000 | | | — | | | 480,000 | | | Connected to Phillips66 Blue Line Pipeline |
| Michigan | | 1 | | | 480,000 | | | — | | | 480,000 | | | Connected to Ambassador Pipeline |
| New York | | 2 | | | — | | | 450,000 | | | 450,000 | | | Rail Facility |
| Maine | | 1 | | | — | | | 120,000 | | | 120,000 | | | Rail Facility |
| Vermont | | 1 | | | — | | | 120,000 | | | 120,000 | | | Rail Facility |
| Washington | | 1 | | | — | | | 120,000 | | | 120,000 | | | Rail Facility |
| United States Total | | 22 | | | 33,300,400 | | | 1,290,000 | | | 34,590,400 | | | |
| | | | | | | | | | |
| Ontario, Canada (3) | | 1 | | | — | | | 120,000 | | | 120,000 | | | Truck Facility |
| Canada Total | | 1 | | | — | | | 120,000 | | | 120,000 | | | |
| | | | | | | | | | |
| Total | | 23 | | | 33,300,400 | | | 1,410,000 | | | 34,710,400 | | | |
(1) These facilities are located on lands we own.
(2) These facilities are located on lands we lease.
(3) This facility is operated by a third party under a year-to-year agreement.
During the year ended March 31, 2024, we sold three natural gas liquids terminals (see Note 17 to our consolidated financial statements included in this Annual Report).
We own the land on which 15 of the 23 natural gas liquids terminals are located and we either have easements or lease the land on which the remaining terminals are located.
We own a natural gas liquids terminal that supports refined products blending in Port Hudson, Louisiana, and a marine export/import terminal in Chesapeake, Virginia. The Port Hudson terminal is located near Baton Rouge, Louisiana, and is in proximity to other refined products infrastructure along the Colonial pipeline. This truck unloading and storage facility allows for the aggregation and supply of butane and naphtha for motor fuel blending and consists of storage tanks with a total capacity of 720,000 gallons. The Chesapeake facility is a marine export/import terminal situated upstream of Norfolk, Virginia on the Elizabeth River. The site includes a proprietary dock with the capacity to berth handy-sized vessels (a dry bulk carrier of an oil tanker with a capacity between 15,000 and 35,000 dead weight tonnage) to very large gas carriers (a carrier capable of loading anywhere between 100,000 cubic meters to 200,000 cubic meters of natural gas), truck loading and off-road racks along with 22 railcar spots, with service provided by Norfolk Southern Railroad. The facility has an aggregate storage capacity of 20,408,000 gallons.
We own 28 transloading units, which enable customers to transfer product from railcars to trucks. These transloading units can be moved to locations along a railroad where it is most convenient for customers to transfer their product.
We own the Ambassador Pipeline, an approximately 225-mile propane pipeline, which runs from the Kalkaska gas plant in Kalkaska County, Michigan to a termination point near Marysville in St. Clair County, Michigan. The Wheeler propane terminal, in central Michigan, is located at the mid-point of the pipeline. These assets complement our existing assets in the upper Midwest and will expand our presence in Michigan, one of the top propane markets in the United States.
We utilize a fleet of approximately 4,300 high-pressure and general purpose leased railcars of which 295 railcars are subleased by third parties.
We lease storage space to accommodate the supply requirements and contractual needs of our retail and wholesale customers.
The following table summarizes our significant leased storage space at natural gas liquids and refined products storage facilities and interconnects to those facilities:
| | | | | | | | | | | | | | | | | | | | |
| | Leased Storage Space
(in gallons) | |
| Storage Facility Location | | Beginning
April 1,
2024 | | At
March 31,
2024 | | Storage Interconnects |
| Kansas | | 44,100,000 | | | 56,700,000 | | | Connected to Enterprise Mid-America Pipeline, NuStar Pipelines and ONEOK North System Pipeline; Rail Facility; Truck Facility |
| Michigan | | 21,000,000 | | | 26,692,050 | | | Rail Facility; Truck Facility |
| Arizona | | 5,510,400 | | | 5,510,400 | | | Kinder Morgan West Pipeline; Truck Facility |
| Utah | | 5,250,000 | | | 15,750,000 | | | Rail Facility |
| Texas | | 4,830,000 | | | 4,830,000 | | | Connected to Enterprise Texas Eastern Products Pipeline; Truck Facility |
| Mississippi | | 3,150,000 | | | 1,680,000 | | | Connected to Enterprise Dixie Pipeline; Rail Facility |
| Oregon | | 2,100,000 | | | 2,100,000 | | | Rail Facility; Truck Facility |
| United States Total | | 85,940,400 | | | 113,262,450 | | | |
| | | | | | |
| Ontario, Canada | | 8,467,200 | | | 8,467,200 | | | Rail Facility |
| Alberta, Canada | | 1,323,420 | | | 1,323,420 | | | Connected to Cochin Pipeline; Rail Facility |
| Canada Total | | 9,790,620 | | | 9,790,620 | | | |
| | | | | | |
| Total | | 95,731,020 | | | 123,053,070 | | | |
Customers. Our Liquids Logistics segment serves approximately 1,200 customers in 48 states, Mexico and Canada, including national, regional and independent retail, industrial, wholesale, petrochemical, refiner and natural gas liquids production customers. During the year ended March 31, 2024, 23% of the revenues of our Liquids Logistics segment were generated from our ten largest customers of the segment.
Seasonality. Our wholesale liquids business is largely seasonal as the primary users of propane as heating fuel generally purchase propane during the typical fall and winter heating season. However, we are able to partially mitigate the effects of seasonality by preselling a portion of our wholesale volumes to retailers and wholesalers and requiring the customer to take delivery of the product regardless of the weather.
The demand for gasoline typically peaks during the summer driving season, which extends from April to September, and declines during the fall and winter months. However, the demand for diesel typically peaks during the fall and winter months due to colder temperatures, and peaks in the Midwest during spring planting and fall harvest.
Competition. Our Liquids Logistics segment faces significant competition from other natural gas liquids wholesalers, trading companies and companies involved in the natural gas liquids midstream industry (such as terminal and refinery operations), some of which have greater financial resources than we do. The primary factors on which we compete are:
•price;
•availability of supply;
•reliability of service;
•available space on common carrier pipelines;
•storage availability;
•logistics capabilities, including the availability of railcars, and proprietary terminals; and
•long-term customer relationships.
Market Price Risk. Our philosophy is to maintain minimum commodity price exposure through a combination of purchase contracts, sales contracts and financial derivatives. A significant percentage of our refined products and biodiesel businesses is priced on a back-to-back basis which minimizes our commodity price exposure. For discretionary inventory, and for those instances where physical transactions cannot be appropriately matched, we utilize financial derivatives to mitigate commodity price exposure. Specific exposure limits are mandated in our market risk policy.
The value of refined products in any local delivery market is the sum of the commodity price as reflected on the New York Mercantile Exchange (“NYMEX”) and the basis differential for that local delivery market. The basis differential for any local delivery market is the spread between the cash price in the physical market and the quoted price in the futures markets for the prompt month. We typically utilize NYMEX futures contracts to mitigate commodity price exposure. We generally do not manage the financial impact on us from changes in basis differentials affected by local market supply and demand disruptions.
Pricing Policy. In our Liquids Logistics segment, we offer our customers the following categories of contracts:
•customer pre-buys, which typically require deposits based on market pricing conditions;
•market based, which can either be a posted price or an index to spot price at time of delivery; and
•load package, a firm price agreement for customers seeking to purchase specific volumes delivered during a specific time period.
We use back-to-back contracts for many of our liquids business sales to limit commodity price exposure and protect our margins. We are able to match our supply and sales commitments by offering our customers purchase contracts with flexible price, location, storage, and ratable delivery. However, certain common carrier pipelines require us to keep minimum in-line inventory balances year round to conduct our daily business, and these volumes are not matched with a sales commitment.
We generally require deposits from our customers for fixed price future delivery if the delivery date is more than 30 days after the time of contractual agreement.
Legal and Regulatory Considerations. Demand for ethanol and biodiesel is driven in large part by government mandates and incentives. Refiners and producers are required to blend a certain percentage of renewables into their refined products, although the percentage can vary from year to year based on the United States Environmental Protection Agency (“EPA”) mandates. In addition, the federal government has in recent years granted certain tax credits for the use of biodiesel, although on several occasions these tax credits have expired. In August 2022, the federal government extended the tax credit, with the tax credit now expiring on December 31, 2024. Changes in future mandates and incentives, or decisions by the federal government related to future reinstatement of the biodiesel tax credit, could result in changes in demand for ethanol and biodiesel.
Trade Names. Our Liquids Logistics segment operates primarily under the NGL Supply Wholesale, NGL Supply Terminal Company, Centennial Energy, Centennial Gas Liquids and NGL Crude Logistics trade names.
Human Capital
At March 31, 2024, we had 607 employees in 27 states and Canada. Of those employees, 226 provide work primarily for our Water Solutions segment, 58 provide work primarily for our Crude Oil Logistics segment, 151 provide work primarily for our Liquids Logistics segment, and 172 provide administrative services to the various business segments. NGL is an equal-opportunity employer, and our employee handbook underscores that commitment, with policies prohibiting discrimination, harassment, and retaliation.
We understand the importance of competitive benefits packages for the health and welfare of our employees and for our ability to recruit and retain the best talent. In that regard, at the end of fiscal year 2021, we implemented $20 per hour minimum wage for all regular, full-time employees. More than 95% of our eligible employees participated in the NGL 401(k) Plan in fiscal year 2024. As of January 1, 2023, we shortened the NGL 401(k) eligibility period from the first day after six months of employment to the first day of the month after three months of employment. In addition, we provide access to a traditional PPO or a high-deductible medical plan including a health savings account with employer contributions; a flexible spending account option for those not enrolled in the high-deductible medical plan; a dental plan; a vision plan; an Employee Assistance Plan including free counseling for employees and members of their household; company-paid short-term disability coverage; voluntary long-term disability coverage; company-paid life and AD&D coverage; and voluntary life and AD&D coverage options for employees and their family members.
Our operations are guided by specific health and safety protocols. We endeavor to conduct our business in a manner that meets or exceeds applicable health and safety regulations and minimizes risk, both to our employees and the communities where we operate. Our environmental, health and safety team:
• Advises on safety and industrial hygiene regulatory requirements and best practices;
• Develops safety procedures and guidelines;
• Conducts safety inspections;
• Advises on strategies to improve health and safety performance; and
• Designs and conducts safety and industrial hygiene training courses.
As part of this effort, we have implemented an enterprise management information system designed to help us achieve a better understanding of our performance, identify root causes of incidents, and where appropriate, implement necessary mitigations.
Government Regulation
Regulation of the Oil and Natural Gas Industries
Regulation of Oil and Natural Gas Exploration, Production and Sales. Sales of crude oil and natural gas liquids are not currently regulated and are transacted at market prices. In 1989, the United States Congress enacted the Natural Gas Wellhead Decontrol Act, which removed all remaining price and non-price controls affecting wellhead sales of natural gas. The Federal Energy Regulatory Commission (“FERC”), which has authority under the Natural Gas Act to regulate the prices and other terms and conditions of the sale of natural gas for resale in interstate commerce, has issued blanket authorizations for all natural gas resellers subject to its regulation, except interstate pipelines, to resell natural gas at market prices. Either Congress or the FERC (with respect to the resale of natural gas in interstate commerce), however, could re-impose price controls in the future.
Exploration and production operations and water disposal facilities are subject to various types of federal, state and local regulation, including, but not limited to, permitting, well location, methods of drilling, well operations, and conservation of resources. These regulations may affect our businesses and the businesses of certain of our customers and suppliers. It is not possible to predict how or when regulations affecting our operations or our customers’ or suppliers’ operations might change.
Regulation of the Transportation and Storage of Natural Gas and Oil and Related Facilities. The FERC regulates oil pipelines under the Interstate Commerce Act and natural gas pipeline and storage companies under the Natural Gas Act, and Natural Gas Policy Act of 1978 (“NGPA”), as amended by the Energy Policy Act of 2005. The Grand Mesa Pipeline became operational on November 1, 2016 and has several points of origin in Colorado, runs from those origin points through Kansas and terminates in Cushing, Oklahoma. The transportation services on the Grand Mesa Pipeline are subject to FERC regulation. In February 2018, the FERC issued a revised policy to disallow income tax allowance cost recovery in rates charged by pipeline companies organized as master limited partnerships. The FERC’s revised policy impacts cost-of-service rates on oil pipelines. Currently, the volumes of crude oil that are transported on the Grand Mesa Pipeline are subject to contractual agreements. Therefore, the FERC’s revised policy has not impacted the Grand Mesa Pipeline at the present time. Additionally, contracts we enter into for the interstate transportation or storage of crude oil or natural gas may be subject to FERC regulation including reporting or other requirements. In addition, the intrastate transportation and storage of crude oil and natural gas is subject to regulation by the state in which such facilities are located, and such regulation can affect the availability and price of our supply, and have both a direct and indirect effect on our business.
Anti-Market Manipulation. We are subject to the anti-market manipulation provisions in the Natural Gas Act and the NGPA, which authorizes the FERC to impose fines of up to $1 million per day per violation of the Natural Gas Act, the NGPA, or their implementing regulations. In addition, the Federal Trade Commission (“FTC”) holds statutory authority under the Energy Independence and Security Act of 2007 to prevent market manipulation in petroleum markets, including the authority to request that a court impose fines of up to $1 million per violation. These agencies have promulgated broad rules and regulations prohibiting fraud and manipulation in oil and gas markets. The Commodity Futures Trading Commission (“CFTC”) is directed under the Commodity Exchange Act to prevent price manipulations in the commodity and futures markets, including the energy futures markets. Pursuant to statutory authority, the CFTC has adopted anti-market manipulation regulations that prohibit fraud and price manipulation in the commodity and futures markets. The CFTC also has statutory authority to seek civil penalties of up to the greater of $1 million per day per violation or triple the monetary gain to the violator for violations of the anti-market manipulation sections of the Commodity Exchange Act. We are also subject to various reporting requirements that are designed to facilitate transparency and prevent market manipulation.
Environmental Regulation
General. Our operations are subject to federal, state and local laws and regulations relating to the protection of the environment. Existing regulatory requirements inform our decision-making and business activities in many ways, such as:
•informing decisions regarding what types of pollution-control equipment to deploy and how a facility should be designed;
•informing decision-making regarding construction activities, such as where to locate and where not to locate a facility; e.g., locating construction activities away from sensitive environmental, cultural or historic areas, including wetlands, coastal regions or areas inhabited by endangered or threatened species, and limiting or prohibiting construction activities during certain sensitive periods, such as when threatened or endangered species are breeding/nesting;
•informing decision-making regarding the timing of activities, for example, we will delay construction or system modification or upgrades during the issuance or renewal periods of certain permits;
•informing decision-making pertaining to our approach to investigating, mitigating and remediating unplanned releases from our facilities and operations or attributable to former facilities or operations, as necessary and appropriate; and
•informing our decision-making about whether a facility or operation should be temporarily halted to address potential non-compliance with relevant permit requirements.
Failure to comply with these laws and regulations may trigger a variety of administrative, civil, and criminal enforcement measures, including the assessment of monetary penalties. Certain environmental statutes impose strict and/or joint and several liability for costs required to clean up and restore sites where substances such as crude oil or wastes have been disposed or otherwise released. The trend in environmental regulation is to place more restrictions and limitations on activities that may adversely affect human health and the environment and to commit greater financial and other resources to inspection, compliance and enforcement activities. Thus, there can be no assurance as to the amount or timing of future expenditures for environmental compliance or remediation, and actual future expenditures may be different from the amounts we currently anticipate.
The following is a discussion of the material environmental laws and regulations that relate to our businesses.
Hazardous Substances and Waste. We are subject to various federal, state, and local environmental laws and regulations governing the storage, distribution, and transportation of natural gas liquids and the operation of bulk storage liquefied petroleum gas (LPG) terminals, as well as laws and regulations governing hazardous substances and waste, including those addressing the discharge of materials into the environment or otherwise relating to protection of the environment. Generally, these laws (i) regulate air and water quality, impose limitations on the discharge of pollutants and establish standards for the use, handling, storage, treatment, transport and disposal of solid and hazardous wastes; (ii) subject our operations to certain permitting and registration requirements; (iii) may result in the suspension or revocation of necessary permits, licenses and authorizations; (iv) impose substantial liabilities on us for pollution resulting from our operations; (v) require remedial measures to mitigate any violation of environmental laws and regulations or pollution from former or ongoing operations; and (vi) may result in the assessment of administrative, civil and criminal penalties for failure to comply with such laws. These laws include, among others, the Resource Conservation and Recovery Act (“RCRA”), the Comprehensive Environmental Response, Compensation and Liability Act (“CERCLA”), the federal Clean Air Act (“CAA”), the Homeland Security Act of 2002, the
Emergency Planning and Community Right to Know Act, the Clean Water Act (“CWA”), the Safe Drinking Water Act, the Oil Spills Prevention and Preparedness Regulations, each as amended, and comparable state statutes.
CERCLA, also known as the “Superfund” law, and similar state laws, impose liability on certain classes of potentially responsible persons that are considered to have contributed to the release of a “hazardous substance” into the environment. These persons include the current and past owner or operator of the site where the release occurred and anyone who disposed or arranged for the disposal of a hazardous substance released at the site. While natural gas liquids are not a hazardous substance within the meaning of CERCLA, other chemicals used in or generated by our operations may be classified as a hazardous substance. Persons who are or were liable for releases of hazardous substances under CERCLA may be subject to strict and/or joint and several liability for the costs of investigating and cleaning up the hazardous substances that have been released into the environment and for damages to natural resources and for the costs of certain health studies. It is not uncommon for neighboring landowners and other third parties to file claims for personal injury and property damage allegedly caused by the release of hazardous substances into the environment.
RCRA, and comparable state statutes and their implementing regulations, regulate the generation, transportation, treatment, storage, disposal and cleanup of solid and hazardous wastes. Under a delegation of authority from the EPA, most states administer some or all of the provisions of RCRA, sometimes in conjunction with their own, more stringent requirements. Federal and state regulatory agencies can seek to impose administrative, civil and criminal penalties for alleged non-compliance with RCRA and analogous state requirements. Certain wastes associated with the production of oil and natural gas, as well as certain types of petroleum-contaminated media and debris, are excluded from regulation as hazardous waste under Subtitle C of RCRA. These wastes, instead, are regulated as solid waste under RCRA’s less stringent Subtitle D, state laws or other federal laws. It is possible, however, that certain wastes now classified as non-hazardous solid waste could be classified as hazardous wastes in the future and thereby be subject to more rigorous and costly disposal requirements. Legislation has been proposed from time to time in Congress to regulate certain oil and natural gas wastes as “hazardous wastes under RCRA.” Any such change could result in an increase in our costs to manage and dispose of wastes, which could have a material adverse effect on our consolidated results of operations and financial position.
Wastes containing naturally occurring radioactive materials (“NORM”) may also be generated in connection with our operations. Certain processes used to produce oil and gas may enhance the radioactivity of NORM, which may be present in oilfield wastes. NORM is subject primarily to individual state radiation control regulations. Texas and New Mexico have both enacted regulations governing the handling, treatment, storage and disposal of NORM. In addition, NORM handling and management activities are governed by regulations promulgated by the federal Occupational Safety and Health Act (“OSHA”). These state and OSHA regulations impose certain requirements concerning worker protection, the treatment, storage and disposal of NORM waste, the management of waste piles, containers and tanks containing NORM, as well as restrictions on the uses of land with NORM contamination.
We currently own or lease properties where crude oil is being or has been handled for many years. Although previous operators have utilized operating and disposal practices that were standard in the industry at the time, crude oil or other wastes may have been disposed of or released on or under the properties owned or leased by us or on or under the other locations where the crude oil and wastes have been transported for treatment or disposal. These properties and the wastes disposed or released thereon may be subject to CERCLA, RCRA and analogous state laws. Under these laws, we could be required to remove or remediate previously disposed wastes (including wastes disposed of or released by prior owners or operators), to clean up contaminated property (including contaminated groundwater) or to implement remedial measures to prevent or mitigate future contamination. We are not currently aware of any facts, events or conditions relating to such requirements that could materially impact our consolidated results of operations or financial position.
Oil Pollution Prevention. In 1973, the EPA adopted oil pollution prevention regulations under the CWA. These oil pollution prevention regulations, as amended several times since their original adoption, require the preparation of a Spill Prevention Control and Countermeasure (“SPCC”) plan for facilities engaged in drilling, producing, gathering, storing, processing, refining, transferring, distributing, using, or consuming crude oil and oil products, and which due to their location, could reasonably be expected to discharge oil in harmful quantities into or upon the navigable waters of the United States. SPCC requirements under the CWA require appropriate containment berms and similar structures to help prevent the discharge of pollutants into regulated waters in the event of a crude oil or other constituent tank spill, rupture or leak. The owner or operator of an SPCC-regulated facility is required to prepare a written, site-specific SPCC plan, which details how a facility’s operations comply with the spill prevention and control requirements. To be in compliance, the facility’s SPCC plan must satisfy all of the applicable requirements for drainage, bulk storage tanks, tank car and truck loading and unloading, transfer operations (intra-facility piping), inspections and records, security, and training. Most importantly, the facility must fully implement the SPCC plan and train personnel in its execution. Where applicable, we strive to maintain and implement SPCC
plans for our facilities. Violation of SPCC requirements could subject us to monetary penalties, injunctions, conditions or restrictions on operations and, potentially, criminal enforcement actions.
Air Emissions. Our operations are subject to the CAA and comparable state and local laws and regulations, which regulate emissions of air pollutants from various industrial sources and mandate certain permitting, monitoring, recordkeeping and reporting requirements. Under a delegation of authority from the EPA, most states administer some or all of the provisions of the CAA, sometimes in conjunction with their own, more stringent requirements. The CAA and its implementing regulations on the federal and state level may require that we obtain permits prior to the construction, modification or operation of certain projects or facilities expected to emit or increase air emissions above certain threshold levels, that we obtain and strictly comply with air permits containing emissions and operational limitations, or utilize specific emission control technologies to limit emissions, any of which could impose significant costs on our business. Violation of CAA requirements could subject us to monetary penalties, injunctions, conditions or restrictions on operations and, potentially, criminal enforcement actions. Furthermore, we may make certain future capital expenditures for air pollution control equipment in connection with obtaining and maintaining operating permits and approvals for air emissions.
Water Discharges. The CWA and analogous state laws impose restrictions and strict controls regarding the discharge of pollutants into state waters as well as navigable waters, defined as waters of the United States (“WOTUS”), and impose requirements affecting our ability to conduct construction activities in waters and wetlands. Certain state regulations and the general permits issued under the CWA’s National Pollutant Discharge Elimination System program prohibit the discharge of pollutants and chemicals. The CWA prohibits the placement of dredge or fill material in wetlands or other WOTUS unless authorized by a permit issued by the U.S. Army Corps of Engineers or a delegated state agency pursuant to Section 404. In addition, the CWA and analogous state laws require individual permits or coverage under general permits for discharges of storm water runoff from certain types of facilities. We maintain a number of discharge permits, some of which may require us to monitor and sample storm water runoff from such facilities. Some states also maintain groundwater protection programs that require permits for discharges or operations that may impact groundwater conditions. Federal and state regulatory agencies can impose administrative, civil and criminal penalties for non-compliance with discharge permits or other requirements of the CWA and analogous state laws and regulations.
Underground Injection Control. The underground injection of crude oil and natural gas wastes is regulated by the Underground Injection Control (“UIC”) Program, as authorized by the Safe Drinking Water Act, as well as by state programs focused on the conservation of hydrocarbon resources. The primary objective of injection well operating requirements is to ensure the mechanical integrity of the injection apparatus and to prevent migration of fluid from the injection zone into underground sources of drinking water, as well as to prevent communication between injected fluids and zones capable of producing hydrocarbons. The Safe Drinking Water Act establishes requirements for permitting, testing, monitoring, record keeping, and reporting of injection well activities, as well as a prohibition against the migration of fluid containing any contaminant into underground sources of drinking water. Any leakage from the subsurface portions of the injection wells could cause degradation of fresh groundwater resources, potentially resulting in suspension of our UIC permits, issuance of fines and penalties from governmental agencies, incurrence of expenditures for remediation of the affected resource and imposition of liability by third parties for property damages and personal injuries.
Under the auspices of the federal UIC program as implemented by states with UIC primacy, regulators, particularly at the state level, are becoming increasingly sensitive to possible correlations between underground injection and seismic activity. Consequently, state regulators implementing both the federal UIC program and state corollaries are heavily scrutinizing the location of injection facilities relative to faulting and are limiting both the density or injection facilities as well as the rate and volume of injection.
Hydraulic Fracturing. Hydraulic fracturing involves the injection of water, sand, and chemicals under pressure into the formation to stimulate oil and gas production. We do not conduct any hydraulic fracturing activities. However, a portion of our customers’ crude oil and natural gas production is developed from unconventional sources that require hydraulic fracturing as part of the completion process, and our Water Solutions segment treats and disposes of produced water generated from crude oil and natural gas production, including production employing hydraulic fracturing. Legislation to amend the Safe Drinking Water Act to repeal the exemption for hydraulic fracturing from the definition of underground injection and require federal permitting and regulatory control of hydraulic fracturing, as well as legislative proposals to require disclosure of the chemical constituents of the fluids used in the fracturing process, have been proposed in recent sessions of Congress. Congress will likely continue to consider legislation to amend the Safe Drinking Water Act to subject hydraulic fracturing operations to regulation under the Act’s UIC program and/or require disclosure of chemicals used in the hydraulic fracturing process. Federal agencies, including the EPA and the United States Department of the Interior, have asserted their regulatory authority to, for example, study the potential impacts of hydraulic fracturing on the environment, and initiate rulemakings to compel disclosure of the chemicals used in hydraulic fracturing operations, and establish pretreatment standards and effluent limitation guidelines for produced
water from hydraulic fracturing operations. In addition, some states and local governments have also proposed or adopted legislative or regulatory restrictions on hydraulic fracturing, which include additional permit requirements, public disclosure of fracturing fluid contents, operational restrictions, and/or temporary or permanent bans on hydraulic fracturing. We expect that scrutiny of hydraulic fracturing activities will continue in the future.
Endangered Species. The Endangered Species Act (“ESA”) restricts activities that may affect endangered or threatened species or their habitats. Similar protections are offered to migratory birds under the federal Migratory Bird Treaty Act (“MBTA”) and the Bald and Golden Eagle Protection Act (“BGEPA”). To the degree that species listed under the ESA or similar state laws, or are protected under the MBTA or BGEPA, live, breed or nest in or migrate through the areas where we or our oil and gas producing customers operate, our and our customers’ abilities to conduct or expand operations and construct facilities could be limited or be forced to incur material additional costs. Moreover, our customers’ drilling activities may be delayed, restricted, or cancelled in protected habitat areas or during certain seasons, such as breeding and nesting seasons. Some of our operations and the operations of our customers are located in areas that are designated as habitats for protected species. In addition, the U.S. Fish and Wildlife Service (“USFWS”) may make determinations on the listing of currently unlisted species as endangered or threatened under the ESA. For example, on July 3, 2023, the USFWS proposed that the dunes sagebrush lizard, which is found in areas where we operate, be listed as endangered under the ESA. In addition, the lesser prairie-chicken, which can also be found in areas where we operate, was listed under the ESA effective March 27, 2023. The designation of previously unidentified endangered or threatened species could indirectly cause us to incur additional costs, cause our or our oil and gas producing customers’ operations to become subject to operating restrictions or bans and limit future development activity in affected areas. The USFWS and similar state agencies may also designate critical or suitable habitat areas that they believe are necessary for the survival of threatened or endangered species. Such a designation could materially restrict use of or access to federal, state, and private lands.
Greenhouse Gas Regulation
There is a growing concern, both nationally and internationally, about climate change and the contribution of greenhouse gas (“GHG”) emissions, most notably methane and carbon dioxide, to climate change. This growing concern has resulted in a steady stream of legislation considered by Congress to address climate change through a variety of mechanisms, including carbon taxes and carbon cap-and-trade programs. For example, in February 2021, the Climate Emergency Act of 2021 was introduced in the House of Representative by Rep. Earl Blumenauer (D-OR) as H.R. 795 and in the Senate by Sen. Bernie Sanders (I-VT), which would require the President of the United States to declare a national climate emergency and take various actions to address climate change. The ultimate outcome of any possible future federal legislative initiatives is uncertain. In addition, several states have already adopted legal measures to reduce emissions of GHGs, primarily through the planned development of GHG emission inventories and/or regional GHG cap-and-trade programs. For example, on October 7, 2023, California Governor Gavin Newsome signed SB 253, the Climate Corporate Data Accountability Act, and SB 261, the Climate-Related Financial Risk Act. These two bills apply to companies doing business in California and require disclosure of, amongst certain other climate-related financial risk information, scope 1 and 2 GHG emissions, beginning in 2026 (on prior fiscal year information), and scope 3 GHG emissions, beginning in 2027 (on prior fiscal year information).
On December 15, 2009, the EPA published its findings that emissions of carbon dioxide, methane and other GHGs present an endangerment to public health and the environment because emissions of such gases are, according to the EPA, contributing to warming of the earth’s atmosphere and other climatic changes. These findings allowed the EPA to adopt and implement regulations to restrict emissions of GHGs under existing provisions of the CAA. During the Obama Administration, the EPA finalized three rules that regulate GHG emissions from certain sources in the oil and natural gas industry, including New Source Performance Standards for the Oil and Natural Gas Sector (“GHG NSPS”), which became effective on August 2, 2016. During the Trump Administration, rulemaking was undertaken resulting in a substantial relaxation in the GHG NSPS’s requirements, including those relating to fugitive emissions, pneumatic pump standards, and closed vent system certification, among other things, which were finalized on August 13, 2020. The Biden Administration announced its intention to review the revisions to the GHG NSPS in President Biden’s January 20, 2021 Executive Order on Protecting Public Health and the Environment and Restoring Science to Tackle the Climate Crisis. On November 15, 2021, the EPA issued a proposal to revise the GHG NSPS regulations. On December 2, 2023, the EPA issued its final rule, which targets the reduction of emissions of methane and other air pollutants from oil and gas operations. Specifically, the rule establishes New Source Performance Standards to reduce emissions of methane and other volatile organic compounds from new and modified sources, including produced water storage tanks. The rule became effective May 7, 2024 and requires monitoring and repair of methane leaks and certain reporting requirements.
On March 6, 2024, the Securities and Exchange Commission (“SEC”) adopted a new set of rules that require a wide range of climate-related disclosures, including material climate-related risks, information on any climate-related targets or goals that are material to the registrant’s business, results of operations, or financial condition, Scope 1 and Scope 2 GHG emissions
on a phased-in basis by certain larger registrants when those emissions are material and the filing of an attestation report covering the same, and disclosure of the financial statement effects of severe weather events and other natural conditions including costs and losses. Compliance dates under the final rule are phased in by registrant category. Multiple lawsuits have been filed challenging the SEC’s new climate rules, which have been consolidated and will be heard in the U.S. Court of Appeals for the Eighth Circuit. On April 4, 2024, the SEC issued an order staying the final rules until judicial review is complete.
Some scientists have suggested climate change could increase the severity of extreme weather, such as increased hurricanes and floods, which could damage our facilities. Another possible consequence of climate change is increased volatility in seasonal temperatures. The market for our natural gas liquids is generally improved by periods of colder weather and impaired by periods of warmer weather, so any changes in climate could affect the market for our products and services. If there is an overall trend of warmer temperatures, it would be expected to have an adverse effect on our business.
Because propane is considered a clean alternative fuel under the CAA, new climate change regulations may provide us with a competitive advantage over other sources of energy, such as fuel oil and coal.
The trend of more expansive and stringent environmental legislation and regulations, including GHG regulation and regulations relating to climate change, could continue, resulting in increased costs of conducting business and consequently affecting our profitability. To the extent laws are enacted or other governmental action is taken that restricts certain aspects of our business or imposes more stringent and costly operating, waste handling, disposal and cleanup requirements, our business and prospects could be adversely affected.
Safety and Transportation
All states in which we operate have adopted fire safety codes that regulate the storage and distribution of propane and distillates. In some states, state agencies administer these laws, while in other states, municipalities administer these laws. We conduct training programs to help ensure that our operations comply with applicable governmental regulations. With respect to general operations, each state in which we operate adopts National Fire Protection Association, Pamphlet Nos. 54 and 58, or comparable regulations, which establish rules and procedures governing the safe handling of propane, and Pamphlet Nos. 30, 30A, 31, 385, and 395 which establish rules and procedures governing the safe handling of distillates, such as fuel oil. We believe that the policies and procedures currently in effect at all of our facilities for the handling, storage and distribution of propane and distillates and related service and installation operations are consistent with industry standards and are in compliance in all material respects with applicable environmental, health and safety laws.
With respect to the transportation of propane, distillates, crude oil, and water, we are subject to regulations promulgated under federal legislation, including the Federal Motor Carrier Safety Act and the Homeland Security Act of 2002. Regulations under these statutes cover the security and transportation of hazardous materials and are administered by the United States Department of Transportation (“DOT”). Specifically, crude oil pipelines are subject to regulation by the DOT, through the Pipeline and Hazardous Materials Safety Administration (“PHMSA”), under the Hazardous Liquid Pipeline Safety Act of 1979 (“HLPSA”), which requires the PHMSA to develop, prescribe, and enforce minimum federal safety standards for the storage and transportation of hazardous liquids and comparable state statutes with respect to design, installation, testing, construction, operation, replacement and management of pipeline facilities. HLPSA covers petroleum and petroleum products and requires any entity that owns or operates pipeline facilities to comply with such regulations, to permit access to and copying of records and to file certain reports and provide information as required by the United States Secretary of Transportation. These regulations include potential fines and penalties for violations.
The Pipeline Safety Act of 1992 added the environment to the list of statutory factors that must be considered in establishing safety standards for hazardous liquid pipelines, established safety standards for certain “regulated gathering lines,” and mandated that regulations be issued to establish criteria for operators to use in identifying and inspecting pipelines located in high consequence areas (“HCAs”), defined as those areas that are unusually sensitive to environmental damage, that cross a navigable waterway, or that have a high population density. In the Pipeline Inspection, Protection, Enforcement, and Safety Act of 2006, Congress required mandatory inspections for certain United States crude oil and natural gas transmission pipelines in HCAs and mandated that regulations be issued for low-stress hazardous liquid pipelines and pipeline control room management. In January 2012, the federal government passed the Pipeline Safety, Regulatory Certainty, and Job Creation Act of 2011 (“2011 Pipeline Safety Act”). This act provides for additional regulatory oversight of the nation’s pipelines, increases the penalties for violations of pipeline safety rules, and complements the DOT’s other initiatives. The 2011 Pipeline Safety Act increased the maximum fine for the most serious pipeline safety violations involving deaths, injuries or major environmental harm from $1 million to $2 million. In addition, this law established additional safety requirements for newly constructed pipelines. The law also provides for (i) additional pipeline damage prevention measures; (ii) allowing the Secretary of
Transportation to require automatic and remote-controlled shut-off valves on new pipelines; (iii) requiring the Secretary of Transportation to evaluate the effectiveness of expanding pipeline integrity management and leak detection requirements; (iv) improving the way the DOT and pipeline operators provide information to the public and emergency responders; and (v) reforming the process by which pipeline operators notify federal, state and local officials of pipeline accidents. In recent years, Congress has strengthened the PHMSA’s safety authority and repeatedly extended it, most recently in the Protecting our Infrastructure of Pipelines and Enhancing Safety Act of 2020.
Railcar Regulation
We transport a significant portion of our natural gas liquids and biodiesel via rail transportation, and we own and/or lease a fleet of crude oil, high-pressure and general purpose railcars for this purpose. Our railcar operations are subject to the regulatory jurisdiction of the Federal Railroad Administration of the DOT, as well as other federal and state regulatory agencies.
The adoption of additional federal, state or local laws or regulations, including any voluntary measures by the rail industry regarding railcar design or transport activities, or efforts by local communities to restrict or limit rail traffic, could similarly affect our business by increasing compliance costs and decreasing demand for our services, which could adversely affect our financial position and cash flows.
Occupational Health Regulations
The workplaces associated with our manufacturing, processing, terminal, disposal, storage and distribution facilities are subject to the requirements of OSHA and comparable state statutes. We believe we have conducted our operations in substantial compliance with OSHA requirements, including general industry standards, record keeping requirements and monitoring of occupational exposure to regulated substances. In general, we expect to increase our expenditures relating to compliance with likely higher industry and regulatory safety standards such as those described above. Although these expenditures cannot be accurately estimated at this time, we do not expect compliance with these standards to have a material adverse effect on our business.
Available Information on our Website
Our website address is www.nglenergypartners.com. We make available on our website, free of charge, the periodic reports that we file with or furnish to the SEC, as well as all amendments to these reports, as soon as reasonably practicable after such reports are filed with or furnished to the SEC. The information contained on, or connected to, our website is not incorporated by reference into this Annual Report and should not be considered part of this or any other report that we file with or furnish to the SEC.
In addition, the SEC maintains an internet site (www.sec.gov) that contains reports, proxy and information statements and other information related to issuers that file electronically with the SEC.
Item 1A. Risk Factors
The nature of our business activities subjects us to a wide variety of hazards and risks. The following is a summary and a description of the material risks relating to our business activities that we have identified. In addition to the factors discussed elsewhere in this Annual Report, you should carefully consider the risks and uncertainties described below, which could have a material adverse effect on our business, financial condition or results of operations, including our ability to generate cash to fund our operations, repay indebtedness and pay distributions. You should also consider the interrelationship and potential compounding effects if multiple risks are realized. These risks are not the only risks that we face. Our business could be impacted by additional risks and uncertainties not currently known or that we currently believe to be immaterial.
Risk Factor Summary
Risks Related to Liquidity and Financing
•We may not have sufficient cash, which depends on cash flow rather than profitability, to enable us to fund our operations, repay indebtedness or pay distributions.
•Our substantial indebtedness and restrictions contained in our debt and preferred unit agreements may limit our flexibility to obtain financing to pursue other business opportunities and restrict our current and future operations.
•Increasing interest rates could impact our financing costs, common unit price, distributions on our preferred units and our ability to issue equity and incur debt.
•Failure of our banking institutions.
Risks Related to the Operations of Our Business
•Our dependence on the ability and willingness of other parties to explore for and produce crude oil and natural gas.
•Declining demand for hydrocarbons, commodity prices and production volumes, inventory risk, the availability of transportation and storage capacity, and increased transportation and leasing costs.
•Competition from other midstream, transportation, and terminaling and storage companies.
•Interruption of service at our principal storage facilities or on common carrier pipelines or railroads.
•Fees charged to customers for products and services may not cover increases in costs.
•Risk management procedures and the use of derivative financial instruments.
•Reduced demand for our products due to energy efficiency, new technologies, alternative energy sources and new regulations.
•Seasonal weather conditions, including warm winter weather and natural or man-made disasters.
•Our ability to successfully complete, integrate and operate accretive acquisitions and organic growth projects.
•Constructing new transportation systems and facilities subjects us to construction risks.
•Opposition from various groups to the operation of our pipelines and facilities.
•Our dependence on the leadership, involvement and retention of key and qualified personnel.
Risks Related to Regulatory Compliance
•Impact of executive orders and federal, state, provincial and local laws and regulations with respect to environmental, including climate change, safety and other regulatory matters, including initiatives relating to our hydraulic fracturing customers and saltwater disposal wells.
•FERC jurisdiction over our current and potential future operations.
•Governmental regulation and other legal obligations related to privacy, data protection, and data security.
•Regulations related to cross-border operations.
Risks Related to Our Partnership Structure and an Investment in Us
•Our amended and restated limited partnership agreement (“Partnership Agreement”) limits the fiduciary duties of our GP to our unitholders and restricts the remedies available to our unitholders.
•Conflicts of interest by our GP and its affiliates.
•Our unitholders have limited voting rights.
•Control of our GP or the IDRs (as defined herein) may be transferred to a third party.
•Our GP has a limited call right that may require our unitholders to sell their common units at an undesirable time or price.
•Our Partnership Agreement requires that we distribute all of our available cash.
•We may issue additional units without the approval of our unitholders.
•Our GP may elect to cause us to issue common units while also maintaining its GP interest in connection with a resetting of the target distribution levels related to its IDRs.
•Our unitholders liability may not be limited if a court finds that unitholder action constitutes control of our business.
•Our unitholders may have liability to repay distributions that were wrongfully distributed to them.
•The Preferred Units (as defined herein) give the holders thereof liquidation and distribution preferences over our common unitholders.
•The issuance of common units upon exercise of certain warrants would cause dilution to existing common unitholders.
Tax Risks to Our Unitholders
•Our tax treatment depends on our status as a partnership for federal income tax purposes.
•Our unitholders may be subject to limitation on their ability to deduct interest expense incurred by us.
•Additional entity-level taxation by individual states.
•The tax treatment of publicly traded partnerships could be subject to potential changes or interpretations.
•The IRS (as defined herein) may challenge certain income tax positions, methodologies or treatments that we have taken, and pursuant to the Bipartisan Budget Act of 2015, may make audit adjustments to our income tax returns for tax years beginning after 2019.
•Our unitholders will be required to pay taxes on their share of our income even if they do not receive any cash distributions from us.
•Certain action we take, such as issuing additional units, may increase a unitholder’s tax liability.
•Tax gain or loss on the disposition of our common units could be more or less than expected.
•Tax exempt entities and non-United States persons owning our common units face unique tax issues.
•We have subsidiaries that are treated as corporations for federal income tax purposes and subject to corporate level income taxes.
•A unitholder whose common units are loaned to a “short seller” to effect a short sale of units may be considered as having disposed of those common units.
•There are limits on the deductibility of our losses that may adversely affect our unitholders.
•Purchasers of our common units may become subject to state and local taxes and return filing requirements in jurisdictions where we operate or own or acquire properties.
•Treatment of distributions on our Preferred Units as guaranteed payments for the use of capital creates a different tax treatment for the holders of Preferred Units than the holders of our common units.
General Risks
•The default by significant customers and counterparties or the loss of one or more significant customers.
•Failure to maintain an effective system of internal control, including internal control over financial reporting.
•Pandemics, terrorism and political unrest.
•Product liability claims and litigation.
•A failure in our operational systems or cybersecurity attacks on any of our facilities, or those of third parties.
Risks Related to Liquidity and Financing
We may not have sufficient cash to enable us to fund our operations, repay indebtedness or pay distributions to our unitholders following the establishment of cash reserves by our GP and the payment of costs and expenses, including reimbursement of expenses to our GP.
We may not have sufficient cash to enable us to fund our operations, repay indebtedness or pay distributions. The distribution to our common unitholders may only be made from cash available for distribution after the preferred quarterly distribution to which our Preferred Units are entitled. The amount of cash we will have to fund our operations, repay indebtedness or pay distributions principally depends on the amount of cash we generate from our operations, not profitability, which will fluctuate from quarter to quarter based on, among other things:
•the cost of crude oil, natural gas liquids, gasoline, diesel, and biodiesel that we buy for resale and whether we are able to pass along cost increases to our customers;
•the volume of produced water delivered to our processing facilities;
•disruptions in the availability of crude oil and/or natural gas liquids supply;
•our ability to renew leases for storage and railcars;
•the effectiveness of our commodity price hedging strategy;
•weather conditions across the United States;
•the level of competition from other energy providers; and
•prevailing economic conditions.
In addition, the actual amount of cash we will have available to fund our operations, repay indebtedness or pay distributions also depends on other factors, some of which are beyond our control, including:
•fluctuations in working capital needs;
•the level of capital expenditures we make;
•the cost of acquisitions, if any;
•restrictions contained in the ABL Facility, Term Loan B and the indenture governing our 2029 Senior Secured Notes and 2032 Senior Secured Notes (collectively, the “Indenture”);
•restrictions contained in the agreements relating to our 9.00% Class B Fixed-to-Floating Rate Cumulative Redeemable Perpetual Preferred Units (“Class B Preferred Units”), 9.625% Class C Fixed-to-Floating Rate Cumulative Redeemable Perpetual Preferred Units (“Class C Preferred Units”) and 9.00% Class D Preferred Units (“Class D Preferred Units”) (collectively, the “Preferred Units”);
•our ability to borrow funds and access capital markets;
•the amount, if any, of cash reserves established by our GP; and
•other business risks discussed in this Annual Report that may affect our cash levels.
The board of directors of our GP expects to evaluate the reinstatement of the common unit distributions in due course, taking into account a number of important factors, including our leverage, liquidity, the sustainability of cash flows, capital expenditures and the overall performance of our businesses. The quarterly common unit distributions were suspended with the quarter ended December 31, 2020.
Our substantial indebtedness may limit our flexibility to obtain financing and to pursue other business opportunities and our ability to service our debt could impact operations.
At March 31, 2024, the face amount of our long-term debt was $2.9 billion. Our level of indebtedness could have important consequences to us, including the following:
•our ability to obtain additional financing, if necessary, for working capital, capital expenditures, acquisitions or other purposes may be impaired or such financing may not be available on favorable terms;
•our funds available for operations and future business opportunities will be reduced by that portion of our cash flow required to make principal and interest payments on our debt;
•lower availability under the ABL Facility caused by a higher level of borrowings on the ABL Facility could make it more likely that a reduction in our borrowing base following a periodic redetermination could require us to repay a portion of our then-outstanding ABL Facility borrowings;
•we may be more vulnerable to competitive pressures or a downturn in our business or the economy generally;
•our flexibility in responding to changing business and economic conditions may be limited; and
•it may make it more difficult for us to satisfy our debt obligations and increase the risk that we may default on our debt obligations.
Our ability to service our debt will depend on, among other things, our future financial and operating performance, which will be affected by prevailing economic and weather conditions, and financial, business, regulatory and other factors, some of which are beyond our control. If our operating results are not sufficient to service our future indebtedness, we would be forced to take actions such as reducing or delaying our business activities, acquisitions, investments or capital expenditures, selling assets or seeking additional equity capital. We may be unable to effect any of these actions on satisfactory terms or at all. The agreements governing our indebtedness permit us to incur additional debt under certain circumstances, and we may need to incur additional debt in order to implement our growth strategy. We may experience adverse consequences from increased levels of debt.
Our leverage could have important consequences to our debt obligations. We will require substantial cash flow to meet our principal and interest obligations with respect to our debt obligations. Our ability to make scheduled payments, to refinance our obligations with respect to our indebtedness or our ability to obtain additional financing in the future will depend on our financial and operating performance, which, in turn, is subject to prevailing economic conditions and to financial, business and other factors. We may not have sufficient cash flow from operations and available borrowings under the ABL Facility to service
our indebtedness. A significant downturn in our business or other development adversely affecting our cash flow could materially impair our ability to service our indebtedness. If our cash flow and capital resources are insufficient to fund our debt service obligations, we may be forced to refinance all or a portion of our debt or sell assets. We cannot assure you that we would be able to refinance our existing indebtedness or sell assets on terms that are commercially reasonable.
Restrictions in the ABL Facility, Term Loan B and Indenture could adversely affect our business, financial position, results of operations, and the value of our common units.
The ABL Facility, Term Loan B and Indenture limit our ability to, among other things:
•incur additional debt or issue letters of credit;
•redeem or repurchase units;
•make certain loans, investments and acquisitions;
•incur certain liens or permit them to exist;
•engage in sale and leaseback transactions;
•enter into certain types of transactions with affiliates;
•enter into agreements limiting subsidiary distributions;
•change the nature of our business or enter into a substantially different business;
•merge or consolidate with another company; and
•transfer or otherwise dispose of assets.
We will be permitted to make distributions to our unitholders once we meet certain defined metrics and as long as no default or event of default exists both immediately before and after giving effect to the declaration and payment of the distribution and the distribution does not exceed available cash for the applicable quarterly period.
The provisions of the ABL Facility, Term Loan B and Indenture may affect our ability to obtain future financing and pursue attractive business opportunities and our flexibility in planning for, and reacting to, changes in business conditions. In addition, a failure to comply with the provisions of these agreements could result in a default or an event of default that could enable our lenders, subject to the terms and conditions, to declare the outstanding principal of that debt, together with accrued and unpaid interest, to be immediately due and payable. If we were unable to repay the accelerated amounts, our lenders could proceed against the collateral we granted them to secure our debts under our 2029 Senior Secured Notes, 2032 Senior Secured Notes, ABL Facility and Term Loan B. If the payment of our debt is accelerated, defaults under our other debt instruments, if any then exist, may be triggered, and our assets may be insufficient to repay such debt in full, and our unitholders could experience a partial or total loss of their investment.
The Partnership may be required by Class D Preferred Unitholders to redeem all or a portion of the Class D Preferred Units, which could require a substantial amount of cash.
At any time on or after July 2, 2027, each Class D Preferred Unitholder will have the right to require the Partnership to redeem on a date not prior to the 180th day after July 2, 2027 all or a portion of the Class D Preferred Units then held by such preferred unitholder for the then-applicable redemption price, which may be paid in cash or, at the Partnership’s election, a combination of cash and a number of common units not to exceed one-half of the aggregate then-applicable redemption price, as more fully described in our Partnership Agreement. Furthermore, upon a Class D Change of Control (as defined in our Partnership Agreement), each Class D Preferred Unitholder will have the right to require the Partnership to redeem the Class D Preferred Units then held by such Preferred Unitholder at a price per Class D Preferred Unit equal to the applicable redemption price. We cannot assure you that we will have sufficient cash flow, liquidity or the ability to incur indebtedness or sell assets on terms that are commercially reasonable in order to redeem the Class D Preferred Units, even if required to do so. In addition, we may seek to address the outstanding balances on the Class D Preferred Units prior to when they are required to be redeemed, which may impact our ability to service our indebtedness.
Increasing interest rates could impact our financing costs and our common unit price, our ability to issue equity or incur debt, and our ability to make cash distributions at our intended levels.
Interest rates may increase in the future. As a result, interest rates on our existing and future credit facilities and debt offerings could be higher than current levels, causing our financing costs to increase accordingly. We also have exposure to increases in interest rates through variable rate provisions of our Class B Preferred Units, Class C Preferred Units and Class D Preferred Units. In addition, the distribution rates on our Class C Preferred Units converted from fixed rates to floating rates on April 15, 2024, while on or after July 1, 2024, the holders of our Class D Preferred Units can elect, from time to time, for the distributions to be calculated based on a floating rate. Our results of operations, cash flows and financial position could be materially adversely affected by significant changes in interest rates.
Moreover, the market price of our common units, like with other yield-oriented securities, may be impacted by our level of cash distributions and implied distribution yield. The distribution yield is often used by investors to compare and rank yield-oriented securities for investment decision-making purposes. Therefore, increases or decreases in interest rates may affect the yield requirements of investors who invest in our common units. A rising interest rate environment could have an adverse impact on our common unit price and our ability to issue equity or incur debt for acquisitions or other purposes and could affect our ability to make payments on our debt obligations and cash distributions at our intended levels.
Our cash and cash equivalents may be exposed to failure of our banking institutions.
While we seek to minimize our exposure to third-party losses of our cash and cash equivalents, we hold our balances in several large banking institutions. Notwithstanding such allocation, we are subject to the risk of bank failure. For example, on March 10, 2023, Silicon Valley Bank (“SVB”) was unable to continue its operations and the Federal Deposit Insurance Corporation was appointed as receiver for SVB and created the National Bank of Santa Clara to hold the deposits of SVB. None of our cash and cash equivalents were held at SVB. However, if the banking institutions where we hold deposits were to experience a similar failure, we could experience additional risk. Any such loss or limitation on our cash and cash equivalents would adversely affect our business.
Risks Related to the Operations of Our Business
Our business depends on the availability of crude oil, natural gas liquids, and refined products in the United States and Canada, which is dependent on the ability and willingness of other parties to explore for and produce crude oil and natural gas. Spending on crude oil and natural gas exploration and production may be adversely affected by industry and financial market conditions that are beyond our control.
Our business depends on domestic spending by the oil and natural gas industry, and this spending and our business have been, and may continue to be, adversely affected by industry and financial market conditions and existing or new regulations, such as those related to environmental matters, which are beyond our control.
We depend on the ability and willingness of other entities to make operating and capital expenditures to explore for, develop, and produce crude oil and natural gas in the United States and Canada, and to extract natural gas liquids from natural gas, as well as the availability of necessary pipeline transportation and storage capacity. Customers’ expectations of lower market prices for crude oil and natural gas, as well as the availability of capital for operating and capital expenditures, may cause them to curtail spending, thereby reducing business opportunities and demand for our services and equipment. Actual market conditions and producers’ expectations of market conditions for crude oil and natural gas liquids may also cause producers to curtail spending, thereby reducing business opportunities and demand for our services.
Industry conditions are influenced by numerous factors over which we have no control, such as the availability of commercially viable geographic areas in which to explore and produce crude oil and natural gas, the availability of liquids-rich natural gas needed to produce natural gas liquids, the supply of and demand for crude oil and natural gas, environmental restrictions on the exploration and production of crude oil and natural gas, such as existing and proposed regulation of hydraulic fracturing, domestic and worldwide economic conditions, political instability in crude oil and natural gas producing countries and merger and divestiture activity among our current or potential customers. The volatility of the oil and natural gas industry and the resulting impact on exploration and production activity could adversely impact the level of drilling activity. This reduction may cause a decline in business opportunities or the demand for our services, or adversely affect the price of our services. Reduced discovery rates of new crude oil and natural gas reserves in our market areas also may have a negative long-term impact on our business, even in an environment of stronger crude oil and natural gas prices, to the extent existing production is not replaced.
The crude oil and natural gas production industry tends to run in cycles and may, at any time, cycle into a downturn; if that occurs, the rate at which it returns to former levels, if ever, will be uncertain. Prior adverse changes in the global economic environment and capital markets and declines in prices for crude oil and natural gas have caused many customers to reduce capital budgets for future periods and have caused decreased demand for crude oil and natural gas. Limitations on the availability of capital, or higher costs of capital, for financing expenditures have caused and may continue to cause customers to make additional reductions to capital budgets in the future even if commodity prices increase from current levels. These cuts in spending may curtail drilling programs and other discretionary spending, which could result in a reduction in business opportunities and demand for our services, the rates we can charge and our utilization. In addition, certain of our customers could become unable to pay their suppliers, including us. Any of these conditions or events could materially and adversely affect our consolidated results of operations and in addition to impacting our business, financial condition and results of operations could require us to incur impairment charges against the associated assets or the write down of our goodwill.
Declining crude oil prices and crude production volumes could adversely impact our Water Solutions and Crude Oil Logistics segments.
The volume of water we process and crude oil we transport is driven in large part by the level of crude oil production in the areas in which we operate. Lower crude oil prices provide the producers with less incentive to spend on capital expenditures, which results in fewer drilling rigs and lower amounts of crude oil production, which negatively impacts our crude oil transportation and produced water disposal volumes. In addition, a portion of our profitability in our Water Solutions segment is generated from the sale of crude oil that we recover when processing produced water, and lower crude oil prices have an adverse impact on these sales if not hedged. A decline in crude oil prices or a prolonged period of low crude oil prices could have an adverse effect on our businesses.
Our profitability could be negatively impacted by price and inventory risk related to our business.
The Crude Oil Logistics and Liquids Logistics segments are “margin-based” businesses in which our realized margins depend on the differential of sales prices over our supply costs. Our profitability is therefore sensitive to changes in product prices caused by changes in supply, pipeline transportation and storage capacity or other market conditions.
Generally, we attempt to maintain an inventory position that is substantially balanced between our purchases and sales, including our future delivery obligations. We attempt to obtain a certain margin for our purchases by selling our product to our customers, which include third-party consumers, other wholesalers and retailers, and others. However, market, weather or other conditions beyond our control may disrupt our expected supply of product, and we may be required to obtain supply at increased prices that cannot be passed through to our customers. In general, product supply contracts permit suppliers to charge posted prices at the time of delivery or the current prices established at major storage points, creating the potential for sudden and drastic price fluctuations. Sudden and extended wholesale price increases could reduce our margins. Conversely, a prolonged decline in product prices could potentially result in a reduction of the borrowing base under the ABL Facility, and we could be required to liquidate inventory that we have already presold.
One of the strategies of our Liquids Logistics segment is to purchase refined petroleum and renewable products primarily in the Gulf Coast, West Coast and Midwest regions of the United States and schedule them for delivery at various locations throughout the country. We are subject to the risk of a price decline between the time we purchase refined products and the time we sell the products. We seek to mitigate this risk by entering into NYMEX futures contracts. However, price changes in locations where we operate do not correspond directly with changes in prices in the NYMEX futures market, and as a result these futures contracts cannot be perfect hedges of our commodity price risk.
We are affected by competition from other midstream, transportation, and terminaling and storage companies, some of which are larger, more firmly established and may have greater resources than we do.
We experience competition in all of our segments. In our Liquids Logistics segment, we compete for natural gas liquids supplies and also for customers for our services. Our competitors include major integrated oil companies, other midstream or wholesale marketing companies, interstate and intrastate pipelines and companies that gather, compress, treat, process, transport, store and market natural gas. Our natural gas liquids terminals compete with other terminaling and storage providers in the transportation and storage of natural gas liquids. Natural gas and natural gas liquids also compete with other forms of energy, including electricity, coal, fuel oil and renewable or alternative energy. Our Liquids Logistics segment is also seeing increased competition for supply from international markets. We also face significant competition for refined products supplies and customers for those services.
Our Crude Oil Logistics segment faces significant competition for crude oil supplies and customers for our services. These operations also face competition from transportation companies for incremental and marginal volumes in the areas we serve. Further, our crude oil terminals compete with terminals owned by integrated petroleum companies, refining and marketing companies, independent terminal companies and distribution companies with marketing and trading operations.
Our Water Solutions segment is in direct and indirect competition with other businesses, including disposal and other produced water treatment businesses.
We can make no assurance that we will compete successfully in each of our businesses. If a competitor attempts to increase market share by reducing prices, we may lose customers, which would reduce our revenues.
Our business would be adversely affected if service at our principal storage facilities or on common carrier pipelines or railroads we use is interrupted.
We use third-party common carrier pipelines to transport our products and we use third-party facilities to store our products. Any significant interruption in the service at these storage facilities or on common carrier pipelines we use would adversely affect our ability to obtain and deliver products. We transport natural gas liquids and biodiesel by railcar. We do not own or operate the railroads on which these railcars are transported. Any disruptions in the operations of these railroads would adversely impact our ability to deliver product to our customers.
We lease certain facilities and equipment and therefore are subject to the possibility of increased costs to retain necessary land and equipment use.
We do not own all of the land on which our facilities are located, and we are therefore subject to the possibility of more onerous terms and/or increased costs to retain necessary land use if we do not have valid rights-of-way or if our facilities are not properly located within the boundaries of such rights-of-way. Additionally, our loss of rights, through our inability to renew right-of-way contracts or otherwise, could materially and adversely affect our business, consolidated results of operations and financial position.
Additionally, certain facilities and equipment (or parts thereof) used by us are leased from third parties for specific periods, including many of our railcars. Our inability to renew facility or equipment leases or otherwise maintain the right to utilize such facilities and equipment on acceptable terms, or the increased costs to maintain such rights, could have a material and adverse effect on our consolidated results of operations and cash flows.
Our operations depend on various forms of storage and transportation for receipt and delivery of crude oil, natural gas liquids and refined products.
We own natural gas liquids and crude oil terminals and lease storage capacity from third-party natural gas liquids and refined product terminals. The facilities depend on pipelines, railroads, truck transports, and storage systems that are owned and operated by third parties. Any interruption of service at the terminals, or on pipeline, railroad or lateral connections or adverse change in the terms and conditions of services could have a material adverse effect on our ability, and the ability of our customers, to transport product to and from our facilities and have a corresponding material adverse effect on our revenues. In addition, the rates charged by the interconnected pipelines for transportation to and from our facilities impact the utilization and value of our terminals. We have historically been able to pass through the costs of pipeline transportation to our customers. However, if competing pipelines do not have similar annual tariff increases or service fee adjustments, such increases could affect our ability to compete, thereby adversely affecting our revenues.
The fees charged to customers under our agreements with them for the transportation and sale of crude oil, condensate, natural gas liquids, gasoline, diesel, and biodiesel and the disposal of produced water may not escalate sufficiently to cover increases in costs and the agreements may be suspended in some circumstances, which would affect our profitability.
Our costs may increase more rapidly than the fees that we charge to customers pursuant to our contracts with them. Additionally, some customers’ obligations under their agreements with us may be permanently or temporarily reduced upon the occurrence of certain events, some of which are beyond our control, including force majeure events wherein the production of or the supply of crude oil, condensate, and/or natural gas liquids are curtailed or cut off. Force majeure events include (but are not limited to) revolutions, wars, acts of enemies, embargoes, import or export restrictions, strikes, lockouts, fires, storms, floods, acts of God, explosions, mechanical or physical failures of our equipment or facilities of our customers. If the escalation of fees is insufficient to cover increased costs, or if any customer suspends or terminates its contracts with us, our profitability could be materially and adversely affected.
Risk management procedures, including the use of financial derivative contracts, cannot eliminate all commodity price risk, basis risk, or risk of adverse market conditions which can adversely affect our financial position and results of operations. In addition, any non-compliance with our market risk policy could result in significant financial losses.
Pursuant to the requirements of our market risk policy, we attempt to lock in a margin for a portion of the commodities we purchase by selling such commodities for physical delivery to our customers, such as independent refiners or major oil companies, or by entering into future delivery obligations under contracts for forward sale. We also enter into financial derivative contracts, such as futures, to protect against commodity price risk and, as a component of our overall business strategy, we may increase or decrease from time to time our use of such financial derivative contracts in the future. Our use of such financial derivative contracts could cause us to forego the economic benefits we would otherwise realize if commodity prices or interest rates were to change in our favor. Through these transactions, we seek to maintain a position that is substantially balanced between purchases on the one hand, and sales or future delivery obligations on the other hand. These policies and practices cannot, however, eliminate all risks. Although we monitor such activities in our risk management processes and procedures, such activities could result in losses, which could adversely affect our consolidated results of operations and impair our ability to make payments on our debt obligations or distributions to our unitholders. For example, any event that disrupts our anticipated physical supply of commodities could expose us to risk of loss resulting from the need to cover obligations required under contracts for forward sale.
Basis risk describes the inherent market price risk created when a commodity of a certain grade or location is purchased, sold or exchanged as compared to a purchase, sale or exchange of a like commodity at a different time or place. Transportation costs and timing differentials are components of timing risk. In a backwardated market (when prices for future deliveries are lower than current prices), timing risk is created. In these instances, physical inventory generally loses value as the price of such physical inventory declines over time. Timing risk cannot be entirely eliminated, and basis risk exposure, particularly in backwardated or other adverse market conditions, can adversely affect our consolidated financial position and results of operations.
Competition from alternative energy sources, energy efficiency and new technology may reduce the demand for propane and adversely affect our operating results.
Propane competes with other sources of energy, some of which are less costly for equivalent energy value. Competition from alternative energy sources, including electricity, natural gas and renewables, has increased from reduced regulation of many utilities. The gradual expansion of the nation’s natural gas distribution systems has resulted in natural gas being available in areas that previously depended on propane. In addition, the national trend toward increased conservation and technological advances, such as installation of improved insulation and the development of more efficient furnaces and other appliances, has adversely affected the demand for propane. Future expansion of alternative energy sources, conservation measures or technological advances in appliance efficiency, power generation or other devices may reduce demand for propane and cause us to lose customers.
We cannot predict the effect that development of alternative energy sources, increased conservation or new technology may have on our operations, including whether subsidies of alternative energy sources by local, state, and federal governments might be expanded, or what impact this might have on the supply of or the demand for crude oil, natural gas, and natural gas liquids.
The Inflation Reduction Act of 2022 (“IRA”) could impact demand for hydrocarbon fuel products and impose new costs on certain customers.
In August 2022, President Biden signed the IRA, which contains, among other things, numerous incentives for the development of renewable energy, clean hydrogen, clean fuels, electric vehicles and supporting infrastructure and carbon capture and sequestration. In addition, the IRA imposes a federal fee on the emission of methane from sources required to report their GHG emissions to the EPA, including certain sources in the onshore petroleum and natural gas production categories. Some of our producer customers face exposure to the IRA pay to emit methane program. In addition, the multiple incentives offered for various clean energy industries referenced above could decrease demand for crude oil and natural gas, increase our compliance and operating costs and consequently adversely affect our business.
Reduced demand for refined products could have an adverse effect on our results of operations.
Any sustained decrease in demand for refined products in the markets we serve could reduce our cash flow. Factors that could lead to a decrease in market demand include:
•a recession, rising inflation, or other adverse economic conditions that results in lower spending by consumers on gasoline, diesel, and travel;
•higher fuel taxes or other governmental or regulatory actions that increase, directly or indirectly, the cost of gasoline;
•an increase in automotive engine fuel economy, whether as a result of a shift by consumers to more fuel-efficient vehicles or technological advances by manufacturers;
•an increase in the market price of crude oil that leads to higher refined product prices, which may reduce demand for refined products and drive demand for alternative products; and
•the increased use of alternative fuel sources, such as battery-powered engines.
Seasonal weather conditions and natural or man-made disasters could severely disrupt normal operations and have an adverse effect on our business, financial position and results of operations.
We operate in various locations across the United States and Canada which may be adversely affected by seasonal weather conditions and natural or man-made disasters. During periods of heavy snow, ice, rain or extreme weather conditions such as high winds, tornados and hurricanes or after other natural disasters such as earthquakes or wildfires, we may be unable to move our trucks or railcars between locations and our facilities may be damaged, thereby reducing our ability to provide services and generate revenues. In addition, hurricanes or other severe weather in the Gulf Coast region could seriously disrupt the supply of products and cause serious shortages in various areas, including the areas in which we operate. These same conditions may cause serious damage or destruction to homes, business structures and the operations of customers. Such disruptions could potentially have a material adverse impact on our business, consolidated financial position, results of operations and cash flows.
Weather conditions, including warm winters or dry or warm weather in the harvest season, may reduce the demand for propane, which could have a material adverse effect on our results of operations, cash flows, financial condition or liquidity.
Weather conditions have a significant impact on the demand for propane for heating and agriculture purposes. Accordingly, our sales volumes of propane are highest during the winter-heating season of November through March and are directly affected by the temperatures during these months. Actual weather conditions can vary substantially from year to year, which may significantly affect our financial performance or condition. Furthermore, variations in weather in one or more regions in which we operate can significantly affect our total propane sales volume and therefore our financial performance or condition. The agricultural demand for propane is affected by weather, as dry or warm weather during the harvest season may reduce the demand for propane used in some crop drying applications.
Our future financial performance and growth may be limited by our ability to successfully complete accretive acquisitions on economically acceptable terms.
Our ability to complete accretive acquisitions on economically acceptable terms may be limited by various factors, including, but not limited to:
•increased competition for attractive acquisitions;
•covenants in the ABL Facility, Term Loan B and Indenture that limit the amount and types of indebtedness that we may incur to finance acquisitions;
•lack of available cash or external capital or limitations on our ability to issue equity to pay for acquisitions; and
•possible unwillingness of prospective sellers to accept our common units as consideration and the potential dilutive effect to our existing unitholders caused by an issuance of common units in an acquisition.
There can be no assurance that we will identify attractive acquisition candidates in the future, that we will be able to acquire such businesses on economically acceptable terms, that any acquisitions will not be dilutive to earnings and distributions. Furthermore, if we consummate any future acquisitions, our capitalization and results of operations may change
significantly, and unitholders will not have the opportunity to evaluate the economic, financial and other relevant information that we will consider in determining the application of these funds and other resources.
We may be subject to substantial risks in connection with the integration and operation of acquired businesses, in particular, those businesses with operations that are distinct and separate from our existing operations.
Any acquisitions we make in pursuit of our growth strategy are subject to potential risks, including, but not limited to:
•the inability to successfully integrate the operations of recently acquired businesses;
•the assumption of known or unknown liabilities, including environmental liabilities;
•limitations on rights to indemnity from the seller;
•mistaken assumptions about the overall costs of equity, debt or synergies;
•mistaken assumptions about sales volume, margin or operational expenses;
•unforeseen difficulties operating in new geographic areas or in new business segments;
•the diversion of management’s and employees’ attention from other business concerns;
•customer or key employee loss from the acquired businesses; and
•a potential significant increase in our indebtedness and related interest expense.
We undertake due diligence efforts in our assessment of acquisitions, but may be unable to identify or fully plan for all issues and risks associated with a particular acquisition. Even when an issue or risk is identified, we may be unable to obtain adequate contractual protection from the seller. The realization of any of these risks could have a material adverse effect on the success of a particular acquisition or our consolidated financial position, results of operations or future growth.
As part of our growth strategy, we may expand our operations into businesses that differ from our existing operations. Integration of new businesses is a complex, costly and time-consuming process and may involve assets with which we have limited operating experience. Failure to timely and successfully integrate acquired businesses into our existing operations may have a material adverse effect on our business, consolidated financial position or results of operations. In addition to the risks set forth above, new businesses will subject us to additional business and operating risks, such as the acquisitions not being accretive to our unitholders as a result of decreased profitability, increased interest expense related to debt we incur to make such acquisitions or an inability to successfully integrate those operations into our overall business operations. The realization of any of these risks could have a material adverse effect on our consolidated financial position or results of operations.
Growing our business by constructing new transportation systems and facilities subjects us to construction risks and risks that supplies for such systems and facilities will not be available upon completion thereof.
One of the ways we intend to grow our business is through the construction of additions to our systems and/or the construction of new terminaling, transportation, and produced water treatment facilities. These expansion projects require the expenditure of significant amounts of capital, which may exceed our resources, and involve numerous regulatory, environmental, political and legal uncertainties, including political opposition by landowners, environmental activists and others. There can be no assurance that we will complete these projects on schedule or at all or at the budgeted cost. Our revenues may not increase upon the expenditure of funds on a particular project. Moreover, we may undertake expansion projects to capture anticipated future growth in production in a region in which anticipated production growth does not materialize or for which we are unable to acquire new customers. We may also rely on estimates of proved, probable or possible reserves in our decision to undertake expansion projects, which may prove to be inaccurate. As a result, our new facilities and infrastructure may not be able to attract enough product to achieve our expected investment return, which could materially and adversely affect our consolidated results of operations and financial position.
We may face opposition to the operation of our pipelines and facilities from various groups.
We may face opposition to the operation of our pipelines and facilities from environmental groups, landowners, environmental justice communities, tribal groups, local groups and other advocates. Such opposition could take many forms, including the delay or denial of required governmental permits, organized protests, attempts to block or sabotage our operations, intervention in regulatory or administrative proceedings involving our assets, or lawsuits or other actions designed to prevent, disrupt or delay the operation of our assets and business. For example, repairing our pipelines often involves securing consent from individual landowners to access their property; one or more landowners may resist our efforts to make
needed repairs, which could lead to an interruption in the operation of the affected pipeline or facility for a period of time that is significantly longer than would have otherwise been the case. In addition, acts of sabotage or eco-terrorism could cause significant damage or injury to people, property or the environment or lead to extended interruptions of our operations. Moreover, governmental authorities exercise considerable discretion in the timing and scope of permit issuance and the public may engage in the permitting process, including through intervention in the courts. Negative public perception could cause the permits we require to conduct our operations to be withheld, delayed or burdened by requirements that restrict our ability to profitably conduct our business. Any such event that interrupts the revenues generated by our operations, or which causes us to make significant expenditures not covered by insurance, could reduce our cash available for paying distributions to our unitholders and, accordingly, adversely affect our financial condition and the market price of our securities.
Our business plans are based upon the assumption that societal sentiment will continue to enable, and existing regulations will stay intact for, the future development, transportation and use of hydrocarbon-based fuels. Policy decisions relating to the production, refining, transportation and sale of hydrocarbon-based fuels are subject to political pressures, the negative portrayal of the industry in which we operate by the media and others, and the influence and protests of environmental and other special interest groups. Such negative sentiment regarding the hydrocarbon energy industry could influence consumer preferences and government or regulatory actions, which could have an adverse impact on our business.
Recently, activists concerned about the potential effects of climate change have directed their attention towards sources of funding for hydrocarbon energy companies, which has resulted in certain financial institutions, funds and other sources of capital restricting or eliminating their investment in energy-related activities. Ultimately, this could make it more difficult to secure funding for exploration and production activities or energy infrastructure related projects and ongoing operations, and consequently could both indirectly affect demand for our services and directly affect our ability to fund construction or other capital projects, as well as properly run our ongoing operations.
We depend on the leadership and involvement of key personnel for the success of our businesses, and we compete with other businesses to attract and retain qualified personnel.
We have certain key individuals in our senior management who we believe are critical to the success of our business. The loss of leadership and involvement of those key management personnel could potentially have a material adverse impact on our business and possibly on the market value of our common units. Further, we compete with other businesses to attract and retain qualified employees and a tight labor market may cause our labor costs to increase. No assurance can be given that our labor costs will not increase, or that such increases can be recovered through increased prices charged to customers.
Risks Related to Regulatory Compliance
Our sales of crude oil, condensate, natural gas liquids, gasoline, diesel, and biodiesel and related transportation and hedging activities, and our processing of produced water, expose us to potential regulatory risks.
The FTC, the FERC, and the CFTC hold statutory authority to monitor certain segments of the physical and financial energy commodity markets. With regard to our physical sales of energy commodities, and any related transportation and/or hedging activities that we undertake, we are required to observe the market-related regulations enforced by these agencies, which hold substantial enforcement authority. Our sales may also be subject to certain reporting and other requirements. Additionally, some of our operations are currently subject to FERC regulations obligating us to comply with the FERC’s regulations and policies applicable to those assets and operations. Other of our operations may become subject to the FERC’s jurisdiction in the future (see “–Some of our operations are subject to the jurisdiction of the FERC and other operations may become subject in the future,” below). Any failure on our part to comply with the FERC’s regulations and policies at that time could result in the imposition of civil and criminal penalties. Failure to comply with such regulations, as interpreted and enforced, could have a material and adverse effect on our business, consolidated results of operations and financial position.
The intrastate transportation or storage of crude oil and refined products is subject to regulation by the state in which the facilities are located and transactions occur. Compliance with these state regulations could have a material and adverse effect on that portion of our business, consolidated results of operations and financial position.
The Dodd-Frank Wall Street Reform and Consumer Protection Act (“Dodd-Frank Act”) which was enacted on July 21, 2010, established federal oversight and regulation of the over-the-counter derivatives market and of entities, such as us, that participate in that market. The Dodd-Frank Act requires the CFTC and the SEC to promulgate rules and regulations implementing the Dodd-Frank Act. The Dodd-Frank Act provides for statutory and regulatory requirements for derivative transactions, including crude oil, refined and renewable products, and natural gas hedging transactions. Certain transactions will be required to be cleared on exchanges and cash collateral will have to be posted. The Dodd-Frank Act provides for a potential
exemption from these clearing and cash collateral requirements for commercial end users and it includes a number of defined terms that will be used in determining how this exemption applies to particular derivative transactions and the parties to those transactions. Since the Dodd-Frank Act mandates the CFTC to promulgate rules to define these terms, the full impact of the Dodd-Frank Act on our hedging activities is uncertain at this time. The CFTC has also issued new rules, which became effective on March 15, 2021, that place limits on positions in certain core futures and equivalent swaps contracts for or linked to certain physical commodities, subject to exceptions for certain bona fide hedging transactions. However, new legislation and any new regulations could significantly increase the cost of derivative contracts (including through requirements to post collateral which could adversely affect our available liquidity), materially alter the terms of derivative contracts, reduce the availability of derivatives to protect against risks that we encounter, reduce our ability to monetize or restructure our existing derivative contracts, and increase our exposure to less creditworthy counterparties. The Dodd-Frank Act may also materially affect our customers and materially and adversely affect the demand for our services.
Our business is subject to federal, state, provincial and local laws and regulations with respect to environmental, safety and other regulatory matters and the cost of compliance with, violation of or liabilities under, such laws and regulations could adversely affect our profitability.
Our operations, including those involving crude oil, condensate, natural gas liquids, refined products, renewables, and crude oil and natural gas produced water, are subject to stringent federal, state, provincial and local laws and regulations relating to the protection of natural resources and the environment, health and safety, waste management, and transportation and disposal of such products and materials. We face inherent risks of incurring significant environmental costs and liabilities due to handling of produced water and hydrocarbons, such as crude oil, condensate, natural gas liquids, gasoline, diesel, and biodiesel. For instance, our Water Solutions segment carries with it environmental risks, including the risk of leakage from the treatment plants to surface or subsurface soils, surface water or groundwater, or accidental spills. Our Crude Oil Logistics and Liquids Logistics segments carry similar risks of leakage and sudden or accidental spills of crude oil, natural gas liquids, and hydrocarbons. Liability under, or violation of, environmental laws and regulations could result in, among other things, the restriction or cancellation of operations, injunctions, fines and penalties, reputational damage, expenditures for remediation and liability for natural resource damages, property damage and personal injuries.
We use various modes of transportation to carry natural gas liquids, crude oil, refined and renewable products and produced water, including trucks, railcars, barges, and pipelines, each of which is subject to regulation. With respect to transportation by truck, we are subject to regulations promulgated under federal legislation, including the Federal Motor Carrier Safety Act and the Homeland Security Act of 2002, which cover the security and transportation of hazardous materials and are administered by the DOT. We also own and lease a fleet of railcars, the operation of which is subject to the regulatory jurisdiction of the Federal Railroad Administration of the DOT, as well as other federal and state regulatory agencies. Railcar accidents within the industry involving trains carrying crude oil from the Bakken region (none of which directly involved any of our business operations), have led to increased legislative and regulatory scrutiny over the safety of transporting crude oil by railcar. The introduction of regulations that result in new requirements addressing the type, design, specifications or construction of railcars used to transport crude oil could result in severe transportation capacity constraints during the periods in which new railcars are constructed to meet new specifications or in which the railcars already placed in service are being retrofitted.
In addition, under certain environmental laws, we could be subject to strict and/or joint and several liability for the investigation, removal or remediation of previously released materials. As a result, these laws could cause us to become liable for the conduct of others, such as prior owners or operators of our facilities, or for consequences of our or our predecessor’s actions, regardless of whether we were responsible for the release or if such actions were in compliance with all applicable laws at the time of those actions. Also, upon closure of certain facilities, such as at the end of their useful life, we have been and may be required to undertake environmental evaluations or cleanups.
Additionally, in order to conduct our operations, we must obtain and maintain numerous permits, approvals and other authorizations from various federal, state, provincial and local governmental authorities relating to produced water handling, discharge and disposal, air emissions, transportation and other environmental matters. These authorizations subject us to terms and conditions which may be onerous or costly to comply with, and that may require costly operational modifications to attain and maintain compliance. The renewal, amendment or modification of these permits, approvals and other authorizations may involve the imposition of even more stringent and burdensome terms and conditions with higher costs and more significant effects upon our operations.
Changes in environmental laws and regulations occur frequently. New laws or regulations, changes to existing laws or regulations, such as more stringent pollution control requirements or additional safety requirements, or more stringent interpretation or enforcement of existing laws and regulations, may adversely impact us, and could result in increased operating
costs and have a material and adverse effect on our activities and profitability. For example, new or proposed laws or regulations governing the withdrawal, storage and use of surface water or groundwater necessary for hydraulic fracturing of wells may increase our costs for treatment of hydraulic fracturing flowback water (or affect our hydraulic fracturing customers’ ability to operate) and cause delays, interruption or termination of our water treatment operations, all of which could have a material and adverse effect on our consolidated results of operations and financial position.
Furthermore, our customers in the oil and gas production industry are subject to certain environmental laws and regulations that may impose significant costs and liabilities on them. In April 2022, the state of New Mexico adopted new air quality rules that aim to eliminate hundreds of millions of pounds of harmful emissions annually from oil and gas production in New Mexico. Any significant increased costs or restrictions placed on our customers to comply with environmental laws and regulations could affect their production output significantly. Such an effect on our customers could materially and adversely affect our utilization and profitability by reducing demand for our services. The adoption or implementation of any new regulations imposing additional reporting obligations on GHG emissions, or limiting GHG emissions from our equipment and operations, could require us to incur significant costs. As is generally understood regarding the regulatory landscape, there can be no guarantee that these or future rules affecting our operations will not have material effects on our consolidated results of operations and financial position.
Our, our customers’ and our suppliers’ operations are subject to a series of risks arising out of the threat of climate change that could result in increased operating costs, adversely impacting our results of operations and ability to make cash distributions to unitholders, limit the areas in which oil and natural gas production may occur, and reduce demand for the products and services we provide.
The threat of climate change continues to attract considerable attention in the United States and in foreign countries. Numerous proposals have been made and could continue to be made at the international, national, regional and state levels of government to monitor and limit existing emissions of GHGs as well as to restrict or eliminate such future emissions. As a result, our operations as well as the operations of our crude oil and natural gas exploration and production customers and suppliers are subject to a series of regulatory, political, litigation, and financial risks associated with the production and processing of fossil fuels and emission of GHGs.
In the United States, no comprehensive climate change legislation has been implemented at the federal level. However, following the U.S. Supreme Court finding that GHG emissions constitute a pollutant under the CAA, the EPA has adopted regulations that, among other things, establish construction and operating permit reviews for GHG emissions from certain large stationary sources, require the monitoring and annual reporting of GHG emissions from certain petroleum and natural gas system sources in the United States, and together with the DOT, implement GHG emissions limits on vehicles manufactured for operation in the United States. The regulation of methane from oil and gas facilities has been subject to uncertainty in recent years, but most recently, in December 2023, the EPA finalized its rulemaking establishing New Source Performance Standards to reduce emissions of methane and other volatile organic compounds from new and modified sources. Additionally, various states and groups of states have adopted or are considering adopting legislation, regulations or other regulatory initiatives that are focused on such areas as GHG cap and trade programs, carbon taxes, reporting and tracking programs, and restriction of emissions. Internationally, the United Nations-sponsored “Paris Agreement” requires member states to individually determine and submit non-binding emissions reduction targets every five years after 2020. Although the United States withdrew from the Paris Agreement on November 4, 2020, on January 20, 2021, President Biden signed executive orders recommitting the United States to the agreement and calling on the federal government to begin formulating the United States’ nationally determined emissions reduction targets under the agreement.
Governmental, scientific, and public concern over the threat of climate change arising from GHG emissions has resulted in increasing political risks in the United States, including climate change related pledges made by certain candidates recently elected to public office. These have included promises to limit emissions and curtail the production of oil and gas, such as through the cessation of leasing public land for hydrocarbon development. For example, on January 27, 2021, President Biden issued an Executive Order that commits to substantial action on climate change, calling for, among other things, the increased use of zero-emissions vehicles by the federal government, the elimination of subsidies provided to the fossil fuel industry, and increased emphasis on climate-related risk across governmental agencies and economic sectors. Separately, on January 20, 2021, the Acting Secretary of the United States Department of the Interior (“DOI”) issued an order that, among other things, imposed a 60-day moratorium on the issuance of fossil fuel authorizations, including leases and permits, on federal lands. While the DOI announced on April 15, 2022 that it will resume oil and gas leasing on public lands following a federal court’s decision, the topic of oil and gas leasing on public land remains politically fraught, as the announcement indicates that federal land available for oil and gas leasing will be reduced by 80 percent from the acreage originally nominated due to environmental and climate concerns. Other actions that could be pursued by the Biden Administration may include the imposition of more restrictive requirements for the establishment of pipeline infrastructure or the permitting of liquified natural
gas export facilities. Litigation risks are also increasing, as a number of cities and other local governments have sought to bring suit against the largest oil and natural gas companies in state or federal court, alleging, among other things, that such companies created public nuisances by producing fuels that contributed to climate change. Suits have also been brought against such companies under shareholder and consumer production laws, alleging that the companies have been aware of the adverse effects of climate change but failed to adequately disclose those impacts.
There are also increasing financial risks for fossil fuel producers as shareholders currently invested in fossil-fuel energy companies may elect in the future to shift some or all of their investments into other related sectors. Institutional lenders who provide financing to fossil-fuel energy companies also have become more attentive to sustainable lending practices and some of them may elect not to provide funding for fossil-fuel energy companies. There is also a risk that financial institutions will be required to adopt policies that have the effect of reducing the funding provided to the fossil fuel sector. The U.S. Federal Reserve announced that it has applied to join the Network for Greening the Financial System, a consortium of financial regulators focused on addressing climate-related risks in the financial sector. A material reduction in the capital available to the fossil fuel industry could make it more difficult to secure funding for exploration, development, production, transportation and processing activities, which could result in decreased demand for our services.
The adoption and implementation of new or more stringent international, federal or state legislation, regulations or other regulatory initiatives that impose more stringent standards for GHG emissions from the oil and natural gas sector or otherwise restrict the areas in which this sector may produce oil and natural gas or generate GHG emissions could result in increased costs of compliance or costs of consuming, and thereby reduce demand for, oil and natural gas, which could reduce demand for our services and products. Additionally, political, litigation and financial risks may result in our oil and natural gas customers restricting or canceling production activities, incurring liability for infrastructure damages as a result of climatic changes, or impairing their ability to continue to operate in an economic manner, which also could reduce demand for our services and products. One or more of these developments could have a material adverse effect on our business, financial condition, results of operations and ability to make cash distributions to unitholders.
Finally, many scientists have concluded that increasing concentrations of GHGs in the Earth’s atmosphere may produce climate changes that have significant physical effects, such as increased frequency and severity of storms, floods and other climatic events. If any such effects were to occur, they could adversely affect our results of operations and ability to make cash distributions to unitholders. In addition, while our consideration of changing weather conditions and inclusion of safety factors in design covers the uncertainties that climate change and other events may potentially introduce, our ability to mitigate the adverse impacts of these events depends in part on the effectiveness of our facilities and our disaster preparedness and response and business continuity planning, which may not have considered or be prepared for every eventuality.
State and federal legislation and regulatory initiatives relating to our hydraulic fracturing customers could harm our business.
Hydraulic fracturing is a common practice within the oil and gas exploration and production process, including within those fields where our Water Solutions and Crude Oil Logistics segments operate. The practice of hydraulic fracturing is a well-stimulation technique utilized to facilitate the production of oil and natural gas and other hydrocarbon condensates from shale and tight conventional formations. The exploration and production process, including the practice of hydraulic fracturing, is subject to regulation by state and federal authorities. Jurisdiction and applicable regulatory requirements can vary depending on the location of the activity. The process of hydraulic fracturing has come under considerable scrutiny from sections of the public as well as environmental and other groups asserting that the practice could be responsible for incidents of induced seismicity and that chemicals used in the hydraulic fracturing process could adversely affect drinking water supplies. New laws or regulations, or changes to existing laws or regulations in response to this perceived threat may adversely impact the oil and gas drilling industry. Any current or proposed restrictions on hydraulic fracturing could lead to operational delays or increased operating costs and regulatory burdens that could make it more difficult or costly to perform hydraulic fracturing which would negatively impact our customer base resulting in an adverse effect on our profitability. For example, on January 20, 2021, the Biden Administration placed a 60-day moratorium on new oil and gas leasing and drilling permits on federal lands, and on January 27, 2021, the DOI acting pursuant to an Executive Order from President Biden suspended the federal oil and gas leasing program indefinitely. Although the DOI announced the resumption of onshore oil and gas leasing in April 2022, the program is being significantly reformed, with 80 percent less land available for leasing from the acreage originally nominated. On April 12, 2024, the DOI finalized a comprehensive update to federal onshore oil and gas leasing regulations on Bureau of Land Management-managed public lands, which increased bonding requirements, royalty rates, and minimum bids. Actions such as these could have a material adverse effect on us and our industry.
Restrictions on drilling and related activities intended to protect certain species of wildlife or their habitat may adversely affect our customers’ ability to conduct drilling and related activities in some of the areas where we operate.
Various federal and state statutes prohibit certain actions that harm endangered or threatened species and their habitats, migratory birds, wetlands and natural resources. These statutes include the ESA, the MBTA, the BGEPA, the CWA, CERCLA and the Oil Pollution Act. The USFWS may designate critical habitat and suitable habitat areas that it believes are necessary for survival of threatened or endangered species. A critical habitat or suitable habitat designation could result in further material restrictions to federal land use and private land use and could delay, restrict or prohibit our customers’ land access or oil and gas development. If adverse impact to species or damages to wetlands, habitat or natural resources occur or may occur as result of our or our customers’ activities, government entities or, at times, private parties may act to prevent such activities or seek damages for harm to species, habitat or natural resources resulting from our activities or our customers’ drilling, construction or releases of oil, wastes, hazardous substances or other regulated materials, which could reduce the demand for our services.
For example, on July 3, 2023, the USFWS proposed that the dunes sagebrush lizard, which is found in areas where we operate, be listed as endangered under the ESA. The comment period on the proposed rule ended on October 2, 2023. In addition, the lesser prairie-chicken, which can also be found in areas where we operate, was listed under the ESA effective March 27, 2023.
To the extent species are listed under the ESA or similar state laws, or previously unprotected species are designated as threatened or endangered in areas where our assets and operations are located, operations in those areas could incur increased costs arising from species protection measures and face delays or limitations with respect to production activities thereon.
Federal and state legislation and regulatory initiatives relating to saltwater disposal wells could result in increased costs and additional operating restrictions or delays and could harm our business.
The water disposal process is primarily regulated by state oil and gas authorities. This water disposal process has come under scrutiny from sections of the public, including various state regulatory bodies, as well as environmental and other groups asserting that the operation of certain water disposal wells has contributed to specific induced seismic events. New laws or regulations, or changes to existing laws or regulations, in response to this perceived threat may adversely impact the water disposal industry.
On certain specific occasions, state regulatory agencies have and could request that we suspend operations at one or multiple disposal facilities, pending further study of a location’s potential impact on seismic activity. In one specific instance, we limited the water into a disposal well and redirected the flow of water to a different area of the geologic formation in order to address such concerns. In December 2021, as a result of increased seismic activity, the Texas Railroad Commission suspended all deep oil and gas produced water injection in an area which spans approximately 100 square miles in Midland and Ector counties, which directly impacted one of our idled disposal wells. This idled well was subsequently plugged and abandoned. In January 2024, the Texas Railroad Commission indefinitely suspended all deep oil and gas produced water injection in Culberson and Reeves counties, which directly impacted one of our disposal wells. While this suspension resulted in a loss of 10,000 barrels per day of disposal capacity, the suspension did not materially impact our water disposal business.
We cannot predict whether any federal, state or local laws or regulations will be enacted and, if so, what actions any such laws or regulations would require or prohibit. However, any restrictions on water disposal could lead to operational delays or increased operating costs and regulatory burdens that could make it more difficult or costly to perform water disposal operations, which would negatively impact our profitability. To date, due to the capacity of our integrated system in the affected areas, the diverse locations of our disposal facilities, and the connectivity of our system, our ability to dispose of produced water has not been materially impacted by these actions, and with our unique positioning outside of the affected areas, we have the ability to grow our asset base.
Some of our operations are subject to the jurisdiction of the FERC and other operations may become subject in the future.
The FERC regulates the transportation of crude oil and refined products on interstate pipelines, among other things. The FERC’s jurisdiction over oil pipelines derives from a 1906 amendment to the Interstate Commerce Act making oil pipelines common carriers subject to federal regulation. The FERC has regulated oil pipelines under this authority since 1977, when legislation transferred jurisdiction to the FERC from the Interstate Commerce Commission. The Energy Policy Act of 1992 directed the FERC to establish a simplified and generally applicable ratemaking methodology for oil pipelines, keeping with its statutory mandate to ensure that oil pipelines’ rates are just and reasonable.
Intrastate transportation and gathering pipelines that do not provide interstate services are subject to regulation by state regulatory commissions, such as the Texas Railroad Commission. The distinction between the FERC-regulated interstate pipeline transportation on the one hand and intrastate pipeline transportation on the other hand, is a fact-based determination. The Grand Mesa Pipeline became operational on November 1, 2016 and has several points of origin in Colorado, runs from those origin points through Kansas and terminates in Cushing, Oklahoma. The transportation services on the Grand Mesa Pipeline are subject to FERC regulation. Other of our transportation services could in the future become subject to the jurisdiction of the FERC, which could adversely affect the terms of service, rates and revenues of such services.
The classification and regulation of our crude oil pipelines are subject to change based on future determinations by the FERC, federal courts, Congress or regulatory commissions, courts or legislatures in the states in which we operate. If the FERC’s regulatory reach was expanded to our other facilities, or if we expand our operations into areas that are subject to the FERC’s regulation, we may have to commit substantial capital to comply with such regulations and such expenditures could have a material and adverse effect on our consolidated results of operations and cash flows.
We are subject to governmental regulation and other legal obligations related to privacy, data protection, and data security. Our actual or perceived failure to comply with such obligations could harm our business.
There are numerous laws and regulations regarding privacy and the storage, sharing, use, processing, transfer, disclosure and protection of personal data, the scope of which is changing, subject to differing interpretations, and may be inconsistent between states within a country or between countries. For example, the California Consumer Privacy Act (“CCPA”), which went into effect on January 1, 2020, limits how we may collect and use personal data. The effects of the CCPA potentially are far-reaching and may require us to modify our data processing practices and policies and incur compliance-related costs and expenses. Further, in November 2020, California voters passed the California Privacy Rights and Enforcement Act (“CPRA”), which expands the CCPA with additional data privacy compliance requirements that may impact our business, and establishes a regulatory agency dedicated to enforcing those requirements. It remains unclear how various provisions of the CCPA and CPRA will be interpreted and enforced. These and other data privacy laws and their interpretations continue to develop and may be inconsistent from jurisdiction to jurisdiction. Non-compliance with these laws could result in penalties or significant legal liability. Although we take reasonable efforts to comply with all applicable laws and regulations, there can be no assurance that we will not be subject to regulatory action, including fines, in the event of an incident. We or our third-party service providers could be adversely affected if legislation or regulations are expanded to require changes in our or our third-party service providers’ business practices or if governing jurisdictions interpret or implement their legislation or regulations in ways that negatively affect our or our third-party service providers’ business, results of operations or financial condition.
Some of our operations cross the United States/Canada border and are subject to cross-border regulation.
Our cross-border activities subject us to regulatory matters, including import and export licenses, tariffs, Canadian and United States customs and tax issues, and toxic substance certifications. Such regulations include the “Short Supply Controls” of the Export Administration Act, the North American Free Trade Agreement and the Toxic Substances Control Act. Violations of these licensing, tariff and tax reporting requirements could result in the imposition of significant administrative, civil and criminal penalties.
Risks Related to Our Partnership Structure and an Investment in Us
Our Partnership Agreement limits the fiduciary duties of our GP to our unitholders and restricts the remedies available to our unitholders for actions taken by our GP that might otherwise be breaches of fiduciary duty.
Fiduciary duties owed to our unitholders by our GP are prescribed by law and our Partnership Agreement. The Delaware Revised Uniform Limited Partnership Act (“Delaware LP Act”) provides that Delaware limited partnerships may, in their partnership agreements, restrict the fiduciary duties owed by the general partner to limited partners and the partnership. Our Partnership Agreement contains provisions that reduce the standards to which our GP would otherwise be held by state fiduciary duty law. For example, our Partnership Agreement:
•limits the liability and reduces the fiduciary duties of our GP, while also restricting the remedies available to our unitholders for actions that, without these limitations, might constitute breaches of fiduciary duty. As a result of purchasing common units, our unitholders consent to some actions and conflicts of interest that might otherwise constitute a breach of fiduciary or other duties under applicable state law;
•permits our GP to make a number of decisions in its individual capacity, as opposed to in its capacity as our GP. This entitles our GP to consider only the interests and factors that it desires, and it has no duty or obligation to give any consideration to any interest of, or factors affecting, us, our affiliates or any limited partner. Examples include the exercise of its limited call right, its voting rights with respect to the units it owns and its determination whether or not to consent to any merger or consolidation of the Partnership;
•provides that our GP shall not have any liability to us or our unitholders for decisions made in its capacity as GP so long as it acted in good faith, meaning our GP subjectively believed that the decision was in, or not opposed to, the best interests of the Partnership;
•generally provides that affiliated transactions and resolutions of conflicts of interest not approved by the conflicts committee of the board of directors of our GP and not involving a vote of our unitholders must be on terms no less favorable to us than those generally being provided to or available from unrelated third parties or be “fair and reasonable” to us and that, in determining whether a transaction or resolution is “fair and reasonable,” our GP may consider the totality of the relationships between the parties involved, including other transactions that may be particularly favorable or advantageous to us; and
•provides that our GP and its officers and directors will not be liable for monetary damages to us or our limited partners for any acts or omissions unless there has been a final and non-appealable judgment entered by a court of competent jurisdiction determining that our GP or those other persons acted in bad faith or engaged in fraud or willful misconduct.
By purchasing a common unit, a common unitholder will become bound by the provisions of our Partnership Agreement, including the provisions described above.
Our GP and its affiliates have conflicts of interest with us and limited fiduciary duties to our unitholders, and they may favor their own interests to the detriment of us and our unitholders.
The NGL Energy GP Investor Group owns and controls our GP and its 0.1% GP interest in us. Although our GP has certain fiduciary duties to manage us in a manner beneficial to us and our unitholders, the executive officers and directors of our GP have a fiduciary duty to manage our GP in a manner beneficial to its owners. Furthermore, since certain executive officers and directors of our GP are executive officers or directors of affiliates of our GP, conflicts of interest may arise between the NGL Energy GP Investor Group and its affiliates, including our GP, on the one hand, and us and our unitholders, on the other hand. As a result of these conflicts, our GP may favor its own interests and the interests of its affiliates over the interests of our unitholders (see “–Our Partnership Agreement limits the fiduciary duties of our GP to our unitholders and restricts the remedies available to our unitholders for actions taken by our GP that might otherwise be breaches of fiduciary duty,” above). The risk to our unitholders due to such conflicts may arise because of the following factors, among others:
•our GP is allowed to take into account the interests of parties other than us, such as members of the NGL Energy GP Investor Group, in resolving conflicts of interest;
•neither our Partnership Agreement nor any other agreement requires owners of our GP to pursue a business strategy that favors us;
•except in limited circumstances, our GP has the power and authority to conduct our business without unitholder approval;
•our GP determines the amount and timing of asset purchases and sales, borrowings, issuance of additional partnership securities and the creation, reduction or increase of reserves, each of which can affect the amount of cash that is distributed to our unitholders;
•our GP determines the amount and timing of any capital expenditures and whether a capital expenditure is classified as a maintenance capital expenditure, which reduces operating surplus, or an expansion capital expenditure, which does not reduce operating surplus. This determination can affect the amount of cash that is distributed to our unitholders and to our GP;
•our GP determines which costs incurred by it are reimbursable by us;
•our GP may cause us to borrow funds to permit the payment of cash distributions, even if the purpose or effect of the borrowing is to make incentive distributions;
•our Partnership Agreement permits us to classify up to $20.0 million as operating surplus, even if it is generated from asset sales, non-working capital borrowings or other sources that would otherwise constitute capital surplus.
This cash may be used to fund distributions to our GP in respect of the GP interest or the incentive distribution rights (“IDRs”);
•our Partnership Agreement does not restrict our GP from causing us to pay it or its affiliates for any services rendered to us or entering into additional contractual arrangements with any of these entities on our behalf;
•our GP intends to limit its liability regarding our contractual and other obligations;
•our GP may exercise its right to call and purchase all of the common units not owned by it and its affiliates if they own more than 80% of the common units;
•our GP controls the enforcement of the obligations that it and its affiliates owe to us;
•our GP decides whether to retain separate counsel, accountants or others to perform services for us; and
•our GP may elect to cause us to issue common units to it in connection with a resetting of the target distribution levels related to our GP’s IDRs without the approval of the conflicts committee of the board of directors of our GP or our unitholders. This election may result in lower distributions to our common unitholders in certain situations.
In addition, certain members of the NGL Energy GP Investor Group and their affiliates currently hold interests in other companies in the energy and natural resource sectors. Our Partnership Agreement provides that our GP will be restricted from engaging in any business activities other than acting as our GP and those activities incidental to its ownership interest in us. However, members of the NGL Energy GP Investor Group are not prohibited from engaging in other businesses or activities, including those that might be in direct competition with us. As a result, they could potentially compete with us for acquisition opportunities and for new business or extensions of the existing services provided by us.
Pursuant to the terms of our Partnership Agreement, the doctrine of corporate opportunity, or any analogous doctrine, does not apply to our GP or any of its affiliates, including its executive officers, directors and owners. Any such person or entity that becomes aware of a potential transaction, agreement, arrangement or other matter that may be an opportunity for us will not have any duty to communicate or offer such opportunity to us. Any such person or entity will not be liable to us or to any limited partner for breach of any fiduciary duty or other duty by reason of the fact that such person or entity pursues or acquires such opportunity for itself, directs such opportunity to another person or entity or does not communicate such opportunity or information to us. This may create actual and potential conflicts of interest between us and affiliates of our GP and result in less than favorable treatment of us and our unitholders.
Even if our unitholders are dissatisfied, they have limited voting rights and are not entitled to elect our GP or its directors.
Unlike the holders of common stock in a corporation, unitholders have only limited voting rights on matters affecting our business and, therefore, limited ability to influence management’s decisions regarding our business. Unitholders will have no right on an annual or ongoing basis to elect our GP or its board of directors. The board of directors of our GP is chosen entirely by its members and not by our unitholders. Unlike publicly traded corporations, we will not conduct annual meetings of our unitholders to elect directors or conduct other matters routinely conducted at annual meetings of stockholders of corporations. Furthermore, if our unitholders are dissatisfied with the performance of our GP, they will have limited ability to remove our GP. As a result of these limitations, the price at which the common units will trade could be diminished because of the absence or reduction of a takeover premium in the trading price. Our Partnership Agreement also contains provisions limiting the ability of unitholders to call meetings or to acquire information about our operations, as well as other provisions limiting our unitholders’ ability to influence the manner or direction of management.
Our Partnership Agreement restricts the voting rights of unitholders owning 20% or more of our common units.
Unitholders’ voting rights are further restricted by a provision of our Partnership Agreement providing that any units held by a person that owns 20% or more of any class of units then outstanding, other than our GP, its affiliates, their direct transferees and their indirect transferees approved by our GP (which approval may be granted in its sole discretion) and persons who acquired such units with the prior approval of our GP, cannot vote on any matter.
Our GP interest or the control of our GP may be transferred to a third party without the consent of our unitholders.
Our GP may transfer its GP interest to a third party in a merger or in a sale of all or substantially all of its assets without the consent of our unitholders. Furthermore, our Partnership Agreement does not restrict the ability of the members of the NGL Energy GP Investor Group to transfer all or a portion of their ownership interest in our GP to a third party. The new owner of our GP would then be in a position to replace the board of directors and officers of our GP with its own designees and thereby exert significant control over the decisions made by the board of directors and officers.
The IDRs of our GP may be transferred to a third party.
Our GP may transfer its IDRs to a third party at any time without the consent of our unitholders. If our GP transfers its IDRs to a third party but retains its GP interest, our GP may not have the same incentive to grow our partnership and increase quarterly distributions to unitholders over time as it would if it had retained ownership of its IDRs.
Our GP has a limited call right that may require our unitholders to sell their common units at an undesirable time or price.
If at any time our GP and its affiliates own more than 80% of the common units, our GP will have the right, which it may assign to any of its affiliates or to us, but not the obligation, to acquire all, but not less than all, of the common units held by unaffiliated persons at a price that is not less than their then-current market price, as calculated pursuant to the terms of our Partnership Agreement. As a result, our unitholders may be required to sell their common units at an undesirable time or price and may not receive any return or may receive a negative return on their investment. Our unitholders may also incur a tax liability upon a sale of their units.
Our Partnership Agreement requires that we distribute all of our available cash, which could limit our ability to grow and make acquisitions.
We expect that we will distribute all of our available cash to our unitholders and will rely primarily on external financing sources, including commercial bank borrowings and the issuance of debt and equity securities, as well as reserves we have established to fund our acquisitions and expansion capital expenditures. As a result, to the extent we are unable to finance growth externally, our cash distribution policy will significantly impair our ability to grow.
In addition, because we distribute all of our available cash, our growth may not be as fast as that of businesses that reinvest their available cash to expand ongoing operations. To the extent we issue additional units in connection with any acquisitions or expansion capital expenditures, the payment of distributions on those additional units may increase the risk that we will be unable to maintain or increase our per unit distribution level. There are no limitations in our Partnership Agreement or the agreements governing our indebtedness on our ability to issue additional units, including units ranking senior to the common units. The incurrence of additional commercial borrowings or other debt to finance our growth strategy would result in increased interest expense, which, in turn, may impact the available cash that we have to distribute to our unitholders.
We may issue additional units without the approval of our unitholders, which would dilute the interests of existing unitholders.
Our Partnership Agreement does not limit the number of additional limited partner interests that we may issue at any time without the approval of our unitholders. Our issuance of additional common units or other equity securities of equal or senior rank will have the following effects:
•our existing unitholders’ proportionate ownership interest in us will decrease;
•the amount of available cash for distribution on each unit may decrease;
•the ratio of taxable income to distributions may increase;
•the relative voting strength of each previously outstanding unit may be diminished; and
•the market price of the common units may decline.
Our GP, without the approval of our unitholders, may elect to cause us to issue common units while also maintaining its GP interest in connection with a resetting of the target distribution levels related to its IDRs. This could result in lower distributions to our unitholders.
Our GP has the right to reset the initial target distribution levels at higher levels based on our distributions at the time of the exercise of the reset election. Following a reset election by our GP, the minimum quarterly distribution will be adjusted to equal the reset minimum quarterly distribution and the target distribution levels will be reset to correspondingly higher levels based on percentage increases above the reset minimum quarterly distribution.
If our GP elects to reset the target distribution levels, it will be entitled to receive a number of common units. The number of common units to be issued to our GP will be equal to that number of common units that would have entitled their holder to an average aggregate quarterly cash distribution in the prior two quarters equal to the average of the distributions to
our GP on the IDRs in the prior two quarters. We anticipate that our GP would exercise this reset right to facilitate acquisitions or organic growth projects that would not be sufficiently accretive to cash distributions per common unit without such conversion. It is possible, however, that our GP could exercise this reset election at a time when it is experiencing, or expects to experience, declines in the cash distributions it receives related to its IDRs and may, therefore, desire to be issued common units rather than retain the right to receive distributions on its IDRs based on the initial target distribution levels. As a result, a reset election may cause our common unitholders to experience a reduction in the amount of cash distributions that our common unitholders would have otherwise received had we not issued new common units and GP interests to our GP in connection with resetting the target distribution levels.
Our unitholders’ liability may not be limited if a court finds that unitholder action constitutes control of our business.
A general partner of a partnership generally has unlimited liability for the obligations of the partnership, except for those contractual obligations of the partnership that are expressly made without recourse to the general partner. Our Partnership is organized under Delaware law, and we conduct business in a number of other states. The limitations on the liability of holders of limited partner interests for the obligations of a limited partnership have not been clearly established in some of the other states in which we do business. You could be liable for any and all of our obligations as if you were a general partner if a court or government agency were to determine that:
•we were conducting business in a state but had not complied with that particular state’s partnership statute; or
•a unitholder’s right to act with other unitholders to remove or replace our GP, to approve some amendments to our Partnership Agreement or to take other actions under our Partnership Agreement constitute “control” of our business.
Our unitholders may have liability to repay distributions that were wrongfully distributed to them.
Under certain circumstances, unitholders may have to repay amounts wrongfully returned or distributed to them. Under Section 17-607 of the Delaware LP Act, we may not make a distribution to our unitholders if the distribution would cause our liabilities to exceed the fair value of our assets. Delaware law provides that for a period of three years from the date of an impermissible distribution, limited partners who received the distribution and who knew at the time of the distribution that it violated Delaware law will be liable to the limited partnership for the distribution amount. Substituted limited partners are liable both for the obligations of the assignor to make contributions to the partnership that were known to the substituted limited partner at the time it became a limited partner and for those obligations that were unknown if the liabilities could have been determined from the partnership agreement. Neither liabilities to partners on account of their partnership interests nor liabilities that are nonrecourse to the partnership are counted for purposes of determining whether a distribution is permitted. For the purpose of determining the fair value of the assets of a limited partnership, the Delaware LP Act provides that the fair value of property subject to liability for which recourse of creditors is limited shall be included in the assets of the limited partnership only to the extent that the fair value of that property exceeds the nonrecourse liability.
The Preferred Units give the holders thereof liquidation and distribution preferences over our common unitholders.
We currently have three series of Preferred Units outstanding. All of these units rank senior to the common units with respect to distribution rights and rights upon liquidation. Subject to certain exceptions, as long as any Preferred Units remain outstanding, we may not declare any distribution on our common units unless all accumulated and unpaid distributions have been declared and paid on the Preferred Units. In the event of our liquidation, winding-up or dissolution, the holders of the Preferred Units would have the right to receive proceeds from any such transaction before the holders of the common units. The payment of the liquidation preference could result in common unitholders not receiving any consideration if we were to liquidate, dissolve or wind up, either voluntarily or involuntarily. Additionally, the existence of the liquidation preference may reduce the value of the common units, make it harder for us to sell common units in offerings in the future, or prevent or delay a change of control.
The issuance of common units upon exercise of certain warrants would cause dilution to existing common unitholders and may place downward pressure on the trading price of our common units.
We currently have outstanding exercisable warrants to purchase 25,500,000 common units at exercise prices ranging from $13.56 per unit to $17.45 per unit. Any exercise of these warrants would cause dilution to existing common unitholders and may place downward pressure on the trading price of our common units. All outstanding warrants are currently exercisable and any unexercised warrants will expire on the tenth anniversary of the date of issuance. The warrants will not participate in
cash distributions. For additional information related to the warrants, see Note 9 to our consolidated financial statements included in this Annual Report.
Tax Risks to Our Unitholders
Our tax treatment depends on our status as a partnership for federal income tax purposes. We could lose our status as a partnership for a number of reasons, including not having enough “qualifying income.” If the Internal Revenue Service (“IRS”) were to treat us as a corporation for federal income tax purposes, our cash available for distribution to our unitholders would be substantially reduced.
The anticipated after-tax economic benefit of an investment in our common units depends largely on our being treated as a partnership for federal income tax purposes. We have not requested, and do not plan to request, a ruling from the IRS with respect to our treatment as a partnership for federal income tax purposes.
Despite the fact that we are a limited partnership under Delaware law, a publicly traded partnership such as us will be treated as a corporation for federal income tax purposes unless, for each taxable year, 90% or more of its gross income is “qualifying income” under Section 7704 of the Internal Revenue Code of 1986, as amended (“Internal Revenue Code”). “Qualifying income” includes income and gains derived from the exploration, development, production, processing, transportation, storage and marketing of natural gas, natural gas products, and crude oil or other passive types of income such as certain interest and dividends and gains from the sale or other disposition of capital assets held for the production of income that otherwise constitutes qualifying income. Although we do not believe, based upon our current operations, that we are treated as a corporation, we could be treated as a corporation for federal income tax purposes or otherwise subject to taxation as an entity if our gross income is not properly classified as qualifying income, there is a change in our business or there is a change in current law.
If we were treated as a corporation for federal income tax purposes, we would pay federal income tax on our taxable income at the corporate tax rate, which is currently 21% (changed from 35% under the Tax Cuts and Jobs Act of 2017 (“Act”)), and would likely pay state and local income tax at varying rates. Distributions to our unitholders would generally be taxed again as corporate dividends (to the extent of our current and accumulated earnings and profits), and no income, gains, losses, deductions or credits would flow through to our unitholders. Because a tax would be imposed upon us as a corporation, our cash available for distribution to our unitholders would be substantially reduced. Therefore, treatment of us as a corporation would result in a material reduction in the anticipated cash flow and after-tax return to our unitholders, likely causing a substantial reduction in the market value of our common units.
Our Partnership Agreement provides that if a law is enacted or existing law is modified or interpreted in a manner that subjects us to taxation as a corporation or otherwise subjects us to entity-level taxation for federal income tax purposes, the minimum quarterly distribution amount and the target distribution amounts may be adjusted to reflect the impact of that law on us.
Our unitholders may be subject to limitation on their ability to deduct interest expense incurred by us.
In general, our unitholders are entitled to a deduction for the interest we have paid or accrued on indebtedness properly allocable to our business during our taxable year. However, under the Act signed into law by the President of the United States on December 22, 2017, beginning in tax year 2018, the deductibility of net interest expense is limited to 30% of our adjusted taxable income. For tax years beginning after December 31, 2017 and before January 1, 2022, the Act calculates adjusted taxable income using an EBITDA-based calculation. For tax years beginning January 1, 2022 and thereafter, the calculation of adjusted taxable income will not add back depreciation or amortization. Any disallowed business interest expense is then generally carried forward as a deduction in a succeeding taxable year at the partner level. These limitations might cause interest expense to be deducted by our unitholders in a later period than recognized in the GAAP financial statements.
If we were subjected to a material amount of additional entity-level taxation by individual states, it would reduce our cash available for distribution to our unitholders.
Changes in current state law may subject us to additional entity-level taxation by individual states. Because of widespread state budget deficits and other reasons, several states are evaluating ways to subject partnerships to entity-level taxation through the imposition of state income, franchise and other forms of taxation. Imposition of any such taxes may substantially reduce the cash available for distribution to our unitholders. Our Partnership Agreement provides that, if a law is enacted or existing law is modified or interpreted in a manner that subjects us to entity-level taxation, the minimum quarterly distribution amount and the target distribution amounts may be adjusted to reflect the impact of that law on us.
The tax treatment of publicly traded partnerships or an investment in our common units could be subject to potential legislative, judicial or administrative changes and differing interpretations, possibly on a retroactive basis.
The present income tax treatment of publicly traded partnerships, including us, or an investment in our common units may be modified by administrative, legislative or judicial interpretation at any time. For example, from time to time, members of Congress propose and consider substantive changes to the existing federal income tax laws that affect the tax treatment of publicly traded partnerships, including as a result of any fundamental tax reform.
We are unable to predict whether any such change or other proposals will ultimately be enacted or will affect our tax treatment. Any modification to the income tax laws and interpretations thereof may or may not be applied retroactively and could, among other things, cause us to be treated as a corporation for federal income tax purposes or otherwise subject us to entity-level taxation. Moreover, such modifications and change in interpretations may affect or cause us to change our business activities, affect the tax considerations of an investment in us, change the character or treatment of portions of our income and adversely affect an investment in our common units. Although we are unable to predict whether any of these changes, or other proposals, will ultimately be enacted, any such changes could negatively impact the value of an investment in our common units.
Changes in tax laws could adversely affect our performance.
We are subject to extensive tax laws and regulations, with respect to federal, state and foreign income taxes and transactional taxes such as excise, sales/use, payroll, franchise and ad valorem taxes. New tax laws and regulations and changes in existing tax laws and regulations are continuously being enacted that could result in increased tax expenditures in the future.
If the IRS contests the federal income tax positions we take, the market for our common units may be adversely impacted and the cost of any IRS contest will reduce our cash available for distribution to our unitholders.
We have not requested a ruling from the IRS with respect to our treatment as a partnership for federal income tax purposes. The IRS may adopt positions that differ from the positions we take. It may be necessary to resort to administrative or court proceedings to sustain some or all of the positions we take and such positions may not ultimately be sustained. A court may not agree with some or all of the positions we take. Any contest with the IRS may materially and adversely impact the market for our common units and the price at which they trade. In addition, our costs of any contest with the IRS will be borne indirectly by our unitholders and our GP because the costs will reduce our cash available for distribution.
If the IRS makes audit adjustments to our income tax returns for tax years beginning after 2017, it may collect any resulting taxes (including any applicable penalties and interest) directly from us, in which case our cash available for distribution to our unitholders could be substantially reduced.
Pursuant to the Bipartisan Budget Act of 2015, if the IRS makes audit adjustments to our income tax returns for tax years beginning after 2017, it may collect any resulting taxes (including any applicable penalties and interest) directly from us. We will generally have the ability to shift any such tax liability to our GP and our unitholders in accordance with their interests in us during the year under audit, but there can be no assurance that we will be able to do so under all circumstances. If we are required to make payments of taxes, penalties and interest resulting from audit adjustments, our cash available for distribution to our unitholders could be substantially reduced.
Our unitholders will be required to pay taxes on their share of our income even if they do not receive any cash distributions from us.
Because we expect to be treated as a partnership for federal income tax purposes, our unitholders will be treated as partners to whom we will allocate taxable income that could be different in amount than the cash we distribute, our unitholders will be required to pay any federal income taxes and, in some cases, state and local income taxes on their share of our taxable income even if they receive no cash distributions from us. For example, if we sell assets and use the proceeds to repay existing debt or fund capital expenditures, our unitholders may be allocated taxable income and gain resulting from the sale and may not receive a common unit distribution. Similarly, taking advantage of opportunities to reduce our existing debt, such as debt exchanges, debt repurchases, or modifications of our existing debt could result in “cancellation of indebtedness income” being allocated to our unitholders as taxable income without any common unit distribution. Our unitholders may not receive cash distributions from us equal to their share of our taxable income or even equal to the actual tax liability that results from that income.
Certain actions that we may take, such as issuing additional units, may increase the federal income tax liability of unitholders.
In the event we issue additional units or engage in certain other transactions in the future, the allocable share of nonrecourse liabilities allocated to the unitholders will be recalculated to take into account our issuance of any additional units. Any reduction in a unitholder’s share of our nonrecourse liabilities will be treated as a distribution of cash to that unitholder and will result in a corresponding tax basis reduction in a unitholder’s units. A deemed cash distribution may, under certain circumstances, result in the recognition of a taxable gain by a unitholder, to the extent that the deemed cash distribution exceeds such unitholder’s tax basis in its units.
In addition, the federal income tax liability of a unitholder could be increased if we dispose of assets or make a future offering of units and use the proceeds in a manner that does not produce substantial additional deductions, such as to repay indebtedness currently outstanding or to acquire property that is not eligible for depreciation or amortization for federal income tax purposes or that is depreciable or amortizable at a rate significantly slower than the rate currently applicable to our assets.
Tax gain or loss on the disposition of our common units could be more or less than expected.
If unitholders sell their common units, they will recognize a gain or loss equal to the difference between the amount realized and their tax basis in those common units. Because distributions in excess of the unitholder’s allocable share of our net taxable income decrease the unitholder’s tax basis in their common units, the amount, if any, of such prior excess distributions with respect to the units the unitholder sells will, in effect, become taxable income to the unitholder if they sell such units at a price greater than their tax basis in those units, even if the price they receive is less than their original cost. Furthermore, a substantial portion of the amount realized on any sale of common units, whether or not representing a gain, may be taxed as ordinary income due to potential recapture items, including depreciation recapture. In addition, because the amount realized includes a unitholder’s share of our nonrecourse liabilities, if a unitholder sells units, they may incur a tax liability in excess of the amount of cash they receive from the sale.
Tax exempt entities and non-United States persons face unique tax issues from owning our common units that may result in adverse tax consequences to them.
Investment in common units by tax exempt entities, such as employee benefit plans, individual retirement accounts (“IRAs”), Keogh plans and other retirement plans and non-United States persons raises issues unique to them. For example, virtually all of our income allocated to organizations that are exempt from federal income tax, including IRAs and other retirement plans, will be unrelated business taxable income and will be taxable to them. Distributions to non-United States persons are generally taxed and subject to income tax filing requirements by the United States on income effectively connected with a United States trade or business (“effectively connected income”). Income allocated to our unitholders and any gain from the sale of our common units will generally be considered to be “effectively connected” with a United States trade or business. As a result, distributions to a non-United States unitholder will be subject to withholding taxes at the highest applicable effective tax rate and a non-United States unitholder who sells or otherwise disposes of a common unit will also be subject to United States federal income tax on the gain realized from the sale or disposition of that common unit. Non-United States persons will be required to file federal income tax returns and pay tax on their share of our taxable income.
In addition to the withholding tax imposed on distributions of effectively connected income, distributions to a non- United States unitholder will also be subject to a 10% withholding tax on the amount of any distribution in excess of our cumulative net income. We intend to treat all of our distributions as being in excess of our cumulative net income for such purposes and subject to such 10% withholding tax. Accordingly, distributions to a non-United States unitholder will be subject to a combined withholding tax rate equal to the sum of the highest applicable effective tax rate and 10%. For a transfer of interests in a publicly traded partnership that is effected through a broker, the obligation to withhold is imposed on the transferor’s broker. We are required to issue qualified notices regarding these matters. Our qualified notices can be found on our website. If you are a tax exempt entity or a non-United States person, you should consult your tax advisor before investing in our common units.
We treat each purchaser of common units as having the same tax benefits without regard to the actual common units purchased. The IRS may challenge this treatment, which could adversely affect the market value of the common units.
Because we cannot match transferors and transferees of common units and because of other reasons, we have adopted depreciation and amortization positions that may not conform to all aspects of existing Treasury Regulations. Any position we take that is inconsistent with applicable Treasury Regulations may have to be disclosed on our federal income tax return. This disclosure increases the likelihood that the IRS will challenge our positions and propose adjustments to some or all of our
unitholders. A successful IRS challenge to those positions could adversely affect the amount of tax benefits available to our unitholders. It also could affect the timing of these tax benefits or the amount of gain from the sale of common units and could have a negative impact on the market value of our common units or result in audit adjustments to tax returns of unitholders.
We have subsidiaries that are treated as corporations for federal income tax purposes and subject to corporate level income taxes.
We conduct a portion of our operations through subsidiaries that are corporations for federal income tax purposes. We may elect to conduct additional operations in corporate form in the future. Our corporate subsidiaries will be subject to corporate level tax, which will reduce the cash available for distribution to us and, in turn, to our unitholders. If the IRS or other state or local jurisdictions were to successfully assert that our corporate subsidiaries have more tax liability than we anticipate or legislation was enacted that increased the corporate tax rate, our cash available for distribution to our unitholders would be further reduced.
We prorate our items of income, gain, loss and deduction for federal income tax purposes between transferors and transferees of our units each month based on the ownership of our units on the first business day of each month, instead of on the basis of the date a particular unit is transferred. The IRS may challenge this treatment, which could change the allocation of items of income, gain, loss and deduction among our unitholders.
We prorate our items of income, gain, loss and deduction between transferors and transferees of our units each month based on the ownership of our units on the first business day of each month, instead of on the basis of the date a particular unit is transferred. The United States Department of the Treasury adopted final Treasury Regulations allowing a similar monthly simplifying convention for taxable years beginning on or after August 3, 2015. However, such regulations do not specifically authorize all aspects of the proration method we have adopted. If the IRS were to challenge our proration method, we may be required to change the allocation of items of income, gain, loss and deduction among our unitholders.
A unitholder whose common units are loaned to a “short seller” to effect a short sale of units may be considered as having disposed of those common units. If so, such unitholder would no longer be treated for federal income tax purposes as a partner with respect to those common units during the period of the loan and may recognize a gain or loss from the disposition.
Because a unitholder whose common units are loaned to a “short seller” to effect a short sale of units may be considered as having disposed of those common units, the unitholder would no longer be treated for federal income tax purposes as a partner with respect to those common units during the period of the loan to the short seller and the unitholder may recognize a gain or loss from the disposition. Moreover, during the period of the loan to the short seller, any of our income, gain, loss or deduction with respect to those common units may not be reportable by the unitholder and any cash distributions received by the unitholder as to those common units could be fully taxable as ordinary income. Unitholders desiring to assure their status as partners and avoid the risk of gain recognition from a loan to a short seller are urged to consult a tax advisor to discuss whether it is advisable to modify any applicable brokerage account agreements to prohibit their brokers from borrowing their common units.
We have adopted certain valuation methodologies and monthly conventions for federal income tax purposes that may result in a shift of income, gain, loss and deduction between our GP and our unitholders. The IRS may challenge this treatment, which could adversely affect the value of our common units.
When we issue additional units or engage in certain other transactions, we will determine the fair market value of our assets and allocate any unrealized gain or loss attributable to our assets to the capital accounts of our unitholders and our GP. Our methodology may be viewed as understating the value of our assets. In that case, there may be a shift of income, gain, loss and deduction between certain unitholders and the GP, which may be unfavorable to such unitholders. Moreover, under our current valuation methods, subsequent purchasers of common units may have a greater portion of their Internal Revenue Code Section 743(b) adjustment allocated to our tangible assets and a lesser portion allocated to our intangible assets. The IRS may challenge our valuation methods, or our allocation of the Internal Revenue Code Section 743(b) adjustment attributable to our tangible and intangible assets, and allocations of taxable income, gain, loss and deduction between the GP and certain of our unitholders.
A successful IRS challenge to these methods or allocations could adversely affect the amount of taxable income or loss being allocated to our unitholders. It also could affect the amount of taxable gain from our unitholders’ sale of common units and could have a negative impact on the value of the common units or result in audit adjustments to our unitholders’ tax returns without the benefit of additional deductions.
There are limits on the deductibility of our losses that may adversely affect our unitholders.
There are a number of limitations that may prevent unitholders from using their allocable share of our losses as a deduction against unrelated income. In cases where our unitholders are subject to the passive loss rules (generally, individuals and closely held corporations), any losses generated by us will only be available to offset our future income and cannot be used to offset income from other activities, including other passive activities or investments. Unused losses may be deducted when the unitholder disposes of its entire investment in us in a fully taxable transaction with an unrelated party. A unitholder’s share of our net passive income may be offset by unused losses from us carried over from prior years but not by losses from other passive activities, including losses from other publicly traded partnerships. Other limitations that may further restrict the deductibility of our losses by a unitholder include the at-risk rules and the prohibition against loss allocations in excess of the unitholder’s tax basis in its units.
Purchasers of our common units may become subject to state and local taxes and return filing requirements in jurisdictions where we operate or own or acquire properties.
In addition to federal income taxes, holders of our common units are subject to other taxes, including foreign, state and local income taxes, unincorporated business taxes and estate, inheritance or intangible taxes that are imposed by the various jurisdictions in which we conduct business or own or control property now or in the future. Holders of our common units are required to file foreign, state and local income tax returns and pay state and local income taxes in some or all of these various jurisdictions and may be subject to penalties for failure to comply with those requirements. We own assets and conduct business in a number of states, most of which impose a personal income tax on individuals. Most of these states also impose an income tax on corporations and other entities. As we make acquisitions or expand our business, we may own or control assets or conduct business in additional states that impose a personal income tax.
Treatment of distributions on our Preferred Units as guaranteed payments for the use of capital creates a different tax treatment for the holders of Preferred Units than the holders of our common units and such distributions will likely not be eligible for the 20% deduction for qualified publicly traded partnership income.
The tax treatment of distributions on our Preferred Units is uncertain. We will treat the holders of Preferred Units as partners for tax purposes and will treat distributions on the Preferred Units as guaranteed payments for the use of capital that will generally be taxable to the holders of Preferred Units as ordinary income. A holder of our Preferred Units could recognize taxable income from the accrual of such a guaranteed payment even in the absence of a contemporaneous distribution. Otherwise, the holders of Preferred Units are generally not anticipated to share in our items of income, gain, loss or deduction, nor will we allocate any share of our nonrecourse liabilities to the holders of Preferred Units. If the Preferred Units were treated as indebtedness for tax purposes, rather than as guaranteed payments for the use of capital, distributions likely would be treated as payments of interest by us to the holders of Preferred Units.
Although we expect that much of the income we earn is generally eligible for the 20% deduction for qualified publicly traded partnership income, certain Treasury Regulations, which are effective for our taxable years beginning on or after January 1, 2020, provide that a guaranteed payment for the use of capital is not eligible for the 20% deduction for qualified publicly traded partnership income. As a result, income attributable to a guaranteed payment for the use of capital recognized by holders of Preferred Units is not eligible for the 20% deduction for qualified publicly traded partnership income. All holders of our Preferred Units are urged to consult a tax advisor to determine whether they are eligible to receive the 20% deduction for qualified publicly traded partnership income with respect to their Preferred Units. Further, while unitholders of publicly traded partnerships are, subject to certain limitations, entitled to a deduction equal to 20% of their allocable share of qualified publicly traded partnership income, this deduction is scheduled to expire with respect to taxable years beginning after December 31, 2025.
A holder of Preferred Units will be required to recognize a gain or loss on a sale of Preferred Units equal to the difference between the amount realized by such holder and such holder’s tax basis in the Preferred Units sold. The amount realized generally will equal the sum of the cash and the fair market value of other property such holder receives in exchange for such Preferred Units. Subject to general rules requiring a blended basis among multiple partnership interests, the tax basis of a Preferred Unit will generally be equal to the sum of the cash and the fair market value of other property paid by the holder of Preferred Units to acquire such Preferred Unit. Gain or loss recognized by a holder of Preferred Units on the sale or exchange of a Preferred Unit held for more than one year generally will be taxable as a long-term capital gain or loss. Because holders of Preferred Units will generally not be allocated a share of our items of depreciation, depletion or amortization, it is not anticipated that such holders would be required to recharacterize any portion of their gain as ordinary income as a result of the recapture rules.
Investment in the Preferred Units by tax-exempt investors, such as employee benefit plans and IRAs, and non-U.S. persons raises issues unique to them. Distributions to non-U.S. holders of Preferred Units will be subject to withholding taxes. If the amount of withholding exceeds the amount of U.S. federal income tax actually due, non-U.S. holders of Preferred Units may be required to file U.S. federal income tax returns in order to seek a refund of such excess. The treatment of guaranteed payments for the use of capital to tax-exempt investors is not certain and such payments may be treated as unrelated business taxable income for U.S. federal income tax purposes. If you are a tax-exempt entity or a non-U.S. person, you should consult your tax advisor with respect to the consequences of owning our Preferred Units.
All holders of our Preferred Units are urged to consult a tax advisor with respect to the consequences of owning our Preferred Units.
General Risks
The default by significant customers and counterparties or loss of one or more significant customers could materially or adversely affect our business, financial condition, results of operations and cash flows.
The deterioration in the financial condition of one or more of our significant customers or counterparties could result in their failure to perform under the terms of their agreement with us or default in the payment owed to us. Our customers and counterparties include industrial customers, local distribution companies, crude oil and natural gas producers, financial institutions and marketers whose creditworthiness may be suddenly and disparately impacted by, among other factors, commodity price volatility, deteriorating energy market conditions, and public and regulatory opposition to energy producing activities. While we manage our credit risk exposure through credit analysis, credit approvals, establishing credit limits, requiring prepayments (partially or wholly) or other surety, requiring product deliveries over defined time periods, and credit monitoring, we are unable to completely eliminate the performance and credit risk to us associated with doing business with these parties. In a low commodity price environment, certain of our customers have been or could be negatively impacted, causing them significant economic stress resulting, in some cases, in a customer bankruptcy filing or an effort to renegotiate our contracts. The deterioration in the creditworthiness of our customers and the resulting increase in nonpayment and/or nonperformance by them could cause us to write down or write off accounts receivables or tangible and intangible assets. Such write-downs or write-offs could negatively affect our operating results in the periods in which they occur, and, if significant, could materially or adversely affect our business, financial condition, results of operations, and cash flows. We expect to continue to depend on key customers to support our revenues for the foreseeable future. The loss of key customers, failure to renew contracts upon expiration, or a sustained decrease in demand by key customers could result in a substantial loss of revenues and could have a material and adverse effect on our consolidated results of operations. Additionally, certain key customers of the Grand Mesa Pipeline contribute significantly to the cash flows and profitability of that asset. Any loss of those customers or their contracts could have an adverse impact on our financial results. To the extent one or more of our key customers commences bankruptcy proceedings, our contracts with the customers may be subject to rejection under applicable provisions of the United States Bankruptcy Code or, if we so agree, may be renegotiated. Further, during any such bankruptcy proceeding, prior to assumption, rejection or renegotiation of such contracts, the bankruptcy court may temporarily authorize the payment of value for our services less than contractually required, which could have a material adverse effect on our business, financial condition, results of operations and cash flows. The resolution of our outstanding claims against such a customer or counterparty is dependent on the terms of the plan of reorganization but may include our claims being converted to equity in the reorganized entity and in addition to impacting our business, financial condition and results of operations could require us to incur impairment charges against the associated assets or the write down of our goodwill.
The counterparties to our commodity derivative and physical purchase and sale contracts may not be able to perform their obligations to us, which could materially affect our cash flows and results of operations.
We encounter risk of counterparty nonperformance in our businesses. Disruptions in the supply of product and in the crude oil and natural gas liquids commodities sector overall for an extended or near term period of time could result in counterparty defaults on our derivative and physical purchase and sale contracts. This could impair our ability to obtain supply to fulfill our sales delivery commitments or obtain supply at reasonable prices, which could result in decreased gross margins and profitability, thereby impairing our ability to make payments on our debt obligations or distributions to our unitholders.
If we fail to maintain an effective system of internal control, including internal control over financial reporting, we may be unable to report our financial results accurately or prevent fraud, which would likely have a negative impact on the market price of our common units.
We are subject to the public reporting requirements of the Securities Exchange Act of 1934, as amended. We are also subject to the obligation under Section 404(a) of the Sarbanes Oxley Act of 2002 (“Sarbanes-Oxley Act”) to annually review and report on our internal control over financial reporting, and to the obligation under Section 404(b) of the Sarbanes-Oxley Act to engage our independent registered public accounting firm to attest to the effectiveness of our internal control over financial reporting.
The Sarbanes-Oxley Act requires public companies to have and maintain effective disclosure controls and procedures to ensure timely disclosures of material information and to have management review the effectiveness of those controls on a quarterly basis. The Sarbanes-Oxley Act also requires public companies to have and maintain effective internal control over financial reporting to provide reasonable assurance regarding the reliability of financial reporting and preparation of financial statements and to have management review the effectiveness of those controls on an annual basis (and have the company’s independent auditors attest to the effectiveness of such internal controls).
Effective internal controls are necessary for us to provide reliable financial reports, prevent fraud, and operate successfully as a publicly traded partnership. Our efforts to maintain our internal controls may be unsuccessful, and we may be unable to maintain effective internal control over financial reporting, including our disclosure controls. Any failure to maintain effective internal control over financial reporting and disclosure controls could harm our operating results or cause us to fail to meet our reporting obligations. These risks may be heightened after a business combination, during the phase when we are implementing our internal control structure over the recently acquired business.
Given the difficulties inherent in the design and operation of internal control over financial reporting, as well as future growth of our businesses, we can provide no assurance as to either our or our independent registered public accounting firm’s conclusions about the effectiveness of internal controls in the future, and we may incur significant costs in our efforts to comply with Section 404 of the Sarbanes-Oxley Act . Ineffective internal controls could subject us to regulatory scrutiny and a loss of confidence in our reported financial information, which could have an adverse effect on our business and would likely have a negative effect on the market price of our common units.
The impact of a global public health crisis may have material adverse consequences for general economic, financial and business conditions, and could materially and adversely affect our business, financial condition, results of operations and liquidity and those of our customers, suppliers and other counterparties.
Changes in the supply of and demand for hydrocarbon products impacts both the volume of products that we purchase and sell and the level of services that we provide to customers, which in turn impacts our financial position, results of operations and cash flows.
The global and U.S. economy has generally recovered from the negative economic impacts of the COVID-19 pandemic, which disrupted global supply chains, reduced consumer activity, disrupted travel and created significant volatility and disruption of financial and commodity markets. While the World Health Organization declared an end to the global public health emergency for COVID-19 in May 2023, a future global public health crisis could lead to similar disruptions and related economic repercussions. Any resumed period of economic slowdown or recession, or the return to a period of depressed demand or prices for hydrocarbons that we handle, could have significant adverse consequences on our financial condition and the financial condition of our customers, suppliers and other counterparties, and could diminish our liquidity and negatively affect the volumes of products handled by our pipelines and other facilities.
The potential impact of these types of events on our financial condition, results of operations and cash flows depends largely on developments outside our control, including the duration of and response to a public health crisis, the related impact on overall economic activity and the potential long-term impacts on demand for crude oil and other products, all of which cannot be predicted with certainty.
The risk of terrorism and political unrest in various energy producing regions may adversely affect the economy and the price and availability of products.
An act of terror, or political unrest, in any of the major energy producing regions of the world could potentially result in disruptions in the supply of crude oil and natural gas, which could have a material impact on both availability and price. Terrorist attacks in the areas of our operations could negatively impact our ability to transport crude oil, natural gas liquids and
refined and renewables products to our locations. These risks could potentially negatively impact our consolidated results of operations.
Product liability claims and litigation could adversely affect our business and results of operations.
Our operations are subject to all operating hazards and risks incident to handling, storing, transporting and providing customers with combustible liquids. As a result, we are subject to product liability claims and litigation, including potential class actions, in the ordinary course of business. Any product liability claim or other litigation matter brought against us, with or without merit, could be costly to defend and could result in an increase of our insurance premiums. Some claims brought against us might not be covered by our insurance policies. In addition, we have self-insured retention amounts which we would have to pay in full before obtaining any insurance proceeds to satisfy a judgment or settlement and we may have insufficient reserves on our balance sheet to satisfy such self-retention obligations. Furthermore, even where the claim is covered by our insurance, our insurance coverage might be inadequate and we would have to pay the amount of any settlement or judgment that is in excess of our policy limits. Our failure to maintain adequate insurance coverage or successfully defend against product liability claims or other litigation matters could materially and adversely affect our business, consolidated results of operations, financial position and cash flows.
A failure in our operational systems or cybersecurity attacks on any of our facilities, or those of third parties, may adversely affect our financial results.
Our business is dependent upon our operational systems to process a large amount of data and complex transactions. If any of our financial or operational systems fail or have other significant shortcomings, our financial results could be adversely affected. Our financial results could also be adversely affected if an employee causes our systems to fail, either as a result of inadvertent error or by deliberately tampering with or manipulating our systems. In addition, dependence upon automated systems may further increase the risk related to operational system flaws, and employee tampering or manipulation of those systems will result in losses that are difficult to detect.
Due to increased technology advances, we have become more reliant on technology to increase efficiency in our business. We use various systems in our financial and operations sectors, and this may subject our business to increased risks. Any future cybersecurity attacks that affect our facilities, our customers and any financial data could have a material adverse effect on our business. In addition, cybersecurity attacks on our customer and employee data may result in a financial loss, including potential fines for failure to safeguard data, and may negatively impact our reputation. Third-party systems on which we rely could also suffer operational system failure. Any of these occurrences could disrupt our business, resulting in potential liability or reputational damage or otherwise have an adverse effect on our financial results.
Item 1B. Unresolved Staff Comments
None.
Item 1C. Cybersecurity
Cybersecurity Governance and Strategy
Our cybersecurity program is designed to provide logical and physical security protection of our infrastructure, systems and data from theft and destruction that could impact our operations, reputation, and regulatory compliance. To safeguard us from a cyber event, specific mitigating cybersecurity controls, systems and incident procedures exist based upon the United States Department of Commerce National Institute of Standards and Framework (“NIST”) Cybersecurity Framework, which is an industry recognized security framework for private and public sectors. Our commitment to cybersecurity is reflected in our extensive program and related technology investments for continual cybersecurity posture enhancements.
Our cybersecurity governance and strategy program to prevent, detect, manage, mitigate, and remediate cyber threats is comprised of:
•Controls based upon the NIST Cybersecurity Framework for enterprise governance, critical asset management, internal and third-party risk management, segregated access control management, data security and protection,
anomaly logging and general security monitoring, incident response, security training and awareness, and disaster recovery testing.
•Security Policies and Procedures for cybersecurity, incident response, acceptable use, change control, disaster recovery, backup and recovery, business continuity, business operations recovery, third-party vendor security assessments, vulnerability and patch management, data privacy, and various regulatory compliance areas.
•Enterprise Risk Management to identify, assess and mitigate internal and third-party risks in a continuous life cycle program which is also based on the NIST Cybersecurity Framework. This risk management framework incorporates corporate and business segment SCADA (Supervisory Control and Data Acquisition) system risks for an integrated enterprise approach.
•Various Cybersecurity Systems and Protocols for aggregated monitoring, detection and response, network protection and segmentation, layered security methods, vulnerability and patch management, backup and recovery, and asset management.
•Employee Education for continual security awareness and threat diligence. The program includes a myriad of monthly and quarterly required cyber training for high-risk areas plus mandatory semi-annual training for all employees and third parties with access to our network. Additionally, monthly simulated phishing campaigns and newsletters reinforce cyber risks and general security awareness.
Cybersecurity Risk and Threat Management
Our Enterprise Cybersecurity Risk Management program is a continuous life cycle approach with a formal annual risk assessment followed by internal and third-party risk assessments throughout the year. Annually, an independent security expert vendor is engaged to conduct a cybersecurity risk assessment based upon industry and technology standards. The assessment results are prioritized then tracked within our Governance, Risk and Control system which derives the specific risk likelihood and impact mitigated risk score. Cybersecurity projects, controls and practices are then developed to mitigate the identified risks. Monthly, the Compliance and Security Steering Committee meets to review risk register, current threat assessments and related mitigation efforts for risk management tracking. Additionally, on a quarterly basis, our Chief Information Officer (“CIO”) presents the risk score and mitigation updates to the board of directors of our GP for risk oversight.
Event management of a cyber incident follows our Cybersecurity Policy Incident Response Procedure (“Incident Response Policy”) which is based upon the NIST framework. The procedure includes incident identification, isolation and containment, investigation, impact analysis, communication, materiality assessment including in aggregate with previous events, and reporting steps and associated ownership. Annually, the Incident Response Policy is tested with the key owners to validate the procedure and for training purposes.
Impact of Risks from Cybersecurity Threats
While we have not, as of the date of this Annual Report, experienced a cybersecurity threat or incident that resulted in a material adverse impact to our business or operations, there can be no guarantee that we will not experience such an incident in the future due to the increasing global cyberattack volume, frequency, and sophistication. Such incidents, whether or not successful, could result in us incurring significant costs related to, for example, implementing additional threat protection measures, providing modifications or replacements to our products and services, defending against litigation, responding to regulatory inquiries or actions, providing customers with incentives to maintain a business relationship with us, or taking other remedial steps with respect to third parties, as well as incurring reputational harm. In addition, these threats are constantly evolving, thereby increasing the difficulty of successfully defending against them or implementing adequate preventive measures even with our various cybersecurity protection and resilience protocols.
Management’s Cyber Expertise
Our cybersecurity program is led by our CIO who is also our Chief Information Security Officer. Our CIO has been with us since 2014 and has over 30 years of information technology and compliance experience. Our CIO has a Bachelor of Science in Management Information Systems and holds the Certified Information Systems Audit security certification as well. Our security members are comprised of various industry technology skilled resources in cybersecurity, business continuity and system recovery, event management, system administration, network engineering, and regulatory compliance with a collective 100 plus years of experience. Security operations partners are also leveraged for 24x7x365 managed detection and response support plus provide expert cybersecurity resources as an extension of our team.
Board of Director’s Cyber Oversight
For cybersecurity oversight, the board of directors of our GP training program is designed to inform members of the current cyber threat tactics and provide relevant, periodic educational security technology information. The cybersecurity training program includes:
•An annual presentation overview of our cyber controls and related systems for a comprehensive understanding of our cybersecurity protection and resilience;
•Quarterly cybersecurity training on topics such as ransomware, phishing, impersonation, social engineering, third-party security risks, and business email compromise to reinforce general security knowledge; and
•Monthly cybersecurity newsletter distribution for current threat tactics and general security awareness.
Additionally, the CIO presents a quarterly cyber update to the board of directors of our GP for an overview of cyber program key metrics and trends, cyber event executive summaries (based upon occurrence), fiscal year security goals and tracking progression, risk register scoring, and status updates on cyber related projects.
Item 2. Properties
We believe that we have satisfactory title or valid rights to use all of our material properties. Although some of these properties are subject to liabilities and leases, liens for taxes not yet due and payable, encumbrances, easements and restrictions, we do not believe that any of these burdens will materially interfere with our continued use of these properties in our business, taken as a whole. Our obligations under the ABL Facility, Term Loan B and Indenture are secured by liens and mortgages on substantially all of our real and personal property.
We believe that we have all required material approvals, authorizations, orders, licenses, permits, franchises and consents of, and have obtained or made all required material registrations, qualifications and filings with, the various state and local governmental and regulatory authorities that relate to ownership of our properties or the operations of our business.
Our corporate headquarters are in Tulsa, Oklahoma and are leased. We also lease corporate offices in Denver, Colorado and Houston, Texas.
For additional information regarding our properties and the reportable segments in which they are used, see Part I, Item 1–“Business.”
Item 3. Legal Proceedings
We are involved from time to time in various legal proceedings and claims arising in the ordinary course of business. For information related to legal proceedings, see the discussion under the caption “Legal Contingencies” in Note 8 to our consolidated financial statements included in this Annual Report, which is incorporated by reference into this Item 3.
Item 103 of SEC Regulation S-K requires disclosure of certain environmental matters when a governmental authority is a party to the proceedings and such proceedings involve potential monetary sanctions that we reasonably believe will exceed a specified threshold. Pursuant to SEC regulations, we use a threshold of $1 million for such proceedings. We believe that such threshold is reasonably designed to result in disclosure of environmental proceedings that are material to our business or financial condition. Applying this threshold, there are no environmental matters to disclose for the three years ended March 31, 2024.
Item 4. Mine Safety Disclosures
Not applicable.
PART II
Item 5. Market for Registrant’s Common Equity, Related Unitholder Matters and Issuer Purchases of Equity Securities
Market Information
Our common units are listed on the New York Stock Exchange (“NYSE”) under the symbol “NGL.” At June 4, 2024, there were approximately 90 common unitholders of record which does not include unitholders for whom common units may be held in “street name.”
Cash Distribution Policy
Available Cash
Our Partnership Agreement requires that, within 45 days after the end of each quarter, we distribute all of our available cash (as defined in our Partnership Agreement) to unitholders as of the record date. Available cash for any quarter generally consists of all cash on hand at the end of that quarter, less the amount of cash reserves established by our GP, to (i) provide for the proper conduct of our business, (ii) comply with applicable law, any of our debt instruments or other agreements, and (iii) provide funds for distributions to our unitholders and to our GP for any one or more of the next four quarters.
General Partner Interest
Our GP is entitled to 0.1% of all quarterly distributions that we make prior to our liquidation. Our GP has the right, but not the obligation, to contribute a proportionate amount of capital to us to maintain its 0.1% GP interest. Our GP’s interest in our distributions may be reduced if we issue additional limited partner units in the future (other than the issuance of common units upon a reset of the IDRs) and our GP does not contribute a proportionate amount of capital to us to maintain its 0.1% GP interest. As of March 31, 2024, we owned 8.69% of our GP.
Incentive Distribution Rights
The GP will also receive, in addition to distributions on its 0.1% GP interest, additional distributions based on the level of distributions to the limited partners. These distributions are referred to as “incentive distributions” or “IDRs.” Our GP currently holds the IDRs, but may transfer these rights separately from its GP interest.
The following table illustrates the percentage allocations of available cash from operating surplus between our limited partner unitholders and our GP based on the specified target distribution levels. The amounts set forth under “Marginal Percentage Interest In Distributions” are the percentage interests of our GP and our limited partner unitholders in any available cash from operating surplus we distribute up to and including the corresponding amount in the column “Total Quarterly Distribution Per Unit,” until available cash from operating surplus we distribute reaches the next target distribution level, if any. The percentage interests shown for our limited partner unitholders and our GP for the minimum quarterly distribution are also applicable to quarterly distribution amounts that are less than the minimum quarterly distribution. The percentage interests set forth below for our GP include its 0.1% GP interest, and assume that our GP has contributed any additional capital necessary to maintain its 0.1% GP interest and has not transferred its IDRs.
| | | | | | | | | | | | | | | | | | | | | | | | | | | | | | | | | | | | | | |
| | | | Marginal Percentage Interest In Distributions |
| | Total Quarterly Distribution Per Unit | | Limited Partner Unitholders | | General
Partner (1) |
| Minimum quarterly distribution | | | | | | | | $ | 0.337500 | | | 99.9 | % | | 0.1 | % |
| First target distribution | | above | | $ | 0.337500 | | | up to | | $ | 0.388125 | | | 99.9 | % | | 0.1 | % |
| Second target distribution | | above | | $ | 0.388125 | | | up to | | $ | 0.421875 | | | 86.9 | % | | 13.1 | % |
| Third target distribution | | above | | $ | 0.421875 | | | up to | | $ | 0.506250 | | | 76.9 | % | | 23.1 | % |
| Thereafter | | above | | $ | 0.506250 | | | | | | | 51.9 | % | | 48.1 | % |
(1) The maximum distribution of 48.1% does not include distributions that our GP may receive on common units that it owns.
Restrictions on the Payment of Distributions
As described in Note 7 to our consolidated financial statements included in this Annual Report, the ABL Facility, Term Loan B and Indenture contain covenants limiting our ability to pay distributions if we are in default under these agreements. Also, the Term Loan B and Indenture restrict us from paying distributions if our total leverage ratio (as defined within the Indenture and Term Loan B agreement) for the most recently ended four full fiscal quarters at the time of the distribution is greater than 4.75 to 1.00, while the ABL facility restricts the payment of distributions if certain payment conditions (as defined in the ABL Facility) are below certain thresholds. In addition, quarterly distributions on the Preferred Units must be fully paid for all preceding fiscal quarters before we are permitted to declare or pay any distributions on our common units.
Securities Authorized for Issuance Under Equity Compensation Plans
In connection with the completion of our initial public offering, our GP adopted the NGL Energy Partners LP Long-Term Incentive Plan. See Part III, Item 12–“Security Ownership of Certain Beneficial Owners and Management and Related Unitholder Matters–Securities Authorized for Issuance Under Equity Compensation Plan,” which is incorporated by reference into this Item 5.
Item 6. [Reserved]
Item 7. Management’s Discussion and Analysis of Financial Condition and Results of Operations
Overview
NGL Energy Partners LP, a Delaware master limited partnership (“we,” “us,” “our,” or the “Partnership”), is a diversified midstream energy partnership that transports, treats, recycles and disposes of produced and flowback water generated as part of the energy production process as well as transports, stores, markets and provides other logistics services for crude oil and liquid hydrocarbons. NGL Energy Holdings LLC serves as our general partner (“GP”). At March 31, 2024, our operations included three segments as discussed below.
Water Solutions
Our Water Solutions segment transports, treats, recycles and disposes of produced and flowback water generated from crude oil and natural gas production. We also sell produced water for reuse and recycle and brackish non-potable water to our producer customers to be used in their crude oil exploration and production activities. As part of processing water, we aggregate and sell recovered crude oil, also known as skim oil. We also dispose of solids such as tank bottoms, drilling fluids and drilling muds and perform other ancillary services such as truck and frac tank washouts. Our activities in this segment are underpinned by long-term, fixed fee contracts and acreage dedications, some of which contain minimum volume commitments with leading oil and gas companies including large, investment grade producer customers.
We operate in a number of the most prolific crude oil and natural gas producing areas in the United States including the Delaware Basin in New Mexico and Texas, the Denver-Julesburg (“DJ”) Basin in Colorado and the Eagle Ford Basin in Texas. With a system that handled approximately 884.6 million barrels of produced water across its areas of operation during the year ended March 31, 2024, we believe that we are the largest independent produced water transportation and disposal company in the United States.
The opportunity to generate revenue in our Water Solutions segment is driven in large part by the level of crude oil production in the areas where our facilities are located. Recently, our disposal volumes have been positively impacted by the increase in the level of crude oil production, particularly in the Delaware and Eagle Ford Basins, due to increasing or stable crude oil prices. Lower crude oil prices provide producers with less incentive to drill and complete new wells, which results in lower production and negatively impacts our disposal volumes.
Our Water Solutions segment generated operating income of $231.3 million during the year ended March 31, 2024, compared to operating income of $198.9 million during the year ended March 31, 2023.
Crude Oil Logistics
Our Crude Oil Logistics segment purchases crude oil from producers and marketers and transports it to refineries or for resale at pipeline injection stations, storage terminals, barge loading facilities, rail facilities, refineries, and other trade hubs, and provides storage, terminaling and transportation services through its owned assets. Our activities in this segment are supported by certain long-term, fixed rate contracts which include minimum volume commitments on our owned and leased pipelines and storage tanks.
Most of our contracts to purchase or sell crude oil are at floating prices that are indexed to published rates in active markets such as Cushing, Oklahoma, St. James, Louisiana, and Magellan East Houston. We attempt to reduce our exposure to price fluctuations by using back-to-back physical contracts whenever possible. When back-to-back physical contracts are not optimal, we enter into financially settled derivative contracts as economic hedges of our physical inventory, physical sales and physical purchase contracts. We use our transportation assets to move crude oil from the wellhead to the highest value market. Spreads between crude oil prices in different markets can fluctuate, which may expand or limit our opportunity to generate margins by transporting crude oil to different markets.
The following table summarizes the range of low and high crude oil spot prices per barrel of New York Mercantile Exchange (“NYMEX”) West Texas Intermediate Crude Oil at Cushing, Oklahoma for the periods indicated and the prices at period end:
| | | | | | | | | | | | | | | | | | | | |
| | Crude Oil Spot Price Per Barrel |
| Year Ended March 31, | | Low | | High | | At Period End |
| 2024 | | $ | 67.12 | | | $ | 93.68 | | | $ | 83.17 | |
| 2023 | | $ | 66.74 | | | $ | 122.11 | | | $ | 75.67 | |
| 2022 | | $ | 58.65 | | | $ | 123.70 | | | $ | 100.28 | |
We believe volatility in commodity prices will continue, and our ability to adjust to and manage this volatility may impact our financial results.
Our Crude Oil Logistics segment generated operating income of $52.1 million during the year ended March 31, 2024, compared to operating income of $81.5 million during the year ended March 31, 2023.
Liquids Logistics
Our Liquids Logistics segment conducts supply operations for natural gas liquids, refined petroleum products and biodiesel to a broad range of commercial, retail and industrial customers across the United States and Canada. These operations are conducted through our 23 owned terminals, third-party storage and terminal facilities, nine common carrier pipelines and a fleet of leased railcars. We also provide services for marine exports of butane through our facility located in Chesapeake, Virginia, and we also own a propane pipeline in Michigan. We attempt to reduce our exposure to price fluctuations by using back-to-back physical contracts and pre-sale agreements that allow us to lock in a margin on a percentage of our winter volumes. We also enter into financially settled derivative contracts as economic hedges of our physical inventory, physical sales and physical purchase contracts.
Our wholesale liquids business is a “cost-plus” business that can be affected by both price fluctuations and volume variations. We establish our selling price based on a pass-through of our product supply, transportation, handling, storage, and capital costs plus a margin. Also, we conduct just-in-time sales for gasoline and diesel at a national network of terminals owned by third parties via rack spot sales that do not involve continuing contractual obligations to purchase or deliver product.
Weather conditions and gasoline blending can have a significant impact on the demand for propane and butane, and sales volumes and prices are typically higher during the colder months of the year. Consequently, our revenues, operating profits, and operating cash flows are typically lower in the first and second quarters of our fiscal year.
The following table summarizes the range of low and high propane spot prices per gallon at Conway, Kansas, and Mt. Belvieu, Texas, two of our main pricing hubs, for the periods indicated and the prices at period end:
| | | | | | | | | | | | | | | | | | | | | | | | | | | | | | | | | | | | | | |
| | Conway, Kansas | | Mt. Belvieu, Texas |
| | Propane Spot Price Per Gallon | | Propane Spot Price Per Gallon |
| Year Ended March 31, | | Low | | High | | At Period End | | Low | | High | | At Period End |
| 2024 | | $ | 0.49 | | | $ | 0.91 | | | $ | 0.78 | | | $ | 0.53 | | | $ | 0.97 | | | $ | 0.84 | |
| 2023 | | $ | 0.63 | | | $ | 1.34 | | | $ | 0.74 | | | $ | 0.64 | | | $ | 1.39 | | | $ | 0.78 | |
| 2022 | | $ | 0.67 | | | $ | 1.64 | | | $ | 1.37 | | | $ | 0.72 | | | $ | 1.63 | | | $ | 1.39 | |
The following table summarizes the range of low and high butane spot prices per gallon at Mt. Belvieu, Texas for the periods indicated and the prices at period end:
| | | | | | | | | | | | | | | | | | | | |
| | Butane Spot Price Per Gallon |
| Year Ended March 31, | | Low | | High | | At Period End |
| 2024 | | $ | 0.58 | | | $ | 1.14 | | | $ | 0.98 | |
| 2023 | | $ | 0.85 | | | $ | 1.65 | | | $ | 0.92 | |
| 2022 | | $ | 0.78 | | | $ | 2.01 | | | $ | 1.71 | |
The following table summarizes the range of low and high Gulf Coast gasoline spot prices per barrel using NYMEX gasoline prompt-month futures for the periods indicated and the prices at period end:
| | | | | | | | | | | | | | | | | | | | |
| | Gasoline Spot Price Per Barrel |
| Year Ended March 31, | | Low | | High | | At Period End |
| 2024 | | $ | 83.15 | | | $ | 124.53 | | | $ | 115.97 | |
| 2023 | | $ | 86.06 | | | $ | 179.60 | | | $ | 113.42 | |
| 2022 | | $ | 81.95 | | | $ | 154.67 | | | $ | 133.96 | |
The following table summarizes the range of low and high diesel spot prices per barrel using NYMEX ULSD prompt-month futures for the periods indicated and the prices at period end:
| | | | | | | | | | | | | | | | | | | | |
| | Diesel Spot Price Per Barrel |
| Year Ended March 31, | | Low | | High | | At Period End |
| 2024 | | $ | 93.76 | | | $ | 146.22 | | | $ | 109.86 | |
| 2023 | | $ | 109.41 | | | $ | 215.69 | | | $ | 112.40 | |
| 2022 | | $ | 74.44 | | | $ | 186.37 | | | $ | 155.03 | |
We believe volatility in commodity prices will continue, and our ability to adjust to and manage this volatility may impact our financial results.
Our Liquids Logistics segment generated operating income of $2.5 million during the year ended March 31, 2024, compared to operating income of $66.6 million during the year ended March 31, 2023.
Other Developments
Global Pandemic, International Conflicts and Market Update
Since March 2020, and throughout the last three years, global markets and commodity prices have been extremely volatile due to the impacts from the COVID-19 pandemic, with further impacts on volatility caused by the war in Ukraine that began in February 2022, the current conflict between Israel and Hamas that began in October 2023 and conflicts involving Iran and its proxy forces. While we have seen continued recovery in commodity prices since the beginning of the pandemic, there is still volatility that we expect to continue at least for the near-term and possibly longer, due to these conflicts. This volatility could result in economic recession or depression and negatively impact future prices for crude oil, natural gas, petroleum products and industrial products.
In addition, if we see a continuation or acceleration of fiscal year 2023’s inflationary conditions, rising interest rates, supply chain disruptions and tight labor markets, we may also see higher costs of operating our assets and executing on our capital projects in fiscal year 2025. In an effort to curb inflation, the U.S. Federal Reserve raised interest rates during fiscal year
2023, in May 2023 and most recently in July 2023. If the U.S. Federal Reserve implements additional increases, costs under our variable-rate debt and preferred units will increase (see “Item 7A. Quantitative and Qualitative Disclosures About Market Risk–Interest Rate Risk” included in this Annual Report on Form 10-K (“Annual Report”)). On the other hand, our ability to pass along rate increases reflecting changes in producer and/or consumer price indices to our customers, under our contracts, should help to counterbalance the impact of inflation on our costs.
Seismic Activity
The subsurface injection of produced water for disposal has been associated with induced seismic events in Texas and New Mexico. While these events have been of relatively low magnitude, industry and relevant state regulators are, nevertheless, taking proactive measures to attempt to prevent similar induced seismic events. More specifically, we are engaged in various collaborative industry efforts with other disposal operators and relevant state regulatory agencies, working to collect and review data, enhance understanding of regional fault systems, and ultimately develop and implement appropriate longer-term mitigation strategies. As part of this effort, we have implemented reductions in injected volumes at certain facilities, and where appropriate have temporarily shut-in facilities. To date, due to the capacity of our integrated system in the affected areas, the diverse locations of our disposal facilities, and the connectivity of our system, our ability to dispose of produced water has not been materially impacted by these actions, and with our unique positioning outside of the affected areas, we have the ability to grow our asset base.
Regulatory Developments
On March 6, 2024, the Securities and Exchange Commission (“SEC”) adopted a new set of rules that require a wide range of climate-related disclosures, including material climate-related risks, information on any climate-related targets or goals that are material to the registrant’s business, results of operations, or financial condition, Scope 1 and Scope 2 greenhouse gas emissions on a phased-in basis by certain larger registrants when those emissions are material and the filing of an attestation report covering the same, and disclosure of the financial statement effects of severe weather events and other natural conditions including costs and losses. Compliance dates under the final rule are phased in by registrant category. Multiple lawsuits have been filed challenging the SEC’s new climate rules, which have been consolidated and will be heard in the U.S. Court of Appeals for the Eighth Circuit. On April 4, 2024, the SEC issued an order staying the final rules until judicial review is complete.
Consolidated Results of Operations
The following table summarizes our consolidated statements of operations for the periods indicated:
| | | | | | | | | | | | | | | | | | | | |
| | Year Ended March 31, |
| | 2024 | | 2023 | | 2022 |
| | (in thousands) |
| Revenues | | $ | 6,956,571 | | | $ | 8,694,904 | | | $ | 7,947,915 | |
| Cost of sales | | 5,966,794 | | | 7,650,024 | | | 7,139,312 | |
| Operating expenses | | 305,185 | | | 313,725 | | | 285,535 | |
| General and administrative expense | | 121,881 | | | 71,818 | | | 63,546 | |
| Depreciation and amortization | | 266,523 | | | 273,621 | | | 288,720 | |
| Loss on disposal or impairment of assets, net | | 115,936 | | | 86,888 | | | 94,254 | |
| Revaluation of liabilities | | 2,680 | | | 9,665 | | | (6,495) | |
| Operating income | | 177,572 | | | 289,163 | | | 83,043 | |
| Equity in earnings of unconsolidated entities | | 4,120 | | | 4,120 | | | 1,400 | |
| Interest expense | | (269,923) | | | (275,445) | | | (271,640) | |
| (Loss) gain on early extinguishment of liabilities, net | | (55,281) | | | 6,177 | | | 1,813 | |
| Other income, net | | 2,793 | | | 28,748 | | | 2,254 | |
| (Loss) income before income taxes | | (140,719) | | | 52,763 | | | (183,130) | |
| Income tax expense | | (2,405) | | | (271) | | | (971) | |
| Net (loss) income | | (143,124) | | | 52,492 | | | (184,101) | |
| Less: Net income attributable to noncontrolling interests | | (631) | | | (1,106) | | | (655) | |
| Net (loss) income attributable to NGL Energy Partners LP | | $ | (143,755) | | | $ | 51,386 | | | $ | (184,756) | |
Items Impacting the Comparability of Our Financial Results
Our current and future results of operations may not be comparable to our historical results of operations for the periods presented due to commodity price volatility, demand fluctuations, acquisitions, dispositions and other transactions.
Debt Refinancing
On February 2, 2024, we closed a debt refinancing transaction of $2.9 billion consisting of a private offering of $2.2 billion of senior secured notes and also entered into a new seven-year $700.0 million senior secured term loan “B” credit facility (“Term Loan B”). The net proceeds from these transactions were used to (i) fund the redemption, and related discharge of the indentures governing our existing 7.5% senior secured notes due 2026 (“2026 Senior Secured Notes”) as well as our 6.125% senior unsecured notes due 2025 (“2025 Notes”) and 7.5% senior unsecured notes due 2026 (“2026 Notes”) (collectively, the “Senior Unsecured Notes”), including any applicable premiums and accrued and unpaid interest, (ii) to pay fees and expenses in connection therewith, (iii) to repay borrowings under the $600.0 million asset-based revolving credit facility (“ABL Facility”) and (iv) to the extent of any remaining net proceeds, for general corporate purposes. In addition, we amended the ABL Facility. See Note 7 to our consolidated financial statements included in this Annual Report and “–Liquidity, Sources of Capital and Capital Resource Activities” for a further discussion of these transactions.
Repurchase and/or Redemption of Senior Secured Notes and Senior Unsecured Notes
During the three months ended March 31, 2024, we repurchased and/or redeemed all $2.1 billion of our outstanding 2026 Senior Secured Notes and $280.7 million of the 2025 Notes. On February 2, 2024, we deposited $331.9 million with the trustee for the redemption of the 2026 Notes. See Note 7 to our consolidated financial statements included in this Annual Report for a further discussion of the repurchases and redemptions.
Dispositions
We completed several dispositions during the years ended March 31, 2024, 2023 and 2022. These transactions impact the comparability of our results of operations between our current and prior fiscal years. See Note 17 to our consolidated financial statements included in this Annual Report for a discussion of dispositions that occurred during the current and prior fiscal years.
Seasonality
Seasonality impacts our Liquids Logistics segment. Consequently, for our Liquids Logistics segment, revenues, operating profits and operating cash flows are generated mostly in the third and fourth quarters of our fiscal year. We generally borrow under the ABL Facility to supplement our operating cash flows during the periods in which we are building inventory (see “–Liquidity, Sources of Capital and Capital Resource Activities–General”).
Subsequent Events
See Note 18 to our consolidated financial statements included in this Annual Report for a discussion of transactions that occurred subsequent to March 31, 2024.
Segment Operating Results for the Years Ended March 31, 2024 and 2023
Water Solutions
The following table summarizes the operating results of our Water Solutions segment for the periods indicated.
| | | | | | | | | | | | | | | | | | | | |
| | Year Ended March 31, | | |
| | 2024 | | 2023 | | Change |
| | (in thousands, except per barrel and per day amounts) |
| Revenues: | | | | | | |
| Water disposal service fees | | $ | 572,972 | | | $ | 524,689 | | | $ | 48,283 | |
| Sale of recovered crude oil | | 107,367 | | | 120,705 | | | (13,338) | |
| Recycled water | | 9,785 | | | 13,841 | | | (4,056) | |
| Other revenues | | 40,694 | | | 37,803 | | | 2,891 | |
| Total revenues | | 730,818 | | | 697,038 | | | 33,780 | |
| Expenses: | | | | | | |
| Cost of sales-excluding impact of derivatives | | 10,146 | | | 9,737 | | | 409 | |
| Derivative loss | | 1,148 | | | 4,363 | | | (3,215) | |
| Operating expenses | | 212,052 | | | 212,115 | | | (63) | |
| General and administrative expenses | | 5,417 | | | 8,722 | | | (3,305) | |
| Depreciation and amortization expense | | 214,480 | | | 207,081 | | | 7,399 | |
| Loss on disposal or impairment of assets, net | | 53,639 | | | 46,431 | | | 7,208 | |
| Revaluation of liabilities | | 2,680 | | | 9,665 | | | (6,985) | |
| Total expenses | | 499,562 | | | 498,114 | | | 1,448 | |
| Segment operating income | | $ | 231,256 | | | $ | 198,924 | | | $ | 32,332 | |
| | | | | | |
| Produced water processed (barrels per day) | | | | | | |
| Delaware Basin | | 2,123,337 | | | 2,042,777 | | | 80,560 | |
| Eagle Ford Basin | | 142,374 | | | 119,458 | | | 22,916 | |
| DJ Basin | | 150,426 | | | 150,619 | | | (193) | |
| Other Basins | | 740 | | | 14,483 | | | (13,743) | |
| Total | | 2,416,877 | | | 2,327,337 | | | 89,540 | |
| Recycled water (barrels per day) | | 84,212 | | | 118,847 | | | (34,635) | |
| Total (barrels per day) | | 2,501,089 | | | 2,446,184 | | | 54,905 | |
| Skim oil sold (barrels per day) (1) | | 3,992 | | | 3,764 | | | 228 | |
| Service fees for produced water processed ($/barrel) (2) | | $ | 0.65 | | | $ | 0.62 | | | $ | 0.03 | |
| Recovered crude oil for produced water processed ($/barrel) (2) | | $ | 0.12 | | | $ | 0.14 | | | $ | (0.02) | |
| Operating expenses for produced water processed ($/barrel) (2) | | $ | 0.24 | | | $ | 0.25 | | | $ | (0.01) | |
(1) During the three months ended March 31, 2023, 34,380 barrels of skim oil were stored and were sold during the year ended March 31, 2024.
(2) Total produced water barrels processed during the years ended March 31, 2024 and 2023 were 884,576,981 and 849,477,938, respectively. These amounts do not include 63,968,944 barrels and 36,143,594 barrels for the years ended March 31, 2024 and 2023, respectively, related to payments received from producers for committed volumes not delivered, as discussed further below.
Water Disposal Service Fee Revenues. The increase was due primarily to an increase in produced water volumes processed from contracted customers mainly in the Delaware Basin, increased fees from new contracts and higher fees charged for interruptible spot volumes. There was also an increase in payments made by certain producers for committed volumes not delivered. Service fees for produced water processed ($/barrel) also benefited from these deficiency payments. In addition, in July 2023, we entered into a transaction in which a portion of the total consideration received was allocated to revenue due to the termination of a minimum volume water disposal contract (see Note 17 to our consolidated financial statements included in this Annual Report).
Recovered Crude Oil Revenues. The decrease was due primarily to lower realized crude oil prices received from the sale of skim oil barrels, partially offset by an increase in skim oil barrels sold as a result of higher skim oil recovered from increased produced water processed. In addition, during the current fiscal year we sold 34,380 barrels of skim oil that were stored as of March 31, 2023 due to tighter pipeline specifications.
Recycled Water Revenues. Revenue from recycled water includes the sale of produced water and recycled water for use in our customers’ completion activities. The decrease was due primarily to lower recycled water volumes related to timing of water to be used in completions.
Other Revenues. Other revenues primarily include brackish non-potable water revenues, water pipeline revenues, land surface use revenues, solids disposal revenues and reimbursements from construction projects, booster operating fees and generator rentals. The increase was due primarily to higher reimbursements from construction projects, booster operating fees and generator rentals, higher land surface use revenues and higher lease revenue from certain surface use and compensation agreements. These increases were partially offset by lower water pipeline revenues due to the expiration of certain pipeline commitment revenue in December 2022 and lower sales of brackish non-potable water related to the timing of our customers transitioning from brackish non-potable water to recycled water.
Cost of Sales-Excluding Impact of Derivatives. The increase was due primarily to costs incurred that will be reimbursed by producers for generator and fuel costs at various booster stations. In addition, we incurred increased trucking expenses for skim oil sales during the year ended March 31, 2024. These increases were partially offset by lower recycling costs due to a decrease in recycling activity and lower purchases of brackish non-potable water from third-parties to meet customer needs.
Derivative Loss. We enter into derivatives in our Water Solutions segment to protect against the risk of a decline in the market price of the crude oil we expect to recover when processing produced water and selling recovered skim oil. During the year ended March 31, 2024, we had $0.4 million of net unrealized losses on derivatives and $0.8 million of net realized losses on derivatives. During the year ended March 31, 2023, we had $4.5 million of net unrealized gains on derivatives and $8.8 million of net realized losses on derivatives.
Operating and General and Administrative Expenses. The decrease was due primarily to lower chemical expense due to purchasing fewer chemicals and using chemicals more efficiently, lower overhead costs, lower generator rental expense due to renting fewer generators and lower severance taxes due to a decrease in revenue from recovered crude oil and a severance tax refund in September 2023 related to prior periods. These decreases were partially offset by higher operating expenses due to increased produced water volumes processed.
Depreciation and Amortization Expense. The increase was due primarily to depreciation of newly developed facilities and infrastructure, partially offset by certain long-term assets being fully amortized or impaired during the fiscal years ended March 31, 2023 and 2024.
Loss on Disposal or Impairment of Assets, Net. During the year ended March 31, 2024, we recorded a net loss of $37.5 million primarily related to the write down of the value of certain saltwater disposal wells as well as the abandonment of certain capital projects and the retirement of certain assets, a net loss of $17.6 million primarily related to the sale of certain assets and an impairment of $2.4 million for certain leases due to underutilization of certain freshwater wells. In addition, we recorded a gain of $3.9 million from insurance recoveries for certain saltwater disposal facilities and boosters damaged in a prior period. During the year ended March 31, 2023, we recorded a net loss of $26.3 million primarily related to the sale of certain assets and a net loss of $21.8 million to write down the value of an inactive saltwater disposal facility and damaged equipment at another saltwater disposal facility, as well as the abandonment of certain capital projects and the retirement of certain assets. We also recorded a loss of $0.5 million related to the termination of a joint marketing agreement. In addition, we recorded a gain of $2.1 million from an insurance recovery for a saltwater disposal facility damaged in a prior period.
Revaluation of Liabilities. During the years ended March 31, 2024 and 2023, there was an increase in expense for the valuation of our contingent consideration liabilities related to royalty agreements acquired as part of certain business combinations due primarily to higher expected production from new customers, resulting in an increase to the expected future royalty payment.
Crude Oil Logistics
The following table summarizes the operating results of our Crude Oil Logistics segment for the periods indicated:
| | | | | | | | | | | | | | | | | | | | |
| | Year Ended March 31, | | |
| | 2024 | | 2023 | | Change |
| | (in thousands, except per barrel amounts) |
| Revenues: | | | | | | |
| Crude oil sales | | $ | 1,597,238 | | | $ | 2,376,434 | | | $ | (779,196) | |
| Crude oil transportation and other sales | | 59,373 | | | 96,978 | | | (37,605) | |
| Total revenues (1) | | 1,656,611 | | | 2,473,412 | | | (816,801) | |
| Expenses: | | | | | | |
| Cost of sales-excluding impact of derivatives | | 1,514,370 | | | 2,274,089 | | | (759,719) | |
| Derivative loss (gain) | | 7,367 | | | (14,565) | | | 21,932 | |
| Operating expenses | | 39,004 | | | 50,154 | | | (11,150) | |
| General and administrative expenses | | 3,780 | | | 4,547 | | | (767) | |
| Depreciation and amortization expense | | 36,922 | | | 46,577 | | | (9,655) | |
| Loss on disposal or impairment of assets, net | | 3,094 | | | 31,086 | | | (27,992) | |
| Total expenses | | 1,604,537 | | | 2,391,888 | | | (787,351) | |
| Segment operating income | | $ | 52,074 | | | $ | 81,524 | | | $ | (29,450) | |
| | | | | | |
| Crude oil sold (barrels) | | 20,068 | | | 25,497 | | | (5,429) | |
| Crude oil transported on owned pipelines (barrels) | | 25,611 | | | 27,714 | | | (2,103) | |
| Crude oil storage capacity - owned and leased (barrels) (2) | | 5,232 | | | 5,232 | | | — | |
| Crude oil storage capacity leased to third-parties (barrels) (2) | | 2,250 | | | 1,501 | | | 749 | |
| Crude oil inventory (barrels) (2) | | 573 | | | 684 | | | (111) | |
| Crude oil sold ($/barrel) | | $ | 79.591 | | | $ | 93.204 | | | $ | (13.613) | |
| Cost per crude oil sold ($/barrel) (3) | | $ | 75.462 | | | $ | 89.190 | | | $ | (13.728) | |
| Crude oil product margin ($/barrel) (3) | | $ | 4.129 | | | $ | 4.014 | | | $ | 0.115 | |
(1) Revenues include $0.5 million and $8.6 million of intersegment sales during the years ended March 31, 2024 and 2023, respectively, that are eliminated in our consolidated statements of operations.
(2) Information is presented as of March 31, 2024 and March 31, 2023, respectively.
(3) Cost and product margin per barrel excludes the impact of derivatives.
Crude Oil Sales and Cost of Sales-Excluding Impact of Derivatives. The decreases in sales and cost of sales, excluding the impact of derivatives, were due primarily to lower sales volumes due to lower production on acreage dedicated to us in the DJ Basin during the year ended March 31, 2024, compared to the year ended March 31, 2023 and a decrease in crude oil prices year over year.
Crude oil product margin from the sale of crude oil decreased from $102.3 million for the year ended March 31, 2023 to $82.9 million during the year ended March 31, 2024, primarily due to lower volumes and lower crude oil prices year over year. The lower crude oil prices resulted in lower contracted rates with certain producers, compared to the prior year when the contracted rates were higher due to the higher crude oil prices. We also realized lower contract differentials on certain other sales contracts.
Crude oil product margin per barrel increased during the year ended March 31, 2024, compared to the year ended March 31, 2023, due to the sale of lower priced inventory into a market in which prices were increasing during certain periods of 2024. Whereas during the year ended March 31, 2023, we were selling higher priced inventory into a market in which prices were generally declining throughout the fiscal year. Crude oil product margin calculations does not include gain and losses from derivatives that may offset the movement in the physical margin.
Derivative Loss (Gain). Our cost of sales during the year ended March 31, 2024 included $58.4 million of net realized gains on derivatives, driven by decreasing crude oil prices, and $65.8 million of net unrealized losses on derivatives. The amounts in the previous sentence for the year ended March 31, 2024 included net realized gains of $60.9 million and net unrealized losses of $61.4 million associated with derivative instruments related to our hedge of the CMA Differential Roll, defined and discussed below under “–Non-GAAP Financial Measures.” Our cost of sales during the year ended March 31, 2023
included $35.5 million of net realized losses on derivatives, driven by increasing crude oil prices, and $50.1 million of net unrealized gains on derivatives. The amounts in the previous sentence for the year ended March 31, 2023 includes net realized losses of $13.1 million and net unrealized gains of $23.8 million associated with derivative instruments related to our hedge of the CMA Differential Roll.
Crude Oil Transportation and Other Sales. The decrease was primarily due to the sale of our marine assets on March 30, 2023, and lower pipeline tariff revenue due to the assignment of our commitment on a third-party pipeline.
During the year ended March 31, 2024, physical volumes on the Grand Mesa Pipeline averaged approximately 70,000 barrels per day, compared to approximately 76,000 barrels per day for the year ended March 31, 2023. Lower contracted volumes were shipped on the Grand Mesa Pipeline due to lower production on acreage dedicated to us in the DJ Basin.
Operating and General and Administrative Expenses. The decrease was primarily due to the sale of our marine assets on March 30, 2023. Additionally, the current year benefited from lower incentive compensation expense, as well as lower repairs and maintenance expense on leased rail cars returned to the lessor in the prior year.
Depreciation and Amortization Expense. The decrease was primarily due to the sale of our marine assets on March 30, 2023, lower depreciation expense due to certain of our railcar assets becoming fully depreciated during the year ended March 31, 2024 and the impairment of certain terminal assets in the prior year, which lowered their depreciable base.
Loss on Disposal or Impairment of Assets, Net. During the year ended March 31, 2024, we recorded a net loss of $3.1 million primarily due to the retirement or sale of certain assets. During the year ended March 31, 2023, we recorded an impairment of $23.1 million related to an underperforming crude oil terminal and a loss of $8.0 million on the sale of our marine assets.
Liquids Logistics
The following table summarizes the operating results of our Liquids Logistics segment for the periods indicated:
| | | | | | | | | | | | | | | | | | | | |
| | Year Ended March 31, | | |
| | 2024 | | 2023 | | Change |
| | (in thousands, except per gallon amounts) |
| Refined products: | | | | | | |
| Sales-excluding impact of derivatives | | $ | 2,192,783 | | | $ | 2,554,084 | | | $ | (361,301) | |
| Cost of sales-excluding impact of derivatives | | 2,168,481 | | | 2,512,748 | | | (344,267) | |
| Derivative loss | | 110 | | | 1,255 | | | (1,145) | |
| Product margin | | 24,192 | | | 40,081 | | | (15,889) | |
| | | | | | |
| Propane: | | | | | | |
| Sales | | 739,591 | | | 1,161,129 | | | (421,538) | |
| Cost of sales-excluding impact of derivatives | | 692,649 | | | 1,103,786 | | | (411,137) | |
| Derivative loss | | 2,463 | | | 11,642 | | | (9,179) | |
| Product margin | | 44,479 | | | 45,701 | | | (1,222) | |
| | | | | | |
| Butane: | | | | | | |
| Sales | | 628,685 | | | 773,633 | | | (144,948) | |
| Cost of sales-excluding impact of derivatives | | 587,307 | | | 776,845 | | | (189,538) | |
| Derivative loss (gain) | | 2,771 | | | (22,976) | | | 25,747 | |
| Product margin | | 38,607 | | | 19,764 | | | 18,843 | |
| | | | | | |
| Other products: | | | | | | |
| Sales-excluding impact of derivatives | | 958,291 | | | 1,025,733 | | | (67,442) | |
| Cost of sales-excluding impact of derivatives | | 955,259 | | | 970,176 | | | (14,917) | |
| Derivative (gain) loss | | (11,360) | | | 24,483 | | | (35,843) | |
| Product margin | | 14,392 | | | 31,074 | | | (16,682) | |
| | | | | | |
| Service: | | | | | | |
| Sales | | 14,151 | | | 14,218 | | | (67) | |
| Cost of sales | | 1,379 | | | 1,603 | | | (224) | |
| Product margin | | 12,772 | | | 12,615 | | | 157 | |
| | | | | | |
| Expenses: | | | | | |
| Operating expenses | | 54,129 | | | 51,456 | | | 2,673 | |
| General and administrative expenses | | 7,537 | | | 7,571 | | | (34) | |
| Depreciation and amortization expense | | 10,372 | | | 13,301 | | | (2,929) | |
| Loss on disposal or impairment of assets, net | | 59,923 | | | 10,283 | | | 49,640 | |
| Total expenses | | 131,961 | | | 82,611 | | | 49,350 | |
| Segment operating income | | $ | 2,481 | | | $ | 66,624 | | | $ | (64,143) | |
| | | | | | |
| | | | | | | | | | | | | | | | | | | | |
| | Year Ended March 31, | | |
| | 2024 | | 2023 | | Change |
| | (in thousands, except per gallon amounts) |
| | | | | | |
| Natural gas liquids and refined products storage capacity - owned and leased (gallons) (1) | | 130,441 | | | 160,329 | | | (29,888) | |
| | | | | | |
| Refined products sold (gallons) | | 817,634 | | | 769,151 | | | 48,483 | |
| Refined products sold ($/gallon) | | $ | 2.682 | | | $ | 3.321 | | | $ | (0.639) | |
| Cost per refined products sold ($/gallon) (2) | | $ | 2.652 | | | $ | 3.267 | | | $ | (0.615) | |
| Refined products product margin ($/gallon) (2) | | $ | 0.030 | | | $ | 0.054 | | | $ | (0.024) | |
| Refined products inventory (gallons) (1) | | 1,872 | | | 1,003 | | | 869 | |
| | | | | | |
| Propane sold (gallons) | | 811,035 | | | 1,018,937 | | | (207,902) | |
| Propane sold ($/gallon) | | $ | 0.912 | | | $ | 1.140 | | | $ | (0.228) | |
| Cost per propane sold ($/gallon) (2) | | $ | 0.854 | | | $ | 1.083 | | | $ | (0.229) | |
| Propane product margin ($/gallon) (2) | | $ | 0.058 | | | $ | 0.057 | | | $ | 0.001 | |
| Propane inventory (gallons) (1) | | 35,177 | | | 48,379 | | | (13,202) | |
| | | | | | |
| Butane sold (gallons) | | 537,015 | | | 539,658 | | | (2,643) | |
| Butane sold ($/gallon) | | $ | 1.171 | | | $ | 1.434 | | | $ | (0.263) | |
| Cost per butane sold ($/gallon) (2) | | $ | 1.094 | | | $ | 1.440 | | | $ | (0.346) | |
| Butane product margin (loss) ($/gallon) (2) | | $ | 0.077 | | | $ | (0.006) | | | $ | 0.083 | |
| Butane inventory (gallons) (1) | | 17,790 | | | 17,409 | | | 381 | |
| | | | | | |
| Other products sold (gallons) | | 379,077 | | | 391,723 | | | (12,646) | |
| Other products sold ($/gallon) | | $ | 2.528 | | | $ | 2.619 | | | $ | (0.091) | |
| Cost per other products sold ($/gallon) (2) | | $ | 2.520 | | | $ | 2.477 | | | $ | 0.043 | |
| Other products product margin ($/gallon) (2) | | $ | 0.008 | | | $ | 0.142 | | | $ | (0.134) | |
| Other products inventory (gallons) (1) | | 20,112 | | | 12,893 | | | 7,219 | |
(1) Information is presented as of March 31, 2024 and March 31, 2023, respectively.
(2) Cost and product margin (loss) per gallon excludes the impact of derivatives.
Refined Products Sales and Cost of Sales-Excluding Impact of Derivatives. The decreases in sales and cost of sales, excluding the impact of derivatives, during the year ended March 31, 2024 were primarily due to a decrease in sales prices during the current year due to lower commodity prices. This decrease was partially offset by an increase in volumes, as we have added new supply and customer contracts in certain markets.
Refined Products product margins, excluding the impact of derivatives, for the year ended March 31, 2024 decreased from the year ended March 31, 2023 due primarily to the higher margins generated in the prior year due to higher demand in several markets experiencing tighter supply. These supply issues returned to normal in the current year as supply issues were resolved and the supply/demand balance was restored.
Refined Products Derivative Loss. Our Refined Products product margin during the year ended March 31, 2024 included realized losses of $0.1 million and the year ended March 31, 2023 included realized losses of $1.3 million.
Propane Sales and Cost of Sales-Excluding Impact of Derivatives. The decreases in sales and cost of sales, excluding the impact of derivatives, were due to lower propane volumes and lower prices during the year ended March 31, 2024. Propane volumes decreased during the year ended March 31, 2024 due to the sale of three natural gas liquids terminals, the loss of a certain supply contract, lower performing natural gas liquids terminals being idled and a focus on more profitable markets and customers. Also, demand was lower during the year ended March 31, 2024 due to the warmer than normal winter.
Propane product margins, excluding the impact of derivatives, decreased during the year ended March 31, 2024 primarily due to lower volumes and lower prices.
Propane Derivative Loss. Our cost of propane sales included $4.6 million of net unrealized gains on derivatives and $7.0 million of net realized losses on derivatives during the year ended March 31, 2024. During the year ended March 31, 2023, our cost of propane sales included $6.9 million of net unrealized losses on derivatives and $4.7 million of net realized losses on
derivatives.
Butane Sales and Cost of Sales-Excluding Impact of Derivatives. The decreases in sales and cost of sales, excluding the impact of derivatives, were due primarily to lower butane prices. The decrease was also due to lower volumes during the first six months of the year ended March 31, 2024 as a result of weak spot demand, weak export demand and a change in strategy by a significant customer. These decreases were partially offset by strong blending demand from October 2023 through February 15, 2024.
Butane product margins, excluding the impact of derivatives, increased during the year ended March 31, 2024, as compared to the year ended March 31, 2023, primarily due to higher demand for butane blending which has tightened up the butane supply, causing sales differentials to increase. Also, in the prior year, we were negatively impacted by lower location differentials as the product we contracted to purchase in the beginning of the season was continuing to compete with product purchased in the discounted market.
Butane Derivative Loss (Gain). Our cost of butane sales during the year ended March 31, 2024 included $3.2 million of net unrealized losses on derivatives and $0.5 million of net realized gains on derivatives. Our cost of butane sales included $3.9 million of net unrealized gains on derivatives and $19.1 million of net realized gains on derivatives during the year ended March 31, 2023.
Other Products Sales and Cost of Sales-Excluding Impact of Derivatives. The decreases in sales and cost of sales, excluding the impact of derivatives, were due primarily to the decrease in market prices during the year ended March 31, 2024 as compared to the year ended March 31, 2023. Market prices for biodiesel decreased due to the United States Environmental Protection Agency (“EPA”) final renewable fuels standards (“RFS”) mandate which lowered the required amount of biodiesel to be blended, thus increasing the amount of supply in the market. The decrease was also the result of lower natural gasoline volumes due to the loss of certain supply contracts. These decreases were partially offset by increased sales of asphalt due to increased supply.
Other products sales product margins, excluding the impact of derivatives, decreased during the year ended March 31, 2024 due to the increased supply of biodiesel in the market due to the EPA’s final RFS mandate, which lowered biodiesel and renewable identification numbers prices and delivery of biodiesel contracts entered into in the prior year, when prices were higher, for delivery in the current period when prices were declining.
Other Products Derivative (Gain) Loss. Our derivatives of other products included $11.5 million of net realized gains on derivatives and $0.1 million unrealized losses on derivatives during the year ended March 31, 2024. Our derivatives of other products during the year ended March 31, 2023 included $24.6 million of net realized losses on derivatives and $0.1 million of unrealized gains on derivatives.
Service Sales and Cost of Sales. The sales include storage, terminaling and transportation services income. Sales during the year ended March 31, 2024 remained consistent with the year ended March 31, 2023 but cost of sales decreased due to lower third-party costs.
Operating and General and Administrative Expenses. The increase was due to higher incentive compensation due to improved margins in certain of our businesses year over year.
Depreciation and Amortization Expense. The decrease was due to a customer relationship intangible asset being fully amortized as of June 30, 2023.
Loss on Disposal or Impairment of Assets, Net. During the year ended March 31, 2024, we recorded a goodwill impairment loss of $69.2 million in our Wholesale/Terminal reporting unit (see Note 5 to our consolidated financial statements included in this Annual Report). In addition, we recorded a net gain of $8.5 million due to the sale of three natural gas liquids terminals and we recorded a net gain of $0.8 million related to the retirement or sale of certain other assets. During the year ended March 31, 2023, we recorded a net loss of $10.1 million due to the impairment of several underperforming natural gas liquids terminals. In addition, during the year ended March 31, 2023, we recorded a net loss of $0.2 million related to the sale and retirement of other assets.
Corporate and Other
The operating loss within “Corporate and Other” includes the following components for the periods indicated:
| | | | | | | | | | | | | | | | | | | | |
| | Year Ended March 31, | | |
| | 2024 | | 2023 | | Change |
| | (in thousands) |
| | | | | | |
| | | | | | |
| | | | | | |
| | | | | | |
| | | | | | |
| Cost of sales | | | | | | |
| Derivative (gain) loss | | $ | (937) | | | $ | 1,181 | | | $ | (2,118) | |
| Expenses: | | | | | | |
| General and administrative expenses | | 105,147 | | | 50,978 | | | 54,169 | |
| Depreciation and amortization expense | | 4,749 | | | 6,662 | | | (1,913) | |
| Gain on disposal or impairment of assets, net | | (720) | | | (912) | | | 192 | |
| Total expenses | | 109,176 | | | 56,728 | | | 52,448 | |
| Operating loss | | $ | (108,239) | | | $ | (57,909) | | | $ | (50,330) | |
Cost of Sales - Derivative (Gain) Loss. Our cost of sales during the year ended March 31, 2024 included $0.2 million of net realized losses on derivatives and $1.2 million of net unrealized gains on derivatives. We entered into economic hedges to protect our liquidity positions and leverage from a significant increase in commodity prices that drive our working capital demands, as we experienced in the prior fiscal year, thus impacting our ability to reduce absolute indebtedness until commodity prices weakened. There were no open hedge positions that would impact cost of sales as of March 31, 2024.
General and Administrative Expenses. The increase during the year ended March 31, 2024 relates primarily to the increase in our accrual related to the LCT Capital, LLC (“LCT”) legal matter from $2.5 million to $36.0 million (see Note 8 to our consolidated financial statements included in this Annual Report), and the write-off of $14.2 million of legal costs related to the LCT legal matter that were originally allocated to the GP (see Note 12 to our consolidated financial statements included in this Annual Report). In addition, we also incurred increased business insurance expense as we paid the insurance company to be released from any future supplementary calls on our indemnity policy related to our former crude marine business (which we sold on March 30, 2023), increased insurance premiums and a reduction in our corporate overhead allocation to the other business segments. These increases were partially offset by a decrease in equity-based incentive compensation as our final service award vested on November 15, 2023.
Depreciation and Amortization Expense. The decrease during the year ended March 31, 2024 was due to software that became fully depreciated during the year ended March 31, 2024.
Gain on Disposal or Impairment of Assets, Net. During the year ended March 31, 2024, we sold an airplane for a gain of $0.7 million. During the year ended March 31, 2023, we sold an airplane for a gain of $1.3 million, which was partially offset by a loss recorded to write-off the remaining amount of a loan receivable, due July 31, 2023, that was prepaid by the debtor and an impairment loss recorded on the sublease of a building we were no longer using.
Equity in Earnings of Unconsolidated Entities
Equity in earnings of unconsolidated entities of $4.1 million during the year ended March 31, 2024 consisted primarily of earnings from certain membership interests related to specific land and water services operations and earnings from another entity due to a gain recognized on the sale of an airplane during the three months ended December 31, 2023 (see Note 12 to our consolidated financial statements included in this Annual Report). Equity in earnings of unconsolidated entities of $4.1 million during the year ended March 31, 2023 consisted primarily of earnings from certain membership interests related to specific land and water services operations and a loss from our interest in an aircraft company.
Interest Expense
The following table summarizes the components of our consolidated interest expense for the periods indicated:
| | | | | | | | | | | | | | | | | | | | |
| | Year Ended March 31, | | |
| | 2024 | | 2023 | | Change |
| | (in thousands) |
| Senior secured notes | | $ | 160,088 | | | $ | 153,750 | | | $ | 6,338 | |
| Senior unsecured notes | | 40,829 | | | 76,288 | | | (35,459) | |
| ABL Facility | | 15,645 | | | 17,111 | | | (1,466) | |
| Term Loan B | | 11,275 | | | — | | | 11,275 | |
| Other indebtedness | | 26,900 | | | 11,559 | | | 15,341 | |
| Total debt interest expense | | 254,737 | | | 258,708 | | | (3,971) | |
| Amortization of debt issuance costs | | 15,701 | | | 16,737 | | | (1,036) | |
| | | | | | |
| Unrealized gain on interest rate swap | | (515) | | | — | | | (515) | |
| Total interest expense | | $ | 269,923 | | | $ | 275,445 | | | $ | (5,522) | |
The debt interest expense decreased $4.0 million during the year ended March 31, 2024 primarily due to the repurchase of the 7.5% senior unsecured notes due 2023 (“2023 Notes”) throughout the prior year and the redemption of the remaining 2023 Notes on March 31, 2023. In addition, we repurchased a portion of the outstanding 2025 Notes during the three months ended June 30, 2023. Also, in the prior year, we had an accrual of the settlement of a claim for the failure to pay interest on royalty payments. These decreases were partially offset by $26.1 million of interest accrued related to the LCT legal matter (see Note 8 to our consolidated financial statements included in this Annual Report) and an increase due to higher interest rates on the new debt instruments.
(Loss) Gain on Early Extinguishment of Liabilities, Net
Loss on early extinguishment of liabilities, net was $55.3 million during the year ended March 31, 2024, compared to a gain on early extinguishment of liabilities, net of $6.2 million during the year ended March 31, 2023. During the year ended March 31, 2024, the net loss (inclusive of debt issuance costs written off) primarily relates to the call premium of $38.4 million paid for the early extinguishment of the outstanding 2026 Senior Secured Notes, the write-off of debt issuance costs and other expenses related to the repurchase/redemption of the 2026 Senior Secured Notes and Senior Unsecured Notes during the fiscal year. During the year ended March 31, 2023, the net gain (inclusive of debt issuance costs written off) primarily related to the early extinguishment of a portion of the outstanding Senior Unsecured Notes partially offset by the write-off of debt issuance costs. In addition, we paid a prepayment premium of $1.6 million and wrote off debt issuance costs of less than $0.1 million related to the payoff of an outstanding equipment loan. See Note 7 to our consolidated financial statements included in this Annual Report for a further discussion of the debt instruments repurchased and redeemed.
Other Income, Net
Other income, net of $2.8 million during the year ended March 31, 2024 consisted primarily of interest income on loan receivables (see Note 2 to our consolidated financial statements included in this Annual Report for a further discussion) and cash on hand, income from the settlement of a dispute and income from excess distributions received from an equity method investee (see Note 2 to our consolidated financial statements included in this Annual Report for a further discussion). Other income, net of $28.7 million during the year ended March 31, 2023 consisted primarily of a settlement of a dispute associated with commercial activities not occurring in the current reporting periods (see Note 17 to our consolidated financial statements included in this Annual Report for a further discussion).
Income Tax Expense
Income tax expense was $2.4 million during the year ended March 31, 2024, compared to income tax expense of $0.3 million during the year ended March 31, 2023. See Note 2 to our consolidated financial statements included in this Annual Report for a further discussion.
Noncontrolling Interests
Noncontrolling interests represent the portion of certain consolidated subsidiaries that are owned by third-parties. Noncontrolling interest income was $0.6 million during the year ended March 31, 2024, compared to $1.1 million during the
year ended March 31, 2023. The decrease of $0.5 million during the year ended March 31, 2024 was due primarily to lower income from certain water solutions operations during the year ended March 31, 2024.
Segment Operating Results for the Years Ended March 31, 2023 and 2022
Water Solutions
The following table summarizes the operating results of our Water Solutions segment for the periods indicated.
| | | | | | | | | | | | | | | | | | | | |
| | | Year Ended March 31, | | |
| | | 2023 | | 2022 | | Change |
| | | (in thousands, except per barrel and per day amounts) |
| Revenues: | | | | | | |
| Water disposal service fees | | $ | 524,689 | | | $ | 397,128 | | | $ | 127,561 | |
| Sale of recovered crude oil | | 120,705 | | | 77,203 | | | 43,502 | |
| Recycled water | | 13,841 | | | 11,343 | | | 2,498 | |
| Other revenues | | 37,803 | | | 59,192 | | | (21,389) | |
| Total revenues | | 697,038 | | | 544,866 | | | 152,172 | |
| Expenses: | | | | | | |
| Cost of sales-excluding impact of derivatives | | 9,737 | | | 26,340 | | | (16,603) | |
| Derivative loss | | 4,363 | | | 7,640 | | | (3,277) | |
| Operating expenses | | 212,115 | | | 175,022 | | | 37,093 | |
| General and administrative expenses | | 8,722 | | | 7,352 | | | 1,370 | |
| Depreciation and amortization expense | | 207,081 | | | 214,558 | | | (7,477) | |
| Loss on disposal or impairment of assets, net | | 46,431 | | | 25,598 | | | 20,833 | |
| Revaluation of liabilities | | 9,665 | | | (6,495) | | | 16,160 | |
| Total expenses | | 498,114 | | | 450,015 | | | 48,099 | |
| Segment operating income | | $ | 198,924 | | | $ | 94,851 | | | $ | 104,073 | |
| | | | | | |
| Produced water processed (barrels per day) | | | | | | |
| Delaware Basin | | 2,042,777 | | | 1,531,830 | | | 510,947 | |
| Eagle Ford Basin | | 119,458 | | | 99,298 | | | 20,160 | |
| DJ Basin | | 150,619 | | | 142,611 | | | 8,008 | |
| Other Basins | | 14,483 | | | 24,179 | | | (9,696) | |
| Total | | 2,327,337 | | | 1,797,918 | | | 529,419 | |
| Recycled water (barrels per day) | | 118,847 | | | 93,487 | | | 25,360 | |
| Total (barrels per day) | | 2,446,184 | | | 1,891,405 | | | 554,779 | |
| Skim oil sold (barrels per day) (1) | | 3,764 | | | 2,864 | | | 900 | |
| Service fees for produced water processed ($/barrel) (2) | | $ | 0.62 | | | $ | 0.61 | | | $ | 0.01 | |
| Recovered crude oil for produced water processed ($/barrel) (2) | | $ | 0.14 | | | $ | 0.12 | | | $ | 0.02 | |
| Operating expenses for produced water processed ($/barrel) (2) | | $ | 0.25 | | | $ | 0.27 | | | $ | (0.02) | |
(1) During the three months ended March 31, 2023, 34,380 barrels of skim oil were stored and will be sold during fiscal year 2024.
(2) Total produced water barrels processed during the years ended March 31, 2023 and 2022 were 849,477,938 and 656,240,083, respectively. These amounts do not include 36,143,594 barrels and 25,653,729 barrels for the years ended March 31, 2023 and 2022, respectively, related to payments received from producers for committed volumes not delivered, as discussed further below.
Water Disposal Service Fee Revenues. The increase was due to an increase in produced water volumes processed as a result of increased crude oil production driven by higher crude oil prices and completion activity, primarily in the Delaware Basin as well as higher fees charged for spot volumes. In addition, there was an increase in payments made by certain producers for committed volumes not delivered. Service fees for produced water processed ($/barrel) also benefited from these deficiency payments. These were partially offset by lower service fees received per barrel due to increased volumes from customers with long-term acreage dedications or minimum volume commitments with lower contracted fees.
Recovered Crude Oil Revenues. The increase was due primarily to higher volumes of skim oil barrels sold due to an increase in produced water volumes processed as well as higher realized crude oil prices received from the sale of skim oil
barrels. Additionally, an increase in the number of wells completed in our area of operations during the period with increased flowback activity resulted in higher skim oil volumes per barrel of produced water processed.
Recycled Water Revenues. The increase was due primarily to increasing demand for water to be used in completions, driven by an increase in drilling and completion activity primarily in the Delaware Basin, and our customers’ transition from brackish non-potable water to recycled water, partially offset by lower pricing for recycled water.
Other Revenues. The decrease was due primarily to lower sales of brackish non-potable water related to the termination of a joint marketing agreement as well as our customers transitioning from brackish non-potable water to recycled water, partially offset by reimbursements from construction projects in the current period.
Cost of Sales-Excluding Impact of Derivatives. The decrease was due primarily to lower purchases of brackish non-potable water from third-parties to meet customer needs due to the termination of a joint marketing agreement.
Derivative Loss. We enter into derivatives in our Water Solutions segment to protect against the risk of a decline in the market price of the crude oil we expect to recover when processing produced water and selling recovered skim oil. During the year ended March 31, 2023, we had $4.5 million of net unrealized gains on derivatives and $8.8 million of net realized losses on derivatives. During the year ended March 31, 2022, we had $11.7 million of net unrealized losses on derivatives and $4.0 million of net realized gains on derivatives.
Operating and General and Administrative Expenses. The increase was due primarily to higher utility, royalty and chemical expenses as a result of the increase in produced water volumes processed. Utility, royalty and chemical expenses, which are three of our largest variable expenses, were not impacted by the rise in inflation due to negotiated long-term utility contracts with fixed rates, royalty contracts with no escalation clauses and a fixed chemical expense per barrel with our chemical provider. The increase was also due to higher incentive compensation expense, higher severance taxes due to the increase in revenue from recovered crude oil and higher repairs and maintenance expense due to timing of repairs and the operation of temporary booster stations.
Depreciation and Amortization Expense. The decrease was due primarily to certain long-term assets being fully amortized or impaired during the years ended March 31, 2022 and 2023. This decrease was partially offset by the depreciation of newly developed facilities and infrastructure.
Loss on Disposal or Impairment of Assets, Net. During the year ended March 31, 2023, we recorded a net loss of $26.3 million primarily related to the sale of certain assets and a net loss of $21.8 million to write down the value of an inactive saltwater disposal facility and damaged equipment at another saltwater disposal facility, as well as the abandonment of certain capital projects and the retirement of certain assets. We also recorded a loss of $0.5 million related to the termination of a joint marketing agreement. In addition, we recorded a gain of $2.1 million from an insurance recovery for a saltwater disposal facility damaged in a prior period. During the year ended March 31, 2022, we recorded a net loss of $29.8 million primarily related to the write-down of an inactive saltwater disposal facility and damaged equipment and wells at other facilities, abandonment of certain capital projects and the sale of certain other miscellaneous assets. In addition, we recorded a gain of $4.3 million on the sale of certain land and a landfill permit.
Revaluation of Liabilities. During the year ended March 31, 2023, there was an increase in expense for the valuation of our contingent consideration liabilities related to royalty agreements acquired as part of certain business combinations due primarily to higher expected production from new customers, resulting in an increase to the expected future royalty payment. During the year ended March 31, 2022, there was a decrease in expense for the valuation of our contingent consideration liabilities related to royalty agreements acquired as part of certain business combinations due primarily to lower expected production from new customers, resulting in a decrease to the expected future royalty payment.
Crude Oil Logistics
The following table summarizes the operating results of our Crude Oil Logistics segment for the periods indicated:
| | | | | | | | | | | | | | | | | | | | |
| | Year Ended March 31, | | |
| | 2023 | | 2022 | | Change |
| | (in thousands, except per barrel amounts) |
| Revenues: | | | | | | |
| Crude oil sales | | $ | 2,376,434 | | | $ | 2,432,393 | | | $ | (55,959) | |
| Crude oil transportation and other sales | | 96,978 | | | 84,171 | | | 12,807 | |
| Total revenues (1) | | 2,473,412 | | | 2,516,564 | | | (43,152) | |
| Expenses: | | | | | | |
| Cost of sales-excluding impact of derivatives | | 2,274,089 | | | 2,271,973 | | | 2,116 | |
| Derivative (gain) loss | | (14,565) | | | 92,027 | | | (106,592) | |
| Operating expenses | | 50,154 | | | 54,606 | | | (4,452) | |
| General and administrative expenses | | 4,547 | | | 7,537 | | | (2,990) | |
| Depreciation and amortization expense | | 46,577 | | | 48,489 | | | (1,912) | |
| Loss (gain) on disposal or impairment of assets, net | | 31,086 | | | (3,101) | | | 34,187 | |
| Total expenses | | 2,391,888 | | | 2,471,531 | | | (79,643) | |
| Segment operating income | | $ | 81,524 | | | $ | 45,033 | | | $ | 36,491 | |
| | | | | | |
| Crude oil sold (barrels) | | 25,497 | | | 31,091 | | | (5,594) | |
| Crude oil transported on owned pipelines (barrels) | | 27,714 | | | 28,410 | | | (696) | |
| Crude oil storage capacity - owned and leased (barrels) (2) | | 5,232 | | | 5,232 | | | — | |
| Crude oil storage capacity leased to third-parties (barrels) (2) | | 1,501 | | | 1,501 | | | — | |
| Crude oil inventory (barrels) (2) | | 684 | | | 1,339 | | | (655) | |
| Crude oil sold ($/barrel) | | $ | 93.204 | | | $ | 78.235 | | | $ | 14.969 | |
| Cost per crude oil sold ($/barrel) (3) | | $ | 89.190 | | | $ | 73.075 | | | $ | 16.115 | |
| Crude oil product margin ($/barrel) (3) | | $ | 4.014 | | | $ | 5.160 | | | $ | (1.146) | |
(1) Revenues include $8.6 million and $11.1 million of intersegment sales during the years ended March 31, 2023 and 2022, respectively, that are eliminated in our consolidated statements of operations.
(2) Information is presented as of March 31, 2023 and March 31, 2022, respectively. The decrease in crude oil inventory was due primarily to capitalizing additional crude oil barrels as linefill as a result of increased requirements.
(3) Cost and product margin per barrel excludes the impact of derivatives.
Crude Oil Sales and Cost of Sales-Excluding Impact of Derivatives. The decrease in sales was due primarily to a reduction in sales volumes primarily due to lower production in the DJ Basin and increased buy/sell transactions during the year ended March 31, 2023. Buy/sell transactions are transactions in which we purchase product from a counterparty and sell the same volumes of product to the same counterparty at a different location or time. The sales, cost of sales and volumes are netted for these transactions. The decrease was partially offset by an increase in crude oil prices during the year ended March 31, 2023, compared to the year ended March 31, 2022. The increase in cost of sales, excluding the impact of derivatives, was due primarily to an increase in crude oil prices during the year ended March 31, 2023, compared to the year ended March 31, 2022 which was offset by a decrease in sales volumes.
Crude oil product margin from the sale of crude oil decreased primarily due to the sale of higher priced inventory into a market in which prices were declining for most of the year. In the prior year, lower priced inventory was sold into a market in which prices were rising for most of the year. In addition, we incurred increased freight costs during the current period. This decrease in product margin was offset by higher contracted rates with certain producers as well as increased differentials on certain other sales contracts during the first nine months of the current year. Crude oil product margin calculations do not include gains and losses from derivatives that may offset the movement in the physical margin.
Derivative (Gain) Loss. Our cost of sales during the year ended March 31, 2023 included $35.5 million of net realized losses on derivatives, driven by increasing crude oil prices, and $50.1 million of net unrealized gains on derivatives. The amounts in the previous sentence for the year ended March 31, 2023 included net realized losses of $13.1 million and net unrealized gains of $23.8 million associated with derivative instruments related to our hedge of the CMA Differential Roll, defined and discussed below under “–Non-GAAP Financial Measures.” Our cost of sales during the year ended March 31, 2022
included $115.7 million of net realized losses on derivatives, driven by increasing crude oil prices, and $23.7 million of net unrealized gains on derivatives. The amounts in the previous sentence for the year ended March 31, 2022 include net realized losses of $83.5 million and net unrealized gains of $45.0 million associated with derivative instruments related to our hedge of the CMA Differential Roll.
Crude Oil Transportation and Other Sales. The increase was primarily due to an increase in charter days and day rates within our marine transportation business as demand increased. On March 30, 2023, we sold our marine assets (see Note 17 to our consolidated financial statements included in this Annual Report).
During the year ended March 31, 2023, physical volumes on the Grand Mesa Pipeline averaged approximately 76,000 barrels per day, compared to approximately 78,000 barrels per day for the year ended March 31, 2022. Both contracted and non-contracted volumes decreased as overall production in the DJ Basin declined in part due to producer permitting issues.
Operating and General and Administrative Expenses. The decrease was primarily related to the sale of the trucking business during the year ended March 31, 2022, and lower lease expense during the current period due to the completion of the renegotiation of certain leases.
Depreciation and Amortization Expense. The decrease was due primarily to the sale of our trucking assets during the year ended March 31, 2022.
Loss (Gain) on Disposal or Impairment of Assets, Net. During the year ended March 31, 2023, we recorded an impairment of $23.1 million related to an underperforming crude oil terminal and a loss of $8.0 million on the sale of our marine assets. During the year ended March 31, 2022, we recorded a gain of $5.5 million on the sale of our trucking assets and a loss of $2.2 million due to damage caused by Hurricane Ida to one of our Gulf Coast terminals.
Liquids Logistics
The following table summarizes the operating results of our Liquids Logistics segment for the periods indicated:
| | | | | | | | | | | | | | | | | | | | |
| | Year Ended March 31, | | |
| | 2023 | | 2022 | | Change |
| | (in thousands, except per gallon amounts) |
| Refined products: | | | | | | |
| Sales-excluding impact of derivatives (1) | | $ | 2,554,084 | | | $ | 1,899,898 | | | $ | 654,186 | |
| Cost of sales-excluding impact of derivatives | | 2,512,748 | | | 1,876,728 | | | 636,020 | |
| Derivative loss | | 1,255 | | | 2,907 | | | (1,652) | |
| Product margin | | 40,081 | | | 20,263 | | | 19,818 | |
| | | | | | |
| Propane: | | | | | | |
| Sales (1) | | 1,161,129 | | | 1,325,941 | | | (164,812) | |
| Cost of sales-excluding impact of derivatives | | 1,103,786 | | | 1,313,765 | | | (209,979) | |
| Derivative loss (gain) | | 11,642 | | | (20,519) | | | 32,161 | |
| Product margin | | 45,701 | | | 32,695 | | | 13,006 | |
| | | | | | |
| Butane: | | | | | | |
| Sales (1) | | 773,633 | | | 863,348 | | | (89,715) | |
| Cost of sales-excluding impact of derivatives | | 776,845 | | | 794,180 | | | (17,335) | |
| Derivative (gain) loss | | (22,976) | | | 18,690 | | | (41,666) | |
| Product margin | | 19,764 | | | 50,478 | | | (30,714) | |
| | | | | | |
| Other products: | | | | | | |
| Sales -excluding impact of derivatives (1) | | 1,025,733 | | | 791,125 | | | 234,608 | |
| Cost of sales-excluding impact of derivatives | | 970,176 | | | 748,392 | | | 221,784 | |
| Derivative loss | | 24,483 | | | 15,812 | | | 8,671 | |
| Product margin | | 31,074 | | | 26,921 | | | 4,153 | |
| | | | | | |
| Service: | | | | | | |
| Sales (1) | | 14,218 | | | 16,200 | | | (1,982) | |
| Cost of sales | | 1,603 | | | 1,404 | | | 199 | |
| Product margin | | 12,615 | | | 14,796 | | | (2,181) | |
| | | | | | |
| Expenses: | | | | | | |
| Operating expenses | | 51,456 | | | 55,907 | | | (4,451) | |
| General and administrative expenses | | 7,571 | | | 7,166 | | | 405 | |
| Depreciation and amortization expense | | 13,301 | | | 18,714 | | | (5,413) | |
| Loss on disposal or impairment of assets, net | | 10,283 | | | 71,807 | | | (61,524) | |
| Total expenses | | 82,611 | | | 153,594 | | | (70,983) | |
| Segment operating income (loss) | | $ | 66,624 | | | $ | (8,441) | | | $ | 75,065 | |
| | | | | | |
| | | | | | | | | | | | | | | | | | | | |
| | Year Ended March 31, | | |
| | 2023 | | 2022 | | Change |
| | (in thousands, except per gallon amounts) |
| | | | | | |
| Natural gas liquids and refined products storage capacity - owned and leased (gallons) (2) | | 160,329 | | | 156,219 | | | 4,110 | |
| | | | | | |
| Refined products sold (gallons) | | 769,151 | | | 776,797 | | | (7,646) | |
| Refined products sold ($/gallon) | | $ | 3.321 | | | $ | 2.446 | | | $ | 0.875 | |
| Cost per refined products sold ($/gallon) (3) | | $ | 3.267 | | | $ | 2.416 | | | $ | 0.851 | |
| Refined products product margin ($/gallon) (3) | | $ | 0.054 | | | $ | 0.030 | | | $ | 0.024 | |
| Refined products inventory (gallons) (2) | | 1,003 | | | 1,090 | | | (87) | |
| | | | | | |
| Propane sold (gallons) | | 1,018,937 | | | 1,034,706 | | | (15,769) | |
| Propane sold ($/gallon) | | $ | 1.140 | | | $ | 1.281 | | | $ | (0.141) | |
| Cost per propane sold ($/gallon) (3) | | $ | 1.083 | | | $ | 1.270 | | | $ | (0.187) | |
| Propane product margin ($/gallon) (3) | | $ | 0.057 | | | $ | 0.011 | | | $ | 0.046 | |
| Propane inventory (gallons) (2) | | 48,379 | | | 37,719 | | | 10,660 | |
| | | | | | |
| Butane sold (gallons) | | 539,658 | | | 588,032 | | | (48,374) | |
| Butane sold ($/gallon) | | $ | 1.434 | | | $ | 1.468 | | | $ | (0.034) | |
| Cost per butane sold ($/gallon) (3) | | $ | 1.440 | | | $ | 1.351 | | | $ | 0.089 | |
| Butane product (loss) margin ($/gallon) (3) | | $ | (0.006) | | | $ | 0.117 | | | $ | (0.123) | |
| Butane inventory (gallons) (2) | | 17,409 | | | 19,825 | | | (2,416) | |
| | | | | | |
| Other products sold (gallons) | | 391,723 | | | 376,906 | | | 14,817 | |
| Other products sold ($/gallon) | | $ | 2.619 | | | $ | 2.099 | | | $ | 0.520 | |
| Cost per other products sold ($/gallon) (3) | | $ | 2.477 | | | $ | 1.986 | | | $ | 0.491 | |
| Other products product margin ($/gallon) (3) | | $ | 0.142 | | | $ | 0.113 | | | $ | 0.029 | |
| Other products inventory (gallons) (2) | | 12,893 | | | 18,614 | | | (5,721) | |
(1) Revenue includes $1.3 million of intersegment sales during the year ended March 31, 2022 that is eliminated in our consolidated statement of operations.
(2) Information is presented as of March 31, 2023 and March 31, 2022, respectively.
(3) Cost and product margin (loss) per gallon excludes the impact of derivatives.
Refined Products Sales and Cost of Sales-Excluding Impact of Derivatives. The increases in sales and cost of sales, excluding the impact of derivatives, were due to an increase in refined products prices. This was partially offset by a decrease in volumes primarily related to tighter supply in certain markets.
Refined Products product margins, excluding the impact of derivatives, for the year ended March 31, 2023 increased from the year ended March 31, 2022 due to higher demand in several markets that were experiencing tighter supply as well as being well positioned from a supply and inventory perspective during the continued period of extreme volatility in commodity prices.
Refined Products Derivative Loss. Our Refined Products product margin during the year ended March 31, 2023 included realized losses of $1.3 million and the year ended March 31, 2022 included realized losses of $2.9 million.
Propane Sales and Cost of Sales-Excluding Impact of Derivatives. The decreases in sales and cost of sales, excluding the impact of derivatives, were due primarily to lower propane prices and a decline in volumes. Propane prices have declined along with the decline in global energy prices as a result of the increase in interest rates to curb inflation and the overall concerns in the economy about a potential recession, as well as due to an increase in the days of domestic supply available, combined with lower demand due to the warmer heating season. Sales volumes decreased due to the decommissioning of a critical underground storage facility in the Midwest in April 2022, which were offset by an increase in sales volumes in the state of Michigan due to the completion of the Ambassador Pipeline.
Propane product margins, excluding the impact of derivatives, increased as we replaced our inventory in a lower price environment and we realized the margin associated with our forward fixed-priced sales contracts and lower inventory costs due to the decreasing prices throughout the year ended March 31, 2023. During the year ended March 31, 2022, we experienced the
opposite situation and were replacing our inventory when prices were rising.
Propane Derivative Loss (Gain). Our cost of propane sales included $6.9 million of net unrealized losses on derivatives and $4.7 million of net realized losses on derivatives during the year ended March 31, 2023. During the year ended March 31, 2022, our cost of propane sales included $2.0 million of net unrealized gains on derivatives and $18.5 million of net realized gains on derivatives.
Butane Sales and Cost of Sales-Excluding Impact of Derivatives. The decreases in sales and cost of sales, excluding the impact of derivatives, were due to lower volumes due to weaker spot demand for the product, especially exports, and lower prices. The softening of export economics continued throughout the year, which led to lower domestic prices as less product was being moved abroad.
Butane product margins, excluding the impact of derivatives, declined during the year ended March 31, 2023, as compared to the year ended March 31, 2022, due to the declining prices, lower export demand and increased freight charges due to higher fuel surcharges. In addition, we were also negatively impacted by lower location differentials as the product we contracted to purchase in the beginning of the season was continuing to compete with product purchased in the discounted market.
Butane Derivative (Gain) Loss. Our cost of butane sales during the year ended March 31, 2023 included $3.9 million of net unrealized gains on derivatives and $19.1 million of net realized gains on derivatives. Our cost of butane sales included $1.0 million of net unrealized gains on derivatives and $19.7 million of net realized losses on derivatives during the year ended March 31, 2022.
Other Products Sales and Cost of Sales-Excluding Impact of Derivatives. The increases in sales and cost of sales, excluding the impact of derivatives, were due to an increased supply of biodiesel to sell during the current year compared to the prior year period due to favorable supply contracts entered into in the prior year. The increase was also related to the increase in asphalt revenues due to increased supply.
Other products sales product margins, excluding the impact of derivatives, during the year ended March 31, 2023 increased due to an increase in biodiesel and biodiesel renewable identification number market prices, as well as securing favorable biodiesel supply contracts in the Midwest and transporting the product for sale in more favorable markets.
Other Products Derivative Loss. Our derivatives of other products included $24.6 million of net realized losses on derivatives and $0.1 million of unrealized gains on derivatives during the year ended March 31, 2023. Our derivatives of other products during the year ended March 31, 2022 included $15.8 million of net realized losses on derivatives and there was no unrealized gains or losses on derivatives.
Service Sales and Cost of Sales. The sales include storage, terminaling and transportation services income. The decrease during the year ended March 31, 2023 was due to the disposition of Sawtooth Caverns, LLC (“Sawtooth”) in June 2021 as well as less throughput in certain of our propane and butane terminals. Cost of sales increased due to higher chemical costs at our natural gas liquids terminals.
Operating and General and Administrative Expenses. The decrease was primarily related to lower incentive compensation due to lower operating results.
Depreciation and Amortization Expense. The decrease was primarily due to the disposition of Sawtooth in June 2021 as well as lower amortization expense due to certain intangible assets being fully amortized as of March 31, 2023.
Loss on Disposal or Impairment of Assets, Net. During the year ended March 31, 2023, we recorded a net loss of $10.1 million due to the impairment of several underperforming natural gas liquids terminals. In addition, during the year ended March 31, 2023, we recorded a net loss of $0.2 million related to the sale and retirement of other assets. During the year ended March 31, 2022, we recorded a net loss of $60.1 million related to the sale of Sawtooth (see Note 17 to our consolidated financial statements included in this Annual Report) and a net loss of $11.8 million related to the sale of another terminal during the three months ended September 30, 2021.
Corporate and Other
The operating loss within “Corporate and Other” includes the following components for the periods indicated:
| | | | | | | | | | | | | | | | | | | | |
| | Year Ended March 31, | | |
| | 2023 | | 2022 | | Change |
| | (in thousands) |
| Cost of sales | | | | | | |
| Derivative loss | | $ | 1,181 | | | $ | — | | | $ | 1,181 | |
| Expenses: | | | | | | |
| | | | | | |
| General and administrative expenses | | 50,978 | | | 41,491 | | | 9,487 | |
| Depreciation and amortization expense | | 6,662 | | | 6,959 | | | (297) | |
| Gain on disposal or impairment of assets, net | | (912) | | | (50) | | | (862) | |
| Total expenses | | 56,728 | | | 48,400 | | | 8,328 | |
| Operating loss | | $ | (57,909) | | | $ | (48,400) | | | $ | (9,509) | |
Cost of Sales - Derivative Loss. Amount for the year ended March 31, 2023 represents an unrealized loss on crude oil options entered into to protect our liquidity position and leverage from a significant increase in commodity prices that drive our working capital demands, as we experienced in the prior fiscal year. These positions will expire between April 2023 and November 2023.
General and Administrative Expenses. The increase during the year ended March 31, 2023 was due to increased incentive compensation expense compared to the prior year and an increase in equity-based compensation primarily due to a reversal of an incentive compensation accrual during the year ended March 31, 2022.
Depreciation and Amortization Expense. Depreciation and amortization expense during the year ended March 31, 2023 was consistent with the year ended March 31, 2022.
Gain on Disposal or Impairment of Assets, Net. During the year ended March 31, 2023, we sold an airplane for a gain of $1.3 million, which was partially offset by a loss recorded to write-off the remaining amount of a loan receivable, due July 31, 2023, that was prepaid by the debtor and an impairment loss recorded on the sublease of a building we were no longer using.
Equity in Earnings of Unconsolidated Entities
Equity in earnings of unconsolidated entities was $4.1 million during the year ended March 31, 2023, compared to $1.4 million during the year ended March 31, 2022. The increase of $2.7 million during the year ended March 31, 2023 was due primarily to higher earnings from certain membership interests related to specific land and water services operations and a lower loss from our interest in an aircraft company.
Interest Expense
The following table summarizes the components of our consolidated interest expense for the periods indicated:
| | | | | | | | | | | | | | | | | | | | |
| | Year Ended March 31, | | |
| | 2023 | | 2022 | | Change |
| | (in thousands) |
| Senior secured notes | | $ | 153,750 | | | $ | 153,750 | | | $ | — | |
| Senior unsecured notes | | 76,288 | | | 87,766 | | | (11,478) | |
| ABL Facility | | 17,111 | | | 10,077 | | | 7,034 | |
| Other indebtedness | | 11,559 | | | 3,087 | | | 8,472 | |
| Total debt interest expense | | 258,708 | | | 254,680 | | | 4,028 | |
| Amortization of debt issuance costs | | 16,737 | | | 16,960 | | | (223) | |
| Total interest expense | | $ | 275,445 | | | $ | 271,640 | | | $ | 3,805 | |
The debt interest expense increased $4.0 million during the year ended March 31, 2023 due primarily to a settlement of a claim for the failure to pay interest on royalty payments, as discussed further in Note 8 to our consolidated financial
statements included in this Annual Report and an increase in the ABL Facility interest rates in the current year. The increases in the current year were offset by lower interest expense resulting from repurchases of a portion of our Senior Unsecured Notes.
Gain on Early Extinguishment of Liabilities, Net
Gain on early extinguishment of liabilities, net was $6.2 million during the year ended March 31, 2023, compared to $1.8 million during the year ended March 31, 2022. During the years ended March 31, 2023 and 2022, the net gain (inclusive of debt issuance costs written off) primarily relates to the early extinguishment of a portion of the outstanding Senior Unsecured Notes. In addition, we paid a prepayment premium of $1.6 million and wrote off debt issuance costs of less than $0.1 million related to the payoff of an outstanding equipment loan. For the year ended March 31, 2022, the net gain was partially offset by a loss on the early extinguishment of the Sawtooth credit agreement. See Note 7 to our consolidated financial statements included in this Annual Report for a further discussion.
Other Income, Net
Other income, net was $28.7 million during the year ended March 31, 2023, compared to other income, net of $2.3 million during the year ended March 31, 2022. The increase in other income, net of $26.4 million during the year ended March 31, 2023 was due primarily to the settlement of a dispute associated with commercial activities not occurring in the current reporting periods (see Note 17 to our consolidated financial statements included in this Annual Report for a further discussion).
Income Tax Expense
Income tax expense was $0.3 million during the year ended March 31, 2023, compared to income tax expense of $1.0 million during the year ended March 31, 2022. See Note 2 to our consolidated financial statements included in this Annual Report for a further discussion.
Noncontrolling Interests
Noncontrolling interest income was $1.1 million during the year ended March 31, 2023, compared to $0.7 million during the year ended March 31, 2022. The increase of $0.4 million during the year ended March 31, 2023 was due primarily to higher income from certain water solutions operations during the year ended March 31, 2023 and a loss of $0.2 million from the operations of Sawtooth during the year ended March 31, 2022, partially offset by lower income from certain recycling operations during the year ended March 31, 2023.
Non-GAAP Financial Measures
In addition to financial results reported in accordance with accounting principles generally accepted in the United States (“GAAP”), we have provided the non-GAAP financial measures of EBITDA and Adjusted EBITDA. These non-GAAP financial measures are not intended to be a substitute for those reported in accordance with GAAP. These measures may be different from non-GAAP financial measures used by other entities, even when similar terms are used to identify such measures.
We define EBITDA as net income (loss) attributable to NGL Energy Partners LP, plus interest expense, income tax expense (benefit), and depreciation and amortization expense. We define Adjusted EBITDA as EBITDA excluding net unrealized gains and losses on derivatives, lower of cost or net realizable value adjustments, gains and losses on disposal or impairment of assets, gains and losses on early extinguishment of liabilities, equity-based compensation expense, revaluation of liabilities and other. We also include in Adjusted EBITDA certain inventory valuation adjustments related to certain refined products businesses within our Liquids Logistics segment as discussed below. EBITDA and Adjusted EBITDA should not be considered as alternatives to net (loss) income, (loss) income before income taxes, cash flows from operating activities, or any other measure of financial performance calculated in accordance with GAAP, as those items are used to measure operating performance, liquidity or the ability to service debt obligations. We believe that EBITDA provides additional information to investors for evaluating our ability to make quarterly distributions to our unitholders and is presented solely as a supplemental measure. We believe that Adjusted EBITDA provides additional information to investors for evaluating our financial performance without regard to our financing methods, capital structure and historical cost basis. Further, EBITDA and Adjusted EBITDA, as we define them, may not be comparable to EBITDA, Adjusted EBITDA, or similarly titled measures used by other entities.
Other than for certain businesses within our Liquids Logistics segment, for purposes of our Adjusted EBITDA calculation, we make a distinction between realized and unrealized gains and losses on derivatives. During the period when a
derivative contract is open, we record changes in the fair value of the derivative as an unrealized gain or loss. When a derivative contract matures or is settled, we reverse the previously recorded unrealized gain or loss and record a realized gain or loss. We do not draw such a distinction between realized and unrealized gains and losses on derivatives of certain businesses within our Liquids Logistics segment. The primary hedging strategy of these businesses is to hedge against the risk of declines in the value of inventory over the course of the contract cycle, and many of the hedges cover extended periods of time. The “inventory valuation adjustment” row in the reconciliation table reflects the difference between the market value of the inventory of these businesses at the balance sheet date and its cost. We include this in Adjusted EBITDA because the unrealized gains and losses associated with derivative contracts associated with the inventory of this segment, which are intended primarily to hedge inventory holding risk and are included in net income, also affect Adjusted EBITDA. In our Crude Oil Logistics segment, we purchase certain crude oil barrels using the West Texas Intermediate (“WTI”) calendar month average (“CMA”) price and sell the crude oil barrels using the WTI CMA price plus the Argus CMA Differential Roll Component (“CMA Differential Roll”) per our contracts. To eliminate the volatility of the CMA Differential Roll, we entered into derivative instrument positions in January 2021 to secure a margin of approximately $0.20 per barrel on 1.5 million barrels per month from May 2021 through December 2023. Due to the nature of these positions, the cash flow and earnings recognized on a GAAP basis differed from period to period depending on the current crude oil price and future estimated crude oil price which were valued utilizing third-party market quoted prices. We recognized in Adjusted EBITDA the gains and losses from the derivative instrument positions entered into in January 2021 to properly align with the physical margin we hedged each month through the term of this transaction. This representation aligns with management’s evaluation of the transaction. The derivative instrument positions we entered into related to the CMA Differential Roll expired as of December 31, 2023, and we have not entered into any new derivative instrument positions related to the CMA Differential Roll.
The following table reconciles net (loss) income to EBITDA and Adjusted EBITDA for the periods indicated:
| | | | | | | | | | | | | | | | | | | | |
| | Year Ended March 31, |
| | 2024 | | 2023 | | 2022 |
| | (in thousands) |
| Net (loss) income | | $ | (143,124) | | | $ | 52,492 | | | $ | (184,101) | |
| Less: Net income attributable to noncontrolling interests | | (631) | | | (1,106) | | | (655) | |
| Net (loss) income attributable to NGL Energy Partners LP | | (143,755) | | | 51,386 | | | (184,756) | |
| Interest expense | | 270,004 | | | 275,505 | | | 271,689 | |
| Income tax expense | | 2,405 | | | 271 | | | 971 | |
| Depreciation and amortization | | 266,287 | | | 273,544 | | | 287,943 | |
| EBITDA | | 394,941 | | | 600,706 | | | 375,847 | |
| Net unrealized losses (gains) on derivatives | | 63,762 | | | (50,438) | | | (14,977) | |
| CMA Differential Roll net losses (gains) (1) | | (71,285) | | | 3,547 | | | 67,738 | |
| Inventory valuation adjustment (2) | | (3,419) | | | (7,795) | | | 8,409 | |
| Lower of cost or net realizable value adjustments | | 1,337 | | | (11,534) | | | 10,862 | |
| Loss on disposal or impairment of assets, net | | 115,555 | | | 86,872 | | | 94,059 | |
| Loss (gain) on early extinguishment of liabilities, net | | 55,281 | | | (6,177) | | | (1,851) | |
| Equity-based compensation expense | | 1,098 | | | 2,718 | | | (1,052) | |
| Revaluation of liabilities (3) | | 2,680 | | | 9,665 | | | (6,495) | |
| Other (4) | | 50,131 | | | 5,111 | | | 9,976 | |
| Adjusted EBITDA | | $ | 610,081 | | | $ | 632,675 | | | $ | 542,516 | |
(1) Adjustment to align, within Adjusted EBITDA, the net gains and losses of the Partnership’s CMA Differential Roll derivative instruments positions with the physical margin being hedged. See “Non-GAAP Financial Measures” section above for a further discussion.
(2) Amounts represent the difference between the market value of the inventory at the balance sheet date and its cost. See “Non-GAAP Financial Measures” section above for a further discussion.
(3) Amounts represent the non-cash valuation adjustment of contingent consideration liabilities, offset by the cash payments, related to royalty agreements acquired as part of acquisitions in our Water Solutions segment.
(4) Amounts represent accretion expense for asset retirement obligations, unrealized gains/losses on marketable securities and expenses incurred related to legal and advisory costs associated with acquisitions and dispositions, including the accrued judgment related to the LCT legal matter, excluding interest (see Note 8 to our consolidated financial statements included in this Annual Report), and the write-off of the legal costs related to the LCT legal matter that were originally allocated to the GP (see Note 12 to our consolidated financial statements included in this Annual Report). Also, the amount for the year ended March 31, 2023 includes the write off of an asset acquired in a prior period acquisition and the amounts for the years ended March 31, 2023 and 2022 include non-cash operating expenses related to our Grand Mesa Pipeline.
The following tables reconcile depreciation and amortization amounts per the EBITDA table above to depreciation and amortization amounts reported in our consolidated statements of operations and consolidated statements of cash flows for the periods indicated:
| | | | | | | | | | | | | | | | | | | | |
| | Year Ended March 31, |
| | 2024 | | 2023 | | 2022 |
| | (in thousands) |
| Depreciation and amortization per EBITDA table | | $ | 266,287 | | | $ | 273,544 | | | $ | 287,943 | |
| Intangible asset amortization recorded to cost of sales | | (260) | | | (274) | | | (281) | |
| Depreciation and amortization attributable to unconsolidated entities | | (686) | | | (783) | | | (768) | |
| Depreciation and amortization attributable to noncontrolling interests | | 1,182 | | | 1,134 | | | 1,826 | |
| Depreciation and amortization per consolidated statements of operations | | $ | 266,523 | | | $ | 273,621 | | | $ | 288,720 | |
| | | | | | |
| Depreciation and amortization per EBITDA table | | $ | 266,287 | | | $ | 273,544 | | | $ | 287,943 | |
| Amortization of debt issuance costs recorded to interest expense | | 15,701 | | | 16,737 | | | 16,960 | |
| Amortization of royalty expense recorded to operating expense | | 247 | | | 247 | | | 247 | |
| Depreciation and amortization attributable to unconsolidated entities | | (686) | | | (783) | | | (768) | |
| Depreciation and amortization attributable to noncontrolling interests | | 1,182 | | | 1,134 | | | 1,826 | |
| Depreciation and amortization per consolidated statements of cash flows | | $ | 282,731 | | | $ | 290,879 | | | $ | 306,208 | |
The following table reconciles interest expense per the EBITDA table above to interest expense reported in our consolidated statements of operations for the periods indicated:
| | | | | | | | | | | | | | | | | | | | |
| | Year Ended March 31, |
| | 2024 | | 2023 | | 2022 |
| | (in thousands) |
| Interest expense per EBITDA table | | $ | 270,004 | | | $ | 275,505 | | | $ | 271,689 | |
| Interest expense attributable to unconsolidated entities | | (81) | | | (60) | | | (65) | |
| Interest expense attributable to noncontrolling interests | | — | | | — | | | 16 | |
| Interest expense per consolidated statements of operations | | $ | 269,923 | | | $ | 275,445 | | | $ | 271,640 | |
The following tables reconcile operating income (loss) to Adjusted EBITDA by segment for the periods indicated.
| | | | | | | | | | | | | | | | | | | | | | | | | | | | | |
| Year Ended March 31, 2024 |
| Water
Solutions | | Crude Oil
Logistics | | Liquids Logistics | | Corporate
and Other | | Consolidated |
| (in thousands) |
| Operating income (loss) | $ | 231,256 | | | $ | 52,074 | | | $ | 2,481 | | | $ | (108,239) | | | $ | 177,572 | |
| Depreciation and amortization | 214,480 | | | 36,922 | | | 10,372 | | | 4,749 | | | 266,523 | |
| Amortization recorded to cost of sales | — | | | — | | | 260 | | | — | | | 260 | |
| Net unrealized losses (gains) on derivatives | 385 | | | 65,786 | | | (1,230) | | | (1,179) | | | 63,762 | |
| CMA Differential Roll net losses (gains) | — | | | (71,285) | | | — | | | — | | | (71,285) | |
| Inventory valuation adjustment | — | | | — | | | (3,419) | | | — | | | (3,419) | |
| Lower of cost or net realizable value adjustments | — | | | — | | | 1,337 | | | — | | | 1,337 | |
| Loss (gain) on disposal or impairment of assets, net | 53,639 | | | 3,094 | | | 59,923 | | | (720) | | | 115,936 | |
| Equity-based compensation expense | — | | | — | | | — | | | 1,098 | | | 1,098 | |
| Other income, net | 1,110 | | | 105 | | | 12 | | | 1,566 | | | 2,793 | |
| Adjusted EBITDA attributable to unconsolidated entities | 4,393 | | | — | | | (12) | | | 124 | | | 4,505 | |
| Adjusted EBITDA attributable to noncontrolling interest | (1,821) | | | — | | | — | | | — | | | (1,821) | |
| Revaluation of liabilities | 2,680 | | | — | | | — | | | — | | | 2,680 | |
| Other | 2,186 | | | 191 | | | 230 | | | 47,533 | | | 50,140 | |
| Adjusted EBITDA | $ | 508,308 | | | $ | 86,887 | | | $ | 69,954 | | | $ | (55,068) | | | $ | 610,081 | |
| | | | | | | | | | | | | | | | | | | | | | | | | | | | | |
| Year Ended March 31, 2023 |
| Water
Solutions | | Crude Oil
Logistics | | Liquids Logistics | | Corporate
and Other | | Consolidated |
| (in thousands) |
| Operating income (loss) | $ | 198,924 | | | $ | 81,524 | | | $ | 66,624 | | | $ | (57,909) | | | $ | 289,163 | |
| Depreciation and amortization | 207,081 | | | 46,577 | | | 13,301 | | | 6,662 | | | 273,621 | |
| Amortization recorded to cost of sales | — | | | — | | | 274 | | | — | | | 274 | |
| Net unrealized (gains) losses on derivatives | (4,464) | | | (50,104) | | | 2,951 | | | 1,179 | | | (50,438) | |
| CMA Differential Roll net losses (gains) | — | | | 3,547 | | | — | | | — | | | 3,547 | |
| Inventory valuation adjustment | — | | | — | | | (7,795) | | | — | | | (7,795) | |
| Lower of cost or net realizable value adjustments | — | | | (2,247) | | | (9,287) | | | — | | | (11,534) | |
| Loss (gain) on disposal or impairment of assets, net | 46,431 | | | 31,086 | | | 10,283 | | | (912) | | | 86,888 | |
| Equity-based compensation expense | — | | | — | | | — | | | 2,718 | | | 2,718 | |
| Other income (expense), net | 70 | | | 330 | | | (1,665) | | | 30,013 | | | 28,748 | |
| Adjusted EBITDA attributable to unconsolidated entities | 4,759 | | | — | | | 27 | | | 176 | | | 4,962 | |
| Adjusted EBITDA attributable to noncontrolling interest | (2,269) | | | — | | | — | | | — | | | (2,269) | |
| Revaluation of liabilities | 9,665 | | | — | | | — | | | — | | | 9,665 | |
| Other | 2,894 | | | 203 | | | 1,933 | | | 95 | | | 5,125 | |
| Adjusted EBITDA | $ | 463,091 | | | $ | 110,916 | | | $ | 76,646 | | | $ | (17,978) | | | $ | 632,675 | |
| | | | | | | | | | | | | | | | | | | | | | | | | | | | | |
| Year Ended March 31, 2022 |
| Water
Solutions | | Crude Oil
Logistics | | Liquids Logistics | | Corporate
and Other | | Consolidated |
| (in thousands) |
| Operating income (loss) | $ | 94,851 | | | $ | 45,033 | | | $ | (8,441) | | | $ | (48,400) | | | $ | 83,043 | |
| Depreciation and amortization | 214,558 | | | 48,489 | | | 18,714 | | | 6,959 | | | 288,720 | |
| Amortization recorded to cost of sales | — | | | — | | | 281 | | | — | | | 281 | |
| Net unrealized losses (gains) on derivatives | 11,652 | | | (23,664) | | | (2,965) | | | — | | | (14,977) | |
| CMA Differential Roll net losses (gains) | — | | | 67,738 | | | — | | | — | | | 67,738 | |
| Inventory valuation adjustment | — | | | — | | | 8,409 | | | — | | | 8,409 | |
| Lower of cost or net realizable value adjustments | — | | | 2,235 | | | 8,627 | | | — | | | 10,862 | |
| Loss (gain) on disposal or impairment of assets, net | 25,598 | | | (3,101) | | | 71,807 | | | (50) | | | 94,254 | |
| Equity-based compensation expense | — | | | — | | | — | | | (1,052) | | | (1,052) | |
| Other income, net | 718 | | | 353 | | | 711 | | | 472 | | | 2,254 | |
| Adjusted EBITDA attributable to unconsolidated entities | 2,363 | | | — | | | 14 | | | (145) | | | 2,232 | |
| Adjusted EBITDA attributable to noncontrolling interest | (2,212) | | | — | | | (528) | | | — | | | (2,740) | |
| Revaluation of liabilities | (6,495) | | | — | | | — | | | — | | | (6,495) | |
| Other | 925 | | | 9,064 | | | (65) | | | 63 | | | 9,987 | |
| Adjusted EBITDA | $ | 341,958 | | | $ | 146,147 | | | $ | 96,564 | | | $ | (42,153) | | | $ | 542,516 | |
Liquidity, Sources of Capital and Capital Resource Activities
General
Our principal sources of liquidity and capital resource requirements are cash flows from our operations, borrowings under the ABL Facility, issuing long-term notes, common and/or preferred units, loans from financial institutions, asset securitizations or asset sales. We expect our primary cash outflows to be related to capital expenditures, interest and repayment of debt maturities and distributions.
On February 2, 2024, we closed a debt refinancing transaction of $2.9 billion. The refinancing consisted of a private offering of $2.2 billion of senior secured notes, which includes $900.0 million of 8.125% senior secured notes due 2029 (“2029 Senior Secured Notes”) and $1.3 billion of 8.375% senior secured notes due 2032 (“2032 Senior Secured Notes”). We also entered into a new seven-year $700.0 million Term Loan B. The net proceeds from these transactions were used to (i) to fund the redemption, and related discharge of the indentures governing our existing 2025 Notes, 2026 Notes and 2026 Senior Secured Notes, including any applicable premiums and accrued and unpaid interest (as discussed further below), (ii) to pay fees and expenses in connection therewith, (iii) to repay borrowings under the ABL Facility and (iv) to the extent of any remaining net proceeds, for general corporate purposes.
We believe that our anticipated cash flows from operations and the borrowing capacity under the ABL Facility will be sufficient to meet our liquidity needs. Our borrowing needs vary during the year due in part to the seasonal nature of certain businesses within our Liquids Logistics segment. Our greatest working capital borrowing needs generally occur during the period of June through December, when we are building our natural gas liquids inventories in anticipation of the butane blending and heating seasons. Our working capital borrowing needs generally decline during the period of January through March, when the cash inflows from our Liquids Logistics segment are the greatest. In addition, our working capital borrowing needs vary with changes in commodity prices. A significant increase in commodity prices could drive up our working capital demands and limit our ability to continue to delever our balance sheet and restrict our financial flexibility. To protect our liquidity and leverage, we have in the past and may in the future enter into economic hedges that mitigate this exposure when we are building inventory. There were no open hedge positions as of March 31, 2024.
Cash Management
We manage cash by utilizing a centralized cash management program that concentrates the cash assets of our operating subsidiaries in joint accounts for the purposes of providing financial flexibility and lowering the cost of borrowing, transaction costs and bank fees. Our centralized cash management program provides that funds in excess of the daily needs of our operating subsidiaries are concentrated, consolidated or otherwise made available for use within our consolidated group. All of our wholly-owned operating subsidiaries participate in this program. Under the cash management program, depending on whether a participating subsidiary has short-term cash surpluses or cash requirements, we provide cash to the subsidiary or the subsidiary provides cash to us.
Short-Term Liquidity
Our principal sources of short-term liquidity consist of cash flows from our operations and borrowings under the ABL Facility, which we believe will provide liquidity to operate our business, manage our working capital requirements and repay current maturities.
On February 2, 2024, we amended the ABL Facility to, among other things, (i) extend the maturity to the earliest of (a) February 2, 2029 and (b) 91 days prior to the earliest maturity date in respect to any of our indebtedness in an aggregate principal amount of $50.0 million or greater, subject to certain exceptions, (ii) provide for a sub-limit of $200.0 million for letters of credit and a $200.0 million incremental facility, subject to the receipt of commitments from lenders and customary borrowing conditions, (iii) modify the applicable margin for loans under the ABL Facility based on a secured overnight financing rate (“SOFR”) or the alternative base rate to provide for a 0.25% decrease based on our consolidated net leverage ratio, and (iv) provide for a mandatory prepayment under the ABL Facility while any loans are outstanding under the ABL Facility if aggregate “excess cash” (as defined in the ABL Facility) exceeds $50.0 million, subject to certain exceptions.
The commitments under the ABL Facility are $600.0 million. At March 31, 2024, there were no borrowings under the ABL Facility and we had letters of credit outstanding of approximately $99.5 million.
For additional information related to the ABL Facility and the amendment, see Note 7 to our consolidated financial statements included in this Annual Report.
As of March 31, 2024, our current assets exceeded our current liabilities by approximately $201.6 million.
Long-Term Financing
We expect to fund our long-term financing requirements by issuing long-term notes, common units and/or preferred units, loans from financial institutions, asset securitizations or asset sales.
New Senior Secured Notes
On February 2, 2024, we closed on our private offering of $900.0 million of 2029 Senior Secured Notes that mature on February 15, 2029 and $1.3 billion of 2032 Senior Secured Notes that mature on February 15, 2032. Interest on the new senior secured notes will be paid quarterly on February 15, May 15, August 15 and November 15 of each year, beginning on May 15, 2024.
Term Loan B
On February 2, 2024,we entered into a new seven-year $700.0 million Term Loan B. The Term Loan B will mature on February 2, 2031 and will amortize in equal quarterly installments in aggregate annual amounts equal to 1.0% of the original principal amount beginning with the fiscal quarter ending June 30, 2024, with the balance payable on maturity.
2026 Senior Secured Notes
On January 19, 2024, we delivered notice to the holders of our 2026 Senior Secured Notes that we intend to redeem all of the existing 2026 Senior Secured Notes at 101.875% of the principal amount, together with accrued and unpaid interest. On February 6, 2024, we redeemed all of the outstanding 2026 Senior Secured Notes for total consideration of $2.1 billion, which included the payment of accrued interest and unpaid interest of $2.1 million and a call premium of $38.4 million.
Senior Unsecured Notes
On January 19, 2024, we delivered notice to the holders of the 2025 Notes and the 2026 Notes that we intend to redeem all of the outstanding notes for each series at 100% of the principal amount, together with accrued and unpaid interest. On February 20, 2024, we redeemed all of the outstanding 2025 Notes for total consideration of $288.8 million, which included the payment of accrued and unpaid interest of $8.1 million. On February 2, 2024, we deposited $331.9 million with the trustee for the redemption of the 2026 Notes, which included the payment of accrued and unpaid interest of $12.0 million. As we met the requirements of discharge under an indenture dated February 4, 2021, we no longer have this liability as of March 31, 2024.
For additional information related to our long-term debt, see Note 7 to our consolidated financial statements included in this Annual Report.
Capital Expenditures, Acquisitions and Other Investments
The following table summarizes expansion, maintenance and other non-cash capital expenditures (which excludes additions for tank bottoms and linefill and has been prepared on the accrual basis), acquisitions and other investments for the periods indicated.
| | | | | | | | | | | | | | | | | | | | | | | | | | | | | | | | |
| | Capital Expenditures | | | | Other |
| Year Ended March 31, | | Expansion | | Maintenance | | Other (1) | | Acquisitions (2) | | Investments (3) |
| | (in thousands) |
| 2024 | | $ | 99,533 | | | $ | 54,854 | | | $ | 15,680 | | | $ | — | | | $ | 258 | |
| 2023 | | $ | 79,091 | | | $ | 61,649 | | | $ | — | | | $ | — | | | $ | 88 | |
| 2022 | | $ | 75,554 | | | $ | 59,468 | | | $ | — | | | $ | — | | | $ | 350 | |
(1) Amount for the year ended March 31, 2024 includes $9.2 million of equipment and other assets received in connection with contracts with customers and $6.4 million for a transaction classified as an acquisition of assets. See Note 17 to our consolidated financial statements included in this Annual Report for information regarding the acquisition of assets.
(2) There were no acquisitions during the years ended March 31, 2024, 2023 or 2022.
(3) Amounts relate to contributions made to unconsolidated entities.
Capital expenditures for the year ending March 31, 2025 are expected to be approximately $210 million.
Distributions Declared
The board of directors of our GP decided to temporarily suspend all distributions in order to deleverage our balance sheet until we meet the 4.75 to 1.00 total leverage ratio set forth within the indenture for the 2026 Senior Secured Notes. As a result, quarterly common unit distributions were suspended beginning with the quarter ended December 31, 2020 and preferred unit distributions were suspended beginning with the quarter ended March 31, 2021.
On February 6, 2024, the board of directors of our GP declared a cash distribution of 50% of the outstanding distribution arrearages through December 31, 2023 to the holders of the Class B Fixed-to-Floating Rate Cumulative Redeemable Perpetual Preferred Units (“Class B Preferred Units”), the Class C Fixed-to-Floating Rate Cumulative Redeemable Perpetual Preferred Units (“Class C Preferred Units”) and the 9.00% Class D Preferred Units (“Class D Preferred Units”). The
total distribution of $178.3 million was made on February 27, 2024 to the holders of record at the close of trading on February 16, 2024.
On April 4, 2024, the board of directors of our GP declared a cash distribution of 55.4% of the outstanding distribution arrearages through the quarter ended March 31, 2024 to the holders of the Class B Preferred Units, the Class C Preferred Units and the Class D Preferred Units. The total distribution of $120.0 million was made on April 18, 2024 to the holders of record at the close of trading on April 12, 2024.
On April 9, 2024, the board of directors of our GP declared a cash distribution to fully pay the remaining distribution arrearages and interest to the holders of the Class B Preferred Units, the Class C Preferred Units and the Class D Preferred Units. The total distribution of $98.1 million was made on April 25, 2024 to the holders of record at the close of trading on April 19, 2024.
As of April 25, 2024, all preferred unit distributions in arrears have been paid.
The board of directors of our GP expects to evaluate the reinstatement of the common unit distributions in due course, taking into account a number of important factors, including our leverage, liquidity, the sustainability of cash flows, upcoming debt maturities, capital expenditures and the overall performance of our businesses.
See further discussion of our cash distribution policy in Part II, Item 5–“Market for Registrant’s Common Equity, Related Unitholder Matters and Issuer Purchases of Equity Securities” included in this Annual Report. For further discussion of the distributions, see Note 9 to our consolidated financial statements included in this Annual Report.
Contractual Obligations
Our contractual obligations primarily consist of purchase commitments, outstanding debt principal and interest obligations, operating lease obligations, pipeline commitments, asset retirement obligations and other commitments.
Purchase Commitments
Our fixed-price and index-price commodity purchase commitments result from contracts we have entered into for which we expect the parties to physically settle and deliver the inventory in future periods. As of March 31, 2024, our purchase commitments totaled $5.5 billion, with $4.7 billion due within one year. See Note 8 to our consolidated financial statements included in this Annual Report for information regarding our commodity purchase commitments and timing of our expected purchase commitments payments.
Debt Principal and Interest Obligations
As of March 31, 2024, our aggregate principal amount of outstanding debt was $2.9 billion, with $7.0 million due within one year. Our interest obligation on the debt was $1.7 billion, with $258.1 million due within one year, based on our outstanding balances and interest rates as of March 31, 2024. See Note 7 to our consolidated financial statements included in this Annual Report for information regarding our outstanding debt principal and interest obligations and timing of our expected debt principal and interest payments.
Operating Lease Obligations
As of March 31, 2024, our undiscounted operating lease obligation was $131.2 million, with $38.4 million due within one year. See Note 15 to our consolidated financial statements included in this Annual Report for information regarding our lease obligations and timing of our expected lease payments.
Pipeline Commitments
Our pipeline commitment is a noncancelable agreement with a crude oil pipeline operator, which guarantee us minimum monthly shipping capacity on the pipeline. As of March 31, 2024, our future minimum throughput payments were $30.4 million, which is due within one year. See Note 8 to our consolidated financial statements included in this Annual Report for information regarding our pipeline commitment and timing of our expected pipeline commitment payments.
Asset Retirement Obligations
We have contractual and regulatory obligations at certain facilities for which we have to perform remediation, dismantlement or removal activities when the assets are retired. As of March 31, 2024, our asset retirement obligations were $56.6 million, of which we expect to settle $1.2 million during fiscal year 2025. See Note 8 to our consolidated financial statements included in this Annual Report for information regarding our asset retirement obligations and timing of our expected asset retirement obligations payments.
Other Commitments
We have noncancelable agreements for product storage, railcar spurs, capital projects and real estate. As of March 31, 2024, our commitment obligations were $55.7 million, with $34.8 million due within one year. See Note 8 to our consolidated financial statements included in this Annual Report for information regarding our other commitments and timing of our expected commitment payments.
LCT Legal Judgment
On May 28, 2024, the Supreme Court of Delaware affirmed the jury verdict and remanded the case back to the trial court to re-calculate the amount of the pre- and post-judgment interest accrual. As of March 31, 2024, we accrued $62.1 million related to this matter, of which approximately $26.1 million represents interest accrued through March 31, 2024 and $0.1 million of costs awarded to the plaintiff. Interest will continue to accrue until the amount of the judgment is paid. We expect to pay the amount of the judgment, costs and interest related to this matter by June 30, 2024. See Note 8 to our consolidated financial statements included in this Annual Report for further information regarding this matter.
Cash Flows
The following table summarizes the sources (uses) of our cash flows for the periods indicated:
| | | | | | | | | | | | | | | | | | | | |
| | Year Ended March 31, |
| Cash Flows Provided by (Used in): | | 2024 | | 2023 | | 2022 |
| | (in thousands) |
| Operating activities, before changes in operating assets and liabilities | | $ | 324,993 | | | $ | 447,024 | | | $ | 342,362 | |
| Changes in operating assets and liabilities | | 51,171 | | | (1,838) | | | (136,516) | |
| Operating activities | | $ | 376,164 | | | $ | 445,186 | | | $ | 205,846 | |
| Investing activities | | $ | (83,761) | | | $ | 64,188 | | | $ | (212,408) | |
| Financing activities | | $ | (258,925) | | | $ | (507,765) | | | $ | 5,555 | |
Operating Activities. The decrease in net cash provided by operating activities during the year ended March 31, 2024 was due primarily to fluctuations in working capital, particularly accounts receivable and accounts payable, due to lower crude oil volumes and prices, and inventory due to decreased sales and purchases of natural gas liquids, and decreased earnings from operations. The increase in net cash provided by operating activities during the year ended March 31, 2023 was due primarily to fluctuations in working capital, particularly accounts receivable, inventory and accounts payable, during the year ended March 31, 2023 and increased earnings from operations.
Investing Activities. Net cash used in investing activities was $83.8 million during the year ended March 31, 2024, compared to net cash provided by investing activities of $64.2 million during the year ended March 31, 2023. The increase in net cash used in investing activities was due primarily to:
•an $88.4 million decrease in proceeds received due to higher proceeds received from the sale of certain assets and businesses primarily related to the sale of our marine assets and certain saltwater disposal assets in March 2023 compared to lower proceeds received from the sale of certain saltwater disposal assets and the sale of three natural gas liquids terminals during the year ended March 31, 2024 (see Note 17 to our consolidated financial statements included in this Annual Report);
•a $55.5 million increase in payments to settle derivatives; and
•an increase in capital expenditures from $147.8 million (includes payment of amounts accrued as of March 31, 2022) during the year ended March 31, 2023 to $152.3 million (includes payment of amounts accrued as of March 31, 2023) during the year ended March 31, 2024 due primarily to the timing of the expenditures in our Water Solutions segment.
Net cash provided by investing activities was $64.2 million during the year ended March 31, 2023, compared to net cash used in investing activities of $212.4 million during the year ended March 31, 2022. The decrease in net cash used in investing activities was due primarily to:
•a $206.5 million decrease in payments to settle derivatives; and
•a $75.6 million increase in proceeds received from the sale of certain assets and businesses primarily related to the sale of our marine assets and certain saltwater disposal assets in March 2023 and the sale of our interest in Sawtooth in June 2021 (see Note 2, Note 4 and Note 17 to our consolidated financial statements included in this Annual Report).
These decreases in net cash used in investing activities were partially offset by an increase in capital expenditures from $142.4 million (includes payment of amounts accrued as of March 31, 2021) during the year ended March 31, 2022 to $147.8 million (includes payment of amounts accrued as of March 31, 2022) during the year ended March 31, 2023 due primarily to the timing of the expenditures in our Water Solutions segment.
Financing Activities. Net cash used in financing activities was $258.9 million during the year ended March 31, 2024, compared to net cash used in financing activities of $507.8 million during the year ended March 31, 2023. The decrease in net cash used in financing activities was due primarily to:
•$2.9 billion in proceeds from the issuance of the 2029 Senior Secured Notes, 2032 Senior Secured Notes and Term Loan B during the year ended March 31, 2024; and
•payments on other long-term debt of $43.3 million on the outstanding balance on our equipment loan and a prepayment premium as we sold our marine assets in March 2023 (see Note 17 to our consolidated financial statements included in this Annual Report).
These decreases in net cash used in financing activities were partially offset by:
•an increase of $2.3 billion paid in cash to repurchase a portion of our 2025 Notes and redeem the remaining outstanding 2025 Notes, 2026 Notes and 2026 Senior Secured Notes during the year ended March 31, 2024;
•an increase of $177.9 million in distributions paid to our preferred unitholders and noncontrolling interest owners during the year ended March 31, 2024 due primarily to distributions to the holders of the Class B Preferred Units, the Class C Preferred Units and the Class D Preferred Units during the year ended March 31, 2024;
•a decrease of $160.0 million in borrowings on the ABL Facility (net of repayments) during the year ended March 31, 2024; and
•an increase of $49.9 million in debt issuance costs for the 2029 Senior Secured Notes, 2032 Senior Secured Notes, Term Loan B and ABL Facility during the year ended March 31, 2024.
Net cash used in financing activities was $507.8 million during the year ended March 31, 2023, compared to net cash provided by financing activities of $5.6 million during the year ended March 31, 2022. The increase in net cash used in financing activities was due primarily to:
•an increase of $396.1 million paid in cash to repurchase a portion of our Senior Unsecured Notes and redeem the remaining outstanding 2023 Notes during the year ended March 31, 2023;
•a decrease of $90.0 million in borrowings on the ABL Facility (net of repayments) during the year ended March 31, 2023; and
•payments on other long-term debt of $43.3 million on the outstanding balance on our equipment loan and a prepayment premium as we sold our marine assets in March 2023 (see Note 17 to our consolidated financial statements included in this Annual Report).
These increases in net cash used in financing activities were partially offset by:
•a decrease of $9.6 million in debt issuance costs for the ABL Facility during the year ended March 31, 2023; and
•a decrease of $5.0 million in payments on other long-term debt as the Sawtooth credit agreement was paid off and terminated prior to us selling our ownership interest in Sawtooth in June 2021.
Environmental Legislation
See Part I, Item 1–“Business–Government Regulation–Greenhouse Gas Regulation” for a discussion of proposed environmental legislation and regulations that, if enacted, could result in increased compliance and operating costs. However, at this time we cannot predict the structure or outcome of any future legislation or regulations or the eventual cost we could incur in compliance.
Recent Accounting Pronouncements
For a discussion of recent accounting pronouncements that are applicable to us, see Note 2 to our consolidated financial statements included in this Annual Report.
Critical Accounting Estimates
The preparation of financial statements and related disclosures in conformity with GAAP requires the selection and application of appropriate accounting principles to the relevant facts and circumstances of our operations and the use of estimates made by management. We have identified the following more critical judgment areas in the application of our accounting policies that are most important to the portrayal of our consolidated financial position and results of operations. The application of these accounting policies, which requires subjective or complex judgments regarding estimates and projected outcomes of future events, and changes in these accounting policies, could have a material effect on our consolidated financial statements.
Impairment of Goodwill
The goodwill relating to each of our reporting units is tested for impairment annually as well as when an event or change in circumstances indicates an impairment may have occurred. For each reporting unit, we perform a qualitative assessment of relevant events and circumstances about the likelihood of goodwill impairment. If it is deemed more likely than not that the fair value of the reporting unit is less than its carrying value, we calculate the fair value of the reporting unit. Otherwise, further testing is not required. The qualitative assessment is based on reviewing several factors, including macroeconomic conditions, industry and market considerations, cost factors, overall financial performance, other entity specific events (for example, changes in management) or other events such as selling or disposing of a reporting unit. The determination of a reporting unit’s fair value is predicated on our assumptions regarding the future economic prospects of the reporting unit. Such assumptions include (i) discrete financial forecasts for the assets contained within the reporting unit, which rely on management’s estimates of operating margins, (ii) long-term growth rates for cash flows beyond the discrete forecast period, (iii) appropriate discount rates and (iv) estimates of the cash flow multiples to apply in estimating the market value of our reporting units. An estimate of the sensitivity to changes in underlying assumptions of a fair value calculation is not practicable, given the numerous assumptions that can materially affect our estimates. If the fair value of the reporting unit (including its inherent goodwill) is less than its carrying value, an impairment loss is recognized to the extent that the implied fair value of the goodwill of the reporting unit is less than its carrying value, limited to the total amount of goodwill for the reporting unit. If future results are not consistent with our estimates, we could be exposed to future impairment losses that could be material to our results of operations. During the year ended March 31, 2024, we recorded a goodwill impairment of $69.2 million. We did not record a goodwill impairment during the years ended March 31, 2023 and 2022. See Note 5 to our consolidated financial statements included in this Annual Report for a further discussion of our goodwill impairment assessment.
Impairment of Long-Lived Assets
We evaluate the carrying value of our long-lived assets (property, plant and equipment and amortizable intangible assets) for potential impairment when events and circumstances warrant such a review. A long-lived asset group is considered impaired when the anticipated undiscounted future cash flows from the use and eventual disposition of the asset group is less than its carrying value. Individual assets are grouped at the lowest level for which the related identifiable cash flows are largely independent of the cash flows of other assets and liabilities. Estimates of future net cash flows include estimating future volumes, future margins or tariff rates, future operating costs and other estimates and assumptions consistent with our business
plans as well as external factors such as industry and economic trends. An estimate of the sensitivity to changes in underlying assumptions of a fair value calculation is not practicable, given the numerous assumptions that can materially affect our estimates. If the carrying value is not recoverable, an impairment loss is measured as the excess of the asset’s carrying value over its estimated fair value. When we cease to use an acquired trade name, we test the trade name for impairment using the relief from royalty method and we begin amortizing the trade name over its estimated useful life as a defensive asset. If future results are not consistent with our estimates, we could be exposed to future impairment losses that could be material to our results of operations. See Note 4 and Note 6 to our consolidated financial statements included in this Annual Report for a further discussion of our impairments of long-lived assets.
We evaluate our investments in unconsolidated entities for impairment whenever events or changes in circumstances indicate, in management’s judgment, that the fair value of such investment may have experienced a decline to less than its carrying value and the decline is other than temporary.
Depreciation and Amortization Methods and Estimated Useful Lives of Property, Plant and Equipment and Intangible Assets
Depreciation and amortization expense is the systematic write-off of the cost of our property, plant and equipment (net of residual or salvage value, if any) and the cost of our amortizable intangible assets to the results of operations for the quarterly and annual periods during which the assets are used. We depreciate our property, plant and equipment and amortize the majority of our intangible assets using the straight-line method, which results in our recording depreciation and amortization expense evenly over the estimated life of the individual asset. The estimate of depreciation and amortization expense requires us to make assumptions regarding the estimated useful lives and residual values of our assets. When we acquire and place our property, plant and equipment in service or acquire intangible assets, we develop assumptions about the estimated useful lives and residual values of such assets that we believe to be reasonable; however, circumstances may develop that could require us to change these assumptions in future periods, which would change our depreciation and amortization expense prospectively and have a material impact on our results of operations. Examples of such circumstances include changes in laws and regulations that limit the estimated economic life of an asset, changes in technology that render an asset obsolete, changes in expected salvage values or changes in customer attrition rates. See Note 2, Note 4 and Note 6 to our consolidated financial statements included in this Annual Report for a further discussion.
Derivative Financial Instruments
We record all derivative financial instrument contracts at fair value in our consolidated balance sheets except for normal purchase and normal sale transactions that are expected to result in physical delivery. All changes in the fair value of our physical contracts that do not qualify as normal purchases and normal sales and settlements (whether cash transactions or non-cash mark-to-market adjustments) are reported either within revenue (for sales contracts) or cost of sales (for purchase contracts) in our consolidated statements of operations, regardless of whether the contract is physically or financially settled, and within cash flows from operations in our consolidated statements of cash flows. The change in the fair value of our interest rate swap is recorded as a net gain or loss within interest expense in our consolidated statement of operations and within cash flows from operations in our consolidated statements of cash flows. We determine the fair value of our exchange traded derivative financial instruments utilizing publicly available prices, and for non-exchange traded derivative financial instruments, we utilize pricing models for similar instruments including publicly available prices and forward curves generated from a compilation of data gathered from third parties. Actual amounts could vary materially from estimated fair values due to changes in market prices. In addition, changes in the methods or assumptions used to determine the fair value of our derivative financial instruments could have a material effect on our consolidated financial statements. See “Item 7A. Quantitative and Qualitative Disclosures About Market Risk–Commodity Price Risk” for the impact of a 10% increase in the underlying commodity value, “Item 7A. Quantitative and Qualitative Disclosures About Market Risk–Interest Rate Risk” for the impact of a 10% increase in the underlying interest rate swap value and Note 2 and Note 10 to our consolidated financial statements included in this Annual Report for a further discussion of our derivative financial instruments.
Revenue Recognition
Our Water Solutions segment has certain long-term contracts with customers that include variable consideration that must be estimated at contract inception and re-assessed at each reporting period. Total consideration for these arrangements is recognized as revenue over the applicable contract period and is based on our measure of satisfaction of our corresponding performance obligation, and the difference in timing of revenue recognition and billings results in contract assets and liabilities. The estimated performance obligation over the life of a contract includes significant judgments by management including volume and forecasted production information. Changes in these assumptions or a contract modification could have a material
effect on the amount of variable consideration recognized as revenue. See Note 14 to our consolidated financial statements included in this Annual Report for a further discussion of our revenue recognition policies.
Asset Retirement Obligations
We have contractual and regulatory obligations at certain facilities for which we have to perform remediation, dismantlement or removal activities when the assets are retired. Our largest asset retirement obligations involve the abandonment or removal of pipelines and saltwater and freshwater disposal wells. We are required to recognize the fair value of a liability for an asset retirement obligation if a reasonable estimate of fair value can be made. In order to determine the fair value of such a liability, we must make certain estimates and assumptions including, among other things, projected cash flows, the estimated timing of retirement, a credit-adjusted risk-free interest rate, and an assessment of market conditions, which could significantly impact the estimated fair value of the asset retirement obligation. Most of these asset retirement obligations are many years, or decades, in the future and the contracts and regulations often have vague descriptions of what removal practices and criteria must be met when the removal event actually occurs. These estimates and assumptions are very subjective and can vary over time. Our consolidated balance sheet at March 31, 2024 includes a liability of $56.6 million related to asset retirement obligations, which is reported within other noncurrent liabilities.
In addition to the obligations described above, we may be obligated to remove facilities or perform other remediation upon retirement of certain other assets. However, the fair value of the asset retirement obligation cannot currently be reasonably estimated because the settlement dates are indeterminable. We will record an asset retirement obligation for these assets in the periods in which settlement dates are reasonably determinable.
Acquisitions
Fair values of assets acquired and liabilities assumed are based upon available information and may involve engaging an independent third party to perform an appraisal. Estimating fair values can be complex and subject to significant business judgment. We must also identify and include in the allocation all acquired tangible and intangible assets that meet certain criteria, including assets that were not previously recorded by the acquired entity. The estimates most commonly involve property, plant and equipment and intangible assets, including those with indefinite lives. The estimates also include the fair value of contracts including commodity purchase and sale agreements, storage contracts, and transportation contracts. The judgments made in the determination of the estimated fair value assigned to the assets acquired, the liabilities assumed and any noncontrolling interest in the investee, as well as the estimated useful life of each asset and the duration of each liability, can materially impact the financial statements in periods after the acquisition, such as through depreciation and amortization expense. While we believe we have made reasonable assumptions to calculate the fair value, if future results are not consistent with our estimates, we could be exposed to future impairment losses that could be material to our results of operations. For a business combination, the excess of the purchase price over the net fair value of acquired assets and assumed liabilities is recorded as goodwill, which is not amortized but instead is evaluated for impairment at least annually. Pursuant to GAAP, an entity is allowed a reasonable period of time (not to exceed one year) to obtain the information necessary to identify and measure the fair value of the assets acquired and liabilities assumed in a business combination.
Inventories
Our inventories consist of crude oil, natural gas liquids, diesel and biodiesel. Our inventories are valued at the lower of cost or net realizable value, with cost determined using either the weighted-average cost or the first in, first out (FIFO) methods, including the cost of transportation and storage, and with net realizable value defined as the estimated selling price in the ordinary course of business, less reasonably predictable costs of completion, disposal, and transportation. In performing this analysis, we consider fixed-price forward commitments. At the end of each fiscal year, we also perform a “lower of cost or net realizable value” analysis; if the cost basis of the inventories would not be recoverable based on the net realizable value at the end of the year, we reduce the book value of the inventories to the recoverable amount. When performing this analysis during interim periods within a fiscal year, accounting standards do not require us to record a lower of cost or net realizable value write-down if we expect the net realizable value to recover by our fiscal year end. The net realizable values of these commodities change on a daily basis as supply and demand conditions change. We are unable to control changes in the net realizable value of these commodities and are unable to determine whether write-downs will be required in future periods.
Item 7A. Quantitative and Qualitative Disclosures About Market Risk
Interest Rate Risk
A portion of our long-term debt is variable-rate debt. Changes in interest rates impact the interest payments of our variable-rate debt but generally do not impact the fair value of the liability. Conversely, changes in interest rates impact the fair value of our fixed-rate debt but do not impact its cash flows.
The ABL Facility is variable-rate debt with interest rates that are generally indexed to the prime rate or SOFR. At March 31, 2024, there were no borrowings under the ABL Facility.
The Term Loan B is variable-rate debt with interest rates that are generally indexed to the SOFR. At March 31, 2024, there was $700.0 million of outstanding borrowings under the Term Loan B at a weighted average interest rate of 5.33% plus a margin of 4.50%. A change in interest rates of 0.125% would result in an increase or decrease of our annual interest expense of $0.9 million, based on borrowings outstanding at March 31, 2024.
In March 2024, we entered into a $200.0 million interest rate swap to reduce the variability of cash outflows associated with our floating-rate, SOFR-based borrowings, including borrowings on the Term Loan B. An increase of 10% in the value of the underlying interest rate swap would result in a net change in the fair value of our interest rate swap of $0.1 million at March 31, 2024.
The current distribution rate for the Class B Preferred Units is a floating rate of the three-month London Interbank Offered Rate (“LIBOR”) interest rate (5.3314% for the quarter ended March 31, 2024) plus a spread of 7.213%. A change in interest rates of 0.125% would result in an increase or decrease of our Class B Preferred Unit distribution of $0.1 million, based on the Class B Preferred Units outstanding at March 31, 2024. Effective July 3, 2023, the reference to LIBOR in the formulation for the distribution rate in these securities was replaced with three-month CME Term SOFR, as calculated and published by CME Group Benchmark Administration, Ltd., plus a tenor spread adjustment of 0.26161% in accordance with the Adjustable Interest Rate (LIBOR) Act (“LIBOR Act”), and the rules implementing the LIBOR Act.
On April 15, 2024, the distributions for the Class C Preferred Units will accumulate at a percentage of the $25.00 liquidation preference equal to the applicable three-month LIBOR interest rate (or alternative rate as determined in accordance with our amended and restated limited partnership agreement (“Partnership Agreement”)) plus a spread of 7.384%. On or after July 1, 2024, the holders of our Class D Preferred Units can elect, from time to time, for the distributions to be calculated based on a floating rate equal to the applicable three-month LIBOR interest rate (or alternative rate as determined in accordance with our Partnership Agreement) plus a spread of 7.00% (“Class D Variable Rate”, as defined in our Partnership Agreement). Each Class D Variable Rate election shall be effective for at least four quarters following such election.
Commodity Price Risk
Our operations are subject to certain business risks, including commodity price risk. Commodity price risk is the risk that the market value of crude oil, natural gas liquids, or refined and renewables products will change, either favorably or unfavorably, in response to changing market conditions. Procedures and limits for managing commodity price risks are specified in our market risk policy. Open commodity positions and market price changes are monitored daily and are reported to senior management and to marketing operations personnel.
The crude oil, natural gas liquids, and refined and renewables products industries are “margin-based” and “cost-plus” businesses in which our realized margins depend on the differential of sales prices over our supply costs. We have no control over market conditions. As a result, our profitability may be impacted by sudden and significant changes in the price of crude oil, natural gas liquids, and refined and renewables products.
We engage in various types of forward contracts and financial derivative transactions to reduce the effect of price volatility on our product costs, to protect the value of our inventory positions, and to help ensure the availability of product during periods of short supply. We attempt to balance our contractual portfolio by purchasing volumes when we have a matching purchase commitment from our wholesale and retail customers. We may experience net unbalanced positions from time to time. In addition to our ongoing policy to maintain a balanced position, for accounting purposes we are required, on an ongoing basis, to track and report the market value of our derivative portfolio.
Although we use financial derivative instruments to reduce the market price risk associated with forecasted transactions, we do not account for financial derivative transactions as hedges. All changes in the fair value of our physical
contracts that do not qualify as normal purchases and normal sales and settlements (whether cash transactions or non-cash mark-to-market adjustments) are reported either within revenue (for sales contracts) or cost of sales (for purchase contracts) in our consolidated statements of operations, regardless of whether the contract is physically or financially settled, and within cash flows from operations in our consolidated statements of cash flows. See “Item 7. Management’s Discussion and Analysis of Financial Condition and Results of Operations–Critical Accounting Estimates” for a discussion of how we determine the fair value of our financial derivative instruments.
The following table summarizes the hypothetical impact on the March 31, 2024 fair value of our commodity derivatives of an increase of 10% in the value of the underlying commodity (in thousands):
| | | | | |
| Increase
(Decrease)
To Fair Value |
| Crude oil (Water Solutions segment) | $ | (1,504) | |
| Crude oil (Crude Oil Logistics segment) | $ | (152) | |
| Propane (Liquids Logistics segment) | $ | (1,432) | |
| Butane (Liquids Logistics segment) | $ | (6,186) | |
| Refined Products (Liquids Logistics segment) | $ | (2,867) | |
| Other Products (Liquids Logistics segment) | $ | (912) | |
| Canadian dollars (Liquids Logistics segment) | $ | 124 | |
Changes in commodity prices may also impact the volumes that we are able to transport, dispose, store and market, which also impact our cash flows.
Credit Risk
Our operations are also subject to credit risk, which is the risk of loss from nonperformance by suppliers, customers or financial counterparties to a contract. Procedures and limits for managing credit risk are specified in our credit policy. Credit risk is monitored daily and we try to minimize exposure through the following:
•requiring certain customers to prepay or place deposits for our products and services;
•requiring certain customers to post letters of credit or other forms of surety;
•monitoring individual customer receivables relative to previously-approved credit limits;
•requiring certain customers to take delivery of their contracted volume ratably rather than allow them to take delivery at their discretion;
•entering into master netting agreements that allow for offsetting counterparty receivable and payable balances for certain transactions;
•reviewing the receivable aging regularly to identify issues or trends that may develop; and
•requiring marketing personnel to manage their customers’ receivable position and suspend sales to customers that have not timely paid outstanding invoices.
At March 31, 2024, our primary counterparties were retailers, resellers, energy marketers, producers, refiners, and dealers.
Item 8. Financial Statements and Supplementary Data
Our consolidated financial statements beginning on page F-1 of this Annual Report, together with the report of Grant Thornton LLP, our independent registered public accounting firm, are incorporated by reference into this Item 8.
Item 9. Changes in and Disagreements with Accountants on Accounting and Financial Disclosure
None.
Item 9A. Controls and Procedures
Evaluation of Disclosure Controls and Procedures
We maintain disclosure controls and procedures, as defined in Rule 13(a)-15(e) and 15(d)-15(e) of the Securities Exchange Act of 1934, as amended (“Exchange Act”), that are designed to ensure the information required to be disclosed in our filings and submissions under the Exchange Act is recorded, processed, summarized and reported within the periods specified in the rules and forms of the Securities and Exchange Commission (“SEC”) and that such information is accumulated and communicated to our management, including the principal executive officer and principal financial officer of our GP, as appropriate, to allow timely decisions regarding required disclosure.
We completed an evaluation under the supervision and with participation of our management, including the principal executive officer and principal financial officer of our GP, of the effectiveness of the design and operation of our disclosure controls and procedures at March 31, 2024. Based on this evaluation, the principal executive officer and principal financial officer of our GP have concluded that as of March 31, 2024, such disclosure controls and procedures were effective.
Management’s Report on Internal Control Over Financial Reporting
The management of our Delaware limited partnership (“Partnership”) and subsidiaries is responsible for establishing and maintaining adequate internal control over financial reporting, as such term is defined in Exchange Act Rule 13(a)-15(f). Under the supervision and with the participation of our management, including the Chief Executive Officer and Chief Financial Officer of our general partner, we conducted an evaluation of the effectiveness of our internal control over financial reporting based on the framework in the 2013 Internal Control-Integrated Framework issued by the Committee of Sponsoring Organizations of the Treadway Commission, or the COSO framework.
Based on our evaluation under the COSO framework, our management concluded that our internal control over financial reporting was effective as of March 31, 2024.
Our internal control over financial reporting as of March 31, 2024 has been audited by Grant Thornton LLP, an independent registered public accounting firm, as stated in their report, which appears below in this section of the Annual Report.
Changes in Internal Control Over Financial Reporting
There have been no changes in our internal controls over financial reporting (as defined in Rule 13(a)-15(f) of the Exchange Act) during the three months ended March 31, 2024 that have materially affected, or are reasonably likely to materially affect, our internal controls over financial reporting.
REPORT OF INDEPENDENT REGISTERED PUBLIC ACCOUNTING FIRM
Board of Directors of NGL Energy Holdings LLC and
Unitholders of NGL Energy Partners LP
Opinion on internal control over financial reporting
We have audited the internal control over financial reporting of NGL Energy Partners LP (a Delaware limited partnership) and subsidiaries (the “Partnership”) as of March 31, 2024, based on criteria established in the 2013 Internal Control—Integrated Framework issued by the Committee of Sponsoring Organizations of the Treadway Commission (“COSO”). In our opinion, the Partnership maintained, in all material respects, effective internal control over financial reporting as of March 31, 2024, based on criteria established in the 2013 Internal Control—Integrated Framework issued by COSO.
We also have audited, in accordance with the standards of the Public Company Accounting Oversight Board (United States) (“PCAOB”), the consolidated financial statements of the Partnership as of and for the year ended March 31, 2024, and our report dated June 6, 2024 expressed an unqualified opinion on those financial statements.
Basis for opinion
The Partnership’s management is responsible for maintaining effective internal control over financial reporting and for its assessment of the effectiveness of internal control over financial reporting, included in the accompanying Management’s Report on Internal Control Over Financial Reporting. Our responsibility is to express an opinion on the Partnership’s internal control over financial reporting based on our audit. We are a public accounting firm registered with the PCAOB and are required to be independent with respect to the Partnership in accordance with the U.S. federal securities laws and the applicable rules and regulations of the Securities and Exchange Commission and the PCAOB.
We conducted our audit in accordance with the standards of the PCAOB. Those standards require that we plan and perform the audit to obtain reasonable assurance about whether effective internal control over financial reporting was maintained in all material respects. Our audit included obtaining an understanding of internal control over financial reporting, assessing the risk that a material weakness exists, testing and evaluating the design and operating effectiveness of internal control based on the assessed risk, and performing such other procedures as we considered necessary in the circumstances. We believe that our audit provides a reasonable basis for our opinion.
Definition and limitations of internal control over financial reporting
A company’s internal control over financial reporting is a process designed to provide reasonable assurance regarding the reliability of financial reporting and the preparation of financial statements for external purposes in accordance with generally accepted accounting principles. A company’s internal control over financial reporting includes those policies and procedures that (1) pertain to the maintenance of records that, in reasonable detail, accurately and fairly reflect the transactions and dispositions of the assets of the company; (2) provide reasonable assurance that transactions are recorded as necessary to permit preparation of financial statements in accordance with generally accepted accounting principles, and that receipts and expenditures of the company are being made only in accordance with authorizations of management and directors of the company; and (3) provide reasonable assurance regarding prevention or timely detection of unauthorized acquisition, use, or disposition of the company’s assets that could have a material effect on the financial statements.
Because of its inherent limitations, internal control over financial reporting may not prevent or detect misstatements. Also, projections of any evaluation of effectiveness to future periods are subject to the risk that controls may become inadequate because of changes in conditions, or that the degree of compliance with the policies or procedures may deteriorate.
| | | | | |
| /s/ GRANT THORNTON LLP | |
| |
| Tulsa, Oklahoma | |
| June 6, 2024 | |
Item 9B. Other Information
During the three months ended March 31, 2024, no director or officer of the Partnership adopted or terminated a “Rule 10b5-1 trading arrangement” or “non-Rule 10b5-1 trading arrangement,” as each term is defined in Item 408(a) of Regulation S-K.
Item 9C. Disclosure Regarding Foreign Jurisdictions that Prevent Inspections
Not applicable.
PART III
Item 10. Directors, Executive Officers and Corporate Governance
Board of Directors of our General Partner
NGL Energy Holdings LLC, our general partner (“GP”), manages our operations and activities on our behalf through its directors and executive officers. Unitholders are not entitled to elect the directors of our GP or directly or indirectly participate in our management or operations. The NGL Energy GP investor group, which includes 43 individuals and entities that own all of the outstanding membership interests in our GP (“NGL Energy GP Investor Group”), appoints all members to the board of directors of our GP.
The board of directors of our GP currently has seven members. The board of directors of our GP has determined that Mr. James M. Collingsworth, Mr. Bryan K. Guderian and Mr. Derek S. Reiners satisfy the New York Stock Exchange (“NYSE”) and Securities and Exchange Commission (“SEC”) independence requirements. The NYSE does not require a listed publicly traded limited partnership like NGL to have a majority of independent directors on the board of directors of its general partner. In addition, we are not required to have a nominating and corporate governance committee.
In evaluating director candidates, the NGL Energy GP Investor Group assesses whether a candidate possesses the integrity, judgment, knowledge, experience, skill and expertise that are likely to enhance the ability of the board of directors of our GP to manage and direct our affairs and business, including, when applicable, to enhance the ability of committees of the board to fulfill their duties. Our GP has no minimum qualifications for director candidates. In general, however, the NGL Energy GP Investor Group reviews and evaluates both incumbent and potential new directors in an effort to achieve diversity of skills and experience among the directors of our GP and in light of the following criteria:
•experience in business, government, education, technology or public interests;
•high-level managerial experience in large organizations;
•breadth of knowledge regarding our business and industry;
•specific skills, experience or expertise related to an area of importance to us, such as energy production, consumption, distribution or transportation, government, policy, finance or law;
•moral character and integrity;
•commitment to our unitholders’ interests;
•ability to provide insights and practical wisdom based on experience and expertise;
•ability to read and understand financial statements; and
•ability to devote the time necessary to carry out the duties of a director, including attendance at meetings and consultation on partnership matters.
Although our GP does not have a formal policy in regard to the consideration of diversity in identifying director nominees, qualified candidates for nomination to the board are considered without regard to race, color, religion, gender, ancestry or national origin.
Directors and Named Executive Officers
Directors of our GP are appointed by the NGL Energy GP Investor Group and hold office until their successors have been duly elected and qualified or until the earlier of their death, resignation, removal or disqualification. Named executive officers are appointed by, and serve at the discretion of, the board of directors of our GP. The following table summarizes information regarding the directors of our GP and our named executive officers as of June 4, 2024.
| | | | | | | | | | | | | | |
| Name | | Age | | Position with NGL Energy Holdings LLC |
| H. Michael Krimbill | | 70 | | Chief Executive Officer and Director |
| Bradley P. Cooper | | 48 | | Executive Vice President and Chief Financial Officer |
| Jennifer L. Kingham | | 52 | | Executive Vice President and Chief Information Officer |
| Kurston P. McMurray | | 52 | | Executive Vice President and General Counsel and Secretary |
| Lawrence J. Thuillier | | 53 | | Chief Accounting Officer |
| Shawn W. Coady | | 62 | | Director |
| James M. Collingsworth | | 69 | | Director |
| Bryan K. Guderian | | 64 | | Director |
| John T. Raymond | | 53 | | Director |
| Derek S. Reiners | | 53 | | Director |
| Randall S. Wade | | 54 | | Director |
H. Michael Krimbill. Mr. Krimbill has served as our Chief Executive Officer since October 2010 and as a member of the board of directors of our GP since its formation in September 2010. Mr. Krimbill was the President and Chief Financial Officer of Energy Transfer Partners, L.P. from 2004 until his resignation in January 2007. Mr. Krimbill joined Heritage Propane Partners, L.P., the predecessor of Energy Transfer Partners, L.P., as Vice President and Chief Financial Officer in 1990. Mr. Krimbill was President of Heritage Propane Partners, L.P. from 1999 to 2000 and President and Chief Executive Officer of Heritage Propane Partners, L.P. from 2000 to 2005. Mr. Krimbill also served as a director of Energy Transfer Equity, the general partner of Energy Transfer Partners, L.P., from 2000 to January 2007, Williams Partners L.P. from 2007 to September 2012, and Pacific Commerce Bank from January 2011 to March 2015.
Mr. Krimbill brings leadership, oversight and financial experience to the board. Mr. Krimbill provides expertise in managing and operating a publicly traded partnership, including substantial expertise in successfully acquiring and integrating midstream businesses. Mr. Krimbill also brings financial expertise to the board, including his prior service as a chief financial officer. Mr. Krimbill’s experience serving on other public company boards is also a valuable asset to the board of directors of our GP.
Bradley P. Cooper. Mr. Cooper has served as our Executive Vice President and Chief Financial Officer since January 13, 2023. Mr. Cooper served as our Senior Vice President, Administration and Risk from June 2021, when he joined NGL, to January 2023. Mr. Cooper spent 10 years with WPX Energy, Inc. (“WPX”) where he was Vice President of Finance and Treasurer. Prior to WPX, he was at The Williams Companies (“Williams”) where he held various corporate finance and risk management leadership roles.
Jennifer L. Kingham. Ms. Kingham has served as our Executive Vice President and Chief Information Officer since March 2024. Ms. Kingham served as our Senior Vice President and Chief Information Officer from February 2018 to March 2024 and as our Chief Information Officer from April 2014 to February 2018. Prior to joining NGL, Ms. Kingham was the Chief Information Officer and held Information Technology (“IT”) Audit Management positions at a professional advisory firm for nine years. Additionally, Ms. Kingham spent nine years of her career at Williams in various IT technical and successive management positions.
Kurston P. McMurray. Mr. McMurray has served as our Executive Vice President and General Counsel and Secretary since October 2016. Mr. McMurray joined NGL in February 2015 as Vice President, Legal and Corporate Secretary. Prior to joining NGL, Mr. McMurray practiced law in the Tulsa, Oklahoma area since 1998 at firms including Moyers, Martin, Santee, Imel & Tetrick LLP. and Robinett & Osmond and was a founding shareholder of Kurston P. McMurray, PC and Wilkin/McMurray PLLC. Mr. McMurray’s private practice specialized in business transactions, real estate, construction, healthcare, banking, corporate governance, corporate management and commercial litigation.
Lawrence J. Thuillier. Mr. Thuillier has served as our Chief Accounting Officer since January 2016. Prior to joining NGL, Mr. Thuillier served in various roles at Eagle Rock Energy Partners, L.P. from December 2007 through October 2015, most recently as Vice President of Financial Reporting and Corporate Controller. Mr. Thuillier served as Assistant Corporate
Controller for Exterran Holdings, Inc. (formerly Universal Compression) from November 2006 through November 2007. Prior to that, Mr. Thuillier served in various roles at Deloitte & Touche LLP, most recently as Audit Senior Manager.
Shawn W. Coady. Dr. Coady served as our President and Chief Operating Officer, Retail Division, from April 2012 to March 2018, when we sold a portion of our Retail Propane segment to DCC LPG (“DCC”), and previously served as our Co-President and Chief Operating Officer, Retail Division from October 2010 through April 2012. Dr. Coady served as an executive officer of DCC from April 2018 until his retirement in December 2020. Dr. Coady served as a member of the board of directors of our GP since its formation in September 2010. Dr. Coady has served as an officer of Hicks Oils & Hicksgas, Incorporated (“HOH”), from March 1989 to September 2010 when HOH contributed its propane and propane related assets to Hicksgas LLC, and the membership interests in Hicksgas LLC were contributed to us as part of our formation transactions. Dr. Coady was also the President of Hicksgas Gifford, Inc. from March 1989 until the membership interests in the company were contributed to us as part of our formation transactions. Dr. Coady has served as a director for the National Propane Gas Association from 2004 to 2015 and as a member of the executive committee of the Illinois Propane Gas Association from 2004 to March 2015.
Dr. Coady brings valuable operational experience to the board. Dr. Coady has over 25 years of experience in the retail propane industry, and provides expertise in both acquisition and organic growth strategies. Dr. Coady also provides insight into developments and trends in the propane industry through his leadership roles in industry associations.
James M. Collingsworth. Mr. Collingsworth has served on the board of directors of our GP since January 2015. Mr. Collingsworth previously served as a Senior Vice President of the general partner of Enterprise Products Partners L.P. from November 2001 through January 2014. Prior to that, Mr. Collingsworth served as a board member of Texaco Canada Petroleum Inc. from July 1998 to October 2001 and was employed by Texaco from 1991 to 2001 in various management positions, including Senior Vice President of NGL Assets and Business Services from July 1998 to October 2001. Prior to joining Texaco, Mr. Collingsworth was director of feedstocks for Rexene Petrochemical Company from 1988 to 1991 and served in the MAPCO, Inc. organization from 1973 to 1988 in various capacities, including customer service and business development manager of the Mid-America and Seminole pipelines. Mr. Collingsworth served as a director of American Ethane Co. Mr. Collingsworth currently serves on the board of directors of Martin Midstream Partners L.P.
Mr. Collingsworth brings a wealth of in-depth industry experience to the board. Mr. Collingsworth has worked in all facets of the midstream and petrochemical industry for more than 40 years.
Bryan K. Guderian. Mr. Guderian joined the board of directors of our GP in May 2012. Mr. Guderian currently serves as a Principal of BKG Consulting LLC, an energy related consulting firm. Mr. Guderian has served as Executive Vice President of Business Development of WPX from February 2018 until his retirement in January 2021. Mr. Guderian served as Senior Vice President of Business Development of WPX from October 2014 to February 2018 and as Senior Vice President of Operations of WPX from August 2011 to October 2014. Mr. Guderian previously served as Vice President of the Exploration & Production unit of Williams from 1998 until August 2011, where he had responsibility for overseeing international operations. Mr. Guderian served as a director of Apco Oil & Gas International Inc., from 2002 to 2015 and as a director of Petrolera Entre Lomas S.A. from 2003 to 2015.
Mr. Guderian brings considerable upstream experience to the board including executive, operational and financial expertise from 40 years of petroleum industry involvement, the majority of which has been focused in exploration and production.
John T. Raymond. Mr. Raymond joined the board of directors of our GP in August 2013. Mr. Raymond is the Founder and Majority Owner of The Energy & Minerals Group (“EMG”) of which he has been a Managing Partner and the Chief Executive Officer since its September 2006 inception. Mr. Raymond has held executive leadership positions with various energy companies, including President and Chief Executive Officer of Plains Resources Inc. (the predecessor entity of Vulcan Energy Corporation), President and Chief Operating Officer of Plains Exploration and Production Company and was a Director of Plains All American Pipeline, LP. Mr. Raymond also currently serves as a director of Ferus Inc., Ferus Natural Gas Fuels Inc., MarkWest Utica EMG, LLC, Medallion Midstream, LLC and PAA GP Holdings LLC. Mr. Raymond manages various private investments through personally held Lynx Holdings, LLC.
Mr. Raymond brings extensive financial and industry experience to the board. As a director for other public companies, Mr. Raymond also provides cross board experience.
Derek S. Reiners. Mr. Reiners joined the board of directors of our GP in December 2019. Mr. Reiners currently serves as the President of Contango Energy Capital LLC, a privately held investment and consulting firm. Prior to that, Mr. Reiners
served in various senior financial and accounting roles at ONEOK, Inc. and ONEOK Partners, L.P. from August 2009 to May 2019, including Senior Vice President and Chief Accounting Officer from August 2009 to December 2012, Senior Vice President, Chief Financial Officer and Treasurer from January 2013 to May 2017 and Senior Vice President, Finance and Treasurer from June 2017 to May 2019. Prior to joining ONEOK, Mr. Reiners was a partner at Grant Thornton LLP from August 2004 to July 2009. Mr. Reiners currently serves on the board of directors of a community bank in Oklahoma. Mr. Reiners is a certified public accountant.
Mr. Reiners brings extensive executive, financial and operational experience to the board. With over ten years of experience in the natural gas liquids industry in numerous positions, Mr. Reiners provides valuable insight into our business and industry.
Randall S. Wade. Mr. Wade has served on the board of directors of our GP since February 2021. Mr. Wade is the President of EIG Global Energy Partners (“EIG”) and a member of its Investment and Executive Committees. He has broad involvement in the firm’s various activities including investments, investor relations, operations and strategic initiatives. Since joining EIG in 1996, Mr. Wade has filled various roles including Chief Operating Officer, head of the direct lending strategy, investment principal with coverage responsibility for Australia and an analyst for the oil and gas team. Prior to joining EIG, Mr. Wade was a Commercial Lending Officer for First Interstate Bank of Texas, where he was responsible for developing a middle-market loan portfolio.
Mr. Wade brings extensive financial and industry experience to the board.
Director Appointment Rights
The Limited Liability Company Agreement of NGL Energy Holdings LLC grants certain parties the right to designate a specified number of persons to serve on the board of directors of our GP. EMG NGL HC LLC has the right to designate one person to serve on the board of directors of our GP, and has designated John T. Raymond. EIG has the right to designate one person to serve on the board of directors of our GP, and has designated Randall S. Wade. The Coady Group (which consists of certain entities controlled by Shawn W. Coady and his brother Todd M. Coady) and the investors who formed the Partnership (“IEP Parties”) (which consists of certain entities controlled by H. Michael Krimbill, and two other investors) each have the right to designate one person to serve on the board of directors of our GP. The Coady Group has designated Shawn W. Coady and the IEP Parties have designated H. Michael Krimbill.
Board Leadership Structure and Role in Risk Oversight
The board of directors of our GP believes that whether the offices of chairman of the board and chief executive officer are combined or separated should be decided by the board, from time to time, in its business judgment after considering relevant circumstances. The board of directors of our GP currently does not have a chairman, although our chief executive officer, Mr. Krimbill, presides over the meetings.
The board of directors of our GP and its committees regularly review material operational, financial, compensation and compliance risks with senior management. In particular, the audit committee is responsible for risk oversight with respect to financial and compliance risks and risks relating to our audit and independent registered public accounting firm. Our compensation committee considers risk in connection with its design and evaluation of compensation programs for our senior management. Each committee regularly reports to the board of directors of our GP regarding its respective risk oversight role.
Audit Committee
The board of directors of our GP has established an audit committee. The audit committee assists the board in its oversight of the integrity of our financial statements and our compliance with legal and regulatory requirements and partnership policies and controls. The audit committee has the sole authority to, among other things:
•retain and terminate our independent registered public accounting firm;
•approve all auditing services and related fees and the terms thereof performed by our independent registered public accounting firm; and
•establish policies and procedures for the pre-approval of all non-audit services and tax services to be rendered by our independent registered public accounting firm.
The audit committee is also responsible for confirming the independence and objectivity of our independent registered public accounting firm. Our independent registered public accounting firm is given unrestricted access to the audit committee and our management, as necessary.
Mr. Collingsworth, Mr. Guderian and Mr. Reiners currently serve on the audit committee, and Mr. Reiners serves as the chairman. The board of directors of our GP has determined that Mr. Reiners is an “audit committee financial expert” as defined under SEC rules and that each member of the audit committee is financially literate. In compliance with the requirements of the NYSE, all of the members of the audit committee are independent directors, as defined in the applicable NYSE and Exchange Act rules.
Compensation Committee
The board of directors of our GP has established a compensation committee. The compensation committee’s responsibilities include the following, among others:
•establishing the GP’s compensation philosophy and objectives;
•approving the compensation of the Chief Executive Officer and other officers;
•making recommendations to the board of directors with respect to the directors; and
•reviewing and making recommendations to the board of directors with respect to incentive compensation and equity-based compensation plans.
Mr. Collingsworth, Mr. Guderian and Mr. Reiners currently serve on the compensation committee, and Mr. Guderian serves as the chairman. The board of directors of our GP has determined that Mr. Collingsworth, Mr. Guderian and Mr. Reiners are independent directors, as defined in the applicable NYSE and Exchange Act rules.
Corporate Governance
The board of directors of our GP has adopted a Code of Ethics for the Chief Executive Officer and Senior Financial Officers, or Code of Ethics, which applies to the Chief Executive Officer, Chief Financial Officer, Chief Accounting Officer, Corporate Controller and all other senior financial and accounting officers of our GP. Amendments to or waivers from the Code of Ethics will be disclosed on our website. The board of directors of our GP has also adopted Corporate Governance Guidelines that outline important policies and practices regarding our governance and a Code of Business Conduct and Ethics that applies to the directors, officers and employees of our GP and the Partnership.
We make available free of charge, within the “Governance” section of our website at www.nglenergypartners.com/governance, and in print to any unitholder who so requests, the Code of Ethics, the Corporate Governance Guidelines, the Code of Business Conduct and Ethics and the charters of the audit committee and the compensation committee of the board of directors of our GP. Requests for print copies may be directed to Investor Relations at investorinfo@nglep.com or to Investor Relations, NGL Energy Partners LP, 6120 South Yale Avenue, Suite 1300, Tulsa, Oklahoma 74136 or made by telephone at (918) 481-1119. The information contained on, or connected to, our website is not incorporated by reference into this Annual Report and should not be considered part of this or any other report that we file with or furnish to the SEC.
Insider Trading
The board of directors of our GP has adopted insider trading policies and procedures governing the purchase, sale and other dispositions of our securities by directors, officers and employees, or by us, that are reasonably designed to promote compliance with insider trading laws, rules, and regulations, and any listing standards applicable to us. Our insider trading policies have been filed as Exhibit 19.1 and Exhibit 19.2 to this Annual Report.
Meeting of Non-Management Directors and Communications with Directors
At each quarterly meeting of the audit committee and/or the board of directors of our GP, our independent directors meet in an executive session without participation by management or non-independent directors. Mr. Reiners presides over these executive sessions.
Unitholders or interested parties may communicate directly with the board of directors of our GP, any committee of the board, any independent directors, or any one director, by sending written correspondence by mail addressed to the board,
committee or director to the attention of our Secretary at the following address: Name of the Director(s), c/o Secretary, NGL Energy Partners LP, 6120 South Yale Avenue, Suite 1300, Tulsa, Oklahoma 74136. Communications are distributed to the board, committee, or director as appropriate, depending on the facts and circumstances outlined in the communication.
Item 11. Executive Compensation
Compensation Discussion and Analysis
The year “2024” in the Compensation Discussion and Analysis and the summary compensation table refers to our fiscal year ended March 31, 2024.
Introduction
The board of directors of our GP has responsibility and authority for compensation-related decisions for our executive officers. The board of directors of our GP has formed a compensation committee to develop our compensation program and to approve the compensation of the Chief Executive Officer and other officers. Our executive officers are also officers of our operating companies. While we reimburse our GP and its affiliates for all expenses they incur on our behalf, our executive officers do not receive any additional compensation for the services they provide to our GP.
Our “named executive officers” for fiscal year 2024 were:
•H. Michael Krimbill–Chief Executive Officer
•Bradley P. Cooper–Executive Vice President and Chief Financial Officer
•Lawrence J. Thuillier–Chief Accounting Officer
•Kurston P. McMurray–Executive Vice President and General Counsel and Secretary
•Jennifer L. Kingham–Executive Vice President and Chief Information Officer
Compensation Philosophy
Our compensation philosophy emphasizes pay-for-performance, focused primarily on the ability to reinstate sustainable quarterly distributions to our unitholders. Pay-for-performance is based on a combination of our performance and the individual executive officer’s contribution to our performance. We believe this pay-for-performance approach generally aligns the interests of our executive officers with the interests of our unitholders, and at the same time enables us to maintain a lower level of cash compensation expense in the event our operating and financial performance do not meet our expectations.
Our executive compensation program is designed to provide a total compensation package that allows us to:
•Attract and retain individuals with the background and skills necessary to successfully execute our business strategies;
•Motivate those individuals to reach short-term and long-term goals in a way that aligns their interests with the interests of our unitholders; and
•Reward success in reaching those goals.
Factors Enhancing Alignment with Unitholder Interests
•At risk incentive compensation based on annual financial performance;
•No excise tax gross-ups; and
•Compensation committee engages an independent compensation adviser.
Compensation Setting Process
Our compensation program for our named executive officers supports our philosophy of pay-for-performance.
•Role of Management: Our Chief Executive Officer provides periodic recommendations to the compensation committee and the board of directors of our GP regarding the compensation of our named executive officers, other than his own.
•Role of the Compensation Committee’s Consultant: In carrying out its responsibilities for establishing, implementing and monitoring the effectiveness of our executive compensation philosophy, plans and programs, our compensation committee has the authority to engage outside experts to assist in its deliberations, including the receipt of market salary information for certain executive and senior vice president positions or assistance in the design of compensation programs.
Elements of Executive Compensation
As part of our pay-for-performance approach to executive compensation, the compensation of our executive officers includes a significant component of incentive compensation based on our performance. The following table summarizes the primary elements of compensation in our executive compensation program:
| | | | | | | | | | | | | | | | | | | | | | | | | | | | | | | | |
| | | | | | Objective Supported |
| Element | | Primary Purpose | | How Amount Determined | | Attract &
Retain | | Motivate &
Pay-for-
Performance | | Unitholder
Alignment |
| Base Salary | | Fixed income to compensate executive officers for their level of responsibility, expertise and experience | | Based on competition in the marketplace for executive talent and abilities | | X | | | | |
| | | | | | | | | | | |
| Discretionary Cash Bonus Awards | | Rewards achievement of specific annual financial and operational performance goals | | Based on the named executive officer’s relative contribution to the ongoing business of the Partnership | | X | | X | | X |
| | Recognizes individual contributions to our performance | | | | | | | | |
| | | | | | | | | | |
| | | | | | | | | | |
| | | | | | | | | | |
Base Salary
The compensation committee periodically reviews the base salaries of our named executive officers and may recommend adjustments as necessary. We do not make automatic annual adjustments to base salary.
Our named executive officers are entitled to the following annual base salaries:
| | | | | | | | | | | | | | |
| Name | | Fiscal Year Ended
March 31, 2023
Base Salary Rate (1)
($) | | Fiscal Year Ended
March 31, 2024
Base Salary Rate (2)
($) |
| H. Michael Krimbill | | 700,000 | | | 800,000 | |
| Bradley P. Cooper | | 500,000 | | | 600,000 | |
| Lawrence J. Thuillier | | 335,000 | | | 370,000 | |
| Kurston P. McMurray | | 500,000 | | | 515,000 | |
| Jennifer L. Kingham | | — | | | 400,000 | |
(1) Mr. Krimbill’s and Mr. Thuillier’s base salary rate became effective on March 26, 2023. Mr. Cooper’s base salary rate became effective on his promotion to Executive Vice President and Chief Financial Officer on January 13, 2023. Mr. McMurray’s base salary rate was effective April 1, 2022.
(2) Base salary rates became effective on March 24, 2024. Ms. Kingham’s salary increased from $390,000.
Discretionary Cash Bonus Awards
None of the named executive officers is subject to a formal cash bonus plan, and any cash bonuses are at the discretion of the compensation committee of the board of directors of our GP. During fiscal year 2024, cash bonuses of $2.0 million, $0.6 million, $0.5 million, $0.3 million and $0.3 million were paid to Mr. Krimbill, Mr. Cooper, Mr. McMurray, Mr. Thuillier and Ms. Kingham, respectively.
Long-Term Equity Incentive Awards
The Partnership previously adopted a long-term incentive plan (“LTIP”), which allowed for the issuance of equity-based compensation. The LTIP expired with respect to future awards on May 10, 2021. All outstanding restricted units granted prior to the LTIP expiring (“Service Awards”) in the below table vested on November 15, 2023.
The following table summarizes Service Awards activity during fiscal year 2024 with respect to the named executive officers:
| | | | | | | | | | | | | | | | | | | | | | | | |
| | Unvested Units at | | | | | | | | Unvested Units at |
| Name | | March 31, 2023 | | | | Units Vested | | | | March 31, 2024 |
| H. Michael Krimbill | | 62,500 | | | | | (62,500) | | | | | — | |
| Lawrence J. Thuillier | | 13,750 | | | | | (13,750) | | | | | — | |
| Kurston P. McMurray | | 37,500 | | | | | (37,500) | | | | | — | |
| Jennifer L. Kingham | | 25,000 | | | | | (25,000) | | | | | — | |
Severance and Change in Control Benefits
We do not provide any severance or change of control benefits to our named executive officers, other than to Mr. McMurray and Ms. Kingham, who are entitled to receive severance benefits pursuant to their employment agreement in the event of certain terminations of their employment (as described below after the “Summary Compensation Table” under the heading, “Employment Agreements with Mr. McMurray and Ms. Kingham”).
401(k) Plan
We have established a defined contribution 401(k) plan to assist our eligible employees in saving for retirement on a tax-deferred basis. The 401(k) plan permits all eligible employees, including our named executive officers, to make voluntary pre-tax contributions to the plan, subject to applicable tax limitations. For every dollar that employees contribute up to 4% of their eligible compensation (as defined in the plan), we contribute one dollar, plus 50 cents for every dollar employees contribute between 4% and 6% of their eligible compensation (as defined in the plan). Our matching contributions vest over an employee’s first two years of employment, subject to a participant’s continued service.
Other Benefits
We do not maintain a defined benefit or pension plan for our executive officers, because we believe such plans primarily reward longevity rather than performance. We offer a benefits package available to substantially all full-time employees, which includes a 401(k) plan and medical, dental, vision, disability and life insurance.
Other Officers
Certain officers who have leadership roles within our individual business segments, but who are not executive officers, participate in formulaic bonus programs that are based on the performance of the individual business segments with which they are involved. In most cases, similar programs were in place prior to our acquisition of the businesses, and we have left the programs substantially intact.
Employment Agreements
We do not have employment agreements with any of our named executive officers, other than Mr. McMurray and Ms. Kingham (as described below after the “Summary Compensation Table” under the heading, “Employment Agreements with Mr. McMurray and Ms. Kingham”).
Deductibility of Compensation
We believe that the compensation paid to the named executive officers is generally fully deductible for federal income tax purposes. We are a limited partnership and do not meet the definition of a “corporation” subject to deduction limitations under Section 162(m) of the Internal Revenue Code of 1986, as amended.
Compensation Committee Report
The compensation committee of the board of directors of our GP has reviewed and discussed the Compensation Discussion and Analysis set forth above with management. Based on this review and discussion, the compensation committee recommended to the board of directors of our GP that the Compensation Discussion and Analysis be included in this Annual Report.
| | | | | |
| | Members of the Compensation Committee: |
| | |
| | Bryan K. Guderian (Chairman) |
| James M. Collingsworth |
| | Derek S. Reiners |
Relation of Compensation Policies and Practices to Risk Management
Our compensation arrangements contain a number of design elements that serve to minimize the incentive for taking excessive or inappropriate risk to achieve short-term, unsustainable results. This includes using restricted unit grants as a significant element of executive compensation, as the restricted units are designed to reward the executive officers based on the long-term performance of the Partnership. In combination with our risk management practices, we do not believe that risks arising from our compensation policies and practices for our employees are reasonably likely to have a material adverse effect on us.
Compensation Committee Interlocks and Insider Participation
During fiscal year 2024, James M. Collingsworth, Bryan K. Guderian and Derek S. Reiners served on the compensation committee. None of these individuals is an employee or an officer of our GP.
Summary Compensation Table
The following table summarizes the compensation earned by our named executive officers for fiscal years 2022 through 2024.
| | | | | | | | | | | | | | | | | | | | | | | | | | | | | | | | | | | | | | |
| Name and Position | | Fiscal
Year | | Salary
($) | | Bonus
($) | | Stock Awards (1)
($) | | All Other
Compensation (2)
($) | | Total
($) |
| H. Michael Krimbill | | 2024 | | 675,769 | | | 2,000,000 | | | — | | | 19,953 | | | 2,695,722 | |
| Chief Executive Officer | | 2023 | | 649,038 | | | — | | | — | | | 17,922 | | | 666,960 | |
| | 2022 | | 625,000 | | | — | | | 537,500 | | | 15,719 | | | 1,178,219 | |
| | | | | | | | | | | | |
| Bradley P. Cooper (3) | | 2024 | | 482,692 | | | 600,000 | | | — | | | 17,227 | | | 1,099,919 | |
| Executive Vice President and | | 2023 | | 413,942 | | | 375,000 | | | — | | | 17,573 | | | 806,515 | |
| Chief Financial Officer | | | | | | | | | | | | |
| | | | | | | | | | | | |
| Lawrence J. Thuillier | | 2024 | | 323,404 | | | 335,000 | | | — | | | 17,164 | | | 675,568 | |
| Chief Accounting Officer | | 2023 | | 324,000 | | | 225,000 | | | — | | | 16,325 | | | 565,325 | |
| | 2022 | | 300,692 | | | 150,000 | | | 118,250 | | | 15,353 | | | 584,295 | |
| | | | | | | | | | | | |
| Kurston P. McMurray | | 2024 | | 482,692 | | | 500,000 | | | — | | | 16,914 | | | 999,606 | |
| Executive Vice President and | | 2023 | | 519,230 | | | 500,000 | | | — | | | 7,572 | | | 1,026,802 | |
| General Counsel and Secretary | | 2022 | | 495,192 | | | 250,000 | | | 322,500 | | | 3,863 | | | 1,071,555 | |
| | | | | | | | | | | | |
| Jennifer L. Kingham (4) | | 2024 | | 376,500 | | | 300,000 | | | — | | | 16,003 | | | 692,503 | |
| Executive Vice President and | | | | | | | | | | | | |
| Chief Information Officer | | | | | | | | | | | | |
(1) The fair values of the restricted units shown in the table above were calculated in accordance with FASB Accounting Standards Codification Topic 718, Stock Compensation.
(2) The amounts in this column primarily represent matching contributions to our 401(k) plan.
(3) Mr. Cooper became Executive Vice President and Chief Financial Officer effective January 13, 2023, and thus was not a named executive officer prior to fiscal year 2023.
(4) Ms. Kingham was not a named executive officer prior to fiscal year 2024.
Employment Agreements with Mr. McMurray and Ms. Kingham
Mr. McMurray and Ms. Kingham are party to employment agreements with the Partnership, dated March 10, 2017. The agreements have a term of five years from the effective date, subject to automatic renewals for one-year periods thereafter unless either party provides 60 days’ notice of non-renewal of the term. The agreements were renewed by their terms as of March 10, 2024. The agreements provide that Mr. McMurray and Ms. Kingham will receive a base salary of no less than $250,000 per year. Mr. McMurray will be eligible to receive an annual bonus with respect to each fiscal year of the Partnership at a target of 100% of his base salary, while Ms. Kingham will be eligible to receive an annual bonus with respect to each fiscal year of the Partnership at a target of 60% of her base salary. Mr. McMurray and Ms. Kingham are also entitled to receive annual awards of unvested units under the Partnership’s LTIP.
In the event that Mr. McMurray or Ms. Kingham’s employment is terminated by the Partnership without “cause” (as defined in their respective agreements), provided that they execute a general release of claims, Mr. McMurray and Ms. Kingham are entitled to receive (i) continued payment of their base salary for 12 months following the termination, (ii) the restricted unit awards that would have been paid or granted to them had they remained employed for an additional three years following their termination, and (iii) their target annual bonus for the performance year in which their termination occurs. Mr. McMurray and Ms. Kingham would also be entitled to receive the severance benefits described in the foregoing sentence in the event that they voluntarily resign due to a “constructive discharge,” which circumstances would include (1) a reduction of their annual base salary below $250,000 (other than an across-the-board, pro rata reduction of no more than 10% applicable to all similarly situated executive officers of the Partnership) or the Partnership’s failure to provide Mr. McMurray and Ms. Kingham’s elements of compensation, (2) the removal of Mr. McMurray from the position of Executive Vice President and General Counsel and Secretary without Mr. McMurray’s written consent or the removal of Ms. Kingham from the position of Executive Vice President and Chief Information Officer without Ms. Kingham’s written consent, (3) any action by the Partnership that results in significant diminution of Mr. McMurray’s or Ms. Kingham’s authority, power or responsibilities, or
(4) the Partnership’s relocation of its principal place of business in Oklahoma to a location more than 50 miles from its current location. Mr. McMurray and Ms. Kingham are subject to non-disclosure and intellectual property rights assignment obligations, and an obligation not to solicit customers, employees or consultants lasting during their employment and for a period of 12 months thereafter.
Restricted Unit Awards
During fiscal year 2024, no Service Awards were granted to the named executive officers due to the expiration of the LTIP, as discussed above. All outstanding Service Awards in the below table vested on November 15, 2023.
2024 Units Vested
The following table summarizes the value of the awards on the vesting date which was calculated based of the closing market price per common unit on the vesting date.
| | | | | | | | | | | | | | |
| Name | | Number of Service Award Units
Acquired on Vesting | | Value Realized on Vesting
($) |
| H. Michael Krimbill | | 62,500 | | | 246,563 | |
| Lawrence J. Thuillier | | 13,750 | | | 54,244 | |
| Kurston P. McMurray | | 37,500 | | | 147,938 | |
| Jennifer L. Kingham | | 25,000 | | | 98,625 | |
| | | | |
Upon vesting, certain of the named executive officers elected for us to remit payments to taxing authorities in lieu of issuing common units. The following table summarizes the number of common units issued and the number of common units withheld for taxes:
| | | | | | | | | | | | | | | | | | | | |
| Name | | Number of Units
Issued | | Number of Units
Withheld | | Total |
| | | | | | |
| Lawrence J. Thuillier | | 8,236 | | | 5,514 | | | 13,750 | |
| Kurston P. McMurray | | 21,712 | | | 15,788 | | | 37,500 | |
| | | | | | |
Potential Payments Upon Termination or Change in Control
We do not provide any severance or change in control benefits to our named executive officers, other than Mr. McMurray and Ms. Kingham, who are entitled to receive severance benefits for certain types of terminations (as described in more detail above under the heading, “Employment Agreements with Mr. McMurray and Ms. Kingham”). In the event that their employment had been terminated as of March 31, 2024 by the Partnership without “cause” or due to a “constructive discharge,” Mr. McMurray and Ms. Kingham would have been entitled to receive the following amounts:
| | | | | | | | | | | | | | | | | | | | | | |
| | Cash Severance | | | | Target Annual Bonus | | Total |
| Kurston P. McMurray | | $ | 515,000 | | | | | $ | 515,000 | | | $ | 1,030,000 | |
| Jennifer L. Kingham | | $ | 400,000 | | | | | $ | 240,000 | | | $ | 640,000 | |
Pay Ratio Disclosure
As required by Section 953(b) of the Dodd-Frank Wall Street Reform and Consumer Protection Act, and Item 402(u) of Regulation S-K, we are providing the following information regarding the ratio of the annual total compensation of our Chief Executive Officer, Mr. Krimbill, to the median of the annual total compensation of our employees for our last fiscal year.
For the year ended March 31, 2024:
•The median of the annual total compensation of all employees (other than the Chief Executive Officer) was $108,712; and
•The annual total compensation of Mr. Krimbill, as reported in the Summary Compensation Table above, was $2,695,722.
Based on the information for the year ended March 31, 2024, the ratio of the annual total compensation of our Chief Executive Officer to the annual total compensation of our median employee was approximately 25 to 1.
To determine our median employee, we identified each individual employed by us on January 1, 2024, our determination date. As of that date, we had 619 employees located in two countries. We identified the median employee by examining only base pay plus overtime for the period from January 1, 2023 through December 31, 2023. We included all employees, with the exception of three employees that work in Canada, whether employed on a full-time or part-time basis, and did not make any estimates, assumptions or adjustments to any base pay plus overtime amounts. After identifying the median employee, we calculated the annual total compensation for the median employee using the same methodology we use to calculate total annual compensation for our named executive officers, as set forth in the Summary Compensation Table above.
This pay ratio is a reasonable estimate calculated in a manner consistent with SEC rules based on our payroll and employment records and the methodology described above. The SEC rules for identifying the median employee and calculating the pay ratio based on that employee’s annual total compensation allow companies to adopt a variety of methodologies, to apply certain exclusions, and to make reasonable estimates and assumptions that reflect their compensation practices. As such, the pay ratio reported by other companies may not be comparable to the pay ratio reported above, as other companies may have different employment and compensation practices and may utilize different methodologies, exclusions, estimates and assumptions in calculating their own pay ratios.
Hedging of Partnership Common Units
Our supplemental trading policy prohibits directors, named executive officers and other designated employees from the following transactions: (i) trading puts or calls or engaging in short sales with respect to our common units, or (ii) engaging in certain hedging transactions, such as zero-cost collars, equity swaps, prepaid variable forward contracts and exchange funds, that are designed to hedge or offset a decrease in the market value of their holdings. Our supplemental trading policy also specifies that officers, certain employees and directors may not pledge our common units as collateral for any loan without prior notice and these individuals may not hold our common units in a margin account unless our common units are not taken into account in determining their margin requirements and they have given prior notice to their broker of their affiliation and status with the Partnership and any restrictions applicable to our common units with respect to their sale.
Director Compensation
Officers or employees of our GP or its affiliates who also serve as directors do not receive additional compensation for their service as a director of our GP. Each director who is not an officer or employee of our GP or its affiliates receives the following cash compensation for his board service:
•an annual retainer of $180,000;
•an annual retainer of $25,000 for the chairman of the audit committee;
•an annual retainer of $15,000 for the chairman of the compensation committee;
•an annual retainer of $15,000 for each member of the audit committee other than the chairman; and
•an annual retainer of $10,000 for each member of the compensation committee other than the chairman.
In addition, each director who is not an officer or employee of our GP or its affiliates has been granted awards of restricted units. All of our directors are also reimbursed for all out-of-pocket expenses incurred in connection with attending board or committee meetings. Each director is indemnified for his actions associated with being a director to the fullest extent permitted under Delaware law.
Due to the expiration of the LTIP, as discussed above, no restricted units were granted to the directors during fiscal year 2024.
The following table summarizes the compensation earned during fiscal year 2024 by each director who is not an officer or employee of our GP or its affiliates:
| | | | | | | | |
| Name | | Total Compensation (1)
($) |
| Shawn W. Coady | | 180,000 | |
| James M. Collingsworth | | 205,000 | |
| Bryan K. Guderian | | 210,000 | |
| Derek S. Reiners | | 215,000 | |
(1) All of the compensation was paid in cash.
Long-Term Equity Incentive Awards
The following table summarizes Service Awards activity during fiscal year 2024 with respect to each director who is not an officer or employee of our GP or its affiliates:
| | | | | | | | | | | | | | | | | | | | | | |
| | Unvested Units at | | | | | | Unvested Units at |
| Name | | March 31, 2023 | | | | Units Vested (1) | | March 31, 2024 |
| Shawn W. Coady | | 12,500 | | | | | (12,500) | | | — | |
| James M. Collingsworth | | 12,500 | | | | | (12,500) | | | — | |
| Bryan K. Guderian | | 12,500 | | | | | (12,500) | | | — | |
| Derek S. Reiners | | 12,500 | | | | | (12,500) | | | — | |
(1) All outstanding Service Awards vested on November 15, 2023.
Item 12. Security Ownership of Certain Beneficial Owners and Management and Related Unitholder Matters
Security Ownership of Certain Beneficial Owners and Management
The following table summarizes the beneficial ownership, as of June 4, 2024, of our common units by:
•each person or group of persons known by us to be a beneficial owner of more than 5% of our outstanding common units;
•each director of our GP;
•each named executive officer of our GP; and
•all directors and executive officers of our GP as a group.
| | | | | | | | | | | | | | |
| Beneficial Owners | | Common Units
Beneficially
Owned | | Percentage of
Common Units
Beneficially
Owned (1) |
| 5% or greater unitholders (other than officers and directors): | | | | |
| Invesco Ltd. (2) | | 19,562,133 | | | 14.76 | % |
| EIG Neptune Equity Aggregator, L.P. (3) | | 16,734,375 | | | 11.21 | % |
| JPMorgan Chase & Co. (4) | | 8,493,128 | | | 6.41 | % |
| | | | |
| Directors and named executive officers: | | | | |
| Shawn W. Coady (5) | | 2,652,195 | | | 2.00 | % |
| James M. Collingsworth (6) | | 639,870 | | | * |
| Bradley P. Cooper | | 200,000 | | | * |
| Bryan K. Guderian | | 122,500 | | | * |
| Jennifer L. Kingham | | 92,687 | | | * |
| H. Michael Krimbill (7) | | 4,925,018 | | | 3.72 | % |
| Kurston P. McMurray (8) | | 147,524 | | | * |
| John T. Raymond | | 50,000 | | | * |
| Derek S. Reiners | | 126,000 | | | * |
| Lawrence J. Thuillier | | 84,298 | | | * |
| Randall S. Wade | | — | | | * |
| All directors and executive officers as a group (11 persons) (9) | | 9,040,092 | | | 6.82 | % |
* Less than 1.0%
(1) Based on 132,512,766 common units outstanding at June 4, 2024.
(2) The mailing address for Invesco Ltd. is 1331 Spring Street NW, Suite 2500, Atlanta, GA 30309. Invesco Ltd. reported sole voting and dispositive power with respect to all common units beneficially owned. The information related to Invesco Ltd. is based upon its Schedule 13G/A filed with the SEC on February 12, 2024.
(3) The mailing address for EIG Neptune Equity Aggregator, L.P. (“EIG Neptune”) is 600 New Hampshire Ave NW, Suite 1200, Washington, DC 20037. EIG Neptune reported sole voting and dispositive power with respect to all common units beneficially owned. The information related to EIG Neptune is based upon its Schedule 13D/A filed with the SEC on September 4, 2020. The common units beneficially owned relate to warrants that were exercisable on July 2, 2020. For purposes of calculating ownership percentages, the units underlying the warrants are only deemed outstanding for purposes of calculating EIG Neptune’s percentage.
(4) The mailing address for JPMorgan Chase & Co. is 383 Madison Avenue, New York, NY 10179. JPMorgan Chase & Co. reported sole voting and dispositive power with respect to all common units beneficially owned. The information related to JPMorgan Chase & Co. is based upon its Schedule 13G filed with the SEC on February 6, 2024.
(5) Dr. Coady owns 172,304 of these common units. SWC Family Partnership LP owns 2,320,391 of these common units. SWC Family Partnership LP is solely owned by SWC General Partner, LLC, of which Dr. Coady is the sole member. Dr. Coady may be deemed to have sole voting and investment power over these units, but disclaims such beneficial ownership except to the extent of his pecuniary interest therein. The 2012 Shawn W. Coady Irrevocable Insurance Trust, which was established for the benefit of Shawn W. Coady’s children, owns 135,000 of these common units. Dr. Coady may be deemed to have sole voting and investment power over these units, but disclaims such beneficial ownership except to the extent of his pecuniary interest therein. The Tara Nicole Coady Trust II, of which the reporting person is the trustee, owns 12,250 of these common units. The Colleen Blair Coady Trust, of which the reporting person is the trustee, owns 12,250 of these common units. Dr. Coady also owns a 12.27% interest in our GP through Coady Enterprises, LLC, of which he owns 100% of the membership interests.
(6) Mr. Collingsworth owns 627,500 of these common units. Mr. Collingsworth holds 2,000 of these common units jointly with his spouse, Cindy Collingsworth. Cindy Collingsworth and her sister jointly own 9,500 of these common units. Cindy Collingsworth owns 870 of these common units.
(7) Mr. Krimbill owns 2,938,615 of these common units. Krim2010, LLC owns 904,848 of these common units. Krimbill Enterprises LP, H. Michael Krimbill and James E. Krimbill own 90.89%, 4.05%, and 5.06% of Krim2010, LLC, respectively. Krimbill Enterprises LP also owns 588,000 of these common units. Krimbill Enterprises LP is controlled by H. Michael Krimbill via his ownership of its general partner, Krimbill Holding Company. H. Michael Krimbill may be deemed to have sole voting and investment power over these units, but disclaims such beneficial ownership except to the extent of his pecuniary interest therein. KrimGP2010 LLC owns 363,555 of these common units. KrimGP2010 LLC is solely owned by H. Michael Krimbill. H. Michael Krimbill may be deemed to have sole voting and investment power over these units, but disclaims such beneficial ownership except to the extent of his pecuniary interest therein. Krimbill Enterprises LP, II also owns 130,000 of these common units. Krimbill Enterprises LP, II is controlled by H. Michael Krimbill via his ownership of its general partner, Krimbill Holding Company. H. Michael Krimbill may be deemed to have sole voting
and investment power over these units, but disclaims such beneficial ownership except to the extent of his pecuniary interest therein. H. Michael Krimbill also owns a 15.10% interest in our GP through KrimGP2010, LLC, of which he owns 100% of the membership interests.
(8) Mr. McMurray owns a 0.25% interest in our GP through MCM Investments, LLC, of which he owns 100% of the membership interests.
(9) The directors and executive officers of our GP, as of June 4, 2024, also collectively own a 33.90% interest in our GP.
Unless otherwise noted, each of the individuals listed above is believed to have sole voting and investment power with respect to the units beneficially held by them. The mailing address for each of the officers and directors of our GP listed above is 6120 South Yale Avenue, Suite 1300, Tulsa, Oklahoma 74136.
Securities Authorized for Issuance Under Equity Compensation Plan
The LTIP expired on May 10, 2021 and all of the outstanding units vested on November 15, 2023.
Item 13. Certain Relationships and Related Transactions, and Director Independence
Our directors, executive officers, and greater than 5% unitholders collectively own an aggregate of 53,829,728 common units, representing an aggregate 39.20% limited partner interest in us. In addition, our GP owns a 0.1% GP interest in us and all of our incentive distribution rights (“IDRs”). As of March 31, 2024, we owned 8.69% of our GP.
Distributions and Payments to Our General Partner and Its Affiliates
Our GP and its affiliates do not receive any management fee or other compensation for the management of our business and affairs, but they are reimbursed for all expenses that they incur on our behalf, including general and administrative expenses. Our GP determines the amount of these expenses. In addition, our GP owns the 0.1% GP interest and all of the IDRs. Our GP is entitled to receive incentive distributions if the amount we distribute with respect to any quarter exceeds levels specified in our Partnership Agreement.
The following table summarizes the distributions and payments to be made by us to our directors, executive officers, and greater than 5% unitholders and our GP in connection with our ongoing operation and any liquidation. These distributions and payments were determined by and among affiliated entities before our initial public offering (“IPO”) and, consequently, are not the result of arm’s length negotiations.
| | | | | | | | |
| Operation Stage | | |
| | |
Distributions of available cash to our directors, executive officers, and greater than 5% unitholders and our GP | | We generally make cash distributions 99.9% to our unitholders pro rata, including our directors, executive officers, and greater than 5% unitholders as the holders of an aggregate 53,829,728 common units, and 0.1% to our GP. In addition, when distributions exceed the minimum quarterly distribution and other higher target distributions levels, our GP is entitled to increasing percentages of the distributions, up to 48.1% of the distributions above the highest target distribution level. |
| | |
| | If our GP elects to reset the target distribution levels, it will be entitled to receive common units and to maintain its GP interest. |
| | |
| | As described in Note 7 to our consolidated financial statements included in this Annual Report, the ABL Facility, Term Loan B and the indenture for the 2029 Senior Secured Notes and 2032 Senior Secured Notes contain covenants limiting our ability to pay distributions if we are in default under these agreements. In addition, quarterly distributions on the preferred units must be fully paid for all preceding fiscal quarters before we are permitted to declare or pay any distributions on our common units. |
| | |
Payments to our GP and its affiliates | | Our GP and its affiliates do not receive any management fee or other compensation for the management of our business and affairs, but they are reimbursed for all expenses that they incur on our behalf, including general and administrative expenses. As the sole purpose of the GP is to act as our GP, substantially all of the expenses of our GP are incurred on our behalf and reimbursed by us or our subsidiaries. Our GP determines the amount of these expenses. |
| | |
Withdrawal or removal of our GP | | If our GP withdraws or is removed, its GP interest and its IDRs will either be sold to the new general partner for cash or converted into common units, in each case for an amount equal to the fair market value of those interests. |
| | |
| Liquidation Stage | | |
| | |
| Liquidation | | Upon our liquidation, our partners, including our GP, will be entitled to receive liquidating distributions according to their respective capital account balances. |
Transactions with Related Persons
We purchase goods and services from certain entities that are partially owned by our named executive officers. The following table summarizes these transactions from April 1, 2023 to March 31, 2024:
| | | | | | | | | | | | | | | | | | | | |
| Entity | | Nature of Purchases | | Amount Purchased | | Ownership Interest in Entity |
| | | | (in thousands) | | |
| H. Michael Krimbill | | | | | | |
| KAIR2014 LLC (“KAIR2014”) | | Aircraft | | $ | 958 | | | 50 | % |
In connection with the purchase of our 50% interest in an aircraft company, KAIR2014, we executed a joint and several guarantee for the benefit of the lender for KAIR2014’s outstanding loan. The other owner of KAIR2014, our Chief Executive Officer, H. Michael Krimbill, is a party to a similar guarantee. This guarantee obligates us for the payment and performance of KAIR2014 with respect to the repayment of the loan, which was set to mature in September 2023. On September 1, 2023, KAIR2014 entered into an agreement to extend the maturity date of the loan to September 1, 2028. Accordingly, we and H. Michael Krimbill executed new joint and several guarantees for the benefit of the lender for KAIR2014’s outstanding loan. In December 2023, KAIR2014 sold an airplane for total consideration of approximately $4.7 million. A portion of the proceeds was used to repay the outstanding loan balance of approximately $2.1 million, resulting in the release of our guarantee.
Travis Krimbill, an employee of the Partnership, is the son of H. Michael Krimbill, who is a named executive officer of the Partnership and a member of the board of directors of our GP. Travis Krimbill does not report to H. Michael Krimbill and his compensation is determined by the Chief Financial Officer. During the year ended March 31, 2024, Travis Krimbill received total compensation of approximately $0.3 million.
Registration Rights Agreement
We have entered into a registration rights agreement (as amended, the “Registration Rights Agreement”) with certain third parties (“Registration Rights Parties”) pursuant to which we agreed to register for resale under the Securities Act of 1933, as amended (“Securities Act”) common units owned by the Registration Rights Parties. In connection with our IPO, we granted registration rights to the NGL Energy GP Investor Group, and subsequently, we have granted registration rights in connection with several acquisitions. We will not be required to register such common units if an exemption from the registration requirements of the Securities Act is available with respect to the number of common units desired to be sold. Subject to limitations specified in the Registration Rights Agreement, the registration rights of the Registration Rights Parties include the following:
•Demand Registration Rights. Certain registration rights parties deemed “Significant Holders” under the agreement may, to the extent that they continue to own more than 4% of our common units, require us to file a registration statement with the SEC registering the offer and sale of a specified number of common units, subject to limitations on the number of requests for registration that can be made in any twelve-month period as well as customary cutbacks at the discretion of the underwriters relating to a potential offering. All other Registration Rights Parties are entitled to notice of a Significant Holder’s exercise of its demand registration rights and may include their common units in such registration. We can only be required to file a total of nine registration statements upon the Significant Holders’ exercise of these demand registration rights and are only required to effect demand registration if the aggregate proposed offering price to the public is at least $10.0 million.
•Piggyback Registration Rights. If we propose to file a registration statement under the Securities Act to register our common units, the Registration Rights Parties are entitled to notice of such registration and have the right to include their common units in the registration, subject to limitations that the underwriters relating to a potential offering may impose on the number of common units included in the registration. These counterparties also have the right to include their units in our future registrations, including secondary offerings of our common units.
•Expenses of Registration. With specified exceptions, we are required to pay all expenses incidental to any registration of common units, excluding underwriting discounts and commissions.
Review, Approval or Ratification of Transactions with Related Parties
The board of directors of our GP has adopted a Code of Business Conduct and Ethics that, among other things, sets forth our policies for the review, approval and ratification of transactions with related persons. The Code of Business Conduct and Ethics provides that the board of directors of our GP or its authorized committee will periodically review all related person transactions that are required to be disclosed under SEC rules and, when appropriate, initially authorize or ratify all such transactions. In the event that the board of directors of our GP or its authorized committee considers ratification of a related person transaction and determines not to so ratify, the Code of Business Conduct and Ethics provides that our officers will make all reasonable efforts to cancel or annul the transaction.
The Code of Business Conduct and Ethics provides that, in determining whether or not to recommend the initial approval or ratification of a related person transaction, the board of directors of our GP or its authorized committee should consider all of the relevant facts and circumstances available, including (if applicable) but not limited to:
•whether there is an appropriate business justification for the transaction;
•the benefits that accrue to the Partnership as a result of the transaction;
•the terms available to unrelated third parties entering into similar transactions;
•the impact of the transaction on a director’s independence (in the event the related party is a director, an immediate family member of a director or an entity in which a director is a partner, shareholder or executive officer);
•the availability of other sources for comparable products or services;
•whether it is a single transaction or a series of ongoing, related transactions; and
•whether entering into the transaction would be consistent with the Code of Business Conduct and Ethics.
Director Independence
The NYSE does not require a listed publicly traded limited partnership like NGL to have a majority of independent directors on the board of directors of its general partner. For a discussion of the independence of the board of directors of our GP, see Part III, Item 10–“Directors, Executive Officers and Corporate Governance–Board of Directors of our General Partner.”
Item 14. Principal Accountant Fees and Services
We have engaged Grant Thornton LLP as our independent registered public accounting firm. The following table summarizes fees we have paid Grant Thornton LLP for the periods indicated:
| | | | | | | | | | | | | | |
| | March 31, |
| | 2024 | | 2023 |
| | (in thousands) |
| Audit fees (1) | | $ | 1,867 | | | $ | 1,769 | |
| Audit-related fees | | — | | | — | |
| Tax fees | | — | | | — | |
| All other fees | | — | | | — | |
| Total | | $ | 1,867 | | | $ | 1,769 | |
(1) Includes fees for audits of the Partnership’s financial statements, reviews of the related quarterly financial statements, and services that are normally provided by the independent accountants in connection with statutory and regulatory filings or engagements, including reviews of documents filed with the SEC and the preparation of letters to underwriters and other requesting parties.
In fiscal years 2024 and 2023, all of Grant Thornton LLP’s services were pre-approved by the Audit Committee.
PART IV
Item 15. Exhibit and Financial Statement Schedules
(a) The following documents are filed as part of this Annual Report:
1. Financial Statements. See the accompanying Index to Financial Statements.
2. Financial Statement Schedules. All schedules have been omitted because they are either not applicable, not required or the information required in such schedules appears in the financial statements or the related notes.
3. Exhibits.
| | | | | | | | |
| Exhibit Number | | Description |
| 2.1 | | |
| 2.2 | | |
| 2.3 | | Equity Purchase Agreement, dated September 25, 2019, by and among NGL Energy Partners LP, NGL Water Solutions Permian, LLC, Water Remainco, LLC, Hillstone Environmental Partners, LLC, GGCOF HEP Blocker II, LLC, GGCOF HEP Blocker, LLC, Golden Gate Capital Opportunity Fund-A, L.P., GGCOF AIV L.P. and GGCOF HEP Blocker II Holdings, LLC (incorporated by reference to Exhibit 2.1 to the Current Report on Form 8-K (File No. 001-35172) filed with the SEC on November 1, 2019) |
| 2.4 | | |
| 2.5 | | |
| 3.1 | | |
| 3.2 | | |
| 3.3 | | |
| 3.4 | | |
| 3.5 | | |
| 3.6 | | |
| 3.7 | | |
| 3.8 | | |
| 3.9 | | |
| 3.10 | | |
| 3.11 | | |
| 3.12 | | |
| 3.13 | | |
| 3.14 | | |
| | | | | | | | |
| Exhibit Number | | Description |
| 4.1 | | First Amended and Restated Registration Rights Agreement, dated October 3, 2011, by and among the Partnership, Hicks Oils & Hicksgas, Incorporated, NGL Holdings, Inc., Krim2010, LLC, Infrastructure Capital Management, LLC, Atkinson Investors, LLC, E. Osterman Propane, Inc. and the other holders party thereto (incorporated by reference to Exhibit 4.1 to the Current Report on Form 8-K (File No. 001-35172) filed with the SEC on October 7, 2011) |
| 4.2 | | |
| 4.3 | | Amendment No. 2 and Joinder to First Amended and Restated Registration Rights Agreement, dated January 3, 2012, by and among NGL Energy Holdings LLC, Liberty Propane, L.L.C., Pacer-Enviro Propane, L.L.C., Pacer-Pittman Propane, L.L.C., Pacer-Portland Propane, L.L.C., Pacer Propane (Washington), L.L.C., Pacer-Salida Propane, L.L.C. and Pacer-Utah Propane, L.L.C. (incorporated by reference to Exhibit 4.1 to the Current Report on Form 8-K (File No. 001-35172) filed with the SEC on January 9, 2012) |
| 4.4 | | |
| 4.5 | | |
| 4.6 | | |
| 4.7 | | |
| 4.8 | | |
| 4.9 | | |
| 4.10 | | |
| 4.11 | | |
| 4.12* | | |
| 4.13* | | |
| 4.14* | | |
| 4.15 | | |
| 4.16 | | |
| 4.17 | | |
| 4.18* | | |
| 10.1 | | |
| 10.2 | | |
| 10.3 | | |
| | | | | | | | |
| Exhibit Number | | Description |
| 10.4 | | |
| 10.5 | | |
| 10.6 | | Credit Party Accession Agreement, dated as of March 28, 2022, among NGL Shared Services, LLC, NGL Shared Services Holdings, Inc., and JPMorgan Chase Bank, N.A., as Administrative Agent and as Collateral Agent (incorporated by reference to Exhibit 10.4 to the Annual Report on Form 10-K (File No. 001-35172) for the year ended March 31, 2022 filed with the SEC on June 6, 2022) |
| 10.7 | | |
| 10.8 | | |
| 10.9 | | |
| 10.10 | | |
| 10.11 | | |
| 10.12 | | |
| 10.13 | | |
| 10.14 | | |
| 10.15 | | |
| 10.16 | | |
| 10.17 | | |
| 10.18 | | |
| 10.19 | | |
| 19.1* | | |
| 19.2* | | |
| 21.1* | | |
| 23.1* | | |
| 31.1* | | |
| 31.2* | | |
| 32.1* | | |
| 32.2* | | |
| 97.1* | | |
| 101.INS** | | XBRL Instance Document - the instance document does not appear in the Interactive Data File because its XBRL tags are embedded within the Inline XBRL document. |
| 101.SCH** | | Inline XBRL Schema Document |
| | | | | | | | |
| Exhibit Number | | Description |
| 101.CAL** | | Inline XBRL Calculation Linkbase Document |
| 101.DEF** | | Inline XBRL Definition Linkbase Document |
| 101.LAB** | | Inline XBRL Label Linkbase Document |
| 101.PRE** | | Inline XBRL Presentation Linkbase Document |
| 104 | | Cover Page Interactive Data File (formatted as Inline XBRL and contained in Exhibit 101) |
* Exhibits filed with this report.
** The following documents are formatted in Inline XBRL (Extensible Business Reporting Language): (i) Consolidated Balance Sheets at March 31, 2024 and 2023, (ii) Consolidated Statements of Operations for the years ended March 31, 2024, 2023, and 2022, (iii) Consolidated Statements of Comprehensive (Loss) Income for the years ended March 31, 2024, 2023, and 2022, (iv) Consolidated Statements of Changes in Equity for the years ended March 31, 2024, 2023, and 2022, (v) Consolidated Statements of Cash Flows for the years ended March 31, 2024, 2023, and 2022, and (vi) Notes to Consolidated Financial Statements.
Item 16. Form 10-K Summary
None.
SIGNATURES
Pursuant to the requirements of Section 13 or 15(d) of the Securities Exchange Act of 1934, the registrant has duly caused this report to be signed on its behalf by the undersigned, thereunto duly authorized on June 6, 2024.
| | | | | | | | | | | |
| NGL Energy Partners LP |
| By: | NGL Energy Holdings LLC, its general partner |
| | By: | /s/ H. Michael Krimbill |
| | H. Michael Krimbill |
| | Chief Executive Officer |
Pursuant to the requirements of the Securities Exchange Act of 1934, this report has been signed below by the following persons on behalf of the registrant and in the capacities and on the dates indicated.
| | | | | | | | | | | | | | |
| Signature | | Title | | Date |
| | | | |
| /s/ H. Michael Krimbill | | Chief Executive Officer and Director | | June 6, 2024 |
| H. Michael Krimbill | | (Principal Executive Officer) | | |
| | | | |
| /s/ Bradley P. Cooper | | Chief Financial Officer | | June 6, 2024 |
Bradley P. Cooper | | (Principal Financial Officer) | | |
| | | | |
| /s/ Lawrence J. Thuillier | | Chief Accounting Officer | | June 6, 2024 |
| Lawrence J. Thuillier | | (Principal Accounting Officer) | | |
| | | | |
| /s/ Shawn W. Coady | | Director | | June 6, 2024 |
| Shawn W. Coady | | | | |
| | | | |
| /s/ James M. Collingsworth | | Director | | June 6, 2024 |
| James M. Collingsworth | | | | |
| | | | |
| /s/ Bryan K. Guderian | | Director | | June 6, 2024 |
| Bryan K. Guderian | | | | |
| | | | |
| /s/ John T. Raymond | | Director | | June 6, 2024 |
| John T. Raymond | | | | |
| | | | |
| /s/ Derek S. Reiners | | Director | | June 6, 2024 |
| Derek S. Reiners | | | | |
| | | | |
| /s/ Randall S. Wade | | Director | | June 6, 2024 |
| Randall S. Wade | | | | |
INDEX TO FINANCIAL STATEMENTS
| | | | | |
| NGL Energy Partners LP | |
| |
Report of Independent Registered Public Accounting Firm (PCAOB ID Number 248) | |
| |
Consolidated Balance Sheets at March 31, 2024 and 2023 | |
| |
Consolidated Statements of Operations for the years ended March 31, 2024, 2023, and 2022 | |
| |
Consolidated Statements of Comprehensive (Loss) Income for the years ended March 31, 2024, 2023, and 2022 | |
| |
Consolidated Statements of Changes in Equity for the years ended March 31, 2024, 2023, and 2022 | |
| |
Consolidated Statements of Cash Flows for the years ended March 31, 2024, 2023, and 2022 | |
| |
| Notes to Consolidated Financial Statements | |
REPORT OF INDEPENDENT REGISTERED PUBLIC ACCOUNTING FIRM
Board of Directors of NGL Energy Holdings LLC and
Unitholders of NGL Energy Partners LP
Opinion on the financial statements
We have audited the accompanying consolidated balance sheets of NGL Energy Partners LP (a Delaware limited partnership) and subsidiaries (the “Partnership”) as of March 31, 2024 and 2023, the related consolidated statements of operations, comprehensive (loss) income, changes in equity, and cash flows for each of the three years in the period ended March 31, 2024, and the related notes (collectively referred to as the “financial statements”). In our opinion, the financial statements present fairly, in all material respects, the financial position of the Partnership as of March 31, 2024 and 2023, and the results of its operations and its cash flows for each of the three years in the period ended March 31, 2024, in conformity with accounting principles generally accepted in the United States of America.
We also have audited, in accordance with the standards of the Public Company Accounting Oversight Board (United States) (“PCAOB”), the Partnership’s internal control over financial reporting as of March 31, 2024, based on criteria established in the 2013 Internal Control—Integrated Framework issued by the Committee of Sponsoring Organizations of the Treadway Commission (“COSO”), and our report dated June 6, 2024 expressed an unqualified opinion.
Basis for opinion
These financial statements are the responsibility of the Partnership’s management. Our responsibility is to express an opinion on the Partnership’s financial statements based on our audits. We are a public accounting firm registered with the PCAOB and are required to be independent with respect to the Partnership in accordance with the U.S. federal securities laws and the applicable rules and regulations of the Securities and Exchange Commission and the PCAOB.
We conducted our audits in accordance with the standards of the PCAOB. Those standards require that we plan and perform the audit to obtain reasonable assurance about whether the financial statements are free of material misstatement, whether due to error or fraud. Our audits included performing procedures to assess the risks of material misstatement of the financial statements, whether due to error or fraud, and performing procedures that respond to those risks. Such procedures included examining, on a test basis, evidence regarding the amounts and disclosures in the financial statements. Our audits also included evaluating the accounting principles used and significant estimates made by management, as well as evaluating the overall presentation of the financial statements. We believe that our audits provide a reasonable basis for our opinion.
Critical audit matter
The critical audit matter communicated below is a matter arising from the current period audit of the financial statements that was communicated or required to be communicated to the audit committee and that: (1) relates to accounts or disclosures that are material to the financial statements and (2) involved our especially challenging, subjective, or complex judgments. The communication of critical audit matters does not alter in any way our opinion on the financial statements, taken as a whole, and we are not, by communicating the critical audit matter below, providing a separate opinion on the critical audit matter or on the accounts or disclosures to which it relates.
Goodwill Impairment Assessment
As described further in Note 5 to the consolidated financial statements, the Partnership’s consolidated goodwill balance was $634.3 million as of March 31, 2024. Management evaluates goodwill for impairment on January 1 of each year, or more frequently to the extent events or conditions indicate a risk of possible impairment. Management performed quantitative impairment assessments for the Crude Oil Logistics and Wholesale/Terminal reporting units to test goodwill for impairment as of January 1, 2024. As a result of the assessment performed for the reporting units, and as described further in Note 5 to the consolidated financial statements, the Partnership recognized a goodwill impairment charge of $69.2 million during the three months ended March 31, 2024 related to its Wholesale/Terminal reporting unit within the Partnership’s Liquids Logistics reportable segment. We identified the goodwill impairment assessment as a critical audit matter.
The principal considerations for our determination that the goodwill impairment assessment was a critical audit matter are that there was a high estimation uncertainty due to significant judgments with respect to assumptions used to estimate the future cash flows, including growth rates, operating expenses and cash outflows necessary to support the cash flows, weighted average costs of capital and future market conditions as well as the valuation methodologies applied by the Partnership. This in turn led to a high degree of auditor judgment, subjectivity and effort in performing procedures and evaluating audit evidence related to management’s forecasted future cash flows. In addition, the audit effort involved the use of professionals with specialized skill and knowledge to assist in performing these procedures and evaluating the audit evidence obtained.
Our audit procedures related to the goodwill impairment assessment included the following, among others: We tested the effectiveness of controls relating to management’s goodwill impairment assessment, including controls over the determination of the fair value of the reporting units. In addition to testing the effectiveness of controls, we also performed the following:
•Utilized a valuation specialist to evaluate:
◦The methodologies used and whether they were acceptable for the underlying assets or operations and being applied correctly by performing an independent calculation,
◦The appropriateness of the discount rate by recalculating the weighted average costs of capital and evaluating future market conditions, and
◦Other significant assumptions, including the exit multiple.
•Tested the reasonableness of management’s process for determining the fair value of the reporting units, including the growth rate, forecasted costs and operating margins by comparing such items to the industry projections and conditions found in industry reports as well as historical operating results of the reporting units and by assessing the likelihood or capability of the reporting units to undertake activities or initiatives underpinning significant drivers of growth in the forecasted period.
/s/ GRANT THORNTON LLP
We have served as the Partnership’s auditor since 2010.
Tulsa, Oklahoma
June 6, 2024
NGL ENERGY PARTNERS LP AND SUBSIDIARIES
Consolidated Balance Sheets
(in Thousands, except unit amounts)
| | | | | | | | | | | |
| March 31, |
| 2024 | | 2023 |
| ASSETS | | | |
| CURRENT ASSETS: | | | |
| Cash and cash equivalents | $ | 38,909 | | | $ | 5,431 | |
Accounts receivable-trade, net of allowance for expected credit losses of $1,671 and $1,964, respectively | 814,087 | | | 1,033,956 | |
| Accounts receivable-affiliates | 1,501 | | | 12,362 | |
| Inventories | 130,907 | | | 142,607 | |
| Prepaid expenses and other current assets | 126,933 | | | 98,089 | |
| Assets held for sale | 66,597 | | | — | |
| Total current assets | 1,178,934 | | | 1,292,445 | |
PROPERTY, PLANT AND EQUIPMENT, net of accumulated depreciation of $1,011,274 and $898,184, respectively | 2,096,702 | | | 2,223,380 | |
| GOODWILL | 634,282 | | | 712,364 | |
INTANGIBLE ASSETS, net of accumulated amortization of $332,560 and $580,860, respectively | 939,978 | | | 1,058,668 | |
| INVESTMENTS IN UNCONSOLIDATED ENTITIES | 20,305 | | | 21,090 | |
| OPERATING LEASE RIGHT-OF-USE ASSETS | 97,155 | | | 90,220 | |
| OTHER NONCURRENT ASSETS | 52,738 | | | 57,977 | |
| Total assets | $ | 5,020,094 | | | $ | 5,456,144 | |
| LIABILITIES AND EQUITY | | | |
| CURRENT LIABILITIES: | | | |
| Accounts payable-trade | $ | 707,536 | | | $ | 927,591 | |
| Accounts payable-affiliates | 37 | | | 65 | |
| Accrued expenses and other payables | 213,757 | | | 133,616 | |
| Advance payments received from customers | 17,313 | | | 14,699 | |
| Current maturities of long-term debt | 7,000 | | | — | |
| Operating lease obligations | 31,090 | | | 34,166 | |
| Liabilities held for sale | 614 | | | — | |
| Total current liabilities | 977,347 | | | 1,110,137 | |
LONG-TERM DEBT, net of debt issuance costs of $49,178 and $30,117, respectively, and current maturities | 2,843,822 | | | 2,857,805 | |
| OPERATING LEASE OBLIGATIONS | 70,573 | | | 58,450 | |
| OTHER NONCURRENT LIABILITIES | 129,185 | | | 111,226 | |
| COMMITMENTS AND CONTINGENCIES (NOTE 8) | | | |
| | | |
CLASS D 9.00% PREFERRED UNITS, 600,000 and 600,000 preferred units issued and outstanding, respectively | 551,097 | | | 551,097 | |
| | | |
| EQUITY: | | | |
General partner, representing a 0.1% interest, 132,645 and 132,059 notional units, respectively | (52,834) | | | (52,551) | |
Limited partners, representing a 99.9% interest, 132,512,766 and 131,927,343 common units issued and outstanding, respectively | 134,807 | | | 455,564 | |
Class B preferred limited partners, 12,585,642 and 12,585,642 preferred units issued and outstanding, respectively | 305,468 | | | 305,468 | |
Class C preferred limited partners, 1,800,000 and 1,800,000 preferred units issued and outstanding, respectively | 42,891 | | | 42,891 | |
| Accumulated other comprehensive loss | (499) | | | (450) | |
| Noncontrolling interests | 18,237 | | | 16,507 | |
| Total equity | 448,070 | | | 767,429 | |
| Total liabilities and equity | $ | 5,020,094 | | | $ | 5,456,144 | |
The accompanying notes are an integral part of these consolidated financial statements.
NGL ENERGY PARTNERS LP AND SUBSIDIARIES
Consolidated Statements of Operations
(in Thousands, except unit and per unit amounts)
| | | | | | | | | | | | | | | | | |
| Year Ended March 31, |
| 2024 | | 2023 | | 2022 |
| REVENUES: | | | | | |
| Water Solutions | $ | 730,818 | | | $ | 697,038 | | | $ | 544,866 | |
| Crude Oil Logistics | 1,656,064 | | | 2,464,822 | | | 2,505,496 | |
| Liquids Logistics | 4,569,689 | | | 5,533,044 | | | 4,897,553 | |
| | | | | |
| Total Revenues | 6,956,571 | | | 8,694,904 | | | 7,947,915 | |
| COST OF SALES: | | | | | |
| Water Solutions | 11,294 | | | 14,100 | | | 33,980 | |
| Crude Oil Logistics | 1,521,190 | | | 2,250,934 | | | 2,352,932 | |
| Liquids Logistics | 4,435,247 | | | 5,383,809 | | | 4,752,400 | |
| Corporate and Other | (937) | | | 1,181 | | | — | |
| Total Cost of Sales | 5,966,794 | | | 7,650,024 | | | 7,139,312 | |
| OPERATING COSTS AND EXPENSES: | | | | | |
| Operating | 305,185 | | | 313,725 | | | 285,535 | |
| General and administrative | 121,881 | | | 71,818 | | | 63,546 | |
| Depreciation and amortization | 266,523 | | | 273,621 | | | 288,720 | |
| Loss on disposal or impairment of assets, net | 115,936 | | | 86,888 | | | 94,254 | |
| Revaluation of liabilities | 2,680 | | | 9,665 | | | (6,495) | |
| Operating Income | 177,572 | | | 289,163 | | | 83,043 | |
| OTHER INCOME (EXPENSE): | | | | | |
| Equity in earnings of unconsolidated entities | 4,120 | | | 4,120 | | | 1,400 | |
| Interest expense | (269,923) | | | (275,445) | | | (271,640) | |
| (Loss) gain on early extinguishment of liabilities, net | (55,281) | | | 6,177 | | | 1,813 | |
| Other income, net | 2,793 | | | 28,748 | | | 2,254 | |
| (Loss) Income Before Income Taxes | (140,719) | | | 52,763 | | | (183,130) | |
| INCOME TAX EXPENSE | (2,405) | | | (271) | | | (971) | |
| Net (Loss) Income | (143,124) | | | 52,492 | | | (184,101) | |
| LESS: NET INCOME ATTRIBUTABLE TO NONCONTROLLING INTERESTS | (631) | | | (1,106) | | | (655) | |
| NET (LOSS) INCOME ATTRIBUTABLE TO NGL ENERGY PARTNERS LP | $ | (143,755) | | | $ | 51,386 | | | $ | (184,756) | |
| NET LOSS ALLOCATED TO COMMON UNITHOLDERS (NOTE 3) | $ | (283,116) | | | $ | (73,232) | | | $ | (288,630) | |
| BASIC AND DILUTED LOSS PER COMMON UNIT | $ | (2.14) | | | $ | (0.56) | | | $ | (2.22) | |
| BASIC AND DILUTED WEIGHTED AVERAGE COMMON UNITS OUTSTANDING | 132,146,477 | | | 131,007,171 | | | 129,840,234 | |
| | | | | |
The accompanying notes are an integral part of these consolidated financial statements.
NGL ENERGY PARTNERS LP AND SUBSIDIARIES
Consolidated Statements of Comprehensive (Loss) Income
(in Thousands)
| | | | | | | | | | | | | | | | | |
| Year Ended March 31, |
| 2024 | | 2023 | | 2022 |
| Net (loss) income | $ | (143,124) | | | $ | 52,492 | | | $ | (184,101) | |
| Other comprehensive loss | (49) | | | (142) | | | (42) | |
| Comprehensive (loss) income | $ | (143,173) | | | $ | 52,350 | | | $ | (184,143) | |
The accompanying notes are an integral part of these consolidated financial statements.
NGL ENERGY PARTNERS LP AND SUBSIDIARIES
Consolidated Statements of Changes in Equity
For the Years Ended March 31, 2024, 2023, and 2022
(in Thousands, except unit amounts)
| | | | | | | | | | | | | | | | | | | | | | | | | | | | | | | | | | | | | | | | | | | | | | | |
| | | Limited Partners | | | | | | |
| | | Preferred | | Common | | | | | | |
| General
Partner | | Units | | Amount | |
Units | | Amount | | Accumulated Other Comprehensive Income (Loss) | | Noncontrolling
Interests | | Total
Equity |
| BALANCE AT MARCH 31, 2021 | $ | (52,189) | | | 14,385,642 | | | $ | 348,359 | | | 129,593,939 | | | $ | 582,784 | | | $ | (266) | | | $ | 69,471 | | | $ | 948,159 | |
| Distributions to noncontrolling interest owners | — | | | — | | | — | | | — | | | — | | | — | | | (1,635) | | | (1,635) | |
| Sawtooth joint venture disposition (Note 17) | — | | | — | | | — | | | — | | | — | | | — | | | (51,097) | | | (51,097) | |
| Common unit repurchases and cancellations | — | | | — | | | — | | | (44,769) | | | (90) | | | — | | | — | | | (90) | |
| Equity issued pursuant to incentive compensation plan | — | | | — | | | — | | | 1,146,800 | | | 3,259 | | | — | | | — | | | 3,259 | |
| Net (loss) income | (289) | | | — | | | — | | | — | | | (184,467) | | | — | | | 655 | | | (184,101) | |
| Other comprehensive loss | — | | | — | | | — | | | — | | | — | | | (42) | | | — | | | (42) | |
| BALANCE AT MARCH 31, 2022 | (52,478) | | | 14,385,642 | | | 348,359 | | | 130,695,970 | | | 401,486 | | | (308) | | | 17,394 | | | 714,453 | |
| Distributions to noncontrolling interest owners | — | | | — | | | — | | | — | | | — | | | — | | | (1,993) | | | (1,993) | |
| Common unit repurchases and cancellations | — | | | — | | | — | | | (55,702) | | | (99) | | | — | | | — | | | (99) | |
| Equity issued pursuant to incentive compensation plan | — | | | — | | | — | | | 1,287,075 | | | 2,718 | | | — | | | — | | | 2,718 | |
| Net (loss) income | (73) | | | — | | | — | | | — | | | 51,459 | | | — | | | 1,106 | | | 52,492 | |
| Other comprehensive loss | — | | | — | | | — | | | — | | | — | | | (142) | | | — | | | (142) | |
| BALANCE AT MARCH 31, 2023 | (52,551) | | | 14,385,642 | | | 348,359 | | | 131,927,343 | | | 455,564 | | | (450) | | | 16,507 | | | 767,429 | |
| Distributions to preferred unitholders (Note 9) | — | | | — | | | — | | | — | | | (178,299) | | | — | | | — | | | (178,299) | |
| Distributions to noncontrolling interest owners | — | | | — | | | — | | | — | | | — | | | — | | | (1,586) | | | (1,586) | |
| Contributions from noncontrolling interest owners (Note 17) | — | | | — | | | — | | | — | | | — | | | — | | | 2,685 | | | 2,685 | |
| Common unit repurchases and cancellations (Note 9) | — | | | — | | | — | | | (21,302) | | | (84) | | | — | | | — | | | (84) | |
| Equity issued pursuant to incentive compensation plan (Note 9) | — | | | — | | | — | | | 606,725 | | | 1,098 | | | — | | | — | | | 1,098 | |
| Net (loss) income | (283) | | | — | | | — | | | — | | | (143,472) | | | — | | | 631 | | | (143,124) | |
| Other comprehensive loss | — | | | — | | | — | | | — | | | — | | | (49) | | | — | | | (49) | |
| BALANCE AT MARCH 31, 2024 | $ | (52,834) | | | 14,385,642 | | | $ | 348,359 | | | 132,512,766 | | | $ | 134,807 | | | $ | (499) | | | $ | 18,237 | | | $ | 448,070 | |
The accompanying notes are an integral part of these consolidated financial statements.`
NGL ENERGY PARTNERS LP AND SUBSIDIARIES
Consolidated Statements of Cash Flows
(in Thousands)
| | | | | | | | | | | | | | | | | |
| Year Ended March 31, |
| 2024 | | 2023 | | 2022 |
| OPERATING ACTIVITIES: | | | | | |
| Net (loss) income | $ | (143,124) | | | $ | 52,492 | | | $ | (184,101) | |
| Adjustments to reconcile net (loss) income to net cash provided by operating activities: | | | | | |
| Depreciation and amortization, including amortization of debt issuance costs | 282,731 | | | 290,879 | | | 306,208 | |
| Loss (gain) on early extinguishment or revaluation of liabilities, net | 57,961 | | | 3,488 | | | (8,308) | |
| Equity-based compensation expense | 1,098 | | | 2,718 | | | (1,052) | |
| Loss on disposal or impairment of assets, net | 115,936 | | | 86,888 | | | 94,254 | |
| Change in provision for expected credit losses | 471 | | | (385) | | | 929 | |
| Net adjustments to fair value of derivatives | 1,047 | | | 5,383 | | | 116,556 | |
| Equity in earnings of unconsolidated entities | (4,120) | | | (4,120) | | | (1,400) | |
| Distributions of earnings from unconsolidated entities | 5,190 | | | 4,627 | | | 2,205 | |
| Lower of cost or net realizable value adjustments | 4,564 | | | 3,227 | | | 14,761 | |
| Other | 3,239 | | | 1,827 | | | 2,310 | |
| Changes in operating assets and liabilities, exclusive of acquisitions: | | | | | |
| Accounts receivable-trade and affiliates | 230,368 | | | 86,629 | | | (397,607) | |
| Inventories | 7,104 | | | 85,050 | | | (119,806) | |
| Other current and noncurrent assets | 28,195 | | | 20,848 | | | 40,158 | |
| Accounts payable-trade and affiliates | (219,997) | | | (155,883) | | | 405,420 | |
| Other current and noncurrent liabilities | 5,501 | | | (38,482) | | | (64,681) | |
| Net cash provided by operating activities | 376,164 | | | 445,186 | | | 205,846 | |
| INVESTING ACTIVITIES: | | | | | |
| Capital expenditures | (152,295) | | | (147,765) | | | (142,359) | |
| | | | | |
| Net settlements of derivatives | (1,022) | | | 54,430 | | | (152,055) | |
| Proceeds from sales of assets | 53,246 | | | 45,978 | | | 18,500 | |
| Proceeds from divestitures of businesses and investments, net | 16,000 | | | 111,633 | | | 63,489 | |
| Investments in unconsolidated entities | (258) | | | (88) | | | (350) | |
| Distributions of capital from unconsolidated entities | 568 | | | — | | | 367 | |
| Net cash (used in) provided by investing activities | (83,761) | | | 64,188 | | | (212,408) | |
| FINANCING ACTIVITIES: | | | | | |
| Proceeds from borrowings under ABL Facility | 1,652,000 | | | 2,007,000 | | | 1,815,000 | |
| Payments on ABL Facility | (1,790,000) | | | (1,985,000) | | | (1,703,000) | |
| Issuance of secured debt | 2,894,873 | | | — | | | — | |
| Repayment and repurchase of senior secured and unsecured notes | (2,781,067) | | | (479,302) | | | (83,167) | |
| | | | | |
| Payments on other long-term debt | — | | | (43,278) | | | (7,390) | |
| Debt issuance costs | (53,170) | | | (3,294) | | | (12,932) | |
| Distributions to preferred unitholders | (178,299) | | | — | | | — | |
| Distributions to noncontrolling interest owners | (1,586) | | | (1,993) | | | (1,635) | |
| Common unit repurchases and cancellations | (84) | | | (99) | | | (90) | |
| Payments to settle contingent consideration liabilities | (1,576) | | | (1,789) | | | (1,231) | |
| Principal payments of finance lease | (16) | | | (10) | | | — | |
| Net cash (used in) provided by financing activities | (258,925) | | | (507,765) | | | 5,555 | |
| Net increase (decrease) in cash and cash equivalents | 33,478 | | | 1,609 | | | (1,007) | |
| Cash and cash equivalents, beginning of period | 5,431 | | | 3,822 | | | 4,829 | |
| Cash and cash equivalents, end of period | $ | 38,909 | | | $ | 5,431 | | | $ | 3,822 | |
| Supplemental cash flow information: | | | | | |
| Cash interest paid | $ | 247,395 | | | $ | 265,420 | | | $ | 254,814 | |
| Income taxes paid (net of income tax refunds) | $ | 3,250 | | | $ | 3,410 | | | $ | 2,480 | |
| Supplemental non-cash investing and financing activities: | | | | | |
| | | | | |
| Accrued capital expenditures | $ | 9,626 | | | $ | 7,533 | | | $ | 14,558 | |
The accompanying notes are an integral part of these consolidated financial statements.
NGL ENERGY PARTNERS LP AND SUBSIDIARIES
Notes to Consolidated Financial Statements
Note 1—Organization and Operations
NGL Energy Partners LP, a Delaware master limited partnership (“we,” “us,” “our,” or the “Partnership”), was formed in September 2010. NGL Energy Holdings LLC serves as our general partner (“GP”). At March 31, 2024, our operations included three segments:
•Our Water Solutions segment transports, treats, recycles and disposes of produced and flowback water generated from crude oil and natural gas production. We also sell produced water for reuse and recycle and brackish non-potable water to our producer customers to be used in their crude oil exploration and production activities. As part of processing water, we aggregate and sell recovered crude oil, also known as skim oil. We also dispose of solids such as tank bottoms, drilling fluids and drilling muds and perform other ancillary services such as truck and frac tank washouts. Our activities in this segment are underpinned by long-term, fixed fee contracts and acreage dedications, some of which contain minimum volume commitments with leading oil and gas companies including large, investment grade producer customers.
•Our Crude Oil Logistics segment purchases crude oil from producers and marketers and transports it to refineries or for resale at pipeline injection stations, storage terminals, barge loading facilities, rail facilities, refineries, and other trade hubs, and provides storage, terminaling and transportation services through its owned assets. Our activities in this segment are supported by certain long-term, fixed rate contracts which include minimum volume commitments on our owned and leased pipelines and storage tanks.
•Our Liquids Logistics segment conducts supply operations for natural gas liquids, refined petroleum products and biodiesel to a broad range of commercial, retail and industrial customers across the United States and Canada. These operations are conducted through our 23 owned terminals, third-party storage and terminal facilities, nine common carrier pipelines and a fleet of leased railcars. We also provide services for marine exports of butane through our facility located in Chesapeake, Virginia, and we also own a propane pipeline in Michigan. We attempt to reduce our exposure to price fluctuations by using back-to-back physical contracts and pre-sale agreements that allow us to lock in a margin on a percentage of our winter volumes. We also enter into financially settled derivative contracts as economic hedges of our physical inventory, physical sales and physical purchase contracts.
Note 2—Significant Accounting Policies
Basis of Presentation
Our consolidated financial statements are prepared in accordance with accounting principles generally accepted in the United States (“GAAP”). The accompanying consolidated financial statements include our accounts and those of our controlled subsidiaries. Intercompany transactions and account balances have been eliminated in consolidation. Investments we do not control, but can exercise significant influence over, are accounted for using the equity method of accounting. We also own an undivided interest in a crude oil pipeline, and include our proportionate share of assets, liabilities, and expenses related to this pipeline in our consolidated financial statements.
Use of Estimates
The preparation of consolidated financial statements in conformity with GAAP requires us to make estimates and assumptions that affect the amount of assets and liabilities reported at the date of the consolidated financial statements and the amount of revenues and expenses reported during the periods presented.
Critical accounting estimates we make in the preparation of our consolidated financial statements include, among others, determining the impairment of goodwill and long-lived assets, useful lives and recoverability of property, plant and equipment and amortizable intangible assets, the fair value of derivative instruments, estimating certain revenues, the fair value of asset retirement obligations, the fair value of assets and liabilities acquired in acquisitions, the recoverability of inventories, the collectability of accounts and notes receivable and accruals for environmental matters. Although we believe these estimates are reasonable, actual results could differ from those estimates.
Fair Value Measurements
Fair value is defined as the price that would be received to sell an asset or paid to transfer a liability (an exit price) in an orderly transaction between market participants at the measurement date. Fair value is based upon assumptions that market
NGL ENERGY PARTNERS LP AND SUBSIDIARIES
Notes to Consolidated Financial Statements (Continued)
participants would use when pricing an asset or liability. We use the following fair value hierarchy, which prioritizes valuation technique inputs used to measure fair value into three broad levels:
•Level 1: Quoted prices in active markets for identical assets and liabilities that we have the ability to access at the measurement date.
•Level 2: Inputs (other than quoted prices included within Level 1) that are either directly or indirectly observable for the asset or liability, including (i) quoted prices for similar assets or liabilities in active markets, (ii) quoted prices for identical or similar assets or liabilities in inactive markets, (iii) inputs other than quoted prices that are observable for the asset or liability, and (iv) inputs that are derived from observable market data by correlation or other means. Instruments categorized in Level 2 include non-exchange traded derivative financial instruments such as over-the-counter commodity price swap and option contracts and forward commodity contracts. We determine the fair value of all of our derivative financial instruments utilizing pricing models for similar instruments. Inputs to the pricing models include publicly available prices and forward curves generated from a compilation of data gathered from third parties.
•Level 3: Unobservable inputs for the asset or liability including situations where there is little, if any, market activity for the asset or liability.
The fair value hierarchy gives the highest priority to quoted prices in active markets (Level 1) and the lowest priority to unobservable inputs (Level 3). In some cases, the inputs used to measure fair value might fall into different levels of the fair value hierarchy. The lowest level input that is significant to a fair value measurement determines the applicable level in the fair value hierarchy. Assessing the significance of a particular input to a fair value measurement requires judgment, considering factors specific to the asset or liability.
Derivative Financial Instruments
We record all derivative financial instrument contracts at fair value in our consolidated balance sheets except for normal purchase and normal sale transactions that are expected to result in physical delivery. For these transactions, we do not record the physical contracts at fair value at each balance sheet date; instead, we record the purchase or sale at the contracted value once the delivery occurs. We periodically enter into interest rate swaps to hedge variability in interest rates and effectively lock in the benchmark interest rate at the inception of the swap.
We have not designated any financial instruments as hedges for accounting purposes. All changes in the fair value of our physical contracts that do not qualify as normal purchases and normal sales and settlements (whether cash transactions or non-cash mark-to-market adjustments) are reported either within revenue (for sales contracts) or cost of sales (for purchase contracts) in our consolidated statements of operations, regardless of whether the contract is physically or financially settled, and within cash flows from operations in our consolidated statements of cash flows. The change in the fair value of our interest rate swap is recorded as a net gain or loss within interest expense in our consolidated statement of operations and within cash flows from operations in our consolidated statements of cash flows.
We utilize various commodity derivative financial instrument contracts to attempt to reduce our exposure to price fluctuations. We do not enter into such contracts for trading purposes. Changes in assets and liabilities from commodity derivative financial instruments result primarily from changes in market prices, newly originated transactions, and the timing of settlements and are reported within cost of sales on the consolidated statements of operations, along with related settlements. We attempt to balance our contractual portfolio in terms of notional amounts and timing of performance and delivery obligations. However, net unbalanced positions can exist or are established based on our assessment of anticipated market movements. Inherent in the resulting contractual portfolio are certain business risks, including commodity price risk and credit risk. Commodity price risk is the risk that the market value of crude oil, natural gas liquids, or refined and renewables products will change, either favorably or unfavorably, in response to changing market conditions. Credit risk is the risk of loss from nonperformance by suppliers, customers or financial counterparties to a contract. Procedures and limits for managing commodity price risks and credit risks are specified in our market risk policy and credit policy, respectively. Open commodity positions and market price changes are monitored daily and are reported to senior management and to marketing operations personnel. Credit risk is monitored daily and exposure is minimized through customer deposits, letters of credit, monitoring customer receivables relative to previously-approved credit limits, restrictions on product liftings, entering into master netting agreements that allow for offsetting counterparty receivable and payable balances for certain transactions, reviewing the receivable aging and suspending sales to customers that have not timely paid outstanding invoices.
NGL ENERGY PARTNERS LP AND SUBSIDIARIES
Notes to Consolidated Financial Statements (Continued)
Cost of Sales
We include all costs we incur to acquire products, including the costs of purchasing, terminaling, and transporting inventory, prior to delivery to our customers, in cost of sales.
Depreciation and Amortization
Depreciation and amortization in our consolidated statements of operations includes all depreciation of our property, plant and equipment and amortization of intangible assets other than debt issuance costs, for which the amortization is recorded to interest expense and certain contract-based intangible assets, for which the amortization is recorded to either cost of sales or operating expense.
Income Taxes
We qualify as a partnership for income tax purposes. As such, we generally do not pay federal income tax. Rather, each owner reports his or her share of our income or loss on his or her individual tax return. The aggregate difference in the basis of our net assets for financial and tax reporting purposes cannot be readily determined, as we do not have access to information regarding each partner’s basis in the Partnership.
We have certain taxable corporate subsidiaries in the United States and Canada, and our operations in Texas are subject to a state franchise tax that is calculated based on revenues net of cost of sales. Our fiscal years 2020 to 2023 generally remain subject to examination by federal, state, and Canadian tax authorities. We utilize the asset and liability method of accounting for income taxes. Under this method, deferred tax assets and liabilities are recognized for the future tax consequences attributable to differences between the financial statement carrying value of existing assets and liabilities and their respective tax bases. Deferred tax assets and liabilities are measured using enacted tax rates expected to apply in the years in which these temporary differences are expected to be recovered or settled. Changes in tax rates are recognized in income in the period that includes the enactment date.
A publicly traded partnership is required to generate at least 90% of its gross income (as defined for federal income tax purposes) from certain qualifying sources. Income generated by our taxable corporate subsidiaries is excluded from this qualifying income calculation. Although we routinely generate income outside of our corporate subsidiaries that is non-qualifying, we believe that at least 90% of our gross income has been qualifying income for each of the calendar years since our initial public offering.
We have a deferred tax liability of $38.0 million and $40.7 million at March 31, 2024 and 2023, respectively, as a result of acquiring corporations in connection with certain of our acquisitions, which is included within other noncurrent liabilities in our consolidated balance sheets. The deferred tax liability is the tax effected cumulative temporary difference between the GAAP basis and tax basis of the acquired assets within the corporation. For GAAP purposes, certain of the acquired assets will be depreciated and amortized over time which will lower the GAAP basis. The deferred tax benefit recorded during the year ended March 31, 2024 was $1.2 million with an effective tax rate of 31.7%. The deferred tax benefit recorded during the year ended March 31, 2023 was $2.3 million with an effective tax rate of 27.5%.
We evaluate uncertain tax positions for recognition and measurement in the consolidated financial statements. To recognize a tax position, we determine whether it is more likely than not that the tax position will be sustained upon examination, including resolution of any related appeals or litigation, based on the technical merits of the position. A tax position that meets the more likely than not threshold is measured to determine the amount of benefit to be recognized in the consolidated financial statements. We had no uncertain tax positions that required recognition in our consolidated financial statements at March 31, 2024 or 2023.
Cash and Cash Equivalents
Management considers all highly liquid investments with a maturity of three months or less, when purchased, to be cash equivalents. We place our cash and cash equivalents with financial institutions that are insured by the Federal Deposit Insurance Corporation; however, we maintain deposits in banks which exceed the amount of deposit insurance available. Management routinely assesses the financial condition of the institutions and believes that any possible credit loss would be minimal.
NGL ENERGY PARTNERS LP AND SUBSIDIARIES
Notes to Consolidated Financial Statements (Continued)
Accounts Receivable and Concentration of Credit Risk
We operate in the United States and Canada. We grant unsecured credit to customers under normal industry standards and terms, and have established policies and procedures that allow for an evaluation of each customer’s creditworthiness as well as general economic conditions. See Note 16 for a further discussion of our allowance for expected credit losses.
We execute master netting agreements with certain customers to mitigate our credit risk. Receivables and payables are reflected at a net balance to the extent a master netting agreement is in place and we intend to settle on a net basis.
We did not have any customers that represented over 10% of our consolidated revenues for the years ended March 31, 2024 or 2023. CITGO Petroleum Corporation accounted for 12.8% of our consolidated revenues for the year ended March 31, 2022. The majority of the revenue for this customer pertains to our Crude Oil Logistics segment activities.
Inventories
Our inventories are valued at the lower of cost or net realizable value, with cost determined using either the weighted-average cost or the first in, first out (FIFO) methods, including the cost of transportation and storage, and with net realizable value defined as the estimated selling price in the ordinary course of business, less reasonably predictable costs of completion, disposal, and transportation. In performing this analysis, we consider fixed-price forward commitments.
Inventories consist of the following at the dates indicated:
| | | | | | | | | | | | | | |
| | March 31, |
| | 2024 | | 2023 |
| | (in thousands) |
| Crude oil | | $ | 44,056 | | | $ | 49,586 | |
| Propane | | 34,225 | | | 46,910 | |
| Butane | | 20,400 | | | 18,384 | |
| Biodiesel | | 18,919 | | | 19,778 | |
| Diesel | | 5,361 | | | 2,536 | |
| Other (1) | | 7,946 | | | 5,413 | |
| Total | | $ | 130,907 | | | $ | 142,607 | |
(1) Includes less than $0.1 million of ethanol inventory that was separately reported as an individual line item in our Annual Report on Form 10-K for the year ended March 31, 2023 (“2023 Annual Report”).
Investments in Unconsolidated Entities
Investments we do not control, but can exercise significant influence over, are accounted for using the equity method of accounting. Investments in partnerships and limited liability companies, unless our investment is considered to be minor, and investments in unincorporated joint ventures are also accounted for using the equity method of accounting. Under the equity method, we do not report the individual assets and liabilities of these entities on our consolidated balance sheets; instead, our ownership interests are reported within investments in unconsolidated entities on our consolidated balance sheets. Under the equity method, the investment is recorded at acquisition cost, increased by our proportionate share of any earnings and additional capital contributions and decreased by our proportionate share of any losses, distributions paid, and amortization of any excess investment. Excess investment is the amount by which our total investment exceeds our proportionate share of the net assets of the investee. We consider distributions received from unconsolidated entities which do not exceed cumulative equity in earnings subsequent to the date of investment to be a return on investment and are classified as operating activities in our consolidated statements of cash flows. We consider distributions received from unconsolidated entities in excess of cumulative equity in earnings subsequent to the date of investment to be a return of investment and are classified as investing activities in our consolidated statements of cash flows.
At March 31, 2024, cumulative equity earnings and cumulative distributions of our unconsolidated entities since they were acquired were $14.7 million and $19.8 million, respectively.
NGL ENERGY PARTNERS LP AND SUBSIDIARIES
Notes to Consolidated Financial Statements (Continued)
Our investments in unconsolidated entities consist of the following at the dates indicated:
| | | | | | | | | | | | | | | | | | | | | | | | | | |
| | | | | | March 31, |
| Entity | | Segment | | Ownership Interest | | 2024 | | 2023 |
| | | | | | (in thousands) |
| Water services and land company | | Water Solutions | | 50% | | $ | 15,228 | | | $ | 15,036 | |
| Water services and land company | | Water Solutions | | 10% | | 2,926 | | | 3,511 | |
| Water services and land company | | Water Solutions | | 50% | | 2,026 | | | 2,071 | |
| Natural gas liquids terminal company | | Liquids Logistics | | 50% | | 125 | | | 164 | |
| Aircraft company (1) | | Corporate and Other | | 50% | | — | | | 308 | |
| Total | | | | | | $ | 20,305 | | | $ | 21,090 | |
(1) This is an investment with a related party. As the distributions we received exceeded our investment, a gain of $0.6 million was recorded within other income, net in our consolidated statement of operations for the year ended March 31, 2024 as the excess distributions are not refundable. The investee was dissolved on April 30, 2024.
Other Noncurrent Assets
Other noncurrent assets consist of the following at the dates indicated:
| | | | | | | | | | | | | | |
| | March 31, |
| | 2024 | | 2023 |
| | (in thousands) |
| Linefill (1) | | $ | 37,861 | | | $ | 37,861 | |
| Loan receivable (2) | | 4,776 | | | 8,592 | |
| Minimum shipping fees - pipeline commitments (3) | | 356 | | | 4,628 | |
| Other | | 9,745 | | | 6,896 | |
| Total | | $ | 52,738 | | | $ | 57,977 | |
(1) Represents minimum volumes of product we are required to leave on certain third-party owned pipelines under long-term shipment commitments. At March 31, 2024 and 2023, linefill consisted of 502,686 barrels of crude oil. Linefill held in pipelines we own is included within property, plant and equipment (see Note 4).
(2) Represents the noncurrent portion of loan receivables, net of allowances for expected credit losses, primarily related to the sale of certain saltwater disposal assets (see Note 17). At March 31, 2024 and 2023, the loan receivable balance was $7.5 million and $8.6 million, respectively, of which $2.7 million, which includes interest receivable, is recorded within prepaid expenses and other current assets in our March 31, 2024 consolidated balance sheet.
(3) Represents the noncurrent portion of minimum shipping fees paid in excess of volumes shipped, or deficiency credits, for a contract with a crude oil pipeline operator. This amount can be recovered when volumes shipped exceed the minimum monthly volume commitment. At March 31, 2024 and 2023, the deficiency credit was $4.6 million and $8.9 million, respectively, of which $4.3 million and $4.3 million, respectively, are recorded within prepaid expenses and other current assets in our consolidated balance sheets.
Accrued Expenses and Other Payables
Accrued expenses and other payables consist of the following at the dates indicated:
| | | | | | | | | | | | | | |
| | March 31, |
| | 2024 | | 2023 |
| | (in thousands) |
| Accrued interest (1) | | $ | 58,335 | | | $ | 49,362 | |
| Derivative liabilities | | 36,679 | | | 14,752 | |
| Accrued compensation and benefits | | 34,708 | | | 27,013 | |
| Excise and other tax liabilities | | 18,003 | | | 11,777 | |
| Product exchange liabilities | | 3,366 | | | 4,047 | |
| Other (1) | | 62,666 | | | 26,665 | |
| Total | | $ | 213,757 | | | $ | 133,616 | |
(1) Includes amounts accrued related to the LCT Capital, LLC legal matter (see Note 8).
NGL ENERGY PARTNERS LP AND SUBSIDIARIES
Notes to Consolidated Financial Statements (Continued)
Amounts in the table above do not include accrued expenses and other payables related to the sale of certain freshwater water solutions facilities, as these amounts have been classified as liabilities held for sale within our March 31, 2024 consolidated balance sheet (see Note 17).
Property, Plant and Equipment
We record property, plant and equipment at cost less accumulated depreciation. Acquisitions and improvements are capitalized, and maintenance and repairs are expensed as incurred. As we dispose of assets, we remove the cost and related accumulated depreciation from the accounts, and any resulting gain or loss is included within loss on disposal or impairment of assets, net. We compute depreciation expense of our property, plant and equipment using the straight-line method over the estimated useful lives of the assets (see Note 4).
Intangible Assets
Our intangible assets include contracts and arrangements acquired in business combinations, including customer relationships, customer commitments, pipeline capacity rights, rights-of-way and easements, water rights, executory contracts and other agreements, covenants not to compete, and trade names. In addition, we capitalize certain debt issuance costs associated with the ABL Facility (as defined herein). We amortize the majority of our intangible assets on a straight-line basis over the estimated useful lives of the assets (see Note 6). We amortize debt issuance costs over the terms of the related debt using a method that approximates the effective interest method.
Impairment of Long-Lived Assets
We evaluate the carrying value of our long-lived assets (property, plant and equipment and amortizable intangible assets) for potential impairment when events and circumstances warrant such a review. A long-lived asset group is considered impaired when the anticipated undiscounted future cash flows from the use and eventual disposition of the asset group is less than its carrying value. If the carrying value is not recoverable, an impairment loss is measured as the excess of the asset’s carrying value over its estimated fair value. When we cease to use an acquired trade name, we test the trade name for impairment using the relief from royalty method and we begin amortizing the trade name over its estimated useful life as a defensive asset. See Note 4 and Note 6 for a further discussion of long-lived asset impairments recognized in the consolidated statements of operations.
We evaluate our investments in unconsolidated entities for impairment whenever events or changes in circumstances indicate, in management’s judgment, that the fair value of such investment may have experienced a decline to less than its carrying value and the decline is other than temporary.
Goodwill
Goodwill represents the excess of the purchase price of the acquired businesses over the net fair value of acquired assets and assumed liabilities. Business combinations are accounted for using the “acquisition method.” We expect that all of our goodwill at March 31, 2024 is deductible for federal income tax purposes.
Goodwill and indefinite-lived intangible assets are not amortized, but instead are evaluated for impairment at least annually. We perform our annual assessment of impairment on January 1 of our fiscal year, and more frequently if circumstances warrant.
For purposes of the goodwill impairment assessment, assets are grouped into “reporting units.” A reporting unit is either an operating segment or a component of an operating segment, depending on how similar the components of the operating segment are to each other in terms of operational and economic characteristics. For each reporting unit, we perform a qualitative assessment of relevant events and circumstances about the likelihood of goodwill impairment. If it is deemed more likely than not that the fair value of the reporting unit is less than its carrying value, we calculate the fair value of the reporting unit. Otherwise, further testing is not required. If the fair value of the reporting unit (including its inherent goodwill) is less than its carrying value, an impairment loss is recognized to the extent that the implied fair value of the goodwill of the reporting unit is less than its carrying value, limited to the total amount of goodwill for the reporting unit.
Estimates and assumptions used to perform the impairment evaluation are inherently uncertain and can significantly affect the outcome of the analysis. The estimates and assumptions we used in the annual goodwill impairment assessment included market participant considerations and future forecasted operating results. Changes in operating results and other
NGL ENERGY PARTNERS LP AND SUBSIDIARIES
Notes to Consolidated Financial Statements (Continued)
assumptions could materially affect these estimates. See Note 5 for a further discussion and analysis of our goodwill impairment assessment.
Product Exchanges
Quantities of products receivable or returnable under exchange agreements are reported within prepaid expenses and other current assets and within accrued expenses and other payables in our consolidated balance sheets. We estimate the value of product exchange assets and liabilities based on the weighted-average cost basis of the inventory we have delivered or will deliver on the exchange, plus or minus location differentials.
Noncontrolling Interests
Noncontrolling interests represent the portion of certain consolidated subsidiaries that are owned by third-parties. Amounts are adjusted by the noncontrolling interest holder’s proportionate share of the subsidiaries’ earnings or losses each period and any distributions that are paid. Noncontrolling interests are reported as a component of equity, unless the noncontrolling interest is considered redeemable, in which case the noncontrolling interest is recorded between liabilities and equity (mezzanine or temporary equity) in our consolidated balance sheet.
Acquisitions
To determine if a transaction should be accounted for as a business combination or an acquisition of assets, we first calculate the relative fair values of the assets acquired. If substantially all of the relative fair value is concentrated in a single asset or group of similar assets, or if not but the transaction does not include a significant process (does not meet the definition of a business), we record the transaction as an acquisition of assets. For acquisitions of assets, the purchase price is allocated based on the relative fair values and goodwill is not recorded. All other transactions are recorded as business combinations. We record the assets acquired and liabilities assumed in a business combination at their acquisition date fair values. For a business combination, the excess of the purchase price over the net fair value of acquired assets and assumed liabilities is recorded as goodwill, which is not amortized but instead is evaluated for impairment at least annually (as described above).
Pursuant to GAAP, an entity is allowed a reasonable period of time (not to exceed one year) to obtain the information necessary to identify and measure the fair value of the assets acquired and liabilities assumed in a business combination.
Reclassifications
We have reclassified certain prior period financial statement information to be consistent with the classification methods used in the current fiscal year. At March 31, 2024 and 2023, ethanol inventory is included in Other in “Inventories” above. Also, for the years ended March 31, 2024, 2023 and 2022, certain revenues are included in Disposal Services Fees in Note 11. These reclassifications did not impact previously reported amounts of assets, liabilities, equity, net income or cash flows.
Recent Accounting Pronouncements
In December 2023, the Financial Accounting Standards Board (“FASB”) issued Accounting Standards Update (“ASU”) No. 2023-09, Income Taxes (Topic 740): Improvements to Income Tax Disclosures, which includes amendments that further enhance income tax disclosures, primarily through standardization and disaggregation of rate reconciliation categories and income taxes paid by jurisdiction. The ASU is effective for the Partnership’s fiscal year beginning April 1, 2025, with early adoption permitted. The amendments are required to be applied prospectively with retrospective application permitted. We are currently evaluating the ASU to determine its impact on our financial statement disclosures.
In December 2023, the FASB issued ASU No. 2023-08, Intangibles-Goodwill and Other-Crypto Assets (Subtopic 350-60): Accounting for and Disclosure of Crypto Assets, which includes amendments intended to improve the accounting for and disclosure of crypto assets. The ASU requires crypto assets to be measured at fair value each reporting period and for changes from remeasurement to be recognized in net income. The ASU also requires enhanced disclosures for both annual and interim reporting periods to provide investors with relevant information to analyze and assess the exposure and risk of significant individual crypto asset holdings. The ASU is effective for the Partnership’s fiscal year beginning April 1, 2025, including interim periods during that fiscal year, with early adoption permitted and requires a cumulative-effect adjustment upon adoption. This ASU does not currently impact our financial statements.
NGL ENERGY PARTNERS LP AND SUBSIDIARIES
Notes to Consolidated Financial Statements (Continued)
In November 2023, the FASB issued ASU No. 2023-07, Segment Reporting (Topic 280): Improvements to Reportable Segment Disclosures, which includes amendments intended to improve reportable segment disclosure requirements primarily through enhanced disclosures about significant segment expenses. The ASU is effective for the Partnership’s fiscal year beginning April 1, 2024, and interim periods within our fiscal year beginning April 1, 2025, with early adoption permitted and requires retrospective application. We are currently evaluating the ASU to determine its impact on our financial statement disclosures.
In August 2020, the FASB issued ASU No. 2020-06, “Debt - Debt with Conversion and Other Options (Subtopic 470-20) and Derivatives and Hedging - Contracts in Entity’s Own Equity (Subtopic 815-40): Accounting for Convertible Instruments and Contracts in an Entity’s Own Equity.” This ASU (i) simplifies an issuer’s accounting for convertible instruments by eliminating two of the three models in Accounting Standards Codification (“ASC”) 470-20 that require separate accounting for embedded conversion features, (ii) amends diluted earnings per share calculations for convertible instruments by requiring the use of the if-converted method and (iii) simplifies the settlement assessment entities are required to perform on contracts that can potentially settle in an entity’s own equity by removing certain requirements. We adopted this guidance on April 1, 2022 using the modified retrospective method. Under our Class D Preferred Unit (as defined in Note 9) agreement, we are permitted to issue common units to redeem a portion of the outstanding Class D Preferred Units. Using the if-converted method, we expect our calculation of earnings per unit to be impacted by both an increase in the number of diluted weighted average common units outstanding and a decrease in the amount of Class D Preferred Unit distributions, when they are determined to be dilutive. Other than the potential impact to our future earnings per unit calculations, the adoption of this guidance did not impact our financial position, results of operations or cash flows related to any debt or preferred units issued prior to adoption.
In March 2020, the FASB issued ASU 2020-04, Reference Rate Reform (Topic 848): Facilitation of the Effects of Reference Rate Reform on Financial Reporting. The ASU provides optional expedients and exceptions for applying GAAP to contracts, hedging relationships and other transactions that reference the London Interbank Offered Rate (“LIBOR”) interest rate or another reference rate expected to be discontinued because of reference rate reform. In December 2022, the FASB issued ASU 2022-06, Reference Rate Reform (Topic 848): Deferral of the Sunset Date of Topic 848 which deferred the sunset date from December 31, 2022 to December 31, 2024 and left all other provisions of ASU 2020-04 unchanged. On April 13, 2022, the ABL Facility (as defined herein) was amended to replace the LIBOR benchmark with the SOFR (as defined herein) benchmark (as discussed further in Note 7). We are continuing to evaluate the effect that this guidance will have on our financial position, results of operations and cash flows.
Note 3—Loss Per Common Unit
The following table presents our calculation of basic and diluted weighted average common units outstanding for the periods indicated:
| | | | | | | | | | | | | | | | | | | | |
| | Year Ended March 31, |
| | 2024 | | 2023 | | 2022 |
| Weighted average common units outstanding during the period: | | | | | | |
| Common units - Basic | | 132,146,477 | | | 131,007,171 | | | 129,840,234 | |
| | | | | | |
| | | | | | |
| Common units - Diluted | | 132,146,477 | | | 131,007,171 | | | 129,840,234 | |
For the years ended March 31, 2024, 2023 and 2022, all potential common units or convertible securities were considered antidilutive.
Our loss per common unit is as follows for the periods indicated:
| | | | | | | | | | | | | | | | | | | | |
| | Year Ended March 31, |
| | 2024 | | 2023 | | 2022 |
| | (in thousands, except unit and per unit amounts) |
| Net (loss) income | | $ | (143,124) | | | $ | 52,492 | | | $ | (184,101) | |
| Less: Net income attributable to noncontrolling interests | | (631) | | | (1,106) | | | (655) | |
| Net (loss) income attributable to NGL Energy Partners LP | | (143,755) | | | 51,386 | | | (184,756) | |
| Less: Distributions to preferred unitholders (1) | | (139,644) | | | (124,691) | | | (104,163) | |
| Less: Net loss allocated to GP (2) | | 283 | | | 73 | | | 289 | |
| Net loss allocated to common unitholders | | $ | (283,116) | | | $ | (73,232) | | | $ | (288,630) | |
| Basic and diluted loss per common unit | | $ | (2.14) | | | $ | (0.56) | | | $ | (2.22) | |
NGL ENERGY PARTNERS LP AND SUBSIDIARIES
Notes to Consolidated Financial Statements (Continued)
(1) Includes cumulative distributions for the years ended March 31, 2024, 2023 and 2022 which were earned but not declared or paid (see Note 9 for a further discussion of the suspension of common unit and preferred unit distributions).
(2) Net loss allocated to the GP includes distributions to which it is entitled as the holder of incentive distribution rights.
Note 4—Property, Plant and Equipment
Our property, plant and equipment consists of the following at the dates indicated:
| | | | | | | | | | | | | | | | | | | | | | | | | | |
| | Estimated | | March 31, |
| Description | | Useful Lives | | 2024 | | 2023 |
| | (in years) | | (in thousands) |
| Water treatment facilities and equipment | | 3 | - | 30 | | $ | 2,055,565 | | | $ | 2,040,792 | |
| Pipeline and related facilities | | 30 | - | 40 | | 266,129 | | | 265,253 | |
| Crude oil tanks and related equipment | | 2 | - | 30 | | 226,048 | | | 221,881 | |
| Natural gas liquids terminal and storage assets | | 2 | - | 30 | | 167,633 | | | 160,939 | |
| Buildings and leasehold improvements | | 3 | - | 40 | | 122,878 | | | 130,119 | |
| Vehicles and railcars (1) | | 3 | - | 25 | | 91,715 | | | 92,640 | |
| Land | | | | | | 70,270 | | | 89,474 | |
| Information technology equipment | | 3 | - | 7 | | 33,907 | | | 35,884 | |
| Tank bottoms and linefill (2) | | | | | | 28,269 | | | 40,001 | |
| Other | | 3 | - | 20 | | 2,552 | | | 10,908 | |
| Construction in progress | | | | | | 43,010 | | | 33,673 | |
| Gross property, plant and equipment | | | | | | 3,107,976 | | | 3,121,564 | |
| Accumulated depreciation | | | | | | (1,011,274) | | | (898,184) | |
| Net property, plant and equipment | | | | | | $ | 2,096,702 | | | $ | 2,223,380 | |
(1) Includes a finance lease right-of-use asset of $0.1 million at March 31, 2024 and 2023. The accumulated amortization related to this finance lease is included within accumulated depreciation.
(2) Tank bottoms, which are product volumes required for the operation of storage tanks, are recorded at historical cost. We recover tank bottoms when the storage tanks are removed from service. Linefill, which represents our portion of the product volume required for the operation of the proportionate share of a pipeline we own, is recorded at historical cost.
Amounts in the table above do not include property, plant and equipment and accumulated depreciation related to the sale of certain freshwater water solutions facilities, certain saltwater disposal assets and certain real estate, as these amounts have been classified as assets held for sale within our March 31, 2024 consolidated balance sheet (see Note 17).
The following table summarizes depreciation expense and capitalized interest expense for the periods indicated:
| | | | | | | | | | | | | | | | | | | | |
| | Year Ended March 31, |
| | 2024 | | 2023 | | 2022 |
| | (in thousands) |
| Depreciation expense | | $ | 198,542 | | | $ | 196,129 | | | $ | 203,783 | |
| Capitalized interest expense | | $ | 1,561 | | | $ | 945 | | | $ | 916 | |
We record (gains) losses from the sales of property, plant and equipment and any write-downs in value due to impairment within loss on disposal or impairment of assets, net in our consolidated statement of operations. The following table summarizes (gains) losses on the disposal or impairment of property, plant and equipment by segment for the periods indicated:
| | | | | | | | | | | | | | | | | | | | |
| | Year Ended March 31, |
| | 2024 | | 2023 | | 2022 |
| | (in thousands) |
| Water Solutions (1) | | $ | 38,938 | | | $ | 56,644 | | | $ | 28,068 | |
| Crude Oil Logistics | | 2,910 | | | 18,944 | | | (3,194) | |
| Liquids Logistics (2) | | (810) | | | 10,135 | | | 11,750 | |
| Corporate and Other | | (720) | | | (1,214) | | | — | |
| Total | | $ | 40,318 | | | $ | 84,509 | | | $ | 36,624 | |
NGL ENERGY PARTNERS LP AND SUBSIDIARIES
Notes to Consolidated Financial Statements (Continued)
(1) Amounts do not include the loss recognized on the sale of certain saltwater disposal assets discussed in Note 17.
(2) Amounts do not include the gain recognized on the sale of three natural gas liquids terminals discussed in Note 17.
During the year ended March 31, 2024, the following transactions were recorded:
•A net loss of $35.9 million primarily related to the write down of the value of certain saltwater disposal wells as well as the abandonment of certain capital projects and the retirement of certain assets in our Water Solutions segment.
•A net loss of $6.9 million primarily related to the sale of certain assets in our Water Solutions segment.
•A gain of $3.9 million from insurance recoveries for certain saltwater disposal facilities and boosters damaged in a prior period in our Water Solutions segment.
•A loss of $2.9 million related to the retirement or sale of certain assets in our Crude Oil Logistics segment.
•A gain of $0.8 million on the sale of land in our Liquids Logistics segment.
•A gain of $0.7 million on the sale of our plane in Corporate and Other.
During the year ended March 31, 2023, the following transactions were recorded:
•A net loss of $26.3 million primarily related to the sale of certain assets in our Water Solutions segment.
•A net loss of $21.8 million to write down the value of an inactive saltwater disposal facility and damaged equipment at another saltwater disposal facility, as well as the abandonment of certain capital projects and the retirement of certain assets in our Water Solutions segment.
•A net loss of $20.0 million related to the impairment of an underperforming crude oil terminal in our Crude Oil Logistics segment.
•A net loss of $10.0 million related to the impairment of several underperforming natural gas liquids terminals in our Liquids Logistics segment.
•A gain of $2.1 million from an insurance recovery for a saltwater disposal facility damaged in a prior period in our Water Solutions segment.
During the year ended March 31, 2022, the following transactions were recorded:
•A net loss of $22.3 million related to write-down or write off of certain assets, including facilities damaged by lightning strikes and abandoned projects, and the sale of certain other miscellaneous assets in our Water Solutions segment.
•A loss of $11.8 million on the sale of a natural gas liquids terminals in our Liquids Logistics segment.
•An impairment charge of $5.8 million to write down the value of an inactive saltwater disposal facility that we do not expect to bring back online as a result of suspended operations from increased seismic activity in our Water Solutions segment.
•A loss of $2.2 million from the retirement of certain crude oil terminal assets damaged as part of Hurricane Ida in our Crude Oil Logistics segment.
•A gain of $5.5 million on the sale of our trucking assets in our Crude Oil Logistics segment.
NGL ENERGY PARTNERS LP AND SUBSIDIARIES
Notes to Consolidated Financial Statements (Continued)
Note 5—Goodwill
The following table summarizes changes in goodwill by segment for the periods indicated:
| | | | | | | | | | | | | | | | | | | | | | | |
| Water
Solutions | | Crude Oil
Logistics | | Liquids
Logistics | | Total |
| (in thousands) |
| Goodwill at March 31, 2022 | $ | 283,310 | | | $ | 342,046 | | | $ | 119,083 | | | $ | 744,439 | |
| Disposal (1) | — | | | (32,075) | | | — | | | (32,075) | |
| Goodwill at March 31, 2023 | 283,310 | | | 309,971 | | | 119,083 | | | 712,364 | |
| Disposal (2) | — | | | — | | | (4,781) | | | (4,781) | |
| Assets held for sale (3) | (4,108) | | | — | | | — | | | (4,108) | |
| Impairment | — | | | — | | | (69,193) | | | (69,193) | |
| Goodwill at March 31, 2024 | $ | 279,202 | | | $ | 309,971 | | | $ | 45,109 | | | $ | 634,282 | |
(1) Relates to the sale of our marine assets within our Crude Oil Logistics segment during the year ended March 31, 2023 (see Note 17).
(2) Relates to the sale of two natural gas liquids terminals within our Liquids Logistics segment on July 24, 2023 (see Note 17).
(3) Relates to goodwill classified as held for sale for the sale of certain freshwater water solutions facilities within our Water Solutions segment (see Note 17).
Fiscal Year 2024 Goodwill Impairment Assessment
We performed a qualitative assessment as of January 1, 2024 to determine whether it was more likely than not that the fair value of each reporting unit was greater than the carrying value of the reporting unit. Based on these qualitative assessments, we determined that the fair value of each of our reporting units was more likely than not greater than the carrying value of the reporting units as of January 1, 2024, with the exception of our Crude Oil Logistics and Wholesale/Terminal reporting units. See below for a further discussion of the testing.
Due to lower than expected operating results, it was decided that the goodwill within the Crude Oil Logistics reporting unit should be tested for impairment as of January 1, 2024. We estimated the fair value of the Crude Oil Logistics reporting unit based on the income approach, also known as the discounted cash flow method, which utilizes the present value of future expected cash flows to estimate the fair value. The future cash flows of the Crude Oil Logistics reporting unit were projected based upon estimates as of the test date of future revenues, operating expenses and cash outflows necessary to support these cash flows, including working capital and maintenance capital expenditures. We also considered expectations regarding: (i) the crude oil price environment as reflected in crude oil forward prices as of the test date, (ii) volumes based on historical information and estimates of future drilling and completion activity, as well as expectations for future demand recovery and (iii) estimated fixed and variable costs. The discounted cash flows for the Crude Oil Logistics reporting unit were based on five years of projected cash flows and we applied a discount rate and terminal multiple that we believe would be applied by a theoretical market participant in similar market transactions. Based on this test, we concluded that the fair value of the Crude Oil Logistics reporting unit exceeded its carrying value by approximately 4%.
Due to lower than expected operating results, it was decided that the goodwill within the Wholesale/Terminal reporting unit should be tested for impairment as of January 1, 2024. We estimated the fair value of the Wholesale/Terminal reporting unit based on the income approach, also known as the discounted cash flow method, which utilizes the present value of future expected cash flows to estimate the fair value. The future cash flows of the Wholesale/Terminal reporting unit were projected based upon estimates as of the test date of future revenues, operating expenses and cash outflows necessary to support these cash flows, including working capital and maintenance capital expenditures. We also considered expectations regarding: (i) the margins to be generated on product sold, (ii) estimated volumes based on historical information and estimates of future growth, (iii) renewal of certain customer contracts and (iv) estimated fixed and variable costs. The discounted cash flows for the Wholesale/Terminal reporting unit were based on five years of projected cash flows and we applied a discount rate and terminal multiple that we believe would be applied by a theoretical market participant in similar market transactions. Based on this test, we concluded that the fair value of the Wholesale/Terminal reporting unit was less than its carrying value by approximately 23%.
During the three months ended March 31, 2024, in our Wholesale/Terminal reporting unit, we recorded a goodwill impairment charge of $69.2 million within loss on disposal or impairment of assets, net in our consolidated statement of operations.
NGL ENERGY PARTNERS LP AND SUBSIDIARIES
Notes to Consolidated Financial Statements (Continued)
Fiscal Year 2023 Goodwill Impairment Assessment
We performed a qualitative assessment as of January 1, 2023 to determine whether it was more likely than not that the fair value of each reporting unit was greater than the carrying value of the reporting unit. Based on these qualitative assessments, we determined that the fair value of each of our reporting units was more likely than not greater than the carrying value of the reporting units as of January 1, 2023, with the exception of our Crude Oil Logistics and Wholesale/Terminal reporting units. See below for a further discussion of the testing.
Due to lower than expected operating results, it was decided that the goodwill within the Crude Oil Logistics reporting unit should be tested for impairment as of January 1, 2023. We estimated the fair value of the Crude Oil Logistics reporting unit based on the income approach, also known as the discounted cash flow method, which utilizes the present value of future expected cash flows to estimate the fair value. The future cash flows of the Crude Oil Logistics reporting unit were projected based upon estimates as of the test date of future revenues, operating expenses and cash outflows necessary to support these cash flows, including working capital and maintenance capital expenditures. We also considered expectations regarding: (i) the crude oil price environment as reflected in crude oil forward prices as of the test date, (ii) volumes based on historical information and estimates of future drilling and completion activity, as well as expectations for future demand recovery and (iii) estimated fixed and variable costs. The discounted cash flows for the Crude Oil Logistics reporting unit were based on five years of projected cash flows and we applied a discount rate and terminal multiple that we believe would be applied by a theoretical market participant in similar market transactions. Based on this test, we concluded that the fair value of the Crude Oil Logistics reporting unit exceeded its carrying value by approximately 18%.
Due to lower than expected operating results, it was decided that the goodwill within the Wholesale/Terminal reporting unit should be tested for impairment as of January 1, 2023. We estimated the fair value of the Wholesale/Terminal reporting unit based on the income approach, also known as the discounted cash flow method, which utilizes the present value of future expected cash flows to estimate the fair value. The future cash flows of the Wholesale/Terminal reporting unit were projected based upon estimates as of the test date of future revenues, operating expenses and cash outflows necessary to support these cash flows, including working capital and maintenance capital expenditures. We also considered expectations regarding: (i) the margins to be generated on product sold, (ii) estimated volumes based on historical information and estimates of future growth, (iii) renewal of certain customer contracts and (iv) estimated fixed and variable costs. The discounted cash flows for the Wholesale/Terminal reporting unit were based on five years of projected cash flows and we applied a discount rate and terminal multiple that we believe would be applied by a theoretical market participant in similar market transactions. Based on this test, we concluded that the fair value of the Wholesale/Terminal reporting unit exceeded its carrying value by approximately 5%.
Fiscal Year 2022 Goodwill Impairment Assessment
We performed a qualitative assessment as of January 1, 2022 to determine whether it was more likely than not that the fair value of each reporting unit was greater than the carrying value of the reporting unit. Based on these qualitative assessments, we determined that the fair value of each of our reporting units was more likely than not greater than the carrying value of the reporting units as of January 1, 2022, with the exception of our Crude Oil Logistics reporting unit. See below for a further discussion of the testing.
Due to lower than expected operating results, it was decided that the goodwill within the Crude Oil Logistics reporting unit should be tested for impairment as of January 1, 2022. We estimated the fair value of the Crude Oil Logistics reporting unit based on the income approach, also known as the discounted cash flow method, which utilizes the present value of future expected cash flows to estimate the fair value. The future cash flows of the Crude Oil Logistics reporting unit were projected based upon estimates as of the test date of future revenues, operating expenses and cash outflows necessary to support these cash flows, including working capital and maintenance capital expenditures. We also considered expectations regarding: (i) the crude oil price environment as reflected in crude oil forward prices as of the test date, (ii) volumes based on historical information and estimates of future drilling and completion activity, as well as expectations for future demand recovery and (iii) estimated fixed and variable costs. The discounted cash flows for the Crude Oil Logistics reporting unit were based on five years of projected cash flows and we applied a discount rate and terminal multiple that we believe would be applied by a theoretical market participant in similar market transactions. Based on this test, we concluded that the fair value of the Crude Oil Logistics reporting unit exceeded its carrying value by approximately 12%.
NGL ENERGY PARTNERS LP AND SUBSIDIARIES
Notes to Consolidated Financial Statements (Continued)
Note 6—Intangible Assets
Our intangible assets consist of the following at the dates indicated:
| | | | | | | | | | | | | | | | | | | | | | | | | | | | | | | | | | | | | | | | | | | | |
| | | | March 31, 2024 | | March 31, 2023 |
| Description | | Weighted-
Average
Remaining
Useful Life | | Gross Carrying
Amount | | Accumulated
Amortization | | Net | | Gross Carrying
Amount | | Accumulated
Amortization | | Net |
| | (in years) | | (in thousands) |
| Amortizable: | | | | | | | | | | | | | | |
| Customer relationships | | 18.6 | | $ | 905,113 | | | $ | (265,621) | | | $ | 639,492 | | | $ | 1,196,468 | | | $ | (492,002) | | | $ | 704,466 | |
| Customer commitments | | 20.3 | | 192,000 | | | (36,480) | | | 155,520 | | | 192,000 | | | (28,800) | | | 163,200 | |
| Rights-of-way and easements | | 29.9 | | 95,231 | | | (18,187) | | | 77,044 | | | 94,875 | | | (15,138) | | | 79,737 | |
| Water rights | | 25.6 | | 36,068 | | | (5,310) | | | 30,758 | | | 99,869 | | | (26,453) | | | 73,416 | |
| Debt issuance costs (1) | | 4.9 | | 18,473 | | | (605) | | | 17,868 | | | 25,592 | | | (9,921) | | | 15,671 | |
| Executory contracts and other agreements | | 25.2 | | 17,854 | | | (3,670) | | | 14,184 | | | 21,570 | | | (5,037) | | | 16,533 | |
| Pipeline capacity rights | | 19.7 | | 7,799 | | | (2,687) | | | 5,112 | | | 7,799 | | | (2,427) | | | 5,372 | |
| Non-compete agreements | | — | | | — | | | — | | | — | | | 1,100 | | | (1,082) | | | 18 | |
| Total amortizable | | | | 1,272,538 | | | (332,560) | | | 939,978 | | | 1,639,273 | | | (580,860) | | | 1,058,413 | |
| Non-amortizable: | | | | | | | | | | | | | | |
| Trade names | | | | — | | | | | — | | | 255 | | | | | 255 | |
| Total | | | | $ | 1,272,538 | | | $ | (332,560) | | | $ | 939,978 | | | $ | 1,639,528 | | | $ | (580,860) | | | $ | 1,058,668 | |
(1) Includes debt issuance costs related to the ABL Facility. Debt issuance costs related to the fixed-rate notes and Term Loan B are reported as a reduction of the carrying amount of long-term debt.
Amounts in the table above do not include intangible assets and accumulated amortization related to the sale of certain freshwater water solutions facilities and certain saltwater disposal assets, as these amounts have been classified as assets held for sale within our March 31, 2024 consolidated balance sheet (see Note 17).
Write off of Intangible Assets
For intangible assets other than debt issuance costs, we record (gains) losses from the sales of intangible assets and any write-downs in value due to impairment within loss on disposal or impairment of assets, net in our consolidated statement of operations. We record the write-off of debt issuance costs within (loss) gain on early extinguishment of liabilities, net in our consolidated statement of operations. Intangible assets sold as part of the dispositions disclosed in Note 17 are not described below.
During the year ended March 31, 2024, we recorded an impairment charge of $0.3 million to write down the value of a trade name in conjunction with the sale of certain saltwater disposal assets in the Pinedale Anticline Basin as we are no longer using the trade name (see Note 17).
During the year ended March 31, 2023, we recorded an impairment charge of $1.6 million against certain intangible assets related to an underperforming crude oil terminal.
During the year ended March 31, 2022, we recorded the following:
•A gain of $1.6 million related to the sale of certain intangible assets in our Water Solutions segment.
•A loss of $0.1 million from the write-off of debt issuance costs related to the Sawtooth Caverns, LLC (“Sawtooth”) credit agreement which was paid off and terminated prior to us selling our ownership interest in Sawtooth (see Note 17).
NGL ENERGY PARTNERS LP AND SUBSIDIARIES
Notes to Consolidated Financial Statements (Continued)
Amortization expense is as follows for the periods indicated:
| | | | | | | | | | | | | | | | | | | | |
| | Year Ended March 31, |
| Recorded In | | 2024 | | 2023 | | 2022 |
| | (in thousands) |
| Depreciation and amortization | | $ | 67,981 | | | $ | 77,492 | | | $ | 84,937 | |
| Cost of sales | | 260 | | | 274 | | | 281 | |
| Interest expense | | 5,541 | | | 4,866 | | | 4,779 | |
| Operating expenses | | 247 | | | 247 | | | 247 | |
| Total | | $ | 74,029 | | | $ | 82,879 | | | $ | 90,244 | |
The following table summarizes expected amortization of our intangible assets at March 31, 2024 (in thousands):
| | | | | |
| Year Ending March 31, | |
| 2025 | $ | 59,403 | |
| 2026 | 58,145 | |
| 2027 | 57,464 | |
| 2028 | 54,575 | |
| 2029 | 52,001 | |
| Thereafter | 658,390 | |
| Total | $ | 939,978 | |
Note 7—Long-Term Debt
Our long-term debt consists of the following at the dates indicated:
| | | | | | | | | | | | | | | | | | | | | | | | | | | | | | | | | | | | | | |
| | March 31, 2024 | | March 31, 2023 |
| | Face
Amount | | Unamortized
Debt Issuance
Costs (1) | | Book
Value | | Face
Amount | | Unamortized
Debt Issuance
Costs (1) | | Book
Value |
| | (in thousands) |
| Asset-based revolving credit facility (“ABL Facility”) | | $ | — | | | | | $ | — | | | $ | 138,000 | | | | | $ | 138,000 | |
| Senior secured term loan “B” credit facility (“Term Loan B”) | | 700,000 | | | $ | (17,549) | | | 682,451 | | | — | | | $ | — | | | — | |
| Senior secured notes: | | | | | | | | | | | | |
7.500% Notes due 2026 (“2026 Senior Secured Notes”) | | — | | | — | | | — | | | 2,050,000 | | | (26,009) | | | 2,023,991 | |
8.125% Notes due 2029 (“2029 Senior Secured Notes”) | | 900,000 | | | (12,845) | | | 887,155 | | | — | | | — | | | — | |
8.375% Notes due 2032 (“2032 Senior Secured Notes”) | | 1,300,000 | | | (18,784) | | | 1,281,216 | | | — | | | — | | | — | |
| Senior unsecured notes: | | | | | | | | | | | | |
6.125% Notes due 2025 (“2025 Notes”) | | — | | | — | | | — | | | 380,020 | | | (1,612) | | | 378,408 | |
7.500% Notes due 2026 (“2026 Notes”) | | — | | | — | | | — | | | 319,902 | | | (2,496) | | | 317,406 | |
| Total long-term debt | | 2,900,000 | | | (49,178) | | | 2,850,822 | | | 2,887,922 | | | (30,117) | | | 2,857,805 | |
| Less: Current maturities | | 7,000 | | | — | | | 7,000 | | | — | | | — | | | — | |
| Long-term debt | | $ | 2,893,000 | | | $ | (49,178) | | | $ | 2,843,822 | | | $ | 2,887,922 | | | $ | (30,117) | | | $ | 2,857,805 | |
(1) Debt issuance costs related to the ABL Facility are reported within intangible assets, rather than as a reduction of the carrying amount of long-term debt. The unamortized debt issuance costs for Term Loan B include a $5.1 million discount.
Recent Developments
On February 2, 2024, we closed a debt refinancing transaction of $2.9 billion consisting of a private offering of $2.2 billion of senior secured notes, which includes $900.0 million of 2029 Senior Secured Notes and $1.3 billion of 2032 Senior Secured Notes. We also entered into a new seven-year $700.0 million Term Loan B. The net proceeds from these transactions were used (i) to fund the redemption, and related discharge of the indentures governing our existing 2025 Notes, 2026 Notes and 2026 Senior Secured Notes, including any applicable premiums and accrued and unpaid interest (as discussed further
NGL ENERGY PARTNERS LP AND SUBSIDIARIES
Notes to Consolidated Financial Statements (Continued)
below), (ii) to pay fees and expenses in connection therewith, (iii) to repay borrowings under the ABL Facility and (iv) to the extent of any remaining net proceeds, for general corporate purposes.
In addition, in connection with the closing of the refinancing, the ABL Facility was amended.
ABL Facility
The ABL Facility is subject to a borrowing base, and includes a sub-limit for letters of credit. Current commitments under the ABL facility are $600.0 million. On February 2, 2024, we amended the ABL Facility to, among other things, (i) extend the maturity to the earliest of (a) February 2, 2029 and (b) 91 days prior to the earliest maturity date in respect to any of our indebtedness in an aggregate principal amount of $50.0 million or greater, subject to certain exceptions, (ii) provide for a sub-limit of $200.0 million for letters of credit and a $200.0 million incremental facility, subject to the receipt of commitments from lenders and customary borrowing conditions, (iii) modify the applicable margin for loans under the ABL Facility based on a secured overnight financing rate (“SOFR”) or the alternative base rate to provide for a 0.25% decrease based on our consolidated net leverage ratio, and (iv) provide for a mandatory prepayment under the ABL Facility while any loans are outstanding under the ABL Facility if aggregate “excess cash” (as defined in the ABL Facility) exceeds $50.0 million, subject to certain exceptions.
The ABL Facility is secured by a lien on substantially all of our assets, including among other things, a first priority lien on our accounts receivable, inventory, pledged deposit accounts, cash and cash equivalents, renewable energy tax credits and related assets and a second priority lien on all of our other assets. At March 31, 2024, there were no borrowings under the ABL Facility and we had letters of credit outstanding of approximately $99.5 million.
All borrowings under the ABL Facility bear interest at SOFR or the alternative base rate to provide for a 0.25% decrease based on our consolidated net leverage ratio. The applicable margin for alternate base rate loans varies from 1.50% to 2.00% and the applicable margin for SOFR varies from 2.50% to 3.00%. In addition, a commitment fee will be charged and payable quarterly in arrears based on the average daily unused portion of the revolving commitments under the ABL Facility. Such commitment fee will be 0.50% per year, subject to a reduction to 0.375% in the event our fixed charge coverage ratio is greater than or equal to 1.75 to 1.00.
At March 31, 2024, the borrowings under the ABL Facility had a weighted average interest rate of 10.25% calculated as the prime rate of 8.50% plus a margin of 1.75% on the alternate base rate borrowings. On March 31, 2024, the interest rate in effect on letters of credit was 2.75%.
The ABL Facility contains various affirmative and negative covenants, including financial reporting requirements and limitations on indebtedness, liens, mergers, consolidations, liquidations and dissolutions, sales of assets, distributions and other restricted payments, investments (including acquisitions) and transactions with affiliates. The ABL Facility contains, as the only financial covenant, a fixed charge coverage ratio that is tested based on the financial statements for the most recently ended fiscal quarter upon the occurrence and during the continuation of a Cash Dominion Event (as defined in the ABL Facility). At March 31, 2024, no Cash Dominion Event had occurred.
Compliance
At March 31, 2024, we were in compliance with the covenants under the ABL Facility.
Term Loan B
The Term Loan B was issued at 99.25% of par for gross proceeds of $694.8 million. The Term Loan B was issued pursuant to a credit agreement dated February 2, 2024 (“Term Loan Credit Agreement”).
The Term Loan B bears interest at a SOFR-based rate or an alternate base rate, in each case plus an applicable margin. The applicable margin for alternate base rate loans varies from 3.25% to 3.50% and the applicable margin for SOFR-based loans varies from 4.25% to 4.50%, in each case, depending on our consolidated first lien net leverage ratio (as defined in the Term Loan Credit Agreement).
The Term Loan B will mature on February 2, 2031 and will amortize in equal quarterly installments in aggregate annual amounts equal to 1.0% of the original principal amount beginning with the fiscal quarter ending June 30, 2024, with the balance payable on maturity. We have the ability to prepay the Term Loan B at any time without premium or penalty, other
NGL ENERGY PARTNERS LP AND SUBSIDIARIES
Notes to Consolidated Financial Statements (Continued)
than customary breakage costs and a premium of 1% of the principal amount prepaid, if the prepayment occurs prior to the six-month anniversary of the closing date. The Term Loan Credit Agreement contains customary mandatory prepayment requirements, including mandatory prepayments as a result of (a) excess cash flow (subject to certain customary exceptions and thresholds), (b) asset sales (subject to reinvestment rights and certain customary exceptions and thresholds) and (c) the incurrence of non-permitted indebtedness.
Under the Term Loan Credit Agreement, we are permitted to request, from time to time, (i) increases in the Term Loan B, and/or (ii) the establishment of new tranches of incremental term loans, in an aggregate principal amount of up to the greater of $150 million and 20% of consolidated EBITDA plus such additional amounts depending upon satisfaction of certain ratio tests and other conditions, in each case subject to commitments from lenders and customary conditions.
The Term Loan B is secured by first priority liens on substantially all of our assets other than our accounts receivable, inventory, pledged deposit accounts, cash and cash equivalents, renewable energy tax credits and related assets and second priority liens on our accounts receivable, inventory, pledged deposit accounts, cash and cash equivalents, renewable energy tax credits and related assets.
At March 31, 2024, the borrowings under the Term Loan B had a SOFR of 5.33% plus a margin of 4.50%.
The Term Loan Credit Agreement contains various affirmative and negative covenants, including financial reporting requirements and limitations on indebtedness, liens, mergers, consolidations, liquidations and dissolutions, sales of assets, distributions and other restricted payments, investments (including acquisitions) and transactions with affiliates. The Term Loan Credit Agreement requires that we maintain, on a quarterly basis, beginning with the quarter ending June 30, 2024, a debt service coverage rate (as defined in the Term Loan Credit Agreement) of no less than 1.1 to 1.00.
The Term Loan Credit Agreement contains other customary terms, events of default and covenants.
Compliance
At March 31, 2024, we were in compliance with the covenants under the Term Loan B.
Senior Secured Notes
Issuances
On February 4, 2021, we closed on our private offering of $2.05 billion of 2026 Senior Secured Notes. Interest is payable on February 1 and August 1 of each year, beginning on August 1, 2021. We redeemed all of the outstanding 2026 Senior Secured Notes on February 6, 2024 (see “Redemptions” below).
On February 2, 2024, we closed on our private offering of $900.0 million of 2029 Senior Secured Notes. Interest is payable on February 15, May 15, August 15 and November 15 of each year, beginning on May 15, 2024. The 2029 Senior Secured Notes mature on February 15, 2029.
On February 2, 2024, we closed on our private offering of $1.3 billion of 2032 Senior Secured Notes. Interest is payable on February 15, May 15, August 15 and November 15 of each year, beginning on May 15, 2024. The 2032 Senior Secured Notes mature on February 15, 2032.
2026 Senior Secured Notes
The 2026 Senior Secured Notes were secured by first priority liens on substantially all of our assets other than our accounts receivable, inventory, pledged deposit accounts, cash and cash equivalents, renewable energy tax credits and related assets and second priority liens in our accounts receivable, inventory, pledged deposit accounts, cash and cash equivalents, renewable energy tax credits and related assets.
The indenture for the 2026 Senior Secured Notes (“2026 Indenture”) contained covenants that, among other things, limited our ability to: pay distributions or make other restricted payments or repurchase stock; incur or guarantee additional indebtedness or issue disqualified stock or certain preferred stock; make certain investments; create or incur liens; sell assets; enter into restrictions affecting the ability of restricted subsidiaries to make distributions, make loans or advances or transfer assets to the guarantors (including the Partnership); enter into certain transactions with our affiliates; designate restricted
NGL ENERGY PARTNERS LP AND SUBSIDIARIES
Notes to Consolidated Financial Statements (Continued)
subsidiaries as unrestricted subsidiaries; and merge, consolidate or transfer or sell all or substantially all of our assets. The 2026 Indenture specifically restricted our ability to pay distributions until our total leverage ratio (as defined in the 2026 Indenture) for the most recently ended four full fiscal quarters at the time of the distribution is not greater than 4.75 to 1.00.
Redemptions
The following table summarizes redemptions of Senior Secured Notes for the year ended March 31, 2024 (in thousands):
| | | | | | | | |
| 2026 Senior Secured Notes (1) | | |
| Notes redeemed | | $ | 2,050,000 | |
| Cash paid (excluding payments of accrued interest) | | $ | 2,088,438 | |
| Loss on early extinguishment of debt | | $ | 59,014 | |
(1) On February 6, 2024, we redeemed all of the outstanding 2026 Senior Secured Notes. Loss on the early extinguishment of debt for the 2026 Senior Secured Notes during the year ended March 31, 2024 includes the write off of debt issuance costs and other expenses of $20.6 million and a call premium of $38.4 million. The loss is reported within (loss) gain on early extinguishment of liabilities, net within our consolidated statement of operations.
2029 Senior Secured Notes and 2032 Senior Secured Notes
The 2029 Senior Secured Notes and 2032 Senior Secured Notes were issued pursuant to an indenture dated February 2, 2024 (“Indenture”). The 2029 Senior Secured Notes and 2032 Senior Secured Notes are secured by first priority liens on substantially all of our assets other than our accounts receivable, inventory, pledged deposit accounts, cash and cash equivalents, renewable energy tax credits and related assets and second priority liens on our accounts receivable, inventory, pledged deposit accounts, cash and cash equivalents, renewable energy tax credits and related assets.
The Indenture contains covenants that, among other things, limit our ability to: pay distributions or make other restricted payments or repurchase stock; incur or guarantee additional indebtedness or issue disqualified stock or certain preferred stock; make certain investments; create or incur liens; sell assets; enter into restrictions affecting the ability of restricted subsidiaries to make distributions, make loans or advances or transfer assets to the guarantors (including the Partnership); enter into certain transactions with our affiliates; designate restricted subsidiaries as unrestricted subsidiaries; and consolidate, merge or transfer or sell all or substantially all of our assets. These covenants are subject to a number of important exceptions and qualifications.
We have the option to redeem all or part of the 2029 Senior Secured Notes, at any time on or after February 15, 2026 at the redemption prices specified in the Indenture. Prior to such time, we have the option to redeem up to 40% of the principal amount of the 2029 Senior Secured Notes with an amount of cash not greater than the amount equal to the net cash proceeds from certain equity offerings at the redemption price specified in the Indenture. In addition, before February 15, 2026, we have the option to redeem all or part of the 2029 Senior Secured Notes at a redemption price equal to 100% of the aggregate principal amount of the 2029 Senior Secured Notes redeemed, plus an applicable “make-whole” premium as specified in the Indenture and accrued and unpaid interest, if any, to, but excluding, the redemption date.
We have the option to redeem all or part of the 2032 Senior Secured Notes, at any time on or after February 15, 2027 at the redemption prices specified in the Indenture. Prior to such time, we have the option to redeem up to 40% of the principal amount of the 2032 Senior Secured Notes with an amount of cash not greater than the amount equal to the net cash proceeds from certain equity offerings at the redemption price specified in the Indenture. In addition, before February 15, 2027, we have the option to redeem all or part of the 2032 Senior Secured Notes at a redemption price equal to 100% of the aggregate principal amount of the 2032 Senior Secured Notes redeemed, plus an applicable “make-whole” premium as specified in the Indenture and accrued and unpaid interest, if any, to, but excluding, the redemption date.
If we sell certain of our assets, or experience specific kinds of changes of control followed by a rating decline, each holder of the 2029 Senior Secured Notes and 2032 Senior Secured Note will have the right to require us to offer to repurchase all or any part of that holder’s 2029 Senior Secured Notes and 2032 Senior Secured Notes at 101% of the aggregate principal amount of the 2029 Senior Secured Notes and 2032 Senior Secured Notes to be repurchased plus accrued and unpaid interest on the 2029 Senior Secured Notes and 2032 Senior Secured Notes repurchased to, but excluding, the date of purchase.
The Indenture contains other customary terms, events of default and covenants.
NGL ENERGY PARTNERS LP AND SUBSIDIARIES
Notes to Consolidated Financial Statements (Continued)
Compliance
At March 31, 2024, we were in compliance with the covenants under the Indenture.
Senior Unsecured Notes
The Partnership and NGL Energy Finance Corp. are co-issuers of the Senior Unsecured Notes, and the obligations under the Senior Unsecured Notes were fully and unconditionally guaranteed by certain of our existing and future restricted subsidiaries that incur or guarantee indebtedness under certain of our other indebtedness, including the ABL Facility. The indentures governing the Senior Unsecured Notes contained various customary covenants, which included certain covenants that govern our ability to (i) pay distributions on, purchase or redeem our common equity or purchase or redeem our subordinated debt, (ii) incur or guarantee additional indebtedness or issue preferred units, (iii) create or incur certain liens, (iv) enter into agreements that restrict distributions or other payments from our restricted subsidiaries to us, (v) consolidate, merge or transfer all or substantially all of our assets, and (vi) engage in transactions with affiliates.
Our obligations under the Senior Unsecured Notes could have been accelerated following certain events of default (subject to applicable cure periods), including, without limitation, (i) the failure to pay principal or interest when due, (ii) experiencing an event of default on certain other debt agreements, or (iii) certain events of bankruptcy or insolvency.
Issuances
On October 24, 2016, we issued $700.0 million of 7.5% senior unsecured notes due 2023 (“2023 Notes”). Interest is payable on May 1 and November 1 of each year. We redeemed all of the remaining outstanding 2023 Notes on March 31, 2023 (see “Redemptions” below).
On February 22, 2017, we issued $500.0 million of 2025 Notes. Interest is payable on March 1 and September 1 of each year. The 2025 Notes mature on March 1, 2025. On January 19, 2024, we delivered notice to the holders of the 2025 Notes that we intend to redeem the 2025 Notes on February 20, 2024. We redeemed all of the remaining outstanding 2025 Notes on February 20, 2024 (see “Redemptions” below).
On April 9, 2019, we issued $450.0 million of 2026 Notes in a private placement. Interest is payable on April 15 and October 15 of each year. The 2026 Notes mature on April 15, 2026. On February 2, 2024, we deposited $331.9 million with the trustee for the redemption of the 2026 Notes, which included the payment of accrued and unpaid interest of $12.0 million. As we met the requirements of discharge under the 2026 indenture dated February 4, 2021, we no longer have this liability as of March 31, 2024 (see “Redemptions” below).
NGL ENERGY PARTNERS LP AND SUBSIDIARIES
Notes to Consolidated Financial Statements (Continued)
Repurchases
The following table summarizes repurchases of Senior Unsecured Notes for the periods indicated:
| | | | | | | | | | | | | | | | | | | | |
| | Year Ended March 31, |
| | 2024 | | 2023 | | 2022 |
| | (in thousands) |
| 2023 Notes | | | | | | |
| Notes repurchased | | $ | — | | | $ | 272,316 | | | $ | 79,549 | |
| Cash paid (excluding payments of accrued interest) | | $ | — | | | $ | 265,127 | | | $ | 77,847 | |
| Gain on early extinguishment of debt (1) | | $ | — | | | $ | 6,555 | | | $ | 1,318 | |
| | | | | | |
| 2025 Notes | | | | | | |
| Notes repurchased | | $ | 99,275 | | | $ | — | | | $ | — | |
| Cash paid (excluding payments of accrued interest) | | $ | 91,982 | | | $ | — | | | $ | — | |
| Gain on early extinguishment of debt (2) | | $ | 6,906 | | | $ | — | | | $ | — | |
| | | | | | |
| 2026 Notes | | | | | | |
| Notes repurchased | | $ | — | | | $ | 12,500 | | | $ | 6,000 | |
| Cash paid (excluding payments of accrued interest) | | $ | — | | | $ | 10,789 | | | $ | 5,320 | |
| Gain on early extinguishment of debt (3) | | $ | — | | | $ | 1,611 | | | $ | 610 | |
(1) Gain on early extinguishment of debt for the 2023 Notes during the years ended March 31, 2023 and 2022 is inclusive of the write off of debt issuance costs of $0.6 million and $0.4 million, respectively. The gain is reported within (loss) gain on early extinguishment of liabilities, net within our consolidated statements of operations.
(2) Gain on early extinguishment of debt for the 2025 Notes during the year ended March 31, 2024 is inclusive of the write off of debt issuance costs of $0.4 million. The gain is reported within (loss) gain on early extinguishment of liabilities, net within our consolidated statement of operations.
(3) Gain on early extinguishment of debt for the 2026 Notes during the years ended March 31, 2023 and 2022 is inclusive of the write off of debt issuance costs of $0.1 million and $0.1 million respectively. The gain is reported within (loss) gain on early extinguishment of liabilities, net within our consolidated statements of operations.
Redemptions
The following table summarizes redemptions of Senior Unsecured Notes for the periods indicated:
| | | | | | | | | | | | | | |
| | Year Ended March 31, |
| | 2024 | | 2023 |
| | (in thousands) |
| 2023 Notes (1) | | | | |
| Notes redeemed | | $ | — | | | $ | 203,386 | |
| Cash paid (excluding payments of accrued interest) | | $ | — | | | $ | 203,386 | |
| Loss on early extinguishment of debt | | $ | — | | | $ | 367 | |
| | | | |
| 2025 Notes (2) | | | | |
| Notes redeemed | | $ | 280,745 | | | $ | — | |
| Cash paid (excluding payments of accrued interest) | | $ | 280,745 | | | $ | — | |
| Loss on early extinguishment of debt | | $ | 978 | | | $ | — | |
| | | | |
| 2026 Notes (3) | | | | |
| Notes redeemed | | $ | 319,902 | | | $ | — | |
| Cash paid (excluding payments of accrued interest) | | $ | 319,902 | | | $ | — | |
| Loss on early extinguishment of debt | | $ | 2,159 | | | $ | — | |
(1) On March 31, 2023, we redeemed all of the remaining outstanding 2023 Notes. Loss on the early extinguishment of debt for the 2023 Notes during the year ended March 31, 2023 is inclusive of the write off of debt issuance costs of $0.4 million. The loss is reported within (loss) gain on early extinguishment of liabilities, net within our consolidated statement of operations.
NGL ENERGY PARTNERS LP AND SUBSIDIARIES
Notes to Consolidated Financial Statements (Continued)
(2) On February 20, 2024, we redeemed all of the remaining outstanding 2025 Notes. Loss on the early extinguishment of debt for the 2025 Notes during the year ended March 31, 2024 includes the write off of debt issuance costs and other expenses of $1.0 million. The loss is reported within (loss) gain on early extinguishment of liabilities, net within our consolidated statement of operations.
(3) On February 2, 2024, we deposited $331.9 million with the trustee for the redemption of the 2026 Notes, which included the repayment of accrued and unpaid interest of $12.0 million. As we met the requirements of discharge under the 2026 indenture dated February 4, 2021, we no longer had this liability as of March 31, 2024. Loss on the early extinguishment of debt for the 2026 Notes during the year ended March 31, 2024 includes the write off of debt issuance costs and other expenses of $2.2 million. The loss is reported within (loss) gain on early extinguishment of liabilities, net within our consolidated statement of operations.
Debt Maturity Schedule
The scheduled maturities of our long-term debt are as follows at March 31, 2024:
| | | | | | | | | | | | | | | | | | | | | | | | |
| Year Ending March 31, | | | | Term Loan B | | Senior Secured
Notes | | | | Total |
| | | | | | (in thousands) | | | | |
| 2025 | | | | $ | 7,000 | | | $ | — | | | | | $ | 7,000 | |
| 2026 | | | | 7,000 | | | — | | | | | 7,000 | |
| 2027 | | | | 7,000 | | | — | | | | | 7,000 | |
| 2028 | | | | 7,000 | | | — | | | | | 7,000 | |
| 2029 | | | | 7,000 | | | 900,000 | | | | | 907,000 | |
| Thereafter | | | | 665,000 | | | 1,300,000 | | | | | 1,965,000 | |
| Total | | | | $ | 700,000 | | | $ | 2,200,000 | | | | | $ | 2,900,000 | |
Amortization of Debt Issuance Costs
Amortization expense for debt issuance costs related to long-term debt was $10.2 million, $11.9 million and $12.2 million during the years ended March 31, 2024, 2023 and 2022, respectively.
The following table summarizes expected amortization of debt issuance costs at March 31, 2024 (in thousands):
| | | | | | | | |
| Year Ending March 31, | | |
| 2025 | | $ | 7,590 | |
| 2026 | | 7,590 | |
| 2027 | | 7,590 | |
| 2028 | | 7,590 | |
| 2029 | | 7,252 | |
| Thereafter | | 11,566 | |
| Total | | $ | 49,178 | |
Note 8—Commitments and Contingencies
Legal Contingencies
In August 2015, LCT Capital, LLC (“LCT”) filed a lawsuit against the GP and the Partnership seeking payment for investment banking services relating to the purchase of TransMontaigne Inc. and related assets in July 2014. After pre-trial rulings, LCT was limited to pursuing claims of (i) quantum meruit (the value of the services rendered by LCT) and (ii) fraudulent misrepresentation against the defendants. Following a jury trial conducted in Delaware state court from July 23, 2018 through August 1, 2018, the jury returned a verdict consisting of an award of $4.0 million for quantum meruit and $29.0 million for fraudulent misrepresentation, subject to statutory interest. On December 5, 2019, in response to the defendants’ post-trial motion, the Court issued an Order overturning the jury’s damages award and ordering the case to be set for a damages-only trial (“December 5th Order”). Both parties filed applications with the trial court asking the trial court to certify the December 5th Order for interlocutory, immediate review by the Appellate Court. On January 7, 2020, the Supreme Court of Delaware entered an Order accepting an interlocutory appeal of various issues relating to both the quantum meruit and fraudulent misrepresentation verdicts. The Supreme Court of Delaware heard oral arguments of the parties on November 4, 2020, took the matters presented under advisement and on January 28, 2021, issued a ruling that (a) LCT is not entitled to “benefit-of-the-bargain” damages on its fraud claim; (b) LCT is not entitled to receive fraudulent misrepresentation damages separate from its quantum meruit damages; (c) the trial court abused its discretion when it ordered a new trial on damages
NGL ENERGY PARTNERS LP AND SUBSIDIARIES
Notes to Consolidated Financial Statements (Continued)
relating to LCT’s claim of fraudulent misrepresentation; and (d) the trial court properly ordered a new trial on LCT’s claim of quantum meruit damages. The re-trial of the quantum meruit claim was conducted in Delaware state court from February 6, 2023 through February 15, 2023 and resulted in the jury returning a verdict consisting of an award of $36.0 million, subject to statutory interest and costs, as applicable. The GP and the Partnership contend that the jury verdict is not supportable by controlling law or the evidentiary record, and on July 28, 2023, filed their notice of appeal to the Supreme Court of Delaware which raises various issues relating to the quantum meruit verdict, including but not limited to, certain written orders and oral evidentiary and other rulings made prior to and during the February 2023 remand trial. On October 12, 2023, LCT filed its answering brief on appeal and cross-appellant’s opening brief on cross-appeal. The GP and the Partnership filed their reply and answering brief on cross-appeal on November 13, 2023. On February 7, 2024, the Supreme Court of Delaware held before the Court en Banc oral arguments for the appeal matters. On May 28, 2024, the Supreme Court of Delaware affirmed the jury verdict and remanded the case back to the trial court to re-calculate the amount of the pre- and post-judgment interest accrual. As of March 31, 2024, we accrued $62.1 million related to this matter, of which approximately $26.1 million represents interest accrued through March 31, 2024 and $0.1 million of costs awarded to the plaintiff. Interest will continue to accrue until the amount of the judgment is paid.
The Partnership is a party defendant to a purported class action complaint filed in the federal court in the Northern District of Oklahoma styled Gary R. Underwood, Successor Trustee for the James L. Price Revocable Living Trust, on behalf of the Trust and all others similarly situated v. NGL Energy Partners LP, Case No. 4:21-cv-00135-CVE-SH. This case seeks class certification on behalf of owners who allege the Partnership’s Crude Oil Logistics group violated Oklahoma’s Production Revenue Standards Act when it failed to include statutory interest on proceeds payments it made to certain mineral owners and to state unclaimed property divisions for oil purchased from certain Oklahoma wells. A substantial portion of the statutory interest claimed to be owed in the lawsuit related to suspended proceeds we inherited from our predecessors and remitted to various state unclaimed property divisions in 2016. With no admission of liability or wrongdoing, but only to avoid the expense and uncertainty of future litigation, the Partnership entered into a settlement agreement in this case to resolve all claims made against it by the plaintiff and the proposed class and paid approximately $8.4 million to the plaintiff and the proposed class. During the final fairness hearing on June 15, 2023, the settlement agreement was approved by the court and an order granting final approval of the class action settlement was entered into record.
We are party to various other claims, legal actions, and complaints arising in the ordinary course of business. In the opinion of our management, the ultimate resolution of these claims, legal actions, and complaints, after consideration of amounts accrued, insurance coverage, and other arrangements, is not expected to have a material adverse effect on our consolidated financial position, results of operations or cash flows. However, the outcome of such matters is inherently uncertain, and estimates of our liabilities may change materially as circumstances develop.
Environmental Matters
At March 31, 2024, we have an environmental liability, measured on an undiscounted basis, of $1.3 million, which is recorded within accrued expenses and other payables in our consolidated balance sheet. Our operations are subject to extensive federal, state, and local environmental laws and regulations. Although we believe our operations are in substantial compliance with applicable environmental laws and regulations, risks of additional costs and liabilities are inherent in our business, and there can be no assurance that we will not incur significant costs. Moreover, it is possible that other developments, such as increasingly stringent environmental laws, regulations and enforcement policies thereunder, and claims for damages to property or persons resulting from the operations, could result in substantial costs. Accordingly, we have adopted policies, practices, and procedures in the areas of pollution control, product safety, occupational health, and the handling, storage, use, and disposal of hazardous materials designed to prevent material environmental or other damage, and to limit the financial liability that could result from such events. However, some risk of environmental or other damage is inherent in our business.
Asset Retirement Obligations
We have contractual and regulatory obligations at certain facilities for which we have to perform remediation, dismantlement or removal activities when the assets are retired. Our liability for asset retirement obligations is discounted to present value. To calculate the liability, we make estimates and assumptions about the retirement cost and the timing of retirement. Changes in our assumptions and estimates may occur as a result of the passage of time and the occurrence of future events.
NGL ENERGY PARTNERS LP AND SUBSIDIARIES
Notes to Consolidated Financial Statements (Continued)
The following table summarizes changes in our asset retirement obligations, which is reported within other noncurrent liabilities in our consolidated balance sheets (in thousands):
| | | | | | | | |
| Asset retirement obligations at March 31, 2022 | | $ | 29,941 | |
| Liabilities incurred | | 3,880 | |
| Liabilities associated with disposed assets (1) | | (1,493) | |
| Liabilities settled | | (391) | |
| Accretion expense | | 3,226 | |
| Asset retirement obligations at March 31, 2023 | | 35,163 | |
| Liabilities incurred | | 23,088 | |
| | |
| Liabilities associated with disposed assets (2) | | (3,718) | |
| Liabilities settled | | (222) | |
| Liabilities held for sale (3) | | (356) | |
| Accretion expense | | 2,619 | |
| Asset retirement obligations at March 31, 2024 | | $ | 56,574 | |
(1) Relates to the sale of certain saltwater disposal wells and other long-lived assets within our Water Solutions segment (see Note 17).
(2) Relates to the sale of certain saltwater disposal wells and other long-lived assets within our Water Solutions segment and the sale of a natural gas liquids terminal in our Liquids Logistics segment (see Note 17).
(3) Relates to asset retirement obligations classified as held for sale for the sale of certain saltwater disposal assets within our Water Solutions segment (see Note 17).
In addition to the obligations described above, we may be obligated to remove facilities or perform other remediation upon retirement of certain other assets. However, the fair value of the asset retirement obligation cannot currently be reasonably estimated because the settlement dates are indeterminable. We will record an asset retirement obligation for these assets in the periods in which settlement dates are reasonably determinable.
Pipeline Capacity Agreement
We have a noncancelable agreement with a crude oil pipeline operator, which guarantees us minimum monthly shipping capacity on the pipeline. As a result, we are required to pay the minimum shipping fees if actual shipments are less than our allotted capacity. Under this agreement, we have the ability to recover minimum shipping fees previously paid if our shipping volumes exceed the minimum monthly shipping commitment during each month remaining under the agreement, and this agreement allows us to continue shipping up to six months after the maturity date of the contract in order to recapture previously paid minimum shipping delinquency fees.
The future minimum throughput payments under this agreement at March 31, 2024 were $30.4 million, of which all will be recognized during the year ending March 31, 2025.
NGL ENERGY PARTNERS LP AND SUBSIDIARIES
Notes to Consolidated Financial Statements (Continued)
Sales and Purchase Contracts
We have entered into product sales and purchase contracts for which we expect the parties to physically settle and deliver the inventory in future periods.
At March 31, 2024, we had the following commodity purchase commitments:
| | | | | | | | | | | | | | | | | | | | | | | | | | |
| | Crude Oil (1) | | Natural Gas Liquids |
| | Value | | Volume
(in barrels) | | Value | | Volume
(in gallons) |
| | (in thousands) |
| Fixed-Price Commodity Purchase Commitments: | | | | | | | | |
| Year Ending March 31, | | | | | | | | |
| 2025 | | $ | 76,134 | | | 1,037 | | | $ | 25,413 | | | 33,204 | |
| 2026 | | — | | | — | | | 4,464 | | | 6,510 | |
| 2027 | | — | | | — | | | 2,963 | | | 4,284 | |
| | | | | | | | |
| Total | | $ | 76,134 | | | 1,037 | | | $ | 32,840 | | | 43,998 | |
| | | | | | | | |
| Index-Price Commodity Purchase Commitments: | | | | | | | | |
| Year Ending March 31, | | | | | | | | |
| 2025 | | $ | 3,658,596 | | | 46,617 | | | $ | 950,129 | | | 996,662 | |
| 2026 | | 721,488 | | | 10,506 | | | 40,873 | | | 56,053 | |
| 2027 | | — | | | — | | | 12,642 | | | 25,200 | |
| | | | | | | | |
| Total | | $ | 4,380,084 | | | 57,123 | | | $ | 1,003,644 | | | 1,077,915 | |
(1) Our crude oil index-price purchase commitments exceed our crude oil index-price sales commitments (presented below) due primarily to our long-term purchase commitments for crude oil that we purchase and ship on the Grand Mesa Pipeline. As these purchase commitments are deliver-or-pay contracts, whereby our counterparty is required to pay us for any volumes not delivered, we have not entered into corresponding long-term sales contracts for volumes we may not receive.
At March 31, 2024, we had the following commodity sale commitments:
| | | | | | | | | | | | | | | | | | | | | | | | | | |
| | Crude Oil | | Natural Gas Liquids |
| | Value | | Volume
(in barrels) | | Value | | Volume
(in gallons) |
| | (in thousands) |
| Fixed-Price Commodity Sale Commitments: | | | | | | | | |
| Year Ending March 31, | | | | | | | | |
| 2025 | | $ | 76,593 | | | 1,037 | | | $ | 35,840 | | | 38,377 | |
| 2026 | | — | | | — | | | 4,888 | | | 6,136 | |
| 2027 | | — | | | — | | | 3,140 | | | 4,247 | |
| 2028 | | — | | | — | | | 74 | | | 80 | |
| Total | | $ | 76,593 | | | 1,037 | | | $ | 43,942 | | | 48,840 | |
| | | | | | | | |
| Index-Price Commodity Sale Commitments: | | | | | | | | |
| Year Ending March 31, | | | | | | | | |
| 2025 | | $ | 2,953,808 | | | 35,749 | | | $ | 538,274 | | | 479,487 | |
| 2026 | | 30,068 | | | 390 | | | 2,080 | | | 2,007 | |
| | | | | | | | |
| | | | | | | | |
| Total | | $ | 2,983,876 | | | 36,139 | | | $ | 540,354 | | | 481,494 | |
We account for the contracts shown in the tables above using the normal purchase and normal sale election. Under this accounting policy election, we do not record the physical contracts at fair value at each balance sheet date; instead, we record the purchase or sale at the contracted value once the delivery occurs. Contracts in the tables above may have offsetting derivative contracts (described in Note 10) or inventory positions (described in Note 2).
Certain other forward purchase and sale contracts do not qualify for the normal purchase and normal sale election. These contracts are recorded at fair value in our consolidated balance sheet and are not included in the tables above. These
NGL ENERGY PARTNERS LP AND SUBSIDIARIES
Notes to Consolidated Financial Statements (Continued)
contracts are included in the derivative disclosures in Note 10, and represent $52.2 million of our prepaid expenses and other current assets and $34.7 million of our accrued expenses and other payables at March 31, 2024.
Other Commitments
We have noncancelable agreements for product storage, railcar spurs, capital projects and real estate. The following table summarizes future minimum payments under these agreements at March 31, 2024 (in thousands):
| | | | | |
| Year Ending March 31, | |
| 2025 | $ | 34,815 | |
| 2026 | 6,379 | |
| 2027 | 6,405 | |
| 2028 | 2,353 | |
| 2029 | 2,136 | |
| Thereafter | 3,587 | |
| Total | $ | 55,675 | |
As part of the acquisition of Hillstone Environmental Partners, LLC, we assumed an obligation to pay a quarterly subsidy payment in the event that specified volumetric thresholds are not exceeded at a third-party facility (“Subsidy Agreement”). During the years ended March 31, 2023 and 2022, we recorded $1.3 million and $2.1 million, respectively, within operating expense in our consolidated statements of operations. The Subsidy Agreement expired on December 31, 2022.
Note 9—Equity
Partnership Equity
The Partnership’s equity consists of a 0.1% GP interest and a 99.9% limited partner interest, which consists of common units. Our GP has the right, but not the obligation, to contribute a proportionate amount of capital to the Partnership to maintain its 0.1% GP interest. Our GP is not required to guarantee or pay any of our debts or obligations. At March 31, 2024, we owned 8.69% of our GP.
General Partner Contributions
In connection with the issuance of common units for the vesting of restricted units during the years ended March 31, 2024, 2023 and 2022, we issued 586, 1,232 and 1,103, respectively, notional units to our GP for less than $0.1 million in each of the years, in order to maintain its 0.1% interest in the Partnership.
Common Unit Repurchase Program
On August 30, 2019, the board of directors of our GP authorized a common unit repurchase program, under which we may repurchase up to $150.0 million of our outstanding common units through September 30, 2021 from time to time in the open market or in other privately negotiated transactions. We did not repurchase any units under this plan and this plan has expired.
Suspension of Common Unit and Preferred Unit Distributions
The board of directors of our GP temporarily suspended all distributions (common unit distributions which began with the quarter ended December 31, 2020 and preferred unit distributions which began with the quarter ended March 31, 2021) in order to deleverage our balance sheet and meet the financial performance ratios set within the 2026 Indenture, as discussed further in Note 7.
On February 6, 2024, the board of directors of our GP declared a cash distribution of 50% of the outstanding distribution arrearages through December 31, 2023 to the holders of the Class B Preferred Units, the Class C Preferred Units and the Class D Preferred Units. The distributions were made on February 27, 2024 to the holders of record at the close of trading on February 16, 2024. See below for a further discussion.
NGL ENERGY PARTNERS LP AND SUBSIDIARIES
Notes to Consolidated Financial Statements (Continued)
Class B Preferred Units
As of March 31, 2024, there were 12,585,642 of our Class B Fixed-to-Floating Rate Cumulative Redeemable Perpetual Preferred Units (“Class B Preferred Units”) outstanding.
The current distribution rate for the Class B Preferred Units is a floating rate of the three-month LIBOR interest rate (5.3314% for the quarter ended March 31, 2024) plus a spread of 7.213%. Effective July 3, 2023, the reference to LIBOR in the formulation for the distribution rate in these securities was replaced with three-month CME Term SOFR, as calculated and published by CME Group Benchmark Administration, Ltd., plus a tenor spread adjustment of 0.26161%, in accordance with the Adjustable Interest Rate (LIBOR) Act (“LIBOR Act”), and the rules implementing the LIBOR Act.
On February 27, 2024, we made a distribution payment of $55.9 million to the holders of record of the Class B Preferred Units at the close of trading on February 16, 2024.
For the quarter ended March 31, 2024, we did not declare or pay distributions to the holders of the Class B Preferred Units, thus the estimated average quarterly distribution for March 31, 2024 is $0.7840 and the estimated cumulative distributions in arrears as of March 31, 2024 for each Class B preferred unit is $5.4571. In addition, the amount of cumulative but unpaid distributions shall continue to accumulate at the then applicable rate until all unpaid distributions have been paid in full. The estimated total amount due as of March 31, 2024 is $68.7 million.
Class C Preferred Units
As of March 31, 2024, there were 1,800,000 of our Class C Fixed-to-Floating Rate Cumulative Redeemable Perpetual Preferred Units (“Class C Preferred Units”) outstanding.
The current distribution rate for the Class C Preferred Units is 9.625% per year of the $25.00 liquidation preference per unit (equal to $2.41 per unit per year).
On February 27, 2024, we made a distribution payment of $7.3 million to the holders of record of the Class C Preferred Units at the close of trading on February 16, 2024.
For the quarter ended March 31, 2024, we did not declare or pay distributions to the holders of the Class C Preferred Units, thus the estimated average quarterly distribution for March 31, 2024 is $0.6016 and the estimated cumulative distributions in arrears as of March 31, 2024 for each Class C preferred unit is $4.8374. In addition, the amount of cumulative but unpaid distributions shall continue to accumulate at the then applicable rate until all unpaid distributions have been paid in full. The estimated total amount due as of March 31, 2024 is $8.7 million.
On April 15, 2024, the distributions for the Class C Preferred Units will accumulate at a percentage of the $25.00 liquidation preference equal to the applicable three-month LIBOR interest rate (or alternative rate as determined in accordance with our amended and restated limited partnership agreement (“Partnership Agreement”)) plus a spread of 7.384%.
Class D Preferred Units
As of March 31, 2024, there were 600,000 preferred units (“Class D Preferred Units”) and warrants exercisable to purchase an aggregate of 25,500,000 common units outstanding.
The following table summarizes the outstanding warrants at March 31, 2024:
| | | | | | | | | | | | | | |
| Issuance Date and Description | | Number of Warrants | | Exercise Price |
| July 2, 2019 | | | | |
| Premium warrants | | 10,000,000 | | | $ | 17.45 | |
| Par warrants | | 7,000,000 | | | $ | 14.54 | |
| October 31, 2019 | | | | |
| Premium warrants | | 5,000,000 | | | $ | 16.28 | |
| Par warrants | | 3,500,000 | | | $ | 13.56 | |
All outstanding warrants are currently exercisable and any unexercised warrants will expire on the tenth anniversary of the date of issuance. The warrants will not participate in cash distributions.
NGL ENERGY PARTNERS LP AND SUBSIDIARIES
Notes to Consolidated Financial Statements (Continued)
The current distribution rate for the Class D Preferred Units is 10.00% (equal to $100.00 per every $1,000 in unit value per year), and includes an additional 0.50% rate increase due to a Class D distribution payment default, as defined within our Partnership Agreement.
On February 27, 2024, we made a distribution payment of $115.0 million to the holders of record of the Class D Preferred Units at the close of trading on February 16, 2024.
For the quarter ended March 31, 2024, we did not declare or pay distributions to the holders of the Class D Preferred Units, thus the estimated average quarterly distribution for March 31, 2024 is $27.31 and the estimated cumulative distributions in arrears as of March 31, 2024 for each Class D preferred unit is $232.33. In addition, the amount of cumulative but unpaid distributions shall continue to accumulate at the then applicable rate until all unpaid distributions have been paid in full. The estimated total amount due as of March 31, 2024 is $139.4 million.
On or after July 1, 2024, the holders of our Class D Preferred Units can elect, from time to time, for the distributions to be calculated based on a floating rate equal to the applicable three-month LIBOR interest rate (or alternative rate as determined in accordance with our Partnership Agreement) plus a spread of 7.00% (“Class D Variable Rate”, as defined in our Partnership Agreement). Each Class D Variable Rate election shall be effective for at least four quarters following such election.
At any time after July 2, 2019 (“Closing Date”), the Partnership shall have the right to redeem all of the outstanding Class D Preferred Units at a price per Class D Preferred Unit equal to the sum of the then-unpaid accumulations with respect to such Class D Preferred Unit and the greater of either the applicable multiple on invested capital or the applicable redemption price based on an applicable internal rate of return, as more fully described in our Partnership Agreement. At any time on or after the eighth anniversary of the Closing Date, each Class D Preferred Unitholder will have the right to require the Partnership to redeem on a date not prior to the 180th day after such anniversary all or a portion of the Class D Preferred Units then held by such preferred unitholder for the then-applicable redemption price, which may be paid in cash or, at the Partnership’s election, a combination of cash and a number of common units not to exceed one-half of the aggregate then- applicable redemption price, as more fully described in our Partnership Agreement. Upon a Class D Change of Control (as defined in our Partnership Agreement), each Class D Preferred Unitholder will have the right to require the Partnership to redeem the Class D Preferred Units then held by such Preferred Unitholder at a price per Class D Preferred Unit equal to the applicable redemption price. The Class D Preferred Units generally will not have any voting rights, except with respect to certain matters which require the vote of the Class D Preferred Units. The Class D Preferred Units generally do not have any voting rights, except that the Class D Preferred Units shall be entitled to vote as a separate class on any matter on which unitholders are entitled to vote that adversely affects the rights, powers, privileges or preferences of the Class D Preferred Units in relation to other classes of Partnership Interests (as defined in our Partnership Agreement) or as required by law. The consent of a majority of the then-outstanding Class D Preferred Units, with one vote per Class D Preferred Unit, shall be required to approve any matter for which the preferred unitholders are entitled to vote as a separate class or the consent of the representative of the Class D Preferred Unitholders, as applicable.
Total Preferred Unit Distributions in Arrears and Subsequent Payments
The estimated total preferred unit distributions in arrears for all classes of preferred units are $216.8 million as of March 31, 2024.
On April 4, 2024, the board of directors of our GP declared a cash distribution of 55.4% of the outstanding distribution arrearages through the quarter ended March 31, 2024 to the holders of the Class B Preferred Units and the Class C Preferred Units. Each of the Class B Preferred Units received $3.0224 per unit and the Class C Preferred Units received $2.6790 per unit on April 18, 2024 to the holders of record at the close of trading on April 12, 2024. Additionally, on April 4, 2024, the board of directors of our GP declared a cash distribution 55.4% of the outstanding distribution arrearages through the quarter ended March 31, 2024 to the holders of the Class D Preferred Units. The Class D Preferred Units quarterly distribution of $77.1 million was made on April 18, 2024 to the holders of record at the close of trading on April 12, 2024.
On April 9, 2024, the board of directors of our GP declared a cash distribution to fully pay the remaining distribution arrearages and interest on the Class B Preferred Units and the Class C Preferred Units. Each of the Class B Preferred Units received $2.4750 to fully pay the remaining distribution arrearages and interest as of April 25, 2024, which included a distribution of $9.9 million earned during the quarter ended March 31, 2024. The distribution was paid on April 25, 2024 to the holders of record at the close of trading on April 19, 2024. Each of the Class C Preferred Units received $2.1860 to fully pay the remaining distribution arrearages and interest as of April 25, 2024, which included a distribution of $1.1 million earned during the quarter ended March 31, 2024. The distribution was paid on April 25, 2024 to the holders of record at the close of
NGL ENERGY PARTNERS LP AND SUBSIDIARIES
Notes to Consolidated Financial Statements (Continued)
trading on April 19, 2024. Additionally, on April 9, 2024, the board of directors of our GP declared a cash distribution of $63.0 million to the holders of the Class D Preferred Units to fully pay the remaining distribution arrearages and interest as of April 25, 2024, which included a distribution of $16.4 million earned during the quarter ended March 31, 2024. The distribution was made on April 25, 2024 to the holders of record at the close of trading on April 19, 2024.
Amended and Restated Partnership Agreement
On February 4, 2021, NGL Energy Holdings LLC executed the First Amendment to the Seventh Amended and Restated Agreement of Limited Partnership for the purpose of amending certain consent rights in relation to the Class D Preferred Units.
Equity-Based Incentive Compensation
Our GP adopted a long-term incentive plan (“LTIP”), which allowed for the issuance of equity-based compensation. Our GP granted certain restricted units to employees and directors, which vest in tranches, subject to the continued service of the recipients through the vesting date (“Service Awards”). The Service Awards may also vest upon a change of control, at the discretion of the board of directors of our GP. No distributions accrue to or are paid on the Service Awards during the vesting period. As the LTIP expired on May 10, 2021, we had no common units available for grant during the year ended March 31, 2024.
The following table summarizes the Service Award activity during the year ended March 31, 2024:
| | | | | | | | | | | | | | |
| | | | Weighted-Average |
| | | | Grant Date |
| | Number of | | Fair Value |
| | Units | | Per Unit |
| Unvested Service Award units at March 31, 2023 | | 627,975 | | | $2.15 |
| Units vested and issued | | (606,725) | | | $2.15 |
| Units forfeited | | (21,250) | | | $2.15 |
| Unvested Service Award units at March 31, 2024 | | — | | | |
In connection with the vesting of certain Service Awards during the year ended March 31, 2024, 21,302 of the newly-vested common units were surrendered by employees in satisfaction of $0.1 million of employee withholding taxes paid by the Partnership. Pursuant to the expiration of the LTIP discussed above, those surrendered units are not available for future grants.
During the years ended March 31, 2024, 2023 and 2022, we recorded compensation expense related to Service Awards of $1.1 million, $2.7 million and $3.3 million, respectively.
Note 10—Fair Value of Financial Instruments
The carrying values of cash and cash equivalents, accounts receivable, accounts payable, accrued expenses, and other current assets and liabilities (excluding derivative instruments) approximate fair value because of the short-term nature of these instruments. Therefore, these assets and liabilities are not presented in the following table.
NGL ENERGY PARTNERS LP AND SUBSIDIARIES
Notes to Consolidated Financial Statements (Continued)
Derivatives
The following table summarizes, by level within the fair value hierarchy, the estimated fair values of our derivative assets and liabilities reported in our consolidated balance sheets at the dates indicated:
| | | | | | | | | | | | | | | | | | | | | | | | | | |
| | March 31, 2024 | | March 31, 2023 |
| | Derivative
Assets | | Derivative
Liabilities | | Derivative
Assets | | Derivative
Liabilities |
| | (in thousands) |
| Level 1 measurements | | $ | 4,798 | | | $ | (7,517) | | | $ | 63,553 | | | $ | (6,043) | |
| Level 2 measurements | | 54,040 | | | (37,345) | | | 25,128 | | | (15,827) | |
| | 58,838 | | | (44,862) | | | 88,681 | | | (21,870) | |
| | | | | | | | |
| Netting of counterparty contracts (1) | | (4,798) | | | 4,798 | | | (6,670) | | | 6,670 | |
| Net cash collateral provided (held) | | 630 | | | 2,719 | | | (47,686) | | | (114) | |
| Derivatives | | $ | 54,670 | | | $ | (37,345) | | | $ | 34,325 | | | $ | (15,314) | |
(1) Relates to commodity derivative assets and liabilities that are expected to be net settled on an exchange or through a master netting arrangement with the counterparty. Our physical contracts that do not qualify as normal purchase normal sale transactions are not subject to such master netting arrangements.
The following table summarizes the accounts that include our derivative assets and liabilities in our consolidated balance sheets at the dates indicated:
| | | | | | | | | | | | | | |
| | March 31, |
| | 2024 | | 2023 |
| | (in thousands) |
| Prepaid expenses and other current assets | | $ | 54,670 | | | $ | 33,875 | |
| Other noncurrent assets | | — | | | 450 | |
| Accrued expenses and other payables | | (36,679) | | | (14,752) | |
| Other noncurrent liabilities | | (666) | | | (562) | |
| Net derivative asset | | $ | 17,325 | | | $ | 19,011 | |
NGL ENERGY PARTNERS LP AND SUBSIDIARIES
Notes to Consolidated Financial Statements (Continued)
The following table summarizes our open derivative contract positions at the dates indicated. We do not account for these derivatives as hedges.
| | | | | | | | | | | | | | | | | | | | |
| Contracts | | Settlement Period | | Net Long (Short)
Notional Units
(in barrels) | | Fair Value of
Net Assets
(Liabilities) |
| | | | (in thousands) |
| At March 31, 2024: | | | | | | |
| Crude oil fixed-price (1) | | April 2024–March 2025 | | (174) | | | $ | (3,000) | |
| Propane fixed-price (1) | | April 2024–April 2025 | | 6,980 | | | 1,870 | |
| Refined products fixed-price (1) | | April 2024–December 2024 | | (244) | | | 518 | |
| Butane fixed-price (1) | | April 2024–March 2025 | | (982) | | | (2,222) | |
| Variable-to-fixed interest rate swap (2) | | April 2024–April 2026 | | | | 515 | |
| Other | | April 2024–March 2025 | | | | 16,295 | |
| | | | | | 13,976 | |
| Net cash collateral provided | | | | | | 3,349 | |
| Net derivative asset | | | | | | $ | 17,325 | |
| | | | | | |
| At March 31, 2023: | | | | | | |
| Crude oil fixed-price (1) | | April 2023–March 2024 | | 1,069 | | | $ | 52,613 | |
| Propane fixed-price (1) | | April 2023–March 2025 | | (320) | | | (4,047) | |
| Refined products fixed-price (1) | | April 2023–July 2024 | | (429) | | | 4,468 | |
| Butane fixed-price (1) | | April 2023–March 2024 | | (830) | | | 3,485 | |
| Other | | April 2023–September 2024 | | | | 10,292 | |
| | | | | | 66,811 | |
| Net cash collateral held | | | | | | (47,800) | |
| Net derivative asset | | | | | | $ | 19,011 | |
(1) We may have fixed price physical purchases, including inventory, offset by floating price physical sales or floating price physical purchases offset by fixed price physical sales. These contracts are derivatives we have entered into as an economic hedge against the risk of mismatches between fixed and floating price physical obligations.
(2) In March 2024, we entered into a $200.0 million interest rate swap to reduce the variability of cash outflows associated with our floating-rate, SOFR-based borrowings, including borrowings on the Term Loan B. Under this arrangement, we pay a fixed interest rate of 4.32% in exchange for SOFR-based variable interest through April 2026. The change in the fair value of the interest rate swap is recorded as a net gain or loss within interest expense in our consolidated statement of operations. There was $0.5 million of unrealized gains on our interest rate swap as of March 31, 2024.
The following table summarizes the net losses recorded from our commodity derivatives to revenues and cost of sales in our consolidated statements of operations for the periods indicated (in thousands):
| | | | | | | | |
| Year Ended March 31, | | |
| 2024 | | $ | (1,562) | |
| 2023 | | $ | (5,383) | |
| 2022 | | $ | (116,556) | |
Credit Risk
We have credit policies that we believe minimize our overall credit risk, including an evaluation of potential counterparties’ financial condition (including credit ratings), collateral requirements under certain circumstances, and the use of industry standard master netting agreements, which allow for offsetting counterparty receivable and payable balances for certain transactions. At March 31, 2024, our primary counterparties were retailers, resellers, energy marketers, producers, refiners, and dealers. This concentration of counterparties may impact our overall exposure to credit risk, either positively or negatively, as the counterparties may be similarly affected by changes in economic, regulatory or other conditions. If a counterparty does not perform on a contract, we may not realize amounts that have been recorded in our consolidated balance sheets and recognized in our net income.
NGL ENERGY PARTNERS LP AND SUBSIDIARIES
Notes to Consolidated Financial Statements (Continued)
Interest Rate Risk
The ABL Facility is variable-rate debt with interest rates that are generally indexed to the prime rate or SOFR. At March 31, 2024, there were no borrowings under the ABL Facility.
The Term Loan B is variable-rate debt with interest rates that are generally indexed to the SOFR. At March 31, 2024, there was $700.0 million of outstanding borrowings under the Term Loan B at a weighted average interest rate of 5.33% plus a margin of 4.50%.
In March 2024, we entered into a $200.0 million interest rate swap to reduce the variability of cash outflows associated with our floating-rate, SOFR-based borrowings, including borrowings on the Term Loan B.
The current distribution rate for the Class B Preferred Units is a floating rate of the three-month LIBOR interest rate (5.3314% for the quarter ended March 31, 2024) plus a spread of 7.213%. Effective July 3, 2023, the reference to LIBOR in the formulation for the distribution rate in these securities was replaced with three-month CME Term SOFR, as calculated and published by CME Group Benchmark Administration, Ltd., plus a tenor spread adjustment of 0.26161% in accordance with the LIBOR Act, and the rules implementing the LIBOR Act.
On April 15, 2024, the distributions for the Class C Preferred Units will accumulate at a percentage of the $25.00 liquidation preference equal to the applicable three-month LIBOR interest rate (or alternative rate as determined in accordance with our Partnership Agreement) plus a spread of 7.384%. On or after July 1, 2024, the holders of our Class D Preferred Units can elect, from time to time, for the distributions to be calculated based on a floating rate equal to the applicable three-month LIBOR interest rate (or alternative rate as determined in accordance with our Partnership Agreement) plus the Class D Variable Rate. Each Class D Variable Rate election shall be effective for at least four quarters following such election.
Fair Value of Fixed-Rate Notes
The following table provides fair values estimates of our fixed-rate notes at March 31, 2024 (in thousands):
| | | | | |
| 2029 Senior Secured Notes | $ | 921,375 | |
| 2032 Senior Secured Notes | $ | 1,332,500 | |
For the 2029 Senior Secured Notes and 2032 Senior Secured Notes, the fair value estimates were developed based on publicly traded quotes and would be classified as Level 2 in the fair value hierarchy.
Note 11—Segments
Our operations are organized into three reportable segments: (i) Water Solutions, (ii) Crude Oil Logistics and (iii) Liquids Logistics, consistent with the manner in which our chief operating decision maker evaluates performance and allocates resources. These segments have been identified based on the differing products and services, regulatory environment and the expertise required for these operations. Our Liquids Logistics reportable segment includes operating segments that have been aggregated based on the nature of the products and services provided. Operating income of these segments is reviewed by the chief operating decision maker to evaluate performance and make business decisions. Intersegment transactions are recorded based on prices negotiated between the segments and are eliminated upon consolidation.
See Note 1 for a discussion of the products and services of our reportable segments. The remainder of our business operations is presented as “Corporate and Other” and consists of certain corporate expenses that are not allocated to the reportable segments. The following table summarizes revenues related to our segments for the periods indicated:
NGL ENERGY PARTNERS LP AND SUBSIDIARIES
Notes to Consolidated Financial Statements (Continued)
| | | | | | | | | | | | | | | | | | | | |
| | Year Ended March 31, |
| | 2024 | | 2023 | | 2022 |
| | (in thousands) |
| Revenues: | | | | | | |
| Water Solutions: | | | | | | |
| Topic 606 revenues | | | | | | |
| Disposal service fees (1) | | $ | 598,046 | | | $ | 547,716 | | | $ | 413,301 | |
| Sale of recovered crude oil | | 107,367 | | | 120,705 | | | 77,203 | |
| Sale of water | | 11,594 | | | 17,509 | | | 39,518 | |
| Other service revenues (1) | | 13,030 | | | 11,108 | | | 14,844 | |
| Non-Topic 606 revenues | | 781 | | | — | | | — | |
| Total Water Solutions revenues | | 730,818 | | | 697,038 | | | 544,866 | |
| Crude Oil Logistics: | | | | | | |
| Topic 606 revenues | | | | | | |
| Crude oil sales | | 1,597,238 | | | 2,376,434 | | | 2,432,393 | |
| Crude oil transportation and other sales | | 50,151 | | | 89,502 | | | 75,484 | |
| Non-Topic 606 revenues | | 9,222 | | | 7,476 | | | 8,687 | |
| Elimination of intersegment sales | | (547) | | | (8,590) | | | (11,068) | |
| Total Crude Oil Logistics revenues | | 1,656,064 | | | 2,464,822 | | | 2,505,496 | |
| Liquids Logistics: | | | | | | |
| Topic 606 revenues | | | | | | |
| Refined products sales | | 2,192,783 | | | 2,554,084 | | | 1,899,898 | |
| Propane sales | | 735,698 | | | 1,156,821 | | | 1,322,210 | |
| Butane sales | | 627,400 | | | 772,085 | | | 861,998 | |
| Other products sales | | 377,744 | | | 565,706 | | | 551,841 | |
| Service sales | | 8,209 | | | 7,944 | | | 8,781 | |
| Non-Topic 606 revenues | | 627,855 | | | 476,404 | | | 254,148 | |
| Elimination of intersegment sales | | — | | | — | | | (1,323) | |
| Total Liquids Logistics revenues | | 4,569,689 | | | 5,533,044 | | | 4,897,553 | |
| Total revenues | | $ | 6,956,571 | | | $ | 8,694,904 | | | $ | 7,947,915 | |
(1) For the years ended March 31, 2023 and 2022, respectively, $2.7 million and $0.5 million of revenues, which were included in Other Service Revenues in our 2023 Annual Report, are now included in Disposal Service Fees.
During the years ended March 31, 2024, 2023 and 2022, our Liquids Logistics revenues included $132.1 million, $211.0 million and $238.0 million of non-US revenues, respectively.
NGL ENERGY PARTNERS LP AND SUBSIDIARIES
Notes to Consolidated Financial Statements (Continued)
The following table summarizes depreciation and amortization expense (including amortization expense recorded within interest expense, cost of sales and operating expenses in Note 6 and Note 7) and operating income (loss) by segment for the periods indicated:
| | | | | | | | | | | | | | | | | | | | |
| | Year Ended March 31, |
| | 2024 | | 2023 | | 2022 |
| | (in thousands) |
| Depreciation and Amortization: | | | | | | |
| Water Solutions | | $ | 214,727 | | | $ | 207,328 | | | $ | 214,805 | |
| Crude Oil Logistics | | 36,922 | | | 46,577 | | | 48,489 | |
| Liquids Logistics | | 10,632 | | | 13,575 | | | 19,000 | |
| Corporate and Other | | 20,450 | | | 23,399 | | | 23,914 | |
| Total | | $ | 282,731 | | | $ | 290,879 | | | $ | 306,208 | |
| | | | | | |
| Operating Income (Loss): | | | | | | |
| Water Solutions | | $ | 231,256 | | | $ | 198,924 | | | $ | 94,851 | |
| Crude Oil Logistics | | 52,074 | | | 81,524 | | | 45,033 | |
| Liquids Logistics | | 2,481 | | | 66,624 | | | (8,441) | |
| Corporate and Other | | (108,239) | | | (57,909) | | | (48,400) | |
| Total | | $ | 177,572 | | | $ | 289,163 | | | $ | 83,043 | |
The following table summarizes additions to property, plant and equipment and intangible assets by segment for the periods indicated. This information has been prepared on the accrual basis, and includes property, plant and equipment and intangible assets acquired in acquisitions.
| | | | | | | | | | | | | | | | | | | | |
| | Year Ended March 31, |
| | 2024 | | 2023 | | 2022 |
| | (in thousands) |
| Water Solutions | | $ | 145,048 | | | $ | 123,180 | | | $ | 115,267 | |
| Crude Oil Logistics | | 6,905 | | | 9,649 | | | 6,422 | |
| Liquids Logistics | | 15,791 | | | 5,704 | | | 11,185 | |
| Corporate and Other | | 2,323 | | | 2,207 | | | 2,148 | |
| Total | | $ | 170,067 | | | $ | 140,740 | | | $ | 135,022 | |
The following tables summarize long-lived assets (consisting of property, plant and equipment, intangible assets, operating lease right-of-use assets and goodwill) and total assets by segment at the dates indicated:
| | | | | | | | | | | | | | |
| | March 31, |
| | 2024 | | 2023 |
| | (in thousands) |
| Long-lived assets, net: | | | | |
| Water Solutions | | $ | 2,608,007 | | | $ | 2,810,534 | |
| Crude Oil Logistics | | 827,248 | | | 870,999 | |
| Liquids Logistics (1) | | 298,595 | | | 363,736 | |
| Corporate and Other | | 34,267 | | | 39,363 | |
| Total | | $ | 3,768,117 | | | $ | 4,084,632 | |
(1) Includes $10.2 million and $12.5 million of non-US long-lived assets at March 31, 2024 and 2023, respectively.
NGL ENERGY PARTNERS LP AND SUBSIDIARIES
Notes to Consolidated Financial Statements (Continued)
| | | | | | | | | | | | | | |
| | March 31, |
| | 2024 | | 2023 |
| | (in thousands) |
| Total assets: | | | | |
| Water Solutions | | $ | 2,818,444 | | | $ | 3,009,869 | |
| Crude Oil Logistics | | 1,368,461 | | | 1,616,953 | |
| Liquids Logistics (1) | | 686,885 | | | 774,221 | |
| Corporate and Other | | 79,707 | | | 55,101 | |
| Assets held for sale (Note 17) | | 66,597 | | | — | |
| Total | | $ | 5,020,094 | | | $ | 5,456,144 | |
(1) Includes $22.1 million and $32.3 million of non-US total assets at March 31, 2024 and 2023, respectively.
Note 12—Transactions with Affiliates
The following table summarizes our related party transactions for the periods indicated:
| | | | | | | | | | | | | | | | | | | | |
| | Year Ended March 31, |
| | 2024 | | 2023 | | 2022 |
| | (in thousands) |
| Purchases from equity method investees | | $ | 1,281 | | | $ | 1,872 | | | $ | 1,091 | |
| Purchases from entities affiliated with management | | $ | 100 | | | $ | — | | | $ | 1,489 | |
| | | | | | |
Accounts receivable from affiliates consist of the following at the dates indicated:
| | | | | | | | | | | | | | |
| | March 31, |
| | 2024 | | 2023 |
| | (in thousands) |
| Equity method investees | | $ | 1,501 | | | $ | 673 | |
| NGL Energy Holdings LLC (1) | | — | | | 11,688 | |
| Entities affiliated with management | | — | | | 1 | |
| Total | | $ | 1,501 | | | $ | 12,362 | |
(1) The outstanding receivable balance, which related to legal costs associated with the LCT legal matter (see Note 8), was written off, as it was determined that the Partnership should bear the financial responsibility for the litigation.
Accounts payable to affiliates consist of the following at the dates indicated:
| | | | | | | | | | | | | | |
| | March 31, |
| | 2024 | | 2023 |
| | (in thousands) |
| Equity method investees | | $ | 36 | | | $ | 64 | |
| Entities affiliated with management | | 1 | | | 1 | |
| Total | | $ | 37 | | | $ | 65 | |
Other Related Party Transactions
Guarantee of Outstanding Loan for KAIR2014 LLC (“KAIR2014”)
In connection with the purchase of our 50% interest in an aircraft company, KAIR2014, we executed a joint and several guarantee for the benefit of the lender for KAIR2014’s outstanding loan. The other owner of KAIR2014, our Chief Executive Officer, H. Michael Krimbill, is a party to a similar guarantee. This guarantee obligates us for the payment and performance of KAIR2014 with respect to the repayment of the loan, which was set to mature in September 2023. On September 1, 2023, KAIR2014 entered into an agreement to extend the maturity date of the loan to September 1, 2028. Accordingly, we and H. Michael Krimbill executed new joint and several guarantees for the benefit of the lender for KAIR2014’s outstanding loan. In December 2023, KAIR2014 sold an airplane for total consideration of approximately $4.7 million. A portion of the proceeds was used to repay the outstanding loan balance of approximately $2.1 million, resulting in the release of our guarantee.
NGL ENERGY PARTNERS LP AND SUBSIDIARIES
Notes to Consolidated Financial Statements (Continued)
Note 13—Employee Benefit Plan
We have established a defined contribution 401(k) plan to assist our eligible employees in saving for retirement on a tax-deferred basis. The 401(k) plan permits all eligible employees to make voluntary pre-tax contributions to the plan, subject to applicable tax limitations. For every dollar that employees contribute up to 4% of their eligible compensation (as defined in the plan), we contribute one dollar, plus 50 cents for every dollar employees contribute between 4 and 6% of their eligible compensation (as defined in the plan). Our matching contributions vest over an employee’s first two years of employment, subject to a participant’s continued service. Expenses under the plan for the years ended March 31, 2024, 2023 and 2022 were $2.8 million, $2.8 million and $2.9 million, respectively.
Note 14—Revenue from Contracts with Customers
We recognize revenue for services and products under revenue contracts as our obligations to either perform services or deliver or sell products under the contracts are satisfied. A performance obligation is a promise in a contract to transfer a distinct good or service to the customer. A contract’s transaction price is allocated to each distinct performance obligation in the contract and is recognized as revenue when, or as, the performance obligation is satisfied. Our revenue contracts in scope under ASC 606 primarily have a single performance obligation. The evaluation of when performance obligations have been satisfied and the transaction price that is allocated to our performance obligations requires significant judgment and assumptions, including our evaluation of the timing of when control of the underlying good or service has transferred to our customers and the relative stand-alone selling price of goods and services provided to customers under contracts with multiple performance obligations. Actual results can vary from those judgments and assumptions. We do not have any material contracts with multiple performance obligations or under which we receive material amounts of non-cash consideration. Our costs to obtain or fulfill our revenue contracts were not material as of March 31, 2024.
The majority of our revenue agreements are in scope under ASC 606 and the remainder of our revenue comes from contracts that are accounted for as derivatives under ASC 815 or that contain nonmonetary exchanges or leases in the scope of ASC 845 and ASC 842, respectively. See Note 11 for a detail of disaggregated revenue. Revenue from contracts accounted for as derivatives under ASC 815 within our Liquids Logistics segment includes net gains of $36.2 million, $4.2 million and $2.4 million, respectively, during the years ended March 31, 2024, 2023 and 2022, related to changes in the mark-to-market value of these contracts recorded.
Payment terms and conditions vary by contract type, although terms generally include a requirement of payment within 30 to 60 days. In instances where the timing of revenue recognition differs from the timing of invoicing, we have determined our contracts generally do not include a significant financing component. The primary purpose of our invoicing terms is to allow customers to secure the right to reserve the product or storage capacity to be received or used at a later date, not to receive financing from our customers or to provide customers with financing.
We report taxes collected from customers and remitted to taxing authorities, such as sales and use taxes, on a net basis. We include amounts billed to customers for shipping and handling costs in revenues in our consolidated statements of operations.
Water Solutions Performance Obligations
Within the Water Solutions segment, revenue is disaggregated into two primary revenue streams that include service revenue and commodity sales revenue. For contracts involving disposal services, we accept produced water and solids for disposal at our facilities. In cases where we have agreed within a contract to remove crude oil from the produced water, the skim oil will be valued as non-cash consideration. Ordinarily, the fair value of the skim oil should be estimated at the contract inception date; however, due to variability of the form of the non-cash consideration, the amount and dollar value are unknown at the contract inception date. Accordingly, ASC 606-10-32-11 allows us to value the skim oil on the date in which the value becomes known.
The Water Solutions segment has certain disposal contracts that contain the following types of terms or pricing structures that involve significant judgment that impacts the determination and timing of revenue.
•Minimum volume commitments. We receive a shortfall fee if the customer does not deliver a certain amount of volume of produced water over a specified period of time. At each reporting period, we make a determination as to the likelihood of earning this fee. We recognize revenue from these contracts when (i) actual volumes are
NGL ENERGY PARTNERS LP AND SUBSIDIARIES
Notes to Consolidated Financial Statements (Continued)
received; and (ii) when the likelihood of a customer exercising its remaining rights to make up the deficient volumes under minimum volume commitments becomes remote (also known as the breakage model).
•Tiered pricing. For contracts with tiered pricing provisions, the period in which the tiers are earned and settled (i.e., the “reset period”) may vary from monthly to over a period of multiple months. If the tiered pricing is based on a month, we allocate the fee to the distinct daily service to which it relates. If the tiered pricing spans across multiple reporting periods, we estimate the total transaction price at the beginning of each reset period, based on the expected volumes. We revise the estimate of variable consideration at each reporting date throughout each reset period.
•Volume discount pricing. Volume discount pricing is a form of variable consideration whereby the customer pays for the volumes delivered on a cumulative basis. Similar to tiered pricing, the period in which the cumulative volumes are earned and settled (i.e., the “reset period”) may vary from daily to over a period of multiple months. If the volume discount is based on a month, we allocate the fee to the distinct daily service to which it relates. If the volume discount period spans across multiple reporting periods, we estimate the total transaction price at the beginning of each reset period, based on the expected volumes. We revise the estimate of variable consideration at each reporting date throughout each reset period.
For all of our disposal contracts within the Water Solutions segment, revenue will be recognized over time utilizing the output method based on the volume of produced water or solids we accept from the customer. For contracts that involve the sale of recovered crude oil and reuse, recycled and brackish non-potable water, we will recognize revenue at a point in time, based on when control of the product is transferred to the customer.
Crude Oil Logistics Performance Obligations
Within the Crude Oil Logistics segment, revenue is disaggregated into two primary revenue streams that include revenue from the sale of commodities and service revenue. For sales of commodities, we are obligated to deliver a predetermined amount of crude oil, primarily on a month-to-month basis, to our customers. For these types of agreements, revenue is recognized at a point in time based on when the crude oil is delivered and control is transferred to the customer.
For revenue received from services rendered, we are obligated to provide throughput services to move crude oil via pipeline or railcar or to provide terminal maintenance services. In either case, the obligation is satisfied over time utilizing the output method based on each volume of crude oil that is moved from the origination point to the final destination or based on the passage of time.
Liquids Logistics Performance Obligations
Within the Liquids Logistics segment, revenue is disaggregated into two primary revenue streams that include revenue from the sale of commodities and service revenue. For sales of commodities, we are obligated to deliver a specified amount of product over a specified period of time. For these types of agreements, revenue is recognized at a point in time based on when the product is delivered and control is transferred to the customer.
For revenue received from services rendered, we offer a variety of services which include: (i) storage services where product is commingled; (ii) railcar transportation services; (iii) transloading services; and (iv) logistics services. We are obligated to provide these services over a predetermined period of time. All revenue from services is recognized over time utilizing the output method based on volumes stored or moved.
Remaining Performance Obligations
Most of our service contracts are such that we have the right to consideration from a customer in an amount that corresponds directly with the value to the customer of our performance completed to date. Therefore, we utilized the practical expedient in ASC 606-10-55-18 under which we recognize revenue in the amount to which we have the right to invoice. Applying this practical expedient, we are not required to disclose the transaction price allocated to remaining performance obligations under these contracts. The following table summarizes the amount and timing of revenue recognition for such contracts at March 31, 2024 (in thousands):
NGL ENERGY PARTNERS LP AND SUBSIDIARIES
Notes to Consolidated Financial Statements (Continued)
| | | | | |
| Year Ending March 31, | |
| 2025 | $ | 115,348 | |
| 2026 | 69,497 | |
| 2027 | 54,787 | |
| 2028 | 43,627 | |
| 2029 | 42,524 | |
| Thereafter | 55,152 | |
| Total | $ | 380,935 | |
Many agreements are short-term in nature with a contract term of one year or less. For those contracts, we utilized the practical expedient in ASC 606-10-50 that exempts us from disclosure of the transaction price allocated to remaining performance obligations if the performance obligation is part of a contract that has an original expected duration of one year or less. Additionally, for our product sales contracts, we have elected the practical expedient set out in ASC 606-10-50-14A, which states that we are not required to disclose the transaction price allocated to remaining performance obligations if the variable consideration is allocated entirely to a wholly unsatisfied performance obligation. Under these agreements, each unit of product represents a separate performance obligation and therefore future volumes are wholly unsatisfied and disclosure of transaction price allocated to remaining performance obligations is not required. Under product sales contracts, the variability arises as both volume and pricing (typically index-based) are not known until the product is delivered.
Contract Assets and Liabilities
Amounts owed from our customers under our revenue contracts are typically billed as the service is being provided on a monthly basis and are due within 1-30 days of billing, and are classified as accounts receivable-trade on our consolidated balance sheets. Under certain of our contracts, we recognize revenues in excess of billings, referred to as contract assets, within prepaid expenses and other current assets in our consolidated balance sheets. Accounts receivable from contracts with customers are presented within accounts receivable-trade and accounts receivable-affiliates in our consolidated balance sheets.
Under certain of our contracts, we may be entitled to receive payments in advance of satisfying our performance obligations under the contract. We recognize a liability for these payments in excess of revenue recognized, referred to as deferred revenue or contract liabilities, within advance payments received from customers in our consolidated balance sheets. Our deferred revenue primarily relates to:
•Prepayments. Some revenue contracts contain prepayment provisions within our Liquids Logistics segment. In some cases, we also receive prepayments from customers purchasing commodities, which allows the customer to secure the right to receive their requested volumes in a future period. Revenue from these contracts is initially deferred, thus creating a contract liability.
•Multi-period contract in which fee escalates each subsequent year of the contract. Revenue from these contracts is recognized over time based on a weighted average of what is expected to be received over the life of the contract. As the actual amount billed and received from the customer differs from the amount of revenue recognized, a contract liability is recorded.
•Tiered pricing and volume discount pricing. As described above, we revise the estimate of variable consideration at each reporting date throughout each reset period. As the actual amount billed and received from the customer differs from the amount of revenue recognized, a contract liability is recorded.
•Capital reimbursements. Certain contracts in our Water Solutions segment require that our customers reimburse us for capital expenditures related to the construction of long-lived assets, such as water gathering pipelines, booster stations and custody transfer points, utilized to provide services to them under the revenue contracts. Because we consider these amounts as consideration from customers associated with ongoing services to be provided to customers, we defer these upfront payments in deferred revenue and recognize the amounts in revenue over the life of the associated revenue contract as the performance obligations are satisfied under the contract.
NGL ENERGY PARTNERS LP AND SUBSIDIARIES
Notes to Consolidated Financial Statements (Continued)
The following tables summarize the balances of our contract assets and liabilities at the dates indicated:
| | | | | | | | | | | | | | |
| | March 31, 2024 | | March 31, 2023 |
| | (in thousands) |
| Accounts receivable from contracts with customers | | $ | 415,961 | | | $ | 425,760 | |
| Contract assets (current) | | $ | — | | | $ | 10,050 | |
| | | | | | | | |
| Contract liabilities at March 31, 2022 | | $ | 7,667 | |
| Payment received and deferred | | 62,969 | |
| Payment recognized in revenue | | (56,116) | |
| Contract liabilities at March 31, 2023 | | 14,520 | |
| Payment received and deferred | | 59,401 | |
| Payment recognized in revenue | | (56,824) | |
| Liabilities held for sale (1) | | (164) | |
| Contract liabilities at March 31, 2024 | | $ | 16,933 | |
(1) Relates to contract liabilities classified as held for sale for the sale of certain freshwater water solutions facilities within our Water Solutions segment (see Note 17).
Note 15—Leases
Lessee Accounting
Our leasing activity primarily consists of product storage, office space, real estate, railcars, and equipment. We determine if an agreement contains a lease at the inception of the arrangement. If an arrangement is determined to contain a lease, we classify the lease as an operating lease or a finance lease depending on the terms of the arrangement. Our leases are classified as operating and finance leases. Operating lease right-of-use assets represent our right to use an underlying asset for the lease term when we control the use of the asset by obtaining substantially all of the economic benefits of the asset and directing the use of the asset. Operating lease liabilities represent our obligation to make lease payments arising from the lease. Operating lease right-of-use assets and operating lease liabilities with an initial term of greater than one year are recognized at the commencement date based on the present value of lease payments over the lease term. As our leases do not provide an implicit interest rate, we use our incremental borrowing rate based on the information available at the commencement date in determining the present value of lease payments. Our incremental borrowing rate represents the interest rate which we would pay to borrow, on a collateralized basis, an amount equal to the lease payments over a similar term in a similar economic environment. We do not have any leases that provide for guarantees of residual value.
Our lease agreements may include options to extend or terminate the lease which are included in the measurement of our operating lease liability when it is reasonably certain that we will exercise the option. Lease renewal terms vary from one year to 30 years. Operating lease expense is recognized on a straight-line basis over the lease term. We have variable lease payments, including adjustments to lease payments based on an index or rate, such as a consumer price index, fair value adjustments to lease payments, and common area maintenance, real estate taxes, and insurance payments in certain real estate leases. We also have certain land leases within our Water Solutions segment that require us to pay a royalty, which could be based on a flat rate per barrel disposed or a percentage of revenue generated. Variable lease payments are excluded from operating lease right-of-use assets and operating lease liabilities and are expensed as incurred. Operating lease right-of-use assets also include any lease prepayments and exclude lease incentives. For leases acquired as a result of an acquisition, the right-of-use asset also includes adjustments for any favorable or unfavorable market terms present in the lease.
Short-term leases with an initial term of 12 months or less that do not include a purchase option, with the exception of railcar leases, are not recorded on the consolidated balance sheet. Operating lease expense for short-term leases is recognized on a straight-line basis over the lease term and is disclosed below.
We have lease agreements with lease and non-lease components, which are generally accounted for separately. For certain leases of buildings and land, we account for the lease and non-lease components as a single lease component based on the election of the practical expedient to not separate lease components from non-lease components.
At March 31, 2024, we had operating lease right-of-use assets of $97.2 million and current and noncurrent operating lease obligations of $31.1 million and $70.6 million, respectively, on our consolidated balance sheet. During the year ended March 31, 2024, we recorded an impairment of $2.4 million for certain leases in our Water Solutions segment due to
NGL ENERGY PARTNERS LP AND SUBSIDIARIES
Notes to Consolidated Financial Statements (Continued)
underutilization of certain freshwater wells. At March 31, 2023, we had operating lease right-of-use assets of $90.2 million and current and noncurrent operating lease obligations of $34.2 million and $58.5 million, respectively, on our consolidated balance sheet. During the year ended March 31, 2023, an impairment of the operating lease right-of-use asset of $1.5 million was recorded for underperforming terminals in our Crude Oil Logistics segment and an impairment of $0.1 million was recorded for underperforming terminals in our Liquids Logistics segment. Also, during the year ended March 31, 2023, we recorded an impairment of the operating lease right-of-use asset of $0.1 million related to an office lease in our Crude Oil Logistics segment and a $0.3 million loss related to the termination of leases in our Crude Oil Logistics segment.
At March 31, 2024, the weighted-average remaining lease term and weighted-average discount rate for our operating leases was 5.70 years and 9.39%, respectively. At March 31, 2023, the weighted-average remaining lease term and weighted-average discount rate for our operating leases was 5.71 years and 9.61%, respectively.
The following table summarizes the components of our lease cost for the periods indicated:
| | | | | | | | | | | | | | | | | | | | |
| | Year Ended March 31, |
| | 2024 | | 2023 | | 2022 |
| | (in thousands) |
| Operating lease cost (1) | | $ | 47,594 | | | $ | 51,525 | | | $ | 58,535 | |
| Variable lease cost (1) | | 31,118 | | | 29,742 | | | 22,130 | |
| Short-term lease cost (1) | | 931 | | | 341 | | | 351 | |
| Finance lease cost | | | | | | |
| Amortization of right-of-use asset (2) | | 5 | | | 3 | | | — | |
| Interest on lease obligation (3) | | 12 | | | 9 | | | — | |
| Total lease cost | | $ | 79,660 | | | $ | 81,620 | | | $ | 81,016 | |
(1) Included in operating expenses in our consolidated statements of operations.
(2) Included in depreciation and amortization expense in our consolidated statements of operations.
(3) Included in interest expense in our consolidated statement of operations.
The following table summarizes maturities of our lease obligations at March 31, 2024 (in thousands):
| | | | | | | | | | | |
| Operating | | Finance |
| Year Ending March 31, | Leases | | Lease (1) |
| 2025 | $ | 38,364 | | | $ | 28 | |
| 2026 | 25,566 | | | 28 | |
| 2027 | 19,393 | | | 28 | |
| 2028 | 16,461 | | | 9 | |
| 2029 | 7,992 | | | — | |
| Thereafter | 23,392 | | | — | |
| Total lease payments | 131,168 | | | 93 | |
| Less imputed interest | (29,505) | | | (18) | |
| Total lease obligations | $ | 101,663 | | | $ | 75 | |
(1) At March 31, 2024, the short-term finance lease obligation of less than $0.1 million is included in accrued expenses and other payables and the long-term finance lease obligation of $0.1 million is included in other noncurrent liabilities in our consolidated balance sheet.
NGL ENERGY PARTNERS LP AND SUBSIDIARIES
Notes to Consolidated Financial Statements (Continued)
The following table summarizes supplemental cash flow information related to our leases for the periods indicated:
| | | | | | | | | | | | | | | | | | | | |
| | Year Ended March 31, |
| | 2024 | | 2023 | | 2022 |
| | (in thousands) |
| Supplemental Cash Flow Information | | | | | | |
| Cash paid for amounts included in the measurement of lease obligations | | | | | | |
| Operating cash outflows from operating leases | | $ | 47,687 | | | $ | 51,147 | | | $ | 57,449 | |
| Operating cash outflows from finance lease | | $ | 12 | | | $ | 9 | | | $ | — | |
| Financing cash outflows from finance lease | | $ | 16 | | | $ | 10 | | | $ | — | |
| | | | | | |
| Right-of-use assets obtained in exchange for lease obligations | | | | | | |
| Operating leases | | $ | 53,338 | | | $ | 32,984 | | | $ | 14,950 | |
| Finance lease | | $ | — | | | $ | 102 | | | $ | — | |
Lessor Accounting and Subleases
Our lessor arrangements include storage and railcar contracts, of which certain agreements contain renewal options for periods of between one year and five years. We determine if an agreement contains a lease at the inception of the arrangement. If an arrangement is determined to contain a lease, we classify the lease as operating, sales-type or direct financing. Lessor accounting under ASC 842 is substantially unchanged and all of our leases will continue to be classified as operating leases. We also, from time to time, sublease certain of our storage capacity and railcars to third-parties. Fixed rental revenue is recognized on a straight-line basis over the lease term. During the years ended March 31, 2024, 2023 and 2022, fixed rental revenue was $17.8 million, $13.9 million and $14.4 million, which includes $6.2 million, $3.8 million and $1.4 million of sublease revenue, respectively.
The following table summarizes future minimum lease payments to be received under various noncancelable operating lease agreements at March 31, 2024 (in thousands):
| | | | | |
| Year Ending March 31, | |
| 2025 | $ | 10,922 | |
| 2026 | 11,047 | |
| 2027 | 9,741 | |
| 2028 | 6,669 | |
| 2029 | 1,827 | |
| Thereafter | 2,935 | |
| Total | $ | 43,141 | |
Note 16—Allowance for Current Expected Credit Loss (CECL)
ASU 2016-13 requires that an allowance for expected credit losses be recognized for certain financial assets that reflects the current expected credit loss over the financial asset’s contractual life. The valuation allowance considers the risk of loss, even if remote, and considers past events, current conditions and reasonable and supportable forecasts.
We are exposed to credit losses primarily through the sale of products and services and notes receivable from third-parties. A counterparty’s ability to pay is assessed through a credit process that considers the payment terms, the counterparty’s established credit rating or our assessment of the counterparty’s credit worthiness and other risks. We can require prepayment or collateral to mitigate credit risks.
We group our financial assets into pools of counterparties with similar risk characteristics for the purpose of determining the allowance for expected credit losses. Each reporting period, we assess whether a significant change in the risk of expected credit loss has occurred. Among the quantitative and qualitative factors considered in calculating our allowance for expected credit losses are historical financial data, including write-offs and allowances, current conditions, industry risk and current credit ratings. Financial assets will be written off in whole, or in part, when practical recovery efforts have been exhausted and no reasonable expectation of recovery exists. Subsequent recoveries of amounts previously written off are recorded as an increase to the allowance for expected credit losses. We manage receivable pools using past due balances as a key credit quality indicator.
NGL ENERGY PARTNERS LP AND SUBSIDIARIES
Notes to Consolidated Financial Statements (Continued)
The following table summarizes changes in our allowance for expected credit losses for the periods indicated:
| | | | | | | | | | | | | | |
| | Accounts Receivable - Trade | | Notes Receivable and Other |
| | | (in thousands) |
| Allowance for expected credit loss at March 31, 2021 | | $ | 2,192 | | | $ | 458 | |
| Change in provision for expected credit losses | | 929 | | | — | |
| Write-offs charged against the provision | | (491) | | | — | |
Disposition of Sawtooth (See Note 17) | | (4) | | | — | |
| Allowance for expected credit loss at March 31, 2022 | | 2,626 | | | 458 | |
| Change in provision for expected credit losses | | 25 | | | (410) | |
| Write-offs charged against the provision | | (687) | | | — | |
| Allowance for expected credit loss at March 31, 2023 | | 1,964 | | | 48 | |
| Change in provision for expected credit losses | | 367 | | | 104 | |
| Write-offs charged against the provision | | (660) | | | — | |
| Allowance for expected credit loss at March 31, 2024 | | $ | 1,671 | | | $ | 152 | |
Note 17—Other Matters
Dispute Settlement
During the three months ended December 31, 2022, we recorded other income of $29.5 million to settle a dispute associated with commercial activities not occurring in the current reporting periods. We received payment on December 29, 2022. This amount is recorded within other income, net in our consolidated statement of operations for the year ended March 31, 2023.
Third-party Loan Receivable
As previously disclosed, we had an outstanding loan receivable, including accrued interest, associated with our interest in a facility that was utilized by a third-party. Due to the bankruptcy of the third-party, we wrote down the remaining outstanding balance to what we expected to collect as an unsecured claim. At March 31, 2022, the outstanding balance of our unsecured claim was $0.6 million, net of an allowance for an expected credit loss, which was recorded within prepaid expenses and other current assets in our consolidated balance sheet. During the three months ended June 30, 2022, we received $1.0 million to settle our unsecured claim and we reversed the allowance for the expected credit loss.
Acquisition and Disposition of Certain Saltwater Disposal Assets
On June 21, 2023, we sold certain saltwater disposal assets in the Eagle Ford Basin to a third-party for total consideration of $3.0 million, of which $0.05 million was in cash and $2.95 million was a loan receivable. The buyer also assumed certain asset retirement obligations associated with the saltwater disposal assets. Interest on the loan receivable is based on the prime rate and is due monthly beginning on August 1, 2023. The loan receivable matures on December 31, 2025. We recorded a loss of $5.4 million within loss on disposal or impairment of assets, net in our consolidated statement of operations for the year ended March 31, 2024.
On March 6, 2024, we acquired a 51% voting interest in these previously sold saltwater disposal assets, which we are accounting for as an acquisition of assets. Total consideration for this acquisition was $3.0 million, which included the termination of a loan receivable (discussed above), and was allocated to property, plant and equipment, asset retirement obligation and noncontrolling interest.
Dispositions
Sale of Certain Saltwater Disposal Assets
On March 31, 2023, we sold certain saltwater disposal assets in the Midland Basin to two third-parties for total consideration of $13.6 million, of which $5.0 million was in cash and $8.6 million was a loan receivable. The buyer also assumed certain asset retirement obligations and contingent consideration liabilities associated with the saltwater disposal assets. Interest on the loan receivable is based on the prime rate and is due monthly beginning on September 1, 2023. The loan
NGL ENERGY PARTNERS LP AND SUBSIDIARIES
Notes to Consolidated Financial Statements (Continued)
receivable matures on April 1, 2026. We recorded a loss of $18.8 million within loss on disposal or impairment of assets, net in our consolidated statement of operations for the year ended March 31, 2023.
On July 25, 2023, we entered into an agreement in which we terminated a minimum volume water disposal contract and sold certain saltwater disposal assets and intangible assets in the Pinedale Anticline Basin to a third-party for total consideration of $8.7 million in cash. The buyer also assumed certain asset retirement obligations associated with the saltwater disposal assets. For this transaction, the consideration was allocated between the termination of the water disposal contract and the sale of assets based on their relative fair values. The terminated contract included a minimum volume commitment through December 31, 2025. Approximately $7.8 million of the total consideration was allocated to the termination of the water disposal contract and was recognized as revenue, and the remaining $0.9 million was allocated to the sale of assets. We recorded a loss of $21.2 million on the sale within loss on disposal or impairment of assets, net in our consolidated statement of operations for the year ended March 31, 2024.
On December 8, 2023, we sold certain saltwater disposal assets and intangible assets in the Delaware Basin to a third-party for total consideration of $12.0 million in cash. The buyer also assumed certain asset retirement obligations associated with the saltwater disposal assets. We recorded a loss of $1.3 million on the sale within loss on disposal or impairment of assets, net in our consolidated statement of operation for the year ended March 31, 2024.
As these sale transactions did not represent a strategic shift that will have a major effect on our operations or financial results, operations related to these portions of our Water Solutions segment have not been classified as discontinued operations.
Sale of Certain Natural Gas Liquids Terminals
On July 24, 2023, we sold two natural gas liquids terminals in the Pacific Northwest to a third-party for total consideration of $16.0 million in cash. Also, as part of this transaction, we wrote off goodwill allocated to this transaction and terminated an existing lease. We recorded a gain of $6.8 million within loss on disposal or impairment of assets, net in our consolidated statement of operations for the year ended March 31, 2024.
On November 15, 2023, we sold a certain other natural gas liquids terminal to a third-party for total consideration of $2.3 million in cash. The buyer also assumed certain asset retirement obligations associated with the natural gas liquids terminal. As part of this transaction, we also terminated an existing lease. We recorded a gain of $1.6 million on the sale within loss on disposal or impairment of assets, net in our consolidated statement of operations for the year ended March 31, 2024.
As these sale transactions did not represent a strategic shift that will have a major effect on our operations or financial results, operations related to these portions of our Liquids Logistics segment have not been classified as discontinued operations.
Sale of Marine Assets
On March 30, 2023, we sold our marine assets to two third-parties for total consideration of $111.7 million in cash less estimated expenses of approximately $7.5 million. We recorded a loss of $8.0 million within loss on disposal or impairment of assets, net in our consolidated statement of operations for the year ended March 31, 2023.
As this sale transaction did not represent a strategic shift that will have a major effect on our operations or financial results, operations related to this portion of our Crude Oil Logistics segment have not been classified as discontinued operations.
Sale of Sawtooth
On June 18, 2021, we sold our approximately 71.5% interest in Sawtooth to a group of buyers for total consideration of $70.0 million less expenses of approximately $2.0 million. We recorded a loss of $60.1 million within loss on disposal or impairment of assets, net in our consolidated statement of operations for the year ended March 31, 2022.
As this sale transaction did not represent a strategic shift that will have a major effect on our operations or financial results, operations related to this portion of our Liquids Logistics segment have not been classified as discontinued operations.
NGL ENERGY PARTNERS LP AND SUBSIDIARIES
Notes to Consolidated Financial Statements (Continued)
Assets and Liabilities Held for Sale
As discussed in Note 18, at March 31, 2024, we met the criteria for classifying the assets and liabilities of certain freshwater water solutions facilities, certain saltwater disposal assets and certain real estate as held for sale. Upon classification as held for sale, we recorded a loss of $1.6 million to write down certain saltwater disposal assets to fair value less cost to sell within loss on disposal or impairment of assets, net in our consolidated statement of operations for the year ended March 31, 2024, and a valuation allowance included in assets held for sale in our March 31, 2024 consolidated balance sheet. The following table summarizes the major classes of assets and liabilities classified as held for sale at March 31, 2024 (in thousands):
| | | | | | | | |
| Assets Held for Sale | | |
| Accounts receivable-trade, net | | $ | 565 | |
| Prepaid expenses and other current assets | | 13 | |
| Property, plant and equipment, net | | 14,354 | |
| Goodwill | | 4,108 | |
| Intangible assets, net | | 49,179 | |
| Valuation allowance on assets held for sale | | (1,622) | |
| Total assets held for sale | | $ | 66,597 | |
| | |
| Liabilities Held for Sale | | |
| Accounts payable-trade | | $ | 63 | |
| Accrued expenses and other payables | | 31 | |
| Advance payments received from customers | | 164 | |
| Other noncurrent liabilities | | 356 | |
| Total liabilities held for sale | | $ | 614 | |
As these sale transactions did not represent a strategic shift that will have a major effect on our operations or financial results, operations related to these portions of our Water Solutions segment have not been classified as discontinued operations.
Note 18—Subsequent Events
Dispositions
Sale of Certain Freshwater Water Solutions Facilities
On April 5, 2024, we sold approximately 122,250 acres of real estate on two ranches located in Eddy and Lea Counties, New Mexico to a third-party for total consideration of $69.3 million, including working capital. Our two ranches include fee, state and federal agricultural leased property, certain water rights, freshwater wells, and related freshwater infrastructure. See Note 17 for a summary of assets and liabilities held for sale at March 31, 2024.
Sale of Certain Saltwater Disposal Assets
On April 15, 2024, we sold certain saltwater disposal assets and intangible assets in the Delaware Basin to a third-party for total consideration of $4.2 million. See Note 17 for a summary of assets and liabilities held for sale at March 31, 2024.
Sale of Certain Real Estate
On May 14, 2024, we sold approximately 1,400 acres of real estate located in Lea County, New Mexico to a third-party for total consideration of $8.0 million. See Note 17 for a summary of assets and liabilities held for sale at March 31, 2024.
Distributions Declared
On April 4, 2024, the board of directors of our GP declared a cash distribution of 55.4% of the outstanding distribution arrearages through the quarter ended March 31, 2024 to the holders of the Class B Preferred Units, the Class C Preferred Units and the Class D Preferred Units. The total distribution of $120.0 million was made on April 18, 2024 to the holders of record at the close of trading on April 12, 2024. See Note 9 for a further discussion of this transaction.
NGL ENERGY PARTNERS LP AND SUBSIDIARIES
Notes to Consolidated Financial Statements (Continued)
On April 9, 2024, the board of directors of our GP declared a cash distribution to fully pay the remaining distribution arrearages and interest to the holders of the Class B Preferred Units, the Class C Preferred Units and the Class D Preferred Units. The total distribution of $98.1 million was made on April 25, 2024 to the holders of record at the close of trading on April 19, 2024. See Note 9 for a further discussion of this transaction.
Interest Rate Swap
In April 2024, we entered into a $200.0 million interest rate swap to reduce the variability of cash outflows associated with our floating-rate, SOFR-based borrowings, including borrowings on the Term Loan B. Under this arrangement, we pay a fixed interest rate of 4.79% in exchange for SOFR-based variable interest through April 2026.
Legal Contingencies
On May 28, 2024, the Supreme Court of Delaware affirmed the jury’s verdict against us in the LCT legal matter (see Note 8).
Common Unit Repurchase Program
On June 5, 2024, the board of directors of our GP authorized a common unit repurchase program, under which we may repurchase up to $50.0 million of our outstanding common units from time to time in the open market or in other privately negotiated transactions. This program does not have a fixed expiration date.