UNITED STATES
SECURITIES AND EXCHANGE COMMISSION
Washington, D.C. 20549
FORM N-CSR
CERTIFIED SHAREHOLDER REPORT OF REGISTERED
MANAGEMENT INVESTMENT COMPANIES
Investment Company Act file number 811-22487
DBX ETF Trust
(Exact name of registrant as specified in charter)
875 Third Avenue
New York, New York 10022
(Address of principal executive offices) (Zip code)
Diane Kenneally
100 Summer Street
Boston, MA 02110
(Name and address of agent for service)
Registrant’s telephone number, including area code: (212) 454-4500
Date of fiscal year end: May 31
Date of reporting period: May 31, 2023
Form N-CSR is to be used by management investment companies to file reports with the Commission not later than 10 days after the transmission to stockholders of any report that is required to be transmitted to stockholders under Rule 30e-1 under the Investment Company Act of 1940 (17 CFR 270.30e-1). The Commission may use the information provided on Form N-CSR in its regulatory, disclosure review, inspection, and policymaking roles.
A registrant is required to disclose the information specified by Form N-CSR, and the Commission will make this information public. A registrant is not required to respond to the collection of information contained in Form N-CSR unless the Form displays a currently valid Office of Management and Budget (“OMB”) control number. Please direct comments concerning the accuracy of the information collection burden estimate and any suggestions for reducing the burden to Secretary, Securities and Exchange Commission, 450 Fifth Street, NW, Washington, DC 20549-0609. The OMB has reviewed this collection of information under the clearance requirements of 44 U.S.C. § 3507.
| Item 1. | Reports to Stockholders. |
| (a) | The Report to Shareholders is attached herewith. |
May 31, 2023
Annual Report
DBX ETF Trust
Xtrackers International Real Estate ETF (HAUZ)

DBX ETF Trust
| Page | ||||
| 1 | ||||
| 3 | ||||
| 4 | ||||
| 6 | ||||
| 7 | ||||
| 18 | ||||
| 19 | ||||
| 20 | ||||
| 21 | ||||
| 22 | ||||
| 29 | ||||
| 30 | ||||
| 31 | ||||
| Board Considerations in Approval of Investment Advisory Contracts |
32 | |||
| 35 | ||||
| 38 | ||||
To our Shareholders: (Unaudited)
Dear shareholder,
We are pleased to provide this annual report on our Xtrackers International Real Estate ETF for the period ended May 31, 2023.
The global economy witnessed a period of volatility due to heightened inflation, growing interest rates, and sluggish industrial activity amid geopolitical tension between Russia and Ukraine. Rising inflation in both developed and emerging economies affected the cost of living as disposable incomes were eroded, resulting in aggressive interest rate hikes by the major central banks. The U.S. Federal Reserve (Fed) has raised rates eight consecutive times from June 2022 until its recent meeting in May 2023 — from 1% to 5.25%. The European Central Bank (ECB) has followed suit and raised Eurozone interest rates from 0% to 3.75%. Meanwhile, in Q2 2023, financial distress due to regional banking turmoil created new headwinds for the U.S. economy and increased the risk of recession later this year.
The Russia-Ukraine war and China’s Zero COVID policy added to supply headwinds, causing a slowdown in Europe. The energy crisis was aggravated by the closure of Nord Stream 1, the main pipeline supplying Russian gas to Europe. However, Eurozone inflation declined to a one-year low in March 2023 as CPI1 came in at 6.1%, significantly lower than the multi-decade high of 10.7% reached in October 2022. In the U.S., GDP2 grew at a weaker rate in 2022 than in 2021 but saw green shoots emerge in the second half 2022, followed by a slowdown in the first quarter of 2023. Inflation peaked in June 2022 and then continued on its downward trajectory. The labor market remained moderately resilient as the unemployment rate stayed stable during the period amid slowing wage growth. Meanwhile, in the U.K., markets remained volatile amid political and economic uncertainty as the austerity plan released in September 2022 by then Prime Minister Liz Truss received a negative welcome from markets, sending the pound sterling to an all-time low against the U.S. dollar. Markets cheered Rishi Sunak’s appointment as the country’s new prime minister while many of the policies announced by the former government were reversed.
The Bank of Japan remained accommodative and widened the band within which it had been maintaining 10-year bond yields. Japanese equity markets rose sharply in the first half of 2023, backed by strong GDP numbers, while CPI accelerated 4.1% year on year in April 2023, the biggest rise since 1981, increasing investor optimism that Japan is moving away from the deflationary stagnation of the past.
Notably, high borrowing costs and global monetary tightening made the global real estate markets non-compelling to investors. In the U.S., remote work and rising interest rates weighed on the commercial real estate sector. Office property values dropped 25% from 2022 levels, and average occupancy declined to less than half since March 2020. Within commodities, energy prices softened in the first half of 2023, and industrial metals saw price declines due to weakening demand from top consumer China, while precious metals such as gold and silver recorded robust price gains
We believe central banks across the world will likely remain cautious in their approach to monetary policy and watch for positive signs in the economy before taking any interest rate action. Recent banking system stress and debt ceiling-related concerns are also likely to weigh on the U.S. Federal Reserve’s (Fed’s) decisions in the coming months. Unlike the Fed, the ECB has clearly maintained its stance on monetary action and is willing to hike rates further until inflation is within its comfort range. The entire world, in our view, will be keenly watching how China recovers from its COVID-19-induced restrictions to induce an uptick in industrial activity and income recovery while boosting private sector investment.
Our team appreciates your trust and looks forward to serving your investment needs through innovative index-driven strategies.
Sincerely,
/s/ Freddi Klassen
Freddi Klassen
President and Chief Executive Officer
1 The Consumer Price Index (CPI) is a price index, the price of a weighted average market basket of consumer goods and services purchased by households.
2 Gross domestic product (GDP) is the monetary value of all finished goods and services produced within a country’s borders within a specific time period.
Assumptions, estimates and opinions contained in this document constitute our judgment as of the date of the document and are subject to change without notice. Any projections are based on a number of assumptions as to market conditions and there can be no guarantee that any projected results will be achieved. Past performance is not a guarantee of future results.
1
This Page is Intentionally Left Blank
2
DBX ETF Trust
Xtrackers International Real Estate ETF
Xtrackers International Real Estate ETF (HAUZ), seeks investment results that correspond generally to the performance, before fees and expenses, of the iSTOXX Developed and Emerging Markets ex USA PK VN Real Estate Index (the HAUZ Index). The HAUZ index is a free-float capitalization weighted index that provides exposure to publicly traded real estate securities in countries outside the United States, Pakistan, and Vietnam. For the 12-month period ended May 31, 2023, HAUZ shares returned -16.79%, compared to the HAUZ Index return of -16.97%.
The majority of the sectors contributed negatively to performance during the period with the greatest negative contribution coming from Real Estate Management & Development, Retail REITs and Office REITs. The Financial Services and Electric Utilities sectors were the positive contributors to performance. From a geographical perspective, most countries contributed negatively with Hong Kong, Germany and Japan being the most significant detractors. However, Mexico, India and Brazil contributed positively to the performance.
*************************
Performance data quoted represents past performance and does not guarantee future results. Investment returns and principal value of an investment will fluctuate so that an investor’s shares, when sold or redeemed, may be worth more or less than their original cost. Current performance may be lower or higher than the performance data quoted. To obtain the most recent month-end performance data visit www.Xtrackers.com. Returns assume that dividends and capital gains distributions have been reinvested. See pages 4-5 of this report for additional performance information, including performance data based on market value. The views expressed in this report reflect those of the portfolio management team only through the end of the period of the report as stated on the cover. The management team’s views are subject to change at any time based on market and other conditions and should not be construed as a recommendation. Current and future portfolio holdings are subject to risk.
3
DBX ETF Trust
Xtrackers International Real Estate ETF (HAUZ)
The Xtrackers International Real Estate ETF (the “Fund”), using a “passive” or indexing investment approach, seeks investment results that correspond generally to the performance, before fees and expenses, of the iSTOXX Developed and Emerging Markets ex USA PK VN Real Estate Index (the “Underlying Index”). The Underlying Index is a free-float capitalization weighted index that provides exposure to publicly traded real estate securities in countries outside the United States, excluding Pakistan and Vietnam. The MSCI ACWI ex USA Index is designed to provide exposure to equity securities in developed and emerging stock markets (excluding the United States). It is not possible to invest directly into an index.
| Performance as of May 31, 2023 | ||||||||
| Average Annual Total Return | ||||||||
| Net Asset Value | Market Value | iSTOXX Developed and Emerging Markets ex USA PK VN Real Estate Index2 |
MSCI ACWI ex USA Index | |||||
| One Year |
-16.79% | -16.48% | -16.97% | -1.41% | ||||
| Five Year |
-4.16% | -4.02% | -4.14% | 2.22% | ||||
| Since Inception1 |
1.32% | 1.35% | 1.64% | 3.41% | ||||
| Cumulative Total Returns | ||||||||
| Net Asset Value | Market Value | iSTOXX Developed and Emerging Markets ex USA PK VN Real Estate Index2 |
MSCI ACWI ex USA Index | |||||
| One Year |
-16.79% | -16.48% | -16.97% | -1.41% | ||||
| Five Year |
-19.14% | -18.56% | -19.04% | 11.62% | ||||
| Since Inception1 |
13.49% | 13.80% | 17.01% | 38.24% | ||||
1 Total returns are calculated based on the commencement of operations, October 1, 2013 (“Inception”).
2 On February 22, 2019, the Fund changed its Underlying Index from MSCI Asia Pacific ex Japan US Dollar Hedged Index to the iSTOXX Developed and Emerging Markets ex USA PK VN Real Estate Index. Returns reflect performance for the MSCI Asia Pacific ex Japan US Dollar Hedged Index through February 21, 2019.
Prior to February 22, 2019, the Fund was known as Xtrackers MSCI Asia Pacific ex Japan Hedged Equity ETF (DBAP) and had a different investment strategy. Past performance may have been different if the Fund’s current investment strategy had been in effect.
Past performance is no guarantee of future results. Current performance may be lower or higher than the performance data quoted. Performance data current to the most recent month-end is available at www.Xtrackers.com. Performance results assume reinvestment of all dividends and capital gain distributions and do not reflect the deduction of taxes that a shareholder would pay on fund distributions or on the sale of fund shares or redemption of fund creation units. The investment return and principal value of shares will vary with changes in market conditions. Shares may be worth more or less than their original cost when they are sold in the market or redeemed. Performance for certain funds may reflect a waiver of a portion of the unitary advisory fee. Without such waiver, performance would have been lower. The gross expense ratio of the Fund, as stated in the fee table of the prospectus dated October 1, 2022, was 0.12%, and may differ from the expense ratio disclosed in the Financial Highlights table in this report.
The Fund’s net asset value or “NAV” is calculated by dividing the value of the Fund’s total assets less total liabilities by the number of shares outstanding. The price used to calculate market return (“Market Price”) is determined by using the midpoint between the highest bid and the lowest offer on the primary stock exchange on which shares of a fund are listed for trading, as of the time that such fund’s NAV is calculated. Since shares of a fund may not have traded in the secondary market until after the fund’s inception, for the period from inception to the first day of secondary trading, the NAV of the fund is used as a proxy for the Market Price to calculate market returns. Market and NAV returns assume that dividends and capital gain distributions have been reinvested at Market Price and NAV, respectively.
An index is a statistical composite that tracks a specified financial market or sector. Unlike a fund, an index does not actually hold a portfolio of securities and therefore does not incur the expenses incurred by a fund. These expenses negatively impact fund performance. Also, market returns do not include brokerage commissions that may be payable on secondary market transactions. If brokerage commissions were included, market returns would be lower.
Generally accepted accounting principles require adjustments to be made to the net assets of the Fund at period end for financial reporting purposes only, and as such, the total return based on the unadjusted net asset value per share may differ from the total return reported in the financial highlights.
4
DBX ETF Trust
Performance Summary (Unaudited)
Xtrackers International Real Estate ETF (HAUZ) (Continued)
| Growth of an Assumed $10,000 Investment |
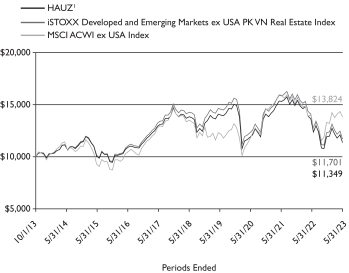
1 Based on Net Asset Value from commencement of operations, October 1, 2013.
| Sector Diversification* as of May 31, 2023 | ||
| Real Estate Operations/Development |
34.3% | |||
| Diversified |
15.3% | |||
| Real Estate Management/Services |
12.0% | |||
| Warehouse/Industry |
10.0% | |||
| Shopping Centers |
8.3% | |||
| Office Property |
5.3% | |||
| Apartments |
4.0% | |||
| Other |
10.8% | |||
|
|
|
|||
| Total |
100.0% |
| Ten Largest Equity Holdings as of May 31, 2023 (18.0% of Net Assets) | ||
| Description | % of Net Assets | |||
| Goodman Group (Australia) |
2.6% | |||
| Sun Hung Kai Properties Ltd. (Hong Kong) |
2.3% | |||
| Mitsui Fudosan Co. Ltd. (Japan) |
2.2% | |||
| Mitsubishi Estate Co. Ltd. (Japan) |
1.8% | |||
| Link (Hong Kong) |
1.8% | |||
| Vonovia SE (Germany) |
1.6% | |||
| Segro PLC (United Kingdom) |
1.5% | |||
| CK Asset Holdings Ltd. (Hong Kong) |
1.4% | |||
| Sumitomo Realty & Development Co. Ltd. (Japan) |
1.4% | |||
| KE Holdings, Inc. (China) |
1.4% | |||
| Country Diversification* as of May 31, 2023 | ||
| Japan |
21.1% | |||
| Hong Kong |
14.1% | |||
| Australia |
10.5% | |||
| United Kingdom |
7.3% | |||
| Singapore |
7.3% | |||
| Canada |
6.4% | |||
| Sweden |
3.3% | |||
| Thailand |
2.7% | |||
| France |
2.5% | |||
| Germany |
2.5% | |||
| China |
2.3% | |||
| Philippines |
2.3% | |||
| Switzerland |
2.1% | |||
| Other |
15.6% | |||
|
|
|
|||
| Total |
100.0% |
* As a percent of total investments excluding exchange-traded funds, securities lending collateral and cash equivalents.
Portfolio holdings and characteristics are subject to change. For more complete details about the Fund’s investment portfolio see page 7.
5
DBX ETF Trust
As a shareholder of the Fund, you incur two types of costs: (1) transaction costs, including brokerage commissions paid on purchases and sales of fund shares, and (2) ongoing costs, including unitary advisory fees and other Fund expenses. In the most recent six-month period the Fund limited these expenses; had it not done so, expenses would have been higher. The expense examples below are intended to help you understand your ongoing costs (in dollars) of investing in the Fund and to compare these costs with the ongoing costs of investing in other funds.
The examples in the tables are based on an investment of $1,000 invested at the beginning of the six-month period and held for the entire period (December 1, 2022 to May 31, 2023).
Actual expenses
The first line in the following tables provides information about actual account values and actual expenses. You may use the information in this line, together with the amount you invested, to estimate the expenses that you paid over the period. Simply divide your account value by $1,000 (for example, an $8,600 account value divided by $1,000 = 8.6), then multiply the result by the number in the first line under the heading “Expenses Paid During the Period” to estimate the expenses you paid on your account during this period.
Hypothetical example for comparison purposes
The second line in the following tables provides information about hypothetical account values and hypothetical expenses based on the Funds’ actual expense ratios and an assumed rate of return of 5% per year before expenses (which is not the Funds’ actual return). The hypothetical account values and expenses may not be used to estimate the actual ending account balance or expenses you paid for the period. You may use this information to compare the ongoing costs of investing in the Fund and other funds. To do so, compare this 5% hypothetical example with the 5% hypothetical examples that appear in the shareholder reports of the other funds.
Please note that the expenses shown in the tables are meant to highlight your ongoing costs only, and do not reflect any transactional costs. Therefore the second line in the table is useful in comparing ongoing costs only, and will not help you determine the relative total costs of owning different funds. In addition, if these transactional costs were included, your costs would have been higher.
| Beginning Account Value December 1, 2022 |
Ending Account Value May 31, 2023 |
Annualized Expense Ratio |
Expenses Paid During the Period Per $1,000(1) |
|||||||||||||
| Xtrackers International Real Estate ETF | ||||||||||||||||
| Actual |
$ | 1,000.00 | $ | 951.10 | 0.10 | % | $ | 0.49 | ||||||||
| Hypothetical (5% return before expenses) |
$ | 1,000.00 | $ | 1,024.43 | 0.10 | % | $ | 0.50 | ||||||||
(1) Expenses are equal to each Fund’s annualized expense ratio, multiplied by the average account value over the period, multiplied by 182 (the number of days in the most recent six-month period), then divided by 365.
6
DBX ETF Trust
Xtrackers International Real Estate ETF
May 31, 2023
| Number |
Value |
|||||||
| COMMON STOCKS — 99.2% | ||||||||
| Australia — 10.5% | ||||||||
| Abacus Property Group REIT |
292,013 | $ | 485,669 | |||||
| Arena REIT |
231,956 | 558,411 | ||||||
| Aspen Group Ltd./Australia REIT |
4,023 | 4,921 | ||||||
| BWP Trust REIT |
332,887 | 803,546 | ||||||
| Cedar Woods Properties Ltd. |
27,149 | 84,509 | ||||||
| Centuria Industrial REIT |
353,755 | 721,138 | ||||||
| Centuria Office REIT |
322,954 | 299,915 | ||||||
| Charter Hall Group REIT |
320,087 | 2,320,017 | ||||||
| Charter Hall Long Wale REIT |
429,557 | 1,198,128 | ||||||
| Charter Hall Retail REIT |
347,603 | 836,819 | ||||||
| Charter Hall Social Infrastructure REIT |
222,282 | 421,480 | ||||||
| Cromwell Property Group REIT |
1,043,774 | 364,758 | ||||||
| Dexus REIT |
719,381 | 3,822,145 | ||||||
| Dexus Convenience Retail REIT REIT |
91,974 | 148,802 | ||||||
| Dexus Industria REIT |
153,053 | 281,297 | ||||||
| GDI Property Group Partnership REIT |
342,387 | 156,211 | ||||||
| Goodman Group REIT |
1,148,538 | 14,590,518 | ||||||
| GPT Group REIT |
1,086,476 | 2,946,044 | ||||||
| Growthpoint Properties Australia Ltd. REIT |
190,136 | 375,292 | ||||||
| Healthco REIT |
92,478 | 82,290 | ||||||
| HMC Capital Ltd. REIT |
139,338 | 396,759 | ||||||
| HomeCo Daily Needs REIT |
1,160,622 | 897,561 | ||||||
| Hotel Property Investments Ltd. REIT |
138,538 | 307,516 | ||||||
| Ingenia Communities Group REIT |
250,036 | 679,605 | ||||||
| Lifestyle Communities Ltd. (a) |
64,785 | 629,304 | ||||||
| Mirvac Group REIT |
2,671,157 | 3,975,871 | ||||||
| National Storage REIT |
742,195 | 1,210,385 | ||||||
| Newmark Property REIT |
34,610 | 30,461 | ||||||
| Peet Ltd. |
250,990 | 192,477 | ||||||
| REA Group Ltd. (a) |
34,143 | 3,038,814 | ||||||
| Region RE Ltd. REIT |
752,730 | 1,222,695 | ||||||
| Rural Funds Group REIT |
261,709 | 304,857 | ||||||
| Scentre Group REIT |
3,492,120 | 6,124,399 | ||||||
| Stockland REIT |
1,606,498 | 4,428,889 | ||||||
| US Masters Residential Property Fund REIT * |
499,199 | 92,071 | ||||||
| Vicinity Ltd. REIT |
3,071,770 | 3,687,548 | ||||||
| Waypoint REIT Ltd. REIT |
445,858 | 770,394 | ||||||
|
|
|
|||||||
| (Cost $65,469,266) |
58,491,516 | |||||||
|
|
|
|||||||
| Austria — 0.2% | ||||||||
| CA Immobilien Anlagen AG |
29,015 | 790,336 | ||||||
| IMMOFINANZ AG * |
21,627 | 356,915 | ||||||
| S IMMO AG |
5,982 | 72,065 | ||||||
| UBM Development AG |
2,426 | 70,607 | ||||||
|
|
|
|||||||
| (Cost $1,536,219) |
1,289,923 | |||||||
|
|
|
|||||||
| Belgium — 1.9% | ||||||||
| Aedifica SA REIT (a) |
27,086 | 1,811,994 | ||||||
| Ascencio REIT |
3,637 | 189,218 | ||||||
| Atenor |
2,425 | 62,047 | ||||||
| Care Property Invest NV REIT |
24,615 | 330,650 | ||||||
| Cofinimmo SA REIT (a) |
22,007 | 1,703,317 | ||||||
| Home Invest Belgium SA REIT (a) |
6,221 | 118,053 | ||||||
| Immobel SA (a) |
2,473 | 104,272 | ||||||
| Number |
Value |
|||||||
| Belgium (Continued) | ||||||||
| Intervest Offices & Warehouses NV REIT (a) |
18,245 | $ | 301,491 | |||||
| Montea NV REIT |
10,612 | 858,691 | ||||||
| Nextensa SA REIT (a) |
1,708 | 79,391 | ||||||
| Retail Estates NV REIT |
7,371 | 503,712 | ||||||
| VGP NV (a) |
8,842 | 871,476 | ||||||
| Warehouses De Pauw CVA REIT |
109,181 | 3,054,281 | ||||||
| Wereldhave Belgium Comm VA REIT |
2,011 | 103,337 | ||||||
| Xior Student Housing NV REIT (a) |
17,149 | 510,998 | ||||||
|
|
|
|||||||
| (Cost $14,725,084) |
10,602,928 | |||||||
|
|
|
|||||||
| Brazil — 0.6% | ||||||||
| Aliansce Sonae Shopping Centers SA |
327,572 | 1,385,909 | ||||||
| Cyrela Brazil Realty SA Empreendimentos e Participacoes |
203,518 | 742,247 | ||||||
| Ez Tec Empreendimentos e Participacoes SA |
98,523 | 339,124 | ||||||
| Multiplan Empreendimentos Imobiliarios SA |
204,811 | 1,060,863 | ||||||
|
|
|
|||||||
| (Cost $3,603,678) |
3,528,143 | |||||||
|
|
|
|||||||
| Canada — 6.4% | ||||||||
| Allied Properties Real Estate Investment Trust REIT |
86,521 | 1,414,328 | ||||||
| Altus Group Ltd. |
30,983 | 1,006,782 | ||||||
| American Hotel Income Properties REIT LP (a) |
55,208 | 99,507 | ||||||
| Artis Real Estate Investment Trust REIT |
51,993 | 265,836 | ||||||
| Boardwalk Real Estate Investment Trust REIT |
22,210 | 987,547 | ||||||
| Canadian Apartment Properties REIT (a) |
114,323 | 4,125,317 | ||||||
| Chartwell Retirement Residences |
159,116 | 1,054,686 | ||||||
| Choice Properties Real Estate Investment Trust REIT (a) |
170,092 | 1,696,791 | ||||||
| Colliers International Group, Inc. |
24,690 | 2,296,626 | ||||||
| Crombie Real Estate Investment Trust REIT (a) |
71,966 | 757,091 | ||||||
| CT Real Estate Investment Trust REIT (a) |
50,041 | 552,943 | ||||||
| Dream Industrial Real Estate Investment Trust REIT |
173,342 | 1,764,918 | ||||||
| Dream Office Real Estate Investment Trust REIT (a) |
17,431 | 186,582 | ||||||
| DREAM Unlimited Corp., Class A (a) |
18,078 | 276,097 | ||||||
| First Capital Real Estate Investment Trust REIT |
130,087 | 1,426,909 | ||||||
| FirstService Corp. |
24,910 | 3,613,810 | ||||||
| Granite Real Estate Investment Trust REIT |
42,771 | 2,506,539 | ||||||
| H&R Real Estate Investment Trust REIT |
176,439 | 1,314,888 | ||||||
| InterRent Real Estate Investment Trust REIT |
93,843 | 906,466 | ||||||
| Killam Apartment Real Estate Investment Trust REIT |
77,943 | 1,003,460 | ||||||
| Mainstreet Equity Corp. * |
1,042 | 103,510 | ||||||
| Minto Apartment Real Estate Investment Trust REIT, 144A (a) |
27,738 | 299,561 | ||||||
| Morguard Corp. |
3,133 | 235,096 | ||||||
| See Notes to Financial Statements. | 7 |
DBX ETF Trust
Schedule of Investments
Xtrackers International Real Estate ETF (Continued)
May 31, 2023
| Number |
Value |
|||||||
| Canada (Continued) | ||||||||
| Morguard North American Residential Real Estate Investment Trust REIT |
21,329 | $ | 257,963 | |||||
| Nexus Industrial REIT REIT |
28,815 | 178,279 | ||||||
| NorthWest Healthcare Properties Real Estate Investment Trust REIT (a) |
145,114 | 798,538 | ||||||
| Primaris Real Estate Investment Trust REIT (a) |
48,430 | 448,564 | ||||||
| RioCan Real Estate Investment Trust REIT (a) |
200,962 | 2,959,802 | ||||||
| SmartCentres Real Estate Investment Trust REIT (a) |
88,907 | 1,657,400 | ||||||
| Tricon Residential, Inc. |
181,921 | 1,460,133 | ||||||
| True North Commercial Real Estate Investment Trust REIT (a) |
56,497 | 107,233 | ||||||
|
|
|
|||||||
| (Cost $41,535,152) |
35,763,202 | |||||||
|
|
|
|||||||
| Chile — 0.2% | ||||||||
| Cencosud Shopping SA |
322,468 | 500,988 | ||||||
| Parque Arauco SA |
443,024 | 620,272 | ||||||
| Plaza SA |
187,760 | 236,362 | ||||||
|
|
|
|||||||
| (Cost $1,461,610) |
1,357,622 | |||||||
|
|
|
|||||||
| China — 2.3% | ||||||||
| A-Living Smart City Services Co. Ltd., 144A (a) |
537,757 | 335,229 | ||||||
| China Resources Mixc Lifestyle Services Ltd., 144A |
422,407 | 1,923,650 | ||||||
| China Vanke Co. Ltd., Class H |
1,179,657 | 1,558,158 | ||||||
| Greattown Holdings Ltd., Class B * |
97,300 | 21,211 | ||||||
| Guangzhou R&F Properties Co. Ltd., Class H * |
1,039,761 | 155,401 | ||||||
| KE Holdings, Inc., Class A * |
1,616,905 | 7,621,601 | ||||||
| Poly Property Services Co. Ltd., Class H |
97,098 | 460,171 | ||||||
| Shanghai Jinqiao Export Processing Zone Development Co. Ltd., Class B |
193,100 | 184,217 | ||||||
| Shanghai Lingang Holdings Corp. Ltd., Class B |
95,706 | 72,737 | ||||||
| Shanghai Lujiazui Finance & Trade Zone Development Co. Ltd., Class B |
721,340 | 430,640 | ||||||
| Shanghai Shibei Hi-Tech Co. Ltd., Class B |
295,800 | 63,005 | ||||||
| Shanxi Guoxin Energy Corp. Ltd., Class B |
68,300 | 23,359 | ||||||
| Shenzhen Properties & Resources Development Group Ltd., Class B |
15,300 | 9,127 | ||||||
| Sino-Ocean Group Holding Ltd. *(a) |
2,005,458 | 121,687 | ||||||
|
|
|
|||||||
| (Cost $20,236,640) |
12,980,193 | |||||||
|
|
|
|||||||
| Denmark — 0.0% | ||||||||
| Jeudan A/S (a) |
||||||||
| (Cost $252,976) |
6,516 | 234,140 | ||||||
|
|
|
|||||||
| Egypt — 0.1% | ||||||||
| Arab Developers Holding * |
280,455 | 5,818 | ||||||
| Egyptians Housing Development & Reconstruction * |
2,227,878 | 20,548 | ||||||
| El Kahera Housing * |
428,198 | 14,342 | ||||||
| Emaar Misr for Development SAE * |
176,430 | 16,958 | ||||||
| Number |
Value |
|||||||
| Egypt (Continued) | ||||||||
| Heliopolis Housing |
287,265 | $ | 93,896 | |||||
| Medinet Nasr Housing |
889,644 | 100,481 | ||||||
| Palm Hills Developments SAE * |
743,811 | 48,071 | ||||||
| Pioneers Properties * |
108,580 | 7,555 | ||||||
| Six of October Development & Investment * |
55,509 | 32,335 | ||||||
| Talaat Moustafa Group |
628,120 | 192,095 | ||||||
| Zahraa El Maadi Investment & Development Co. Sae |
101,058 | 19,819 | ||||||
|
|
|
|||||||
| (Cost $678,998) |
551,918 | |||||||
|
|
|
|||||||
| Finland — 0.3% | ||||||||
| Citycon OYJ * |
52,371 | 336,113 | ||||||
| Kojamo OYJ |
130,878 | 1,308,783 | ||||||
|
|
|
|||||||
| (Cost $2,795,294) |
1,644,896 | |||||||
|
|
|
|||||||
| France — 2.5% | ||||||||
| Altarea SCA REIT *(a) |
3,145 | 395,640 | ||||||
| ARGAN SA REIT |
6,613 | 493,509 | ||||||
| Carmila SA REIT * |
37,770 | 561,317 | ||||||
| Covivio SA REIT |
31,218 | 1,522,297 | ||||||
| Gecina SA REIT |
31,661 | 3,231,927 | ||||||
| ICADE REIT |
21,495 | 853,385 | ||||||
| Klepierre SA REIT |
127,609 | 2,881,412 | ||||||
| Mercialys SA REIT (a) |
62,134 | 497,139 | ||||||
| Nexity SA (a) |
25,625 | 523,975 | ||||||
| Unibail-Rodamco-Westfield REIT *(a) |
66,892 | 3,052,221 | ||||||
|
|
|
|||||||
| (Cost $18,775,389) |
14,012,822 | |||||||
|
|
|
|||||||
| Germany — 2.5% | ||||||||
| Deutsche EuroShop AG |
8,073 | 173,854 | ||||||
| Deutsche Wohnen SE |
34,430 | 683,096 | ||||||
| DIC Asset AG |
25,104 | 142,114 | ||||||
| Hamborner REIT AG REIT |
47,728 | 337,862 | ||||||
| Instone Real Estate Group SE, 144A |
28,684 | 154,123 | ||||||
| LEG Immobilien SE * |
49,739 | 2,572,328 | ||||||
| PATRIZIA SE |
25,523 | 225,027 | ||||||
| TAG Immobilien AG * |
122,119 | 975,132 | ||||||
| Vonovia SE |
472,381 | 8,641,871 | ||||||
|
|
|
|||||||
| (Cost $31,817,948) |
13,905,407 | |||||||
|
|
|
|||||||
| Greece — 0.1% | ||||||||
| LAMDA Development SA * |
||||||||
| (Cost $386,035) |
54,162 | 368,395 | ||||||
|
|
|
|||||||
| Hong Kong — 14.0% | ||||||||
| C C Land Holdings Ltd. |
602,137 | 123,070 | ||||||
| C&D International Investment Group Ltd. * |
510,805 | 1,284,149 | ||||||
| Champion REIT (a) |
1,600,313 | 580,575 | ||||||
| China Jinmao Holdings Group Ltd. |
4,233,688 | 605,720 | ||||||
| China Overseas Grand Oceans Group Ltd. (a) |
1,169,109 | 524,201 | ||||||
| China Overseas Land & Investment Ltd. |
2,510,017 | 5,091,696 | ||||||
| China Overseas Property Holdings Ltd. |
820,833 | 752,861 | ||||||
| China Resources Land Ltd. |
1,924,850 | 7,204,433 | ||||||
| Chinese Estates Holdings Ltd. * |
302,442 | 92,723 | ||||||
| CK Asset Holdings Ltd. |
1,438,609 | 7,755,156 | ||||||
| See Notes to Financial Statements. | 8 |
DBX ETF Trust
Schedule of Investments
Xtrackers International Real Estate ETF (Continued)
May 31, 2023
| Number |
Value |
|||||||
| Hong Kong (Continued) | ||||||||
| Emperor International Holdings Ltd. |
127,696 | $ | 8,809 | |||||
| ESR Group Ltd., 144A |
1,879,038 | 2,774,781 | ||||||
| Far East Consortium International Ltd. |
707,798 | 179,023 | ||||||
| Fortune Real Estate Investment Trust REIT |
939,963 | 678,414 | ||||||
| GR Properties Ltd. * |
470,000 | 55,836 | ||||||
| Hang Lung Group Ltd. |
556,662 | 829,135 | ||||||
| Hang Lung Properties Ltd. |
1,204,908 | 1,908,582 | ||||||
| Henderson Land Development Co. Ltd. |
880,673 | 2,795,609 | ||||||
| HKR International Ltd. |
441,839 | 124,172 | ||||||
| Hong Kong Ferry Holdings Co. Ltd. |
139,456 | 127,373 | ||||||
| Hongkong Land Holdings Ltd. |
714,287 | 3,064,291 | ||||||
| Hysan Development Co. Ltd. |
398,035 | 1,009,801 | ||||||
| Joy City Property Ltd. * |
2,383,276 | 82,200 | ||||||
| K Wah International Holdings Ltd. |
659,583 | 217,382 | ||||||
| Kerry Properties Ltd. |
384,237 | 839,326 | ||||||
| Kowloon Development Co. Ltd. |
201,098 | 218,611 | ||||||
| Lai Sun Development Co. Ltd. * |
78,644 | 14,266 | ||||||
| Langham Hospitality Investments and Langham Hospitality Investments Ltd. (b) |
628,986 | 75,527 | ||||||
| Link REIT |
1,710,713 | 9,943,147 | ||||||
| LVGEM China Real Estate Investment Co. Ltd. * |
670,455 | 119,047 | ||||||
| New World Development Co. Ltd. |
930,495 | 2,222,752 | ||||||
| Paliburg Holdings Ltd. * |
110,000 | 22,483 | ||||||
| Poly Property Group Co. Ltd. |
1,042,469 | 231,712 | ||||||
| Prosperity REIT |
786,676 | 165,812 | ||||||
| Shandong Hi-Speed Holdings Group Ltd. *(a) |
1,259,026 | 780,031 | ||||||
| Shenzhen Investment Ltd. |
1,470,942 | 259,304 | ||||||
| Shin Hwa World Ltd. * |
803,373 | 10,365 | ||||||
| Shun Tak Holdings Ltd. * |
916,618 | 138,167 | ||||||
| Sino Land Co. Ltd. |
2,437,102 | 3,169,252 | ||||||
| Sun Hung Kai Properties Ltd. |
1,025,849 | 13,065,135 | ||||||
| Sunlight Real Estate Investment Trust REIT |
609,322 | 215,607 | ||||||
| Swire Properties Ltd. |
713,230 | 1,700,108 | ||||||
| Touyun Biotech Group Ltd. * |
501,628 | 35,244 | ||||||
| Wang On Properties Ltd. |
2,949,152 | 20,344 | ||||||
| Wharf Holdings Ltd. |
653,642 | 1,372,705 | ||||||
| Wharf Real Estate Investment Co. Ltd. |
1,043,610 | 5,152,560 | ||||||
| Yuexiu Property Co. Ltd. (a) |
808,933 | 876,282 | ||||||
|
|
|
|||||||
| (Cost $97,551,118) |
78,517,779 | |||||||
|
|
|
|||||||
| India — 1.9% | ||||||||
| Brigade Enterprises Ltd. |
97,874 | 665,570 | ||||||
| DLF Ltd. |
647,087 | 3,714,427 | ||||||
| Godrej Properties Ltd. * |
91,554 | 1,538,554 | ||||||
| Indiabulls Real Estate Ltd. * |
309,616 | 251,677 | ||||||
| Macrotech Developers Ltd., 144A * |
177,370 | 1,169,397 | ||||||
| Oberoi Realty Ltd. |
78,473 | 882,837 | ||||||
| Omaxe Ltd. * |
35,128 | 21,400 | ||||||
| Phoenix Mills Ltd. |
66,520 | 1,179,611 | ||||||
| Prestige Estates Projects Ltd. |
112,252 | 655,682 | ||||||
| Privi Speciality Chemicals Ltd. |
12,212 | 164,747 | ||||||
| Sobha Ltd. |
22,141 | 139,338 | ||||||
| Number |
Value |
|||||||
| India (Continued) | ||||||||
| Sunteck Realty Ltd. |
39,700 | $ | 134,938 | |||||
|
|
|
|||||||
| (Cost $8,325,284) |
10,518,178 | |||||||
|
|
|
|||||||
| Indonesia — 0.3% | ||||||||
| PT Alam Sutera Realty Tbk * |
7,531,106 | 86,917 | ||||||
| PT Andalan Perkasa Abadi Tbk * |
507,804 | 1,694 | ||||||
| PT Bumi Serpong Damai Tbk * |
5,455,112 | 382,113 | ||||||
| PT Ciputra Development Tbk |
5,752,942 | 410,650 | ||||||
| PT Jaya Real Property Tbk |
1,752,867 | 59,637 | ||||||
| PT Kawasan Industri Jababeka Tbk * |
10,146,852 | 87,321 | ||||||
| PT Lippo Karawaci Tbk * |
22,223,923 | 137,880 | ||||||
| PT Pakuwon Jati Tbk |
10,400,593 | 324,715 | ||||||
| PT PP Properti Tbk * |
3,602,844 | 12,018 | ||||||
| PT Puradelta Lestari Tbk |
5,783,559 | 64,819 | ||||||
| PT Summarecon Agung Tbk |
7,197,504 | 307,298 | ||||||
|
|
|
|||||||
| (Cost $1,883,907) |
1,875,062 | |||||||
|
|
|
|||||||
| Israel — 1.8% | ||||||||
| Adgar Investment and Development Ltd. |
59,230 | 67,556 | ||||||
| AFI Properties Ltd. * |
3,849 | 106,970 | ||||||
| Africa Israel Residences Ltd. |
4,477 | 195,624 | ||||||
| Airport City Ltd. * |
45,023 | 590,671 | ||||||
| Alony Hetz Properties & Investments Ltd. |
104,514 | 811,778 | ||||||
| Alrov Properties and Lodgings Ltd. (a) |
2,040 | 95,147 | ||||||
| Amot Investments Ltd. |
142,920 | 703,704 | ||||||
| Arad Investment & Industrial Development Ltd. |
1,777 | 177,655 | ||||||
| Aura Investments Ltd. (a) |
86,241 | 127,227 | ||||||
| Azrieli Group Ltd. |
24,728 | 1,298,982 | ||||||
| Big Shopping Centers Ltd. * |
7,982 | 671,480 | ||||||
| Blue Square Real Estate Ltd. |
3,299 | 186,548 | ||||||
| Carasso Real Estate Ltd. |
11,703 | 71,817 | ||||||
| Duniec Brothers Ltd. *(a) |
2,224 | 103,729 | ||||||
| Electra Real Estate Ltd. |
15,693 | 172,226 | ||||||
| G City Ltd. |
56,649 | 171,087 | ||||||
| Gav-Yam Lands Corp. Ltd. (a) |
18,326 | 126,591 | ||||||
| Israel Canada T.R Ltd. (a) |
97,374 | 183,045 | ||||||
| Isras Investment Co. Ltd. |
1,051 | 184,314 | ||||||
| Keystone REIT Ltd. REIT |
98,875 | 152,166 | ||||||
| Kvutzat Acro Ltd. |
22,947 | 165,823 | ||||||
| Lahav L.R. Real Estate Ltd. (a) |
40,920 | 34,588 | ||||||
| Megureit Israel Ltd. REIT *(a) |
76,752 | 82,980 | ||||||
| Melisron Ltd. (a) |
15,296 | 950,126 | ||||||
| Menivim- The New REIT Ltd. REIT (a) |
402,217 | 167,458 | ||||||
| Mivne Real Estate KD Ltd. |
424,560 | 1,044,193 | ||||||
| Norstar Holdings, Inc. *(a) |
26,100 | 54,619 | ||||||
| Prashkovsky Investments and Construction Ltd. |
4,939 | 102,074 | ||||||
| Property & Building Corp. Ltd. *(a) |
1,781 | 77,726 | ||||||
| Rani Zim Shopping Centers Ltd. * |
33,520 | 19,251 | ||||||
| Reit 1 Ltd. REIT |
126,578 | 521,908 | ||||||
| REIT Azorim HF Living Ltd. REIT *(a) |
30,674 | 35,142 | ||||||
| Sella Capital Real Estate Ltd. REIT |
139,303 | 272,269 | ||||||
| Summit Real Estate Holdings Ltd. |
26,476 | 336,005 | ||||||
| Villar International Ltd. |
2,804 | 109,008 | ||||||
| See Notes to Financial Statements. | 9 |
DBX ETF Trust
Schedule of Investments
Xtrackers International Real Estate ETF (Continued)
May 31, 2023
| Number |
Value |
|||||||
| Israel (Continued) | ||||||||
| Vitania Ltd. (a) |
17,472 | $ | 93,279 | |||||
|
|
|
|||||||
| (Cost $13,268,533) |
10,264,766 | |||||||
|
|
|
|||||||
| Italy — 0.0% | ||||||||
| Immobiliare Grande Distribuzione SIIQ SpA REIT |
38,279 | 101,207 | ||||||
| Risanamento SpA *(a) |
390,059 | 44,162 | ||||||
|
|
|
|||||||
| (Cost $184,816) |
145,369 | |||||||
|
|
|
|||||||
| Japan — 21.0% | ||||||||
| Activia Properties, Inc. REIT (a) |
349 | 982,940 | ||||||
| Advance Logistics Investment Corp. REIT |
452 | 455,187 | ||||||
| Advance Residence Investment Corp. REIT |
665 | 1,703,969 | ||||||
| Aeon Mall Co. Ltd. |
64,800 | 815,827 | ||||||
| AEON REIT Investment Corp. REIT |
1,193 | 1,371,333 | ||||||
| Comforia Residential REIT, Inc. REIT |
450 | 1,090,255 | ||||||
| CRE Logistics REIT, Inc. REIT |
382 | 523,040 | ||||||
| Daito Trust Construction Co. Ltd. |
46,100 | 4,371,936 | ||||||
| Daiwa House REIT Investment Corp. REIT |
1,422 | 2,977,025 | ||||||
| Daiwa Office Investment Corp. REIT (a) |
187 | 776,295 | ||||||
| Daiwa Securities Living Investments Corp. REIT |
1,289 | 1,098,808 | ||||||
| ES-Con Japan Ltd. (a) |
25,600 | 142,736 | ||||||
| ESCON Japan Reit Investment Corp. REIT |
224 | 185,658 | ||||||
| Frontier Real Estate Investment Corp. REIT |
347 | 1,224,428 | ||||||
| Fukuoka REIT Corp. REIT |
479 | 559,173 | ||||||
| Global One Real Estate Investment Corp. REIT |
677 | 521,384 | ||||||
| GLP J REIT |
3,157 | 3,339,689 | ||||||
| Goldcrest Co. Ltd. |
9,400 | 114,847 | ||||||
| Hankyu Hanshin REIT, Inc. REIT (a) |
464 | 469,928 | ||||||
| Health Care & Medical Investment Corp. REIT |
237 | 274,293 | ||||||
| Heiwa Real Estate Co. Ltd. |
20,100 | 525,824 | ||||||
| Heiwa Real Estate REIT, Inc. REIT (a) |
645 | 700,329 | ||||||
| Hoshino Resorts REIT, Inc. REIT |
170 | 833,482 | ||||||
| Hulic Co. Ltd. (a) |
458,600 | 3,817,427 | ||||||
| Hulic Reit, Inc. REIT |
864 | 981,404 | ||||||
| Ichigo Office REIT Investment Corp. REIT |
1,005 | 652,425 | ||||||
| Ichigo, Inc. |
151,900 | 266,367 | ||||||
| Industrial & Infrastructure Fund Investment Corp. REIT |
1,384 | 1,585,931 | ||||||
| Invincible Investment Corp. REIT |
4,115 | 1,746,552 | ||||||
| Japan Excellent, Inc. REIT |
584 | 521,238 | ||||||
| Japan Hotel REIT Investment Corp. REIT |
2,954 | 1,672,415 | ||||||
| Japan Logistics Fund, Inc. REIT |
465 | 1,086,659 | ||||||
| Japan Metropolitan Fund Invest REIT |
4,664 | 3,291,489 | ||||||
| Japan Prime Realty Investment Corp. REIT |
478 | 1,228,229 | ||||||
| Japan Real Estate Investment Corp. REIT |
688 | 2,609,884 | ||||||
| Kabuki-Za Co. Ltd. |
6,100 | 207,823 | ||||||
| Keihanshin Building Co. Ltd. |
29,500 | 251,050 | ||||||
| Number |
Value |
|||||||
| Japan (Continued) | ||||||||
| Kenedix Office Investment Corp. REIT |
561 | $ | 1,268,840 | |||||
| Kenedix Residential Next Investment Corp. REIT |
509 | 778,901 | ||||||
| Kenedix Retail REIT Corp. REIT |
405 | 727,588 | ||||||
| Ki-Star Real Estate Co. Ltd. |
5,300 | 173,550 | ||||||
| LaSalle Logiport REIT |
1,188 | 1,427,658 | ||||||
| Leopalace21 Corp. * |
158,500 | 348,277 | ||||||
| LIFULL Co. Ltd. |
42,400 | 73,441 | ||||||
| Mirai Corp. REIT |
1,192 | 401,841 | ||||||
| Mirarth Holdings, Inc. |
61,700 | 184,153 | ||||||
| Mitsubishi Estate Co. Ltd. |
886,600 | 10,172,278 | ||||||
| Mitsubishi Estate Logistics REIT Investment Corp. REIT |
309 | 960,960 | ||||||
| Mitsui Fudosan Co. Ltd. |
638,100 | 12,160,049 | ||||||
| Mitsui Fudosan Logistics Park, Inc. REIT |
371 | 1,333,014 | ||||||
| Mori Hills REIT Investment Corp. REIT |
1,076 | 1,186,785 | ||||||
| Mori Trust Sogo Reit, Inc. REIT |
1,705 | 877,425 | ||||||
| Nippon Accommodations Fund, Inc. REIT |
343 | 1,664,488 | ||||||
| Nippon Building Fund, Inc. REIT |
1,140 | 4,552,983 | ||||||
| Nippon Kanzai Holdings Co. Ltd. |
14,600 | 272,009 | ||||||
| Nippon Prologis REIT, Inc. REIT (a) |
1,581 | 3,306,504 | ||||||
| NIPPON REIT Investment Corp. REIT |
309 | 720,996 | ||||||
| Nomura Real Estate Holdings, Inc. |
78,600 | 1,898,687 | ||||||
| Nomura Real Estate Master Fund, Inc. REIT |
2,357 | 2,765,002 | ||||||
| NTT UD REIT Investment Corp. REIT |
670 | 619,096 | ||||||
| One REIT, Inc. REIT |
154 | 265,971 | ||||||
| Open House Group Co. Ltd. |
54,600 | 2,094,664 | ||||||
| Orix JREIT, Inc. REIT |
1,364 | 1,821,726 | ||||||
| Pressance Corp. |
16,300 | 213,032 | ||||||
| Relo Group, Inc. |
77,100 | 1,082,154 | ||||||
| SAMTY Co. Ltd. (a) |
20,000 | 305,050 | ||||||
| Samty Residential Investment Corp. REIT |
318 | 273,127 | ||||||
| Sankei Real Estate, Inc. REIT |
318 | 194,376 | ||||||
| Sekisui House Reit, Inc. REIT |
2,159 | 1,228,504 | ||||||
| SOSiLA Logistics REIT, Inc. REIT (a) |
486 | 473,077 | ||||||
| SRE Holdings Corp. * |
6,800 | 172,050 | ||||||
| Star Asia Investment Corp. REIT |
1,278 | 525,964 | ||||||
| Starts Corp., Inc. |
21,700 | 421,218 | ||||||
| Starts Proceed Investment Corp. REIT |
152 | 257,186 | ||||||
| Sumitomo Realty & Development Co. Ltd. |
319,700 | 7,709,046 | ||||||
| Sun Frontier Fudousan Co. Ltd. |
17,600 | 166,029 | ||||||
| Takara Leben Real Estate Investment Corp. REIT |
428 | 281,218 | ||||||
| Tama Home Co. Ltd. (a) |
11,600 | 289,346 | ||||||
| TOC Co. Ltd. |
30,700 | 131,181 | ||||||
| Tokyo Tatemono Co. Ltd. |
139,800 | 1,721,046 | ||||||
| Tokyu Fudosan Holdings Corp. |
407,500 | 2,169,989 | ||||||
| Tokyu REIT, Inc. REIT |
404 | 540,440 | ||||||
| Tosei Corp. |
22,900 | 273,230 | ||||||
| Tosei Reit Investment Corp. REIT |
195 | 183,116 | ||||||
| United Urban Investment Corp. REIT (a) |
1,449 | 1,534,925 | ||||||
| XYMAX REIT Investment Corp. REIT (a) |
149 | 117,097 | ||||||
|
|
|
|||||||
| (Cost $140,286,228) |
117,296,566 | |||||||
|
|
|
|||||||
| See Notes to Financial Statements. | 10 |
DBX ETF Trust
Schedule of Investments
Xtrackers International Real Estate ETF (Continued)
May 31, 2023
| Number |
Value |
|||||||
| Luxembourg — 0.2% | ||||||||
| ADLER Group SA, 144A *(a) |
53,031 | $ | 26,538 | |||||
| Aroundtown SA (a) |
553,942 | 578,747 | ||||||
| Grand City Properties SA |
51,049 | 375,521 | ||||||
|
|
|
|||||||
| (Cost $4,728,759) |
980,806 | |||||||
|
|
|
|||||||
| Malaysia — 0.6% | ||||||||
| AmFIRST Real Estate Investment Trust REIT |
147,300 | 10,532 | ||||||
| Axis Real Estate Investment Trust REIT |
834,084 | 334,320 | ||||||
| Capitaland Malaysia Trust REIT |
486,908 | 53,274 | ||||||
| Eastern & Oriental Bhd * |
490,636 | 33,485 | ||||||
| Eco World Development Group Bhd |
714,000 | 115,249 | ||||||
| Eco World International Bhd * |
546,800 | 71,674 | ||||||
| Ecofirst Consolidated BHD * |
482,900 | 35,050 | ||||||
| IGB Commercial Real Estate Investment Trust REIT |
459,500 | 49,778 | ||||||
| IGB Real Estate Investment Trust REIT |
959,000 | 326,212 | ||||||
| IOI Properties Group Bhd |
665,600 | 157,189 | ||||||
| Iskandar Waterfront City Bhd * |
358,600 | 25,251 | ||||||
| KIP REIT |
222,352 | 43,357 | ||||||
| KLCCP Stapled Group (b) |
104,900 | 157,958 | ||||||
| KSL Holdings Bhd * |
233,500 | 41,484 | ||||||
| Land & General Bhd |
1,121,900 | 25,522 | ||||||
| LBS Bina Group Bhd |
701,500 | 62,315 | ||||||
| Mah Sing Group Bhd |
828,600 | 106,818 | ||||||
| Malton Bhd * |
97,400 | 8,336 | ||||||
| Matrix Concepts Holdings Bhd |
525,294 | 167,302 | ||||||
| MKH Bhd |
198,000 | 51,479 | ||||||
| Paramount Corp. Bhd |
202,240 | 34,835 | ||||||
| Pavilion Real Estate Investment Trust REIT |
374,500 | 103,859 | ||||||
| Sentral REIT |
319,800 | 58,549 | ||||||
| Sime Darby Property Bhd |
1,450,546 | 146,139 | ||||||
| SP Setia Bhd Group |
853,205 | 97,974 | ||||||
| Sunway Bhd |
1,169,961 | 397,972 | ||||||
| Sunway Real Estate Investment Trust REIT |
867,100 | 306,223 | ||||||
| Symphony Life Bhd * |
322,700 | 26,568 | ||||||
| Titijaya Land Bhd * |
93,900 | 5,289 | ||||||
| Tropicana Corp. Bhd * |
283,591 | 84,177 | ||||||
| UEM Sunrise Bhd |
782,900 | 44,950 | ||||||
| UOA Development Bhd |
199,400 | 74,740 | ||||||
| YNH Property Bhd * |
239,100 | 251,248 | ||||||
| YTL Hospitality REIT |
505,800 | 103,012 | ||||||
|
|
|
|||||||
| (Cost $3,895,899) |
3,612,120 | |||||||
|
|
|
|||||||
| Mexico — 1.8% | ||||||||
| CFE Capital S de RL de CV REIT |
571,903 | 900,128 | ||||||
| Concentradora Fibra Danhos SA de CV REIT |
604,484 | 754,658 | ||||||
| Corp. Inmobiliaria Vesta SAB de CV |
456,670 | 1,443,178 | ||||||
| FIBRA Macquarie Mexico REIT, 144A |
522,715 | 883,346 | ||||||
| Fibra MTY SAPI de CV REIT |
1,475,526 | 986,274 | ||||||
| Fibra Uno Administracion SA de CV REIT |
1,924,859 | 2,783,516 | ||||||
| Prologis Property Mexico SA de CV REIT (a) |
445,215 | 1,494,475 | ||||||
| Number |
Value |
|||||||
| Mexico (Continued) | ||||||||
| TF Administradora Industrial S de RL de CV REIT (a) |
546,848 | $ | 990,644 | |||||
|
|
|
|||||||
| (Cost $7,846,109) |
10,236,219 | |||||||
|
|
|
|||||||
| Netherlands — 0.7% | ||||||||
| Argo Properties NV *(a) |
9,488 | 117,592 | ||||||
| CTP NV, 144A |
73,654 | 942,271 | ||||||
| Eurocommercial Properties NV REIT |
30,164 | 686,249 | ||||||
| NEPI Rockcastle NV |
285,220 | 1,621,254 | ||||||
| NSI NV REIT (a) |
12,565 | 267,375 | ||||||
|
|
|
|||||||
| (Cost $4,519,515) |
3,634,741 | |||||||
|
|
|
|||||||
| New Zealand — 0.7% | ||||||||
| Argosy Property Ltd. |
580,079 | 378,961 | ||||||
| Goodman Property Trust REIT |
713,097 | 914,625 | ||||||
| Investore Property Ltd. |
187,596 | 155,161 | ||||||
| Kiwi Property Group Ltd. |
1,036,126 | 565,112 | ||||||
| Precinct Properties New Zealand Ltd. |
902,100 | 651,512 | ||||||
| Property for Industry Ltd. |
342,538 | 474,243 | ||||||
| Stride Property Group (b) |
354,824 | 289,223 | ||||||
| Vital Healthcare Property Trust REIT |
318,522 | 437,175 | ||||||
|
|
|
|||||||
| (Cost $5,067,074) |
3,866,012 | |||||||
|
|
|
|||||||
| Norway — 0.2% | ||||||||
| Entra ASA, 144A |
51,847 | 447,609 | ||||||
| KMC Properties ASA * |
51,814 | 25,110 | ||||||
| Olav Thon Eiendomsselskap ASA |
17,853 | 271,569 | ||||||
| Selvaag Bolig ASA |
27,362 | 76,367 | ||||||
|
|
|
|||||||
| (Cost $1,364,568) |
820,655 | |||||||
|
|
|
|||||||
| Philippines — 2.3% | ||||||||
| 8990 Holdings, Inc. * |
1,289,300 | 209,144 | ||||||
| ACEN Corp. * |
464,085 | 48,425 | ||||||
| AREIT, Inc. REIT |
522,040 | 306,754 | ||||||
| Ayala Corp. |
191,035 | 2,245,069 | ||||||
| Ayala Land, Inc. |
4,916,196 | 2,302,278 | ||||||
| Belle Corp. |
1,441,000 | 30,791 | ||||||
| DDMP Reit, Inc. REIT |
4,280,000 | 96,788 | ||||||
| DoubleDragon Corp. |
355,170 | 46,800 | ||||||
| Filinvest Land, Inc. |
5,923,000 | 74,881 | ||||||
| Filinvest REIT Corp. REIT |
1,011,200 | 74,364 | ||||||
| GT Capital Holdings, Inc. |
59,771 | 549,178 | ||||||
| Megaworld Corp. |
6,683,600 | 242,780 | ||||||
| MREIT, Inc. REIT |
532,600 | 130,874 | ||||||
| RL Commercial REIT, Inc. REIT |
2,499,300 | 259,899 | ||||||
| Robinsons Land Corp. |
1,157,461 | 286,480 | ||||||
| SM Prime Holdings, Inc. |
9,667,457 | 5,629,021 | ||||||
| Vista Land & Lifescapes, Inc. |
2,009,900 | 61,199 | ||||||
|
|
|
|||||||
| (Cost $16,056,726) |
12,594,725 | |||||||
|
|
|
|||||||
| Poland — 0.2% | ||||||||
| Archicom SA |
2,847 | 14,659 | ||||||
| Atal SA (a) |
4,517 | 49,702 | ||||||
| Cavatina Holding SA * |
4,168 | 17,100 | ||||||
| Develia SA * |
299,085 | 271,432 | ||||||
| Dom Development SA |
5,768 | 187,418 | ||||||
| Echo Investment SA (a) |
98,643 | 95,089 | ||||||
| See Notes to Financial Statements. | 11 |
DBX ETF Trust
Schedule of Investments
Xtrackers International Real Estate ETF (Continued)
May 31, 2023
| Number |
Value |
|||||||
| Poland (Continued) | ||||||||
| Globe Trade Centre SA (a) |
132,086 | $ | 180,121 | |||||
| Marvipol Development SA * |
6,983 | 10,310 | ||||||
| MLP Group SA * |
5,429 | 105,434 | ||||||
| Polski Holding Nieruchomosci SA |
7,682 | 20,771 | ||||||
|
|
|
|||||||
| (Cost $842,970) |
952,036 | |||||||
|
|
|
|||||||
| Russia — 0.0% | ||||||||
| LSR Group PJSC *(c) |
30,984 | 0 | ||||||
| PIK Group PJSC *(c) |
192,287 | 0 | ||||||
|
|
|
|||||||
| (Cost $2,472,023) |
0 | |||||||
|
|
|
|||||||
| Singapore — 7.2% | ||||||||
| AIMS APAC REIT (a)(c) |
427,400 | 410,949 | ||||||
| Bukit Sembawang Estates Ltd. |
123,100 | 362,526 | ||||||
| CapitaLand Ascendas REIT |
2,254,769 | 4,493,395 | ||||||
| CapitaLand Ascott Trust (b) |
1,556,637 | 1,217,873 | ||||||
| CapitaLand China Trust REIT |
773,147 | 570,651 | ||||||
| Capitaland India Trust |
614,600 | 480,847 | ||||||
| CapitaLand Integrated Commercial Trust REIT |
3,389,292 | 5,003,199 | ||||||
| CapitaLand Investment Ltd. |
1,670,463 | 4,081,066 | ||||||
| CDL Hospitality Trusts (b) |
483,344 | 413,831 | ||||||
| City Developments Ltd. |
336,298 | 1,675,471 | ||||||
| Cromwell European Real Estate Investment Trust REIT |
207,619 | 360,789 | ||||||
| Daiwa House Logistics Trust REIT |
364,200 | 153,223 | ||||||
| Digital Core REIT Management Pte Ltd. REIT |
483,900 | 203,238 | ||||||
| ESR-LOGOS REIT REIT |
4,172,987 | 1,016,412 | ||||||
| Far East Hospitality Trust (b) |
720,600 | 316,461 | ||||||
| First Real Estate Investment Trust REIT |
811,200 | 152,678 | ||||||
| Frasers Centrepoint Trust REIT |
713,000 | 1,120,928 | ||||||
| Frasers Hospitality Trust (b) |
490,800 | 170,259 | ||||||
| Frasers Logistics & Commercial Trust REIT |
1,916,778 | 1,754,294 | ||||||
| Frasers Property Ltd. |
342,100 | 217,150 | ||||||
| GuocoLand Ltd. |
170,100 | 193,345 | ||||||
| Ho Bee Land Ltd. |
137,600 | 207,185 | ||||||
| Hong Fok Corp. Ltd. |
286,100 | 210,111 | ||||||
| IREIT Global REIT |
372,500 | 133,345 | ||||||
| Keppel REIT |
1,295,900 | 832,146 | ||||||
| Keppel DC REIT |
887,155 | 1,368,531 | ||||||
| Keppel Pacific Oak US REIT |
485,354 | 145,606 | ||||||
| Lendlease Global Commercial REIT |
1,096,851 | 538,367 | ||||||
| Lippo Malls Indonesia Retail Trust REIT * |
3,017,900 | 33,412 | ||||||
| Manulife US Real Estate Investment Trust REIT |
1,126,626 | 190,400 | ||||||
| Mapletree Industrial Trust REIT (a) |
1,317,422 | 2,207,291 | ||||||
| Mapletree Logistics Trust REIT |
2,120,491 | 2,598,085 | ||||||
| Mapletree Pan Asia Commercial Trust REIT |
1,556,870 | 1,896,029 | ||||||
| OUE Commercial Real Estate Investment Trust REIT |
1,618,939 | 400,299 | ||||||
| PARAGON REIT REIT |
741,000 | 525,047 | ||||||
| Parkway Life Real Estate Investment Trust REIT |
257,500 | 682,308 | ||||||
| Prime US REIT |
442,900 | 95,223 | ||||||
| Number |
Value |
|||||||
| Singapore (Continued) | ||||||||
| Sabana Industrial Real Estate Investment Trust REIT |
601,400 | $ | 190,871 | |||||
| Sasseur Real Estate Investment Trust REIT |
342,300 | 188,223 | ||||||
| Singapore Land Group Ltd. |
127,500 | 193,859 | ||||||
| Starhill Global REIT |
918,909 | 345,901 | ||||||
| Suntec Real Estate Investment Trust REIT |
1,223,800 | 1,183,288 | ||||||
| Tuan Sing Holdings Ltd. |
315,700 | 72,235 | ||||||
| UOL Group Ltd. |
307,717 | 1,442,228 | ||||||
| Wing Tai Holdings Ltd. |
209,800 | 226,083 | ||||||
| Yanlord Land Group Ltd. * |
349,900 | 197,567 | ||||||
|
|
|
|||||||
| (Cost $44,966,297) |
40,472,225 | |||||||
|
|
|
|||||||
| South Africa — 0.7% | ||||||||
| Attacq Ltd. REIT |
319,482 | 128,978 | ||||||
| Equites Property Fund Ltd. REIT |
421,823 | 255,441 | ||||||
| Fortress Real Estate Investments Ltd. * |
692,318 | 447,891 | ||||||
| Fortress Real Estate Investments Ltd., Class B * |
467,604 | 115,625 | ||||||
| Growthpoint Properties Ltd. REIT |
1,939,916 | 1,144,395 | ||||||
| Hyprop Investments Ltd. REIT |
214,589 | 326,817 | ||||||
| Redefine Properties Ltd. REIT (a) |
3,925,802 | 618,104 | ||||||
| Resilient REIT Ltd. REIT |
200,069 | 403,848 | ||||||
| SA Corporate Real Estate Ltd. REIT |
1,527,846 | 139,552 | ||||||
| Vukile Property Fund Ltd. REIT (a) |
534,158 | 334,249 | ||||||
|
|
|
|||||||
| (Cost $5,740,708) |
3,914,900 | |||||||
|
|
|
|||||||
| South Korea — 0.5% | ||||||||
| D&D Platform REIT Co. Ltd. REIT |
27,980 | 69,779 | ||||||
| E KOCREF CR-REIT Co. Ltd. REIT |
15,427 | 62,649 | ||||||
| ESR Kendall Square REIT Co. Ltd. REIT |
103,150 | 323,692 | ||||||
| JR Global REIT |
130,465 | 446,761 | ||||||
| KB Star Real Estate Investment Trust, Inc. REIT |
45,326 | 157,604 | ||||||
| Koramco Energy Plus REIT |
30,653 | 127,485 | ||||||
| Korea Asset In Trust Co. Ltd. |
37,138 | 86,042 | ||||||
| Korea Real Estate Investment & Trust Co. Ltd. |
100,571 | 104,492 | ||||||
| LOTTE Reit Co. Ltd. REIT |
71,444 | 210,739 | ||||||
| Mirae Asset Global REIT Co. Ltd. REIT |
17,123 | 43,864 | ||||||
| NH All-One REIT Co. Ltd. REIT |
26,245 | 72,570 | ||||||
| Seobu T&D |
24,271 | 139,162 | ||||||
| Shinhan Alpha REIT Co. Ltd. REIT |
63,060 | 299,324 | ||||||
| SK D&D Co. Ltd. |
6,271 | 97,804 | ||||||
| SK REITs Co. Ltd. REIT |
69,392 | 268,209 | ||||||
|
|
|
|||||||
| (Cost $3,155,251) |
2,510,176 | |||||||
|
|
|
|||||||
| Spain — 0.6% | ||||||||
| Aedas Homes SA, 144A |
6,202 | 88,865 | ||||||
| Inmobiliaria Colonial Socimi SA REIT |
203,412 | 1,187,295 | ||||||
| Lar Espana Real Estate Socimi SA REIT |
30,710 | 160,753 | ||||||
| Merlin Properties Socimi SA REIT |
224,884 | 1,843,669 | ||||||
| Metrovacesa SA, 144A *(a) |
9,172 | 66,590 | ||||||
| Neinor Homes SA, 144A * |
23,080 | 220,466 | ||||||
|
|
|
|||||||
| (Cost $4,719,876) |
3,567,638 | |||||||
|
|
|
|||||||
| See Notes to Financial Statements. | 12 |
DBX ETF Trust
Schedule of Investments
Xtrackers International Real Estate ETF (Continued)
May 31, 2023
| Number |
Value |
|||||||
| Sweden — 3.2% | ||||||||
| Atrium Ljungberg AB, Class B (a) |
30,827 | $ | 499,357 | |||||
| Castellum AB *(a) |
94,230 | 870,127 | ||||||
| Castellum AB (a) |
190,047 | 1,774,117 | ||||||
| Catena AB |
22,368 | 766,179 | ||||||
| Cibus Nordic Real Estate AB |
29,361 | 264,539 | ||||||
| Corem Property Group AB, Class B (a) |
357,576 | 199,099 | ||||||
| Corem Property Group AB, Class D |
2,515 | 26,020 | ||||||
| Dios Fastigheter AB |
63,992 | 367,185 | ||||||
| Eastnine AB |
7,646 | 76,294 | ||||||
| Fabege AB (a) |
185,380 | 1,318,352 | ||||||
| Fastighets AB Balder, Class B *(a) |
444,676 | 1,488,845 | ||||||
| Fastighets AB Trianon * |
40,317 | 58,714 | ||||||
| FastPartner AB, Class A (a) |
35,613 | 151,174 | ||||||
| Heba Fastighets AB, Class B |
75,971 | 187,771 | ||||||
| Hemnet Group AB |
62,248 | 1,049,516 | ||||||
| Hufvudstaden AB, Class A |
78,670 | 938,234 | ||||||
| JM AB (a) |
28,899 | 346,779 | ||||||
| John Mattson Fastighetsforetagen AB *(a) |
13,313 | 75,228 | ||||||
| K-fast Holding AB *(a) |
44,414 | 77,536 | ||||||
| Klarabo Sverige AB, Class B * |
66,127 | 70,601 | ||||||
| Nivika Fastigheter AB, Class B * |
15,480 | 53,906 | ||||||
| NP3 Fastigheter AB |
18,706 | 298,544 | ||||||
| Nyfosa AB |
98,942 | 545,455 | ||||||
| Pandox AB |
59,483 | 609,390 | ||||||
| Platzer Fastigheter Holding AB, Class B |
41,878 | 294,357 | ||||||
| Sagax AB, Class A (a) |
4,885 | 95,154 | ||||||
| Sagax AB, Class B (a) |
133,842 | 2,629,224 | ||||||
| Sagax AB, Class D |
73,524 | 173,616 | ||||||
| Samhallsbyggnadsbolaget i Norden AB (a) |
781,595 | 249,554 | ||||||
| Samhallsbyggnadsbolaget i Norden AB, Class D (a) |
94,439 | 36,271 | ||||||
| Stendorren Fastigheter AB * |
8,937 | 135,489 | ||||||
| Swedish Logistic Property AB, Class B * |
33,646 | 79,141 | ||||||
| Wallenstam AB, Class B (a) |
325,994 | 1,039,361 | ||||||
| Wihlborgs Fastigheter AB |
181,871 | 1,296,739 | ||||||
|
|
|
|||||||
| (Cost $30,500,755) |
18,141,868 | |||||||
|
|
|
|||||||
| Switzerland — 2.1% | ||||||||
| Allreal Holding AG (a) |
10,345 | 1,704,268 | ||||||
| Fundamenta Real Estate AG * |
15,744 | 277,283 | ||||||
| Intershop Holding AG |
829 | 553,181 | ||||||
| Mobimo Holding AG |
4,851 | 1,257,657 | ||||||
| Peach Property Group AG *(a) |
7,053 | 98,448 | ||||||
| PSP Swiss Property AG |
30,928 | 3,308,821 | ||||||
| Swiss Prime Site AG |
51,518 | 4,330,972 | ||||||
| Zug Estates Holding AG, Class B |
182 | 336,466 | ||||||
|
|
|
|||||||
| (Cost $13,522,630) |
11,867,096 | |||||||
|
|
|
|||||||
| Taiwan — 1.2% | ||||||||
| Cathay No. 1 REIT |
897,504 | 525,461 | ||||||
| Cathay No. 2 REIT |
198,000 | 110,703 | ||||||
| Cathay Real Estate Development Co. Ltd. |
453,424 | 243,479 | ||||||
| Chong Hong Construction Co. Ltd. |
150,740 | 389,022 | ||||||
| Farglory Land Development Co. Ltd. |
184,479 | 376,433 | ||||||
| Highwealth Construction Corp. |
1,053,401 | 1,460,414 | ||||||
| Number |
Value |
|||||||
| Taiwan (Continued) | ||||||||
| Hong Pu Real Estate Development Co. |
130,515 | $ | 108,948 | |||||
| Huaku Development Co. Ltd. |
173,338 | 508,266 | ||||||
| Huang Hsiang Construction Corp. |
89,643 | 134,344 | ||||||
| Hung Sheng Construction Ltd. |
251,915 | 184,053 | ||||||
| KEE TAI Properties Co. Ltd. |
278,118 | 117,665 | ||||||
| Kindom Development Co. Ltd. |
254,531 | 244,777 | ||||||
| Kuo Yang Construction Co. Ltd. * |
159,983 | 97,622 | ||||||
| Prince Housing & Development Corp. |
897,799 | 353,539 | ||||||
| Radium Life Tech Co. Ltd. |
392,797 | 117,862 | ||||||
| Ruentex Development Co. Ltd. |
1,412,141 | 1,603,896 | ||||||
| Shining Building Business Co. Ltd. * |
318,249 | 124,286 | ||||||
| Sinyi Realty, Inc. |
196,039 | 190,122 | ||||||
| Taiwan Land Development Corp. *(c) |
243,531 | 0 | ||||||
|
|
|
|||||||
| (Cost $6,587,600) |
6,890,892 | |||||||
|
|
|
|||||||
| Thailand — 2.7% | ||||||||
| Amata Corp. PCL, NVDR |
558,400 | 354,616 | ||||||
| Ananda Development PCL, NVDR * |
1,576,500 | 45,755 | ||||||
| AP Thailand PCL, NVDR |
1,629,700 | 543,233 | ||||||
| Asset World Corp. PCL, NVDR |
5,443,100 | 769,542 | ||||||
| Ba Airport Leasehold REIT REIT |
450,000 | 138,362 | ||||||
| Bangkok Land PCL, NVDR |
8,938,300 | 218,321 | ||||||
| Central Pattana PCL, NVDR |
2,196,700 | 4,260,840 | ||||||
| CP Tower Growth Leasehold Property Fund |
800 | 160 | ||||||
| CPN Retail Growth Leasehold REIT |
1,161,400 | 427,182 | ||||||
| Digital Telecommunications Infrastructure Fund, Class F |
5,100,000 | 1,802,586 | ||||||
| Frasers Property Thailand Industrial Freehold & Leasehold REIT |
1,161,400 | 367,109 | ||||||
| Frasers Property Thailand PCL, NVDR |
255,825 | 111,004 | ||||||
| Golden Ventures Leasehold Real Estate Investment Trust REIT |
238,500 | 62,024 | ||||||
| Grand Canal Land PCL, NVDR * |
822,800 | 51,070 | ||||||
| IMPACT Growth Real Estate Investment Trust REIT |
333,532 | 123,637 | ||||||
| Land & Houses PCL, NVDR |
5,534,800 | 1,351,891 | ||||||
| LH Hotel Leasehold Real Estate Investment Trust, Class F REIT |
261,700 | 94,001 | ||||||
| Lotus’s Retail Growth Freehold And Leasehold Property Fund |
271,900 | 103,916 | ||||||
| LPN Development PCL, NVDR |
775,159 | 98,009 | ||||||
| Noble Development PCL, NVDR |
748,157 | 96,744 | ||||||
| Nusasiri PCL, NVDR * |
6,422,200 | 147,637 | ||||||
| Origin Property PCL, NVDR |
618,700 | 192,010 | ||||||
| Platinum Group PCL, NVDR * |
794,100 | 76,672 | ||||||
| Principal Capital PCL, NVDR * |
412,800 | 54,565 | ||||||
| Property Perfect PCL, NVDR |
6,081,506 | 64,660 | ||||||
| Pruksa Holding PCL, NVDR |
572,600 | 204,030 | ||||||
| Quality Houses PCL, NVDR |
6,135,000 | 405,474 | ||||||
| Rabbit Holdings PCL, NVDR * |
13,658,100 | 243,334 | ||||||
| Rabbit Holdings PCL, PFD NVDR * |
161,700 | 2,927 | ||||||
| Sansiri PCL, NVDR |
10,347,500 | 517,375 | ||||||
| SC Asset Corp. PCL, NVDR |
1,286,800 | 161,220 | ||||||
| Singha Estate PCL, NVDR |
1,916,700 | 86,472 | ||||||
| Supalai PCL |
51,400 | 29,836 | ||||||
| See Notes to Financial Statements. | 13 |
DBX ETF Trust
Schedule of Investments
Xtrackers International Real Estate ETF (Continued)
May 31, 2023
| Number |
Value |
|||||||
| Thailand (Continued) | ||||||||
| Supalai PCL |
500 | $ | 290 | |||||
| Supalai PCL, NVDR |
877,365 | 509,275 | ||||||
| Univentures PCL, NVDR |
445,600 | 36,365 | ||||||
| WHA Corp. PCL, NVDR |
6,853,196 | 870,435 | ||||||
| WHA Premium Growth Freehold & Leasehold Real Estate InvestmentTrust, Class F REIT |
1,559,000 | 492,787 | ||||||
|
|
|
|||||||
| (Cost $15,469,223) |
15,115,366 | |||||||
|
|
|
|||||||
| Turkey — 0.4% | ||||||||
| Akfen Gayrimenkul Yatirim Ortakligi AS REIT * |
384,172 | 65,332 | ||||||
| AKIS Gayrimenkul Yatirimi AS REIT * |
248,455 | 60,737 | ||||||
| Akmerkez Gayrimenkul Yatirim Ortakligi AS REIT |
6,147 | 21,739 | ||||||
| Alarko Gayrimenkul Yatirim Ortakligi AS REIT |
25,204 | 70,137 | ||||||
| Baskent Dogalgaz Dagitim Gayrimenkul Yatirim Ortakligi AS |
69,758 | 41,048 | ||||||
| Emlak Konut Gayrimenkul Yatirim Ortakligi AS REIT |
1,353,740 | 465,008 | ||||||
| Gimat Magazacilik Sanayi VE Ticaret |
96,280 | 56,934 | ||||||
| Halk Gayrimenkul Yatirim Ortakligi AS REIT * |
158,825 | 32,534 | ||||||
| Ihlas Gayrimenkul Proje Gelistirme Ve Ticaret AS * |
490,774 | 23,473 | ||||||
| Is Gayrimenkul Yatirim Ortakligi AS |
260,845 | 112,158 | ||||||
| Kiler Gayrimenkul Yatirim Ortakligi AS |
381,253 | 43,285 | ||||||
| Kiler Holding As * |
66,400 | 115,485 | ||||||
| Kizilbuk Gayrimenkul Yatirim Ortakligi |
49,164 | 42,160 | ||||||
| Kuyumcukent Gayrimenkul Yatirimlari AS REIT * |
60,418 | 84,941 | ||||||
| Marti Gayrimenkul Yatirim Ortakligi As |
119,161 | 31,433 | ||||||
| Nurol Gayrimenkul Yatirim Ortakligi AS REIT * |
88,135 | 22,823 | ||||||
| Ozak Gayrimenkul Yatirim Ortakligi |
137,752 | 82,190 | ||||||
| Ozderici Gayrimenkul Yatirim Ortakligi AS REIT * |
96,803 | 18,005 | ||||||
| Panora Gayrimenkul Yatirim Ortakligi |
35,510 | 45,394 | ||||||
| Peker Gayrimenkul Yatirim Ortakligi AS * |
253,206 | 82,572 | ||||||
| Reysas Gayrimenkul Yatirim Ortakligi AS REIT * |
94,886 | 54,689 | ||||||
| Servet Gayrimenkul Yatirim Ortakligi |
8,448 | 73,547 | ||||||
| Sinpas Gayrimenkul Yatirim Ortakligi AS REIT * |
509,687 | 59,836 | ||||||
| Torunlar Gayrimenkul Yatirim Ortakligi AS REIT |
86,457 | 68,669 | ||||||
| Vakif Gayrimenkul Yatirim Ortakligi AS |
443,066 | 67,855 | ||||||
| Yeni Gimat Gayrimenkul Ortakligi AS |
148,959 | 245,114 | ||||||
| Number |
Value |
|||||||
| Turkey (Continued) | ||||||||
| Yesil Gayrimenkul Yatirim Ortakligi AS |
95,653 | $ | 8,688 | |||||
| Ziraat Gayrimenkul Yatirim Ortakligi AS |
511,599 | 109,988 | ||||||
|
|
|
|||||||
| (Cost $2,022,411) |
2,205,774 | |||||||
|
|
|
|||||||
| United Kingdom — 7.3% | ||||||||
| Assura PLC REIT |
1,975,630 | 1,174,347 | ||||||
| Big Yellow Group PLC REIT |
122,146 | 1,740,960 | ||||||
| British Land Co. PLC REIT |
577,881 | 2,456,656 | ||||||
| Capital & Counties Properties PLC REIT |
954,988 | 1,419,152 | ||||||
| CLS Holdings PLC REIT |
116,208 | 197,031 | ||||||
| Derwent London PLC REIT |
68,499 | 1,823,603 | ||||||
| Empiric Student Property PLC REIT |
404,112 | 453,275 | ||||||
| Grainger PLC |
448,882 | 1,381,960 | ||||||
| Great Portland Estates PLC REIT |
137,774 | 825,440 | ||||||
| Hammerson PLC REIT (a) |
2,731,016 | 839,436 | ||||||
| Helical PLC REIT |
75,124 | 226,720 | ||||||
| Henry Boot PLC |
71,608 | 207,677 | ||||||
| Industrials REIT Ltd. REIT |
182,471 | 377,534 | ||||||
| Land Securities Group PLC REIT |
453,014 | 3,380,025 | ||||||
| LondonMetric Property PLC REIT |
610,814 | 1,362,678 | ||||||
| LXI REIT PLC REIT |
1,086,009 | 1,321,772 | ||||||
| Picton Property Income Ltd. REIT |
371,056 | 344,456 | ||||||
| Primary Health Properties PLC REIT |
905,583 | 1,119,013 | ||||||
| Rightmove PLC |
559,597 | 3,631,506 | ||||||
| Safestore Holdings PLC REIT |
145,769 | 1,688,326 | ||||||
| Savills PLC |
94,245 | 1,062,947 | ||||||
| Segro PLC REIT |
822,430 | 8,130,100 | ||||||
| Tritax Big Box REIT PLC REIT |
1,237,891 | 2,147,940 | ||||||
| UK Commercial Property REIT Ltd. REIT |
522,334 | 342,465 | ||||||
| UNITE Group PLC REIT, Series 6 |
219,533 | 2,435,200 | ||||||
| Workspace Group PLC REIT |
91,250 | 568,870 | ||||||
|
|
|
|||||||
| (Cost $51,153,495) |
40,659,089 | |||||||
|
|
|
|||||||
| Virgin Islands — 0.0% | ||||||||
| SF Real Estate Investment Trust REIT |
||||||||
| (Cost $131,397) |
333,016 | 116,986 | ||||||
|
|
|
|||||||
| TOTAL COMMON STOCKS |
555,508,149 | |||||||
|
|
|
|||||||
| PREFERRED STOCKS — 0.1% | ||||||||
| Brazil — 0.1% | ||||||||
| Iguatemi SA (Cost $324,084) |
200,000 | 380,327 | ||||||
|
|
|
|||||||
| RIGHTS — 0.0% | ||||||||
| Austria — 0.0% | ||||||||
| S IMMO AG *, expires 12/31/49 (c) (Cost $0) |
31,199 | 0 | ||||||
|
|
|
|||||||
| WARRANTS — 0.0% | ||||||||
| Malaysia — 0.0% | ||||||||
| Eco World Development Group Bhd *, expires 4/12/29 |
106,640 | 2,542 | ||||||
| Paramount Corp. Bhd *, expires 7/28/24 |
7,840 | 127 | ||||||
|
|
|
|||||||
| (Cost $0) |
2,669 | |||||||
|
|
|
|||||||
| See Notes to Financial Statements. | 14 |
DBX ETF Trust
Schedule of Investments
Xtrackers International Real Estate ETF (Continued)
May 31, 2023
| Number |
Value |
|||||||
| Thailand — 0.0% | ||||||||
| Noble Development PCL *, expires 1/12/24 |
||||||||
| (Cost $0) |
54,825 | $ | 236 | |||||
|
|
|
|||||||
| TOTAL WARRANTS |
2,905 | |||||||
|
|
|
|||||||
| EXCHANGE-TRADED FUNDS — 0.0% | ||||||||
| iShares Global REIT ETF |
500 | 11,190 | ||||||
| Vanguard Global ex-U.S. Real Estate ETF |
500 | 19,665 | ||||||
|
|
|
|||||||
| (Cost $34,635) |
30,855 | |||||||
|
|
|
|||||||
| SECURITIES LENDING COLLATERAL — 2.5% | ||||||||
| DWS Government & Agency Securities Portfolio “DWS Government Cash Institutional Shares”,
5.03% (d)(e) |
13,660,219 | 13,660,219 | ||||||
|
|
|
|||||||
| Number |
Value |
|||||||
| CASH EQUIVALENTS — 0.0% | ||||||||
| DWS Government Money Market Series “Institutional Shares”, 5.04% (d) |
44,853 | $ | 44,853 | |||||
|
|
|
|||||||
| TOTAL INVESTMENTS — 101.8% |
||||||||
| (Cost $703,601,252) |
$ | 569,627,308 | ||||||
| Other assets and liabilities, net — (1.8%) |
(9,858,826 | ) | ||||||
|
|
|
|||||||
| NET ASSETS — 100.0% |
$ | 559,768,482 | ||||||
|
|
|
|||||||
A summary of the Fund’s transactions with affiliated investments during the year ended May 31, 2023 is as follows:
| Value ($) at 5/31/2022 |
Purchases Cost ($) |
Sales Proceeds ($) |
Net Realized Gain/(Loss) ($) |
Net Change in Unrealized Appreciation (Depreciation) ($) |
Income ($) | Capital Gain Distributions ($) |
Number of Shares at 5/31/2023 |
Value ($) at 5/31/2023 |
||||||||||||||||||||||||||||
| SECURITIES LENDING COLLATERAL — 2.5% |
| |||||||||||||||||||||||||||||||||||
| DWS Government & Agency Securities Portfolio “DWS Government Cash Institutional Shares”, 5.03% (d)(e) |
| |||||||||||||||||||||||||||||||||||
| 10,913,250 | 2,746,969 | (f) | — | — | — | 331,437 | — | 13,660,219 | 13,660,219 | |||||||||||||||||||||||||||
| CASH EQUIVALENTS — 0.0% |
| |||||||||||||||||||||||||||||||||||
| DWS Government Money Market Series “Institutional Shares”, 5.04%(d) |
| |||||||||||||||||||||||||||||||||||
| 620,850 | 32,739,770 | (33,315,767 | ) | — | — | 25,914 | — | 44,853 | 44,853 | |||||||||||||||||||||||||||
|
|
|
|
|
|
|
|
|
|
|
|
|
|
|
|
|
|
|
|||||||||||||||||||
| 11,534,100 | 35,486,739 | (33,315,767 | ) | — | — | 357,351 | — | 13,705,072 | 13,705,072 | |||||||||||||||||||||||||||
|
|
|
|
|
|
|
|
|
|
|
|
|
|
|
|
|
|
|
|||||||||||||||||||
| * | Non-income producing security. |
| (a) | All or a portion of these securities were on loan. In addition, “Other assets and liabilities, net” may include pending sales that are also on loan. The value of securities loaned at May 31, 2023 amounted to $42,299,933, which is 7.6% of net assets. |
| (b) | Stapled Security — A security contractually bound to one or more other securities to form a single saleable unit which cannot be sold separately. |
| (c) | Investment was valued using significant unobservable inputs. |
| (d) | Affiliated fund managed by DWS Investment Management Americas, Inc. The rate shown is the annualized seven-day yield at period end. |
| (e) | Represents cash collateral held in connection with securities lending. Income earned by the Fund is net of borrower rebates. In addition, the Fund held non-cash U.S. Treasury securities collateral having a value of $33,126,979. |
| (f) | Represents the net increase (purchase cost) or decrease (sales proceeds) in the amount invested in cash collateral for the year ended May 31, 2023. |
| CVA: | Credit Valuation Adjustment |
| NVDR: | Non Voting Depositary Receipt |
| PJSC: | Public Joint Stock Company |
| REIT: | Real Estate Investment Trust |
| SAE: | Societe Anonyme Egyptienne |
| 144A: | Security exempt from registration under Rule 144A of the Securities Act of 1933. These securities may be resold in transactions exempt from registration, normally to qualified institutional buyers. |
Securities are listed in country of domicile.
| See Notes to Financial Statements. | 15 |
DBX ETF Trust
Schedule of Investments
Xtrackers International Real Estate ETF (Continued)
May 31, 2023
At May 31, 2023, open futures contracts purchased were as follows:
| Contract Description |
Currency | Number of Contracts |
Notional Amount |
Contract Value |
Expiration Date |
Unrealized Appreciation (Depreciation) |
||||||||||||
| EURO CAC40 10 Futures |
EUR | 8 | $ | 629,152 | $ | 605,502 | 6/16/2023 | $ | (23,650 | ) | ||||||||
| EURO STOXX 50 Futures |
EUR | 10 | 430,524 | 449,575 | 6/16/2023 | 19,051 | ||||||||||||
| E-Mini S&P 500 Futures |
USD | 5 | 981,855 | 1,047,625 | 6/16/2023 | 65,770 | ||||||||||||
| MINI TOPIX Index Futures |
JPY | 35 | 516,944 | 532,584 | 6/08/2023 | 15,640 | ||||||||||||
| SPI 200 Futures |
AUD | 8 | 935,356 | 918,953 | 6/15/2023 | (16,403 | ) | |||||||||||
| TOPIX Index Futures |
JPY | 3 | 434,071 | 456,501 | 6/08/2023 | 22,430 | ||||||||||||
|
|
|
|||||||||||||||||
| Total net unrealized appreciation |
$ | 82,838 | ||||||||||||||||
|
|
|
|||||||||||||||||
For information on the Fund’s policy and additional disclosures regarding open futures contracts, please refer to the Derivatives section of Note 2 in the accompanying Notes to Financial Statements.
Currency Abbreviations
| AUD | Australian Dollar |
| EUR | Euro |
| JPY | Japanese Yen |
| USD | U.S. Dollar |
Fair Value Measurements
Various inputs are used in determining the value of the Fund’s investments. These inputs are summarized in three broad levels. Level 1 includes quoted prices in active markets for identical securities. Level 2 includes other significant observable inputs (including quoted prices for similar securities, interest rates, prepayment speeds and credit risk). Level 3 includes significant unobservable inputs (including the Fund’s own assumptions in determining the fair value of investments). The level assigned to the securities valuations may not be an indication of the risk or liquidity associated with investing in those securities.
The following is a summary of the inputs used as of May 31, 2023 in valuing the Fund’s investments. For information on the Fund’s policy regarding the valuation of investments, please refer to the Security Valuation section of Note 2 in the accompanying Notes to Financial Statements.
| Assets |
Level 1 | Level 2 | Level 3 | Total | ||||||||||||
| Common Stocks (a) |
$ | 555,097,200 | $ | — | $ | 410,949 | $ | 555,508,149 | ||||||||
| Preferred Stocks (a) |
380,327 | — | — | 380,327 | ||||||||||||
| Rights (a) |
— | — | 0 | 0 | ||||||||||||
| Warrants (a) |
2,905 | — | — | 2,905 | ||||||||||||
| Exchange-Traded Funds |
30,855 | — | — | 30,855 | ||||||||||||
| Short-Term Investments (a) |
13,705,072 | — | — | 13,705,072 | ||||||||||||
| Derivatives (b) |
||||||||||||||||
| Futures Contracts |
122,891 | — | — | 122,891 | ||||||||||||
|
|
|
|
|
|
|
|
|
|||||||||
| TOTAL |
$ | 569,339,250 | $ | — | $ | 410,949 | $ | 569,750,199 | ||||||||
|
|
|
|
|
|
|
|
|
|||||||||
| Liabilities |
Level 1 | Level 2 | Level 3 | Total | ||||||||||||
| Derivatives (b) |
||||||||||||||||
| Futures Contracts |
$ | (40,053 | ) | $ | — | $ | — | $ | (40,053 | ) | ||||||
|
|
|
|
|
|
|
|
|
|||||||||
| TOTAL |
$ | (40,053 | ) | $ | — | $ | — | $ | (40,053 | ) | ||||||
|
|
|
|
|
|
|
|
|
|||||||||
| (a) | See Schedule of Investments for additional detailed categorizations. |
| (b) | Derivatives include unrealized appreciation (depreciation) on open futures contracts. |
During the year ended May 31, 2023, the amount of transfers from Level 1 to Level 3 was $311,253. The investment was transferred from Level 1 to Level 3 due to the lack of observable market data due to a decrease in market activity.
| See Notes to Financial Statements. | 16 |
This Page is Intentionally Left Blank
17
DBX ETF Trust
May 31, 2023
| Xtrackers International Real Estate ETF |
||||
| Assets |
||||
| Investment in non-affiliated securities at value |
$ | 555,922,236 | ||
| Investment in DWS Government Money Market Series |
44,853 | |||
| Investment in DWS Government & Agency Securities Portfolio* |
13,660,219 | |||
| Foreign currency at value |
752,628 | |||
| Deposit with broker for futures contracts |
260,780 | |||
| Receivables: | ||||
| Investment securities sold |
1,590 | |||
| Capital shares |
2,014,603 | |||
| Dividends |
2,651,465 | |||
| Interest |
1,479 | |||
| Securities lending income |
30,299 | |||
| Foreign tax reclaim |
469,695 | |||
|
|
|
|||
| Total assets |
$ | 575,809,847 | ||
|
|
|
|||
| Liabilities |
||||
| Payable upon return of securities loaned |
$ | 13,660,219 | ||
| Payables: | ||||
| Investment securities purchased |
1,955,675 | |||
| Investment advisory fees |
48,943 | |||
| Variation margin on futures contracts |
55,005 | |||
| Deferred foreign tax payable |
321,523 | |||
|
|
|
|||
| Total liabilities |
16,041,365 | |||
|
|
|
|||
| Net Assets, at value |
$ | 559,768,482 | ||
|
|
|
|||
| Net Assets Consist of |
||||
| Paid-in capital |
$ | 722,907,153 | ||
| Distributable earnings (loss) |
(163,138,671 | ) | ||
|
|
|
|||
| Net Assets, at value |
$ | 559,768,482 | ||
|
|
|
|||
| Number of Common Shares outstanding |
27,800,001 | |||
|
|
|
|||
| Net Asset Value |
$ | 20.14 | ||
|
|
|
|||
| Investment in non-affiliated securities at cost |
$ | 689,896,180 | ||
|
|
|
|||
| Value of securities loaned |
$ | 42,299,933 | ||
|
|
|
|||
| Investment in DWS Government Money Market Series at cost |
$ | 44,853 | ||
|
|
|
|||
| Investment in DWS Government & Agency Securities Portfolio at cost* |
$ | 13,660,219 | ||
|
|
|
|||
| Non-cash collateral for securities on loan |
$ | 33,126,979 | ||
|
|
|
|||
| Foreign currency at cost |
$ | 757,756 | ||
|
|
|
|||
| * | Represents collateral on securities loaned. |
| See Notes to Financial Statements. | 18 |
DBX ETF Trust
For the Year Ended May 31, 2023
| Xtrackers International Real Estate ETF |
||||
| Investment Income |
||||
| Unaffiliated dividend income* |
$ | 19,995,833 | ||
| Income distributions from affiliated funds |
25,914 | |||
| Affiliated securities lending income |
331,437 | |||
| Unaffiliated securities lending income, net of borrower rebates |
73,295 | |||
|
|
|
|||
| Total investment income |
20,426,479 | |||
|
|
|
|||
| Expenses |
||||
| Investment advisory fees |
645,106 | |||
| Other expenses |
179 | |||
|
|
|
|||
| Total expenses |
645,285 | |||
|
|
|
|||
| Less fees waived (see note 3): |
||||
| Waiver |
(107,997 | ) | ||
|
|
|
|||
| Net expenses |
537,288 | |||
|
|
|
|||
| Net investment income (loss) |
19,889,191 | |||
|
|
|
|||
| Realized and Unrealized Gain (Loss) |
||||
| Net realized gain (loss) from: |
||||
| Investments** |
(18,037,145 | ) | ||
| In-kind redemptions |
462,034 | |||
| Futures contracts |
(131,093 | ) | ||
| Foreign currency transactions |
(188,989 | ) | ||
|
|
|
|||
| Net realized gain (loss) |
(17,895,193 | ) | ||
|
|
|
|||
| Net change in unrealized appreciation (depreciation) on: |
||||
| Investments*** |
(99,567,004 | ) | ||
| Futures contracts |
15,857 | |||
| Foreign currency translations |
(39,929 | ) | ||
|
|
|
|||
| Net change in unrealized appreciation (depreciation) |
(99,591,076 | ) | ||
|
|
|
|||
| Net realized and unrealized gain (loss) on investments, futures and foreign currency transactions |
(117,486,269 | ) | ||
|
|
|
|||
| Net Increase (Decrease) in Net Assets Resulting from Operations |
$ | (97,597,078 | ) | |
|
|
|
|||
| * Unaffiliated foreign tax withheld |
$ | 2,416,346 | ||
| ** Including foreign taxes |
$ | 2,200 | ||
| *** Including change in deferred foreign taxes |
$ | 203,383 | ||
| See Notes to Financial Statements. | 19 |
DBX ETF Trust
| Xtrackers International Real Estate ETF |
||||||||
| Year Ended May 31, 2023 |
Year Ended May 31, 2022 |
|||||||
| Increase (Decrease) in Net Assets from Operations |
||||||||
| Net investment income (loss) |
$ | 19,889,191 | $ | 18,055,590 | ||||
| Net realized gain (loss) |
(17,895,193 | ) | (2,295,310 | ) | ||||
| Net change in net unrealized appreciation (depreciation) |
(99,591,076 | ) | (83,902,671 | ) | ||||
|
|
|
|
|
|||||
| Net increase (decrease) in net assets resulting from operations |
(97,597,078 | ) | (68,142,391 | ) | ||||
|
|
|
|
|
|||||
| Distributions to Shareholders |
(10,275,798 | ) | (23,945,405 | ) | ||||
|
|
|
|
|
|||||
| Fund Shares Transactions |
||||||||
| Proceeds from shares sold |
112,001,214 | 212,069,381 | ||||||
| Value of shares redeemed |
(3,232,508 | ) | (18,792,278 | ) | ||||
|
|
|
|
|
|||||
| Net increase (decrease) in net assets resulting from fund share transactions |
108,768,706 | 193,277,103 | ||||||
|
|
|
|
|
|||||
| Total net increase (decrease) in Net Assets |
895,830 | 101,189,307 | ||||||
| Net Assets |
||||||||
| Beginning of year |
$ | 558,872,652 | $ | 457,683,345 | ||||
|
|
|
|
|
|||||
| End of year |
$ | 559,768,482 | $ | 558,872,652 | ||||
|
|
|
|
|
|||||
| Changes in Shares Outstanding |
||||||||
| Shares outstanding, beginning of year |
22,650,001 | 15,700,001 | ||||||
| Shares sold |
5,300,000 | 7,700,000 | ||||||
| Shares redeemed |
(150,000 | ) | (750,000 | ) | ||||
|
|
|
|
|
|||||
| Shares outstanding, end of year |
27,800,001 | 22,650,001 | ||||||
|
|
|
|
|
|||||
| See Notes to Financial Statements. | 20 |
DBX ETF Trust
| Xtrackers International Real Estate ETF Selected Per Share Data |
Years Ended May 31, | |||||||||||||||||||
| 2023 | 2022 | 2021 | 2020 | 2019 | ||||||||||||||||
| Net Asset Value, beginning of year |
$ | 24.67 | $ | 29.15 | $ | 22.85 | $ | 27.84 | $ | 29.17 | ||||||||||
|
|
|
|
|
|
|
|
|
|
|
|||||||||||
| Income (loss) from investment operations: | ||||||||||||||||||||
| Net investment income (loss) (a) |
0.80 | 0.92 | 0.92 | 0.84 | 1.14 | |||||||||||||||
| Net realized and unrealized gain (loss) |
(4.91 | ) | (4.05 | ) | 6.28 | (4.74 | ) | (1.98 | ) | |||||||||||
|
|
|
|
|
|
|
|
|
|
|
|||||||||||
| Total from investment operations |
(4.11 | ) | (3.13 | ) | 7.20 | (3.90 | ) | (0.84 | ) | |||||||||||
|
|
|
|
|
|
|
|
|
|
|
|||||||||||
| Less distributions from: |
| |||||||||||||||||||
| Net investment income |
(0.42 | ) | (1.35 | ) | (0.90 | ) | (1.09 | ) | (0.49 | ) | ||||||||||
|
|
|
|
|
|
|
|
|
|
|
|||||||||||
| Total distributions |
(0.42 | ) | (1.35 | ) | (0.90 | ) | (1.09 | ) | (0.49 | ) | ||||||||||
|
|
|
|
|
|
|
|
|
|
|
|||||||||||
| Net Asset Value, end of year |
$ | 20.14 | $ | 24.67 | $ | 29.15 | $ | 22.85 | $ | 27.84 | ||||||||||
|
|
|
|
|
|
|
|
|
|
|
|||||||||||
| Total Return (%) (b) |
(16.76 | ) | (11.26 | ) | 32.15 | (14.80 | ) | (2.78 | ) | |||||||||||
| Ratios to Average Net Assets and Supplemental Data |
||||||||||||||||||||
| Net Assets, end of year ($ millions) |
560 | 559 | 458 | 231 | 60 | |||||||||||||||
| Ratio of expenses before fee waiver (%) |
0.12 | 0.12 | 0.12 | 0.12 | 0.30 | |||||||||||||||
| Ratio of expenses after fee waiver (%) |
0.10 | 0.10 | 0.10 | 0.10 | 0.28 | |||||||||||||||
| Ratio of net investment income (loss) (%) |
3.70 | 3.38 | 3.55 | 3.21 | 4.25 | |||||||||||||||
| Portfolio turnover rate (%) (c) |
8 | 17 | 9 | 12 | 43 | |||||||||||||||
| (a) | Based on average shares outstanding during the period. |
| (b) | Total Return would have been lower if certain expenses had not been reimbursed by the Advisor. |
| (c) | Portfolio turnover rate does not include securities received or delivered from processing creations or redemptions. |
| See Notes to Financial Statements. | 21 |
DBX ETF Trust
1. Organization
DBX ETF Trust (the “Trust”) is registered under the Investment Company Act of 1940, as amended (the “1940 Act”), as an open-end registered management investment company organized as a Delaware statutory trust.
As of May 31, 2023, the Trust consists of thirty-nine investment series of exchange-traded funds (“ETFs”) in operation and trading. These financial statements report on Xtrackers International Real Estate ETF (the “Fund”), a diversified series of the Trust.
DBX Advisors LLC (“DBX” or the “Advisor”), an indirect, wholly-owned subsidiary of DWS Group GmbH & Co. KGaA (“DWS Group”), serves as investment advisor to the Fund and has overall responsibility for the general management and administration of the Fund, subject to the supervision of the Fund’s Board of Trustees (“Board”).
The Fund offers shares that are listed and traded on the NYSE Arca, Inc. (“NYSE Arca”). Unlike conventional mutual funds, the Fund issues and redeems shares on a continuous basis, at net asset value (“NAV”), only in large specified lots consisting of 50,000 shares, each called a “Creation Unit”, to authorized participants who have entered into agreements with the Fund’s distributor. Shares are not individually redeemable securities of the Fund, and owners of shares may acquire those shares from the Fund or tender such shares for redemption to the Fund, in Creation Units only.
The investment objective of the Fund is to seek investment results that correspond generally to the performance, before fees and expenses, of the iSTOXX Developed and Emerging Markets ex USA PK VN Real Estate Index (the “Underlying Index”).
The Underlying Index is a free-float capitalization weighted index that provides exposure to publicly traded international real estate securities in countries outside the United States, excluding Pakistan and Vietnam. The iSTOXX Developed and Emerging Markets ex USA PK VN Real Estate Index is rebalanced quarterly.
The Fund is entitled to use its Underlying Index pursuant to a licensing agreement between the Index Provider and DBX. There is no charge to the Fund in connection with the licensing agreement.
Pursuant to the Trust’s organizational documents, the Trust’s officers and trustees are indemnified against certain liabilities that may arise out of the performance of their duties to the Fund. Additionally, in the normal course of business the Trust enters into contracts that contain a variety of representations that provide indemnification for certain liabilities. The Trust’s maximum exposure under these arrangements is unknown, as this would involve future claims that may be made against the Fund that have not yet occurred. However, the Trust expects the risk of loss to be remote.
2. Significant Accounting Policies
The financial statements have been prepared in conformity with U.S. generally accepted accounting principles (“U.S. GAAP”), which require management to make certain estimates and assumptions that affect the reported amounts and disclosures in the financial statements. Actual results could differ from those estimates. The Fund qualifies as an investment company under Topic 946 of the Accounting Standards Codification of U.S. GAAP. The following is a summary of significant accounting policies followed by the Fund.
Security Valuation The NAV of the Fund’s shares is calculated each business day as of the close of regular trading on the New York Stock Exchange, generally 4:00 p.m. Eastern Time. NAV per share is calculated by dividing a Fund’s net assets by the number of Fund shares outstanding.
The Fund’s Board has designated the Advisor as the valuation designee for the Fund pursuant to Rule 2a-5 under the 1940 Act. The Advisor’s Pricing Committee (the “Pricing Committee”) typically values securities using readily available market quotations or prices supplied by independent pricing services (which are considered fair values under Rule 2a-5). The Advisor has adopted fair valuation procedures that provide methodologies for fair valuing securities.
22
DBX ETF Trust
Notes to Financial Statements (Continued)
Various inputs are used in determining the value of the Fund’s investments. These inputs are summarized in three broad levels. Level 1 includes quoted prices in active markets for identical securities. Level 2 includes other significant observable inputs (including quoted prices for similar securities, interest rates, prepayment speeds, and credit risk). Level 3 includes significant unobservable inputs (including the Fund’s own assumptions in determining the fair value of investments). The level assigned to the securities valuations may not be an indication of the risk or liquidity associated with investing in those securities.
Equity securities and ETFs are valued at the most recent sale price or official closing price reported on the exchange (U.S. or foreign) or over-the-counter market on which they trade. Securities or ETFs for which no sales are reported are valued at the calculated mean between the most recent bid and asked quotations on the relevant market or, if a mean cannot be determined, at the most recent bid quotation. Equity securities and ETFs are generally categorized as Level 1.
Investments in open-end investment companies are valued at their NAV each business day and are categorized as Level 1.
Futures contracts are generally valued at the settlement prices established each day on the exchange on which they are traded and are categorized as Level 1.
Securities and other assets for which market quotations are not readily available or for which the above valuation procedures are deemed not to reflect fair value are valued in a manner that is intended to reflect their fair value as determined in accordance with procedures approved by the Pricing Committee and are generally categorized as Level 3. In accordance with the Fund’s valuation procedures, factors considered in determining value may include, but are not limited to, the type of the security; the size of the holding; the initial cost of the security; the existence of any contractual restrictions on the security’s disposition; the price and extent of public trading in similar securities of the issuer or of comparable companies; quotations or evaluated prices from broker-dealers and/or pricing services; information obtained from the issuer, analysts, and/or the appropriate stock exchange (for exchange traded securities); an analysis of the company’s or issuer’s financial statements; an evaluation of the forces that influence the issuer and the market(s) in which the security is purchased and sold; and with respect to debt securities, the maturity, coupon, creditworthiness, currency denomination and the movement of the market in which the security is normally traded. The value determined under these procedures may differ from published values for the same securities.
Fair value pricing could result in a difference between the prices used to calculate a Fund’s NAV and the prices used by the Fund’s Underlying Index, which in turn could result in a difference between the Fund’s performance and the performance of the Fund’s Underlying Index.
Disclosure about the classification of the fair value measurements is included in a table following the Fund’s Schedule of Investments.
Cash Cash consists of cash held at banks and is on deposit with major financial institutions.
Investment Transactions and Investment Income Investment transactions are recorded as of the date that the securities are purchased or sold (trade date). Realized gains and losses from the sale or disposition of securities are calculated on the identified cost-method. Dividend income is net of any foreign taxes withheld at source. Certain dividends from foreign securities may be recorded subsequent to the ex-dividend date as soon as the Fund is informed of such dividends. Interest income is recorded on the accrual basis. Distributions received from foreign domiciled corporations, generally determined to be passive foreign investment companies for tax reporting purposes, are included in dividend income.
Tax Information and Dividends and Distributions to Shareholders It is the Fund’s policy to comply with all requirements of the Internal Revenue Code of 1986, as amended (“the Code”). The Fund intends to qualify for and to elect treatment as a separate Regulated Investment Company (“RIC”) under Subchapter M of the Code. It is the policy of the Fund to pay out dividends from its net investment income, if any, semi-annually. Taxable net realized gains from investment transactions, reduced by capital loss carryforwards, if any, are declared and distributed to shareholders at least annually. The capital loss carryforward amount, if any, is available to offset future net capital gains. The Fund may occasionally be required to make supplemental distributions at some other time during the year. The Fund reserve the right to declare special distributions if, in their reasonable discretion, such action is
23
DBX ETF Trust
Notes to Financial Statements (Continued)
necessary or advisable to preserve the status of the Fund as a RIC or to avoid imposition of income or excise taxes on undistributed income. Dividends and distributions to shareholders, if any, are recorded on the ex-dividend date. The amount of dividends and distributions from net investment income and net realized capital gains are determined in accordance with Federal income tax regulations which may differ from U.S. GAAP. These “book/tax” differences are either considered temporary or permanent in nature. To the extent these differences are permanent in nature, such amounts are reclassified at the end of the year within the components of net assets based on their federal tax treatment; temporary differences do not require reclassification. Dividends and distributions, which exceed earnings and profits for the full year for tax purposes, are reported as a tax return of capital.
In accordance with U.S. GAAP requirements regarding accounting for uncertainties in income taxes, management has analyzed the Fund’s tax positions taken or expected to be taken on foreign, federal and state income tax returns for all open tax years and has concluded that no provision for income tax is required in the Fund’s financial statements.
The Fund recognizes interest and penalties, if any, related to uncertain tax positions as income tax expense on the Statement of Operations. For the year ended May 31, 2023, the Fund did not incur any interest or penalties.
As of May 31, 2023, the components of accumulated earnings (losses) on a tax basis were as follows:
| Undistributed Ordinary Income |
Capital and Other Gains (Losses) |
Unrealized Appreciation (Depreciation) |
Total Accumulated Earnings (Losses) |
|||||||||||||
| $ | 10,607,682 | $ | (9,912,732 | ) | $ | (163,833,621 | ) | $ | (163,138,671 | ) | ||||||
The tax character of dividends and distributions declared for the years ended May 31, 2023 and May 31, 2022 were as follows:
| Ordinary Income* | ||||
| 2023 |
$ | 10,275,798 | ||
| 2022 |
23,945,405 | |||
| * | For tax purposes short-term capital gain distributions are considered ordinary income distributions |
At May 31, 2023, for Federal income tax purposes, the Funds have capital loss carryforwards available as shown in the table below, to the extent provided by regulations, to offset future capital gains for an unlimited period. To the extent that these capital loss carryforwards are used to offset future capital gains, it is probable that the capital gains so offset will not be distributed to shareholders.
| Short-Term | Long-Term | Total Amount | ||||||||||
| $ | 2,535,312 | $ | 7,377,420 | $ | 9,912,732 | |||||||
For the fiscal year ended May 31, 2023, the effect of permanent “book/tax” reclassifications to the components of net assets are included below. These differences are primarily due to redemptions-in-kind.
| Distributable earnings (loss) |
Paid-In Capital |
|||||||
| $ | (171,950 | ) | $ | 171,950 | ||||
As of May 31, 2023, the aggregate cost of investments for federal income tax purposes, the net unrealized appreciation or depreciation and the aggregated gross unrealized appreciation (depreciation) on investments were as follows:
| Aggregate Tax Cost |
Net Unrealized Appreciation (Depreciation) |
Aggregate Gross Unrealized Appreciation |
Aggregate Gross Unrealized (Depreciation) |
|||||||||||||
| $ | 733,061,305 | $ | (163,435,980 | ) | $ | 8,468,543 | $ | (171,904,523 | ) | |||||||
24
DBX ETF Trust
Notes to Financial Statements (Continued)
Foreign Taxes The Fund may be subject to foreign taxes (a portion of which may be reclaimable) on income, capital gains on investments, certain foreign currency transactions or other corporate events. All foreign taxes are recorded in accordance with the applicable foreign tax regulations and rates that exist in the foreign jurisdictions in which the Fund invest. These foreign taxes, if any, are paid by the Fund and are reflected in their Statements of Operations as follows: foreign taxes withheld at source are presented as a reduction of income, foreign taxes on capital gains from sales of investments and foreign currency transactions are included in their respective net realized gain (loss) categories, and deferred foreign taxes on unrealized gains are included in net change in unrealized appreciation (depreciation). Receivables and payables related to foreign taxes as of May 31, 2023, if any, are disclosed in the Fund’s Statements of Assets and Liabilities.
Foreign Currency Translations The books and records of the Fund are maintained in U.S. dollars. Investment securities and other assets and liabilities denominated in a foreign currency are translated into U.S. dollars at the prevailing exchange rates at period end. Purchases and sales of investment securities, income and expenses are translated into U.S. dollars at the prevailing exchange rates on the respective dates of the transactions.
Net realized and unrealized gains and losses on foreign currency transactions represent net gains and losses between trade and settlement dates on securities transactions, the acquisition and disposition of foreign currencies, and the difference between the amount of net investment income accrued and the U.S. dollar amount actually received. The portion of both realized and unrealized gains and losses on investments that results from fluctuations in foreign currency exchange rates is not separately disclosed, but is included with net realized and unrealized gain/appreciation and loss/depreciation on investments.
Securities Lending The Fund may lend securities to certain financial institutions under the terms of its securities lending agreement. During the term of the loans, the Fund continues to receive interest and dividends generated by the securities and to participate in any changes in their market value. The Fund requires the borrowers of the securities to maintain collateral with the Fund consisting of cash and/or securities issued or guaranteed by the U.S. Government, its agencies or instrumentalities having a value at least equal to the value of the securities loaned. When the collateral falls below specified amounts, the lending agent will use its best effort to obtain additional collateral on the next business day to meet required amounts under the securities lending agreement. During the year ended May 31, 2023, the Fund invested the cash collateral into a joint trading account in DWS Government & Agency Securities Portfolio, an affiliated money market fund managed by DWS Investment Management Americas, Inc. DWS Investment Management Americas, Inc. receives a management/administration fee (0.08% annualized effective rate as of May 31, 2023) on the cash collateral invested in DWS Government & Agency Securities Portfolio. The Fund receives compensation for lending its securities either in the form of fees or by earning interest on invested cash collateral, net of borrower rebates and fees paid to a lending agent. Either the Fund or the borrower may terminate the loan at any time and the borrower, after notice, is required to return borrowed securities within a standard time period. There may be risks of delay and costs in recovery of securities or even loss of rights in the collateral should the borrower of the securities fail financially. If the Fund is not able to recover securities lent, the Fund may sell the collateral and purchase a replacement investment in the market, incurring the risk that the value of the replacement security is greater than the value of the collateral. The Fund is also subject to all investment risks associated with the reinvestment of any cash collateral received, including, but not limited to, interest rate, credit and liquidity risk associated with such investments.
As of May 31, 2023, the Fund had securities on loan. The value of the related collateral exceeded the value of the securities loaned at period end.
| Remaining Contractual Maturity of the Agreements, as of November 30, 2023 |
||||||||||||||||||||
| Securities Lending Transactions | Overnight and Continuous |
<30 Days | Between 30 & 90 days |
>90 days | Total | |||||||||||||||
| Common Stocks |
$ | 13,660,219 | $ | — | $ | 440,268 | $ | 32,686,711 | $ | 46,787,198 | ||||||||||
|
|
|
|
|
|
|
|
|
|
|
|||||||||||
| Gross amount of recognized liabilities and non-cash collateral for securities lending transactions |
|
$ | 46,787,198 | |||||||||||||||||
Derivatives
Futures Contracts The Fund may enter into futures contracts. These futures contracts will be used to simulate investment in the respective Underlying Index, to facilitate trading or to reduce transaction costs. The Fund will
25
DBX ETF Trust
Notes to Financial Statements (Continued)
enter into futures contracts that are traded on a U.S. or non-U.S. exchange. The Fund will not use futures for speculative purposes. Futures contracts provide for the future sale by one party and purchase by another party of a specified amount of a specific instrument or index at a specified future time and at a specified price. For the year ended May 31, 2023, the Fund utilized futures in order to simulate investment in the Fund’s Underlying Index. To the extent required by law, liquid assets committed to futures contracts will be maintained.
At the time the Fund enters into a futures contract, the Fund deposits and maintains as collateral an initial margin with the broker, as required by the exchange on which the transaction is affected. Pursuant to the contract, the Fund agrees to receive from or pay to the broker an amount of cash equal to the daily fluctuation in the value of the contract. Such receipts or payments are known as variation margin and are recorded by the Fund as unrealized gains or losses. Risks may arise from the potential inability of a counterparty to meet the terms of the contract. The credit/counterparty risk for exchange-traded futures contracts is generally less than privately negotiated futures contracts, since the clearinghouse, which is the issuer or counterparty to each exchange-traded future, provides a guarantee of performance. The guarantee is supported by a daily payment system (i.e., margin requirements).
Use of long futures contracts subjects the Fund to risk of loss in excess of the amounts shown on the Statement of Assets and Liabilities, up to the notional value of the futures contracts. Use of short futures contracts subjects the Fund to unlimited risk of loss. Under some circumstances, futures exchanges may establish daily limits on the amount that the price of a futures contract can vary from the previous day’s settlement price, which could effectively prevent liquidation of unfavorable positions.
A summary of the open futures contracts as of May 31, 2023 is included in a table following the Fund’s Schedule of Investments.
The following table summarizes the value of the Fund’s derivative instruments held as of May 31, 2023 and the related location in the accompanying Statement of Assets and Liabilities, presented by primary underlying risk exposure:
| Asset Derivatives |
Liability Derivatives |
|||||||||||||
| Equity contracts | Unrealized appreciation on futures contracts* | $ | 122,891 | Unrealized depreciation on futures contracts* | $ | 40,053 | ||||||||
| * | Includes cumulative appreciation or cumulative depreciation on futures contracts as disclosed in the Schedule of Investments. Unsettled variation margin is disclosed separately within the Statement of Assets and Liabilities. |
Additionally, the amount of realized and unrealized gains and losses on derivative instruments recognized in the Fund’s earnings during the year ended May 31, 2023 and the related location in the accompanying Statement of Operations is summarized in the following table by primary underlying risk exposure:
| Net Realized Gain (Loss) from: |
||||
| Futures Contracts — Equity Contracts |
||||
| $ | (131,093 | ) | ||
| Net Change in Unrealized Appreciation (Depreciation) on: |
||||
| Futures Contracts — Equity Contracts |
||||
| $ | 15,857 | |||
For the year ended May 31, 2023 the average monthly volume of derivatives was as follows:
| Futures Contracts (Contract Value) |
||||
| Xtrackers International Real Estate ETF |
$ | 3,770,332 | ||
26
DBX ETF Trust
Notes to Financial Statements (Continued)
Affiliated Cash Management Vehicles The Fund may invest uninvested cash balances in DWS Government Money Market Series and DWS ESG Liquidity Fund, affiliated money market funds which are managed by DWS Investment Management Americas, Inc. (“DIMA”), also an indirect, wholly owned subsidiary of DWS Group GmbH & Co. KGaA. Each affiliated money market fund is managed in accordance with Rule 2a-7 under the 1940 Act, which governs the quality, maturity, diversity and liquidity of instruments in which a money market fund may invest. DWS Government Money Market Series seeks to maintain a stable NAV and DWS ESG Liquidity Fund maintains a floating NAV. The Fund indirectly bears its proportionate share of the expenses of each affiliated money market fund in which it invests. The Advisor will waive an amount of the unitary advisory fee payable to the Advisor by the Funds equal to such acquired fund’s fees and expenses on the Funds’ assets invested in the affiliated money market funds.
3. Investment Advisory and Other Agreements
The Advisor has overall responsibility for the general management and administration of the Fund, subject to the supervision of the Fund’s Board of Trustees. Under an investment advisory agreement between the Trust, on behalf of the Fund, and the Advisor (the “Investment Advisory Agreement”), the Advisor is responsible for arranging sub-advisory, transfer agency, custody, fund administration, and all other non-distribution related services for the Fund to operate.
For its investment advisory services to the Fund, the Advisor is entitled to receive a unitary advisory fee from the Fund based on the Fund’s average daily net assets, computed and accrued daily and payable monthly, at an annual rate equal to 0.12%.
The Advisor for the Fund has contractually agreed, until September 30, 2023, to waive a portion of its unitary advisory fee to the extent necessary to prevent the operating expenses of the Fund (excluding interest expense, taxes, brokerage expenses, distribution fees or expenses, litigation expenses and other extraordinary expenses) from exceeding 0.10% of the Fund’s average daily net assets. This agreement may only be terminated by the Fund’s Board (and may not be terminated by the Advisor) prior to that time. For the year ended May 31, 2023, the Advisor waived $107,496 of the expenses of the Fund.
The Advisor for the Fund has contractually agreed to waive a portion of its unitary advisory fee in an amount equal to the acquired fund’s fees and expenses attributable to the Fund’s investments in affiliated cash management vehicles. For the period from June 1, 2022 through May 31, 2023, the Advisor waived $501 of expenses to the Fund.
Out of the unitary advisory fee, the Advisor pays substantially all expenses of the Fund, including the cost of transfer agency, custody, fund administration, legal, audit and other services and expenses of the Independent Trustees. The Fund is responsible for the payment of, interest expense, acquired fund fees and expenses, taxes, brokerage expenses, distribution fees or expenses, if any, litigation expenses and extraordinary expenses.
The Bank of New York Mellon, a wholly-owned subsidiary of The Bank of New York Mellon Corporation, serves as Administrator, Custodian, Accounting Agent, Lending Agent and Transfer Agent for each Fund.
ALPS Distributors, Inc. (the “Distributor”) serves as the distributor of Creation Units for the Fund on an agency basis. The Distributor does not maintain a secondary market in shares of the Fund.
The Board of Trustees is currently comprised of three Independent Trustees. The Advisor paid retainer fees and attendance fees to each Independent Trustee; retainer fees to the Chairman of the Board of Trustees and Chairman of the Audit Committee; and attendance fees to each member of the Audit Committee (which is comprised of all of the Fund’s Independent Trustees).
4. Investment Portfolio Transactions
For the year ended May 31, 2023, the cost of investments purchased and proceeds from sale of investments (excluding in-kind transactions and short-term investments) were as follows:
| Purchases | Sales | |||||||
| Xtrackers International Real Estate ETF |
$ | 77,744,894 | $ | 45,019,557 | ||||
27
DBX ETF Trust
Notes to Financial Statements (Continued)
For the year ended May 31, 2023, the cost of in-kind purchases and proceeds from in-kind sales were as follows:
| Purchases | Sales | |||||||
| Xtrackers International Real Estate ETF |
$ | 88,540,266 | $ | 3,021,662 | ||||
5. Fund Share Transactions
As of May 31, 2023, there were unlimited Fund shares, no par value, authorized by the Trust. Fund shares are issued and redeemed by the Fund only in Creation Units or multiples thereof. Except when aggregated in Creation Units, shares of the Fund are not redeemable. Transactions in capital shares for the Fund are disclosed in detail in the Statement of Changes in Net Assets. The consideration for the purchase of Creation Units of a Fund generally consists of the in-kind contribution of a designated portfolio of securities constituting a portfolio sampling representation of the securities included in the Fund’s Underlying Index and an amount of cash, which under certain circumstances may include cash in lieu of portfolio securities. Investors purchasing and redeeming Creation Units pay a purchase transaction fee and a redemption transaction fee to offset transfer and other transaction costs associated with the issuance and redemption of Creation Units.
6. Line of Credit
The Trust has entered into a senior unsecured credit facility with a syndication of banks which allows the Xtrackers International Real Estate ETF and certain other funds managed by the Advisor to borrow up to $105 million. The Fund may borrow money under this credit facility to the extent necessary for temporary or emergency purposes, including the funding of shareholder redemption requests, trade settlements, and as necessary to distribute to shareholders any income necessary to maintain the Fund’s status as a regulated investment company. Borrowings are charged an interest rate of 1.25% per annum plus the greater of the Federal Funds Effective Rate or the Secured Overnight Financing Rate plus .10%. The Fund may borrow up to the lesser of 33 percent of its net assets as permitted by the 1940 Act or 25 percent of adjusted total net assets. The Fund had no outstanding loans at May 31, 2023.
28
DBX ETF Trust
To the Shareholders and the Board of Trustees of Xtrackers International Real Estate ETF
Opinion on the Financial Statements
We have audited the accompanying statement of assets and liabilities of Xtrackers International Real Estate ETF (the “Fund”), (one of the funds constituting DBX ETF Trust (the “Trust”)), including the schedule of investments, as of May 31, 2023, and the related statement of operations for the year then ended, the statements of changes in net assets for each of the two years in the period then ended, the financial highlights for each of the five years in the period then ended and the related notes (collectively referred to as the “financial statements”). In our opinion, the financial statements present fairly, in all material respects, the financial position of the Fund (one of the funds constituting DBX ETF Trust) at May 31, 2023, the results of its operations for the year then ended, the changes in its net assets for each of the two years in the period then ended and its financial highlights for each of the five years in the period then ended, in conformity with U.S. generally accepted accounting principles.
Basis for Opinion
These financial statements are the responsibility of the Trust’s management. Our responsibility is to express an opinion on the Fund’s financial statements based on our audits. We are a public accounting firm registered with the Public Company Accounting Oversight Board (United States) (“PCAOB”) and are required to be independent with respect to the Trust in accordance with the U.S. federal securities laws and the applicable rules and regulations of the Securities and Exchange Commission and the PCAOB.
We conducted our audits in accordance with the standards of the PCAOB. Those standards require that we plan and perform the audit to obtain reasonable assurance about whether the financial statements are free of material misstatement, whether due to error or fraud. The Trust is not required to have, nor were we engaged to perform, an audit of the Trust’s internal control over financial reporting. As part of our audits we are required to obtain an understanding of the internal control over financial reporting but not for the purpose of expressing an opinion on the effectiveness of the Trust’s internal control over financial reporting. Accordingly, we express no such opinion.
Our audits included performing procedures to assess the risks of material misstatement of the financial statements, whether due to error or fraud, and performing procedures that respond to those risks. Such procedures included examining, on a test basis, evidence regarding the amounts and disclosures in the financial statements. Our procedures included confirmation of securities owned as of May 31, 2023, by correspondence with the custodians, brokers and others; when replies were not received from brokers, we performed other auditing procedures. Our audits also included evaluating the accounting principles used and significant estimates made by management, as well as evaluating the overall presentation of the financial statements. We believe that our audits provide a reasonable basis for our opinion.

We have served as the auditor of one or more investment companies in the DWS family of funds since at least 1979, but we are unable to determine the specific year.
New York, New York
July 25, 2023
29
DBX ETF Trust
Regulatory Update — Tailored Shareholder Report
Effective January 24, 2023, the SEC amended the rules for mutual fund and exchange-traded fund (“ETF”) annual and semi-annual shareholder reports. The amended rules apply to mutual funds and ETFs that are registered on Form N-1A (i.e., open-end funds) and implement a new streamlined disclosure framework requiring “concise and visually engaging” shareholder reports highlighting key information, including a simplified expense presentation, performance information, portfolio holdings and certain fund statistics. The amended rules seek to simplify shareholder reporting by consolidating investor friendly data in one report and moving other data to Form N-CSR, creating a layered disclosure framework. Certain information from the Fund’s current shareholder reports, including the Fund’s investment portfolio, financial statements and financial highlights, will move to Form N-CSR. This information must be available online, delivered free of charge upon request and filed on a semiannual basis on Form N-CSR. Notably, the amended rules will require mutual funds and ETFs to prepare separate individual shareholder reports for each fund share class. The amendments also include a revised definition of “appropriate broad-based securities market index” that will affect performance presentations in the new streamlined reports and mutual fund and ETF prospectuses. The amended rules and related form amendments have a compliance date of July 24, 2024. At this time, management is evaluating the impact of the amended rules and form amendments on the content of the Fund’s current shareholder reports.
30
DBX ETF Trust
In accordance with Rule 22e-4 (the “Liquidity Rule”) under the Investment Company Act of 1940 (the “1940 Act”), the Fund has adopted a liquidity risk management program (the “Program”), and the Board has designated DBX Advisors LLC (the “Advisor”) as Program administrator. The Program is designed to assess and manage your Fund’s liquidity risk (the risk that the Fund would be unable to meet requests to redeem shares of the Fund without significant dilution of remaining investors’ interests in the Fund). The Advisor has designated a committee (the “Committee”) composed of personnel from multiple departments within an affiliate of the Advisor that is responsible for the implementation and ongoing administration of the Program, which includes assessing the Fund’s liquidity risk under both normal and reasonably foreseeable stressed conditions. Under the Program, every investment held by a Fund is classified on a daily basis into one of four liquidity categories based on estimations of the investment’s ability to be sold during designated timeframes in current market conditions without significantly changing the investment’s market value.
In February 2023, as required by the Program and the Liquidity Rule, the Advisor provided the Board with an annual written report (the “Report”) addressing the operation of the Program and assessing the adequacy and effectiveness of its implementation during the period from December 1, 2021 through November 30, 2022 (the “Reporting Period”). During the Reporting Period, your Fund was primarily invested in highly liquid investments (investments that the Fund anticipates can be converted to cash within three business days or less in current market conditions without significantly changing their market value). As a result, the Fund is not required to adopt, and has not adopted, a “Highly Liquid Investment Minimum” as defined in the Liquidity Rule. During the Reporting Period, your Fund did not approach the 15% limit imposed by the Liquidity Rule on holdings in illiquid investments (investments that cannot be sold or disposed of in seven days or less in current market conditions without the sale of the investment significantly changing the market value of the investment). The Fund did not experience any issues meeting investor redemptions at any time during the Reporting Period. In the Report, the Advisor stated that it believes the Program has operated adequately and effectively to manage the Fund’s liquidity risk during the Reporting Period. The Advisor also reported that there were no material changes made to the Program during the Reporting Period.
31
DBX ETF Trust
Xtrackers International Real Estate ETF
Board Approval of Investment Advisory Agreement with DBX Advisors LLC
After discussions at the meeting of the Board of Trustees (“Board” or “Trustees”) held on February 15-16, 2023 (the “Meeting”), the Trustees, all of whom are the Independent Trustees (those not affiliated with DBX ETF Trust (the “Trust”) or its service providers), unanimously approved the continuance of the Investment Advisory Agreement with respect to Xtrackers International Real Estate ETF (the “Fund”). The Independent Trustees were advised throughout the review and Meeting by K&L Gates LLP (“Independent Trustee Counsel”).
Before reaching their decision to approve the Investment Advisory Agreement for another annual period, the Independent Trustees evaluated the materials furnished to them in advance of the Meeting from DBX Advisors LLC (“DBX” or the “Advisor”) for purposes of reviewing the agreement’s terms, including statistical information prepared by Broadridge Financial Solutions Inc. (“Broadridge”) regarding (a) fee and expense information for the Fund (including the fee and expense components and any amounts waived or reimbursed) as compared to a peer group of other exchange-traded funds (“ETFs”) selected pursuant to Broadridge’s proprietary methodology (each, a “Peer Group”) and (b) the Fund’s tracking error as compared to its underlying index over the previous five years (or since inception, if shorter). The Independent Trustees met with representatives of the Advisor on February 13, 2023 to review financial reports and other information provided by the Advisor and inquire further with regard to the financial information provided, and asked questions of the Advisor during this meeting. The Independent Trustees also took into consideration the discussions they had with management before and during the Meeting and among themselves during their Executive Sessions held on February 15 and February 16, 2023.
The Independent Trustees also noted that they had received and should take into consideration a substantial amount of information furnished throughout the year at regular Board meetings, which information included, among other things, an analysis of the Fund’s investment performance, tracking error and related financial information, presentations given by DBX, as well as its periodic reports on brokerage commissions, portfolio execution and other services provided to the Fund.
In reaching its decision to continue in effect the Investment Advisory Agreement for another annual period, the Board considered all factors it believed relevant, including (1) the nature, extent and quality of the services provided to the Fund and its shareholders; (2) the financial resources of DBX and its resulting ability to perform its obligations under the Investment Advisory Agreement; (3) the competitiveness of the advisory fee; (4) the total cost of the services provided by and the profits realized by the Advisor from its relationship with the Fund; (5) the extent to which economies of scale have been realized, and if the Fund’s shareholders have benefitted from those economies; and (6) fall out benefits, if any, enjoyed by the Advisor.
The Board reached a determination, with the assistance of Independent Trustee Counsel and Vedder Price P.C. (“Trust Counsel”) and through the exercise of its business judgment, that approval of the Investment Advisory Agreement and the compensation to be received thereunder is in the best interests of the Fund and its shareholders as well as consistent with the Board’s duties under state and federal law. The Board reached this conclusion based on multiple factors.
The Board considered the following in determining whether to approve the Investment Advisory Agreement:
Nature, Extent and Quality of Services. The Board reviewed in detail the nature, extent and quality of services provided and the risks incurred by the Advisor under the Investment Advisory Agreement. In doing so, the Board considered the information it had received from and the discussions it had with the Advisor continuously during the prior year, in addition to the information the Advisor had provided in response to the Board’s requests prior to the Meeting. The Board considered that these services include, among other things, furnishing a continuous investment program for the Fund, including arranging for, or implementing, the purchase and sale of portfolio securities, the provision of general corporate services such as portfolio management compliance services and the preparation and filing of certain reports on behalf of the Trust. The Board also considered, among other things, the professional experience, qualifications and performance of the senior management and key professional personnel of the Advisor, including portfolio management.
32
DBX ETF Trust
Board Considerations in Approval of Investment Advisory Contracts (Unaudited) (Continued)
The Board considered that the Advisor provides, at its own expense, office facilities and equipment for use by the Fund and supervisory persons responsible for supervising and monitoring the Trust’s service providers. The Board also considered that the Advisor pays or arranges for the compensation of officers of the Trust who are also officers or employees of the Advisor or one of its DWS Group affiliates, except as may otherwise be determined by the Board. In addition, the Board considered that the Advisor arranges for the provision of transfer agency, custody, fund administration and accounting, and other non-distribution services necessary for the Fund’s operations. The Board also considered that in addition to managing the Fund’s portfolios directly, the Advisor provides oversight of day-to-day operations, including monitoring tracking error, providing services in connection with the creation and redemption of creation units and assistance in meeting legal, compliance and regulatory requirements applicable to the Fund.
The Board considered the information regarding the Fund’s tracking error compared to its underlying index that had been provided by the Advisor and by Broadridge. The Board took note of the detailed information provided by the Advisor throughout the year with respect to the Fund’s tracking error and the sources thereof. The Trustees noted that tracking error for the Fund during the year was in an expected range.
Based on its review, the Board concluded that the nature, extent, and quality of services provided by the Advisor under the Investment Advisory Agreement are reasonable and appropriate in relation to the fees paid to the Advisor, taking special consideration of the fact that the advisory fee is a unitary fee and, as a result, a portion of the unitary advisory fee will be used to compensate the Fund’s service providers. The Board considered the staffing of the Advisor, including the training, qualifications and experience of investment personnel in managing the Fund. The Board also considered the expertise of the Advisor in supervising third party service providers to the Fund, such as the administrator and the custodian, noting the Advisor’s extensive work with these service providers (including onsite due diligence sessions) to conduct such supervision. The Board further considered the compliance program of the Advisor, which supports the Fund’s compliance program.
Advisor’s Financial Resources. In connection with the assessment of the ability of the Advisor to perform its duties under the Investment Advisory Agreement, the Board considered the Advisor’s financial condition and whether it has the resources necessary to carry out its functions. The Board concluded that the Advisor has the financial resources necessary to perform its obligations under the Investment Advisory Agreement.
Reasonableness of Advisory Fee. The Board compared the Fund’s advisory fee and total expenses to those of the other ETFs in its Peer Group. The Board noted that due to the special characteristics of certain Funds, there were limitations faced by Broadridge in providing comparable funds in the Peer Groups and the information in the Broadridge reports accordingly may or may not provide meaningful direct comparisons to the Fund. The Board also noted that the advisory fees and total expenses (after waivers/reimbursements) for the Fund were below or equal to the average and/or median of the ETFs in the Fund’s respective Peer Group compiled by Broadridge.
The Board accordingly noted that the Fund’s fee is competitive with the fees of applicable peer ETFs.
The Board considered that the fee for the Fund is a unitary fee pursuant to which the Advisor pays all of the Fund’s costs (subject to certain specified exceptions). The Board considered that the Fund’s fee had been priced to scale when it was established. The Board also considered that the Fund’s portfolio is managed on a day-to-day basis by the Advisor and that the Advisor also provides oversight of day-to-day operations, including monitoring tracking error, providing services in connection with creation and redemption units and assistance in meeting legal and regulatory requirements applicable to the Fund. Based on its review, the Board concluded that the advisory fee for the Fund is reasonable in light of the services provided.
Costs of Services and Profitability. The Board considered the expenses of the Advisor in developing and rendering services provided to the Fund and the information provided by the Advisor to the Board regarding the Fund’s profitability. The Board considered that the Advisor had provided extensive information about the Advisor’s profitability and the Advisor’s methodology in determining profitability. While the Advisor had provided information about the Advisor’s expenses relating to marketing the Fund, the Board considered the Advisor’s profitability without accounting for such expenses, which reflected that the Fund was not profitable as of this
33
DBX ETF Trust
Board Considerations in Approval of Investment Advisory Contracts (Unaudited) (Continued)
time. The Board considered whether the Advisor would benefit in other ways from its relationships with the Fund and concluded that there were no material fall-out benefits likely to accrue to the Advisor related to the operation of the Fund.
Economies of Scale. The Board considered that the Fund had attracted a substantial amount of assets, but determined that the Fund was not experiencing economies of scale beyond what was reflected in the Fund’s unitary fee, which the Board noted was very competitive. The Board also acknowledged that the concept of economies of scale is a complex subject as to determining with a fair degree of certainty whether economies of scale exist, to what extent they exist, whether scale can result in additional expenses, and alternative ways advisers can share benefits of economies of scale.
Given all the information available to it and considering all material factors, the Board concluded that the Investment Advisory Agreement was fair and reasonable and it was unanimously approved.
34
DBX ETF Trust
Identification and Background
The Board has responsibility for the overall management and operations of the funds, including general supervision of the duties performed by the Advisor and other service providers. Each Board Member serves until his or her successor is duly elected or appointed and qualified. Each officer serves until he or she resigns, is removed, dies, retires or becomes disqualified.
The Trust currently has three Board Members. The three Independent Board Members have no affiliation or business connection with the Advisor or any of its affiliated persons and do not own any stock or other securities issued by the Advisor.
The Independent Board Members of the Trust, their term of office and length of time served, their principal business occupations during the past five years, the number of portfolios in the fund complex (defined below) overseen by each Independent Board Member, and other directorships, if any, held by the Board Members are shown below. The fund complex includes all registered open- and closed-end funds (including all of their portfolios) advised by the Advisor and any registered funds that have an investment advisor that is an affiliated person of the Advisor. As of the date of this shareholder report, the fund complex consists of the funds in the Trust, as well as the registered funds advised by affiliates of the Advisor.
Shareholder Communications to the Board. Shareholders may send communications to the Trust’s Board by addressing the communications directly to the Board (or individual Board Members) and/or otherwise clearly indicating in the salutation that the communication is for the Board (or individual Board Members). The shareholder may send the communication to either the Trust’s office or directly to such Board members c/o 875 Third Avenue, New York, NY 10022. Other shareholder communications received by the Trust not directly addressed and sent to the Board will be reviewed and generally responded to by management. Such communications will be forwarded to the Board at management’s discretion based on the matters contained therein.
| Independent Board Members | ||||||
| Name, Year of Birth, Position with the Trust and Length of Time Served(1) |
Business Experience and Directorships During the Past 5 Years |
Number of Portfolios in Fund Complex Overseen |
Other Directorships Held by Board Member | |||
| Stephen R. Byers (1953) Chairperson since 2016, and Board Member since 2011 (formerly, Lead Independent Board Member, 2015-2016) |
Independent Director (2011- present); Independent Consultant (2014-present); Director of Investment Management, the Dreyfus Corporation (2000-2006) and Vice Chairman and Chief Investment Officer, the Dreyfus Corporation (2002-2006). | 42 | The Arbitrage Funds, Sierra Income Corporation, Mutual Fund Directors Forum | |||
| George O. Elston (1964) Board Member since 2011, Chairperson of the Audit Committee since 2015 |
Chief Financial Officer, EyePoint Pharmaceuticals, Inc. (2019-present); Chief Financial Officer, Enzyvant (2018-2019); Chief Executive Officer, 2X Oncology, Inc. (2017-2018); Senior Vice President and Chief Financial Officer, Juniper Pharmaceuticals, Inc. (2014-2016); Senior Vice President and Chief Financial Officer, KBI BioPharma Inc. (2013-2014); Managing Partner, Chatham Street Partners (2010-2013). | 42 | — | |||
| J. David Officer (1948) Board Member since 2011, Chairperson of the Nominating Committee since 2015 |
Independent Director (2010- present); Vice Chairman, the Dreyfus Corporation (2006-2009); President, The Dreyfus Family of Funds, Inc. (2006-2009). | 42 | (Chairman of) Ilex Management Ltd; Old Westbury Funds | |||
35
DBX ETF Trust
Board Members and Officers (Unaudited) (Continued)
| Officers(2) |
||||||
| Name, Year of Birth, Position with the Trust and Length of Time Served(3) |
Business Experience and Directorships During the Past 5 Years | |||||
| Freddi Klassen(4) (1975) President and Chief Executive Officer, 2016-present |
Chief Administrative Officer Investment Division Americas, of DWS Investment Management Americas, Inc. and Manager (since 2023) and Chief Operating Officer of the Advisor (2016-present). Formerly: Programmes (Head 2021- 2023), of DWS Investment Management Americas, Inc.; Chief Operating Officer in the Americas for the Traditional Asset Classes Department (2014-2020); Global Chief Operating Officer for Equities Technology in the Investment Bank Division at Deutsche Bank AG (2013-2014); Chief Operating Officer for Exchange Traded Funds and Systematic Funds in Europe (2008-2013). | |||||
| Diane Kenneally(4) (1966) Treasurer, Chief Financial Officer and Controller, 2019-present |
Fund Administration Treasurer’s Office (Co-Head since 2018), of DWS Investment Management Americas, Inc.; Chief Financial Officer and Treasurer for DWS US registered investment companies advised by DWS Investment Management Americas, Inc. (2018-present); Treasurer and Chief Financial Officer, The European Equity Fund, Inc., The New Germany Fund, Inc. and The Central and Eastern Europe Fund, Inc. (2018-present); formerly: Assistant Treasurer for the DWS funds (2007-2018). | |||||
| Frank Gecsedi(4) (1967) Chief Compliance Officer, 2010-present |
AFC Compliance US (Senior Team Lead), of DWS Investment Management Americas, Inc.; Compliance Department (2016-present), Vice President in the Deutsche Asset Management Compliance Department at Deutsche Bank AG (2013-2016) and Chief Compliance Officer of the Advisor (2010-present); Chief Compliance Officer of DWS Distributors, Inc. (2019-2022); Vice President in Deutsche Bank’s Global Markets Legal, Risk and Capital Division (2010-2012). | |||||
| Bryan Richards(4) (1978) Vice President, 2016-present |
Portfolio Engineering, Systematic Investments Solutions (Head), of DWS Investment Management Americas, Inc. (2018-present); Portfolio Manager in the Passive Asset Management Department at DWS (2011-present); Primary Portfolio Manager for the PowerShares DB Commodity ETFs (2011-2015). | |||||
| John Millette(5) (1962) Secretary, 2020-present |
Legal (Associate General Counsel), DWS US Retail Legal (2003-present), of DWS Investment Management Americas, Inc.; Vice President and Secretary of DWS US registered investment companies advised by DWS Investment Management Americas, Inc. (1999-present); Chief Legal Officer, DWS Investment Management Americas, Inc. (2015-present); Director and Vice President of DWS Trust Company (2016-present); Vice President, DBX Advisors LLC (2021-present); Secretary, The European Equity Fund, Inc., The New Germany Fund, Inc. and The Central and Eastern Europe Fund, Inc. (2011-present); formerly: Secretary of Deutsche Investment Management Americas Inc. (2015-2017); and Assistant Secretary of DBX ETF Trust (2019-2020). | |||||
36
DBX ETF Trust
Board Members and Officers (Unaudited) (Continued)
| Name, Year of Birth, Position with the Trust and Length of Time Served(3) |
Business Experience and Directorships During the Past 5 Years | |||||
| Caroline Pearson(5) (1962) Assistant Secretary, 2020-present |
Legal (Senior Team Lead), DWS US Retail Legal, of DWS Investment Management Americas, Inc.; Chief Legal Officer of DWS US registered investment companies advised by DWS Investment Management Americas, Inc. (2010-present); Chief Legal Officer, DBX Advisors LLC and DBX Strategic Advisors LLC (2020- present); Chief Legal Officer, The European Equity Fund, Inc., The New Germany Fund, Inc. and The Central and Eastern Europe Fund, Inc. (2012-present); formerly: Secretary, Deutsche AM Distributors, Inc. (2002-2017); Secretary, Deutsche AM Service Company (2010-2017); and Chief Legal Officer, DBXStrategic Advisors LLC (2020-2021). | |||||
| Paul Antosca(5) (1957) Assistant Treasurer, 2019-present |
Fund Administration Tax (Head), of DWS Investment Management Americas, Inc.; Assistant Treasurer for DWS US registered investment companies advised by DWS Investment Management Americas, Inc. (2007-present). | |||||
| Jeffrey Berry(5) (1959) Assistant Treasurer, 2019-present |
Fund Administration (Senior Specialist), of DWS Investment Management Americas, Inc. | |||||
| Sheila Cadogan(5) (1966) Assistant Treasurer, 2019-present |
Fund Administration Treasurer’s Office (Co-Head since 2018), of DWS Investment Management Americas, Inc.; Assistant Treasurer for DWS US registered investment companies advised by DWS Investment Management Americas, Inc. (2017-present); Director and Vice President, DWS Trust Company (2018-present); Assistant Treasurer, The European Equity Fund, Inc., The New Germany Fund, Inc. and The Central and Eastern Europe Fund, Inc. (2018-present). | |||||
| Christina A. Morse(6) (1964) Assistant Secretary, 2017-present |
Vice President at BNY Mellon Asset Servicing (2014- present); Vice President and Counsel at Lord Abbett & Co. LLC (2013-2014). | |||||
| Christian Rijs(4) (1980) Anti-Money Laundering Compliance Officer, since October 21, 2021 |
Senior Team Lead Anti-Financial Crime and Compliance, DWS Investment Management Americas, Inc.; AML Officer, DWS Trust Company (since November 2, 2021); AML Officer, DWS US registered investment companies advised by DWS Investment Management Americas, Inc. (since October 6, 2021); AML Officer, The European Equity Fund, Inc., The New Germany Fund, Inc. and The Central and Eastern Europe Fund, Inc. (since November 12, 2021); formerly: DWS UK & Ireland Head of Anti-Financial Crime and MLRO. | |||||
| (1) | The length of time served is represented by the year in which the Board Member joined the Board. |
| (2) | As a result of their respective positions held with the Advisor and its affiliates, these individuals are considered “interested persons” of the Advisor within the meaning of the 1940 Act. Interested persons receive no compensation from the Funds. |
| (3) | The length of time served is represented by the year in which the officer was first elected to the Trust in such capacity. |
| (4) | Address: 875 Third Avenue, New York, New York 10022. |
| (5) | Address: 100 Summer Street, Boston, MA 02110. |
| (6) | Address: BNY Mellon Asset Servicing, 240 Greenwich Street, New York, NY 10286. |
The Funds’ Statement of Additional Information (“SAI”) includes additional information about the Funds’ Board Members. The SAI is available by calling 855-329-3837, or on the Company’s website at www.Xtrackers.com.
37
DBX ETF Trust
Proxy Voting Policies and Procedures
The Funds’ policies and procedures for voting proxies for portfolio securities and information about how each Fund voted proxies related to its portfolio securities during the most recent 12-month period ended June 30 are available on our Web site — www.Xtrackers.com (click on “Resources” and “Proxy Voting” at the top of the page) — or on the SEC’s Web site — www.sec.gov. To obtain a written copy of the Funds’ policies and procedures without charge, upon request, call us toll free at (855) 329-3837.
Portfolio Holdings Information
The Fund is required to file its complete schedule of portfolio holdings with the SEC for its first and third fiscal quarters on Form N-PORT. Copies of the filings are available without charge, upon request on the SEC’s website at www.sec.gov and are available by calling the Trust at 855-329-3837.
Information about each Fund’s portfolio holdings is available daily at www.Xtrackers.com.
Discount & Premium Information
Information regarding how often shares of the Fund traded on NYSE Arca at a price above (i.e., at a premium) or below (i.e., at a discount) the NAV of the Fund can be found at www.Xtrackers.com.
Tax Information
Form 1099-DIV and other year-end tax information provide shareholders with actual calendar year amounts that should be included in their tax returns. Shareholders should consult their tax advisors.
The Fund designates the following amounts or, if subsequently determined to be different, the maximum allowable for its fiscal year ended May 31, 2023.
| Qualified Dividend Income* |
||||
| 86 | % | |||
| * | The above percentage is based on ordinary income dividends paid to shareholders during each Fund’s fiscal year. |
The Fund intends to elect to pass through to shareholders the credit for taxes paid to foreign countries. The gross foreign source income and foreign taxes paid are as follows:
| Gross Foreign Income |
Foreign Taxes Paid |
|||||||
| $ | 22,398,162 | $ | 1,674,016 | |||||
38
DBX ETF Trust
This report is intended for the shareholders of DBX ETF Trust.
This report must be preceded or accompanied by a prospectus.
Investing involves risk, including possible loss of principal. Stocks may decline in value. Foreign investing involves greater and different risks than investing in U.S. companies, including currency fluctuations, less liquidity, less developed or less efficient trading markets, lack of comprehensive company information, political instability and differing auditing and legal standards. There are special risks associated with an investment in real estate, including REITS. These risks include credit risk, interest rate fluctuations and the impact of varied economic conditions. Investing in foreign securities, particularly those of emerging markets, present certain risks such as currency fluctuations, political and economical changes, and market risks. Any fund that concentrates in a particular segment of the market will generally be more volatile than a fund that invests more broadly. Emerging markets tend to be more volatile and less liquid than the markets of more mature economies and generally have less diverse and less mature economic structures and less stable political systems than those of developed countries. Investing in derivatives entails special risks relating to liquidity, leverage and credit that may reduce returns and/or increase volatility. Performance of a Fund may diverge from that of an Underlying Index due to operating expenses, transaction costs, cash flows, use of sampling strategies or operational inefficiencies. An investment in any Fund should be considered only as a supplement to a complete investment program for those investors willing to accept the risks associated with that fund. Please read the prospectus for more information.
War, terrorism, sanctions, economic uncertainty, trade disputes, public health crises, natural disasters, climate change and related geopolitical events have led and, in the future, may lead to significant disruptions in U.S. and world economies and markets, which may lead to increased market volatility and may have significant adverse effects on the Fund and its investments.
Shares of the Funds are bought and sold at market price (not NAV) throughout the day on the NYSE Arca, Inc. Transactions in Fund shares may result in brokerage commissions and may generate tax consequences. There can be no assurance that an active trading market for shares of a Fund will develop or be maintained.
DBX ETF Trust Funds are distributed by ALPS Distributors, Inc. (“ALPS”). The Funds are managed by DBX Advisors LLC which is not affiliated with ALPS.
The brand DWS represents DWS Group GmbH & Co. KGaA and any of its subsidiaries such as DWS Distributors, Inc. which offers investment products or DWS Investment Management Americas, Inc. and RREEF America L.L.C. which offer advisory services.
The iSTOXX Developed and Emerging Markets ex USA PK VN Real Estate Index is the intellectual property (including registered trademarks) of STOXX Limited, Zug, Switzerland (“STOXX”), Deutsche Börse Group or their licensors, which is used under license. Xtrackers International Real Estate ETF is neither sponsored nor promoted, distributed or in any other manner supported by STOXX, Deutsche Börse Group or their licensors, research partners or data providers and STOXX, Deutsche Börse Group and their licensors, research partners or data providers do not give any warranty, and exclude any liability (whether in negligence or otherwise) with respect thereto generally or specifically in relation to any errors, omissions or interruptions in the Index or its data.
Copyright © 2022 DWS Group. All rights reserved. XtrackersTM is a trademark of DWS Invesment GmbH. All other trademarks, servicemarks or registered trademarks are the property of their respective owners.
Not FDIC Insured | No Bank Guarantee | May Lose Value
DBX ETF Trust
| Investment advisor DBX Advisors LLC 875 Third Avenue New York, NY 10022 |
Administrator, custodian, The Bank of New York Mellon 240 Greenwich Street New York, NY 10286 |
Distributor ALPS Distributors, Inc. 1290 Broadway Suite 1000 Denver, CO 80203 | ||
| Independent registered public accounting firm Ernst & Young LLP One Manhattan West New York, NY, 10001 |
Legal counsel Vedder Price P.C. 1633 Broadway New York, NY 10019 |
|||
R-38754-9 (7/23) DBX005560 (7/24)
May 31, 2023
Annual Report
DBX ETF Trust
Xtrackers Harvest CSI 300 China A-Shares ETF (ASHR)
Xtrackers Harvest CSI 500 China A-Shares Small Cap ETF (ASHS)
Xtrackers MSCI All China Equity ETF (CN)
Xtrackers MSCI China A Inclusion Equity ETF (ASHX)

DBX ETF Trust
| Page | ||||
| 1 | ||||
| 3 | ||||
| 6 | ||||
| 8 | ||||
| 10 | ||||
| 12 | ||||
| 14 | ||||
| 15 | ||||
| 20 | ||||
| 28 | ||||
| 33 | ||||
| 42 | ||||
| 43 | ||||
| 44 | ||||
| 46 | ||||
| 48 | ||||
| 58 | ||||
| 59 | ||||
| 60 | ||||
| Board Considerations in Approval of Investment Advisory and Sub-Advisory Contracts |
61 | |||
| 67 | ||||
| 70 | ||||
To our Shareholders: (Unaudited)
Dear shareholder,
We are pleased to provide this annual report on four of our flagship ETFs tracking China’s equity market for the period ended May 31, 2023.
The global economy witnessed a period of volatility due to heightened inflation, growing interest rates and sluggish industrial activity amid geopolitical tension between Russia and Ukraine. Rising inflation in both developed and emerging economies affected the cost of living as disposable incomes were eroded, resulting in aggressive interest rate hikes by major central banks, except for the Bank of Japan. Global financial markets remained largely volatile with short periods of gains and losses as investors remained uncertain about interest rate actions but acted on positive economic data. Despite the challenges in the banking sectors of the U.S. and Europe during the first quarter of 2023, market sentiment turned positive on the back of China’s reopening after its COVID-19-related restrictions.
China’s economy recovered at a faster-than-expected pace, with GDP1 increasing by 4.5% year on year in Q1 2023, marking the most growth since Q1 2022. Chinese markets had robust gains from the start of Q4 2022, after Beijing loosened the pandemic-related restrictions that had constrained the country’s economic growth since early 2020. Investor confidence was also boosted by measures supportive of the real estate sector and a relaxation of the regulatory restrictions on Chinese technology companies. Market optimism regarding China’s economic recovery was sparked by the country’s stronger-than-expected first-quarter GDP growth and unexpected double-digit export and retail growth in March 2023. China’s urban unemployment rate eased to 5.2% in May 2023 from 5.9% in the same period last year.
On the policy front, the People’s Bank of China (PBoC) maintained its key lending rates steady for the ninth straight month in May 2023. The one-year loan prime rate (the medium-term lending facility for corporate and household loans) was maintained at 3.65%; meanwhile, the five-year rate, which serves as a benchmark for mortgages, was maintained at 4.3%. China’s General Composite PMI2 rose as a result of faster growth in output in both the manufacturing and service sectors.
We believe central banks across the world will remain cautious in their approach to monetary policy and watch for positive signs in the economy before taking any interest rate action. Recent banking system stress and debt ceiling-related concerns are also likely to weigh on the U.S. Federal Reserve’s (Fed’s) decisions in the coming months. Unlike the Fed, the European Central Bank has clearly maintained its stance on monetary action and is willing to hike rates further until inflation is within its comfort range. The entire world will be keenly watching how China recovers from its COVID-19-induced restrictions to induce an uptick in industrial activity and income recovery while boosting private sector investment.
Our team appreciates your trust and looks forward to serving your investment needs through innovative index-driven strategies.
Sincerely,
/s/ Freddi Klassen
Freddi Klassen
President and Chief Executive Officer
1 Gross domestic product (GDP) is the monetary value of all finished goods and services produced within a country’s borders within a specific time period.
2 Purchasing Managers’ Index (PMI) is an index of the prevailing direction of economic trends in the manufacturing and service sectors
Assumptions, estimates and opinions contained in this document constitute our judgment as of the date of the document and are subject to change without notice. Any projections are based on a number of assumptions as to market conditions and there can be no guarantee that any projected results will be achieved. Past performance is not a guarantee of future results.
1
This Page is Intentionally Left Blank
2
DBX ETF Trust
Xtrackers Harvest CSI 300 China A-Shares ETF (ASHR)
The Xtrackers Harvest CSI 300 China A-Shares ETF (ASHR) seeks investment results that correspond generally to the performance, before fees and expenses, of the CSI 300 Index (the ASHR Index). The ASHR Index is designed to reflect price fluctuations and performance of the China A-share market and is composed of the 300 largest and most liquid stocks in the China A-share market. ASHR is sub-advised by Harvest Global Investments. The continued strategic partnership between DWS and Harvest Global Investments provides investors with unique access to the expansive Chinese economy and stock market. For the 12-month period ended May 31, 2023, ASHR shares returned -12.28%, compared with the ASHR Index’s -11.16%.
The majority of the sectors contributed negatively to performance during the period with the greatest negative contribution coming from Materials, Information Technology, and Industrials. The Communication Services sector was the only positive contributor to performance.
Xtrackers Harvest CSI 500 China A-Shares Small Cap ETF (ASHS)
The Xtrackers Harvest CSI 500 China A-Shares Small Cap ETF (ASHS) seeks investment results that correspond generally to the performance, before fees and expenses, of the CSI 500 Index (the ASHS Index). The ASHS Index is designed to reflect the price fluctuation and performance of small-cap companies in the China A-Share market and is composed of the 500 smallest and most liquid stocks in the China A-Share market. ASHS is also sub-advised by Harvest Global Investments. The continued strategic partnership between DWS and Harvest Global Investments provides investors with unique access to the expansive Chinese economy and stock market. For the 12-month period ended May 31, 2023, ASHS fund returned -4.71%, compared with the ASHS Index’s -4.38%.
The majority of the sectors contributed negatively to performance during the period with the greatest negative contribution coming from Materials, Industrials and Consumer Staples. Information Technology, Communication Services and Utilities sectors were the positive contributors to performance.
Xtrackers MSCI All China Equity ETF (CN)
The Xtrackers MSCI All China Equity ETF (CN) seeks investment results that correspond generally to the performance, before fees and expenses, of the MSCI China All Shares Index (the CN Index). The CN Index captures large and midcap representations across China A-shares, H-shares, B-shares, Red chips, and P chips, as well as securities of Chinese companies listed outside of China (e.g. American depository receipts). CN expects to gain exposure to the China A-share components of the index by investing in the Xtrackers Harvest CSI 500 China A-Shares Small Cap ETF, affiliated Fund sub-advised by Harvest Global Investments Limited; and Xtrackers MSCI China A Inclusion Equity ETF, an affiliated Fund advised by DBX Advisors LLC. For the 12-month period ended May 31, 2023, CN returned -13.28%, compared with the CN Index’s -13.25%.
The majority of the sectors contributed negatively to performance during the period with the greatest negative contribution coming from Consumer Discretionary, Materials and Consumer Staples. The Energy sector was the only positive contributor to performance.
MSCI China A Inclusion Equity ETF (ASHX)
The Xtrackers MSCI China A Inclusion Equity ETF (ASHX) seeks investment results that correspond generally to the performance, before fees and expenses, of the MSCI China A Inclusion Index (the ASHX Index). The ASHX Index is designed to track the equity market performance of China A-Shares that are accessible through the Shanghai-Hong Kong Stock Connect program or the Shenzhen-Hong Kong Stock Connect program. China A-Shares are equity securities issued by companies incorporated in mainland China and are denominated in renminbi. For the 12-month period ended May 31, 2023, ASHX returned -12.32%, compared with the ASHX Index’s -11.92%.
The majority of the sectors contributed negatively to performance during the period with the greatest negative contribution coming from Materials, Consumer Staples, and Industrials. The Communication Services sector was the only positive contributor to performance.
*************************
3
DBX ETF Trust
Management’s Discussion of Fund Performance (Unaudited) (Continued)
Performance data quoted represents past performance and does not guarantee future results. Investment returns and principal value of an investment will fluctuate so that an investor’s shares, when sold or redeemed, may be worth more or less than their original cost. Current performance may be lower or higher than the performance data quoted. To obtain the most recent month-end performance data visit www.Xtrackers.com. Returns assume that dividends and capital gains distributions have been reinvested. See pages 6-13 of this report for additional performance information, including performance data based on market value.
The views expressed in this report reflect those of the portfolio management team only through the end of the period of the report as stated on the cover. The management team’s views are subject to change at any time based on market and other conditions and should not be construed as a recommendation. Current and future portfolio holdings are subject to risk.
4
This Page is Intentionally Left Blank
5
DBX ETF Trust
Xtrackers Harvest CSI 300 China A-Shares ETF (ASHR)
The Xtrackers Harvest CSI 300 China A-Shares ETF (the “Fund”), using a “passive” or indexing investment approach, seeks investment results that correspond generally to the performance, before fees and expenses, of the CSI 300 Index (the “Underlying Index”). The Underlying Index is designed to reflect the price fluctuation and performance of the China A-Share market and is composed of the 300 largest and most liquid stocks in the China A-Share market. The MSCI ACWI ex USA Index is designed to provide exposure to equity securities in developed and emerging stock markets (excluding the United States). It is not possible to invest directly into an index.
| Performance as of May 31, 2023 |
| Average Annual Total Return | ||||||||
| Net Asset Value | Market Value | CSI 300 Index | MSCI ACWI ex USA Index | |||||
| One Year |
-12.28% | -12.39% | -11.16% | -1.41% | ||||
| Five Year |
-0.99% | -1.03% | -0.19% | 2.22% | ||||
| Since Inception1 |
4.27% | 4.23% | 5.22% | 3.16% | ||||
| Cumulative Total Returns | ||||||||
| Net Asset Value | Market Value | CSI 300 Index | MSCI ACWI ex USA Index | |||||
| One Year |
-12.28% | -12.39% | -11.16% | -1.41% | ||||
| Five Year |
-4.84% | -5.06% | -0.96% | 11.62% | ||||
| Since Inception1 |
49.21% | 48.69% | 62.78% | 34.74% | ||||
1 Total returns are calculated based on the commencement of operations, November 6, 2013 (“Inception”).
Past performance is no guarantee of future results. Current performance may be lower or higher than the performance data quoted. Performance data current to the most recent month-end is available at www.Xtrackers.com. Performance results assume reinvestment of all dividends and capital gain distributions and do not reflect the deduction of taxes that a shareholder would pay on fund distributions or on the sale of fund shares or redemption of fund creation units. The investment return and principal value of shares will vary with changes in market conditions. Shares may be worth more or less than their original cost when they are sold in the market or redeemed. Performance for certain funds may reflect a waiver of a portion of the unitary advisory fee. Without such waiver, performance would have been lower. The gross expense ratio of the Fund, as stated in the fee table of the prospectus dated October 1, 2022 was 0.65%, and may differ from the expense ratio disclosed in the Financial Highlights table in this report.
The Fund’s net asset value or “NAV” is calculated by dividing the value of the Fund’s total assets less total liabilities by the number of shares outstanding. The price used to calculate market return (“Market Price”) is determined by using the midpoint between the highest bid and the lowest offer on the primary stock exchange on which shares of a fund are listed for trading, as of the time that such fund’s NAV is calculated. Since shares of a fund may not have traded in the secondary market until after the fund’s inception, for the period from inception to the first day of secondary trading, the NAV of the fund is used as a proxy for the Market Price to calculate market returns. Market and NAV returns assume that dividends and capital gain distributions have been reinvested at Market Price and NAV, respectively.
An index is a statistical composite that tracks a specified financial market or sector. Unlike a fund, an index does not actually hold a portfolio of securities and therefore does not incur the expenses incurred by a fund. These expenses negatively impact fund performance. Also, market returns do not include brokerage commissions that may be payable on secondary market transactions. If brokerage commissions were included, market returns would be lower.
Generally accepted accounting principles require adjustments to be made to the net assets of the Fund at period end for financial reporting purposes only, and as such, the total return based on the unadjusted net asset value per share may differ from the total return reported in the financial highlights.
6
DBX ETF Trust
Performance Summary (Unaudited)
Xtrackers Harvest CSI 300 China A-Shares ETF (ASHR) (Continued)
| Growth of an Assumed $10,000 Investment |
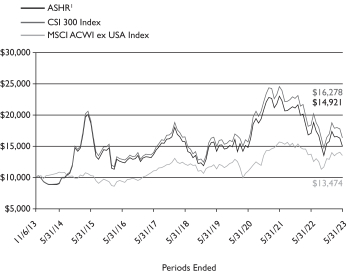
1 Based on Net Asset Value from commencement of operations, November 6, 2013.
| Sector Diversification* as of May 31, 2023 |
| Financials |
22.0% | |||
| Industrials |
16.6% | |||
| Information Technology |
16.2% | |||
| Consumer Staples |
13.2% | |||
| Materials |
9.0% | |||
| Health Care |
7.5% | |||
| Consumer Discretionary |
7.3% | |||
| Utilities |
3.2% | |||
| Energy |
2.0% | |||
| Real Estate |
1.5% | |||
| Communication Services |
1.5% | |||
|
|
|
|||
| Total |
100.0% |
| Ten Largest Equity Holdings as of May 31, 2023 (21.9% of Net Assets) |
| Description | % of Net Assets | |||
| Kweichow Moutai Co. Ltd. |
5.6% | |||
| Contemporary Amperex Technology Co. Ltd. |
3.2% | |||
| Ping An Insurance Group Co. of China Ltd. |
2.8% | |||
| China Merchants Bank Co. Ltd. |
2.2% | |||
| Wuliangye Yibin Co. Ltd. |
1.7% | |||
| Midea Group Co. Ltd. |
1.4% | |||
| Industrial Bank Co. Ltd. |
1.3% | |||
| BYD Co. Ltd. |
1.3% | |||
| China Yangtze Power Co. Ltd. |
1.3% | |||
| Jiangsu Hengrui Pharmaceuticals Co. Ltd. |
1.1% | |||
* As a percent of total investments.
Portfolio holdings and characteristics are subject to change. For more complete details about the Fund’s investment portfolio see page 15.
7
DBX ETF Trust
Performance Summary (Unaudited)
Xtrackers Harvest CSI 500 China A-Shares Small Cap ETF (ASHS)
The Xtrackers Harvest CSI 500 China A-Shares Small Cap ETF (the “Fund”), using a “passive” or indexing investment approach, seeks investment results that correspond generally to the performance, before fees and expenses, of the CSI 500 Index (the “Underlying Index”). The Underlying Index is designed to reflect the price fluctuation and performance of small-cap companies in the China A-Share market and is composed of the 500 smallest and most liquid stocks in the China A-Share market. The MSCI ACWI ex USA Index is designed to provide exposure to equity securities in developed and emerging stock markets (excluding the United States). It is not possible to invest directly into an index.
| Performance as of May 31, 2023 |
| Average Annual Total Return | ||||||||
| Net Asset Value | Market Value | CSI 500 Index | MSCI ACWI ex USA Index | |||||
| One Year |
-4.71% | -4.30% | -4.38% | -1.41% | ||||
| Five Year |
-0.60% | -0.68% | 0.18% | 2.22% | ||||
| Since Inception1 |
3.59% | 3.64% | 5.09% | 2.84% | ||||
| Cumulative Total Returns | ||||||||
| Net Asset Value | Market Value | CSI 500 Index | MSCI ACWI ex USA Index | |||||
| One Year |
-4.71% | -4.30% | -4.38% | -1.41% | ||||
| Five Year |
-2.95% | -3.35% | 0.92% | 11.62% | ||||
| Since Inception1 |
37.53% | 38.14% | 56.65% | 28.79% | ||||
1 Total returns are calculated based on the commencement of operations, May 21, 2014 (“Inception”).
Past performance is no guarantee of future results. Current performance may be lower or higher than the performance data quoted. Performance data current to the most recent month-end is available at www.Xtrackers.com. Performance results assume reinvestment of all dividends and capital gain distributions and do not reflect the deduction of taxes that a shareholder would pay on fund distributions or on the sale of fund shares or redemption of fund creation units. The investment return and principal value of shares will vary with changes in market conditions. Shares may be worth more or less than their original cost when they are sold in the market or redeemed. Performance for certain funds may reflect a waiver of a portion of the unitary advisory fee. Without such waiver, performance would have been lower. The gross expense ratio of the Fund, as stated in the fee table of the prospectus dated October 1, 2022, was 0.65%, and may differ from the expense ratio disclosed in the Financial Highlights table in this report.
The Fund’s net asset value or “NAV” is calculated by dividing the value of the Fund’s total assets less total liabilities by the number of shares outstanding. The price used to calculate market return (“Market Price”) is determined by using the midpoint between the highest bid and the lowest offer on the primary stock exchange on which shares of a fund are listed for trading, as of the time that such fund’s NAV is calculated. Since shares of a fund may not have traded in the secondary market until after the fund’s inception, for the period from inception to the first day of secondary trading, the NAV of the fund is used as a proxy for the Market Price to calculate market returns. Market and NAV returns assume that dividends and capital gain distributions have been reinvested at Market Price and NAV, respectively.
An index is a statistical composite that tracks a specified financial market or sector. Unlike a fund, an index does not actually hold a portfolio of securities and therefore does not incur the expenses incurred by a fund. These expenses negatively impact fund performance. Also, market returns do not include brokerage commissions that may be payable on secondary market transactions. If brokerage commissions were included, market returns would be lower.
Generally accepted accounting principles require adjustments to be made to the net assets of the Fund at period end for financial reporting purposes only, and as such, the total return based on the unadjusted net asset value per share may differ from the total return reported in the financial highlights.
8
DBX ETF Trust
Performance Summary (Unaudited)
Xtrackers Harvest CSI 500 China A-Shares Small Cap ETF (ASHS) (Continued)
| Growth of an Assumed $10,000 Investment |

1 Based on Net Asset Value from commencement of operations, May 21, 2014.
| Sector Diversification* as of May 31, 2023 |
| Information Technology |
19.8% | |||
| Materials |
19.8% | |||
| Industrials |
14.8% | |||
| Health Care |
11.6% | |||
| Financials |
8.6% | |||
| Consumer Discretionary |
6.6% | |||
| Consumer Staples |
6.2% | |||
| Communication Services |
4.2% | |||
| Utilities |
3.4% | |||
| Real Estate |
2.6% | |||
| Energy |
2.4% | |||
|
|
|
|||
| Total |
100.0% |
| Ten Largest Equity Holdings as of May 31, 2023 (6.3% of Net Assets) |
| Description | % of Net Assets | |||
| Zhongji Innolight Co. Ltd. |
1.0% | |||
| Kunlun Tech Co. Ltd. |
0.8% | |||
| Cambricon Technologies Corp. Ltd. |
0.8% | |||
| Zhejiang Supcon Technology Co. Ltd. |
0.6% | |||
| Huagong Tech Co. Ltd. |
0.6% | |||
| Sichuan Kelun Pharmaceutical Co. Ltd. |
0.5% | |||
| Suzhou Dongshan Precision Manufacturing Co. Ltd. |
0.5% | |||
| GEM Co. Ltd. |
0.5% | |||
| Zhongjin Gold Corp. Ltd. |
0.5% | |||
| Wintime Energy Co. Ltd. |
0.5% | |||
* As a percentage of total investments.
Portfolio holdings and characteristics are subject to change. For more complete details about the Fund’s investment portfolio see page 20.
9
DBX ETF Trust
Performance Summary (Unaudited)
Xtrackers MSCI All China Equity ETF (CN)
The Xtrackers MSCI All China Equity ETF (the “Fund”), using a “passive” or indexing investment approach, seeks investment results that correspond generally to the performance, before fees and expenses, of the MSCI China All Shares Index (the “Underlying Index”). The Underlying Index is designed to capture large- and mid-capitalization representation across all China securities listed in Hong Kong, Shanghai and Shenzhen. The Underlying Index includes A-Shares, H-Shares, B-Shares, Red chips and P chips share classes, as well as securities of Chinese companies listed outside of China (e.g. American depository receipts). The Fund expects to obtain exposure to the A-Share components of the Underlying Index indirectly by investing in the Xtrackers MSCI China A Inclusion Equity ETF, an affiliated fund advised by DBX Advisors LLC (the “Advisor”). The Fund may also invest in Xtrackers Harvest CSI 300 China A-Shares ETF and Xtrackers Harvest CSI 500 China A-Shares Small Cap ETF or other affiliated funds advised by the Advisor and sub-advised by Harvest Global Investments Limited. It is not possible to invest directly into an index.
| Performance as of May 31, 2023 |
| Average Annual Total Return | ||||||
| Net Asset Value | Market Value | MSCI China All Shares Index | ||||
| One Year |
-13.28% | -12.90% | -13.25% | |||
| Five Year |
-4.60% | -4.69% | -4.12% | |||
| Since Inception1 |
4.92% | 4.90% | 4.36% | |||
| Cumulative Total Returns | ||||||
| Net Asset Value | Market Value | MSCI China All Shares Index | ||||
| One Year |
-13.28% | -12.90% | -13.25% | |||
| Five Year |
-20.96% | -21.37% | -18.99% | |||
| Since Inception1 |
54.69% | 54.45% | 47.45% | |||
1 Total returns are calculated based on the commencement of operations, April 30, 2014 (“Inception”).
Past performance is no guarantee of future results. Current performance may be lower or higher than the performance data quoted. Performance data current to the most recent month-end is available at www.Xtrackers.com. Performance results assume reinvestment of all dividends and capital gain distributions and do not reflect the deduction of taxes that a shareholder would pay on fund distributions or on the sale of fund shares or redemption of fund creation units. The investment return and principal value of shares will vary with changes in market conditions. Shares may be worth more or less than their original cost when they are sold in the market or redeemed. Performance for certain funds may reflect a waiver of a portion of the unitary advisory fee. Without such waiver, performance would have been lower. The gross expense ratio of the Fund, as stated in the fee table of the prospectus dated October 1, 2022, was 0.79%, and may differ from the expense ratio disclosed in the Financial Highlights table in this report. This expense ratio includes net expenses of the affiliated funds in which CN invests.
The Fund’s net asset value or “NAV” is calculated by dividing the value of the Fund’s total assets less total liabilities by the number of shares outstanding. The price used to calculate market return (“Market Price”) is determined by using the midpoint between the highest bid and the lowest offer on the primary stock exchange on which shares of a fund are listed for trading, as of the time that such fund’s NAV is calculated. Since shares of a fund may not have traded in the secondary market until after the fund’s inception, for the period from inception to the first day of secondary trading, the NAV of the fund is used as a proxy for the Market Price to calculate market returns. Market and NAV returns assume that dividends and capital gain distributions have been reinvested at Market Price and NAV, respectively.
An index is a statistical composite that tracks a specified financial market or sector. Unlike a fund, an index does not actually hold a portfolio of securities and therefore does not incur the expenses incurred by a fund. These expenses negatively impact fund performance. Also, market returns do not include brokerage commissions that may be payable on secondary market transactions. If brokerage commissions were included, market returns would be lower.
Generally accepted accounting principles require adjustments to be made to the net assets of the Fund at period end for financial reporting purposes only, and as such, the total return based on the unadjusted net asset value per share may differ from the total return reported in the financial highlights.
10
DBX ETF Trust
Performance Summary (Unaudited)
Xtrackers MSCI All China Equity ETF (CN) (Continued)
| Growth of an Assumed $10,000 Investment |
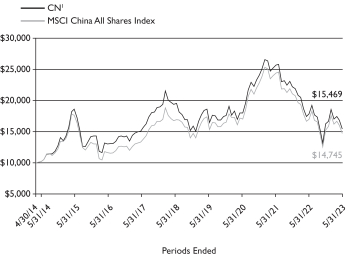
1 Based on Net Asset Value from commencement of operations, April 30, 2014.
| Sector Diversification* as of May 31, 2023 |
| Consumer Discretionary |
18.5% | |||
| Financials |
17.3% | |||
| Communication Services |
11.9% | |||
| Industrials |
10.0% | |||
| Information Technology |
9.9% | |||
| Consumer Staples |
9.1% | |||
| Health Care |
7.4% | |||
| Materials |
7.1% | |||
| Utilities |
3.2% | |||
| Energy |
3.1% | |||
| Real Estate |
2.5% | |||
|
|
|
|||
| Total |
100.0% |
| Ten Largest Equity and ETF Holdings as of May 31, 2023 (72.2% of Net Assets) |
| Description | % of Net Assets | |||
| Xtrackers MSCI China A Inclusion Equity ETF |
47.3% | |||
| Tencent Holdings Ltd. |
7.5% | |||
| Alibaba Group Holding Ltd. |
5.0% | |||
| Xtrackers Harvest CSI 500 China A-Shares Small Cap ETF |
4.0% | |||
| Meituan |
2.2% | |||
| China Construction Bank Corp. |
1.9% | |||
| Ping An Insurance Group Co. of China Ltd. |
1.2% | |||
| JD.com, Inc. |
1.1% | |||
| Baidu, Inc. |
1.0% | |||
| NetEase, Inc. |
1.0% | |||
* As a percentage of total investments excluding securities lending collateral and cash equivalents. Sector percentages include the sector allocations of the Fund’s investment in Xtrackers MSCI China A Inclusion Equity ETF and Xtrackers Harvest CSI 500 China A-Shares Small Cap ETF
Portfolio holdings and characteristics are subject to change. For more complete details about the Fund’s investment portfolio see page 28.
11
DBX ETF Trust
Performance Summary (Unaudited)
Xtrackers MSCI China A Inclusion Equity ETF (ASHX)
The Xtrackers MSCI China A Inclusion Equity ETF (the “Fund”), using a “passive” or indexing investment approach, seeks investment results that correspond generally to the performance, before fees and expenses, of the MSCI China A Inclusion Index (the “Underlying Index”). The Underlying Index is designed to track the equity market performance of China A-Shares that are accessible through the Shanghai-Hong Kong Stock Connect program or the Shenzhen-Hong Kong Stock Connect program. China A-Shares are equity securities issued by companies incorporated in mainland China and are denominated in renminbi. The MSCI ACWI ex USA Index is designed to provide exposure to equity securities in developed and emerging stock markets (excluding the United States). It is not possible to invest directly into an index.
| Performance as of May 31, 2023 |
| Average Annual Total Return | ||||||||
| Net Asset Value | Market Value | MSCI China A Inclusion Index2 |
MSCI ACWI ex USA Index | |||||
| One Year |
-12.32% | -11.76% | -11.92% | -1.41% | ||||
| Five Year |
1.06% | 1.13% | 1.51% | 2.22% | ||||
| Since Inception1 |
1.28% | 1.32% | 0.94% | 4.51% | ||||
| Cumulative Total Returns | ||||||||
| Net Asset Value | Market Value | MSCI China A Inclusion Index2 |
MSCI ACWI ex USA Index | |||||
| One Year |
-12.32% | -11.76% | -11.92% | -1.41% | ||||
| Five Year |
5.40% | 5.78% | 7.78% | 11.62% | ||||
| Since Inception1 |
10.14% | 10.52% | 7.39% | 39.98% | ||||
1 Total returns are calculated based on the commencement of operations, October 20, 2015 (“Inception”).
2 On June 4, 2018, the Fund changed its Underlying Index from CSI 300 USD Hedged Index to the Underlying Index. Returns reflect performance for the CSI 300 USD Hedged Index prior to June 4, 2018. Past performance may have been different if the Fund’s current investment strategy had been in effect.
Past performance is no guarantee of future results. Current performance may be lower or higher than the performance data quoted. Performance data current to the most recent month-end is available at www.Xtrackers.com. Performance results assume reinvestment of all dividends and capital gain distributions and do not reflect the deduction of taxes that a shareholder would pay on fund distributions or on the sale of fund shares or redemption of fund creation units. The investment return and principal value of shares will vary with changes in market conditions. Shares may be worth more or less than their original cost when they are sold in the market or redeemed. Performance for certain funds may reflect a waiver of a portion of the unitary advisory fee. Without such waiver, performance would have been lower. The gross expense ratio of the Fund, as stated in the fee table of the prospectus dated October 1, 2022, was 0.60%, and may differ from the expense ratio disclosed in the Financial Highlights table in this report. This expense ratio includes net expenses of the affiliated funds in which ASHX invests.
The Fund’s net asset value or “NAV” is calculated by dividing the value of the Fund’s total assets less total liabilities by the number of shares outstanding. The price used to calculate market return (“Market Price”) is determined by using the midpoint between the highest bid and the lowest offer on the primary stock exchange on which shares of a fund are listed for trading, as of the time that such fund’s NAV is calculated. Since shares of a fund may not have traded in the secondary market until after the fund’s inception, for the period from inception to the first day of secondary trading, the NAV of the fund is used as a proxy for the Market Price to calculate market returns. Market and NAV returns assume that dividends and capital gain distributions have been reinvested at Market Price and NAV, respectively.
An index is a statistical composite that tracks a specified financial market or sector. Unlike a fund, an index does not actually hold a portfolio of securities and therefore does not incur the expenses incurred by a fund. These expenses negatively impact fund performance. Also, market returns do not include brokerage commissions that may be payable on secondary market transactions. If brokerage commissions were included, market returns would be lower.
Generally accepted accounting principles require adjustments to be made to the net assets of the Fund at period end for financial reporting purposes only, and as such, the total return based on the unadjusted net asset value per share may differ from the total return reported in the financial highlights.
12
DBX ETF Trust
Performance Summary (Unaudited)
Xtrackers MSCI China A Inclusion Equity ETF (ASHX) (Continued)
| Growth of an Assumed $10,000 Investment |
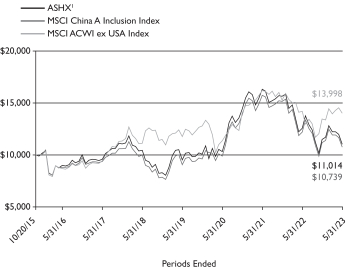
1 Based on Net Asset Value from commencement of operations, October 20, 2015.
| Sector Diversification* as of May 31, 2023 |
| Financials |
18.4% | |||
| Industrials |
15.9% | |||
| Information Technology |
15.1% | |||
| Consumer Staples |
14.1% | |||
| Materials |
11.3% | |||
| Health Care |
8.9% | |||
| Consumer Discretionary |
5.7% | |||
| Utilities |
4.0% | |||
| Energy |
3.1% | |||
| Communication Services |
1.8% | |||
| Real Estate |
1.7% | |||
|
|
|
|||
| Total |
100.0% |
| Ten Largest Equity Holdings as of May 31, 2023 (17.4% of Net Assets) |
| Description | % of Net Assets | |||
| Kweichow Moutai Co. Ltd. |
5.1% | |||
| Contemporary Amperex Technology Co. Ltd. |
2.5% | |||
| China Merchants Bank Co. Ltd. |
1.7% | |||
| Wuliangye Yibin Co. Ltd. |
1.6% | |||
| China Yangtze Power Co. Ltd. |
1.4% | |||
| Ping An Insurance Group Co. of China Ltd. |
1.3% | |||
| BYD Co. Ltd. |
1.2% | |||
| Shenzhen Mindray Bio-Medical Electronics Co. Ltd. |
0.9% | |||
| Industrial Bank Co. Ltd. |
0.9% | |||
| Luzhou Laojiao Co. Ltd. |
0.8% | |||
* As a percent of total investments excluding cash equivalents.
Portfolio holdings and characteristics are subject to change. For more complete details about the Fund’s investment portfolio see page 33.
13
DBX ETF Trust
As a shareholder of one or more of the Funds, you incur two types of costs: (1) transaction costs, including brokerage commissions paid on purchases and sales of fund shares, and (2) ongoing costs, including unitary advisory fees and other fund expenses. In the most recent six-month period Xtrackers MSCI China A Inclusion Equity ETF and Xtrackers MSCI All China Equity ETF limited these expenses; had they not done so, expenses would have been higher. In addition to the ongoing expenses which each Fund bears directly, the Xtrackers MSCI All China Equity ETF shareholders indirectly bear the expenses of Xtrackers MSCI China A Inclusion Equity ETF and Xtrackers Harvest CSI 500 China A-Shares Small Cap ETF (the “Underlying Funds”) in which the Xtrackers MSCI All China Equity ETF invests. The Underlying Funds’ expenses are not included in Xtrackers MSCI All China Equity ETF’s annualized expense ratios used to calculate the expense estimate in the tables. The expense examples below are intended to help you understand your ongoing costs (in dollars) of investing in the Funds and to compare these costs with the ongoing costs of investing in other funds.
The examples in the tables are based on an investment of $1,000 invested at the beginning of the six-month period and held for the entire period (December 1, 2022 to, May 31, 2023).
Actual expenses
The first line in the following tables provides information about actual account values and actual expenses. You may use the information in this line, together with the amount you invested, to estimate the expenses that you paid over the period. Simply divide your account value by $1,000 (for example, an $8,600 account value divided by $1,000 = 8.6), then multiply the result by the number in the first line under the heading “Expenses Paid During the Period” to estimate the expenses you paid on your account during this period.
Hypothetical example for comparison purposes
The second line in the following tables provides information about hypothetical account values and hypothetical expenses based on the Funds’ actual expense ratios and an assumed rate of return of 5% per year before expenses (which is not the Funds’ actual return). The hypothetical account values and expenses may not be used to estimate the actual ending account balance or expenses you paid for the period. You may use this information to compare the ongoing costs of investing in the Fund and other funds. To do so, compare this 5% hypothetical example with the 5% hypothetical examples that appear in the shareholder reports of the other funds.
Please note that the expenses shown in the tables are meant to highlight your ongoing costs only, and do not reflect any transactional costs. Therefore the second line in the table is useful in comparing ongoing costs only, and will not help you determine the relative total costs of owning different funds. In addition, if these transactional costs were included, your costs would have been higher.
| Beginning Account Value December 1, 2022 |
Ending Account Value May 31, 2023 |
Annualized Expense Ratio |
Expenses Paid During the Period Per $1,000(1) |
|||||||||||||
| Xtrackers Harvest CSI 300 China A-Shares ETF |
| |||||||||||||||
| Actual |
$ | 1,000.00 | $ | 971.50 | 0.65 | % | $ | 3.19 | ||||||||
| Hypothetical (5% return before expenses) |
$ | 1,000.00 | $ | 1,021.69 | 0.65 | % | $ | 3.28 | ||||||||
| Xtrackers Harvest CSI 500 China A-Shares Small Cap ETF |
| |||||||||||||||
| Actual |
$ | 1,000.00 | $ | 975.10 | 0.65 | % | $ | 3.20 | ||||||||
| Hypothetical (5% return before expenses) |
$ | 1,000.00 | $ | 1,021.69 | 0.65 | % | $ | 3.28 | ||||||||
| Xtrackers MSCI All China Equity ETF (2) |
| |||||||||||||||
| Actual |
$ | 1,000.00 | $ | 950.50 | 0.20 | % | $ | 0.97 | ||||||||
| Hypothetical (5% return before expenses) |
$ | 1,000.00 | $ | 1,023.93 | 0.20 | % | $ | 1.01 | ||||||||
| Xtrackers MSCI China A Inclusion Equity ETF |
| |||||||||||||||
| Actual |
$ | 1,000.00 | $ | 960.00 | 0.60 | % | $ | 2.93 | ||||||||
| Hypothetical (5% return before expenses) |
$ | 1,000.00 | $ | 1,021.94 | 0.60 | % | $ | 3.02 | ||||||||
(1) Expenses are equal to each Fund’s annualized expense ratio, multiplied by the average account value over the period, multiplied by 182 (the number of days in the most recent six-month period), then divided by 365.
(2) The Fund invests in other ETFs and indirectly bears its proportionate share of fees and expenses incurred by the Underlying Funds in which the Fund is invested. This ratio does not include these indirect fees and expenses.
14
DBX ETF Trust
Schedule of Investments
Xtrackers Harvest CSI 300 China A-Shares ETF
May 31, 2023
| Number |
Value |
|||||||
| COMMON STOCKS — 99.7% | ||||||||
| Communication Services — 1.5% | ||||||||
| 37 Interactive Entertainment Network Technology Group Co. Ltd., Class A |
1,313,304 | $ | 6,022,866 | |||||
| China United Network Communications Ltd., Class A |
18,110,681 | 12,519,520 | ||||||
| Focus Media Information Technology Co. Ltd., Class A |
9,486,353 | 8,557,011 | ||||||
| Mango Excellent Media Co. Ltd., Class A |
710,589 | 2,921,330 | ||||||
| Zhejiang Century Huatong Group Co. Ltd., Class A* |
5,588,913 | 4,884,335 | ||||||
|
|
|
|||||||
| (Cost $29,465,717) |
34,905,062 | |||||||
|
|
|
|||||||
| Consumer Discretionary — 7.3% | ||||||||
| Beijing Roborock Technology Co. Ltd., Class A |
50,477 | 2,145,817 | ||||||
| BYD Co. Ltd., Class A |
836,195 | 29,802,132 | ||||||
| Changzhou Xingyu Automotive Lighting Systems Co. Ltd., Class A* |
135,424 | 2,016,352 | ||||||
| China Tourism Group Duty Free Corp. Ltd., Class A |
896,448 | 15,504,970 | ||||||
| Chongqing Changan Automobile Co. Ltd., Class A |
4,608,484 | 7,737,734 | ||||||
| Ecovacs Robotics Co. Ltd., Class A |
209,092 | 2,034,147 | ||||||
| Fuyao Glass Industry Group Co. Ltd., Class A |
1,551,644 | 7,072,301 | ||||||
| Great Wall Motor Co. Ltd., Class A* |
1,151,577 | 3,655,081 | ||||||
| Gree Electric Appliances, Inc. of Zhuhai, Class A |
4,155,419 | 19,255,431 | ||||||
| Guangzhou Automobile Group Co. Ltd., Class A |
2,143,482 | 3,068,893 | ||||||
| Haier Smart Home Co. Ltd., Class A |
3,513,308 | 10,603,232 | ||||||
| Huali Industrial Group Co. Ltd., Class A |
141,657 | 787,774 | ||||||
| Huayu Automotive Systems Co. Ltd., Class A |
1,498,654 | 3,676,490 | ||||||
| Huizhou Desay Sv Automotive Co. Ltd., Class A |
264,234 | 4,212,671 | ||||||
| Midea Group Co. Ltd., Class A |
4,472,521 | 32,256,069 | ||||||
| Ningbo Tuopu Group Co. Ltd., Class A |
429,530 | 3,508,178 | ||||||
| Oppein Home Group, Inc., Class A |
173,828 | 2,316,567 | ||||||
| SAIC Motor Corp. Ltd., Class A |
4,429,401 | 8,351,900 | ||||||
| Shandong Linglong Tyre Co. Ltd., Class A |
568,291 | 1,700,741 | ||||||
| Shenzhen Overseas Chinese Town Co. Ltd., Class A |
3,678,557 | 2,455,042 | ||||||
| TCL Technology Group Corp., Class A |
13,602,647 | 7,377,318 | ||||||
| Zhejiang Supor Co. Ltd., Class A |
183,037 | 1,149,824 | ||||||
|
|
|
|||||||
| (Cost $164,879,908) |
170,688,664 | |||||||
|
|
|
|||||||
| Consumer Staples — 13.1% | ||||||||
| Anhui Gujing Distillery Co. Ltd., Class A |
151,199 | 5,351,793 | ||||||
| Chongqing Brewery Co. Ltd., Class A |
218,027 | 2,732,824 | ||||||
| Eastroc Beverage Group Co. Ltd., Class A* |
40,400 | 900,212 | ||||||
| Foshan Haitian Flavouring & Food Co. Ltd., Class A* |
1,276,277 | 10,848,963 | ||||||
| Number |
Value |
|||||||
| Consumer Staples (Continued) | ||||||||
| Guangdong Haid Group Co. Ltd., Class A |
786,441 | $ | 5,109,422 | |||||
| Henan Shuanghui Investment & Development Co. Ltd., Class A |
996,727 | 3,442,278 | ||||||
| Inner Mongolia Yili Industrial Group Co. Ltd., Class A |
5,850,157 | 23,680,920 | ||||||
| Jiangsu King’s Luck Brewery JSC Ltd., Class A* |
595,982 | 4,663,351 | ||||||
| Jiangsu Yanghe Brewery Joint-Stock Co. Ltd., Class A |
548,080 | 10,337,456 | ||||||
| Kweichow Moutai Co. Ltd., Class A |
568,005 | 129,997,309 | ||||||
| Luzhou Laojiao Co. Ltd., Class A |
671,129 | 19,239,236 | ||||||
| Muyuan Foods Co. Ltd., Class A |
2,429,112 | 13,669,034 | ||||||
| New Hope Liuhe Co. Ltd., Class A* |
2,016,027 | 3,192,332 | ||||||
| Shanxi Xinghuacun Fen Wine Factory Co. Ltd., Class A |
445,432 | 13,132,178 | ||||||
| Tsingtao Brewery Co. Ltd., Class A |
325,782 | 4,358,102 | ||||||
| Wens Foodstuffs Group Co. Ltd., Class A |
4,803,754 | 11,352,579 | ||||||
| Wuliangye Yibin Co. Ltd., Class A |
1,761,978 | 39,902,436 | ||||||
| Yihai Kerry Arawana Holdings Co. Ltd., Class A |
548,893 | 3,100,285 | ||||||
| Yunnan Botanee Bio-Technology Group Co. Ltd., Class A |
115,674 | 1,498,654 | ||||||
|
|
|
|||||||
| (Cost $241,791,441) |
306,509,364 | |||||||
|
|
|
|||||||
| Energy — 2.1% | ||||||||
| China Coal Energy Co. Ltd., Class A |
1,661,698 | 1,905,153 | ||||||
| China Oilfield Services Ltd., Class A |
564,285 | 1,119,492 | ||||||
| China Petroleum & Chemical Corp., Class A |
12,439,898 | 11,116,338 | ||||||
| China Shenhua Energy Co. Ltd., Class A |
3,099,745 | 12,294,889 | ||||||
| PetroChina Co. Ltd., Class A |
9,041,941 | 9,528,196 | ||||||
| Shaanxi Coal Industry Co. Ltd., Class A |
3,654,216 | 8,605,102 | ||||||
| Yankuang Energy Group Co. Ltd., Class A |
836,314 | 3,187,917 | ||||||
|
|
|
|||||||
| (Cost $38,125,225) |
47,757,087 | |||||||
|
|
|
|||||||
| Financials — 21.9% | ||||||||
| Agricultural Bank of China Ltd., Class A |
30,249,000 | 14,960,340 | ||||||
| Bank of Beijing Co. Ltd., Class A |
14,188,843 | 9,429,658 | ||||||
| Bank of Chengdu Co. Ltd., Class A |
2,079,856 | 3,673,299 | ||||||
| Bank of China Ltd., Class A |
20,368,500 | 11,161,214 | ||||||
| Bank of Communications Co. Ltd., Class A |
25,919,550 | 21,304,488 | ||||||
| Bank of Hangzhou Co. Ltd., Class A |
2,760,833 | 4,503,603 | ||||||
| Bank of Jiangsu Co. Ltd., Class A* |
11,342,265 | 11,824,737 | ||||||
| Bank of Nanjing Co. Ltd., Class A |
4,904,253 | 5,815,715 | ||||||
| Bank of Ningbo Co. Ltd., Class A |
3,619,551 | 12,510,585 | ||||||
| Bank of Shanghai Co. Ltd., Class A |
9,248,988 | 8,018,020 | ||||||
| China CITIC Bank Corp. Ltd., Class A |
3,437,829 | 3,115,529 | ||||||
| China Construction Bank Corp., Class A |
6,990,328 | 6,285,869 | ||||||
| China Everbright Bank Co. Ltd., Class A |
21,321,573 | 9,436,644 | ||||||
| See Notes to Financial Statements. | 15 |
DBX ETF Trust
Schedule of Investments
Xtrackers Harvest CSI 300 China A-Shares ETF (Continued)
May 31, 2023
| Number |
Value |
|||||||
| Financials (Continued) | ||||||||
| China Galaxy Securities Co. Ltd., Class A |
1,188,117 | $ | 1,896,380 | |||||
| China International Capital Corp. Ltd., Class A |
819,010 | 4,792,830 | ||||||
| China Life Insurance Co. Ltd., Class A |
1,558,085 | 8,174,350 | ||||||
| China Merchants Bank Co. Ltd., Class A |
11,253,984 | 51,073,614 | ||||||
| China Merchants Securities Co. Ltd., Class A |
3,390,835 | 6,627,070 | ||||||
| China Minsheng Banking Corp. Ltd., Class A |
22,718,808 | 12,640,624 | ||||||
| China Pacific Insurance Group Co. Ltd., Class A |
3,174,980 | 12,423,786 | ||||||
| CITIC Securities Co. Ltd., Class A |
8,978,248 | 25,292,617 | ||||||
| CSC Financial Co. Ltd., Class A |
1,211,850 | 4,323,141 | ||||||
| East Money Information Co. Ltd., Class A |
11,652,096 | 22,953,021 | ||||||
| Everbright Securities Co. Ltd., Class A |
1,805,627 | 4,018,565 | ||||||
| Founder Securities Co. Ltd., Class A |
3,976,738 | 3,900,050 | ||||||
| GF Securities Co. Ltd., Class A |
2,720,402 | 5,695,176 | ||||||
| Guosen Securities Co. Ltd., Class A |
2,669,751 | 3,454,762 | ||||||
| Guotai Junan Securities Co. Ltd., Class A |
4,156,432 | 8,643,112 | ||||||
| Haitong Securities Co. Ltd., Class A |
8,853,374 | 11,705,398 | ||||||
| Hithink RoyalFlush Information Network Co. Ltd., Class A |
210,190 | 4,750,003 | ||||||
| Hongta Securities Co. Ltd., Class A |
884,910 | 984,719 | ||||||
| Huatai Securities Co. Ltd., Class A |
4,710,288 | 8,954,329 | ||||||
| Huaxia Bank Co. Ltd., Class A |
6,129,861 | 4,978,130 | ||||||
| Industrial & Commercial Bank of China Ltd., Class A |
32,350,184 | 21,953,899 | ||||||
| Industrial Bank Co. Ltd., Class A |
13,317,670 | 30,986,773 | ||||||
| Industrial Securities Co. Ltd., Class A |
6,377,536 | 5,483,933 | ||||||
| New China Life Insurance Co. Ltd., Class A |
756,260 | 3,909,207 | ||||||
| Orient Securities Co. Ltd., Class A |
4,837,205 | 6,721,691 | ||||||
| People’s Insurance Co. Group of China Ltd., Class A |
3,231,298 | 2,778,537 | ||||||
| Ping An Bank Co. Ltd., Class A |
8,845,121 | 14,416,159 | ||||||
| Ping An Insurance Group Co. of China Ltd., Class A |
9,854,142 | 65,073,543 | ||||||
| Postal Savings Bank of China Co. Ltd., Class A |
10,340,900 | 7,468,085 | ||||||
| SDIC Capital Co. Ltd., Class A |
2,354,749 | 2,444,988 | ||||||
| Shanghai Pudong Development Bank Co. Ltd., Class A |
10,702,249 | 11,052,236 | ||||||
| Shenwan Hongyuan Group Co. Ltd., Class A |
8,466,434 | 5,614,748 | ||||||
| Zheshang Securities Co. Ltd., Class A |
1,799,250 | 2,528,013 | ||||||
| Zhongtai Securities Co. Ltd., Class A |
2,358,175 | 2,256,373 | ||||||
|
|
|
|||||||
| (Cost $496,932,998) |
512,009,563 | |||||||
|
|
|
|||||||
| Health Care — 7.5% | ||||||||
| Aier Eye Hospital Group Co. Ltd., Class A |
3,300,537 | 12,428,170 | ||||||
| Asymchem Laboratories Tianjin Co. Ltd., Class A |
187,033 | 3,463,550 | ||||||
| Number |
Value |
|||||||
| Health Care (Continued) | ||||||||
| Beijing Tongrentang Co. Ltd., Class A |
648,996 | $ | 5,524,980 | |||||
| Beijing Wantai Biological Pharmacy Enterprise Co. Ltd., Class A* |
168,165 | 2,197,386 | ||||||
| Bloomage Biotechnology Corp. Ltd., Class A* |
89,826 | 1,111,774 | ||||||
| Changchun High & New Technology Industry Group, Inc., Class A |
294,721 | 6,600,657 | ||||||
| Chongqing Zhifei Biological Products Co. Ltd., Class A |
732,543 | 7,234,598 | ||||||
| Guangzhou Baiyunshan Pharmaceutical Holdings Co. Ltd., Class A |
691,061 | 3,485,769 | ||||||
| Guangzhou Kingmed Diagnostics Group Co. Ltd., Class A |
264,265 | 2,566,812 | ||||||
| Hangzhou Tigermed Consulting Co. Ltd., Class A* |
483,982 | 5,494,502 | ||||||
| Huadong Medicine Co. Ltd., Class A |
827,380 | 4,526,773 | ||||||
| Hualan Biological Engineering, Inc., Class A |
1,018,680 | 3,224,681 | ||||||
| Imeik Technology Development Co. Ltd., Class A |
100,505 | 6,363,070 | ||||||
| Jafron Biomedical Co. Ltd., Class A |
436,224 | 1,693,473 | ||||||
| Jiangsu Hengrui Pharmaceuticals Co. Ltd., Class A |
4,105,539 | 26,275,218 | ||||||
| Ovctek China, Inc., Class A |
401,227 | 1,572,831 | ||||||
| Pharmaron Beijing Co. Ltd., Class A |
455,142 | 2,948,055 | ||||||
| Shanghai Fosun Pharmaceutical Group Co. Ltd., Class A |
1,155,935 | 5,064,042 | ||||||
| Shanghai RAAS Blood Products Co. Ltd., Class A |
4,542,120 | 4,288,601 | ||||||
| Shenzhen Kangtai Biological Products Co. Ltd., Class A |
601,017 | 2,346,730 | ||||||
| Shenzhen Mindray Bio-Medical Electronics Co. Ltd., Class A |
448,091 | 18,924,050 | ||||||
| Topchoice Medical Corp., Class A* |
204,492 | 3,038,396 | ||||||
| Walvax Biotechnology Co. Ltd., Class A |
1,472,316 | 5,976,355 | ||||||
| WuXi AppTec Co. Ltd., Class A |
1,879,006 | 17,160,475 | ||||||
| Yunnan Baiyao Group Co. Ltd., Class A |
697,664 | 5,278,613 | ||||||
| Zhangzhou Pientzehuang Pharmaceutical Co. Ltd., Class A |
279,922 | 11,964,210 | ||||||
| Zhejiang NHU Co. Ltd., Class A* |
1,687,381 | 3,579,958 | ||||||
|
|
|
|||||||
| (Cost $179,492,973) |
174,333,729 | |||||||
|
|
|
|||||||
| Industrials — 16.5% | ||||||||
| AECC Aviation Power Co. Ltd., Class A |
1,498,836 | 8,371,032 | ||||||
| Air China Ltd., Class A* |
3,354,237 | 4,109,585 | ||||||
| Beijing New Building Materials PLC, Class A |
943,377 | 3,012,815 | ||||||
| Beijing-Shanghai High Speed Railway Co. Ltd., Class A |
23,407,783 | 18,976,839 | ||||||
| China CSSC Holdings Ltd., Class A |
1,729,126 | 7,001,779 | ||||||
| China Eastern Airlines Corp. Ltd., Class A* |
5,227,624 | 3,430,117 | ||||||
| China Energy Engineering Corp. Ltd., Class A |
13,845,177 | 4,668,717 | ||||||
| See Notes to Financial Statements. | 16 |
DBX ETF Trust
Schedule of Investments
Xtrackers Harvest CSI 300 China A-Shares ETF (Continued)
May 31, 2023
| Number |
Value |
|||||||
| Industrials (Continued) | ||||||||
| China National Chemical Engineering Co. Ltd., Class A |
3,543,902 | $ | 4,257,313 | |||||
| China Railway Group Ltd., Class A |
10,007,366 | 11,093,908 | ||||||
| China Southern Airlines Co. Ltd., Class A* |
5,133,166 | 4,522,105 | ||||||
| China State Construction Engineering Corp. Ltd., Class A |
20,264,520 | 16,798,717 | ||||||
| Contemporary Amperex Technology Co. Ltd., Class A |
2,408,667 | 74,849,819 | ||||||
| COSCO SHIPPING Holdings Co. Ltd., Class A |
5,919,396 | 8,682,917 | ||||||
| CRRC Corp. Ltd., Class A |
12,556,899 | 12,420,608 | ||||||
| Daqin Railway Co. Ltd., Class A |
6,218,128 | 6,674,839 | ||||||
| Eve Energy Co. Ltd., Class A |
1,134,073 | 10,197,854 | ||||||
| FAW Jiefang Group Co. Ltd., Class A |
991,587 | 1,128,506 | ||||||
| Ginlong Technologies Co. Ltd., |
191,719 | 2,688,605 | ||||||
| Gongniu Group Co. Ltd., Class A* |
84,459 | 1,796,634 | ||||||
| Gotion High-tech Co. Ltd., Class A |
1,038,156 | 3,881,462 | ||||||
| Han’s Laser Technology Industry Group Co. Ltd., Class A |
822,729 | 2,792,811 | ||||||
| Hoyuan Green Energy Co. Ltd., Class A |
193,116 | 2,095,521 | ||||||
| Jiangsu Hengli Hydraulic Co. Ltd., Class A |
504,420 | 3,866,824 | ||||||
| Metallurgical Corp. of China Ltd., Class A |
7,729,509 | 4,376,680 | ||||||
| Ming Yang Smart Energy Group Ltd., Class A |
1,539,060 | 3,799,401 | ||||||
| NARI Technology Co. Ltd., Class A |
3,205,676 | 12,359,233 | ||||||
| Ningbo Deye Technology Co. Ltd., Class A |
167,940 | 3,195,868 | ||||||
| Ningbo Ronbay New Energy Technology Co. Ltd., Class A |
254,643 | 2,059,398 | ||||||
| Power Construction Corp. of China Ltd., Class A |
6,582,528 | 6,131,886 | ||||||
| Sany Heavy Industry Co. Ltd., Class A |
5,532,637 | 11,411,586 | ||||||
| SF Holding Co. Ltd., Class A |
2,259,791 | 15,027,701 | ||||||
| Shanghai International Airport Co. Ltd., Class A* |
955,273 | 6,254,624 | ||||||
| Shanghai International Port Group Co. Ltd., Class A |
3,298,447 | 2,442,350 | ||||||
| Shanghai M&G Stationery, Inc., Class A |
377,178 | 2,253,344 | ||||||
| Shenzhen Inovance Technology Co. Ltd., Class A |
1,753,071 | 14,554,633 | ||||||
| Sichuan Road & Bridge Group Co. Ltd., Class A |
1,892,000 | 4,040,662 | ||||||
| Spring Airlines Co. Ltd., Class A* |
381,195 | 3,095,728 | ||||||
| Sungrow Power Supply Co. Ltd., Class A |
961,138 | 14,873,686 | ||||||
| Sunwoda Electronic Co. Ltd., Class A |
1,228,858 | 2,748,733 | ||||||
| Suzhou Maxwell Technologies Co. Ltd., Class A |
132,712 | 2,946,151 | ||||||
| TBEA Co. Ltd., Class A |
3,603,711 | 11,326,708 | ||||||
| Weichai Power Co. Ltd., Class A |
5,271,334 | 8,561,821 | ||||||
| Number |
Value |
|||||||
| Industrials (Continued) | ||||||||
| Wuxi Lead Intelligent Equipment Co. Ltd., Class A |
1,045,260 | $ | 4,941,937 | |||||
| XCMG Construction Machinery Co. Ltd., Class A |
5,978,087 | 5,022,861 | ||||||
| Xinjiang Goldwind Science & Technology Co. Ltd., Class A |
2,753,824 | 4,209,717 | ||||||
| YTO Express Group Co. Ltd., Class A |
1,620,444 | 3,503,970 | ||||||
| Yunda Holding Co. Ltd., Class A |
1,311,835 | 2,101,222 | ||||||
| Zhejiang Chint Electrics Co. Ltd., Class A |
1,013,592 | 3,724,111 | ||||||
| Zhejiang Sanhua Intelligent Controls Co. Ltd., Class A |
2,030,701 | 7,415,493 | ||||||
| Zhuzhou CRRC Times Electric Co. Ltd., Class A |
259,820 | 1,670,500 | ||||||
| Zoomlion Heavy Industry Science and Technology Co. Ltd., Class A |
5,097,353 | 4,533,526 | ||||||
|
|
|
|||||||
| (Cost $399,290,729) |
385,902,857 | |||||||
|
|
|
|||||||
| Information Technology — 16.2% | ||||||||
| 360 Security Technology, Inc., Class A |
2,792,268 | 5,472,920 | ||||||
| Advanced Micro-Fabrication Equipment Inc China, Class A* |
416,271 | 10,138,244 | ||||||
| Avary Holding Shenzhen Co. Ltd., Class A |
829,059 | 2,961,070 | ||||||
| Beijing Kingsoft Office Software, Inc., Class A* |
177,375 | 10,766,237 | ||||||
| BOE Technology Group Co. Ltd., Class A* |
38,492,025 | 21,470,841 | ||||||
| Chaozhou Three-Circle Group Co. Ltd., Class A |
1,437,758 | 6,090,612 | ||||||
| China Resources Microelectronics Ltd., Class A |
707,733 | 5,914,639 | ||||||
| China Zhenhua Group Science & Technology Co. Ltd., Class A |
381,600 | 4,943,415 | ||||||
| Flat Glass Group Co. Ltd., Class A |
557,658 | 2,529,235 | ||||||
| Foxconn Industrial Internet Co. Ltd., Class A |
4,062,031 | 10,301,684 | ||||||
| GigaDevice Semiconductor, Inc., Class A |
646,967 | 10,071,860 | ||||||
| Glodon Co. Ltd., Class A |
1,306,759 | 6,303,142 | ||||||
| GoerTek, Inc., Class A |
2,284,291 | 5,899,086 | ||||||
| Guangzhou Shiyuan Electronic Technology Co. Ltd., Class A* |
378,953 | 3,303,809 | ||||||
| Hangzhou First Applied Material Co. Ltd., Class A |
755,029 | 3,250,425 | ||||||
| Hangzhou Silan Microelectronics Co. Ltd., Class A |
921,727 | 4,137,719 | ||||||
| Hundsun Technologies, Inc., Class A |
1,479,094 | 8,828,117 | ||||||
| Iflytek Co. Ltd., Class A |
1,764,995 | 14,817,303 | ||||||
| Ingenic Semiconductor Co. Ltd., Class A |
267,422 | 3,547,716 | ||||||
| Inspur Electronic Information Industry Co. Ltd., Class A* |
1,018,475 | 6,376,514 | ||||||
| JA Solar Technology Co. Ltd., Class A |
1,300,249 | 6,576,833 | ||||||
| JCET Group Co. Ltd., Class A |
1,530,564 | 6,709,557 | ||||||
| Lens Technology Co. Ltd., Class A |
2,164,387 | 3,536,734 | ||||||
| See Notes to Financial Statements. | 17 |
DBX ETF Trust
Schedule of Investments
Xtrackers Harvest CSI 300 China A-Shares ETF (Continued)
May 31, 2023
| Number |
Value |
|||||||
| Information Technology (Continued) | ||||||||
| Lingyi iTech Guangdong Co., Class A* |
3,684,504 | $ | 3,261,425 | |||||
| LONGi Green Energy Technology Co. Ltd., Class A |
5,639,903 | 22,837,754 | ||||||
| Luxshare Precision Industry Co. Ltd., Class A |
4,656,725 | 17,862,039 | ||||||
| Maxscend Microelectronics Co. Ltd., Class A |
317,738 | 3,957,188 | ||||||
| Montage Technology Co. Ltd., Class A |
784,242 | 7,030,052 | ||||||
| National Silicon Industry Group Co. Ltd., Class A* |
1,212,072 | 3,814,733 | ||||||
| NAURA Technology Group Co. Ltd., Class A |
252,221 | 10,753,657 | ||||||
| Ninestar Corp., Class A |
882,231 | 4,847,947 | ||||||
| Qi An Xin Technology Group, Inc., Class A* |
288,523 | 2,408,800 | ||||||
| Sangfor Technologies, Inc., Class A |
243,315 | 4,259,999 | ||||||
| SG Micro Corp., Class A |
250,177 | 3,811,752 | ||||||
| Shanghai Baosight Software Co. Ltd., Class A |
656,730 | 4,893,237 | ||||||
| Shengyi Technology Co. Ltd., Class A |
1,537,081 | 3,295,635 | ||||||
| Shennan Circuits Co. Ltd., Class A |
299,052 | 3,291,683 | ||||||
| Shenzhen Transsion Holdings Co. Ltd., Class A |
329,866 | 5,828,185 | ||||||
| StarPower Semiconductor Ltd., Class A |
76,600 | 2,347,643 | ||||||
| TCL Zhonghuan Renewable Energy Technology Co. Ltd., Class A |
2,435,856 | 12,714,468 | ||||||
| Thunder Software Technology Co. Ltd., Class A |
309,021 | 4,246,339 | ||||||
| Tongwei Co. Ltd., Class A |
2,541,189 | 12,182,426 | ||||||
| Trina Solar Co. Ltd., Class A |
1,039,996 | 5,742,645 | ||||||
| Unigroup Guoxin Microelectronics Co. Ltd., Class A |
665,954 | 8,622,383 | ||||||
| Unisplendour Corp. Ltd., Class A |
1,967,086 | 9,015,609 | ||||||
| Will Semiconductor Co. Ltd. Shanghai, Class A |
716,738 | 10,059,357 | ||||||
| Wingtech Technology Co. Ltd., Class A |
745,126 | 5,224,179 | ||||||
| Wuhan Guide Infrared Co. Ltd., |
1,647,409 | 2,377,167 | ||||||
| Xinjiang Daqo New Energy Co. Ltd., Class A |
342,143 | 2,052,689 | ||||||
| Yealink Network Technology Corp. Ltd., Class A* |
417,023 | 3,105,444 | ||||||
| Yonyou Network Technology Co. Ltd., Class A |
2,000,474 | 5,587,751 | ||||||
| Zhejiang Dahua Technology Co. Ltd., Class A |
2,148,859 | 5,990,146 | ||||||
| Zhejiang Jingsheng Mechanical & Electrical Co. Ltd., Class A |
665,072 | 6,443,038 | ||||||
| ZTE Corp., Class A |
3,093,425 | 15,290,554 | ||||||
|
|
|
|||||||
| (Cost $357,314,300) |
377,103,636 | |||||||
|
|
|
|||||||
| Materials — 8.9% | ||||||||
| Aluminum Corp. of China Ltd., Class A |
7,414,467 | 5,635,922 | ||||||
| Anhui Conch Cement Co. Ltd., Class A |
2,258,616 | 7,952,639 | ||||||
| Baoshan Iron & Steel Co. Ltd., Class A |
8,720,609 | 7,204,634 | ||||||
| Number |
Value |
|||||||
| Materials (Continued) | ||||||||
| Beijing Oriental Yuhong Waterproof Technology Co. Ltd., Class A |
1,856,316 | $ | 6,841,290 | |||||
| Cathay Biotech, Inc., Class A |
168,834 | 1,243,022 | ||||||
| China Jushi Co. Ltd., Class A |
2,312,309 | 4,428,223 | ||||||
| China Northern Rare Earth Group High-Tech Co. Ltd., Class A |
2,019,071 | 6,768,771 | ||||||
| Citic Pacific Special Steel Group Co. Ltd., Class A |
984,852 | 2,088,084 | ||||||
| CMOC Group Ltd., Class A |
6,792,285 | 5,000,748 | ||||||
| CNGR Advanced Material Co. Ltd., Class A* |
178,200 | 1,441,424 | ||||||
| Ganfeng Lithium Group Co. Ltd., Class A |
1,044,967 | 9,102,947 | ||||||
| Guangzhou Tinci Materials Technology Co. Ltd., Class A |
1,078,638 | 6,196,987 | ||||||
| Hengli Petrochemical Co. Ltd., Class A |
1,947,583 | 4,320,817 | ||||||
| Hoshine Silicon Industry Co. Ltd., Class A |
218,308 | 2,066,139 | ||||||
| Huafon Chemical Co. Ltd., Class A |
2,005,402 | 1,893,470 | ||||||
| Inner Mongolia BaoTou Steel Union Co. Ltd., Class A |
21,530,727 | 5,536,019 | ||||||
| Inner Mongolia Junzheng Energy & Chemical Industry Group Co. Ltd., Class A |
3,265,973 | 2,014,489 | ||||||
| Jiangsu Eastern Shenghong Co. Ltd., Class A |
1,819,400 | 2,975,562 | ||||||
| Jiangxi Copper Co. Ltd., Class A |
1,094,401 | 2,844,697 | ||||||
| LB Group Co. Ltd., Class A |
1,361,850 | 3,002,203 | ||||||
| Ningbo Shanshan Co. Ltd., Class A* |
1,039,800 | 2,156,373 | ||||||
| Ningxia Baofeng Energy Group Co. Ltd., Class A |
2,093,174 | 3,573,299 | ||||||
| Qinghai Salt Lake Industry Co. Ltd., Class A* |
4,977,685 | 13,141,410 | ||||||
| Rongsheng Petrochemical Co. Ltd., Class A |
2,802,137 | 4,567,043 | ||||||
| Satellite Chemical Co. Ltd., Class A |
1,565,539 | 2,786,944 | ||||||
| Shandong Gold Mining Co. Ltd., Class A |
1,825,666 | 6,476,950 | ||||||
| Shandong Hualu Hengsheng Chemical Co. Ltd., Class A |
1,429,438 | 5,858,542 | ||||||
| Shandong Nanshan Aluminum Co. Ltd., Class A |
6,802,390 | 2,876,841 | ||||||
| Shanghai Putailai New Energy Technology Co. Ltd., Class A |
946,333 | 4,722,856 | ||||||
| Shanxi Meijin Energy Co. Ltd., Class A |
2,448,367 | 2,466,513 | ||||||
| Shenzhen Dynanonic Co. Ltd., Class A |
180,000 | 2,780,962 | ||||||
| Tianqi Lithium Corp., Class A* |
946,087 | 9,562,893 | ||||||
| Wanhua Chemical Group Co. Ltd., Class A |
1,745,314 | 20,172,051 | ||||||
| Xinjiang Tianshan Cement Co. Ltd., Class A |
661,551 | 791,937 | ||||||
| YongXing Special Materials Technology Co. Ltd., Class A |
249,140 | 2,214,072 | ||||||
| Yunnan Energy New Material Co. Ltd., Class A* |
492,074 | 6,286,047 | ||||||
| Zangge Mining Co. Ltd., Class A |
606,801 | 1,959,224 | ||||||
| See Notes to Financial Statements. | 18 |
DBX ETF Trust
Schedule of Investments
Xtrackers Harvest CSI 300 China A-Shares ETF (Continued)
May 31, 2023
| Number |
Value |
|||||||
| Materials (Continued) | ||||||||
| Zhejiang Huayou Cobalt Co. Ltd., Class A |
1,172,036 | $ | 7,616,237 | |||||
| Zijin Mining Group Co. Ltd., Class A |
13,244,762 | 19,893,429 | ||||||
|
|
|
|||||||
| (Cost $221,309,984) |
208,461,710 | |||||||
|
|
|
|||||||
| Real Estate — 1.5% | ||||||||
| China Merchants Shekou Industrial Zone Holdings Co. Ltd., Class A |
2,917,224 | 5,197,288 | ||||||
| China Vanke Co. Ltd., Class A |
6,241,349 | 12,487,521 | ||||||
| Gemdale Corp., Class A |
2,811,636 | 2,864,078 | ||||||
| Greenland Holdings Corp. Ltd., |
3,357,246 | 1,382,098 | ||||||
| Poly Developments and Holdings Group Co. Ltd., Class A |
6,609,492 | 11,831,104 | ||||||
| Seazen Holdings Co. Ltd., Class A* |
755,843 | 1,484,659 | ||||||
|
|
|
|||||||
| (Cost $41,773,712) |
35,246,748 | |||||||
|
|
|
|||||||
| Utilities — 3.2% | ||||||||
| CGN Power Co. Ltd., Class A |
8,099,779 | 3,539,332 | ||||||
| China Longyuan Power Group Corp. Ltd., Class A |
101,900 | 297,657 | ||||||
| China National Nuclear Power Co. Ltd., Class A |
8,884,901 | 8,788,466 | ||||||
| China Three Gorges Renewables Group Co. Ltd., Class A |
8,160,900 | 6,226,237 | ||||||
| Number |
Value |
|||||||
| Utilities (Continued) | ||||||||
| China Yangtze Power Co. Ltd., Class A |
9,281,595 | $ | 29,355,258 | |||||
| ENN Natural Gas Co. Ltd., Class A |
884,600 | 2,406,246 | ||||||
| GD Power Development Co. Ltd., Class A* |
8,676,453 | 4,973,821 | ||||||
| Huaneng Lancang River Hydropower, Inc., Class A |
2,203,200 | 2,321,683 | ||||||
| Huaneng Power International, Inc., Class A* |
4,139,242 | 5,920,472 | ||||||
| SDIC Power Holdings Co. Ltd., Class A |
3,099,466 | 5,744,067 | ||||||
| Sichuan Chuantou Energy Co. Ltd., Class A |
2,012,467 | 4,213,110 | ||||||
|
|
|
|||||||
| (Cost $61,508,753) |
73,786,349 | |||||||
|
|
|
|||||||
| TOTAL COMMON STOCKS |
2,326,704,769 | |||||||
|
|
|
|||||||
| TOTAL INVESTMENTS — 99.7% (Cost $2,231,885,740) |
$ | 2,326,704,769 | ||||||
| Other assets and liabilities, net — 0.3% |
6,362,559 | |||||||
|
|
|
|||||||
| NET ASSETS — 100.0% |
$ | 2,333,067,328 | ||||||
|
|
|
|||||||
| * | Non-income producing security. |
| JSC: | Joint Stock Company |
Fair Value Measurements
Various inputs are used in determining the value of the Fund’s investments. These inputs are summarized in three broad levels. Level 1 includes quoted prices in active markets for identical securities. Level 2 includes other significant observable inputs (including quoted prices for similar securities, interest rates, prepayment speeds and credit risk). Level 3 includes significant unobservable inputs (including the Fund’s own assumptions in determining the fair value of investments). The level assigned to the securities valuations may not be an indication of the risk or liquidity associated with investing in those securities.
The following is a summary of the inputs used as of May 31, 2023 in valuing the Fund’s investments. For information on the Fund’s policy regarding the valuation of investments, please refer to the Security Valuation section of Note 2 in the accompanying Notes to Financial Statements.
| Assets |
Level 1 | Level 2 | Level 3 | Total | ||||||||||||
| Common Stocks (a) |
$ | 2,326,704,769 | $ | — | $ | — | $ | 2,326,704,769 | ||||||||
|
|
|
|
|
|
|
|
|
|||||||||
| TOTAL |
$ | 2,326,704,769 | $ | — | $ | — | $ | 2,326,704,769 | ||||||||
|
|
|
|
|
|
|
|
|
|||||||||
| (a) | See Schedule of Investments for additional detailed categorizations. |
| See Notes to Financial Statements. | 19 |
DBX ETF Trust
Schedule of Investments
Xtrackers Harvest CSI 500 China A-Shares Small Cap ETF
May 31, 2023
| Number |
Value |
|||||||
| COMMON STOCKS — 99.5% | ||||||||
| Communication Services — 4.1% | ||||||||
| Beijing Enlight Media Co. Ltd., Class A |
32,700 | $ | 40,478 | |||||
| Beijing Jetsen Technology Co. Ltd., Class A* |
56,500 | 49,218 | ||||||
| Bluefocus Intelligent Communications Group Co. Ltd., Class A |
68,800 | 106,043 | ||||||
| China South Publishing & Media Group Co. Ltd., Class A |
21,100 | 40,082 | ||||||
| Chinese Universe Publishing and Media Group Co. Ltd., Class A |
17,389 | 39,165 | ||||||
| G-bits Network Technology Xiamen Co. Ltd., Class A |
1,173 | 92,273 | ||||||
| Inmyshow Digital Technology Group Co. Ltd., Class A |
25,300 | 25,914 | ||||||
| Jiangsu Broadcasting Cable Information Network Corp. Ltd., Class A |
81,300 | 40,095 | ||||||
| Jiangsu Phoenix Publishing & Media Corp. Ltd., Class A |
21,700 | 40,459 | ||||||
| Kunlun Tech Co. Ltd., Class A |
26,800 | 216,027 | ||||||
| Leo Group Co. Ltd., Class A* |
187,695 | 60,919 | ||||||
| NanJi E-Commerce Co. Ltd., Class A |
54,400 | 30,497 | ||||||
| Oriental Pearl Group Co. Ltd., Class A |
57,000 | 66,793 | ||||||
| People.cn Co. Ltd., Class A |
15,500 | 41,813 | ||||||
| Perfect World Co. Ltd., Class A |
38,300 | 98,855 | ||||||
| Wanda Film Holding Co. Ltd., Class A* |
30,300 | 52,321 | ||||||
| Wasu Media Holding Co. Ltd., Class A |
24,500 | 30,774 | ||||||
|
|
|
|||||||
| (Cost $810,272) |
1,071,726 | |||||||
|
|
|
|||||||
| Consumer Discretionary — 6.6% | ||||||||
| Anhui Jianghuai Automobile Group Corp. Ltd., Class A |
49,300 | 80,836 | ||||||
| Anhui Zhongding Sealing Parts Co. Ltd., Class A |
22,800 | 38,570 | ||||||
| Autel Intelligent Technology Corp. Ltd., Class A |
7,822 | 32,630 | ||||||
| Beiqi Foton Motor Co. Ltd., Class A* |
142,400 | 62,224 | ||||||
| Bethel Automotive Safety Systems Co. Ltd., Class A |
7,100 | 70,638 | ||||||
| BTG Hotels Group Co. Ltd., Class A |
18,845 | 52,453 | ||||||
| China Grand Automotive Services Group Co. Ltd., Class A* |
109,400 | 31,664 | ||||||
| Chow Tai Seng Jewellery Co. Ltd., Class A |
12,300 | 29,189 | ||||||
| DongFeng Automobile Co. Ltd., Class A |
23,900 | 18,771 | ||||||
| Easyhome New Retail Group Co. Ltd., Class A* |
53,200 | 28,329 | ||||||
| Guangdong Xinbao Electrical Appliances Holdings Co. Ltd., Class A |
9,117 | 21,059 | ||||||
| Hang Zhou Great Star Industrial Co. Ltd., Class A* |
20,353 | 49,444 | ||||||
| Hangzhou Robam Appliances Co. Ltd., Class A |
13,400 | 43,981 | ||||||
| Hisense Visual Technology Co. Ltd., Class A |
22,200 | 67,687 | ||||||
| HLA Group Corp. Ltd., Class A |
49,600 | 48,992 | ||||||
| Jason Furniture Hangzhou Co. Ltd., Class A |
13,800 | 68,445 | ||||||
| Number |
Value |
|||||||
| Consumer Discretionary (Continued) | ||||||||
| Joyoung Co. Ltd., Class A |
9,201 | $ | 18,565 | |||||
| Keboda Technology Co. Ltd., Class A |
1,500 | 11,263 | ||||||
| KingClean Electric Co. Ltd., Class A |
3,800 | 13,049 | ||||||
| Liaoning Cheng Da Co. Ltd., Class A |
29,258 | 54,222 | ||||||
| Ninebot Ltd.* |
12,408 | 56,973 | ||||||
| Ningbo Huaxiang Electronic Co. Ltd., Class A |
15,000 | 26,598 | ||||||
| Ningbo Joyson Electronic Corp., Class A |
27,220 | 60,618 | ||||||
| Sailun Group Co. Ltd., Class A* |
69,700 | 101,652 | ||||||
| Shanghai Yuyuan Tourist Mart Group Co. Ltd., Class A |
52,500 | 52,447 | ||||||
| Shenzhen Kedali Industry Co. Ltd., Class A |
3,900 | 69,652 | ||||||
| Shenzhen MTC Co. Ltd., Class A* |
63,000 | 44,170 | ||||||
| Sichuan Changhong Electric Co. Ltd., Class A |
104,100 | 66,404 | ||||||
| Songcheng Performance Development Co. Ltd., Class A |
44,500 | 79,405 | ||||||
| Suofeiya Home Collection Co. Ltd., Class A |
17,918 | 39,324 | ||||||
| Tianneng Battery Group Co. Ltd., Class A |
4,139 | 20,441 | ||||||
| Wangfujing Group Co. Ltd., Class A |
22,330 | 65,102 | ||||||
| Wanxiang Qianchao Co. Ltd., Class A |
43,200 | 31,867 | ||||||
| Weifu High-Technology Group Co. Ltd., Class A |
15,700 | 32,978 | ||||||
| Wuchan Zhongda Group Co. Ltd., Class A |
85,800 | 62,084 | ||||||
| Xiamen Intretech, Inc., Class A |
8,630 | 23,342 | ||||||
| Zhejiang Semir Garment Co. Ltd., Class A |
24,300 | 20,691 | ||||||
|
|
|
|||||||
| (Cost $1,845,780) |
1,695,759 | |||||||
|
|
|
|||||||
| Consumer Staples — 6.2% | ||||||||
| Angel Yeast Co. Ltd., Class A |
14,800 | 75,651 | ||||||
| Anhui Kouzi Distillery Co. Ltd., Class A |
9,900 | 75,253 | ||||||
| Anjoy Foods Group Co. Ltd., Class A |
4,900 | 106,113 | ||||||
| Beijing Dabeinong Technology Group Co. Ltd., Class A |
93,962 | 84,889 | ||||||
| Beijing Yanjing Brewery Co. Ltd., Class A |
38,800 | 63,019 | ||||||
| Bestore Co. Ltd., Class A* |
3,500 | 13,818 | ||||||
| Bright Dairy & Food Co. Ltd., Class A |
20,800 | 32,381 | ||||||
| By-health Co. Ltd., Class A |
29,000 | 92,657 | ||||||
| C&S Paper Co. Ltd., Class A* |
22,400 | 36,823 | ||||||
| Chacha Food Co. Ltd., Class A |
8,600 | 50,206 | ||||||
| Chongqing Fuling Zhacai Group Co. Ltd., Class A* |
17,738 | 58,643 | ||||||
| COFCO Sugar Holding Co. Ltd., Class A |
31,100 | 35,351 | ||||||
| DaShenLin Pharmaceutical Group Co. Ltd., Class A |
10,760 | 49,210 | ||||||
| Fujian Sunner Development Co. Ltd., Class A |
21,600 | 57,420 | ||||||
| Hebei Yangyuan Zhihui Beverage Co. Ltd., Class A |
14,500 | 54,946 | ||||||
| Heilongjiang Agriculture Co. Ltd., Class A |
21,400 | 40,200 | ||||||
| Juewei Food Co. Ltd., Class A |
10,300 | 55,384 | ||||||
| Laobaixing Pharmacy Chain JSC, Class A |
8,320 | 38,155 | ||||||
| MeiHua Holdings Group Co. Ltd., Class A |
59,600 | 74,864 | ||||||
| Pengdu Agriculture & Animal Husbandry Co. Ltd., Class A* |
91,020 | 24,170 | ||||||
| See Notes to Financial Statements. | 20 |
DBX ETF Trust
Schedule of Investments
Xtrackers Harvest CSI 500 China A-Shares Small Cap ETF (Continued)
May 31, 2023
| Number |
Value |
|||||||
| Consumer Staples (Continued) | ||||||||
| Proya Cosmetics Co. Ltd., Class A |
5,698 | $ | 96,135 | |||||
| Shanghai Bailian Group Co. Ltd., Class A |
22,300 | 42,800 | ||||||
| Shanghai Bairun Investment Holding Group Co. Ltd., Class A |
14,600 | 69,808 | ||||||
| Shanghai Flyco Electrical Appliance Co. Ltd., Class A |
1,400 | 13,001 | ||||||
| Shanghai Jahwa United Co. Ltd., Class A |
9,664 | 39,010 | ||||||
| Sichuan Teway Food Group Co. Ltd., Class A |
9,259 | 19,709 | ||||||
| Tech-Bank Food Co. Ltd., Class A* |
41,520 | 25,260 | ||||||
| Toly Bread Co. Ltd., Class A |
18,172 | 26,681 | ||||||
| Yantai Changyu Pioneer Wine Co. Ltd., Class A |
3,500 | 14,901 | ||||||
| Yifeng Pharmacy Chain Co. Ltd., Class A |
10,200 | 71,112 | ||||||
| Yuan Longping High-tech Agriculture Co. Ltd., Class A* |
30,454 | 62,729 | ||||||
|
|
|
|||||||
| (Cost $1,771,562) |
1,600,299 | |||||||
|
|
|
|||||||
| Energy — 2.4% | ||||||||
| China Merchants Energy Shipping Co. Ltd., Class A |
91,000 | 73,007 | ||||||
| China Petroleum Engineering Corp. |
51,500 | 28,727 | ||||||
| China Suntien Green Energy Corp. Ltd., Class A |
7,600 | 9,685 | ||||||
| CNOOC Energy Technology & Services Ltd., Class A |
65,200 | 30,230 | ||||||
| COFCO Capital Holdings Co. Ltd., Class A |
26,000 | 29,371 | ||||||
| COSCO SHIPPING Energy Transportation Co. Ltd., Class A* |
39,200 | 61,632 | ||||||
| Inner Mongolia Dian Tou Energy Corp. Ltd., Class A |
21,100 | 39,341 | ||||||
| Jizhong Energy Resources Co. Ltd., Class A |
29,400 | 30,031 | ||||||
| Oriental Energy Co. Ltd., Class A |
25,900 | 30,422 | ||||||
| Pingdingshan Tianan Coal Mining Co. Ltd., Class A |
38,700 | 43,446 | ||||||
| Shan Xi Hua Yang Group New Energy Co. Ltd., Class A |
33,370 | 58,514 | ||||||
| Shanxi Lu’an Environmental Energy Development Co. Ltd., Class A |
33,700 | 88,544 | ||||||
| Sinopec Oilfield Service Corp., Class A* |
128,500 | 37,373 | ||||||
| Yantai Jereh Oilfield Services Group Co. Ltd., Class A* |
14,441 | 49,508 | ||||||
|
|
|
|||||||
| (Cost $480,045) |
609,831 | |||||||
|
|
|
|||||||
| Financials — 8.6% | ||||||||
| AVIC Industry-Finance Holdings Co. Ltd., Class A |
147,400 | 79,942 | ||||||
| Bank of Changsha Co. Ltd., Class A |
56,800 | 64,005 | ||||||
| Bank of Guiyang Co. Ltd., Class A |
83,700 | 66,445 | ||||||
| Bank of Lanzhou Co. Ltd., Class A |
21,500 | 8,670 | ||||||
| Bank of Qingdao Co. Ltd., Class A* |
51,270 | 23,628 | ||||||
| Bank of Suzhou Co. Ltd., Class A |
105,210 | 100,520 | ||||||
| Bank of Xi’an Co. Ltd., Class A |
38,500 | 20,447 | ||||||
| Bank of Zhengzhou Co. Ltd., Class A* |
146,906 | 47,681 | ||||||
| BOC International China Co. Ltd., Class A |
47,300 | 72,306 | ||||||
| Caida Securities Co. Ltd., Class A |
36,900 | 38,521 | ||||||
| Number |
Value |
|||||||
| Financials (Continued) | ||||||||
| Caitong Securities Co. Ltd., Class A |
91,525 | $ | 96,190 | |||||
| Changjiang Securities Co. Ltd., Class A |
108,798 | 91,872 | ||||||
| China Great Wall Securities Co. Ltd., Class A* |
33,700 | 40,011 | ||||||
| Chinalin Securities Co. Ltd., Class A |
8,800 | 16,519 | ||||||
| Chongqing Rural Commercial Bank Co. Ltd., Class A |
179,600 | 99,676 | ||||||
| Dongxing Securities Co. Ltd., Class A |
54,700 | 62,945 | ||||||
| First Capital Securities Co. Ltd., Class A |
96,400 | 79,507 | ||||||
| Guangzhou Yuexiu Capital Holdings Group Co. Ltd., Class A |
41,755 | 39,659 | ||||||
| Guolian Securities Co. Ltd., Class A |
33,700 | 45,455 | ||||||
| Guosheng Financial Holding, Inc., Class A* |
33,787 | 38,214 | ||||||
| Guoyuan Securities Co. Ltd., Class A |
73,800 | 69,474 | ||||||
| Huaan Securities Co. Ltd., Class A |
80,715 | 55,570 | ||||||
| Huaxi Securities Co. Ltd., Class A |
44,500 | 51,895 | ||||||
| Jiangsu Changshu Rural Commercial Bank Co. Ltd., Class A |
78,955 | 78,652 | ||||||
| Jiangsu Financial Leasing Co. Ltd., Class A* |
34,100 | 30,232 | ||||||
| Minmetals Capital Co. Ltd., Class A |
63,800 | 50,110 | ||||||
| Nanjing Securities Co. Ltd., Class A |
63,700 | 76,344 | ||||||
| Polaris Bay Group Co. Ltd., Class A* |
30,300 | 26,395 | ||||||
| Qilu Bank Co. Ltd., Class A |
64,100 | 36,656 | ||||||
| Qingdao Rural Commercial Bank Corp., Class A |
109,200 | 42,500 | ||||||
| Sealand Securities Co. Ltd., Class A |
110,370 | 52,880 | ||||||
| Shaanxi International Trust Co. Ltd., Class A* |
61,990 | 28,045 | ||||||
| Shanxi Securities Co. Ltd., Class A |
62,240 | 50,895 | ||||||
| Sinolink Securities Co. Ltd., Class A |
64,200 | 79,198 | ||||||
| SooChow Securities Co. Ltd., Class A |
113,220 | 114,378 | ||||||
| Southwest Securities Co. Ltd., Class A |
96,600 | 50,491 | ||||||
| Tianfeng Securities Co. Ltd., Class A |
198,500 | 83,670 | ||||||
| Western Securities Co. Ltd., Class A |
77,300 | 70,379 | ||||||
| Xiamen Bank Co. Ltd., Class A |
37,300 | 29,192 | ||||||
| Yongan Futures Co. Ltd., Class A |
5,300 | 12,637 | ||||||
|
|
|
|||||||
| (Cost $2,688,044) |
2,221,806 | |||||||
|
|
|
|||||||
| Health Care — 11.5% | ||||||||
| Anhui Anke Biotechnology Group Co. Ltd., Class A |
33,808 | 47,787 | ||||||
| Apeloa Pharmaceutical Co. Ltd., Class A |
16,700 | 43,526 | ||||||
| Autobio Diagnostics Co. Ltd., Class A |
6,700 | 53,461 | ||||||
| Beijing Tiantan Biological Products Corp. Ltd., Class A |
23,400 | 91,729 | ||||||
| Betta Pharmaceuticals Co. Ltd., Class A* |
7,000 | 55,441 | ||||||
| BGI Genomics Co. Ltd., Class A |
7,000 | 57,920 | ||||||
| CanSino Biologics, Inc., Class A |
1,875 | 23,449 | ||||||
| China Animal Husbandry Industry Co. Ltd., Class A |
14,757 | 25,607 | ||||||
| China Meheco Co. Ltd., Class A |
21,021 | 40,759 | ||||||
| China National Medicines Corp. Ltd., Class A |
10,633 | 59,759 | ||||||
| China Resources Double Crane Pharmaceutical Co. Ltd., Class A |
11,849 | 31,082 | ||||||
| See Notes to Financial Statements. | 21 |
DBX ETF Trust
Schedule of Investments
Xtrackers Harvest CSI 500 China A-Shares Small Cap ETF (Continued)
May 31, 2023
| Number |
Value |
|||||||
| Health Care (Continued) | ||||||||
| China Resources Sanjiu Medical & Pharmaceutical Co. Ltd., Class A |
11,318 | $ | 103,873 | |||||
| Contec Medical Systems Co. Ltd., Class A* |
4,400 | 16,011 | ||||||
| Daan Gene Co. Ltd., Class A* |
27,718 | 47,668 | ||||||
| Dian Diagnostics Group Co. Ltd., Class A |
13,940 | 50,043 | ||||||
| Double Medical Technology, Inc., Class A* |
1,600 | 7,646 | ||||||
| Guangzhou Wondfo Biotech Co. Ltd., Class A |
7,540 | 31,867 | ||||||
| Hainan Poly Pharm Co. Ltd., Class A |
7,399 | 20,231 | ||||||
| Haisco Pharmaceutical Group Co. Ltd., Class A |
6,600 | 22,988 | ||||||
| Hubei Jumpcan Pharmaceutical Co. Ltd., Class A* |
10,600 | 47,227 | ||||||
| Humanwell Healthcare Group Co. Ltd., Class A |
32,000 | 118,068 | ||||||
| Intco Medical Technology Co. Ltd., Class A |
12,920 | 41,462 | ||||||
| iRay Technology Co. Ltd., Class A |
1,363 | 53,752 | ||||||
| Jiangsu Yuyue Medical Equipment & Supply Co. Ltd., Class A |
17,085 | 80,201 | ||||||
| Jilin Aodong Pharmaceutical Group Co. Ltd., Class A |
26,400 | 62,836 | ||||||
| Jinyu Bio-Technology Co. Ltd., Class A |
31,804 | 45,803 | ||||||
| Joincare Pharmaceutical Group Industry Co. Ltd., Class A |
32,556 | 62,804 | ||||||
| Joinn Laboratories China Co. Ltd., Class A |
6,240 | 39,646 | ||||||
| Jointown Pharmaceutical Group Co. Ltd., Class A |
26,300 | 59,936 | ||||||
| Lepu Medical Technology Beijing Co. Ltd., Class A |
37,200 | 129,100 | ||||||
| Livzon Pharmaceutical Group, Inc., Class A* |
10,762 | 59,245 | ||||||
| Maccura Biotechnology Co. Ltd., Class A |
11,800 | 27,091 | ||||||
| Micro-Tech Nanjing Co. Ltd., Class A |
2,621 | 32,716 | ||||||
| Nanjing King-Friend Biochemical Pharmaceutical Co. Ltd., Class A |
13,574 | 25,824 | ||||||
| Porton Pharma Solutions Ltd., Class A |
10,600 | 45,812 | ||||||
| Sansure Biotech, Inc., Class A |
8,028 | 20,439 | ||||||
| Shandong Buchang Pharmaceuticals Co. Ltd., Class A |
15,800 | 50,327 | ||||||
| Shandong Pharmaceutical Glass Co. Ltd., Class A |
14,938 | 54,360 | ||||||
| Shanghai Pharmaceuticals Holding Co. Ltd., Class A |
30,900 | 101,809 | ||||||
| Shenzhen Hepalink Pharmaceutical Group Co. Ltd., Class A |
11,300 | 18,846 | ||||||
| Shenzhen New Industries Biomedical Engineering Co. Ltd., Class A |
9,000 | 75,758 | ||||||
| Shenzhen Salubris Pharmaceuticals Co. Ltd., Class A |
16,100 | 79,333 | ||||||
| Shijiazhuang Yiling Pharmaceutical Co. Ltd., Class A |
23,600 | 95,000 | ||||||
| Sichuan Kelun Pharmaceutical Co. Ltd., Class A |
32,100 | 139,680 | ||||||
| Tasly Pharmaceutical Group Co. Ltd., Class A |
25,700 | 56,981 | ||||||
| Number |
Value |
|||||||
| Health Care (Continued) | ||||||||
| Tianjin Chase Sun Pharmaceutical Co. Ltd., Class A |
59,300 | $ | 53,157 | |||||
| Tianjin Pharmaceutical Da Re Tang Group Corp. Ltd., Class A |
8,462 | 65,023 | ||||||
| Tonghua Dongbao Pharmaceutical Co. Ltd., Class A |
40,600 | 65,601 | ||||||
| Winner Medical Co. Ltd., Class A* |
3,600 | 29,752 | ||||||
| Winning Health Technology Group Co. Ltd., Class A |
48,300 | 67,456 | ||||||
| Yifan Pharmaceutical Co. Ltd., Class A* |
20,500 | 45,250 | ||||||
| Zhejiang Huahai Pharmaceutical Co. Ltd., Class A |
25,020 | 64,859 | ||||||
| Zhejiang Jiuzhou Pharmaceutical Co. Ltd., Class A |
12,717 | 52,049 | ||||||
| Zhejiang Medicine Co. Ltd., Class A |
18,600 | 29,531 | ||||||
| Zhejiang Wolwo Bio-Pharmaceutical Co. Ltd., Class A |
10,400 | 55,717 | ||||||
|
|
|
|||||||
| (Cost $3,032,502) |
2,983,298 | |||||||
|
|
|
|||||||
| Industrials — 14.8% | ||||||||
| AECC Aero-Engine Control Co. Ltd., Class A |
25,900 | 86,537 | ||||||
| AVICOPTER PLC, Class A |
9,500 | 52,163 | ||||||
| Beijing Bei Mo Gao Ke Friction Material Co. Ltd., Class A* |
7,659 | 46,520 | ||||||
| Beijing Easpring Material Technology Co. Ltd., Class A* |
11,500 | 79,239 | ||||||
| Beijing Originwater Technology Co. Ltd., Class A |
72,600 | 56,817 | ||||||
| Beijing United Information Technology Co. Ltd., Class A* |
9,855 | 63,487 | ||||||
| Bohai Leasing Co. Ltd., Class A* |
64,800 | 19,939 | ||||||
| Centre Testing International Group Co. Ltd., Class A |
47,900 | 125,584 | ||||||
| China Baoan Group Co. Ltd., Class A |
60,280 | 102,397 | ||||||
| China First Heavy Industries Co. Ltd., Class A* |
93,800 | 44,809 | ||||||
| China International Marine Containers Group Co. Ltd., Class A |
57,080 | 54,776 | ||||||
| China Merchants Port Group Co. Ltd., Class A* |
7,000 | 16,563 | ||||||
| China Railway Hi-tech Industry Co. Ltd., Class A |
41,300 | 59,363 | ||||||
| China Southern Power Grid Energy Efficiency&Clean Energy Co. Ltd., Class A |
34,500 | 29,715 | ||||||
| China XD Electric Co. Ltd., Class A |
62,200 | 46,843 | ||||||
| CITIC Heavy Industries Co. Ltd., Class A |
62,800 | 35,824 | ||||||
| CMST Development Co. Ltd., Class A |
25,100 | 19,961 | ||||||
| COSCO SHIPPING Development Co. Ltd., Class A |
107,800 | 37,866 | ||||||
| Deppon Logistics Co. Ltd., Class A* |
8,900 | 18,345 | ||||||
| Dongguan Yiheda Automation Co. Ltd., Class A |
3,720 | 22,506 | ||||||
| East Group Co. Ltd., Class A |
35,300 | 34,917 | ||||||
| Eastern Air Logistics Co. Ltd., Class A |
13,200 | 25,001 | ||||||
| Eternal Asia Supply Chain Management Ltd., Class A |
51,700 | 36,611 | ||||||
| See Notes to Financial Statements. | 22 |
DBX ETF Trust
Schedule of Investments
Xtrackers Harvest CSI 500 China A-Shares Small Cap ETF (Continued)
May 31, 2023
| Number |
Value |
|||||||
| Industrials (Continued) | ||||||||
| Fangda Carbon New Material Co. Ltd., Class A* |
66,800 | $ | 59,317 | |||||
| Farasis Energy Gan Zhou Co. Ltd., Class A* |
20,706 | 61,298 | ||||||
| GoodWe Technologies Co. Ltd., Class A |
1,964 | 64,362 | ||||||
| Guangshen Railway Co. Ltd., Class A* |
112,600 | 53,949 | ||||||
| Guangzhou Port Co. Ltd., Class A* |
33,500 | 15,109 | ||||||
| Hefei Meiya Optoelectronic Technology, Inc., Class A |
11,500 | 40,087 | ||||||
| Hongfa Technology Co. Ltd., Class A |
24,012 | 102,158 | ||||||
| Infore Environment Technology Group Co. Ltd., Class A |
45,500 | 33,051 | ||||||
| Jiangsu Expressway Co. Ltd., Class A |
16,300 | 21,871 | ||||||
| Jihua Group Corp. Ltd., Class A* |
79,600 | 33,664 | ||||||
| Juneyao Airlines Co. Ltd., Class A* |
19,040 | 42,000 | ||||||
| Kaishan Group Co. Ltd., Class A* |
12,351 | 25,631 | ||||||
| Keda Industrial Group Co. Ltd., Class A |
39,100 | 58,289 | ||||||
| Kuang-Chi Technologies Co. Ltd., Class A |
48,300 | 107,767 | ||||||
| Liaoning Port Co. Ltd., Class A |
227,320 | 50,144 | ||||||
| Luoyang Xinqianglian Slewing Bearing Co. Ltd., Class A |
5,300 | 27,188 | ||||||
| Ningbo Orient Wires & Cables Co. Ltd., Class A |
11,800 | 81,239 | ||||||
| North Industries Group Red Arrow Co. Ltd., Class A |
24,247 | 61,323 | ||||||
| Pylon Technologies Co. Ltd., Class A |
2,465 | 68,444 | ||||||
| Qingdao Port International Co. Ltd., Class A |
24,200 | 24,651 | ||||||
| Qingdao TGOOD Electric Co. Ltd., Class A* |
21,581 | 66,406 | ||||||
| Riyue Heavy Industry Co. Ltd., Class A |
15,100 | 45,190 | ||||||
| Shandong Himile Mechanical Science & Technology Co. Ltd., Class A |
12,500 | 58,327 | ||||||
| Shandong Hi-speed Co. Ltd., Class A |
21,900 | 22,154 | ||||||
| Shanghai Construction Group Co. Ltd., Class A |
157,700 | 58,495 | ||||||
| Shanghai Tunnel Engineering Co. Ltd., Class A |
65,100 | 55,247 | ||||||
| Shanghai Waigaoqiao Free Trade Zone Group Co. Ltd., Class A* |
11,700 | 18,855 | ||||||
| Shanxi Coal International Energy Group Co. Ltd., Class A |
27,800 | 52,653 | ||||||
| Shenzhen Airport Co. Ltd., Class A |
31,600 | 30,724 | ||||||
| Siasun Robot & Automation Co. Ltd., Class A* |
38,400 | 84,599 | ||||||
| Sichuan New Energy Power Co. Ltd.* |
20,900 | 41,141 | ||||||
| Sieyuan Electric Co. Ltd., Class A |
17,580 | 116,932 | ||||||
| Sinochem International Corp., Class A |
39,900 | 33,412 | ||||||
| Sinoma International Engineering Co., Class A |
33,050 | 61,761 | ||||||
| Sinotrans Ltd., Class A |
44,100 | 29,123 | ||||||
| State Grid Yingda Co. Ltd., Class A |
51,700 | 40,461 | ||||||
| STO Express Co. Ltd., Class A* |
21,800 | 30,599 | ||||||
| Suzhou Gold Mantis Construction Decoration Co. Ltd., Class A* |
49,200 | 32,214 | ||||||
| TangShan Port Group Co. Ltd., Class A |
92,174 | 47,529 | ||||||
| Tian Di Science & Technology Co. Ltd., Class A |
54,600 | 41,733 | ||||||
| Number |
Value |
|||||||
| Industrials (Continued) | ||||||||
| Titan Wind Energy Suzhou Co. Ltd., Class A |
25,700 | $ | 56,186 | |||||
| Wolong Electric Group Co. Ltd., Class A |
27,139 | 45,910 | ||||||
| Xiamen C & D, Inc., Class A |
42,100 | 68,675 | ||||||
| Xiamen ITG Group Corp. Ltd., Class A |
42,548 | 55,357 | ||||||
| Xuji Electric Co. Ltd., Class A |
20,400 | 66,498 | ||||||
| Yantai Eddie Precision Machinery Co. Ltd., Class A |
11,240 | 28,237 | ||||||
| Yutong Bus Co. Ltd., Class A |
40,500 | 73,919 | ||||||
| Zhefu Holding Group Co. Ltd., Class A |
64,600 | 36,942 | ||||||
| Zhejiang HangKe Technology, Inc. Co., Class A |
3,565 | 20,767 | ||||||
| Zhejiang Wanliyang Co. Ltd., Class A* |
24,000 | 26,977 | ||||||
| Zhejiang Weiming Environment Protection Co. Ltd., Class A |
14,588 | 37,120 | ||||||
| Zhejiang Weixing New Building Materials Co. Ltd., Class A |
18,680 | 50,681 | ||||||
| Zhengzhou Coal Mining Machinery Group Co. Ltd., Class A |
27,000 | 47,193 | ||||||
| Zhongshan Broad Ocean Motor Co. Ltd., Class A |
50,500 | 37,464 | ||||||
| Zhuhai CosMX Battery Co. Ltd., Class A* |
3,222 | 8,447 | ||||||
| Zhuzhou Kibing Group Co. Ltd., Class A* |
45,300 | 51,428 | ||||||
|
|
|
|||||||
| (Cost $4,052,995) |
3,826,681 | |||||||
|
|
|
|||||||
| Information Technology — 19.7% | ||||||||
| Accelink Technologies Co. Ltd., Class A |
12,922 | 50,346 | ||||||
| Addsino Co. Ltd., Class A |
37,000 | 50,530 | ||||||
| Aisino Corp., Class A |
33,100 | 66,877 | ||||||
| Amlogic Shanghai Co. Ltd., Class A* |
8,279 | 104,423 | ||||||
| Anker Innovations Technology Co. Ltd., Class A |
5,700 | 59,256 | ||||||
| Arcsoft Corp. Ltd., Class A |
6,133 | 43,525 | ||||||
| Beijing E-Hualu Information Technology Co. Ltd., Class A* |
11,240 | 58,370 | ||||||
| Beijing Shiji Information Technology Co. Ltd., Class A |
17,915 | 49,059 | ||||||
| Beijing Sinnet Technology Co. Ltd., Class A* |
40,200 | 66,819 | ||||||
| Beijing Yuanliu Hongyuan Electronic Technology Co. Ltd., Class A |
4,000 | 34,232 | ||||||
| Beijing Zhong Ke San Huan High-Tech Co. Ltd., Class A |
27,900 | 46,296 | ||||||
| Cambricon Technologies Corp. Ltd., Class A* |
5,766 | 205,931 | ||||||
| CETC Cyberspace Security Technology Co. Ltd., Class A |
16,904 | 70,302 | ||||||
| China National Software & Service Co. Ltd., Class A |
11,260 | 96,079 | ||||||
| China Railway Signal & Communication Corp. Ltd., Class A |
83,746 | 70,129 | ||||||
| China TransInfo Technology Co. Ltd., Class A* |
32,200 | 60,579 | ||||||
| DHC Software Co. Ltd., Class A |
67,400 | 69,793 | ||||||
| Everdisplay Optronics Shanghai Co. Ltd., Class A* |
132,669 | 50,143 | ||||||
| Fiberhome Telecommunication Technologies Co. Ltd., Class A |
22,400 | 61,530 | ||||||
| See Notes to Financial Statements. | 23 |
DBX ETF Trust
Schedule of Investments
Xtrackers Harvest CSI 500 China A-Shares Small Cap ETF (Continued)
May 31, 2023
| Number |
Value |
|||||||
| Information Technology (Continued) | ||||||||
| Fujian Star-net Communication Co. Ltd., Class A |
14,100 | $ | 41,900 | |||||
| GCL System Integration Technology Co. Ltd., Class A* |
121,100 | 49,684 | ||||||
| GRG Banking Equipment Co. Ltd., Class A |
37,700 | 66,106 | ||||||
| Guangdong Fenghua Advanced Technology Holding Co. Ltd., Class A |
23,600 | 52,059 | ||||||
| Guangzhou Haige Communications Group, Inc. Co., Class A |
56,400 | 79,482 | ||||||
| Hangzhou Chang Chuan Technology Co. Ltd., Class A |
10,500 | 74,517 | ||||||
| Hangzhou Lion Electronics Co. Ltd., Class A* |
13,500 | 77,276 | ||||||
| Hengdian Group DMEGC Magnetics Co. Ltd., Class A |
23,400 | 59,574 | ||||||
| Hengtong Optic-electric Co. Ltd., Class A |
56,100 | 113,978 | ||||||
| Huagong Tech Co. Ltd., Class A |
29,159 | 142,123 | ||||||
| IRICO Display Devices Co. Ltd., Class A* |
44,300 | 29,005 | ||||||
| Jiangsu Pacific Quartz Co. Ltd., Class A |
5,100 | 81,538 | ||||||
| Leyard Optoelectronic Co. Ltd., Class A |
60,200 | 58,109 | ||||||
| Longshine Technology Group Co. Ltd., Class A |
15,100 | 43,090 | ||||||
| MLS Co. Ltd., Class A |
25,673 | 32,897 | ||||||
| Neusoft Corp., Class A |
25,900 | 38,392 | ||||||
| Newland Digital Technology Co. Ltd., Class A |
24,040 | 62,826 | ||||||
| PCI Technology Group Co. Ltd., Class A |
40,950 | 41,138 | ||||||
| Raytron Technology Co. Ltd., Class A |
10,257 | 71,553 | ||||||
| Rockchip Electronics Co. Ltd., Class A |
4,800 | 59,113 | ||||||
| Shanghai 2345 Network Holding Group Co. Ltd., Class A |
166,948 | 69,432 | ||||||
| Shanghai Belling Co. Ltd., Class A |
16,700 | 43,338 | ||||||
| Shanghai Friendess Electronic Technology Corp. Ltd., Class A* |
1,180 | 33,134 | ||||||
| Shanghai Fudan Microelectronics Group Co. Ltd., Class A |
7,657 | 61,409 | ||||||
| Shenzhen Aisidi Co. Ltd., Class A |
21,900 | 23,600 | ||||||
| Shenzhen Everwin Precision Technology Co. Ltd., Class A* |
24,636 | 46,556 | ||||||
| Shenzhen Goodix Technology Co. Ltd., Class A |
8,000 | 57,415 | ||||||
| Shenzhen Huaqiang Industry Co. Ltd., Class A |
10,840 | 18,078 | ||||||
| Shenzhen Kaifa Technology Co. Ltd., Class A |
29,200 | 93,911 | ||||||
| Shenzhen Kinwong Electronic Co. Ltd., Class A |
10,220 | 37,134 | ||||||
| Shenzhen SC New Energy Technology Corp., Class A |
7,900 | 106,148 | ||||||
| Shenzhen Sunlord Electronics Co. Ltd., Class A |
23,300 | 75,787 | ||||||
| Shenzhen Sunway Communication Co. Ltd., Class A |
28,600 | 78,038 | ||||||
| Sinosoft Co. Ltd., Class A |
11,020 | 59,797 | ||||||
| State Grid Information & Communication Co. Ltd., Class A |
13,900 | 39,236 | ||||||
| Suzhou Dongshan Precision Manufacturing Co. Ltd., Class A |
38,800 | 138,523 | ||||||
| Number |
Value |
|||||||
| Information Technology (Continued) | ||||||||
| Taiji Computer Corp. Ltd., Class A |
11,919 | $ | 65,479 | |||||
| Tianjin 712 Communication & Broadcasting Co. Ltd., Class A |
11,200 | 48,453 | ||||||
| Tianma Microelectronics Co. Ltd., Class A* |
35,900 | 48,777 | ||||||
| Tianshui Huatian Technology Co. Ltd., Class A |
74,700 | 102,017 | ||||||
| TongFu Microelectronics Co. Ltd., Class A |
25,900 | 90,139 | ||||||
| Topsec Technologies Group, Inc., Class A |
33,680 | 49,735 | ||||||
| Universal Scientific Industrial Shanghai Co. Ltd., Class A |
19,500 | 38,522 | ||||||
| Venustech Group, Inc., Class A |
19,300 | 85,555 | ||||||
| Verisilicon Microelectronics Shanghai Co. Ltd., Class A* |
7,222 | 94,734 | ||||||
| Wangsu Science & Technology Co. Ltd., Class A* |
71,700 | 76,665 | ||||||
| Wonders Information Co. Ltd., Class A* |
34,594 | 65,570 | ||||||
| Wuhan DR Laser Technology Corp. Ltd., Class A |
2,400 | 33,738 | ||||||
| Wuhu Token Science Co. Ltd., Class A |
70,700 | 62,384 | ||||||
| Wuxi Taiji Industry Co. Ltd., Class A |
45,300 | 45,508 | ||||||
| Xiamen Faratronic Co. Ltd., Class A |
3,900 | 73,427 | ||||||
| Yangling Metron New Material, Inc., Class A |
5,500 | 33,569 | ||||||
| Yangtze Optical Fibre and Cable Joint Stock Ltd. Co., Class A |
3,700 | 18,284 | ||||||
| Yangzhou Yangjie Electronic Technology Co. Ltd., Class A* |
7,500 | 43,416 | ||||||
| Zhejiang Crystal-Optech Co. Ltd., Class A |
40,862 | 67,919 | ||||||
| Zhejiang Supcon Technology Co. Ltd., Class A |
10,081 | 146,500 | ||||||
| Zhongji Innolight Co. Ltd., Class A* |
16,300 | 246,197 | ||||||
|
|
|
|||||||
| (Cost $4,804,157) |
5,106,703 | |||||||
|
|
|
|||||||
| Materials — 19.7% | ||||||||
| ADAMA Ltd., Class A |
13,100 | 15,480 | ||||||
| Angang Steel Co. Ltd., Class A |
72,000 | 28,528 | ||||||
| BBMG Corp., Class A |
123,200 | 37,736 | ||||||
| Beijing Haixin Energy Technology Co. Ltd., Class A |
48,300 | 24,363 | ||||||
| Beijing Shougang Co. Ltd., Class A |
42,400 | 21,209 | ||||||
| Bluestar Adisseo Co., Class A |
11,900 | 13,427 | ||||||
| Chengzhi Co. Ltd., Class A* |
17,409 | 19,300 | ||||||
| Chifeng Jilong Gold Mining Co. Ltd., Class A* |
38,200 | 86,037 | ||||||
| China Hainan Rubber Industry Group Co. Ltd., Class A |
57,000 | 36,039 | ||||||
| China Rare Earth Resources And Technology Co. Ltd., Class A* |
16,800 | 73,646 | ||||||
| Chongqing Iron & Steel Co. Ltd., Class A* |
199,300 | 39,203 | ||||||
| COFCO Biotechnology Co. Ltd., Class A |
33,485 | 37,262 | ||||||
| CSG Holding Co. Ltd., Class A |
40,161 | 34,421 | ||||||
| Do-Fluoride New Materials Co. Ltd., Class A |
30,240 | 84,977 | ||||||
| Fangda Special Steel Technology Co. Ltd., Class A |
42,646 | 27,443 | ||||||
| Fushun Special Steel Co. Ltd., Class A* |
44,800 | 56,273 | ||||||
| See Notes to Financial Statements. | 24 |
DBX ETF Trust
Schedule of Investments
Xtrackers Harvest CSI 500 China A-Shares Small Cap ETF (Continued)
May 31, 2023
| Number |
Value |
|||||||
| Materials (Continued) | ||||||||
| Gansu Jiu Steel Group Hongxing Iron & Steel Co. Ltd., Class A* |
101,400 | $ | 22,510 | |||||
| GEM Co. Ltd., Class A |
146,500 | 137,294 | ||||||
| Guangdong HEC Technology Holding Co. Ltd., Class A |
42,805 | 43,362 | ||||||
| Guangdong Hongda Holdings Group Co. Ltd., Class A |
14,900 | 62,156 | ||||||
| Hainan Mining Co. Ltd., Class A |
18,100 | 16,607 | ||||||
| Hangzhou Iron & Steel Co., Class A |
48,810 | 31,272 | ||||||
| Hangzhou Oxygen Plant Group Co. Ltd., Class A |
11,400 | 57,230 | ||||||
| Haohua Chemical Science & Technology Co. Ltd., Class A |
8,000 | 43,815 | ||||||
| Hengyi Petrochemical Co. Ltd., Class A |
60,800 | 57,236 | ||||||
| Hesteel Co. Ltd., Class A |
115,800 | 37,259 | ||||||
| Hongda Xingye Co. Ltd., Class A* |
69,678 | 20,070 | ||||||
| Huabao Flavours & Fragrances Co. Ltd., Class A |
3,900 | 12,110 | ||||||
| Huaibei Mining Holdings Co. Ltd., Class A |
28,200 | 51,866 | ||||||
| Huaxin Cement Co. Ltd., Class A |
19,272 | 34,416 | ||||||
| Hubei Xingfa Chemicals Group Co. Ltd., Class A |
21,820 | 65,577 | ||||||
| Hunan Changyuan Lico Co. Ltd., Class A* |
22,249 | 35,730 | ||||||
| Hunan Gold Corp. Ltd., Class A |
24,600 | 47,767 | ||||||
| Hunan Valin Steel Co. Ltd., Class A |
116,520 | 79,566 | ||||||
| Inner Mongolia Dazhong Mining Co. Ltd., Class A |
13,100 | 21,002 | ||||||
| Inner Mongolia Yuan Xing Energy Co. Ltd., Class A |
71,300 | 66,719 | ||||||
| Jiangsu Yangnong Chemical Co. Ltd., Class A |
5,400 | 62,966 | ||||||
| Jiangsu Yoke Technology Co. Ltd., Class A |
8,196 | 84,329 | ||||||
| Jiangsu Zhongnan Construction Group Co. Ltd., Class A |
5,303 | 33,373 | ||||||
| Jinduicheng Molybdenum Co. Ltd., Class A |
27,900 | 42,689 | ||||||
| Kingfa Sci & Tech Co. Ltd., Class A |
52,400 | 62,654 | ||||||
| Lianhe Chemical Technology Co. Ltd., Class A |
21,559 | 33,108 | ||||||
| Luxi Chemical Group Co. Ltd., Class A |
32,800 | 48,759 | ||||||
| Maanshan Iron & Steel Co. Ltd., Class A |
72,500 | 27,402 | ||||||
| Nanjing Hanrui Cobalt Co. Ltd., Class A |
6,200 | 29,086 | ||||||
| Nanjing Iron & Steel Co. Ltd., Class A |
88,300 | 42,058 | ||||||
| ORG Technology Co. Ltd., Class A |
53,550 | 34,385 | ||||||
| Pangang Group Vanadium Titanium & Resources Co. Ltd., Class A* |
121,800 | 68,111 | ||||||
| Red Avenue New Materials Group Co. Ltd., Class A |
5,100 | 25,739 | ||||||
| Rising Nonferrous Metals Share Co. Ltd., Class A* |
5,800 | 28,628 | ||||||
| Sansteel Minguang Co. Ltd. Fujian, Class A |
34,450 | 20,958 | ||||||
| Shaanxi Beiyuan Chemical Industry Group Co. Ltd., Class A |
38,590 | 29,984 | ||||||
| Shandong Iron and Steel Co. Ltd., Class A |
171,730 | 34,987 | ||||||
| Shandong Sinocera Functional Material Co. Ltd., Class A |
22,700 | 86,115 | ||||||
| Number |
Value |
|||||||
| Materials (Continued) | ||||||||
| Shandong Sun Paper Industry JSC Ltd., Class A |
46,300 | $ | 68,175 | |||||
| Shanghai Huayi Group Co. Ltd., Class A |
20,600 | 17,858 | ||||||
| Shanxi Taigang Stainless Steel Co. Ltd., Class A |
63,700 | 35,621 | ||||||
| Shanying International Holding Co. Ltd., Class A |
94,700 | 29,538 | ||||||
| Shenghe Resources Holding Co. Ltd., Class A |
39,390 | 70,730 | ||||||
| Shenzhen Capchem Technology Co. Ltd., Class A |
14,580 | 96,323 | ||||||
| Shenzhen Jinjia Group Co. Ltd., Class A |
29,000 | 28,441 | ||||||
| Shenzhen Senior Technology Material Co. Ltd., Class A |
29,000 | 65,927 | ||||||
| Shenzhen YUTO Packaging Technology Co. Ltd., Class A |
11,140 | 37,033 | ||||||
| Shenzhen Zhongjin Lingnan Nonfemet Co. Ltd., Class A |
76,200 | 50,534 | ||||||
| Shinghwa Advanced Material Group Co. Ltd., Class A |
4,000 | 35,688 | ||||||
| Sichuan Hebang Biotechnology Co. Ltd., Class A* |
174,080 | 57,478 | ||||||
| Sichuan Yahua Industrial Group Co. Ltd., Class A |
32,600 | 82,356 | ||||||
| Sinoma Science & Technology Co. Ltd., Class A |
18,900 | 51,570 | ||||||
| Sinomine Resource Group Co. Ltd., Class A |
14,420 | 108,597 | ||||||
| Skshu Paint Co. Ltd., Class A* |
4,200 | 52,756 | ||||||
| Suzhou Nanomicro Technology Co. Ltd., Class A* |
4,711 | 29,905 | ||||||
| Canmax Technologies Co. Ltd., Class A |
14,040 | 66,006 | ||||||
| Tangshan Jidong Cement Co. Ltd., Class A |
29,481 | 31,936 | ||||||
| Tangshan Sanyou Chemical Industries Co. Ltd., Class A* |
34,400 | 25,327 | ||||||
| Tianshan Aluminum Group Co. Ltd., Class A |
65,000 | 57,537 | ||||||
| Tongkun Group Co. Ltd., Class A |
47,000 | 79,640 | ||||||
| Tongling Nonferrous Metals Group Co. Ltd., Class A* |
210,300 | 85,689 | ||||||
| Transfar Zhilian Co. Ltd., Class A |
39,000 | 29,809 | ||||||
| Weihai Guangwei Composites Co. Ltd., Class A |
14,400 | 59,261 | ||||||
| Western Mining Co. Ltd., Class A |
53,100 | 76,548 | ||||||
| Western Superconducting Technologies Co. Ltd., Class A |
9,318 | 101,608 | ||||||
| Xiamen Tungsten Co. Ltd., Class A* |
24,120 | 61,204 | ||||||
| Xinfengming Group Co. Ltd., Class A |
21,116 | 31,152 | ||||||
| Xinjiang Zhongtai Chemical Co. Ltd., Class A* |
58,200 | 54,052 | ||||||
| Xinxing Ductile Iron Pipes Co. Ltd., Class A |
67,250 | 40,630 | ||||||
| Xinyu Iron & Steel Co. Ltd., Class A |
53,700 | 28,444 | ||||||
| Yintai Gold Co. Ltd., Class A |
48,208 | 87,716 | ||||||
| Youngy Co. Ltd., Class A* |
5,900 | 50,990 | ||||||
| Yunnan Aluminium Co. Ltd., Class A |
58,200 | 98,946 | ||||||
| See Notes to Financial Statements. | 25 |
DBX ETF Trust
Schedule of Investments
Xtrackers Harvest CSI 500 China A-Shares Small Cap ETF (Continued)
May 31, 2023
| Number |
Value |
|||||||
| Materials (Continued) | ||||||||
| Yunnan Chihong Zinc & Germanium Co. Ltd., Class A |
101,400 | $ | 73,515 | |||||
| Yunnan Copper Co. Ltd., Class A |
34,500 | 52,836 | ||||||
| Yunnan Tin Co. Ltd., Class A |
27,630 | 55,204 | ||||||
| Yunnan Yuntianhua Co. Ltd., Class A |
36,000 | 84,269 | ||||||
| Zhejiang Hailiang Co. Ltd., Class A |
34,500 | 57,538 | ||||||
| Zhejiang Juhua Co. Ltd., Class A |
38,490 | 71,115 | ||||||
| Zhejiang Longsheng Group Co. Ltd., Class A |
74,900 | 99,975 | ||||||
| Zhejiang Sanmei Chemical Industry Co. Ltd., Class A* |
7,060 | 24,155 | ||||||
| Zhejiang Yongtai Technology Co. Ltd., Class A |
17,400 | 40,314 | ||||||
| Zhongjin Gold Corp. Ltd., Class A |
87,000 | 137,274 | ||||||
| Zibo Qixiang Tengda Chemical Co. Ltd., Class A* |
48,521 | 43,017 | ||||||
|
|
|
|||||||
| (Cost $5,752,487) |
5,098,476 | |||||||
|
|
|
|||||||
| Real Estate — 2.6% | ||||||||
| Beijing Capital Development Co. Ltd., Class A |
37,300 | 20,963 | ||||||
| China Green Electricity Investment of Tianjin Co. Ltd., Class A |
16,000 | 26,729 | ||||||
| China Merchants Property Operation & Service Co. Ltd., Class A |
12,000 | 24,465 | ||||||
| Financial Street Holdings Co. Ltd., Class A |
33,200 | 21,318 | ||||||
| Grandjoy Holdings Group Co. Ltd., Class A* |
37,300 | 19,077 | ||||||
| Hangzhou Binjiang Real Estate Group Co. Ltd., Class A |
35,500 | 42,048 | ||||||
| Jiangsu Zhongnan Construction Group Co. Ltd., Class A* |
57,100 | 10,991 | ||||||
| Jinke Properties Group Co. Ltd., Class A* |
113,600 | 14,205 | ||||||
| Nanjing Gaoke Co. Ltd., Class A |
33,608 | 31,024 | ||||||
| Red Star Macalline Group Corp. Ltd., Class A |
28,600 | 19,047 | ||||||
| RiseSun Real Estate Development Co. Ltd., Class A*(a) |
63,000 | 10,357 | ||||||
| Shanghai Lingang Holdings Corp. Ltd., Class A |
27,600 | 50,800 | ||||||
| Shanghai Lujiazui Finance & Trade Zone Development Co. Ltd., Class A |
24,100 | 34,302 | ||||||
| Shanghai Zhangjiang High-Tech Park Development Co. Ltd., Class A |
21,800 | 44,474 | ||||||
| Xiangcai Co. Ltd., Class A |
24,100 | 27,360 | ||||||
| Number |
Value |
|||||||
| Real Estate (Continued) | ||||||||
| Xinhu Zhongbao Co. Ltd., Class A* |
120,500 | $ | 45,544 | |||||
| Youngor Group Co. Ltd., Class A |
76,700 | 74,035 | ||||||
| Zhejiang China Commodities City Group Co. Ltd., Class A |
77,200 | 89,270 | ||||||
| Zhongtian Financial Group Co. Ltd., Class A*(a) |
139,200 | 7,823 | ||||||
| Zhuhai Huafa Properties Co. Ltd., Class A |
47,940 | 66,347 | ||||||
|
|
|
|||||||
| (Cost $880,322) |
680,179 | |||||||
|
|
|
|||||||
| Utilities — 3.3% | ||||||||
| Beijing Capital Eco-Environment Protection Group Co. Ltd., Class A* |
125,990 | 54,345 | ||||||
| CECEP Solar Energy Co. Ltd., Class A |
66,100 | 64,918 | ||||||
| CECEP Wind-Power Corp., Class A* |
109,830 | 59,411 | ||||||
| Chengdu Xingrong Environment Co. Ltd., Class A |
52,300 | 40,857 | ||||||
| Chongqing Gas Group Corp. Ltd., Class A |
10,100 | 10,388 | ||||||
| Chongqing Water Group Co. Ltd., Class A |
19,900 | 15,602 | ||||||
| Datang International Power Generation Co. Ltd., Class A* |
75,800 | 39,086 | ||||||
| Huadian Power International Corp. Ltd., Class A |
92,900 | 93,066 | ||||||
| Hubei Energy Group Co. Ltd., Class A |
55,800 | 37,240 | ||||||
| Inner Mongolia MengDian HuaNeng Thermal Power Corp. Ltd., Class A |
93,100 | 54,417 | ||||||
| Jinko Power Technology Co. Ltd., Class A |
49,100 | 32,494 | ||||||
| Luenmei Quantum Co. Ltd., Class A |
27,450 | 27,847 | ||||||
| Shanghai Electric Power Co. Ltd., Class A |
31,700 | 52,022 | ||||||
| Shenergy Co. Ltd., Class A |
69,749 | 69,874 | ||||||
| Shenzhen Energy Group Co. Ltd., Class A |
52,960 | 51,418 | ||||||
| Shenzhen Gas Corp. Ltd., Class A |
18,700 | 19,154 | ||||||
| Wintime Energy Co. Ltd.* |
632,200 | 132,351 | ||||||
| Zhejiang Provincial New Energy Investment Group Co. Ltd., Class A |
5,900 | 10,105 | ||||||
|
|
|
|||||||
| (Cost $820,416) |
864,595 | |||||||
|
|
|
|||||||
| TOTAL COMMON STOCKS |
25,759,353 | |||||||
|
|
|
|||||||
| TOTAL INVESTMENTS — 99.5% (Cost $26,938,582) |
$ | 25,759,353 | ||||||
| Other assets and liabilities, net — 0.5% |
120,138 | |||||||
|
|
|
|||||||
| NET ASSETS — 100.0% |
$ | 25,879,491 | ||||||
|
|
|
|||||||
| * | Non-income producing security. |
| (a) | Investment was valued using significant unobservable inputs. |
| JSC: | Joint Stock Company |
| See Notes to Financial Statements. | 26 |
DBX ETF Trust
Schedule of Investments
Xtrackers Harvest CSI 500 China A-Shares Small Cap ETF (Continued)
May 31, 2023
Fair Value Measurements
Various inputs are used in determining the value of the Fund’s investments. These inputs are summarized in three broad levels. Level 1 includes quoted prices in active markets for identical securities. Level 2 includes other significant observable inputs (including quoted prices for similar securities, interest rates, prepayment speeds and credit risk). Level 3 includes significant unobservable inputs (including the Fund’s own assumptions in determining the fair value of investments). The level assigned to the securities valuations may not be an indication of the risk or liquidity associated with investing in those securities.
The following is a summary of the inputs used as of May 31, 2023 in valuing the Fund’s investments. For information on the Fund’s policy regarding the valuation of investments, please refer to the Security Valuation section of Note 2 in the accompanying Notes to Financial Statements.
| Assets |
Level 1 | Level 2 | Level 3 | Total | ||||||||||||
| Common Stocks (b) |
$ | 25,741,173 | $ | — | $ | 18,180 | $ | 25,759,353 | ||||||||
|
|
|
|
|
|
|
|
|
|||||||||
| TOTAL |
$ | 25,741,173 | $ | — | $ | 18,180 | $ | 25,759,353 | ||||||||
|
|
|
|
|
|
|
|
|
|||||||||
| (b) | See Schedule of Investments for additional detailed categorizations. |
During the year ended May 31, 2023, the amount of transfers from Level 1 to Level 3 was $82,121. The investments were transferred from Level 1 to Level 3 due to the lack of observable market data due to a decrease in market activity.
| See Notes to Financial Statements. | 27 |
DBX ETF Trust
Schedule of Investments
Xtrackers MSCI All China Equity ETF
May 31, 2023
| Number |
Value |
|||||||
| COMMON STOCKS — 48.4% | ||||||||
| Communication Services — 10.8% | ||||||||
| Autohome, Inc., ADR |
152 | $ | 4,350 | |||||
| Baidu, Inc., Class A* |
4,588 | 69,978 | ||||||
| Bilibili, Inc., Class Z*(a) |
366 | 5,961 | ||||||
| China Literature Ltd., 144A*(a) |
934 | 3,532 | ||||||
| China Ruyi Holdings Ltd.*(a) |
10,742 | 2,401 | ||||||
| China Tower Corp. Ltd., Class H, 144A |
93,077 | 10,225 | ||||||
| iQIYI, Inc., ADR* |
726 | 2,948 | ||||||
| JOYY, Inc., ADR |
99 | 2,455 | ||||||
| Kanzhun Ltd., ADR* |
373 | 5,174 | ||||||
| Kingsoft Corp. Ltd.*(a) |
1,965 | 7,141 | ||||||
| Kuaishou Technology, 144A* |
4,649 | 31,475 | ||||||
| NetEase, Inc. |
4,009 | 67,907 | ||||||
| Tencent Holdings Ltd. |
12,635 | 501,317 | ||||||
| Tencent Music Entertainment Group, ADR* |
1,551 | 10,764 | ||||||
| Weibo Corp., ADR* |
151 | 2,110 | ||||||
|
|
|
|||||||
| (Cost $921,274) |
727,738 | |||||||
|
|
|
|||||||
| Consumer Discretionary — 15.6% | ||||||||
| Alibaba Group Holding Ltd.* |
33,550 | 333,861 | ||||||
| ANTA Sports Products Ltd. |
2,509 | 25,624 | ||||||
| Bosideng International Holdings Ltd. |
6,935 | 2,879 | ||||||
| BYD Co. Ltd., Class H |
1,991 | 60,125 | ||||||
| China Meidong Auto Holdings Ltd. |
1,633 | 2,103 | ||||||
| China Tourism Group Duty Free Corp. Ltd., Class H, 144A* |
133 | 2,117 | ||||||
| Chow Tai Fook Jewellery Group Ltd. (a) |
3,914 | 6,930 | ||||||
| Dongfeng Motor Group Co. Ltd., Class H |
6,612 | 2,863 | ||||||
| East Buy Holding Ltd., 144A*(a) |
749 | 2,779 | ||||||
| Fuyao Glass Industry Group Co. Ltd., Class H, 144A |
1,228 | 4,471 | ||||||
| Geely Automobile Holdings Ltd. |
12,792 | 14,886 | ||||||
| Great Wall Motor Co. Ltd., Class H* |
4,769 | 4,898 | ||||||
| Guangzhou Automobile Group Co. Ltd., Class H |
6,438 | 3,693 | ||||||
| H World Group Ltd., ADR* |
414 | 15,161 | ||||||
| Haidilao International Holding |
3,400 | 7,158 | ||||||
| Haier Smart Home Co. Ltd., Class H |
4,861 | 13,940 | ||||||
| JD.com, Inc., Class A |
4,750 | 76,393 | ||||||
| Jiumaojiu International Holdings Ltd., 144A (a) |
1,567 | 2,682 | ||||||
| Li Auto, Inc., Class A* |
2,325 | 33,591 | ||||||
| Li Ning Co. Ltd. |
4,818 | 25,849 | ||||||
| Meituan, Class B, 144A* |
10,290 | 144,855 | ||||||
| MINISO Group Holding Ltd., ADR |
150 | 2,280 | ||||||
| Minth Group Ltd. |
1,607 | 4,019 | ||||||
| New Oriental Education & Technology Group, Inc.* |
3,234 | 12,352 | ||||||
| NIO, Inc., ADR*(a) |
2,794 | 21,039 | ||||||
| PDD Holdings, Inc., ADR* |
1,030 | 67,280 | ||||||
| Pop Mart International Group Ltd., 144A |
1,200 | 2,637 | ||||||
| Shenzhou International Group Holdings Ltd. |
1,756 | 14,222 | ||||||
| TAL Education Group, ADR* |
917 | 4,979 | ||||||
| Tongcheng Travel Holdings Ltd.* |
2,610 | 5,208 | ||||||
| Topsports International Holdings Ltd., 144A |
4,063 | 3,156 | ||||||
| Number |
Value |
|||||||
| Consumer Discretionary (Continued) | ||||||||
| TravelSky Technology Ltd., Class H |
2,082 | $ | 3,798 | |||||
| Trip.Com Group Ltd.* |
1,150 | 36,902 | ||||||
| Vipshop Holdings Ltd., ADR* |
731 | 10,468 | ||||||
| XPeng, Inc., Class A*(a) |
2,000 | 7,933 | ||||||
| Xtep International Holdings Ltd. |
2,814 | 2,829 | ||||||
| Yadea Group Holdings Ltd., 144A (a) |
2,300 | 4,583 | ||||||
| Yum China Holdings, Inc. |
852 | 48,104 | ||||||
| Zhongsheng Group Holdings Ltd. |
1,304 | 4,814 | ||||||
|
|
|
|||||||
| (Cost $1,782,013) |
1,043,461 | |||||||
|
|
|
|||||||
| Consumer Staples — 2.1% | ||||||||
| Alibaba Health Information Technology |
9,807 | 5,813 | ||||||
| Anhui Gujing Distillery Co. Ltd., Class B |
255 | 4,180 | ||||||
| China Feihe Ltd., 144A |
7,800 | 4,534 | ||||||
| China Mengniu Dairy Co. Ltd.* |
6,501 | 25,246 | ||||||
| China Resources Beer Holdings Co. Ltd. |
3,299 | 20,818 | ||||||
| Dali Foods Group Co. Ltd., 144A |
6,297 | 2,099 | ||||||
| Hengan International Group Co. Ltd. |
1,429 | 6,079 | ||||||
| JD Health International, Inc., 144A* |
2,378 | 14,657 | ||||||
| Nongfu Spring Co. Ltd., Class H, 144A |
3,624 | 19,443 | ||||||
| Ping An Healthcare and Technology Co. Ltd., 144A*(a) |
1,068 | 2,464 | ||||||
| Smoore International Holdings Ltd., 144A (a) |
3,823 | 3,848 | ||||||
| Tingyi Cayman Islands Holding Corp. |
4,364 | 6,545 | ||||||
| Tsingtao Brewery Co. Ltd., Class H |
1,322 | 11,382 | ||||||
| Uni-President China Holdings Ltd.* |
3,308 | 2,874 | ||||||
| Vinda International Holdings Ltd. |
923 | 2,221 | ||||||
| Want Want China Holdings Ltd. |
10,633 | 7,117 | ||||||
| Yihai International Holding Ltd.*(a) |
1,030 | 2,284 | ||||||
|
|
|
|||||||
| (Cost $183,736) |
141,604 | |||||||
|
|
|
|||||||
| Energy — 1.5% | ||||||||
| China Coal Energy Co. Ltd., Class H |
4,365 | 3,301 | ||||||
| China Oilfield Services Ltd., Class H |
4,138 | 4,218 | ||||||
| China Petroleum & Chemical Corp., Class H |
50,966 | 32,097 | ||||||
| China Shenhua Energy Co. Ltd., Class H |
6,923 | 21,888 | ||||||
| COSCO SHIPPING Energy Transportation Co. Ltd., Class H* |
2,000 | 1,689 | ||||||
| PetroChina Co. Ltd., Class H |
43,354 | 28,023 | ||||||
| Yankuang Energy Group Co. Ltd., Class H (a) |
3,230 | 8,186 | ||||||
|
|
|
|||||||
| (Cost $82,133) |
99,402 | |||||||
|
|
|
|||||||
| Financials — 8.2% | ||||||||
| Agricultural Bank of China Ltd., Class H |
59,901 | 22,573 | ||||||
| Bank of China Ltd., Class H |
161,826 | 63,463 | ||||||
| Bank of Communications Co. Ltd., Class H |
17,815 | 11,492 | ||||||
| China Cinda Asset Management Co. Ltd., Class H |
23,162 | 2,574 | ||||||
| China CITIC Bank Corp. Ltd., Class H |
19,670 | 10,352 | ||||||
| China Construction Bank Corp., Class H |
195,973 | 125,421 | ||||||
| China Everbright Bank Co. Ltd., Class H* |
6,519 | 2,007 | ||||||
| China Galaxy Securities Co. Ltd., Class H |
7,669 | 4,134 | ||||||
| China International Capital Corp. Ltd., Class H, 144A |
3,289 | 6,016 | ||||||
| China Life Insurance Co. Ltd., Class H |
15,304 | 25,845 | ||||||
| See Notes to Financial Statements. | 28 |
DBX ETF Trust
Schedule of Investments
Xtrackers MSCI All China Equity ETF (Continued)
May 31, 2023
| Number |
Value |
|||||||
| Financials (Continued) | ||||||||
| China Merchants Bank Co. Ltd., Class H |
8,026 | $ | 37,319 | |||||
| China Minsheng Banking Corp. Ltd., Class H |
12,739 | 5,045 | ||||||
| China Pacific Insurance Group Co. Ltd., Class H |
5,412 | 13,689 | ||||||
| China Taiping Insurance Holdings Co. Ltd. |
3,564 | 3,715 | ||||||
| CITIC Securities Co. Ltd., Class H |
3,772 | 6,948 | ||||||
| Far East Horizon Ltd. |
2,663 | 2,232 | ||||||
| GF Securities Co. Ltd., Class H |
2,419 | 3,362 | ||||||
| Haitong Securities Co. Ltd., Class H |
6,688 | 4,443 | ||||||
| Huatai Securities Co. Ltd., Class H, 144A |
3,188 | 3,987 | ||||||
| Industrial & Commercial Bank of China Ltd., Class H |
114,912 | 61,506 | ||||||
| Lufax Holding Ltd., ADR |
1,461 | 1,870 | ||||||
| New China Life Insurance Co. Ltd., Class H |
1,692 | 4,377 | ||||||
| People’s Insurance Co. Group of China Ltd., Class H |
18,269 | 6,908 | ||||||
| PICC Property & Casualty Co. Ltd., Class H |
14,680 | 17,496 | ||||||
| Ping An Insurance Group Co. of China Ltd., Class H |
12,886 | 81,811 | ||||||
| Postal Savings Bank of China Co. Ltd., Class H, 144A |
17,372 | 10,918 | ||||||
| Qifu Technology, Inc., ADR |
284 | 3,905 | ||||||
| ZhongAn Online P&C Insurance Co. Ltd., Class H, 144A* |
1,509 | 4,250 | ||||||
|
|
|
|||||||
| (Cost $725,977) |
547,658 | |||||||
|
|
|
|||||||
| Health Care — 2.7% | ||||||||
| 3SBio, Inc., 144A |
3,368 | 3,407 | ||||||
| Akeso, Inc., 144A*(a) |
1,000 | 4,458 | ||||||
| BeiGene Ltd.* |
1,321 | 22,477 | ||||||
| China Medical System Holdings Ltd. |
3,060 | 4,300 | ||||||
| China Resources Pharmaceutical Group Ltd., 144A |
3,500 | 3,358 | ||||||
| China Traditional Chinese Medicine Holdings Co. Ltd. |
5,879 | 2,831 | ||||||
| CSPC Pharmaceutical Group Ltd. |
18,220 | 15,873 | ||||||
| Genscript Biotech Corp.* |
2,593 | 5,737 | ||||||
| Hangzhou Tigermed Consulting Co. Ltd., Class H, 144A (a) |
361 | 2,707 | ||||||
| Hansoh Pharmaceutical Group Co. Ltd., 144A |
2,547 | 4,217 | ||||||
| Hygeia Healthcare Holdings Co. |
738 | 4,341 | ||||||
| Innovent Biologics, Inc., 144A* |
2,200 | 10,314 | ||||||
| Legend Biotech Corp., ADR* |
121 | 7,765 | ||||||
| Microport Scientific Corp.*(a) |
1,405 | 2,419 | ||||||
| Pharmaron Beijing Co. Ltd., Class H, 144A |
525 | 1,938 | ||||||
| Shandong Weigao Group Medical Polymer Co. Ltd., Class H |
4,899 | 7,247 | ||||||
| Shanghai Fosun Pharmaceutical Group Co. Ltd., Class H |
1,183 | 3,219 | ||||||
| Shanghai Pharmaceuticals Holding Co. Ltd., Class H |
1,680 | 3,348 | ||||||
| Sino Biopharmaceutical Ltd. |
21,063 | 10,036 | ||||||
| Sinopharm Group Co. Ltd., Class H |
2,935 | 9,617 | ||||||
| WuXi AppTec Co. Ltd., Class H, 144A* |
754 | 6,213 | ||||||
| Number |
Value |
|||||||
| Health Care (Continued) | ||||||||
| Wuxi Biologics Cayman, Inc., 144A* |
7,621 | $ | 38,990 | |||||
| Zai Lab Ltd.*(a) |
1,800 | 5,944 | ||||||
|
|
|
|||||||
| (Cost $179,516) |
180,756 | |||||||
|
|
|
|||||||
| Industrials — 1.8% | ||||||||
| Air China Ltd., Class H* |
3,754 | 2,853 | ||||||
| AviChina Industry & Technology Co. Ltd., Class H |
6,585 | 3,188 | ||||||
| Beijing Capital International Airport Co. Ltd., Class H* |
4,795 | 3,344 | ||||||
| BOC Aviation Ltd., 144A |
455 | 3,345 | ||||||
| China Communications Services Corp. Ltd., Class H |
6,281 | 2,985 | ||||||
| China Conch Venture Holdings Ltd. |
2,883 | 3,624 | ||||||
| China Everbright Environment Group Ltd. |
8,141 | 3,182 | ||||||
| China Lesso Group Holdings Ltd. |
2,852 | 1,884 | ||||||
| China Merchants Port Holdings Co. Ltd. |
2,816 | 4,086 | ||||||
| China Railway Group Ltd., Class H |
8,835 | 5,824 | ||||||
| China Southern Airlines Co. Ltd., Class H* |
4,449 | 2,563 | ||||||
| China State Construction International Holdings Ltd. |
4,449 | 5,030 | ||||||
| CITIC Ltd. |
11,906 | 13,749 | ||||||
| COSCO SHIPPING Holdings Co. Ltd., Class H |
6,995 | 6,166 | ||||||
| COSCO SHIPPING Ports Ltd. |
3,988 | 2,511 | ||||||
| CRRC Corp. Ltd., Class H |
9,486 | 5,877 | ||||||
| Fosun International Ltd. |
5,472 | 3,607 | ||||||
| Haitian International Holdings Ltd. |
1,409 | 3,200 | ||||||
| Jiangsu Expressway Co. Ltd., Class H |
3,209 | 3,103 | ||||||
| Orient Overseas International Ltd. (a) |
281 | 3,426 | ||||||
| Sany Heavy Equipment International Holdings Co. Ltd. |
2,284 | 3,017 | ||||||
| Shenzhen International Holdings Ltd. |
3,180 | 2,523 | ||||||
| Weichai Power Co. Ltd., Class H |
4,304 | 5,850 | ||||||
| Zhejiang Expressway Co. Ltd., Class H |
2,486 | 1,842 | ||||||
| Zhuzhou CRRC Times Electric Co. Ltd. |
1,035 | 4,356 | ||||||
| ZTO Express Cayman, Inc., ADR |
896 | 22,615 | ||||||
|
|
|
|||||||
| (Cost $159,943) |
123,750 | |||||||
|
|
|
|||||||
| Information Technology — 2.0% | ||||||||
| AAC Technologies Holdings, Inc. (a) |
1,596 | 3,274 | ||||||
| BYD Electronic International Co. Ltd. |
1,447 | 4,214 | ||||||
| Chinasoft International Ltd.*(a) |
5,976 | 3,565 | ||||||
| Daqo New Energy Corp., ADR*(a) |
126 | 4,530 | ||||||
| Flat Glass Group Co. Ltd., Class H |
1,196 | 3,361 | ||||||
| GCL Technology Holdings Ltd.*(a) |
41,641 | 9,043 | ||||||
| GDS Holdings Ltd., Class A* |
1,612 | 1,989 | ||||||
| Hua Hong Semiconductor Ltd., 144A* |
1,150 | 3,724 | ||||||
| Kingboard Holdings Ltd. |
1,426 | 3,844 | ||||||
| Kingboard Laminates Holdings Ltd. |
2,458 | 2,248 | ||||||
| Kingdee International Software Group Co. Ltd.* |
5,695 | 7,566 | ||||||
| Lenovo Group Ltd. |
14,796 | 13,911 | ||||||
| Shanghai Fudan Microelectronics Group Co. Ltd., Class H (a) |
600 | 1,613 | ||||||
| Sunny Optical Technology Group Co. Ltd. |
1,517 | 14,263 | ||||||
| Xiaomi Corp., Class B, 144A* |
31,464 | 41,560 | ||||||
| See Notes to Financial Statements. | 29 |
DBX ETF Trust
Schedule of Investments
Xtrackers MSCI All China Equity ETF (Continued)
May 31, 2023
| Number |
Value |
|||||||
| Information Technology (Continued) | ||||||||
| Xinyi Solar Holdings Ltd. |
10,695 | $ | 10,561 | |||||
| ZTE Corp., Class H |
1,608 | 4,940 | ||||||
|
|
|
|||||||
| (Cost $167,350) |
134,206 | |||||||
|
|
|
|||||||
| Materials — 0.9% | ||||||||
| Aluminum Corp. of China Ltd., Class H |
8,732 | 3,859 | ||||||
| Anhui Conch Cement Co. Ltd., Class H |
2,736 | 7,270 | ||||||
| China Hongqiao Group Ltd. |
5,013 | 3,560 | ||||||
| China National Building Material Co. Ltd., Class H |
8,296 | 4,695 | ||||||
| China Resources Cement Holdings Ltd. |
6,419 | 2,337 | ||||||
| CMOC Group Ltd., Class H |
7,624 | 3,983 | ||||||
| Dongyue Group Ltd. |
2,681 | 2,346 | ||||||
| Ganfeng Lithium Group Co. Ltd., Class H, 144A (a) |
773 | 4,893 | ||||||
| Jiangxi Copper Co. Ltd., Class H |
2,428 | 3,654 | ||||||
| Nine Dragons Paper Holdings Ltd. (a) |
3,620 | 2,007 | ||||||
| Shandong Gold Mining Co. Ltd., Class H, 144A |
1,792 | 3,415 | ||||||
| Zhaojin Mining Industry Co. Ltd., Class H* |
3,019 | 4,289 | ||||||
| Zijin Mining Group Co. Ltd., Class H |
11,209 | 15,206 | ||||||
|
|
|
|||||||
| (Cost $66,712) |
61,514 | |||||||
|
|
|
|||||||
| Real Estate — 1.6% | ||||||||
| C&D International Investment Group Ltd.* |
1,249 | 3,140 | ||||||
| China Evergrande Group*(b) |
8,413 | 0 | ||||||
| China Jinmao Holdings Group Ltd. |
14,414 | 2,062 | ||||||
| China Overseas Land & Investment Ltd. |
8,133 | 16,498 | ||||||
| China Overseas Property Holdings Ltd. |
2,910 | 2,669 | ||||||
| China Resources Land Ltd. |
6,600 | 24,703 | ||||||
| China Resources Mixc Lifestyle Services Ltd., 144A |
1,327 | 6,043 | ||||||
| China Vanke Co. Ltd., Class H |
4,330 | 5,719 | ||||||
| Country Garden Holdings Co. Ltd. (a) |
22,721 | 4,180 | ||||||
| Country Garden Services Holdings Co. Ltd. |
4,386 | 5,104 | ||||||
| Greentown China Holdings Ltd. |
1,990 | 1,869 | ||||||
| Greentown Service Group Co. Ltd. (a) |
4,359 | 2,355 | ||||||
| KE Holdings, Inc., ADR* |
1,346 | 19,167 | ||||||
| Longfor Group Holdings Ltd., 144A |
4,014 | 7,722 | ||||||
| Shimao Group Holdings Ltd.*(b) |
4,310 | 0 | ||||||
| Sunac China Holdings Ltd.* |
7,560 | 1,149 | ||||||
| Yuexiu Property Co. Ltd. (a) |
3,048 | 3,302 | ||||||
|
|
|
|||||||
| (Cost $267,412) |
105,682 | |||||||
|
|
|
|||||||
| Utilities — 1.2% | ||||||||
| Beijing Enterprises Holdings Ltd. |
1,104 | 4,266 | ||||||
| Beijing Enterprises Water Group Ltd. |
7,824 | 1,919 | ||||||
| CGN Power Co. Ltd., Class H, 144A |
20,465 | 4,915 | ||||||
| China Gas Holdings Ltd. |
5,594 | 6,346 | ||||||
| China Longyuan Power Group Corp. Ltd., Class H |
7,305 | 8,193 | ||||||
| China Power International Development Ltd. |
11,511 | 4,382 | ||||||
| China Resources Gas Group Ltd. |
2,045 | 6,727 | ||||||
| China Resources Power Holdings Co. Ltd. |
4,290 | 9,908 | ||||||
| ENN Energy Holdings Ltd. |
1,618 | 18,808 | ||||||
| Guangdong Investment Ltd. |
6,481 | 5,522 | ||||||
| Number |
Value |
|||||||
| Utilities (Continued) | ||||||||
| Huaneng Power International, Inc., Class H* |
7,773 | $ | 4,994 | |||||
| Kunlun Energy Co. Ltd.* |
8,523 | 6,794 | ||||||
|
|
|
|||||||
| (Cost $95,477) |
82,774 | |||||||
|
|
|
|||||||
| TOTAL COMMON STOCKS |
3,248,545 | |||||||
|
|
|
|||||||
| EXCHANGE-TRADED FUNDS — 51.4% | ||||||||
| Xtrackers Harvest CSI 500 China A-Shares Small Cap ETF (c) |
8,783 | 269,023 | ||||||
| Xtrackers MSCI China A Inclusion Equity ETF (c) |
153,650 | 3,174,271 | ||||||
|
|
|
|||||||
| (Cost $4,635,601) |
3,443,294 | |||||||
|
|
|
|||||||
| SECURITIES LENDING COLLATERAL — 0.4% | ||||||||
| DWS Government & Agency Securities Portfolio “DWS Government Cash Institutional Shares”,
5.03% (d)(e) |
32,169 | 32,169 | ||||||
|
|
|
|||||||
| CASH EQUIVALENTS — 0.4% | ||||||||
| DWS Government Money Market Series “Institutional Shares”, 5.04% (d) |
25,239 | 25,239 | ||||||
|
|
|
|||||||
| TOTAL INVESTMENTS — 100.6% (Cost $9,324,552) |
$ | 6,749,247 | ||||||
| Other assets and liabilities, net — (0.6%) |
(43,563 | ) | ||||||
|
|
|
|||||||
| NET ASSETS — 100.0% |
$ | 6,705,684 | ||||||
|
|
|
|||||||
| See Notes to Financial Statements. | 30 |
DBX ETF Trust
Schedule of Investments
Xtrackers MSCI All China Equity ETF (Continued)
May 31, 2023
A summary of the Fund’s transactions with affiliated investments during the year ended May 31, 2023 is as follows:
| Value ($) at 5/31/2022 |
Purchases Cost ($) |
Sales Proceeds ($) |
Net Realized Gain/(Loss) ($) |
Net Change in Unrealized Appreciation (Depreciation) ($) |
Income ($) | Capital Gain Distributions ($) |
Number of Shares at 5/31/2023 |
Value ($) at 5/31/2023 |
||||||||||||||||||||||||||||
| EXCHANGE-TRADED FUNDS — 51.4% |
|
|||||||||||||||||||||||||||||||||||
| Xtrackers Harvest CSI 500 China A-Shares Small Cap ETF (c) |
| |||||||||||||||||||||||||||||||||||
| 506,451 | 32,883 | (245,914 | ) | (49,655 | ) | 25,258 | 5,946 | — | 8,783 | 269,023 | ||||||||||||||||||||||||||
| Xtrackers MSCI China A Inclusion Equity ETF (c) |
| |||||||||||||||||||||||||||||||||||
| 4,186,445 | 185,678 | (684,425 | ) | 53,114 | (566,541 | ) | 58,002 | — | 153,650 | 3,174,271 | ||||||||||||||||||||||||||
| SECURITIES LENDING COLLATERAL — 0.4% |
| |||||||||||||||||||||||||||||||||||
| DWS Government & Agency Securities Portfolio “DWS Government Cash Institutional Shares”, 5.03% (d)(e) |
| |||||||||||||||||||||||||||||||||||
| 46,367 | — | (14,198 | )(f) | — | — | 1,323 | — | 32,169 | 32,169 | |||||||||||||||||||||||||||
| CASH EQUIVALENTS — 0.4% |
| |||||||||||||||||||||||||||||||||||
| DWS Government Money Market Series “Institutional Shares”, 5.04% (d) |
| |||||||||||||||||||||||||||||||||||
| 6,466 | 166,837 | (148,064 | ) | — | — | 543 | — | 25,239 | 25,239 | |||||||||||||||||||||||||||
|
|
|
|
|
|
|
|
|
|
|
|
|
|
|
|
|
|
|
|||||||||||||||||||
| 4,745,729 | 385,398 | (1,092,601 | ) | 3,459 | (541,283 | ) | 65,814 | — | 219,841 | 3,500,702 | ||||||||||||||||||||||||||
|
|
|
|
|
|
|
|
|
|
|
|
|
|
|
|
|
|
|
|||||||||||||||||||
| * | Non-income producing security. |
| (a) | All or a portion of these securities were on loan. In addition, “Other assets and liabilities, net” may include pending sales that are also on loan. The value of securities loaned at May 31, 2023 amounted to $133,610, which is 2.0% of net assets. |
| (b) | Investment was valued using significant unobservable inputs. |
| (c) | Affiliated fund advised by DBX Advisors LLC. |
| (d) | Affiliated fund managed by DWS Investment Management Americas, Inc. The rate shown is the annualized seven-day yield at period end. |
| (e) | Represents cash collateral held in connection with securities lending. Income earned by the Fund is net of borrower rebates. In addition, the Fund held non-cash U.S. Treasury securities collateral having a value of $116,577. |
| (f) | Represents the net increase (purchase cost) or decrease (sales proceeds) in the amount invested in cash collateral for the year ended May 31, 2023. |
| ADR: | American Depositary Receipt |
| 144A: | Security exempt from registration under Rule 144A of the Securities Act of 1933. These securities may be resold in transactions exempt from registration, normally to qualified institutional buyers. |
At May 31, 2023, open futures contracts purchased were as follows:
| Contract Description |
Currency | Number of Contracts |
Notional Amount |
Contract Value |
Expiration Date |
Unrealized Depreciation |
||||||||||||
| FTSE China A50 Index Futures |
USD | 1 | $ | 12,610 | $ | 12,261 | 6/29/2023 | $ | (349 | ) | ||||||||
For information on the Fund’s policy and additional disclosures regarding futures contracts, please refer to the Derivatives section of Note 2 in the accompanying Notes to Financial Statements.
Currency Abbreviations
| USD | U.S. Dollar |
Fair Value Measurements
Various inputs are used in determining the value of the Fund’s investments. These inputs are summarized in three broad levels. Level 1 includes quoted prices in active markets for identical securities. Level 2 includes other significant observable inputs (including quoted prices for similar securities, interest rates, prepayment speeds and credit risk). Level 3 includes significant unobservable inputs (including the Fund’s own assumptions in determining the fair value of investments). The level assigned to the securities valuations may not be an indication of the risk or liquidity associated with investing in those securities.
| See Notes to Financial Statements. | 31 |
DBX ETF Trust
Schedule of Investments
Xtrackers MSCI All China Equity ETF (Continued)
May 31, 2023
The following is a summary of the inputs used as of May 31, 2023 in valuing the Fund’s investments. For information on the Fund’s policy regarding the valuation of investments, please refer to the Security Valuation section of Note 2 in the accompanying Notes to Financial Statements.
| Assets |
Level 1 | Level 2 | Level 3 | Total | ||||||||||||
| Common Stocks (a) |
$ | 3,248,545 | $ | — | $ | 0 | $ | 3,248,545 | ||||||||
| Exchange-Traded Funds |
3,443,294 | — | — | 3,443,294 | ||||||||||||
| Short-Term Investments (a) |
57,408 | — | — | 57,408 | ||||||||||||
|
|
|
|
|
|
|
|
|
|||||||||
| TOTAL |
$ | 6,749,247 | $ | — | $ | 0 | $ | 6,749,247 | ||||||||
|
|
|
|
|
|
|
|
|
|||||||||
| Liabilities |
Level 1 | Level 2 | Level 3 | Total | ||||||||||||
| Derivatives (b) |
||||||||||||||||
| Futures Contracts |
$ | (349 | ) | $ | — | $ | — | $ | (349 | ) | ||||||
|
|
|
|
|
|
|
|
|
|||||||||
| TOTAL |
$ | (349 | ) | $ | — | $ | — | $ | (349 | ) | ||||||
|
|
|
|
|
|
|
|
|
|||||||||
| (a) | See Schedule of Investments for additional detailed categorizations. |
| (b) | Derivatives include unrealized appreciation (depreciation) on open futures contracts. |
During the year ended May 31, 2023, the amount of transfers from Level 3 to Level 1 was $ 4,413. The investment was transferred from Level 3 to Level 1 due to the availability of a pricing source supported by observable inputs.
| See Notes to Financial Statements. | 32 |
DBX ETF Trust
Schedule of Investments
Xtrackers MSCI China A Inclusion Equity ETF
| Number |
Value |
|||||||
| COMMON STOCKS — 98.7% | ||||||||
| Communication Services — 1.7% | ||||||||
| 37 Interactive Entertainment Network Technology Group Co. Ltd., Class A |
2,300 | $ | 10,535 | |||||
| Beijing Enlight Media Co. Ltd., Class A |
2,500 | 3,091 | ||||||
| China United Network Communications Ltd., Class A |
31,000 | 21,404 | ||||||
| Focus Media Information Technology Co. Ltd., Class A |
13,223 | 11,913 | ||||||
| G-bits Network Technology Xiamen Co. Ltd., Class A |
100 | 7,857 | ||||||
| Giant Network Group Co. Ltd., Class A |
1,800 | 5,264 | ||||||
| Kunlun Tech Co. Ltd., Class A |
1,000 | 8,051 | ||||||
| Mango Excellent Media Co. Ltd., Class A |
1,500 | 6,159 | ||||||
| Perfect World Co. Ltd., Class A |
2,100 | 5,414 | ||||||
| Wanda Film Holding Co. Ltd., Class A* |
1,400 | 2,415 | ||||||
| Zhejiang Century Huatong Group Co. Ltd., Class A* |
8,220 | 7,175 | ||||||
|
|
|
|||||||
| (Cost $80,178) |
89,278 | |||||||
|
|
|
|||||||
| Consumer Discretionary — 5.6% | ||||||||
| AIMA Technology Group Co. Ltd., Class A |
500 | 2,659 | ||||||
| Bethel Automotive Safety Systems Co. Ltd., Class A |
400 | 3,975 | ||||||
| BTG Hotels Group Co. Ltd., Class A |
1,000 | 2,780 | ||||||
| BYD Co. Ltd., Class A |
1,698 | 60,444 | ||||||
| Changzhou Xingyu Automotive Lighting Systems Co. Ltd., Class A* |
300 | 4,461 | ||||||
| China Tourism Group Duty Free Corp. Ltd., Class A |
1,843 | 31,838 | ||||||
| Chongqing Changan Automobile Co. Ltd., Class A |
7,762 | 13,017 | ||||||
| Ecovacs Robotics Co. Ltd., Class A |
500 | 4,858 | ||||||
| Fuyao Glass Industry Group Co. Ltd., Class A |
2,009 | 9,146 | ||||||
| Great Wall Motor Co. Ltd., Class A* |
2,300 | 7,291 | ||||||
| Gree Electric Appliances, Inc. of Zhuhai, Class A |
2,800 | 12,959 | ||||||
| Guangzhou Automobile Group Co. Ltd., Class A |
4,900 | 7,007 | ||||||
| Haier Smart Home Co. Ltd., Class A |
5,800 | 17,484 | ||||||
| Hangzhou Robam Appliances Co. Ltd., Class A |
1,100 | 3,606 | ||||||
| Huayu Automotive Systems Co. Ltd., Class A |
3,300 | 8,086 | ||||||
| Huizhou Desay Sv Automotive Co. Ltd., Class A |
600 | 9,554 | ||||||
| Jason Furniture Hangzhou Co. Ltd., Class A |
410 | 2,031 | ||||||
| Ningbo Joyson Electronic Corp., Class A |
1,300 | 2,892 | ||||||
| Ningbo Tuopu Group Co. Ltd., Class A |
1,100 | 8,973 | ||||||
| Offcn Education Technology Co. Ltd., Class A* |
4,800 | 3,382 | ||||||
| Oppein Home Group, Inc., Class A |
540 | 7,188 | ||||||
| SAIC Motor Corp. Ltd., Class A |
6,627 | 12,481 | ||||||
| Sailun Group Co. Ltd., Class A* |
3,300 | 4,807 | ||||||
| Seres Group Co. Ltd., Class A* |
1,100 | 3,980 | ||||||
| Shandong Linglong Tyre Co. Ltd., Class A |
1,400 | 4,185 | ||||||
| Number |
Value |
|||||||
| Consumer Discretionary (Continued) | ||||||||
| Shanghai Jinjiang International Hotels Co. Ltd., Class A |
900 | $ | 5,922 | |||||
| Shanghai Yuyuan Tourist Mart Group Co. Ltd., Class A |
3,700 | 3,692 | ||||||
| Shenzhen Kedali Industry Co. Ltd., Class A |
200 | 3,568 | ||||||
| Shenzhen Overseas Chinese Town Co. Ltd., Class A |
8,300 | 5,533 | ||||||
| Songcheng Performance Development Co. Ltd., Class A |
2,843 | 5,067 | ||||||
| TCL Technology Group Corp., Class A |
18,700 | 10,130 | ||||||
| Wuchan Zhongda Group Co. Ltd., Class A |
5,500 | 3,975 | ||||||
| Zhejiang Supor Co. Ltd., Class A |
500 | 3,137 | ||||||
|
|
|
|||||||
| (Cost $234,425) |
290,108 | |||||||
|
|
|
|||||||
| Consumer Staples — 13.9% | ||||||||
| Angel Yeast Co. Ltd., Class A |
800 | 4,084 | ||||||
| Anhui Gujing Distillery Co. Ltd., Class A |
400 | 14,141 | ||||||
| Anhui Kouzi Distillery Co. Ltd., Class A |
400 | 3,037 | ||||||
| Anhui Yingjia Distillery Co. Ltd., Class A* |
500 | 3,960 | ||||||
| Anjoy Foods Group Co. Ltd., Class A |
300 | 6,489 | ||||||
| Beijing Dabeinong Technology Group Co. Ltd., Class A |
4,200 | 3,790 | ||||||
| Beijing Yanjing Brewery Co. Ltd., Class A |
3,100 | 5,029 | ||||||
| By-health Co. Ltd., Class A |
1,200 | 3,829 | ||||||
| Chongqing Brewery Co. Ltd., Class A |
500 | 6,260 | ||||||
| Chongqing Fuling Zhacai Group Co. Ltd., Class A* |
900 | 2,972 | ||||||
| DaShenLin Pharmaceutical Group Co. Ltd., Class A |
936 | 4,276 | ||||||
| Foshan Haitian Flavouring & Food Co. Ltd., Class A* |
3,592 | 30,500 | ||||||
| Fujian Sunner Development Co. Ltd., Class A |
800 | 2,124 | ||||||
| Guangdong Haid Group Co. Ltd., Class A |
1,400 | 9,085 | ||||||
| Hebei Hengshui Laobaigan Liquor Co. Ltd., Class A |
800 | 3,009 | ||||||
| Hebei Yangyuan Zhihui Beverage Co. Ltd., Class A |
1,100 | 4,163 | ||||||
| Heilongjiang Agriculture Co. Ltd., Class A |
2,000 | 3,753 | ||||||
| Henan Shuanghui Investment & Development Co. Ltd., Class A |
3,600 | 12,418 | ||||||
| Inner Mongolia Yili Industrial Group Co. Ltd., Class A |
6,013 | 24,311 | ||||||
| Jiangsu King’s Luck Brewery JSC Ltd., Class A* |
1,300 | 10,160 | ||||||
| Jiangsu Yanghe Brewery Joint-Stock Co. Ltd., Class A |
1,424 | 26,826 | ||||||
| JiuGui Liquor Co. Ltd., Class A |
300 | 3,987 | ||||||
| Jonjee Hi-Tech Industrial And Commercial Holding Co. Ltd., Class A |
800 | 4,081 | ||||||
| Juewei Food Co. Ltd., Class A |
600 | 3,222 | ||||||
| Kweichow Moutai Co. Ltd., Class A |
1,150 | 262,881 | ||||||
| Luzhou Laojiao Co. Ltd., Class A |
1,406 | 40,257 | ||||||
| MeiHua Holdings Group Co. Ltd., Class A |
2,500 | 3,137 | ||||||
| Muyuan Foods Co. Ltd., Class A |
5,285 | 29,704 | ||||||
| New Hope Liuhe Co. Ltd., Class A* |
4,072 | 6,440 | ||||||
| See Notes to Financial Statements. | 33 |
DBX ETF Trust
Schedule of Investments
Xtrackers MSCI China A Inclusion Equity ETF (Continued)
May 31, 2023
| Number |
Value |
|||||||
| Consumer Staples (Continued) | ||||||||
| Shanghai Bairun Investment Holding Group Co. Ltd., Class A |
1,092 | $ | 5,215 | |||||
| Shanxi Xinghuacun Fen Wine Factory Co. Ltd., Class A |
1,174 | 34,570 | ||||||
| Shede Spirits Co. Ltd., Class A |
300 | 6,652 | ||||||
| Sichuan Swellfun Co. Ltd., Class A |
500 | 4,091 | ||||||
| Toly Bread Co. Ltd., Class A |
1,435 | 2,104 | ||||||
| Tsingtao Brewery Co. Ltd., Class A |
700 | 9,353 | ||||||
| Wens Foodstuffs Group Co. Ltd., Class A |
5,344 | 12,614 | ||||||
| Wuliangye Yibin Co. Ltd., Class A |
3,654 | 82,651 | ||||||
| Yifeng Pharmacy Chain Co. Ltd., Class A |
686 | 4,777 | ||||||
| Yihai Kerry Arawana Holdings Co. Ltd., Class A |
1,000 | 5,641 | ||||||
| Yonghui Superstores Co. Ltd., Class A |
8,100 | 3,649 | ||||||
| Yuan Longping High-tech Agriculture Co. Ltd., Class A* |
1,200 | 2,469 | ||||||
| Yunnan Botanee Bio-Technology Group Co. Ltd., Class A |
300 | 3,882 | ||||||
|
|
|
|||||||
| (Cost $443,533) |
715,593 | |||||||
|
|
|
|||||||
| Energy — 3.1% | ||||||||
| China Merchants Energy Shipping Co. Ltd., Class A |
8,100 | 6,491 | ||||||
| China Petroleum & Chemical Corp., Class A |
29,750 | 26,553 | ||||||
| China Shenhua Energy Co. Ltd., Class A |
6,200 | 24,562 | ||||||
| COSCO SHIPPING Energy Transportation Co. Ltd., Class A* |
3,600 | 5,653 | ||||||
| Guanghui Energy Co. Ltd., Class A |
6,600 | 6,724 | ||||||
| Inner Mongolia Dian Tou Energy Corp. Ltd., Class A |
1,800 | 3,352 | ||||||
| Jizhong Energy Resources Co. Ltd., Class A |
3,300 | 3,367 | ||||||
| Offshore Oil Engineering Co. Ltd., Class A |
3,900 | 3,360 | ||||||
| PetroChina Co. Ltd., Class A |
19,635 | 20,666 | ||||||
| Pingdingshan Tianan Coal Mining Co. Ltd., Class A |
2,200 | 2,467 | ||||||
| Shaanxi Coal Industry Co. Ltd., Class A |
9,799 | 23,047 | ||||||
| Shan Xi Hua Yang Group New Energy Co. Ltd., Class A |
2,200 | 3,853 | ||||||
| Shanxi Coking Coal Energy Group Co. Ltd., Class A |
5,600 | 7,741 | ||||||
| Shanxi Lu’an Environmental Energy Development Co. Ltd., Class A |
3,200 | 8,398 | ||||||
| Yankuang Energy Group Co. Ltd., Class A |
2,500 | 9,518 | ||||||
| Yantai Jereh Oilfield Services Group Co. Ltd., Class A* |
1,100 | 3,767 | ||||||
|
|
|
|||||||
| (Cost $112,232) |
159,519 | |||||||
|
|
|
|||||||
| Financials — 18.1% | ||||||||
| Agricultural Bank of China Ltd., Class A |
80,217 | 39,626 | ||||||
| AVIC Industry-Finance Holdings Co. Ltd., Class A |
9,710 | 5,260 | ||||||
| Bank of Beijing Co. Ltd., Class A |
21,314 | 14,148 | ||||||
| Bank of Changsha Co. Ltd., Class A |
3,800 | 4,277 | ||||||
| Bank of Chengdu Co. Ltd., Class A |
3,750 | 6,615 | ||||||
| Bank of China Ltd., Class A |
33,012 | 18,068 | ||||||
| Bank of Communications Co. Ltd., Class A |
36,538 | 29,996 | ||||||
| Number |
Value |
|||||||
| Financials (Continued) | ||||||||
| Bank of Hangzhou Co. Ltd., Class A |
6,240 | $ | 10,167 | |||||
| Bank of Jiangsu Co. Ltd., Class A* |
14,499 | 15,098 | ||||||
| Bank of Nanjing Co. Ltd., Class A |
9,300 | 11,015 | ||||||
| Bank of Ningbo Co. Ltd., Class A |
6,155 | 21,249 | ||||||
| Bank of Shanghai Co. Ltd., Class A |
14,135 | 12,239 | ||||||
| Bank of Suzhou Co. Ltd., Class A |
3,400 | 3,245 | ||||||
| BOC International China Co. Ltd., Class A |
2,800 | 4,275 | ||||||
| Caitong Securities Co. Ltd., Class A |
4,810 | 5,049 | ||||||
| Changjiang Securities Co. Ltd., Class A |
3,600 | 3,036 | ||||||
| China Construction Bank Corp., Class A |
9,700 | 8,712 | ||||||
| China Everbright Bank Co. Ltd., Class A |
41,531 | 18,359 | ||||||
| China Galaxy Securities Co. Ltd., Class A |
3,700 | 5,899 | ||||||
| China Great Wall Securities Co. Ltd., |
2,700 | 3,202 | ||||||
| China International Capital Corp. Ltd., Class A |
1,200 | 7,014 | ||||||
| China Life Insurance Co. Ltd., Class A |
2,514 | 13,174 | ||||||
| China Merchants Bank Co. Ltd., Class A |
19,343 | 87,678 | ||||||
| China Merchants Securities Co. Ltd., Class A |
6,131 | 11,968 | ||||||
| China Minsheng Banking Corp. Ltd., Class A |
32,971 | 18,323 | ||||||
| China Pacific Insurance Group Co. Ltd., Class A |
6,277 | 24,533 | ||||||
| China Zheshang Bank Co. Ltd., Class A |
16,300 | 6,565 | ||||||
| Chongqing Rural Commercial Bank Co. Ltd., Class A |
7,700 | 4,268 | ||||||
| CITIC Securities Co. Ltd., Class A |
11,493 | 32,338 | ||||||
| CSC Financial Co. Ltd., Class A |
4,200 | 14,965 | ||||||
| Dongxing Securities Co. Ltd., Class A |
3,100 | 3,563 | ||||||
| East Money Information Co. Ltd., Class A |
15,729 | 30,947 | ||||||
| Everbright Securities Co. Ltd., Class A |
4,237 | 9,418 | ||||||
| First Capital Securities Co. Ltd., Class A |
4,000 | 3,295 | ||||||
| Founder Securities Co. Ltd., Class A |
6,000 | 5,877 | ||||||
| GF Securities Co. Ltd., Class A |
5,900 | 12,337 | ||||||
| Guangzhou Yuexiu Capital Holdings Group Co. Ltd., Class A |
3,867 | 3,668 | ||||||
| Guolian Securities Co. Ltd., Class A |
2,100 | 2,829 | ||||||
| Guosen Securities Co. Ltd., Class A |
6,700 | 8,660 | ||||||
| Guotai Junan Securities Co. Ltd., Class A |
7,051 | 14,645 | ||||||
| Guoyuan Securities Co. Ltd., Class A |
4,690 | 4,410 | ||||||
| Haitong Securities Co. Ltd., Class A |
8,914 | 11,771 | ||||||
| Hithink RoyalFlush Information Network Co. Ltd., Class A |
500 | 11,286 | ||||||
| Huatai Securities Co. Ltd., Class A |
6,880 | 13,063 | ||||||
| Huaxi Securities Co. Ltd., Class A |
2,800 | 3,261 | ||||||
| Huaxia Bank Co. Ltd., Class A |
12,598 | 10,219 | ||||||
| Industrial & Commercial Bank of China Ltd., Class A |
59,233 | 40,149 | ||||||
| Industrial Bank Co. Ltd., Class A |
19,485 | 45,282 | ||||||
| Industrial Securities Co. Ltd., Class A |
8,720 | 7,489 | ||||||
| Nanjing Securities Co. Ltd., Class A |
3,400 | 4,070 | ||||||
| New China Life Insurance Co. Ltd., Class A |
1,964 | 10,140 | ||||||
| Orient Securities Co. Ltd., Class A |
6,385 | 8,862 | ||||||
| People’s Insurance Co. Group of China Ltd., Class A |
9,600 | 8,245 | ||||||
| Ping An Bank Co. Ltd., Class A |
18,166 | 29,572 | ||||||
| See Notes to Financial Statements. | 34 |
DBX ETF Trust
Schedule of Investments
Xtrackers MSCI China A Inclusion Equity ETF (Continued)
May 31, 2023
| Number |
Value |
|||||||
| Financials (Continued) | ||||||||
| Ping An Insurance Group Co. of China Ltd., Class A |
10,109 | $ | 66,676 | |||||
| Postal Savings Bank of China Co. Ltd., Class A |
26,700 | 19,259 | ||||||
| SDIC Capital Co. Ltd., Class A |
5,700 | 5,911 | ||||||
| Shanghai Pudong Development Bank Co. Ltd., Class A |
27,527 | 28,393 | ||||||
| Shanghai Rural Commercial Bank Co. Ltd., Class A |
7,500 | 6,210 | ||||||
| Shanxi Securities Co. Ltd., Class A |
3,680 | 3,006 | ||||||
| Shenwan Hongyuan Group Co. Ltd., Class A |
21,195 | 14,039 | ||||||
| Sinolink Securities Co. Ltd., Class A |
2,000 | 2,464 | ||||||
| SooChow Securities Co. Ltd., Class A |
5,373 | 5,421 | ||||||
| Southwest Securities Co. Ltd., Class A |
4,200 | 2,193 | ||||||
| Western Securities Co. Ltd., Class A |
4,600 | 4,183 | ||||||
| Zheshang Securities Co. Ltd., Class A |
4,100 | 5,754 | ||||||
| Zhongtai Securities Co. Ltd., Class A |
6,200 | 5,925 | ||||||
|
|
|
|||||||
| (Cost $947,468) |
932,853 | |||||||
|
|
|
|||||||
| Health Care — 8.8% | ||||||||
| Aier Eye Hospital Group Co. Ltd., Class A |
7,168 | 26,959 | ||||||
| Apeloa Pharmaceutical Co. Ltd., Class A |
1,300 | 3,384 | ||||||
| Asymchem Laboratories Tianjin Co. Ltd., Class A |
320 | 5,919 | ||||||
| Autobio Diagnostics Co. Ltd., Class A |
500 | 3,985 | ||||||
| Beijing Tiantan Biological Products Corp. Ltd., Class A |
1,500 | 5,873 | ||||||
| Beijing Tongrentang Co. Ltd., Class A |
1,200 | 10,203 | ||||||
| Beijing Wantai Biological Pharmacy Enterprise Co. Ltd., Class A* |
580 | 7,570 | ||||||
| Betta Pharmaceuticals Co. Ltd., Class A* |
400 | 3,164 | ||||||
| BGI Genomics Co. Ltd., Class A |
400 | 3,306 | ||||||
| Bloomage Biotechnology Corp. Ltd., |
303 | 3,746 | ||||||
| Changchun High & New Technology Industry Group, Inc., Class A |
400 | 8,948 | ||||||
| China Meheco Co. Ltd., Class A |
1,400 | 2,711 | ||||||
| China National Medicines Corp. Ltd., Class A |
700 | 3,929 | ||||||
| China Resources Sanjiu Medical & Pharmaceutical Co. Ltd., Class A |
1,075 | 9,854 | ||||||
| Chongqing Zhifei Biological Products Co. Ltd., Class A |
1,400 | 13,810 | ||||||
| Daan Gene Co. Ltd., Class A* |
1,496 | 2,570 | ||||||
|
Dong-E-E-Jiao Co. Ltd., Class A |
500 | 3,464 | ||||||
| Guangzhou Baiyunshan Pharmaceutical Holdings Co. Ltd., Class A |
1,500 | 7,557 | ||||||
| Guangzhou Kingmed Diagnostics Group Co. Ltd., Class A |
500 | 4,851 | ||||||
| Hangzhou Tigermed Consulting Co. Ltd., Class A* |
350 | 3,969 | ||||||
| Huadong Medicine Co. Ltd., Class A |
1,560 | 8,525 | ||||||
| Hualan Biological Engineering, Inc., Class A |
1,840 | 5,818 | ||||||
| Hubei Jumpcan Pharmaceutical Co. Ltd., Class A* |
900 | 4,005 | ||||||
| Number |
Value |
|||||||
| Health Care (Continued) | ||||||||
| Humanwell Healthcare Group Co. Ltd., Class A |
1,200 | $ | 4,422 | |||||
| Imeik Technology Development Co. Ltd., Class A |
200 | 12,647 | ||||||
| Jafron Biomedical Co. Ltd., Class A |
750 | 2,908 | ||||||
| Jiangsu Hengrui Pharmaceuticals Co. Ltd., Class A |
5,976 | 38,200 | ||||||
| Jiangsu Yuyue Medical Equipment & Supply Co. Ltd., Class A |
1,000 | 4,689 | ||||||
| Joincare Pharmaceutical Group Industry Co. Ltd., Class A |
1,300 | 2,505 | ||||||
| Joinn Laboratories China Co. Ltd., Class A |
420 | 2,665 | ||||||
| Jointown Pharmaceutical Group Co. Ltd., Class A |
1,500 | 3,414 | ||||||
| Kangmei Pharmaceutical Co. Ltd., Class A* |
12,413 | 4,094 | ||||||
| Lepu Medical Technology Beijing Co. Ltd., Class A |
2,000 | 6,933 | ||||||
| Livzon Pharmaceutical Group, Inc., |
600 | 3,299 | ||||||
| Meinian Onehealth Healthcare Holdings Co. Ltd., Class A* |
4,132 | 3,699 | ||||||
| Nanjing King-Friend Biochemical Pharmaceutical Co. Ltd., Class A |
923 | 1,754 | ||||||
| Ovctek China, Inc., Class A |
860 | 3,367 | ||||||
| Pharmaron Beijing Co. Ltd., Class A |
650 | 4,205 | ||||||
| Porton Pharma Solutions Ltd., Class A |
500 | 2,158 | ||||||
| Shandong Buchang Pharmaceuticals Co. Ltd., Class A |
1,238 | 3,939 | ||||||
| Shanghai Fosun Pharmaceutical Group Co. Ltd., Class A |
2,200 | 9,626 | ||||||
| Shanghai Junshi Biosciences Co. Ltd., Class A* |
745 | 4,757 | ||||||
| Shanghai Pharmaceuticals Holding Co. Ltd., Class A |
2,800 | 9,214 | ||||||
| Shanghai RAAS Blood Products Co. Ltd., Class A |
7,400 | 6,979 | ||||||
| Shenzhen Kangtai Biological Products Co. Ltd., Class A |
820 | 3,198 | ||||||
| Shenzhen Mindray Bio-Medical Electronics Co. Ltd., Class A |
1,100 | 46,400 | ||||||
| Shenzhen New Industries Biomedical Engineering Co. Ltd., Class A |
700 | 5,885 | ||||||
| Shenzhen Salubris Pharmaceuticals Co. Ltd., Class A |
1,200 | 5,906 | ||||||
| Shijiazhuang Yiling Pharmaceutical Co. Ltd., Class A |
1,780 | 7,157 | ||||||
| Sichuan Kelun Pharmaceutical Co. Ltd., Class A |
1,200 | 5,215 | ||||||
| Topchoice Medical Corp., Class A* |
300 | 4,452 | ||||||
| Walvax Biotechnology Co. Ltd., Class A |
1,300 | 5,271 | ||||||
| WuXi AppTec Co. Ltd., Class A |
2,536 | 23,133 | ||||||
| Yunnan Baiyao Group Co. Ltd., Class A |
1,778 | 13,436 | ||||||
| Zhangzhou Pientzehuang Pharmaceutical Co. Ltd., Class A |
596 | 25,443 | ||||||
| Zhejiang Huahai Pharmaceutical Co. Ltd., Class A |
1,420 | 3,677 | ||||||
| See Notes to Financial Statements. | 35 |
DBX ETF Trust
Schedule of Investments
Xtrackers MSCI China A Inclusion Equity ETF (Continued)
May 31, 2023
| Number |
Value |
|||||||
| Health Care (Continued) | ||||||||
| Zhejiang Jiuzhou Pharmaceutical Co. Ltd., Class A |
400 | $ | 1,635 | |||||
| Zhejiang NHU Co. Ltd., Class A* |
3,264 | 6,917 | ||||||
| Zhejiang Wolwo Bio-Pharmaceutical Co. Ltd., Class A |
500 | 2,675 | ||||||
|
|
|
|||||||
| (Cost $399,340) |
449,994 | |||||||
|
|
|
|||||||
| Industrials — 15.7% | ||||||||
| AECC Aero-Engine Control Co. Ltd., Class A |
1,200 | 4,005 | ||||||
| AECC Aviation Power Co. Ltd., Class A |
2,400 | 13,388 | ||||||
| Air China Ltd., Class A* |
6,500 | 7,954 | ||||||
| AVICOPTER PLC, Class A |
400 | 2,194 | ||||||
| Beijing Easpring Material Technology Co. Ltd., Class A* |
500 | 3,441 | ||||||
| Beijing New Building Materials PLC, Class A |
1,300 | 4,147 | ||||||
| Beijing United Information Technology Co. Ltd., Class A* |
535 | 3,442 | ||||||
| Beijing-Shanghai High Speed Railway Co. Ltd., Class A |
30,000 | 24,292 | ||||||
| China Baoan Group Co. Ltd., Class A |
2,700 | 4,581 | ||||||
| China CSSC Holdings Ltd., Class A |
4,400 | 17,796 | ||||||
| China Eastern Airlines Corp. Ltd., Class A* |
11,500 | 7,537 | ||||||
| China Energy Engineering Corp. Ltd., Class A |
33,700 | 11,350 | ||||||
| China National Chemical Engineering Co. Ltd., Class A |
5,200 | 6,239 | ||||||
| China Railway Group Ltd., Class A |
19,000 | 21,038 | ||||||
| China Southern Airlines Co. Ltd., Class A* |
10,800 | 9,503 | ||||||
| China State Construction Engineering Corp. Ltd., Class A |
39,400 | 32,622 | ||||||
| Contemporary Amperex Technology Co. Ltd., Class A |
4,220 | 130,980 | ||||||
| COSCO SHIPPING Development Co. Ltd., Class A |
10,800 | 3,789 | ||||||
| COSCO SHIPPING Holdings Co. Ltd., Class A |
12,850 | 18,827 | ||||||
| CRRC Corp. Ltd., Class A |
23,100 | 22,822 | ||||||
| Dajin Heavy Industry Co. Ltd., Class A |
500 | 2,328 | ||||||
| Daqin Railway Co. Ltd., Class A |
14,200 | 15,225 | ||||||
| Dongfang Electric Corp. Ltd., Class A |
3,000 | 7,578 | ||||||
| Eve Energy Co. Ltd., Class A |
1,962 | 17,622 | ||||||
| Fangda Carbon New Material Co. Ltd., Class A* |
4,273 | 3,790 | ||||||
| FAW Jiefang Group Co. Ltd., Class A |
3,200 | 3,637 | ||||||
| Ginlong Technologies Co. Ltd., Class A* |
350 | 4,902 | ||||||
| GoodWe Technologies Co. Ltd., Class A |
126 | 4,124 | ||||||
| Gotion High-tech Co. Ltd., Class A |
1,600 | 5,975 | ||||||
| Guangdong Kinlong Hardware Products Co. Ltd., Class A |
300 | 2,664 | ||||||
| Guangzhou Baiyun International Airport Co. Ltd., Class A* |
2,000 | 3,986 | ||||||
| Guangzhou Great Power Energy & Technology Co. Ltd., Class A |
400 | 2,632 | ||||||
| Hainan Airlines Holding Co. Ltd., Class A* |
38,000 | 9,119 | ||||||
| Hongfa Technology Co. Ltd., Class A |
420 | 1,785 | ||||||
| Number |
Value |
|||||||
| Industrials (Continued) | ||||||||
| Hoyuan Green Energy Co. Ltd., Class A |
420 | $ | 4,552 | |||||
| Jiangsu Hengli Hydraulic Co. Ltd., Class A |
1,308 | 10,015 | ||||||
| Jiangsu Zhongtian Technology Co. Ltd., Class A |
3,400 | 6,938 | ||||||
| Jiangxi Special Electric Motor Co. Ltd., Class A* |
1,700 | 2,777 | ||||||
| Juneyao Airlines Co. Ltd., Class A* |
1,800 | 3,966 | ||||||
| Keda Industrial Group Co. Ltd., Class A |
1,800 | 2,680 | ||||||
| Kuang-Chi Technologies Co. Ltd., Class A |
2,200 | 4,903 | ||||||
| Liaoning Port Co. Ltd., Class A |
14,800 | 3,261 | ||||||
| Metallurgical Corp. of China Ltd., Class A |
16,314 | 9,226 | ||||||
| Ming Yang Smart Energy Group Ltd., Class A |
2,200 | 5,425 | ||||||
| NARI Technology Co. Ltd., Class A |
6,240 | 24,029 | ||||||
| Ningbo Deye Technology Co. Ltd., Class A |
360 | 6,843 | ||||||
| Ningbo Orient Wires & Cables Co. Ltd., Class A |
700 | 4,813 | ||||||
| Ningbo Ronbay New Energy Technology Co. Ltd., Class A |
469 | 3,788 | ||||||
| North Industries Group Red Arrow Co. Ltd., Class A |
1,400 | 3,536 | ||||||
| Power Construction Corp. of China Ltd., Class A |
15,500 | 14,422 | ||||||
| Pylon Technologies Co. Ltd., Class A |
159 | 4,410 | ||||||
| Riyue Heavy Industry Co. Ltd., Class A |
600 | 1,793 | ||||||
| Sany Heavy Industry Co. Ltd., Class A |
8,150 | 16,790 | ||||||
| SF Holding Co. Ltd., Class A |
4,600 | 30,553 | ||||||
| Shanghai Construction Group Co. Ltd., Class A |
8,700 | 3,223 | ||||||
| Shanghai Electric Group Co. Ltd., Class A* |
13,700 | 9,286 | ||||||
| Shanghai International Airport Co. Ltd., Class A* |
995 | 6,507 | ||||||
| Shanghai International Port Group Co. Ltd., Class A |
6,500 | 4,807 | ||||||
| Shanghai M&G Stationery, Inc., Class A |
900 | 5,370 | ||||||
| Shanxi Coal International Energy Group Co. Ltd., Class A |
1,000 | 1,892 | ||||||
| Shenzhen Inovance Technology Co. Ltd., Class A |
1,400 | 11,609 | ||||||
| Shenzhen Kstar Science And Technology Co. Ltd., Class A |
600 | 3,261 | ||||||
| Shuangliang Eco-Energy Systems Co. Ltd., Class A |
1,600 | 2,872 | ||||||
| Sichuan New Energy Power Co. Ltd.* |
1,600 | 3,146 | ||||||
| Sichuan Road & Bridge Group Co. Ltd., Class A |
5,200 | 11,092 | ||||||
| Sieyuan Electric Co. Ltd., Class A |
600 | 3,986 | ||||||
| Sinoma International Engineering Co., Class A |
1,900 | 3,546 | ||||||
| Spring Airlines Co. Ltd., Class A* |
900 | 7,300 | ||||||
| Sungrow Power Supply Co. Ltd., Class A |
1,500 | 23,185 | ||||||
| Sunwoda Electronic Co. Ltd., Class A |
1,800 | 4,021 | ||||||
| Suzhou Maxwell Technologies Co. Ltd., Class A |
256 | 5,676 | ||||||
| TBEA Co. Ltd., Class A |
3,481 | 10,928 | ||||||
| Titan Wind Energy Suzhou Co. Ltd., Class A |
1,800 | 3,930 | ||||||
| See Notes to Financial Statements. | 36 |
DBX ETF Trust
Schedule of Investments
Xtrackers MSCI China A Inclusion Equity ETF (Continued)
May 31, 2023
| Number |
Value |
|||||||
| Industrials (Continued) | ||||||||
| Weichai Power Co. Ltd., Class A |
6,900 | $ | 11,194 | |||||
| XCMG Construction Machinery Co. Ltd., Class A |
11,749 | 9,860 | ||||||
| Xiamen C & D, Inc., Class A |
2,900 | 4,725 | ||||||
| Xinjiang Goldwind Science & Technology Co. Ltd., Class A |
3,343 | 5,104 | ||||||
| YTO Express Group Co. Ltd., Class A |
3,700 | 7,991 | ||||||
| Yunda Holding Co. Ltd., Class A |
2,810 | 4,495 | ||||||
| Zhefu Holding Group Co. Ltd., Class A |
5,000 | 2,856 | ||||||
| Zhejiang Chint Electrics Co. Ltd., Class A |
1,717 | 6,301 | ||||||
| Zhejiang Dingli Machinery Co. Ltd., Class A |
280 | 1,852 | ||||||
| Zhejiang Sanhua Intelligent Controls Co. Ltd., Class A |
1,600 | 5,836 | ||||||
| Zhejiang Weiming Environment Protection Co. Ltd., Class A |
1,590 | 4,041 | ||||||
| Zhejiang Weixing New Building Materials Co. Ltd., Class A |
1,700 | 4,607 | ||||||
| Zhuzhou CRRC Times Electric Co. Ltd., Class A |
728 | 4,675 | ||||||
| Zhuzhou Kibing Group Co. Ltd., Class A* |
3,000 | 3,402 | ||||||
| Zoomlion Heavy Industry Science and Technology Co. Ltd., Class A |
7,750 | 6,884 | ||||||
|
|
|
|||||||
| (Cost $654,926) |
809,494 | |||||||
|
|
|
|||||||
| Information Technology — 14.9% | ||||||||
| 360 Security Technology, Inc., Class A |
6,500 | 12,725 | ||||||
| 3peak, Inc., Class A (a) |
121 | 3,854 | ||||||
| Advanced Micro-Fabrication Equipment Inc China, Class A* |
580 | 14,109 | ||||||
| Amlogic Shanghai Co. Ltd., Class A* |
386 | 4,863 | ||||||
| ASR Microelectronics Co. Ltd., Class A* |
300 | 3,338 | ||||||
| Avary Holding Shenzhen Co. Ltd., Class A |
2,000 | 7,135 | ||||||
| Beijing E-Hualu Information Technology Co. Ltd., Class A* |
600 | 3,112 | ||||||
| Beijing Kingsoft Office Software, Inc., Class A* |
421 | 25,523 | ||||||
| Beijing Shiji Information Technology Co. Ltd., Class A |
1,736 | 4,748 | ||||||
| BOE Technology Group Co. Ltd., Class A* |
37,702 | 21,005 | ||||||
| CETC Cyberspace Security Technology Co. Ltd., Class A |
800 | 3,323 | ||||||
| Chaozhou Three-Circle Group Co. Ltd., Class A |
1,758 | 7,438 | ||||||
| China Greatwall Technology Group Co. Ltd., Class A |
3,400 | 5,745 | ||||||
| China National Software & Service Co. Ltd., Class A |
600 | 5,114 | ||||||
| China Railway Signal & Communication Corp. Ltd., Class A |
7,720 | 6,457 | ||||||
| China Resources Microelectronics Ltd., Class A |
1,151 | 9,608 | ||||||
| China Zhenhua Group Science & Technology Co. Ltd., Class A |
500 | 6,469 | ||||||
| DHC Software Co. Ltd., Class A |
2,500 | 2,586 | ||||||
| Flat Glass Group Co. Ltd., Class A |
1,700 | 7,701 | ||||||
| Foxconn Industrial Internet Co. Ltd., Class A |
9,300 | 23,557 | ||||||
| Number |
Value |
|||||||
| Information Technology (Continued) | ||||||||
| GalaxyCore, Inc., Class A* |
1,545 | $ | 3,558 | |||||
| GigaDevice Semiconductor, Inc., Class A |
612 | 9,516 | ||||||
| GoerTek, Inc., Class A |
3,577 | 9,226 | ||||||
| GRG Banking Equipment Co. Ltd., Class A |
2,600 | 4,554 | ||||||
| Guangzhou Haige Communications Group, Inc. Co., Class A |
1,800 | 2,534 | ||||||
| Guangzhou Shiyuan Electronic Technology Co. Ltd., Class A* |
700 | 6,095 | ||||||
| Hangzhou Chang Chuan Technology Co. Ltd., Class A |
600 | 4,253 | ||||||
| Hangzhou First Applied Material Co. Ltd., Class A |
1,881 | 8,088 | ||||||
| Hangzhou Lion Electronics Co. Ltd., |
700 | 4,002 | ||||||
| Hangzhou Silan Microelectronics Co. Ltd., Class A |
1,400 | 6,277 | ||||||
| Hengdian Group DMEGC Magnetics Co. Ltd., Class A |
1,600 | 4,069 | ||||||
| Hengtong Optic-electric Co. Ltd., Class A |
2,300 | 4,667 | ||||||
| Hundsun Technologies, Inc., Class A |
1,946 | 11,601 | ||||||
| Iflytek Co. Ltd., Class A |
2,134 | 17,894 | ||||||
| Ingenic Semiconductor Co. Ltd., Class A |
500 | 6,625 | ||||||
| Inspur Electronic Information Industry Co. Ltd., Class A* |
1,288 | 8,054 | ||||||
| Isoftstone Information Technology Group Co. Ltd., Class A |
300 | 1,736 | ||||||
| JA Solar Technology Co. Ltd., Class A |
3,332 | 16,834 | ||||||
| JCET Group Co. Ltd., Class A |
1,400 | 6,130 | ||||||
| Jiangsu Pacific Quartz Co. Ltd., Class A |
300 | 4,791 | ||||||
| Jinko Solar Co. Ltd., Class A |
5,700 | 10,183 | ||||||
| Lens Technology Co. Ltd., Class A |
5,400 | 8,813 | ||||||
| Lingyi iTech Guangdong Co., Class A* |
7,700 | 6,808 | ||||||
| LONGi Green Energy Technology Co. Ltd., Class A |
7,603 | 30,750 | ||||||
| Luxshare Precision Industry Co. Ltd., Class A |
7,033 | 26,944 | ||||||
| Maxscend Microelectronics Co. Ltd., Class A |
512 | 6,369 | ||||||
| Montage Technology Co. Ltd., Class A |
1,184 | 10,601 | ||||||
| National Silicon Industry Group Co. Ltd., Class A* |
2,000 | 6,287 | ||||||
| NAURA Technology Group Co. Ltd., Class A |
500 | 21,292 | ||||||
| NavInfo Co. Ltd., Class A |
2,200 | 3,618 | ||||||
| Ninestar Corp., Class A |
1,200 | 6,586 | ||||||
| Qi An Xin Technology Group, Inc., |
600 | 5,003 | ||||||
| Raytron Technology Co. Ltd., Class A |
495 | 3,449 | ||||||
| Risen Energy Co. Ltd., Class A* |
1,000 | 3,284 | ||||||
| Rockchip Electronics Co. Ltd., Class A |
300 | 3,690 | ||||||
| Sangfor Technologies, Inc., Class A |
400 | 6,995 | ||||||
| SG Micro Corp., Class A |
375 | 5,707 | ||||||
| Shanghai Aiko Solar Energy Co. Ltd., |
1,100 | 5,321 | ||||||
| Shanghai Baosight Software Co. Ltd., Class A |
1,351 | 10,054 | ||||||
| See Notes to Financial Statements. | 37 |
DBX ETF Trust
Schedule of Investments
Xtrackers MSCI China A Inclusion Equity ETF (Continued)
May 31, 2023
| Number |
Value |
|||||||
| Information Technology (Continued) | ||||||||
| Shanghai Friendess Electronic Technology Corp. Ltd., Class A* |
128 | $ | 3,590 | |||||
| Shanghai Fudan Microelectronics Group Co. Ltd., Class A |
500 | 4,005 | ||||||
| Shengyi Technology Co. Ltd., Class A |
1,800 | 3,855 | ||||||
| Shennan Circuits Co. Ltd., Class A |
380 | 4,178 | ||||||
| Shenzhen Kaifa Technology Co. Ltd., Class A |
1,200 | 3,855 | ||||||
| Shenzhen SC New Energy Technology Corp., Class A |
300 | 4,026 | ||||||
| Shenzhen Sunlord Electronics Co. Ltd., Class A |
800 | 2,599 | ||||||
| Shenzhen Transsion Holdings Co. Ltd., Class A |
696 | 12,282 | ||||||
| StarPower Semiconductor Ltd., Class A |
200 | 6,122 | ||||||
| Suzhou Dongshan Precision Manufacturing Co. Ltd., Class A |
1,800 | 6,419 | ||||||
| TCL Zhonghuan Renewable Energy Technology Co. Ltd., Class A |
3,200 | 16,683 | ||||||
| Thunder Software Technology Co. Ltd., Class A |
500 | 6,862 | ||||||
| Tianjin 712 Communication & Broadcasting Co. Ltd., Class A |
800 | 3,457 | ||||||
| Tianma Microelectronics Co. Ltd., Class A* |
2,500 | 3,393 | ||||||
| Tianshui Huatian Technology Co. Ltd., Class A |
2,200 | 3,001 | ||||||
| TongFu Microelectronics Co. Ltd., Class A |
1,200 | 4,171 | ||||||
| Tongwei Co. Ltd., Class A |
4,400 | 21,068 | ||||||
| Trina Solar Co. Ltd., Class A |
2,171 | 11,973 | ||||||
| Unigroup Guoxin Microelectronics Co. Ltd., Class A |
839 | 10,850 | ||||||
| Unisplendour Corp. Ltd., Class A |
2,508 | 11,481 | ||||||
| Universal Scientific Industrial Shanghai Co. Ltd., Class A |
1,700 | 3,354 | ||||||
| Will Semiconductor Co. Ltd., Class A |
1,215 | 17,032 | ||||||
| Wingtech Technology Co. Ltd., Class A |
1,264 | 8,851 | ||||||
| Wuhan Guide Infrared Co. Ltd., Class A* |
3,323 | 4,789 | ||||||
| WUS Printed Circuit Kunshan Co. Ltd., Class A |
1,610 | 4,720 | ||||||
| Wuxi Autowell Technology Co. Ltd., Class A |
160 | 3,949 | ||||||
| Xiamen Faratronic Co. Ltd., Class A |
200 | 3,761 | ||||||
| Yangzhou Yangjie Electronic Technology Co. Ltd., Class A* |
500 | 2,891 | ||||||
| Yealink Network Technology Corp. Ltd., Class A* |
900 | 6,694 | ||||||
| Yonyou Network Technology Co. Ltd., Class A |
3,026 | 8,442 | ||||||
| Zhejiang Dahua Technology Co. Ltd., Class A |
3,200 | 8,910 | ||||||
| Zhejiang Jingsheng Mechanical & Electrical Co. Ltd., Class A |
1,300 | 12,579 | ||||||
| Zhejiang Supcon Technology Co. Ltd., Class A |
400 | 5,806 | ||||||
| Zhongji Innolight Co. Ltd., Class A* |
800 | 12,069 | ||||||
| ZTE Corp., Class A |
3,700 | 18,267 | ||||||
|
|
|
|||||||
| (Cost $652,210) |
766,652 | |||||||
|
|
|
|||||||
| Number |
Value |
|||||||
| Materials — 11.2% | ||||||||
| Aluminum Corp. of China Ltd., Class A |
13,408 | $ | 10,180 | |||||
| Anhui Conch Cement Co. Ltd., Class A |
3,564 | 12,534 | ||||||
| Anhui Honglu Steel Construction Group Co. Ltd., Class A |
780 | 3,078 | ||||||
| Asia — Potash International Investment Guangzhou Co. Ltd., Class A* |
500 | 1,623 | ||||||
| Baoshan Iron & Steel Co. Ltd., Class A |
20,657 | 17,046 | ||||||
| BBMG Corp., Class A |
9,500 | 2,906 | ||||||
| Canmax Technologies Co. Ltd., Class A |
780 | 3,663 | ||||||
| Chengxin Lithium Group Co. Ltd., Class A |
800 | 3,393 | ||||||
| Chifeng Jilong Gold Mining Co. Ltd., |
1,400 | 3,149 | ||||||
| China Jushi Co. Ltd., Class A |
3,672 | 7,024 | ||||||
| China Northern Rare Earth Group High-Tech Co. Ltd., Class A |
3,793 | 12,700 | ||||||
| China Rare Earth Resources And Technology Co. Ltd., Class A* |
1,100 | 4,816 | ||||||
| CMOC Group Ltd., Class A |
16,400 | 12,060 | ||||||
| CNGR Advanced Material Co. Ltd., |
600 | 4,847 | ||||||
| CNNC Hua Yuan Titanium Dioxide Co. Ltd., Class A* |
3,190 | 2,784 | ||||||
| Do-Fluoride New Materials Co. Ltd., Class A |
1,120 | 3,143 | ||||||
| Ganfeng Lithium Group Co. Ltd., Class A |
1,280 | 11,137 | ||||||
| GEM Co. Ltd., Class A |
3,500 | 3,276 | ||||||
| Guangdong HEC Technology Holding Co. Ltd., Class A |
2,600 | 2,631 | ||||||
| Guangzhou Tinci Materials Technology Co. Ltd., Class A |
1,880 | 10,788 | ||||||
| Hangzhou Oxygen Plant Group Co. Ltd., Class A |
900 | 4,513 | ||||||
| Haohua Chemical Science & Technology Co. Ltd., Class A |
600 | 3,282 | ||||||
| Henan Shenhuo Coal & Power Co. Ltd., Class A |
2,100 | 3,766 | ||||||
| Hengli Petrochemical Co. Ltd., Class A |
6,220 | 13,783 | ||||||
| Hengyi Petrochemical Co. Ltd., Class A |
2,260 | 2,125 | ||||||
| Hesteel Co. Ltd., Class A |
11,200 | 3,599 | ||||||
| Hoshine Silicon Industry Co. Ltd., Class A |
700 | 6,617 | ||||||
| Huafon Chemical Co. Ltd., Class A |
5,200 | 4,904 | ||||||
| Huaibei Mining Holdings Co. Ltd., Class A |
2,300 | 4,225 | ||||||
| Huaxin Cement Co. Ltd., Class A |
200 | 357 | ||||||
| Hubei Feilihua Quartz Glass Co. Ltd., Class A |
500 | 3,367 | ||||||
| Hubei Xingfa Chemicals Group Co. Ltd., Class A |
1,200 | 3,602 | ||||||
| Hunan Changyuan Lico Co. Ltd., Class A* |
1,403 | 2,250 | ||||||
| Hunan Valin Steel Co. Ltd., Class A |
7,200 | 4,911 | ||||||
| Inner Mongolia BaoTou Steel Union Co. Ltd., Class A |
45,700 | 11,736 | ||||||
| Inner Mongolia Junzheng Energy & Chemical Industry Group Co. Ltd., Class A |
6,495 | 4,001 | ||||||
| Inner Mongolia Yuan Xing Energy Co. Ltd., Class A |
3,700 | 3,458 | ||||||
| Jiangsu Eastern Shenghong Co. Ltd., Class A |
4,300 | 7,024 | ||||||
| See Notes to Financial Statements. | 38 |
DBX ETF Trust
Schedule of Investments
Xtrackers MSCI China A Inclusion Equity ETF (Continued)
May 31, 2023
| Number |
Value |
|||||||
| Materials (Continued) | ||||||||
| Jiangsu Yangnong Chemical Co. Ltd., Class A |
300 | $ | 3,494 | |||||
| Jiangsu Yoke Technology Co. Ltd., Class A |
500 | 5,138 | ||||||
| Jiangxi Copper Co. Ltd., Class A |
2,244 | 5,826 | ||||||
| Jinduicheng Molybdenum Co. Ltd., Class A |
3,000 | 4,585 | ||||||
| LB Group Co. Ltd., Class A |
2,000 | 4,404 | ||||||
| Luxi Chemical Group Co. Ltd., Class A |
800 | 1,188 | ||||||
| Ningbo Shanshan Co. Ltd., Class A* |
2,200 | 4,557 | ||||||
| Ningxia Baofeng Energy Group Co. Ltd., Class A |
6,600 | 11,253 | ||||||
| Pangang Group Vanadium Titanium & Resources Co. Ltd., Class A* |
8,500 | 4,748 | ||||||
| Qinghai Salt Lake Industry Co. Ltd., |
4,900 | 12,921 | ||||||
| Rongsheng Petrochemical Co. Ltd., Class A |
9,728 | 15,836 | ||||||
| Satellite Chemical Co. Ltd., Class A |
2,586 | 4,598 | ||||||
| Shandong Gold Mining Co. Ltd., Class A |
3,753 | 13,299 | ||||||
| Shandong Hualu Hengsheng Chemical Co. Ltd., Class A |
2,270 | 9,292 | ||||||
| Shandong Nanshan Aluminum Co. Ltd., Class A |
9,900 | 4,182 | ||||||
| Shandong Sun Paper Industry JSC Ltd., Class A |
2,600 | 3,824 | ||||||
| Shanghai Putailai New Energy Technology Co. Ltd., Class A |
2,001 | 9,974 | ||||||
| Shanxi Meijin Energy Co. Ltd., Class A |
4,500 | 4,528 | ||||||
| Shanxi Taigang Stainless Steel Co. Ltd., Class A |
5,400 | 3,016 | ||||||
| Shenghe Resources Holding Co. Ltd., Class A |
1,600 | 2,870 | ||||||
| Shenzhen Capchem Technology Co. Ltd., Class A |
720 | 4,751 | ||||||
| Shenzhen Dynanonic Co. Ltd., Class A |
320 | 4,938 | ||||||
| Shenzhen Senior Technology Material Co. Ltd., Class A |
1,198 | 2,720 | ||||||
| Shenzhen YUTO Packaging Technology Co. Ltd., Class A |
900 | 2,988 | ||||||
| Sichuan Hebang Biotechnology Co. Ltd., Class A* |
9,200 | 3,034 | ||||||
| Sichuan Yahua Industrial Group Co. Ltd., Class A |
1,300 | 3,280 | ||||||
| Sinoma Science & Technology Co. Ltd., Class A |
1,500 | 4,088 | ||||||
| Sinomine Resource Group Co. Ltd., Class A |
588 | 4,423 | ||||||
| Sinopec Shanghai Petrochemical Co. Ltd., Class A |
6,570 | 2,895 | ||||||
| Skshu Paint Co. Ltd., Class A* |
340 | 4,266 | ||||||
| Sunresin New Materials Co. Ltd., Class A |
300 | 3,867 | ||||||
| Tangshan Jidong Cement Co. Ltd., Class A |
2,400 | 2,597 | ||||||
| Tianqi Lithium Corp., Class A* |
1,500 | 15,144 | ||||||
| Tianshan Aluminum Group Co. Ltd., Class A |
4,100 | 3,625 | ||||||
| Tibet Summit Resources Co. Ltd., Class A* |
900 | 2,236 | ||||||
| Tongkun Group Co. Ltd., Class A |
2,500 | 4,231 | ||||||
| Tongling Nonferrous Metals Group Co. Ltd., Class A* |
11,700 | 4,762 | ||||||
| Wanhua Chemical Group Co. Ltd., Class A |
2,900 | 33,477 | ||||||
| Number |
Value |
|||||||
| Materials (Continued) | ||||||||
| Weihai Guangwei Composites Co. Ltd., Class A |
800 | $ | 3,288 | |||||
| Western Mining Co. Ltd., Class A |
2,100 | 3,024 | ||||||
| Western Superconducting Technologies Co. Ltd., Class A |
436 | 4,749 | ||||||
| Xiamen Tungsten Co. Ltd., Class A* |
1,400 | 3,548 | ||||||
| Xinjiang Zhongtai Chemical Co. Ltd., |
2,700 | 2,505 | ||||||
| Yintai Gold Co. Ltd., Class A |
2,880 | 5,234 | ||||||
| YongXing Special Materials Technology Co. Ltd., Class A |
520 | 4,616 | ||||||
| Youngy Co. Ltd., Class A* |
300 | 2,590 | ||||||
| Yunnan Aluminium Co. Ltd., Class A |
3,500 | 5,943 | ||||||
| Yunnan Energy New Material Co. Ltd., Class A* |
900 | 11,483 | ||||||
| Yunnan Tin Co. Ltd., Class A |
1,700 | 3,392 | ||||||
| Yunnan Yuntianhua Co. Ltd., Class A |
1,800 | 4,208 | ||||||
| Zangge Mining Co. Ltd., Class A |
1,600 | 5,160 | ||||||
| Zhejiang Huayou Cobalt Co. Ltd., Class A |
1,601 | 10,391 | ||||||
| Zhejiang Juhua Co. Ltd., Class A |
2,500 | 4,613 | ||||||
| Zhejiang Longsheng Group Co. Ltd., Class A |
3,000 | 4,000 | ||||||
| Zhongjin Gold Corp. Ltd., Class A |
4,500 | 7,092 | ||||||
| Zibo Qixiang Tengda Chemical Co. Ltd., Class A* |
2,800 | 2,479 | ||||||
| Zijin Mining Group Co. Ltd., Class A |
20,997 | 31,499 | ||||||
|
|
|
|||||||
| (Cost $601,249) |
576,967 | |||||||
|
|
|
|||||||
| Real Estate — 1.7% | ||||||||
| China Merchants Shekou Industrial Zone Holdings Co. Ltd., Class A |
7,815 | 13,907 | ||||||
| China Vanke Co. Ltd., Class A |
8,396 | 16,778 | ||||||
| Gemdale Corp., Class A |
4,722 | 4,804 | ||||||
| Greenland Holdings Corp. Ltd., Class A* |
10,200 | 4,194 | ||||||
| Hainan Airport Infrastructure Co. Ltd., Class A* |
10,000 | 6,203 | ||||||
| Hangzhou Binjiang Real Estate Group Co. Ltd., Class A |
3,000 | 3,549 | ||||||
| Poly Developments and Holdings Group Co. Ltd., Class A |
11,273 | 20,155 | ||||||
| Seazen Holdings Co. Ltd., Class A* |
1,913 | 3,753 | ||||||
| Shanghai Lingang Holdings Corp. Ltd., Class A |
2,500 | 4,596 | ||||||
| Youngor Group Co. Ltd., Class A |
5,100 | 4,917 | ||||||
| Zhejiang China Commodities City Group Co. Ltd., Class A |
5,200 | 6,006 | ||||||
|
|
|
|||||||
| (Cost $108,765) |
88,862 | |||||||
|
|
|
|||||||
| Utilities — 4.0% | ||||||||
| CECEP Solar Energy Co. Ltd., Class A |
4,100 | 4,022 | ||||||
| CECEP Wind-Power Corp., Class A* |
6,760 | 3,652 | ||||||
| China National Nuclear Power Co. Ltd., Class A |
18,084 | 17,866 | ||||||
| China Three Gorges Renewables Group Co. Ltd., Class A |
26,900 | 20,498 | ||||||
| China Yangtze Power Co. Ltd., Class A |
22,200 | 70,129 | ||||||
| See Notes to Financial Statements. | 39 |
DBX ETF Trust
Schedule of Investments
Xtrackers MSCI China A Inclusion Equity ETF (Continued)
May 31, 2023
| Number |
Value |
|||||||
| Utilities (Continued) | ||||||||
| Datang International Power Generation Co. Ltd., Class A* |
7,800 | $ | 4,017 | |||||
| ENN Natural Gas Co. Ltd., Class A |
2,500 | 6,792 | ||||||
| GD Power Development Co. Ltd., Class A* |
18,700 | 10,707 | ||||||
| Huadian Power International Corp. Ltd., Class A |
7,700 | 7,705 | ||||||
| Huaneng Power International, Inc., |
9,200 | 13,143 | ||||||
| SDIC Power Holdings Co. Ltd., Class A |
6,700 | 12,402 | ||||||
| Shanghai Electric Power Co. Ltd., Class A |
2,600 | 4,262 | ||||||
| Shenergy Co. Ltd., Class A |
4,000 | 4,002 | ||||||
| Shenzhen Energy Group Co. Ltd., Class A |
4,200 | 4,073 | ||||||
| Sichuan Chuantou Energy Co. Ltd., Class A |
4,100 | 8,573 | ||||||
| Wintime Energy Co. Ltd.* |
20,000 | 4,182 | ||||||
| Zhejiang Zheneng Electric Power Co. Ltd., Class A* |
10,000 | 7,298 | ||||||
|
|
|
|||||||
| (Cost $177,503) |
203,323 | |||||||
|
|
|
|||||||
| TOTAL COMMON STOCKS |
5,082,643 | |||||||
|
|
|
|||||||
| Number |
Value |
|||||||
| EXCHANGE-TRADED FUNDS — 0.1% | ||||||||
| Xtrackers Harvest CSI 300 China A-Shares ETF (b) |
150 | $ | 4,009 | |||||
|
|
|
|||||||
| CASH EQUIVALENTS — 1.2% | ||||||||
| DWS Government Money Market Series “Institutional Shares”, 5.04% (c) |
61,695 | 61,695 | ||||||
|
|
|
|||||||
| TOTAL INVESTMENTS — 100.0% |
||||||||
| (Cost $4,477,739) |
$ | 5,148,347 | ||||||
| Other assets and liabilities, net — 0.0% |
718 | |||||||
|
|
|
|||||||
| NET ASSETS — 100.0% |
$ | 5,149,065 | ||||||
|
|
|
|||||||
A summary of the Fund’s transactions with affiliated investments during the year ended May 31, 2023 is as follows:
| Value ($) at 5/31/2022 |
Purchases Cost ($) |
Sales Proceeds ($) |
Net Realized Gain/(Loss) ($) |
Net Change in Unrealized Appreciation (Depreciation) ($) |
Income ($) | Capital Gain Distributions ($) |
Number of Shares at 5/31/2023 |
Value ($) at 5/31/2023 |
||||||||||||||||||||||||||||
| EXCHANGE-TRADED FUNDS — 0.1% |
| |||||||||||||||||||||||||||||||||||
| Xtrackers Harvest CSI 300 China A-Shares ETF (b) |
| |||||||||||||||||||||||||||||||||||
| — | 36,806 | (33,257 | ) | 666 | (206 | ) | 316 | — | 150 | 4,009 | ||||||||||||||||||||||||||
| SECURITIES LENDING COLLATERAL — 0.0% |
| |||||||||||||||||||||||||||||||||||
| DWS Government & Agency Securities Portfolio “DWS Government Cash Institutional Shares”, 5.03% (c)(d) |
| |||||||||||||||||||||||||||||||||||
| — | 0 | (e) | — | — | — | 35 | — | — | — | |||||||||||||||||||||||||||
| CASH EQUIVALENTS — 1.2% |
| |||||||||||||||||||||||||||||||||||
| DWS Government Money Market Series “Institutional Shares”, 5.04% (c) |
| |||||||||||||||||||||||||||||||||||
| 3,816 | 341,910 | (284,031 | ) | — | — | 772 | — | 61,695 | 61,695 | |||||||||||||||||||||||||||
|
|
|
|
|
|
|
|
|
|
|
|
|
|
|
|
|
|
|
|||||||||||||||||||
| 3,816 | 378,716 | (317,288 | ) | 666 | (206 | ) | 1,123 | — | 61,845 | 65,704 | ||||||||||||||||||||||||||
|
|
|
|
|
|
|
|
|
|
|
|
|
|
|
|
|
|
|
|||||||||||||||||||
| * | Non-income producing security. |
| (a) | Investment was valued using significant unobservable inputs. |
| (b) | Affiliated fund advised by DBX Advisors LLC. |
| (c) | Affiliated fund managed by DWS Investment Management Americas, Inc. The rate shown is the annualized seven-day yield at period end. |
| (d) | Represents collateral held in connection with securities lending. Income earned by the Fund is net of borrower rebates. |
| (e) | Represents the net increase (purchase cost) or decrease (sales proceeds) in the amount invested in cash collateral for the year ended May 31, 2023. |
| JSC: | Joint Stock Company |
| See Notes to Financial Statements. | 40 |
DBX ETF Trust
Schedule of Investments
Xtrackers MSCI China A Inclusion Equity ETF (Continued)
May 31, 2023
At May 31, 2023, open futures contracts purchased were as follows:
| Contract Description |
Currency | Number of Contracts |
Notional Amount |
Contract Value |
Expiration Date |
Unrealized Depreciation |
||||||||||||
| FTSE China A50 Index Futures |
USD | 1 | $ | 12,610 | $12,261 | 6/29/2023 | $ | (349 | ) | |||||||||
For information on the Fund’s policy and additional disclosures regarding futures contracts, please refer to the Derivatives section of Note 2 in the accompanying Notes to Financial Statements.
Currency Abbreviations
| USD | U.S. Dollar |
Fair Value Measurements
Various inputs are used in determining the value of the Fund’s investments. These inputs are summarized in three broad levels. Level 1 includes quoted prices in active markets for identical securities. Level 2 includes other significant observable inputs (including quoted prices for similar securities, interest rates, prepayment speeds and credit risk). Level 3 includes significant unobservable inputs (including the Fund’s own assumptions in determining the fair value of investments). The level assigned to the securities valuations may not be an indication of the risk or liquidity associated with investing in those securities.
The following is a summary of the inputs used as of May 31, 2023 in valuing the Fund’s investments. For information on the Fund’s policy regarding the valuation of investments, please refer to the Security Valuation section of Note 2 in the accompanying Notes to Financial Statements.
| Assets |
Level 1 | Level 2 | Level 3 | Total | ||||||||||||
| Common Stocks (a) |
$ | 5,078,789 | $ | — | $ | 3,854 | $ | 5,082,643 | ||||||||
| Exchange-Traded Funds |
4,009 | — | — | 4,009 | ||||||||||||
| Short-Term Investments (a) |
61,695 | — | — | 61,695 | ||||||||||||
|
|
|
|
|
|
|
|
|
|||||||||
| TOTAL |
$ | 5,144,493 | $ | — | $ | 3,854 | $ | 5,148,347 | ||||||||
|
|
|
|
|
|
|
|
|
|||||||||
| Liabilities |
Level 1 | Level 2 | Level 3 | Total | ||||||||||||
| Derivatives (b) |
||||||||||||||||
| Futures Contracts |
$ | (349 | ) | $ | — | $ | — | $ | (349 | ) | ||||||
|
|
|
|
|
|
|
|
|
|||||||||
| TOTAL |
$ | (349 | ) | $ | — | $ | — | $ | (349 | ) | ||||||
|
|
|
|
|
|
|
|
|
|||||||||
| (a) | See Schedule of Investments for additional detailed categorizations. |
| (b) | Derivatives include unrealized appreciation (depreciation) on open futures contracts. |
| See Notes to Financial Statements. | 41 |
DBX ETF Trust
May 31, 2023
| Xtrackers Harvest CSI 300 China A-Shares ETF |
Xtrackers Harvest CSI 500 China A-Shares Small Cap ETF |
Xtrackers MSCI All China Equity ETF |
Xtrackers MSCI China A Inclusion Equity ETF |
|||||||||||||
| Assets |
||||||||||||||||
| Investment in non-affiliated securities at value |
$ | 2,326,704,769 | $ | 25,759,353 | $ | 3,248,545 | $ | 5,082,643 | ||||||||
| Investment in affiliated securities at value |
— | — | 3,443,294 | 4,009 | ||||||||||||
| Investment in DWS Government Money Market Series |
— | — | 25,239 | 61,695 | ||||||||||||
| Investment in DWS Government & Agency Securities Portfolio* |
— | — | 32,169 | — | ||||||||||||
| Cash |
341,087 | 27 | — | — | ||||||||||||
| Foreign currency at value |
7,382,892 | † | 134,830 | † | 2,026 | 2,596 | ||||||||||
| Deposit with broker for futures contracts |
— | — | 990 | 990 | ||||||||||||
| Receivables: | ||||||||||||||||
| Investment securities sold |
— | — | 115,309 | 3 | ||||||||||||
| Variation margin on futures contracts |
— | — | 617 | — | ||||||||||||
| Dividends |
— | — | 11,137 | — | ||||||||||||
| Interest |
— | — | 112 | 86 | ||||||||||||
| Securities lending income |
— | — | 92 | — | ||||||||||||
|
|
|
|
|
|
|
|
|
|||||||||
| Total assets |
$ | 2,334,428,748 | $ | 25,894,210 | $ | 6,879,530 | $ | 5,152,022 | ||||||||
|
|
|
|
|
|
|
|
|
|||||||||
| Liabilities |
||||||||||||||||
| Payable upon return of securities loaned |
$ | — | $ | — | $ | 32,169 | $ | — | ||||||||
| Payables: | ||||||||||||||||
| Investment securities purchased |
— | — | 140,483 | — | ||||||||||||
| Investment advisory fees |
1,361,420 | 14,719 | 1,194 | 2,774 | ||||||||||||
| Variation margin on futures contracts |
— | — | — | 183 | ||||||||||||
|
|
|
|
|
|
|
|
|
|||||||||
| Total liabilities |
1,361,420 | 14,719 | 173,846 | 2,957 | ||||||||||||
|
|
|
|
|
|
|
|
|
|||||||||
| Net Assets, at value |
$ | 2,333,067,328 | $ | 25,879,491 | $ | 6,705,684 | $ | 5,149,065 | ||||||||
|
|
|
|
|
|
|
|
|
|||||||||
| Net Assets Consist of |
||||||||||||||||
| Paid-in capital |
$ | 2,829,422,588 | $ | 43,537,467 | $ | 23,359,493 | $ | 6,005,654 | ||||||||
| Distributable earnings (loss) |
(496,355,260 | ) | (17,657,976 | ) | (16,653,809 | ) | (856,589 | ) | ||||||||
|
|
|
|
|
|
|
|
|
|||||||||
| Net Assets, at value |
$ | 2,333,067,328 | $ | 25,879,491 | $ | 6,705,684 | $ | 5,149,065 | ||||||||
|
|
|
|
|
|
|
|
|
|||||||||
| Number of Common Shares outstanding |
87,250,001 | 850,001 | 250,001 | 250,001 | ||||||||||||
|
|
|
|
|
|
|
|
|
|||||||||
| Net Asset Value |
$ | 26.74 | $ | 30.45 | $ | 26.82 | $ | 20.60 | ||||||||
|
|
|
|
|
|
|
|
|
|||||||||
| Investment in non-affiliated securities at cost |
$ | 2,231,885,740 | $ | 26,938,582 | $ | 4,631,543 | $ | 4,411,829 | ||||||||
|
|
|
|
|
|
|
|
|
|||||||||
| Investment in affiliated securities at cost |
$ | — | $ | — | $ | 4,635,601 | $ | 4,215 | ||||||||
|
|
|
|
|
|
|
|
|
|||||||||
| Value of securities loaned |
$ | — | $ | — | $ | 133,610 | $ | — | ||||||||
|
|
|
|
|
|
|
|
|
|||||||||
| Investment in DWS Government Money Market Series at cost |
$ | — | $ | — | $ | 25,239 | $ | 61,695 | ||||||||
|
|
|
|
|
|
|
|
|
|||||||||
| Investment in DWS Government & Agency Securities Portfolio at cost* |
$ | — | $ | — | $ | 32,169 | $ | — | ||||||||
|
|
|
|
|
|
|
|
|
|||||||||
| Non-cash collateral for securities on loan |
$ | — | $ | — | $ | 116,577 | $ | — | ||||||||
|
|
|
|
|
|
|
|
|
|||||||||
| Foreign currency at cost |
$ | 7,490,549 | $ | 137,419 | $ | 2,753 | $ | 2,596 | ||||||||
|
|
|
|
|
|
|
|
|
|||||||||
| * | Represents collateral on securities loaned. |
| † | Included in foreign currency at value is $166,555 and $10,209 respectively which represents foreign investor minimum settlement reserve funds required by China Securities Depository and Clearing Corporation Limited. |
| See Notes to Financial Statements. | 42 |
DBX ETF Trust
For the Year Ended May 31, 2023
| Xtrackers Harvest CSI 300 China A-Shares ETF |
Xtrackers Harvest CSI 500 China A-Shares Small Cap ETF |
Xtrackers MSCI All China Equity ETF |
Xtrackers MSCI China A Inclusion Equity ETF |
|||||||||||||
| Investment Income |
||||||||||||||||
| Unaffiliated interest income |
$ | 12,488 | $ | 326 | $ | — | $ | 118 | ||||||||
| Unaffiliated dividend income* |
48,306,283 | 530,214 | 101,579 | 118,138 | ||||||||||||
| Affiliated dividend income |
— | — | 63,947 | 316 | ||||||||||||
| Income distributions from affiliated funds |
— | — | 543 | 772 | ||||||||||||
| Affiliated securities lending income |
— | — | 1,323 | 35 | ||||||||||||
|
|
|
|
|
|
|
|
|
|||||||||
| Total investment income |
48,318,771 | 530,540 | 167,392 | 119,379 | ||||||||||||
|
|
|
|
|
|
|
|
|
|||||||||
| Expenses |
||||||||||||||||
| Investment advisory fees |
14,261,425 | 194,046 | 41,354 | 34,401 | ||||||||||||
| Other expenses |
58 | 58 | 58 | 58 | ||||||||||||
|
|
|
|
|
|
|
|
|
|||||||||
| Total expenses |
14,261,483 | 194,104 | 41,412 | 34,459 | ||||||||||||
|
|
|
|
|
|
|
|
|
|||||||||
| Less fees waived (see note 3): |
||||||||||||||||
| Waiver |
— | — | (25,514 | ) | (76 | ) | ||||||||||
|
|
|
|
|
|
|
|
|
|||||||||
| Net expenses |
14,261,483 | 194,104 | 15,898 | 34,383 | ||||||||||||
|
|
|
|
|
|
|
|
|
|||||||||
| Net investment income (loss) |
34,057,288 | 336,436 | 151,494 | 84,996 | ||||||||||||
|
|
|
|
|
|
|
|
|
|||||||||
| Realized and Unrealized Gain (Loss) |
||||||||||||||||
| Net realized gain (loss) from: |
||||||||||||||||
| Investments |
(141,205,254 | ) | (1,491,751 | ) | (495,017 | ) | (71,971 | ) | ||||||||
| Investments in affiliates |
— | — | (39,239 | ) | 666 | |||||||||||
| In-kind redemptions |
— | — | (26,359 | ) | — | |||||||||||
| In-kind redemptions in affiliates |
— | — | 42,698 | — | ||||||||||||
| Futures contracts |
— | — | (4,967 | ) | (543 | ) | ||||||||||
| Foreign currency transactions |
(4,017,744 | ) | (99,766 | ) | 930 | (163 | ) | |||||||||
|
|
|
|
|
|
|
|
|
|||||||||
| Net realized gain (loss) |
(145,222,998 | ) | (1,591,517 | ) | (521,954 | ) | (72,011 | ) | ||||||||
|
|
|
|
|
|
|
|
|
|||||||||
| Net change in unrealized appreciation (depreciation) on: |
||||||||||||||||
| Investments |
(198,261,844 | ) | (32,916 | ) | (221,039 | ) | (743,422 | ) | ||||||||
| Investments in affiliates |
— | — | (541,283 | ) | (206 | ) | ||||||||||
| Futures contracts |
— | — | (349 | ) | (821 | ) | ||||||||||
| Foreign currency translations |
(123,575 | ) | (3,974 | ) | (768 | ) | (6 | ) | ||||||||
|
|
|
|
|
|
|
|
|
|||||||||
| Net change in unrealized appreciation (depreciation) |
(198,385,419 | ) | (36,890 | ) | (763,439 | ) | (744,455 | ) | ||||||||
|
|
|
|
|
|
|
|
|
|||||||||
| Net realized and unrealized gain (loss) on investments, futures and foreign currency transactions |
(343,608,417 | ) | (1,628,407 | ) | (1,285,393 | ) | (816,466 | ) | ||||||||
|
|
|
|
|
|
|
|
|
|||||||||
| Net Increase (Decrease) in Net Assets Resulting from Operations |
$ | (309,551,129 | ) | $ | (1,291,971 | ) | $ | (1,133,899 | ) | $ | (731,470 | ) | ||||
|
|
|
|
|
|
|
|
|
|||||||||
| * Unaffiliated foreign tax withheld |
$ | 5,370,872 | $ | 59,317 | $ | 7,473 | $ | 13,172 | ||||||||
| See Notes to Financial Statements. | 43 |
DBX ETF Trust
| Xtrackers Harvest CSI 300 China A-Shares ETF |
Xtrackers Harvest CSI 500 China A-Shares Small Cap ETF |
|||||||||||||||
| Year Ended May 31, | Year Ended May 31, | |||||||||||||||
| 2023 | 2022 | 2023 | 2022 | |||||||||||||
| Increase (Decrease) in Net Assets from Operations |
||||||||||||||||
| Net investment income (loss) |
$ | 34,057,288 | $ | 23,808,796 | $ | 336,436 | $ | 274,693 | ||||||||
| Net realized gain (loss) |
(145,222,998 | ) | (161,499,191 | ) | (1,591,517 | ) | 5,609,063 | |||||||||
| Net change in net unrealized appreciation (depreciation) |
(198,385,419 | ) | (694,688,035 | ) | (36,890 | ) | (11,757,074 | ) | ||||||||
|
|
|
|
|
|
|
|
|
|||||||||
| Net increase (decrease) in net assets resulting from operations |
(309,551,129 | ) | (832,378,430 | ) | (1,291,971 | ) | (5,873,318 | ) | ||||||||
|
|
|
|
|
|
|
|
|
|||||||||
| Distributions to Shareholders |
(23,017,176 | ) | (23,518,334 | ) | (463,728 | ) | (315,040 | ) | ||||||||
|
|
|
|
|
|
|
|
|
|||||||||
| Fund Shares Transactions |
||||||||||||||||
| Proceeds from shares sold |
2,304,709,929 | 1,830,677,155 | 1,649,807 | 7,908,275 | ||||||||||||
| Value of shares redeemed |
(1,311,138,220 | ) | (2,017,705,513 | ) | (8,194,136 | ) | (7,816,588 | ) | ||||||||
|
|
|
|
|
|
|
|
|
|||||||||
| Net increase (decrease) in net assets resulting from fund share transactions |
993,571,709 | (187,028,358 | ) | (6,544,329 | ) | 91,687 | ||||||||||
|
|
|
|
|
|
|
|
|
|||||||||
| Total net increase (decrease) in Net Assets |
661,003,404 | (1,042,925,122 | ) | (8,300,028 | ) | (6,096,671 | ) | |||||||||
| Net Assets |
||||||||||||||||
| Beginning of year |
1,672,063,924 | 2,714,989,046 | 34,179,519 | 40,276,190 | ||||||||||||
|
|
|
|
|
|
|
|
|
|||||||||
| End of year |
$ | 2,333,067,328 | $ | 1,672,063,924 | $ | 25,879,491 | $ | 34,179,519 | ||||||||
|
|
|
|
|
|
|
|
|
|||||||||
| Changes in Shares Outstanding |
||||||||||||||||
| Shares outstanding, beginning of year |
54,250,001 | 64,900,001 | 1,050,001 | 1,050,001 | ||||||||||||
| Shares sold |
75,050,000 | 47,950,000 | 50,000 | 200,000 | ||||||||||||
| Shares redeemed |
(42,050,000 | ) | (58,600,000 | ) | (250,000 | ) | (200,000 | ) | ||||||||
|
|
|
|
|
|
|
|
|
|||||||||
| Shares outstanding, end of year |
87,250,001 | 54,250,001 | 850,001 | 1,050,001 | ||||||||||||
|
|
|
|
|
|
|
|
|
|||||||||
| See Notes to Financial Statements. | 44 |
DBX ETF Trust
Statements of Changes in Net Assets (Continued)
| Xtrackers MSCI All China Equity ETF |
Xtrackers MSCI China A Inclusion Equity ETF |
|||||||||||||||
| Year Ended May 31, | Year Ended May 31, | |||||||||||||||
| 2023 | 2022 | 2023 | 2022 | |||||||||||||
| Increase (Decrease) in Net Assets from Operations |
||||||||||||||||
| Net investment income (loss) |
$ | 151,494 | $ | 305,700 | $ | 84,996 | $ | 131,487 | ||||||||
| Net realized gain (loss) |
(521,954 | ) | 1,080,022 | (72,011 | ) | 2,030,731 | ||||||||||
| Net change in net unrealized appreciation (depreciation) |
(763,439 | ) | (9,259,280 | ) | (744,455 | ) | (4,571,179 | ) | ||||||||
|
|
|
|
|
|
|
|
|
|||||||||
| Net increase (decrease) in net assets resulting from operations |
(1,133,899 | ) | (7,873,558 | ) | (731,470 | ) | (2,408,961 | ) | ||||||||
|
|
|
|
|
|
|
|
|
|||||||||
| Distributions to Shareholders |
(129,968 | ) | (423,116 | ) | (95,723 | ) | (114,292 | ) | ||||||||
|
|
|
|
|
|
|
|
|
|||||||||
| Fund Shares Transactions |
||||||||||||||||
| Proceeds from shares sold |
— | — | — | — | ||||||||||||
| Value of shares redeemed |
(1,474,801 | ) | (17,240,981 | ) | — | (7,191,275 | ) | |||||||||
|
|
|
|
|
|
|
|
|
|||||||||
| Net increase (decrease) in net assets resulting from fund share transactions |
(1,474,801 | ) | (17,240,981 | ) | — | (7,191,275 | ) | |||||||||
|
|
|
|
|
|
|
|
|
|||||||||
| Total net increase (decrease) in Net Assets |
(2,738,668 | ) | (25,537,655 | ) | (827,193 | ) | (9,714,528 | ) | ||||||||
| Net Assets |
||||||||||||||||
| Beginning of year |
9,444,352 | 34,982,007 | 5,976,258 | 15,690,786 | ||||||||||||
|
|
|
|
|
|
|
|
|
|||||||||
| End of year |
$ | 6,705,684 | $ | 9,444,352 | $ | 5,149,065 | $ | 5,976,258 | ||||||||
|
|
|
|
|
|
|
|
|
|||||||||
| Changes in Shares Outstanding |
||||||||||||||||
| Shares outstanding, beginning of year |
300,001 | 750,001 | 250,001 | 500,001 | ||||||||||||
| Shares sold |
— | — | — | — | ||||||||||||
| Shares redeemed |
(50,000 | ) | (450,000 | ) | — | (250,000 | ) | |||||||||
|
|
|
|
|
|
|
|
|
|||||||||
| Shares outstanding, end of year |
250,001 | 300,001 | 250,001 | 250,001 | ||||||||||||
|
|
|
|
|
|
|
|
|
|||||||||
| See Notes to Financial Statements. | 45 |
DBX ETF Trust
| Xtrackers Harvest CSI 300 China A-Shares ETF Selected Per Share Data |
Years Ended May 31, | |||||||||||||||||||
| 2023 | 2022 | 2021 | 2020 | 2019 | ||||||||||||||||
| Net Asset Value, beginning of year |
$ | 30.82 | $ | 41.83 | $ | 27.18 | $ | 26.27 | $ | 29.56 | ||||||||||
|
|
|
|
|
|
|
|
|
|
|
|||||||||||
| Income (loss) from investment operations: |
||||||||||||||||||||
| Net investment income (loss) (a) |
0.46 | 0.36 | 0.30 | 0.29 | 0.22 | |||||||||||||||
| Net realized and unrealized gain (loss) |
(4.22 | ) | (11.02 | ) | 14.67 | 0.91 | (3.22 | ) | ||||||||||||
|
|
|
|
|
|
|
|
|
|
|
|||||||||||
| Total from investment operations |
(3.76 | ) | (10.66 | ) | 14.97 | 1.20 | (3.00 | ) | ||||||||||||
|
|
|
|
|
|
|
|
|
|
|
|||||||||||
| Less distributions from: |
| |||||||||||||||||||
| Net investment income |
(0.32 | ) | (0.35 | ) | (0.32 | ) | (0.29 | ) | — | |||||||||||
| Net realized gains |
— | — | — | — | (0.29 | ) | ||||||||||||||
|
|
|
|
|
|
|
|
|
|
|
|||||||||||
| Total distributions |
(0.32 | ) | (0.35 | ) | (0.32 | ) | (0.29 | ) | (0.29 | ) | ||||||||||
|
|
|
|
|
|
|
|
|
|
|
|||||||||||
| Net Asset Value, end of year |
$ | 26.74 | $ | 30.82 | $ | 41.83 | $ | 27.18 | $ | 26.27 | ||||||||||
|
|
|
|
|
|
|
|
|
|
|
|||||||||||
| Total Return (%) |
(12.28 | ) | (25.67 | ) | 55.20 | 4.50 | (10.02 | ) | ||||||||||||
| Ratios to Average Net Assets and Supplemental Data |
||||||||||||||||||||
| Net Assets, end of year ($ millions) |
2,333 | 1,672 | 2,715 | 1,271 | 1,449 | |||||||||||||||
| Ratio of expenses (%) |
0.65 | 0.65 | 0.65 | 0.65 | 0.65 | |||||||||||||||
| Ratio of net investment income (loss) (%) |
1.55 | 0.97 | 0.79 | 1.05 | 0.87 | |||||||||||||||
| Portfolio turnover rate (%) (b) |
69 | 95 | 78 | 115 | 81 | |||||||||||||||
| Xtrackers Harvest CSI 500 China A-Shares Small Cap ETF Selected Per Share Data |
Years Ended May 31, | |||||||||||||||||||
| 2023 | 2022 | 2021 | 2020 | 2019 | ||||||||||||||||
| Net Asset Value, beginning of year |
$ | 32.55 | $ | 38.36 | $ | 27.59 | $ | 25.93 | $ | 32.53 | ||||||||||
|
|
|
|
|
|
|
|
|
|
|
|||||||||||
| Income (loss) from investment operations: | ||||||||||||||||||||
| Net investment income (loss) (a) |
0.36 | 0.28 | 0.13 | 0.17 | 0.20 | |||||||||||||||
| Net realized and unrealized gain (loss) |
(1.88 | ) | (5.77 | ) | 10.79 | 1.65 | (6.80 | ) | ||||||||||||
|
|
|
|
|
|
|
|
|
|
|
|||||||||||
| Total from investment operations |
(1.52 | ) | (5.49 | ) | 10.92 | 1.82 | (6.60 | ) | ||||||||||||
|
|
|
|
|
|
|
|
|
|
|
|||||||||||
| Less distributions from: |
| |||||||||||||||||||
| Net investment income |
(0.58 | ) | (0.32 | ) | (0.15 | ) | (0.16 | ) | — | |||||||||||
|
|
|
|
|
|
|
|
|
|
|
|||||||||||
| Total distributions |
(0.58 | ) | (0.32 | ) | (0.15 | ) | (0.16 | ) | — | |||||||||||
|
|
|
|
|
|
|
|
|
|
|
|||||||||||
| Net Asset Value, end of year |
$ | 30.45 | $ | 32.55 | $ | 38.36 | $ | 27.59 | $ | 25.93 | ||||||||||
|
|
|
|
|
|
|
|
|
|
|
|||||||||||
| Total Return (%) |
(4.71 | ) | (14.50 | ) | 39.64 | 7.02 | (20.29 | ) | ||||||||||||
| Ratios to Average Net Assets and Supplemental Data |
||||||||||||||||||||
| Net Assets, end of year ($ millions) |
26 | 34 | 40 | 30 | 74 | |||||||||||||||
| Ratio of expenses (%) |
0.65 | 0.65 | 0.65 | 0.65 | 0.65 | |||||||||||||||
| Ratio of net investment income (loss) (%) |
1.13 | 0.73 | 0.37 | 0.63 | 0.74 | |||||||||||||||
| Portfolio turnover rate (%) (b) |
41 | 62 | 34 | 48 | 16 | |||||||||||||||
| (a) | Based on average shares outstanding during the period. |
| (b) | Portfolio turnover rate does not include securities received or delivered from processing creations or redemptions. |
| See Notes to Financial Statements. | 46 |
DBX ETF Trust
Financial Highlights (Continued)
| Xtrackers MSCI All China Equity ETF Selected Per Share Data |
Years Ended May 31, | |||||||||||||||||||
| 2023 | 2022 | 2021 | 2020 | 2019 | ||||||||||||||||
| Net Asset Value, beginning of year |
$ | 31.48 | $ | 46.64 | $ | 32.66 | $ | 31.13 | $ | 37.78 | ||||||||||
|
|
|
|
|
|
|
|
|
|
|
|||||||||||
| Income (loss) from investment operations: |
||||||||||||||||||||
| Net investment income (loss) (a) |
0.55 | 0.54 | 0.48 | 0.76 | 0.36 | |||||||||||||||
| Net realized and unrealized gain (loss) |
(4.69 | ) | (14.93 | ) | 13.85 | 2.21 | (6.42 | ) | ||||||||||||
|
|
|
|
|
|
|
|
|
|
|
|||||||||||
| Total from investment operations |
(4.14 | ) | (14.39 | ) | 14.33 | 2.97 | (6.06 | ) | ||||||||||||
|
|
|
|
|
|
|
|
|
|
|
|||||||||||
| Less distributions from: |
|
|||||||||||||||||||
| Net investment income |
(0.52 | ) | (0.77 | ) | (0.35 | ) | (1.44 | ) | (0.59 | ) | ||||||||||
|
|
|
|
|
|
|
|
|
|
|
|||||||||||
| Total distributions |
(0.52 | ) | (0.77 | ) | (0.35 | ) | (1.44 | ) | (0.59 | ) | ||||||||||
|
|
|
|
|
|
|
|
|
|
|
|||||||||||
| Net Asset Value, end of year |
$ | 26.82 | $ | 31.48 | $ | 46.64 | $ | 32.66 | $ | 31.13 | ||||||||||
|
|
|
|
|
|
|
|
|
|
|
|||||||||||
| Total Return (%) (b) |
(13.28 | ) | (31.15 | ) | 43.94 | 9.35 | (15.89 | ) | ||||||||||||
| Ratios to Average Net Assets and Supplemental Data |
||||||||||||||||||||
| Net Assets, end of year ($ millions) |
7 | 9 | 35 | 20 | 227 | |||||||||||||||
| Ratio of expenses before fee waiver (%) (c) |
0.50 | 0.50 | 0.50 | 0.50 | 0.50 | |||||||||||||||
| Ratio of expenses after fee waiver (%) (c) |
0.19 | 0.21 | 0.25 | 0.26 | 0.28 | |||||||||||||||
| Ratio of net investment income (loss) (%) |
1.83 | 1.34 | 1.10 | 2.27 | 1.07 | |||||||||||||||
| Portfolio turnover rate (%) (d) |
7 | 5 | 8 | 14 | 102 | |||||||||||||||
| Xtrackers MSCI China A Inclusion Equity ETF Selected Per Share Data |
Years Ended May 31, | |||||||||||||||||||
| 2023 | 2022 | 2021 | 2020 | 2019 | ||||||||||||||||
| Net Asset Value, beginning of year |
$ | 23.90 | $ | 31.38 | $ | 19.98 | $ | 18.75 | $ | 20.80 | ||||||||||
|
|
|
|
|
|
|
|
|
|
|
|||||||||||
| Income (loss) from investment operations: | ||||||||||||||||||||
| Net investment income (loss) (a) |
0.34 | 0.32 | 0.20 | 0.41 | 0.15 | |||||||||||||||
| Net realized and unrealized gain (loss) |
(3.26 | ) | (7.55 | ) | 11.44 | 1.19 | (2.03 | ) | ||||||||||||
|
|
|
|
|
|
|
|
|
|
|
|||||||||||
| Total from investment operations |
(2.92 | ) | (7.23 | ) | 11.64 | 1.60 | (1.88 | ) | ||||||||||||
|
|
|
|
|
|
|
|
|
|
|
|||||||||||
| Less distributions from: |
| |||||||||||||||||||
| Net investment income |
(0.38 | ) | (0.25 | ) | (0.24 | ) | (0.37 | ) | (0.17 | ) | ||||||||||
|
|
|
|
|
|
|
|
|
|
|
|||||||||||
| Total distributions |
(0.38 | ) | (0.25 | ) | (0.24 | ) | (0.37 | ) | (0.17 | ) | ||||||||||
|
|
|
|
|
|
|
|
|
|
|
|||||||||||
| Net Asset Value, end of year |
$ | 20.60 | $ | 23.90 | $ | 31.38 | $ | 19.98 | $ | 18.75 | ||||||||||
|
|
|
|
|
|
|
|
|
|
|
|||||||||||
| Total Return (%) (b) |
(12.32 | ) | (23.20 | ) | 58.37 | 8.49 | (8.91 | ) | ||||||||||||
| Ratios to Average Net Assets and Supplemental Data |
||||||||||||||||||||
| Net Assets, end of year ($ millions) |
5 | 6 | 16 | 14 | 83 | |||||||||||||||
| Ratio of expenses before fee waiver (%) (c) |
0.60 | 0.60 | 0.60 | 0.60 | 0.60 | |||||||||||||||
| Ratio of expenses after fee waiver (%) (c) |
0.60 | 0.60 | 0.60 | 0.60 | 0.60 | |||||||||||||||
| Ratio of net investment income (loss) (%) |
1.48 | 1.11 | 0.74 | 2.03 | 0.75 | |||||||||||||||
| Portfolio turnover rate (%) (d) |
12 | 18 | 33 | 27 | 180 | |||||||||||||||
| (a) | Based on average shares outstanding during the period. |
| (b) | Total Return would have been lower if certain expenses had not been reimbursed by the Advisor. |
| (c) | The Fund invests in other ETFs and indirectly bears its proportionate shares of fees and expenses incurred by the Underlying Funds in which the Fund is invested. This ratio does not included these indirect fees and expenses. |
| (d) | Portfolio turnover rate does not include securities received or delivered from processing creations or redemptions. |
| See Notes to Financial Statements. | 47 |
DBX ETF Trust
1. Organization
DBX ETF Trust (the “Trust”) is registered under the Investment Company Act of 1940, as amended (the “1940 Act”), as an open-end registered management investment company organized as a Delaware statutory trust.
As of May 31, 2023, the Trust consists of thirty-nine investment series of exchange-traded funds (“ETFs”) (each a “Fund” and collectively, the “Funds”) in operation and trading. These financial statements report on the Funds listed below:
| Xtrackers Harvest CSI 300 China A-Shares ETF |
| Xtrackers Harvest CSI 500 China A-Shares Small Cap ETF |
| Xtrackers MSCI All China Equity ETF |
| Xtrackers MSCI China A Inclusion Equity ETF |
DBX Advisors LLC (“DBX” or the “Advisor”), an indirect, wholly-owned subsidiary of DWS Group GmbH & Co. KGaA (“DWS Group”), serves as investment advisor to the Funds and has overall responsibility for the general management and administration of the Funds, subject to the supervision of the Funds’ Board of Trustees (“Board”).
Each Fund offers shares that are listed and traded on the NYSE Arca, Inc. (“NYSE Arca”). Unlike conventional mutual funds, each Fund issues and redeems shares on a continuous basis, at net asset value (“NAV”), only in large specified lots consisting of 50,000 shares, each called a “Creation Unit”, to authorized participants who have entered into agreements with the Funds’ distributor. Shares are not individually redeemable securities of the Funds, and owners of the shares may acquire those shares from the Funds, or tender such shares for redemption to the Funds, in Creation Units only.
The investment objective of each Fund is to seek investment results that correspond generally to the performance, before fees and expenses, of a particular index (the “Underlying Index”). The underlying indices for the Funds are:
| Fund |
Underlying Index | |
| Xtrackers Harvest CSI 300 China A-Shares ETF | CSI 300 Index | |
| Xtrackers Harvest CSI 500 China A-Shares Small Cap ETF | CSI 500 Index | |
| Xtrackers MSCI All China Equity ETF | MSCI China All Shares Index | |
| Xtrackers MSCI China A Inclusion Equity ETF | MSCI China A Inclusion Index |
CSI 300 Index is calculated and maintained by China Securities Index Co., Ltd. It is designed to reflect the price fluctuation and performance of the China A-Share market and is composed of the 300 largest and most liquid stocks in the China A-Share market. Constituent stocks for the Underlying Index generally must have been listed on either the Shanghai Stock Exchange or the Shenzhen Stock Exchange for specified time periods, have demonstrated positive performance, and not be subject to abnormal volatility or other evidence of possible market manipulation, among other factors. The composition of the Underlying Index is reviewed every six-months.
CSI 500 Index is calculated and maintained by China Securities Index Co., Ltd. is designed to reflect the price fluctuation and performance of small-cap companies in the China A-Share market and is composed of the 500 smallest and most liquid stocks in the China A-Share market. Constituent stocks for the Underlying Index generally must have been listed on either the Shanghai Stock Exchange or the Shenzhen Stock Exchange for specified time periods, have demonstrated positive performance, and not be subject to abnormal volatility or other evidence of possible market manipulation, among other factors. The composition of the Underlying Index is reviewed every six-months.
MSCI China All Shares Index and MSCI China A Inclusion Equity Index are each calculated and maintained by MSCI, Inc. (“MSCI”). The MSCI China All Share Index is designed to capture large- and mid-capitalization representation across all China securities listed in Hong Kong, Shanghai and Shenzhen. The Underlying Index is intended to give investors a means of tracking the overall performance of equity securities that are a representative sample of the entire Chinese investment universe. The Underlying Index is comprised of A-Shares, H-Shares, B-Shares, Red chips and P chips share classes as well as securities of Chinese companies listed outside of China (e.g. American depository receipts). The Underlying Index is rebalanced on a quarterly basis.
48
DBX ETF Trust
Notes to Financial Statements (Continued)
The MSCI China A Inclusion Index is designed to track the equity market performance of China A-Shares that are accessible through the Shanghai-Hong Kong Stock Connect program or the Shenzhen-Hong Kong Stock Connect program (together “Stock Connect”). “A-Shares” are equity securities issued by companies incorporated in mainland China and are denominated in renminbi. Certain eligible A-Shares are traded on the Shanghai or Shenzhen Stock Exchanges. The Underlying Index is designed to track the inclusion of A-Shares in the MSCI Emerging Markets Index over time and is constructed by MSCI by applying eligibility criteria for the MSCI Global Investable Market Indexes, and then excluding mid- and small-capitalization A-Shares (as determined by MSCI), A-Shares suspended for trading for more than 50 days in the past 12 months and A-Shares that are not accessible through Stock Connect. The Underlying Index is weighted by each issuer’s free float-adjusted market capitalization (i.e., includes only shares that are readily available for trading in the market) available to foreign investors and includes only large-capitalization companies, as determined by MSCI. The Underlying Index is rebalanced on a quarterly basis.
Each Fund is entitled to use its respective Underlying Index pursuant to a licensing agreement between the Index Provider and DBX. There is no charge to the Funds in connection with these licensing agreements.
Each Fund is a diversified series of the Trust. In addition, each Fund, with the exception of Xtrackers MSCI All China Equity ETF, may change its diversification status over time and then change it back again, without shareholder approval, solely as a result of a change in relative market capitalization or index weighting of one or more constituents of the index each Fund tracks.
Pursuant to the Trust’s organizational documents, the Trust’s officers and trustees are indemnified against certain liabilities that may arise out of the performance of their duties to the Funds. Additionally, in the normal course of business the Trust enters into contracts that contain a variety of representations that provide indemnification for certain liabilities. The Trust’s maximum exposure under these arrangements is unknown, as this would involve future claims that may be made against the Funds that have not yet occurred. However, the Trust expects the risk of loss to be remote.
2. Significant Accounting Policies
The financial statements have been prepared in conformity with U.S. generally accepted accounting principles (“U.S. GAAP”), which require management to make certain estimates and assumptions that affect the reported amounts and disclosures in the financial statements. Actual results could differ from those estimates. Each Fund qualifies as an investment company under Topic 946 of the Accounting Standards Codification of U.S. GAAP. The following is a summary of significant accounting policies followed by the Funds.
Security Valuation The NAV of each Fund’s shares is calculated each business day as of the close of regular trading on the New York Stock Exchange, generally 4:00 p.m. Eastern Time. NAV per share is calculated by dividing a Fund’s net assets by the number of Fund shares outstanding.
The Funds’ Board has designated the Advisor as the valuation designee for the Funds pursuant to Rule 2a-5 under the 1940 Act. The Advisor’s Pricing Committee (the “Pricing Committee”) typically values securities using readily available market quotations or prices supplied by independent pricing services (which are considered fair values under Rule 2a-5). The Advisor has adopted fair valuation procedures that provide methodologies for fair valuing securities.
Various inputs are used in determining the value of the Funds’ investments. These inputs are summarized in three broad levels. Level 1 includes quoted prices in active markets for identical securities. Level 2 includes other significant observable inputs (including quoted prices for similar securities, interest rates, prepayment speeds, and credit risk). Level 3 includes significant unobservable inputs (including the Funds’ own assumptions in determining the fair value of investments). The level assigned to the securities valuations may not be an indication of the risk or liquidity associated with investing in those securities.
Equity securities and ETFs are valued at the most recent sale price or official closing price reported on the exchange (U.S. or foreign) or over-the-counter market on which they trade. Securities or ETFs for which no sales are reported are valued at the calculated mean between the most recent bid and asked quotations on the relevant market or, if a mean cannot be determined, at the most recent bid quotation. Equity securities and ETFs are generally categorized as Level 1.
49
DBX ETF Trust
Notes to Financial Statements (Continued)
Investments in open-end investment companies are valued at their NAV each business day and are categorized as a Level 1.
Futures contracts are generally valued at the settlement prices established each day on the exchange on which they are traded and are categorized as Level 1.
Securities and other assets for which market quotations are not readily available or for which the above valuation procedures are deemed not to reflect fair value are valued in a manner that is intended to reflect their fair value as determined in accordance with procedures approved by the Pricing Committee and are generally categorized as Level 3. In accordance with the Funds’ valuation procedures, factors considered in determining value may include, but are not limited to, the type of the security; the size of the holding; the initial cost of the security; the existence of any contractual restrictions on the security’s disposition; the price and extent of public trading in similar securities of the issuer or of comparable companies; quotations or evaluated prices from broker-dealers and/or pricing services; information obtained from the issuer, analysts, and/or the appropriate stock exchange (for exchange traded securities); an analysis of the company’s or issuer’s financial statements; an evaluation of the forces that influence the issuer and the market(s) in which the security is purchased and sold; and with respect to debt securities, the maturity, coupon, creditworthiness, currency denomination and the movement of the market in which the security is normally traded. The value determined under these procedures may differ from published values for the same securities.
Fair value pricing could result in a difference between the prices used to calculate a Fund’s NAV and the prices used by the Fund’s Underlying Index, which in turn could result in a difference between the Fund’s performance and the performance of the Fund’s Underlying Index.
Disclosure about the classification of the fair value measurements is included in a table following the Fund’s Schedule of Investments.
Cash Cash consists of cash held at banks and is on deposit with major financial institutions.
Investment Transactions and Investment Income Investment transactions are recorded as of the date that the securities are purchased or sold (trade date). Realized gains and losses from the sale or disposition of securities are calculated on the identified cost-method. Dividend income is net of any foreign taxes withheld at source. Certain dividends from foreign securities may be recorded subsequent to the ex-dividend date as soon as the Fund is informed of such dividends. Distributions of income and capital gains from investments in affiliated funds are recorded on the ex-dividend date. Interest income is recorded on the accrual basis. Distributions received from foreign domiciled corporations, generally determined to be passive foreign investment companies for tax reporting purposes, are included in dividend income.
Tax Information and Dividends and Distributions to Shareholders It is each Fund’s policy to comply with all requirements of the Internal Revenue Code of 1986, as amended (“the Code”). Each Fund intends to qualify for and to elect treatment as a separate Regulated Investment Company (“RIC”) under Subchapter M of the Code. It is the policy of each Fund to pay out dividends from its net investment income, if any, to investors annually. Taxable net realized gains from investment transactions, reduced by capital loss carryforwards, if any, are declared and distributed to shareholders at least annually. The capital loss carryforward amount, if any, is available to offset future net capital gains. The Funds may occasionally be required to make supplemental distributions at some other time during the year. The Funds reserve the right to declare special distributions if, in their reasonable discretion, such action is necessary or advisable to preserve the status of each Fund as a RIC or to avoid imposition of income or excise taxes on undistributed income.
Dividends and distributions to shareholders, if any, are recorded on the ex-dividend date. The amount of dividends and distributions from net investment income and net realized capital gains are determined in accordance with Federal income tax regulations which may differ from U.S. GAAP. These “book/tax” differences are either considered temporary or permanent in nature. To the extent these differences are permanent in nature, such amounts are reclassified at the end of the year within the components of net assets based on their federal tax treatment; temporary differences do not require reclassification. Dividends and distributions, which exceed earnings and profits for the full year for tax purposes, are reported as a tax return of capital.
50
DBX ETF Trust
Notes to Financial Statements (Continued)
In accordance with U.S. GAAP requirements regarding accounting for uncertainties in income taxes, management has analyzed the Funds’ tax positions taken or expected to be taken on foreign, federal and state income tax returns for all open tax years and has concluded that no provision for income tax is required in the Funds’ financial statements.
The Funds recognize interest and penalties, if any, related to uncertain tax positions as income tax expense on the Statements of Operations. For the year ended May 31, 2023, the Funds did not incur any interest or penalties.
As of May 31, 2023, the components of accumulated earnings (losses) on a tax basis were as follows:
| Undistributed Ordinary Income* |
Capital and Other Gains (Losses) |
Unrealized Appreciation (Depreciation) |
Total Accumulated Earnings (Losses) |
|||||||||||||
| Xtrackers Harvest CSI 300 China A-Shares ETF |
$ | 15,145,482 | $ | (467,194,893 | ) | $ | (44,305,849 | ) | $ | (496,355,260 | ) | |||||
| Xtrackers Harvest CSI 500 China A-Shares Small Cap ETF |
— | (15,728,089 | ) | (1,929,887 | ) | (17,657,976 | ) | |||||||||
| Xtrackers MSCI All China Equity ETF |
102,190 | (14,046,763 | ) | (2,709,236 | ) | (16,653,809 | ) | |||||||||
| Xtrackers MSCI China A Inclusion Equity ETF |
32,956 | (1,451,450 | ) | 561,905 | (856,589 | ) | ||||||||||
The tax character of dividends and distributions declared for the years ended May 31, 2023 and May 31, 2022 were as follows:
| Year Ended May 31, 2023 |
||||
| Ordinary Income* | ||||
| Xtrackers Harvest CSI 300 China A-Shares ETF |
$ | 23,017,176 | ||
| Xtrackers Harvest CSI 500 China A-Shares Small Cap ETF |
463,728 | |||
| Xtrackers MSCI All China Equity ETF |
129,968 | |||
| Xtrackers MSCI China A Inclusion Equity ETF |
95,723 | |||
| Year Ended May 31, 2022 |
||||
| Ordinary Income* | ||||
| Xtrackers Harvest CSI 300 China A-Shares ETF |
$ | 23,518,334 | ||
| Xtrackers Harvest CSI 500 China A-Shares Small Cap ETF |
315,040 | |||
| Xtrackers MSCI All China Equity ETF |
423,116 | |||
| Xtrackers MSCI China A Inclusion Equity ETF |
114,292 | |||
| * | For tax purposes short-term capital gain distributions are considered ordinary income distributions. |
At May 31, 2023, for Federal income tax purposes, the Funds have capital loss carryforwards available as shown in the table below, to the extent provided by regulations, to offset future capital gains for an unlimited period. To the extent that these loss carryforwards are used to offset future capital gains, it is probable that the capital gains so offset will not be distributed to shareholders.
| Short-Term | Long-Term | Total Amount | ||||||||||
| Xtrackers Harvest CSI 300 China A-Shares ETF |
$ | 360,440,664 | $ | 106,754,229 | $ | 467,194,893 | ||||||
| Xtrackers Harvest CSI 500 China A-Shares Small Cap ETF |
14,446,255 | 1,274,166 | 15,720,421 | |||||||||
| Xtrackers MSCI All China Equity ETF |
8,211,386 | 5,835,377 | 14,046,763 | |||||||||
| Xtrackers MSCI China A Inclusion Equity ETF |
1,388,705 | 62,745 | 1,451,450 | |||||||||
Capital losses incurred after October 31 (“post-October capital losses”) and late year ordinary losses incurred after December 31 within the taxable year are deemed to arise on the first business day of each Fund’s next taxable year. During the fiscal year ended May 31, 2023, the Fund listed below incurred and will elect to defer late year ordinary losses as follows. The Funds had no post-October capital losses.
| Late Year Ordinary Losses |
||||
| Xtrackers Harvest CSI 500 China A-Shares Small Cap ETF |
$ | 7,668 | ||
51
DBX ETF Trust
Notes to Financial Statements (Continued)
For the fiscal year ended May 31, 2023, the effect of permanent “book/tax” reclassifications to the components of net assets are included below. These differences are primarily due to redemptions-in-kind.
| Distributable earnings (loss) |
Paid-In Capital |
|||||||
| Xtrackers MSCI All China Equity ETF |
$ | (14,727 | ) | $ | 14,727 | |||
As of May 31, 2023, the aggregate cost of investments for federal income tax purposes, the net unrealized appreciation or depreciation and the aggregated gross unrealized appreciation (depreciation) on investments were as follows:
| Aggregate Tax Cost |
Net Unrealized Appreciation (Depreciation) |
Aggregate Gross Unrealized Appreciation |
Aggregate Gross Unrealized (Depreciation) |
|||||||||||||
| Xtrackers Harvest CSI 300 China A-Shares ETF |
$ | 2,370,902,961 | $ | (44,198,192 | ) | $ | 234,245,855 | $ | (278,444,047 | ) | ||||||
| Xtrackers Harvest CSI 500 China A-Shares Small Cap ETF |
27,686,651 | (1,927,298 | ) | 3,275,951 | (5,203,249 | ) | ||||||||||
| Xtrackers MSCI All China Equity ETF |
9,457,373 | (2,708,475 | ) | 221,165 | (2,929,640 | ) | ||||||||||
| Xtrackers MSCI China A Inclusion Equity ETF |
4,586,096 | 561,902 | 1,206,229 | (644,327 | ) | |||||||||||
Foreign Taxes The Funds may be subject to foreign taxes (a portion of which may be reclaimable) on income, capital gains on investments, certain foreign currency transactions or other corporate events. All foreign taxes are recorded in accordance with the applicable foreign tax regulations and rates that exist in the foreign jurisdictions in which the Funds invest. These foreign taxes, if any, are paid by the Funds and are reflected in their Statements of Operations as follows: foreign taxes withheld at source are presented as a reduction of income, foreign taxes on capital gains from sales of investments and foreign currency transactions are included in their respective net realized gain (loss) categories, and deferred foreign taxes on unrealized gains are included in net change in unrealized appreciation (depreciation). Receivables and payables related to foreign taxes as of May 31, 2023, if any, are disclosed in the Funds’ Statements of Assets and Liabilities.
The Funds’ direct investments in China A-Shares will be subject to a number of Chinese tax rules and the application of many of those rules is evolving. Chinese taxes that may apply to the Funds’ direct investments in A-Shares include withholding income tax (“WHT”) on dividends, WHT on bank deposit interest, WHT on capital gains realized from the disposal of equity investments prior to November 17, 2014 and stamp duty. China imposes WHT at a rate of 10% on dividends on shares and interest income derived by non People’s Republic of China (“PRC”) enterprises including Qualified Foreign Institutional Investors (“QFII”) and Renminbi Qualified Foreign Institutional Investors (“RQFII”) from PRC resident issuers, subject to any lower rate provided by an applicable tax treaty.
Since November 17, 2014, QFIIs and RQFIIs have been temporarily exempt from WHT with respect to gains derived from the trading of equity investments (including shares in PRC enterprises). With respect to gains derived from equity investments prior to November 17, 2014, QFIIs and RQFIIs are subject to WHT at a rate of 10% on such gains on a gross basis, subject to any lower rate provided by an applicable tax treaty. The above WHT treatment applies to QFIIs and RQFIIs which do not have a permanent establishment (“PE”) in the PRC. The Funds do not have PEs in the PRC, therefore, the Funds are only subject to WHT at 10% with respect to gross realized gains derived from the disposal of land-rich A-Share companies and exempt from WHT with respect to gross realized gains derived from non land-rich A-Share companies prior to November 17, 2014 as long as treaty relief is eligible. Land-rich enterprises refer to companies whose value of immovable property in the PRC is greater than 50% of the value of their total assets at any time during the three-year period before the alienation of the PRC companies’ shares. The WHT relating to the realized gains from shares in land-rich companies prior to November 17, 2014 has been paid by the Xtrackers Harvest CSI 300 China A-Shares ETF and Xtrackers Harvest CSI 500 China A-Shares Small Cap ETF while realized gains from shares in non land-rich companies prior to November 17, 2014 were granted treaty relief pursuant to the PRC-US Double Taxation Arrangement.
52
DBX ETF Trust
Notes to Financial Statements (Continued)
The PRC rules for taxation of QFIIs and RQFIIs are evolving and the tax regulations to be issued by the PRC State Taxation Administration and/or PRC Ministry of Finance, as well as the practices adopted by the local PRC authorities, may apply retroactively which may adversely affect the Fund and its shareholders.
Foreign Currency Translations The books and records of the Funds are maintained in U.S. dollars. Investment securities and other assets and liabilities denominated in a foreign currency are translated into U.S. dollars at the prevailing exchange rates at period end. Purchases and sales of investment securities, income and expenses are translated into U.S. dollars at the prevailing exchange rates on the respective dates of the transactions.
Net realized and unrealized gains and losses on foreign currency transactions represent net gains and losses between trade and settlement dates on securities transactions, the acquisition and disposition of foreign currencies, and the difference between the amount of net investment income accrued and the U.S. dollar amount actually received. The portion of both realized and unrealized gains and losses on investments that results from fluctuations in foreign currency exchange rates is not separately disclosed, but is included with net realized and unrealized gain/appreciation and loss/depreciation on investments.
Securities Lending The Xtrackers MSCI All China Equity ETF and Xtrackers MSCI China A Inclusion Equity ETF may lend securities to certain financial institutions under the terms of their securities lending agreement. During the term of the loans, the Funds continue to receive interest and dividends generated by the securities and to participate in any changes in their market value. The Funds require the borrowers of the securities to maintain collateral with the Funds consisting of cash and/or securities issued or guaranteed by the U.S. Government, its agencies or instrumentalities having a value at least equal to the value of the securities loaned. When the collateral falls below specified amounts, the lending agent will use its best effort to obtain additional collateral on the next business day to meet required amounts under the securities lending agreement. During the year ended May 31, 2023, the Funds invested the cash collateral into a joint trading account in DWS Government & Agency Securities Portfolio, an affiliated money market fund managed by DWS Investment Management Americas, Inc. DWS Investment Management Americas, Inc. receives a management/administration fee (0.08% annualized effective rate as of May 31, 2023) on the cash collateral invested in DWS Government & Agency Securities Portfolio. The Funds receive compensation for lending their securities either in the form of fees or by earning interest on invested cash collateral, net of borrower rebates and fees paid to a lending agent. Either the Fund or the borrower may terminate the loan at any time and the borrower, after notice, is required to return borrowed securities within a standard time period. There may be risks of delay and costs in recovery of securities or even loss of rights in the collateral should the borrower of the securities fail financially. If the Funds are not able to recover securities lent, the Funds may sell the collateral and purchase a replacement investment in the market, incurring the risk that the value of the replacement security is greater than the value of the collateral. The Funds are also subject to all investment risks associated with the reinvestment of any cash collateral received, including, but not limited to, interest rate, credit and liquidity risk associated with such investments.
As of May 31, 2023, the Funds listed below had securities on loan. The value of the related collateral exceeded the value of the securities loaned at year end.
| Remaining Contractual Maturity of the Agreements, as of May 31, 2023 |
||||||||||||||||||||
| Securities Lending Transactions | Overnight and Continuous |
<30 Days | Between 30 & 90 days |
>90 days | Total | |||||||||||||||
| Xtrackers MSCI All China Equity ETF |
| |||||||||||||||||||
| Common Stocks |
$ | 32,169 | $ | 1,212 | $ | 2,224 | $ | 113,141 | $ | 148,746 | ||||||||||
|
|
|
|
|
|
|
|
|
|
|
|||||||||||
| Gross amount of recognized liabilities and non-cash collateral for securities lending transactions |
|
$ | 148,746 | |||||||||||||||||
Derivatives
Futures Contracts Each Fund may enter into futures contracts. These futures contracts will be used to simulate investment in the respective Underlying Index, to facilitate trading or to reduce transaction costs. Each Fund will enter into futures contracts that are traded on a U.S. or non-U.S. exchange. No Fund will use futures for speculative purposes. Futures contracts provide for the future sale by one party and purchase by another party of a specified amount of a specific instrument or index at a specified future time and at a specified price. For the year ended May 31, 2023, Xtrackers MSCI All China Equity ETF and Xtrackers MSCI China A Inclusion Equity ETF
53
DBX ETF Trust
Notes to Financial Statements (Continued)
utilized futures in order to simulate investment in the Funds’ Underlying Index. To the extent required by law, liquid assets committed to futures contracts will be maintained.
At the time each Fund enters into a futures contract, each Fund deposits and maintains as collateral an initial margin with the broker, as required by the exchange on which the transaction is affected. Pursuant to the contract, each Fund agrees to receive from or pay to the broker an amount of cash equal to the daily fluctuation in the value of the contract. Such receipts or payments are known as variation margin and are recorded by each Fund as unrealized gains or losses. Risks may arise from the potential inability of a counterparty to meet the terms of the contract. The credit/counterparty risk for exchange-traded futures contracts is generally less than privately negotiated futures contracts, since the clearinghouse, which is the issuer or counterparty to each exchange-traded future, provides a guarantee of performance. The guarantee is supported by a daily payment system (i.e., margin requirements).
Use of long futures contracts subjects each Fund to risk of loss in excess of the amounts shown on the Statement of Assets and Liabilities, up to the notional value of the futures contracts. Use of short futures contracts subjects each Fund to unlimited risk of loss. Under some circumstances, futures exchanges may establish daily limits on the amount that the price of a futures contract can vary from the previous day’s settlement price, which could effectively prevent liquidation of unfavorable positions.
A summary of the open futures contracts as of May 31, 2023 is included in a table following the Funds’ Schedule of Investments.
The following tables summarize the value of the Funds’ derivative instruments held as of May 31, 2023 and the related location in the accompanying Statement of Assets and Liabilities, presented by primary underlying risk exposure:
| Asset Derivatives |
Liability Derivatives |
|||||||||||||
| Xtrackers MSCI All China Equity ETF | ||||||||||||||
| Equity contracts | Unrealized appreciation on futures contracts* | $ | — | Unrealized depreciation on futures contracts* | $ | 349 | ||||||||
| Xtrackers MSCI China A Inclusion Equity ETF | ||||||||||||||
| Equity contracts | Unrealized appreciation on futures contracts* | $ | — | Unrealized depreciation on futures contracts* | $ | 349 | ||||||||
| * | Includes cumulative appreciation or cumulative depreciation on futures contracts as disclosed in the Schedule of Investments. Unsettled variation margin is disclosed separately within the Statement of Assets and Liabilities. |
Additionally, the amount of realized and unrealized gains and losses on derivative instruments recognized in the Funds’ earnings during the year ended May 31, 2023 and the related location in the accompanying Statement of Operations is summarized in the following tables by primary underlying risk exposure:
| Net Realized Gain (Loss) from: |
||||
| Futures Contracts — Equity Contracts |
||||
| Xtrackers MSCI All China Equity ETF |
$ | (4,967 | ) | |
| Xtrackers MSCI China A Inclusion Equity ETF |
(543 | ) | ||
| Net Change in Unrealized Appreciation (Depreciation) on: |
||||
| Futures Contracts — Equity Contracts |
||||
| Xtrackers MSCI All China Equity ETF |
$ | (349 | ) | |
| Xtrackers MSCI China A Inclusion Equity ETF |
(821 | ) | ||
54
DBX ETF Trust
Notes to Financial Statements (Continued)
For the year ended May 31, 2023 the average monthly volume of derivatives was as follows:
| Futures Contracts (Contract Value) |
||||
| Xtrackers MSCI All China Equity ETF |
$ | 29,720 | ||
| Xtrackers MSCI China A Inclusion Equity ETF |
15,398 | |||
Affiliated Cash Management Vehicles The Funds may invest uninvested cash balances in DWS Government Money Market Series and DWS ESG Liquidity Fund, affiliated money market funds which are managed by DWS Investment Management Americas, Inc. (“DIMA”), also an indirect, wholly owned subsidiary of DWS Group GmbH & Co. KGaA. Each affiliated money market fund is managed in accordance with Rule 2a-7 under the 1940 Act, which governs the quality, maturity, diversity and liquidity of instruments in which a money market fund may invest. DWS Government Money Market Series seeks to maintain a stable NAV, and DWS ESG Liquidity Fund maintains a floating NAV. The Funds indirectly bear their proportionate share of the expenses of each affiliated money market fund in which they invest. The Advisor will waive an amount of the unitary advisory fee payable to the Advisor by the Funds equal to such acquired fund’s fees and expenses on the Funds’ assets invested in the affiliated money market funds.
3. Investment Advisory and Other Agreements
The Advisor has overall responsibility for the general management and administration of the Funds, subject to the supervision of the Funds’ Board of Trustees. Under an investment advisory agreement between the Trust, on behalf of the Funds, and the Advisor (the “Investment Advisory Agreement”), the Advisor is responsible for arranging sub-advisory, transfer agency, custody, fund administration, and all other non-distribution related services for the Funds to operate.
Harvest Global Investments Limited serves as investment sub-Advisor (the “Sub-Advisor”) to the Xtrackers Harvest CSI 300 China A-Shares ETF and the Xtrackers Harvest CSI 500 China A-Shares Small Cap ETF. The Sub-Advisor is responsible for day-to-day management of each Fund, subject to supervision of the Advisor.
For its investment advisory services to the Funds below, the Advisor is entitled to receive a unitary advisory fee based on each Fund’s average daily net assets, computed and accrued daily and payable monthly, at an annual rate equal to:
| Unitary Advisory Fee |
||||
| Xtrackers Harvest CSI 300 China A-Shares ETF |
0.65 | % | ||
| Xtrackers Harvest CSI 500 China A-Shares Small Cap ETF |
0.65 | % | ||
| Xtrackers MSCI All China Equity ETF |
0.50 | % | ||
| Xtrackers MSCI China A Inclusion Equity ETF |
0.60 | % | ||
The Advisor for Xtrackers MSCI All China Equity ETF has contractually agreed, until November 14, 2024, to waive a portion of its unitary advisory fee in an amount equal to the acquired fund’s fees and expenses attributable to the Fund’s investments in affiliated funds. In addition, the Advisor has contractually agreed, until September 30, 2023, to waive a portion of its unitary advisory fee to the extent necessary to prevent the operating expenses
(except for interest expense, taxes, brokerage expenses, distribution fees or expenses, litigation expenses and other extraordinary expenses) of the Fund from exceeding 0.50% of the Fund’s average daily net assets. For the year ended May 31, 2023, the Advisor waived $25,400 of the expenses of the Fund which were attributable to the Fund’s investments in affiliated funds.
The Advisor for Xtrackers MSCI China A Inclusion Equity ETF has contractually agreed to waive a portion of its unitary advisory fee in an amount equal to the acquired fund’s fees and expenses attributable to the Fund’s investments in affiliated funds. For the year ended May 31, 2023, the advisor waived $32 of the expenses of the Fund.
55
DBX ETF Trust
Notes to Financial Statements (Continued)
The Advisor for the Funds below has contractually agreed to waive a portion of its unitary advisory fee in an amount equal to the acquired funds’ fees and expenses attributable to the Funds’ investments in affiliated cash management vehicles. For the year ended May 31, 2023, the Advisor waived expenses of the Funds as follows:
| Expenses Waived |
||||
| Xtrackers MSCI All China Equity ETF |
$ | 114 | ||
| Xtrackers MSCI China A Inclusion Equity ETF |
44 | |||
Out of the unitary advisory fee, the Advisor pays substantially all expenses of each Fund, including the cost of transfer agency, custody, fund administration, legal, audit and other services, and expenses of the Independent Trustees. Each Fund is responsible for the payment of interest expense, acquired fund fees and expenses, taxes, brokerage expenses, distribution fees or expenses, if any, litigation expenses and extraordinary expenses.
The Bank of New York Mellon, a wholly-owned subsidiary of The Bank of New York Mellon Corporation, serves as Administrator, Custodian, Accounting Agent, Lending Agent and Transfer Agent for each Fund.
ALPS Distributors, Inc. (the “Distributor”) serves as the distributor of Creation Units for each Fund on an agency basis. The Distributor does not maintain a secondary market in shares of the Funds.
The Board of Trustees is currently comprised of three Independent Trustees. The Advisor paid retainer fees and attendance fees to each Independent Trustee; retainer fees to the Chairman of the Board of Trustees and Chairman of the Audit Committee; and attendance fees to each member of the Audit Committee (which is comprised of all of the Funds’ Independent Trustees).
4. Investment Portfolio Transactions
For the year ended May 31, 2023, the cost of investments purchased and proceeds from sale of investments (excluding in-kind transactions and short-term investments) were as follows:
| Purchases | Sales | |||||||
| Xtrackers Harvest CSI 300 China A-Shares ETF |
$ | 2,499,588,044 | $ | 1,501,907,875 | ||||
| Xtrackers Harvest CSI 500 China A-Shares Small Cap ETF |
12,008,252 | 18,738,698 | ||||||
| Xtrackers MSCI All China Equity ETF |
539,360 | 1,136,389 | ||||||
| Xtrackers MSCI China A Inclusion Equity ETF |
683,462 | 732,793 | ||||||
For the year ended May 31, 2023, the cost of in-kind purchases and proceeds from in-kind sale were as follows:
| Purchases | Sales | |||||||
| Xtrackers MSCI All China Equity ETF |
$ | — | $ | 823,188 | ||||
5. Fund Share Transactions
As of May 31, 2023, there were unlimited Fund shares, no par value, authorized by the Trust. Fund shares are issued and redeemed by each Fund only in Creation Units or multiples thereof. Except when aggregated in Creation Units, shares of each Fund are not redeemable. Transactions in capital shares for each Fund are disclosed in detail in the Statements of Changes in Net Assets. The consideration for the purchase of Creation Units of Xtrackers MSCI All China Equity ETF generally consists of the in-kind contribution of a designated portfolio of securities constituting a portfolio sampling representation of the securities included in the respective Fund’s Underlying Index and an amount of cash, which under certain circumstances may include cash in lieu of portfolio securities. The purchase of Creation Units for Xtrackers Harvest CSI 300 China A-Shares ETF, Xtrackers Harvest CSI 500 China A-Shares Small Cap ETF and Xtrackers MSCI China A Inclusion Equity ETF are generally issued in exchange for a specific amount of cash totaling the NAV of the Creation Units. Investors purchasing and redeeming Creation Units pay a purchase transaction fee and a redemption transaction fee to offset transfer and other transaction costs associated with the issuance and redemption of Creation Units.
56
DBX ETF Trust
Notes to Financial Statements (Continued)
6. Concentration of Ownership
From time to time, Xtrackers MSCI China A Inclusion Equity ETF may have a concentration of several shareholders, including affiliated funds, holding a significant percentage of shares outstanding. Investment activities of these shareholders could have a material impact on the Fund. As of May 31, 2023, Xtrackers MSCI All China Equity ETF held 61% of the total shares outstanding of the Fund.
7. Investing in China
Investing in securities of Chinese issuers involves certain risks and considerations not typically associated with investing in securities of U.S. issuers, including, among others; more frequent (and potentially widespread) trading suspensions and government interventions with respect to Chinese issuers, resulting in lack of liquidity and in price volatility; currency revaluations and other currency exchange rate fluctuations or blockage; the nature and extent of intervention by the Chinese government in the Chinese securities markets (including both direct and indirect market stabilization efforts, which may affect valuations of Chinese issuers), whether such intervention will continue and the impact of such intervention or its discontinuation; the risk of nationalization or expropriation of assets; the risk that the Chinese government may decide not to continue to support economic reform programs; limitations on the use of brokers (or action by the Chinese government that discourages brokers from serving international clients); higher rates of inflation; greater political, economic and social uncertainty; higher market volatility caused by any potential regional territorial conflicts or natural disasters; the risk of increased trade tariffs, embargoes and other trade limitations; restrictions on foreign ownership which require US investors to invest in offshore special purpose companies to obtain indirect exposure to Chinese issuers; custody risks associated with investing through Stock Connect, an RQFII or other programs to access the Chinese securities markets, both interim and permanent market regulations which may affect the ability of certain stockholders to sell Chinese securities when it would otherwise be advisable; different and less stringent financial reporting standards; and increased political pressure from the US and other countries to restrict the ability of investors outside China to invest in Chinese issuers. In addition, in June 2021, the President of the United States issued an executive order (“CMIC Order”) prohibiting US persons, including the Funds, from purchasing or selling publicly traded securities (including publicly traded securities that are derivative of, or designed to provide exposure to, such securities) of any Chinese company identified as a “Chinese Military-Industrial Complex Company”
(“CMIC”). This prohibition, effective August 2, 2021, expands on similar sanctions imposed by the prior administration on certain designated Chinese military companies (“CCMCs”) that took effect in January 2021. To the extent that any company in an Underlying Index is identified as a CMIC at any time (or was previously designed as a CCMC), it may have material adverse effect on a fund’s ability to track its Underlying Index.
8. Line of Credit
The Trust has entered into a senior unsecured credit facility with a syndication of banks which allows the Xtrackers Harvest CSI 300 China A-Shares ETF, Xtrackers Harvest CSI 500 China A-Shares Small Cap ETF, Xtrackers MSCI China A Inclusion Equity ETF and certain other funds managed by the Advisor to borrow up to $105 million. Each Fund may borrow money under this credit facility to the extent necessary for temporary or emergency purposes, including the funding of shareholder redemption requests, trade settlements, and as necessary to distribute to shareholders any income necessary to maintain each Funds’ status as a regulated investment company. Borrowings are charged an interest rate of 1.25% per annum plus the greater of the Federal Funds Effective Rate or the Secured Overnight Financing Rate plus .10%. Each Fund may borrow up to the lesser of 33 percent of its net assets as permitted by the 1940 Act or 25 percent of adjusted total net assets. The Funds had no outstanding loans at May 31, 2023.
57
DBX ETF Trust
To the Shareholders of
Xtrackers Harvest CSI 300 China A-Shares ETF, Xtrackers Harvest CSI 500 China A-Shares Small Cap ETF, Xtrackers MSCI All China Equity ETF and Xtrackers MSCI China A Inclusion Equity ETF and the Board of Trustees of DBX ETF Trust
Opinion on the Financial Statements
We have audited the accompanying statements of assets and liabilities of Xtrackers Harvest CSI 300 China A-Shares ETF, Xtrackers Harvest CSI 500 China A-Shares Small Cap ETF, Xtrackers MSCI All China Equity ETF and Xtrackers MSCI China A Inclusion Equity ETF (collectively referred to as the “Funds”), (four of the funds constituting DBX ETF Trust (the “Trust”)), including the schedules of investments, as of May 31, 2023, and the related statements of operations for the year ended, the statements of changes in net assets for each of the two years in the period then ended, the financial highlights for each of the five years in the period then ended and the related notes (collectively referred to as the “financial statements”). In our opinion, the financial statements present fairly, in all material respects, the financial position of each of the Funds (four of the funds constituting DBX ETF Trust) at May 31, 2023, the results of their operations for the year then ended, the changes in their net assets for each of the two years in the period then ended and their financial highlights for each of the five years in the period then ended, in conformity with U.S. generally accepted accounting principles.
Basis for Opinion
These financial statements are the responsibility of the Trust’s management. Our responsibility is to express an opinion on each of the Funds’ financial statements based on our audits. We are a public accounting firm registered with the Public Company Accounting Oversight Board (United States) (“PCAOB”) and are required to be independent with respect to the Trust in accordance with the U.S. federal securities laws and the applicable rules and regulations of the Securities and Exchange Commission and the PCAOB.
We conducted our audits in accordance with the standards of the PCAOB. Those standards require that we plan and perform the audit to obtain reasonable assurance about whether the financial statements are free of material misstatement, whether due to error or fraud. The Trust is not required to have, nor were we engaged to perform, an audit of the Trust’s internal control over financial reporting. As part of our audits we are required to obtain an understanding of the internal control over financial reporting but not for the purpose of expressing an opinion on the effectiveness of the Trust’s internal control over financial reporting. Accordingly, we express no such opinion.
Our audits included performing procedures to assess the risks of material misstatement of the financial statements, whether due to error or fraud, and performing procedures that respond to those risks. Such procedures included examining, on a test basis, evidence regarding the amounts and disclosures in the financial statements. Our procedures included confirmation of securities owned as of May 31, 2023, by correspondence with the custodians, brokers and others; when replies were not received from brokers, we performed other auditing procedures. Our audits also included evaluating the accounting principles used and significant estimates made by management, as well as evaluating the overall presentation of the financial statements. We believe that our audits provide a reasonable basis for our opinion.

We have served as the auditor of one or more investment companies in the DWS family of funds since at least 1979, but we are unable to determine the specific year.
New York, New York
July 25, 2023
58
DBX ETF Trust
Regulatory Update — Tailored Shareholder Report
Effective January 24, 2023, the SEC amended the rules for mutual fund and exchange-traded fund (“ETF”) annual and semi-annual shareholder reports. The amended rules apply to mutual funds and ETFs that are registered on Form N-1A (i.e., open-end funds) and implement a new streamlined disclosure framework requiring “concise and visually engaging” shareholder reports highlighting key information, including a simplified expense presentation, performance information, portfolio holdings and certain fund statistics. The amended rules seek to simplify shareholder reporting by consolidating investor friendly data in one report and moving other data to Form N-CSR, creating a layered disclosure framework. Certain information from the Funds’ current shareholder reports, including the Funds’ investment portfolio, financial statements and financial highlights, will move to Form N-CSR. This information must be available online, delivered free of charge upon request and filed on a semiannual basis on Form N-CSR. Notably, the amended rules will require mutual funds and ETFs to prepare separate individual shareholder reports for each fund share class. The amendments also include a revised definition of “appropriate broad-based securities market index” that will affect performance presentations in the new streamlined reports and mutual fund and ETF prospectuses. The amended rules and related form amendments have a compliance date of July 24, 2024. At this time, management is evaluating the impact of the amended rules and form amendments on the content of the Funds’ current shareholder reports.
59
DBX ETF Trust
In accordance with Rule 22e-4 (the “Liquidity Rule”) under the Investment Company Act of 1940 (the “1940 Act”), your Fund has adopted a liquidity risk management program (the “Program”), and the Board has designated DBX Advisors LLC (the “Advisor”) as Program administrator. The Program is designed to assess and manage your Fund’s liquidity risk (the risk that the Fund would be unable to meet requests to redeem shares of the Fund without significant dilution of remaining investors’ interests in the Fund). The Advisor has designated a committee (the “Committee”) composed of personnel from multiple departments within an affiliate of the Advisor that is responsible for the implementation and ongoing administration of the Program, which includes assessing the Fund’s liquidity risk under both normal and reasonably foreseeable stressed conditions. Under the Program, every investment held by a Fund is classified on a daily basis into one of four liquidity categories based on estimations of the investment’s ability to be sold during designated timeframes in current market conditions without significantly changing the investment’s market value.
Xtrackers MSCI All China Equity ETF
In February 2023, as required by the Program and the Liquidity Rule, the Advisor provided the Board with an annual written report (the “Report”) addressing the operation of the Program and assessing the adequacy and effectiveness of its implementation during the period from December 1, 2021 through November 30, 2022 (the “Reporting Period”). During the Reporting Period, your Fund was primarily invested in highly liquid investments (investments that the Fund anticipates can be converted to cash within three business days or less in current market conditions without significantly changing their market value). As a result, your Fund is not required to adopt, and has not adopted, a “Highly Liquid Investment Minimum” as defined in the Liquidity Rule. During the Reporting Period, the Fund did not approach the 15% limit imposed by the Liquidity Rule on holdings in illiquid investments (investments that cannot be sold or disposed of in seven days or less in current market conditions without the sale of the investment significantly changing the market value of the investment). Your Fund did not experience any issues meeting investor redemptions at any time during the Reporting Period. In the Report, the Advisor stated that it believes the Program has operated adequately and effectively to manage the Fund’s liquidity risk during the Reporting Period. The Advisor also reported that there were no material changes made to the Program during the Reporting Period.
Xtrackers Harvest CSI 300 China A-Shares ETF, Xtrackers Harvest CSI 500 China A-Shares Small Cap ETF and Xtrackers MSCI China A Inclusion Equity ETF
In February 2023, as required by the Program and the Liquidity Rule, the Advisor provided the Board with an annual written report (the “Report”) addressing the operation of the Program and assessing the adequacy and effectiveness of its implementation during the period from December 1, 2021 through November 30, 2022 (the “Reporting Period”). During the Reporting Period, your Fund was primarily invested in highly liquid investments (investments that the Fund anticipates can be converted to cash within three business days or less in current market conditions without significantly changing their market value). As a result, your Fund is not required to adopt, and has not adopted, a “Highly Liquid Investment Minimum” as defined in the Liquidity Rule. During the Reporting Period, on two occasions your Fund did experience a temporary breach of the 15% limit imposed by the Liquidity Rule on holdings in illiquid investments (investments that cannot be sold or disposed of in seven days or less in current market conditions without the sale of the investment significantly changing the market value of the investment). The breaches were caused by the temporary reclassification of Chinese securities as illiquid due to an extended Chinese and Taiwan holiday market closure in January/February 2022 and a separate extended Chinese holiday market closure in October 2022. Because notifications to the Fund’s board of the anticipated extended holiday closures were made before the start of each holiday closure no filing on Form N-LIQUID was required. Also, because the holiday closures were anticipated in advance, no actions were needed to rebalance the Fund’s portfolio. Your Fund did not experience any issues meeting investor redemptions at any time during the Reporting Period. In the Report, the Advisor stated that it believes the Program has operated adequately and effectively to manage the Fund’s liquidity risk during the Reporting Period. The Advisor also reported that there were no material changes made to the Program during the Reporting Period.
60
DBX ETF Trust
Xtrackers MSCI China A Inclusion Equity ETF and Xtrackers MSCI All China Equity ETF
Board Approval of Investment Advisory Agreement with DBX Advisors LLC
After discussions at the meeting of the Board of Trustees (“Board” or “Trustees”) held on February 15-16, 2023 (the “Meeting”), the Trustees, all of whom are the Independent Trustees (those not affiliated with DBX ETF Trust (the “Trust”) or its service providers), unanimously approved the continuance of the Investment Advisory Agreement with respect to Xtrackers MSCI All China Equity ETF and Xtrackers MSCI China A Inclusion Equity ETF (each a “Fund,” and collectively, the “Funds”). The Independent Trustees were advised throughout the review and Meeting by K&L Gates LLP (“Independent Trustee Counsel”).
Before reaching their decision to approve the Investment Advisory Agreement for another annual period, the Independent Trustees evaluated the materials furnished to them in advance of the Meeting from DBX Advisors LLC (“DBX” or the “Advisor”) for purposes of reviewing the agreement’s terms, including statistical information prepared by Broadridge Financial Solutions Inc. (“Broadridge”) regarding (a) fee and expense information for each Fund (including the fee and expense components and any amounts waived or reimbursed) as compared to a peer group of other exchange-traded funds (“ETFs”) selected pursuant to Broadridge’s proprietary methodology (each, a “Peer Group”) and (b) each Fund’s tracking error as compared to its underlying index over the previous five years (or since inception, if shorter). The Independent Trustees met with representatives of the Advisor on February 13, 2023 to review financial reports and other information provided by the Advisor and inquire further with regard to the financial information provided, and asked questions of the Advisor during this meeting. The Independent Trustees also took into consideration the discussions they had with management before and during the Meeting and among themselves during their Executive Sessions held on February 15 and February 16, 2023.
The Independent Trustees also noted that they had received and should take into consideration a substantial amount of information furnished throughout the year at regular Board meetings, which information included, among other things, an analysis of each Fund’s investment performance, tracking error and related financial information, presentations given by DBX, as well as its periodic reports on brokerage commissions, portfolio execution and other services provided to the Funds.
In reaching its decision to continue in effect the Investment Advisory Agreement for another annual period, the Board considered all factors it believed relevant, including (1) the nature, extent and quality of the services provided to the Funds and their shareholders; (2) the financial resources of DBX and its resulting ability to perform its obligations under the Investment Advisory Agreement; (3) the competitiveness of the advisory fee; (4) the total cost of the services provided by and the profits realized by the Advisor from its relationship with the Funds; (5) the extent to which economies of scale have been realized, and if the Funds’ shareholders have benefitted from those economies; and (6) fall out benefits, if any, enjoyed by the Advisor.
The Board reached a determination, with the assistance of Independent Trustee Counsel and Vedder Price P.C. (“Trust Counsel”) and through the exercise of its business judgment, that approval of the Investment Advisory Agreement and the compensation to be received thereunder is in the best interests of each Fund and its shareholders as well as consistent with the Board’s duties under state and federal law. The Board reached this conclusion based on multiple factors.
The Board considered the following in determining whether to approve the Investment Advisory Agreement:
Nature, Extent and Quality of Services. The Board reviewed in detail the nature, extent and quality of services provided and the risks incurred by the Advisor under the Investment Advisory Agreement. In doing so, the Board considered the information it had received from and the discussions it had with the Advisor continuously during the prior year, in addition to the information the Advisor had provided in response to the Board’s requests prior to the Meeting. The Board considered that these services include, among other things, furnishing a continuous investment program for the Funds, including arranging for, or implementing, the purchase and sale of portfolio securities, the provision of general corporate services such as portfolio management compliance services and the preparation and filing of certain reports on behalf of the Trust. The Board also considered, among other things, the professional experience, qualifications and performance of the senior management and key professional personnel of the Advisor, including portfolio management.
61
DBX ETF Trust
Board Considerations in Approval of Investment Advisory and Sub-Advisory Contracts (Unaudited) (Continued)
The Board considered that the Advisor provides, at its own expense, office facilities and equipment for use by the Funds and supervisory persons responsible for supervising and monitoring the Trust’s service providers. The Board also considered that the Advisor pays or arranges for the compensation of officers of the Trust who are also officers or employees of the Advisor or one of its DWS Group affiliates, except as may otherwise be determined by the Board. In addition, the Board considered that the Advisor arranges for the provision of transfer agency, custody, fund administration and accounting, and other non-distribution services necessary for the Funds’ operations. The Board also considered that in addition to managing the Funds’ portfolios directly, the Advisor provides oversight of day-to-day operations, including monitoring tracking error, providing services in connection with the creation and redemption of creation units and assistance in meeting legal, compliance and regulatory requirements applicable to the Funds.
The Board considered the information regarding each Fund’s tracking error compared to its underlying index that had been provided by the Advisor and by Broadridge. The Board took note of the detailed information provided by the Advisor throughout the year with respect to each Fund’s tracking error and the sources thereof. The Trustees noted that tracking error for each Fund during the year was in an expected range.
Based on its review, the Board concluded that the nature, extent, and quality of services provided by the Advisor under the Investment Advisory Agreement are reasonable and appropriate in relation to the fees paid to the Advisor, taking special consideration of the fact that the advisory fee is a unitary fee and, as a result, a portion of the unitary advisory fee will be used to compensate the Funds’ service providers. The Board considered the staffing of the Advisor, including the training, qualifications and experience of investment personnel in managing the Funds. The Board also considered the expertise of the Advisor in supervising third party service providers to the Funds, such as the administrator and the custodian, noting the Advisor’s extensive work with these service providers (including onsite due diligence sessions) to conduct such supervision. The Board further considered the compliance program of the Advisor, which supports the Funds’ compliance program.
Advisor’s Financial Resources. In connection with the assessment of the ability of the Advisor to perform its duties under the Investment Advisory Agreement, the Board considered the Advisor’s financial condition and whether it has the resources necessary to carry out its functions. The Board concluded that the Advisor has the financial resources necessary to perform its obligations under the Investment Advisory Agreement.
Reasonableness of Advisory Fee. The Board compared each Fund’s advisory fee and total expenses to those of the other ETFs in its Peer Group. The Board noted that due to the special characteristics of certain Funds, there were limitations faced by Broadridge in providing comparable funds in the Peer Groups and the information in the Broadridge reports accordingly may or may not provide meaningful direct comparisons to the Funds. The Board also noted that the advisory fees and total expenses (after waivers/reimbursements) for the Xtrackers MSCI All China Equity ETF were below or equal to the average and/or median of the ETFs in the Fund’s Peer Group compiled by Broadridge, but Xtrackers MSCI China A Inclusion Equity ETF had advisory fees and/or total expenses (after waivers/reimbursements) that were above the average and/or median of the Fund’s Peer Group.
The Board accordingly noted that each Fund’s fee is competitive with the fees of applicable peer ETFs. The Board considered that the fee for each of the Funds is a unitary fee pursuant to which the Advisor pays all of the Funds’ costs (subject to certain specified exceptions). The Board considered that each Fund’s fee had been priced to scale when it was established. The Board also considered that each Fund’s portfolio is managed on a day-to-day basis by the Advisor and that the Advisor also provides oversight of day-to-day operations, including monitoring tracking error, providing services in connection with creation and redemption units and assistance in meeting legal and regulatory requirements applicable to the Funds. Based on its review, the Board concluded that the advisory fee for each Fund is reasonable in light of the services provided.
Costs of Services and Profitability. The Board considered the expenses of the Advisor in developing and rendering services provided to the Funds and the information provided by the Advisor to the Board regarding the Funds’ profitability. The Board considered that the Advisor had provided extensive information about the Advisor’s profitability and the Advisor’s methodology in determining profitability. While the Advisor had provided information about the Advisor’s expenses relating to marketing the Funds, the Board considered the Advisor’s profitability without accounting for such expenses. The Board determined that, although only some of the Funds
62
DBX ETF Trust
Board Considerations in Approval of Investment Advisory and Sub-Advisory Contracts (Unaudited) (Continued)
were profitable as of this time, the Advisor’s profitability with respect to each profitable Fund was not excessive. The Board considered whether the Advisor would benefit in other ways from its relationships with the Funds and concluded that there were no material fall-out benefits likely to accrue to the Advisor related to the operation of the Funds.
Economies of Scale. The Board considered that certain Funds had attracted a substantial amount of assets, but determined that those Funds were not experiencing economies of scale beyond what was reflected in each Fund’s unitary fee, which the Board noted was very competitive. The Board considered that the other Funds were not experiencing economies of scale at this time and determined to revisit this matter after the Funds had attracted more assets. The Board also acknowledged that the concept of economies of scale is a complex subject as to determining with a fair degree of certainty whether economies of scale exist, to what extent they exist, whether scale can result in additional expenses, and alternative ways advisers can share benefits of economies of scale.
Given all the information available to it and considering all material factors, the Board concluded that the Investment Advisory Agreement was fair and reasonable and it was unanimously approved.
Xtrackers Harvest CSI 300 China A-Shares ETF and Xtrackers Harvest CSI 500 China A-Shares Small Cap ETF
Board Approval of Investment Advisory Agreement with DBX Advisors LLC and Investment Sub-Advisory Agreement with Harvest Global Investments Limited
After discussions at the meeting of the Board of Trustees (“Board” or “Trustees”) held on February 15-16, 2023 (the “Meeting”), the Trustees, all of whom are Independent Trustees (those not affiliated with DBX ETF Trust (the “Trust”) or its service providers), unanimously approved the continuance of the Investment Advisory Agreement and Investment Sub-Advisory Agreement with respect to Xtrackers Harvest CSI 300 China A-Shares ETF and Xtrackers Harvest CSI 500 China A-Shares Small Cap ETF (each a “Fund,” and collectively, the “Funds”). The Independent Trustees were advised throughout the review and Meeting by K&L Gates LLP (“Independent Trustee Counsel”).
Before reaching their decision to continue in effect the Investment Advisory Agreement and the Investment Sub-Advisory Agreement for another annual period, the Independent Trustees evaluated the materials furnished to them in advance of the Meeting from DBX Advisors LLC (“DBX” or the “Advisor”) and Harvest Global Investments Limited (“Harvest” or “Sub-Advisor”) for purposes of reviewing the agreements’ terms and also took into consideration the discussions they had with management before and during the Meeting and among themselves during their Executive Sessions held on February 15-16, 2023. The Independent Trustees also noted that they had received and should take into consideration a substantial amount of information furnished throughout the year at regular Board meetings, which information included, among other things, an analysis of each Fund’s investment performance and related financial information, presentations given by DBX and Harvest, as well as periodic reports on brokerage commissions, portfolio execution and other services provided to the Funds.
In reaching its decision with respect to the Investment Advisory Agreement, the Board considered all factors it believed relevant, including (1) the nature, extent and quality of the services provided to the Funds and their shareholders; (2) the financial resources of DBX and its resulting ability to perform its obligations under the Investment Advisory Agreement; (3) the competitiveness of the advisory fee; (4) the total cost of the services provided by and the profits realized by the Advisor from its relationship with the Funds; (5) the extent to which economies of scale have been realized, and if the Funds’ shareholders have benefitted from those economies; and (6) fall out benefits, if any, enjoyed by the Advisor.
In reaching its decision with respect to the Investment Sub-Advisory Agreement, the Board considered all factors it believed relevant, including (1) the nature, extent and quality of the services provided to the Funds and their shareholders; (2) the performance of Harvest with respect to its management of the Funds, as well as Harvest’s financial resources and its resulting ability to perform its obligations under the Investment Sub-Advisory Agreement; (3) the total cost of the services provided by Harvest from its relationship with the Funds; (4) the extent to which economies of scale have been realized, and if the Funds’ shareholders have benefitted from those economies; and (5) fall out benefits, if any, enjoyed by the Sub-Advisor.
The Board reached a determination, with the assistance of Independent Trustee Counsel and Vedder Price P.C. (“Trust Counsel”) and through the exercise of its business judgment, that approval of the Investment Advisory
63
DBX ETF Trust
Board Considerations in Approval of Investment Advisory and Sub-Advisory Contracts (Unaudited) (Continued)
Agreement and the Investment Sub-Advisory Agreement and the compensation to be received thereunder is in the best interests of each Fund and its shareholders as well as consistent with the Board’s duties under state and federal law. The Board reached this conclusion based on multiple factors.
The Board considered the following in determining whether to approve the Investment Advisory Agreement:
Nature, Extent and Quality of Services. The Board reviewed in detail the nature, extent and quality of services provided and the risks incurred by the Advisor under the Investment Advisory Agreement. In doing so, the Board considered the information it had received from and the discussions it had with the Advisor continuously during the prior year, in addition to the information the Advisor had provided in response to the Board’s requests prior to the Meeting. The Board considered that these services include, among other things, furnishing a continuous investment program for the Funds, including arranging for, or implementing, the purchase and sale of portfolio securities, the provision of general corporate services such as portfolio management compliance services and the preparation and filing of certain reports on behalf of the Trust. The Board also considered, among other things, the professional experience, qualifications and performance of the senior management and key professional personnel of the Advisor, including portfolio management.
The Board considered that the Advisor provides, at its own expense, office facilities and equipment for use by the Funds and supervisory persons responsible for supervising and monitoring the Trust’s service providers. The Board also considered that the Advisor pays or arranges for the compensation of officers of the Trust who are also officers or employees of the Advisor or one of its DWS Group affiliates, except as may otherwise be determined by the Board. The Board also considered that the Advisor arranges for the provision of transfer agency, custody, fund administration and accounting, and other non-distribution services necessary for the Funds’ operation. The Board also considered the role played by the Advisor in working with Harvest to manage the Funds’ portfolios, noting that the Advisor provides oversight of day-to-day operations, including monitoring tracking error, providing services in connection with the creation and redemption of creation units and assistance in meeting legal, compliance and regulatory requirements applicable to the Funds. The Board considered the information regarding each Fund’s tracking error compared to its underlying index that had been provided by the Advisor and by Broadridge Financial Solutions Inc. (“Broadridge”). The Board took note of the detailed information provided by the Advisor throughout the year with respect to each Fund’s tracking error and the sources thereof. The Trustees noted that tracking error for each Fund during the year was in an expected range.
Based on its review, the Board concluded that the nature, extent, and quality of services provided by the Advisor under the Investment Advisory Agreement are reasonable and appropriate in relation to the fees paid to the Advisor, taking special consideration of the fact that the advisory fee is a unitary fee and, as a result, a portion of the unitary advisory fee will be used to compensate the Funds’ service providers. The Board considered the staffing of the Advisor, including the training, qualifications and experience of investment personnel in managing the Funds. The Board also considered the expertise of the Advisor in supervising third party service providers to the Funds, such as the administrator and the custodian, noting the Advisor’s extensive work with these service providers (including onsite due diligence sessions) to conduct such supervision. The Board further considered the compliance program of the Advisor, which supports the Funds’ compliance program.
Advisor’s Financial Resources. In connection with the assessment of the ability of the Advisor to perform its duties under the Investment Advisory Agreement, the Board considered the Advisor’s financial condition and whether it has the resources necessary to carry out its functions. The Board concluded that the Advisor has the financial resources necessary to perform its obligations under the Investment Advisory Agreement.
Reasonableness of Advisory Fee. The Board compared each Fund’s advisory fee and total expenses to those of the other ETFs in its Peer Group. The Board noted that due to the special characteristics of certain Funds, there were limitations faced by Broadridge in providing comparable funds in the Peer Groups and the information in the Broadridge reports accordingly may or may not provide meaningful direct comparisons to the Funds. The Board considered that while each Fund’s advisory fees and total expenses after waivers/reimbursements were above the average and median of those Funds’ respective Peer Groups, many of those other ETFs in the Funds’ respective Peer Groups only invested directly in A-Shares through the Stock Connect programs, rather than also utilizing the Renminbi Qualified Foreign Institutional Investor (“RQFII”) program, as the Funds did using the quota
64
DBX ETF Trust
Board Considerations in Approval of Investment Advisory and Sub-Advisory Contracts (Unaudited) (Continued)
allocated to the Sub-Advisor. The Board also noted that the Chinese authorities had abolished the quotas under the RQFII system, but that it remained in the Funds’ best interests to continue utilizing Harvest as the Funds’ sub-advisor and that Harvest’s local market capabilities provided the Funds with the widest feasible range of means to access A-shares.
The Board considered that the fee for the Funds is a unitary fee pursuant to which the Advisor pays all of the Funds’ costs (subject to certain specified exceptions). The Board considered that each Fund’s fee had been priced to scale when it was established. The Board also considered that the Funds’ portfolios are managed on a day-to-day basis by the Sub-Advisor, which receives a fee from the Advisor. The Board considered the allocation of responsibilities between the Advisor and Sub-Advisor and noted that the Advisor provides oversight of day-to-day operations, including monitoring tracking error, providing services in connection with creation and redemption units and assistance in meeting legal and regulatory requirements applicable to the Funds. Based on its review, the Board concluded that the advisory fee is reasonable in light of the services provided.
Costs of Services and Profitability. The Board considered the expenses of the Advisor in developing and rendering services to the Funds and the information provided by the Advisor to the Board regarding the Funds’ profitability. The Board considered that the Advisor had provided extensive information about the Advisor’s profitability and the Advisor’s methodology in determining profitability. While the Advisor had provided information about the Advisor’s expenses relating to marketing the Funds, the Board considered the Advisor’s profitability without accounting for such expenses. The Board determined that only Xtrackers Harvest CSI 300 China A-Shares ETF was profitable as of this time and the Advisor’s profitability with respect to the Fund was not excessive. The Board also noted that since the fee paid by the Advisor to the Sub-Advisor under the Investment Sub-Advisory Agreement contained breakpoints, the Advisor could experience increased profitability as the Funds’ assets increased. The Board considered whether the Advisor would benefit in other ways from its relationships with the Funds and concluded that there were no material fall-out benefits likely to accrue to the Advisor related to the operation of the Funds.
Economies of Scale. The Board considered that Xtrackers Harvest CSI 300 China A-Shares ETF had attracted a substantial amount of assets), but determined that the Fund was not experiencing economies of scale beyond what was reflected in the Fund’s unitary fee, which the Board noted was very competitive. The Board considered that Xtrackers Harvest CSI 500 China A-Shares Small Cap ETF was not experiencing economies of scale at this time and determined to evaluate the economies of scale on an ongoing basis as a result of asset growth of the Funds. The Board also acknowledged that the concept of economies of scale is a complex subject as to determining with a fair degree of certainty whether economies of scale exist, to what extent they exist, whether scale can result in additional expenses, and alternative ways advisers can share benefits of economies of scale.
Given all the information available to it and considering all material factors, the Board concluded that the Investment Advisory Agreement was fair and reasonable and it was unanimously approved.
The Board considered the following in determining whether to approve the Investment Sub-Advisory Agreement:
Nature, Extent and Quality of Services. In considering the nature, extent and quality of services that Harvest provides to the Funds, the Board reviewed in detail the nature, extent and quality of services provided by Harvest under the Investment Sub-Advisory Agreement. In doing so, the Board considered the information it had received from the Sub-Advisor continuously during the prior year, in addition to the information the Sub-Advisor had provided in response to the Board’s requests prior to the Meeting. The Board considered that these services include, among other things, furnishing a continuous investment program for the Funds, including arranging for, or implementing, the purchase and sale of portfolio securities.
The Board also considered Harvest’s operational capabilities and resources, and its experience in serving as investment sub-advisor to the Funds. The Board considered the professional experience, qualifications and performance of Harvest’s senior management and key professional personnel, as well as Harvest’s depth and breadth of experience in managing investment portfolios consisting of China A-Shares, and their techniques for implementing such strategies while minimizing index tracking error. The Board also noted that the Chinese
65
DBX ETF Trust
Board Considerations in Approval of Investment Advisory and Sub-Advisory Contracts (Unaudited) (Continued)
authorities had abolished the quotas under the RQFII system, but that it remained in the Funds’ best interests to continue utilizing Harvest as the Funds’ sub-advisor and that Harvest’s local market capabilities provided the Funds with the widest feasible range of means to access A-shares. In addition, the Board considered Harvest’s operational capabilities and resources, and Harvest’s experience in managing index funds covering various asset classes. The Board also noted Harvest’s processes to minimize the cost of trading.
Based on its review, the Board concluded that the nature, extent, and quality of services provided by Harvest under the Investment Sub-Advisory Agreement are reasonable and appropriate in relation to the fees paid to Harvest, taking special consideration of the fact that the fees paid to Harvest are payable by the Advisor and not the Funds.
Performance of Harvest; Harvest’s Financial Resources. The Board considered Harvest’s performance in managing the Funds and its ability to minimize tracking error, taking note of the detailed information provided by the Advisor throughout the year with respect to each Fund’s tracking error and the sources thereof. The Board concluded that, given Harvest’s capabilities and experience in managing the Funds, Harvest had generally been able to keep the Funds’ tracking error within acceptable ranges.
The Board also considered Harvest’s financial condition and whether it has the resources necessary to carry out its functions. The Board concluded that Harvest has the financial resources necessary to perform its obligations under the Investment Sub-Advisory Agreement.
Reasonableness of Sub-Advisory Fee. The Board considered that the fee paid to Harvest in respect of the Funds would be paid by the Advisor and not the Funds. Based on its review, the Board concluded that the fees agreed upon with Harvest are reasonable in light of the nature and quality of investment advisory services rendered for each Fund. The Board reached its conclusion based in part on the aggregate fees paid by the Funds, the fact that the sub-advisory fee is paid by the Advisor and not the Funds, and fees paid by comparable funds to advisors.
Costs of Services and Profitability. The Board considered that the fees paid by the Advisor to Harvest under the Investment Sub-Advisory Agreement contain breakpoints. The Board further considered that specific information about Harvest’s profitability with respect to its services provided to the Funds was not available because Harvest receives a fixed fee which is computed as a percentage of each Fund’s advisory fees and does not calculate the profitability of its sub-advisory services on a per-Fund level. The Board also considered that the overall fees paid by each Fund remained reasonable.
The Board also considered whether Harvest would benefit in other ways from its relationship with the Funds. The Board discussed Harvest’s practices regarding the selection and compensation of brokers and dealers that execute portfolio transactions for the Funds and the brokers’ and dealers’ provision of brokerage services to Harvest.
Economies of Scale. The Board considered that Xtrackers Harvest CSI 300 China A-Shares ETF had attracted a substantial amount of assets, but determined that the Fund was not experiencing economies of scale beyond what was reflected in the Fund’s unitary fee, which the Board noted was very competitive. The Board considered that Xtrackers Harvest CSI 500 China A-Shares Small Cap ETF was not experiencing economies of scale at this time and determined to evaluate the economies of scale on an ongoing basis as a result of asset growth of the Funds. The Board also acknowledged that the concept of economies of scale is a complex subject as to determining with a fair degree of certainty whether economies of scale exist, to what extent they exist, whether scale can result in additional expenses, and alternative ways advisers can share benefits of economies of scale.
Given all the information available to it and considering all material factors, the Board concluded that the Investment Sub-Advisory Agreement was fair and reasonable and it was unanimously approved.
66
DBX ETF Trust
Identification and Background
The Board has responsibility for the overall management and operations of the funds, including general supervision of the duties performed by the Advisor and other service providers. Each Board Member serves until his or her successor is duly elected or appointed and qualified. Each officer serves until he or she resigns, is removed, dies, retires or becomes disqualified.
The Trust currently has three Board Members. The three Independent Board Members have no affiliation or business connection with the Advisor or any of its affiliated persons and do not own any stock or other securities issued by the Advisor.
The Independent Board Members of the Trust, their term of office and length of time served, their principal business occupations during the past five years, the number of portfolios in the fund complex (defined below) overseen by each Independent Board Member, and other directorships, if any, held by the Board Members are shown below. The fund complex includes all registered open- and closed-end funds (including all of their portfolios) advised by the Advisor and any registered funds that have an investment advisor that is an affiliated person of the Advisor. As of the date of this shareholder report, the fund complex consists of the funds in the Trust, as well as the registered funds advised by affiliates of the Advisor.
Shareholder Communications to the Board. Shareholders may send communications to the Trust’s Board by addressing the communications directly to the Board (or individual Board Members) and/or otherwise clearly indicating in the salutation that the communication is for the Board (or individual Board Members). The shareholder may send the communication to either the Trust’s office or directly to such Board members c/o 875 Third Avenue, New York, NY 10022. Other shareholder communications received by the Trust not directly addressed and sent to the Board will be reviewed and generally responded to by management. Such communications will be forwarded to the Board at management’s discretion based on the matters contained therein.
| Independent Board Members |
||||||
| Name, Year of Birth, Position with the Trust and Length of Time Served(1) |
Business Experience and Directorships During the Past 5 Years |
Number of Portfolios in Fund Complex Overseen |
Other Directorships Held by Board Member | |||
| Stephen R. Byers (1953) Chairperson since 2016, and Board Member since 2011 (formerly, Lead Independent Board Member, 2015-2016) |
Independent Director (2011- present); Independent Consultant (2014-present); Director of Investment Management, the Dreyfus Corporation (2000-2006) and Vice Chairman and Chief Investment Officer, the Dreyfus Corporation (2002-2006). | 42 | The Arbitrage Funds, Sierra Income Corporation, Mutual Fund Directors Forum | |||
| George O. Elston (1964) Board Member since 2011, Chairperson of the Audit Committee since 2015 |
Chief Financial Officer, EyePoint Pharmaceuticals, Inc. (2019-present); Chief Financial Officer, Enzyvant (2018-2019); Chief Executive Officer, 2X Oncology, Inc. (2017-2018); Senior Vice President and Chief Financial Officer, Juniper Pharmaceuticals, Inc. (2014-2016); Senior Vice President and Chief Financial Officer, KBI BioPharma Inc. (2013-2014); Managing Partner, Chatham Street Partners (2010-2013). | 42 | — | |||
| J. David Officer (1948) Board Member since 2011, Chairperson of the Nominating Committee since 2015 |
Independent Director (2010-present); Vice Chairman, the Dreyfus Corporation (2006-2009); President, The Dreyfus Family of Funds, Inc. (2006-2009). | 42 | (Chairman of) Ilex Management Ltd; Old Westbury Funds |
67
DBX ETF Trust
Board Members and Officers (Unaudited) (Continued)
| Officers(2) |
||||||
| Name, Year of Birth, Position with the Trust and Length of Time Served(3) |
Business Experience and Directorships During the Past 5 Years | |||||
| Freddi Klassen(4) (1975) President and Chief Executive Officer, 2016-present |
Chief Administrative Officer Investment Division Americas, of DWS Investment Management Americas, Inc. and Manager (since 2023) and Chief Operating Officer of the Advisor (2016-present). Formerly: Programmes (Head 2021- 2023), of DWS Investment Management Americas, Inc.; Chief Operating Officer in the Americas for the Traditional Asset Classes Department (2014-2020); Global Chief Operating Officer for Equities Technology in the Investment Bank Division at Deutsche Bank AG (2013-2014); Chief Operating Officer for Exchange Traded Funds and Systematic Funds in Europe (2008-2013). | |||||
| Diane Kenneally(4) (1966) Treasurer, Chief Financial Officer and Controller, 2019-present |
Fund Administration Treasurer’s Office (Co-Head since 2018), of DWS Investment Management Americas, Inc.; Chief Financial Officer and Treasurer for DWS US registered investment companies advised by DWS Investment Management Americas, Inc. (2018-present); Treasurer and Chief Financial Officer, The European Equity Fund, Inc., The New Germany Fund, Inc. and The Central and Eastern Europe Fund, Inc. (2018-present); formerly: Assistant Treasurer for the DWS funds (2007-2018). | |||||
| Frank Gecsedi(4) (1967) Chief Compliance Officer, 2010-present |
AFC Compliance US (Senior Team Lead), of DWS Investment Management Americas, Inc.; Compliance Department (2016-present), Vice President in the Deutsche Asset Management Compliance Department at Deutsche Bank AG (2013-2016) and Chief Compliance Officer of the Advisor (2010-present); Chief Compliance Officer of DWS Distributors, Inc. (2019-2022); Vice President in Deutsche Bank’s Global Markets Legal, Risk and Capital Division (2010-2012). | |||||
| Bryan Richards(4) (1978) Vice President, 2016-present |
Portfolio Engineering, Systematic Investments Solutions (Head), of DWS Investment Management Americas, Inc.(2018-present); Portfolio Manager in the Passive Asset Management Department at DWS (2011-present); Primary Portfolio Manager for the PowerShares DB Commodity ETFs (2011-2015). | |||||
| John Millette(5) (1962) Secretary, 2020-present |
Legal (Associate General Counsel), DWS US Retail Legal (2003-present), of DWS Investment Management Americas, Inc.; Vice President and Secretary of DWS US registered investment companies advised by DWS Investment Management Americas, Inc. (1999-present); Chief Legal Officer, DWS Investment Management Americas, Inc. (2015-present); Director and Vice President of DWS Trust Company (2016-present); Vice President, DBX Advisors LLC (2021-present); Secretary, The European Equity Fund, Inc., The New Germany Fund, Inc. and The Central and Eastern Europe Fund, Inc. (2011-present); formerly: Secretary of Deutsche Investment Management Americas Inc. (2015-2017); and Assistant Secretary of DBX ETF Trust (2019-2020). | |||||
68
DBX ETF Trust
Board Members and Officers (Unaudited) (Continued)
| Name, Year of Birth, Position with the Trust and Length of Time Served(3) |
Business Experience and Directorships During the Past 5 Years | |||||
| Caroline Pearson(5) (1962) Assistant Secretary, 2020-present |
Legal (Senior Team Lead), DWS US Retail Legal, of DWS Investment Management Americas, Inc.; Chief Legal Officer of DWS US registered investment companies advised by DWS Investment Management Americas, Inc. (2010-present); Chief Legal Officer, DBX Advisors LLC and DBX Strategic Advisors LLC (2020-present); Chief Legal Officer, The European Equity Fund, Inc., The New Germany Fund, Inc. and The Central and Eastern Europe Fund, Inc. (2012-present); formerly: Secretary, Deutsche AM Distributors, Inc. (2002-2017); Secretary, Deutsche AM Service Company (2010-2017); and Chief Legal Officer, DBXStrategic Advisors LLC (2020-2021). | |||||
| Paul Antosca(5) (1957) Assistant Treasurer, 2019-present |
Fund Administration Tax (Head), of DWS Investment Management Americas, Inc.; Assistant Treasurer for DWS US registered investment companies advised by DWS Investment Management Americas, Inc. (2007-present). | |||||
| Jeffrey Berry(5) (1959) Assistant Treasurer, 2019-present |
Fund Administration (Senior Specialist), of DWS Investment Management Americas, Inc. | |||||
| Sheila Cadogan(5) (1966) Assistant Treasurer, 2019-present |
Fund Administration Treasurer’s Office (Co-Head since 2018), of DWS Investment Management Americas, Inc.; Assistant Treasurer for DWS US registered investment companies advised by DWS Investment Management Americas, Inc. (2017-present); Director and Vice President, DWS Trust Company (2018-present); Assistant Treasurer, The European Equity Fund, Inc., The New Germany Fund, Inc. and The Central and Eastern Europe Fund, Inc. (2018-present). | |||||
| Christina A. Morse(6) (1964) Assistant Secretary, 2017-present |
Vice President at BNY Mellon Asset Servicing (2014-present); Vice President and Counsel at Lord Abbett & Co. LLC (2013-2014). | |||||
| Christian Rijs(4) (1980) Anti-Money Laundering Compliance Officer, since October 21, 2021 |
Senior Team Lead Anti-Financial Crime and Compliance, DWS Investment Management Americas, Inc.; AML Officer, DWS Trust Company (since November 2, 2021); AML Officer, DWS US registered investment companies advised by DWS Investment Management Americas, Inc. (since October 6, 2021); AML Officer, The European Equity Fund, Inc., The New Germany Fund, Inc. and The Central and Eastern Europe Fund, Inc. (since November 12, 2021); formerly: DWS UK & Ireland Head of Anti-Financial Crime and MLRO. | |||||
| (1) | The length of time served is represented by the year in which the Board Member joined the Board. |
| (2) | As a result of their respective positions held with the Advisor and its affiliates, these individuals are considered “interested persons” of the Advisor within the meaning of the 1940 Act. Interested persons receive no compensation from the Funds. |
| (3) | The length of time served is represented by the year in which the officer was first elected to the Trust in such capacity. |
| (4) | Address: 875 Third Avenue, New York, New York 10022. |
| (5) | Address: 100 Summer Street, Boston, MA 02110. |
| (6) | Address: BNY Mellon Asset Servicing, 240 Greenwich Street, New York, NY 10286. |
The Funds’ Statement of Additional Information (“SAI”) includes additional information about the Funds’ Board Members. The SAI is available by calling 855-329-3837, or on the Company’s website at www.Xtrackers.com.
69
DBX ETF Trust
Proxy Voting Policies and Procedures
The Funds’ policies and procedures for voting proxies for portfolio securities and information about how each Fund voted proxies related to its portfolio securities during the most recent 12-month period ended June 30 are available on our Web site — www.Xtrackers.com (click on “Resources” and “Proxy Voting” at the top of the page) — or on the SEC’s Web site — www.sec.gov. To obtain a written copy of the Funds’ policies and procedures without charge, upon request, call us toll free at (855) 329-3837.
Portfolio Holdings Information
The Funds are required to file their complete schedule of portfolio holdings with the SEC for their first and third fiscal quarters on Form N-PORT. Copies of the filings are available without charge, upon request on the SEC’s website at www.sec.gov and are available by calling the Trust at 855-329-3837.
Information about each Fund’s portfolio holdings is available daily at www.Xtrackers.com.
Discount & Premium Information
Information regarding how often shares of each Fund traded on NYSE Arca at a price above (i.e., at a premium) or below (i.e., at a discount) the NAV of the Fund can be found at www.Xtrackers.com.
Tax Information
Form 1099-DIV and other year-end tax information provide shareholders with actual calendar year amounts that should be included in their tax returns. Shareholders should consult their tax advisors.
Each Fund designates the following amounts or, if subsequently determined to be different, the maximum allowable for its period ended May 31, 2023.
| Qualified Dividend Income* | ||
| Xtrackers Harvest CSI 300 China A-Shares ETF |
100% | |
| Xtrackers Harvest CSI 500 China A-Shares Small Cap ETF |
100% | |
| Xtrackers MSCI All China Equity ETF |
89% | |
| Xtrackers MSCI China A Inclusion Equity ETF |
100% |
* The above percentage is based on ordinary income dividends paid to shareholders during each Fund’s fiscal year.
Each Fund intends to elect to pass through to shareholders the credit for taxes paid to foreign countries. The gross foreign source income and foreign taxes paid are as follows:
| Gross Foreign Income | Foreign Taxes Paid | |||||||
| Xtrackers Harvest CSI 300 China A-Shares ETF |
$53,675,133 | $5,333,296 | ||||||
| Xtrackers Harvest CSI 500 China A-Shares Small Cap ETF |
589,537 | 59,290 | ||||||
| Xtrackers MSCI China A Inclusion Equity ETF |
131,238 | 13,172 | ||||||
70
DBX ETF Trust
This report is intended for the shareholders of DBX ETF Trust.
This report must be preceded or accompanied by a prospectus.
Investing involves risk, including possible loss of principal. Stocks may decline in value. Foreign investing involves greater and different risks than investing in U.S. companies, including currency fluctuations, less liquidity, less developed or less efficient trading markets, lack of comprehensive company information, political instability and differing auditing and legal standards. Funds investing in a single industry, country or in a limited geographic region generally are more volatile than more diversified funds. Special risks associated with investments in Chinese companies include exposure to currency fluctuations, less liquidity, less developed or less efficient trading markets, lack of comprehensive company information, political instability and differing auditing and legal standards, the nature and extent of intervention by the Chinese government in the Chinese securities markets, and the potential unavailability of A shares. Uncertainties in the Chinese tax rules governing taxation of income and gains from investments in A-shares could result in unexpected tax liabilities for the Funds which may reduce Fund returns. Any reduction or elimination of access to A-shares will have a material adverse effect on the ability of the Funds to achieve its investment objective. Performance of the Funds may diverge from that of the Underlying Index due to operating expenses, transaction costs, cash flows, use of sampling strategies or operational inefficiencies. An investment in these Funds should be considered only as a supplement to a complete investment program for those investors willing to accept the risks associated with the Funds. Please read the prospectus for more information.
The U.S. government has imposed restrictions on the ability of U.S. investors to hold and/or acquire securities of certain Chinese companies. To the extent that an Underlying Index includes such a security and the Fund excludes it, the Fund’s tracking error may increase and the performance of the Fund and Underlying Index may diverge.
War, terrorism, sanctions, economic uncertainty, trade disputes, public health crises, natural disasters, climate change and related geopolitical events have led and, in the future, may lead to significant disruptions in U.S. and world economies and markets, which may lead to increased market volatility and may have significant adverse effects on the Funds and their investments.
Shares of the Funds are bought and sold at market price (not NAV) throughout the day on the NYSE Arca, Inc. Transactions in Fund shares may result in brokerage commissions and may generate tax consequences. There can be no assurance that an active trading market for shares of a Fund will develop or be maintained.
DBX ETF Trust Funds are distributed by ALPS Distributors, Inc. (“ALPS”). The Funds are managed by DBX Advisors LLC which is not affiliated with ALPS.
The brand DWS represents DWS Group GmbH & Co. KGaA and any of its subsidiaries such as DWS Distributors, Inc. which offers investment products or DWS Investment Management Americas, Inc. and RREEF America L.L.C. which offer advisory services.
The CSI Indexes are calculated by China Securities Index Co., Ltd. (CSI). CSI does not make any warranties, express or implied, to its customers or any other party regarding the accuracy or completeness of any data related to the Index. All information is provided for information purposes only. CSI accepts no liability for any errors or any loss arising from the use of information it provides.
The Funds or securities referred to herein are not sponsored, endorsed, issued, sold or promoted by MSCI, and MSCI bears no liability with respect to any such Funds or securities or any index on which such Funds or securities are based. The prospectus contains a more detailed description of the limited relationship MSCI has with DBX Advisors LLC and any related funds.
Copyright © 2023 DWS Group. All rights reserved. XtrackersTM is a trademark of DWS Investment GmbH. All other trademarks, servicemarks or registered trademarks are the property of their respective owners.
Not FDIC Insured | No Bank Guarantee | May Lose Value
DBX ETF Trust
| Investment advisor DBX Advisors LLC 875 Third Avenue New York, NY 10022 |
Investment sub-advisor Harvest Global Investments Limited 31/F, One Exchange Square 8 Connaught Place Central, Hong Kong |
Administrator, custodian, fund accounting agent, lending agent & transfer agent The Bank of New York Mellon 240 Greenwich Street New York, NY 10286 | ||
| Distributor ALPS Distributors, Inc. 1290 Broadway Suite 1000 Denver, CO 80203 |
Independent registered public accounting firm Ernst & Young LLP One Manhattan West New York, NY 10001 |
Legal counsel Vedder Price P.C. 1633 Broadway New York, NY 10019 | ||
R-35360-10 (7/23) DBX005556 (7/24)
May 31, 2023
Annual Report
DBX ETF Trust
Xtrackers MSCI All World ex US Hedged Equity ETF (DBAW)
Xtrackers MSCI Emerging Markets Hedged Equity ETF (DBEM)
Xtrackers MSCI Europe Hedged Equity ETF (DBEU)
Xtrackers MSCI Eurozone Hedged Equity ETF (DBEZ)
Xtrackers MSCI Germany Hedged Equity ETF (DBGR)
Xtrackers MSCI Japan Hedged Equity ETF (DBJP)

DBX ETF Trust
| Page | ||||
| 1 | ||||
| 3 | ||||
| 6 | ||||
| 8 | ||||
| 10 | ||||
| 12 | ||||
| 14 | ||||
| 16 | ||||
| 18 | ||||
| 19 | ||||
| 48 | ||||
| 69 | ||||
| 77 | ||||
| 86 | ||||
| 89 | ||||
| 94 | ||||
| 96 | ||||
| 98 | ||||
| 101 | ||||
| 104 | ||||
| 117 | ||||
| 118 | ||||
| 119 | ||||
| Board Considerations in Approval of Investment Advisory and Sub-Advisory Contracts |
120 | |||
| 123 | ||||
| 126 | ||||
To our Shareholders: (Unaudited)
Dear shareholder,
We are pleased to provide this annual report on our six currency hedged equity ETFs for the period ended May 31, 2023.
The global economy witnessed a period of volatility due to heightened inflation, growing interest rates and sluggish industrial activity amid geopolitical tension between Russia and Ukraine. Rising inflation in both developed and emerging economies affected the cost of living as disposable incomes were eroded, resulting in aggressive interest rate hikes by major central banks, except for the Bank of Japan. Global financial markets remained largely volatile with short periods of gains and losses as investors remained uncertain about interest rate actions but acted on positive economic data. Despite the challenges in the banking sectors of the U.S. and Europe during the first quarter of 2023, market sentiment turned positive on the back of China’s reopening after its COVID-19-related restrictions. However, concerns around the U.S. defaulting on its debt and negotiations to increase the debt ceiling dominated the headlines, sending jitters among investors.
U.S. GDP1 grew at a weaker rate in 2022 than in 2021, but second half of 2022 saw green shoots emerge, followed by a slowdown in the first quarter of 2023. Inflation peaked in June 2022, before cooling down in the second half of the year as energy prices softened and retreated further in the early part of 2023. However, core CPI2 remained elevated due to critical components, such as electricity and housing costs, witnessing a significant increase, consequently weighing on the U.S. Federal Reserve’s (Fed’s) decision on interest rate hikes. The labor market remained moderately resilient as the unemployment rate stayed stable during the period amid slowing wage growth.
The Eurozone’s economy started slowing from mid-2022; inflation peaked in October and continued to surpass the rate of wage growth, weighing on consumption demand. Like other central banks, the European Central Bank (ECB) resorted to interest rate hikes to combat this, which took a toll on the economy, with GDP contracting each quarter. Despite major indicators pointing toward a hard recession in 2023, a heavily energy-reliant economy witnessed a surprising first-quarter expansion as energy prices retreated and budgetary support measures helped soften the blow. One key positive for the economy was the tight labor market, with the employment rate rising despite sluggish growth and a downturn in global business activity in the last quarter of 2022.
Emerging economies were weighed down by a multitude of factors including high inflation alongside slowing growth, a hawkish Fed, a strong dollar performance, and heavyweight China facing a slowdown. The monetary tightening cycle of most developing markets that started last year seemed to be drawing to a close as focus shifted from fighting inflation to improving growth rates and boosting demand. Some countries, such as India, paused their rate hikes as manufacturing indicators turned positive and softer indicators such as business and consumer sentiment started to improve.
We believe central banks across the world will likely remain cautious in their approach to monetary policy and watch for positive signs in the economy before taking any interest rate action. Recent banking system stress and debt ceiling-related concerns are also likely to weigh on the Fed’s decisions in the coming months. Unlike the Fed, the ECB has clearly maintained its stance on monetary action and is willing to hike rates further until inflation is within its comfort range. The entire world, in our view, will be keenly watching how China recovers from its COVID-19-induced restrictions to induce an uptick in industrial activity and income recovery while boosting private sector investment.
Our team appreciates your trust and looks forward to serving your investment needs through innovative index-driven strategies
Sincerely,
/s/ Freddi Klassen
Freddi Klassen
President and Chief Executive Officer
1 Gross domestic product (GDP) is the monetary value of all finished goods and services produced within a country’s borders within a specific time period.
2 The Consumer Price Index (CPI) is a price index, the price of a weighted average market basket of consumer goods and services purchased by households. The Core Consumer Price Index excludes volatile energy and food categories.
Assumptions, estimates and opinions contained in this document constitute our judgment as of the date of the document and are subject to change without notice. Any projections are based on a number of assumptions as to market conditions and there can be no guarantee that any projected results will be achieved. Past performance is not a guarantee of future results.
1
This Page is Intentionally Left Blank
2
DBX ETF Trust
Xtrackers MSCI All World ex US Hedged Equity ETF (DBAW)
The Xtrackers MSCI All World ex US Hedged Equity ETF (DBAW) seeks investment results that correspond generally to the performance, before fees and expenses, of the MSCI ACWI ex USA US Dollar Hedged Index (the DBAW Index). The DBAW Index is designed to provide exposure to equity securities in developed and emerging stock markets (excluding the U.S.), while at the same time mitigating exposure to fluctuation between the value of the U.S. dollar and select non-U.S. currencies. For the 12-month period ended May 31, 2023, DBAW returned 4.02%, compared to the DBAW Index return of 4.55%.
The majority of the sectors contributed negatively to performance during the period with the greatest negative contribution coming from Materials, Communication Services and Energy sectors. The Industrials, Information Technology and Consumer Discretionary were the major positive contributors. From a geographical perspective, most countries contributed negatively with Hong Kong, Canada and Australia being the most significant detractors. However, France, Japan and Germany contributed positively to the performance. The Fund entered into forward foreign currency contracts during the period to hedge against changes in the value of the U.S. dollar against specified non-U.S. currencies. The currency hedging strategy contributed positively to performance.
Xtrackers MSCI Emerging Markets Hedged Equity ETF (DBEM)
The Xtrackers MSCI Emerging Markets Hedged Equity ETF (DBEM) seeks investment results that correspond generally to the performance, before fees and expenses, of the MSCI EM US Dollar Hedged Index (the DBEM Index). The DBEM Index is designed to provide exposure to equity securities in the global emerging markets, while at the same time mitigating exposure to fluctuations between the value of the US dollar and the currencies of countries included in the underlying index. For the 12-month period ended May 31, 2023, DBEM returned -5.40%, compared to the DBEM Index return of -4.52%.
All the sectors contributed negatively to performance during the period with the greatest negative contribution coming from Consumer Discretionary, Communication Services and Financials sectors. From a geographical perspective, most countries contributed negatively with Hong Kong, South Africa and South Korea being the most significant detractors. However, Mexico, India and Turkey contributed positively to the performance. The Fund entered into forward foreign currency contracts during the period to hedge against changes in the value of the U.S. dollar against specified non-U.S. currencies. The currency hedging strategy contributed positively to performance.
Xtrackers MSCI Europe Hedged Equity ETF (DBEU)
The Xtrackers MSCI Europe Hedged Equity ETF (DBEU) seeks investment results that correspond generally to the performance, before fees and expenses, of the MSCI Europe US Dollar Hedged Index (the DBEU Index). The DBEU index is designed to provide exposure to equity securities in fifteen developed European stock markets, while at the same time mitigating exposure to fluctuations between the value of the U.S. dollar and selected non-U.S. currencies. For the 12-month period ended May 31, 2023, DBEU returned 8.77%, compared to the DBEU Index return of 8.75%.
Consumer Discretionary, Industrials and Financials were the major positive contributors, while Materials, Real Estate and Communication Services sectors detracted most from the performance. From a geographical perspective Norway, Finland and Sweden contributed negatively to the performance. However, France, Germany and Denmark contributed positively to the performance. The Fund entered into forward foreign currency contracts during the period to hedge against changes in the value of the U.S. dollar against specified non-U.S. currencies. The currency hedging strategy contributed positively to performance.
Xtrackers MSCI Eurozone Hedged Equity ETF (DBEZ)
The Xtrackers MSCI Eurozone Hedged Equity ETF (DBEZ) seeks investment results that correspond generally to the performance, before fees and expenses, of the MSCI EMU IMI U.S. Dollar Hedged Index (the DBEZ Index). The DBEZ Index is designed to provide exposure to equities in countries in the European Monetary Union, or the “Eurozone” that have adopted the euro as their common currency and sole legal tender, while at the same time mitigating exposure to the fluctuations between the value of the U.S. dollar and the euro. For the 12-month period ended May 31, 2023, DBEZ returned 10.57%, compared to the DBEZ Index return of 10.75%.
3
DBX ETF Trust
Management’s Discussion of Fund Performance (Unaudited) (Continued)
Consumer Discretionary, Information Technology and Industrials were the major positive contributors, while Real Estate, Health Care and Materials sectors detracted most from the performance. From a geographical perspective, most countries contributed positively with France, Germany and Netherlands being the most significant contributors. However, Finland, Belgium and Austria contributed negatively to the performance. The Fund entered into forward foreign currency contracts during the period to hedge against changes in the value of the U.S. dollar against the euro. The currency hedging strategy contributed positively to performance.
Xtrackers MSCI Germany Hedged Equity ETF (DBGR)
The Xtrackers MSCI Germany Hedged Equity ETF (DBGR) seeks investment results that correspond generally to the performance, before fees and expenses, of the MSCI Germany US Dollar Hedged Index (the DBGR Index). The DBGR Index is designed to provide exposure to Germany’s equity market, while at the same time mitigating exposure to fluctuations between the value of the US dollar and euro. For the 12-month period ended May 31, 2023, DBGR returned 9.67%, compared to the DBGR Index return of 9.86%.
The majority of the sectors contributed positively to performance during the period with the greatest contribution coming from, Information Technology, Industrials and Financials. While the Health Care, Real Estate and Materials sectors detracted most from the performance. The Fund entered into forward foreign currency contracts during the period to hedge against changes in the value of the U.S. dollar against specified non-U.S. currencies. The currency hedging strategy contributed positively to performance.
Xtrackers MSCI Japan Hedged Equity ETF (DBJP)
The Xtrackers MSCI Japan Hedged Equity ETF (DBJP) seeks investment results that correspond generally to the performance, before fees and expenses, of the MSCI Japan US Dollar Hedged Index (the DBJP Index). The DBJP Index is designed to track the performance of the Japanese equity market, while at the same time mitigating exposure to fluctuations between the value of the U.S. dollar and Japanese yen. For the 12-month period ended May 31, 2023, DBJP returned 17.78%, compared to the DBJP Index return of 18.43%.
The majority of sectors contributed positively to performance during the period with the greatest contributions coming from Industrials, Financials, and Information Technology. The Communication Services, Real Estate and Energy sectors detracted from performance. The Fund entered into forward foreign currency contracts during the period to hedge against changes in the value of the U.S. dollar against the Japanese yen. The currency hedging strategy contributed positively to performance.
*************************
Performance data quoted represents past performance and does not guarantee future results. Investment returns and principal value of an investment will fluctuate so that an investor’s shares, when sold or redeemed, may be worth more or less than their original cost. Current performance may be lower or higher than the performance data quoted. To obtain the most recent month-end performance data visit www.Xtrackers.com. Returns assume that dividends and capital gains distributions have been reinvested. See pages 6-17 of this report for additional performance information, including performance data based on market value. The views expressed in this report reflect those of the portfolio management team only through the end of the period of the report as stated on the cover. The management team’s views are subject to change at any time based on market and other conditions and should not be construed as a recommendation. Current and future portfolio holdings are subject to risk.
4
This Page is Intentionally Left Blank
5
DBX ETF Trust
Performance Summary (Unaudited)
Xtrackers MSCI All World ex US Hedged Equity ETF (DBAW)
The Xtrackers MSCI All World ex US Hedged Equity ETF (the “Fund”), using a “passive” or indexing investment approach, seeks investment results that correspond generally to the performance, before fees and expenses, of the MSCI ACWI ex USA US Dollar Hedged Index (the “Underlying Index”). The Underlying Index is designed to track the performance of equity securities in developed and emerging stock markets (excluding the United States), while mitigating exposure to fluctuations between the value of the U.S. dollar and the currencies of the countries included in the Underlying Index. It is not possible to invest directly into an index.
| Performance as of May 31, 2023 |
| Average Annual Total Return | ||||||||
| Net Asset Value | Market Value | MSCI ACWI ex USA US Dollar Hedged Index |
MSCI ACWI ex USA Index | |||||
| One Year |
4.02% | 3.56% | 4.55% | -1.41% | ||||
| Five Year |
5.46% | 5.49% | 5.83% | 2.22% | ||||
| Since Inception1 |
5.97% | 5.92% | 6.41% | 3.04% | ||||
| Cumulative Total Returns | ||||||||
| Net Asset Value | Market Value | MSCI ACWI ex USA US Dollar Hedged Index |
MSCI ACWI ex USA Index | |||||
| One Year |
4.02% | 3.56% | 4.55% | -1.41% | ||||
| Five Year |
30.45% | 30.61% | 32.75% | 11.62% | ||||
| Since Inception1 |
72.06% | 71.30% | 78.80% | 32.35% | ||||
1 Total returns are calculated based on the commencement of operations, January 23, 2014 (“Inception”).
Past performance is no guarantee of future results. Current performance may be lower or higher than the performance data quoted. Performance data current to the most recent month-end is available at www.Xtrackers.com. Performance results assume reinvestment of all dividends and capital gain distributions and do not reflect the deduction of taxes that a shareholder would pay on fund distributions or on the sale of fund shares or redemption of fund creation units. The investment return and principal value of shares will vary with changes in market conditions. Shares may be worth more or less than their original cost when they are sold in the market or redeemed. Performance for certain funds may reflect a waiver of a portion of the unitary advisory fee. Without such waiver, performance would have been lower. The gross expense ratio of the Fund, as stated in the fee table of the prospectus dated October 1, 2022, was 0.40%, and may differ from the expense ratio disclosed in the Financial Highlights table in this report.
The Fund’s net asset value or “NAV” is calculated by dividing the value of the Fund’s total assets less total liabilities by the number of shares outstanding. The price used to calculate market return (“Market Price”) is determined by using the midpoint between the highest bid and the lowest offer on the primary stock exchange on which shares of a fund are listed for trading, as of the time that such fund’s NAV is calculated. Since shares of a fund may not have traded in the secondary market until after the fund’s inception, for the period from inception to the first day of secondary trading, the NAV of the fund is used as a proxy for the Market Price to calculate market returns. Market and NAV returns assume that dividends and capital gain distributions have been reinvested at Market Price and NAV, respectively.
An index is a statistical composite that tracks a specified financial market or sector. Unlike a fund, an index does not actually hold a portfolio of securities and therefore does not incur the expenses incurred by a fund. These expenses negatively impact fund performance. Also, market returns do not include brokerage commissions that may be payable on secondary market transactions. If brokerage commissions were included, market returns would be lower.
Generally accepted accounting principles require adjustments to be made to the net assets of the Fund at period end for financial reporting purposes only, and as such, the total return based on the unadjusted net asset value per share may differ from the total return reported in the financial highlights.
6
DBX ETF Trust
Performance Summary (Unaudited)
Xtrackers MSCI All World ex US Hedged Equity ETF (DBAW) (Continued)
| Growth of an Assumed $10,000 Investment |

1 Based on Net Asset Value from commencement of operations, January 23, 2014.
| Sector Diversification* as of May 31, 2023 |
| Financials |
20.3% | |||
| Industrials |
13.0% | |||
| Information Technology |
12.1% | |||
| Consumer Discretionary |
11.7% | |||
| Health Care |
9.9% | |||
| Consumer Staples |
8.8% | |||
| Materials |
7.9% | |||
| Communication Services |
5.6% | |||
| Energy |
5.4% | |||
| Utilities |
3.3% | |||
| Real Estate |
2.0% | |||
|
|
|
|||
| Total |
100.0% |
| Ten Largest Equity Holdings as of May 31, 2023 (11.6% of Net Assets) | ||
| Description | % of Net Assets | |||
| Taiwan Semiconductor Manufacturing Co. Ltd. (Taiwan) |
1.9% | |||
| Nestle SA (Switzerland) |
1.4% | |||
| Samsung Electronics Co. Ltd. (South Korea) |
1.2% | |||
| ASML Holding NV (Netherlands) |
1.2% | |||
| Novo Nordisk A/S (Denmark) |
1.1% | |||
| Tencent Holdings Ltd. (China) |
1.0% | |||
| LVMH Moet Hennessy Louis Vuitton SE (France) |
1.0% | |||
| Roche Holding AG (Switzerland) |
1.0% | |||
| AstraZeneca PLC (United Kingdom) |
1.0% | |||
| Novartis AG (Switzerland) |
0.8% | |||
| Country Diversification* as of May 31, 2023 | ||
| Japan |
14.5% | |||
| United Kingdom |
9.1% | |||
| France |
7.6% | |||
| China |
7.5% | |||
| Canada |
7.4% | |||
| Switzerland |
7.1% | |||
| Germany |
5.5% | |||
| Australia |
4.7% | |||
| Taiwan |
4.4% | |||
| India |
4.1% | |||
| South Korea |
3.6% | |||
| Netherlands |
3.2% | |||
| Hong Kong |
2.3% | |||
| Denmark |
2.0% | |||
| Sweden |
2.0% | |||
| Other |
15.0% | |||
|
|
|
|||
| Total |
100.0% |
* As a percent of total investments excluding securities lending collateral and cash equivalents.
Portfolio holdings and characteristics are subject to change. For more complete details about the Fund’s investment portfolio see page 19.
7
DBX ETF Trust
Performance Summary (Unaudited)
Xtrackers MSCI Emerging Markets Hedged Equity ETF (DBEM)
The Xtrackers MSCI Emerging Markets Hedged Equity ETF (the “Fund”), using a “passive” or indexing investment approach, seeks investment results that correspond generally to the performance, before fees and expenses, of the MSCI EM US Dollar Hedged Index (the “Underlying Index”). The Underlying Index is designed to track emerging market performance while mitigating exposure to fluctuations between the value of the U.S. dollar and the currencies of the countries included in the Underlying Index. It is not possible to invest directly into and index.
| Performance as of May 31, 2023 |
| Average Annual Total Return | ||||||||
| Net Asset Value | Market Value | MSCI EM US Dollar Hedged Index |
MSCI EM Index | |||||
| One Year |
-5.40% | -3.55% | -4.52% | -8.49% | ||||
| Five Year |
0.57% | 0.79% | 1.36% | -0.67% | ||||
| Ten Year |
2.21% | 2.33% | 3.41% | 1.90% | ||||
| Cumulative Total Returns | ||||||||
| Net Asset Value | Market Value | MSCI EM US Dollar Hedged Index |
MSCI EM Index | |||||
| One Year |
-5.40% | -3.55% | -4.52% | -8.49% | ||||
| Five Year |
2.86% | 4.01% | 6.99% | -3.28% | ||||
| Ten Year |
24.48% | 25.84% | 39.90% | 20.67% | ||||
Past performance is no guarantee of future results. Current performance may be lower or higher than the performance data quoted. Performance data current to the most recent month-end is available at www.Xtrackers.com. Performance results assume reinvestment of all dividends and capital gain distributions and do not reflect the deduction of taxes that a shareholder would pay on fund distributions or on the sale of fund shares or redemption of fund creation units. The investment return and principal value of shares will vary with changes in market conditions. Shares may be worth more or less than their original cost when they are sold in the market or redeemed. Performance for certain funds may reflect a waiver of a portion of the unitary advisory fee. Without such waiver, performance would have been lower. The gross expense ratio of the Fund, as stated in the fee table of the prospectus dated October 1, 2022, was 0.65%, and may differ from the expense ratio disclosed in the Financial Highlights table in this report.
The Fund’s net asset value or “NAV” is calculated by dividing the value of the Fund’s total assets less total liabilities by the number of shares outstanding. The price used to calculate market return (“Market Price”) is determined by using the midpoint between the highest bid and the lowest offer on the primary stock exchange on which shares of a fund are listed for trading, as of the time that such fund’s NAV is calculated. Since shares of a fund may not have traded in the secondary market until after the fund’s inception, for the period from inception to the first day of secondary trading, the NAV of the fund is used as a proxy for the Market Price to calculate market returns. Market and NAV returns assume that dividends and capital gain distributions have been reinvested at Market Price and NAV, respectively.
An index is a statistical composite that tracks a specified financial market or sector. Unlike a fund, an index does not actually hold a portfolio of securities and therefore does not incur the expenses incurred by a fund. These expenses negatively impact fund performance. Also, market returns do not include brokerage commissions that may be payable on secondary market transactions. If brokerage commissions were included, market returns would be lower.
Generally accepted accounting principles require adjustments to be made to the net assets of the Fund at period end for financial reporting purposes only, and as such, the total return based on the unadjusted net asset value per share may differ from the total return reported in the financial highlights.
8
DBX ETF Trust
Performance Summary (Unaudited)
Xtrackers MSCI Emerging Markets Hedged Equity ETF (DBEM) (Continued)
| Growth of an Assumed $10,000 Investment |

| Sector Diversification* as of May 31, 2023 | ||
| Financials |
22.0% | |||
| Information Technology |
21.3% | |||
| Consumer Discretionary |
13.0% | |||
| Communication Services |
9.7% | |||
| Materials |
8.3% | |||
| Consumer Staples |
6.4% | |||
| Industrials |
6.2% | |||
| Energy |
4.9% | |||
| Health Care |
3.9% | |||
| Utilities |
2.6% | |||
| Real Estate |
1.7% | |||
|
|
|
|||
| Total |
100.0% |
| Ten Largest Equity Holdings as of May 31, 2023 (23.6% of Net Assets) | ||
| Description | % of Net Assets | |||
| Taiwan Semiconductor Manufacturing Co. Ltd. (Taiwan) |
6.8% | |||
| Samsung Electronics Co. Ltd. (South Korea) |
4.5% | |||
| Tencent Holdings Ltd. (China) |
3.8% | |||
| Alibaba Group Holding Ltd. (China) |
2.5% | |||
| Reliance Industries Ltd. (India) |
1.4% | |||
| Meituan (China) |
1.1% | |||
| China Construction Bank Corp. (China) |
0.9% | |||
| ICICI Bank Ltd. (India) |
0.9% | |||
| Housing Development Finance Corp. Ltd. (India) |
0.9% | |||
| Infosys Ltd. (India) |
0.8% | |||
| Country Diversification* as of May 31, 2023 | ||
| China |
26.9% | |||
| Taiwan |
15.9% | |||
| India |
14.5% | |||
| South Korea |
12.7% | |||
| Brazil |
5.0% | |||
| Saudi Arabia |
4.2% | |||
| South Africa |
3.0% | |||
| Mexico |
2.8% | |||
| Indonesia |
2.1% | |||
| Thailand |
2.0% | |||
| Other |
10.9% | |||
|
|
|
|||
| Total |
100.0% |
* As a percent of total investments excluding securities lending collateral and cash equivalents.
Portfolio holdings and characteristics are subject to change. For more complete details about the Fund’s investment portfolio see page 48.
9
DBX ETF Trust
Performance Summary (Unaudited)
Xtrackers MSCI Europe Hedged Equity ETF (DBEU)
The X-trackers MSCI Europe Hedged Equity ETF (the “Fund”), using a “passive” or indexing investment approach, seeks investment results that correspond generally to the performance, before fees and expenses, of the MSCI Europe US Dollar Hedged Index (the “Underlying Index”). The Underlying Index is designed to track the performance of the developed markets in Europe, while mitigating exposure to fluctuations between the value of the U.S. dollar and the currencies of the countries included in the Underlying Index. It is not possible to invest directly into an index.
| Performance as of May 31, 2023 |
| Average Annual Total Return | ||||||||
| Net Asset Value | Market Value | MSCI Europe US Dollar Hedged Index |
MSCI Europe Index | |||||
| One Year |
8.77% | 9.09% | 8.75% | 4.68% | ||||
| Five Year |
7.66% | 7.68% | 7.83% | 4.07% | ||||
| Since Inception1 |
7.87% | 7.89% | 8.13% | 4.00% | ||||
| Cumulative Total Returns | ||||||||
| Net Asset Value | Market Value | MSCI Europe US Dollar Hedged Index |
MSCI Europe Index | |||||
| One Year |
8.77% | 9.09% | 8.75% | 4.68% | ||||
| Five Year |
44.62% | 44.75% | 45.78% | 22.06% | ||||
| Since Inception1 |
107.92% | 108.43% | 112.88% | 46.16% | ||||
1 Total returns are calculated based on the commencement of operations, October 1, 2013 (“Inception”).
Past performance is no guarantee of future results. Current performance may be lower or higher than the performance data quoted. Performance data current to the most recent month-end is available at www.Xtrackers.com. Performance results assume reinvestment of all dividends and capital gain distributions and do not reflect the deduction of taxes that a shareholder would pay on fund distributions or on the sale of fund shares or redemption of fund creation units. The investment return and principal value of shares will vary with changes in market conditions. Shares may be worth more or less than their original cost when they are sold in the market or redeemed. Performance for certain funds may reflect a waiver of a portion of the unitary advisory fee. Without such waiver, performance would have been lower. The gross expense ratio of the Fund, as stated in the fee table of the prospectus dated October 1, 2022, was 0.45%, and may differ from the expense ratio disclosed in the Financial Highlights table in this report.
The Fund’s net asset value or “NAV” is calculated by dividing the value of the Fund’s total assets less total liabilities by the number of shares outstanding. The price used to calculate market return (“Market Price”) is determined by using the midpoint between the highest bid and the lowest offer on the primary stock exchange on which shares of a fund are listed for trading, as of the time that such fund’s NAV is calculated. Since shares of a fund may not have traded in the secondary market until after the fund’s inception, for the period from inception to the first day of secondary trading, the NAV of the fund is used as a proxy for the Market Price to calculate market returns. Market and NAV returns assume that dividends and capital gain distributions have been reinvested at Market Price and NAV, respectively.
An index is a statistical composite that tracks a specified financial market or sector. Unlike a fund, an index does not actually hold a portfolio of securities and therefore does not incur the expenses incurred by a fund. These expenses negatively impact fund performance. Also, market returns do not include brokerage commissions that may be payable on secondary market transactions. If brokerage commissions were included, market returns would be lower.
Generally accepted accounting principles require adjustments to be made to the net assets of the Fund at period end for financial reporting purposes only, and as such, the total return based on the unadjusted net asset value per share may differ from the total return reported in the financial highlights.
10
DBX ETF Trust
Performance Summary (Unaudited)
Xtrackers MSCI Europe Hedged Equity ETF (DBEU) (Continued)
| Growth of an Assumed $10,000 Investment |
1 Based on Net Asset Value from commencement of operations, October 1, 2013.
| Sector Diversification* as of May 31, 2023 | ||
| Financials |
16.9% | |||
| Health Care |
16.1% | |||
| Industrials |
15.0% | |||
| Consumer Staples |
12.6% | |||
| Consumer Discretionary |
11.6% | |||
| Information Technology |
7.1% | |||
| Materials |
6.8% | |||
| Energy |
5.5% | |||
| Utilities |
4.4% | |||
| Communication Services |
3.3% | |||
| Real Estate |
0.7% | |||
|
|
|
|||
| Total |
100.0% |
| Ten Largest Equity Holdings as of May 31, 2023 (22.4% of Net Assets) | ||
| Nestle SA (Switzerland) |
3.2% | |||
| ASML Holding NV (Netherlands) |
2.9% | |||
| Novo Nordisk A/S (Denmark) |
2.6% | |||
| LVMH Moet Hennessy Louis Vuitton SE (France) |
2.4% | |||
| Roche Holding AG (Switzerland) |
2.3% | |||
| AstraZeneca PLC (United Kingdom) |
2.2% | |||
| Novartis AG (Switzerland) |
2.0% | |||
| Shell PLC (United Kingdom) |
1.9% | |||
| HSBC Holdings PLC (United Kingdom) |
1.5% | |||
| SAP SE (Germany) |
1.4% |
| Country Diversification* as of May 31, 2023 | ||
| United Kingdom |
21.5% | |||
| France |
18.0% | |||
| Switzerland |
16.8% | |||
| Germany |
13.0% | |||
| Netherlands |
7.4% | |||
| Denmark |
4.8% | |||
| Sweden |
4.7% | |||
| Spain |
3.9% | |||
| Italy |
3.1% | |||
| Other |
6.8% | |||
|
|
|
|||
| Total |
100.0% |
* As a percent of total investments excluding exchange-traded funds, securities lending collateral and cash equivalents.
Portfolio holdings and characteristics are subject to change. For more complete details about the Fund’s investment portfolio see page 69.
11
DBX ETF Trust
Performance Summary (Unaudited)
Xtrackers MSCI Eurozone Hedged Equity ETF (DBEZ)
The Xtrackers MSCI Eurozone Hedged Equity ETF (the “Fund”), using a “passive” or indexing investment approach, seeks investment results that correspond generally to the performance, before fees and expenses, of the MSCI EMU IMI US Dollar Hedged Index (the “Underlying Index”). The Underlying Index is designed to track the performance of equity securities based in the countries in the European Monetary Union (the “EMU”), while seeking to mitigate exposure to fluctuations between the value of the U.S. dollar and the euro. It is not possible to invest directly into an index.
| Performance as of May 31, 2023 |
| Average Annual Total Return | ||||||||
| Net Asset Value | Market Value | MSCI EMU IMI US Dollar Hedged Index |
MSCI EMU IMI Index | |||||
| One Year |
10.57% | 11.23% | 10.75% | 6.53% | ||||
| Five Year |
7.27% | 7.37% | 7.44% | 3.05% | ||||
| Since Inception1 |
8.18% | 8.29% | 8.35% | 4.47% | ||||
| Cumulative Total Returns | ||||||||
| Net Asset Value | Market Value | MSCI EMU IMI US Dollar Hedged Index |
MSCI EMU IMI Index | |||||
| One Year |
10.57% | 11.23% | 10.75% | 6.53% | ||||
| Five Year |
42.06% | 42.72% | 43.14% | 16.21% | ||||
| Since Inception1 |
94.64% | 96.42% | 97.35% | 44.83% | ||||
1 Total returns are calculated based on the commencement of operations, December 10, 2014 (“Inception”).
Past performance is no guarantee of future results. Current performance may be lower or higher than the performance data quoted. Performance data current to the most recent month-end is available at www.Xtrackers.com. Performance results assume reinvestment of all dividends and capital gain distributions and do not reflect the deduction of taxes that a shareholder would pay on fund distributions or on the sale of fund shares or redemption of fund creation units. The investment return and principal value of shares will vary with changes in market conditions. Shares may be worth more or less than their original cost when they are sold in the market or redeemed. Performance for certain funds may reflect a waiver of a portion of the unitary advisory fee. Without such waiver, performance would have been lower. The gross expense ratio of the Fund, as stated in the fee table of the prospectus dated October 1, 2022 was 0.45%, and may differ from the expense ratio disclosed in the Financial Highlights table in this report.
The Fund’s net asset value or “NAV” is calculated by dividing the value of the Fund’s total assets less total liabilities by the number of shares outstanding. The price used to calculate market return (“Market Price”) is determined by using the midpoint between the highest bid and the lowest offer on the primary stock exchange on which shares of a fund are listed for trading, as of the time that such fund’s NAV is calculated. Since shares of a fund may not have traded in the secondary market until after the fund’s inception, for the period from inception to the first day of secondary trading, the NAV of the fund is used as a proxy for the Market Price to calculate market returns. Market and NAV returns assume that dividends and capital gain distributions have been reinvested at Market Price and NAV, respectively.
An index is a statistical composite that tracks a specified financial market or sector. Unlike a fund, an index does not actually hold a portfolio of securities and therefore does not incur the expenses incurred by a fund. These expenses negatively impact fund performance. Also, market returns do not include brokerage commissions that may be payable on secondary market transactions. If brokerage commissions were included, market returns would be lower.
Generally accepted accounting principles require adjustments to be made to the net assets of the Fund at period end for financial reporting purposes only, and as such, the total return based on the unadjusted net asset value per share may differ from the total return reported in the financial highlights.
12
DBX ETF Trust
Performance Summary (Unaudited)
Xtrackers MSCI Eurozone Hedged Equity ETF (DBEZ) (Continued)
| Growth of an Assumed $10,000 Investment |

1 Based on Net Asset Value from commencement of operations, December 10, 2014.
| Sector Diversification* as of May 31, 2023 | ||
| Industrials |
16.9% | |||
| Consumer Discretionary |
16.4% | |||
| Financials |
16.3% | |||
| Information Technology |
12.3% | |||
| Health Care |
7.9% | |||
| Consumer Staples |
7.6% | |||
| Materials |
6.5% | |||
| Utilities |
6.0% | |||
| Communication Services |
4.5% | |||
| Energy |
4.3% | |||
| Real Estate |
1.3% | |||
|
|
|
|||
| Total |
100.0% |
| Ten Largest Equity Holdings as of May 31, 2023 (25.8% of Net Assets) | ||
| Description | % of Net Assets | |||
| ASML Holding NV (Netherlands) |
5.3% | |||
| LVMH Moet Hennessy Louis Vuitton SE (France) |
4.4% | |||
| SAP SE (Germany) |
2.5% | |||
| TotalEnergies SE (France) |
2.4% | |||
| Siemens AG (Germany) |
2.3% | |||
| Sanofi (France) |
2.1% | |||
| L’Oreal SA (France) |
1.9% | |||
| Schneider Electric SE (France) |
1.7% | |||
| Air Liquide SA (France) |
1.6% | |||
| Allianz SE (Germany) |
1.6% | |||
| Country Diversification* as of May 31, 2023 | ||
| France |
33.9% | |||
| Germany |
25.2% | |||
| Netherlands |
14.1% | |||
| Spain |
7.8% | |||
| Italy |
7.0% | |||
| Finland |
3.1% | |||
| Belgium |
2.8% | |||
| Ireland |
2.5% | |||
| Other |
3.6% | |||
|
|
|
|||
| Total |
100.0% |
* As a percent of total investments excluding exchange-traded funds, securities lending collateral and cash equivalents.
Portfolio holdings and characteristics are subject to change. For more complete details about the Fund’s investment portfolio see page 77.
13
DBX ETF Trust
Performance Summary (Unaudited)
Xtrackers MSCI Germany Hedged Equity ETF (DBGR)
The Xtrackers MSCI Germany Hedged Equity ETF (the “Fund”), using a “passive” or indexing investment approach, seeks investment results that correspond generally to the performance, before fees and expenses, of the MSCI Germany US Dollar Hedged Index (the “Underlying Index”). The Underlying Index is designed to track the performance of the German equity market while mitigating exposure to fluctuations between the value of the U.S. dollar and the euro. It is not possible to invest directly into an index.
| Performance as of May 31, 2023 |
| Average Annual Total Return | ||||||||
| Net Asset Value | Market Value | MSCI Germany US Dollar Hedged Index |
MSCI Germany Index | |||||
| One Year |
9.67% | 9.78% | 9.86% | 5.47% | ||||
| Five Year |
4.47% | 4.50% | 4.63% | 0.25% | ||||
| Ten Year |
6.60% | 6.66% | 6.86% | 3.10% | ||||
| Cumulative Total Returns | ||||||||
| Net Asset Value | Market Value | MSCI Germany US Dollar Hedged Index |
MSCI Germany Index | |||||
| One Year |
9.67% | 9.78% | 9.86% | 5.47% | ||||
| Five Year |
24.45% | 24.64% | 25.39% | 1.24% | ||||
| Ten Year |
89.41% | 90.63% | 94.09% | 35.65% | ||||
Prior to May 31, 2013, this Fund was known as dbx-trackers MSCI Canada Hedged Equity Fund (DBCN) and had a different investment strategy. Past performance may have been different if the Fund’s current investment strategy had been in effect.
Past performance is no guarantee of future results. Current performance may be lower or higher than the performance data quoted. Performance data current to the most recent month-end is available at www.Xtrackers.com. Performance results assume reinvestment of all dividends and capital gain distributions and do not reflect the deduction of taxes that a shareholder would pay on fund distributions or on the sale of fund shares or redemption of fund creation units. The investment return and principal value of shares will vary with changes in market conditions. Shares may be worth more or less than their original cost when they are sold in the market or redeemed. Performance for certain funds may reflect a waiver of a portion of the unitary advisory fee. Without such waiver, performance would have been lower. The gross expense ratio of the Fund, as stated in the fee table of the prospectus dated October 1, 2022 was 0.45%, and may differ from the expense ratio disclosed in the Financial Highlights table in this report.
The Fund’s net asset value or “NAV” is calculated by dividing the value of the Fund’s total assets less total liabilities by the number of shares outstanding. The price used to calculate market return (“Market Price”) is determined by using the midpoint between the highest bid and the lowest offer on the primary stock exchange on which shares of a fund are listed for trading, as of the time that such fund’s NAV is calculated. Since shares of a fund may not have traded in the secondary market until after the fund’s inception, for the period from inception to the first day of secondary trading, the NAV of the fund is used as a proxy for the Market Price to calculate market returns. Market and NAV returns assume that dividends and capital gain distributions have been reinvested at Market Price and NAV, respectively.
An index is a statistical composite that tracks a specified financial market or sector. Unlike a fund, an index does not actually hold a portfolio of securities and therefore does not incur the expenses incurred by a fund. These expenses negatively impact fund performance. Also, market returns do not include brokerage commissions that may be payable on secondary market transactions. If brokerage commissions were included, market returns would be lower.
Generally accepted accounting principles require adjustments to be made to the net assets of the Fund at period end for financial reporting purposes only, and as such, the total return based on the unadjusted net asset value per share may differ from the total return reported in the financial highlights.
14
DBX ETF Trust
Performance Summary (Unaudited)
Xtrackers MSCI Germany Hedged Equity ETF (DBGR) (Continued)
| Growth of an Assumed $10,000 Investment |

| Sector Diversification* as of May 31, 2023 | ||
| Industrials |
19.9% | |||
| Financials |
16.9% | |||
| Consumer Discretionary |
16.4% | |||
| Information Technology |
15.1% | |||
| Health Care |
10.7% | |||
| Materials |
6.3% | |||
| Communication Services |
6.2% | |||
| Utilities |
4.2% | |||
| Consumer Staples |
3.0% | |||
| Real Estate |
1.3% | |||
|
|
|
|||
| Total |
100.0% |
| Ten Largest Equity Holdings as of May 31, 2023 (54.1% of Net Assets) | ||
| Description | % of Net Assets | |||
| SAP SE |
10.2% | |||
| Siemens AG |
9.3% | |||
| Allianz SE |
6.4% | |||
| Deutsche Telekom AG |
5.4% | |||
| Mercedes-Benz Group AG |
4.8% | |||
| Bayer AG |
4.1% | |||
| Muenchener Rueckversicherungs-Gesellschaft AG in Muenchen |
3.7% | |||
| Infineon Technologies AG |
3.6% | |||
| Deutsche Post AG |
3.4% | |||
| BASF SE |
3.2% | |||
* As a percent of total investments excluding exchange-traded fund and cash equivalents.
Portfolio holdings and characteristics are subject to change. For more complete details about the Fund’s investment portfolio see page 86.
15
DBX ETF Trust
Performance Summary (Unaudited)
Xtrackers MSCI Japan Hedged Equity ETF (DBJP)
The Xtrackers MSCI Japan Hedged Equity ETF (the “Fund”), using a “passive” or indexing investment approach, seeks investment results that correspond generally to the performance, before fees and expenses, of the MSCI Japan US Dollar Hedged Index (the “Underlying Index”). The Underlying Index is designed to track the performance of the Japanese equity market while mitigating exposure to fluctuations between the value of the U.S. dollar and Japanese yen. It is not possible to invest directly into an index.
| Performance as of May 31, 2023 |
| Average Annual Total Return | ||||||||
| Net Asset Value | Market Value | MSCI Japan US Dollar Hedged Index |
MSCI Japan Index | |||||
| One Year |
17.78% | 17.45% | 18.43% | 4.53% | ||||
| Five Year |
8.48% | 8.51% | 8.99% | 1.78% | ||||
| Ten Year |
8.88% | 9.03% | 9.48% | 4.99% | ||||
| Cumulative Total Returns | ||||||||
| Net Asset Value | Market Value | MSCI Japan US Dollar Hedged Index |
MSCI Japan Index | |||||
| One Year |
17.78% | 17.45% | 18.43% | 4.53% | ||||
| Five Year |
50.21% | 50.46% | 53.78% | 9.24% | ||||
| Ten Year |
134.09% | 137.48% | 147.46% | 62.70% | ||||
Past performance is no guarantee of future results. Current performance may be lower or higher than the performance data quoted. Performance data current to the most recent month-end is available at www.Xtrackers.com. Performance results assume reinvestment of all dividends and capital gain distributions and do not reflect the deduction of taxes that a shareholder would pay on fund distributions or on the sale of fund shares or redemption of fund creation units. The investment return and principal value of shares will vary with changes in market conditions. Shares may be worth more or less than their original cost when they are sold in the market or redeemed. Performance for certain funds may reflect a waiver of a portion of the unitary advisory fee. Without such waiver, performance would have been lower. The gross expense ratio of the Fund, as stated in the fee table of the prospectus dated October 1, 2022 was 0.45%, and may differ from the expense ratio disclosed in the Financial Highlights table in this report.
The Fund’s net asset value or “NAV” is calculated by dividing the value of the Fund’s total assets less total liabilities by the number of shares outstanding. The price used to calculate market return (“Market Price”) is determined by using the midpoint between the highest bid and the lowest offer on the primary stock exchange on which shares of a fund are listed for trading, as of the time that such fund’s NAV is calculated. Since shares of a fund may not have traded in the secondary market until after the fund’s inception, for the period from inception to the first day of secondary trading, the NAV of the fund is used as a proxy for the Market Price to calculate market returns. Market and NAV returns assume that dividends and capital gain distributions have been reinvested at Market Price and NAV, respectively.
An index is a statistical composite that tracks a specified financial market or sector. Unlike a fund, an index does not actually hold a portfolio of securities and therefore does not incur the expenses incurred by a fund. These expenses negatively impact fund performance. Also, market returns do not include brokerage commissions that may be payable on secondary market transactions. If brokerage commissions were included, market returns would be lower.
Generally accepted accounting principles require adjustments to be made to the net assets of the Fund at period end for financial reporting purposes only, and as such, the total return based on the unadjusted net asset value per share may differ from the total return reported in the financial highlights.
16
DBX ETF Trust
Performance Summary (Unaudited)
Xtrackers MSCI Japan Hedged Equity ETF (DBJP) (Continued)
| Growth of an Assumed $10,000 Investment |
| Sector Diversification* as of May 31, 2023 | ||
| Industrials |
22.8% | |||
| Consumer Discretionary |
18.3% | |||
| Information Technology |
14.9% | |||
| Financials |
11.2% | |||
| Health Care |
9.6% | |||
| Communication Services |
7.3% | |||
| Consumer Staples |
6.6% | |||
| Materials |
4.6% | |||
| Real Estate |
3.0% | |||
| Utilities |
1.0% | |||
| Energy |
0.7% | |||
|
|
|
|||
| Total |
100.0% |
| Ten Largest Equity Holdings as of May 31, 2023 (22.6% of Net Assets) | ||
| Description | % of Net Assets | |||
| Toyota Motor Corp. |
4.2% | |||
| Sony Group Corp. |
3.5% | |||
| Keyence Corp. |
2.8% | |||
| Mitsubishi UFJ Financial Group, Inc. |
2.2% | |||
| Tokyo Electron Ltd. |
1.8% | |||
| Daiichi Sankyo Co. Ltd. |
1.8% | |||
| Shin-Etsu Chemical Co. Ltd. |
1.6% | |||
| Hitachi Ltd. |
1.6% | |||
| Sumitomo Mitsui Financial Group, Inc. |
1.6% | |||
| Takeda Pharmaceutical Co. Ltd. |
1.5% | |||
* As a percent of total investments excluding exchange-traded fund, securities lending collateral and cash equivalents.
Portfolio holdings and characteristics are subject to change. For more complete details about the Fund’s investment portfolio see page 89.
17
DBX ETF Trust
As a shareholder of one or more of the Funds, you incur two types of costs: (1) transaction costs, including brokerage commissions paid on purchases and sales of fund shares, and (2) ongoing costs, including unitary advisory fees and other Fund expenses. In the most recent six-month period the Funds limited these expenses; had they not done so, expenses would have been higher. The expense examples below are intended to help you understand your ongoing costs (in dollars) of investing in the Funds and to compare these costs with the ongoing costs of investing in other funds.
The examples in the tables are based on an investment of $1,000 invested at the beginning of the six-month period and held for the entire period (December 1, 2022 to May 31, 2023).
Actual expenses
The first line in the following tables provides information about actual account values and actual expenses. You may use the information in this line, together with the amount you invested, to estimate the expenses that you paid over the period. Simply divide your account value by $1,000 (for example, an $8,600 account value divided by $1,000 = 8.6), then multiply the result by the number in the first line under the heading “Expenses Paid During the Period” to estimate the expenses you paid on your account during this period.
Hypothetical example for comparison purposes
The second line in the following tables provides information about hypothetical account values and hypothetical expenses based on the Funds’ actual expense ratios and an assumed rate of return of 5% per year before expenses (which is not the Funds’ actual return). The hypothetical account values and expenses may not be used to estimate the actual ending account balance or expenses you paid for the period. You may use this information to compare the ongoing costs of investing in the Fund and other funds. To do so, compare this 5% hypothetical example with the 5% hypothetical examples that appear in the shareholder reports of the other funds.
Please note that the expenses shown in the tables are meant to highlight your ongoing costs only, and do not reflect any transactional costs. Therefore the second line in the table is useful in comparing ongoing costs only, and will not help you determine the relative total costs of owning different funds. In addition, if these transactional costs were included, your costs would have been higher.
| Beginning Account Value December 1, 2022 |
Ending Account Value May 31, 2023 |
Annualized Expense Ratio |
Expenses Paid During the Period Per $1,000(1) |
|||||||||||||
| Xtrackers MSCI All World ex US Hedged Equity ETF |
| |||||||||||||||
| Actual |
$ | 1,000.00 | $ | 1,037.40 | 0.40 | % | $ | 2.03 | ||||||||
| Hypothetical (5% return before expenses) |
$ | 1,000.00 | $ | 1,022.94 | 0.40 | % | $ | 2.02 | ||||||||
| Xtrackers MSCI Emerging Markets Hedged Equity ETF |
| |||||||||||||||
| Actual |
$ | 1,000.00 | $ | 996.30 | 0.65 | % | $ | 3.24 | ||||||||
| Hypothetical (5% return before expenses) |
$ | 1,000.00 | $ | 1,021.69 | 0.65 | % | $ | 3.28 | ||||||||
| Xtrackers MSCI Europe Hedged Equity ETF |
| |||||||||||||||
| Actual |
$ | 1,000.00 | $ | 1,062.40 | 0.45 | % | $ | 2.31 | ||||||||
| Hypothetical (5% return before expenses) |
$ | 1,000.00 | $ | 1,022.69 | 0.45 | % | $ | 2.27 | ||||||||
| Xtrackers MSCI Eurozone Hedged Equity ETF |
| |||||||||||||||
| Actual |
$ | 1,000.00 | $ | 1,081.90 | 0.45 | % | $ | 2.34 | ||||||||
| Hypothetical (5% return before expenses) |
$ | 1,000.00 | $ | 1,022.69 | 0.45 | % | $ | 2.27 | ||||||||
| Xtrackers MSCI Germany Hedged Equity ETF |
| |||||||||||||||
| Actual |
$ | 1,000.00 | $ | 1,096.40 | 0.45 | % | $ | 2.35 | ||||||||
| Hypothetical (5% return before expenses) |
$ | 1,000.00 | $ | 1,022.69 | 0.45 | % | $ | 2.27 | ||||||||
| Xtrackers MSCI Japan Hedged Equity ETF |
| |||||||||||||||
| Actual |
$ | 1,000.00 | $ | 1,110.30 | 0.45 | % | $ | 2.37 | ||||||||
| Hypothetical (5% return before expenses) |
$ | 1,000.00 | $ | 1,022.69 | 0.45 | % | $ | 2.27 | ||||||||
(1) Expenses are equal to each Fund’s annualized expense ratio, multiplied by the average account value over the period, multiplied by 182 (the number of days in the most recent six-month period), then divided by 365.
18
DBX ETF Trust
Schedule of Investments
Xtrackers MSCI All World ex US Hedged Equity ETF
May 31, 2023
| Number |
Value |
|||||||
| COMMON STOCKS — 96.2% | ||||||||
| Australia — 4.5% | ||||||||
| Ampol Ltd. |
1,132 | $ | 23,127 | |||||
| ANZ Group Holdings Ltd. |
16,865 | 251,429 | ||||||
| APA Group (a) |
6,471 | 42,259 | ||||||
| Aristocrat Leisure Ltd. |
3,274 | 79,114 | ||||||
| ASX Ltd. |
1,129 | 49,518 | ||||||
| Aurizon Holdings Ltd. |
11,688 | 27,065 | ||||||
| BHP Group Ltd. |
28,092 | 767,808 | ||||||
| BlueScope Steel Ltd. |
2,379 | 28,658 | ||||||
| Brambles Ltd. |
8,381 | 74,903 | ||||||
| Cochlear Ltd. |
351 | 55,572 | ||||||
| Coles Group Ltd. |
7,156 | 83,690 | ||||||
| Commonwealth Bank of Australia |
9,445 | 594,568 | ||||||
| Computershare Ltd. |
3,152 | 45,843 | ||||||
| CSL Ltd. |
2,679 | 533,902 | ||||||
| Dexus REIT |
5,645 | 30,145 | ||||||
| EBOS Group Ltd. (b) |
1,218 | 30,870 | ||||||
| Endeavour Group Ltd. |
7,738 | 31,055 | ||||||
| Fortescue Metals Group Ltd. |
9,269 | 115,878 | ||||||
| Goodman Group REIT |
9,023 | 115,209 | ||||||
| GPT Group REIT |
11,034 | 30,072 | ||||||
| IDP Education Ltd. (b) |
1,240 | 17,599 | ||||||
| IGO Ltd. |
3,512 | 32,575 | ||||||
| Insurance Australia Group Ltd. |
14,724 | 49,706 | ||||||
| Lendlease Corp. Ltd. (a) |
3,916 | 20,123 | ||||||
| Lottery Corp. Ltd. |
13,414 | 43,451 | ||||||
| Macquarie Group Ltd. |
1,997 | 221,783 | ||||||
| Medibank Pvt Ltd. |
15,582 | 36,183 | ||||||
| Mineral Resources Ltd. |
964 | 44,388 | ||||||
| Mirvac Group REIT |
21,179 | 31,684 | ||||||
| National Australia Bank Ltd. |
17,754 | 299,904 | ||||||
| Newcrest Mining Ltd. |
4,541 | 75,880 | ||||||
| Northern Star Resources Ltd. |
6,974 | 58,563 | ||||||
| Orica Ltd. |
2,566 | 25,520 | ||||||
| Origin Energy Ltd. |
9,026 | 48,905 | ||||||
| Pilbara Minerals Ltd. (b) |
15,747 | 45,170 | ||||||
| Qantas Airways Ltd.* |
5,390 | 23,314 | ||||||
| QBE Insurance Group Ltd. |
8,114 | 77,161 | ||||||
| Ramsay Health Care Ltd. |
1,077 | 40,190 | ||||||
| REA Group Ltd. (b) |
255 | 22,811 | ||||||
| Reece Ltd. |
1,026 | 12,119 | ||||||
| Rio Tinto Ltd. |
2,028 | 141,145 | ||||||
| Santos Ltd. |
19,320 | 91,611 | ||||||
| Scentre Group REIT |
28,919 | 50,976 | ||||||
| SEEK Ltd. |
1,941 | 29,707 | ||||||
| Sonic Healthcare Ltd. |
2,394 | 54,797 | ||||||
| South32 Ltd. |
24,670 | 62,261 | ||||||
| Stockland REIT |
15,971 | 44,254 | ||||||
| Suncorp Group Ltd. |
7,434 | 64,311 | ||||||
| Telstra Group Ltd. |
22,052 | 62,539 | ||||||
| Transurban Group (a) |
16,692 | 161,123 | ||||||
| Treasury Wine Estates Ltd. |
5,231 | 39,537 | ||||||
| Vicinity Ltd. REIT |
18,069 | 21,802 | ||||||
| Washington H Soul Pattinson & Co. Ltd. |
1,181 | 24,674 | ||||||
| Wesfarmers Ltd. |
6,245 | 193,638 | ||||||
| Westpac Banking Corp. |
19,886 | 267,493 | ||||||
| WiseTech Global Ltd. |
959 | 46,678 | ||||||
| Number |
Value |
|||||||
| Australia (Continued) | ||||||||
| Woodside Energy Group Ltd. |
10,352 | $ | 230,958 | |||||
| Woolworths Group Ltd. |
6,618 | 161,598 | ||||||
|
|
|
|||||||
| (Cost $6,053,773) |
5,986,816 | |||||||
|
|
|
|||||||
| Austria — 0.1% | ||||||||
| Erste Group Bank AG |
1,931 | 62,478 | ||||||
| OMV AG |
806 | 35,909 | ||||||
| Verbund AG |
394 | 29,712 | ||||||
| voestalpine AG |
742 | 22,985 | ||||||
|
|
|
|||||||
| (Cost $163,919) |
151,084 | |||||||
|
|
|
|||||||
| Belgium — 0.5% | ||||||||
| Ageas SA/NV (b) |
827 | 32,999 | ||||||
| Anheuser-Busch InBev SA/NV |
4,772 | 254,581 | ||||||
| D’ieteren Group |
108 | 18,667 | ||||||
| Elia Group SA/NV |
191 | 23,090 | ||||||
| Groupe Bruxelles Lambert NV |
626 | 48,231 | ||||||
| KBC Group NV |
1,346 | 88,022 | ||||||
| Sofina SA |
93 | 19,186 | ||||||
| Solvay SA (b) |
445 | 46,453 | ||||||
| UCB SA |
684 | 59,602 | ||||||
| Umicore SA (b) |
1,218 | 33,850 | ||||||
| Warehouses De Pauw CVA REIT |
1,045 | 29,310 | ||||||
|
|
|
|||||||
| (Cost $837,552) |
653,991 | |||||||
|
|
|
|||||||
| Brazil — 1.0% | ||||||||
| Ambev SA |
26,300 | 74,701 | ||||||
| Atacadao SA |
2,964 | 5,533 | ||||||
| B3 SA — Brasil Bolsa Balcao |
34,459 | 90,472 | ||||||
| Banco Bradesco SA |
9,678 | 25,314 | ||||||
| Banco BTG Pactual S.A |
6,891 | 35,723 | ||||||
| Banco do Brasil SA |
5,000 | 43,975 | ||||||
| Banco Santander Brasil SA |
2,049 | 11,551 | ||||||
| BB Seguridade Participacoes SA |
3,235 | 19,723 | ||||||
| CCR SA |
8,872 | 23,731 | ||||||
| Centrais Eletricas Brasileiras SA |
6,261 | 43,564 | ||||||
| Cia de Saneamento Basico do Estado de Sao Paulo |
2,817 | 29,179 | ||||||
| Cia Siderurgica Nacional SA |
3,957 | 9,477 | ||||||
| Cosan SA |
5,210 | 15,404 | ||||||
| CPFL Energia SA |
1,773 | 10,582 | ||||||
| Energisa SA |
279 | 2,422 | ||||||
| Eneva SA* |
3,626 | 8,184 | ||||||
| Engie Brasil Energia SA |
1,304 | 10,803 | ||||||
| Equatorial Energia SA |
5,875 | 32,598 | ||||||
| Equatorial Energia SA* |
82 | 455 | ||||||
| Hapvida Participacoes e Investimentos SA, 144A* |
33,394 | 26,263 | ||||||
| Hypera SA |
3,014 | 24,251 | ||||||
| JBS SA |
5,104 | 16,902 | ||||||
| Klabin SA |
3,942 | 16,302 | ||||||
| Localiza Rent a Car SA |
1,544 | 18,881 | ||||||
| Localiza Rent a Car SA* |
18 | 218 | ||||||
| Lojas Renner SA |
6,078 | 23,302 | ||||||
| Magazine Luiza SA* |
19,206 | 14,386 | ||||||
| Natura & Co. Holding SA* |
6,002 | 16,433 | ||||||
| Petroleo Brasileiro SA |
20,338 | 117,098 | ||||||
| PRIO SA* |
3,690 | 24,868 | ||||||
| See Notes to Financial Statements. | 19 |
DBX ETF Trust
Schedule of Investments
Xtrackers MSCI All World ex US Hedged Equity ETF (Continued)
May 31, 2023
| Number |
Value |
|||||||
| Brazil (Continued) | ||||||||
| Raia Drogasil SA |
7,106 | $ | 39,681 | |||||
| Rede D’Or Sao Luiz SA, 144A |
2,233 | 12,764 | ||||||
| Rumo SA |
7,169 | 29,420 | ||||||
| Sendas Distribuidora SA |
6,762 | 14,328 | ||||||
| Suzano SA |
4,434 | 39,137 | ||||||
| Telefonica Brasil SA |
2,515 | 19,829 | ||||||
| TIM SA |
4,993 | 13,739 | ||||||
| TOTVS SA |
1,901 | 10,777 | ||||||
| Ultrapar Participacoes SA |
3,444 | 11,493 | ||||||
| Vale SA |
18,774 | 236,132 | ||||||
| Vibra Energia SA |
7,838 | 24,858 | ||||||
| WEG SA |
9,143 | 67,780 | ||||||
|
|
|
|||||||
| (Cost $1,201,809) |
1,312,233 | |||||||
|
|
|
|||||||
| Canada — 7.2% | ||||||||
| Agnico Eagle Mines Ltd. |
2,722 | 138,516 | ||||||
| Air Canada* |
1,018 | 16,071 | ||||||
| Algonquin Power & Utilities Corp. |
4,257 | 35,875 | ||||||
| Alimentation Couche-Tard, Inc. |
4,502 | 217,986 | ||||||
| AltaGas Ltd. |
1,555 | 26,369 | ||||||
| ARC Resources Ltd. |
3,455 | 41,638 | ||||||
| Bank of Montreal |
3,994 | 333,113 | ||||||
| Bank of Nova Scotia |
6,623 | 319,904 | ||||||
| Barrick Gold Corp. |
2,794 | 48,189 | ||||||
| Barrick Gold Corp. |
6,885 | 116,348 | ||||||
| BCE, Inc. |
455 | 20,526 | ||||||
| Brookfield Asset Management Ltd., Class A |
1,924 | 58,818 | ||||||
| Brookfield Corp. |
7,995 | 240,115 | ||||||
| BRP, Inc. |
178 | 12,655 | ||||||
| CAE, Inc.* |
1,806 | 36,932 | ||||||
| Cameco Corp. |
2,292 | 63,805 | ||||||
| Canadian Apartment Properties REIT (b) |
436 | 15,754 | ||||||
| Canadian Imperial Bank of Commerce |
5,159 | 212,707 | ||||||
| Canadian National Railway Co. |
3,203 | 361,143 | ||||||
| Canadian Natural Resources Ltd. |
6,134 | 330,445 | ||||||
| Canadian Pacific Kansas City Ltd. |
5,183 | 394,939 | ||||||
| Canadian Tire Corp. Ltd., Class A |
348 | 41,801 | ||||||
| Canadian Utilities Ltd., Class A |
795 | 21,346 | ||||||
| CCL Industries, Inc., Class B |
906 | 42,213 | ||||||
| Cenovus Energy, Inc. (b) |
8,131 | 129,916 | ||||||
| CGI, Inc.* |
1,124 | 116,416 | ||||||
| Constellation Software, Inc. |
116 | 236,530 | ||||||
| Descartes Systems Group, Inc.* |
534 | 41,288 | ||||||
| Dollarama, Inc. |
1,642 | 99,887 | ||||||
| Element Fleet Management Corp. |
2,329 | 35,325 | ||||||
| Emera, Inc. |
1,595 | 65,762 | ||||||
| Empire Co. Ltd., Class A |
1,021 | 26,038 | ||||||
| Enbridge, Inc. |
11,156 | 392,740 | ||||||
| Fairfax Financial Holdings Ltd. |
122 | 87,569 | ||||||
| First Quantum Minerals Ltd. |
3,134 | 65,658 | ||||||
| FirstService Corp. |
251 | 36,462 | ||||||
| Fortis, Inc. |
2,576 | 108,353 | ||||||
| Franco-Nevada Corp. |
1,056 | 153,464 | ||||||
| George Weston Ltd. |
338 | 39,758 | ||||||
| GFL Environmental, Inc. |
1,080 | 38,983 | ||||||
| Gildan Activewear, Inc. |
880 | 23,998 | ||||||
| Number |
Value |
|||||||
| Canada (Continued) | ||||||||
| Great-West Lifeco, Inc. (b) |
1,338 | $ | 37,878 | |||||
| Hydro One Ltd., 144A |
1,597 | 45,516 | ||||||
| iA Financial Corp., Inc. |
638 | 40,663 | ||||||
| IGM Financial, Inc. |
297 | 8,725 | ||||||
| Imperial Oil Ltd. |
1,130 | 51,293 | ||||||
| Intact Financial Corp. |
951 | 140,153 | ||||||
| Ivanhoe Mines Ltd., Class A* |
3,638 | 26,638 | ||||||
| Keyera Corp. |
1,294 | 28,883 | ||||||
| Kinross Gold Corp. |
7,362 | 34,709 | ||||||
| Loblaw Cos. Ltd. |
895 | 78,252 | ||||||
| Lundin Mining Corp. |
3,958 | 27,670 | ||||||
| Magna International, Inc. |
1,445 | 69,914 | ||||||
| Manulife Financial Corp. |
10,018 | 185,601 | ||||||
| Metro, Inc. |
1,280 | 67,333 | ||||||
| National Bank of Canada |
1,875 | 134,420 | ||||||
| Northland Power, Inc. |
1,498 | 32,862 | ||||||
| Nutrien Ltd. |
2,940 | 154,894 | ||||||
| Nuvei Corp., 144A* |
390 | 12,236 | ||||||
| Onex Corp. |
462 | 20,920 | ||||||
| Open Text Corp. |
1,605 | 66,730 | ||||||
| Pan American Silver Corp. |
2,077 | 31,656 | ||||||
| Parkland Corp. |
871 | 21,725 | ||||||
| Pembina Pipeline Corp. |
2,878 | 87,135 | ||||||
| Power Corp. of Canada |
2,891 | 74,836 | ||||||
| Quebecor, Inc., Class B |
1,005 | 23,965 | ||||||
| RB Global, Inc. |
1,009 | 52,706 | ||||||
| Restaurant Brands International, Inc. |
1,700 | 123,427 | ||||||
| RioCan Real Estate Investment Trust REIT |
676 | 9,969 | ||||||
| Rogers Communications, Inc., Class B |
1,850 | 81,564 | ||||||
| Royal Bank of Canada |
7,759 | 694,052 | ||||||
| Saputo, Inc. |
1,462 | 37,824 | ||||||
| Shopify, Inc., Class A* |
6,661 | 381,112 | ||||||
| Sun Life Financial, Inc. (b) |
3,296 | 159,641 | ||||||
| Suncor Energy, Inc. |
7,387 | 206,945 | ||||||
| TC Energy Corp. |
5,517 | 214,746 | ||||||
| Teck Resources Ltd., Class B |
2,569 | 100,281 | ||||||
| TELUS Corp. |
2,690 | 50,966 | ||||||
| TFI International, Inc. |
479 | 50,458 | ||||||
| Thomson Reuters Corp. |
892 | 113,427 | ||||||
| TMX Group Ltd. |
337 | 36,681 | ||||||
| Toromont Industries Ltd. |
515 | 39,834 | ||||||
| Toronto-Dominion Bank |
10,058 | 569,324 | ||||||
| Tourmaline Oil Corp. |
1,717 | 71,779 | ||||||
| West Fraser Timber Co. Ltd. |
266 | 17,951 | ||||||
| Wheaton Precious Metals Corp. |
2,428 | 110,034 | ||||||
| WSP Global, Inc. |
755 | 93,564 | ||||||
|
|
|
|||||||
| (Cost $8,305,041) |
9,566,247 | |||||||
|
|
|
|||||||
| Cayman Islands — 0.0% | ||||||||
| Parade Technologies Ltd. |
418 | 13,875 | ||||||
|
|
|
|||||||
| Chile — 0.1% | ||||||||
| Antofagasta PLC |
2,156 | 35,871 | ||||||
| Banco de Chile |
258,773 | 26,165 | ||||||
| Banco de Credito e Inversiones SA |
222 | 6,526 | ||||||
| Banco Santander Chile |
361,173 | 15,695 | ||||||
| See Notes to Financial Statements. | 20 |
DBX ETF Trust
Schedule of Investments
Xtrackers MSCI All World ex US Hedged Equity ETF (Continued)
May 31, 2023
| Number |
Value |
|||||||
| Chile (Continued) | ||||||||
| Cencosud SA |
8,433 | $ | 15,929 | |||||
| Cia Cervecerias Unidas SA |
667 | 4,899 | ||||||
| Cia Sud Americana de Vapores SA |
36,842 | 2,709 | ||||||
| Empresas CMPC SA |
7,496 | 12,817 | ||||||
| Empresas Copec SA |
2,226 | 16,077 | ||||||
| Enel Americas SA* |
107,638 | 13,879 | ||||||
| Enel Chile SA |
123,794 | 6,801 | ||||||
| Falabella SA |
4,372 | 9,634 | ||||||
|
|
|
|||||||
| (Cost $202,279) |
167,002 | |||||||
|
|
|
|||||||
| China — 7.3% | ||||||||
| 360 Security Technology, Inc., Class A |
3,700 | 7,252 | ||||||
| 37 Interactive Entertainment Network Technology Group Co. Ltd., Class A |
1,900 | 8,713 | ||||||
| 3SBio, Inc., 144A |
9,586 | 9,696 | ||||||
| AAC Technologies Holdings, Inc. (b) |
3,567 | 7,316 | ||||||
| Advanced Micro-Fabrication Equipment Inc China, Class A* |
350 | 8,524 | ||||||
| AECC Aviation Power Co. Ltd., Class A |
1,000 | 5,585 | ||||||
| Agricultural Bank of China Ltd., Class A |
28,900 | 14,293 | ||||||
| Agricultural Bank of China Ltd., Class H |
157,970 | 59,513 | ||||||
| Aier Eye Hospital Group Co. Ltd., Class A |
3,124 | 11,763 | ||||||
| Air China Ltd., Class A* |
6,900 | 8,454 | ||||||
| Air China Ltd., Class H* (b) |
9,926 | 7,542 | ||||||
| Akeso, Inc., 144A* (b) |
3,369 | 15,015 | ||||||
| Alibaba Group Holding Ltd.* |
91,333 | 908,612 | ||||||
| Aluminum Corp. of China Ltd., Class A |
7,300 | 5,549 | ||||||
| Aluminum Corp. of China Ltd., Class H |
18,664 | 8,247 | ||||||
| Anhui Conch Cement Co. Ltd., Class A |
1,200 | 4,225 | ||||||
| Anhui Conch Cement Co. Ltd., Class H |
6,575 | 17,465 | ||||||
| Anhui Gujing Distillery Co. Ltd., Class A |
100 | 3,540 | ||||||
| Anhui Gujing Distillery Co. Ltd., Class B |
526 | 8,619 | ||||||
| ANTA Sports Products Ltd. |
6,442 | 65,774 | ||||||
| Asymchem Laboratories Tianjin Co. Ltd., Class A |
280 | 5,185 | ||||||
| Autohome, Inc., ADR |
380 | 10,876 | ||||||
| AviChina Industry & Technology Co. Ltd., Class H |
21,908 | 10,604 | ||||||
| Baidu, Inc., Class A* |
12,684 | 193,408 | ||||||
| Bank of Beijing Co. Ltd., Class A |
11,100 | 7,377 | ||||||
| Bank of China Ltd., Class A |
16,800 | 9,206 | ||||||
| Bank of China Ltd., Class H |
432,156 | 169,431 | ||||||
| Bank of Communications Co. Ltd., Class A |
11,800 | 9,699 | ||||||
| Bank of Communications Co. Ltd., Class H |
49,744 | 32,081 | ||||||
| Bank of Hangzhou Co. Ltd., Class A |
3,700 | 6,036 | ||||||
| Bank of Jiangsu Co. Ltd., Class A* |
11,600 | 12,093 | ||||||
| Bank of Nanjing Co. Ltd., Class A |
7,900 | 9,368 | ||||||
| Bank of Ningbo Co. Ltd., Class A |
2,210 | 7,639 | ||||||
| Bank of Shanghai Co. Ltd., Class A |
5,590 | 4,846 | ||||||
| Baoshan Iron & Steel Co. Ltd., Class A |
10,200 | 8,427 | ||||||
| Beijing Capital International Airport Co. Ltd., Class H* |
6,501 | 4,533 | ||||||
| Beijing Kingsoft Office Software, Inc., Class A* |
256 | 15,539 | ||||||
| Beijing Tongrentang Co. Ltd., Class A |
100 | 851 | ||||||
| Number |
Value |
|||||||
| China (Continued) | ||||||||
| Beijing Wantai Biological Pharmacy Enterprise Co. Ltd., Class A* |
145 | $ | 1,895 | |||||
| Beijing-Shanghai High Speed Railway Co. Ltd., Class A |
10,800 | 8,756 | ||||||
| Betta Pharmaceuticals Co. Ltd., Class A* |
400 | 3,168 | ||||||
| BGI Genomics Co. Ltd., Class A |
500 | 4,137 | ||||||
| Bilibili, Inc., Class Z* (b) |
1,128 | 18,367 | ||||||
| BOE Technology Group Co. Ltd., Class A* |
15,500 | 8,646 | ||||||
| BYD Co. Ltd., Class A |
700 | 24,948 | ||||||
| BYD Co. Ltd., Class H |
5,554 | 167,674 | ||||||
| BYD Electronic International Co. Ltd. |
2,894 | 8,426 | ||||||
| CGN Power Co. Ltd., Class H, 144A |
82,381 | 19,779 | ||||||
| Changchun High & New Technology Industry Group, Inc., Class A |
200 | 4,479 | ||||||
| Chaozhou Three-Circle Group Co. Ltd., Class A |
1,100 | 4,660 | ||||||
| China Cinda Asset Management Co. Ltd., Class H |
54,699 | 6,077 | ||||||
| China CITIC Bank Corp. Ltd., Class H |
52,339 | 27,538 | ||||||
| China Coal Energy Co. Ltd., Class H |
5,298 | 4,005 | ||||||
| China Communications Services Corp. Ltd., Class H |
14,234 | 6,762 | ||||||
| China Conch Venture Holdings Ltd. |
10,486 | 13,177 | ||||||
| China Construction Bank Corp., Class A |
4,300 | 3,867 | ||||||
| China Construction Bank Corp., Class H |
537,832 | 344,110 | ||||||
| China CSSC Holdings Ltd., Class A |
2,400 | 9,718 | ||||||
| China Energy Engineering Corp. Ltd., Class A |
17,700 | 5,969 | ||||||
| China Everbright Bank Co. Ltd., Class A |
14,000 | 6,196 | ||||||
| China Everbright Bank Co. Ltd., Class H* |
13,497 | 4,154 | ||||||
| China Evergrande Group* (c) |
8,123 | 0 | ||||||
| China Feihe Ltd., 144A |
21,663 | 12,588 | ||||||
| China Galaxy Securities Co. Ltd., Class A |
1,470 | 2,346 | ||||||
| China Galaxy Securities Co. Ltd., Class H |
26,284 | 14,165 | ||||||
| China Hongqiao Group Ltd. |
14,641 | 10,396 | ||||||
| China International Capital Corp. Ltd., Class H, 144A |
8,796 | 16,086 | ||||||
| China Jushi Co. Ltd., Class A |
4,400 | 8,426 | ||||||
| China Lesso Group Holdings Ltd. |
5,474 | 3,614 | ||||||
| China Life Insurance Co. Ltd., Class A |
700 | 3,672 | ||||||
| China Life Insurance Co. Ltd., Class H |
41,086 | 69,365 | ||||||
| China Literature Ltd., 144A* (b) |
2,048 | 7,742 | ||||||
| China Longyuan Power Group Corp. Ltd., Class H |
21,208 | 23,780 | ||||||
| China Meidong Auto Holdings Ltd. |
2,636 | 3,393 | ||||||
| China Merchants Bank Co. Ltd., Class A |
7,600 | 34,491 | ||||||
| China Merchants Bank Co. Ltd., Class H |
21,031 | 97,763 | ||||||
| China Merchants Energy Shipping Co. Ltd., Class A |
6,700 | 5,375 | ||||||
| China Merchants Securities Co. Ltd., Class A |
4,200 | 8,208 | ||||||
| China Merchants Shekou Industrial Zone Holdings Co. Ltd., Class A |
2,300 | 4,098 | ||||||
| China Minsheng Banking Corp. Ltd., Class A |
13,500 | 7,511 | ||||||
| China Minsheng Banking Corp. Ltd., Class H |
28,896 | 11,440 | ||||||
| See Notes to Financial Statements. | 21 |
DBX ETF Trust
Schedule of Investments
Xtrackers MSCI All World ex US Hedged Equity ETF (Continued)
May 31, 2023
| Number |
Value |
|||||||
| China (Continued) | ||||||||
| China National Building Material Co. Ltd., Class H |
15,893 | $ | 8,991 | |||||
| China National Nuclear Power Co. Ltd., Class A |
11,200 | 11,078 | ||||||
| China Northern Rare Earth Group High-Tech Co. Ltd., Class A |
1,300 | 4,358 | ||||||
| China Oilfield Services Ltd., Class H |
10,996 | 11,206 | ||||||
| China Pacific Insurance Group Co. Ltd., Class A |
2,100 | 8,217 | ||||||
| China Pacific Insurance Group Co. Ltd., Class H |
13,944 | 35,259 | ||||||
| China Petroleum & Chemical Corp., Class A |
9,200 | 8,221 | ||||||
| China Petroleum & Chemical Corp., Class H |
135,133 | 85,079 | ||||||
| China Railway Group Ltd., Class A |
13,900 | 15,409 | ||||||
| China Railway Group Ltd., Class H |
18,491 | 12,185 | ||||||
| China Resources Microelectronics Ltd., Class A |
622 | 5,198 | ||||||
| China Resources Mixc Lifestyle Services Ltd., 144A |
3,535 | 16,094 | ||||||
| China Resources Pharmaceutical Group Ltd., 144A |
5,360 | 5,141 | ||||||
| China Shenhua Energy Co. Ltd., Class A |
2,690 | 10,670 | ||||||
| China Shenhua Energy Co. Ltd., Class H |
18,207 | 57,548 | ||||||
| China Southern Airlines Co. Ltd., Class A* |
10,000 | 8,810 | ||||||
| China Southern Airlines Co. Ltd., Class H* |
7,607 | 4,381 | ||||||
| China State Construction Engineering Corp. Ltd., Class A |
13,900 | 11,523 | ||||||
| China Three Gorges Renewables Group Co. Ltd., Class A |
12,800 | 9,766 | ||||||
| China Tourism Group Duty Free Corp. Ltd., Class A |
800 | 13,837 | ||||||
| China Tourism Group Duty Free Corp. Ltd., Class H, 144A* |
620 | 9,866 | ||||||
| China Tower Corp. Ltd., Class H, 144A |
293,078 | 32,188 | ||||||
| China United Network Communications Ltd., Class A |
10,000 | 6,913 | ||||||
| China Vanke Co. Ltd., Class A |
3,300 | 6,603 | ||||||
| China Vanke Co. Ltd., Class H |
11,678 | 15,421 | ||||||
| China Yangtze Power Co. Ltd., Class A |
8,900 | 28,148 | ||||||
| China Zhenhua Group Science & Technology Co. Ltd., Class A |
600 | 7,773 | ||||||
| Chinasoft International Ltd.* (b) |
14,445 | 8,615 | ||||||
| Chongqing Brewery Co. Ltd., Class A |
200 | 2,507 | ||||||
| Chongqing Changan Automobile Co. Ltd., Class A |
3,640 | 6,112 | ||||||
| Chongqing Rural Commercial Bank Co. Ltd., Class A |
7,100 | 3,940 | ||||||
| Chongqing Zhifei Biological Products Co. Ltd., Class A |
800 | 7,901 | ||||||
| CITIC Ltd. |
29,803 | 34,407 | ||||||
| CITIC Securities Co. Ltd., Class A |
8,430 | 23,748 | ||||||
| CITIC Securities Co. Ltd., Class H |
14,270 | 26,279 | ||||||
| CMOC Group Ltd., Class A |
13,200 | 9,718 | ||||||
| Number |
Value |
|||||||
| China (Continued) | ||||||||
| CMOC Group Ltd., Class H |
15,252 | $ | 7,966 | |||||
| Contemporary Amperex Technology Co. Ltd., Class A |
1,578 | 49,037 | ||||||
| COSCO SHIPPING Energy Transportation Co. Ltd., Class A* |
2,600 | 4,088 | ||||||
| COSCO SHIPPING Holdings Co. Ltd., Class A |
6,330 | 9,285 | ||||||
| COSCO SHIPPING Holdings Co. Ltd., Class H |
18,876 | 16,633 | ||||||
| Country Garden Holdings Co. Ltd. (b) |
60,195 | 11,070 | ||||||
| Country Garden Services Holdings Co. Ltd. |
11,992 | 13,952 | ||||||
| CRRC Corp. Ltd., Class A |
24,300 | 24,036 | ||||||
| CRRC Corp. Ltd., Class H |
3,776 | 2,339 | ||||||
| CSC Financial Co. Ltd., Class A |
1,960 | 6,992 | ||||||
| CSPC Pharmaceutical Group Ltd. |
52,024 | 45,311 | ||||||
| Dali Foods Group Co. Ltd., 144A |
15,749 | 5,249 | ||||||
| Daqin Railway Co. Ltd., Class A |
7,700 | 8,266 | ||||||
| Daqo New Energy Corp., ADR* (b) |
388 | 13,949 | ||||||
| DaShenLin Pharmaceutical Group Co. Ltd., Class A |
840 | 3,842 | ||||||
| Dongfang Electric Corp. Ltd., Class A |
100 | 253 | ||||||
| Dongfeng Motor Group Co. Ltd., Class H |
23,713 | 10,266 | ||||||
| Dongyue Group Ltd. |
9,332 | 8,164 | ||||||
| East Buy Holding Ltd., 144A* (b) |
2,750 | 10,202 | ||||||
| East Money Information Co. Ltd., Class A |
5,134 | 10,113 | ||||||
| Ecovacs Robotics Co. Ltd., Class A |
200 | 1,946 | ||||||
| ENN Energy Holdings Ltd. |
4,157 | 48,310 | ||||||
| Eve Energy Co. Ltd., Class A |
900 | 8,093 | ||||||
| Everbright Securities Co. Ltd., Class A |
1,800 | 4,006 | ||||||
| Flat Glass Group Co. Ltd., Class H |
2,614 | 7,344 | ||||||
| Focus Media Information Technology Co. Ltd., Class A |
3,200 | 2,886 | ||||||
| Foshan Haitian Flavouring & Food Co. Ltd., Class A* |
1,517 | 12,899 | ||||||
| Fosun International Ltd. |
21,044 | 13,867 | ||||||
| Foxconn Industrial Internet Co. Ltd., Class A |
4,600 | 11,666 | ||||||
| Fuyao Glass Industry Group Co. Ltd., Class A |
1,100 | 5,014 | ||||||
| Fuyao Glass Industry Group Co. Ltd., Class H, 144A |
3,423 | 12,458 | ||||||
| Ganfeng Lithium Group Co. Ltd., Class A |
700 | 6,098 | ||||||
| Ganfeng Lithium Group Co. Ltd., Class H, 144A (b) |
2,119 | 13,409 | ||||||
| GD Power Development Co. Ltd., Class A* |
12,900 | 7,395 | ||||||
| GDS Holdings Ltd., Class A* |
4,320 | 5,329 | ||||||
| Gemdale Corp., Class A |
1,700 | 1,732 | ||||||
| Genscript Biotech Corp.* |
6,892 | 15,244 | ||||||
| GF Securities Co. Ltd., Class A |
2,000 | 4,187 | ||||||
| GF Securities Co. Ltd., Class H |
6,132 | 8,520 | ||||||
| GigaDevice Semiconductor, Inc., Class A |
168 | 2,615 | ||||||
| Ginlong Technologies Co. Ltd., Class A* |
300 | 4,207 | ||||||
| GoerTek, Inc., Class A |
1,500 | 3,874 | ||||||
| Gotion High-tech Co. Ltd., Class A |
1,500 | 5,608 | ||||||
| Great Wall Motor Co. Ltd., Class A* |
1,200 | 3,809 | ||||||
| See Notes to Financial Statements. | 22 |
DBX ETF Trust
Schedule of Investments
Xtrackers MSCI All World ex US Hedged Equity ETF (Continued)
May 31, 2023
| Number |
Value |
|||||||
| China (Continued) | ||||||||
| Great Wall Motor Co. Ltd., Class H* (b) |
17,402 | $ | 17,868 | |||||
| Gree Electric Appliances, Inc. of Zhuhai, Class A |
1,000 | 4,634 | ||||||
| Greentown China Holdings Ltd. |
4,920 | 4,618 | ||||||
| Greentown Service Group Co. Ltd. (b) |
8,393 | 4,534 | ||||||
| Guangdong Haid Group Co. Ltd., Class A |
400 | 2,599 | ||||||
| Guanghui Energy Co. Ltd., Class A |
2,500 | 2,550 | ||||||
| Guangzhou Automobile Group Co. Ltd., Class A |
3,800 | 5,441 | ||||||
| Guangzhou Automobile Group Co. Ltd., Class H |
17,222 | 9,875 | ||||||
| Guangzhou Tinci Materials Technology Co. Ltd., Class A |
800 | 4,596 | ||||||
| Guosen Securities Co. Ltd., Class A |
5,900 | 7,635 | ||||||
| Guotai Junan Securities Co. Ltd., Class A |
3,100 | 6,446 | ||||||
| H World Group Ltd., ADR* |
988 | 36,181 | ||||||
| Haidilao International Holding Ltd., 144A* (b) |
11,144 | 23,454 | ||||||
| Haier Smart Home Co. Ltd., Class A |
2,100 | 6,338 | ||||||
| Haier Smart Home Co. Ltd., Class H |
12,032 | 34,496 | ||||||
| Haitian International Holdings Ltd. |
4,489 | 10,193 | ||||||
| Haitong Securities Co. Ltd., Class A |
5,000 | 6,611 | ||||||
| Haitong Securities Co. Ltd., Class H |
14,205 | 9,433 | ||||||
| Hangzhou First Applied Material Co. Ltd., Class A |
784 | 3,375 | ||||||
| Hangzhou Silan Microelectronics Co. Ltd., Class A |
800 | 3,591 | ||||||
| Hangzhou Tigermed Consulting Co. Ltd., Class H, 144A (b) |
788 | 5,907 | ||||||
| Hansoh Pharmaceutical Group Co. Ltd., 144A |
7,293 | 12,070 | ||||||
| Henan Shuanghui Investment & Development Co. Ltd., Class A |
1,100 | 3,799 | ||||||
| Hengan International Group Co. Ltd. |
3,819 | 16,241 | ||||||
| Hengli Petrochemical Co. Ltd., Class A |
1,800 | 3,993 | ||||||
| Hithink RoyalFlush Information Network Co. Ltd., Class A |
400 | 9,039 | ||||||
| Hoshine Silicon Industry Co. Ltd., Class A |
500 | 4,732 | ||||||
| Hoyuan Green Energy Co. Ltd., Class A |
400 | 4,340 | ||||||
| Hua Hong Semiconductor Ltd., 144A* |
2,689 | 8,705 | ||||||
| Huadian Power International Corp. Ltd., Class A |
8,000 | 8,014 | ||||||
| Huadong Medicine Co. Ltd., Class A |
700 | 3,830 | ||||||
| Hualan Biological Engineering, Inc., Class A |
670 | 2,121 | ||||||
| Huaneng Power International, Inc., Class A* |
3,500 | 5,006 | ||||||
| Huaneng Power International, Inc., Class H* |
17,022 | 10,934 | ||||||
| Huatai Securities Co. Ltd., Class A |
1,700 | 3,232 | ||||||
| Huatai Securities Co. Ltd., Class H, 144A |
9,693 | 12,119 | ||||||
| Huaxia Bank Co. Ltd., Class A |
9,400 | 7,634 | ||||||
| Huayu Automotive Systems Co. Ltd., Class A |
1,700 | 4,170 | ||||||
| Huizhou Desay Sv Automotive Co. Ltd., Class A |
300 | 4,783 | ||||||
| Number |
Value |
|||||||
| China (Continued) | ||||||||
| Hundsun Technologies, Inc., Class A |
1,456 | $ | 8,690 | |||||
| Hygeia Healthcare Holdings Co. Ltd., 144A* |
2,124 | 12,491 | ||||||
| Iflytek Co. Ltd., Class A |
900 | 7,556 | ||||||
| Imeik Technology Development Co. Ltd., Class A |
100 | 6,331 | ||||||
| Industrial & Commercial Bank of China Ltd., Class A |
33,000 | 22,395 | ||||||
| Industrial & Commercial Bank of China Ltd., Class H |
300,742 | 160,924 | ||||||
| Industrial Bank Co. Ltd., Class A |
8,800 | 20,475 | ||||||
| Industrial Securities Co. Ltd., Class A |
1,950 | 1,677 | ||||||
| Ingenic Semiconductor Co. Ltd., Class A |
300 | 3,980 | ||||||
| Inner Mongolia BaoTou Steel Union Co. Ltd., Class A |
32,600 | 8,382 | ||||||
| Inner Mongolia Junzheng Energy & Chemical Industry Group Co. Ltd., Class A |
2,600 | 1,604 | ||||||
| Inner Mongolia Yili Industrial Group Co. Ltd., Class A |
2,100 | 8,501 | ||||||
| Inner Mongolia Yitai Coal Co. Ltd., Class B |
10,900 | 14,061 | ||||||
| Innovent Biologics, Inc., 144A* |
5,347 | 25,060 | ||||||
| iQIYI, Inc., ADR* |
3,404 | 13,820 | ||||||
| JA Solar Technology Co. Ltd., Class A |
1,764 | 8,923 | ||||||
| JD Health International, Inc., 144A* |
5,531 | 34,081 | ||||||
| JD Logistics, Inc., 144A* |
13,732 | 21,956 | ||||||
| JD.com, Inc., Class A |
12,988 | 208,824 | ||||||
| Jiangsu Eastern Shenghong Co. Ltd., Class A |
2,200 | 3,598 | ||||||
| Jiangsu Expressway Co. Ltd., Class H |
8,873 | 8,578 | ||||||
| Jiangsu Hengli Hydraulic Co. Ltd., Class A |
600 | 4,600 | ||||||
| Jiangsu Hengrui Pharmaceuticals Co. Ltd., Class A |
2,600 | 16,640 | ||||||
| Jiangsu Yanghe Brewery Joint-Stock Co. Ltd., Class A |
700 | 13,203 | ||||||
| Jiangsu Zhongtian Technology Co. Ltd., Class A |
1,300 | 2,656 | ||||||
| Jiangxi Copper Co. Ltd., Class A |
2,700 | 7,018 | ||||||
| Jiangxi Copper Co. Ltd., Class H |
3,974 | 5,978 | ||||||
| Jinko Solar Co. Ltd. |
4,383 | 7,839 | ||||||
| Jiumaojiu International Holdings Ltd., 144A |
8,278 | 14,166 | ||||||
| Kanzhun Ltd., ADR* |
1,212 | 16,810 | ||||||
| KE Holdings, Inc., ADR* |
3,589 | 51,107 | ||||||
| Kingdee International Software Group Co. Ltd.* |
15,602 | 20,722 | ||||||
| Kingsoft Corp. Ltd.* (b) |
5,845 | 21,236 | ||||||
| Kuaishou Technology, 144A* |
13,213 | 89,431 | ||||||
| Kweichow Moutai Co. Ltd., Class A |
400 | 91,547 | ||||||
| Lenovo Group Ltd. |
33,923 | 31,885 | ||||||
| Lens Technology Co. Ltd., Class A |
2,610 | 4,265 | ||||||
| Lepu Medical Technology Beijing Co. Ltd., Class A |
1,200 | 4,165 | ||||||
| Li Auto, Inc., Class A* |
6,095 | 88,034 | ||||||
| Li Ning Co. Ltd. |
12,557 | 67,352 | ||||||
| See Notes to Financial Statements. | 23 |
DBX ETF Trust
Schedule of Investments
Xtrackers MSCI All World ex US Hedged Equity ETF (Continued)
May 31, 2023
| Number |
Value |
|||||||
| China (Continued) | ||||||||
| Lingyi iTech Guangdong Co., Class A* |
3,100 | $ | 2,744 | |||||
| Longfor Group Holdings Ltd., 144A |
10,936 | 21,033 | ||||||
| LONGi Green Energy Technology Co. Ltd., Class A |
3,340 | 13,525 | ||||||
| Lufax Holding Ltd., ADR |
5,225 | 6,688 | ||||||
| Luxshare Precision Industry Co. Ltd., Class A |
3,349 | 12,846 | ||||||
| Luzhou Laojiao Co. Ltd., Class A |
600 | 17,200 | ||||||
| Mango Excellent Media Co. Ltd., Class A |
1,200 | 4,933 | ||||||
| Maxscend Microelectronics Co. Ltd., Class A |
160 | 1,993 | ||||||
| Meituan, Class B, 144A* |
28,367 | 399,216 | ||||||
| Metallurgical Corp. of China Ltd., Class A |
5,900 | 3,341 | ||||||
| Microport Scientific Corp.* (b) |
3,646 | 6,277 | ||||||
| Ming Yang Smart Energy Group Ltd., Class A |
2,300 | 5,678 | ||||||
| MINISO Group Holding Ltd., ADR |
644 | 9,789 | ||||||
| Minth Group Ltd. |
4,579 | 11,450 | ||||||
| Montage Technology Co. Ltd., Class A |
617 | 5,531 | ||||||
| Muyuan Foods Co. Ltd., Class A |
2,134 | 12,008 | ||||||
| NARI Technology Co. Ltd., Class A |
3,076 | 11,859 | ||||||
| NAURA Technology Group Co. Ltd., Class A |
200 | 8,527 | ||||||
| NetEase, Inc. |
10,740 | 181,870 | ||||||
| New China Life Insurance Co. Ltd., Class A |
1,300 | 6,720 | ||||||
| New China Life Insurance Co. Ltd., Class H |
4,257 | 11,009 | ||||||
| New Hope Liuhe Co. Ltd., Class A* |
1,400 | 2,217 | ||||||
| New Oriental Education & Technology Group, Inc.* |
8,270 | 31,578 | ||||||
| Ninestar Corp., Class A |
548 | 3,011 | ||||||
| Ningbo Deye Technology Co. Ltd., Class A |
180 | 3,425 | ||||||
| Ningbo Tuopu Group Co. Ltd., Class A |
500 | 4,084 | ||||||
| Ningxia Baofeng Energy Group Co. Ltd., Class A |
4,466 | 7,624 | ||||||
| NIO, Inc., ADR* (b) |
7,790 | 58,659 | ||||||
| Nongfu Spring Co. Ltd., Class H, 144A (b) |
10,821 | 58,040 | ||||||
| Oppein Home Group, Inc., Class A |
500 | 6,663 | ||||||
| Orient Securities Co. Ltd., Class A |
2,048 | 2,846 | ||||||
| People’s Insurance Co. Group of China Ltd., Class A |
5,600 | 4,815 | ||||||
| People’s Insurance Co. Group of China Ltd., Class H |
44,346 | 16,763 | ||||||
| PetroChina Co. Ltd., Class A |
7,700 | 8,114 | ||||||
| PetroChina Co. Ltd., Class H |
109,802 | 70,954 | ||||||
| Pharmaron Beijing Co. Ltd., Class A |
600 | 3,886 | ||||||
| Pharmaron Beijing Co. Ltd., Class H, 144A |
1,081 | 3,990 | ||||||
| PICC Property & Casualty Co. Ltd., Class H |
37,106 | 44,212 | ||||||
| Ping An Bank Co. Ltd., Class A |
6,600 | 10,757 | ||||||
| Ping An Healthcare and Technology Co. Ltd., 144A* (b) |
2,085 | 4,809 | ||||||
| Ping An Insurance Group Co. of China Ltd., Class A |
4,400 | 29,056 | ||||||
| Number |
Value |
|||||||
| China (Continued) | ||||||||
| Ping An Insurance Group Co. of China Ltd., Class H |
34,742 | $ | 220,508 | |||||
| Poly Developments and Holdings Group Co. Ltd., Class A |
3,900 | 6,981 | ||||||
| Pop Mart International Group Ltd., 144A |
3,770 | 8,281 | ||||||
| Postal Savings Bank of China Co. Ltd., Class A |
14,000 | 10,111 | ||||||
| Postal Savings Bank of China Co. Ltd., Class H, 144A |
44,006 | 27,650 | ||||||
| Power Construction Corp. of China Ltd., Class A |
5,900 | 5,496 | ||||||
| Qifu Technology, Inc., ADR |
515 | 7,081 | ||||||
| Qinghai Salt Lake Industry Co. Ltd., Class A* |
2,900 | 7,656 | ||||||
| Rongsheng Petrochemical Co. Ltd., Class A |
2,550 | 4,156 | ||||||
| SAIC Motor Corp. Ltd., Class A |
2,400 | 4,525 | ||||||
| Sangfor Technologies, Inc., Class A |
400 | 7,003 | ||||||
| Sany Heavy Equipment International Holdings Co. Ltd. |
6,832 | 9,022 | ||||||
| Sany Heavy Industry Co. Ltd., Class A |
2,800 | 5,775 | ||||||
| Satellite Chemical Co. Ltd., Class A |
2,937 | 5,228 | ||||||
| SDIC Power Holdings Co. Ltd., Class A |
2,500 | 4,633 | ||||||
| Seazen Holdings Co. Ltd., Class A* |
2,500 | 4,911 | ||||||
| SF Holding Co. Ltd., Class A |
1,860 | 12,369 | ||||||
| SG Micro Corp., Class A |
150 | 2,285 | ||||||
| Shaanxi Coal Industry Co. Ltd., Class A |
4,700 | 11,068 | ||||||
| Shandong Gold Mining Co. Ltd., Class A |
2,200 | 7,805 | ||||||
| Shandong Gold Mining Co. Ltd., Class H, 144A |
4,780 | 9,108 | ||||||
| Shandong Hualu Hengsheng Chemical Co. Ltd., Class A |
900 | 3,689 | ||||||
| Shandong Weigao Group Medical Polymer Co. Ltd., Class H |
13,432 | 19,864 | ||||||
| Shanghai Baosight Software Co. Ltd., Class A |
910 | 6,780 | ||||||
| Shanghai Baosight Software Co. Ltd., Class B |
3,380 | 11,238 | ||||||
| Shanghai Fosun Pharmaceutical Group Co. Ltd., Class A |
1,100 | 4,819 | ||||||
| Shanghai Fosun Pharmaceutical Group Co. Ltd., Class H |
3,018 | 8,209 | ||||||
| Shanghai Fudan Microelectronics Group Co. Ltd., Class H (b) |
2,852 | 7,667 | ||||||
| Shanghai Junshi Biosciences Co. Ltd., Class A* |
270 | 1,726 | ||||||
| Shanghai Lujiazui Finance & Trade Zone Development Co. Ltd., Class B |
3,931 | 2,347 | ||||||
| Shanghai M&G Stationery, Inc., Class A |
800 | 4,779 | ||||||
| Shanghai Pharmaceuticals Holding Co. Ltd., Class A |
1,300 | 4,283 | ||||||
| Shanghai Pharmaceuticals Holding Co. Ltd., Class H |
5,214 | 10,387 | ||||||
| Shanghai Pudong Development Bank Co. Ltd., Class A |
9,300 | 9,604 | ||||||
| Shanghai Putailai New Energy Technology Co. Ltd., Class A |
1,160 | 5,789 | ||||||
| See Notes to Financial Statements. | 24 |
DBX ETF Trust
Schedule of Investments
Xtrackers MSCI All World ex US Hedged Equity ETF (Continued)
May 31, 2023
| Number |
Value |
|||||||
| China (Continued) | ||||||||
| Shanghai Rural Commercial Bank Co. Ltd., Class A |
7,000 | $ | 5,803 | |||||
| Shanxi Coking Coal Energy Group Co. Ltd., Class A |
1,600 | 2,214 | ||||||
| Shanxi Meijin Energy Co. Ltd., Class A |
3,100 | 3,123 | ||||||
| Shanxi Xinghuacun Fen Wine Factory Co. Ltd., Class A |
420 | 12,382 | ||||||
| Shenwan Hongyuan Group Co. Ltd., Class A |
11,900 | 7,892 | ||||||
| Shenzhen Dynanonic Co. Ltd., Class A |
320 | 4,944 | ||||||
| Shenzhen Inovance Technology Co. Ltd., Class A |
1,050 | 8,717 | ||||||
| Shenzhen Kangtai Biological Products Co. Ltd., Class A |
896 | 3,499 | ||||||
| Shenzhen Mindray Bio-Medical Electronics Co. Ltd., Class A |
445 | 18,793 | ||||||
| Shenzhen SC New Energy Technology Corp., Class A |
300 | 4,031 | ||||||
| Shenzhen Transsion Holdings Co. Ltd., Class A |
633 | 11,184 | ||||||
| Shenzhou International Group Holdings Ltd. |
4,510 | 36,516 | ||||||
| Sichuan Chuantou Energy Co. Ltd., Class A |
1,900 | 3,978 | ||||||
| Sichuan Road & Bridge Group Co. Ltd., Class A |
2,800 | 5,980 | ||||||
| Sichuan Yahua Industrial Group Co. Ltd., Class A |
1,000 | 2,526 | ||||||
| Silergy Corp. |
1,844 | 24,035 | ||||||
| Sinopharm Group Co. Ltd., Class H |
8,105 | 26,549 | ||||||
| Smoore International Holdings Ltd., 144A |
10,110 | 10,174 | ||||||
| StarPower Semiconductor Ltd., Class A |
100 | 3,065 | ||||||
| Sunac China Holdings Ltd.* |
14,174 | 2,154 | ||||||
| Sungrow Power Supply Co. Ltd., Class A |
500 | 7,738 | ||||||
| Sunny Optical Technology Group Co. Ltd. |
3,609 | 33,922 | ||||||
| Suzhou Maxwell Technologies Co. Ltd., Class A |
160 | 3,552 | ||||||
| TAL Education Group, ADR* |
2,073 | 11,256 | ||||||
| TBEA Co. Ltd., Class A |
1,500 | 4,715 | ||||||
| TCL Technology Group Corp., Class A |
1,280 | 694 | ||||||
| TCL Zhonghuan Renewable Energy Technology Co. Ltd., Class A |
1,100 | 5,742 | ||||||
| Tencent Holdings Ltd. |
34,592 | 1,372,115 | ||||||
| Tencent Music Entertainment Group, ADR* |
3,659 | 25,393 | ||||||
| Tianma Microelectronics Co. Ltd., Class A* |
1,000 | 1,359 | ||||||
| Tianqi Lithium Corp., Class A* |
800 | 8,086 | ||||||
| Tingyi Cayman Islands Holding Corp. |
13,235 | 19,843 | ||||||
| Tongcheng Travel Holdings Ltd.* |
5,989 | 11,947 | ||||||
| Tongwei Co. Ltd., Class A |
1,700 | 8,150 | ||||||
| Topsports International Holdings Ltd., 144A |
16,911 | 13,131 | ||||||
| TravelSky Technology Ltd., Class H |
4,346 | 7,926 | ||||||
| Trina Solar Co. Ltd., Class A |
1,184 | 6,538 | ||||||
| Trip.com Group Ltd.* |
3,149 | 101,020 | ||||||
| Number |
Value |
|||||||
| China (Continued) | ||||||||
| Tsingtao Brewery Co. Ltd., Class A |
200 | $ | 2,675 | |||||
| Tsingtao Brewery Co. Ltd., Class H |
2,870 | 24,703 | ||||||
| Unigroup Guoxin Microelectronics Co. Ltd., Class A |
475 | 6,150 | ||||||
| Uni-President China Holdings Ltd.* |
10,252 | 8,903 | ||||||
| Unisplendour Corp. Ltd., Class A |
1,880 | 8,616 | ||||||
| Vipshop Holdings Ltd., ADR* |
2,612 | 37,404 | ||||||
| Walvax Biotechnology Co. Ltd., Class A |
900 | 3,653 | ||||||
| Wanhua Chemical Group Co. Ltd., Class A |
1,021 | 11,801 | ||||||
| Weibo Corp., ADR* |
333 | 4,652 | ||||||
| Weichai Power Co. Ltd., Class A |
2,100 | 3,411 | ||||||
| Weichai Power Co. Ltd., Class H |
14,848 | 20,175 | ||||||
| Wens Foodstuffs Group Co. Ltd., Class A |
2,440 | 5,766 | ||||||
| Will Semiconductor Co. Ltd., Class A |
540 | 7,579 | ||||||
| Wingtech Technology Co. Ltd., Class A |
478 | 3,351 | ||||||
| Wuliangye Yibin Co. Ltd., Class A |
1,200 | 27,176 | ||||||
| WUS Printed Circuit Kunshan Co. Ltd., Class A |
1,500 | 4,403 | ||||||
| WuXi AppTec Co. Ltd., Class A |
920 | 8,402 | ||||||
| WuXi AppTec Co. Ltd., Class H, 144A* |
2,094 | 17,248 | ||||||
| Wuxi Biologics Cayman, Inc., 144A* |
21,469 | 109,806 | ||||||
| Xiaomi Corp., Class B, 144A* |
83,432 | 110,171 | ||||||
| Xinjiang Goldwind Science & Technology Co. Ltd., Class A |
4,300 | 6,573 | ||||||
| Xinyi Solar Holdings Ltd. |
24,569 | 24,254 | ||||||
| XPeng, Inc., Class A* (b) |
5,888 | 23,348 | ||||||
| Xtep International Holdings Ltd. |
8,580 | 8,623 | ||||||
| Yadea Group Holdings Ltd., 144A (b) |
6,987 | 13,920 | ||||||
| Yankuang Energy Group Co. Ltd., Class A |
700 | 2,668 | ||||||
| Yankuang Energy Group Co. Ltd., Class H (b) |
9,496 | 24,060 | ||||||
| Yifeng Pharmacy Chain Co. Ltd., Class A |
600 | 4,183 | ||||||
| Yihai International Holding Ltd.* (b) |
2,432 | 5,392 | ||||||
| Yihai Kerry Arawana Holdings Co. Ltd., Class A |
1,000 | 5,648 | ||||||
| YongXing Special Materials Technology Co. Ltd., Class A |
390 | 3,466 | ||||||
| Yonyou Network Technology Co. Ltd., Class A |
1,700 | 4,748 | ||||||
| YTO Express Group Co. Ltd., Class A |
900 | 1,946 | ||||||
| Yum China Holdings, Inc. |
2,265 | 127,882 | ||||||
| Yunnan Baiyao Group Co. Ltd., Class A |
560 | 4,237 | ||||||
| Yunnan Energy New Material Co. Ltd., Class A* |
300 | 3,832 | ||||||
| Zai Lab Ltd.* (b) |
5,802 | 19,154 | ||||||
| Zhangzhou Pientzehuang Pharmaceutical Co. Ltd., Class A |
200 | 8,548 | ||||||
| Zhaojin Mining Industry Co. Ltd., Class H* |
8,439 | 11,984 | ||||||
| Zhejiang Chint Electrics Co. Ltd., Class A |
1,200 | 4,409 | ||||||
| Zhejiang Dahua Technology Co. Ltd., Class A |
3,600 | 10,035 | ||||||
| Zhejiang Expressway Co. Ltd., Class H (b) |
5,816 | 4,308 | ||||||
| Zhejiang Huayou Cobalt Co. Ltd., Class A |
650 | 4,224 | ||||||
| Zhejiang Jingsheng Mechanical & Electrical Co. Ltd., Class A |
600 | 5,813 | ||||||
| See Notes to Financial Statements. | 25 |
DBX ETF Trust
Schedule of Investments
Xtrackers MSCI All World ex US Hedged Equity ETF (Continued)
May 31, 2023
| Number |
Value |
|||||||
| China (Continued) | ||||||||
| Zhejiang NHU Co. Ltd., Class A* |
2,160 | $ | 4,583 | |||||
| Zhejiang Supcon Technology Co. Ltd., Class A |
279 | 4,054 | ||||||
| ZhongAn Online P&C Insurance Co. Ltd., Class H, 144A* |
5,473 | 15,412 | ||||||
| Zhongji Innolight Co. Ltd., Class A* |
600 | 9,062 | ||||||
| Zhongsheng Group Holdings Ltd. |
3,824 | 14,113 | ||||||
| Zhuzhou CRRC Times Electric Co. Ltd. |
3,305 | 13,907 | ||||||
| Zijin Mining Group Co. Ltd., Class A |
6,800 | 10,213 | ||||||
| Zijin Mining Group Co. Ltd., Class H |
34,308 | 46,530 | ||||||
| Zoomlion Heavy Industry Science and Technology Co. Ltd., Class A |
4,400 | 3,913 | ||||||
| ZTE Corp., Class A |
1,512 | 7,474 | ||||||
| ZTE Corp., Class H |
3,477 | 10,679 | ||||||
| ZTO Express Cayman, Inc., ADR |
2,213 | 55,856 | ||||||
|
|
|
|||||||
| (Cost $11,952,499) |
9,702,555 | |||||||
|
|
|
|||||||
| Colombia — 0.0% | ||||||||
| Bancolombia SA |
1,292 | 8,071 | ||||||
| Interconexion Electrica SA ESP |
2,692 | 10,647 | ||||||
|
|
|
|||||||
| (Cost $24,936) |
18,718 | |||||||
|
|
|
|||||||
| Cyprus — 0.0% | ||||||||
| Polymetal International PLC* (c) |
1,738 | 0 | ||||||
| TCS Group Holding PLC, GDR* (c) |
608 | 0 | ||||||
|
|
|
|||||||
| (Cost $62,312) |
0 | |||||||
|
|
|
|||||||
| Czech Republic — 0.0% | ||||||||
| CEZ AS |
965 | 43,414 | ||||||
| Komercni Banka AS |
414 | 12,339 | ||||||
| Moneta Money Bank AS, 144A |
1,846 | 6,587 | ||||||
|
|
|
|||||||
| (Cost $44,943) |
62,340 | |||||||
|
|
|
|||||||
| Denmark — 2.0% | ||||||||
| A.P. Moller — Maersk A/S, Class A |
19 | 31,882 | ||||||
| A.P. Moller — Maersk A/S, Class B |
26 | 43,721 | ||||||
| Carlsberg A/S, Class B |
506 | 76,227 | ||||||
| Chr Hansen Holding A/S |
622 | 45,106 | ||||||
| Coloplast A/S, Class B |
654 | 82,329 | ||||||
| Danske Bank A/S* |
4,096 | 83,312 | ||||||
| Demant A/S* |
659 | 25,049 | ||||||
| DSV A/S |
1,016 | 195,787 | ||||||
| Genmab A/S* |
350 | 136,902 | ||||||
| Novo Nordisk A/S, Class B |
9,199 | 1,473,868 | ||||||
| Novozymes A/S, Class B (b) |
1,088 | 52,427 | ||||||
| Orsted AS, 144A |
1,086 | 95,090 | ||||||
| Pandora A/S |
496 | 39,514 | ||||||
| ROCKWOOL A/S, Class B |
71 | 16,928 | ||||||
| Tryg A/S |
2,057 | 46,799 | ||||||
| Vestas Wind Systems A/S* |
5,535 | 157,581 | ||||||
|
|
|
|||||||
| (Cost $1,484,367) |
2,602,522 | |||||||
|
|
|
|||||||
| Egypt — 0.0% | ||||||||
| Commercial International Bank Egypt SAE |
15,165 | 25,667 | ||||||
| Eastern Co. SAE |
4,376 | 2,701 | ||||||
|
|
|
|||||||
| (Cost $32,658) |
28,368 | |||||||
|
|
|
|||||||
| Number |
Value |
|||||||
| Finland — 0.7% | ||||||||
| Elisa OYJ |
869 | $ | 48,673 | |||||
| Fortum OYJ |
2,716 | 36,086 | ||||||
| Kesko OYJ, Class B |
1,624 | 30,699 | ||||||
| Kone OYJ, Class B |
1,822 | 92,450 | ||||||
| Metso Corp. |
3,013 | 32,963 | ||||||
| Neste OYJ |
2,319 | 87,674 | ||||||
| Nokia OYJ |
29,278 | 118,766 | ||||||
| Nordea Bank Abp |
17,919 | 176,155 | ||||||
| Orion OYJ, Class B |
706 | 29,876 | ||||||
| Sampo OYJ, Class A |
2,722 | 125,169 | ||||||
| Stora Enso OYJ, Class R |
2,625 | 33,235 | ||||||
| UPM-Kymmene OYJ |
3,085 | 92,563 | ||||||
| Wartsila OYJ Abp |
2,903 | 32,861 | ||||||
|
|
|
|||||||
| (Cost $1,031,454) |
937,170 | |||||||
|
|
|
|||||||
| France — 7.4% | ||||||||
| Accor SA |
985 | 32,607 | ||||||
| Aeroports de Paris* |
174 | 26,429 | ||||||
| Air Liquide SA |
2,887 | 483,378 | ||||||
| Airbus SE |
3,310 | 433,554 | ||||||
| Alstom SA (b) |
1,849 | 50,872 | ||||||
| Amundi SA, 144A |
378 | 21,253 | ||||||
| Arkema SA |
368 | 32,058 | ||||||
| AXA SA |
10,458 | 295,282 | ||||||
| BioMerieux |
238 | 23,822 | ||||||
| BNP Paribas SA (b) |
6,126 | 353,662 | ||||||
| Bollore SE |
5,529 | 35,401 | ||||||
| Bouygues SA |
1,361 | 43,585 | ||||||
| Bureau Veritas SA |
1,752 | 44,440 | ||||||
| Capgemini SE |
909 | 158,181 | ||||||
| Carrefour SA |
3,166 | 58,156 | ||||||
| Cie de Saint-Gobain |
2,705 | 149,773 | ||||||
| Cie Generale des Etablissements Michelin SCA |
3,620 | 102,772 | ||||||
| Covivio SA REIT |
172 | 8,409 | ||||||
| Credit Agricole SA (b) |
6,975 | 79,715 | ||||||
| Danone SA |
3,632 | 214,844 | ||||||
| Dassault Aviation SA |
152 | 25,703 | ||||||
| Dassault Systemes SE |
3,796 | 166,806 | ||||||
| Edenred |
1,429 | 91,770 | ||||||
| Eiffage SA |
443 | 47,172 | ||||||
| Engie SA |
9,843 | 147,739 | ||||||
| EssilorLuxottica SA (b) |
1,660 | 298,876 | ||||||
| Eurazeo SE |
248 | 16,939 | ||||||
| Gecina SA REIT |
216 | 22,107 | ||||||
| Getlink SE |
2,720 | 46,170 | ||||||
| Hermes International |
174 | 353,713 | ||||||
| Ipsen SA* |
243 | 28,078 | ||||||
| Kering SA |
409 | 217,869 | ||||||
| Klepierre SA REIT |
1,245 | 28,186 | ||||||
| La Francaise des Jeux SAEM, 144A |
466 | 17,962 | ||||||
| Legrand SA* |
1,442 | 136,348 | ||||||
| L’Oreal SA |
1,348 | 574,910 | ||||||
| LVMH Moet Hennessy Louis Vuitton SE |
1,539 | 1,338,897 | ||||||
| Orange SA |
10,946 | 130,714 | ||||||
| Pernod Ricard SA |
1,127 | 243,460 | ||||||
| Publicis Groupe SA |
1,222 | 90,546 | ||||||
| See Notes to Financial Statements. | 26 |
DBX ETF Trust
Schedule of Investments
Xtrackers MSCI All World ex US Hedged Equity ETF (Continued)
May 31, 2023
| Number |
Value |
|||||||
| France (Continued) | ||||||||
| Remy Cointreau SA |
132 | $ | 20,282 | |||||
| Renault SA |
1,162 | 38,858 | ||||||
| Safran SA |
1,846 | 267,249 | ||||||
| Sanofi (b) |
6,329 | 641,870 | ||||||
| Sartorius Stedim Biotech |
145 | 38,066 | ||||||
| Schneider Electric SE |
3,027 | 522,026 | ||||||
| SEB SA |
169 | 15,861 | ||||||
| Societe Generale SA (b) |
4,306 | 99,556 | ||||||
| Sodexo SA |
462 | 49,902 | ||||||
| Teleperformance |
331 | 49,497 | ||||||
| Thales SA |
543 | 75,628 | ||||||
| TotalEnergies SE (b) |
13,062 | 741,102 | ||||||
| Unibail-Rodamco-Westfield REIT* (b) |
650 | 29,737 | ||||||
| Valeo |
1,380 | 26,492 | ||||||
| Veolia Environnement SA |
3,496 | 102,914 | ||||||
| Vinci SA |
2,941 | 334,232 | ||||||
| Vivendi SE |
3,875 | 34,337 | ||||||
| Wendel SE |
166 | 17,442 | ||||||
| Worldline SA, 144A* |
1,243 | 48,296 | ||||||
|
|
|
|||||||
| (Cost $7,819,009) |
9,825,505 | |||||||
|
|
|
|||||||
| Germany — 5.0% | ||||||||
| adidas AG |
941 | 152,384 | ||||||
| Allianz SE |
2,264 | 483,950 | ||||||
| BASF SE |
4,968 | 235,857 | ||||||
| Bayer AG |
5,542 | 308,869 | ||||||
| Bayerische Motoren Werke AG |
1,900 | 206,991 | ||||||
| Bechtle AG |
466 | 18,271 | ||||||
| Beiersdorf AG |
579 | 73,741 | ||||||
| Brenntag SE |
901 | 70,671 | ||||||
| Carl Zeiss Meditec AG |
251 | 28,131 | ||||||
| Commerzbank AG* |
5,399 | 54,247 | ||||||
| Continental AG |
530 | 35,283 | ||||||
| Covestro AG, 144A* |
1,012 | 39,007 | ||||||
| Daimler Truck Holding AG* |
2,907 | 87,936 | ||||||
| Delivery Hero SE, 144A* |
879 | 32,885 | ||||||
| Deutsche Bank AG (d) |
11,155 | 112,988 | ||||||
| Deutsche Boerse AG |
1,089 | 187,991 | ||||||
| Deutsche Lufthansa AG* |
2,647 | 25,917 | ||||||
| Deutsche Post AG |
5,608 | 252,064 | ||||||
| Deutsche Telekom AG |
18,190 | 403,351 | ||||||
| E.ON SE |
11,941 | 144,358 | ||||||
| Evonik Industries AG* |
897 | 17,973 | ||||||
| Fresenius Medical Care AG & Co. KGaA |
1,202 | 51,329 | ||||||
| Fresenius SE & Co. KGaA |
2,261 | 61,846 | ||||||
| GEA Group AG |
769 | 32,296 | ||||||
| Hannover Rueck SE |
347 | 74,256 | ||||||
| Heidelberg Materials AG |
687 | 49,112 | ||||||
| HelloFresh SE* |
935 | 22,217 | ||||||
| Henkel AG & Co. KGaA |
577 | 41,397 | ||||||
| Infineon Technologies AG |
7,083 | 262,942 | ||||||
| Knorr-Bremse AG |
426 | 29,133 | ||||||
| LEG Immobilien SE* |
458 | 23,748 | ||||||
| Mercedes-Benz Group AG |
4,718 | 351,855 | ||||||
| Merck KGaA |
709 | 123,340 | ||||||
| MTU Aero Engines AG |
322 | 74,275 | ||||||
| Muenchener Rueckversicherungs-Gesellschaft AG in Muenchen |
804 | 287,038 | ||||||
| Number |
Value |
|||||||
| Germany (Continued) | ||||||||
| Nemetschek SE |
340 | $ | 26,617 | |||||
| Puma SE |
610 | 29,028 | ||||||
| Rational AG |
32 | 21,464 | ||||||
| Rheinmetall AG |
257 | 64,941 | ||||||
| RWE AG |
3,710 | 155,135 | ||||||
| SAP SE |
5,789 | 756,034 | ||||||
| Scout24 SE, 144A |
317 | 20,331 | ||||||
| Siemens AG |
4,200 | 688,402 | ||||||
| Siemens Energy AG* |
2,893 | 73,412 | ||||||
| Siemens Healthineers AG, 144A |
1,483 | 83,856 | ||||||
| Symrise AG |
720 | 76,946 | ||||||
| Talanx AG |
349 | 19,454 | ||||||
| Telefonica Deutschland Holding AG |
5,759 | 16,221 | ||||||
| Volkswagen AG |
191 | 28,664 | ||||||
| Vonovia SE |
3,877 | 71,113 | ||||||
| Wacker Chemie AG |
111 | 14,736 | ||||||
| Zalando SE, 144A* |
1,332 | 38,499 | ||||||
|
|
|
|||||||
| (Cost $6,486,194) |
6,642,502 | |||||||
|
|
|
|||||||
| Greece — 0.1% | ||||||||
| Alpha Services and Holdings SA* |
12,017 | 17,797 | ||||||
| Eurobank Ergasias Services and Holdings SA* |
16,513 | 25,770 | ||||||
| Hellenic Telecommunications Organization SA |
1,100 | 16,837 | ||||||
| JUMBO SA |
804 | 18,649 | ||||||
| Motor Oil Hellas Corinth Refineries SA |
523 | 13,484 | ||||||
| Mytilineos SA |
568 | 17,899 | ||||||
| National Bank of Greece SA* |
1,750 | 10,849 | ||||||
| OPAP SA |
966 | 16,500 | ||||||
| Public Power Corp. SA* |
1,163 | 12,313 | ||||||
| Terna Energy SA |
661 | 14,230 | ||||||
|
|
|
|||||||
| (Cost $130,266) |
164,328 | |||||||
|
|
|
|||||||
| Hong Kong — 2.2% | ||||||||
| AIA Group Ltd. |
64,299 | 616,677 | ||||||
| Alibaba Health Information Technology Ltd.* |
25,048 | 14,842 | ||||||
| Beijing Enterprises Holdings Ltd. |
4,754 | 18,365 | ||||||
| Beijing Enterprises Water Group Ltd. |
29,600 | 7,258 | ||||||
| BOC Hong Kong Holdings Ltd. |
20,760 | 61,640 | ||||||
| Bosideng International Holdings Ltd. |
14,160 | 5,877 | ||||||
| Budweiser Brewing Co. APAC Ltd., 144A |
10,027 | 25,201 | ||||||
| C&D International Investment Group Ltd.* |
5,397 | 13,564 | ||||||
| China Everbright Environment Group Ltd. |
26,229 | 10,250 | ||||||
| China Gas Holdings Ltd. |
18,497 | 20,976 | ||||||
| China Jinmao Holdings Group Ltd. |
29,943 | 4,283 | ||||||
| China Medical System Holdings Ltd. |
8,280 | 11,632 | ||||||
| China Mengniu Dairy Co. Ltd.* |
20,484 | 79,525 | ||||||
| China Merchants Port Holdings Co. Ltd. |
8,916 | 12,935 | ||||||
| China Overseas Land & Investment Ltd. |
20,926 | 42,438 | ||||||
| China Overseas Property Holdings Ltd. |
9,399 | 8,618 | ||||||
| China Power International Development Ltd. |
32,211 | 12,258 | ||||||
| China Resources Beer Holdings Co. Ltd. |
8,382 | 52,880 | ||||||
| China Resources Cement Holdings Ltd. |
18,836 | 6,856 | ||||||
| See Notes to Financial Statements. | 27 |
DBX ETF Trust
Schedule of Investments
Xtrackers MSCI All World ex US Hedged Equity ETF (Continued)
May 31, 2023
| Number |
Value |
|||||||
| Hong Kong (Continued) | ||||||||
| China Resources Gas Group Ltd. |
5,528 | $ | 18,179 | |||||
| China Resources Land Ltd. |
16,909 | 63,270 | ||||||
| China Resources Power Holdings Co. Ltd. |
11,465 | 26,472 | ||||||
| China Ruyi Holdings Ltd.* (b) |
53,692 | 11,999 | ||||||
| China State Construction International Holdings Ltd. |
5,764 | 6,515 | ||||||
| China Taiping Insurance Holdings Co. Ltd. |
8,417 | 8,771 | ||||||
| China Traditional Chinese Medicine Holdings Co. Ltd. |
18,429 | 8,873 | ||||||
| Chow Tai Fook Jewellery Group Ltd. (b) |
11,774 | 20,840 | ||||||
| CK Asset Holdings Ltd. |
10,635 | 57,314 | ||||||
| CK Hutchison Holdings Ltd. |
14,322 | 86,604 | ||||||
| CK Infrastructure Holdings Ltd. |
2,240 | 12,387 | ||||||
| CLP Holdings Ltd. |
8,608 | 62,715 | ||||||
| COSCO SHIPPING Ports Ltd. |
8,299 | 5,225 | ||||||
| ESR Group Ltd., 144A |
14,114 | 20,836 | ||||||
| Far East Horizon Ltd. (b) |
11,701 | 9,803 | ||||||
| Futu Holdings Ltd., ADR* |
290 | 10,689 | ||||||
| Galaxy Entertainment Group Ltd.* |
11,799 | 73,156 | ||||||
| GCL Technology Holdings Ltd.* (b) |
124,733 | 27,080 | ||||||
| Geely Automobile Holdings Ltd. |
31,985 | 37,212 | ||||||
| Guangdong Investment Ltd. |
16,239 | 13,832 | ||||||
| Hang Lung Properties Ltd. |
11,594 | 18,360 | ||||||
| Hang Seng Bank Ltd. |
3,616 | 48,349 | ||||||
| Henderson Land Development Co. Ltd. |
8,011 | 25,423 | ||||||
| HKT Trust & HKT Ltd. (a) |
19,553 | 24,970 | ||||||
| Hong Kong & China Gas Co. Ltd. |
58,802 | 53,016 | ||||||
| Hong Kong Exchanges & Clearing Ltd. |
6,679 | 244,456 | ||||||
| Hongkong Land Holdings Ltd. |
7,400 | 31,746 | ||||||
| Jardine Matheson Holdings Ltd. |
921 | 44,217 | ||||||
| Kingboard Holdings Ltd. |
3,978 | 10,719 | ||||||
| Kingboard Laminates Holdings Ltd. |
6,739 | 6,162 | ||||||
| Kunlun Energy Co. Ltd.* |
28,991 | 23,103 | ||||||
| Link REIT |
14,095 | 81,901 | ||||||
| MTR Corp. Ltd. |
7,996 | 36,812 | ||||||
| New World Development Co. Ltd. |
9,515 | 22,723 | ||||||
| Nine Dragons Paper Holdings Ltd. (b) |
11,423 | 6,331 | ||||||
| Orient Overseas International Ltd. (b) |
824 | 10,044 | ||||||
| Power Assets Holdings Ltd. |
8,161 | 43,929 | ||||||
| Prudential PLC |
15,599 | 204,910 | ||||||
| Shenzhen International Holdings Ltd. |
8,123 | 6,442 | ||||||
| Shimao Group Holdings Ltd.* (c) |
6,159 | 0 | ||||||
| Sino Biopharmaceutical Ltd. |
53,674 | 25,567 | ||||||
| Sino Land Co. Ltd. |
16,821 | 21,868 | ||||||
| SITC International Holdings Co. Ltd. |
7,529 | 13,076 | ||||||
| Sun Hung Kai Properties Ltd. |
8,368 | 106,544 | ||||||
| Swire Pacific Ltd., Class A |
3,404 | 22,736 | ||||||
| Swire Properties Ltd. |
8,946 | 21,318 | ||||||
| Techtronic Industries Co. Ltd. |
7,328 | 67,988 | ||||||
| Vinda International Holdings Ltd. |
3,130 | 7,531 | ||||||
| Want Want China Holdings Ltd. |
26,923 | 18,016 | ||||||
| WH Group Ltd., 144A |
39,827 | 20,802 | ||||||
| Wharf Real Estate Investment Co. Ltd. |
10,016 | 49,438 | ||||||
| Xinyi Glass Holdings Ltd. |
10,872 | 16,078 | ||||||
| Yuexiu Property Co. Ltd. (b) |
11,555 | 12,514 | ||||||
|
|
|
|||||||
| (Cost $3,420,033) |
2,954,936 | |||||||
|
|
|
|||||||
| Number |
Value |
|||||||
| Hungary — 0.1% | ||||||||
| MOL Hungarian Oil & Gas PLC |
2,264 | $ | 18,418 | |||||
| OTP Bank Nyrt |
1,369 | 42,633 | ||||||
| Richter Gedeon Nyrt |
842 | 21,193 | ||||||
|
|
|
|||||||
| (Cost $91,148) |
82,244 | |||||||
|
|
|
|||||||
| India — 3.9% | ||||||||
| ABB India Ltd. |
364 | 18,153 | ||||||
| ACC Ltd.* |
400 | 8,593 | ||||||
| Adani Enterprises Ltd. |
873 | 26,310 | ||||||
| Adani Green Energy Ltd.* |
1,907 | 22,536 | ||||||
| Adani Ports & Special Economic Zone Ltd. |
2,531 | 22,604 | ||||||
| Adani Power Ltd.* |
4,860 | 14,665 | ||||||
| Ambuja Cements Ltd.* |
3,761 | 19,257 | ||||||
| Apollo Hospitals Enterprise Ltd. |
448 | 25,028 | ||||||
| Asian Paints Ltd. |
2,199 | 84,868 | ||||||
| AU Small Finance Bank Ltd., 144A |
1,340 | 12,583 | ||||||
| Aurobindo Pharma Ltd. |
1,823 | 14,512 | ||||||
| Avenue Supermarts Ltd., 144A* |
813 | 34,112 | ||||||
| Axis Bank Ltd. |
12,277 | 135,759 | ||||||
| Bajaj Auto Ltd. |
375 | 20,702 | ||||||
| Bajaj Finance Ltd. |
1,452 | 122,677 | ||||||
| Bajaj Finserv Ltd. |
2,280 | 39,989 | ||||||
| Bajaj Holdings & Investment Ltd. |
177 | 15,543 | ||||||
| Balkrishna Industries Ltd. |
426 | 11,708 | ||||||
| Bandhan Bank Ltd., 144A* |
3,700 | 11,986 | ||||||
| Bank of Baroda |
9,060 | 20,259 | ||||||
| Berger Paints India Ltd. |
1,200 | 9,435 | ||||||
| Bharat Electronics Ltd. |
15,339 | 20,793 | ||||||
| Bharat Forge Ltd. |
1,102 | 10,540 | ||||||
| Bharat Petroleum Corp. Ltd. |
6,191 | 27,202 | ||||||
| Bharti Airtel Ltd. |
11,993 | 123,203 | ||||||
| Britannia Industries Ltd. |
588 | 33,099 | ||||||
| CG Power & Industrial Solutions Ltd. |
4,785 | 22,721 | ||||||
| Cholamandalam Investment and Finance Co. Ltd. |
2,409 | 30,600 | ||||||
| Cipla Ltd. |
3,005 | 34,617 | ||||||
| Coal India Ltd. |
8,686 | 25,329 | ||||||
| Colgate-Palmolive India Ltd. |
694 | 13,350 | ||||||
| Container Corp. Of India Ltd. |
1,452 | 11,776 | ||||||
| Dabur India Ltd. |
3,991 | 26,793 | ||||||
| Divi’s Laboratories Ltd. |
734 | 30,552 | ||||||
| DLF Ltd. |
3,332 | 19,126 | ||||||
| Dr. Reddy’s Laboratories Ltd. |
626 | 34,058 | ||||||
| Eicher Motors Ltd. |
766 | 33,998 | ||||||
| GAIL India Ltd. |
13,881 | 17,584 | ||||||
| Godrej Consumer Products Ltd.* |
1,827 | 23,372 | ||||||
| Godrej Properties Ltd.* |
767 | 12,889 | ||||||
| Grasim Industries Ltd. |
1,167 | 24,239 | ||||||
| Havells India Ltd. |
1,403 | 22,181 | ||||||
| HCL Technologies Ltd. |
5,467 | 75,669 | ||||||
| HDFC Life Insurance Co. Ltd., 144A* |
5,058 | 36,215 | ||||||
| Hero MotoCorp Ltd. |
692 | 23,085 | ||||||
| Hindalco Industries Ltd. |
6,994 | 34,314 | ||||||
| Hindustan Aeronautics Ltd. |
510 | 19,215 | ||||||
| Hindustan Petroleum Corp. Ltd. |
3,845 | 12,125 | ||||||
| Hindustan Unilever Ltd. |
4,481 | 144,482 | ||||||
| See Notes to Financial Statements. | 28 |
DBX ETF Trust
Schedule of Investments
Xtrackers MSCI All World ex US Hedged Equity ETF (Continued)
May 31, 2023
| Number |
Value |
|||||||
| India (Continued) | ||||||||
| Housing Development Finance Corp. Ltd. |
9,472 | $ | 302,300 | |||||
| ICICI Bank Ltd. |
28,161 | 323,080 | ||||||
| ICICI Lombard General Insurance Co. Ltd., 144A |
1,437 | 20,532 | ||||||
| ICICI Prudential Life Insurance Co. Ltd., 144A |
2,368 | 13,338 | ||||||
| Indian Hotels Co. Ltd. |
5,027 | 23,679 | ||||||
| Indian Oil Corp. Ltd. |
15,346 | 16,694 | ||||||
| Indian Railway Catering & Tourism Corp. Ltd. |
1,558 | 12,231 | ||||||
| Indraprastha Gas Ltd. |
1,513 | 8,789 | ||||||
| Info Edge India Ltd. |
447 | 22,011 | ||||||
| Infosys Ltd. |
18,396 | 293,133 | ||||||
| InterGlobe Aviation Ltd., 144A* |
612 | 17,550 | ||||||
| ITC Ltd. |
17,688 | 95,248 | ||||||
| Jindal Steel & Power Ltd. |
2,591 | 16,199 | ||||||
| JSW Steel Ltd. |
4,507 | 37,933 | ||||||
| Jubilant Foodworks Ltd. |
2,564 | 14,978 | ||||||
| Kotak Mahindra Bank Ltd. |
6,043 | 147,135 | ||||||
| Larsen & Toubro Ltd. |
3,699 | 98,616 | ||||||
| LTIMindtree Ltd., 144A |
488 | 29,483 | ||||||
| Lupin Ltd. |
460 | 4,473 | ||||||
| Mahindra & Mahindra Ltd. |
5,252 | 83,733 | ||||||
| Marico Ltd. |
3,283 | 21,550 | ||||||
| Maruti Suzuki India Ltd. |
763 | 86,394 | ||||||
| Max Healthcare Institute Ltd.* |
4,561 | 30,291 | ||||||
| Mphasis Ltd. |
553 | 13,013 | ||||||
| MRF Ltd. |
5 | 5,875 | ||||||
| Muthoot Finance Ltd. |
756 | 10,193 | ||||||
| Nestle India Ltd. |
177 | 46,368 | ||||||
| NTPC Ltd. |
24,064 | 50,567 | ||||||
| Oil & Natural Gas Corp. Ltd. |
19,534 | 36,574 | ||||||
| Page Industries Ltd. |
35 | 16,404 | ||||||
| Petronet LNG Ltd. |
3,652 | 9,970 | ||||||
| PI Industries Ltd. |
355 | 15,520 | ||||||
| Pidilite Industries Ltd. |
770 | 24,272 | ||||||
| Power Grid Corp. of India Ltd. |
17,432 | 49,273 | ||||||
| Reliance Industries Ltd. |
17,009 | 507,791 | ||||||
| Samvardhana Motherson International Ltd. |
11,778 | 11,254 | ||||||
| SBI Cards & Payment Services Ltd. |
1,384 | 15,339 | ||||||
| SBI Life Insurance Co. Ltd., 144A |
2,079 | 31,035 | ||||||
| Shree Cement Ltd. |
72 | 21,901 | ||||||
| Shriram Finance Ltd. |
1,196 | 20,235 | ||||||
| Siemens Ltd. |
413 | 17,730 | ||||||
| Sona Blw Precision Forgings Ltd., 144A |
2,705 | 17,707 | ||||||
| SRF Ltd. |
973 | 29,635 | ||||||
| State Bank of India |
10,321 | 72,338 | ||||||
| Sun Pharmaceutical Industries Ltd. |
5,281 | 62,259 | ||||||
| Tata Consultancy Services Ltd. |
4,977 | 197,890 | ||||||
| Tata Consumer Products Ltd. |
3,294 | 31,799 | ||||||
| Tata Elxsi Ltd. |
210 | 18,838 | ||||||
| Tata Motors Ltd.* |
10,084 | 64,150 | ||||||
| Tata Power Co. Ltd. |
8,029 | 20,725 | ||||||
| Tata Steel Ltd. |
39,753 | 50,837 | ||||||
| Tech Mahindra Ltd. |
3,212 | 43,310 | ||||||
| Number |
Value |
|||||||
| India (Continued) | ||||||||
| Titan Co. Ltd. |
1,960 | $ | 66,886 | |||||
| Torrent Pharmaceuticals Ltd. |
496 | 11,006 | ||||||
| Trent Ltd. |
1,162 | 21,917 | ||||||
| Tube Investments of India Ltd. |
613 | 21,213 | ||||||
| TVS Motor Co. Ltd. |
1,211 | 19,070 | ||||||
| UltraTech Cement Ltd. |
660 | 62,784 | ||||||
| United Spirits Ltd.* |
1,860 | 19,863 | ||||||
| UPL Ltd. |
2,858 | 23,667 | ||||||
| Varun Beverages Ltd. |
1,445 | 29,595 | ||||||
| Vedanta Ltd. |
2,680 | 9,015 | ||||||
| Wipro Ltd. |
6,894 | 33,636 | ||||||
| Yes Bank Ltd.* |
56,316 | 11,027 | ||||||
| Zomato Ltd.* |
26,626 | 22,223 | ||||||
|
|
|
|||||||
| (Cost $4,265,208) |
5,218,480 | |||||||
|
|
|
|||||||
| Indonesia — 0.6% | ||||||||
| Aneka Tambang Tbk |
47,388 | 5,991 | ||||||
| GoTo Gojek Tokopedia Tbk PT* |
4,795,303 | 47,025 | ||||||
| PT Adaro Energy Indonesia Tbk |
82,036 | 11,164 | ||||||
| PT Astra International Tbk |
100,569 | 43,274 | ||||||
| PT Bank Central Asia Tbk |
302,998 | 182,931 | ||||||
| PT Bank Mandiri Persero Tbk |
215,118 | 72,471 | ||||||
| PT Bank Negara Indonesia Persero Tbk |
41,364 | 24,973 | ||||||
| PT Bank Rakyat Indonesia Persero Tbk |
368,084 | 136,896 | ||||||
| PT Barito Pacific Tbk* |
142,535 | 7,227 | ||||||
| PT Charoen Pokphand Indonesia Tbk |
46,010 | 15,193 | ||||||
| PT Indah Kiat Pulp & Paper Tbk |
20,659 | 9,509 | ||||||
| PT Indofood CBP Sukses Makmur Tbk |
15,127 | 11,807 | ||||||
| PT Indofood Sukses Makmur Tbk |
13,056 | 6,184 | ||||||
| PT Kalbe Farma Tbk |
126,870 | 17,181 | ||||||
| PT Merdeka Copper Gold Tbk* |
79,644 | 15,939 | ||||||
| PT Sarana Menara Nusantara Tbk |
163,488 | 10,797 | ||||||
| PT Semen Indonesia Persero Tbk |
26,264 | 10,162 | ||||||
| PT Sumber Alfaria Trijaya Tbk |
109,079 | 19,211 | ||||||
| PT Telkom Indonesia Persero Tbk |
276,435 | 74,503 | ||||||
| PT Unilever Indonesia Tbk |
51,686 | 15,620 | ||||||
| PT United Tractors Tbk |
11,193 | 16,595 | ||||||
| PT Vale Indonesia Tbk |
18,118 | 7,615 | ||||||
|
|
|
|||||||
| (Cost $651,703) |
762,268 | |||||||
|
|
|
|||||||
| Ireland — 0.9% | ||||||||
| AerCap Holdings NV* |
924 | 52,742 | ||||||
| AIB Group PLC |
6,701 | 27,447 | ||||||
| Bank of Ireland Group PLC |
6,581 | 61,861 | ||||||
| CRH PLC |
4,100 | 193,268 | ||||||
| DCC PLC |
616 | 35,225 | ||||||
| Experian PLC |
5,275 | 185,831 | ||||||
| Flutter Entertainment PLC* |
976 | 190,549 | ||||||
| James Hardie Industries PLC CDI* |
2,457 | 60,554 | ||||||
| Kerry Group PLC, Class A |
901 | 87,814 | ||||||
| Kingspan Group PLC |
920 | 61,049 | ||||||
| PDD Holdings, Inc., ADR* |
2,762 | 180,414 | ||||||
| Smurfit Kappa Group PLC |
1,239 | 44,009 | ||||||
|
|
|
|||||||
| (Cost $1,038,452) |
1,180,763 | |||||||
|
|
|
|||||||
| Israel — 0.4% | ||||||||
| Azrieli Group Ltd. |
249 | 13,092 | ||||||
| Bank Hapoalim BM |
6,392 | 51,423 | ||||||
| See Notes to Financial Statements. | 29 |
DBX ETF Trust
Schedule of Investments
Xtrackers MSCI All World ex US Hedged Equity ETF (Continued)
May 31, 2023
| Number |
Value |
|||||||
| Israel (Continued) | ||||||||
| Bank Leumi Le-Israel BM |
7,825 | $ | 54,836 | |||||
| Check Point Software Technologies Ltd.* |
545 | 68,022 | ||||||
| CyberArk Software Ltd.* |
225 | 34,814 | ||||||
| Elbit Systems Ltd. |
186 | 37,997 | ||||||
| ICL Group Ltd. |
4,138 | 22,533 | ||||||
| Israel Discount Bank Ltd., Class A |
7,946 | 38,266 | ||||||
| Mizrahi Tefahot Bank Ltd. |
670 | 21,492 | ||||||
| Monday.com Ltd.* |
122 | 21,984 | ||||||
| Nice Ltd.* |
386 | 77,644 | ||||||
| Teva Pharmaceutical Industries Ltd., ADR* |
6,547 | 47,139 | ||||||
| Tower Semiconductor Ltd.* |
690 | 28,550 | ||||||
| Wix.com Ltd.* |
337 | 25,686 | ||||||
|
|
|
|||||||
| (Cost $647,907) |
543,478 | |||||||
|
|
|
|||||||
| Italy — 1.3% | ||||||||
| Amplifon SpA (b) |
798 | 27,534 | ||||||
| Assicurazioni Generali SpA |
6,112 | 115,734 | ||||||
| Davide Campari-Milano NV (b) |
3,324 | 43,382 | ||||||
| DiaSorin SpA |
150 | 15,424 | ||||||
| Enel SpA |
44,857 | 280,878 | ||||||
| Eni SpA |
12,717 | 169,236 | ||||||
| Ferrari NV |
690 | 196,629 | ||||||
| FinecoBank Banca Fineco SpA |
2,978 | 39,503 | ||||||
| Infrastrutture Wireless Italiane SpA, 144A |
2,148 | 27,322 | ||||||
| Intesa Sanpaolo SpA |
89,593 | 206,424 | ||||||
| Mediobanca Banca di Credito Finanziario SpA |
2,730 | 30,042 | ||||||
| Moncler SpA |
1,076 | 72,827 | ||||||
| Nexi SpA, 144A* |
3,229 | 25,292 | ||||||
| Poste Italiane SpA, 144A |
2,858 | 29,621 | ||||||
| Prysmian SpA |
1,468 | 54,402 | ||||||
| Recordati Industria Chimica e Farmaceutica SpA |
624 | 27,093 | ||||||
| Snam SpA |
11,803 | 61,693 | ||||||
| Telecom Italia SpA* |
59,521 | 15,766 | ||||||
| Terna — Rete Elettrica Nazionale |
8,322 | 69,669 | ||||||
| UniCredit SpA |
10,425 | 199,621 | ||||||
|
|
|
|||||||
| (Cost $1,532,125) |
1,708,092 | |||||||
|
|
|
|||||||
| Japan — 14.1% | ||||||||
| Advantest Corp. |
1,000 | 128,548 | ||||||
| Aeon Co. Ltd. |
3,500 | 69,334 | ||||||
| AGC, Inc. (b) |
1,200 | 43,840 | ||||||
| Aisin Corp. |
800 | 23,025 | ||||||
| Ajinomoto Co., Inc. |
2,500 | 97,273 | ||||||
| ANA Holdings, Inc.* |
600 | 13,329 | ||||||
| Asahi Group Holdings Ltd. |
2,700 | 104,822 | ||||||
| Asahi Intecc Co. Ltd. |
1,300 | 24,773 | ||||||
| Asahi Kasei Corp. |
7,800 | 53,101 | ||||||
| Astellas Pharma, Inc. |
9,900 | 156,858 | ||||||
| Azbil Corp. |
800 | 25,351 | ||||||
| Bandai Namco Holdings, Inc. |
3,300 | 77,476 | ||||||
| BayCurrent Consulting, Inc. |
800 | 29,341 | ||||||
| Bridgestone Corp. (b) |
3,100 | 126,336 | ||||||
| Brother Industries Ltd. |
1,519 | 22,067 | ||||||
| Number |
Value |
|||||||
| Japan (Continued) | ||||||||
| Canon, Inc. (b) |
5,700 | $ | 141,595 | |||||
| Capcom Co. Ltd. |
1,100 | 42,950 | ||||||
| Central Japan Railway Co. |
800 | 97,527 | ||||||
| Chiba Bank Ltd. |
3,800 | 23,756 | ||||||
| Chubu Electric Power Co., Inc. |
4,000 | 47,744 | ||||||
| Chugai Pharmaceutical Co. Ltd. (b) |
4,164 | 112,225 | ||||||
| Concordia Financial Group Ltd. |
6,100 | 23,643 | ||||||
| CyberAgent, Inc. |
2,500 | 17,728 | ||||||
| Dai Nippon Printing Co. Ltd. |
1,400 | 39,943 | ||||||
| Daifuku Co. Ltd. |
1,800 | 36,549 | ||||||
| Dai-ichi Life Holdings, Inc. |
5,300 | 91,088 | ||||||
| Daiichi Sankyo Co. Ltd. |
10,226 | 333,221 | ||||||
| Daikin Industries Ltd. |
1,413 | 269,365 | ||||||
| Daito Trust Construction Co. Ltd. |
300 | 28,530 | ||||||
| Daiwa House Industry Co. Ltd. |
3,271 | 85,505 | ||||||
| Daiwa House REIT Investment Corp. REIT |
10 | 20,994 | ||||||
| Daiwa Securities Group, Inc. |
6,200 | 28,169 | ||||||
| Denso Corp. |
2,300 | 142,152 | ||||||
| Dentsu Group, Inc. (b) |
1,300 | 41,802 | ||||||
| Disco Corp. |
523 | 76,390 | ||||||
| East Japan Railway Co. |
1,570 | 86,633 | ||||||
| Eisai Co. Ltd. |
1,400 | 89,110 | ||||||
| ENEOS Holdings, Inc. |
16,393 | 54,571 | ||||||
| FANUC Corp. |
5,125 | 176,492 | ||||||
| Fast Retailing Co. Ltd. |
948 | 222,362 | ||||||
| Fuji Electric Co. Ltd. |
600 | 25,279 | ||||||
| FUJIFILM Holdings Corp. |
2,100 | 128,615 | ||||||
| Fujitsu Ltd. |
1,000 | 127,185 | ||||||
| GLP J REIT |
19 | 20,156 | ||||||
| GMO Payment Gateway, Inc. |
300 | 23,729 | ||||||
| Hakuhodo DY Holdings, Inc. |
1,200 | 12,592 | ||||||
| Hamamatsu Photonics KK |
700 | 35,722 | ||||||
| Hankyu Hanshin Holdings, Inc. |
1,500 | 47,748 | ||||||
| Hikari Tsushin, Inc. |
100 | 14,477 | ||||||
| Hirose Electric Co. Ltd. |
205 | 27,838 | ||||||
| Hitachi Construction Machinery Co. Ltd. |
600 | 14,857 | ||||||
| Hitachi Ltd. |
5,341 | 308,442 | ||||||
| Honda Motor Co. Ltd. |
8,443 | 242,700 | ||||||
| Hoshizaki Corp. |
656 | 23,636 | ||||||
| Hoya Corp. |
1,978 | 249,371 | ||||||
| Hulic Co. Ltd. (b) |
1,300 | 10,852 | ||||||
| Ibiden Co. Ltd. |
600 | 32,815 | ||||||
| Idemitsu Kosan Co. Ltd. |
1,232 | 23,946 | ||||||
| Iida Group Holdings Co. Ltd. |
800 | 13,229 | ||||||
| Inpex Corp. (b) |
5,200 | 55,238 | ||||||
| Isuzu Motors Ltd. |
3,300 | 38,465 | ||||||
| ITOCHU Corp. |
6,500 | 220,251 | ||||||
| Itochu Techno-Solutions Corp. |
500 | 13,027 | ||||||
| Japan Airlines Co. Ltd. |
900 | 17,222 | ||||||
| Japan Exchange Group, Inc. |
3,000 | 49,105 | ||||||
| Japan Metropolitan Fund Invest REIT |
45 | 31,846 | ||||||
| Japan Post Bank Co. Ltd. |
8,200 | 61,268 | ||||||
| Japan Post Holdings Co. Ltd. |
12,999 | 91,854 | ||||||
| Japan Post Insurance Co. Ltd. |
1,100 | 16,556 | ||||||
| Japan Real Estate Investment Corp. REIT |
7 | 26,628 | ||||||
| Japan Tobacco, Inc. |
6,588 | 143,747 | ||||||
| See Notes to Financial Statements. | 30 |
DBX ETF Trust
Schedule of Investments
Xtrackers MSCI All World ex US Hedged Equity ETF (Continued)
May 31, 2023
| Number |
Value |
|||||||
| Japan (Continued) | ||||||||
| JFE Holdings, Inc. |
2,700 | $ | 33,410 | |||||
| JSR Corp. |
700 | 16,906 | ||||||
| Kajima Corp. |
2,500 | 35,080 | ||||||
| Kansai Electric Power Co., Inc. |
3,600 | 41,239 | ||||||
| Kao Corp. |
2,611 | 91,397 | ||||||
| Kawasaki Kisen Kaisha Ltd. |
700 | 15,751 | ||||||
| KDDI Corp. |
8,200 | 252,548 | ||||||
| Keio Corp. |
600 | 21,145 | ||||||
| Keisei Electric Railway Co. Ltd. |
800 | 30,720 | ||||||
| Keyence Corp. |
1,074 | 522,643 | ||||||
| Kikkoman Corp. |
900 | 53,163 | ||||||
| Kintetsu Group Holdings Co. Ltd. |
1,000 | 33,124 | ||||||
| Kirin Holdings Co. Ltd. |
4,600 | 68,657 | ||||||
| Kobayashi Pharmaceutical Co. Ltd. |
400 | 22,623 | ||||||
| Kobe Bussan Co. Ltd. |
800 | 22,078 | ||||||
| Koei Tecmo Holdings Co. Ltd. |
520 | 8,760 | ||||||
| Koito Manufacturing Co. Ltd. |
1,200 | 22,583 | ||||||
| Komatsu Ltd. |
5,000 | 118,141 | ||||||
| Konami Group Corp. |
600 | 31,825 | ||||||
| Kose Corp. |
200 | 20,097 | ||||||
| Kubota Corp. |
5,500 | 76,070 | ||||||
| Kurita Water Industries Ltd. |
700 | 28,688 | ||||||
| Kyocera Corp. |
1,684 | 95,800 | ||||||
| Kyowa Kirin Co. Ltd. |
1,700 | 32,701 | ||||||
| Lasertec Corp. (b) |
400 | 62,157 | ||||||
| Lixil Corp. |
1,300 | 16,795 | ||||||
| M3, Inc. |
2,442 | 54,475 | ||||||
| Makita Corp. |
1,400 | 37,983 | ||||||
| Marubeni Corp. |
8,800 | 125,818 | ||||||
| MatsukiyoCocokara & Co. |
800 | 42,893 | ||||||
| Mazda Motor Corp. |
3,200 | 27,424 | ||||||
| McDonald’s Holdings Co. Japan Ltd. (b) |
400 | 16,451 | ||||||
| MEIJI Holdings Co. Ltd. |
1,400 | 31,401 | ||||||
| MINEBEA MITSUMI, Inc. |
2,200 | 42,460 | ||||||
| MISUMI Group, Inc. |
1,400 | 30,648 | ||||||
| Mitsubishi Chemical Group Corp. |
9,100 | 51,161 | ||||||
| Mitsubishi Corp. |
6,944 | 278,408 | ||||||
| Mitsubishi Electric Corp. |
10,700 | 139,697 | ||||||
| Mitsubishi Estate Co. Ltd. |
6,600 | 75,936 | ||||||
| Mitsubishi HC Capital, Inc. |
4,000 | 21,733 | ||||||
| Mitsubishi Heavy Industries Ltd. |
1,700 | 72,063 | ||||||
| Mitsubishi UFJ Financial Group, Inc. |
63,000 | 421,658 | ||||||
| Mitsui & Co. Ltd. |
7,200 | 227,589 | ||||||
| Mitsui Chemicals, Inc. |
1,100 | 27,831 | ||||||
| Mitsui Fudosan Co. Ltd. |
4,900 | 93,639 | ||||||
| Mitsui OSK Lines Ltd. (b) |
2,100 | 47,856 | ||||||
| Mizuho Financial Group, Inc. |
13,250 | 195,243 | ||||||
| MonotaRO Co. Ltd. |
1,600 | 22,279 | ||||||
| MS&AD Insurance Group Holdings, Inc. |
2,300 | 79,206 | ||||||
| Murata Manufacturing Co. Ltd. |
3,100 | 182,429 | ||||||
| NEC Corp. |
1,300 | 61,116 | ||||||
| Nexon Co. Ltd. (b) |
2,460 | 50,251 | ||||||
| NGK Insulators Ltd. |
2,300 | 27,783 | ||||||
| Nidec Corp. |
2,400 | 119,548 | ||||||
| Nintendo Co. Ltd. |
6,000 | 255,632 | ||||||
| Nippon Building Fund, Inc. REIT |
9 | 36,045 | ||||||
| NIPPON EXPRESS HOLDINGS, Inc. (b) |
500 | 28,100 | ||||||
| Nippon Paint Holdings Co. Ltd. (b) |
4,900 | 37,667 | ||||||
| Number |
Value |
|||||||
| Japan (Continued) | ||||||||
| Nippon Prologis REIT, Inc. REIT (b) |
12 | $ | 25,167 | |||||
| Nippon Sanso Holdings Corp. |
1,000 | 20,528 | ||||||
| Nippon Shinyaku Co. Ltd. |
200 | 9,158 | ||||||
| Nippon Steel Corp. |
4,510 | 87,902 | ||||||
| Nippon Telegraph & Telephone Corp. |
6,400 | 181,676 | ||||||
| Nippon Yusen KK (b) |
2,900 | 61,872 | ||||||
| Nissan Chemical Corp. |
600 | 26,097 | ||||||
| Nissan Motor Co. Ltd. |
12,100 | 45,412 | ||||||
| Nisshin Seifun Group, Inc. |
1,150 | 14,436 | ||||||
| Nissin Foods Holdings Co. Ltd. |
415 | 35,416 | ||||||
| Nitori Holdings Co. Ltd. |
501 | 61,112 | ||||||
| Nitto Denko Corp. |
900 | 64,145 | ||||||
| Nomura Holdings, Inc. |
15,300 | 53,700 | ||||||
| Nomura Real Estate Holdings, Inc. |
600 | 14,534 | ||||||
| Nomura Real Estate Master Fund, Inc. REIT |
27 | 31,762 | ||||||
| Nomura Research Institute Ltd. |
2,156 | 54,316 | ||||||
| NTT Data Corp. |
3,400 | 48,734 | ||||||
| Obayashi Corp. |
3,900 | 31,463 | ||||||
| Obic Co. Ltd. |
400 | 64,856 | ||||||
| Odakyu Electric Railway Co. Ltd. |
1,600 | 23,335 | ||||||
| Oji Holdings Corp. |
4,122 | 15,887 | ||||||
| Olympus Corp. |
6,600 | 100,309 | ||||||
| Omron Corp. |
1,000 | 60,470 | ||||||
| Ono Pharmaceutical Co. Ltd. |
1,800 | 33,700 | ||||||
| Open House Group Co. Ltd. |
500 | 19,236 | ||||||
| Oracle Corp. (b) |
200 | 15,331 | ||||||
| Oriental Land Co. Ltd. |
6,025 | 226,037 | ||||||
| ORIX Corp. |
7,256 | 123,715 | ||||||
| Osaka Gas Co. Ltd. |
2,308 | 36,593 | ||||||
| Otsuka Corp. |
608 | 22,954 | ||||||
| Otsuka Holdings Co. Ltd. (b) |
2,183 | 81,053 | ||||||
| Pan Pacific International Holdings Corp. |
2,400 | 40,980 | ||||||
| Panasonic Holdings Corp. |
12,700 | 133,130 | ||||||
| Persol Holdings Co. Ltd. |
1,000 | 18,920 | ||||||
| Rakuten Group, Inc. |
4,800 | 19,844 | ||||||
| Recruit Holdings Co. Ltd. |
8,100 | 249,410 | ||||||
| Renesas Electronics Corp.* |
7,100 | 116,698 | ||||||
| Resona Holdings, Inc. |
11,900 | 54,108 | ||||||
| Ricoh Co. Ltd. |
3,800 | 31,802 | ||||||
| Rohm Co. Ltd. |
400 | 33,906 | ||||||
| SBI Holdings, Inc. |
1,517 | 28,418 | ||||||
| SCSK Corp. |
900 | 14,263 | ||||||
| Secom Co. Ltd. |
1,100 | 72,131 | ||||||
| Seiko Epson Corp. |
1,700 | 25,855 | ||||||
| Sekisui Chemical Co. Ltd. |
1,600 | 22,107 | ||||||
| Sekisui House Ltd. |
3,300 | 64,508 | ||||||
| Seven & i Holdings Co. Ltd. |
4,061 | 170,368 | ||||||
| SG Holdings Co. Ltd. |
1,400 | 20,579 | ||||||
| Sharp Corp.* |
1,300 | 7,465 | ||||||
| Shimadzu Corp. |
1,400 | 43,409 | ||||||
| Shimano, Inc. |
453 | 71,238 | ||||||
| Shimizu Corp. |
3,000 | 18,216 | ||||||
| Shin-Etsu Chemical Co. Ltd. |
10,395 | 320,598 | ||||||
| Shionogi & Co. Ltd. |
1,409 | 63,469 | ||||||
| Shiseido Co. Ltd. |
2,106 | 95,909 | ||||||
| Shizuoka Financial Group, Inc. |
1,600 | 11,783 | ||||||
| SMC Corp. |
308 | 165,976 | ||||||
| See Notes to Financial Statements. | 31 |
DBX ETF Trust
Schedule of Investments
Xtrackers MSCI All World ex US Hedged Equity ETF (Continued)
May 31, 2023
| Number |
Value |
|||||||
| Japan (Continued) | ||||||||
| SoftBank Corp. |
15,400 | $ | 164,197 | |||||
| SoftBank Group Corp. |
5,700 | 223,991 | ||||||
| Sompo Holdings, Inc. |
1,600 | 65,344 | ||||||
| Sony Group Corp. |
7,000 | 661,188 | ||||||
| Square Enix Holdings Co. Ltd. |
500 | 22,430 | ||||||
| Subaru Corp. |
3,200 | 55,100 | ||||||
| SUMCO Corp. |
2,100 | 30,010 | ||||||
| Sumitomo Chemical Co. Ltd. |
9,300 | 27,768 | ||||||
| Sumitomo Corp. |
6,200 | 117,325 | ||||||
| Sumitomo Electric Industries Ltd. |
4,400 | 52,235 | ||||||
| Sumitomo Metal Mining Co. Ltd. |
1,500 | 45,541 | ||||||
| Sumitomo Mitsui Financial Group, Inc. |
7,100 | 289,351 | ||||||
| Sumitomo Mitsui Trust Holdings, Inc. |
1,810 | 63,722 | ||||||
| Sumitomo Realty & Development Co. Ltd. |
1,439 | 34,796 | ||||||
| Suntory Beverage & Food Ltd. (b) |
800 | 29,456 | ||||||
| Suzuki Motor Corp. |
1,900 | 62,758 | ||||||
| Sysmex Corp. |
900 | 58,971 | ||||||
| T&D Holdings, Inc. |
2,900 | 39,589 | ||||||
| Taisei Corp. |
1,100 | 35,015 | ||||||
| Takeda Pharmaceutical Co. Ltd. |
8,687 | 275,652 | ||||||
| TDK Corp. |
2,100 | 80,488 | ||||||
| Terumo Corp. |
3,800 | 115,807 | ||||||
| TIS, Inc. |
1,300 | 36,483 | ||||||
| Tobu Railway Co. Ltd. |
1,092 | 28,608 | ||||||
| Toho Co. Ltd. |
500 | 19,702 | ||||||
| Tokio Marine Holdings, Inc. |
10,002 | 225,705 | ||||||
| Tokyo Electric Power Co. Holdings, Inc.* |
9,300 | 32,107 | ||||||
| Tokyo Electron Ltd. |
2,514 | 348,523 | ||||||
| Tokyo Gas Co. Ltd. |
2,400 | 51,144 | ||||||
| Tokyu Corp. |
2,800 | 36,215 | ||||||
| TOPPAN, Inc. |
1,500 | 32,116 | ||||||
| Toray Industries, Inc. |
7,000 | 37,039 | ||||||
| Toshiba Corp. |
2,051 | 66,230 | ||||||
| Tosoh Corp. |
1,100 | 12,672 | ||||||
| TOTO Ltd. |
740 | 22,493 | ||||||
| Toyota Industries Corp. |
900 | 55,683 | ||||||
| Toyota Motor Corp. |
59,120 | 809,837 | ||||||
| Toyota Tsusho Corp. |
1,100 | 48,477 | ||||||
| Trend Micro, Inc. |
800 | 38,127 | ||||||
| Unicharm Corp. |
2,205 | 84,022 | ||||||
| USS Co. Ltd. |
1,100 | 17,914 | ||||||
| Welcia Holdings Co. Ltd. |
600 | 12,695 | ||||||
| West Japan Railway Co. |
1,100 | 46,116 | ||||||
| Yakult Honsha Co. Ltd. |
800 | 51,965 | ||||||
| Yamaha Corp. |
800 | 31,753 | ||||||
| Yamaha Motor Co. Ltd. |
1,800 | 44,443 | ||||||
| Yamato Holdings Co. Ltd. |
1,800 | 32,983 | ||||||
| Yaskawa Electric Corp. |
1,500 | 63,521 | ||||||
| Yokogawa Electric Corp. |
1,361 | 25,711 | ||||||
| Z Holdings Corp. |
12,800 | 31,889 | ||||||
| ZOZO, Inc. |
733 | 14,962 | ||||||
|
|
|
|||||||
| (Cost $16,216,695) |
18,726,303 | |||||||
|
|
|
|||||||
| Jordan — 0.0% | ||||||||
| Hikma Pharmaceuticals PLC |
1,155 | 25,740 | ||||||
|
|
|
|||||||
| Number |
Value |
|||||||
| Kuwait — 0.2% | ||||||||
| Agility Public Warehousing Co. KSC |
8,404 | $ | 16,696 | |||||
| Boubyan Bank KSCP |
6,628 | 12,930 | ||||||
| Gulf Bank KSCP |
4,433 | 3,690 | ||||||
| Kuwait Finance House KSCP |
44,711 | 102,782 | ||||||
| Mabanee Co. KPSC |
3,640 | 8,770 | ||||||
| Mobile Telecommunications Co. KSCP |
11,016 | 18,626 | ||||||
| National Bank of Kuwait SAKP |
41,435 | 123,948 | ||||||
|
|
|
|||||||
| (Cost $258,449) |
287,442 | |||||||
|
|
|
|||||||
| Luxembourg — 0.1% | ||||||||
| ArcelorMittal SA |
2,686 | 66,695 | ||||||
| Eurofins Scientific SE |
819 | 53,961 | ||||||
| Reinet Investments SCA |
806 | 15,941 | ||||||
| Tenaris SA |
2,613 | 32,595 | ||||||
|
|
|
|||||||
| (Cost $165,756) |
169,192 | |||||||
|
|
|
|||||||
| Macau — 0.0% | ||||||||
| Sands China Ltd.* |
14,172 | 45,880 | ||||||
|
|
|
|||||||
| Malaysia — 0.4% | ||||||||
| AMMB Holdings Bhd |
10,087 | 7,955 | ||||||
| Axiata Group Bhd |
11,876 | 7,153 | ||||||
| Celcomdigi Bhd |
20,644 | 19,993 | ||||||
| CIMB Group Holdings Bhd |
34,514 | 36,043 | ||||||
| Dialog Group Bhd |
23,700 | 11,091 | ||||||
| Gamuda Bhd |
16,900 | 16,257 | ||||||
| Genting Bhd |
16,200 | 14,742 | ||||||
| Genting Malaysia Bhd |
21,700 | 11,801 | ||||||
| Hong Leong Bank Bhd |
5,182 | 21,736 | ||||||
| Hong Leong Financial Group Bhd |
1,753 | 6,578 | ||||||
| IHH Healthcare Bhd |
9,091 | 11,365 | ||||||
| Inari Amertron Bhd |
21,000 | 11,466 | ||||||
| IOI Corp. Bhd |
12,200 | 9,754 | ||||||
| Kuala Lumpur Kepong Bhd |
2,620 | 11,853 | ||||||
| Malayan Banking Bhd |
28,237 | 52,920 | ||||||
| Malaysia Airports Holdings Bhd |
8,454 | 12,657 | ||||||
| Maxis Bhd |
12,100 | 10,775 | ||||||
| MISC Bhd |
6,000 | 9,490 | ||||||
| MR DIY Group M Bhd, 144A |
17,400 | 5,919 | ||||||
| Nestle Malaysia Bhd |
300 | 8,710 | ||||||
| Petronas Chemicals Group Bhd |
13,257 | 18,842 | ||||||
| Petronas Dagangan Bhd |
1,500 | 6,864 | ||||||
| Petronas Gas Bhd |
4,641 | 16,832 | ||||||
| PPB Group Bhd |
2,440 | 8,596 | ||||||
| Press Metal Aluminium Holdings Bhd |
21,100 | 21,075 | ||||||
| Public Bank Bhd |
77,700 | 64,140 | ||||||
| QL Resources Bhd |
7,800 | 9,379 | ||||||
| RHB Bank Bhd |
3,224 | 3,737 | ||||||
| Sime Darby Bhd |
8,000 | 3,588 | ||||||
| Sime Darby Plantation Bhd |
11,711 | 10,707 | ||||||
| Telekom Malaysia Bhd |
4,400 | 4,862 | ||||||
| Tenaga Nasional Bhd |
14,500 | 29,876 | ||||||
| Top Glove Corp. Bhd* |
37,600 | 9,287 | ||||||
|
|
|
|||||||
| (Cost $590,547) |
506,043 | |||||||
|
|
|
|||||||
| Mexico — 0.8% | ||||||||
| Alfa SAB de CV, Class A |
20,533 | 12,571 | ||||||
| America Movil SAB de CV, Series B |
178,024 | 190,010 | ||||||
| See Notes to Financial Statements. | 32 |
DBX ETF Trust
Schedule of Investments
Xtrackers MSCI All World ex US Hedged Equity ETF (Continued)
May 31, 2023
| Number |
Value |
|||||||
| Mexico (Continued) | ||||||||
| Arca Continental SAB de CV |
2,306 | $ | 23,313 | |||||
| Banco del Bajio SA, 144A |
4,748 | 14,873 | ||||||
| Cemex SAB de CV, Series CPO* |
79,753 | 47,972 | ||||||
| Coca-Cola Femsa SAB de CV |
2,948 | 24,214 | ||||||
| Controladora AXTEL SAB de CV* |
20,533 | 317 | ||||||
| Fibra Uno Administracion SA de CV REIT |
16,664 | 24,192 | ||||||
| Fomento Economico Mexicano SAB de CV |
10,640 | 107,140 | ||||||
| Gruma SAB de CV, Class B |
1,259 | 19,351 | ||||||
| Grupo Aeroportuario del Pacifico SAB de CV, Class B |
2,257 | 39,933 | ||||||
| Grupo Aeroportuario del Sureste SAB de CV, Class B |
1,207 | 33,806 | ||||||
| Grupo Bimbo SAB de CV, Series A |
6,565 | 35,094 | ||||||
| Grupo Carso SAB de CV, Series A1 |
2,233 | 13,284 | ||||||
| Grupo Financiero Banorte SAB de CV, Class O |
14,690 | 117,751 | ||||||
| Grupo Financiero Inbursa SAB de CV, Class O* |
14,955 | 33,217 | ||||||
| Grupo Mexico SAB de CV, Series B |
17,101 | 75,900 | ||||||
| Grupo Televisa SAB, Series CPO |
14,028 | 13,434 | ||||||
| Industrias Penoles SAB de CV* |
1,324 | 20,260 | ||||||
| Kimberly-Clark de Mexico SAB de CV, Class A |
7,913 | 16,095 | ||||||
| Operadora De Sites Mexicanos SAB de CV, Class A-1 |
11,601 | 10,231 | ||||||
| Orbia Advance Corp. SAB de CV |
6,495 | 13,483 | ||||||
| Promotora y Operadora de Infraestructura SAB de CV |
496 | 4,789 | ||||||
| Wal-Mart de Mexico SAB de CV |
27,876 | 105,932 | ||||||
|
|
|
|||||||
| (Cost $844,028) |
997,162 | |||||||
|
|
|
|||||||
| Netherlands — 3.0% | ||||||||
| ABN AMRO Bank NV, 144A |
2,423 | 35,236 | ||||||
| Adyen NV, 144A* |
116 | 189,312 | ||||||
| Aegon NV (b) |
9,689 | 42,617 | ||||||
| Akzo Nobel NV |
984 | 74,089 | ||||||
| Argenx SE* |
295 | 114,968 | ||||||
| ASM International NV |
248 | 107,466 | ||||||
| ASML Holding NV |
2,246 | 1,612,104 | ||||||
| Euronext NV, 144A |
502 | 33,349 | ||||||
| EXOR NV* |
689 | 57,194 | ||||||
| Heineken Holding NV |
636 | 54,080 | ||||||
| Heineken NV |
1,402 | 141,588 | ||||||
| IMCD NV |
353 | 53,033 | ||||||
| ING Groep NV |
20,584 | 253,202 | ||||||
| JDE Peet’s NV |
549 | 15,950 | ||||||
| Just Eat Takeaway.com NV, 144A* |
1,332 | 20,030 | ||||||
| Koninklijke Ahold Delhaize NV |
5,683 | 180,171 | ||||||
| Koninklijke KPN NV |
18,070 | 62,156 | ||||||
| Koninklijke Philips NV* |
5,409 | 102,023 | ||||||
| NEPI Rockcastle NV |
2,628 | 15,012 | ||||||
| NN Group NV |
1,526 | 55,002 | ||||||
| OCI NV |
441 | 9,800 | ||||||
| Prosus NV* |
4,382 | 288,389 | ||||||
| QIAGEN NV* |
1,377 | 62,128 | ||||||
| Randstad NV |
712 | 34,902 | ||||||
| Stellantis NV |
12,115 | 183,653 | ||||||
| Number |
Value |
|||||||
| Netherlands (Continued) | ||||||||
| Universal Music Group NV |
4,608 | $ | 91,122 | |||||
| Wolters Kluwer NV |
1,423 | 162,448 | ||||||
|
|
|
|||||||
| (Cost $3,086,916) |
4,051,024 | |||||||
|
|
|
|||||||
| New Zealand — 0.2% | ||||||||
| Auckland International Airport Ltd.* |
6,402 | 34,221 | ||||||
| Fisher & Paykel Healthcare Corp. Ltd. |
3,273 | 45,833 | ||||||
| Mercury NZ Ltd. |
3,536 | 13,971 | ||||||
| Meridian Energy Ltd. |
7,709 | 24,655 | ||||||
| Spark New Zealand Ltd. |
11,432 | 35,529 | ||||||
| Xero Ltd.* |
792 | 56,642 | ||||||
|
|
|
|||||||
| (Cost $191,378) |
210,851 | |||||||
|
|
|
|||||||
| Norway — 0.4% | ||||||||
| Adevinta ASA* |
1,580 | 11,060 | ||||||
| Aker BP ASA |
1,768 | 38,417 | ||||||
| DNB Bank ASA |
5,027 | 84,144 | ||||||
| Equinor ASA |
5,126 | 131,034 | ||||||
| Gjensidige Forsikring ASA |
1,249 | 20,985 | ||||||
| Kongsberg Gruppen ASA |
475 | 19,025 | ||||||
| Mowi ASA |
2,153 | 36,950 | ||||||
| Norsk Hydro ASA |
7,355 | 44,447 | ||||||
| Orkla ASA |
4,370 | 31,440 | ||||||
| Salmar ASA (b) |
350 | 15,419 | ||||||
| Telenor ASA |
4,392 | 45,106 | ||||||
| Yara International ASA (b) |
981 | 36,606 | ||||||
|
|
|
|||||||
| (Cost $569,055) |
514,633 | |||||||
|
|
|
|||||||
| Peru — 0.0% | ||||||||
| Cia de Minas Buenaventura SAA, ADR |
1,193 | 8,124 | ||||||
| Credicorp Ltd. |
377 | 48,803 | ||||||
|
|
|
|||||||
| (Cost $73,040) |
56,927 | |||||||
|
|
|
|||||||
| Philippines — 0.2% | ||||||||
| Aboitiz Equity Ventures, Inc. |
7,900 | 7,666 | ||||||
| ACEN Corp.* |
4,620 | 482 | ||||||
| Ayala Corp. |
1,400 | 16,453 | ||||||
| Ayala Land, Inc. |
43,600 | 20,418 | ||||||
| Bank of the Philippine Islands |
12,563 | 22,359 | ||||||
| BDO Unibank, Inc. |
14,830 | 35,913 | ||||||
| International Container Terminal Services, Inc. |
4,050 | 14,062 | ||||||
| JG Summit Holdings, Inc. |
22,570 | 19,291 | ||||||
| Jollibee Foods Corp. |
2,230 | 9,355 | ||||||
| Manila Electric Co. |
860 | 5,007 | ||||||
| Metropolitan Bank & Trust Co. |
12,041 | 12,350 | ||||||
| PLDT, Inc. |
600 | 12,821 | ||||||
| SM Investments Corp. |
1,265 | 20,926 | ||||||
| SM Prime Holdings, Inc. |
63,200 | 36,799 | ||||||
| Universal Robina Corp. |
4,470 | 11,191 | ||||||
|
|
|
|||||||
| (Cost $271,398) |
245,093 | |||||||
|
|
|
|||||||
| Poland — 0.2% | ||||||||
| Allegro.eu SA, 144A* |
2,074 | 17,394 | ||||||
| Bank Polska Kasa Opieki SA |
1,080 | 24,547 | ||||||
| CD Projekt SA |
384 | 10,989 | ||||||
| Cyfrowy Polsat SA |
1,176 | 4,289 | ||||||
| Dino Polska SA, 144A* |
212 | 20,829 | ||||||
| See Notes to Financial Statements. | 33 |
DBX ETF Trust
Schedule of Investments
Xtrackers MSCI All World ex US Hedged Equity ETF (Continued)
May 31, 2023
| Number |
Value |
|||||||
| Poland (Continued) | ||||||||
| KGHM Polska Miedz SA |
693 | $ | 17,115 | |||||
| LPP SA* |
6 | 17,000 | ||||||
| mBank SA* |
102 | 8,497 | ||||||
| PGE Polska Grupa Energetyczna SA* |
5,244 | 8,316 | ||||||
| Polski Koncern Naftowy ORLEN SA |
3,024 | 42,977 | ||||||
| Powszechna Kasa Oszczednosci Bank Polski SA |
5,325 | 40,335 | ||||||
| Powszechny Zaklad Ubezpieczen SA |
3,645 | 33,204 | ||||||
| Santander Bank Polska SA* |
169 | 13,431 | ||||||
|
|
|
|||||||
| (Cost $288,916) |
258,923 | |||||||
|
|
|
|||||||
| Portugal — 0.1% | ||||||||
| EDP — Energias de Portugal SA |
16,153 | 78,768 | ||||||
| Galp Energia SGPS SA |
3,020 | 31,945 | ||||||
| Jeronimo Martins SGPS SA |
1,416 | 34,176 | ||||||
|
|
|
|||||||
| (Cost $135,046) |
144,889 | |||||||
|
|
|
|||||||
| Qatar — 0.3% | ||||||||
| Barwa Real Estate Co. |
7,266 | 5,124 | ||||||
| Commercial Bank PSQC |
20,519 | 31,568 | ||||||
| Dukhan Bank |
10,103 | 10,866 | ||||||
| Industries Qatar QSC |
8,441 | 27,781 | ||||||
| Masraf Al Rayan QSC |
36,318 | 25,442 | ||||||
| Mesaieed Petrochemical Holding Co. |
25,772 | 13,941 | ||||||
| Ooredoo QPSC |
5,108 | 14,889 | ||||||
| Qatar Electricity & Water Co. QSC |
2,691 | 12,642 | ||||||
| Qatar Fuel QSC |
2,870 | 12,505 | ||||||
| Qatar Gas Transport Co. Ltd. |
16,921 | 18,362 | ||||||
| Qatar International Islamic Bank QSC |
4,630 | 12,707 | ||||||
| Qatar Islamic Bank SAQ |
9,924 | 47,766 | ||||||
| Qatar National Bank QPSC |
24,254 | 106,678 | ||||||
|
|
|
|||||||
| (Cost $343,953) |
340,271 | |||||||
|
|
|
|||||||
| Russia — 0.0% | ||||||||
| Alrosa PJSC* (c) |
15,266 | 0 | ||||||
| Gazprom PJSC* (c) |
63,321 | 0 | ||||||
| Inter RAO UES PJSC* (c) |
208,853 | 0 | ||||||
| LUKOIL PJSC* (c) |
2,194 | 0 | ||||||
| Magnit PJSC, GDR* (c) |
3 | 0 | ||||||
| Magnit PJSC* (c) |
443 | 0 | ||||||
| MMC Norilsk Nickel PJSC* (c) |
352 | 0 | ||||||
| Mobile TeleSystems PJSC, ADR* (c) |
3,019 | 0 | ||||||
| Moscow Exchange MICEX-RTS PJSC* (c) |
8,105 | 0 | ||||||
| Novatek PJSC* (c) |
5,150 | 0 | ||||||
| Novolipetsk Steel PJSC* (c) |
7,219 | 0 | ||||||
| Ozon Holdings PLC, ADR* (c) |
322 | 0 | ||||||
| PhosAgro PJSC* (c) |
217 | 0 | ||||||
| PhosAgro PJSC, GDR* (c) |
4 | 0 | ||||||
| Polyus PJSC* (c) |
204 | 0 | ||||||
| Rosneft Oil Co. PJSC* (c) |
6,103 | 0 | ||||||
| Sberbank of Russia PJSC* (c) |
57,586 | 0 | ||||||
| Severstal PAO* (c) |
1,243 | 0 | ||||||
| Surgutneftegas PJSC* (c) |
29,592 | 0 | ||||||
| Tatneft PJSC* (c) |
7,874 | 0 | ||||||
| United Co. RUSAL International PJSC* (c) |
21,438 | 0 | ||||||
| VK Co. Ltd., GDR* (c) |
452 | 0 | ||||||
| Number |
Value |
|||||||
| Russia (Continued) | ||||||||
| VTB Bank PJSC* (c) |
16,943,490 | $ | 0 | |||||
| X5 Retail Group NV, GDR* (c) |
635 | 0 | ||||||
| Yandex NV, Class A* (c) |
1,576 | 0 | ||||||
|
|
|
|||||||
| (Cost $1,162,914) |
0 | |||||||
|
|
|
|||||||
| Saudi Arabia — 1.2% | ||||||||
| ACWA Power Co. |
500 | 19,889 | ||||||
| Advanced Petrochemical Co. |
941 | 10,963 | ||||||
| Al Rajhi Bank |
10,659 | 200,915 | ||||||
| Alinma Bank |
5,083 | 44,247 | ||||||
| Almarai Co. JSC |
1,382 | 20,154 | ||||||
| Arab National Bank |
3,205 | 21,747 | ||||||
| Arabian Internet & Communications Services Co. |
132 | 10,347 | ||||||
| Bank AlBilad |
2,723 | 27,006 | ||||||
| Bank Al-Jazira |
2,489 | 11,639 | ||||||
| Banque Saudi Fransi |
3,616 | 38,370 | ||||||
| Bupa Arabia for Cooperative Insurance Co. |
417 | 18,678 | ||||||
| Dallah Healthcare Co. |
333 | 14,507 | ||||||
| Dar Al Arkan Real Estate Development Co.* |
3,593 | 14,752 | ||||||
| Dr Sulaiman Al Habib Medical Services Group Co. |
469 | 33,386 | ||||||
| Elm Co. |
154 | 18,427 | ||||||
| Emaar Economic City* |
1,215 | 3,194 | ||||||
| Etihad Etisalat Co.* |
2,194 | 25,152 | ||||||
| Jarir Marketing Co. |
3,200 | 15,015 | ||||||
| Mobile Telecommunications Co. Saudi Arabia* |
2,628 | 9,655 | ||||||
| Mouwasat Medical Services Co. |
284 | 17,036 | ||||||
| Nahdi Medical Co. |
215 | 9,756 | ||||||
| National Industrialization Co.* |
3,439 | 13,460 | ||||||
| Rabigh Refining & Petrochemical Co.* |
3,673 | 10,772 | ||||||
| Riyad Bank |
8,136 | 71,039 | ||||||
| SABIC Agri-Nutrients Co. |
1,251 | 41,691 | ||||||
| Sahara International Petrochemical Co. |
2,888 | 27,411 | ||||||
| Saudi Arabian Mining Co.* |
4,605 | 76,243 | ||||||
| Saudi Arabian Oil Co., 144A |
15,218 | 127,804 | ||||||
| Saudi Aramco Base Oil Co. |
330 | 11,789 | ||||||
| Saudi Basic Industries Corp. |
4,662 | 109,627 | ||||||
| Saudi British Bank |
5,667 | 55,902 | ||||||
| Saudi Electricity Co. |
5,222 | 30,072 | ||||||
| Saudi Industrial Investment Group |
2,082 | 13,688 | ||||||
| Saudi Investment Bank |
2,706 | 12,135 | ||||||
| Saudi Kayan Petrochemical Co.* |
4,663 | 15,863 | ||||||
| Saudi National Bank |
15,739 | 154,839 | ||||||
| Saudi Research & Media Group* |
208 | 10,426 | ||||||
| Saudi Tadawul Group Holding Co. |
228 | 9,738 | ||||||
| Saudi Telecom Co. |
10,936 | 126,102 | ||||||
| Savola Group |
1,298 | 12,424 | ||||||
| Yanbu National Petrochemical Co. |
1,411 | 15,969 | ||||||
|
|
|
|||||||
| (Cost $1,371,918) |
1,531,829 | |||||||
|
|
|
|||||||
| Singapore — 0.9% | ||||||||
| BOC Aviation Ltd., 144A |
1,235 | 9,077 | ||||||
| CapitaLand Ascendas REIT |
18,346 | 36,630 | ||||||
| CapitaLand Integrated Commercial Trust REIT |
30,940 | 45,759 | ||||||
| See Notes to Financial Statements. | 34 |
DBX ETF Trust
Schedule of Investments
Xtrackers MSCI All World ex US Hedged Equity ETF (Continued)
May 31, 2023
| Number |
Value |
|||||||
| Singapore (Continued) | ||||||||
| CapitaLand Investment Ltd. |
14,057 | $ | 34,407 | |||||
| City Developments Ltd. |
2,200 | 10,981 | ||||||
| DBS Group Holdings Ltd. |
10,306 | 230,919 | ||||||
| Genting Singapore Ltd. |
28,300 | 21,137 | ||||||
| Grab Holdings Ltd., Class A* (b) |
8,644 | 25,759 | ||||||
| Jardine Cycle & Carriage Ltd. |
700 | 16,735 | ||||||
| JOYY, Inc., ADR |
289 | 7,167 | ||||||
| Keppel Corp. Ltd. |
8,500 | 39,662 | ||||||
| Mapletree Logistics Trust REIT |
22,909 | 28,122 | ||||||
| Mapletree Pan Asia Commercial Trust REIT |
17,100 | 20,864 | ||||||
| Oversea-Chinese Banking Corp. Ltd. |
19,365 | 175,707 | ||||||
| Sea Ltd., ADR* |
1,939 | 111,318 | ||||||
| Seatrium Ltd.* |
162,222 | 14,755 | ||||||
| Singapore Airlines Ltd. |
6,750 | 31,996 | ||||||
| Singapore Exchange Ltd. |
5,093 | 34,950 | ||||||
| Singapore Technologies Engineering Ltd. |
9,430 | 25,522 | ||||||
| Singapore Telecommunications Ltd. |
44,200 | 81,386 | ||||||
| United Overseas Bank Ltd. |
7,022 | 145,134 | ||||||
| UOL Group Ltd. |
2,600 | 12,209 | ||||||
| Venture Corp. Ltd. |
1,100 | 12,340 | ||||||
| Wilmar International Ltd. |
11,237 | 32,490 | ||||||
|
|
|
|||||||
| (Cost $1,342,082) |
1,205,026 | |||||||
|
|
|
|||||||
| South Africa — 0.8% | ||||||||
| Absa Group Ltd. |
4,904 | 38,257 | ||||||
| African Rainbow Minerals Ltd. |
612 | 6,401 | ||||||
| Anglo American Platinum Ltd. |
255 | 14,687 | ||||||
| AngloGold Ashanti Ltd. |
2,167 | 53,068 | ||||||
| Aspen Pharmacare Holdings Ltd. |
2,097 | 18,243 | ||||||
| Bid Corp. Ltd. |
1,419 | 30,225 | ||||||
| Bidvest Group Ltd. |
1,207 | 14,557 | ||||||
| Capitec Bank Holdings Ltd. (b) |
454 | 31,082 | ||||||
| Clicks Group Ltd. (b) |
1,169 | 13,902 | ||||||
| Discovery Ltd.* |
3,021 | 20,289 | ||||||
| Exxaro Resources Ltd. |
1,589 | 12,908 | ||||||
| FirstRand Ltd. |
27,022 | 82,592 | ||||||
| Foschini Group Ltd. |
555 | 2,359 | ||||||
| Gold Fields Ltd. |
5,241 | 80,135 | ||||||
| Growthpoint Properties Ltd. REIT |
15,095 | 8,949 | ||||||
| Harmony Gold Mining Co. Ltd. |
3,264 | 15,495 | ||||||
| Impala Platinum Holdings Ltd. |
5,693 | 45,726 | ||||||
| Kumba Iron Ore Ltd. |
412 | 9,059 | ||||||
| Mr Price Group Ltd. |
1,532 | 9,639 | ||||||
| MTN Group Ltd. |
9,663 | 59,770 | ||||||
| MultiChoice Group |
2,644 | 13,151 | ||||||
| Naspers Ltd., Class N |
1,081 | 163,193 | ||||||
| Nedbank Group Ltd. |
2,667 | 28,155 | ||||||
| Northam Platinum Holdings Ltd.* |
2,088 | 17,188 | ||||||
| Old Mutual Ltd. |
28,074 | 15,191 | ||||||
| OUTsurance Group Ltd. |
5,701 | 9,151 | ||||||
| Pepkor Holdings Ltd., 144A |
10,826 | 7,747 | ||||||
| Remgro Ltd. |
3,115 | 20,729 | ||||||
| Sanlam Ltd. |
6,983 | 18,379 | ||||||
| Sasol Ltd. |
3,350 | 39,248 | ||||||
| Shoprite Holdings Ltd. |
3,096 | 30,648 | ||||||
| Sibanye Stillwater Ltd. |
20,671 | 36,701 | ||||||
| Number |
Value |
|||||||
| South Africa (Continued) | ||||||||
| Standard Bank Group Ltd. |
7,854 | $ | 60,359 | |||||
| Vodacom Group Ltd. |
4,033 | 22,574 | ||||||
| Woolworths Holdings Ltd. |
5,743 | 17,329 | ||||||
|
|
|
|||||||
| (Cost $1,241,147) |
1,067,086 | |||||||
|
|
|
|||||||
| South Korea — 3.3% | ||||||||
| Amorepacific Corp. |
95 | 7,480 | ||||||
| BGF retail Co. Ltd. |
27 | 3,873 | ||||||
| Celltrion Healthcare Co. Ltd. |
580 | 32,338 | ||||||
| Celltrion Pharm, Inc.* |
135 | 8,666 | ||||||
| Celltrion, Inc. |
581 | 74,986 | ||||||
| CJ CheilJedang Corp. |
49 | 11,445 | ||||||
| CJ Corp. |
66 | 4,406 | ||||||
| CosmoAM&T Co. Ltd.* |
140 | 18,849 | ||||||
| Coway Co. Ltd. |
325 | 11,790 | ||||||
| DB Insurance Co. Ltd. |
281 | 15,667 | ||||||
| Doosan Bobcat, Inc. |
371 | 14,955 | ||||||
| Doosan Enerbility Co. Ltd.* |
2,580 | 31,257 | ||||||
| Ecopro BM Co. Ltd. |
264 | 49,528 | ||||||
| E-MART, Inc. |
125 | 7,939 | ||||||
| F&F Co. Ltd. / New |
56 | 5,460 | ||||||
| GS Holdings Corp. |
304 | 8,818 | ||||||
| Hana Financial Group, Inc. |
1,557 | 48,625 | ||||||
| Hankook Tire & Technology Co. Ltd. |
342 | 8,890 | ||||||
| Hanmi Pharm. Co. Ltd. |
27 | 5,950 | ||||||
| Hanon Systems |
837 | 5,915 | ||||||
| Hanwha Aerospace Co. Ltd. |
236 | 18,866 | ||||||
| Hanwha Solutions Corp.* |
682 | 22,995 | ||||||
| HD Hyundai Co. Ltd. |
312 | 13,423 | ||||||
| HD Hyundai Heavy Industries Co. Ltd.* |
124 | 10,847 | ||||||
| HD Korea Shipbuilding & Offshore Engineering Co. Ltd.* |
219 | 15,873 | ||||||
| HLB, Inc.* |
704 | 19,626 | ||||||
| HMM Co. Ltd. |
1,108 | 14,818 | ||||||
| Hotel Shilla Co. Ltd. |
152 | 8,841 | ||||||
| HYBE Co. Ltd.* |
99 | 20,438 | ||||||
| Hyundai Engineering & Construction Co. Ltd. |
541 | 15,611 | ||||||
| Hyundai Glovis Co. Ltd. |
55 | 7,003 | ||||||
| Hyundai Mipo Dockyard Co. Ltd.* |
203 | 11,410 | ||||||
| Hyundai Mobis Co. Ltd. |
343 | 57,630 | ||||||
| Hyundai Motor Co. |
745 | 112,262 | ||||||
| Hyundai Steel Co. |
483 | 11,863 | ||||||
| Industrial Bank of Korea |
1,244 | 9,570 | ||||||
| Kakao Corp. |
1,782 | 75,456 | ||||||
| Kakao Games Corp.* |
182 | 5,327 | ||||||
| KakaoBank Corp. |
701 | 13,838 | ||||||
| Kakaopay Corp.* |
212 | 9,600 | ||||||
| Kangwon Land, Inc. |
553 | 7,596 | ||||||
| KB Financial Group, Inc. |
2,073 | 74,970 | ||||||
| Kia Corp. |
1,401 | 90,673 | ||||||
| Korea Aerospace Industries Ltd. |
409 | 15,870 | ||||||
| Korea Electric Power Corp.* |
1,005 | 14,447 | ||||||
| Korea Investment Holdings Co. Ltd. |
286 | 11,938 | ||||||
| Korea Zinc Co. Ltd. |
32 | 11,585 | ||||||
| Korean Air Lines Co. Ltd. |
989 | 16,468 | ||||||
| Krafton, Inc.* |
163 | 23,223 | ||||||
| KT Corp. |
609 | 14,476 | ||||||
| See Notes to Financial Statements. | 35 |
DBX ETF Trust
Schedule of Investments
Xtrackers MSCI All World ex US Hedged Equity ETF (Continued)
May 31, 2023
| Number |
Value |
|||||||
| South Korea (Continued) | ||||||||
| KT&G Corp. |
665 | $ | 41,887 | |||||
| Kumho Petrochemical Co. Ltd. |
141 | 13,481 | ||||||
| L&F Co. Ltd. |
134 | 27,259 | ||||||
| LG Chem Ltd. |
268 | 139,931 | ||||||
| LG Corp. |
615 | 39,849 | ||||||
| LG Display Co. Ltd.* |
1,336 | 15,824 | ||||||
| LG Electronics, Inc. |
627 | 58,011 | ||||||
| LG Energy Solution Ltd.* |
192 | 86,651 | ||||||
| LG H&H Co. Ltd. |
47 | 18,662 | ||||||
| LG Innotek Co. Ltd. |
85 | 19,661 | ||||||
| LG Uplus Corp. |
922 | 7,808 | ||||||
| Lotte Chemical Corp. |
109 | 13,707 | ||||||
| Lotte Energy Materials Corp. |
143 | 6,174 | ||||||
| Meritz Financial Group, Inc.* |
570 | 19,304 | ||||||
| Mirae Asset Securities Co. Ltd. |
1,783 | 9,807 | ||||||
| NAVER Corp. |
712 | 107,021 | ||||||
| NCSoft Corp. |
98 | 23,702 | ||||||
| Netmarble Corp., 144A* |
128 | 5,391 | ||||||
| NH Investment & Securities Co. Ltd. |
155 | 1,167 | ||||||
| Orion Corp. |
110 | 10,708 | ||||||
| Pan Ocean Co. Ltd. |
1,682 | 5,969 | ||||||
| Pearl Abyss Corp.* |
207 | 7,782 | ||||||
| POSCO Future M Co. Ltd. |
187 | 49,312 | ||||||
| POSCO Holdings, Inc. |
422 | 114,462 | ||||||
| Posco International Corp. |
404 | 9,162 | ||||||
| Samsung Biologics Co. Ltd., 144A* |
105 | 62,023 | ||||||
| Samsung C&T Corp. |
527 | 43,915 | ||||||
| Samsung Electro-Mechanics Co. Ltd. |
347 | 38,563 | ||||||
| Samsung Electronics Co. Ltd. |
26,609 | 1,431,443 | ||||||
| Samsung Engineering Co. Ltd.* |
1,026 | 21,877 | ||||||
| Samsung Fire & Marine Insurance Co. Ltd. |
176 | 29,902 | ||||||
| Samsung Heavy Industries Co. Ltd.* |
3,789 | 17,471 | ||||||
| Samsung Life Insurance Co. Ltd. |
443 | 22,129 | ||||||
| Samsung SDI Co. Ltd. |
300 | 162,290 | ||||||
| Samsung SDS Co. Ltd. |
162 | 15,172 | ||||||
| Samsung Securities Co. Ltd. |
383 | 10,605 | ||||||
| Shinhan Financial Group Co. Ltd. |
2,489 | 65,729 | ||||||
| SK Biopharmaceuticals Co. Ltd.* |
244 | 13,512 | ||||||
| SK Bioscience Co. Ltd.* |
145 | 9,057 | ||||||
| SK Hynix, Inc. |
2,979 | 243,752 | ||||||
| SK IE Technology Co. Ltd., 144A* |
142 | 9,479 | ||||||
| SK Innovation Co. Ltd.* |
325 | 46,304 | ||||||
| SK Square Co. Ltd.* |
560 | 19,472 | ||||||
| SK, Inc. |
198 | 25,033 | ||||||
| SKC Co. Ltd. |
116 | 8,294 | ||||||
| S-Oil Corp. |
293 | 15,939 | ||||||
| Woori Financial Group, Inc. |
3,004 | 27,115 | ||||||
| Yuhan Corp. |
298 | 13,314 | ||||||
|
|
|
|||||||
| (Cost $3,360,449) |
4,338,462 | |||||||
|
|
|
|||||||
| Spain — 1.6% | ||||||||
| Acciona SA |
103 | 16,658 | ||||||
| ACS Actividades de Construccion y Servicios SA (b) |
1,124 | 37,389 | ||||||
| Aena SME SA, 144A |
410 | 64,072 | ||||||
| Amadeus IT Group SA* |
2,434 | 174,054 | ||||||
| Number |
Value |
|||||||
| Spain (Continued) | ||||||||
| Banco Bilbao Vizcaya Argentaria SA |
33,187 | $ | 217,098 | |||||
| Banco Santander SA |
88,009 | 286,452 | ||||||
| Banco Santander SA |
4,119 | 13,392 | ||||||
| CaixaBank SA |
24,028 | 88,018 | ||||||
| Cellnex Telecom SA, 144A* (b) |
3,083 | 124,929 | ||||||
| Corp ACCIONA Energias Renovables |
384 | 12,773 | ||||||
| EDP Renovaveis SA |
1,637 | 32,511 | ||||||
| EDP Renovaveis SA* |
21 | 417 | ||||||
| Enagas SA |
1,497 | 28,571 | ||||||
| Endesa SA |
1,889 | 40,847 | ||||||
| Ferrovial SA |
2,736 | 84,665 | ||||||
| Grifols SA* (b) |
1,771 | 20,530 | ||||||
| Iberdrola SA |
32,093 | 391,068 | ||||||
| Industria de Diseno Textil SA |
5,954 | 199,137 | ||||||
| Naturgy Energy Group SA |
718 | 20,430 | ||||||
| Red Electrica Corp. SA |
2,098 | 35,533 | ||||||
| Repsol SA |
7,366 | 99,915 | ||||||
| Telefonica SA |
27,941 | 118,569 | ||||||
|
|
|
|||||||
| (Cost $2,103,445) |
2,107,028 | |||||||
|
|
|
|||||||
| Sweden — 1.9% | ||||||||
| Alfa Laval AB |
1,599 | 57,437 | ||||||
| Assa Abloy AB, Class B |
5,408 | 120,003 | ||||||
| Atlas Copco AB, Class A |
14,954 | 217,796 | ||||||
| Atlas Copco AB, Class B |
8,852 | 111,427 | ||||||
| Beijer Ref AB |
2,048 | 30,290 | ||||||
| Boliden AB |
1,586 | 48,296 | ||||||
| Boliden AB* |
1,586 | 1,678 | ||||||
| Embracer Group AB* (b) |
2,335 | 5,370 | ||||||
| Epiroc AB, Class A |
3,414 | 59,774 | ||||||
| Epiroc AB, Class B |
2,344 | 35,403 | ||||||
| EQT AB (b) |
1,744 | 32,962 | ||||||
| Essity AB, Class B |
3,333 | 88,579 | ||||||
| Evolution AB, 144A |
999 | 131,239 | ||||||
| Fastighets AB Balder, Class B* (b) |
3,804 | 12,774 | ||||||
| Getinge AB, Class B |
1,461 | 33,591 | ||||||
| H & M Hennes & Mauritz AB, Class B |
3,740 | 46,678 | ||||||
| Hexagon AB, Class B |
12,028 | 139,435 | ||||||
| Holmen AB, Class B (b) |
583 | 22,048 | ||||||
| Husqvarna AB, Class B |
2,481 | 18,313 | ||||||
| Industrivarden AB, Class A |
724 | 19,481 | ||||||
| Industrivarden AB, Class C |
667 | 17,831 | ||||||
| Indutrade AB |
1,510 | 35,510 | ||||||
| Investment AB Latour, Class B (b) |
881 | 17,447 | ||||||
| Investor AB, Class A |
2,660 | 54,686 | ||||||
| Investor AB, Class B |
9,912 | 201,541 | ||||||
| Kinnevik AB, Class B* |
1,369 | 19,649 | ||||||
| L E Lundbergforetagen AB, Class B (b) |
447 | 18,594 | ||||||
| Lifco AB, Class B |
1,561 | 32,955 | ||||||
| Nibe Industrier AB, Class B |
8,289 | 79,095 | ||||||
| Saab AB, Class B |
454 | 24,717 | ||||||
| Sagax AB, Class B (b) |
1,080 | 21,278 | ||||||
| Sandvik AB |
5,738 | 100,808 | ||||||
| Securitas AB, Class B (b) |
2,900 | 21,358 | ||||||
| Skandinaviska Enskilda Banken AB, Class A |
8,654 | 90,473 | ||||||
| See Notes to Financial Statements. | 36 |
DBX ETF Trust
Schedule of Investments
Xtrackers MSCI All World ex US Hedged Equity ETF (Continued)
May 31, 2023
| Number |
Value |
|||||||
| Sweden (Continued) | ||||||||
| Skanska AB, Class B |
1,879 | $ | 24,761 | |||||
| SKF AB, Class B |
2,194 | 34,754 | ||||||
| Svenska Cellulosa AB SCA, Class B |
3,569 | 47,327 | ||||||
| Svenska Handelsbanken AB, Class A (b) |
8,635 | 68,225 | ||||||
| Swedbank AB, Class A |
4,925 | 75,360 | ||||||
| Swedish Orphan Biovitrum AB* |
1,173 | 23,564 | ||||||
| Tele2 AB, Class B |
2,532 | 23,006 | ||||||
| Telefonaktiebolaget LM Ericsson, Class B |
15,613 | 80,742 | ||||||
| Telia Co. AB |
15,585 | 36,292 | ||||||
| Volvo AB, Class A |
1,038 | 20,010 | ||||||
| Volvo AB, Class B |
8,311 | 153,364 | ||||||
| Volvo Car AB, Class B* (b) |
3,804 | 13,068 | ||||||
|
|
|
|||||||
| (Cost $2,622,411) |
2,568,989 | |||||||
|
|
|
|||||||
| Switzerland — 6.9% | ||||||||
| ABB Ltd. |
8,654 | 316,039 | ||||||
| Adecco Group AG |
758 | 22,605 | ||||||
| Alcon, Inc. |
2,711 | 210,331 | ||||||
| Bachem Holding AG |
234 | 24,563 | ||||||
| Baloise Holding AG |
278 | 42,704 | ||||||
| Banque Cantonale Vaudoise (b) |
207 | 20,831 | ||||||
| Barry Callebaut AG |
22 | 44,471 | ||||||
| BKW AG |
146 | 26,178 | ||||||
| Chocoladefabriken Lindt & Spruengli AG Participation Certificates |
11 | 131,529 | ||||||
| Cie Financiere Richemont SA, Class A |
2,917 | 462,973 | ||||||
| Clariant AG* |
1,336 | 19,261 | ||||||
| Coca-Cola HBC AG* |
1,169 | 34,726 | ||||||
| DSM-Firmenich AG* |
944 | 104,981 | ||||||
| Dufry AG* |
549 | 24,817 | ||||||
| EMS-Chemie Holding AG |
46 | 35,608 | ||||||
| Geberit AG |
192 | 101,697 | ||||||
| Givaudan SA |
50 | 164,480 | ||||||
| Glencore PLC |
58,352 | 298,659 | ||||||
| Helvetia Holding AG |
227 | 32,227 | ||||||
| Holcim AG* |
3,008 | 185,418 | ||||||
| Julius Baer Group Ltd. |
1,114 | 68,057 | ||||||
| Kuehne + Nagel International AG |
289 | 82,218 | ||||||
| Logitech International SA |
852 | 54,595 | ||||||
| Lonza Group AG |
419 | 261,958 | ||||||
| Nestle SA |
15,337 | 1,817,032 | ||||||
| Novartis AG |
11,318 | 1,083,148 | ||||||
| Partners Group Holding AG |
121 | 109,050 | ||||||
| Roche Holding AG |
178 | 60,001 | ||||||
| Roche Holding AG |
3,917 | 1,239,505 | ||||||
| Schindler Holding AG |
195 | 39,096 | ||||||
| Schindler Holding AG Participation Certificates |
211 | 43,694 | ||||||
| SGS SA |
850 | 75,448 | ||||||
| SIG Group AG* |
1,938 | 52,857 | ||||||
| Sika AG |
784 | 213,830 | ||||||
| Sonova Holding AG |
305 | 78,163 | ||||||
| STMicroelectronics NV |
3,889 | 168,752 | ||||||
| Straumann Holding AG |
581 | 84,909 | ||||||
| Swatch Group AG — Bearer |
169 | 50,213 | ||||||
| Swatch Group AG — Registered |
318 | 17,842 | ||||||
| Number |
Value |
|||||||
| Switzerland (Continued) | ||||||||
| Swiss Life Holding AG |
166 | $ | 95,873 | |||||
| Swiss Prime Site AG |
504 | 42,528 | ||||||
| Swiss Re AG |
1,633 | 163,560 | ||||||
| Swisscom AG |
138 | 87,399 | ||||||
| Temenos AG |
313 | 26,373 | ||||||
| UBS Group AG |
17,488 | 331,038 | ||||||
| VAT Group AG, 144A (b) |
171 | 70,465 | ||||||
| Zurich Insurance Group AG |
829 | 387,762 | ||||||
|
|
|
|||||||
| (Cost $7,478,349) |
9,109,464 | |||||||
|
|
|
|||||||
| Taiwan — 4.3% | ||||||||
| Accton Technology Corp. |
3,744 | 43,011 | ||||||
| Acer, Inc. |
15,004 | 15,064 | ||||||
| Advantech Co. Ltd. |
2,380 | 31,524 | ||||||
| Airtac International Group |
485 | 15,658 | ||||||
| ASE Technology Holding Co. Ltd. |
16,926 | 61,419 | ||||||
| Asia Cement Corp. |
11,957 | 17,102 | ||||||
| Asustek Computer, Inc. |
3,969 | 39,396 | ||||||
| AUO Corp. |
40,692 | 23,307 | ||||||
| Catcher Technology Co. Ltd. |
3,469 | 20,942 | ||||||
| Cathay Financial Holding Co. Ltd. |
47,257 | 68,131 | ||||||
| Chailease Holding Co. Ltd. |
8,081 | 53,255 | ||||||
| Chang Hwa Commercial Bank Ltd. |
36,579 | 21,428 | ||||||
| Cheng Shin Rubber Industry Co. Ltd. |
9,594 | 12,177 | ||||||
| China Airlines Ltd. |
17,656 | 12,756 | ||||||
| China Development Financial Holding Corp. |
92,961 | 38,422 | ||||||
| China Steel Corp. |
58,594 | 55,300 | ||||||
| Chunghwa Telecom Co. Ltd. |
22,587 | 92,619 | ||||||
| Compal Electronics, Inc. |
14,125 | 12,802 | ||||||
| CTBC Financial Holding Co. Ltd. |
93,406 | 73,868 | ||||||
| Delta Electronics, Inc. |
10,562 | 108,791 | ||||||
| E Ink Holdings, Inc. |
4,643 | 31,278 | ||||||
| E.Sun Financial Holding Co. Ltd. |
71,189 | 60,005 | ||||||
| Eclat Textile Co. Ltd. |
1,129 | 17,232 | ||||||
| eMemory Technology, Inc. |
336 | 20,120 | ||||||
| Eva Airways Corp. |
15,796 | 17,453 | ||||||
| Evergreen Marine Corp. Taiwan Ltd. |
5,990 | 29,826 | ||||||
| Far Eastern New Century Corp. |
11,992 | 12,606 | ||||||
| Far EasTone Telecommunications Co. Ltd. |
9,472 | 23,643 | ||||||
| Feng TAY Enterprise Co. Ltd. |
2,227 | 13,843 | ||||||
| First Financial Holding Co. Ltd. |
71,274 | 65,179 | ||||||
| Formosa Chemicals & Fibre Corp. |
19,380 | 43,140 | ||||||
| Formosa Petrochemical Corp. |
8,746 | 24,535 | ||||||
| Formosa Plastics Corp. |
22,719 | 69,575 | ||||||
| Fubon Financial Holding Co. Ltd. |
40,062 | 79,270 | ||||||
| Giant Manufacturing Co. Ltd. |
1,596 | 10,700 | ||||||
| Globalwafers Co. Ltd. |
1,063 | 17,436 | ||||||
| Hon Hai Precision Industry Co. Ltd. |
68,266 | 236,607 | ||||||
| Hotai Motor Co. Ltd. |
1,327 | 34,765 | ||||||
| Hua Nan Financial Holdings Co. Ltd. |
42,347 | 30,664 | ||||||
| Innolux Corp. |
50,163 | 22,692 | ||||||
| Inventec Corp. |
13,870 | 16,634 | ||||||
| Largan Precision Co. Ltd. |
610 | 44,965 | ||||||
| Lite-On Technology Corp. |
12,678 | 36,721 | ||||||
| MediaTek, Inc. |
8,280 | 204,524 | ||||||
| See Notes to Financial Statements. | 37 |
DBX ETF Trust
Schedule of Investments
Xtrackers MSCI All World ex US Hedged Equity ETF (Continued)
May 31, 2023
| Number |
Value |
|||||||
| Taiwan (Continued) | ||||||||
| Mega Financial Holding Co. Ltd. |
60,712 | $ | 70,734 | |||||
| Micro-Star International Co. Ltd. |
4,501 | 24,316 | ||||||
| momo.com, Inc. |
296 | 6,733 | ||||||
| Nan Ya Plastics Corp. |
25,376 | 64,168 | ||||||
| Nan Ya Printed Circuit Board Corp. |
805 | 7,938 | ||||||
| Nanya Technology Corp. |
7,561 | 18,086 | ||||||
| Nien Made Enterprise Co. Ltd. |
1,542 | 17,689 | ||||||
| Novatek Microelectronics Corp. |
3,668 | 50,793 | ||||||
| Pegatron Corp. |
12,436 | 30,475 | ||||||
| PharmaEssentia Corp.* |
1,000 | 11,390 | ||||||
| Pou Chen Corp. |
11,351 | 11,692 | ||||||
| Powerchip Semiconductor Manufacturing Corp. |
17,656 | 17,755 | ||||||
| President Chain Store Corp. |
3,049 | 27,734 | ||||||
| Quanta Computer, Inc. |
15,017 | 56,935 | ||||||
| Realtek Semiconductor Corp. |
2,916 | 36,251 | ||||||
| Ruentex Development Co. Ltd. |
10,153 | 11,532 | ||||||
| Shanghai Commercial & Savings Bank Ltd. |
23,764 | 34,918 | ||||||
| Shin Kong Financial Holding Co. Ltd. |
87,480 | 24,541 | ||||||
| SinoPac Financial Holdings Co. Ltd. |
53,020 | 29,851 | ||||||
| Synnex Technology International Corp. |
7,230 | 15,035 | ||||||
| Taishin Financial Holding Co. Ltd. |
59,403 | 35,475 | ||||||
| Taiwan Business Bank |
34,000 | 15,602 | ||||||
| Taiwan Cement Corp. |
38,975 | 48,073 | ||||||
| Taiwan Cooperative Financial Holding Co. Ltd. |
53,818 | 48,953 | ||||||
| Taiwan High Speed Rail Corp. |
9,687 | 10,261 | ||||||
| Taiwan Mobile Co. Ltd. |
8,900 | 29,978 | ||||||
| Taiwan Semiconductor Manufacturing Co. Ltd. |
137,021 | 2,488,250 | ||||||
| Unimicron Technology Corp. |
7,427 | 43,628 | ||||||
| Uni-President Enterprises Corp. |
26,268 | 63,517 | ||||||
| United Microelectronics Corp.* |
67,321 | 113,489 | ||||||
| Vanguard International Semiconductor Corp. |
5,110 | 15,449 | ||||||
| Voltronic Power Technology Corp. |
354 | 22,350 | ||||||
| Walsin Lihwa Corp. |
15,905 | 23,914 | ||||||
| Wan Hai Lines Ltd. |
4,590 | 8,664 | ||||||
| Win Semiconductors Corp. |
1,933 | 10,034 | ||||||
| Winbond Electronics Corp. |
17,887 | 15,513 | ||||||
| Wistron Corp. |
16,000 | 34,731 | ||||||
| Wiwynn Corp. |
484 | 18,272 | ||||||
| WPG Holdings Ltd. |
9,996 | 17,306 | ||||||
| Yageo Corp. |
1,463 | 24,187 | ||||||
| Yang Ming Marine Transport Corp. |
9,989 | 19,765 | ||||||
| Yuanta Financial Holding Co. Ltd. |
50,334 | 39,068 | ||||||
| Zhen Ding Technology Holding Ltd. |
3,857 | 14,561 | ||||||
|
|
|
|||||||
| (Cost $3,590,281) |
5,709,991 | |||||||
|
|
|
|||||||
| Thailand — 0.5% | ||||||||
| Advanced Info Service PCL, NVDR |
6,500 | 39,411 | ||||||
| Airports of Thailand PCL, NVDR* |
23,700 | 48,183 | ||||||
| Asset World Corp. PCL, NVDR |
40,500 | 5,726 | ||||||
| B Grimm Power PCL, NVDR |
7,500 | 8,082 | ||||||
| Bangkok Dusit Medical Services PCL, NVDR |
60,900 | 49,437 | ||||||
| Number |
Value |
|||||||
| Thailand (Continued) | ||||||||
| Bangkok Expressway & Metro PCL, NVDR |
39,500 | $ | 9,137 | |||||
| Berli Jucker PCL, NVDR |
7,600 | 7,917 | ||||||
| BTS Group Holdings PCL, NVDR |
46,100 | 9,405 | ||||||
| Bumrungrad Hospital PCL, NVDR |
3,300 | 21,146 | ||||||
| Carabao Group PCL, NVDR |
1,900 | 3,631 | ||||||
| Central Pattana PCL, NVDR |
11,100 | 21,530 | ||||||
| Central Retail Corp. PCL, NVDR |
9,800 | 11,828 | ||||||
| Charoen Pokphand Foods PCL, NVDR |
23,600 | 13,631 | ||||||
| CP ALL PCL, NVDR |
32,500 | 59,537 | ||||||
| Delta Electronics Thailand PCL, NVDR |
14,000 | 39,828 | ||||||
| Electricity Generating PCL, NVDR |
1,600 | 6,644 | ||||||
| Energy Absolute PCL, NVDR |
9,700 | 18,118 | ||||||
| Global Power Synergy PCL, Class F |
5,600 | 9,414 | ||||||
| Gulf Energy Development PCL, NVDR |
16,510 | 23,128 | ||||||
| Home Product Center PCL, NVDR |
29,000 | 11,500 | ||||||
| Indorama Ventures PCL, NVDR |
10,200 | 9,306 | ||||||
| Intouch Holdings PCL, NVDR |
6,400 | 13,747 | ||||||
| Krung Thai Bank PCL, NVDR |
26,200 | 14,305 | ||||||
| Krungthai Card PCL, NVDR |
5,800 | 8,500 | ||||||
| Land & Houses PCL, NVDR |
53,300 | 13,019 | ||||||
| Minor International PCL, NVDR |
19,194 | 18,615 | ||||||
| Osotspa PCL, NVDR |
11,300 | 9,417 | ||||||
| PTT Exploration & Production PCL, NVDR |
7,700 | 30,866 | ||||||
| PTT Global Chemical PCL, NVDR |
16,900 | 17,118 | ||||||
| PTT Oil & Retail Business PCL, NVDR |
16,400 | 9,425 | ||||||
| PTT PCL, NVDR |
53,600 | 46,207 | ||||||
| Ratch Group PCL, NVDR |
5,300 | 5,521 | ||||||
| SCB X PCL, NVDR |
4,600 | 13,681 | ||||||
| SCG Packaging PCL, NVDR |
7,900 | 8,910 | ||||||
| Siam Cement PCL |
700 | 6,417 | ||||||
| Siam Cement PCL, NVDR |
3,300 | 30,250 | ||||||
| Srisawad Corp. PCL, NVDR |
5,200 | 8,330 | ||||||
| Thai Oil PCL, NVDR |
6,675 | 8,296 | ||||||
| True Corp. PCL, NVDR. |
39,012 | 7,679 | ||||||
|
|
|
|||||||
| (Cost $747,498) |
696,842 | |||||||
|
|
|
|||||||
| Turkey — 0.2% | ||||||||
| Akbank TAS |
23,169 | 17,653 | ||||||
| Aselsan Elektronik Sanayi Ve Ticaret AS |
2,864 | 6,560 | ||||||
| BIM Birlesik Magazalar AS |
2,466 | 16,767 | ||||||
| Eregli Demir ve Celik Fabrikalari TAS* |
8,429 | 13,430 | ||||||
| Ford Otomotiv Sanayi AS |
286 | 7,905 | ||||||
| Haci Omer Sabanci Holding AS |
6,969 | 12,972 | ||||||
| Hektas Ticaret TAS* |
7,870 | 10,573 | ||||||
| KOC Holding AS |
5,007 | 19,027 | ||||||
| Koza Altin Isletmeleri AS |
8,882 | 9,860 | ||||||
| Sasa Polyester Sanayi AS* |
6,862 | 17,869 | ||||||
| Tofas Turk Otomobil Fabrikasi AS |
1,142 | 11,813 | ||||||
| Turk Hava Yollari AO* |
3,472 | 24,077 | ||||||
| Turkcell Iletisim Hizmetleri AS |
5,784 | 9,344 | ||||||
| Turkiye Is Bankasi AS, Class C |
11,035 | 5,933 | ||||||
| Turkiye Petrol Rafinerileri AS |
6,832 | 22,074 | ||||||
| Turkiye Sise ve Cam Fabrikalari AS |
4,429 | 8,620 | ||||||
| Yapi ve Kredi Bankasi AS |
22,378 | 11,007 | ||||||
|
|
|
|||||||
| (Cost $217,229) |
225,484 | |||||||
|
|
|
|||||||
| See Notes to Financial Statements. | 38 |
DBX ETF Trust
Schedule of Investments
Xtrackers MSCI All World ex US Hedged Equity ETF (Continued)
May 31, 2023
| Number |
Value |
|||||||
| United Arab Emirates — 0.4% | ||||||||
| Abu Dhabi Commercial Bank PJSC |
18,116 | $ | 39,409 | |||||
| Abu Dhabi Islamic Bank PJSC |
10,861 | 29,570 | ||||||
| Abu Dhabi National Oil Co. for Distribution PJSC |
15,036 | 16,948 | ||||||
| Aldar Properties PJSC |
16,216 | 22,516 | ||||||
| Americana Restaurants International PLC |
14,047 | 15,833 | ||||||
| Dubai Islamic Bank PJSC |
16,344 | 23,406 | ||||||
| Emaar Properties PJSC |
39,319 | 65,836 | ||||||
| Emirates NBD Bank PJSC |
10,460 | 38,873 | ||||||
| Emirates Telecommunications Group Co. PJSC |
20,113 | 126,386 | ||||||
| First Abu Dhabi Bank PJSC |
23,011 | 79,565 | ||||||
| Multiply Group PJSC* |
20,274 | 18,271 | ||||||
|
|
|
|||||||
| (Cost $463,239) |
476,613 | |||||||
|
|
|
|||||||
| United Kingdom — 8.8% | ||||||||
| 3i Group PLC |
5,366 | 130,530 | ||||||
| abrdn PLC |
13,145 | 32,458 | ||||||
| Admiral Group PLC |
1,166 | 33,723 | ||||||
| Anglo American PLC |
7,224 | 199,810 | ||||||
| Ashtead Group PLC |
2,403 | 146,472 | ||||||
| Associated British Foods PLC |
2,140 | 48,596 | ||||||
| AstraZeneca PLC |
8,637 | 1,252,751 | ||||||
| Auto Trader Group PLC, 144A |
5,490 | 43,025 | ||||||
| Aviva PLC |
14,976 | 73,437 | ||||||
| BAE Systems PLC |
16,843 | 194,475 | ||||||
| Barclays PLC |
85,947 | 161,803 | ||||||
| Barratt Developments PLC |
6,381 | 36,735 | ||||||
| Berkeley Group Holdings PLC |
484 | 23,637 | ||||||
| BP PLC |
98,365 | 554,663 | ||||||
| British American Tobacco PLC |
11,718 | 372,360 | ||||||
| British Land Co. PLC REIT |
5,264 | 22,460 | ||||||
| BT Group PLC (b) |
37,228 | 68,006 | ||||||
| Bunzl PLC |
1,995 | 78,024 | ||||||
| Burberry Group PLC |
2,061 | 55,224 | ||||||
| Centrica PLC |
32,682 | 47,830 | ||||||
| CNH Industrial NV |
5,957 | 76,091 | ||||||
| Coca-Cola Europacific Partners PLC |
1,222 | 76,241 | ||||||
| Compass Group PLC |
9,614 | 263,345 | ||||||
| Croda International PLC |
745 | 56,531 | ||||||
| Diageo PLC |
12,559 | 522,894 | ||||||
| Endeavour Mining PLC |
1,007 | 26,957 | ||||||
| Entain PLC |
3,732 | 61,234 | ||||||
| GSK PLC |
22,819 | 382,185 | ||||||
| Haleon PLC |
28,878 | 114,306 | ||||||
| Halma PLC |
2,022 | 60,593 | ||||||
| Hargreaves Lansdown PLC |
1,594 | 15,907 | ||||||
| HSBC Holdings PLC |
111,273 | 817,359 | ||||||
| Imperial Brands PLC |
4,925 | 103,843 | ||||||
| Informa PLC |
7,613 | 66,007 | ||||||
| InterContinental Hotels Group PLC |
961 | 62,976 | ||||||
| Intertek Group PLC |
797 | 41,184 | ||||||
| J Sainsbury PLC |
10,437 | 35,132 | ||||||
| JD Sports Fashion PLC |
14,680 | 27,757 | ||||||
| Johnson Matthey PLC |
1,149 | 24,727 | ||||||
| Kingfisher PLC |
12,104 | 34,781 | ||||||
| Number |
Value |
|||||||
| United Kingdom (Continued) | ||||||||
| Land Securities Group PLC REIT |
4,100 | $ | 30,703 | |||||
| Legal & General Group PLC |
32,673 | 92,708 | ||||||
| Lloyds Banking Group PLC |
368,924 | 202,706 | ||||||
| London Stock Exchange Group PLC |
2,205 | 234,519 | ||||||
| M&G PLC |
15,895 | 39,189 | ||||||
| Mondi PLC |
2,637 | 40,840 | ||||||
| National Grid PLC |
20,130 | 276,950 | ||||||
| NatWest Group PLC |
30,561 | 98,691 | ||||||
| Next PLC |
669 | 52,812 | ||||||
| Ocado Group PLC* (b) |
3,430 | 15,744 | ||||||
| Pearson PLC |
3,601 | 35,755 | ||||||
| Pepco Group NV* |
1,528 | 14,431 | ||||||
| Persimmon PLC |
1,508 | 22,539 | ||||||
| Phoenix Group Holdings PLC |
3,787 | 26,023 | ||||||
| Reckitt Benckiser Group PLC |
4,048 | 314,518 | ||||||
| RELX PLC |
10,569 | 329,998 | ||||||
| Rentokil Initial PLC |
13,914 | 110,531 | ||||||
| Rio Tinto PLC |
6,206 | 369,168 | ||||||
| Rolls-Royce Holdings PLC* |
49,768 | 88,716 | ||||||
| Sage Group PLC |
6,024 | 65,269 | ||||||
| Schroders PLC |
4,182 | 23,701 | ||||||
| Segro PLC REIT |
6,475 | 64,243 | ||||||
| Severn Trent PLC |
1,382 | 47,672 | ||||||
| Shell PLC |
38,779 | 1,071,151 | ||||||
| Smith & Nephew PLC |
5,139 | 76,840 | ||||||
| Smiths Group PLC |
1,747 | 34,901 | ||||||
| Spirax-Sarco Engineering PLC |
402 | 54,632 | ||||||
| SSE PLC |
5,856 | 137,059 | ||||||
| St James’s Place PLC |
3,356 | 46,548 | ||||||
| Standard Chartered PLC |
13,426 | 105,819 | ||||||
| Taylor Wimpey PLC |
22,278 | 31,648 | ||||||
| Tesco PLC |
40,228 | 130,509 | ||||||
| Unilever PLC |
14,118 | 707,577 | ||||||
| United Utilities Group PLC |
3,769 | 47,471 | ||||||
| Vodafone Group PLC |
124,990 | 118,741 | ||||||
| Whitbread PLC |
1,047 | 42,797 | ||||||
| Wise PLC, Class A* |
3,842 | 27,739 | ||||||
| WPP PLC |
5,853 | 62,164 | ||||||
|
|
|
|||||||
| (Cost $11,667,642) |
11,739,091 | |||||||
|
|
|
|||||||
| United States — 0.1% | ||||||||
| BeiGene Ltd.* |
3,831 | 65,167 | ||||||
| Brookfield Renewable Corp. |
777 | 26,078 | ||||||
| Legend Biotech Corp., ADR* |
287 | 18,417 | ||||||
| Southern Copper Corp. |
439 | 29,312 | ||||||
|
|
|
|||||||
| (Cost $126,907) |
138,974 | |||||||
|
|
|
|||||||
| TOTAL COMMON STOCKS |
127,780,769 | |||||||
|
|
|
|||||||
| PREFERRED STOCKS — 0.9% | ||||||||
| Brazil — 0.4% | ||||||||
| Banco Bradesco SA |
30,057 | 91,890 | ||||||
| Centrais Eletricas Brasileiras SA, Class B |
2,074 | 16,107 | ||||||
| Cia Energetica de Minas Gerais |
7,925 | 18,276 | ||||||
| Gerdau SA |
6,582 | 31,098 | ||||||
| Itau Unibanco Holding SA |
25,620 | 132,966 | ||||||
| See Notes to Financial Statements. | 39 |
DBX ETF Trust
Schedule of Investments
Xtrackers MSCI All World ex US Hedged Equity ETF (Continued)
May 31, 2023
| Number |
Value |
|||||||
| Brazil (Continued) | ||||||||
| Itausa SA |
28,228 | $ | 48,852 | |||||
| Petroleo Brasileiro SA |
26,172 | 134,747 | ||||||
|
|
|
|||||||
| (Cost $425,767) |
473,936 | |||||||
|
|
|
|||||||
| Chile — 0.0% | ||||||||
| Sociedad Quimica y Minera de Chile SA, Class B |
805 | 51,878 | ||||||
|
|
|
|||||||
| Colombia — 0.0% | ||||||||
| Bancolombia SA |
2,686 | 15,669 | ||||||
|
|
|
|||||||
| Germany — 0.3% | ||||||||
| Bayerische Motoren Werke AG |
329 | 33,813 | ||||||
| Dr Ing hc F Porsche AG, 144A* |
607 | 75,361 | ||||||
| Henkel AG & Co. KGaA |
967 | 77,046 | ||||||
| Porsche Automobil Holding SE* |
817 | 45,324 | ||||||
| Sartorius AG (b) |
157 | 52,611 | ||||||
| Volkswagen AG |
1,137 | 141,684 | ||||||
|
|
|
|||||||
| (Cost $484,994) |
425,839 | |||||||
|
|
|
|||||||
| Russia — 0.0% | ||||||||
| Surgutneftegas PJSC* (c) |
41,062 | 0 | ||||||
|
|
|
|||||||
| South Korea — 0.2% | ||||||||
| Hyundai Motor Co. |
104 | 8,259 | ||||||
| Hyundai Motor Co. — 2nd Preferred |
228 | 18,123 | ||||||
| LG Chem Ltd. |
44 | 11,968 | ||||||
| Samsung Electronics Co. Ltd. |
4,523 | 199,697 | ||||||
|
|
|
|||||||
| (Cost $142,755) |
238,047 | |||||||
|
|
|
|||||||
| TOTAL PREFERRED STOCKS |
1,205,369 | |||||||
|
|
|
|||||||
| Principal |
||||||||
| CORPORATE BONDS — 0.0% | ||||||||
| India — 0.0% | ||||||||
| Britannia Industries Ltd. |
||||||||
| (Cost $0) |
INR 17,168 | 203 | ||||||
|
|
|
|||||||
| Number of |
||||||||
| WARRANTS — 0.0% | ||||||||
| Switzerland — 0.0% | ||||||||
| Cie Financiere Richemont SA*, (Cost $0) |
4,502 | 5,561 | ||||||
|
|
|
|||||||
| Thailand — 0.0% | ||||||||
| BTS Group Holdings PCL*, |
3,960 | 10 | ||||||
| BTS Group Holdings PCL*, |
7,920 | 30 | ||||||
|
|
|
|||||||
| (Cost $0) |
40 | |||||||
|
|
|
|||||||
| TOTAL WARRANTS |
5,601 | |||||||
|
|
|
|||||||
| Number |
value |
|||||||
| SECURITIES LENDING COLLATERAL — 2.2% | ||||||||
| DWS Government & Agency Securities Portfolio “DWS Government Cash Institutional Shares”,
5.03% (e)(f) |
2,996,484 | $ | 2,996,484 | |||||
|
|
|
|||||||
| CASH EQUIVALENTS — 1.8% | ||||||||
| DWS Government Money Market Series “Institutional Shares”, 5.04% (e) |
2,327,718 | 2,327,718 | ||||||
|
|
|
|||||||
| TOTAL INVESTMENTS — 101.1% |
$ | 134,316,144 | ||||||
| Other assets and liabilities, net — (1.1%) |
(1,417,111 | ) | ||||||
|
|
|
|||||||
| NET ASSETS — 100.0% |
$ | 132,899,033 | ||||||
|
|
|
|||||||
| See Notes to Financial Statements. | 40 |
DBX ETF Trust
Schedule of Investments
Xtrackers MSCI All World ex US Hedged Equity ETF (Continued)
May 31, 2023
A summary of the Fund’s transactions with affiliated investments during the year ended May 31, 2023 is as follows:
| Value ($) at 5/31/2022 |
Purchases Cost ($) |
Sales Proceeds ($) |
Net Realized Gain/(Loss) ($) |
Net Change in Unrealized Appreciation (Depreciation) ($) |
Income ($) | Capital Gain Distributions ($) |
Number of Shares at 5/31/2023 |
Value ($) at 5/31/2023 |
||||||||||||||||||||||||||||
| COMMON STOCKS — 0.1% |
|
|||||||||||||||||||||||||||||||||||
| Germany — 0.1% |
|
|||||||||||||||||||||||||||||||||||
| Deutsche Bank AG |
|
|||||||||||||||||||||||||||||||||||
| 146,908 | 10,665 | (36,670 | ) | (18,306 | ) | 10,391 | 3,605 | — | 11,155 | 112,988 | ||||||||||||||||||||||||||
| SECURITIES LENDING COLLATERAL — 2.2% |
|
|||||||||||||||||||||||||||||||||||
| DWS Government & Agency Securities Portfolio “DWS Government Cash Institutional Shares”, 5.03% (e)(f) |
|
|||||||||||||||||||||||||||||||||||
| 2,880,589 | 115,895 | (g) | — | — | — | 24,460 | — | 2,996,484 | 2,996,484 | |||||||||||||||||||||||||||
| CASH EQUIVALENTS — 1.8% |
|
|||||||||||||||||||||||||||||||||||
| DWS Government Money Market Series “Institutional Shares”, 5.04% (e) |
|
|||||||||||||||||||||||||||||||||||
| — | 59,942,595 | (57,614,877 | ) | — | — | 91,329 | — | 2,327,718 | 2,327,718 | |||||||||||||||||||||||||||
|
|
|
|
|
|
|
|
|
|
|
|
|
|
|
|
|
|
|
|||||||||||||||||||
| 3,027,497 | 60,069,155 | (57,651,547 | ) | (18,306 | ) | 10,391 | 119,394 | — | 5,335,357 | 5,437,190 | ||||||||||||||||||||||||||
|
|
|
|
|
|
|
|
|
|
|
|
|
|
|
|
|
|
|
|||||||||||||||||||
| * | Non-income producing security. |
| (a) | Stapled Security — A security contractually bound to one or more other securities to form a single saleable unit which cannot be sold separately. |
| (b) | All or a portion of these securities were on loan. In addition, “Other assets and liabilities, net” may include pending sales that are also on loan. The value of securities loaned at May 31, 2023 amounted to $4,764,797, which is 3.6% of net assets. |
| (c) | Investment was valued using significant unobservable inputs |
| (d) | Affiliated issuer. This security is owned in proportion with its representation in the index |
| (e) | Affiliated fund managed by DWS Investment Management Americas, Inc. The rate shown is the annualized seven-day yield at period end. |
| (f) | Represents cash collateral held in connection with securities lending. Income earned by the Fund is net of borrower rebates. In addition, the Fund held non-cash U.S. Treasury securities collateral having a value of $2,372,391. |
| (g) | Represents the net increase (purchase cost) or decrease (sales proceeds) in the amount invested in cash collateral for the year ended May 31, 2023. |
| ADR: | American Depositary Receipt |
| CDI: | Chess Depositary Interests |
| CPO: | Ordinary Participation Certificates |
| CVA: | Credit Valuation Adjustment |
| GDR: | Global Depositary Receipt |
| JSC: | Joint Stock Company |
| KSC: | Kuwait Shareholding Company |
| KSCP: | Kuwait Shareholding Company Public |
| NVDR: | Non Voting Depositary Receipt |
| PJSC: | Public Joint Stock Company |
| PSQC: | Public Shareholders Qatari Company |
| QPSC: | Qatari Public Shareholders Company |
| QSC: | Qatari Shareholders Company |
| REIT: | Real Estate Investment Trust |
| SAE: | Societe Anonyme Egyptienne |
| SAQ: | Societe Anonyme Qatar |
| 144A: | Security exempt from registration under Rule 144A of the Securities Act of 1933. These securities may be resold in transactions exempt from registration, normally to qualified institutional buyers. |
Securities are listed in country of domicile.
| See Notes to Financial Statements. | 41 |
DBX ETF Trust
Schedule of Investments
Xtrackers MSCI All World ex US Hedged Equity ETF (Continued)
May 31, 2023
At May 31, 2023, open futures contracts purchased were as follows:
| Contract Description |
Currency | Number of Contracts |
Notional Amount |
Contract Value |
Expiration Date |
Unrealized Appreciation (Depreciation) |
||||||||||||
| MSCI EAFE Futures |
USD | 25 | $ | 2,564,170 | $ | 2,566,750 | 6/16/2023 | $ | 2,580 | |||||||||
| MSCI Emerging Markets Index Future |
USD | 24 | 1,158,770 | 1,148,160 | 6/16/2023 | (10,610 | ) | |||||||||||
| MINI S&P/TSX 60 Futures |
CAD | 9 | 393,706 | 390,033 | 6/15/2023 | (3,673 | ) | |||||||||||
|
|
|
|||||||||||||||||
| Total net unrealized depreciation |
$ | (11,703 | ) | |||||||||||||||
|
|
|
|||||||||||||||||
As of May 31, 2023, the Fund had the following forward foreign currency contracts outstanding:
| Counterparty |
Settlement Date |
Currency To Deliver |
Currency To Receive |
Unrealized Appreciation |
Unrealized Depreciation |
|||||||||||||||||
| Goldman Sachs & Co. |
6/2/2023 | AED | 1,747,000 | USD | 475,672 | $ | 32 | $ | — | |||||||||||||
| Goldman Sachs & Co. |
6/2/2023 | AUD | 243,000 | USD | 160,797 | 2,738 | — | |||||||||||||||
| Goldman Sachs & Co. |
6/2/2023 | AUD | 3,809,400 | USD | 2,520,775 | 42,950 | — | |||||||||||||||
| JP Morgan & Chase Co. |
6/2/2023 | AUD | 2,368,800 | USD | 1,567,435 | 26,648 | — | |||||||||||||||
| RBC Capital Markets |
6/2/2023 | AUD | 3,334,000 | USD | 2,206,183 | 37,582 | — | |||||||||||||||
| Goldman Sachs & Co. |
6/2/2023 | CAD | 410,000 | USD | 302,474 | 448 | — | |||||||||||||||
| Goldman Sachs & Co. |
6/2/2023 | CAD | 5,081,800 | USD | 3,749,105 | 5,606 | — | |||||||||||||||
| JP Morgan & Chase Co. |
6/2/2023 | CAD | 3,506,200 | USD | 2,586,685 | 3,849 | — | |||||||||||||||
| RBC Capital Markets |
6/2/2023 | CAD | 4,879,500 | USD | 3,599,779 | 5,304 | — | |||||||||||||||
| Goldman Sachs & Co. |
6/2/2023 | CHF | 269,000 | USD | 303,265 | 7,904 | — | |||||||||||||||
| Goldman Sachs & Co. |
6/2/2023 | CHF | 3,410,000 | USD | 3,844,419 | 100,252 | — | |||||||||||||||
| JP Morgan & Chase Co. |
6/2/2023 | CHF | 1,742,900 | USD | 1,964,883 | 51,185 | — | |||||||||||||||
| RBC Capital Markets |
6/2/2023 | CHF | 2,724,800 | USD | 3,071,841 | 80,021 | — | |||||||||||||||
| JP Morgan & Chase Co. |
6/2/2023 | CNH | 8,596,400 | USD | 1,244,367 | 36,541 | — | |||||||||||||||
| RBC Capital Markets |
6/2/2023 | CNH | 4,319,800 | USD | 625,310 | 18,362 | — | |||||||||||||||
| Goldman Sachs & Co. |
6/2/2023 | CZK | 1,029,400 | USD | 48,331 | 1,950 | — | |||||||||||||||
| JP Morgan & Chase Co. |
6/2/2023 | CZK | 707,000 | USD | 33,194 | 1,339 | — | |||||||||||||||
| JP Morgan & Chase Co. |
6/2/2023 | DKK | 491,000 | USD | 72,868 | 2,390 | — | |||||||||||||||
| JP Morgan & Chase Co. |
6/2/2023 | DKK | 6,622,600 | USD | 982,859 | 32,244 | — | |||||||||||||||
| RBC Capital Markets |
6/2/2023 | DKK | 11,480,100 | USD | 1,703,911 | 56,046 | — | |||||||||||||||
| Goldman Sachs & Co. |
6/2/2023 | EUR | 10,757,800 | USD | 11,897,051 | 398,030 | — | |||||||||||||||
| Goldman Sachs & Co. |
6/2/2023 | EUR | 531,000 | USD | 587,224 | 19,638 | — | |||||||||||||||
| JP Morgan & Chase Co. |
6/2/2023 | EUR | 5,856,400 | USD | 6,476,827 | 216,916 | — | |||||||||||||||
| RBC Capital Markets |
6/2/2023 | EUR | 10,157,900 | USD | 11,234,130 | 376,342 | — | |||||||||||||||
| Goldman Sachs & Co. |
6/2/2023 | GBP | 294,000 | USD | 369,764 | 4,043 | — | |||||||||||||||
| Goldman Sachs & Co. |
6/2/2023 | GBP | 4,524,700 | USD | 5,690,828 | 62,325 | — | |||||||||||||||
| JP Morgan & Chase Co. |
6/2/2023 | GBP | 2,949,900 | USD | 3,710,148 | 40,619 | — | |||||||||||||||
| RBC Capital Markets |
6/2/2023 | GBP | 2,934,300 | USD | 3,690,528 | 40,404 | — | |||||||||||||||
| Goldman Sachs & Co. |
6/2/2023 | HKD | 35,966,100 | USD | 4,587,513 | — | (5,595 | ) | ||||||||||||||
| JP Morgan & Chase Co. |
6/2/2023 | HKD | 17,657,700 | USD | 2,252,355 | — | (2,649 | ) | ||||||||||||||
| RBC Capital Markets |
6/2/2023 | HKD | 35,290,800 | USD | 4,501,573 | — | (5,295 | ) | ||||||||||||||
| Goldman Sachs & Co. |
6/2/2023 | HUF | 14,453,900 | USD | 42,353 | 656 | — | |||||||||||||||
| JP Morgan & Chase Co. |
6/2/2023 | HUF | 11,896,900 | USD | 34,860 | 540 | — | |||||||||||||||
| Goldman Sachs & Co. |
6/2/2023 | ILS | 476,100 | USD | 131,032 | 3,445 | — | |||||||||||||||
| JP Morgan & Chase Co. |
6/2/2023 | ILS | 323,700 | USD | 89,094 | 2,347 | — | |||||||||||||||
| RBC Capital Markets |
6/2/2023 | ILS | 603,000 | USD | 165,967 | 4,372 | — | |||||||||||||||
| Goldman Sachs & Co. |
6/2/2023 | JPY | 78,511,000 | USD | 579,259 | 15,749 | — | |||||||||||||||
| Goldman Sachs & Co. |
6/2/2023 | JPY | 805,999,300 | USD | 5,946,798 | 161,768 | — | |||||||||||||||
| JP Morgan & Chase Co. |
6/2/2023 | JPY | 846,901,300 | USD | 6,248,603 | 170,001 | — | |||||||||||||||
| RBC Capital Markets |
6/2/2023 | JPY | 799,509,100 | USD | 5,898,912 | 160,466 | — | |||||||||||||||
| Goldman Sachs & Co. |
6/2/2023 | MXN | 9,002,600 | USD | 495,956 | — | (12,981 | ) | ||||||||||||||
| JP Morgan & Chase Co. |
6/2/2023 | MXN | 5,830,800 | USD | 321,221 | — | (8,408 | ) | ||||||||||||||
| RBC Capital Markets |
6/2/2023 | MXN | 3,211,600 | USD | 176,928 | — | (4,631 | ) | ||||||||||||||
| Goldman Sachs & Co. |
6/2/2023 | NOK | 5,299,200 | USD | 496,408 | 19,011 | — | |||||||||||||||
| JP Morgan & Chase Co. |
6/2/2023 | NOK | 645,500 | USD | 60,468 | 2,316 | — | |||||||||||||||
| See Notes to Financial Statements. | 42 |
DBX ETF Trust
Schedule of Investments
Xtrackers MSCI All World ex US Hedged Equity ETF (Continued)
May 31, 2023
| Counterparty |
Settlement Date |
Currency To Deliver |
Currency To Receive |
Unrealized Appreciation |
Unrealized Depreciation |
|||||||||||||||||||||||
| JP Morgan & Chase Co. |
6/2/2023 | NZD | 58,300 | USD | 36,006 | $ | 892 | $ | — | |||||||||||||||||||
| RBC Capital Markets |
6/2/2023 | NZD | 220,300 | USD | 136,058 | 3,371 | — | |||||||||||||||||||||
| JP Morgan & Chase Co. |
6/2/2023 | PHP | 1,433,200 | USD | 25,842 | 322 | — | |||||||||||||||||||||
| RBC Capital Markets |
6/2/2023 | PHP | 13,104,400 | USD | 236,371 | 3,030 | — | |||||||||||||||||||||
| Goldman Sachs & Co. |
6/2/2023 | PLN | 1,103,200 | USD | 265,415 | 4,932 | — | |||||||||||||||||||||
| JP Morgan & Chase Co. |
6/2/2023 | PLN | 89,400 | USD | 21,510 | 401 | — | |||||||||||||||||||||
| JP Morgan & Chase Co. |
6/2/2023 | SEK | 16,350,800 | USD | 1,596,430 | 89,694 | — | |||||||||||||||||||||
| JP Morgan & Chase Co. |
6/2/2023 | SEK | 1,063,000 | USD | 103,787 | 5,831 | — | |||||||||||||||||||||
| RBC Capital Markets |
6/2/2023 | SEK | 13,282,600 | USD | 1,296,952 | 72,952 | — | |||||||||||||||||||||
| JP Morgan & Chase Co. |
6/2/2023 | THB | 27,181,600 | USD | 799,106 | 18,026 | — | |||||||||||||||||||||
| JP Morgan & Chase Co. |
6/2/2023 | TRY | 4,409,500 | USD | 205,110 | — | (7,530 | ) | ||||||||||||||||||||
| Goldman Sachs & Co. |
6/2/2023 | USD | 475,633 | AED | 1,747,000 | 6 | — | |||||||||||||||||||||
| Goldman Sachs & Co. |
6/2/2023 | USD | 2,622,511 | AUD | 4,052,400 | 13,374 | — | |||||||||||||||||||||
| JP Morgan & Chase Co. |
6/2/2023 | USD | 1,532,969 | AUD | 2,368,800 | 7,818 | — | |||||||||||||||||||||
| RBC Capital Markets |
6/2/2023 | USD | 2,157,598 | AUD | 3,334,000 | 11,003 | — | |||||||||||||||||||||
| Goldman Sachs & Co. |
6/2/2023 | USD | 4,040,227 | CAD | 5,491,800 | 5,298 | — | |||||||||||||||||||||
| JP Morgan & Chase Co. |
6/2/2023 | USD | 2,579,416 | CAD | 3,506,200 | 3,420 | — | |||||||||||||||||||||
| RBC Capital Markets |
6/2/2023 | USD | 3,589,795 | CAD | 4,879,500 | 4,681 | — | |||||||||||||||||||||
| Goldman Sachs & Co. |
6/2/2023 | USD | 4,024,504 | CHF | 3,679,000 | 15,024 | — | |||||||||||||||||||||
| JP Morgan & Chase Co. |
6/2/2023 | USD | 1,906,580 | CHF | 1,742,900 | 7,118 | — | |||||||||||||||||||||
| RBC Capital Markets |
6/2/2023 | USD | 2,980,692 | CHF | 2,724,800 | 11,127 | — | |||||||||||||||||||||
| JP Morgan & Chase Co. |
6/2/2023 | USD | 1,206,377 | CNH | 8,596,400 | 1,449 | — | |||||||||||||||||||||
| RBC Capital Markets |
6/2/2023 | USD | 606,220 | CNH | 4,319,800 | 728 | — | |||||||||||||||||||||
| Goldman Sachs & Co. |
6/2/2023 | USD | 46,174 | CZK | 1,029,400 | 206 | — | |||||||||||||||||||||
| JP Morgan & Chase Co. |
6/2/2023 | USD | 31,713 | CZK | 707,000 | 142 | — | |||||||||||||||||||||
| JP Morgan & Chase Co. |
6/2/2023 | USD | 1,018,382 | DKK | 7,113,600 | 2,712 | — | |||||||||||||||||||||
| RBC Capital Markets |
6/2/2023 | USD | 1,643,489 | DKK | 11,480,100 | 4,376 | — | |||||||||||||||||||||
| Goldman Sachs & Co. |
6/2/2023 | USD | 12,034,990 | EUR | 11,288,800 | 31,618 | — | |||||||||||||||||||||
| JP Morgan & Chase Co. |
6/2/2023 | USD | 6,243,508 | EUR | 5,856,400 | 16,403 | — | |||||||||||||||||||||
| RBC Capital Markets |
6/2/2023 | USD | 10,829,337 | EUR | 10,157,900 | 28,450 | — | |||||||||||||||||||||
| Goldman Sachs & Co. |
6/2/2023 | USD | 5,972,297 | GBP | 4,818,700 | 21,928 | — | |||||||||||||||||||||
| JP Morgan & Chase Co. |
6/2/2023 | USD | 3,656,106 | GBP | 2,949,900 | 13,424 | — | |||||||||||||||||||||
| RBC Capital Markets |
6/2/2023 | USD | 3,636,771 | GBP | 2,934,300 | 13,353 | — | |||||||||||||||||||||
| Goldman Sachs & Co. |
6/2/2023 | USD | 4,156,881 | HKD | 32,541,100 | — | (1,168 | ) | ||||||||||||||||||||
| Goldman Sachs & Co. |
6/2/2023 | USD | 436,901 | HKD | 3,425,000 | 494 | — | |||||||||||||||||||||
| JP Morgan & Chase Co. |
6/2/2023 | USD | 2,255,638 | HKD | 17,657,700 | — | (634 | ) | ||||||||||||||||||||
| RBC Capital Markets |
6/2/2023 | USD | 4,502,383 | HKD | 35,290,800 | 4,485 | — | |||||||||||||||||||||
| Goldman Sachs & Co. |
6/2/2023 | USD | 41,560 | HUF | 14,453,900 | 137 | — | |||||||||||||||||||||
| JP Morgan & Chase Co. |
6/2/2023 | USD | 34,207 | HUF | 11,896,900 | 113 | — | |||||||||||||||||||||
| Goldman Sachs & Co. |
6/2/2023 | USD | 127,472 | ILS | 476,100 | 116 | — | |||||||||||||||||||||
| JP Morgan & Chase Co. |
6/2/2023 | USD | 86,668 | ILS | 323,700 | 79 | — | |||||||||||||||||||||
| RBC Capital Markets |
6/2/2023 | USD | 161,448 | ILS | 603,000 | 147 | — | |||||||||||||||||||||
| Goldman Sachs & Co. |
6/2/2023 | USD | 6,330,818 | JPY | 884,510,300 | 17,721 | — | |||||||||||||||||||||
| JP Morgan & Chase Co. |
6/2/2023 | USD | 6,061,635 | JPY | 846,901,300 | 16,968 | — | |||||||||||||||||||||
| RBC Capital Markets |
6/2/2023 | USD | 5,722,429 | JPY | 799,509,100 | 16,018 | — | |||||||||||||||||||||
| Goldman Sachs & Co. |
6/2/2023 | USD | 506,953 | MXN | 9,002,600 | 1,985 | — | |||||||||||||||||||||
| JP Morgan & Chase Co. |
6/2/2023 | USD | 328,343 | MXN | 5,830,800 | 1,285 | — | |||||||||||||||||||||
| RBC Capital Markets |
6/2/2023 | USD | 180,851 | MXN | 3,211,600 | 708 | — | |||||||||||||||||||||
| RBC Capital Markets |
6/2/2023 | USD | 475,565 | NOK | 5,299,200 | 1,832 | — | |||||||||||||||||||||
| RBC Capital Markets |
6/2/2023 | USD | 57,929 | NOK | 645,500 | 223 | — | |||||||||||||||||||||
| Goldman Sachs & Co. |
6/2/2023 | USD | 34,942 | NZD | 58,300 | 172 | — | |||||||||||||||||||||
| Goldman Sachs & Co. |
6/2/2023 | USD | 132,037 | NZD | 220,300 | 650 | — | |||||||||||||||||||||
| JP Morgan & Chase Co. |
6/2/2023 | USD | 25,510 | PHP | 1,433,200 | 10 | — | |||||||||||||||||||||
| RBC Capital Markets |
6/2/2023 | USD | 233,174 | PHP | 13,104,400 | 166 | — | |||||||||||||||||||||
| Goldman Sachs & Co. |
6/2/2023 | USD | 259,378 | PLN | 1,103,200 | 1,105 | — | |||||||||||||||||||||
| JP Morgan & Chase Co. |
6/2/2023 | USD | 21,019 | PLN | 89,400 | 90 | — | |||||||||||||||||||||
| JP Morgan & Chase Co. |
6/2/2023 | USD | 1,600,004 | SEK | 17,413,800 | 4,689 | — | |||||||||||||||||||||
| See Notes to Financial Statements. | 43 |
DBX ETF Trust
Schedule of Investments
Xtrackers MSCI All World ex US Hedged Equity ETF (Continued)
May 31, 2023
| Counterparty |
Settlement Date |
Currency To Deliver |
Currency To Receive |
Unrealized Appreciation |
Unrealized Depreciation |
|||||||||||||||||
| RBC Capital Markets |
6/2/2023 | USD | 1,220,423 | SEK | 13,282,600 | $ | 3,576 | $ | — | |||||||||||||
| JP Morgan & Chase Co. |
6/2/2023 | USD | 782,655 | THB | 27,181,600 | — | (1,574 | ) | ||||||||||||||
| JP Morgan & Chase Co. |
6/2/2023 | USD | 213,032 | TRY | 4,409,500 | — | (393 | ) | ||||||||||||||
| JP Morgan & Chase Co. |
6/2/2023 | USD | 558,052 | ZAR | 11,058,500 | 2,759 | — | |||||||||||||||
| RBC Capital Markets |
6/2/2023 | USD | 633,233 | ZAR | 12,548,300 | 3,131 | — | |||||||||||||||
| JP Morgan & Chase Co. |
6/2/2023 | ZAR | 11,058,500 | USD | 603,187 | 42,376 | — | |||||||||||||||
| RBC Capital Markets |
6/2/2023 | ZAR | 12,548,300 | USD | 684,448 | 48,084 | — | |||||||||||||||
| JP Morgan & Chase Co. |
6/5/2023 | BRL | 2,507,800 | USD | 498,376 | 4,464 | — | |||||||||||||||
| RBC Capital Markets |
6/5/2023 | BRL | 7,150,400 | USD | 1,420,734 | 12,459 | — | |||||||||||||||
| Goldman Sachs & Co. |
6/5/2023 | CLP | 78,893,400 | USD | 97,855 | 526 | — | |||||||||||||||
| JP Morgan & Chase Co. |
6/5/2023 | CLP | 85,394,300 | USD | 105,843 | 494 | — | |||||||||||||||
| Goldman Sachs & Co. |
6/5/2023 | COP | 98,581,700 | USD | 20,984 | — | (1,139 | ) | ||||||||||||||
| JP Morgan & Chase Co. |
6/5/2023 | COP | 163,398,300 | USD | 34,909 | — | (1,761 | ) | ||||||||||||||
| Goldman Sachs & Co. |
6/5/2023 | INR | 221,518,700 | USD | 2,701,448 | 24,370 | — | |||||||||||||||
| JP Morgan & Chase Co. |
6/5/2023 | INR | 14,153,000 | USD | 172,800 | 1,759 | — | |||||||||||||||
| JP Morgan & Chase Co. |
6/5/2023 | INR | 169,736,700 | USD | 2,070,768 | 19,482 | — | |||||||||||||||
| Goldman Sachs & Co. |
6/5/2023 | KRW | 3,029,703,100 | USD | 2,268,761 | — | (14,578 | ) | ||||||||||||||
| JP Morgan & Chase Co. |
6/5/2023 | KRW | 1,084,472,400 | USD | 810,960 | — | (6,354 | ) | ||||||||||||||
| RBC Capital Markets |
6/5/2023 | KRW | 1,615,214,900 | USD | 1,208,360 | — | (8,948 | ) | ||||||||||||||
| RBC Capital Markets |
6/5/2023 | KRW | 79,054,000 | USD | 59,179 | — | (400 | ) | ||||||||||||||
| Goldman Sachs & Co. |
6/5/2023 | KWD | 103,000 | USD | 336,656 | 1,664 | — | |||||||||||||||
| Goldman Sachs & Co. |
6/5/2023 | QAR | 1,355,000 | USD | 370,979 | — | (1,214 | ) | ||||||||||||||
| Goldman Sachs & Co. |
6/5/2023 | SAR | 319,000 | USD | 85,005 | — | (37 | ) | ||||||||||||||
| Goldman Sachs & Co. |
6/5/2023 | SAR | 5,491,000 | USD | 1,463,291 | — | (559 | ) | ||||||||||||||
| JP Morgan & Chase Co. |
6/5/2023 | SGD | 941,500 | USD | 706,495 | 10,152 | — | |||||||||||||||
| RBC Capital Markets |
6/5/2023 | SGD | 564,400 | USD | 423,522 | 6,086 | — | |||||||||||||||
| Goldman Sachs & Co. |
6/5/2023 | TWD | 78,050,600 | USD | 2,542,365 | 838 | — | |||||||||||||||
| JP Morgan & Chase Co. |
6/5/2023 | TWD | 54,501,200 | USD | 1,776,035 | 1,337 | — | |||||||||||||||
| RBC Capital Markets |
6/5/2023 | TWD | 40,964,200 | USD | 1,334,078 | 179 | — | |||||||||||||||
| JP Morgan & Chase Co. |
6/5/2023 | USD | 420,958 | BRL | 2,150,800 | 2,643 | — | |||||||||||||||
| JP Morgan & Chase Co. |
6/5/2023 | USD | 70,915 | BRL | 357,000 | — | (603 | ) | ||||||||||||||
| RBC Capital Markets |
6/5/2023 | USD | 1,396,044 | BRL | 7,150,400 | 12,231 | — | |||||||||||||||
| Goldman Sachs & Co. |
6/5/2023 | USD | 96,893 | CLP | 78,893,400 | 436 | — | |||||||||||||||
| JP Morgan & Chase Co. |
6/5/2023 | USD | 105,328 | CLP | 85,394,300 | 21 | — | |||||||||||||||
| Goldman Sachs & Co. |
6/5/2023 | USD | 22,292 | COP | 98,581,700 | — | (168 | ) | ||||||||||||||
| JP Morgan & Chase Co. |
6/5/2023 | USD | 36,868 | COP | 163,398,300 | — | (198 | ) | ||||||||||||||
| Goldman Sachs & Co. |
6/5/2023 | USD | 2,678,582 | INR | 221,518,700 | — | (1,504 | ) | ||||||||||||||
| JP Morgan & Chase Co. |
6/5/2023 | USD | 2,222,796 | INR | 183,889,700 | — | (469 | ) | ||||||||||||||
| Goldman Sachs & Co. |
6/5/2023 | USD | 2,284,844 | KRW | 3,029,703,100 | — | (1,505 | ) | ||||||||||||||
| JP Morgan & Chase Co. |
6/5/2023 | USD | 817,846 | KRW | 1,084,472,400 | — | (533 | ) | ||||||||||||||
| RBC Capital Markets |
6/5/2023 | USD | 1,277,729 | KRW | 1,694,268,900 | — | (842 | ) | ||||||||||||||
| Goldman Sachs & Co. |
6/5/2023 | USD | 334,687 | KWD | 103,000 | 305 | — | |||||||||||||||
| Goldman Sachs & Co. |
6/5/2023 | USD | 371,946 | QAR | 1,355,000 | 247 | — | |||||||||||||||
| Goldman Sachs & Co. |
6/5/2023 | USD | 1,549,003 | SAR | 5,810,000 | — | (110 | ) | ||||||||||||||
| JP Morgan & Chase Co. |
6/5/2023 | USD | 694,911 | SGD | 941,500 | 1,432 | — | |||||||||||||||
| RBC Capital Markets |
6/5/2023 | USD | 416,577 | SGD | 564,400 | 859 | — | |||||||||||||||
| Goldman Sachs & Co. |
6/5/2023 | USD | 2,535,345 | TWD | 78,050,600 | 6,182 | — | |||||||||||||||
| JP Morgan & Chase Co. |
6/5/2023 | USD | 1,456,590 | TWD | 44,822,200 | 2,935 | — | |||||||||||||||
| JP Morgan & Chase Co. |
6/5/2023 | USD | 315,678 | TWD | 9,679,000 | — | (505 | ) | ||||||||||||||
| RBC Capital Markets |
6/5/2023 | USD | 1,330,871 | TWD | 40,964,200 | 3,028 | — | |||||||||||||||
| Goldman Sachs & Co. |
6/6/2023 | EGP | 407,000 | USD | 11,662 | — | (1,455 | ) | ||||||||||||||
| RBC Capital Markets |
6/6/2023 | MYR | 2,465,200 | USD | 553,083 | 18,728 | — | |||||||||||||||
| Goldman Sachs & Co. |
6/6/2023 | USD | 13,172 | EGP | 407,000 | — | (55 | ) | ||||||||||||||
| RBC Capital Markets |
6/6/2023 | USD | 534,345 | MYR | 2,465,200 | 10 | — | |||||||||||||||
| JP Morgan & Chase Co. |
6/7/2023 | IDR | 5,549,534,200 | USD | 378,111 | 7,924 | — | |||||||||||||||
| RBC Capital Markets |
6/7/2023 | IDR | 5,018,076,700 | USD | 341,947 | 7,211 | — | |||||||||||||||
| JP Morgan & Chase Co. |
6/7/2023 | USD | 370,068 | IDR | 5,549,534,200 | 120 | — | |||||||||||||||
| See Notes to Financial Statements. | 44 |
DBX ETF Trust
Schedule of Investments
Xtrackers MSCI All World ex US Hedged Equity ETF (Continued)
May 31, 2023
| Counterparty |
Settlement Date |
Currency To Deliver |
Currency To Receive |
Unrealized Appreciation |
Unrealized Depreciation |
|||||||||||||||||
| RBC Capital Markets |
6/7/2023 | USD | 334,538 | IDR | 5,018,076,700 | $ | 197 | $ | — | |||||||||||||
| Goldman Sachs & Co. |
7/5/2023 | AED | 1,747,000 | USD | 475,607 | — | (41 | ) | ||||||||||||||
| Goldman Sachs & Co. |
7/5/2023 | AED | 82,000 | USD | 22,325 | — | (1 | ) | ||||||||||||||
| Goldman Sachs & Co. |
7/5/2023 | AUD | 4,052,400 | USD | 2,625,732 | — | (13,712 | ) | ||||||||||||||
| Goldman Sachs & Co. |
7/5/2023 | AUD | 83,000 | USD | 53,779 | — | (281 | ) | ||||||||||||||
| JP Morgan & Chase Co. |
7/5/2023 | AUD | 2,368,800 | USD | 1,534,847 | — | (8,020 | ) | ||||||||||||||
| RBC Capital Markets |
7/5/2023 | AUD | 3,334,000 | USD | 2,160,249 | — | (11,281 | ) | ||||||||||||||
| Goldman Sachs & Co. |
7/5/2023 | CAD | 5,491,800 | USD | 4,043,738 | — | (5,518 | ) | ||||||||||||||
| JP Morgan & Chase Co. |
7/5/2023 | CAD | 3,506,200 | USD | 2,581,657 | — | (3,561 | ) | ||||||||||||||
| RBC Capital Markets |
7/5/2023 | CAD | 4,879,500 | USD | 3,592,914 | — | (4,876 | ) | ||||||||||||||
| Goldman Sachs & Co. |
7/5/2023 | CHF | 3,679,000 | USD | 4,039,883 | — | (16,422 | ) | ||||||||||||||
| JP Morgan & Chase Co. |
7/5/2023 | CHF | 1,742,900 | USD | 1,913,876 | — | (7,769 | ) | ||||||||||||||
| RBC Capital Markets |
7/5/2023 | CHF | 2,724,800 | USD | 2,992,083 | — | (12,163 | ) | ||||||||||||||
| JP Morgan & Chase Co. |
7/5/2023 | CNH | 8,596,400 | USD | 1,209,840 | — | (1,810 | ) | ||||||||||||||
| RBC Capital Markets |
7/5/2023 | CNH | 4,319,800 | USD | 607,969 | — | (901 | ) | ||||||||||||||
| JP Morgan & Chase Co. |
7/5/2023 | DKK | 307,000 | USD | 44,045 | — | (130 | ) | ||||||||||||||
| JP Morgan & Chase Co. |
7/5/2023 | DKK | 7,113,600 | USD | 1,020,603 | — | (2,988 | ) | ||||||||||||||
| RBC Capital Markets |
7/5/2023 | DKK | 11,480,100 | USD | 1,647,144 | — | (4,752 | ) | ||||||||||||||
| Goldman Sachs & Co. |
7/5/2023 | EGP | 407,000 | USD | 12,859 | 27 | — | |||||||||||||||
| Goldman Sachs & Co. |
7/5/2023 | EUR | 11,288,800 | USD | 12,058,414 | — | (33,222 | ) | ||||||||||||||
| JP Morgan & Chase Co. |
7/5/2023 | EUR | 5,856,400 | USD | 6,255,602 | — | (17,293 | ) | ||||||||||||||
| RBC Capital Markets |
7/5/2023 | EUR | 10,157,900 | USD | 10,850,384 | — | (29,924 | ) | ||||||||||||||
| Goldman Sachs & Co. |
7/5/2023 | GBP | 4,818,700 | USD | 5,976,634 | — | (22,087 | ) | ||||||||||||||
| JP Morgan & Chase Co. |
7/5/2023 | GBP | 2,949,900 | USD | 3,658,746 | — | (13,536 | ) | ||||||||||||||
| RBC Capital Markets |
7/5/2023 | GBP | 2,934,300 | USD | 3,639,412 | — | (13,450 | ) | ||||||||||||||
| Goldman Sachs & Co. |
7/5/2023 | HKD | 32,541,100 | USD | 4,160,229 | 783 | — | |||||||||||||||
| JP Morgan & Chase Co. |
7/5/2023 | HKD | 17,657,700 | USD | 2,257,455 | 425 | — | |||||||||||||||
| RBC Capital Markets |
7/5/2023 | HKD | 35,290,800 | USD | 4,506,004 | — | (4,912 | ) | ||||||||||||||
| Goldman Sachs & Co. |
7/5/2023 | HUF | 14,453,900 | USD | 41,182 | — | (100 | ) | ||||||||||||||
| JP Morgan & Chase Co. |
7/5/2023 | HUF | 11,896,900 | USD | 33,897 | — | (82 | ) | ||||||||||||||
| JP Morgan & Chase Co. |
7/5/2023 | IDR | 5,549,534,200 | USD | 369,673 | — | (403 | ) | ||||||||||||||
| RBC Capital Markets |
7/5/2023 | IDR | 5,018,076,700 | USD | 334,293 | — | (342 | ) | ||||||||||||||
| Goldman Sachs & Co. |
7/5/2023 | ILS | 476,100 | USD | 127,663 | — | (140 | ) | ||||||||||||||
| JP Morgan & Chase Co. |
7/5/2023 | ILS | 323,700 | USD | 86,798 | — | (95 | ) | ||||||||||||||
| RBC Capital Markets |
7/5/2023 | ILS | 603,000 | USD | 161,690 | — | (177 | ) | ||||||||||||||
| Goldman Sachs & Co. |
7/5/2023 | INR | 221,518,700 | USD | 2,673,893 | — | (316 | ) | ||||||||||||||
| Goldman Sachs & Co. |
7/5/2023 | INR | 22,588,000 | USD | 272,990 | 304 | — | |||||||||||||||
| JP Morgan & Chase Co. |
7/5/2023 | INR | 183,889,700 | USD | 2,220,220 | 274 | — | |||||||||||||||
| Goldman Sachs & Co. |
7/5/2023 | JPY | 884,510,300 | USD | 6,363,383 | — | (20,540 | ) | ||||||||||||||
| Goldman Sachs & Co. |
7/5/2023 | JPY | 210,206,000 | USD | 1,512,273 | — | (4,881 | ) | ||||||||||||||
| JP Morgan & Chase Co. |
7/5/2023 | JPY | 846,901,300 | USD | 6,092,815 | — | (19,666 | ) | ||||||||||||||
| RBC Capital Markets |
7/5/2023 | JPY | 799,509,100 | USD | 5,751,843 | — | (18,586 | ) | ||||||||||||||
| Goldman Sachs & Co. |
7/5/2023 | KRW | 306,518,000 | USD | 231,326 | — | (74 | ) | ||||||||||||||
| Goldman Sachs & Co. |
7/5/2023 | KRW | 3,029,703,100 | USD | 2,288,295 | 1,079 | — | |||||||||||||||
| JP Morgan & Chase Co. |
7/5/2023 | KRW | 1,084,472,400 | USD | 819,094 | 392 | — | |||||||||||||||
| RBC Capital Markets |
7/5/2023 | KRW | 1,694,268,900 | USD | 1,279,766 | 709 | — | |||||||||||||||
| Goldman Sachs & Co. |
7/5/2023 | KWD | 103,000 | USD | 334,720 | — | (801 | ) | ||||||||||||||
| Goldman Sachs & Co. |
7/5/2023 | MXN | 646,000 | USD | 36,122 | — | (121 | ) | ||||||||||||||
| Goldman Sachs & Co. |
7/5/2023 | MXN | 9,002,600 | USD | 503,398 | — | (1,689 | ) | ||||||||||||||
| JP Morgan & Chase Co. |
7/5/2023 | MXN | 5,830,800 | USD | 326,058 | — | (1,077 | ) | ||||||||||||||
| RBC Capital Markets |
7/5/2023 | MXN | 3,211,600 | USD | 179,592 | — | (593 | ) | ||||||||||||||
| RBC Capital Markets |
7/5/2023 | MYR | 2,465,200 | USD | 534,925 | — | (593 | ) | ||||||||||||||
| RBC Capital Markets |
7/5/2023 | NOK | 5,299,200 | USD | 476,337 | — | (1,887 | ) | ||||||||||||||
| RBC Capital Markets |
7/5/2023 | NOK | 645,500 | USD | 58,023 | — | (230 | ) | ||||||||||||||
| Goldman Sachs & Co. |
7/5/2023 | NZD | 58,300 | USD | 34,937 | — | (171 | ) | ||||||||||||||
| Goldman Sachs & Co. |
7/5/2023 | NZD | 220,300 | USD | 132,017 | — | (647 | ) | ||||||||||||||
| Goldman Sachs & Co. |
7/5/2023 | NZD | 46,000 | USD | 27,564 | — | (137 | ) | ||||||||||||||
| JP Morgan & Chase Co. |
7/5/2023 | PHP | 1,433,200 | USD | 25,471 | — | (19 | ) | ||||||||||||||
| See Notes to Financial Statements. | 45 |
DBX ETF Trust
Schedule of Investments
Xtrackers MSCI All World ex US Hedged Equity ETF (Continued)
May 31, 2023
| Counterparty |
Settlement Date |
Currency To Deliver |
Currency To Receive |
Unrealized Appreciation |
Unrealized Depreciation |
|||||||||||||||||||||||
| RBC Capital Markets |
7/5/2023 | PHP | 13,104,400 | USD | 232,843 | $ | — | $ | (223 | ) | ||||||||||||||||||
| Goldman Sachs & Co. |
7/5/2023 | PLN | 1,103,200 | USD | 258,903 | — | (1,061 | ) | ||||||||||||||||||||
| JP Morgan & Chase Co. |
7/5/2023 | PLN | 89,400 | USD | 20,981 | — | (86 | ) | ||||||||||||||||||||
| Goldman Sachs & Co. |
7/5/2023 | QAR | 1,355,000 | USD | 371,487 | — | (340 | ) | ||||||||||||||||||||
| Goldman Sachs & Co. |
7/5/2023 | SAR | 5,810,000 | USD | 1,548,177 | — | (83 | ) | ||||||||||||||||||||
| JP Morgan & Chase Co. |
7/5/2023 | SEK | 280,000 | USD | 25,773 | — | (80 | ) | ||||||||||||||||||||
| JP Morgan & Chase Co. |
7/5/2023 | SEK | 17,413,800 | USD | 1,602,897 | — | (4,944 | ) | ||||||||||||||||||||
| RBC Capital Markets |
7/5/2023 | SEK | 13,282,600 | USD | 1,222,630 | — | (3,771 | ) | ||||||||||||||||||||
| JP Morgan & Chase Co. |
7/5/2023 | SGD | 941,500 | USD | 695,633 | — | (1,464 | ) | ||||||||||||||||||||
| RBC Capital Markets |
7/5/2023 | SGD | 564,400 | USD | 417,011 | — | (878 | ) | ||||||||||||||||||||
| JP Morgan & Chase Co. |
7/5/2023 | THB | 27,181,600 | USD | 784,688 | 791 | — | |||||||||||||||||||||
| JP Morgan & Chase Co. |
7/5/2023 | TRY | 4,409,500 | USD | 191,146 | 1,365 | — | |||||||||||||||||||||
| JP Morgan & Chase Co. |
7/5/2023 | TRY | 486,000 | USD | 21,067 | 150 | — | |||||||||||||||||||||
| Goldman Sachs & Co. |
7/5/2023 | TWD | 15,806,000 | USD | 515,483 | — | (950 | ) | ||||||||||||||||||||
| Goldman Sachs & Co. |
7/5/2023 | TWD | 78,050,600 | USD | 2,538,644 | — | (11,520 | ) | ||||||||||||||||||||
| JP Morgan & Chase Co. |
7/5/2023 | TWD | 44,822,200 | USD | 1,459,151 | — | (5,334 | ) | ||||||||||||||||||||
| RBC Capital Markets |
7/5/2023 | TWD | 40,964,200 | USD | 1,332,906 | — | (5,526 | ) | ||||||||||||||||||||
| Goldman Sachs & Co. |
7/5/2023 | USD | 218,691 | CAD | 297,000 | 295 | — | |||||||||||||||||||||
| Goldman Sachs & Co. |
7/5/2023 | USD | 26,355 | CHF | 24,000 | 106 | — | |||||||||||||||||||||
| JP Morgan & Chase Co. |
7/5/2023 | USD | 85,993 | CNH | 611,000 | 127 | — | |||||||||||||||||||||
| Goldman Sachs & Co. |
7/5/2023 | USD | 129,249 | EUR | 121,000 | 356 | — | |||||||||||||||||||||
| Goldman Sachs & Co. |
7/5/2023 | USD | 320,005 | GBP | 258,000 | 1,175 | — | |||||||||||||||||||||
| Goldman Sachs & Co. |
7/5/2023 | USD | 240,100 | HKD | 1,878,000 | — | (51 | ) | ||||||||||||||||||||
| Goldman Sachs & Co. |
7/5/2023 | USD | 35,749 | KWD | 11,000 | 83 | — | |||||||||||||||||||||
| Goldman Sachs & Co. |
7/5/2023 | USD | 27,446 | SAR | 103,000 | 1 | — | |||||||||||||||||||||
| JP Morgan & Chase Co. |
7/5/2023 | USD | 40,792 | THB | 1,413,000 | — | (42 | ) | ||||||||||||||||||||
| JP Morgan & Chase Co. |
7/5/2023 | USD | 66,148 | ZAR | 1,315,000 | 307 | — | |||||||||||||||||||||
| JP Morgan & Chase Co. |
7/5/2023 | ZAR | 11,058,500 | USD | 556,258 | — | (2,595 | ) | ||||||||||||||||||||
| RBC Capital Markets |
7/5/2023 | ZAR | 12,548,300 | USD | 631,200 | — | (2,942 | ) | ||||||||||||||||||||
| JP Morgan & Chase Co. |
7/6/2023 | BRL | 2,150,800 | USD | 418,479 | — | (2,906 | ) | ||||||||||||||||||||
| JP Morgan & Chase Co. |
7/6/2023 | BRL | 199,000 | USD | 38,672 | — | (316 | ) | ||||||||||||||||||||
| RBC Capital Markets |
7/6/2023 | BRL | 7,150,400 | USD | 1,387,915 | — | (12,989 | ) | ||||||||||||||||||||
| Goldman Sachs & Co. |
7/6/2023 | CLP | 78,893,400 | USD | 96,478 | — | (425 | ) | ||||||||||||||||||||
| JP Morgan & Chase Co. |
7/6/2023 | CLP | 85,394,300 | USD | 104,875 | — | (13 | ) | ||||||||||||||||||||
| Goldman Sachs & Co. |
7/7/2023 | COP | 98,581,700 | USD | 22,087 | 149 | — | |||||||||||||||||||||
| JP Morgan & Chase Co. |
7/7/2023 | COP | 163,398,300 | USD | 36,531 | 169 | — | |||||||||||||||||||||
| Goldman Sachs & Co. |
7/7/2023 | CZK | 1,029,400 | USD | 46,107 | — | (200 | ) | ||||||||||||||||||||
| JP Morgan & Chase Co. |
7/7/2023 | CZK | 707,000 | USD | 31,667 | — | (138 | ) | ||||||||||||||||||||
| Goldman Sachs & Co. |
7/7/2023 | USD | 23,743 | COP | 105,969,000 | — | (161 | ) | ||||||||||||||||||||
|
|
|
|
|
|||||||||||||||||||||||||
| Total unrealized appreciation (depreciation) |
$ | 2,951,993 | $ | (454,850 | ) | |||||||||||||||||||||||
|
|
|
|
|
|||||||||||||||||||||||||
For information on the Fund’s policy and additional disclosures regarding futures contracts and forward foreign currency contracts, please refer to the Derivatives section of Note 2 in the accompanying Notes to Financial Statements.
| See Notes to Financial Statements. | 46 |
DBX ETF Trust
Schedule of Investments
Xtrackers MSCI All World ex US Hedged Equity ETF (Continued)
May 31, 2023
Currency Abbreviations
| AED | Arab Emirates Dirham |
| AUD | Australian Dollar |
| BRL | Brazilian Real |
| CAD | Canadian Dollar |
| CHF | Swiss Franc |
| CLP | Chilean Peso |
| CNH | Chinese Yuan |
| COP | Colombian Peso |
| CZK | Czech Koruna |
| DKK | Danish Krone |
| EGP | Egyptian Pound |
| EUR | Euro |
| GBP | Pound Sterling |
| HKD | Hong Kong Dollar |
| HUF | Hungarian Forint |
| IDR | Indonesian Rupiah |
| ILS | Israeli Shekel |
| INR | Indian Rupee |
| JPY | Japanese Yen |
| KRW | South Korean Won |
| KWD | Kuwaiti Dinar |
| MXN | Mexican Peso |
| MYR | Malaysian Ringgit |
| NOK | Norwegian Krone |
| NZD | New Zealand Dollar |
| PHP | Philippine Peso |
| PLN | Polish Zloty |
| QAR | Qatari Rial |
| SAR | Saudi Riyal |
| SEK | Swedish Krona |
| SGD | Singapore Dollar |
| THB | Thai Baht |
| TRY | Turkish Lira |
| TWD | New Taiwan Dollar |
| USD | U.S. Dollar |
| ZAR | South African Rand |
Fair Value Measurements
Various inputs are used in determining the value of the Fund’s investments. These inputs are summarized in three broad levels. Level 1 includes quoted prices in active markets for identical securities. Level 2 includes other significant observable inputs (including quoted prices for similar securities, interest rates, prepayment speeds and credit risk). Level 3 includes significant unobservable inputs (including the Fund’s own assumptions in determining the fair value of investments). The level assigned to the securities valuations may not be an indication of the risk or liquidity associated with investing in those securities.
The following is a summary of the inputs used as of May 31, 2023 in valuing the Fund’s investments. For information on the Fund’s policy regarding the valuation of investments, please refer to the Security Valuation section of Note 2 in the accompanying Notes to Financial Statements.
| Assets |
Level 1 | Level 2 | Level 3 | Total | ||||||||||||
| Common Stocks (a) |
$ | 127,780,769 | $ | — | $ | 0 | $ | 127,780,769 | ||||||||
| Preferred Stocks (a) |
1,205,369 | — | 0 | 1,205,369 | ||||||||||||
| Corporate Bonds |
— | 203 | — | 203 | ||||||||||||
| Warrants (a) |
5,601 | — | — | 5,601 | ||||||||||||
| Short-Term Investments (a) |
5,324,202 | — | — | 5,324,202 | ||||||||||||
| Derivatives (b) |
||||||||||||||||
| Forward Foreign Currency Contracts |
— | 2,951,993 | — | 2,951,993 | ||||||||||||
| Futures Contracts |
2,580 | — | — | 2,580 | ||||||||||||
|
|
|
|
|
|
|
|
|
|||||||||
| TOTAL |
$ | 134,318,521 | $ | 2,952,196 | $ | 0 | $ | 137,270,717 | ||||||||
|
|
|
|
|
|
|
|
|
|||||||||
| Liabilities |
Level 1 | Level 2 | Level 3 | Total | ||||||||||||
| Derivatives (b) |
||||||||||||||||
| Forward Foreign Currency Contracts |
$ | — | $ | (454,850 | ) | $ | — | $ | (454,850 | ) | ||||||
| Futures Contracts |
(14,283 | ) | — | — | (14,283 | ) | ||||||||||
|
|
|
|
|
|
|
|
|
|||||||||
| TOTAL |
$ | (14,283 | ) | $ | (454,850 | ) | $ | — | $ | (469,133 | ) | |||||
|
|
|
|
|
|
|
|
|
|||||||||
| (a) | See Schedule of Investments for additional detailed categorizations. |
| (b) | Derivatives include unrealized appreciation (depreciation) on open futures contracts and forward foreign currency contracts. |
During the year ended May 31, 2023, the amount of transfers from Level 3 to Level 1 was $8,273. The investment was transferred from Level 3 to Level 1 due to the availability of a pricing source supported by observable inputs.
| See Notes to Financial Statements. | 47 |
DBX ETF Trust
Schedule of Investments
Xtrackers MSCI Emerging Markets Hedged Equity ETF
May 31, 2023
| Number |
Value |
|||||||
| COMMON STOCKS — 96.6% | ||||||||
| Brazil — 3.7% | ||||||||
| Ambev SA |
62,477 | $ | 177,457 | |||||
| Atacadao SA |
8,891 | 16,596 | ||||||
| B3 SA — Brasil Bolsa Balcao |
78,881 | 207,103 | ||||||
| Banco Bradesco SA |
23,245 | 60,801 | ||||||
| Banco BTG Pactual S.A |
15,967 | 82,773 | ||||||
| Banco do Brasil SA |
11,657 | 102,524 | ||||||
| Banco Santander Brasil SA |
4,168 | 23,496 | ||||||
| BB Seguridade Participacoes SA |
9,896 | 60,332 | ||||||
| CCR SA |
12,842 | 34,350 | ||||||
| Centrais Eletricas Brasileiras SA |
17,752 | 123,518 | ||||||
| Cia de Saneamento Basico do Estado de Sao Paulo |
4,664 | 48,310 | ||||||
| Cia Siderurgica Nacional SA |
9,725 | 23,290 | ||||||
| Cosan SA |
17,520 | 51,801 | ||||||
| CPFL Energia SA |
3,053 | 18,222 | ||||||
| Energisa SA |
2,558 | 22,205 | ||||||
| Eneva SA* |
11,081 | 25,009 | ||||||
| Engie Brasil Energia SA |
2,780 | 23,031 | ||||||
| Equatorial Energia SA* |
196 | 1,088 | ||||||
| Equatorial Energia SA |
14,014 | 77,759 | ||||||
| Hapvida Participacoes e Investimentos SA, 144A* |
77,515 | 60,963 | ||||||
| Hypera SA |
5,704 | 45,895 | ||||||
| JBS SA |
9,994 | 33,095 | ||||||
| Klabin SA |
9,551 | 39,497 | ||||||
| Localiza Rent A Car SA |
9,683 | 118,411 | ||||||
| Localiza Rent A Car SA* |
42 | 509 | ||||||
| Lojas Renner SA |
12,484 | 47,861 | ||||||
| Magazine Luiza SA* |
46,946 | 35,163 | ||||||
| Natura & Co. Holding SA* |
12,624 | 34,563 | ||||||
| Petroleo Brasileiro SA |
50,581 | 291,225 | ||||||
| PRIO SA* |
9,463 | 63,773 | ||||||
| Raia Drogasil SA |
17,288 | 96,539 | ||||||
| Rede D’Or Sao Luiz SA, 144A |
7,863 | 44,946 | ||||||
| Rumo SA |
18,335 | 75,244 | ||||||
| Sendas Distribuidora SA |
16,606 | 35,187 | ||||||
| Suzano SA |
11,220 | 99,034 | ||||||
| Telefonica Brasil SA |
5,092 | 40,147 | ||||||
| TIM SA |
12,632 | 34,759 | ||||||
| TOTVS SA |
6,971 | 39,518 | ||||||
| Ultrapar Participacoes SA |
10,498 | 35,033 | ||||||
| Vale SA |
45,725 | 575,111 | ||||||
| Vibra Energia SA |
15,641 | 49,606 | ||||||
| WEG SA |
22,623 | 167,712 | ||||||
|
|
|
|||||||
| (Cost $2,542,113) |
3,243,456 | |||||||
|
|
|
|||||||
| Cayman Islands — 0.0% | ||||||||
| Parade Technologies Ltd. (Cost $78,631) |
1,053 | 34,954 | ||||||
|
|
|
|||||||
| Chile — 0.4% | ||||||||
| Banco de Chile |
634,874 | 64,192 | ||||||
| Banco de Credito e Inversiones SA |
798 | 23,457 | ||||||
| Banco Santander Chile |
939,232 | 40,816 | ||||||
| Cencosud SA |
14,789 | 27,935 | ||||||
| Cia Cervecerias Unidas SA |
1,715 | 12,598 | ||||||
| Cia Sud Americana de Vapores SA |
203,741 | 14,981 | ||||||
| Number |
Value |
|||||||
| Chile (Continued) | ||||||||
| Empresas CMPC SA |
14,852 | $ | 25,395 | |||||
| Empresas Copec SA |
5,489 | 39,642 | ||||||
| Enel Americas SA* |
280,743 | 36,198 | ||||||
| Enel Chile SA |
408,382 | 22,436 | ||||||
| Falabella SA |
10,090 | 22,235 | ||||||
|
|
|
|||||||
| (Cost $449,620) |
329,885 | |||||||
|
|
|
|||||||
| China — 26.6% | ||||||||
| 360 Security Technology, Inc., Class A |
7,500 | 14,700 | ||||||
| 37 Interactive Entertainment Network Technology Group Co. Ltd., Class A |
1,000 | 4,586 | ||||||
| 3SBio, Inc., 144A |
18,254 | 18,463 | ||||||
| AAC Technologies Holdings, Inc. (a) |
9,611 | 19,712 | ||||||
| Advanced Micro-Fabrication Equipment Inc China, Class A* |
525 | 12,786 | ||||||
| AECC Aviation Power Co. Ltd., Class A |
2,400 | 13,404 | ||||||
| Agricultural Bank of China Ltd., Class A |
79,700 | 39,417 | ||||||
| Agricultural Bank of China Ltd., Class H |
408,812 | 154,014 | ||||||
| Aier Eye Hospital Group Co. Ltd., Class A |
4,964 | 18,692 | ||||||
| Air China Ltd., Class A* |
4,400 | 5,391 | ||||||
| Air China Ltd., Class H* (a) |
20,555 | 15,619 | ||||||
| Akeso, Inc., 144A* (a) |
6,401 | 28,529 | ||||||
| Alibaba Group Holding Ltd.* |
223,820 | 2,226,638 | ||||||
| Aluminum Corp. of China Ltd., Class A |
9,632 | 7,322 | ||||||
| Aluminum Corp. of China Ltd., Class H |
50,919 | 22,499 | ||||||
| Anhui Conch Cement Co. Ltd., Class A |
3,400 | 11,971 | ||||||
| Anhui Conch Cement Co. Ltd., Class H |
16,053 | 42,642 | ||||||
| Anhui Gujing Distillery Co. Ltd., Class A |
360 | 12,742 | ||||||
| Anhui Gujing Distillery Co. Ltd., Class B |
1,363 | 22,334 | ||||||
| Anhui Honglu Steel Construction Group Co. Ltd., Class A |
1,100 | 4,346 | ||||||
| Anhui Kouzi Distillery Co. Ltd., Class A |
229 | 1,741 | ||||||
| Anhui Yingjia Distillery Co. Ltd., Class A* |
600 | 4,757 | ||||||
| Anjoy Foods Group Co. Ltd., Class A |
200 | 4,331 | ||||||
| ANTA Sports Products Ltd. |
16,559 | 169,070 | ||||||
| Apeloa Pharmaceutical Co. Ltd., Class A |
800 | 2,085 | ||||||
| Asymchem Laboratories Tianjin Co. Ltd., Class A |
364 | 6,741 | ||||||
| Autobio Diagnostics Co. Ltd., Class A |
700 | 5,585 | ||||||
| Autohome, Inc., ADR |
1,043 | 29,851 | ||||||
| Avary Holding Shenzhen Co. Ltd., Class A |
730 | 2,607 | ||||||
| AVIC Industry-Finance Holdings Co. Ltd., Class A |
2,300 | 1,247 | ||||||
| AviChina Industry & Technology Co. Ltd., Class H |
37,487 | 18,144 | ||||||
| Baidu, Inc., Class A* |
30,556 | 465,923 | ||||||
| Bank of Beijing Co. Ltd., Class A |
16,300 | 10,833 | ||||||
| Bank of Changsha Co. Ltd., Class A |
6,000 | 6,761 | ||||||
| Bank of Chengdu Co. Ltd., Class A |
2,955 | 5,219 | ||||||
| Bank of China Ltd., Class A |
35,100 | 19,234 | ||||||
| Bank of China Ltd., Class H |
1,041,528 | 408,341 | ||||||
| Bank of Communications Co. Ltd., Class A |
32,100 | 26,384 | ||||||
| Bank of Communications Co. Ltd., Class H |
117,924 | 76,051 | ||||||
| Bank of Hangzhou Co. Ltd., Class A |
5,960 | 9,722 | ||||||
| Bank of Jiangsu Co. Ltd., Class A* |
9,554 | 9,960 | ||||||
| Bank of Nanjing Co. Ltd., Class A |
8,400 | 9,961 | ||||||
| Bank of Ningbo Co. Ltd., Class A |
4,970 | 17,178 | ||||||
| See Notes to Financial Statements. | 48 |
DBX ETF Trust
Schedule of Investments
Xtrackers MSCI Emerging Markets Hedged Equity ETF (Continued)
May 31, 2023
| Number |
Value |
|||||||
| China (Continued) | ||||||||
| Bank of Shanghai Co. Ltd., Class A |
12,540 | $ | 10,871 | |||||
| Baoshan Iron & Steel Co. Ltd., Class A |
17,500 | 14,458 | ||||||
| BBMG Corp., Class A |
4,000 | 1,225 | ||||||
| Beijing Capital International Airport Co. Ltd., Class H* |
28,415 | 19,813 | ||||||
| Beijing Dabeinong Technology Group Co. Ltd., Class A |
2,100 | 1,897 | ||||||
| Beijing Easpring Material Technology Co. Ltd., Class A* |
500 | 3,445 | ||||||
| Beijing Kingsoft Office Software, Inc., Class A* |
328 | 19,909 | ||||||
| Beijing New Building Materials PLC, Class A |
1,770 | 5,653 | ||||||
| Beijing Shiji Information Technology Co. Ltd., Class A |
392 | 1,073 | ||||||
| Beijing Tiantan Biological Products Corp. Ltd., Class A |
3,000 | 11,760 | ||||||
| Beijing Tongrentang Co. Ltd., Class A |
900 | 7,662 | ||||||
| Beijing United Information Technology Co. Ltd., Class A* |
435 | 2,802 | ||||||
| Beijing Wantai Biological Pharmacy Enterprise Co. Ltd., Class A* |
435 | 5,684 | ||||||
| Beijing Yanjing Brewery Co. Ltd., Class A |
3,600 | 5,847 | ||||||
| Beijing-Shanghai High Speed Railway Co. Ltd., Class A |
31,200 | 25,294 | ||||||
| Betta Pharmaceuticals Co. Ltd., Class A* |
600 | 4,752 | ||||||
| BGI Genomics Co. Ltd., Class A |
600 | 4,965 | ||||||
| Bilibili, Inc., Class Z* |
2,510 | 40,869 | ||||||
| Bloomage Biotechnology Corp. Ltd., Class A* |
320 | 3,961 | ||||||
| BOC International China Co. Ltd., Class A |
2,100 | 3,210 | ||||||
| BOE Technology Group Co. Ltd., Class A* |
32,200 | 17,961 | ||||||
| BYD Co. Ltd., Class A |
1,500 | 53,460 | ||||||
| BYD Co. Ltd., Class H |
13,371 | 403,668 | ||||||
| BYD Electronic International Co. Ltd. |
10,222 | 29,764 | ||||||
| By-health Co. Ltd., Class A |
2,100 | 6,710 | ||||||
| Caitong Securities Co. Ltd., Class A |
3,204 | 3,367 | ||||||
| Canmax Technologies Co. Ltd., Class A |
1,040 | 4,889 | ||||||
| CECEP Solar Energy Co. Ltd., Class A |
5,200 | 5,107 | ||||||
| CECEP Wind-Power Corp., Class A* |
12,100 | 6,545 | ||||||
| CETC Cyberspace Security Technology Co. Ltd., Class A |
1,400 | 5,822 | ||||||
| CGN Power Co. Ltd., Class H, 144A |
162,914 | 39,114 | ||||||
| Changchun High & New Technology Industry Group, Inc., Class A |
360 | 8,063 | ||||||
| Changjiang Securities Co. Ltd., Class A |
1,400 | 1,182 | ||||||
| Changzhou Xingyu Automotive Lighting Systems Co. Ltd., Class A* |
400 | 5,956 | ||||||
| Chaozhou Three-Circle Group Co. Ltd., Class A |
2,000 | 8,472 | ||||||
| Chengxin Lithium Group Co. Ltd., Class A |
1,200 | 5,095 | ||||||
| China Baoan Group Co. Ltd., Class A |
1,700 | 2,888 | ||||||
| China Cinda Asset Management Co. Ltd., Class H |
117,448 | 13,049 | ||||||
| China CITIC Bank Corp. Ltd., Class H |
119,272 | 62,755 | ||||||
| China Coal Energy Co. Ltd., Class H |
26,665 | 20,159 | ||||||
| Number |
Value |
|||||||
| China (Continued) | ||||||||
| China Communications Services Corp. Ltd., Class H |
34,393 | $ | 16,339 | |||||
| China Conch Venture Holdings Ltd. |
22,996 | 28,898 | ||||||
| China Construction Bank Corp., Class A |
10,400 | 9,352 | ||||||
| China Construction Bank Corp., Class H |
1,280,824 | 819,484 | ||||||
| China CSSC Holdings Ltd., Class A |
3,500 | 14,173 | ||||||
| China Eastern Airlines Corp. Ltd., |
5,835 | 3,829 | ||||||
| China Energy Engineering Corp. Ltd., Class A |
25,300 | 8,531 | ||||||
| China Everbright Bank Co. Ltd., Class A |
34,400 | 15,225 | ||||||
| China Everbright Bank Co. Ltd., Class H* |
45,257 | 13,929 | ||||||
| China Evergrande Group* (b) |
25,065 | 0 | ||||||
| China Feihe Ltd., 144A |
48,957 | 28,447 | ||||||
| China Galaxy Securities Co. Ltd., Class A |
3,700 | 5,906 | ||||||
| China Galaxy Securities Co. Ltd., Class H |
51,727 | 27,877 | ||||||
| China Greatwall Technology Group Co. Ltd., Class A |
3,300 | 5,582 | ||||||
| China Hongqiao Group Ltd. |
31,610 | 22,445 | ||||||
| China International Capital Corp. Ltd., Class A |
1,000 | 5,852 | ||||||
| China International Capital Corp. Ltd., Class H, 144A |
22,024 | 40,277 | ||||||
| China Jushi Co. Ltd., Class A |
4,572 | 8,756 | ||||||
| China Lesso Group Holdings Ltd. |
11,537 | 7,617 | ||||||
| China Life Insurance Co. Ltd., Class A |
2,400 | 12,591 | ||||||
| China Life Insurance Co. Ltd., Class H |
103,496 | 174,730 | ||||||
| China Literature Ltd., 144A* (a) |
5,306 | 20,057 | ||||||
| China Longyuan Power Group Corp. Ltd., Class H |
45,446 | 50,957 | ||||||
| China Meheco Co. Ltd., Class A |
3,000 | 5,817 | ||||||
| China Meidong Auto Holdings Ltd. |
7,184 | 9,248 | ||||||
| China Merchants Bank Co. Ltd., Class A |
17,263 | 78,344 | ||||||
| China Merchants Bank Co. Ltd., Class H |
53,180 | 247,208 | ||||||
| China Merchants Energy Shipping Co. Ltd., Class A |
5,200 | 4,172 | ||||||
| China Merchants Securities Co. Ltd., Class A |
6,100 | 11,922 | ||||||
| China Merchants Shekou Industrial Zone Holdings Co. Ltd., Class A |
5,700 | 10,155 | ||||||
| China Minsheng Banking Corp. Ltd., Class A |
30,600 | 17,026 | ||||||
| China Minsheng Banking Corp. Ltd., Class H |
95,826 | 37,937 | ||||||
| China National Building Material Co. Ltd., Class H |
48,906 | 27,668 | ||||||
| China National Chemical Engineering Co. Ltd., Class A |
5,200 | 6,247 | ||||||
| China National Nuclear Power Co. Ltd., Class A |
19,400 | 19,189 | ||||||
| China National Software & Service Co. Ltd., Class A |
700 | 5,973 | ||||||
| China Northern Rare Earth Group High-Tech Co. Ltd., Class A |
3,300 | 11,063 | ||||||
| China Oilfield Services Ltd., Class H |
26,369 | 26,873 | ||||||
| China Pacific Insurance Group Co. Ltd., Class A |
6,000 | 23,478 | ||||||
| See Notes to Financial Statements. | 49 |
DBX ETF Trust
Schedule of Investments
Xtrackers MSCI Emerging Markets Hedged Equity ETF (Continued)
May 31, 2023
| Number |
Value |
|||||||
| China (Continued) | ||||||||
| China Pacific Insurance Group Co. Ltd., Class H |
36,218 | $ | 91,580 | |||||
| China Petroleum & Chemical Corp., Class A |
27,700 | 24,753 | ||||||
| China Petroleum & Chemical Corp., Class H |
322,202 | 202,856 | ||||||
| China Railway Group Ltd., Class A |
19,500 | 21,617 | ||||||
| China Railway Group Ltd., Class H |
61,868 | 40,769 | ||||||
| China Railway Signal & Communication Corp. Ltd., Class A |
10,435 | 8,738 | ||||||
| China Rare Earth Resources And Technology Co. Ltd., Class A* |
1,300 | 5,699 | ||||||
| China Resources Microelectronics Ltd., Class A |
893 | 7,463 | ||||||
| China Resources Mixc Lifestyle Services Ltd., 144A |
9,493 | 43,219 | ||||||
| China Resources Pharmaceutical Group Ltd., 144A |
17,891 | 17,159 | ||||||
| China Resources Sanjiu Medical & Pharmaceutical Co. Ltd., Class A |
1,100 | 10,095 | ||||||
| China Shenhua Energy Co. Ltd., Class A |
5,465 | 21,676 | ||||||
| China Shenhua Energy Co. Ltd., Class H |
45,071 | 142,458 | ||||||
| China Southern Airlines Co. Ltd., Class A* |
8,400 | 7,400 | ||||||
| China Southern Airlines Co. Ltd., Class H* |
27,705 | 15,957 | ||||||
| China State Construction Engineering Corp. Ltd., Class A |
39,000 | 32,330 | ||||||
| China Three Gorges Renewables Group Co. Ltd., Class A |
19,186 | 14,638 | ||||||
| China Tourism Group Duty Free Corp. Ltd., Class A |
1,600 | 27,674 | ||||||
| China Tourism Group Duty Free Corp. Ltd., Class H, 144A* |
879 | 13,987 | ||||||
| China Tower Corp. Ltd., Class H, 144A |
611,655 | 67,177 | ||||||
| China United Network Communications Ltd., Class A |
26,500 | 18,319 | ||||||
| China Vanke Co. Ltd., Class A |
9,000 | 18,007 | ||||||
| China Vanke Co. Ltd., Class H |
28,706 | 37,906 | ||||||
| China Yangtze Power Co. Ltd., Class A |
19,600 | 61,990 | ||||||
| China Zhenhua Group Science & Technology Co. Ltd., Class A |
600 | 7,773 | ||||||
| China Zheshang Bank Co. Ltd., Class A |
3,900 | 1,573 | ||||||
| Chinasoft International Ltd.* (a) |
34,896 | 20,812 | ||||||
| Chongqing Brewery Co. Ltd., Class A |
500 | 6,267 | ||||||
| Chongqing Changan Automobile Co. Ltd., Class A |
7,462 | 12,529 | ||||||
| Chongqing Fuling Zhacai Group Co. Ltd., Class A* |
1,200 | 3,967 | ||||||
| Chongqing Rural Commercial Bank Co. Ltd., Class A |
13,400 | 7,437 | ||||||
| Chongqing Zhifei Biological Products Co. Ltd., Class A |
1,252 | 12,365 | ||||||
| CITIC Ltd. |
82,098 | 94,779 | ||||||
| CITIC Securities Co. Ltd., Class A |
9,610 | 27,072 | ||||||
| CITIC Securities Co. Ltd., Class H |
27,904 | 51,386 | ||||||
| CMOC Group Ltd., Class A |
15,700 | 11,559 | ||||||
| CMOC Group Ltd., Class H |
53,199 | 27,787 | ||||||
| Number |
Value |
|||||||
| China (Continued) | ||||||||
| CNGR Advanced Material Co. Ltd., |
600 | $ | 4,853 | |||||
| Contemporary Amperex Technology Co. Ltd., Class A |
3,473 | 107,924 | ||||||
| COSCO SHIPPING Development Co. Ltd., Class A |
14,000 | 4,918 | ||||||
| COSCO SHIPPING Energy Transportation Co. Ltd., Class A* |
3,500 | 5,503 | ||||||
| COSCO SHIPPING Energy Transportation Co. Ltd., Class H* |
15,107 | 12,752 | ||||||
| COSCO SHIPPING Holdings Co. Ltd., Class A |
11,530 | 16,913 | ||||||
| COSCO SHIPPING Holdings Co. Ltd., Class H |
43,880 | 38,666 | ||||||
| Country Garden Holdings Co. Ltd. (a) |
174,110 | 32,018 | ||||||
| Country Garden Services Holdings Co. Ltd. |
28,123 | 32,718 | ||||||
| CRRC Corp. Ltd., Class A |
20,700 | 20,475 | ||||||
| CRRC Corp. Ltd., Class H |
62,306 | 38,591 | ||||||
| CSC Financial Co. Ltd., Class A |
2,925 | 10,435 | ||||||
| CSPC Pharmaceutical Group Ltd. |
121,933 | 106,199 | ||||||
| Daan Gene Co. Ltd., Class A* |
2,900 | 4,987 | ||||||
| Dali Foods Group Co. Ltd., 144A |
24,671 | 8,223 | ||||||
| Daqin Railway Co. Ltd., Class A |
13,600 | 14,599 | ||||||
| Daqo New Energy Corp., ADR* (a) |
807 | 29,012 | ||||||
| DaShenLin Pharmaceutical Group Co. Ltd., Class A |
960 | 4,390 | ||||||
| DHC Software Co. Ltd., Class A |
800 | 828 | ||||||
| Do-Fluoride New Materials Co. Ltd., Class A |
1,260 | 3,541 | ||||||
|
Dong-E-E-Jiao Co. Ltd., Class A |
200 | 1,387 | ||||||
| Dongfang Electric Corp. Ltd., Class A |
2,280 | 5,766 | ||||||
| Dongfeng Motor Group Co. Ltd., Class H |
36,130 | 15,642 | ||||||
| Dongxing Securities Co. Ltd., Class A |
600 | 690 | ||||||
| Dongyue Group Ltd. |
20,698 | 18,106 | ||||||
| East Buy Holding Ltd., 144A* (a) |
5,305 | 19,681 | ||||||
| East Money Information Co. Ltd., Class A |
11,674 | 22,996 | ||||||
| Ecovacs Robotics Co. Ltd., Class A |
500 | 4,864 | ||||||
| ENN Energy Holdings Ltd. |
10,840 | 125,975 | ||||||
| ENN Natural Gas Co. Ltd., Class A |
2,300 | 6,256 | ||||||
| Eve Energy Co. Ltd., Class A |
1,967 | 17,688 | ||||||
| Everbright Securities Co. Ltd., Class A |
4,800 | 10,683 | ||||||
| Fangda Carbon New Material Co. Ltd., Class A* |
3,834 | 3,405 | ||||||
| FAW Jiefang Group Co. Ltd., Class A |
5,500 | 6,259 | ||||||
| First Capital Securities Co. Ltd., Class A |
900 | 742 | ||||||
| Flat Glass Group Co. Ltd., Class A |
700 | 3,175 | ||||||
| Flat Glass Group Co. Ltd., Class H |
6,437 | 18,085 | ||||||
| Focus Media Information Technology Co. Ltd., Class A |
11,720 | 10,572 | ||||||
| Foshan Haitian Flavouring & Food Co. Ltd., Class A* |
3,292 | 27,987 | ||||||
| Fosun International Ltd. |
28,609 | 18,852 | ||||||
| Founder Securities Co. Ltd., Class A |
10,000 | 9,807 | ||||||
| Foxconn Industrial Internet Co. Ltd., Class A |
7,100 | 18,006 | ||||||
| See Notes to Financial Statements. | 50 |
DBX ETF Trust
Schedule of Investments
Xtrackers MSCI Emerging Markets Hedged Equity ETF (Continued)
May 31, 2023
| Number |
Value |
|||||||
| China (Continued) | ||||||||
| Fuyao Glass Industry Group Co. Ltd., Class A |
2,100 | $ | 9,572 | |||||
| Fuyao Glass Industry Group Co. Ltd., Class H, 144A |
7,983 | 29,055 | ||||||
| Ganfeng Lithium Group Co. Ltd., Class A |
1,680 | 14,635 | ||||||
| Ganfeng Lithium Group Co. Ltd., Class H, 144A (a) |
4,957 | 31,367 | ||||||
| GD Power Development Co. Ltd., Class A* |
9,450 | 5,417 | ||||||
| GDS Holdings Ltd., Class A* |
12,108 | 14,937 | ||||||
| Gemdale Corp., Class A |
4,300 | 4,380 | ||||||
| Genscript Biotech Corp.* (a) |
15,546 | 34,386 | ||||||
| GF Securities Co. Ltd., Class A |
6,300 | 13,189 | ||||||
| GF Securities Co. Ltd., Class H |
16,286 | 22,629 | ||||||
| GigaDevice Semiconductor, Inc., Class A |
641 | 9,979 | ||||||
| Ginlong Technologies Co. Ltd., Class A* |
450 | 6,311 | ||||||
| GoerTek, Inc., Class A |
2,100 | 5,423 | ||||||
| Gotion High-tech Co. Ltd., Class A |
1,200 | 4,487 | ||||||
| Great Wall Motor Co. Ltd., Class A* |
1,900 | 6,031 | ||||||
| Great Wall Motor Co. Ltd., Class H* (a) |
39,993 | 41,063 | ||||||
| Gree Electric Appliances, Inc. of Zhuhai, Class A |
2,800 | 12,975 | ||||||
| Greentown China Holdings Ltd. |
13,343 | 12,524 | ||||||
| Greentown Service Group Co. Ltd. (a) |
20,048 | 10,830 | ||||||
| Guangdong Haid Group Co. Ltd., Class A |
1,081 | 7,023 | ||||||
| Guangdong Kinlong Hardware Products Co. Ltd., Class A |
400 | 3,556 | ||||||
| Guanghui Energy Co. Ltd., Class A |
3,641 | 3,714 | ||||||
| Guangzhou Automobile Group Co. Ltd., Class A |
4,800 | 6,872 | ||||||
| Guangzhou Automobile Group Co. Ltd., Class H |
39,187 | 22,470 | ||||||
| Guangzhou Baiyunshan Pharmaceutical Holdings Co. Ltd., Class A |
600 | 3,026 | ||||||
| Guangzhou Haige Communications Group, Inc. Co., Class A |
5,700 | 8,033 | ||||||
| Guangzhou Kingmed Diagnostics Group Co. Ltd., Class A |
500 | 4,857 | ||||||
| Guangzhou Shiyuan Electronic Technology Co. Ltd., Class A* |
600 | 5,231 | ||||||
| Guangzhou Tinci Materials Technology Co. Ltd., Class A |
1,940 | 11,146 | ||||||
| Guolian Securities Co. Ltd., Class A |
1,900 | 2,563 | ||||||
| Guosen Securities Co. Ltd., Class A |
6,400 | 8,282 | ||||||
| Guotai Junan Securities Co. Ltd., Class A |
6,100 | 12,685 | ||||||
| Guoyuan Securities Co. Ltd., Class A |
6,630 | 6,241 | ||||||
| H World Group Ltd., ADR* |
2,602 | 95,285 | ||||||
| Haidilao International Holding Ltd., |
22,575 | 47,511 | ||||||
| Haier Smart Home Co. Ltd., Class A |
6,000 | 18,108 | ||||||
| Haier Smart Home Co. Ltd., Class H |
30,357 | 87,034 | ||||||
| Hainan Airlines Holding Co. Ltd., Class A* |
49,900 | 11,989 | ||||||
| Haitian International Holdings Ltd. |
9,936 | 22,561 | ||||||
| Haitong Securities Co. Ltd., Class A |
7,800 | 10,313 | ||||||
| Haitong Securities Co. Ltd., Class H |
37,734 | 25,058 | ||||||
| Hangzhou First Applied Material Co. Ltd., Class A |
1,143 | 4,921 | ||||||
| Number |
Value |
|||||||
| China (Continued) | ||||||||
| Hangzhou Lion Electronics Co. Ltd., |
600 | $ | 3,434 | |||||
| Hangzhou Oxygen Plant Group Co. Ltd., Class A |
1,100 | 5,522 | ||||||
| Hangzhou Robam Appliances Co. Ltd., Class A |
200 | 656 | ||||||
| Hangzhou Silan Microelectronics Co. Ltd., Class A |
1,300 | 5,836 | ||||||
| Hangzhou Tigermed Consulting Co. Ltd., Class A* |
174 | 1,975 | ||||||
| Hangzhou Tigermed Consulting Co. Ltd., Class H, 144A (a) |
1,559 | 11,687 | ||||||
| Hansoh Pharmaceutical Group Co. Ltd., 144A |
17,799 | 29,459 | ||||||
| Heilongjiang Agriculture Co. Ltd., Class A |
3,400 | 6,387 | ||||||
| Henan Shenhuo Coal & Power Co. Ltd., Class A |
621 | 1,115 | ||||||
| Henan Shuanghui Investment & Development Co. Ltd., Class A |
2,308 | 7,971 | ||||||
| Hengan International Group Co. Ltd. |
8,872 | 37,729 | ||||||
| Hengli Petrochemical Co. Ltd., Class A |
4,210 | 9,340 | ||||||
| Hengtong Optic-electric Co. Ltd., Class A |
1,900 | 3,860 | ||||||
| Hengyi Petrochemical Co. Ltd., Class A |
1,366 | 1,286 | ||||||
| Hesteel Co. Ltd., Class A |
2,700 | 869 | ||||||
| Hithink RoyalFlush Information Network Co. Ltd., Class A |
500 | 11,299 | ||||||
| Hongfa Technology Co. Ltd., Class A |
700 | 2,978 | ||||||
| Hoshine Silicon Industry Co. Ltd., Class A |
500 | 4,732 | ||||||
| Hoyuan Green Energy Co. Ltd., Class A |
280 | 3,038 | ||||||
| Hua Hong Semiconductor Ltd., 144A* |
8,797 | 28,479 | ||||||
| Huadian Power International Corp. Ltd., Class A |
7,800 | 7,814 | ||||||
| Huadong Medicine Co. Ltd., Class A |
1,900 | 10,395 | ||||||
| Huafon Chemical Co. Ltd., Class A |
2,500 | 2,360 | ||||||
| Huaibei Mining Holdings Co. Ltd., Class A |
2,600 | 4,782 | ||||||
| Hualan Biological Engineering, Inc., Class A |
2,573 | 8,145 | ||||||
| Huaneng Power International, Inc., |
7,900 | 11,300 | ||||||
| Huaneng Power International, Inc., |
56,260 | 36,139 | ||||||
| Huatai Securities Co. Ltd., Class A |
5,800 | 11,026 | ||||||
| Huatai Securities Co. Ltd., Class H, 144A |
22,639 | 28,304 | ||||||
| Huaxia Bank Co. Ltd., Class A |
14,100 | 11,451 | ||||||
| Huaxin Cement Co. Ltd., Class A |
1,500 | 2,679 | ||||||
| Huayu Automotive Systems Co. Ltd., Class A |
2,800 | 6,869 | ||||||
| Hubei Xingfa Chemicals Group Co. Ltd., Class A |
1,000 | 3,005 | ||||||
| Huizhou Desay Sv Automotive Co. Ltd., Class A |
400 | 6,377 | ||||||
| Humanwell Healthcare Group Co. Ltd., Class A |
1,500 | 5,534 | ||||||
| Hunan Changyuan Lico Co. Ltd., Class A* |
3,062 | 4,917 | ||||||
| Hunan Valin Steel Co. Ltd., Class A |
4,600 | 3,141 | ||||||
| Hundsun Technologies, Inc., Class A |
1,689 | 10,081 | ||||||
| Hygeia Healthcare Holdings Co. Ltd., |
4,609 | 27,105 | ||||||
| See Notes to Financial Statements. | 51 |
DBX ETF Trust
Schedule of Investments
Xtrackers MSCI Emerging Markets Hedged Equity ETF (Continued)
May 31, 2023
| Number |
Value |
|||||||
| China (Continued) | ||||||||
| Iflytek Co. Ltd., Class A |
2,050 | $ | 17,210 | |||||
| Imeik Technology Development Co. Ltd., Class A |
200 | 12,662 | ||||||
| Industrial & Commercial Bank of China Ltd., Class A |
49,200 | 33,389 | ||||||
| Industrial & Commercial Bank of China Ltd., Class H |
770,179 | 412,116 | ||||||
| Industrial Bank Co. Ltd., Class A |
15,459 | 35,969 | ||||||
| Industrial Securities Co. Ltd., Class A |
6,700 | 5,761 | ||||||
| Ingenic Semiconductor Co. Ltd., Class A |
600 | 7,960 | ||||||
| Inner Mongolia BaoTou Steel Union Co. Ltd., Class A |
49,800 | 12,805 | ||||||
| Inner Mongolia Dian Tou Energy Corp. Ltd., Class A |
2,900 | 5,407 | ||||||
| Inner Mongolia Junzheng Energy & Chemical Industry Group Co. Ltd., Class A |
9,600 | 5,921 | ||||||
| Inner Mongolia Yili Industrial Group Co. Ltd., Class A |
5,400 | 21,859 | ||||||
| Inner Mongolia Yitai Coal Co. Ltd., Class B |
15,100 | 19,479 | ||||||
| Inner Mongolia Yuan Xing Energy Co. Ltd., Class A |
4,700 | 4,398 | ||||||
| Innovent Biologics, Inc., 144A* |
15,825 | 74,169 | ||||||
| Inspur Electronic Information Industry Co. Ltd., Class A* |
1,585 | 9,923 | ||||||
| iQIYI, Inc., ADR* |
5,844 | 23,727 | ||||||
| JA Solar Technology Co. Ltd., Class A |
2,744 | 13,880 | ||||||
| Jafron Biomedical Co. Ltd., Class A |
950 | 3,688 | ||||||
| Jason Furniture Hangzhou Co. Ltd., Class A |
166 | 823 | ||||||
| JCET Group Co. Ltd., Class A |
1,800 | 7,891 | ||||||
| JD Health International, Inc., 144A* |
15,136 | 93,266 | ||||||
| JD Logistics, Inc., 144A* |
27,599 | 44,128 | ||||||
| JD.com, Inc., Class A |
31,703 | 509,729 | ||||||
| Jiangsu Eastern Shenghong Co. Ltd., Class A |
2,400 | 3,925 | ||||||
| Jiangsu Expressway Co. Ltd., Class H |
20,078 | 19,410 | ||||||
| Jiangsu Hengli Hydraulic Co. Ltd., Class A |
1,332 | 10,211 | ||||||
| Jiangsu Hengrui Pharmaceuticals Co. Ltd., Class A |
5,578 | 35,699 | ||||||
| Jiangsu King’s Luck Brewery JSC Ltd., Class A* |
778 | 6,088 | ||||||
| Jiangsu Pacific Quartz Co. Ltd., Class A |
400 | 6,395 | ||||||
| Jiangsu Yanghe Brewery Joint-Stock Co. Ltd., Class A |
1,200 | 22,633 | ||||||
| Jiangsu Yoke Technology Co. Ltd., Class A |
500 | 5,145 | ||||||
| Jiangsu Zhongtian Technology Co. Ltd., Class A |
3,000 | 6,129 | ||||||
| Jiangxi Copper Co. Ltd., Class A |
3,000 | 7,798 | ||||||
| Jiangxi Copper Co. Ltd., Class H |
16,826 | 25,313 | ||||||
| Jiangxi Special Electric Motor Co. Ltd., Class A* |
1,700 | 2,780 | ||||||
| Jinko Solar Co. Ltd. |
6,840 | 12,234 | ||||||
| JiuGui Liquor Co. Ltd., Class A |
300 | 3,992 | ||||||
| Jiumaojiu International Holdings Ltd., 144A |
10,083 | 17,255 | ||||||
| Number |
Value |
|||||||
| China (Continued) | ||||||||
| Jizhong Energy Resources Co. Ltd., Class A |
5,500 | $ | 5,618 | |||||
| Joincare Pharmaceutical Group Industry Co. Ltd., Class A |
2,500 | 4,823 | ||||||
| Joinn Laboratories China Co. Ltd., Class A |
280 | 1,779 | ||||||
| Jointown Pharmaceutical Group Co. Ltd., Class A |
500 | 1,139 | ||||||
| Jonjee Hi-Tech Industrial And Commercial Holding Co. Ltd., Class A |
980 | 5,005 | ||||||
| Juewei Food Co. Ltd., Class A |
300 | 1,613 | ||||||
| Kangmei Pharmaceutical Co. Ltd., |
606 | 200 | ||||||
| Kanzhun Ltd., ADR* |
2,523 | 34,994 | ||||||
| KE Holdings, Inc., ADR* |
9,072 | 129,185 | ||||||
| Keda Industrial Group Co. Ltd., Class A |
2,200 | 3,280 | ||||||
| Kingdee International Software Group Co. Ltd.* |
33,863 | 44,975 | ||||||
| Kingsoft Corp. Ltd.* (a) |
12,822 | 46,586 | ||||||
| Kuaishou Technology, 144A* |
31,566 | 213,653 | ||||||
| Kuang-Chi Technologies Co. Ltd., Class A |
1,600 | 3,570 | ||||||
| Kunlun Tech Co. Ltd., Class A |
1,200 | 9,673 | ||||||
| Kweichow Moutai Co. Ltd., Class A |
1,014 | 232,071 | ||||||
| LB Group Co. Ltd., Class A |
2,300 | 5,070 | ||||||
| Lenovo Group Ltd. |
95,854 | 90,095 | ||||||
| Lens Technology Co. Ltd., Class A |
3,700 | 6,046 | ||||||
| Lepu Medical Technology Beijing Co. Ltd., Class A |
1,020 | 3,540 | ||||||
| Li Auto, Inc., Class A* |
15,287 | 220,800 | ||||||
| Li Ning Co. Ltd. |
32,025 | 171,772 | ||||||
| Lingyi iTech Guangdong Co., Class A* |
6,890 | 6,099 | ||||||
| Longfor Group Holdings Ltd., 144A |
25,221 | 48,507 | ||||||
| LONGi Green Energy Technology Co. Ltd., Class A |
6,254 | 25,324 | ||||||
| Lufax Holding Ltd., ADR |
8,132 | 10,409 | ||||||
| Luxi Chemical Group Co. Ltd., Class A |
3,200 | 4,757 | ||||||
| Luxshare Precision Industry Co. Ltd., Class A |
6,670 | 25,584 | ||||||
| Luzhou Laojiao Co. Ltd., Class A |
1,200 | 34,400 | ||||||
| Mango Excellent Media Co. Ltd., Class A |
1,803 | 7,412 | ||||||
| Maxscend Microelectronics Co. Ltd., Class A |
448 | 5,580 | ||||||
| Meinian Onehealth Healthcare Holdings Co. Ltd., Class A* |
3,708 | 3,324 | ||||||
| Meituan, Class B, 144A* |
68,436 | 963,118 | ||||||
| Metallurgical Corp. of China Ltd., Class A |
21,700 | 12,287 | ||||||
| Microport Scientific Corp.* (a) |
8,655 | 14,899 | ||||||
| Ming Yang Smart Energy Group Ltd., Class A |
1,200 | 2,962 | ||||||
| MINISO Group Holding Ltd., ADR |
1,276 | 19,395 | ||||||
| Minth Group Ltd. |
9,591 | 23,982 | ||||||
| Montage Technology Co. Ltd., Class A |
489 | 4,383 | ||||||
| Muyuan Foods Co. Ltd., Class A |
4,764 | 26,808 | ||||||
| Nanjing King-Friend Biochemical Pharmaceutical Co. Ltd., Class A |
2,600 | 4,946 | ||||||
| NARI Technology Co. Ltd., Class A |
5,304 | 20,449 | ||||||
| National Silicon Industry Group Co. Ltd., Class A* |
3,759 | 11,831 | ||||||
| See Notes to Financial Statements. | 52 |
DBX ETF Trust
Schedule of Investments
Xtrackers MSCI Emerging Markets Hedged Equity ETF (Continued)
May 31, 2023
| Number |
Value |
|||||||
| China (Continued) | ||||||||
| NAURA Technology Group Co. Ltd., Class A |
336 | $ | 14,326 | |||||
| NavInfo Co. Ltd., Class A |
2,200 | 3,623 | ||||||
| NetEase, Inc. |
26,987 | 456,995 | ||||||
| New China Life Insurance Co. Ltd., Class A |
2,100 | 10,855 | ||||||
| New China Life Insurance Co. Ltd., Class H |
11,602 | 30,003 | ||||||
| New Hope Liuhe Co. Ltd., Class A* |
4,300 | 6,809 | ||||||
| New Oriental Education & Technology Group, Inc.* |
21,784 | 83,181 | ||||||
| Ninestar Corp., Class A |
1,200 | 6,594 | ||||||
| Ningbo Deye Technology Co. Ltd., Class A |
360 | 6,851 | ||||||
| Ningbo Joyson Electronic Corp., Class A |
1,500 | 3,340 | ||||||
| Ningbo Orient Wires & Cables Co. Ltd., Class A |
600 | 4,131 | ||||||
| Ningbo Ronbay New Energy Technology Co. Ltd., Class A |
398 | 3,219 | ||||||
| Ningbo Shanshan Co. Ltd., Class A* |
2,000 | 4,148 | ||||||
| Ningbo Tuopu Group Co. Ltd., Class A |
900 | 7,351 | ||||||
| Ningxia Baofeng Energy Group Co. Ltd., Class A |
6,000 | 10,243 | ||||||
| NIO, Inc., ADR* (a) |
18,657 | 140,487 | ||||||
| Nongfu Spring Co. Ltd., Class H, 144A (a) |
24,504 | 131,432 | ||||||
| North Industries Group Red Arrow Co. Ltd., Class A |
1,400 | 3,541 | ||||||
| Offshore Oil Engineering Co. Ltd., Class A |
4,600 | 3,968 | ||||||
| Oppein Home Group, Inc., Class A |
460 | 6,130 | ||||||
| Orient Securities Co. Ltd., Class A |
4,438 | 6,167 | ||||||
| Ovctek China, Inc., Class A |
900 | 3,528 | ||||||
| Pangang Group Vanadium Titanium & Resources Co. Ltd., Class A* |
6,600 | 3,691 | ||||||
| People’s Insurance Co. Group of China Ltd., Class A |
6,700 | 5,761 | ||||||
| People’s Insurance Co. Group of China Ltd., Class H |
114,747 | 43,376 | ||||||
| Perfect World Co. Ltd., Class A |
2,250 | 5,807 | ||||||
| PetroChina Co. Ltd., Class A |
13,632 | 14,365 | ||||||
| PetroChina Co. Ltd., Class H |
287,732 | 185,931 | ||||||
| Pharmaron Beijing Co. Ltd., Class A |
1,050 | 6,801 | ||||||
| Pharmaron Beijing Co. Ltd., Class H, 144A |
2,507 | 9,253 | ||||||
| PICC Property & Casualty Co. Ltd., Class H |
95,522 | 113,815 | ||||||
| Ping An Bank Co. Ltd., Class A |
17,900 | 29,174 | ||||||
| Ping An Healthcare and Technology Co. Ltd., 144A* (a) |
6,436 | 14,844 | ||||||
| Ping An Insurance Group Co. of China Ltd., Class A |
9,100 | 60,093 | ||||||
| Ping An Insurance Group Co. of China Ltd., Class H |
86,633 | 549,861 | ||||||
| Pingdingshan Tianan Coal Mining Co. Ltd., Class A |
2,900 | 3,256 | ||||||
| Poly Developments and Holdings Group Co. Ltd., Class A |
9,900 | 17,721 | ||||||
| Pop Mart International Group Ltd., 144A |
7,396 | 16,246 | ||||||
| Postal Savings Bank of China Co. Ltd., Class A |
23,800 | 17,188 | ||||||
| Number |
Value |
|||||||
| China (Continued) | ||||||||
| Postal Savings Bank of China Co. Ltd., Class H, 144A |
111,212 | $ | 69,876 | |||||
| Power Construction Corp. of China Ltd., Class A |
12,201 | 11,366 | ||||||
| Qifu Technology, Inc., ADR |
1,577 | 21,684 | ||||||
| Qinghai Salt Lake Industry Co. Ltd., Class A* |
4,400 | 11,616 | ||||||
| Raytron Technology Co. Ltd., Class A |
344 | 2,400 | ||||||
| Rongsheng Petrochemical Co. Ltd., Class A |
8,875 | 14,465 | ||||||
| SAIC Motor Corp. Ltd., Class A |
7,300 | 13,765 | ||||||
| Sailun Group Co. Ltd., Class A* |
2,700 | 3,938 | ||||||
| Sanan Optoelectronics Co. Ltd., Class A |
5,600 | 15,540 | ||||||
| Sangfor Technologies, Inc., Class A |
375 | 6,566 | ||||||
| Sany Heavy Equipment International Holdings Co. Ltd. |
14,851 | 19,611 | ||||||
| Sany Heavy Industry Co. Ltd., Class A |
6,000 | 12,376 | ||||||
| Satellite Chemical Co. Ltd., Class A |
3,917 | 6,973 | ||||||
| SDIC Capital Co. Ltd., Class A |
10,700 | 11,110 | ||||||
| SDIC Power Holdings Co. Ltd., Class A |
6,900 | 12,787 | ||||||
| Seazen Holdings Co. Ltd., Class A* |
2,200 | 4,321 | ||||||
| SF Holding Co. Ltd., Class A |
4,267 | 28,376 | ||||||
| SG Micro Corp., Class A |
152 | 2,316 | ||||||
| Shaanxi Coal Industry Co. Ltd., Class A |
7,100 | 16,719 | ||||||
| Shan Xi Hua Yang Group New Energy Co. Ltd., Class A |
2,500 | 4,384 | ||||||
| Shandong Buchang Pharmaceuticals Co. Ltd., Class A |
338 | 1,077 | ||||||
| Shandong Gold Mining Co. Ltd., Class A |
4,436 | 15,738 | ||||||
| Shandong Gold Mining Co. Ltd., Class H, 144A |
7,838 | 14,934 | ||||||
| Shandong Hualu Hengsheng Chemical Co. Ltd., Class A |
1,560 | 6,394 | ||||||
| Shandong Linglong Tyre Co. Ltd., Class A |
1,400 | 4,190 | ||||||
| Shandong Nanshan Aluminum Co. Ltd., Class A |
6,800 | 2,876 | ||||||
| Shandong Sun Paper Industry JSC Ltd., Class A |
3,800 | 5,595 | ||||||
| Shandong Weigao Group Medical Polymer Co. Ltd., Class H |
35,126 | 51,946 | ||||||
| Shanghai Aiko Solar Energy Co. Ltd., Class A* |
1,300 | 6,296 | ||||||
| Shanghai Bairun Investment Holding Group Co. Ltd., Class A |
980 | 4,686 | ||||||
| Shanghai Baosight Software Co. Ltd., Class A |
698 | 5,201 | ||||||
| Shanghai Baosight Software Co. Ltd., Class B |
7,150 | 23,774 | ||||||
| Shanghai Construction Group Co. Ltd., Class A |
17,700 | 6,565 | ||||||
| Shanghai Electric Group Co. Ltd., Class A* |
16,200 | 10,994 | ||||||
| Shanghai Fosun Pharmaceutical Group Co. Ltd., Class A |
1,700 | 7,448 | ||||||
| Shanghai Fosun Pharmaceutical Group Co. Ltd., Class H |
6,671 | 18,146 | ||||||
| Shanghai Friendess Electronic Technology Corp. Ltd., Class A* |
225 | 6,318 | ||||||
| See Notes to Financial Statements. | 53 |
DBX ETF Trust
Schedule of Investments
Xtrackers MSCI Emerging Markets Hedged Equity ETF (Continued)
May 31, 2023
| Number |
Value |
|||||||
| China (Continued) | ||||||||
| Shanghai Fudan Microelectronics Group Co. Ltd., Class A |
569 | $ | 4,563 | |||||
| Shanghai Fudan Microelectronics Group Co. Ltd., Class H (a) |
3,698 | 9,941 | ||||||
| Shanghai International Airport Co. Ltd., Class A* |
900 | 5,893 | ||||||
| Shanghai International Port Group Co. Ltd., Class A |
11,400 | 8,441 | ||||||
| Shanghai Jinjiang International Hotels Co. Ltd., Class A |
1,100 | 7,247 | ||||||
| Shanghai Junshi Biosciences Co. Ltd., Class A* |
514 | 3,286 | ||||||
| Shanghai Lujiazui Finance & Trade Zone Development Co. Ltd., Class B |
14,259 | 8,513 | ||||||
| Shanghai M&G Stationery, Inc., Class A |
275 | 1,643 | ||||||
| Shanghai Pharmaceuticals Holding Co. Ltd., Class A |
2,800 | 9,225 | ||||||
| Shanghai Pharmaceuticals Holding Co. Ltd., Class H |
12,618 | 25,138 | ||||||
| Shanghai Pudong Development Bank Co. Ltd., Class A |
29,200 | 30,155 | ||||||
| Shanghai Putailai New Energy Technology Co. Ltd., Class A |
942 | 4,701 | ||||||
| Shanghai RAAS Blood Products Co. Ltd., Class A |
5,600 | 5,287 | ||||||
| Shanghai Rural Commercial Bank Co. Ltd., Class A |
9,000 | 7,461 | ||||||
| Shanxi Coking Coal Energy Group Co. Ltd., Class A |
3,640 | 5,038 | ||||||
| Shanxi Lu’an Environmental Energy Development Co. Ltd., Class A |
3,000 | 7,882 | ||||||
| Shanxi Meijin Energy Co. Ltd., Class A |
4,700 | 4,735 | ||||||
| Shanxi Securities Co. Ltd., Class A |
4,050 | 3,312 | ||||||
| Shanxi Taigang Stainless Steel Co. Ltd., Class A |
5,900 | 3,299 | ||||||
| Shanxi Xinghuacun Fen Wine Factory Co. Ltd., Class A |
980 | 28,892 | ||||||
| Shede Spirits Co. Ltd., Class A |
400 | 8,880 | ||||||
| Shenghe Resources Holding Co. Ltd., Class A |
1,600 | 2,873 | ||||||
| Shengyi Technology Co. Ltd., Class A |
2,455 | 5,264 | ||||||
| Shennan Circuits Co. Ltd., Class A |
658 | 7,243 | ||||||
| Shenwan Hongyuan Group Co. Ltd., Class A |
21,000 | 13,927 | ||||||
| Shenzhen Capchem Technology Co. Ltd., Class A |
540 | 3,568 | ||||||
| Shenzhen Dynanonic Co. Ltd., Class A |
320 | 4,944 | ||||||
| Shenzhen Energy Group Co. Ltd., Class A |
6,260 | 6,078 | ||||||
| Shenzhen Inovance Technology Co. Ltd., Class A |
1,937 | 16,082 | ||||||
| Shenzhen Kangtai Biological Products Co. Ltd., Class A |
752 | 2,936 | ||||||
| Shenzhen Kedali Industry Co. Ltd., Class A |
300 | 5,358 | ||||||
| Shenzhen Mindray Bio-Medical Electronics Co. Ltd., Class A |
1,070 | 45,189 | ||||||
| Shenzhen New Industries Biomedical Engineering Co. Ltd., Class A |
314 | 2,643 | ||||||
| Number |
Value |
|||||||
| China (Continued) | ||||||||
| Shenzhen Overseas Chinese Town Co. Ltd., Class A |
3,185 | $ | 2,126 | |||||
| Shenzhen Salubris Pharmaceuticals Co. Ltd., Class A |
200 | 985 | ||||||
| Shenzhen SC New Energy Technology Corp., Class A |
300 | 4,031 | ||||||
| Shenzhen Senior Technology Material Co. Ltd., Class A |
2,200 | 5,001 | ||||||
| Shenzhen Transsion Holdings Co. Ltd., Class A |
422 | 7,456 | ||||||
| Shenzhou International Group Holdings Ltd. |
10,902 | 88,269 | ||||||
| Shijiazhuang Yiling Pharmaceutical Co. Ltd., Class A |
1,700 | 6,843 | ||||||
| Sichuan Chuantou Energy Co. Ltd., Class A |
2,200 | 4,606 | ||||||
| Sichuan Hebang Biotechnology Co. Ltd., Class A* |
11,600 | 3,830 | ||||||
| Sichuan Kelun Pharmaceutical Co. Ltd., Class A |
400 | 1,741 | ||||||
| Sichuan New Energy Power Co. Ltd.* |
1,800 | 3,543 | ||||||
| Sichuan Road & Bridge Group Co. Ltd., Class A |
4,900 | 10,465 | ||||||
| Sichuan Swellfun Co. Ltd., Class A |
500 | 4,096 | ||||||
| Sichuan Yahua Industrial Group Co. Ltd., Class A |
1,500 | 3,789 | ||||||
| Sieyuan Electric Co. Ltd., Class A |
1,000 | 6,651 | ||||||
| Silergy Corp. |
4,545 | 59,239 | ||||||
| Sinoma Science & Technology Co. Ltd., Class A |
1,000 | 2,729 | ||||||
| Sinomine Resource Group Co. Ltd., Class A |
700 | 5,272 | ||||||
| Sinopec Shanghai Petrochemical Co. Ltd., Class A |
1,200 | 529 | ||||||
| Sinopharm Group Co. Ltd., Class H |
18,642 | 61,065 | ||||||
| Skshu Paint Co. Ltd., Class A* |
420 | 5,276 | ||||||
| Smoore International Holdings Ltd., 144A |
23,681 | 23,831 | ||||||
| Songcheng Performance Development Co. Ltd., Class A |
2,520 | 4,497 | ||||||
| SooChow Securities Co. Ltd., Class A |
1,352 | 1,366 | ||||||
| Spring Airlines Co. Ltd., Class A* |
1,200 | 9,745 | ||||||
| StarPower Semiconductor Ltd., Class A |
200 | 6,130 | ||||||
| Sunac China Holdings Ltd.* |
40,216 | 6,112 | ||||||
| Sungrow Power Supply Co. Ltd., Class A |
1,140 | 17,642 | ||||||
| Sunny Optical Technology Group Co. Ltd. |
9,550 | 89,762 | ||||||
| Sunwoda Electronic Co. Ltd., Class A |
1,800 | 4,026 | ||||||
| Suzhou Dongshan Precision Manufacturing Co. Ltd., Class A |
898 | 3,206 | ||||||
| Suzhou Maxwell Technologies Co. Ltd., Class A |
256 | 5,683 | ||||||
| TAL Education Group, ADR* |
5,662 | 30,745 | ||||||
| Tangshan Jidong Cement Co. Ltd., Class A |
5,300 | 5,741 | ||||||
| TBEA Co. Ltd., Class A |
3,100 | 9,744 | ||||||
| TCL Technology Group Corp., Class A |
14,080 | 7,636 | ||||||
| TCL Zhonghuan Renewable Energy Technology Co. Ltd., Class A |
3,236 | 16,891 | ||||||
| See Notes to Financial Statements. | 54 |
DBX ETF Trust
Schedule of Investments
Xtrackers MSCI Emerging Markets Hedged Equity ETF (Continued)
May 31, 2023
| Number |
Value |
|||||||
| China (Continued) | ||||||||
| Tencent Holdings Ltd. |
84,139 | $ | 3,337,429 | |||||
| Tencent Music Entertainment Group, |
9,448 | 65,569 | ||||||
| Thunder Software Technology Co. Ltd., Class A |
400 | 5,497 | ||||||
| Tianma Microelectronics Co. Ltd., |
1,000 | 1,359 | ||||||
| Tianqi Lithium Corp., Class A* |
1,200 | 12,129 | ||||||
| Tianshan Aluminum Group Co. Ltd., Class A |
774 | 685 | ||||||
| Tibet Summit Resources Co. Ltd., |
1,400 | 3,482 | ||||||
| Tingyi Cayman Islands Holding Corp. |
28,665 | 42,977 | ||||||
| Titan Wind Energy Suzhou Co. Ltd., Class A |
2,500 | 5,466 | ||||||
| Tongcheng Travel Holdings Ltd.* |
17,013 | 33,937 | ||||||
| TongFu Microelectronics Co. Ltd., Class A |
2,100 | 7,309 | ||||||
| Tongkun Group Co. Ltd., Class A |
2,000 | 3,389 | ||||||
| Tongling Nonferrous Metals Group Co. Ltd., Class A* |
2,600 | 1,059 | ||||||
| Tongwei Co. Ltd., Class A |
4,100 | 19,655 | ||||||
| Topchoice Medical Corp., Class A* |
255 | 3,789 | ||||||
| Topsports International Holdings Ltd., 144A |
27,577 | 21,412 | ||||||
| TravelSky Technology Ltd., Class H |
12,348 | 22,518 | ||||||
| Trina Solar Co. Ltd., Class A |
2,056 | 11,353 | ||||||
| Trip.Com Group Ltd.* |
7,500 | 240,599 | ||||||
| Tsingtao Brewery Co. Ltd., Class A |
500 | 6,689 | ||||||
| Tsingtao Brewery Co. Ltd., Class H |
8,145 | 70,107 | ||||||
| Unigroup Guoxin Microelectronics Co. Ltd., Class A |
929 | 12,028 | ||||||
| Uni-President China Holdings Ltd.* |
13,233 | 11,492 | ||||||
| Unisplendour Corp. Ltd., Class A |
3,254 | 14,914 | ||||||
| Vipshop Holdings Ltd., ADR* |
4,884 | 69,939 | ||||||
| Walvax Biotechnology Co. Ltd., Class A |
1,300 | 5,277 | ||||||
| Wanhua Chemical Group Co. Ltd., Class A |
2,789 | 32,235 | ||||||
| Weibo Corp., ADR* |
845 | 11,805 | ||||||
| Weichai Power Co. Ltd., Class A |
5,900 | 9,583 | ||||||
| Weichai Power Co. Ltd., Class H |
26,241 | 35,656 | ||||||
| Weihai Guangwei Composites Co. Ltd., Class A |
800 | 3,292 | ||||||
| Wens Foodstuffs Group Co. Ltd., Class A |
4,716 | 11,145 | ||||||
| Western Securities Co. Ltd., Class A |
900 | 819 | ||||||
| Western Superconducting Technologies Co. Ltd., Class A |
564 | 6,150 | ||||||
| Will Semiconductor Co. Ltd., Class A |
791 | 11,102 | ||||||
| Wingtech Technology Co. Ltd., Class A |
1,035 | 7,257 | ||||||
| Wuchan Zhongda Group Co. Ltd., Class A |
4,500 | 3,256 | ||||||
| Wuhan Guide Infrared Co. Ltd., Class A* |
3,665 | 5,289 | ||||||
| Wuliangye Yibin Co. Ltd., Class A |
3,307 | 74,892 | ||||||
| WUS Printed Circuit Kunshan Co. Ltd., Class A |
2,200 | 6,457 | ||||||
| WuXi AppTec Co. Ltd., Class A |
1,911 | 17,453 | ||||||
| WuXi AppTec Co. Ltd., Class H, 144A* |
4,771 | 39,299 | ||||||
| Wuxi Autowell Technology Co. Ltd., Class A |
251 | 6,203 | ||||||
| Wuxi Biologics Cayman, Inc., 144A* |
51,499 | 263,399 | ||||||
| Number |
Value |
|||||||
| China (Continued) | ||||||||
| XCMG Construction Machinery Co. Ltd., Class A |
8,400 | $ | 7,058 | |||||
| Xiamen C & D, Inc., Class A |
3,500 | 5,709 | ||||||
| Xiamen Faratronic Co. Ltd., Class A |
300 | 5,648 | ||||||
| Xiamen Tungsten Co. Ltd., Class A* |
1,800 | 4,567 | ||||||
| Xiaomi Corp., Class B, 144A* |
207,556 | 274,075 | ||||||
| Xinjiang Goldwind Science & Technology Co. Ltd., Class A |
1,138 | 1,740 | ||||||
| Xinyi Solar Holdings Ltd. |
71,769 | 70,848 | ||||||
| XPeng, Inc., Class A* (a) |
12,459 | 49,404 | ||||||
| Xtep International Holdings Ltd. |
17,203 | 17,290 | ||||||
| Yadea Group Holdings Ltd., 144A (a) |
17,563 | 34,989 | ||||||
| Yangzhou Yangjie Electronic Technology Co. Ltd., Class A* |
700 | 4,052 | ||||||
| Yankuang Energy Group Co. Ltd., Class A |
2,200 | 8,386 | ||||||
| Yankuang Energy Group Co. Ltd., Class H |
21,892 | 55,468 | ||||||
| Yantai Jereh Oilfield Services Group Co. Ltd., Class A* |
1,100 | 3,771 | ||||||
| Yealink Network Technology Corp. Ltd., Class A* |
900 | 6,702 | ||||||
| Yifeng Pharmacy Chain Co. Ltd., Class A |
730 | 5,089 | ||||||
| Yihai International Holding Ltd.* (a) |
6,646 | 14,734 | ||||||
| Yihai Kerry Arawana Holdings Co. Ltd., Class A |
900 | 5,083 | ||||||
| Yintai Gold Co. Ltd., Class A |
2,400 | 4,367 | ||||||
| YongXing Special Materials Technology Co. Ltd., Class A |
520 | 4,621 | ||||||
| Yonyou Network Technology Co. Ltd., Class A |
2,697 | 7,533 | ||||||
| Youngor Group Co. Ltd., Class A |
7,500 | 7,239 | ||||||
| Youngy Co. Ltd., Class A* |
300 | 2,593 | ||||||
| YTO Express Group Co. Ltd., Class A |
2,500 | 5,406 | ||||||
| Yum China Holdings, Inc. |
5,688 | 321,144 | ||||||
| Yunda Holding Co. Ltd., Class A |
3,160 | 5,062 | ||||||
| Yunnan Aluminium Co. Ltd., Class A |
3,800 | 6,460 | ||||||
| Yunnan Baiyao Group Co. Ltd., Class A |
1,400 | 10,593 | ||||||
| Yunnan Botanee Bio-Technology Group Co. Ltd., Class A |
200 | 2,591 | ||||||
| Yunnan Energy New Material Co. Ltd., Class A* |
760 | 9,709 | ||||||
| Yunnan Yuntianhua Co. Ltd., Class A |
1,500 | 3,511 | ||||||
| Zai Lab Ltd.* (a) |
12,000 | 39,615 | ||||||
| Zangge Mining Co. Ltd., Class A |
1,300 | 4,197 | ||||||
| Zhangzhou Pientzehuang Pharmaceutical Co. Ltd., Class A |
500 | 21,371 | ||||||
| Zhaojin Mining Industry Co. Ltd., Class H* |
13,459 | 19,113 | ||||||
| Zhejiang Century Huatong Group Co. Ltd., Class A* |
8,280 | 7,236 | ||||||
| Zhejiang Chint Electrics Co. Ltd., Class A |
2,300 | 8,451 | ||||||
| Zhejiang Dahua Technology Co. Ltd., Class A |
932 | 2,598 | ||||||
| Zhejiang Expressway Co. Ltd., Class H |
21,098 | 15,627 | ||||||
| Zhejiang Huahai Pharmaceutical Co. Ltd., Class A |
2,000 | 5,185 | ||||||
| Zhejiang Huayou Cobalt Co. Ltd., Class A |
1,627 | 10,573 | ||||||
| Zhejiang Jingsheng Mechanical & Electrical Co. Ltd., Class A |
1,100 | 10,657 | ||||||
| See Notes to Financial Statements. | 55 |
DBX ETF Trust
Schedule of Investments
Xtrackers MSCI Emerging Markets Hedged Equity ETF (Continued)
May 31, 2023
| Number |
Value |
|||||||
| China (Continued) | ||||||||
| Zhejiang Jiuzhou Pharmaceutical Co. Ltd., Class A |
1,000 | $ | 4,093 | |||||
| Zhejiang Juhua Co. Ltd., Class A |
2,100 | 3,880 | ||||||
| Zhejiang NHU Co. Ltd., Class A* |
1,483 | 3,146 | ||||||
| Zhejiang Supcon Technology Co. Ltd., Class A |
402 | 5,842 | ||||||
| Zhejiang Supor Co. Ltd., Class A |
68 | 427 | ||||||
| Zhejiang Weiming Environment Protection Co. Ltd., Class A |
1,500 | 3,817 | ||||||
| Zhejiang Weixing New Building Materials Co. Ltd., Class A |
1,900 | 5,155 | ||||||
| Zhejiang Wolwo Bio-Pharmaceutical Co. Ltd., Class A |
700 | 3,750 | ||||||
| Zhejiang Zheneng Electric Power Co. Ltd., Class A* |
13,100 | 9,571 | ||||||
| Zheshang Securities Co. Ltd., Class A |
2,100 | 2,951 | ||||||
| ZhongAn Online P&C Insurance Co. Ltd., Class H, 144A* |
10,403 | 29,294 | ||||||
| Zhongji Innolight Co. Ltd., Class A* |
700 | 10,573 | ||||||
| Zhongjin Gold Corp. Ltd., Class A |
3,700 | 5,838 | ||||||
| Zhongsheng Group Holdings Ltd. |
8,019 | 29,596 | ||||||
| Zhongtai Securities Co. Ltd., Class A |
4,000 | 3,827 | ||||||
| Zhuzhou CRRC Times Electric Co. Ltd. |
7,223 | 30,394 | ||||||
| Zhuzhou CRRC Times Electric Co. Ltd., Class A |
771 | 4,957 | ||||||
| Zhuzhou Kibing Group Co. Ltd., Class A* |
1,800 | 2,043 | ||||||
| Zijin Mining Group Co. Ltd., Class A |
16,600 | 24,933 | ||||||
| Zijin Mining Group Co. Ltd., Class H |
77,714 | 105,399 | ||||||
| Zoomlion Heavy Industry Science and Technology Co. Ltd., Class A |
6,976 | 6,204 | ||||||
| ZTE Corp., Class A |
3,200 | 15,817 | ||||||
| ZTE Corp., Class H |
11,485 | 35,274 | ||||||
| ZTO Express Cayman, Inc., ADR |
5,653 | 142,682 | ||||||
|
|
|
|||||||
| (Cost $25,355,090) |
23,603,967 | |||||||
|
|
|
|||||||
| Colombia — 0.1% | ||||||||
| Bancolombia SA |
3,936 | 24,589 | ||||||
| Interconexion Electrica SA ESP |
6,175 | 24,422 | ||||||
|
|
|
|||||||
| (Cost $61,807) |
49,011 | |||||||
|
|
|
|||||||
| Cyprus — 0.0% | ||||||||
| Polymetal International PLC* (b) |
4,894 | 0 | ||||||
| TCS Group Holding PLC, GDR* (b) |
1,702 | 0 | ||||||
|
|
|
|||||||
| (Cost $173,897) |
0 | |||||||
|
|
|
|||||||
| Czech Republic — 0.2% | ||||||||
| CEZ AS |
2,125 | 95,600 | ||||||
| Komercni Banka AS |
1,123 | 33,470 | ||||||
| Moneta Money Bank AS, 144A |
5,303 | 18,923 | ||||||
|
|
|
|||||||
| (Cost $99,587) |
147,993 | |||||||
|
|
|
|||||||
| Egypt — 0.1% | ||||||||
| Commercial International Bank Egypt SAE |
33,883 | 57,349 | ||||||
| Eastern Co. SAE |
17,485 | 10,791 | ||||||
| Egyptian Financial Group-Hermes Holding Co.* |
13,302 | 8,153 | ||||||
| Number |
Value |
|||||||
| Egypt (Continued) | ||||||||
| Fawry for Banking & Payment Technology Services SAE* |
6,535 | $ | 1,206 | |||||
|
|
|
|||||||
| (Cost $90,442) |
77,499 | |||||||
|
|
|
|||||||
| Greece — 0.4% | ||||||||
| Alpha Services and Holdings SA* |
30,350 | 44,947 | ||||||
| Eurobank Ergasias Services and Holdings SA* |
34,242 | 53,438 | ||||||
| Hellenic Telecommunications Organization SA |
2,770 | 42,400 | ||||||
| JUMBO SA |
1,483 | 34,398 | ||||||
| Motor Oil Hellas Corinth Refineries SA |
843 | 21,734 | ||||||
| Mytilineos SA |
1,419 | 44,714 | ||||||
| National Bank of Greece SA* |
7,718 | 47,849 | ||||||
| OPAP SA |
2,796 | 47,759 | ||||||
| Public Power Corp. SA* |
2,587 | 27,390 | ||||||
| Terna Energy SA |
810 | 17,437 | ||||||
|
|
|
|||||||
| (Cost $281,954) |
382,066 | |||||||
|
|
|
|||||||
| Hong Kong — 1.8% | ||||||||
| Alibaba Health Information Technology |
65,217 | 38,645 | ||||||
| Beijing Enterprises Holdings Ltd. |
8,171 | 31,566 | ||||||
| Beijing Enterprises Water Group Ltd. |
49,069 | 12,032 | ||||||
| Bosideng International Holdings Ltd. |
40,915 | 16,982 | ||||||
| C&D International Investment Group Ltd.* |
8,504 | 21,373 | ||||||
| China Everbright Environment Group Ltd. |
46,457 | 18,155 | ||||||
| China Gas Holdings Ltd. |
42,300 | 47,970 | ||||||
| China Jinmao Holdings Group Ltd. |
85,312 | 12,202 | ||||||
| China Medical System Holdings Ltd. |
18,965 | 26,642 | ||||||
| China Mengniu Dairy Co. Ltd.* |
42,408 | 164,640 | ||||||
| China Merchants Port Holdings Co. Ltd. |
19,294 | 27,991 | ||||||
| China Overseas Land & Investment Ltd. |
52,925 | 107,331 | ||||||
| China Overseas Property Holdings Ltd. |
18,814 | 17,251 | ||||||
| China Power International Development Ltd. |
71,798 | 27,324 | ||||||
| China Resources Beer Holdings Co. Ltd. |
22,019 | 138,911 | ||||||
| China Resources Cement Holdings Ltd. |
34,265 | 12,471 | ||||||
| China Resources Gas Group Ltd. |
12,361 | 40,648 | ||||||
| China Resources Land Ltd. |
43,903 | 164,276 | ||||||
| China Resources Power Holdings Co. Ltd. |
26,610 | 61,441 | ||||||
| China Ruyi Holdings Ltd.* (a) |
62,792 | 14,033 | ||||||
| China State Construction International Holdings Ltd. |
26,516 | 29,968 | ||||||
| China Taiping Insurance Holdings Co. Ltd. |
21,417 | 22,318 | ||||||
| China Traditional Chinese Medicine Holdings Co. Ltd. |
41,519 | 19,989 | ||||||
| Chow Tai Fook Jewellery Group Ltd. (a) |
26,715 | 47,286 | ||||||
| COSCO SHIPPING Ports Ltd. |
27,086 | 17,053 | ||||||
| Far East Horizon Ltd. (a) |
21,048 | 17,633 | ||||||
| GCL Technology Holdings Ltd.* (a) |
278,189 | 60,395 | ||||||
| Geely Automobile Holdings Ltd. |
83,133 | 96,718 | ||||||
| Guangdong Investment Ltd. |
41,419 | 35,281 | ||||||
| Kingboard Holdings Ltd. |
9,057 | 24,405 | ||||||
| Kingboard Laminates Holdings Ltd. |
14,186 | 12,971 | ||||||
| Kunlun Energy Co. Ltd.* |
50,575 | 40,303 | ||||||
| See Notes to Financial Statements. | 56 |
DBX ETF Trust
Schedule of Investments
Xtrackers MSCI Emerging Markets Hedged Equity ETF (Continued)
May 31, 2023
| Number |
Value |
|||||||
| Hong Kong (Continued) | ||||||||
| Nine Dragons Paper Holdings Ltd. (a) |
16,156 | $ | 8,954 | |||||
| Orient Overseas International Ltd. (a) |
1,812 | 22,088 | ||||||
| Shenzhen International Holdings Ltd. |
16,004 | 12,692 | ||||||
| Shimao Group Holdings Ltd.* (b) |
18,475 | 0 | ||||||
| Sino Biopharmaceutical Ltd. |
136,085 | 64,823 | ||||||
| Vinda International Holdings Ltd. |
5,643 | 13,577 | ||||||
| Want Want China Holdings Ltd. |
61,725 | 41,305 | ||||||
| Yuexiu Property Co. Ltd. (a) |
21,842 | 23,654 | ||||||
|
|
|
|||||||
| (Cost $1,785,811) |
1,613,297 | |||||||
|
|
|
|||||||
| Hungary — 0.2% | ||||||||
| MOL Hungarian Oil & Gas PLC |
5,606 | 45,606 | ||||||
| OTP Bank Nyrt |
2,944 | 91,681 | ||||||
| Richter Gedeon Nyrt |
1,950 | 49,082 | ||||||
|
|
|
|||||||
| (Cost $153,115) |
186,369 | |||||||
|
|
|
|||||||
| India — 14.3% | ||||||||
| ABB India Ltd. |
687 | 34,261 | ||||||
| ACC Ltd.* |
800 | 17,185 | ||||||
| Adani Enterprises Ltd. |
2,289 | 68,985 | ||||||
| Adani Green Energy Ltd.* |
4,192 | 49,540 | ||||||
| Adani Ports & Special Economic Zone Ltd. |
7,499 | 66,971 | ||||||
| Adani Power Ltd.* |
10,412 | 31,419 | ||||||
| Ambuja Cements Ltd.* |
8,324 | 42,620 | ||||||
| Apollo Hospitals Enterprise Ltd. |
1,417 | 79,163 | ||||||
| Asian Paints Ltd. |
5,233 | 201,962 | ||||||
| AU Small Finance Bank Ltd., 144A |
1,978 | 18,575 | ||||||
| Aurobindo Pharma Ltd. |
4,008 | 31,906 | ||||||
| Avenue Supermarts Ltd., 144A* |
2,151 | 90,251 | ||||||
| Axis Bank Ltd. |
30,791 | 340,487 | ||||||
| Bajaj Auto Ltd. |
823 | 45,433 | ||||||
| Bajaj Finance Ltd. |
3,704 | 312,943 | ||||||
| Bajaj Finserv Ltd. |
5,201 | 91,221 | ||||||
| Bajaj Holdings & Investment Ltd. |
388 | 34,071 | ||||||
| Balkrishna Industries Ltd. |
1,194 | 32,816 | ||||||
| Bandhan Bank Ltd., 144A* |
8,893 | 28,808 | ||||||
| Bank of Baroda |
13,872 | 31,020 | ||||||
| Berger Paints India Ltd. |
3,075 | 24,176 | ||||||
| Bharat Electronics Ltd. |
48,406 | 65,618 | ||||||
| Bharat Forge Ltd. |
3,470 | 33,189 | ||||||
| Bharat Petroleum Corp. Ltd. |
9,246 | 40,624 | ||||||
| Bharti Airtel Ltd. |
30,313 | 311,404 | ||||||
| Britannia Industries Ltd. |
1,456 | 81,960 | ||||||
| CG Power & Industrial Solutions Ltd. |
8,706 | 41,340 | ||||||
| Cholamandalam Investment and Finance Co. Ltd. |
5,355 | 68,022 | ||||||
| Cipla Ltd. |
6,376 | 73,450 | ||||||
| Coal India Ltd. |
21,354 | 62,269 | ||||||
| Colgate-Palmolive India Ltd. |
1,863 | 35,837 | ||||||
| Container Corp. Of India Ltd. |
3,859 | 31,296 | ||||||
| Dabur India Ltd. |
8,282 | 55,599 | ||||||
| Divi’s Laboratories Ltd. |
1,589 | 66,140 | ||||||
| DLF Ltd. |
8,877 | 50,956 | ||||||
| Dr. Reddy’s Laboratories Ltd. |
1,506 | 81,934 | ||||||
| Eicher Motors Ltd. |
1,928 | 85,572 | ||||||
| GAIL India Ltd. |
32,547 | 41,229 | ||||||
| Number |
Value |
|||||||
| India (Continued) | ||||||||
| Godrej Consumer Products Ltd.* |
5,681 | $ | 72,674 | |||||
| Godrej Properties Ltd.* |
1,957 | 32,887 | ||||||
| Grasim Industries Ltd. |
3,499 | 72,675 | ||||||
| Havells India Ltd. |
3,331 | 52,661 | ||||||
| HCL Technologies Ltd. |
13,011 | 180,086 | ||||||
| HDFC Life Insurance Co. Ltd., 144A* |
13,236 | 94,768 | ||||||
| Hero MotoCorp Ltd. |
1,572 | 52,441 | ||||||
| Hindalco Industries Ltd. |
15,931 | 78,161 | ||||||
| Hindustan Aeronautics Ltd. |
1,113 | 41,934 | ||||||
| Hindustan Petroleum Corp. Ltd. |
8,217 | 25,913 | ||||||
| Hindustan Unilever Ltd. |
11,262 | 363,124 | ||||||
| Housing Development Finance Corp. Ltd. |
23,535 | 751,123 | ||||||
| ICICI Bank Ltd. |
69,802 | 800,810 | ||||||
| ICICI Lombard General Insurance Co. Ltd., 144A |
2,946 | 42,093 | ||||||
| ICICI Prudential Life Insurance Co. Ltd., 144A |
4,785 | 26,952 | ||||||
| Indian Hotels Co. Ltd. |
10,878 | 51,240 | ||||||
| Indian Oil Corp. Ltd. |
42,523 | 46,259 | ||||||
| Indian Railway Catering & Tourism Corp. Ltd. |
2,417 | 18,975 | ||||||
| Indraprastha Gas Ltd. |
4,455 | 25,880 | ||||||
| Info Edge India Ltd. |
1,037 | 51,064 | ||||||
| Infosys Ltd. |
44,877 | 715,097 | ||||||
| InterGlobe Aviation Ltd., 144A* |
1,908 | 54,716 | ||||||
| ITC Ltd. |
41,065 | 221,129 | ||||||
| Jindal Steel & Power Ltd. |
5,332 | 33,336 | ||||||
| JSW Steel Ltd. |
7,833 | 65,925 | ||||||
| Jubilant Foodworks Ltd. |
5,877 | 34,332 | ||||||
| Kotak Mahindra Bank Ltd. |
14,681 | 357,452 | ||||||
| Larsen & Toubro Ltd. |
9,256 | 246,767 | ||||||
| LTIMindtree Ltd., 144A |
1,188 | 71,775 | ||||||
| Lupin Ltd. |
3,109 | 30,233 | ||||||
| Mahindra & Mahindra Ltd. |
12,677 | 202,110 | ||||||
| Marico Ltd. |
6,831 | 44,839 | ||||||
| Maruti Suzuki India Ltd. |
1,845 | 208,909 | ||||||
| Max Healthcare Institute Ltd.* |
10,584 | 70,292 | ||||||
| Mphasis Ltd. |
1,258 | 29,603 | ||||||
| MRF Ltd. |
27 | 31,726 | ||||||
| Muthoot Finance Ltd. |
1,737 | 23,421 | ||||||
| Nestle India Ltd. |
443 | 116,052 | ||||||
| NTPC Ltd. |
56,754 | 119,261 | ||||||
| Oil & Natural Gas Corp. Ltd. |
39,479 | 73,917 | ||||||
| Page Industries Ltd. |
92 | 43,120 | ||||||
| Petronet LNG Ltd. |
11,532 | 31,481 | ||||||
| PI Industries Ltd. |
1,092 | 47,739 | ||||||
| Pidilite Industries Ltd. |
2,129 | 67,110 | ||||||
| Power Grid Corp. of India Ltd. |
43,728 | 123,602 | ||||||
| Reliance Industries Ltd. |
40,901 | 1,221,069 | ||||||
| Samvardhana Motherson International Ltd. |
24,697 | 23,598 | ||||||
| SBI Cards & Payment Services Ltd. |
3,140 | 34,802 | ||||||
| SBI Life Insurance Co. Ltd., 144A |
5,885 | 87,850 | ||||||
| Shree Cement Ltd. |
119 | 36,197 | ||||||
| Shriram Finance Ltd. |
2,870 | 48,558 | ||||||
| Siemens Ltd. |
1,018 | 43,702 | ||||||
| Sona Blw Precision Forgings Ltd., 144A |
5,785 | 37,868 | ||||||
| See Notes to Financial Statements. | 57 |
DBX ETF Trust
Schedule of Investments
Xtrackers MSCI Emerging Markets Hedged Equity ETF (Continued)
May 31, 2023
| Number |
Value |
|||||||
| India (Continued) | ||||||||
| SRF Ltd. |
2,004 | $ | 61,035 | |||||
| State Bank of India |
24,649 | 172,760 | ||||||
| Sun Pharmaceutical Industries Ltd. |
12,594 | 148,474 | ||||||
| Tata Consultancy Services Ltd. |
12,335 | 490,452 | ||||||
| Tata Consumer Products Ltd. |
7,881 | 76,079 | ||||||
| Tata Elxsi Ltd. |
485 | 43,507 | ||||||
| Tata Motors Ltd.* |
22,810 | 145,106 | ||||||
| Tata Power Co. Ltd. |
20,561 | 53,073 | ||||||
| Tata Steel Ltd. |
98,815 | 126,368 | ||||||
| Tech Mahindra Ltd. |
7,252 | 97,785 | ||||||
| Titan Co. Ltd. |
4,903 | 167,316 | ||||||
| Torrent Pharmaceuticals Ltd. |
1,579 | 35,038 | ||||||
| Trent Ltd. |
2,666 | 50,285 | ||||||
| Tube Investments of India Ltd. |
1,440 | 49,831 | ||||||
| TVS Motor Co. Ltd. |
2,990 | 47,084 | ||||||
| UltraTech Cement Ltd. |
1,539 | 146,401 | ||||||
| United Spirits Ltd.* |
4,273 | 45,632 | ||||||
| UPL Ltd. |
6,799 | 56,302 | ||||||
| Varun Beverages Ltd. |
3,023 | 61,915 | ||||||
| Vedanta Ltd. |
10,028 | 33,733 | ||||||
| Wipro Ltd. |
18,953 | 92,472 | ||||||
| Yes Bank Ltd.* |
176,395 | 34,540 | ||||||
| Zomato Ltd.* |
60,281 | 50,312 | ||||||
|
|
|
|||||||
| (Cost $9,292,284) |
12,665,060 | |||||||
|
|
|
|||||||
| Indonesia — 2.1% | ||||||||
| Aneka Tambang Tbk |
115,155 | 14,558 | ||||||
| GoTo Gojek Tokopedia Tbk PT* |
11,407,769 | 111,871 | ||||||
| PT Adaro Energy Indonesia Tbk |
200,306 | 27,260 | ||||||
| PT Astra International Tbk |
270,606 | 116,438 | ||||||
| PT Bank Central Asia Tbk |
752,259 | 454,166 | ||||||
| PT Bank Mandiri Persero Tbk |
503,774 | 169,717 | ||||||
| PT Bank Negara Indonesia Persero Tbk |
106,841 | 64,504 | ||||||
| PT Bank Rakyat Indonesia Persero Tbk |
913,649 | 339,799 | ||||||
| PT Barito Pacific Tbk* |
429,761 | 21,789 | ||||||
| PT Charoen Pokphand Indonesia Tbk |
104,446 | 34,490 | ||||||
| PT Indah Kiat Pulp & Paper Tbk |
36,440 | 16,774 | ||||||
| PT Indofood CBP Sukses Makmur Tbk |
33,200 | 25,913 | ||||||
| PT Indofood Sukses Makmur Tbk |
38,954 | 18,451 | ||||||
| PT Kalbe Farma Tbk |
249,016 | 33,723 | ||||||
| PT Merdeka Copper Gold Tbk* |
160,702 | 32,162 | ||||||
| PT Sarana Menara Nusantara Tbk |
305,741 | 20,192 | ||||||
| PT Semen Indonesia Persero Tbk |
49,425 | 19,124 | ||||||
| PT Sumber Alfaria Trijaya Tbk |
223,853 | 39,424 | ||||||
| PT Telkom Indonesia Persero Tbk |
679,688 | 183,185 | ||||||
| PT Unilever Indonesia Tbk |
105,841 | 31,985 | ||||||
| PT United Tractors Tbk |
23,838 | 35,343 | ||||||
| PT Vale Indonesia Tbk |
32,281 | 13,567 | ||||||
|
|
|
|||||||
| (Cost $1,496,128) |
1,824,435 | |||||||
|
|
|
|||||||
| Ireland — 0.5% | ||||||||
| PDD Holdings, Inc., ADR* (Cost $493,649) |
6,851 | 447,507 | ||||||
|
|
|
|||||||
| Kuwait — 0.8% | ||||||||
| Agility Public Warehousing Co. KSC |
19,473 | 38,686 | ||||||
| Boubyan Bank KSCP |
19,881 | 38,786 | ||||||
| Gulf Bank KSCP |
20,479 | 17,047 | ||||||
| Number |
Value |
|||||||
| Kuwait (Continued) | ||||||||
| Kuwait Finance House KSCP |
111,147 | $ | 255,506 | |||||
| Mabanee Co KPSC |
8,493 | 20,463 | ||||||
| Mobile Telecommunications Co. KSCP |
23,417 | 39,593 | ||||||
| National Bank of Kuwait SAKP |
98,747 | 295,390 | ||||||
|
|
|
|||||||
| (Cost $593,998) |
705,471 | |||||||
|
|
|
|||||||
| Luxembourg — 0.0% | ||||||||
| Reinet Investments SCA |
||||||||
| (Cost $36,502) |
1,932 | 38,211 | ||||||
|
|
|
|||||||
| Malaysia — 1.4% | ||||||||
| AMMB Holdings Bhd |
25,746 | 20,304 | ||||||
| Axiata Group Bhd |
40,099 | 24,152 | ||||||
| Celcomdigi Bhd |
43,560 | 42,187 | ||||||
| CIMB Group Holdings Bhd |
81,835 | 85,461 | ||||||
| Dialog Group Bhd |
47,536 | 22,246 | ||||||
| Gamuda Bhd |
23,562 | 22,666 | ||||||
| Genting Bhd |
31,267 | 28,452 | ||||||
| Genting Malaysia Bhd |
34,645 | 18,841 | ||||||
| Hong Leong Bank Bhd |
9,941 | 41,698 | ||||||
| Hong Leong Financial Group Bhd |
2,700 | 10,132 | ||||||
| IHH Healthcare Bhd |
25,135 | 31,422 | ||||||
| Inari Amertron Bhd |
38,500 | 21,020 | ||||||
| IOI Corp. Bhd |
38,694 | 30,935 | ||||||
| Kuala Lumpur Kepong Bhd |
6,020 | 27,234 | ||||||
| Malayan Banking Bhd |
68,718 | 128,786 | ||||||
| Malaysia Airports Holdings Bhd |
9,963 | 14,916 | ||||||
| Maxis Bhd |
37,096 | 33,033 | ||||||
| MISC Bhd |
19,500 | 30,842 | ||||||
| MR DIY Group M Bhd, 144A |
29,100 | 9,899 | ||||||
| Nestle Malaysia Bhd |
883 | 25,636 | ||||||
| Petronas Chemicals Group Bhd |
37,024 | 52,622 | ||||||
| Petronas Dagangan Bhd |
3,504 | 16,034 | ||||||
| Petronas Gas Bhd |
11,990 | 43,487 | ||||||
| PPB Group Bhd |
9,962 | 35,095 | ||||||
| Press Metal Aluminium Holdings Bhd |
50,150 | 50,090 | ||||||
| Public Bank Bhd |
196,110 | 161,885 | ||||||
| QL Resources Bhd |
17,100 | 20,562 | ||||||
| RHB Bank Bhd |
21,344 | 24,741 | ||||||
| Sime Darby Bhd |
34,123 | 15,304 | ||||||
| Sime Darby Plantation Bhd |
29,323 | 26,810 | ||||||
| Telekom Malaysia Bhd |
16,645 | 18,392 | ||||||
| Tenaga Nasional Bhd |
36,705 | 75,629 | ||||||
| Top Glove Corp. Bhd* |
77,500 | 19,142 | ||||||
|
|
|
|||||||
| (Cost $1,423,680) |
1,229,655 | |||||||
|
|
|
|||||||
| Mexico — 2.7% | ||||||||
| Alfa SAB de CV, Class A |
42,224 | 25,851 | ||||||
| America Movil SAB de CV, Series B |
427,200 | 455,963 | ||||||
| Arca Continental SAB de CV |
6,331 | 64,004 | ||||||
| Banco del Bajio SA, 144A |
10,588 | 33,166 | ||||||
| Cemex SAB de CV, Series CPO* |
199,970 | 120,283 | ||||||
| Coca-Cola Femsa SAB de CV |
6,925 | 56,879 | ||||||
| Controladora AXTEL SAB de CV* |
42,224 | 652 | ||||||
| Fibra Uno Administracion SA de CV REIT |
41,243 | 59,875 | ||||||
| Fomento Economico Mexicano SAB de CV |
26,139 | 263,208 | ||||||
| Gruma SAB de CV, Class B |
2,675 | 41,115 | ||||||
| See Notes to Financial Statements. | 58 |
DBX ETF Trust
Schedule of Investments
Xtrackers MSCI Emerging Markets Hedged Equity ETF (Continued)
May 31, 2023
| Number |
Value |
|||||||
| Mexico (Continued) | ||||||||
| Grupo Aeroportuario del Pacifico SAB de CV, Class B |
5,024 | $ | 88,889 | |||||
| Grupo Aeroportuario del Sureste SAB de CV, Class B |
2,655 | 74,362 | ||||||
| Grupo Bimbo SAB de CV, Series A |
18,161 | 97,083 | ||||||
| Grupo Carso SAB de CV, Series A1 |
6,547 | 38,947 | ||||||
| Grupo Financiero Banorte SAB de CV, Class O |
35,244 | 282,506 | ||||||
| Grupo Financiero Inbursa SAB de CV, Class O* |
30,046 | 66,737 | ||||||
| Grupo Mexico SAB de CV, Series B |
42,789 | 189,913 | ||||||
| Grupo Televisa SAB, Series CPO |
33,101 | 31,699 | ||||||
| Industrias Penoles SAB de CV* |
2,665 | 40,780 | ||||||
| Kimberly-Clark de Mexico SAB de CV, Class A |
18,869 | 38,380 | ||||||
| Operadora De Sites Mexicanos SAB de CV, Class A-1 |
18,765 | 16,549 | ||||||
| Orbia Advance Corp. SAB de CV |
11,671 | 24,228 | ||||||
| Promotora y Operadora de Infraestructura SAB de CV |
3,339 | 32,241 | ||||||
| Wal-Mart de Mexico SAB de CV |
71,382 | 271,259 | ||||||
|
|
|
|||||||
| (Cost $2,223,003) |
2,414,569 | |||||||
|
|
|
|||||||
| Netherlands — 0.0% | ||||||||
| NEPI Rockcastle NV |
||||||||
| (Cost $84,043) |
6,616 | 37,793 | ||||||
|
|
|
|||||||
| Peru — 0.2% | ||||||||
| Cia de Minas Buenaventura SAA, ADR |
3,137 | 21,363 | ||||||
| Credicorp Ltd. |
950 | 122,978 | ||||||
|
|
|
|||||||
| (Cost $191,453) |
144,341 | |||||||
|
|
|
|||||||
| Philippines — 0.7% | ||||||||
| Aboitiz Equity Ventures, Inc. |
25,450 | 24,698 | ||||||
| ACEN Corp.* |
10,578 | 1,104 | ||||||
| Ayala Corp. |
3,904 | 45,880 | ||||||
| Ayala Land, Inc. |
93,224 | 43,657 | ||||||
| Bank of the Philippine Islands |
28,228 | 50,238 | ||||||
| BDO Unibank, Inc. |
32,550 | 78,825 | ||||||
| International Container Terminal Services, Inc. |
13,721 | 47,642 | ||||||
| JG Summit Holdings, Inc. |
40,134 | 34,303 | ||||||
| Jollibee Foods Corp. |
6,853 | 28,749 | ||||||
| Manila Electric Co. |
3,560 | 20,729 | ||||||
| Metropolitan Bank & Trust Co. |
15,512 | 15,910 | ||||||
| PLDT, Inc. |
1,206 | 25,769 | ||||||
| SM Investments Corp. |
3,263 | 53,977 | ||||||
| SM Prime Holdings, Inc. |
123,091 | 71,672 | ||||||
| Universal Robina Corp. |
12,494 | 31,279 | ||||||
|
|
|
|||||||
| (Cost $668,872) |
574,432 | |||||||
|
|
|
|||||||
| Poland — 0.7% | ||||||||
| Allegro.eu SA, 144A* |
4,763 | 39,946 | ||||||
| Bank Polska Kasa Opieki SA |
2,657 | 60,390 | ||||||
| CD Projekt SA |
953 | 27,272 | ||||||
| Cyfrowy Polsat SA |
4,268 | 15,565 | ||||||
| Dino Polska SA, 144A* |
665 | 65,335 | ||||||
| KGHM Polska Miedz SA |
1,893 | 46,753 | ||||||
| Number |
Value |
|||||||
| Poland (Continued) | ||||||||
| LPP SA* |
15 | $ | 42,501 | |||||
| mBank SA* |
179 | 14,911 | ||||||
| PGE Polska Grupa Energetyczna SA* |
11,699 | 18,552 | ||||||
| Polski Koncern Naftowy ORLEN SA |
7,505 | 106,660 | ||||||
| Powszechna Kasa Oszczednosci Bank Polski SA |
12,013 | 90,994 | ||||||
| Powszechny Zaklad Ubezpieczen SA |
8,497 | 77,402 | ||||||
| Santander Bank Polska SA* |
458 | 36,400 | ||||||
|
|
|
|||||||
| (Cost $794,963) |
642,681 | |||||||
|
|
|
|||||||
| Qatar — 0.9% | ||||||||
| Barwa Real Estate Co. |
30,415 | 21,449 | ||||||
| Commercial Bank PSQC |
44,292 | 68,142 | ||||||
| Dukhan Bank |
20,564 | 22,118 | ||||||
| Industries Qatar QSC |
20,900 | 68,786 | ||||||
| Masraf Al Rayan QSC |
77,316 | 54,164 | ||||||
| Mesaieed Petrochemical Holding Co. |
64,544 | 34,914 | ||||||
| Ooredoo QPSC |
8,328 | 24,275 | ||||||
| Qatar Electricity & Water Co. QSC |
5,674 | 26,655 | ||||||
| Qatar Fuel QSC |
8,554 | 37,271 | ||||||
| Qatar Gas Transport Co. Ltd. |
32,116 | 34,851 | ||||||
| Qatar International Islamic Bank QSC |
14,554 | 39,943 | ||||||
| Qatar Islamic Bank SAQ |
23,323 | 112,258 | ||||||
| Qatar National Bank QPSC |
62,638 | 275,504 | ||||||
|
|
|
|||||||
| (Cost $777,562) |
820,330 | |||||||
|
|
|
|||||||
| Russia — 0.0% | ||||||||
| Alrosa PJSC* (b) |
34,709 | 0 | ||||||
| Gazprom PJSC* (b) |
164,723 | 0 | ||||||
| Inter RAO UES PJSC* (b) |
490,959 | 0 | ||||||
| LUKOIL PJSC* (b) |
5,651 | 0 | ||||||
| Magnit PJSC, GDR* (b) |
4 | 0 | ||||||
| Magnit PJSC* (b) |
933 | 0 | ||||||
| MMC Norilsk Nickel PJSC* (b) |
883 | 0 | ||||||
| Mobile TeleSystems PJSC, ADR* (b) |
6,594 | 0 | ||||||
| Moscow Exchange MICEX-RTS PJSC* (b) |
20,735 | 0 | ||||||
| Novatek PJSC* (b) |
12,810 | 0 | ||||||
| Novolipetsk Steel PJSC* (b) |
21,183 | 0 | ||||||
| Ozon Holdings PLC, ADR* (b) |
700 | 0 | ||||||
| PhosAgro PJSC* (b) |
713 | 0 | ||||||
| PhosAgro PJSC, GDR* (b) |
13 | 0 | ||||||
| Polyus PJSC* (b) |
476 | 0 | ||||||
| Rosneft Oil Co. PJSC* (b) |
14,582 | 0 | ||||||
| Sberbank of Russia PJSC* (b) |
146,997 | 0 | ||||||
| Severstal PAO* (b) |
707 | 0 | ||||||
| Severstal PAO, GDR* (b) |
2,248 | 0 | ||||||
| Surgutneftegas PJSC* (b) |
68,300 | 0 | ||||||
| Surgutneftegas PJSC, ADR* (b) |
2,000 | 0 | ||||||
| Tatneft PJSC* (b) |
17,973 | 0 | ||||||
| United Co. RUSAL International PJSC* (b) |
39,327 | 0 | ||||||
| VK Co. Ltd., GDR* (b) |
1,691 | 0 | ||||||
| VTB Bank PJSC* (b) |
48,782,071 | 0 | ||||||
| X5 Retail Group NV, GDR* (b) |
1,749 | 0 | ||||||
| Yandex NV, Class A* (b) |
4,277 | 0 | ||||||
|
|
|
|||||||
| (Cost $2,809,837) |
0 | |||||||
|
|
|
|||||||
| See Notes to Financial Statements. | 59 |
DBX ETF Trust
Schedule of Investments
Xtrackers MSCI Emerging Markets Hedged Equity ETF (Continued)
May 31, 2023
| Number |
Value |
|||||||
| Saudi Arabia — 4.2% | ||||||||
| ACWA Power Co. |
1,050 | $ | 41,767 | |||||
| Advanced Petrochemical Co. |
1,387 | 16,160 | ||||||
| Al Rajhi Bank |
26,657 | 502,466 | ||||||
| Alinma Bank |
13,333 | 116,061 | ||||||
| Almarai Co. JSC |
3,652 | 53,259 | ||||||
| Arab National Bank |
8,123 | 55,116 | ||||||
| Arabian Internet & Communications Services Co. |
332 | 26,023 | ||||||
| Bank AlBilad |
6,678 | 66,232 | ||||||
| Bank Al-Jazira |
6,260 | 29,274 | ||||||
| Banque Saudi Fransi |
8,310 | 88,178 | ||||||
| Bupa Arabia for Cooperative Insurance Co. |
984 | 44,074 | ||||||
| Dallah Healthcare Co. |
452 | 19,691 | ||||||
| Dar Al Arkan Real Estate Development |
8,204 | 33,684 | ||||||
| Dr Sulaiman Al Habib Medical Services Group Co. |
1,192 | 84,852 | ||||||
| Elm Co. |
328 | 39,247 | ||||||
| Emaar Economic City* |
6,696 | 17,602 | ||||||
| Etihad Etisalat Co.* |
5,217 | 59,809 | ||||||
| Jarir Marketing Co. |
8,820 | 41,386 | ||||||
| Mobile Telecommunications Co. Saudi Arabia* |
6,440 | 23,660 | ||||||
| Mouwasat Medical Services Co. |
704 | 42,231 | ||||||
| Nahdi Medical Co. |
542 | 24,594 | ||||||
| National Industrialization Co.* |
4,370 | 17,103 | ||||||
| Rabigh Refining & Petrochemical Co.* |
5,886 | 17,262 | ||||||
| Riyad Bank |
19,754 | 172,481 | ||||||
| SABIC Agri-Nutrients Co. |
3,034 | 101,112 | ||||||
| Sahara International Petrochemical Co. |
4,977 | 47,238 | ||||||
| Saudi Arabian Mining Co.* |
11,790 | 195,201 | ||||||
| Saudi Arabian Oil Co., 144A |
36,268 | 304,586 | ||||||
| Saudi Aramco Base Oil Co. |
650 | 23,222 | ||||||
| Saudi Basic Industries Corp. |
12,250 | 288,059 | ||||||
| Saudi British Bank |
12,853 | 126,789 | ||||||
| Saudi Electricity Co. |
11,795 | 67,925 | ||||||
| Saudi Industrial Investment Group |
5,410 | 35,569 | ||||||
| Saudi Investment Bank |
6,671 | 29,915 | ||||||
| Saudi Kayan Petrochemical Co.* |
9,856 | 33,530 | ||||||
| Saudi National Bank |
40,041 | 393,919 | ||||||
| Saudi Research & Media Group* |
482 | 24,159 | ||||||
| Saudi Tadawul Group Holding Co. |
697 | 29,769 | ||||||
| Saudi Telecom Co. |
26,213 | 302,259 | ||||||
| Savola Group |
3,688 | 35,299 | ||||||
| Yanbu National Petrochemical Co. |
3,192 | 36,126 | ||||||
|
|
|
|||||||
| (Cost $3,079,100) |
3,706,889 | |||||||
|
|
|
|||||||
| Singapore — 0.0% | ||||||||
| BOC Aviation Ltd., 144A |
2,752 | 20,226 | ||||||
| JOYY, Inc., ADR |
582 | 14,433 | ||||||
|
|
|
|||||||
| (Cost $54,219) |
34,659 | |||||||
|
|
|
|||||||
| South Africa — 2.9% | ||||||||
| Absa Group Ltd. |
11,604 | 90,525 | ||||||
| African Rainbow Minerals Ltd. |
1,428 | 14,936 | ||||||
| Anglo American Platinum Ltd. |
765 | 44,062 | ||||||
| Number |
Value |
|||||||
| South Africa (Continued) | ||||||||
| AngloGold Ashanti Ltd. |
5,883 | $ | 144,071 | |||||
| Aspen Pharmacare Holdings Ltd. |
5,257 | 45,732 | ||||||
| Bid Corp. Ltd. |
4,455 | 94,892 | ||||||
| Bidvest Group Ltd. |
4,100 | 49,449 | ||||||
| Capitec Bank Holdings Ltd. (a) |
1,192 | 81,608 | ||||||
| Clicks Group Ltd. |
3,629 | 43,157 | ||||||
| Discovery Ltd.* |
6,892 | 46,286 | ||||||
| Exxaro Resources Ltd. |
3,238 | 26,303 | ||||||
| FirstRand Ltd. |
68,858 | 210,463 | ||||||
| Foschini Group Ltd. |
4,849 | 20,612 | ||||||
| Gold Fields Ltd. |
12,364 | 189,046 | ||||||
| Growthpoint Properties Ltd. REIT |
39,383 | 23,348 | ||||||
| Harmony Gold Mining Co. Ltd. |
8,266 | 39,241 | ||||||
| Impala Platinum Holdings Ltd. |
11,462 | 92,062 | ||||||
| Kumba Iron Ore Ltd. |
923 | 20,294 | ||||||
| Mr Price Group Ltd. |
3,663 | 23,048 | ||||||
| MTN Group Ltd. |
21,703 | 134,244 | ||||||
| MultiChoice Group |
5,563 | 27,670 | ||||||
| Naspers Ltd., Class N |
2,654 | 400,661 | ||||||
| Nedbank Group Ltd. |
6,216 | 65,622 | ||||||
| Northam Platinum Holdings Ltd.* |
4,518 | 37,191 | ||||||
| Old Mutual Ltd. |
66,255 | 35,851 | ||||||
| OUTsurance Group Ltd. |
12,077 | 19,384 | ||||||
| Pepkor Holdings Ltd., 144A |
24,131 | 17,267 | ||||||
| Remgro Ltd. |
7,006 | 46,622 | ||||||
| Sanlam Ltd. |
24,245 | 63,813 | ||||||
| Sasol Ltd. |
7,687 | 90,059 | ||||||
| Shoprite Holdings Ltd. |
6,776 | 67,077 | ||||||
| Sibanye Stillwater Ltd. |
37,528 | 66,630 | ||||||
| Standard Bank Group Ltd. |
18,368 | 141,159 | ||||||
| Vodacom Group Ltd. |
8,967 | 50,190 | ||||||
| Woolworths Holdings Ltd. |
13,831 | 41,734 | ||||||
|
|
|
|||||||
| (Cost $3,706,524) |
2,604,309 | |||||||
|
|
|
|||||||
| South Korea — 11.8% | ||||||||
| Amorepacific Corp. |
393 | 30,943 | ||||||
| BGF retail Co. Ltd. |
104 | 14,919 | ||||||
| Celltrion Healthcare Co. Ltd. |
1,445 | 80,565 | ||||||
| Celltrion Pharm, Inc.* |
254 | 16,305 | ||||||
| Celltrion, Inc. |
1,473 | 190,111 | ||||||
| CJ CheilJedang Corp. |
118 | 27,561 | ||||||
| CJ Corp. |
217 | 14,486 | ||||||
| CosmoAM&T Co. Ltd.* |
315 | 42,411 | ||||||
| Coway Co. Ltd. |
788 | 28,587 | ||||||
| DB Insurance Co. Ltd. |
564 | 31,445 | ||||||
| Doosan Bobcat, Inc. |
776 | 31,280 | ||||||
| Doosan Enerbility Co. Ltd.* |
5,882 | 71,262 | ||||||
| Ecopro BM Co. Ltd. |
690 | 129,448 | ||||||
| E-MART, Inc. |
262 | 16,641 | ||||||
| F&F Co. Ltd. / New |
244 | 23,789 | ||||||
| GS Holdings Corp. |
657 | 19,058 | ||||||
| Hana Financial Group, Inc. |
3,934 | 122,859 | ||||||
| Hankook Tire & Technology Co. Ltd. |
1,138 | 29,581 | ||||||
| Hanmi Pharm. Co. Ltd. |
94 | 20,716 | ||||||
| Hanon Systems |
2,266 | 16,014 | ||||||
| Hanwha Aerospace Co. Ltd. |
472 | 37,732 | ||||||
| Hanwha Solutions Corp.* |
1,465 | 49,394 | ||||||
| See Notes to Financial Statements. | 60 |
DBX ETF Trust
Schedule of Investments
Xtrackers MSCI Emerging Markets Hedged Equity ETF (Continued)
May 31, 2023
| Number |
Value |
|||||||
| South Korea (Continued) | ||||||||
| HD Hyundai Co. Ltd. |
670 | $ | 28,824 | |||||
| HD Hyundai Heavy Industries Co. Ltd.* |
229 | 20,032 | ||||||
| HD Korea Shipbuilding & Offshore Engineering Co. Ltd.* |
622 | 45,083 | ||||||
| HLB, Inc.* |
1,451 | 40,450 | ||||||
| HMM Co. Ltd. |
2,994 | 40,040 | ||||||
| Hotel Shilla Co. Ltd. |
459 | 26,698 | ||||||
| HYBE Co. Ltd.* |
278 | 57,391 | ||||||
| Hyundai Engineering & Construction Co. Ltd. |
1,167 | 33,676 | ||||||
| Hyundai Glovis Co. Ltd. |
277 | 35,271 | ||||||
| Hyundai Mipo Dockyard Co. Ltd.* |
314 | 17,649 | ||||||
| Hyundai Mobis Co. Ltd. |
833 | 139,958 | ||||||
| Hyundai Motor Co. |
1,774 | 267,320 | ||||||
| Hyundai Steel Co. |
1,344 | 33,011 | ||||||
| Industrial Bank of Korea |
3,132 | 24,093 | ||||||
| Kakao Corp. |
4,236 | 179,366 | ||||||
| Kakao Games Corp.* |
402 | 11,767 | ||||||
| KakaoBank Corp. |
2,032 | 40,112 | ||||||
| Kakaopay Corp.* |
338 | 15,305 | ||||||
| Kangwon Land, Inc. |
1,174 | 16,125 | ||||||
| KB Financial Group, Inc. |
5,258 | 190,156 | ||||||
| Kia Corp. |
3,571 | 231,116 | ||||||
| Korea Aerospace Industries Ltd. |
1,103 | 42,799 | ||||||
| Korea Electric Power Corp.* |
3,473 | 49,926 | ||||||
| Korea Investment Holdings Co. Ltd. |
603 | 25,169 | ||||||
| Korea Zinc Co. Ltd. |
95 | 34,393 | ||||||
| Korean Air Lines Co. Ltd. |
2,512 | 41,827 | ||||||
| Krafton, Inc.* |
394 | 56,135 | ||||||
| KT Corp. |
541 | 12,860 | ||||||
| KT&G Corp. |
1,457 | 91,773 | ||||||
| Kumho Petrochemical Co. Ltd. |
279 | 26,676 | ||||||
| L&F Co. Ltd. |
344 | 69,979 | ||||||
| LG Chem Ltd. |
659 | 344,085 | ||||||
| LG Corp. |
1,307 | 84,688 | ||||||
| LG Display Co. Ltd.* |
3,252 | 38,517 | ||||||
| LG Electronics, Inc. |
1,488 | 137,673 | ||||||
| LG Energy Solution Ltd.* |
470 | 212,115 | ||||||
| LG H&H Co. Ltd. |
121 | 48,044 | ||||||
| LG Innotek Co. Ltd. |
198 | 45,798 | ||||||
| LG Uplus Corp. |
2,880 | 24,390 | ||||||
| Lotte Chemical Corp. |
276 | 34,707 | ||||||
| Lotte Energy Materials Corp. |
308 | 13,297 | ||||||
| Meritz Financial Group, Inc.* |
1,382 | 46,804 | ||||||
| Mirae Asset Securities Co. Ltd. |
3,397 | 18,684 | ||||||
| NAVER Corp. |
1,790 | 269,056 | ||||||
| NCSoft Corp. |
191 | 46,194 | ||||||
| Netmarble Corp., 144A* |
332 | 13,983 | ||||||
| NH Investment & Securities Co. Ltd. |
1,668 | 12,555 | ||||||
| Orion Corp. |
358 | 34,849 | ||||||
| Pan Ocean Co. Ltd. |
3,856 | 13,684 | ||||||
| Pearl Abyss Corp.* |
439 | 16,505 | ||||||
| POSCO Future M Co. Ltd. |
421 | 111,019 | ||||||
| POSCO Holdings, Inc. |
988 | 267,983 | ||||||
| Posco International Corp. |
671 | 15,217 | ||||||
| Samsung Biologics Co. Ltd., 144A* |
249 | 147,083 | ||||||
| Samsung C&T Corp. |
1,164 | 96,996 | ||||||
| Number |
Value |
|||||||
| South Korea (Continued) | ||||||||
| Samsung Electro-Mechanics Co. Ltd. |
732 | $ | 81,349 | |||||
| Samsung Electronics Co. Ltd. |
64,430 | 3,466,040 | ||||||
| Samsung Engineering Co. Ltd.* |
2,058 | 43,881 | ||||||
| Samsung Fire & Marine Insurance Co. Ltd. |
421 | 71,528 | ||||||
| Samsung Heavy Industries Co. Ltd.* |
8,790 | 40,531 | ||||||
| Samsung Life Insurance Co. Ltd. |
1,114 | 55,648 | ||||||
| Samsung SDI Co. Ltd. |
740 | 400,316 | ||||||
| Samsung SDS Co. Ltd. |
486 | 45,515 | ||||||
| Samsung Securities Co. Ltd. |
816 | 22,594 | ||||||
| Shinhan Financial Group Co. Ltd. |
5,594 | 147,726 | ||||||
| SK Biopharmaceuticals Co. Ltd.* |
460 | 25,474 | ||||||
| SK Bioscience Co. Ltd.* |
337 | 21,049 | ||||||
| SK Hynix, Inc. |
7,368 | 602,874 | ||||||
| SK IE Technology Co. Ltd., 144A* |
352 | 23,498 | ||||||
| SK Innovation Co. Ltd.* |
787 | 112,128 | ||||||
| SK Square Co. Ltd.* |
1,344 | 46,732 | ||||||
| SK, Inc. |
472 | 59,673 | ||||||
| SKC Co. Ltd. |
275 | 19,663 | ||||||
| S-Oil Corp. |
610 | 33,183 | ||||||
| Woori Financial Group, Inc. |
7,309 | 65,972 | ||||||
| Yuhan Corp. |
534 | 23,858 | ||||||
|
|
|
|||||||
| (Cost $6,954,047) |
10,493,245 | |||||||
|
|
|
|||||||
| Taiwan — 15.7% | ||||||||
| Accton Technology Corp. |
6,879 | 79,026 | ||||||
| Acer, Inc. |
41,385 | 41,550 | ||||||
| Advantech Co. Ltd. |
6,008 | 79,579 | ||||||
| Airtac International Group |
1,891 | 61,049 | ||||||
| ASE Technology Holding Co. Ltd. |
41,461 | 150,448 | ||||||
| Asia Cement Corp. |
33,169 | 47,442 | ||||||
| Asustek Computer, Inc. |
9,911 | 98,376 | ||||||
| AUO Corp. |
86,953 | 49,805 | ||||||
| Catcher Technology Co. Ltd. |
7,842 | 47,342 | ||||||
| Cathay Financial Holding Co. Ltd. |
126,744 | 182,727 | ||||||
| Chailease Holding Co. Ltd. |
19,466 | 128,285 | ||||||
| Chang Hwa Commercial Bank Ltd. |
71,366 | 41,806 | ||||||
| Cheng Shin Rubber Industry Co. Ltd. |
27,323 | 34,679 | ||||||
| China Airlines Ltd. |
41,386 | 29,901 | ||||||
| China Development Financial Holding Corp. |
199,815 | 82,586 | ||||||
| China Steel Corp. |
158,256 | 149,359 | ||||||
| Chunghwa Telecom Co. Ltd. |
51,511 | 211,224 | ||||||
| Compal Electronics, Inc. |
48,838 | 44,265 | ||||||
| CTBC Financial Holding Co. Ltd. |
235,415 | 186,171 | ||||||
| Delta Electronics, Inc. |
26,474 | 272,688 | ||||||
| E Ink Holdings, Inc. |
10,980 | 73,968 | ||||||
| E.Sun Financial Holding Co. Ltd. |
176,343 | 148,638 | ||||||
| Eclat Textile Co. Ltd. |
2,563 | 39,120 | ||||||
| eMemory Technology, Inc. |
855 | 51,198 | ||||||
| Eva Airways Corp. |
39,537 | 43,683 | ||||||
| Evergreen Marine Corp. Taiwan Ltd. |
13,900 | 69,212 | ||||||
| Far Eastern New Century Corp. |
42,295 | 44,459 | ||||||
| Far EasTone Telecommunications Co. Ltd. |
23,253 | 58,043 | ||||||
| Feng TAY Enterprise Co. Ltd. |
6,119 | 38,035 | ||||||
| First Financial Holding Co. Ltd. |
146,637 | 134,098 | ||||||
| See Notes to Financial Statements. | 61 |
DBX ETF Trust
Schedule of Investments
Xtrackers MSCI Emerging Markets Hedged Equity ETF (Continued)
May 31, 2023
| Number |
Value |
|||||||
| Taiwan (Continued) | ||||||||
| Formosa Chemicals & Fibre Corp. |
48,926 | $ | 108,910 | |||||
| Formosa Petrochemical Corp. |
15,086 | 42,321 | ||||||
| Formosa Plastics Corp. |
50,315 | 154,085 | ||||||
| Fubon Financial Holding Co. Ltd. |
99,370 | 196,622 | ||||||
| Giant Manufacturing Co. Ltd. |
4,830 | 32,381 | ||||||
| Global Unichip Corp. |
1,209 | 58,822 | ||||||
| Globalwafers Co. Ltd. |
2,872 | 47,107 | ||||||
| Hon Hai Precision Industry Co. Ltd. |
166,662 | 577,642 | ||||||
| Hotai Motor Co. Ltd. |
3,859 | 101,098 | ||||||
| Hua Nan Financial Holdings Co. Ltd. |
125,809 | 91,099 | ||||||
| Innolux Corp. |
124,245 | 56,204 | ||||||
| Inventec Corp. |
37,024 | 44,401 | ||||||
| Largan Precision Co. Ltd. |
1,395 | 102,829 | ||||||
| Lite-On Technology Corp. |
28,746 | 83,261 | ||||||
| MediaTek, Inc. |
20,516 | 506,766 | ||||||
| Mega Financial Holding Co. Ltd. |
150,454 | 175,291 | ||||||
| Micro-Star International Co. Ltd. |
9,607 | 51,900 | ||||||
| momo.com, Inc. |
987 | 22,453 | ||||||
| Nan Ya Plastics Corp. |
63,693 | 161,059 | ||||||
| Nan Ya Printed Circuit Board Corp. |
3,074 | 30,312 | ||||||
| Nanya Technology Corp. |
18,138 | 43,386 | ||||||
| Nien Made Enterprise Co. Ltd. |
2,332 | 26,752 | ||||||
| Novatek Microelectronics Corp. |
7,761 | 107,471 | ||||||
| Pegatron Corp. |
27,620 | 67,685 | ||||||
| PharmaEssentia Corp.* |
2,754 | 31,369 | ||||||
| Pou Chen Corp. |
27,819 | 28,654 | ||||||
| Powerchip Semiconductor Manufacturing Corp. |
42,425 | 42,663 | ||||||
| President Chain Store Corp. |
7,920 | 72,041 | ||||||
| Quanta Computer, Inc. |
36,760 | 139,372 | ||||||
| Realtek Semiconductor Corp. |
6,271 | 77,960 | ||||||
| Ruentex Development Co. Ltd. |
24,873 | 28,251 | ||||||
| Shanghai Commercial & Savings Bank Ltd. |
54,195 | 79,632 | ||||||
| Shin Kong Financial Holding Co. Ltd. |
197,560 | 55,422 | ||||||
| SinoPac Financial Holdings Co. Ltd. |
132,880 | 74,813 | ||||||
| Synnex Technology International Corp. |
18,316 | 38,089 | ||||||
| Taishin Financial Holding Co. Ltd. |
152,298 | 90,950 | ||||||
| Taiwan Business Bank |
83,128 | 38,145 | ||||||
| Taiwan Cement Corp. |
85,193 | 105,079 | ||||||
| Taiwan Cooperative Financial Holding Co. Ltd. |
128,722 | 117,087 | ||||||
| Taiwan High Speed Rail Corp. |
29,145 | 30,874 | ||||||
| Taiwan Mobile Co. Ltd. |
24,449 | 82,352 | ||||||
| Taiwan Semiconductor Manufacturing Co. Ltd. |
333,182 | 6,050,461 | ||||||
| Unimicron Technology Corp. |
17,423 | 102,346 | ||||||
| Uni-President Enterprises Corp. |
64,803 | 156,696 | ||||||
| United Microelectronics Corp.* |
150,866 | 254,328 | ||||||
| Vanguard International Semiconductor Corp. |
13,077 | 39,536 | ||||||
| Voltronic Power Technology Corp. |
884 | 55,812 | ||||||
| Walsin Lihwa Corp. |
34,212 | 51,439 | ||||||
| Wan Hai Lines Ltd. |
9,733 | 18,372 | ||||||
| Win Semiconductors Corp. |
4,639 | 24,080 | ||||||
| Winbond Electronics Corp. |
37,736 | 32,728 | ||||||
| Wistron Corp. |
35,579 | 77,231 | ||||||
| Number |
Value |
|||||||
| Taiwan (Continued) | ||||||||
| Wiwynn Corp. |
1,207 | $ | 45,566 | |||||
| WPG Holdings Ltd. |
20,819 | 36,045 | ||||||
| Yageo Corp. |
4,495 | 74,313 | ||||||
| Yang Ming Marine Transport Corp. |
23,921 | 47,332 | ||||||
| Yuanta Financial Holding Co. Ltd. |
135,202 | 104,941 | ||||||
| Zhen Ding Technology Holding Ltd. |
9,482 | 35,796 | ||||||
|
|
|
|||||||
| (Cost $6,932,111) |
13,948,394 | |||||||
|
|
|
|||||||
| Thailand — 2.0% | ||||||||
| Advanced Info Service PCL, NVDR |
13,973 | 84,721 | ||||||
| Airports of Thailand PCL, NVDR* |
55,100 | 112,021 | ||||||
| Asset World Corp. PCL, NVDR |
119,500 | 16,895 | ||||||
| B Grimm Power PCL, NVDR |
10,400 | 11,207 | ||||||
| Bangkok Dusit Medical Services PCL, NVDR |
143,100 | 116,166 | ||||||
| Bangkok Expressway & Metro PCL, NVDR |
103,900 | 24,034 | ||||||
| Banpu PCL, NVDR |
99,900 | 23,683 | ||||||
| Berli Jucker PCL, NVDR |
18,200 | 18,958 | ||||||
| BTS Group Holdings PCL, NVDR |
119,844 | 24,451 | ||||||
| Bumrungrad Hospital PCL, NVDR |
8,300 | 53,187 | ||||||
| Carabao Group PCL, NVDR |
4,200 | 8,026 | ||||||
| Central Pattana PCL, NVDR |
26,000 | 50,431 | ||||||
| Central Retail Corp. PCL, NVDR |
26,900 | 32,466 | ||||||
| Charoen Pokphand Foods PCL, NVDR |
54,569 | 31,518 | ||||||
| CP ALL PCL, NVDR |
80,349 | 147,191 | ||||||
| Delta Electronics Thailand PCL, NVDR |
43,380 | 123,409 | ||||||
| Electricity Generating PCL, NVDR |
3,500 | 14,533 | ||||||
| Energy Absolute PCL, NVDR |
24,600 | 45,948 | ||||||
| Global Power Synergy PCL, NVDR |
10,400 | 17,483 | ||||||
| Gulf Energy Development PCL, NVDR |
39,850 | 55,824 | ||||||
| Home Product Center PCL, NVDR |
90,700 | 35,967 | ||||||
| Indorama Ventures PCL, NVDR |
23,919 | 21,823 | ||||||
| Intouch Holdings PCL, NVDR |
13,200 | 28,353 | ||||||
| Kasikornbank PCL, NVDR |
7,503 | 27,921 | ||||||
| Krung Thai Bank PCL, NVDR |
51,806 | 28,285 | ||||||
| Krungthai Card PCL, NVDR |
14,900 | 21,836 | ||||||
| Land & Houses PCL, NVDR |
118,100 | 28,846 | ||||||
| Minor International PCL, NVDR |
43,547 | 42,233 | ||||||
| Muangthai Capital PCL, NVDR |
9,700 | 11,498 | ||||||
| Osotspa PCL, NVDR |
22,800 | 19,000 | ||||||
| PTT Exploration & Production PCL, NVDR |
19,483 | 78,100 | ||||||
| PTT Global Chemical PCL, NVDR |
29,400 | 29,780 | ||||||
| PTT Oil & Retail Business PCL, NVDR |
40,700 | 23,391 | ||||||
| PTT PCL |
13,400 | 11,552 | ||||||
| PTT PCL, NVDR |
124,980 | 107,741 | ||||||
| Ratch Group PCL, NVDR |
10,800 | 11,250 | ||||||
| SCB X PCL, NVDR |
11,198 | 33,304 | ||||||
| SCG Packaging PCL, NVDR |
16,600 | 18,723 | ||||||
| Siam Cement PCL |
4,758 | 43,615 | ||||||
| Siam Cement PCL, NVDR |
5,778 | 52,965 | ||||||
| Siam Makro PCL, NVDR |
26,000 | 30,259 | ||||||
| Srisawad Corp. PCL, NVDR |
10,400 | 16,661 | ||||||
| Thai Oil PCL, NVDR |
18,849 | 23,426 | ||||||
| True Corp. PCL, NVDR. |
143,472 | 28,241 | ||||||
|
|
|
|||||||
| (Cost $1,895,610) |
1,786,922 | |||||||
|
|
|
|||||||
| See Notes to Financial Statements. | 62 |
DBX ETF Trust
Schedule of Investments
Xtrackers MSCI Emerging Markets Hedged Equity ETF (Continued)
May 31, 2023
| Number |
Value |
|||||||
| Turkey — 0.6% | ||||||||
| Akbank TAS |
43,392 | $ | 33,061 | |||||
| Aselsan Elektronik Sanayi Ve Ticaret AS |
10,200 | 23,364 | ||||||
| BIM Birlesik Magazalar AS |
6,420 | 43,652 | ||||||
| Eregli Demir ve Celik Fabrikalari TAS* |
18,797 | 29,949 | ||||||
| Ford Otomotiv Sanayi AS |
893 | 24,684 | ||||||
| Haci Omer Sabanci Holding AS |
14,489 | 26,970 | ||||||
| Hektas Ticaret TAS* |
15,516 | 20,845 | ||||||
| KOC Holding AS |
9,563 | 36,339 | ||||||
| Koza Altin Isletmeleri AS |
13,195 | 14,648 | ||||||
| Pegasus Hava Tasimaciligi AS* |
583 | 12,899 | ||||||
| Sasa Polyester Sanayi AS* |
14,123 | 36,777 | ||||||
| Tofas Turk Otomobil Fabrikasi AS |
1,547 | 16,002 | ||||||
| Turk Hava Yollari AO* |
7,036 | 48,791 | ||||||
| Turkcell Iletisim Hizmetleri AS |
15,716 | 25,389 | ||||||
| Turkiye Is Bankasi AS, Class C |
49,972 | 26,869 | ||||||
| Turkiye Petrol Rafinerileri AS |
13,246 | 42,797 | ||||||
| Turkiye Sise ve Cam Fabrikalari AS |
20,811 | 40,504 | ||||||
| Yapi ve Kredi Bankasi AS |
41,297 | 20,313 | ||||||
|
|
|
|||||||
| (Cost $650,934) |
523,853 | |||||||
|
|
|
|||||||
| United Arab Emirates — 1.3% | ||||||||
| Abu Dhabi Commercial Bank PJSC |
41,839 | 91,015 | ||||||
| Abu Dhabi Islamic Bank PJSC |
19,590 | 53,336 | ||||||
| Abu Dhabi National Oil Co. for Distribution PJSC |
44,205 | 49,826 | ||||||
| Aldar Properties PJSC |
50,999 | 70,814 | ||||||
| Americana Restaurants International PLC |
32,657 | 36,810 | ||||||
| Dubai Islamic Bank PJSC |
40,570 | 58,100 | ||||||
| Emaar Properties PJSC |
86,480 | 144,802 | ||||||
| Emirates NBD Bank PJSC |
25,370 | 94,284 | ||||||
| Emirates Telecommunications Group Co. PJSC |
47,521 | 298,611 | ||||||
| First Abu Dhabi Bank PJSC |
60,213 | 208,199 | ||||||
| Multiply Group PJSC* |
44,864 | 40,431 | ||||||
|
|
|
|||||||
| (Cost $1,024,544) |
1,146,228 | |||||||
|
|
|
|||||||
| United Kingdom — 0.0% | ||||||||
| Pepco Group NV* |
2,743 | 25,907 | ||||||
|
|
|
|||||||
| United States — 0.3% | ||||||||
| BeiGene Ltd.* |
9,315 | 158,453 | ||||||
| Legend Biotech Corp., ADR* |
796 | 51,079 | ||||||
| Southern Copper Corp. |
1,197 | 79,924 | ||||||
|
|
|
|||||||
| (Cost $231,915) |
289,456 | |||||||
|
|
|
|||||||
| TOTAL COMMON STOCKS |
85,772,844 | |||||||
|
|
|
|||||||
| PREFERRED STOCKS — 2.2% | ||||||||
| Brazil — 1.3% | ||||||||
| Banco Bradesco SA |
71,992 | 220,093 | ||||||
| Centrais Eletricas Brasileiras SA, Class B |
2,927 | 22,732 | ||||||
| Cia Energetica de Minas Gerais |
17,867 | 41,205 | ||||||
| Gerdau SA |
15,687 | 74,117 | ||||||
| Itau Unibanco Holding SA |
66,367 | 344,439 | ||||||
| Itausa SA |
67,827 | 117,383 | ||||||
| Petroleo Brasileiro SA |
65,185 | 335,606 | ||||||
|
|
|
|||||||
| (Cost $1,028,414) |
1,155,575 | |||||||
|
|
|
|||||||
| Number |
Value |
|||||||
| Chile — 0.2% | ||||||||
| Sociedad Quimica y Minera de Chile SA, Class B |
||||||||
| (Cost $43,498) |
1,939 | $ | 124,957 | |||||
|
|
|
|||||||
| Colombia — 0.0% | ||||||||
| Bancolombia SA |
5,055 | 29,489 | ||||||
|
|
|
|||||||
| Russia — 0.0% | ||||||||
| Surgutneftegas PJSC* (b) |
101,715 | 0 | ||||||
|
|
|
|||||||
| South Korea — 0.7% | ||||||||
| Hyundai Motor Co. |
360 | 28,589 | ||||||
| Hyundai Motor Co. — 2nd Preferred |
525 | 41,731 | ||||||
| LG Chem Ltd. |
119 | 32,367 | ||||||
| Samsung Electronics Co. Ltd. |
11,076 | 489,021 | ||||||
|
|
|
|||||||
| (Cost $272,307) |
591,708 | |||||||
|
|
|
|||||||
| TOTAL PREFERRED STOCKS |
1,901,729 | |||||||
|
|
|
|||||||
| Principal |
||||||||
| CORPORATE BONDS — 0.0% | ||||||||
| India — 0.0% | ||||||||
| Britannia Industries Ltd. |
||||||||
| (Cost $0) |
INR 45,965 | 545 | ||||||
|
|
|
|||||||
| Number |
||||||||
| WARRANTS — 0.0% | ||||||||
| Thailand — 0.0% | ||||||||
| BTS Group Holdings PCL*, expires 11/7/24 |
11,834 | 31 | ||||||
| BTS Group Holdings PCL*, expires 11/20/26 |
23,669 | 88 | ||||||
| Srisawad Corp. PCL*, |
432 | 35 | ||||||
|
|
|
|||||||
| (Cost $0) |
154 | |||||||
|
|
|
|||||||
| TOTAL WARRANTS |
154 | |||||||
|
|
|
|||||||
| SECURITIES LENDING COLLATERAL — 0.2% | ||||||||
| DWS Government & Agency Securities Portfolio “DWS Government Cash Institutional Shares”,
5.03% (c)(d) |
179,111 | 179,111 | ||||||
|
|
|
|||||||
| CASH EQUIVALENTS — 1.0% | ||||||||
| DWS Government Money Market Series “Institutional Shares”, 5.04% (c) |
912,728 | 912,728 | ||||||
|
|
|
|||||||
| TOTAL INVESTMENTS — 100.0% |
$ | 88,767,111 | ||||||
| Other assets and liabilities, net — 0.0% |
22,371 | |||||||
|
|
|
|||||||
| NET ASSETS — 100.0% |
$ | 88,789,482 | ||||||
|
|
|
|||||||
| See Notes to Financial Statements. | 63 |
DBX ETF Trust
Schedule of Investments
Xtrackers MSCI Emerging Markets Hedged Equity ETF (Continued)
May 31, 2023
A summary of the Fund’s transactions with affiliated investments during the year ended May 31, 2023 is as follows:
| Value ($) at 5/31/2022 |
Purchases Cost ($) |
Sales Proceeds ($) |
Net Realized Gain/(Loss) ($) |
Net Change in Unrealized Appreciation (Depreciation) ($) |
Income ($) | Capital Gain Distributions ($) |
Number of Shares at 5/31/2023 |
Value ($) at 5/31/2023 |
||||||||||||||||||||||||||||
| SECURITIES LENDING COLLATERAL — 0.2% |
| |||||||||||||||||||||||||||||||||||
| DWS Government & Agency Securities Portfolio “DWS Government Cash Institutional Shares”, 5.03% (c)(d) |
| |||||||||||||||||||||||||||||||||||
| 281,038 | — | (101,927 | )(e) | — | — | 9,322 | — | 179,111 | 179,111 | |||||||||||||||||||||||||||
| CASH EQUIVALENTS — 1.0% |
| |||||||||||||||||||||||||||||||||||
| DWS Government Money Market Series “Institutional Shares”, 5.04% (c) |
| |||||||||||||||||||||||||||||||||||
| 93,470 | 25,068,339 | (24,249,081 | ) | — | — | 35,427 | — | 912,728 | 912,728 | |||||||||||||||||||||||||||
|
|
|
|
|
|
|
|
|
|
|
|
|
|
|
|
|
|
|
|||||||||||||||||||
| 374,508 | 25,068,339 | (24,351,008 | ) | — | — | 44,749 | — | 1,091,839 | 1,091,839 | |||||||||||||||||||||||||||
|
|
|
|
|
|
|
|
|
|
|
|
|
|
|
|
|
|
|
|||||||||||||||||||
| * | Non-income producing security. |
| (a) | All or a portion of these securities were on loan. In addition, “Other assets and liabilities, net” may include pending sales that are also on loan. The value of securities loaned at May 31, 2023 amounted to $1,005,478, which is 1.1% of net assets. |
| (b) | Investment was valued using significant unobservable inputs. |
| (c) | Affiliated fund managed by DWS Investment Management Americas, Inc. The rate shown is the annualized seven-day yield at period end. |
| (d) | Represents cash collateral held in connection with securities lending. Income earned by the Fund is net of borrower rebates. In addition, the Fund held non-cash U.S. Treasury securities collateral having a value of $912,877. |
| (e) | Represents the net increase (purchase cost) or decrease (sales proceeds) in the amount invested in cash collateral for the year ended May 31, 2023. |
| ADR: | American Depositary Receipt |
| CPO: | Ordinary Participation Certificates |
| GDR: | Global Depositary Receipt |
| JSC: | Joint Stock Company |
| KSC: | Kuwait Shareholding Company |
| KSCP: | Kuwait Shareholding Company Public |
| NVDR: | Non Voting Depositary Receipt |
| PJSC: | Public Joint Stock Company |
| PSQC: | Public Shareholders Qatari Company |
| QPSC: | Qatari Public Shareholders Company |
| QSC: | Qatari Shareholders Company |
| REIT: | Real Estate Investment Trust |
| SAE: | Societe Anonyme Egyptienne |
| SAQ: | Societe Anonyme Qatar |
| 144A: | Security exempt from registration under Rule 144A of the Securities Act of 1933. These securities may be resold in transactions exempt from registration, normally to qualified institutional buyers. |
Securities are listed in country of domicile.
At May 31, 2023, open futures contracts purchased were as follows:
| Contract Description |
Currency | Number of Contracts |
Notional Amount |
Contract Value |
Expiration Date |
Unrealized Depreciation |
||||||||||||
| MSCI Emerging Markets Index Future |
USD | 30 | $ | 1,445,505 | $ | 1,435,200 | 6/16/2023 | $ | (10,305 | ) | ||||||||
| See Notes to Financial Statements. | 64 |
DBX ETF Trust
Schedule of Investments
Xtrackers MSCI Emerging Markets Hedged Equity ETF (Continued)
May 31, 2023
As of May 31, 2023, the Fund had the following forward foreign currency contracts outstanding:
| Counterparty |
Settlement Date |
Currency To Deliver |
Currency To Receive |
Unrealized Appreciation |
Unrealized Depreciation |
|||||||||||||||||
| Goldman Sachs & Co. |
6/2/2023 | AED | 532,000 | USD | 144,853 | $ | 10 | $ | — | |||||||||||||
| Goldman Sachs & Co. |
6/2/2023 | AED | 3,966,700 | USD | 1,080,050 | 74 | — | |||||||||||||||
| JP Morgan & Chase Co. |
6/2/2023 | CNH | 16,213,900 | USD | 2,347,034 | 68,921 | — | |||||||||||||||
| RBC Capital Markets |
6/2/2023 | CNH | 16,443,300 | USD | 2,380,241 | 69,896 | — | |||||||||||||||
| JP Morgan & Chase Co. |
6/2/2023 | CZK | 3,215,000 | USD | 150,945 | 6,091 | — | |||||||||||||||
| JP Morgan & Chase Co. |
6/2/2023 | CZK | 585,000 | USD | 27,465 | 1,108 | — | |||||||||||||||
| JP Morgan & Chase Co. |
6/2/2023 | EUR | 312,800 | USD | 345,938 | 11,586 | — | |||||||||||||||
| Goldman Sachs & Co. |
6/2/2023 | HKD | 57,599,500 | USD | 7,346,875 | — | (8,960 | ) | ||||||||||||||
| JP Morgan & Chase Co. |
6/2/2023 | HKD | 48,222,400 | USD | 6,151,083 | — | (7,235 | ) | ||||||||||||||
| RBC Capital Markets |
6/2/2023 | HKD | 65,554,900 | USD | 8,361,957 | — | (9,835 | ) | ||||||||||||||
| JP Morgan & Chase Co. |
6/2/2023 | HUF | 5,044,000 | USD | 14,781 | 229 | — | |||||||||||||||
| JP Morgan & Chase Co. |
6/2/2023 | HUF | 32,694,000 | USD | 95,799 | 1,483 | — | |||||||||||||||
| RBC Capital Markets |
6/2/2023 | HUF | 28,733,400 | USD | 84,194 | 1,303 | — | |||||||||||||||
| Goldman Sachs & Co. |
6/2/2023 | MXN | 14,240,300 | USD | 784,503 | — | (20,534 | ) | ||||||||||||||
| Goldman Sachs & Co. |
6/2/2023 | MXN | 1,941,000 | USD | 106,928 | — | (2,802 | ) | ||||||||||||||
| JP Morgan & Chase Co. |
6/2/2023 | MXN | 13,179,200 | USD | 726,047 | — | (19,004 | ) | ||||||||||||||
| RBC Capital Markets |
6/2/2023 | MXN | 14,622,800 | USD | 805,575 | — | (21,086 | ) | ||||||||||||||
| Goldman Sachs & Co. |
6/2/2023 | PHP | 13,800,300 | USD | 248,856 | 3,124 | — | |||||||||||||||
| JP Morgan & Chase Co. |
6/2/2023 | PHP | 10,973,100 | USD | 197,856 | 2,466 | — | |||||||||||||||
| RBC Capital Markets |
6/2/2023 | PHP | 9,045,400 | USD | 163,157 | 2,092 | — | |||||||||||||||
| Goldman Sachs & Co. |
6/2/2023 | PLN | 1,618,200 | USD | 389,317 | 7,234 | — | |||||||||||||||
| Goldman Sachs & Co. |
6/2/2023 | PLN | 474,000 | USD | 114,035 | 2,116 | — | |||||||||||||||
| JP Morgan & Chase Co. |
6/2/2023 | PLN | 987,600 | USD | 237,621 | 4,432 | — | |||||||||||||||
| Goldman Sachs & Co. |
6/2/2023 | THB | 19,405,200 | USD | 570,523 | 12,902 | — | |||||||||||||||
| JP Morgan & Chase Co. |
6/2/2023 | THB | 44,082,900 | USD | 1,295,984 | 29,234 | — | |||||||||||||||
| JP Morgan & Chase Co. |
6/2/2023 | TRY | 7,360,700 | USD | 342,386 | — | (12,569 | ) | ||||||||||||||
| RBC Capital Markets |
6/2/2023 | TRY | 3,839,100 | USD | 181,705 | — | (3,428 | ) | ||||||||||||||
| Goldman Sachs & Co. |
6/2/2023 | USD | 1,224,803 | AED | 4,498,700 | 17 | — | |||||||||||||||
| JP Morgan & Chase Co. |
6/2/2023 | USD | 160,247 | CNH | 1,107,000 | — | (4,709 | ) | ||||||||||||||
| JP Morgan & Chase Co. |
6/2/2023 | USD | 2,120,029 | CNH | 15,106,900 | 2,547 | — | |||||||||||||||
| RBC Capital Markets |
6/2/2023 | USD | 2,307,572 | CNH | 16,443,300 | 2,772 | — | |||||||||||||||
| JP Morgan & Chase Co. |
6/2/2023 | USD | 170,451 | CZK | 3,800,000 | 761 | — | |||||||||||||||
| JP Morgan & Chase Co. |
6/2/2023 | USD | 333,476 | EUR | 312,800 | 876 | — | |||||||||||||||
| Goldman Sachs & Co. |
6/2/2023 | USD | 7,357,902 | HKD | 57,599,500 | — | (2,067 | ) | ||||||||||||||
| JP Morgan & Chase Co. |
6/2/2023 | USD | 607,694 | HKD | 4,764,000 | 700 | — | |||||||||||||||
| JP Morgan & Chase Co. |
6/2/2023 | USD | 5,551,483 | HKD | 43,458,400 | — | (1,560 | ) | ||||||||||||||
| RBC Capital Markets |
6/2/2023 | USD | 8,363,461 | HKD | 65,554,900 | 8,331 | — | |||||||||||||||
| JP Morgan & Chase Co. |
6/2/2023 | USD | 108,509 | HUF | 37,738,000 | 358 | — | |||||||||||||||
| RBC Capital Markets |
6/2/2023 | USD | 82,618 | HUF | 28,733,400 | 273 | — | |||||||||||||||
| Goldman Sachs & Co. |
6/2/2023 | USD | 911,199 | MXN | 16,181,300 | 3,567 | — | |||||||||||||||
| JP Morgan & Chase Co. |
6/2/2023 | USD | 742,145 | MXN | 13,179,200 | 2,905 | — | |||||||||||||||
| RBC Capital Markets |
6/2/2023 | USD | 823,437 | MXN | 14,622,800 | 3,224 | — | |||||||||||||||
| Goldman Sachs & Co. |
6/2/2023 | USD | 245,513 | PHP | 13,800,300 | 219 | — | |||||||||||||||
| JP Morgan & Chase Co. |
6/2/2023 | USD | 195,317 | PHP | 10,973,100 | 73 | — | |||||||||||||||
| RBC Capital Markets |
6/2/2023 | USD | 160,950 | PHP | 9,045,400 | 115 | — | |||||||||||||||
| Goldman Sachs & Co. |
6/2/2023 | USD | 491,906 | PLN | 2,092,200 | 2,096 | — | |||||||||||||||
| JP Morgan & Chase Co. |
6/2/2023 | USD | 232,199 | PLN | 987,600 | 990 | — | |||||||||||||||
| Goldman Sachs & Co. |
6/2/2023 | USD | 558,745 | THB | 19,405,200 | — | (1,124 | ) | ||||||||||||||
| JP Morgan & Chase Co. |
6/2/2023 | USD | 1,269,303 | THB | 44,082,900 | — | (2,553 | ) | ||||||||||||||
| JP Morgan & Chase Co. |
6/2/2023 | USD | 355,611 | TRY | 7,360,700 | — | (656 | ) | ||||||||||||||
| RBC Capital Markets |
6/2/2023 | USD | 184,850 | TRY | 3,839,100 | 283 | — | |||||||||||||||
| JP Morgan & Chase Co. |
6/2/2023 | USD | 1,470,884 | ZAR | 29,147,400 | 7,273 | — | |||||||||||||||
| RBC Capital Markets |
6/2/2023 | USD | 1,516,937 | ZAR | 30,060,000 | 7,501 | — | |||||||||||||||
| JP Morgan & Chase Co. |
6/2/2023 | ZAR | 29,147,400 | USD | 1,589,848 | 111,692 | — | |||||||||||||||
| RBC Capital Markets |
6/2/2023 | ZAR | 1,413,000 | USD | 77,068 | 5,410 | — | |||||||||||||||
| RBC Capital Markets |
6/2/2023 | ZAR | 28,647,000 | USD | 1,562,554 | 109,774 | — | |||||||||||||||
| See Notes to Financial Statements. | 65 |
DBX ETF Trust
Schedule of Investments
Xtrackers MSCI Emerging Markets Hedged Equity ETF (Continued)
May 31, 2023
| Counterparty |
Settlement Date |
Currency To Deliver |
Currency To Receive |
Unrealized Appreciation |
Unrealized Depreciation |
|||||||||||||||||
| JP Morgan & Chase Co. |
6/5/2023 | BRL | 9,378,600 | USD | 1,863,814 | $ | 16,694 | $ | — | |||||||||||||
| RBC Capital Markets |
6/5/2023 | BRL | 13,190,200 | USD | 2,620,800 | 22,983 | — | |||||||||||||||
| RBC Capital Markets |
6/5/2023 | BRL | 209,000 | USD | 41,521 | 358 | — | |||||||||||||||
| Goldman Sachs & Co. |
6/5/2023 | CLP | 214,304,900 | USD | 265,813 | 1,430 | — | |||||||||||||||
| RBC Capital Markets |
6/5/2023 | CLP | 176,141,400 | USD | 218,612 | 1,311 | — | |||||||||||||||
| Goldman Sachs & Co. |
6/5/2023 | COP | 458,572,400 | USD | 97,612 | — | (5,300 | ) | ||||||||||||||
| Goldman Sachs & Co. |
6/5/2023 | INR | 476,611,500 | USD | 5,812,335 | 52,434 | — | |||||||||||||||
| JP Morgan & Chase Co. |
6/5/2023 | INR | 482,789,400 | USD | 5,889,974 | 55,412 | — | |||||||||||||||
| JP Morgan & Chase Co. |
6/5/2023 | KRW | 6,878,911,200 | USD | 5,143,996 | — | (40,303 | ) | ||||||||||||||
| RBC Capital Markets |
6/5/2023 | KRW | 7,326,704,700 | USD | 5,481,189 | — | (40,590 | ) | ||||||||||||||
| Goldman Sachs & Co. |
6/5/2023 | KWD | 246,000 | USD | 804,053 | 3,974 | — | |||||||||||||||
| Goldman Sachs & Co. |
6/5/2023 | QAR | 2,916,700 | USD | 798,549 | — | (2,614 | ) | ||||||||||||||
| Goldman Sachs & Co. |
6/5/2023 | SAR | 301,000 | USD | 80,209 | — | (35 | ) | ||||||||||||||
| Goldman Sachs & Co. |
6/5/2023 | SAR | 13,378,000 | USD | 3,565,090 | — | (1,362 | ) | ||||||||||||||
| Goldman Sachs & Co. |
6/5/2023 | TWD | 142,083,200 | USD | 4,628,117 | 1,525 | — | |||||||||||||||
| JP Morgan & Chase Co. |
6/5/2023 | TWD | 119,443,700 | USD | 3,892,322 | 2,930 | — | |||||||||||||||
| RBC Capital Markets |
6/5/2023 | TWD | 161,024,000 | USD | 5,244,057 | 703 | — | |||||||||||||||
| JP Morgan & Chase Co. |
6/5/2023 | USD | 1,835,594 | BRL | 9,378,600 | 11,527 | — | |||||||||||||||
| RBC Capital Markets |
6/5/2023 | USD | 2,616,060 | BRL | 13,399,200 | 22,919 | — | |||||||||||||||
| Goldman Sachs & Co. |
6/5/2023 | USD | 263,198 | CLP | 214,304,900 | 1,185 | — | |||||||||||||||
| RBC Capital Markets |
6/5/2023 | USD | 216,327 | CLP | 176,141,400 | 974 | — | |||||||||||||||
| Goldman Sachs & Co. |
6/5/2023 | USD | 15,835 | COP | 74,391,000 | 860 | — | |||||||||||||||
| Goldman Sachs & Co. |
6/5/2023 | USD | 86,873 | COP | 384,181,400 | — | (655 | ) | ||||||||||||||
| Goldman Sachs & Co. |
6/5/2023 | USD | 5,763,138 | INR | 476,611,500 | — | (3,236 | ) | ||||||||||||||
| JP Morgan & Chase Co. |
6/5/2023 | USD | 5,835,794 | INR | 482,789,400 | — | (1,232 | ) | ||||||||||||||
| JP Morgan & Chase Co. |
6/5/2023 | USD | 4,913,036 | KRW | 6,514,734,200 | — | (3,200 | ) | ||||||||||||||
| JP Morgan & Chase Co. |
6/5/2023 | USD | 272,755 | KRW | 364,177,000 | 1,707 | — | |||||||||||||||
| RBC Capital Markets |
6/5/2023 | USD | 5,525,418 | KRW | 7,326,704,700 | — | (3,640 | ) | ||||||||||||||
| Goldman Sachs & Co. |
6/5/2023 | USD | 32,706 | KWD | 10,000 | — | (183 | ) | ||||||||||||||
| Goldman Sachs & Co. |
6/5/2023 | USD | 766,856 | KWD | 236,000 | 699 | — | |||||||||||||||
| Goldman Sachs & Co. |
6/5/2023 | USD | 800,631 | QAR | 2,916,700 | 532 | — | |||||||||||||||
| Goldman Sachs & Co. |
6/5/2023 | USD | 3,646,955 | SAR | 13,679,000 | — | (259 | ) | ||||||||||||||
| Goldman Sachs & Co. |
6/5/2023 | USD | 4,615,339 | TWD | 142,083,200 | 11,254 | — | |||||||||||||||
| JP Morgan & Chase Co. |
6/5/2023 | USD | 1,136,003 | TWD | 34,831,000 | — | (1,817 | ) | ||||||||||||||
| JP Morgan & Chase Co. |
6/5/2023 | USD | 2,749,665 | TWD | 84,612,700 | 5,541 | — | |||||||||||||||
| RBC Capital Markets |
6/5/2023 | USD | 5,231,449 | TWD | 161,024,000 | 11,905 | — | |||||||||||||||
| Goldman Sachs & Co. |
6/6/2023 | EGP | 2,455,600 | USD | 70,361 | — | (8,778 | ) | ||||||||||||||
| RBC Capital Markets |
6/6/2023 | MYR | 5,650,300 | USD | 1,267,679 | 42,925 | — | |||||||||||||||
| Goldman Sachs & Co. |
6/6/2023 | USD | 79,469 | EGP | 2,455,600 | — | (330 | ) | ||||||||||||||
| RBC Capital Markets |
6/6/2023 | USD | 1,224,732 | MYR | 5,650,300 | 22 | — | |||||||||||||||
| Goldman Sachs & Co. |
6/7/2023 | IDR | 1,487,949,000 | USD | 101,338 | 2,083 | — | |||||||||||||||
| Goldman Sachs & Co. |
6/7/2023 | IDR | 7,371,736,000 | USD | 502,367 | 10,628 | — | |||||||||||||||
| JP Morgan & Chase Co. |
6/7/2023 | IDR | 9,713,867,700 | USD | 661,843 | 13,870 | — | |||||||||||||||
| RBC Capital Markets |
6/7/2023 | IDR | 8,381,022,300 | USD | 571,109 | 12,044 | — | |||||||||||||||
| Goldman Sachs & Co. |
6/7/2023 | USD | 590,488 | IDR | 8,859,685,000 | 506 | — | |||||||||||||||
| JP Morgan & Chase Co. |
6/7/2023 | USD | 647,764 | IDR | 9,713,867,700 | 209 | — | |||||||||||||||
| RBC Capital Markets |
6/7/2023 | USD | 558,735 | IDR | 8,381,022,300 | 330 | — | |||||||||||||||
| Goldman Sachs & Co. |
7/5/2023 | AED | 4,498,700 | USD | 1,224,736 | — | (105 | ) | ||||||||||||||
| JP Morgan & Chase Co. |
7/5/2023 | CNH | 15,106,900 | USD | 2,126,115 | — | (3,181 | ) | ||||||||||||||
| RBC Capital Markets |
7/5/2023 | CNH | 16,443,300 | USD | 2,314,230 | — | (3,430 | ) | ||||||||||||||
| Goldman Sachs & Co. |
7/5/2023 | EGP | 2,455,600 | USD | 77,586 | 163 | — | |||||||||||||||
| JP Morgan & Chase Co. |
7/5/2023 | EUR | 62,000 | USD | 66,225 | — | (184 | ) | ||||||||||||||
| JP Morgan & Chase Co. |
7/5/2023 | EUR | 312,800 | USD | 334,122 | — | (924 | ) | ||||||||||||||
| Goldman Sachs & Co. |
7/5/2023 | HKD | 57,599,500 | USD | 7,363,829 | 1,385 | — | |||||||||||||||
| JP Morgan & Chase Co. |
7/5/2023 | HKD | 43,458,400 | USD | 5,555,955 | 1,045 | — | |||||||||||||||
| RBC Capital Markets |
7/5/2023 | HKD | 65,554,900 | USD | 8,370,189 | — | (9,124 | ) | ||||||||||||||
| JP Morgan & Chase Co. |
7/5/2023 | HUF | 37,738,000 | USD | 107,523 | — | (261 | ) | ||||||||||||||
| RBC Capital Markets |
7/5/2023 | HUF | 28,733,400 | USD | 81,867 | — | (199 | ) | ||||||||||||||
| See Notes to Financial Statements. | 66 |
DBX ETF Trust
Schedule of Investments
Xtrackers MSCI Emerging Markets Hedged Equity ETF (Continued)
May 31, 2023
| Counterparty |
Settlement Date |
Currency To Deliver |
Currency To Receive |
Unrealized Appreciation |
Unrealized Depreciation |
|||||||||||||||||
| Goldman Sachs & Co. |
7/5/2023 | IDR | 8,859,685,000 | USD | 589,859 | $ | — | $ | (958 | ) | ||||||||||||
| JP Morgan & Chase Co. |
7/5/2023 | IDR | 9,713,867,700 | USD | 647,074 | — | (705 | ) | ||||||||||||||
| RBC Capital Markets |
7/5/2023 | IDR | 8,381,022,300 | USD | 558,325 | — | (571 | ) | ||||||||||||||
| Goldman Sachs & Co. |
7/5/2023 | INR | 476,611,500 | USD | 5,753,051 | — | (679 | ) | ||||||||||||||
| Goldman Sachs & Co. |
7/5/2023 | INR | 96,344,000 | USD | 1,164,376 | 1,296 | — | |||||||||||||||
| JP Morgan & Chase Co. |
7/5/2023 | INR | 482,789,400 | USD | 5,829,030 | 719 | — | |||||||||||||||
| JP Morgan & Chase Co. |
7/5/2023 | KRW | 1,327,678,000 | USD | 1,003,407 | 1,102 | — | |||||||||||||||
| JP Morgan & Chase Co. |
7/5/2023 | KRW | 6,514,734,200 | USD | 4,920,531 | 2,357 | — | |||||||||||||||
| RBC Capital Markets |
7/5/2023 | KRW | 7,326,704,700 | USD | 5,534,225 | 3,068 | — | |||||||||||||||
| Goldman Sachs & Co. |
7/5/2023 | KWD | 236,000 | USD | 766,931 | — | (1,835 | ) | ||||||||||||||
| Goldman Sachs & Co. |
7/5/2023 | MXN | 16,181,300 | USD | 904,810 | — | (3,036 | ) | ||||||||||||||
| JP Morgan & Chase Co. |
7/5/2023 | MXN | 13,179,200 | USD | 736,980 | — | (2,435 | ) | ||||||||||||||
| RBC Capital Markets |
7/5/2023 | MXN | 14,622,800 | USD | 817,706 | — | (2,701 | ) | ||||||||||||||
| RBC Capital Markets |
7/5/2023 | MYR | 170,000 | USD | 36,921 | — | (9 | ) | ||||||||||||||
| RBC Capital Markets |
7/5/2023 | MYR | 5,650,300 | USD | 1,226,061 | — | (1,359 | ) | ||||||||||||||
| Goldman Sachs & Co. |
7/5/2023 | PHP | 13,800,300 | USD | 245,186 | — | (256 | ) | ||||||||||||||
| JP Morgan & Chase Co. |
7/5/2023 | PHP | 10,973,100 | USD | 195,015 | — | (145 | ) | ||||||||||||||
| JP Morgan & Chase Co. |
7/5/2023 | PHP | 1,263,000 | USD | 22,379 | — | (84 | ) | ||||||||||||||
| RBC Capital Markets |
7/5/2023 | PHP | 9,045,400 | USD | 160,721 | — | (154 | ) | ||||||||||||||
| Goldman Sachs & Co. |
7/5/2023 | PLN | 2,092,200 | USD | 491,006 | — | (2,013 | ) | ||||||||||||||
| JP Morgan & Chase Co. |
7/5/2023 | PLN | 987,600 | USD | 231,774 | — | (950 | ) | ||||||||||||||
| Goldman Sachs & Co. |
7/5/2023 | QAR | 2,916,700 | USD | 799,644 | — | (732 | ) | ||||||||||||||
| Goldman Sachs & Co. |
7/5/2023 | QAR | 171,000 | USD | 46,881 | — | (43 | ) | ||||||||||||||
| Goldman Sachs & Co. |
7/5/2023 | SAR | 289,000 | USD | 77,009 | — | (4 | ) | ||||||||||||||
| Goldman Sachs & Co. |
7/5/2023 | SAR | 13,679,000 | USD | 3,645,012 | — | (194 | ) | ||||||||||||||
| Goldman Sachs & Co. |
7/5/2023 | THB | 19,405,200 | USD | 560,196 | 565 | — | |||||||||||||||
| JP Morgan & Chase Co. |
7/5/2023 | THB | 44,082,900 | USD | 1,272,601 | 1,283 | — | |||||||||||||||
| JP Morgan & Chase Co. |
7/5/2023 | TRY | 7,360,700 | USD | 319,077 | 2,279 | — | |||||||||||||||
| RBC Capital Markets |
7/5/2023 | TRY | 3,839,100 | USD | 165,916 | 685 | — | |||||||||||||||
| Goldman Sachs & Co. |
7/5/2023 | TWD | 142,083,200 | USD | 4,621,343 | — | (20,971 | ) | ||||||||||||||
| JP Morgan & Chase Co. |
7/5/2023 | TWD | 84,612,700 | USD | 2,754,499 | — | (10,069 | ) | ||||||||||||||
| JP Morgan & Chase Co. |
7/5/2023 | TWD | 55,933,000 | USD | 1,821,507 | — | (6,004 | ) | ||||||||||||||
| RBC Capital Markets |
7/5/2023 | TWD | 161,024,000 | USD | 5,239,449 | — | (21,721 | ) | ||||||||||||||
| Goldman Sachs & Co. |
7/5/2023 | USD | 37,571 | AED | 138,000 | 1 | — | |||||||||||||||
| RBC Capital Markets |
7/5/2023 | USD | 141,455 | CNH | 1,005,000 | 198 | — | |||||||||||||||
| RBC Capital Markets |
7/5/2023 | USD | 762,544 | HKD | 5,964,000 | — | (218 | ) | ||||||||||||||
| Goldman Sachs & Co. |
7/5/2023 | USD | 23,705 | PLN | 101,000 | 96 | — | |||||||||||||||
| JP Morgan & Chase Co. |
7/5/2023 | USD | 293,868 | ZAR | 5,842,000 | 1,364 | — | |||||||||||||||
| JP Morgan & Chase Co. |
7/5/2023 | ZAR | 29,147,400 | USD | 1,466,156 | — | (6,840 | ) | ||||||||||||||
| RBC Capital Markets |
7/5/2023 | ZAR | 30,060,000 | USD | 1,512,067 | — | (7,048 | ) | ||||||||||||||
| JP Morgan & Chase Co. |
7/6/2023 | BRL | 9,378,600 | USD | 1,824,783 | — | (12,670 | ) | ||||||||||||||
| JP Morgan & Chase Co. |
7/6/2023 | BRL | 237,000 | USD | 46,056 | — | (377 | ) | ||||||||||||||
| RBC Capital Markets |
7/6/2023 | BRL | 13,399,200 | USD | 2,600,827 | — | (24,341 | ) | ||||||||||||||
| Goldman Sachs & Co. |
7/6/2023 | CLP | 214,304,900 | USD | 262,071 | — | (1,153 | ) | ||||||||||||||
| RBC Capital Markets |
7/6/2023 | CLP | 176,141,400 | USD | 215,402 | — | (948 | ) | ||||||||||||||
| Goldman Sachs & Co. |
7/7/2023 | COP | 384,181,400 | USD | 86,077 | 582 | — | |||||||||||||||
| JP Morgan & Chase Co. |
7/7/2023 | CZK | 3,800,000 | USD | 170,202 | — | (739 | ) | ||||||||||||||
|
|
|
|
|
|||||||||||||||||||
| Total unrealized appreciation (depreciation) |
$ | 825,720 | $ | (381,026 | ) | |||||||||||||||||
|
|
|
|
|
|||||||||||||||||||
For information on the Fund’s policy and additional disclosures regarding futures contracts and forward foreign currency contracts, please refer to the Derivatives section of Note 2 in the accompanying Notes to Financial Statements.
| See Notes to Financial Statements. | 67 |
DBX ETF Trust
Schedule of Investments
Xtrackers MSCI Emerging Markets Hedged Equity ETF (Continued)
May 31, 2023
Currency Abbreviations
| AED | Arab Emirates Dirham |
| BRL | Brazilian Real |
| CLP | Chilean Peso |
| CNH | Chinese Yuan |
| COP | Colombian Peso |
| CZK | Czech Koruna |
| EGP | Egyptian Pound |
| EUR | Euro |
| HKD | Hong Kong Dollar |
| HUF | Hungarian Forint |
| IDR | Indonesian Rupiah |
| INR | Indian Rupee |
| KRW | South Korean Won |
| KWD | Kuwaiti Dinar |
| MXN | Mexican Peso |
| MYR | Malaysian Ringgit |
| PHP | Philippine Peso |
| PLN | Polish Zloty |
| QAR | Qatari Rial |
| SAR | Saudi Riyal |
| THB | Thai Baht |
| TRY | Turkish Lira |
| TWD | New Taiwan Dollar |
| USD | U.S. Dollar |
| ZAR | South African Rand |
Fair Value Measurements
Various inputs are used in determining the value of the Fund’s investments. These inputs are summarized in three broad levels. Level 1 includes quoted prices in active markets for identical securities. Level 2 includes other significant observable inputs (including quoted prices for similar securities, interest rates, prepayment speeds and credit risk). Level 3 includes significant unobservable inputs (including the Fund’s own assumptions in determining the fair value of investments). The level assigned to the securities valuations may not be an indication of the risk or liquidity associated with investing in those securities.
The following is a summary of the inputs used as of May 31, 2023 in valuing the Fund’s investments. For information on the Fund’s policy regarding the valuation of investments, please refer to the Security Valuation section of Note 2 in the accompanying Notes to Financial Statements.
| Assets |
Level 1 | Level 2 | Level 3 | Total | ||||||||||||
| Common Stocks (a) |
$ | 85,772,844 | $ | — | $ | 0 | $ | 85,772,844 | ||||||||
| Preferred Stocks (a) |
1,901,729 | — | 0 | 1,901,729 | ||||||||||||
| Corporate Bonds |
— | 545 | — | 545 | ||||||||||||
| Warrants |
154 | — | — | 154 | ||||||||||||
| Short-Term Investments (a) |
1,091,839 | — | — | 1,091,839 | ||||||||||||
| Derivatives (b) |
||||||||||||||||
| Forward Foreign Currency Contracts |
— | 825,720 | — | 825,720 | ||||||||||||
|
|
|
|
|
|
|
|
|
|||||||||
| TOTAL |
$ | 88,766,566 | $ | 826,265 | $ | 0 | $ | 89,592,831 | ||||||||
|
|
|
|
|
|
|
|
|
|||||||||
| Liabilities |
Level 1 | Level 2 | Level 3 | Total | ||||||||||||
| Derivatives (b) |
||||||||||||||||
| Forward Foreign Currency Contracts |
$ | — | $ | (381,026 | ) | $ | — | $ | (381,026 | ) | ||||||
| Futures Contracts |
(10,305 | ) | — | — | (10,305 | ) | ||||||||||
|
|
|
|
|
|
|
|
|
|||||||||
| TOTAL |
$ | (10,305 | ) | $ | (381,026 | ) | $ | — | $ | (391,331 | ) | |||||
|
|
|
|
|
|
|
|
|
|||||||||
| (a) | See Schedule of Investments for additional detailed categorizations. |
| (b) | Derivatives include unrealized appreciation (depreciation) on open futures contracts and forward foreign currency contracts. |
During the year ended May 31, 2023, the amount of transfers from Level 3 to Level 1 was $ 23,472. The investment was transferred from Level 3 to Level 1 due to the availability of a pricing source supported by observable inputs.
| See Notes to Financial Statements. | 68 |
DBX ETF Trust
Schedule of Investments
Xtrackers MSCI Europe Hedged Equity ETF
May 31, 2023
| Number |
Value |
|||||||
| COMMON STOCKS — 96.6% | ||||||||
| Austria — 0.3% | ||||||||
| Erste Group Bank AG |
15,720 | $ | 508,630 | |||||
| OMV AG |
6,733 | 299,967 | ||||||
| Verbund AG |
3,119 | 235,207 | ||||||
| voestalpine AG |
5,310 | 164,487 | ||||||
|
|
|
|||||||
| (Cost $1,480,639) |
1,208,291 | |||||||
|
|
|
|||||||
| Belgium — 1.2% | ||||||||
| Ageas SA/NV (a) |
7,412 | 295,754 | ||||||
| Anheuser-Busch InBev SA/NV |
39,680 | 2,116,882 | ||||||
| D’ieteren Group |
993 | 171,631 | ||||||
| Elia Group SA/NV |
1,345 | 162,601 | ||||||
| Groupe Bruxelles Lambert NV |
4,516 | 347,941 | ||||||
| KBC Group NV |
11,730 | 767,087 | ||||||
| Sofina SA |
714 | 147,297 | ||||||
| Solvay SA (a) |
3,371 | 351,895 | ||||||
| UCB SA |
5,780 | 503,651 | ||||||
| Umicore SA (a) |
9,571 | 265,992 | ||||||
| Warehouses De Pauw CVA REIT |
7,415 | 207,975 | ||||||
|
|
|
|||||||
| (Cost $7,860,131) |
5,338,706 | |||||||
|
|
|
|||||||
| Chile — 0.1% | ||||||||
| Antofagasta PLC |
18,024 | 299,880 | ||||||
|
|
|
|||||||
| Denmark — 4.7% | ||||||||
| A.P. Moller — Maersk A/S, Class A |
138 | 231,563 | ||||||
| A.P. Moller — Maersk A/S, Class B |
232 | 390,127 | ||||||
| Carlsberg A/S, Class B |
4,505 | 678,662 | ||||||
| Chr Hansen Holding A/S |
4,773 | 346,123 | ||||||
| Coloplast A/S, Class B |
5,442 | 685,069 | ||||||
| Danske Bank A/S* |
31,339 | 637,428 | ||||||
| Demant A/S* |
4,234 | 160,933 | ||||||
| DSV A/S |
8,548 | 1,647,232 | ||||||
| Genmab A/S* |
3,023 | 1,182,444 | ||||||
| Novo Nordisk A/S, Class B |
75,691 | 12,127,248 | ||||||
| Novozymes A/S, Class B |
9,341 | 450,112 | ||||||
| Orsted AS, 144A |
8,648 | 757,219 | ||||||
| Pandora A/S |
4,169 | 332,125 | ||||||
| ROCKWOOL A/S, Class B |
423 | 100,852 | ||||||
| Tryg A/S |
16,596 | 377,580 | ||||||
| Vestas Wind Systems A/S* |
45,885 | 1,306,343 | ||||||
|
|
|
|||||||
| (Cost $16,945,744) |
21,411,060 | |||||||
|
|
|
|||||||
| Finland — 1.7% | ||||||||
| Elisa OYJ |
6,524 | 365,412 | ||||||
| Fortum OYJ |
20,555 | 273,103 | ||||||
| Kesko OYJ, Class B |
12,501 | 236,313 | ||||||
| Kone OYJ, Class B |
15,576 | 790,337 | ||||||
| Metso Corp. |
29,887 | 326,970 | ||||||
| Neste OYJ |
19,342 | 731,263 | ||||||
| Nokia OYJ |
245,507 | 995,894 | ||||||
| Nordea Bank Abp |
150,349 | 1,478,025 | ||||||
| Orion OYJ, Class B |
4,897 | 207,230 | ||||||
| Sampo OYJ, Class A |
21,066 | 968,701 | ||||||
| Stora Enso OYJ, Class R |
26,549 | 336,140 | ||||||
| UPM-Kymmene OYJ |
24,343 | 730,389 | ||||||
| Wartsila OYJ Abp |
21,709 | 245,739 | ||||||
|
|
|
|||||||
| (Cost $9,833,550) |
7,685,516 | |||||||
|
|
|
|||||||
| Number |
Value |
|||||||
| France — 17.6% | ||||||||
| Accor SA |
8,482 | $ | 280,787 | |||||
| Aeroports de Paris* |
1,356 | 205,964 | ||||||
| Air Liquide SA |
23,907 | 4,002,812 | ||||||
| Airbus SE |
27,112 | 3,551,214 | ||||||
| Alstom SA (a) |
14,843 | 408,383 | ||||||
| Amundi SA, 144A |
2,793 | 157,034 | ||||||
| Arkema SA |
2,579 | 224,671 | ||||||
| AXA SA (a) |
83,795 | 2,365,953 | ||||||
| BioMerieux |
1,862 | 186,371 | ||||||
| BNP Paribas SA (a) |
50,732 | 2,928,826 | ||||||
| Bollore SE |
40,844 | 261,513 | ||||||
| Bouygues SA (a) |
9,415 | 301,508 | ||||||
| Bureau Veritas SA |
13,442 | 340,957 | ||||||
| Capgemini SE |
7,536 | 1,311,393 | ||||||
| Carrefour SA |
27,100 | 497,802 | ||||||
| Cie de Saint-Gobain (a) |
22,403 | 1,240,433 | ||||||
| Cie Generale des Etablissements Michelin SCA |
31,058 | 881,737 | ||||||
| Covivio SA REIT |
1,967 | 96,170 | ||||||
| Credit Agricole SA (a) |
55,152 | 630,315 | ||||||
| Danone SA (a) |
29,338 | 1,735,430 | ||||||
| Dassault Aviation SA |
1,102 | 186,348 | ||||||
| Dassault Systemes SE |
30,525 | 1,341,345 | ||||||
| Edenred |
11,415 | 733,066 | ||||||
| Eiffage SA |
3,315 | 352,994 | ||||||
| Engie SA |
83,514 | 1,253,504 | ||||||
| EssilorLuxottica SA (a) |
13,308 | 2,396,048 | ||||||
| Eurazeo SE |
1,967 | 134,352 | ||||||
| Gecina SA REIT |
2,139 | 218,921 | ||||||
| Getlink SE |
16,847 | 285,963 | ||||||
| Hermes International |
1,451 | 2,949,644 | ||||||
| Ipsen SA* |
1,732 | 200,129 | ||||||
| Kering SA |
3,405 | 1,813,798 | ||||||
| Klepierre SA REIT |
9,801 | 221,888 | ||||||
| La Francaise des Jeux SAEM, 144A |
4,894 | 188,637 | ||||||
| Legrand SA* |
12,196 | 1,153,192 | ||||||
| L’Oreal SA |
11,010 | 4,695,671 | ||||||
| LVMH Moet Hennessy Louis Vuitton SE |
12,634 | 10,991,307 | ||||||
| Orange SA |
85,120 | 1,016,483 | ||||||
| Pernod Ricard SA |
9,429 | 2,036,898 | ||||||
| Publicis Groupe SA |
10,465 | 775,417 | ||||||
| Remy Cointreau SA |
1,058 | 162,566 | ||||||
| Renault SA |
8,816 | 294,812 | ||||||
| Safran SA |
15,647 | 2,265,246 | ||||||
| Sanofi (a) |
51,882 | 5,261,733 | ||||||
| Sartorius Stedim Biotech |
1,268 | 332,878 | ||||||
| Schneider Electric SE |
24,804 | 4,277,610 | ||||||
| SEB SA |
1,164 | 109,241 | ||||||
| Societe Generale SA (a) |
33,211 | 767,849 | ||||||
| Sodexo SA |
4,050 | 437,450 | ||||||
| Teleperformance |
2,695 | 403,008 | ||||||
| Thales SA |
4,814 | 670,483 | ||||||
| TotalEnergies SE (a) |
108,145 | 6,135,850 | ||||||
| Unibail-Rodamco-Westfield REIT* (a) |
5,393 | 246,724 | ||||||
| Valeo |
9,559 | 183,509 | ||||||
| Veolia Environnement SA |
31,070 | 914,624 | ||||||
| Vinci SA |
24,295 | 2,761,018 | ||||||
| See Notes to Financial Statements. | 69 |
DBX ETF Trust
Schedule of Investments
Xtrackers MSCI Europe Hedged Equity ETF (Continued)
May 31, 2023
| Number |
Value |
|||||||
| France (Continued) | ||||||||
| Vivendi SE |
32,841 | $ | 291,010 | |||||
| Wendel SE |
1,191 | 125,142 | ||||||
| Worldline SA, 144A* |
11,031 | 428,604 | ||||||
|
|
|
|||||||
| (Cost $80,558,991) |
80,624,235 | |||||||
|
|
|
|||||||
| Germany — 11.9% | ||||||||
| adidas AG |
7,418 | 1,201,260 | ||||||
| Allianz SE |
18,412 | 3,935,727 | ||||||
| BASF SE |
40,849 | 1,939,316 | ||||||
| Bayer AG |
44,901 | 2,502,444 | ||||||
| Bayerische Motoren Werke AG |
15,104 | 1,645,466 | ||||||
| Bechtle AG |
3,744 | 146,792 | ||||||
| Beiersdorf AG |
4,601 | 585,981 | ||||||
| Brenntag SE |
7,051 | 553,052 | ||||||
| Carl Zeiss Meditec AG |
1,844 | 206,665 | ||||||
| Commerzbank AG* |
48,660 | 488,920 | ||||||
| Continental AG |
5,052 | 336,317 | ||||||
| Covestro AG, 144A* |
8,858 | 341,428 | ||||||
| Daimler Truck Holding AG* |
22,621 | 684,283 | ||||||
| Delivery Hero SE, 144A* |
7,948 | 297,347 | ||||||
| Deutsche Bank AG (b) |
88,635 | 897,775 | ||||||
| Deutsche Boerse AG |
8,690 | 1,500,133 | ||||||
| Deutsche Lufthansa AG* |
27,374 | 268,022 | ||||||
| Deutsche Post AG |
45,962 | 2,065,867 | ||||||
| Deutsche Telekom AG |
148,077 | 3,283,511 | ||||||
| E.ON SE |
102,754 | 1,242,221 | ||||||
| Evonik Industries AG* |
9,507 | 190,487 | ||||||
| Fresenius Medical Care AG & Co. KGaA |
9,393 | 401,105 | ||||||
| Fresenius SE & Co. KGaA |
19,313 | 528,272 | ||||||
| GEA Group AG |
6,973 | 292,846 | ||||||
| Hannover Rueck SE |
2,750 | 588,483 | ||||||
| Heidelberg Materials AG |
6,566 | 469,391 | ||||||
| HelloFresh SE* |
7,497 | 178,141 | ||||||
| Henkel AG & Co. KGaA |
4,735 | 339,711 | ||||||
| Infineon Technologies AG |
59,737 | 2,217,612 | ||||||
| Knorr-Bremse AG |
3,345 | 228,759 | ||||||
| LEG Immobilien SE* |
3,393 | 175,935 | ||||||
| Mercedes-Benz Group AG |
39,110 | 2,916,715 | ||||||
| Merck KGaA |
5,924 | 1,030,560 | ||||||
| MTU Aero Engines AG |
2,450 | 565,139 | ||||||
| Muenchener Rueckversicherungs-Gesellschaft AG in Muenchen |
6,402 | 2,285,596 | ||||||
| Nemetschek SE |
2,638 | 206,519 | ||||||
| Puma SE |
4,883 | 232,370 | ||||||
| Rational AG |
234 | 156,952 | ||||||
| Rheinmetall AG |
1,991 | 503,102 | ||||||
| RWE AG |
28,906 | 1,208,716 | ||||||
| SAP SE |
47,722 | 6,232,412 | ||||||
| Scout24 SE, 144A |
3,530 | 226,393 | ||||||
| Siemens AG |
34,741 | 5,694,232 | ||||||
| Siemens Energy AG* |
23,542 | 597,395 | ||||||
| Siemens Healthineers AG, 144A |
13,010 | 735,649 | ||||||
| Symrise AG |
6,062 | 647,838 | ||||||
| Talanx AG |
2,869 | 159,927 | ||||||
| Telefonica Deutschland Holding AG |
41,083 | 115,712 | ||||||
| Volkswagen AG |
1,336 | 200,498 | ||||||
| Vonovia SE |
32,769 | 601,060 | ||||||
| Wacker Chemie AG |
828 | 109,923 | ||||||
| Number |
Value |
|||||||
| Germany (Continued) | ||||||||
| Zalando SE, 144A* |
10,247 | $ | 296,170 | |||||
|
|
|
|||||||
| (Cost $66,505,266) |
54,456,147 | |||||||
|
|
|
|||||||
| Hong Kong — 0.3% | ||||||||
| Prudential PLC |
126,036 | 1,655,624 | ||||||
|
|
|
|||||||
| Ireland — 1.7% | ||||||||
| AerCap Holdings NV* |
7,519 | 429,185 | ||||||
| AIB Group PLC |
61,113 | 250,321 | ||||||
| Bank of Ireland Group PLC |
48,904 | 459,693 | ||||||
| CRH PLC |
34,046 | 1,604,878 | ||||||
| DCC PLC |
4,382 | 250,582 | ||||||
| Experian PLC |
42,017 | 1,480,203 | ||||||
| Flutter Entertainment PLC* |
8,075 | 1,576,520 | ||||||
| Kerry Group PLC, Class A |
7,282 | 709,721 | ||||||
| Kingspan Group PLC |
7,083 | 470,009 | ||||||
| Smurfit Kappa Group PLC |
11,886 | 422,186 | ||||||
|
|
|
|||||||
| (Cost $7,658,260) |
7,653,298 | |||||||
|
|
|
|||||||
| Italy — 3.0% | ||||||||
| Amplifon SpA (a) |
5,683 | 196,087 | ||||||
| Assicurazioni Generali SpA |
45,993 | 870,904 | ||||||
| Davide Campari-Milano NV |
23,781 | 310,372 | ||||||
| DiaSorin SpA |
1,084 | 111,466 | ||||||
| Enel SpA |
371,278 | 2,324,802 | ||||||
| Eni SpA |
106,141 | 1,412,505 | ||||||
| Ferrari NV |
5,749 | 1,638,286 | ||||||
| FinecoBank Banca Fineco SpA |
27,777 | 368,464 | ||||||
| Infrastrutture Wireless Italiane SpA, 144A |
15,223 | 193,635 | ||||||
| Intesa Sanpaolo SpA |
736,471 | 1,696,841 | ||||||
| Mediobanca Banca di Credito Finanziario SpA |
24,735 | 272,192 | ||||||
| Moncler SpA |
9,417 | 637,369 | ||||||
| Nexi SpA, 144A* |
27,047 | 211,857 | ||||||
| Poste Italiane SpA, 144A |
23,297 | 241,452 | ||||||
| Prysmian SpA |
11,843 | 438,887 | ||||||
| Recordati Industria Chimica e Farmaceutica SpA |
4,767 | 206,977 | ||||||
| Snam SpA |
91,795 | 479,806 | ||||||
| Telecom Italia SpA* |
437,980 | 116,009 | ||||||
| Terna — Rete Elettrica Nazionale |
63,196 | 529,054 | ||||||
| UniCredit SpA |
84,208 | 1,612,439 | ||||||
|
|
|
|||||||
| (Cost $15,469,872) |
13,869,404 | |||||||
|
|
|
|||||||
| Jordan — 0.0% | ||||||||
| Hikma Pharmaceuticals PLC |
6,773 | 150,939 | ||||||
|
|
|
|||||||
| Luxembourg — 0.3% | ||||||||
| ArcelorMittal SA |
21,997 | 546,198 | ||||||
| Eurofins Scientific SE |
6,178 | 407,050 | ||||||
| Tenaris SA |
21,949 | 273,793 | ||||||
|
|
|
|||||||
| (Cost $1,440,808) |
1,227,041 | |||||||
|
|
|
|||||||
| Netherlands — 7.2% | ||||||||
| ABN AMRO Bank NV, 144A |
18,367 | 267,100 | ||||||
| Adyen NV, 144A* |
993 | 1,620,574 | ||||||
| See Notes to Financial Statements. | 70 |
DBX ETF Trust
Schedule of Investments
Xtrackers MSCI Europe Hedged Equity ETF (Continued)
May 31, 2023
| Number |
Value |
|||||||
| Netherlands (Continued) | ||||||||
| Aegon NV (a) |
77,437 | $ | 340,609 | |||||
| Akzo Nobel NV |
7,789 | 586,460 | ||||||
| Argenx SE* |
2,533 | 987,164 | ||||||
| ASM International NV |
2,145 | 929,498 | ||||||
| ASML Holding NV |
18,434 | 13,231,315 | ||||||
| Euronext NV, 144A |
3,949 | 262,341 | ||||||
| EXOR NV* |
5,022 | 416,880 | ||||||
| Heineken Holding NV |
5,251 | 446,498 | ||||||
| Heineken NV |
11,853 | 1,197,031 | ||||||
| IMCD NV |
2,607 | 391,660 | ||||||
| ING Groep NV |
165,500 | 2,035,801 | ||||||
| JDE Peet’s NV |
5,758 | 167,286 | ||||||
| Just Eat Takeaway.com NV, 144A* |
9,622 | 144,689 | ||||||
| Koninklijke Ahold Delhaize NV |
44,501 | 1,410,842 | ||||||
| Koninklijke KPN NV |
147,526 | 507,448 | ||||||
| Koninklijke Philips NV* |
42,715 | 805,683 | ||||||
| NN Group NV (a) |
11,564 | 416,805 | ||||||
| OCI NV |
4,504 | 100,090 | ||||||
| Prosus NV* |
36,676 | 2,413,729 | ||||||
| QIAGEN NV* |
10,497 | 473,607 | ||||||
| Randstad NV |
5,042 | 247,158 | ||||||
| Stellantis NV |
102,739 | 1,557,436 | ||||||
| Universal Music Group NV |
37,463 | 740,818 | ||||||
| Wolters Kluwer NV |
11,804 | 1,347,528 | ||||||
|
|
|
|||||||
| (Cost $32,984,923) |
33,046,050 | |||||||
|
|
|
|||||||
| Norway — 0.9% | ||||||||
| Adevinta ASA* |
14,213 | 99,489 | ||||||
| Aker BP ASA |
14,447 | 313,924 | ||||||
| DNB Bank ASA |
42,338 | 708,672 | ||||||
| Equinor ASA |
43,551 | 1,113,277 | ||||||
| Gjensidige Forsikring ASA |
8,512 | 143,014 | ||||||
| Kongsberg Gruppen ASA |
4,065 | 162,817 | ||||||
| Mowi ASA |
20,129 | 345,451 | ||||||
| Norsk Hydro ASA |
62,935 | 380,325 | ||||||
| Orkla ASA |
34,376 | 247,317 | ||||||
| Salmar ASA (a) |
3,335 | 146,918 | ||||||
| Telenor ASA |
32,010 | 328,745 | ||||||
| Yara International ASA (a) |
7,752 | 289,263 | ||||||
|
|
|
|||||||
| (Cost $5,357,712) |
4,279,212 | |||||||
|
|
|
|||||||
| Portugal — 0.2% | ||||||||
| EDP — Energias de Portugal SA |
132,573 | 646,469 | ||||||
| Galp Energia SGPS SA |
22,497 | 237,970 | ||||||
| Jeronimo Martins SGPS SA |
12,931 | 312,100 | ||||||
|
|
|
|||||||
| (Cost $1,256,828) |
1,196,539 | |||||||
|
|
|
|||||||
| Spain — 3.8% | ||||||||
| Acciona SA |
1,126 | 182,102 | ||||||
| ACS Actividades de Construccion y Servicios SA (a) |
9,523 | 316,775 | ||||||
| Aena SME SA, 144A |
3,425 | 535,236 | ||||||
| Amadeus IT Group SA* |
20,573 | 1,471,164 | ||||||
| Banco Bilbao Vizcaya Argentaria SA |
275,257 | 1,800,641 | ||||||
| Banco Santander SA |
751,760 | 2,446,831 | ||||||
| CaixaBank SA |
188,559 | 690,715 | ||||||
| Cellnex Telecom SA, 144A* (a) |
25,960 | 1,051,952 | ||||||
| Corp ACCIONA Energias Renovables SA* (a) |
3,012 | 100,192 | ||||||
| Number |
Value |
|||||||
| Spain (Continued) | ||||||||
| EDP Renovaveis SA |
11,696 | $ | 232,285 | |||||
| EDP Renovaveis SA* |
127 | 2,522 | ||||||
| Enagas SA (a) |
11,326 | 216,159 | ||||||
| Endesa SA |
15,121 | 326,974 | ||||||
| Ferrovial SA |
23,294 | 720,825 | ||||||
| Grifols SA* (a) |
13,686 | 158,651 | ||||||
| Iberdrola SA |
265,799 | 3,238,886 | ||||||
| Industria de Diseno Textil SA |
49,896 | 1,668,817 | ||||||
| Naturgy Energy Group SA |
6,151 | 175,021 | ||||||
| Red Electrica Corp. SA |
18,432 | 312,178 | ||||||
| Repsol SA |
60,677 | 823,044 | ||||||
| Telefonica SA |
237,544 | 1,008,027 | ||||||
|
|
|
|||||||
| (Cost $22,799,553) |
17,478,997 | |||||||
|
|
|
|||||||
| Sweden — 4.5% | ||||||||
| Alfa Laval AB (a) |
13,230 | 475,226 | ||||||
| Assa Abloy AB, Class B |
45,674 | 1,013,500 | ||||||
| Atlas Copco AB, Class A |
122,733 | 1,787,533 | ||||||
| Atlas Copco AB, Class B |
71,471 | 899,661 | ||||||
| Beijer Ref AB |
15,400 | 227,769 | ||||||
| Boliden AB |
12,483 | 380,122 | ||||||
| Boliden AB* |
12,679 | 13,413 | ||||||
| Embracer Group AB* (a) |
26,490 | 60,917 | ||||||
| Epiroc AB, Class A |
30,166 | 528,165 | ||||||
| Epiroc AB, Class B |
17,811 | 269,008 | ||||||
| EQT AB (a) |
16,213 | 306,427 | ||||||
| Essity AB, Class B |
27,875 | 740,812 | ||||||
| Evolution AB, 144A |
8,383 | 1,101,274 | ||||||
| Fastighets AB Balder, Class B* (a) |
28,213 | 94,738 | ||||||
| Getinge AB, Class B |
10,251 | 235,687 | ||||||
| H & M Hennes & Mauritz AB, Class B (a) |
30,044 | 374,975 | ||||||
| Hexagon AB, Class B |
95,003 | 1,101,327 | ||||||
| Holmen AB, Class B (a) |
4,295 | 162,431 | ||||||
| Husqvarna AB, Class B |
18,212 | 134,427 | ||||||
| Industrivarden AB, Class A |
5,447 | 146,568 | ||||||
| Industrivarden AB, Class C (a) |
7,534 | 201,406 | ||||||
| Indutrade AB |
12,526 | 294,572 | ||||||
| Investment AB Latour, Class B (a) |
6,748 | 133,632 | ||||||
| Investor AB, Class A |
19,743 | 405,892 | ||||||
| Investor AB, Class B (a) |
79,197 | 1,610,315 | ||||||
| Kinnevik AB, Class B* |
11,174 | 160,374 | ||||||
| L E Lundbergforetagen AB, Class B (a) |
3,535 | 147,045 | ||||||
| Lifco AB, Class B |
10,688 | 225,642 | ||||||
| Nibe Industrier AB, Class B |
70,833 | 675,902 | ||||||
| Saab AB, Class B |
3,656 | 199,042 | ||||||
| Sagax AB, Class B (a) |
8,753 | 172,450 | ||||||
| Sandvik AB |
48,797 | 857,291 | ||||||
| Securitas AB, Class B |
22,453 | 165,359 | ||||||
| Skandinaviska Enskilda Banken AB, Class A |
73,647 | 769,942 | ||||||
| Skanska AB, Class B |
15,544 | 204,832 | ||||||
| SKF AB, Class B |
15,630 | 247,590 | ||||||
| Svenska Cellulosa AB SCA, Class B |
27,690 | 367,182 | ||||||
| Svenska Handelsbanken AB, Class A |
66,260 | 523,520 | ||||||
| Swedbank AB, Class A |
39,325 | 601,736 | ||||||
| Swedish Orphan Biovitrum AB* |
7,826 | 157,215 | ||||||
| Tele2 AB, Class B (a) |
24,323 | 221,000 | ||||||
| See Notes to Financial Statements. | 71 |
DBX ETF Trust
Schedule of Investments
Xtrackers MSCI Europe Hedged Equity ETF (Continued)
May 31, 2023
| Number |
Value |
|||||||
| Sweden (Continued) | ||||||||
| Telefonaktiebolaget LM Ericsson, Class B |
133,604 | $ | 690,932 | |||||
| Telia Co. AB |
110,357 | 256,982 | ||||||
| Volvo AB, Class A |
8,975 | 173,019 | ||||||
| Volvo AB, Class B |
69,190 | 1,276,774 | ||||||
| Volvo Car AB, Class B* (a) |
26,021 | 89,392 | ||||||
|
|
|
|||||||
| (Cost $25,644,386) |
20,883,018 | |||||||
|
|
|
|||||||
| Switzerland — 16.3% | ||||||||
| ABB Ltd. |
71,873 | 2,624,755 | ||||||
| Adecco Group AG |
7,332 | 218,652 | ||||||
| Alcon, Inc. |
22,898 | 1,776,528 | ||||||
| Bachem Holding AG (a) |
1,551 | 162,806 | ||||||
| Baloise Holding AG |
2,243 | 344,547 | ||||||
| Banque Cantonale Vaudoise |
1,377 | 138,569 | ||||||
| Barry Callebaut AG |
163 | 329,490 | ||||||
| BKW AG |
965 | 173,027 | ||||||
| Chocoladefabriken Lindt & Spruengli AG |
5 | 604,996 | ||||||
| Chocoladefabriken Lindt & Spruengli AG Participation Certificates |
45 | 538,073 | ||||||
| Cie Financiere Richemont SA, Class A |
23,899 | 3,793,138 | ||||||
| Clariant AG* |
9,840 | 141,860 | ||||||
| Coca-Cola HBC AG* |
10,078 | 299,372 | ||||||
| DSM-Firmenich AG* |
7,992 | 888,778 | ||||||
| Dufry AG* |
4,535 | 205,002 | ||||||
| EMS-Chemie Holding AG |
320 | 247,708 | ||||||
| Geberit AG |
1,555 | 823,642 | ||||||
| Givaudan SA |
422 | 1,388,210 | ||||||
| Glencore PLC |
487,647 | 2,495,892 | ||||||
| Helvetia Holding AG |
1,702 | 241,634 | ||||||
| Holcim AG* |
25,462 | 1,569,516 | ||||||
| Julius Baer Group Ltd. |
9,804 | 598,951 | ||||||
| Kuehne + Nagel International AG |
2,479 | 705,253 | ||||||
| Logitech International SA |
7,532 | 482,643 | ||||||
| Lonza Group AG |
3,409 | 2,131,303 | ||||||
| Nestle SA |
125,664 | 14,887,890 | ||||||
| Novartis AG |
93,712 | 8,968,364 | ||||||
| Partners Group Holding AG |
1,036 | 933,680 | ||||||
| Roche Holding AG |
1,463 | 493,155 | ||||||
| Roche Holding AG |
32,120 | 10,164,133 | ||||||
| Schindler Holding AG |
1,075 | 215,531 | ||||||
| Schindler Holding AG Participation Certificates |
1,862 | 385,587 | ||||||
| SGS SA |
6,859 | 608,819 | ||||||
| SIG Group AG* |
14,006 | 382,003 | ||||||
| Sika AG |
6,702 | 1,827,919 | ||||||
| Sonova Holding AG |
2,379 | 609,672 | ||||||
| STMicroelectronics NV |
31,258 | 1,356,348 | ||||||
| Straumann Holding AG |
5,119 | 748,108 | ||||||
| Swatch Group AG — Bearer |
1,357 | 403,189 | ||||||
| Swatch Group AG — Registered |
2,263 | 126,972 | ||||||
| Swiss Life Holding AG |
1,409 | 813,762 | ||||||
| Swiss Prime Site AG |
3,489 | 294,405 | ||||||
| Swiss Re AG |
13,717 | 1,373,884 | ||||||
| Swisscom AG |
1,183 | 749,223 | ||||||
| Temenos AG |
2,922 | 246,208 | ||||||
| UBS Group AG |
145,063 | 2,745,963 | ||||||
| VAT Group AG, 144A |
1,273 | 524,575 | ||||||
| Number |
Value |
|||||||
| Switzerland (Continued) | ||||||||
| Zurich Insurance Group AG |
6,875 | $ | 3,215,756 | |||||
|
|
|
|||||||
| (Cost $71,942,185) |
74,999,491 | |||||||
|
|
|
|||||||
| United Kingdom — 20.9% | ||||||||
| 3i Group PLC |
44,472 | 1,081,801 | ||||||
| abrdn PLC |
81,028 | 200,078 | ||||||
| Admiral Group PLC |
9,735 | 281,554 | ||||||
| Anglo American PLC |
57,885 | 1,601,055 | ||||||
| Ashtead Group PLC |
20,248 | 1,234,188 | ||||||
| Associated British Foods PLC |
16,601 | 376,981 | ||||||
| AstraZeneca PLC |
70,873 | 10,279,748 | ||||||
| Auto Trader Group PLC, 144A |
42,084 | 329,808 | ||||||
| Aviva PLC |
126,935 | 622,445 | ||||||
| BAE Systems PLC |
139,609 | 1,611,974 | ||||||
| Barclays PLC |
711,243 | 1,338,982 | ||||||
| Barratt Developments PLC |
44,016 | 253,400 | ||||||
| Berkeley Group Holdings PLC |
4,395 | 214,641 | ||||||
| BP PLC |
808,961 | 4,561,592 | ||||||
| British American Tobacco PLC |
97,133 | 3,086,568 | ||||||
| British Land Co. PLC REIT |
40,638 | 173,392 | ||||||
| BT Group PLC (a) |
318,283 | 581,421 | ||||||
| Bunzl PLC |
15,468 | 604,950 | ||||||
| Burberry Group PLC |
17,252 | 462,262 | ||||||
| Centrica PLC |
261,158 | 382,207 | ||||||
| CNH Industrial NV |
46,774 | 597,461 | ||||||
| Coca-Cola Europacific Partners PLC |
9,379 | 585,156 | ||||||
| Compass Group PLC |
79,674 | 2,182,413 | ||||||
| Croda International PLC |
6,462 | 490,343 | ||||||
| Diageo PLC |
103,141 | 4,294,278 | ||||||
| Endeavour Mining PLC |
8,525 | 228,213 | ||||||
| Entain PLC |
25,898 | 424,927 | ||||||
| GSK PLC |
187,215 | 3,135,580 | ||||||
| Haleon PLC |
232,761 | 921,326 | ||||||
| Halma PLC |
17,417 | 521,931 | ||||||
| Hargreaves Lansdown PLC |
16,361 | 163,266 | ||||||
| HSBC Holdings PLC |
913,558 | 6,710,566 | ||||||
| Imperial Brands PLC |
40,203 | 847,679 | ||||||
| Informa PLC |
64,125 | 555,985 | ||||||
| InterContinental Hotels Group PLC |
7,969 | 522,219 | ||||||
| Intertek Group PLC |
7,332 | 378,872 | ||||||
| J Sainsbury PLC |
77,036 | 259,313 | ||||||
| JD Sports Fashion PLC |
119,429 | 225,817 | ||||||
| Johnson Matthey PLC |
8,395 | 180,663 | ||||||
| Kingfisher PLC |
88,702 | 254,887 | ||||||
| Land Securities Group PLC REIT |
32,490 | 243,304 | ||||||
| Legal & General Group PLC |
273,171 | 775,109 | ||||||
| Lloyds Banking Group PLC |
3,028,300 | 1,663,908 | ||||||
| London Stock Exchange Group PLC |
18,376 | 1,954,430 | ||||||
| M&G PLC |
104,273 | 257,086 | ||||||
| Mondi PLC |
22,235 | 344,358 | ||||||
| National Grid PLC |
168,000 | 2,311,360 | ||||||
| NatWest Group PLC |
261,898 | 845,746 | ||||||
| Next PLC |
5,652 | 446,175 | ||||||
| Ocado Group PLC* (a) |
26,891 | 123,434 | ||||||
| Pearson PLC |
29,555 | 293,458 | ||||||
| Persimmon PLC |
14,772 | 220,783 | ||||||
| Phoenix Group Holdings PLC |
35,340 | 242,842 | ||||||
| Reckitt Benckiser Group PLC |
32,754 | 2,544,892 | ||||||
| See Notes to Financial Statements. | 72 |
DBX ETF Trust
Schedule of Investments
Xtrackers MSCI Europe Hedged Equity ETF (Continued)
May 31, 2023
| Number |
Value |
|||||||
| United Kingdom (Continued) | ||||||||
| RELX PLC |
86,995 | $ | 2,716,259 | |||||
| Rentokil Initial PLC |
115,563 | 918,017 | ||||||
| Rio Tinto PLC |
51,462 | 3,061,254 | ||||||
| Rolls-Royce Holdings PLC* |
382,489 | 681,818 | ||||||
| Sage Group PLC |
46,962 | 508,824 | ||||||
| Schroders PLC |
37,585 | 213,011 | ||||||
| Segro PLC REIT |
55,584 | 551,490 | ||||||
| Severn Trent PLC |
11,616 | 400,691 | ||||||
| Shell PLC |
313,041 | 8,646,794 | ||||||
| Smith & Nephew PLC |
39,865 | 596,073 | ||||||
| Smiths Group PLC |
16,301 | 325,659 | ||||||
| Spirax-Sarco Engineering PLC |
3,386 | 460,163 | ||||||
| SSE PLC |
49,824 | 1,166,127 | ||||||
| St James’s Place PLC |
24,697 | 342,549 | ||||||
| Standard Chartered PLC |
110,100 | 867,772 | ||||||
| Taylor Wimpey PLC |
166,151 | 236,033 | ||||||
| Tesco PLC |
334,557 | 1,085,377 | ||||||
| Unilever PLC |
115,523 | 5,789,870 | ||||||
| United Utilities Group PLC |
31,136 | 392,158 | ||||||
| Vodafone Group PLC |
1,049,890 | 997,401 | ||||||
| Whitbread PLC |
9,342 | 381,866 | ||||||
| Wise PLC, Class A* |
28,186 | 203,500 | ||||||
| WPP PLC |
49,377 | 524,426 | ||||||
|
|
|
|||||||
| (Cost $113,761,322) |
96,093,959 | |||||||
|
|
|
|||||||
| TOTAL COMMON STOCKS |
443,557,407 | |||||||
|
|
|
|||||||
| PREFERRED STOCKS — 0.8% | ||||||||
| Germany — 0.8% | ||||||||
| Bayerische Motoren Werke AG |
2,714 | 278,931 | ||||||
| Dr Ing hc F Porsche AG, 144A* |
5,315 | 659,872 | ||||||
| Henkel AG & Co. KGaA |
7,754 | 617,807 | ||||||
| Porsche Automobil Holding SE* |
7,012 | 388,997 | ||||||
| Sartorius AG |
1,192 | 399,440 | ||||||
| Number |
Value |
|||||||
| Germany (Continued) | ||||||||
| Volkswagen AG |
9,439 | $ | 1,176,217 | |||||
|
|
|
|||||||
| (Cost $4,765,961) |
3,521,264 | |||||||
|
|
|
|||||||
| WARRANTS — 0.0% | ||||||||
| Switzerland — 0.0% | ||||||||
| Cie Financiere Richemont SA*, |
48,882 | 60,381 | ||||||
|
|
|
|||||||
| EXCHANGE-TRADED FUNDS — 0.2% | ||||||||
| iShares Currency Hedged MSCI Eurozone ETF (a) |
28,763 | 905,747 | ||||||
| iShares MSCI Eurozone ETF |
5,200 | 229,476 | ||||||
|
|
|
|||||||
| (Cost $1,060,635) |
1,135,223 | |||||||
|
|
|
|||||||
| SECURITIES LENDING COLLATERAL — 3.3% | ||||||||
| DWS Government & Agency Securities Portfolio “DWS Government Cash Institutional Shares”,
5.03% (c)(d) |
15,074,264 | 15,074,264 | ||||||
|
|
|
|||||||
| CASH EQUIVALENTS — 0.4% | ||||||||
| DWS ESG Liquidity Fund “Capital Shares”, 5.20% (c) |
664,942 | 664,743 | ||||||
| DWS Government Money Market Series “Institutional Shares”, 5.04% (c) |
1,116,927 | 1,116,927 | ||||||
|
|
|
|||||||
| TOTAL CASH EQUIVALENTS |
1,781,670 | |||||||
|
|
|
|||||||
| TOTAL INVESTMENTS — 101.3% |
$ | 465,130,209 | ||||||
| Other assets and liabilities, net — (1.3%) |
(6,446,561 | ) | ||||||
|
|
|
|||||||
| NET ASSETS — 100.0% |
$ | 458,683,648 | ||||||
|
|
|
|||||||
A summary of the Fund’s transactions with affiliated investments during the year ended May 31, 2023 is as follows:
| Value ($) at 5/31/2022 |
Purchases Cost ($) |
Sales Proceeds ($) |
Net Realized Gain/(Loss) ($) |
Net Change in Unrealized Appreciation (Depreciation) ($) |
Income ($) | Capital Gain Distributions ($) |
Number of Shares at 5/31/2023 |
Value ($) at 5/31/2023 |
||||||||||||||||||||||||||||
| COMMON STOCKS — 0.2% |
|
|||||||||||||||||||||||||||||||||||
| Germany — 0.2% |
|
|||||||||||||||||||||||||||||||||||
| Deutsche Bank AG (b) |
|
|||||||||||||||||||||||||||||||||||
| 1,228,546 | 340,752 | (519,716 | ) | (280,114 | ) | 128,307 | 29,744 | — | 88,635 | 897,775 | ||||||||||||||||||||||||||
| SECURITIES LENDING COLLATERAL — 3.3% |
|
|||||||||||||||||||||||||||||||||||
| DWS Government & Agency Securities Portfolio “DWS Government Cash Institutional Shares”, 5.03% (c)(d) |
| |||||||||||||||||||||||||||||||||||
| 21,303,043 | — | (6,228,779 | )(e) | — | — | 117,775 | — | 15,074,264 | 15,074,264 | |||||||||||||||||||||||||||
| CASH EQUIVALENTS — 0.4% |
|
|||||||||||||||||||||||||||||||||||
| DWS ESG Liquidity Fund “Capital Shares”, 5.20% (c) |
|
|||||||||||||||||||||||||||||||||||
| 641,141 | 23,416 | — | — | 186 | 23,485 | — | 664,942 | 664,743 | ||||||||||||||||||||||||||||
| DWS Government Money Market Series “Institutional Shares”, 5.04% (c) |
| |||||||||||||||||||||||||||||||||||
| — | 201,911,388 | (200,794,461 | ) | — | — | 243,862 | — | 1,116,927 | 1,116,927 | |||||||||||||||||||||||||||
|
|
|
|
|
|
|
|
|
|
|
|
|
|
|
|
|
|
|
|||||||||||||||||||
| 23,172,730 | 202,275,556 | (207,542,956 | ) | (280,114 | ) | 128,493 | 414,866 | — | 16,944,768 | 17,753,709 | ||||||||||||||||||||||||||
|
|
|
|
|
|
|
|
|
|
|
|
|
|
|
|
|
|
|
|||||||||||||||||||
| See Notes to Financial Statements. | 73 |
DBX ETF Trust
Schedule of Investments
Xtrackers MSCI Europe Hedged Equity ETF (Continued)
May 31, 2023
| * | Non-income producing security. |
| (a) | All or a portion of these securities were on loan. In addition, “Other assets and liabilities, net” may include pending sales that are also on loan. The value of securities loaned at May 31, 2023 amounted to $22,377,388, which is 4.9% of net assets. |
| (b) | Affiliated issuer. This security is owned in proportion with its representation in the index. |
| (c) | Affiliated fund managed by DWS Investment Management Americas, Inc. The rate shown is the annualized seven-day yield at period end. |
| (d) | Represents cash collateral held in connection with securities lending. Income earned by the Fund is net of borrower rebates. In addition, the Fund held non-cash U.S. Treasury securities collateral having a value of $11,497,216. |
| (e) | Represents the net increase (purchase cost) or decrease (sales proceeds) in the amount invested in cash collateral for the year ended May 31, 2023. |
| CVA: | Credit Valuation Adjustment |
| REIT: | Real Estate Investment Trust |
| 144A: | Security exempt from registration under Rule 144A of the Securities Act of 1933. These securities may be resold in transactions exempt from registration, normally to qualified institutional buyers. |
Securities are listed in country of domicile.
At May 31, 2023, open futures contracts purchased were as follows:
| Contract Description |
Currency | Number of Contracts |
Notional Amount |
Contract Value |
Expiration Date |
Unrealized Appreciation (Depreciation) |
||||||||||||
| AMSTERDAM Index Futures |
EUR | 6 | $ | 969,617 | $ | 961,164 | 6/16/2023 | $ | (8,453 | ) | ||||||||
| CAC40 10 EURO Futures |
EUR | 26 | 2,040,947 | 1,973,052 | 6/16/2023 | (67,895 | ) | |||||||||||
| DAX Index Futures |
EUR | 3 | 1,244,039 | 1,255,825 | 6/16/2023 | 11,786 | ||||||||||||
| EURO STOXX 50 Futures |
EUR | 29 | 1,331,672 | 1,307,191 | 6/16/2023 | (24,481 | ) | |||||||||||
| FTSE 100 Index Futures |
GBP | 34 | 3,217,189 | 3,151,773 | 6/16/2023 | (65,416 | ) | |||||||||||
| FTSE/MIB Index Futures |
EUR | 3 | 430,768 | 418,362 | 6/16/2023 | (12,406 | ) | |||||||||||
| IBEX 35 Index Futures |
EUR | 7 | 688,493 | 676,183 | 6/16/2023 | (12,310 | ) | |||||||||||
| OMXS30 Index Futures |
SEK | 37 | 768,155 | 763,489 | 6/16/2023 | (4,666 | ) | |||||||||||
| SWISS MID CAP Futures |
CHF | 38 | 1,138,603 | 1,119,034 | 6/16/2023 | (19,569 | ) | |||||||||||
|
|
|
|||||||||||||||||
| Total net unrealized depreciation |
$ | (203,410 | ) | |||||||||||||||
|
|
|
|||||||||||||||||
As of May 31, 2023, the Fund had the following forward foreign currency contracts outstanding:
| Counterparty |
Settlement Date |
Currency To Deliver |
Currency To Receive |
Unrealized Appreciation |
Unrealized Depreciation |
|||||||||||||||||
| Goldman Sachs & Co. |
6/2/2023 | CHF | 29,737,300 | USD | 33,525,705 | $ | 874,263 | $ | — | |||||||||||||
| JP Morgan & Chase Co. |
6/2/2023 | CHF | 5,737,122 | USD | 6,467,824 | 168,487 | — | |||||||||||||||
| RBC Capital Markets |
6/2/2023 | CHF | 27,923,717 | USD | 31,480,192 | 820,058 | — | |||||||||||||||
| RBC Capital Markets |
6/2/2023 | CHF | 2,022,000 | USD | 2,279,496 | 59,348 | — | |||||||||||||||
| Goldman Sachs & Co. |
6/2/2023 | DKK | 62,184,200 | USD | 9,229,566 | 303,583 | — | |||||||||||||||
| Goldman Sachs & Co. |
6/2/2023 | DKK | 3,262,000 | USD | 484,149 | 15,918 | — | |||||||||||||||
| JP Morgan & Chase Co. |
6/2/2023 | DKK | 8,480,342 | USD | 1,258,566 | 41,289 | — | |||||||||||||||
| RBC Capital Markets |
6/2/2023 | DKK | 75,531,000 | USD | 11,210,538 | 368,742 | — | |||||||||||||||
| Goldman Sachs & Co. |
6/2/2023 | EUR | 105,197,300 | USD | 116,337,694 | 3,892,215 | — | |||||||||||||||
| JP Morgan & Chase Co. |
6/2/2023 | EUR | 8,778,523 | USD | 9,708,520 | 325,149 | — | |||||||||||||||
| RBC Capital Markets |
6/2/2023 | EUR | 101,542,873 | USD | 112,301,340 | 3,762,081 | — | |||||||||||||||
| RBC Capital Markets |
6/2/2023 | EUR | 3,046,000 | USD | 3,368,504 | 112,633 | — | |||||||||||||||
| Goldman Sachs & Co. |
6/2/2023 | GBP | 1,722,000 | USD | 2,165,763 | 23,680 | — | |||||||||||||||
| Goldman Sachs & Co. |
6/2/2023 | GBP | 37,109,654 | USD | 46,673,740 | 511,166 | — | |||||||||||||||
| JP Morgan & Chase Co. |
6/2/2023 | GBP | 1,883,850 | USD | 2,369,356 | 25,940 | — | |||||||||||||||
| RBC Capital Markets |
6/2/2023 | GBP | 44,500,420 | USD | 55,969,068 | 612,748 | — | |||||||||||||||
| Goldman Sachs & Co. |
6/2/2023 | NOK | 23,255,700 | USD | 2,178,500 | 83,429 | — | |||||||||||||||
| JP Morgan & Chase Co. |
6/2/2023 | NOK | 897,191 | USD | 84,045 | 3,219 | — | |||||||||||||||
| RBC Capital Markets |
6/2/2023 | NOK | 23,651,000 | USD | 2,215,530 | 84,847 | — | |||||||||||||||
| Goldman Sachs & Co. |
6/2/2023 | SEK | 103,330,250 | USD | 10,089,465 | 567,520 | — | |||||||||||||||
| Goldman Sachs & Co. |
6/2/2023 | SEK | 7,576,000 | USD | 739,732 | 41,599 | — | |||||||||||||||
| JP Morgan & Chase Co. |
6/2/2023 | SEK | 14,746,636 | USD | 1,439,806 | 80,894 | — | |||||||||||||||
| RBC Capital Markets |
6/2/2023 | SEK | 121,498,200 | USD | 11,863,437 | 667,303 | — | |||||||||||||||
| Goldman Sachs & Co. |
6/2/2023 | USD | 32,530,001 | CHF | 29,737,300 | 121,441 | — | |||||||||||||||
| JP Morgan & Chase Co. |
6/2/2023 | USD | 6,275,909 | CHF | 5,737,122 | 23,429 | — | |||||||||||||||
| See Notes to Financial Statements. | 74 |
DBX ETF Trust
Schedule of Investments
Xtrackers MSCI Europe Hedged Equity ETF (Continued)
May 31, 2023
| Counterparty |
Settlement Date |
Currency To Deliver |
Currency To Receive |
Unrealized Appreciation |
Unrealized Depreciation |
|||||||||||||||||
| RBC Capital Markets |
6/2/2023 | USD | 31,635,418 | CHF | 28,919,517 | $ | 118,101 | $ | — | |||||||||||||
| RBC Capital Markets |
6/2/2023 | USD | 1,143,702 | CHF | 1,026,200 | — | (16,938 | ) | ||||||||||||||
| Goldman Sachs & Co. |
6/2/2023 | USD | 9,369,266 | DKK | 65,446,200 | 24,947 | — | |||||||||||||||
| JP Morgan & Chase Co. |
6/2/2023 | USD | 1,214,044 | DKK | 8,480,342 | 3,233 | — | |||||||||||||||
| RBC Capital Markets |
6/2/2023 | USD | 340,553 | DKK | 2,344,400 | — | (4,036 | ) | ||||||||||||||
| RBC Capital Markets |
6/2/2023 | USD | 10,477,381 | DKK | 73,186,600 | 27,898 | — | |||||||||||||||
| Goldman Sachs & Co. |
6/2/2023 | USD | 3,708,458 | EUR | 3,428,500 | — | (43,731 | ) | ||||||||||||||
| Goldman Sachs & Co. |
6/2/2023 | USD | 108,495,718 | EUR | 101,768,800 | 285,035 | — | |||||||||||||||
| JP Morgan & Chase Co. |
6/2/2023 | USD | 9,358,783 | EUR | 8,778,523 | 24,587 | — | |||||||||||||||
| RBC Capital Markets |
6/2/2023 | USD | 111,502,198 | EUR | 104,588,873 | 292,934 | — | |||||||||||||||
| Goldman Sachs & Co. |
6/2/2023 | USD | 48,127,952 | GBP | 38,831,654 | 176,704 | — | |||||||||||||||
| JP Morgan & Chase Co. |
6/2/2023 | USD | 2,334,844 | GBP | 1,883,850 | 8,572 | — | |||||||||||||||
| RBC Capital Markets |
6/2/2023 | USD | 1,662,045 | GBP | 1,336,700 | 744 | — | |||||||||||||||
| RBC Capital Markets |
6/2/2023 | USD | 53,497,115 | GBP | 43,163,720 | 196,417 | — | |||||||||||||||
| RBC Capital Markets |
6/2/2023 | USD | 2,055,210 | NOK | 22,901,100 | 7,915 | — | |||||||||||||||
| RBC Capital Markets |
6/2/2023 | USD | 80,516 | NOK | 897,191 | 310 | — | |||||||||||||||
| RBC Capital Markets |
6/2/2023 | USD | 68,791 | NOK | 749,900 | — | (1,233 | ) | ||||||||||||||
| RBC Capital Markets |
6/2/2023 | USD | 2,087,033 | NOK | 23,255,700 | 8,038 | — | |||||||||||||||
| Goldman Sachs & Co. |
6/2/2023 | USD | 10,190,217 | SEK | 110,906,250 | 29,861 | — | |||||||||||||||
| JP Morgan & Chase Co. |
6/2/2023 | USD | 1,354,941 | SEK | 14,746,636 | 3,970 | — | |||||||||||||||
| RBC Capital Markets |
6/2/2023 | USD | 367,093 | SEK | 3,876,900 | — | (9,834 | ) | ||||||||||||||
| RBC Capital Markets |
6/2/2023 | USD | 10,807,205 | SEK | 117,621,300 | 31,669 | — | |||||||||||||||
| Goldman Sachs & Co. |
7/5/2023 | CHF | 29,737,300 | USD | 32,654,309 | — | (132,742 | ) | ||||||||||||||
| JP Morgan & Chase Co. |
7/5/2023 | CHF | 5,737,122 | USD | 6,299,926 | — | (25,575 | ) | ||||||||||||||
| JP Morgan & Chase Co. |
7/5/2023 | CHF | 1,002,000 | USD | 1,100,282 | — | (4,480 | ) | ||||||||||||||
| RBC Capital Markets |
7/5/2023 | CHF | 28,919,517 | USD | 31,756,308 | — | (129,091 | ) | ||||||||||||||
| Goldman Sachs & Co. |
7/5/2023 | DKK | 65,446,200 | USD | 9,390,103 | — | (27,089 | ) | ||||||||||||||
| JP Morgan & Chase Co. |
7/5/2023 | DKK | 8,480,342 | USD | 1,216,692 | — | (3,563 | ) | ||||||||||||||
| JP Morgan & Chase Co. |
7/5/2023 | DKK | 4,460,000 | USD | 639,876 | — | (1,883 | ) | ||||||||||||||
| RBC Capital Markets |
7/5/2023 | DKK | 73,186,600 | USD | 10,500,682 | — | (30,293 | ) | ||||||||||||||
| Goldman Sachs & Co. |
7/5/2023 | EUR | 101,768,800 | USD | 108,706,888 | — | (299,493 | ) | ||||||||||||||
| JP Morgan & Chase Co. |
7/5/2023 | EUR | 1,240,000 | USD | 1,324,499 | — | (3,688 | ) | ||||||||||||||
| JP Morgan & Chase Co. |
7/5/2023 | EUR | 8,778,523 | USD | 9,376,911 | — | (25,922 | ) | ||||||||||||||
| RBC Capital Markets |
7/5/2023 | EUR | 104,588,873 | USD | 111,718,906 | — | (308,106 | ) | ||||||||||||||
| Goldman Sachs & Co. |
7/5/2023 | GBP | 38,831,654 | USD | 48,162,900 | — | (177,993 | ) | ||||||||||||||
| JP Morgan & Chase Co. |
7/5/2023 | GBP | 1,883,850 | USD | 2,336,530 | — | (8,644 | ) | ||||||||||||||
| RBC Capital Markets |
7/5/2023 | GBP | 43,163,720 | USD | 53,535,962 | — | (197,850 | ) | ||||||||||||||
| Goldman Sachs & Co. |
7/5/2023 | NOK | 1,165,000 | USD | 104,716 | — | (419 | ) | ||||||||||||||
| RBC Capital Markets |
7/5/2023 | NOK | 23,255,700 | USD | 2,090,419 | — | (8,282 | ) | ||||||||||||||
| RBC Capital Markets |
7/5/2023 | NOK | 22,901,100 | USD | 2,058,544 | — | (8,155 | ) | ||||||||||||||
| RBC Capital Markets |
7/5/2023 | NOK | 897,191 | USD | 80,647 | — | (320 | ) | ||||||||||||||
| Goldman Sachs & Co. |
7/5/2023 | SEK | 110,906,250 | USD | 10,208,645 | — | (31,486 | ) | ||||||||||||||
| JP Morgan & Chase Co. |
7/5/2023 | SEK | 14,746,636 | USD | 1,357,391 | — | (4,186 | ) | ||||||||||||||
| JP Morgan & Chase Co. |
7/5/2023 | SEK | 2,437,000 | USD | 224,314 | — | (697 | ) | ||||||||||||||
| RBC Capital Markets |
7/5/2023 | SEK | 117,621,300 | USD | 10,826,749 | — | (33,392 | ) | ||||||||||||||
| RBC Capital Markets |
7/5/2023 | USD | 1,124,984 | GBP | 907,000 | 4,126 | — | |||||||||||||||
|
|
|
|
|
|||||||||||||||||||
| Total unrealized appreciation (depreciation) |
$ | 14,836,042 | $ | (1,539,121 | ) | |||||||||||||||||
|
|
|
|
|
|||||||||||||||||||
For information on the Fund’s policy and additional disclosures regarding futures contracts and forward foreign currency contracts, please refer to the Derivatives section of Note 2 in the accompanying Notes to Financial Statements.
Currency Abbreviations
| CHF | Swiss Franc |
| DKK | Danish Krone |
| EUR | Euro |
| GBP | Pound Sterling |
| NOK | Norwegian Krone |
| SEK | Swedish Krona |
| USD | U.S. Dollar |
| See Notes to Financial Statements. | 75 |
DBX ETF Trust
Schedule of Investments
Xtrackers MSCI Europe Hedged Equity ETF (Continued)
May 31, 2023
Fair Value Measurements
Various inputs are used in determining the value of the Fund’s investments. These inputs are summarized in three broad levels. Level 1 includes quoted prices in active markets for identical securities. Level 2 includes other significant observable inputs (including quoted prices for similar securities, interest rates, prepayment speeds and credit risk). Level 3 includes significant unobservable inputs (including the Fund’s own assumptions in determining the fair value of investments). The level assigned to the securities valuations may not be an indication of the risk or liquidity associated with investing in those securities.
The following is a summary of the inputs used as of May 31, 2023 in valuing the Fund’s investments. For information on the Fund’s policy regarding the valuation of investments, please refer to the Security Valuation section of Note 2 in the accompanying Notes to Financial Statements.
| Assets |
Level 1 | Level 2 | Level 3 | Total | ||||||||||||
| Common Stocks (a) |
$ | 443,557,407 | $ | — | $ | — | $ | 443,557,407 | ||||||||
| Preferred Stocks |
3,521,264 | — | — | 3,521,264 | ||||||||||||
| Warrants |
60,381 | — | — | 60,381 | ||||||||||||
| Exchange-Traded Funds |
1,135,223 | — | — | 1,135,223 | ||||||||||||
| Short-Term Investments (a) |
16,855,934 | — | — | 16,855,934 | ||||||||||||
| Derivatives (b) |
||||||||||||||||
| Forward Foreign Currency Contracts |
— | 14,836,042 | — | 14,836,042 | ||||||||||||
| Futures Contracts |
11,786 | — | — | 11,786 | ||||||||||||
|
|
|
|
|
|
|
|
|
|||||||||
| TOTAL |
$ | 465,141,995 | $ | 14,836,042 | $ | — | $ | 479,978,037 | ||||||||
|
|
|
|
|
|
|
|
|
|||||||||
| Liabilities |
Level 1 | Level 2 | Level 3 | Total | ||||||||||||
| Derivatives (b) |
||||||||||||||||
| Forward Foreign Currency Contracts |
$ | — | $ | (1,539,121 | ) | $ | — | $ | (1,539,121 | ) | ||||||
| Futures Contracts |
(215,196 | ) | — | — | (215,196 | ) | ||||||||||
|
|
|
|
|
|
|
|
|
|||||||||
| TOTAL |
$ | (215,196 | ) | $ | (1,539,121 | ) | $ | — | $ | (1,754,317 | ) | |||||
|
|
|
|
|
|
|
|
|
|||||||||
| (a) | See Schedule of Investments for additional detailed categorizations. |
| (b) | Derivatives include unrealized appreciation (depreciation) on open futures contracts and forward foreign currency contracts. |
| See Notes to Financial Statements. | 76 |
DBX ETF Trust
Schedule of Investments
Xtrackers MSCI Eurozone Hedged Equity ETF
May 31, 2023
| Number |
Value |
|||||||
| COMMON STOCKS — 98.0% | ||||||||
| Austria — 0.9% | ||||||||
| Agrana Beteiligungs AG |
81 | $ | 1,511 | |||||
| ANDRITZ AG |
365 | 19,566 | ||||||
| AT&S Austria Technologie & Systemtechnik AG |
109 | 3,328 | ||||||
| BAWAG Group AG, 144A* |
418 | 18,167 | ||||||
| CA Immobilien Anlagen AG |
197 | 5,380 | ||||||
| DO & CO AG* |
41 | 5,040 | ||||||
| Erste Group Bank AG |
1,725 | 55,813 | ||||||
| EVN AG |
165 | 3,677 | ||||||
| IMMOFINANZ AG* |
165 | 2,730 | ||||||
| Kontron AG |
184 | 3,764 | ||||||
| Lenzing AG* |
67 | 3,882 | ||||||
| Oesterreichische Post AG (a) |
179 | 6,266 | ||||||
| OMV AG |
713 | 31,765 | ||||||
| Palfinger AG |
67 | 2,020 | ||||||
| Porr AG |
39 | 560 | ||||||
| Raiffeisen Bank International AG* |
672 | 9,841 | ||||||
| Schoeller-Bleckmann Oilfield Equipment AG |
67 | 3,681 | ||||||
| Semperit AG Holding |
44 | 990 | ||||||
| UNIQA Insurance Group AG |
728 | 6,249 | ||||||
| Verbund AG |
356 | 26,846 | ||||||
| Vienna Insurance Group AG Wiener Versicherung Gruppe |
165 | 4,286 | ||||||
| voestalpine AG |
619 | 19,175 | ||||||
| Wienerberger AG |
534 | 15,092 | ||||||
|
|
|
|||||||
| (Cost $272,089) |
249,629 | |||||||
|
|
|
|||||||
| Belgium — 2.8% | ||||||||
| Ackermans & van Haaren NV |
124 | 20,319 | ||||||
| Aedifica SA REIT |
200 | 13,415 | ||||||
| Ageas SA/NV (a) |
818 | 32,640 | ||||||
| AGFA-Gevaert NV* |
754 | 1,979 | ||||||
| Anheuser-Busch InBev SA/NV |
4,341 | 231,587 | ||||||
| Barco NV |
300 | 7,773 | ||||||
| Bekaert SA |
151 | 6,459 | ||||||
| bpost SA |
408 | 1,708 | ||||||
| Cofinimmo SA REIT |
152 | 11,796 | ||||||
| Deme Group NV* |
39 | 4,969 | ||||||
| D’ieteren Group |
115 | 19,877 | ||||||
| Elia Group SA/NV |
153 | 18,497 | ||||||
| Etablissements Franz Colruyt NV |
338 | 11,200 | ||||||
| Euronav NV |
641 | 10,154 | ||||||
| Exmar NV |
259 | 2,962 | ||||||
| Fagron |
324 | 5,822 | ||||||
| Galapagos NV* (a) |
250 | 10,336 | ||||||
| Groupe Bruxelles Lambert NV |
489 | 37,676 | ||||||
| Immobel SA (a) |
17 | 719 | ||||||
| Intervest Offices & Warehouses NV REIT (a) |
95 | 1,574 | ||||||
| Ion Beam Applications |
95 | 1,523 | ||||||
| KBC Ancora |
165 | 7,870 | ||||||
| KBC Group NV |
1,248 | 81,613 | ||||||
| Kinepolis Group NV |
67 | 2,979 | ||||||
| Melexis NV |
114 | 10,400 | ||||||
| Montea NV REIT |
82 | 6,653 | ||||||
| Number |
Value |
|||||||
| Belgium (Continued) | ||||||||
| Ontex Group NV* |
324 | $ | 2,466 | |||||
| Proximus SADP |
812 | 6,303 | ||||||
| Recticel SA |
198 | 2,616 | ||||||
| Retail Estates NV REIT |
53 | 3,631 | ||||||
| Sofina SA |
72 | 14,853 | ||||||
| Solvay SA (a) |
361 | 37,684 | ||||||
| Telenet Group Holding NV |
198 | 4,218 | ||||||
| Tessenderlo Group SA |
163 | 4,957 | ||||||
| UCB SA |
644 | 56,116 | ||||||
| Umicore SA (a) |
1,005 | 27,930 | ||||||
| VGP NV (a) |
58 | 5,732 | ||||||
| Warehouses De Pauw CVA REIT |
794 | 22,270 | ||||||
| X-Fab Silicon Foundries SE, 144A* |
212 | 1,797 | ||||||
| Xior Student Housing NV REIT |
151 | 4,511 | ||||||
|
|
|
|||||||
| (Cost $949,913) |
757,584 | |||||||
|
|
|
|||||||
| Finland — 3.1% | ||||||||
| Aktia Bank OYJ |
294 | 2,875 | ||||||
| Anora Group OYJ |
165 | 855 | ||||||
| Cargotec OYJ, Class B |
193 | 10,282 | ||||||
| Caverion OYJ |
417 | 3,744 | ||||||
| Citycon OYJ* (a) |
592 | 3,809 | ||||||
| Elisa OYJ |
728 | 40,776 | ||||||
| Finnair OYJ* |
2,291 | 1,396 | ||||||
| Fortum OYJ |
2,183 | 29,004 | ||||||
| F-Secure OYJ |
352 | 1,008 | ||||||
| Huhtamaki OYJ |
463 | 15,134 | ||||||
| Incap OYJ* |
79 | 849 | ||||||
| Kemira OYJ |
608 | 9,631 | ||||||
| Kempower OYJ* |
63 | 2,225 | ||||||
| Kesko OYJ, Class B |
1,303 | 24,631 | ||||||
| Kojamo OYJ |
643 | 6,447 | ||||||
| Kone OYJ, Class B |
1,714 | 86,970 | ||||||
| Konecranes OYJ |
353 | 13,172 | ||||||
| Marimekko OYJ |
128 | 1,172 | ||||||
| Metsa Board OYJ, Class B |
850 | 6,837 | ||||||
| Metso Corp. |
3,319 | 36,311 | ||||||
| Musti Group OYJ* |
112 | 2,285 | ||||||
| Neste OYJ |
2,129 | 80,491 | ||||||
| Nokia OYJ |
26,818 | 108,787 | ||||||
| Nokian Renkaat OYJ |
584 | 5,060 | ||||||
| Oriola OYJ, Class B |
464 | 676 | ||||||
| Orion OYJ, Class B |
529 | 22,386 | ||||||
| Outokumpu OYJ |
1,652 | 9,013 | ||||||
| Puuilo OYJ |
182 | 1,384 | ||||||
| QT Group OYJ* |
92 | 8,237 | ||||||
| Revenio Group OYJ |
109 | 3,568 | ||||||
| Rovio Entertainment OYJ, 144A |
212 | 2,085 | ||||||
| Sampo OYJ, Class A |
2,277 | 104,706 | ||||||
| Stora Enso OYJ, Class R |
2,939 | 37,211 | ||||||
| Talenom OYJ |
296 | 2,386 | ||||||
| TietoEVRY OYJ |
520 | 14,274 | ||||||
| Tokmanni Group Corp. |
240 | 3,076 | ||||||
| UPM-Kymmene OYJ |
2,677 | 80,321 | ||||||
| Uponor OYJ |
251 | 7,378 | ||||||
| Valmet OYJ (a) |
773 | 22,747 | ||||||
| Wartsila OYJ Abp |
2,489 | 28,175 | ||||||
| See Notes to Financial Statements. | 77 |
DBX ETF Trust
Schedule of Investments
Xtrackers MSCI Eurozone Hedged Equity ETF (Continued)
May 31, 2023
| Number |
Value |
|||||||
| Finland (Continued) | ||||||||
| YIT OYJ |
570 | $ | 1,225 | |||||
|
|
|
|||||||
| (Cost $934,159) |
842,599 | |||||||
|
|
|
|||||||
| France — 33.7% | ||||||||
| AB Science SA* |
109 | 483 | ||||||
| ABC arbitrage |
95 | 627 | ||||||
| Abivax SA* |
144 | 2,795 | ||||||
| Accor SA |
934 | 30,919 | ||||||
| Aeroports de Paris* |
139 | 21,113 | ||||||
| Air France-KLM* (a) |
5,436 | 9,657 | ||||||
| Air Liquide SA |
2,618 | 438,339 | ||||||
| Airbus SE |
2,967 | 388,627 | ||||||
| AKWEL |
39 | 586 | ||||||
| ALD SA, 144A |
672 | 7,233 | ||||||
| Alstom SA |
1,653 | 45,480 | ||||||
| Altarea SCA REIT* |
29 | 3,658 | ||||||
| Alten SA |
138 | 22,067 | ||||||
| Amundi SA, 144A (a) |
296 | 16,642 | ||||||
| Antin Infrastructure Partners SA |
168 | 2,642 | ||||||
| Arkema SA |
281 | 24,479 | ||||||
| Atos SE* (a) |
654 | 9,518 | ||||||
| Aubay |
17 | 838 | ||||||
| AXA SA |
9,175 | 259,056 | ||||||
| Believe SA* |
95 | 1,139 | ||||||
| Beneteau SA |
123 | 2,067 | ||||||
| BioMerieux |
210 | 21,019 | ||||||
| BNP Paribas SA (a) |
5,558 | 320,871 | ||||||
| Boiron SA |
17 | 689 | ||||||
| Bollore SE |
4,407 | 28,217 | ||||||
| Bonduelle SCA |
53 | 653 | ||||||
| Bouygues SA |
1,102 | 35,291 | ||||||
| Bureau Veritas SA |
1,424 | 36,120 | ||||||
| Capgemini SE |
823 | 143,216 | ||||||
| Carmila SA REIT* |
250 | 3,725 | ||||||
| Carrefour SA |
2,986 | 54,850 | ||||||
| Casino Guichard Perrachon SA* (a) |
165 | 982 | ||||||
| CGG SA* |
3,134 | 2,185 | ||||||
| Chargeurs SA |
84 | 1,110 | ||||||
| Cie de Saint-Gobain (a) |
2,453 | 135,820 | ||||||
| Cie des Alpes |
172 | 2,636 | ||||||
| Cie Generale des Etablissements Michelin SCA |
3,418 | 97,037 | ||||||
| Cie Plastic Omnium SA |
240 | 3,881 | ||||||
| Coface SA |
560 | 7,752 | ||||||
| Covivio SA REIT |
235 | 11,490 | ||||||
| Credit Agricole SA (a) |
6,058 | 69,235 | ||||||
| Danone SA |
3,212 | 189,999 | ||||||
| Dassault Aviation SA |
123 | 20,799 | ||||||
| Dassault Systemes SE |
3,330 | 146,329 | ||||||
| Derichebourg SA |
489 | 2,558 | ||||||
| Edenred |
1,256 | 80,660 | ||||||
| Eiffage SA |
378 | 40,251 | ||||||
| Elior Group SA, 144A* |
436 | 1,324 | ||||||
| Elis SA (a) |
940 | 16,257 | ||||||
| Engie SA |
9,145 | 137,262 | ||||||
| Equasens |
30 | 2,479 | ||||||
| Eramet SA |
42 | 3,641 | ||||||
| Esker SA |
35 | 5,376 | ||||||
| Number |
Value |
|||||||
| France (Continued) | ||||||||
| EssilorLuxottica SA (a) |
1,457 | $ | 262,327 | |||||
| Etablissements Maurel et Prom SA |
474 | 1,863 | ||||||
| Eurazeo SE |
210 | 14,344 | ||||||
| Euroapi SA* (a) |
235 | 2,461 | ||||||
| Eutelsat Communications SA (a) |
826 | 5,249 | ||||||
| Faurecia SE* |
752 | 15,538 | ||||||
| Fnac Darty SA |
67 | 2,398 | ||||||
| Gaztransport Et Technigaz SA |
151 | 15,099 | ||||||
| Gecina SA REIT |
241 | 24,666 | ||||||
| Getlink SE |
1,933 | 32,811 | ||||||
| Hermes International |
159 | 323,221 | ||||||
| ICADE REIT |
179 | 7,125 | ||||||
| ID Logistics Group* |
13 | 3,474 | ||||||
| Imerys SA (a) |
151 | 5,368 | ||||||
| Interparfums SA |
95 | 6,793 | ||||||
| Ipsen SA* |
183 | 21,145 | ||||||
| IPSOS |
194 | 9,493 | ||||||
| JCDecaux SE* |
377 | 7,648 | ||||||
| Kaufman & Broad SA |
55 | 1,517 | ||||||
| Kering SA |
373 | 198,692 | ||||||
| Klepierre SA REIT |
1,035 | 23,432 | ||||||
| Korian SA (a) |
350 | 2,782 | ||||||
| La Francaise des Jeux SAEM, 144A |
506 | 19,504 | ||||||
| Legrand SA* |
1,333 | 126,042 | ||||||
| LISI (a) |
70 | 1,867 | ||||||
| L’Oreal SA |
1,205 | 513,922 | ||||||
| LVMH Moet Hennessy Louis Vuitton SE |
1,381 | 1,201,440 | ||||||
| Maisons du Monde SA, 144A |
179 | 1,787 | ||||||
| Manitou BF SA |
39 | 890 | ||||||
| McPhy Energy SA* (a) |
84 | 844 | ||||||
| Mercialys SA REIT |
309 | 2,479 | ||||||
| Mersen SA |
93 | 3,534 | ||||||
| Metropole Television SA |
109 | 1,505 | ||||||
| Neoen SA, 144A |
387 | 11,599 | ||||||
| Nexans SA |
147 | 11,313 | ||||||
| Nexity SA (a) |
179 | 3,670 | ||||||
| Orange SA |
9,493 | 113,363 | ||||||
| Ovh Groupe Sas* |
256 | 2,769 | ||||||
| Pernod Ricard SA |
1,032 | 222,938 | ||||||
| PEUGEOT INVEST |
17 | 1,790 | ||||||
| Pierre & Vacances SA* |
1,352 | 2,428 | ||||||
| Publicis Groupe SA |
1,148 | 85,062 | ||||||
| Quadient SA |
151 | 2,770 | ||||||
| Remy Cointreau SA |
112 | 17,209 | ||||||
| Renault SA |
952 | 31,835 | ||||||
| Rexel SA* |
1,201 | 24,545 | ||||||
| Rubis SCA |
471 | 12,838 | ||||||
| Safran SA |
1,712 | 247,850 | ||||||
| Sanofi (a) |
5,676 | 575,645 | ||||||
| Sartorius Stedim Biotech |
141 | 37,016 | ||||||
| Schneider Electric SE |
2,715 | 468,219 | ||||||
| SCOR SE (a) |
766 | 19,577 | ||||||
| SEB SA |
114 | 10,699 | ||||||
| Seche Environnement SA |
24 | 2,558 | ||||||
| SES-imagotag SA* |
31 | 5,222 | ||||||
| SMCP SA, 144A* |
165 | 1,291 | ||||||
| Societe BIC SA |
109 | 6,501 | ||||||
| See Notes to Financial Statements. | 78 |
DBX ETF Trust
Schedule of Investments
Xtrackers MSCI Eurozone Hedged Equity ETF (Continued)
May 31, 2023
| Number |
Value |
|||||||
| France (Continued) | ||||||||
| Societe Generale SA (a) |
3,686 | $ | 85,222 | |||||
| Sodexo SA |
448 | 48,390 | ||||||
| SOITEC* |
142 | 19,876 | ||||||
| Sopra Steria Group SACA |
85 | 15,954 | ||||||
| SPIE SA (a) |
737 | 21,853 | ||||||
| Technip Energies NV |
668 | 13,242 | ||||||
| Teleperformance |
302 | 45,161 | ||||||
| Television Francaise 1 (a) |
170 | 1,179 | ||||||
| Thales SA |
533 | 74,235 | ||||||
| TotalEnergies SE (a) |
11,842 | 671,883 | ||||||
| Trigano SA |
38 | 5,146 | ||||||
| Ubisoft Entertainment SA* |
491 | 13,924 | ||||||
| Unibail-Rodamco-Westfield REIT* (a) |
569 | 26,031 | ||||||
| Valeo |
982 | 18,852 | ||||||
| Vallourec SA* |
645 | 6,744 | ||||||
| Valneva SE* |
489 | 2,722 | ||||||
| Veolia Environnement SA |
3,416 | 100,559 | ||||||
| Verallia SA, 144A |
401 | 13,922 | ||||||
| Vicat SA |
86 | 2,298 | ||||||
| Vilmorin & Cie SA |
39 | 2,610 | ||||||
| Vinci SA |
2,657 | 301,956 | ||||||
| Virbac SA |
24 | 7,311 | ||||||
| Vivendi SE |
3,484 | 30,872 | ||||||
| Voltalia SA* |
137 | 2,202 | ||||||
| Wavestone |
57 | 2,720 | ||||||
| Wendel SE |
141 | 14,815 | ||||||
| Worldline SA, 144A* |
1,216 | 47,247 | ||||||
|
|
|
|||||||
| (Cost $8,772,476) |
9,288,572 | |||||||
|
|
|
|||||||
| Germany — 23.6% | ||||||||
| 1&1 AG |
182 | 1,945 | ||||||
| About You Holding SE* |
165 | 796 | ||||||
| Adesso SE |
13 | 1,579 | ||||||
| adidas AG |
813 | 131,656 | ||||||
| ADVA Optical Networking SE* |
140 | 2,918 | ||||||
| AIXTRON SE |
534 | 16,559 | ||||||
| Allianz SE |
2,017 | 431,151 | ||||||
| Amadeus Fire AG |
38 | 4,882 | ||||||
| Atoss Software AG |
16 | 3,497 | ||||||
| AURELIUS Equity Opportunities SE & Co. KGaA |
139 | 2,560 | ||||||
| Aurubis AG |
156 | 11,926 | ||||||
| Auto1 Group SE, 144A* |
418 | 3,585 | ||||||
| BASF SE |
4,479 | 212,642 | ||||||
| Basler AG |
39 | 911 | ||||||
| Bayer AG |
4,916 | 273,981 | ||||||
| Bayerische Motoren Werke AG |
1,656 | 180,409 | ||||||
| BayWa AG* |
56 | 2,257 | ||||||
| Bechtle AG |
406 | 15,918 | ||||||
| Beiersdorf AG |
503 | 64,062 | ||||||
| Bertrandt AG |
17 | 872 | ||||||
| Bilfinger SE |
127 | 4,491 | ||||||
| Borussia Dortmund GmbH & Co. KGaA* |
337 | 1,488 | ||||||
| Brenntag SE |
776 | 60,866 | ||||||
| CANCOM SE |
168 | 5,179 | ||||||
| Carl Zeiss Meditec AG |
196 | 21,967 | ||||||
| CECONOMY AG* |
756 | 1,749 | ||||||
| Cewe Stiftung & Co. KGaA |
17 | 1,630 | ||||||
| Number |
Value |
|||||||
| Germany (Continued) | ||||||||
| Commerzbank AG* |
5,439 | $ | 54,649 | |||||
| CompuGroup Medical SE & Co. KGaA |
162 | 8,606 | ||||||
| Continental AG |
567 | 37,746 | ||||||
| Covestro AG, 144A* |
994 | 38,313 | ||||||
| CropEnergies AG |
198 | 2,002 | ||||||
| CTS Eventim AG & Co. KGaA |
332 | 22,322 | ||||||
| CureVac NV* |
572 | 5,454 | ||||||
| Daimler Truck Holding AG* |
2,484 | 75,141 | ||||||
| Datagroup SE |
17 | 1,010 | ||||||
| Delivery Hero SE, 144A* |
871 | 32,585 | ||||||
| Dermapharm Holding SE |
81 | 4,059 | ||||||
| Deutsche Bank AG (b) |
9,929 | 100,569 | ||||||
| Deutsche Beteiligungs AG |
67 | 2,030 | ||||||
| Deutsche Boerse AG |
952 | 164,341 | ||||||
| Deutsche EuroShop AG |
133 | 2,872 | ||||||
| Deutsche Lufthansa AG* |
2,962 | 29,001 | ||||||
| Deutsche Pfandbriefbank AG, 144A |
598 | 4,494 | ||||||
| Deutsche Post AG |
5,028 | 225,995 | ||||||
| Deutsche Telekom AG |
16,201 | 359,247 | ||||||
| Deutz AG |
786 | 4,663 | ||||||
| DIC Asset AG (a) |
211 | 1,198 | ||||||
| Draegerwerk AG & Co. KGaA |
3 | 124 | ||||||
| Duerr AG |
245 | 7,160 | ||||||
| E.ON SE |
11,200 | 135,400 | ||||||
| Eckert & Ziegler Strahlen- und Medizintechnik AG |
67 | 2,842 | ||||||
| Einhell Germany AG |
3 | 468 | ||||||
| Elmos Semiconductor SE |
40 | 2,805 | ||||||
| ElringKlinger AG |
123 | 1,120 | ||||||
| Encavis AG* |
614 | 9,930 | ||||||
| Energiekontor AG |
28 | 2,059 | ||||||
| Evonik Industries AG* |
1,052 | 21,078 | ||||||
| Evotec SE* |
710 | 15,323 | ||||||
| Fielmann AG |
106 | 5,303 | ||||||
| flatexDEGIRO AG* |
310 | 2,919 | ||||||
| Formycon AG* |
46 | 3,702 | ||||||
| Fraport AG Frankfurt Airport Services Worldwide* |
179 | 9,100 | ||||||
| Freenet AG |
562 | 13,781 | ||||||
| Fresenius Medical Care AG & Co. KGaA |
1,041 | 44,453 | ||||||
| Fresenius SE & Co. KGaA |
2,149 | 58,782 | ||||||
| GEA Group AG |
779 | 32,716 | ||||||
| Gerresheimer AG |
166 | 18,241 | ||||||
| GFT Technologies SE |
81 | 2,539 | ||||||
| GRENKE AG |
124 | 3,678 | ||||||
| Hamborner REIT AG REIT |
362 | 2,569 | ||||||
| Hamburger Hafen und Logistik AG |
109 | 1,414 | ||||||
| Hannover Rueck SE |
302 | 64,626 | ||||||
| Heidelberg Materials AG |
726 | 51,900 | ||||||
| Heidelberger Druckmaschinen AG* |
1,149 | 2,034 | ||||||
| HelloFresh SE* |
785 | 18,653 | ||||||
| Henkel AG & Co. KGaA |
520 | 37,307 | ||||||
| Hensoldt AG |
257 | 8,186 | ||||||
| HOCHTIEF AG |
109 | 9,064 | ||||||
| Hornbach Holding AG & Co. KGaA |
41 | 2,901 | ||||||
| HUGO BOSS AG |
298 | 20,252 | ||||||
| Hypoport SE* |
15 | 2,378 | ||||||
| See Notes to Financial Statements. | 79 |
DBX ETF Trust
Schedule of Investments
Xtrackers MSCI Eurozone Hedged Equity ETF (Continued)
May 31, 2023
| Number |
Value |
|||||||
| Germany (Continued) | ||||||||
| Indus Holding AG |
74 | $ | 1,950 | |||||
| Infineon Technologies AG |
6,548 | 243,081 | ||||||
| Instone Real Estate Group SE, 144A |
195 | 1,051 | ||||||
| Ionos Se* |
139 | 1,914 | ||||||
| Jenoptik AG |
293 | 9,759 | ||||||
| JOST Werke AG, 144A |
55 | 2,898 | ||||||
| K+S AG |
922 | 14,832 | ||||||
| KION Group AG |
361 | 12,579 | ||||||
| Kloeckner & Co. SE |
296 | 2,810 | ||||||
| Knaus Tabbert AG |
45 | 2,309 | ||||||
| Knorr-Bremse AG |
379 | 25,919 | ||||||
| Krones AG |
67 | 7,484 | ||||||
| LANXESS AG |
418 | 14,999 | ||||||
| LEG Immobilien SE* |
351 | 18,200 | ||||||
| MBB SE |
3 | 251 | ||||||
| Medios AG* |
114 | 2,128 | ||||||
| Mercedes-Benz Group AG |
4,293 | 320,160 | ||||||
| Merck KGaA |
646 | 112,380 | ||||||
| METRO AG* |
599 | 4,652 | ||||||
| MorphoSys AG* (a) |
137 | 3,485 | ||||||
| MTU Aero Engines AG |
270 | 62,281 | ||||||
| Muenchener Rueckversicherungs-Gesellschaft AG in Muenchen |
701 | 250,266 | ||||||
| Nagarro SE* |
39 | 3,227 | ||||||
| Nemetschek SE |
280 | 21,920 | ||||||
| Nordex SE* (a) |
628 | 7,575 | ||||||
| Norma Group SE |
111 | 2,002 | ||||||
| Northern Data AG* |
113 | 2,259 | ||||||
| OHB SE |
17 | 562 | ||||||
| PATRIZIA SE |
184 | 1,626 | ||||||
| Pfeiffer Vacuum Technology AG |
17 | 2,740 | ||||||
| PNE AG |
154 | 2,334 | ||||||
| ProSiebenSat.1 Media SE* |
783 | 6,334 | ||||||
| Puma SE |
502 | 23,889 | ||||||
| PVA TePla AG* |
85 | 1,708 | ||||||
| Rational AG |
27 | 18,110 | ||||||
| Rheinmetall AG |
221 | 55,844 | ||||||
| RWE AG |
3,175 | 132,764 | ||||||
| SAF-Holland SA |
242 | 3,099 | ||||||
| Salzgitter AG |
142 | 4,611 | ||||||
| SAP SE |
5,223 | 682,115 | ||||||
| Scout24 SE, 144A |
389 | 24,948 | ||||||
| Secunet Security Networks AG* |
13 | 2,757 | ||||||
| SGL Carbon SE* (a) |
426 | 3,855 | ||||||
| Siemens AG |
3,803 | 623,332 | ||||||
| Siemens Energy AG* |
2,606 | 66,129 | ||||||
| Siemens Healthineers AG, 144A |
1,419 | 80,237 | ||||||
| Siltronic AG |
82 | 7,038 | ||||||
| Sixt SE |
67 | 7,341 | ||||||
| SMA Solar Technology AG* |
77 | 8,272 | ||||||
| Software AG |
281 | 9,924 | ||||||
| Stabilus SE |
114 | 6,799 | ||||||
| Steico SE |
30 | 1,449 | ||||||
| STRATEC SE |
30 | 1,825 | ||||||
| Stroeer SE & Co. KGaA |
181 | 8,776 | ||||||
| Suedzucker AG |
292 | 5,019 | ||||||
| Suess Microtec Se |
103 | 2,725 | ||||||
| Number |
Value |
|||||||
| Germany (Continued) | ||||||||
| SUSE SA* |
253 | $ | 3,816 | |||||
| Symrise AG |
667 | 71,281 | ||||||
| Synlab AG |
379 | 3,650 | ||||||
| TAG Immobilien AG* |
696 | 5,572 | ||||||
| Takkt AG |
137 | 2,035 | ||||||
| Talanx AG |
311 | 17,336 | ||||||
| TeamViewer AG, 144A* |
727 | 11,373 | ||||||
| Telefonica Deutschland Holding AG |
5,189 | 14,615 | ||||||
| thyssenkrupp AG |
2,599 | 17,857 | ||||||
| United Internet AG |
478 | 6,867 | ||||||
| Varta AG (a) |
113 | 1,771 | ||||||
| VERBIO Vereinigte BioEnergie AG |
109 | 3,882 | ||||||
| Vitesco Technologies Group AG* |
95 | 6,169 | ||||||
| Volkswagen AG |
141 | 21,160 | ||||||
| Vonovia SE |
3,591 | 65,867 | ||||||
| Vossloh AG |
44 | 1,862 | ||||||
| Wacker Chemie AG |
93 | 12,346 | ||||||
| Wacker Neuson SE |
123 | 2,695 | ||||||
| Wuestenrot & Wuerttembergische AG |
81 | 1,370 | ||||||
| Zalando SE, 144A* |
1,076 | 31,100 | ||||||
|
|
|
|||||||
| (Cost $6,873,161) |
6,503,737 | |||||||
|
|
|
|||||||
| Ireland — 2.5% | ||||||||
| AerCap Holdings NV* |
815 | 46,520 | ||||||
| AIB Group PLC |
6,688 | 27,394 | ||||||
| Bank of Ireland Group PLC |
5,461 | 51,333 | ||||||
| Cairn Homes PLC |
3,760 | 4,196 | ||||||
| CRH PLC |
3,696 | 174,224 | ||||||
| Dalata Hotel Group PLC* |
865 | 3,943 | ||||||
| Flutter Entertainment PLC* |
884 | 172,588 | ||||||
| Glanbia PLC |
1,092 | 15,793 | ||||||
| Glenveagh Properties PLC, 144A* |
3,063 | 3,405 | ||||||
| Irish Residential Properties REIT PLC REIT |
2,295 | 2,433 | ||||||
| Kerry Group PLC, Class A |
797 | 77,678 | ||||||
| Kingspan Group PLC |
753 | 49,967 | ||||||
| Origin Enterprises PLC |
520 | 1,945 | ||||||
| Smurfit Kappa Group PLC |
1,254 | 44,542 | ||||||
| Uniphar PLC |
1,769 | 6,240 | ||||||
|
|
|
|||||||
| (Cost $643,848) |
682,201 | |||||||
|
|
|
|||||||
| Italy — 7.0% | ||||||||
| A2A SpA |
6,979 | 11,548 | ||||||
| ACEA SpA |
221 | 3,189 | ||||||
| AMCO — Asset Management Co SpA, Class B* (c) |
13 | 0 | ||||||
| Amplifon SpA (a) |
612 | 21,116 | ||||||
| Anima Holding SpA, 144A |
1,149 | 3,989 | ||||||
| Antares Vision SpA* |
212 | 1,604 | ||||||
| Ariston Holding NV (a) |
463 | 5,058 | ||||||
| Arnoldo Mondadori Editore SpA |
391 | 767 | ||||||
| Ascopiave SpA |
207 | 535 | ||||||
| Assicurazioni Generali SpA |
5,129 | 97,121 | ||||||
| Azimut Holding SpA |
488 | 9,689 | ||||||
| Banca Generali SpA |
279 | 8,589 | ||||||
| Banca IFIS SpA |
113 | 1,691 | ||||||
| Banca Mediolanum SpA |
1,038 | 8,739 | ||||||
| Banca Monte dei Paschi di Siena SpA* |
2,428 | 5,471 | ||||||
| Banca Popolare di Sondrio SpA |
2,053 | 7,681 | ||||||
| See Notes to Financial Statements. | 80 |
DBX ETF Trust
Schedule of Investments
Xtrackers MSCI Eurozone Hedged Equity ETF (Continued)
May 31, 2023
| Number |
Value |
|||||||
| Italy (Continued) | ||||||||
| Banco BPM SpA |
6,948 | $ | 27,167 | |||||
| BFF Bank SpA, 144A |
895 | 9,275 | ||||||
| Biesse SpA |
53 | 663 | ||||||
| BPER Banca |
5,080 | 12,978 | ||||||
| Brembo SpA |
686 | 10,427 | ||||||
| Brunello Cucinelli SpA |
188 | 16,217 | ||||||
| Buzzi Unicem SpA |
437 | 9,977 | ||||||
| Carel Industries SpA, 144A |
179 | 4,965 | ||||||
| Cementir Holding NV |
109 | 825 | ||||||
| CIR SpA-Compagnie Industriali* |
3,163 | 1,234 | ||||||
| Credito Emiliano SpA |
378 | 2,602 | ||||||
| Danieli & C Officine Meccaniche SpA |
53 | 1,272 | ||||||
| Danieli & C Officine Meccaniche SpA-RSP |
137 | 2,478 | ||||||
| Datalogic SpA |
81 | 591 | ||||||
| Davide Campari-Milano NV |
2,690 | 35,108 | ||||||
| De’ Longhi SpA |
391 | 7,636 | ||||||
| DiaSorin SpA |
117 | 12,031 | ||||||
| Digital Bros SpA |
30 | 567 | ||||||
| Digital Value SpA |
14 | 937 | ||||||
| doValue SpA, 144A |
376 | 1,644 | ||||||
| El.En. SpA |
196 | 2,179 | ||||||
| Enav SpA, 144A |
1,232 | 5,202 | ||||||
| Enel SpA |
40,740 | 255,098 | ||||||
| Eni SpA |
11,693 | 155,608 | ||||||
| ERG SpA |
323 | 8,859 | ||||||
| Esprinet SpA |
338 | 2,128 | ||||||
| Eurogroup Laminations SpA* |
427 | 2,716 | ||||||
| Ferrari NV |
634 | 180,670 | ||||||
| Fila SpA |
95 | 802 | ||||||
| Fincantieri SpA* |
2,044 | 1,136 | ||||||
| FinecoBank Banca Fineco SpA |
3,147 | 41,745 | ||||||
| Gruppo MutuiOnline SpA* |
123 | 3,780 | ||||||
| GVS SpA, 144A* |
282 | 1,744 | ||||||
| Hera SpA (a) |
4,030 | 12,596 | ||||||
| Illimity Bank SpA |
265 | 1,758 | ||||||
| Industrie de Nora SpA |
151 | 3,165 | ||||||
| Infrastrutture Wireless Italiane SpA, 144A |
1,579 | 20,085 | ||||||
| Interpump Group SpA |
361 | 19,363 | ||||||
| Intesa Sanpaolo SpA |
80,709 | 185,955 | ||||||
| Iren SpA |
3,666 | 7,308 | ||||||
| Italgas SpA |
2,236 | 12,715 | ||||||
| Iveco Group NV* |
880 | 6,571 | ||||||
| Juventus Football Club SpA* |
3,913 | 1,257 | ||||||
| Leonardo SpA |
1,959 | 21,003 | ||||||
| Lu-VE SpA |
87 | 2,781 | ||||||
| Maire Tecnimont SpA |
492 | 1,765 | ||||||
| MARR SpA |
151 | 2,353 | ||||||
| Mediobanca Banca di Credito Finanziario SpA |
2,881 | 31,703 | ||||||
| MFE-MediaForEurope NV, Class A |
2,242 | 1,062 | ||||||
| MFE-MediaForEurope NV, Class B |
1,059 | 731 | ||||||
| Moncler SpA |
1,041 | 70,458 | ||||||
| Nexi SpA, 144A* |
3,096 | 24,251 | ||||||
| OVS SpA, 144A |
954 | 2,498 | ||||||
| Pharmanutra SpA |
16 | 1,004 | ||||||
| Piaggio & C SpA |
701 | 2,700 | ||||||
| Pirelli & C SpA, 144A* |
1,649 | 7,770 | ||||||
| Number |
Value |
|||||||
| Italy (Continued) | ||||||||
| Poste Italiane SpA, 144A |
2,718 | $ | 28,170 | |||||
| Prysmian SpA |
1,277 | 47,324 | ||||||
| RAI Way SpA, 144A |
435 | 2,483 | ||||||
| Recordati Industria Chimica e Farmaceutica SpA |
506 | 21,970 | ||||||
| Reply SpA |
135 | 14,603 | ||||||
| Safilo Group SpA* |
1,594 | 2,017 | ||||||
| Saipem SpA* |
5,844 | 7,390 | ||||||
| Salcef Group SpA |
70 | 1,642 | ||||||
| Salvatore Ferragamo SpA |
224 | 3,615 | ||||||
| Sanlorenzo SpA |
55 | 2,184 | ||||||
| Saras SpA |
2,407 | 2,804 | ||||||
| Seco SpA* |
151 | 772 | ||||||
| Sesa SpA |
39 | 4,498 | ||||||
| Snam SpA |
9,843 | 51,449 | ||||||
| SOL SpA |
165 | 4,524 | ||||||
| Tamburi Investment Partners SpA* |
712 | 6,705 | ||||||
| Technogym SpA, 144A |
599 | 5,478 | ||||||
| Technoprobe SpA* |
640 | 5,028 | ||||||
| Telecom Italia SpA* |
49,618 | 13,142 | ||||||
| Terna — Rete Elettrica Nazionale |
7,163 | 59,966 | ||||||
| Tinexta SpA |
123 | 2,278 | ||||||
| Tod’s SpA* |
41 | 1,665 | ||||||
| UniCredit SpA |
9,228 | 176,700 | ||||||
| Unipol Gruppo SpA |
1,871 | 9,334 | ||||||
| Webuild SpA (a) |
1,663 | 3,216 | ||||||
| Wiit SpA |
26 | 549 | ||||||
| Zignago Vetro SpA |
151 | 2,489 | ||||||
|
|
|
|||||||
| (Cost $1,936,343) |
1,929,895 | |||||||
|
|
|
|||||||
| Luxembourg — 0.6% | ||||||||
| APERAM SA |
226 | 7,397 | ||||||
| ArcelorMittal SA |
2,459 | 61,058 | ||||||
| Aroundtown SA |
5,212 | 5,460 | ||||||
| B&S Group SARL, 144A |
109 | 431 | ||||||
| Befesa SA, 144A |
229 | 8,543 | ||||||
| Eurofins Scientific SE |
686 | 45,198 | ||||||
| Grand City Properties SA |
492 | 3,629 | ||||||
| SES SA |
1,885 | 11,182 | ||||||
| Shurgard Self Storage Ltd. REIT |
114 | 5,217 | ||||||
| Tenaris SA |
2,269 | 28,304 | ||||||
|
|
|
|||||||
| (Cost $242,946) |
176,419 | |||||||
|
|
|
|||||||
| Netherlands — 14.0% | ||||||||
| Aalberts NV |
491 | 20,731 | ||||||
| ABN AMRO Bank NV, 144A |
2,094 | 30,452 | ||||||
| Adyen NV, 144A* |
109 | 177,888 | ||||||
| Aegon NV |
8,597 | 37,814 | ||||||
| Akzo Nobel NV |
867 | 65,279 | ||||||
| Alfen N.V., 144A* (a) |
111 | 7,923 | ||||||
| AMG Advanced Metallurgical Group NV |
137 | 6,171 | ||||||
| Arcadis NV |
361 | 14,640 | ||||||
| Argenx SE* |
279 | 108,732 | ||||||
| ASM International NV |
235 | 101,833 | ||||||
| ASML Holding NV |
2,016 | 1,447,018 | ||||||
| ASR Nederland NV (a) |
759 | 32,290 | ||||||
| Basic-Fit NV, 144A* (a) |
298 | 11,372 | ||||||
| BE Semiconductor Industries NV |
372 | 40,976 | ||||||
| See Notes to Financial Statements. | 81 |
DBX ETF Trust
Schedule of Investments
Xtrackers MSCI Eurozone Hedged Equity ETF (Continued)
May 31, 2023
| Number |
Value |
|||||||
| Netherlands (Continued) | ||||||||
| Brunel International NV |
109 | $ | 1,347 | |||||
| Corbion NV |
263 | 7,219 | ||||||
| Ebusco Holding NV* (a) |
98 | 803 | ||||||
| Eurocommercial Properties NV REIT |
183 | 4,174 | ||||||
| Euronext NV, 144A |
407 | 27,038 | ||||||
| EXOR NV* |
557 | 46,237 | ||||||
| Fastned BV* (a) |
39 | 1,186 | ||||||
| Flow Traders Ltd. |
137 | 3,166 | ||||||
| Fugro NV* |
643 | 9,244 | ||||||
| Heineken Holding NV |
574 | 48,808 | ||||||
| Heineken NV |
1,297 | 130,984 | ||||||
| IMCD NV |
279 | 41,915 | ||||||
| ING Groep NV |
18,103 | 222,683 | ||||||
| JDE Peet’s NV |
668 | 19,407 | ||||||
| Just Eat Takeaway.com NV, 144A* |
1,066 | 16,030 | ||||||
| Koninklijke Ahold Delhaize NV |
4,915 | 155,823 | ||||||
| Koninklijke BAM Groep NV |
1,363 | 2,768 | ||||||
| Koninklijke KPN NV |
16,034 | 55,153 | ||||||
| Koninklijke Philips NV* |
4,647 | 87,651 | ||||||
| Koninklijke Vopak NV |
335 | 11,763 | ||||||
| NN Group NV |
1,284 | 46,280 | ||||||
| NSI NV REIT |
85 | 1,814 | ||||||
| OCI NV |
504 | 11,200 | ||||||
| Ordina NV |
464 | 2,807 | ||||||
| Pharming Group NV* |
4,167 | 5,073 | ||||||
| PostNL NV |
2,008 | 3,111 | ||||||
| Prosus NV* |
4,017 | 264,368 | ||||||
| QIAGEN NV* |
1,154 | 52,067 | ||||||
| Randstad NV |
568 | 27,843 | ||||||
| SBM Offshore NV |
697 | 9,469 | ||||||
| Shop Apotheke Europe NV, 144A* |
78 | 7,584 | ||||||
| Signify NV, 144A |
626 | 15,952 | ||||||
| Sligro Food Group NV |
109 | 1,829 | ||||||
| Stellantis NV |
11,291 | 171,162 | ||||||
| TKH Group NV |
197 | 9,775 | ||||||
| TomTom NV* |
296 | 2,259 | ||||||
| Universal Music Group NV |
4,103 | 81,135 | ||||||
| Van Lanschot Kempen NV |
123 | 3,366 | ||||||
| Vastned Retail NV REIT |
67 | 1,404 | ||||||
| Wereldhave NV REIT |
165 | 2,416 | ||||||
| Wolters Kluwer NV |
1,286 | 146,808 | ||||||
|
|
|
|||||||
| (Cost $3,460,823) |
3,864,240 | |||||||
|
|
|
|||||||
| Poland — 0.1% | ||||||||
| InPost SA* |
1,246 | 13,438 | ||||||
|
|
|
|||||||
| Portugal — 0.6% | ||||||||
| Altri SGPS SA (a) |
268 | 1,182 | ||||||
| Banco Comercial Portugues SA, Class R |
38,038 | 8,359 | ||||||
| Corticeira Amorim SGPS SA |
209 | 2,198 | ||||||
| CTT-Correios de Portugal SA |
534 | 1,858 | ||||||
| EDP — Energias de Portugal SA |
14,653 | 71,453 | ||||||
| Galp Energia SGPS SA |
2,393 | 25,313 | ||||||
| Greenvolt-Energias Renovaveis SA* |
295 | 1,923 | ||||||
| Jeronimo Martins SGPS SA |
1,365 | 32,945 | ||||||
| Mota-Engil SGPS SA |
991 | 1,947 | ||||||
| Navigator Co. SA |
1,050 | 3,455 | ||||||
| Number |
Value |
|||||||
| Portugal (Continued) | ||||||||
| NOS SGPS SA |
1,079 | $ | 3,979 | |||||
| REN — Redes Energeticas Nacionais SGPS SA |
1,834 | 4,911 | ||||||
| Semapa-Sociedade de Investimento e Gestao |
100 | 1,370 | ||||||
| Sonae SGPS SA |
5,272 | 5,089 | ||||||
|
|
|
|||||||
| (Cost $170,150) |
165,982 | |||||||
|
|
|
|||||||
| Spain — 7.7% | ||||||||
| Acciona SA |
129 | 20,863 | ||||||
| Acerinox SA |
996 | 10,157 | ||||||
| ACS Actividades de Construccion y Servicios SA |
1,043 | 34,695 | ||||||
| Aena SME SA, 144A |
382 | 59,696 | ||||||
| Almirall SA |
470 | 4,132 | ||||||
| Amadeus IT Group SA* |
2,250 | 160,896 | ||||||
| Applus Services SA |
576 | 5,517 | ||||||
| Atresmedia Corp. de Medios de Comunicacion SA |
352 | 1,321 | ||||||
| Banco Bilbao Vizcaya Argentaria SA |
30,168 | 197,349 | ||||||
| Banco de Sabadell SA |
27,414 | 27,076 | ||||||
| Banco Santander SA |
82,194 | 267,525 | ||||||
| Bankinter SA (a) |
3,256 | 18,592 | ||||||
| CaixaBank SA |
20,936 | 76,691 | ||||||
| Cellnex Telecom SA, 144A* (a) |
2,831 | 114,718 | ||||||
| Cia de Distribucion Integral Logista Holdings SA |
333 | 8,279 | ||||||
| CIE Automotive SA (a) |
236 | 6,745 | ||||||
| Construcciones y Auxiliar de Ferrocarriles SA |
81 | 2,576 | ||||||
| Corp ACCIONA Energias Renovables SA* |
333 | 11,077 | ||||||
| Distribuidora Internacional de Alimentacion SA* |
55,147 | 814 | ||||||
| Ebro Foods SA (a) |
291 | 5,170 | ||||||
| EDP Renovaveis SA* |
16 | 318 | ||||||
| EDP Renovaveis SA |
1,250 | 24,825 | ||||||
| eDreams ODIGEO SA* |
320 | 1,775 | ||||||
| Enagas SA |
1,177 | 22,463 | ||||||
| Ence Energia y Celulosa SA |
450 | 1,390 | ||||||
| Endesa SA |
1,535 | 33,193 | ||||||
| Faes Farma SA |
1,498 | 5,292 | ||||||
| Ferrovial SA |
2,547 | 78,816 | ||||||
| Fluidra SA (a) |
488 | 8,622 | ||||||
| Gestamp Automocion SA, 144A |
645 | 2,827 | ||||||
| Global Dominion Access SA, 144A |
422 | 1,834 | ||||||
| Grenergy Renovables SA* |
44 | 1,155 | ||||||
| Grifols SA* (a) |
1,454 | 16,855 | ||||||
| Iberdrola SA |
29,214 | 355,986 | ||||||
| Indra Sistemas SA (a) |
631 | 7,736 | ||||||
| Industria de Diseno Textil SA |
5,452 | 182,347 | ||||||
| Inmobiliaria Colonial Socimi SA REIT |
1,678 | 9,820 | ||||||
| Laboratorios Farmaceuticos Rovi SA |
132 | 5,830 | ||||||
| Lar Espana Real Estate Socimi SA REIT |
380 | 1,994 | ||||||
| Linea Directa Aseguradora SA Cia de Seguros y Reaseguros |
2,796 | 2,645 | ||||||
| Mapfre SA (a) |
4,742 | 9,316 | ||||||
| Melia Hotels International SA* (a) |
450 | 2,852 | ||||||
| Merlin Properties Socimi SA REIT |
1,538 | 12,642 | ||||||
| See Notes to Financial Statements. | 82 |
DBX ETF Trust
Schedule of Investments
Xtrackers MSCI Eurozone Hedged Equity ETF (Continued)
May 31, 2023
| Number |
Value |
|||||||
| Spain (Continued) | ||||||||
| Miquel y Costas & Miquel SA |
140 | $ | 1,739 | |||||
| Naturgy Energy Group SA |
697 | 19,833 | ||||||
| Neinor Homes SA, 144A* |
268 | 2,567 | ||||||
| Pharma Mar SA |
68 | 2,358 | ||||||
| Prosegur Cash SA, 144A |
2,142 | 1,449 | ||||||
| Prosegur Cia de Seguridad SA |
1,093 | 1,951 | ||||||
| Red Electrica Corp. SA |
1,972 | 33,399 | ||||||
| Repsol SA |
6,634 | 89,986 | ||||||
| Sacyr SA (a) |
1,795 | 5,372 | ||||||
| Solaria Energia y Medio Ambiente SA* |
380 | 5,157 | ||||||
| Soltec Power Holdings SA* |
225 | 994 | ||||||
| Talgo SA, 144A* |
433 | 1,437 | ||||||
| Tecnicas Reunidas SA* |
137 | 1,215 | ||||||
| Telefonica SA |
25,996 | 110,315 | ||||||
| Unicaja Banco SA, 144A |
7,999 | 7,618 | ||||||
| Vidrala SA |
99 | 9,386 | ||||||
| Viscofan SA |
195 | 13,027 | ||||||
|
|
|
|||||||
| (Cost $2,350,683) |
2,132,225 | |||||||
|
|
|
|||||||
| Switzerland — 0.9% | ||||||||
| DSM-Firmenich AG* |
872 | 96,974 | ||||||
| STMicroelectronics NV |
3,424 | 148,574 | ||||||
|
|
|
|||||||
| (Cost $232,280) |
245,548 | |||||||
|
|
|
|||||||
| United Kingdom — 0.5% | ||||||||
| Allfunds Group PLC |
1,611 | 10,986 | ||||||
| CNH Industrial NV |
5,118 | 65,374 | ||||||
| Coca-Cola Europacific Partners PLC |
1,041 | 64,948 | ||||||
|
|
|
|||||||
| (Cost $131,088) |
141,308 | |||||||
|
|
|
|||||||
| TOTAL COMMON STOCKS |
26,993,377 | |||||||
|
|
|
|||||||
| PREFERRED STOCKS — 1.5% | ||||||||
| Germany — 1.5% | ||||||||
| Bayerische Motoren Werke AG |
308 | 31,655 | ||||||
| Dr Ing hc F Porsche AG, 144A* |
579 | 71,885 | ||||||
| Draegerwerk AG & Co. KGaA |
58 | 2,697 | ||||||
| FUCHS PETROLUB SE |
347 | 12,314 | ||||||
| Henkel AG & Co. KGaA |
866 | 68,999 | ||||||
| Jungheinrich AG |
212 | 6,735 | ||||||
| Porsche Automobil Holding SE* |
786 | 43,604 | ||||||
| Sartorius AG (a) |
132 | 44,233 | ||||||
| Schaeffler AG |
433 | 2,636 | ||||||
| Sixt SE |
98 | 6,987 | ||||||
| STO SE & Co. KGaA |
13 | 2,415 | ||||||
| Volkswagen AG |
1,029 | 128,226 | ||||||
|
|
|
|||||||
| (Cost $453,395) |
422,386 | |||||||
|
|
|
|||||||
| RIGHTS — 0.0% | ||||||||
| Austria — 0.0% | ||||||||
| S IMMO AG*, |
188 | 0 | ||||||
|
|
|
|||||||
| Number |
Value |
|||||||
| Spain — 0.0% | ||||||||
| Almirall SA*, |
136 | $ | 25 | |||||
|
|
|
|||||||
| TOTAL RIGHTS |
25 | |||||||
|
|
|
|||||||
| WARRANTS — 0.0% | ||||||||
| Italy — 0.0% | ||||||||
| Webuild SpA* (c), |
38 | 25 | ||||||
|
|
|
|||||||
| Spain — 0.0% | ||||||||
| Abengoa SA* (c), |
7,125 | 0 | ||||||
|
|
|
|||||||
| TOTAL WARRANTS |
25 | |||||||
|
|
|
|||||||
| EXCHANGE-TRADED FUNDS — 0.0% | ||||||||
| iShares Currency Hedged MSCI Eurozone ETF |
100 | 3,149 | ||||||
| iShares MSCI Eurozone ETF |
100 | 4,413 | ||||||
|
|
|
|||||||
| (Cost $6,341) |
7,562 | |||||||
|
|
|
|||||||
| SECURITIES LENDING COLLATERAL — 5.4% |
|
|||||||
| DWS Government & Agency Securities Portfolio “DWS Government Cash Institutional Shares”,
5.03% (d)(e) |
1,477,246 | 1,477,246 | ||||||
|
|
|
|||||||
| CASH EQUIVALENTS — 0.0% | ||||||||
| DWS Government Money Market Series “Institutional Shares”, 5.04% (d) |
8,289 | 8,289 | ||||||
|
|
|
|||||||
| TOTAL INVESTMENTS — 104.9% |
$ | 28,908,910 | ||||||
| Other assets and liabilities, net — (4.9%) |
(1,344,108 | ) | ||||||
|
|
|
|||||||
| NET ASSETS — 100.0% |
$ | 27,564,802 | ||||||
|
|
|
|||||||
| See Notes to Financial Statements. | 83 |
DBX ETF Trust
Schedule of Investments
Xtrackers MSCI Eurozone Hedged Equity ETF (Continued)
May 31, 2023
A summary of the Fund’s transactions with affiliated investments during the year ended May 31, 2023 is as follows:
| Value ($) at 5/31/2022 |
Purchases Cost ($) |
Sales Proceeds ($) |
Net Realized Gain/(Loss) ($) |
Net Change in Unrealized Appreciation (Depreciation) ($) |
Income ($) | Capital Gain Distributions ($) |
Number of Shares at 5/31/2023 |
Value ($) at 5/31/2023 |
||||||||||||||||||||||||||||
| COMMON STOCKS — 0.4% |
| |||||||||||||||||||||||||||||||||||
| Germany — 0.4% |
| |||||||||||||||||||||||||||||||||||
| Deutsche Bank AG (b) |
| |||||||||||||||||||||||||||||||||||
| 53,391 | 75,855 | (12,198 | ) | (11,550 | ) | (4,929 | ) | 3,209 | — | 9,929 | 100,569 | |||||||||||||||||||||||||
| SECURITIES LENDING COLLATERAL — 5.4% |
| |||||||||||||||||||||||||||||||||||
| DWS Government & Agency Securities Portfolio “DWS Government Cash Institutional Shares”, 5.03% (d)(e) |
| |||||||||||||||||||||||||||||||||||
| 999,756 | 477,490 | (f) | — | — | — | 9,158 | — | 1,477,246 | 1,477,246 | |||||||||||||||||||||||||||
| CASH EQUIVALENTS — 0.0% |
| |||||||||||||||||||||||||||||||||||
| DWS Government Money Market Series “Institutional Shares”, 5.04% (d) |
| |||||||||||||||||||||||||||||||||||
| 22,163 | 1,167,643 | (1,181,517 | ) | — | — | 1,932 | — | 8,289 | 8,289 | |||||||||||||||||||||||||||
|
|
|
|
|
|
|
|
|
|
|
|
|
|
|
|
|
|
|
|||||||||||||||||||
| 1,075,310 | 1,720,988 | (1,193,715 | ) | (11,550 | ) | (4,929 | ) | 14,299 | — | 1,495,464 | 1,586,104 | |||||||||||||||||||||||||
|
|
|
|
|
|
|
|
|
|
|
|
|
|
|
|
|
|
|
|||||||||||||||||||
| * | Non-income producing security. |
| (a) | All or a portion of these securities were on loan. In addition, “Other assets and liabilities, net” may include pending sales that are also on loan. The value of securities loaned at May 31, 2023 amounted to $2,252,295, which is 8.2% of net assets. |
| (b) | Affiliated issuer. This security is owned in proportion with its representation in the index. |
| (c) | Investment was valued using significant unobservable inputs. |
| (d) | Affiliated fund managed by DWS Investment Management Americas, Inc. The rate shown is the annualized seven-day yield at period end. |
| (e) | Represents cash collateral held in connection with securities lending. Income earned by the Fund is net of borrower rebates. In addition, the Fund held non-cash U.S. Treasury securities collateral having a value of $954,601. |
| (f) | Represents the net increase (purchase cost) or decrease (sales proceeds) in the amount invested in cash collateral for the year ended May 31, 2023. |
| CVA: | Credit Valuation Adjustment |
| REIT: | Real Estate Investment Trust |
| RSP: | Risparmio (Convertible Savings Shares) |
| 144A: | Security exempt from registration under Rule 144A of the Securities Act of 1933. These securities may be resold in transactions exempt from registration, normally to qualified institutional buyers. |
Securities are listed in country of domicile.
At May 31, 2023, open futures contracts purchased were as follows:
| Contract Description |
Currency | Number of Contracts |
Notional Amount |
Contract Value |
Expiration Date |
Unrealized Depreciation |
||||||||||||
| EURO STOXX 50 Futures |
EUR | 4 | $ | 183,579 | $180,302 | 6/16/2023 | $ | (3,277 | ) | |||||||||
As of May 31, 2023, the Fund had the following forward foreign currency contracts outstanding:
| Counterparty |
Settlement Date |
Currency To Deliver |
Currency To Receive |
Unrealized Appreciation |
Unrealized Depreciation |
|||||||||||||||||
| Goldman Sachs & Co. |
6/2/2023 | EUR | 5,703,300 | USD | 6,307,279 | $ | 211,017 | $ | — | |||||||||||||
| Goldman Sachs & Co. |
6/2/2023 | EUR | 239,000 | USD | 264,306 | 8,839 | — | |||||||||||||||
| JP Morgan & Chase Co. |
6/2/2023 | EUR | 2,846,530 | USD | 3,148,091 | 105,433 | — | |||||||||||||||
| RBC Capital Markets |
6/2/2023 | EUR | 16,576,400 | USD | 18,332,670 | 614,142 | — | |||||||||||||||
| Goldman Sachs & Co. |
6/2/2023 | USD | 35,367 | EUR | 32,000 | — | (1,162 | ) | ||||||||||||||
| Goldman Sachs & Co. |
6/2/2023 | USD | 6,300,971 | EUR | 5,910,300 | 16,554 | — | |||||||||||||||
| JP Morgan & Chase Co. |
6/2/2023 | USD | 3,034,686 | EUR | 2,846,530 | 7,973 | — | |||||||||||||||
| RBC Capital Markets |
6/2/2023 | USD | 17,672,100 | EUR | 16,576,400 | 46,427 | — | |||||||||||||||
| Goldman Sachs & Co. |
7/5/2023 | EUR | 681,000 | USD | 727,427 | — | (2,004 | ) | ||||||||||||||
| Goldman Sachs & Co. |
7/5/2023 | EUR | 5,910,300 | USD | 6,313,235 | — | (17,393 | ) | ||||||||||||||
| JP Morgan & Chase Co. |
7/5/2023 | EUR | 2,846,530 | USD | 3,040,564 | — | (8,406 | ) | ||||||||||||||
| RBC Capital Markets |
7/5/2023 | EUR | 16,576,400 | USD | 17,706,446 | — | (48,832 | ) | ||||||||||||||
|
|
|
|
|
|||||||||||||||||||
| Total unrealized appreciation (depreciation) |
$ | 1,010,385 | $ | (77,797 | ) | |||||||||||||||||
|
|
|
|
|
|||||||||||||||||||
| See Notes to Financial Statements. | 84 |
DBX ETF Trust
Schedule of Investments
Xtrackers MSCI Eurozone Hedged Equity ETF (Continued)
May 31, 2023
For information on the Fund’s policy and additional disclosures regarding futures contracts and forward foreign currency contracts, please refer to the Derivatives section of Note 2 in the accompanying Notes to Financial Statements.
Currency Abbreviations
| EUR | Euro |
| USD | U.S. Dollar |
Fair Value Measurements
Various inputs are used in determining the value of the Fund’s investments. These inputs are summarized in three broad levels. Level 1 includes quoted prices in active markets for identical securities. Level 2 includes other significant observable inputs (including quoted prices for similar securities, interest rates, prepayment speeds and credit risk). Level 3 includes significant unobservable inputs (including the Fund’s own assumptions in determining the fair value of investments). The level assigned to the securities valuations may not be an indication of the risk or liquidity associated with investing in those securities.
The following is a summary of the inputs used as of May 31, 2023 in valuing the Fund’s investments. For information on the Fund’s policy regarding the valuation of investments, please refer to the Security Valuation section of Note 2 in the accompanying Notes to Financial Statements.
| Assets |
Level 1 | Level 2 | Level 3 | Total | ||||||||||||
| Common Stocks (a) |
$ | 26,993,377 | $ | — | $ | 0 | $ | 26,993,377 | ||||||||
| Preferred Stocks |
422,386 | — | — | 422,386 | ||||||||||||
| Rights (a) |
— | — | 25 | 25 | ||||||||||||
| Warrants (a) |
— | — | 25 | 25 | ||||||||||||
| Exchange-Traded Funds |
7,562 | — | — | 7,562 | ||||||||||||
| Short-Term Investments (a) |
1,485,535 | — | — | 1,485,535 | ||||||||||||
| Derivatives (b) |
||||||||||||||||
| Forward Foreign Currency Contracts |
— | 1,010,385 | — | 1,010,385 | ||||||||||||
|
|
|
|
|
|
|
|
|
|||||||||
| TOTAL |
$ | 28,908,860 | $ | 1,010,385 | $ | 50 | $ | 29,919,295 | ||||||||
|
|
|
|
|
|
|
|
|
|||||||||
| Liabilities |
Level 1 | Level 2 | Level 3 | Total | ||||||||||||
| Derivatives (b) |
||||||||||||||||
| Forward Foreign Currency Contracts |
$ | — | $ | (77,797 | ) | $ | — | $ | (77,797 | ) | ||||||
| Futures Contracts |
(3,277 | ) | — | — | (3,277 | ) | ||||||||||
|
|
|
|
|
|
|
|
|
|||||||||
| TOTAL |
$ | (3,277 | ) | $ | (77,797 | ) | $ | — | $ | (81,074 | ) | |||||
|
|
|
|
|
|
|
|
|
|||||||||
| (a) | See Schedule of Investments for additional detailed categorizations. |
| (b) | Derivatives include unrealized appreciation (depreciation) on open futures contracts and forward foreign currency contracts. |
During the period ended May 31, 2023, the amount of transfers from Level 1 to Level 3 was $77. The investment was transferred from Level 1 to Level 3 due to the lack of observable market data due to a decrease in market activity.
| See Notes to Financial Statements. | 85 |
DBX ETF Trust
Schedule of Investments
Xtrackers MSCI Germany Hedged Equity ETF
May 31, 2023
| Number |
Value |
|||||||
| COMMON STOCKS — 89.5% | ||||||||
| Communication Services — 5.9% | ||||||||
| Deutsche Telekom AG |
22,338 | $ | 495,331 | |||||
| Scout24 SE, 144A |
523 | 33,542 | ||||||
| Telefonica Deutschland Holding AG |
6,301 | 17,747 | ||||||
|
|
|
|||||||
| (Cost $481,503) |
546,620 | |||||||
|
|
|
|||||||
| Consumer Discretionary — 11.6% | ||||||||
| adidas AG |
1,118 | 181,047 | ||||||
| Bayerische Motoren Werke AG |
2,284 | 248,824 | ||||||
| Continental AG |
753 | 50,128 | ||||||
| Delivery Hero SE, 144A* |
1,199 | 44,857 | ||||||
| Mercedes-Benz Group AG |
5,899 | 439,931 | ||||||
| Puma SE |
718 | 34,168 | ||||||
| Volkswagen AG |
202 | 30,315 | ||||||
| Zalando SE, 144A* |
1,535 | 44,366 | ||||||
|
|
|
|||||||
| (Cost $1,417,293) |
1,073,636 | |||||||
|
|
|
|||||||
| Consumer Staples — 1.8% | ||||||||
| Beiersdorf AG |
691 | 88,005 | ||||||
| HelloFresh SE* |
1,120 | 26,613 | ||||||
| Henkel AG & Co. KGaA |
709 | 50,867 | ||||||
|
|
|
|||||||
| (Cost $203,763) |
165,485 | |||||||
|
|
|
|||||||
| Financials — 16.1% | ||||||||
| Allianz SE |
2,779 | 594,036 | ||||||
| Commerzbank AG* |
7,301 | 73,358 | ||||||
| Deutsche Bank AG (a) |
13,389 | 135,616 | ||||||
| Deutsche Boerse AG |
1,311 | 226,315 | ||||||
| Hannover Rueck SE |
413 | 88,379 | ||||||
| Muenchener Rueckversicherungs-Gesellschaft AG in Muenchen |
966 | 344,874 | ||||||
| Talanx AG |
444 | 24,750 | ||||||
|
|
|
|||||||
| (Cost $1,486,604) |
1,487,328 | |||||||
|
|
|
|||||||
| Health Care — 9.6% | ||||||||
| Bayer AG |
6,772 | 377,420 | ||||||
| Carl Zeiss Meditec AG |
276 | 30,933 | ||||||
| Fresenius Medical Care AG & Co. KGaA |
1,405 | 59,997 | ||||||
| Fresenius SE & Co. KGaA |
2,891 | 79,078 | ||||||
| Merck KGaA |
892 | 155,176 | ||||||
| QIAGEN NV* |
1,559 | 70,339 | ||||||
| Siemens Healthineers AG, 144A |
1,950 | 110,263 | ||||||
|
|
|
|||||||
| (Cost $1,426,762) |
883,206 | |||||||
|
|
|
|||||||
| Industrials — 18.9% | ||||||||
| Brenntag SE |
1,058 | 82,985 | ||||||
| Daimler Truck Holding AG* |
3,415 | 103,303 | ||||||
| Deutsche Lufthansa AG* |
4,098 | 40,124 | ||||||
| Deutsche Post AG |
6,940 | 311,934 | ||||||
| GEA Group AG |
1,030 | 43,257 | ||||||
| Knorr-Bremse AG |
493 | 33,715 | ||||||
| MTU Aero Engines AG |
366 | 84,425 | ||||||
| Rational AG |
36 | 24,147 | ||||||
| Rheinmetall AG |
298 | 75,301 | ||||||
| Siemens AG |
5,236 | 858,208 | ||||||
| Siemens Energy AG* |
3,558 | 90,287 | ||||||
|
|
|
|||||||
| (Cost $1,387,508) |
1,747,686 | |||||||
|
|
|
|||||||
| Information Technology — 14.3% | ||||||||
| Bechtle AG |
569 | 22,309 | ||||||
| Infineon Technologies AG |
9,004 | 334,255 | ||||||
| Number |
Value |
|||||||
| Information Technology (Continued) | ||||||||
| Nemetschek SE |
390 | $ | 30,532 | |||||
| SAP SE |
7,194 | 939,524 | ||||||
|
|
|
|||||||
| (Cost $986,085) |
1,326,620 | |||||||
|
|
|
|||||||
| Materials — 6.0% | ||||||||
| BASF SE |
6,164 | 292,637 | ||||||
| Covestro AG, 144A* |
1,320 | 50,879 | ||||||
| Evonik Industries AG* |
1,427 | 28,592 | ||||||
| Heidelberg Materials AG |
991 | 70,845 | ||||||
| Symrise AG |
909 | 97,143 | ||||||
| Wacker Chemie AG |
129 | 17,126 | ||||||
|
|
|
|||||||
| (Cost $893,795) |
557,222 | |||||||
|
|
|
|||||||
| Real Estate — 1.3% | ||||||||
| LEG Immobilien SE* |
501 | 25,978 | ||||||
| Vonovia SE |
4,905 | 89,969 | ||||||
|
|
|
|||||||
| (Cost $267,655) |
115,947 | |||||||
|
|
|
|||||||
| Utilities — 4.0% | ||||||||
| E.ON SE |
15,496 | 187,335 | ||||||
| RWE AG |
4,340 | 181,479 | ||||||
|
|
|
|||||||
| (Cost $353,545) |
368,814 | |||||||
|
|
|
|||||||
| TOTAL COMMON STOCKS |
8,272,564 | |||||||
|
|
|
|||||||
| PREFERRED STOCKS — 5.7% | ||||||||
| Consumer Discretionary — 4.0% | ||||||||
| Bayerische Motoren Werke AG |
407 | 41,829 | ||||||
| Dr Ing hc F Porsche AG, 144A* |
780 | 96,839 | ||||||
| Porsche Automobil Holding SE |
1,049 | 58,194 | ||||||
| Volkswagen AG |
1,423 | 177,324 | ||||||
|
|
|
|||||||
| (Cost $523,903) |
374,186 | |||||||
|
|
|
|||||||
| Consumer Staples — 1.0% | ||||||||
| Henkel AG & Co. KGaA |
1,171 | 93,301 | ||||||
|
|
|
|||||||
| Health Care — 0.7% | ||||||||
| Sartorius AG |
182 | 60,988 | ||||||
|
|
|
|||||||
| TOTAL PREFERRED STOCKS |
528,475 | |||||||
|
|
|
|||||||
| EXCHANGE-TRADED FUNDS — 2.3% | ||||||||
| iShares Currency Hedged MSCI Germany ETF |
2,500 | 77,450 | ||||||
| iShares MSCI Germany ETF |
4,850 | 135,703 | ||||||
|
|
|
|||||||
| (Cost $216,736) |
213,153 | |||||||
|
|
|
|||||||
| CASH EQUIVALENTS — 0.0% | ||||||||
| DWS Government Money Market Series “Institutional Shares”, 5.04% (b) |
1,145 | 1,145 | ||||||
|
|
|
|||||||
| TOTAL INVESTMENTS — 97.5% |
$ | 9,015,337 | ||||||
| Other assets and liabilities, net — 2.5% |
229,013 | |||||||
|
|
|
|||||||
| NET ASSETS — 100.0% |
$ | 9,244,350 | ||||||
|
|
|
|||||||
| See Notes to Financial Statements. | 86 |
DBX ETF Trust
Schedule of Investments
Xtrackers MSCI Germany Hedged Equity ETF (Continued)
May 31, 2023
A summary of the Fund’s transactions with affiliated investments during the year ended May 31, 2023 is as follows:
| Value ($) at 5/31/2022 |
Purchases Cost ($) |
Sales Proceeds ($) |
Net Realized Gain/(Loss) ($) |
Net Change in Unrealized Appreciation (Depreciation) ($) |
Income ($) |
Capital Gain Distributions ($) |
Number of Shares at 5/31/2023 |
Value ($) at 5/31/2023 |
||||||||||||||||||||||||||||
| COMMON STOCKS — 1.5% |
| |||||||||||||||||||||||||||||||||||
| Financials — 1.5% |
| |||||||||||||||||||||||||||||||||||
| Deutsche Bank AG (a) |
||||||||||||||||||||||||||||||||||||
| 186,311 | 19,143 | (51,465 | ) | (87,984 | ) | 69,611 | 4,536 | — | 13,389 | 135,616 | ||||||||||||||||||||||||||
| SECURITIES LENDING COLLATERAL — 0.0% |
| |||||||||||||||||||||||||||||||||||
| DWS Government & Agency Securities Portfolio “DWS Government Cash Institutional Shares, 5.03% (b)(c) |
| |||||||||||||||||||||||||||||||||||
| 15,960 | — | (15,960 | )(d) | — | — | 47 | — | — | — | |||||||||||||||||||||||||||
| CASH EQUIVALENTS — 0.0% |
| |||||||||||||||||||||||||||||||||||
| DWS Government Money Market Series “Institutional Shares”, 5.04% (b) |
| |||||||||||||||||||||||||||||||||||
| 6,428 | 665,912 | (671,195 | ) | — | — | 966 | — | 1,145 | 1,145 | |||||||||||||||||||||||||||
|
|
|
|
|
|
|
|
|
|
|
|
|
|
|
|
|
|
|
|||||||||||||||||||
| 208,699 | 685,055 | (738,620 | ) | (87,984 | ) | 69,611 | 5,549 | — | 14,534 | 136,761 | ||||||||||||||||||||||||||
|
|
|
|
|
|
|
|
|
|
|
|
|
|
|
|
|
|
|
|||||||||||||||||||
| * | Non-income producing security. |
| (a) | Affiliated issuer. This security is owned in proportion with its representation in the index. |
| (b) | Affiliated fund managed by DWS Investment Management Americas, Inc. The rate shown is the annualized seven-day yield at period end. |
| (c) | Represents collateral held in connection with securities lending. Income earned by the Fund is net of borrower rebates. |
| (d) | Represents the net increase (purchase cost) or decrease (sales proceeds) in the amount invested in cash collateral for the year ended May 31, 2023. |
| 144A: | Security exempt from registration under Rule 144A of the Securities Act of 1933. These securities may be resold in transactions exempt from registration, normally to qualified institutional buyers. |
At May 31, 2023, open futures contracts purchased were as follows:
| Contract Description |
Currency | Number of Contracts |
Notional Amount |
Contract Value |
Expiration Date |
Unrealized Appreciation |
||||||||||||
| DAX Mini Futures |
EUR | 3 | $ | 248,521 | $ | 251,165 | 6/16/2023 | $ | 2,644 | |||||||||
As of May 31, 2023, the Fund had the following forward foreign currency contracts outstanding:
| Counterparty |
Settlement Date |
Currency To Deliver |
Currency To Receive |
Unrealized Appreciation |
Unrealized Depreciation |
|||||||||||||||||
| Goldman Sachs & Co. |
6/2/2023 | EUR | 2,629,867 | USD | 2,908,370 | $ | 97,303 | $ | — | |||||||||||||
| Goldman Sachs & Co. |
6/2/2023 | EUR | 80,000 | USD | 88,471 | 2,959 | — | |||||||||||||||
| JP Morgan & Chase Co. |
6/2/2023 | EUR | 2,823,000 | USD | 3,122,069 | 104,561 | — | |||||||||||||||
| RBC Capital Markets |
6/2/2023 | EUR | 2,898,319 | USD | 3,205,396 | 107,380 | — | |||||||||||||||
| Goldman Sachs & Co. |
6/2/2023 | USD | 2,888,989 | EUR | 2,709,867 | 7,590 | — | |||||||||||||||
| JP Morgan & Chase Co. |
6/2/2023 | USD | 3,009,600 | EUR | 2,823,000 | 7,907 | — | |||||||||||||||
| RBC Capital Markets |
6/2/2023 | USD | 3,089,898 | EUR | 2,898,319 | 8,118 | — | |||||||||||||||
| Goldman Sachs & Co. |
7/5/2023 | EUR | 2,709,867 | USD | 2,894,612 | — | (7,975 | ) | ||||||||||||||
| Goldman Sachs & Co. |
7/5/2023 | EUR | 104,000 | USD | 111,090 | — | (306 | ) | ||||||||||||||
| JP Morgan & Chase Co. |
7/5/2023 | EUR | 2,823,000 | USD | 3,015,430 | — | (8,336 | ) | ||||||||||||||
| RBC Capital Markets |
7/5/2023 | EUR | 2,898,319 | USD | 3,095,903 | — | (8,538 | ) | ||||||||||||||
|
|
|
|
|
|||||||||||||||||||
| Total unrealized appreciation (depreciation) |
$ | 335,818 | $ | (25,155 | ) | |||||||||||||||||
|
|
|
|
|
|||||||||||||||||||
For information on the Fund’s policy and additional disclosures regarding futures contracts and forward foreign currency contracts, please refer to the Derivatives section of Note 2 in the accompanying Notes to Financial Statements.
Currency Abbreviations
| EUR | Euro |
| USD | U.S. Dollar |
| See Notes to Financial Statements. | 87 |
DBX ETF Trust
Schedule of Investments
Xtrackers MSCI Germany Hedged Equity ETF (Continued)
May 31, 2023
Fair Value Measurements
Various inputs are used in determining the value of the Fund’s investments. These inputs are summarized in three broad levels. Level 1 includes quoted prices in active markets for identical securities. Level 2 includes other significant observable inputs (including quoted prices for similar securities, interest rates, prepayment speeds and credit risk). Level 3 includes significant unobservable inputs (including the Fund’s own assumptions in determining the fair value of investments). The level assigned to the securities valuations may not be an indication of the risk or liquidity associated with investing in those securities.
The following is a summary of the inputs used as of May 31, 2023 in valuing the Fund’s investments. For information on the Fund’s policy regarding the valuation of investments, please refer to the Security Valuation section of Note 2 in the accompanying Notes to Financial Statements.
| Assets |
Level 1 | Level 2 | Level 3 | Total | ||||||||||||
| Common Stocks (a) |
$ | 8,272,564 | $ | — | $ | — | $ | 8,272,564 | ||||||||
| Preferred Stocks (a) |
528,475 | — | — | 528,475 | ||||||||||||
| Exchange-Traded Funds |
213,153 | — | — | 213,153 | ||||||||||||
| Short-Term Investments (a) |
1,145 | — | — | 1,145 | ||||||||||||
| Derivatives (b) |
||||||||||||||||
| Forward Foreign Currency Contracts |
— | 335,818 | — | 335,818 | ||||||||||||
| Futures Contracts |
2,644 | — | — | 2,644 | ||||||||||||
|
|
|
|
|
|
|
|
|
|||||||||
| TOTAL |
$ | 9,017,981 | $ | 335,818 | $ | — | $ | 9,353,799 | ||||||||
|
|
|
|
|
|
|
|
|
|||||||||
| Liabilities |
Level 1 | Level 2 | Level 3 | Total | ||||||||||||
| Derivatives (b) |
||||||||||||||||
| Forward Foreign Currency Contracts |
$ | — | $ | (25,155 | ) | $ | — | $ | (25,155 | ) | ||||||
|
|
|
|
|
|
|
|
|
|||||||||
| TOTAL |
$ | — | $ | (25,155 | ) | $ | — | $ | (25,155 | ) | ||||||
|
|
|
|
|
|
|
|
|
|||||||||
| (a) | See Schedule of Investments for additional detailed categorizations. |
| (b) | Derivatives include unrealized appreciation (depreciation) on open futures contracts and forward foreign currency contracts. |
| See Notes to Financial Statements. | 88 |
DBX ETF Trust
Schedule of Investments
Xtrackers MSCI Japan Hedged Equity ETF
May 31, 2023
| Number |
Value |
|||||||
| COMMON STOCKS — 98.0% | ||||||||
| Communication Services — 7.1% | ||||||||
| Capcom Co. Ltd. |
14,700 | $ | 573,967 | |||||
| CyberAgent, Inc. |
36,500 | 258,834 | ||||||
| Dentsu Group, Inc. |
16,936 | 544,578 | ||||||
| Hakuhodo DY Holdings, Inc. |
19,580 | 205,462 | ||||||
| KDDI Corp. |
127,015 | 3,911,870 | ||||||
| Koei Tecmo Holdings Co. Ltd. |
10,440 | 175,867 | ||||||
| Konami Group Corp. |
8,564 | 454,247 | ||||||
| Nexon Co. Ltd. |
33,164 | 677,443 | ||||||
| Nintendo Co. Ltd. |
88,210 | 3,758,224 | ||||||
| Nippon Telegraph & Telephone Corp. |
101,452 | 2,879,904 | ||||||
| SoftBank Corp. |
243,800 | 2,599,425 | ||||||
| SoftBank Group Corp. |
87,386 | 3,433,973 | ||||||
| Square Enix Holdings Co. Ltd. |
7,200 | 322,986 | ||||||
| Toho Co. Ltd. |
9,498 | 374,262 | ||||||
| Z Holdings Corp. |
226,828 | 565,096 | ||||||
|
|
|
|||||||
| (Cost $21,559,225) |
20,736,138 | |||||||
|
|
|
|||||||
| Consumer Discretionary — 18.0% | ||||||||
| Aisin Corp. |
12,523 | 360,432 | ||||||
| Bandai Namco Holdings, Inc. |
50,921 | 1,195,497 | ||||||
| Bridgestone Corp. (a) |
48,507 | 1,976,836 | ||||||
| Denso Corp. |
36,810 | 2,275,047 | ||||||
| Fast Retailing Co. Ltd. |
14,818 | 3,475,702 | ||||||
| Honda Motor Co. Ltd. |
130,645 | 3,755,487 | ||||||
| Iida Group Holdings Co. Ltd. |
13,466 | 222,686 | ||||||
| Isuzu Motors Ltd. |
49,495 | 576,924 | ||||||
| Koito Manufacturing Co. Ltd. |
17,444 | 328,284 | ||||||
| Mazda Motor Corp. |
48,304 | 413,960 | ||||||
| McDonald’s Holdings Co. Japan Ltd. |
7,419 | 305,120 | ||||||
| Nissan Motor Co. Ltd. |
197,047 | 739,536 | ||||||
| Nitori Holdings Co. Ltd. |
6,847 | 835,204 | ||||||
| Open House Group Co. Ltd. |
6,500 | 250,063 | ||||||
| Oriental Land Co. Ltd. |
92,625 | 3,474,975 | ||||||
| Pan Pacific International Holdings Corp. |
32,300 | 551,528 | ||||||
| Panasonic Holdings Corp. |
187,444 | 1,964,916 | ||||||
| Rakuten Group, Inc. (a) |
81,038 | 335,029 | ||||||
| Sekisui Chemical Co. Ltd. |
31,352 | 433,179 | ||||||
| Sekisui House Ltd. |
52,352 | 1,023,367 | ||||||
| Sharp Corp.* |
18,455 | 105,968 | ||||||
| Shimano, Inc. |
6,584 | 1,035,388 | ||||||
| Sony Group Corp. |
106,993 | 10,106,068 | ||||||
| Subaru Corp. |
52,217 | 899,111 | ||||||
| Sumitomo Electric Industries Ltd. |
60,613 | 719,569 | ||||||
| Suzuki Motor Corp. |
31,289 | 1,033,497 | ||||||
| Toyota Motor Corp. |
900,065 | 12,329,259 | ||||||
| USS Co. Ltd. |
17,418 | 283,664 | ||||||
| Yamaha Corp. |
11,907 | 472,605 | ||||||
| Yamaha Motor Co. Ltd. |
25,224 | 622,792 | ||||||
| ZOZO, Inc. |
10,334 | 210,945 | ||||||
|
|
|
|||||||
| (Cost $49,962,857) |
52,312,638 | |||||||
|
|
|
|||||||
| Consumer Staples — 6.5% | ||||||||
| Aeon Co. Ltd. |
55,502 | 1,099,483 | ||||||
| Ajinomoto Co., Inc. |
38,201 | 1,486,364 | ||||||
| Asahi Group Holdings Ltd. |
40,897 | 1,587,740 | ||||||
| Japan Tobacco, Inc. (a) |
101,889 | 2,223,166 | ||||||
| Number |
Value |
|||||||
| Consumer Staples (Continued) | ||||||||
| Kao Corp. |
39,584 | $ | 1,385,618 | |||||
| Kikkoman Corp. |
11,548 | 682,146 | ||||||
| Kirin Holdings Co. Ltd. |
65,889 | 983,428 | ||||||
| Kobayashi Pharmaceutical Co. Ltd. |
4,300 | 243,201 | ||||||
| Kobe Bussan Co. Ltd. |
12,800 | 353,246 | ||||||
| Kose Corp. |
2,788 | 280,151 | ||||||
| MatsukiyoCocokara & Co. |
9,700 | 520,072 | ||||||
| MEIJI Holdings Co. Ltd. |
18,686 | 419,119 | ||||||
| Nisshin Seifun Group, Inc. |
16,575 | 208,072 | ||||||
| Nissin Foods Holdings Co. Ltd. |
5,270 | 449,742 | ||||||
| Seven & i Holdings Co. Ltd. |
63,902 | 2,680,834 | ||||||
| Shiseido Co. Ltd. |
33,907 | 1,544,159 | ||||||
| Suntory Beverage & Food Ltd. |
11,836 | 435,806 | ||||||
| Unicharm Corp. |
34,274 | 1,306,016 | ||||||
| Welcia Holdings Co. Ltd. |
8,200 | 173,505 | ||||||
| Yakult Honsha Co. Ltd. |
10,938 | 710,489 | ||||||
|
|
|
|||||||
| (Cost $19,791,584) |
18,772,357 | |||||||
|
|
|
|||||||
| Energy — 0.7% | ||||||||
| ENEOS Holdings, Inc. |
244,537 | 814,041 | ||||||
| Idemitsu Kosan Co. Ltd. |
17,660 | 343,250 | ||||||
| Inpex Corp. |
82,344 | 874,711 | ||||||
|
|
|
|||||||
| (Cost $2,570,698) |
2,032,002 | |||||||
|
|
|
|||||||
| Financials — 10.9% | ||||||||
| Chiba Bank Ltd. |
44,960 | 281,071 | ||||||
| Concordia Financial Group Ltd. |
89,238 | 345,871 | ||||||
| Dai-ichi Life Holdings, Inc. |
80,219 | 1,378,679 | ||||||
| Daiwa Securities Group, Inc. |
113,244 | 514,505 | ||||||
| GMO Payment Gateway, Inc. |
3,600 | 284,744 | ||||||
| Japan Exchange Group, Inc. |
42,632 | 697,809 | ||||||
| Japan Post Bank Co. Ltd. |
125,225 | 935,648 | ||||||
| Japan Post Holdings Co. Ltd. |
186,270 | 1,316,223 | ||||||
| Japan Post Insurance Co. Ltd. |
16,800 | 252,859 | ||||||
| Mitsubishi HC Capital, Inc. |
74,616 | 405,414 | ||||||
| Mitsubishi UFJ Financial Group, Inc. |
969,142 | 6,486,452 | ||||||
| Mizuho Financial Group, Inc. |
204,777 | 3,017,457 | ||||||
| MS&AD Insurance Group Holdings, Inc. |
36,389 | 1,253,145 | ||||||
| Nomura Holdings, Inc. |
246,977 | 866,835 | ||||||
| ORIX Corp. |
99,527 | 1,696,942 | ||||||
| Resona Holdings, Inc. |
181,676 | 826,067 | ||||||
| SBI Holdings, Inc. |
20,199 | 378,391 | ||||||
| Shizuoka Financial Group, Inc. |
35,982 | 264,974 | ||||||
| Sompo Holdings, Inc. |
26,575 | 1,085,317 | ||||||
| Sumitomo Mitsui Financial Group, Inc. |
110,872 | 4,518,437 | ||||||
| Sumitomo Mitsui Trust Holdings, Inc. |
28,162 | 991,456 | ||||||
| T&D Holdings, Inc. |
42,049 | 574,033 | ||||||
| Tokio Marine Holdings, Inc. |
153,013 | 3,452,883 | ||||||
|
|
|
|||||||
| (Cost $31,474,814) |
31,825,212 | |||||||
|
|
|
|||||||
| Health Care — 9.4% | ||||||||
| Asahi Intecc Co. Ltd. |
17,900 | 341,105 | ||||||
| Astellas Pharma, Inc. |
153,635 | 2,434,231 | ||||||
| Chugai Pharmaceutical Co. Ltd. |
57,035 | 1,537,172 | ||||||
| Daiichi Sankyo Co. Ltd. |
156,983 | 5,115,398 | ||||||
| Eisai Co. Ltd. |
21,412 | 1,362,868 | ||||||
| Hoya Corp. |
30,286 | 3,818,221 | ||||||
| Kyowa Kirin Co. Ltd. |
22,960 | 441,649 | ||||||
| See Notes to Financial Statements. | 89 |
DBX ETF Trust
Schedule of Investments
Xtrackers MSCI Japan Hedged Equity ETF (Continued)
May 31, 2023
| Number |
Value |
|||||||
| Health Care (Continued) | ||||||||
| M3, Inc. |
37,484 | $ | 836,176 | |||||
| Nippon Shinyaku Co. Ltd. |
4,500 | 206,065 | ||||||
| Olympus Corp. |
102,076 | 1,551,379 | ||||||
| Ono Pharmaceutical Co. Ltd. |
32,883 | 615,649 | ||||||
| Otsuka Holdings Co. Ltd. |
33,100 | 1,228,970 | ||||||
| Shionogi & Co. Ltd. |
22,208 | 1,000,376 | ||||||
| Sysmex Corp. |
14,244 | 933,311 | ||||||
| Takeda Pharmaceutical Co. Ltd. |
134,323 | 4,262,279 | ||||||
| Terumo Corp. |
57,102 | 1,740,213 | ||||||
|
|
|
|||||||
| (Cost $26,331,590) |
27,425,062 | |||||||
|
|
|
|||||||
| Industrials — 22.4% | ||||||||
| AGC, Inc. (a) |
17,362 | 634,291 | ||||||
| ANA Holdings, Inc.* (a) |
13,618 | 302,514 | ||||||
| BayCurrent Consulting, Inc. |
11,200 | 410,781 | ||||||
| Central Japan Railway Co. |
12,252 | 1,493,632 | ||||||
| Dai Nippon Printing Co. Ltd. |
18,343 | 523,333 | ||||||
| Daifuku Co. Ltd. |
25,800 | 523,870 | ||||||
| Daikin Industries Ltd. |
22,348 | 4,260,275 | ||||||
| East Japan Railway Co. |
25,685 | 1,417,307 | ||||||
| FANUC Corp. |
81,445 | 2,804,759 | ||||||
| Fuji Electric Co. Ltd. |
10,806 | 455,275 | ||||||
| Hankyu Hanshin Holdings, Inc. |
19,440 | 618,815 | ||||||
| Hikari Tsushin, Inc. |
1,752 | 253,636 | ||||||
| Hitachi Construction Machinery Co. Ltd. |
9,020 | 223,355 | ||||||
| Hitachi Ltd. |
79,734 | 4,604,628 | ||||||
| Hoshizaki Corp. |
9,108 | 328,169 | ||||||
| ITOCHU Corp. |
100,888 | 3,418,570 | ||||||
| Japan Airlines Co. Ltd. |
11,954 | 228,741 | ||||||
| Kajima Corp. |
35,876 | 503,410 | ||||||
| Kawasaki Kisen Kaisha Ltd. |
11,700 | 263,266 | ||||||
| Keio Corp. |
8,636 | 304,344 | ||||||
| Keisei Electric Railway Co. Ltd. |
10,984 | 421,779 | ||||||
| Kintetsu Group Holdings Co. Ltd. |
15,410 | 510,441 | ||||||
| Komatsu Ltd. |
78,537 | 1,855,688 | ||||||
| Kubota Corp. |
85,963 | 1,188,952 | ||||||
| Kurita Water Industries Ltd. |
8,642 | 354,178 | ||||||
| Lixil Corp. |
24,316 | 314,149 | ||||||
| Makita Corp. |
19,044 | 516,679 | ||||||
| Marubeni Corp. |
129,787 | 1,855,630 | ||||||
| MINEBEA MITSUMI, Inc. |
30,824 | 594,909 | ||||||
| MISUMI Group, Inc. |
24,120 | 528,017 | ||||||
| Mitsubishi Corp. |
105,191 | 4,217,455 | ||||||
| Mitsubishi Electric Corp. |
164,026 | 2,141,491 | ||||||
| Mitsubishi Heavy Industries Ltd. |
27,202 | 1,153,095 | ||||||
| Mitsui & Co. Ltd. |
111,471 | 3,523,548 | ||||||
| Mitsui OSK Lines Ltd. (a) |
29,200 | 665,423 | ||||||
| MonotaRO Co. Ltd. |
20,800 | 289,625 | ||||||
| NGK Insulators Ltd. |
19,664 | 237,535 | ||||||
| Nidec Corp. |
35,390 | 1,762,832 | ||||||
| NIPPON EXPRESS HOLDINGS, Inc. |
6,139 | 345,009 | ||||||
| Nippon Yusen KK (a) |
41,136 | 877,637 | ||||||
| Obayashi Corp. |
55,108 | 444,582 | ||||||
| Odakyu Electric Railway Co. Ltd. |
24,977 | 364,280 | ||||||
| Persol Holdings Co. Ltd. |
15,100 | 285,689 | ||||||
| Recruit Holdings Co. Ltd. |
122,391 | 3,768,580 | ||||||
| Secom Co. Ltd. |
17,872 | 1,171,926 | ||||||
| Number |
Value |
|||||||
| Industrials (Continued) | ||||||||
| SG Holdings Co. Ltd. |
27,200 | $ | 399,825 | |||||
| Shimizu Corp. |
47,868 | 290,661 | ||||||
| SMC Corp. |
4,858 | 2,617,898 | ||||||
| Sumitomo Corp. |
95,573 | 1,808,564 | ||||||
| Taisei Corp. |
14,352 | 456,854 | ||||||
| Tobu Railway Co. Ltd. |
15,690 | 411,043 | ||||||
| Tokyu Corp. |
45,122 | 583,598 | ||||||
| TOPPAN, Inc. |
21,239 | 454,735 | ||||||
| Toshiba Corp. |
34,923 | 1,127,713 | ||||||
| TOTO Ltd. |
11,338 | 344,636 | ||||||
| Toyota Industries Corp. |
12,399 | 767,123 | ||||||
| Toyota Tsusho Corp. |
18,031 | 794,619 | ||||||
| West Japan Railway Co. |
18,679 | 783,090 | ||||||
| Yamato Holdings Co. Ltd. |
24,217 | 443,754 | ||||||
| Yaskawa Electric Corp. |
20,382 | 863,117 | ||||||
|
|
|
|||||||
| (Cost $60,590,259) |
65,109,330 | |||||||
|
|
|
|||||||
| Information Technology — 14.6% | ||||||||
| Advantest Corp. |
16,300 | 2,095,338 | ||||||
| Azbil Corp. |
9,900 | 313,716 | ||||||
| Brother Industries Ltd. |
19,722 | 286,505 | ||||||
| Canon, Inc. (a) |
84,897 | 2,108,943 | ||||||
| Disco Corp. |
7,800 | 1,139,279 | ||||||
| FUJIFILM Holdings Corp. |
31,657 | 1,938,842 | ||||||
| Fujitsu Ltd. |
14,888 | 1,893,525 | ||||||
| Hamamatsu Photonics KK |
11,888 | 606,666 | ||||||
| Hirose Electric Co. Ltd. |
2,566 | 348,457 | ||||||
| Ibiden Co. Ltd. |
9,600 | 525,046 | ||||||
| Itochu Techno-Solutions Corp. |
8,000 | 208,433 | ||||||
| Keyence Corp. |
16,543 | 8,050,353 | ||||||
| Kyocera Corp. |
27,208 | 1,547,824 | ||||||
| Lasertec Corp. |
6,400 | 994,509 | ||||||
| Murata Manufacturing Co. Ltd. |
48,745 | 2,868,547 | ||||||
| NEC Corp. |
20,793 | 977,528 | ||||||
| Nomura Research Institute Ltd. |
32,422 | 816,804 | ||||||
| NTT Data Corp. |
53,540 | 767,410 | ||||||
| Obic Co. Ltd. |
5,967 | 967,483 | ||||||
| Omron Corp. |
14,817 | 895,986 | ||||||
| Oracle Corp. (a) |
3,272 | 250,816 | ||||||
| Otsuka Corp. |
9,660 | 364,698 | ||||||
| Renesas Electronics Corp.* |
108,100 | 1,776,774 | ||||||
| Ricoh Co. Ltd. |
46,634 | 390,276 | ||||||
| Rohm Co. Ltd. |
7,412 | 628,284 | ||||||
| SCSK Corp. |
13,400 | 212,361 | ||||||
| Seiko Epson Corp. |
24,524 | 372,987 | ||||||
| Shimadzu Corp. |
20,136 | 624,350 | ||||||
| SUMCO Corp. |
29,700 | 424,423 | ||||||
| TDK Corp. |
32,984 | 1,264,199 | ||||||
| TIS, Inc. |
18,600 | 521,988 | ||||||
| Tokyo Electron Ltd. |
38,042 | 5,273,865 | ||||||
| Trend Micro, Inc. |
11,372 | 541,971 | ||||||
| Yokogawa Electric Corp. |
18,808 | 355,303 | ||||||
|
|
|
|||||||
| (Cost $34,870,462) |
42,353,489 | |||||||
|
|
|
|||||||
| Materials — 4.5% | ||||||||
| Asahi Kasei Corp. |
106,484 | 724,924 | ||||||
| JFE Holdings, Inc. |
41,719 | 516,229 | ||||||
| See Notes to Financial Statements. | 90 |
DBX ETF Trust
Schedule of Investments
Xtrackers MSCI Japan Hedged Equity ETF (Continued)
May 31, 2023
| Number |
Value |
|||||||
| Materials (Continued) | ||||||||
| JSR Corp. |
15,051 | $ | 363,514 | |||||
| Mitsubishi Chemical Group Corp. |
108,696 | 611,101 | ||||||
| Mitsui Chemicals, Inc. |
14,581 | 368,907 | ||||||
| Nippon Paint Holdings Co. Ltd. |
80,515 | 618,924 | ||||||
| Nippon Sanso Holdings Corp. |
14,780 | 303,397 | ||||||
| Nippon Steel Corp. |
68,537 | 1,335,814 | ||||||
| Nissan Chemical Corp. |
10,802 | 469,838 | ||||||
| Nitto Denko Corp. |
12,718 | 906,440 | ||||||
| Oji Holdings Corp. |
73,084 | 281,687 | ||||||
| Shin-Etsu Chemical Co. Ltd. |
154,655 | 4,769,801 | ||||||
| Sumitomo Chemical Co. Ltd. |
119,256 | 356,078 | ||||||
| Sumitomo Metal Mining Co. Ltd. |
21,005 | 637,726 | ||||||
| Toray Industries, Inc. |
117,742 | 622,999 | ||||||
| Tosoh Corp. |
22,100 | 254,588 | ||||||
|
|
|
|||||||
| (Cost $13,447,876) |
13,141,967 | |||||||
|
|
|
|||||||
| Real Estate — 2.9% | ||||||||
| Daito Trust Construction Co. Ltd. |
5,251 | 499,377 | ||||||
| Daiwa House Industry Co. Ltd. |
50,917 | 1,330,987 | ||||||
| Daiwa House REIT Investment Corp. REIT |
186 | 390,490 | ||||||
| GLP J REIT |
389 | 412,662 | ||||||
| Hulic Co. Ltd. |
32,610 | 272,208 | ||||||
| Japan Metropolitan Fund Invest REIT |
593 | 419,665 | ||||||
| Japan Real Estate Investment Corp. REIT |
111 | 422,250 | ||||||
| Mitsubishi Estate Co. Ltd. |
95,524 | 1,099,049 | ||||||
| Mitsui Fudosan Co. Ltd. |
76,482 | 1,461,571 | ||||||
| Nippon Building Fund, Inc. REIT |
130 | 520,653 | ||||||
| Nippon Prologis REIT, Inc. REIT (a) |
190 | 398,478 | ||||||
| Nomura Real Estate Holdings, Inc. |
9,228 | 223,539 | ||||||
| Nomura Real Estate Master Fund, Inc. REIT |
360 | 423,499 | ||||||
| Sumitomo Realty & Development Co. Ltd. |
24,250 | 586,386 | ||||||
|
|
|
|||||||
| (Cost $10,099,793) |
8,460,814 | |||||||
|
|
|
|||||||
| Number |
Value |
|||||||
| Utilities — 1.0% | ||||||||
| Chubu Electric Power Co., Inc. |
54,634 | $ | 652,118 | |||||
| Kansai Electric Power Co., Inc. |
59,707 | 683,958 | ||||||
| Osaka Gas Co. Ltd. |
31,789 | 504,015 | ||||||
| Tokyo Electric Power Co. Holdings, Inc.* |
129,584 | 447,371 | ||||||
| Tokyo Gas Co. Ltd. |
33,265 | 708,873 | ||||||
|
|
|
|||||||
| (Cost $3,233,670) |
2,996,335 | |||||||
|
|
|
|||||||
| TOTAL COMMON STOCKS |
285,165,344 | |||||||
|
|
|
|||||||
| EXCHANGE-TRADED FUNDS — 0.2% | ||||||||
| iShares Currency Hedged MSCI Japan ETF |
6,774 | 209,249 | ||||||
| iShares MSCI Japan ETF |
5,200 | 308,568 | ||||||
|
|
|
|||||||
| (Cost $486,603) |
517,817 | |||||||
|
|
|
|||||||
| SECURITIES LENDING COLLATERAL — 1.3% | ||||||||
| DWS Government & Agency Securities Portfolio “DWS Government Cash Institutional Shares”,
5.03% (b)(c) |
3,785,348 | 3,785,348 | ||||||
|
|
|
|||||||
| CASH EQUIVALENTS — 1.5% | ||||||||
| DWS ESG Liquidity Fund “Capital Shares”, 5.20% (b) |
122,281 | 122,244 | ||||||
| DWS Government Money Market Series “Institutional Shares”, 5.04% (b) |
4,433,180 | 4,433,180 | ||||||
|
|
|
|||||||
| TOTAL CASH EQUIVALENTS |
4,555,424 | |||||||
|
|
|
|||||||
| TOTAL INVESTMENTS — 101.0% |
$ | 294,023,933 | ||||||
| Other assets and liabilities, net — (1.0%) |
(3,014,029 | ) | ||||||
|
|
|
|||||||
| NET ASSETS — 100.0% |
$ | 291,009,904 | ||||||
|
|
|
|||||||
A summary of the Fund’s transactions with affiliated investments during the year ended May 31, 2023 is as follows:
| Value ($) at 5/31/2022 |
Purchases Cost ($) |
Sales Proceeds ($) |
Net Realized Gain/(Loss) ($) |
Net Change in Unrealized Appreciation (Depreciation) ($) |
Income ($) |
Capital Gain Distributions ($) |
Number of Shares at 5/31/2023 |
Value ($) at 5/31/2023 |
||||||||||||||||||||||||||||
| SECURITIES LENDING COLLATERAL — 1.3% |
| |||||||||||||||||||||||||||||||||||
| DWS Government & Agency Securities Portfolio “DWS Government Cash Institutional Shares”, 5.03% (b)(c) |
| |||||||||||||||||||||||||||||||||||
| 466,150 | 3,319,198 | (d) | — | — | — | 49,220 | — | 3,785,348 | 3,785,348 | |||||||||||||||||||||||||||
| CASH EQUIVALENTS — 1.5% |
| |||||||||||||||||||||||||||||||||||
| DWS ESG Liquidity Fund “Capital Shares”, 5.20% (b) |
| |||||||||||||||||||||||||||||||||||
| 117,904 | 4,306 | — | — | 34 | 4,319 | — | 122,281 | 122,244 | ||||||||||||||||||||||||||||
| DWS Government Money Market Series “Institutional Shares”, 5.04% (b) |
| |||||||||||||||||||||||||||||||||||
| — | 120,407,158 | (115,973,978 | ) | — | — | 163,012 | — | 4,433,180 | 4,433,180 | |||||||||||||||||||||||||||
|
|
|
|
|
|
|
|
|
|
|
|
|
|
|
|
|
|
|
|||||||||||||||||||
| 584,054 | 123,730,662 | (115,973,978 | ) | — | 34 | 216,551 | — | 8,340,809 | 8,340,772 | |||||||||||||||||||||||||||
|
|
|
|
|
|
|
|
|
|
|
|
|
|
|
|
|
|
|
|||||||||||||||||||
| * | Non-income producing security. |
| (a) | All or a portion of these securities were on loan. In addition, “Other assets and liabilities, net” may include pending sales that are also on loan. The value of securities loaned at May 31, 2023 amounted to $6,967,565, which is 2.4% of net assets. |
| See Notes to Financial Statements. | 91 |
DBX ETF Trust
Schedule of Investments
Xtrackers MSCI Japan Hedged Equity ETF (Continued)
May 31, 2023
| (b) | Affiliated fund managed by DWS Investment Management Americas, Inc. The rate shown is the annualized seven-day yield at period end. |
| (c) | Represents cash collateral held in connection with securities lending. Income earned by the Fund is net of borrower rebates. In addition, the Fund held non-cash U.S. Treasury securities collateral having a value of $3,616,115. |
| (d) | Represents the net increase (purchase cost) or decrease (sales proceeds) in the amount invested in cash collateral for the year ended May 31, 2023. |
REIT: Real Estate Investment Trust
At May 31, 2023, open futures contracts purchased were as follows:
| Contract Description |
Currency | Number of Contracts |
Notional Amount |
Contract Value |
Expiration Date |
Unrealized Appreciation |
||||||||||||
| Nikkei 225 Futures |
JPY | 4 | $ | 785,889 | $ | 885,699 | 6/08/2023 | $ | 99,810 | |||||||||
| TOPIX Index Futures |
JPY | 39 | 5,532,103 | 5,951,121 | 6/08/2023 | 419,018 | ||||||||||||
|
|
|
|||||||||||||||||
| Total unrealized appreciation |
$ | 518,828 | ||||||||||||||||
|
|
|
|||||||||||||||||
As of May 31, 2023, the Fund had the following forward foreign currency contracts outstanding:
| Counterparty |
Settlement Date |
Currency To Deliver |
Currency To Receive |
Unrealized Appreciation |
Unrealized Depreciation |
|||||||||||||||||
| Goldman Sachs & Co. |
6/2/2023 | JPY | 9,234,567,100 | USD | 68,134,187 | $ | 1,853,426 | $ | — | |||||||||||||
| Goldman Sachs & Co. |
6/2/2023 | JPY | 1,971,748,000 | USD | 14,547,673 | 395,525 | — | |||||||||||||||
| Goldman Sachs & Co. |
6/2/2023 | JPY | 16,000,000 | USD | 117,017 | 2,178 | — | |||||||||||||||
| Goldman Sachs & Co. |
6/2/2023 | JPY | 1,086,518,200 | USD | 7,932,295 | 133,851 | — | |||||||||||||||
| Goldman Sachs & Co. |
6/2/2023 | JPY | 362,172,700 | USD | 2,628,555 | 29,074 | — | |||||||||||||||
| JP Morgan & Chase Co. |
6/2/2023 | JPY | 9,520,181,100 | USD | 70,241,755 | 1,911,009 | — | |||||||||||||||
| JP Morgan & Chase Co. |
6/2/2023 | JPY | 362,172,700 | USD | 2,616,600 | 17,119 | — | |||||||||||||||
| JP Morgan & Chase Co. |
6/2/2023 | JPY | 724,345,500 | USD | 5,232,126 | 33,163 | — | |||||||||||||||
| RBC Capital Markets |
6/2/2023 | JPY | 13,663,914,100 | USD | 100,814,654 | 2,742,419 | — | |||||||||||||||
| Goldman Sachs & Co. |
6/2/2023 | USD | 90,691,808 | JPY | 12,671,006,000 | 253,865 | — | |||||||||||||||
| JP Morgan & Chase Co. |
6/2/2023 | USD | 75,916,683 | JPY | 10,606,699,300 | 212,507 | — | |||||||||||||||
| RBC Capital Markets |
6/2/2023 | USD | 97,798,476 | JPY | 13,663,914,100 | 273,759 | — | |||||||||||||||
| Goldman Sachs & Co. |
7/5/2023 | JPY | 12,671,006,000 | USD | 91,158,317 | — | (294,239 | ) | ||||||||||||||
| JP Morgan & Chase Co. |
7/5/2023 | JPY | 10,606,699,300 | USD | 76,307,189 | — | (246,302 | ) | ||||||||||||||
| JP Morgan & Chase Co. |
7/5/2023 | JPY | 3,784,227,000 | USD | 27,224,243 | — | (88,286 | ) | ||||||||||||||
| RBC Capital Markets |
7/5/2023 | JPY | 13,663,914,100 | USD | 98,301,187 | — | (317,649 | ) | ||||||||||||||
|
|
|
|
|
|||||||||||||||||||
| Total unrealized appreciation (depreciation) |
$ | 7,857,895 | $ | (946,476 | ) | |||||||||||||||||
|
|
|
|
|
|||||||||||||||||||
For information on the Fund’s policy and additional disclosures regarding futures contracts and forward foreign currency contracts, please refer to the Derivatives section of Note 2 in the accompanying Notes to Financial Statements.
Currency Abbreviations
| JPY | Japanese Yen |
| USD | U.S. Dollar |
| See Notes to Financial Statements. | 92 |
DBX ETF Trust
Schedule of Investments
Xtrackers MSCI Japan Hedged Equity ETF (Continued)
May 31, 2023
Fair Value Measurements
Various inputs are used in determining the value of the Fund’s investments. These inputs are summarized in three broad levels. Level 1 includes quoted prices in active markets for identical securities. Level 2 includes other significant observable inputs (including quoted prices for similar securities, interest rates, prepayment speeds and credit risk). Level 3 includes significant unobservable inputs (including the Fund’s own assumptions in determining the fair value of investments). The level assigned to the securities valuations may not be an indication of the risk or liquidity associated with investing in those securities.
The following is a summary of the inputs used as of May 31, 2023 in valuing the Fund’s investments. For information on the Fund’s policy regarding the valuation of investments, please refer to the Security Valuation section of Note 2 in the accompanying Notes to Financial Statements.
| Assets |
Level 1 | Level 2 | Level 3 | Total | ||||||||||||
| Common Stocks (a) |
$ | 285,165,344 | $ | — | $ | — | $ | 285,165,344 | ||||||||
| Exchange-Traded Funds |
517,817 | — | — | 517,817 | ||||||||||||
| Short-Term Investments (a) |
8,340,772 | — | — | 8,340,772 | ||||||||||||
| Derivatives (b) |
||||||||||||||||
| Forward Foreign Currency Contracts |
— | 7,857,895 | — | 7,857,895 | ||||||||||||
| Futures Contracts |
518,828 | — | — | 518,828 | ||||||||||||
|
|
|
|
|
|
|
|
|
|||||||||
| TOTAL |
$ | 294,542,761 | $ | 7,857,895 | $ | — | $ | 302,400,656 | ||||||||
|
|
|
|
|
|
|
|
|
|||||||||
| Liabilities |
Level 1 | Level 2 | Level 3 | Total | ||||||||||||
| Derivatives (b) |
||||||||||||||||
| Forward Foreign Currency Contracts |
$ | — | $ | (946,476 | ) | $ | — | $ | (946,476 | ) | ||||||
|
|
|
|
|
|
|
|
|
|||||||||
| TOTAL |
$ | — | $ | (946,476 | ) | $ | — | $ | (946,476 | ) | ||||||
|
|
|
|
|
|
|
|
|
|||||||||
| (a) | See Schedule of Investments for additional detailed categorizations. |
| (b) | Derivatives include unrealized appreciation (depreciation) on open futures contracts and forward foreign currency contracts. |
| See Notes to Financial Statements. | 93 |
DBX ETF Trust
May 31, 2023
| Xtrackers MSCI All World ex US Hedged Equity ETF |
Xtrackers MSCI Emerging Markets Hedged Equity ETF |
Xtrackers MSCI Europe Hedged Equity ETF |
Xtrackers MSCI Eurozone Hedged Equity ETF |
|||||||||||||
| Assets |
||||||||||||||||
| Investment in non-affiliated securities at value |
$ | 128,878,954 | $ | 87,675,272 | $ | 447,376,500 | $ | 27,322,806 | ||||||||
| Investment in affiliated securities at value |
112,988 | — | 897,775 | 100,569 | ||||||||||||
| Investment in DWS ESG Liquidity Fund |
— | — | 664,743 | — | ||||||||||||
| Investment in DWS Government Money Market Series* |
2,327,718 | 912,728 | 1,116,927 | 8,289 | ||||||||||||
| Investment in DWS Government & Agency Securities Portfolio** |
2,996,484 | 179,111 | 15,074,264 | 1,477,246 | ||||||||||||
| Cash |
21 | 76 | 159 | — | ||||||||||||
| Foreign currency at value |
600,915 | 219,003 | 3,782,053 | 107,425 | ||||||||||||
| Receivable for return of collateral pledged for forward foreign currency contracts |
110,000 | 10,000 | — | — | ||||||||||||
| Unrealized appreciation on forward foreign currency contracts |
2,951,993 | 825,720 | 14,836,042 | 1,010,385 | ||||||||||||
| Deposit with broker for futures contracts |
143,285 | 45,390 | 866,073 | 14,160 | ||||||||||||
| Receivables: | ||||||||||||||||
| Investment securities sold |
681,453 | 1,667,079 | 2,706,478 | 49,896 | ||||||||||||
| Dividends |
452,222 | 168,087 | 1,282,338 | 75,958 | ||||||||||||
| Interest |
10,587 | 4,636 | 7,114 | 59 | ||||||||||||
| Securities lending income |
5,887 | 598 | 37,001 | 4,004 | ||||||||||||
| Foreign tax reclaim |
178,383 | — | 1,987,074 | 20,145 | ||||||||||||
|
|
|
|
|
|
|
|
|
|||||||||
| Total assets |
$ | 139,450,890 | $ | 91,707,700 | $ | 490,634,541 | $ | 30,190,942 | ||||||||
|
|
|
|
|
|
|
|
|
|||||||||
| Liabilities |
||||||||||||||||
| Payable upon return of securities loaned |
$ | 2,996,484 | $ | 179,111 | $ | 15,074,264 | $ | 1,477,246 | ||||||||
| Payable upon return of deposit for forward foreign currency contracts |
— | 70,000 | — | — | ||||||||||||
| Unrealized depreciation on forward foreign currency contracts |
454,850 | 381,026 | 1,539,121 | 77,797 | ||||||||||||
| Payables: | ||||||||||||||||
| Investment securities purchased |
2,903,577 | 1,887,506 | 14,594,089 | 1,057,331 | ||||||||||||
| Investment advisory fees |
45,664 | 49,541 | 181,216 | 10,728 | ||||||||||||
| Variation margin on futures contracts |
47,745 | 14,773 | 286,903 | 3,038 | ||||||||||||
| Deferred foreign tax |
103,537 | 336,261 | — | — | ||||||||||||
| IRS closing agreements fee |
— | — | 255,300 | — | ||||||||||||
| Accrued other expenses |
— | — | 20,000 | — | ||||||||||||
|
|
|
|
|
|
|
|
|
|||||||||
| Total liabilities |
6,551,857 | 2,918,218 | 31,950,893 | 2,626,140 | ||||||||||||
|
|
|
|
|
|
|
|
|
|||||||||
| Net Assets, at value |
$ | 132,899,033 | $ | 88,789,482 | $ | 458,683,648 | $ | 27,564,802 | ||||||||
|
|
|
|
|
|
|
|
|
|||||||||
| Net Assets Consist of |
||||||||||||||||
| Paid-in capital |
$ | 135,613,524 | $ | 102,374,503 | $ | 575,345,859 | $ | 28,153,161 | ||||||||
| Distributable earnings (loss) |
(2,714,491 | ) | (13,585,021 | ) | (116,662,211 | ) | (588,359 | ) | ||||||||
|
|
|
|
|
|
|
|
|
|||||||||
| Net Assets, at value |
$ | 132,899,033 | $ | 88,789,482 | $ | 458,683,648 | $ | 27,564,802 | ||||||||
|
|
|
|
|
|
|
|
|
|||||||||
| Number of Common Shares outstanding |
4,600,001 | 4,050,001 | 12,550,001 | 700,001 | ||||||||||||
|
|
|
|
|
|
|
|
|
|||||||||
| Net Asset Value |
$ | 28.89 | $ | 21.92 | $ | 36.55 | $ | 39.38 | ||||||||
|
|
|
|
|
|
|
|
|
|||||||||
| Investment in non-affiliated securities at cost |
$ | 119,117,376 | $ | 77,959,481 | $ | 488,047,899 | $ | 27,260,279 | ||||||||
|
|
|
|
|
|
|
|
|
|||||||||
| Investment in affiliated securities at cost |
$ | 137,317 | $ | — | $ | 2,297,392 | $ | 183,033 | ||||||||
|
|
|
|
|
|
|
|
|
|||||||||
| Value of securities loaned |
$ | 4,764,797 | $ | 1,005,478 | $ | 22,377,388 | $ | 2,252,295 | ||||||||
|
|
|
|
|
|
|
|
|
|||||||||
| Investment in DWS ESG Liquidity Fund at cost |
$ | — | $ | — | $ | 664,942 | $ | — | ||||||||
|
|
|
|
|
|
|
|
|
|||||||||
| Investment in DWS Government Money Market Series at cost* |
$ | 2,327,718 | $ | 912,728 | $ | 1,116,927 | $ | 8,289 | ||||||||
|
|
|
|
|
|
|
|
|
|||||||||
| Investment in DWS Government & Agency Securities Portfolio at cost** |
$ | 2,996,484 | $ | 179,111 | $ | 15,074,264 | $ | 1,477,246 | ||||||||
|
|
|
|
|
|
|
|
|
|||||||||
| Non-cash collateral for securities on loan |
$ | 2,372,391 | $ | 912,877 | $ | 11,497,216 | $ | 954,601 | ||||||||
|
|
|
|
|
|
|
|
|
|||||||||
| Foreign currency at cost |
$ | 610,018 | $ | 227,237 | $ | 3,856,153 | $ | 108,133 | ||||||||
|
|
|
|
|
|
|
|
|
|||||||||
| * Includes collateral held for forward foreign currency contracts |
$ | — | $ | 70,000 | $ | — | $ | — | ||||||||
|
|
|
|
|
|
|
|
|
|||||||||
| ** | Represents collateral on securities loaned. |
| See Notes to Financial Statements. | 94 |
DBX ETF Trust
Statements of Assets and Liabilities (Continued)
May 31, 2023
| Xtrackers MSCI Germany Hedged Equity ETF |
Xtrackers MSCI Japan Hedged Equity ETF |
|||||||
| Assets |
||||||||
| Investment in non-affiliated securities at value |
$ | 8,878,576 | $ | 285,683,161 | ||||
| Investment in affiliated securities at value |
135,616 | — | ||||||
| Investment in DWS ESG Liquidity Fund |
— | 122,244 | ||||||
| Investment in DWS Government Money Market Series |
1,145 | 4,433,180 | ||||||
| Investment in DWS Government & Agency Securities Portfolio* |
— | 3,785,348 | ||||||
| Cash |
— | 548 | ||||||
| Foreign currency at value |
56,281 | 399,829 | ||||||
| Unrealized appreciation on forward foreign currency contracts |
335,818 | 7,857,895 | ||||||
| Deposit with broker for futures contracts |
19,516 | 274,812 | ||||||
| Receivables: | ||||||||
| Investment securities sold |
33,352 | 1,845,450 | ||||||
| Dividends |
4,457 | 2,216,277 | ||||||
| Interest |
51 | 16,228 | ||||||
| Securities lending income |
5 | 1,982 | ||||||
| Foreign tax reclaim |
27,274 | 86,947 | ||||||
|
|
|
|
|
|||||
| Total assets |
$ | 9,492,091 | $ | 306,723,901 | ||||
|
|
|
|
|
|||||
| Liabilities |
||||||||
| Payable upon return of securities loaned |
$ | — | $ | 3,785,348 | ||||
| Unrealized depreciation on forward foreign currency contracts |
25,155 | 946,476 | ||||||
| Payables: | ||||||||
| Investment securities purchased |
204,727 | 10,765,046 | ||||||
| Investment advisory fees |
3,570 | 105,911 | ||||||
| Variation margin on futures contracts |
14,289 | 111,216 | ||||||
|
|
|
|
|
|||||
| Total liabilities |
247,741 | 15,713,997 | ||||||
|
|
|
|
|
|||||
| Net Assets, at value |
$ | 9,244,350 | $ | 291,009,904 | ||||
|
|
|
|
|
|||||
| Net Assets Consist of |
||||||||
| Paid-in capital |
$ | 17,396,785 | $ | 404,612,497 | ||||
| Distributable earnings (loss) |
(8,152,435 | ) | (113,602,593 | ) | ||||
|
|
|
|
|
|||||
| Net Assets, at value |
$ | 9,244,350 | $ | 291,009,904 | ||||
|
|
|
|
|
|||||
| Number of Common Shares outstanding |
300,001 | 5,100,001 | ||||||
|
|
|
|
|
|||||
| Net Asset Value |
$ | 30.81 | $ | 57.06 | ||||
|
|
|
|
|
|||||
| Investment in non-affiliated securities at cost |
$ | 9,395,340 | $ | 274,419,431 | ||||
|
|
|
|
|
|||||
| Investment in affiliated securities at cost |
$ | 415,420 | $ | — | ||||
|
|
|
|
|
|||||
| Value of securities loaned |
$ | — | $ | 6,967,565 | ||||
|
|
|
|
|
|||||
| Investment in DWS ESG Liquidity Fund at cost |
$ | — | $ | 122,279 | ||||
|
|
|
|
|
|||||
| Investment in DWS Government Money Market Series at cost |
$ | 1,145 | $ | 4,433,180 | ||||
|
|
|
|
|
|||||
| Investment in DWS Government & Agency Securities Portfolio at cost* |
$ | — | $ | 3,785,348 | ||||
|
|
|
|
|
|||||
| Non-cash collateral for securities on loan |
$ | — | $ | 3,616,115 | ||||
|
|
|
|
|
|||||
| Foreign currency at cost |
$ | 56,944 | $ | 401,283 | ||||
|
|
|
|
|
|||||
| * | Represents collateral on securities loaned. |
| See Notes to Financial Statements. | 95 |
DBX ETF Trust
For the Year Ended May 31, 2023
| Xtrackers MSCI All World ex US Hedged Equity ETF |
Xtrackers MSCI Emerging Markets Hedged Equity ETF |
Xtrackers MSCI Europe Hedged Equity ETF |
Xtrackers MSCI Eurozone Hedged Equity ETF |
|||||||||||||
| Investment Income |
||||||||||||||||
| Unaffiliated dividend income*,** |
$ | 4,172,026 | $ | 2,666,751 | $ | 16,900,580 | $ | 630,987 | ||||||||
| Affiliated dividend income |
3,605 | — | 29,744 | 3,209 | ||||||||||||
| Income distributions from affiliated funds |
91,329 | 35,427 | 267,347 | 1,932 | ||||||||||||
| Affiliated securities lending income |
24,460 | 9,322 | 117,775 | 9,158 | ||||||||||||
| Other income |
— | — | 262,488 | — | ||||||||||||
|
|
|
|
|
|
|
|
|
|||||||||
| Total investment income† |
4,291,420 | 2,711,500 | 17,577,934 | 645,286 | ||||||||||||
|
|
|
|
|
|
|
|
|
|||||||||
| Expenses |
||||||||||||||||
| Investment advisory fees |
538,523 | 588,824 | 2,237,736 | 70,718 | ||||||||||||
| Interest expense (see note 2): |
14,887 | 9,023 | 63,197 | 263 | ||||||||||||
| Other expenses |
3,650 | 403 | 82,612 | 289 | ||||||||||||
|
|
|
|
|
|
|
|
|
|||||||||
| Total expenses |
557,060 | 598,250 | 2,383,545 | 71,270 | ||||||||||||
|
|
|
|
|
|
|
|
|
|||||||||
| Less fees waived (see note 3): |
||||||||||||||||
| Waiver |
(1,633 | ) | (597 | ) | (4,951 | ) | (27 | ) | ||||||||
|
|
|
|
|
|
|
|
|
|||||||||
| Net expenses |
555,427 | 597,653 | 2,378,594 | 71,243 | ||||||||||||
|
|
|
|
|
|
|
|
|
|||||||||
| Net investment income (loss) |
3,735,993 | 2,113,847 | 15,199,340 | 574,043 | ||||||||||||
|
|
|
|
|
|
|
|
|
|||||||||
| Realized and Unrealized Gain (Loss) |
||||||||||||||||
| Net realized gain (loss) from: |
||||||||||||||||
| Investments*** |
(8,494,294 | ) | (3,309,942 | ) | (23,507,144 | ) | (453,885 | ) | ||||||||
| Investments in affiliates |
(20,844 | ) | — | (217,362 | ) | (11,080 | ) | |||||||||
| In-kind redemptions |
2,609,462 | 727,366 | 33,074,951 | 297,623 | ||||||||||||
| In-kind redemptions in affiliates |
2,538 | — | (62,752 | ) | (470 | ) | ||||||||||
| Futures contracts |
44,780 | (22,349 | ) | 596,849 | 14,871 | |||||||||||
| Foreign currency transactions |
(47,414 | ) | (61,320 | ) | (59,625 | ) | (749 | ) | ||||||||
| Forward foreign currency contracts |
2,929,910 | 2,190,323 | (5,975,102 | ) | (577,215 | ) | ||||||||||
| Payments by Affiliates (see note 6) |
— | — | 48 | — | ||||||||||||
|
|
|
|
|
|
|
|
|
|||||||||
| Net realized gain (loss) |
(2,975,862 | ) | (475,922 | ) | 3,849,863 | (730,905 | ) | |||||||||
|
|
|
|
|
|
|
|
|
|||||||||
| Net change in unrealized appreciation (depreciation) on: |
||||||||||||||||
| Investments**** |
393,160 | (7,461,189 | ) | (2,951,251 | ) | 128,438 | ||||||||||
| Investments in affiliates |
10,391 | — | 128,493 | (4,929 | ) | |||||||||||
| Futures contracts |
(68,845 | ) | (37,365 | ) | (326,572 | ) | (8,148 | ) | ||||||||
| Foreign currency translations |
(20,055 | ) | (26,028 | ) | (88,930 | ) | 365 | |||||||||
| Forward foreign currency contracts |
3,833,757 | 1,041,313 | 19,280,471 | 1,140,897 | ||||||||||||
|
|
|
|
|
|
|
|
|
|||||||||
| Net change in unrealized appreciation (depreciation) |
4,148,408 | (6,483,269 | ) | 16,042,211 | 1,256,623 | |||||||||||
|
|
|
|
|
|
|
|
|
|||||||||
| Net realized and unrealized gain (loss) on investments, futures and foreign currency transactions |
1,172,546 | (6,959,191 | ) | 19,892,074 | 525,718 | |||||||||||
|
|
|
|
|
|
|
|
|
|||||||||
| Net Increase (Decrease) in Net Assets Resulting from Operations |
$ | 4,908,539 | $ | (4,845,344 | ) | $ | 35,091,414 | $ | 1,099,761 | |||||||
|
|
|
|
|
|
|
|
|
|||||||||
| * Unaffiliated foreign tax withheld |
$ | 481,708 | $ | 346,283 | $ | 1,792,108 | $ | 110,458 | ||||||||
| ** Net of IRS Closing Agreement Fee |
$ | — | $ | — | $ | 255,300 | $ | — | ||||||||
| *** Including foreign taxes |
$ | 59,327 | $ | 50,666 | $ | — | $ | — | ||||||||
| **** Including (Net of) change in deferred foreign taxes |
$ | (8,442 | ) | $ | 56,037 | $ | — | $ | — | |||||||
| † | Total investment income includes $1,589,864 of non-recurring foreign dividend reclaims and $262,488 of non-recurring related interest which are included in Unaffiliated dividend income and Other income, respectively for Xtrackers MSCI Europe Hedged Equity ETF. |
| See Notes to Financial Statements. | 96 |
DBX ETF Trust
Statements of Operations (Continued)
For the Year Ended May 31, 2023
| Xtrackers MSCI Germany Hedged Equity ETF |
Xtrackers MSCI Japan Hedged Equity ETF |
|||||||
| Investment Income |
||||||||
| Unaffiliated dividend income* |
$ | 274,804 | $ | 5,298,893 | ||||
| Affiliated dividend income |
4,536 | — | ||||||
| Income distributions from affiliated funds |
966 | 167,331 | ||||||
| Affiliated securities lending income |
47 | 49,220 | ||||||
|
|
|
|
|
|||||
| Total investment income |
280,353 | 5,515,444 | ||||||
|
|
|
|
|
|||||
| Expenses |
||||||||
| Investment advisory fees |
38,411 | 1,017,205 | ||||||
| Interest expense (see note 2): |
— | 31,186 | ||||||
| Other expenses |
173 | 2,825 | ||||||
|
|
|
|
|
|||||
| Total expenses |
38,584 | 1,051,216 | ||||||
|
|
|
|
|
|||||
| Less fees waived (see note 3): |
||||||||
| Waiver |
(160 | ) | (2,792 | ) | ||||
|
|
|
|
|
|||||
| Net expenses |
38,424 | 1,048,424 | ||||||
|
|
|
|
|
|||||
| Net investment income (loss) |
241,929 | 4,467,020 | ||||||
|
|
|
|
|
|||||
| Realized and Unrealized Gain (Loss) |
||||||||
| Net realized gain (loss) from: | ||||||||
| Investments |
(680,773 | ) | (12,169,311 | ) | ||||
| Investments in affiliates |
(68,657 | ) | — | |||||
| In-kind redemptions |
(16,368 | ) | 3,397,969 | |||||
| In-kind redemptions in affiliates |
(19,327 | ) | — | |||||
| Futures contracts |
2,938 | 746,219 | ||||||
| Foreign currency transactions |
(5,616 | ) | (101,668 | ) | ||||
| Forward foreign currency contracts |
(178,382 | ) | 13,411,556 | |||||
|
|
|
|
|
|||||
| Net realized gain (loss) |
(966,185 | ) | 5,284,765 | |||||
|
|
|
|
|
|||||
| Net change in unrealized appreciation (depreciation) on: |
||||||||
| Investments |
850,221 | 21,120,362 | ||||||
| Investments in affiliates |
69,611 | 34 | ||||||
| Futures contracts |
(9 | ) | 482,857 | |||||
| Foreign currency translations |
(1,384 | ) | (42,049 | ) | ||||
| Forward foreign currency contracts |
475,099 | 8,001,303 | ||||||
|
|
|
|
|
|||||
| Net change in unrealized appreciation (depreciation) |
1,393,538 | 29,562,507 | ||||||
|
|
|
|
|
|||||
| Net realized and unrealized gain (loss) on investments, futures and foreign currency transactions |
427,353 | 34,847,272 | ||||||
|
|
|
|
|
|||||
| Net Increase (Decrease) in Net Assets Resulting from Operations |
$ | 669,282 | $ | 39,314,292 | ||||
|
|
|
|
|
|||||
| * Unaffiliated foreign tax withheld |
$ | 45,053 | $ | 594,683 | ||||
| See Notes to Financial Statements. | 97 |
DBX ETF Trust
| Xtrackers MSCI All World ex US Hedged Equity ETF |
Xtrackers MSCI Emerging Markets Hedged Equity ETF |
|||||||||||||||
| Year Ended May 31, 2023 |
Year Ended May 31, 2022 |
Year Ended May 31, 2023 |
Year Ended May 31, 2022 |
|||||||||||||
| Increase (Decrease) in Net Assets from Operations |
||||||||||||||||
| Net investment income (loss) |
$ | 3,735,993 | $ | 3,790,573 | $ | 2,113,847 | $ | 2,206,226 | ||||||||
| Net realized gain (loss) |
(2,975,862 | ) | 11,166,776 | (475,922 | ) | 2,104,464 | ||||||||||
| Net change in net unrealized appreciation (depreciation) |
4,148,408 | (20,502,502 | ) | (6,483,269 | ) | (25,281,095 | ) | |||||||||
|
|
|
|
|
|
|
|
|
|||||||||
| Net increase (decrease) in net assets resulting from operations |
4,908,539 | (5,545,153 | ) | (4,845,344 | ) | (20,970,405 | ) | |||||||||
|
|
|
|
|
|
|
|
|
|||||||||
| Distributions to Shareholders |
(16,652,096 | ) | (2,755,823 | ) | (2,355,448 | ) | (1,932,852 | ) | ||||||||
|
|
|
|
|
|
|
|
|
|||||||||
| Fund Shares Transactions |
||||||||||||||||
| Proceeds from shares sold |
— | 38,846,234 | 5,375,253 | 10,392,890 | ||||||||||||
| Value of shares redeemed |
(11,041,632 | ) | — | (6,843,163 | ) | (7,486,062 | ) | |||||||||
|
|
|
|
|
|
|
|
|
|||||||||
| Net increase (decrease) in net assets resulting from fund share transactions |
(11,041,632 | ) | 38,846,234 | (1,467,910 | ) | 2,906,828 | ||||||||||
|
|
|
|
|
|
|
|
|
|||||||||
| Total net increase (decrease) in Net Assets |
(22,785,189 | ) | 30,545,258 | (8,668,702 | ) | (19,996,429 | ) | |||||||||
| Net Assets |
||||||||||||||||
| Beginning of year |
155,684,222 | 125,138,964 | 97,458,184 | 117,454,613 | ||||||||||||
|
|
|
|
|
|
|
|
|
|||||||||
| End of year |
$ | 132,899,033 | $ | 155,684,222 | $ | 88,789,482 | $ | 97,458,184 | ||||||||
|
|
|
|
|
|
|
|
|
|||||||||
| Changes in Shares Outstanding |
||||||||||||||||
| Shares outstanding, beginning of year |
4,950,001 | 3,750,001 | 4,100,800 | 4,000,800 | ||||||||||||
| Shares sold |
— | 1,200,000 | 250,000 | 400,000 | ||||||||||||
| Shares redeemed |
(350,000 | ) | — | (300,799 | ) | (300,000 | ) | |||||||||
|
|
|
|
|
|
|
|
|
|||||||||
| Shares outstanding, end of year |
4,600,001 | 4,950,001 | 4,050,001 | 4,100,800 | ||||||||||||
|
|
|
|
|
|
|
|
|
|||||||||
| See Notes to Financial Statements. | 98 |
DBX ETF Trust
Statements of Changes in Net Assets (Continued)
| Xtrackers MSCI Europe Hedged Equity ETF |
Xtrackers MSCI Eurozone Hedged Equity ETF |
|||||||||||||||
| Year Ended May 31, 2023 |
Year Ended May 31, 2022 |
Year Ended May 31, 2023 |
Year Ended May 31, 2022 |
|||||||||||||
| Increase (Decrease) in Net Assets from Operations |
||||||||||||||||
| Net investment income (loss) |
$ | 15,199,340 | $ | 16,144,511 | $ | 574,043 | $ | 344,293 | ||||||||
| Net realized gain (loss) |
3,849,863 | 88,684,890 | (730,905 | ) | 2,307,837 | |||||||||||
| Net change in net unrealized appreciation (depreciation) |
16,042,211 | (89,272,383 | ) | 1,256,623 | (3,058,939 | ) | ||||||||||
|
|
|
|
|
|
|
|
|
|||||||||
| Net increase (decrease) in net assets resulting from operations |
35,091,414 | 15,557,018 | 1,099,761 | (406,809 | ) | |||||||||||
|
|
|
|
|
|
|
|
|
|||||||||
| Distributions to Shareholders |
(9,814,152 | ) | (11,268,402 | ) | (206,409 | ) | (261,109 | ) | ||||||||
|
|
|
|
|
|
|
|
|
|||||||||
| Fund Shares Transactions |
||||||||||||||||
| Proceeds from shares sold |
102,071,418 | 78,587,519 | 15,755,852 | — | ||||||||||||
| Value of shares redeemed |
(195,260,931 | ) | (119,387,070 | ) | (1,771,612 | ) | (1,813,038 | ) | ||||||||
|
|
|
|
|
|
|
|
|
|||||||||
| Net increase (decrease) in net assets resulting from fund share transactions |
(93,189,513 | ) | (40,799,551 | ) | 13,984,240 | (1,813,038 | ) | |||||||||
|
|
|
|
|
|
|
|
|
|||||||||
| Total net increase (decrease) in Net Assets |
(67,912,251 | ) | (36,510,935 | ) | 14,877,592 | (2,480,956 | ) | |||||||||
| Net Assets |
||||||||||||||||
| Beginning of year |
526,595,899 | 563,106,834 | 12,687,210 | 15,168,166 | ||||||||||||
|
|
|
|
|
|
|
|
|
|||||||||
| End of year |
$ | 458,683,648 | $ | 526,595,899 | $ | 27,564,802 | $ | 12,687,210 | ||||||||
|
|
|
|
|
|
|
|
|
|||||||||
| Changes in Shares Outstanding |
||||||||||||||||
| Shares outstanding, beginning of year |
15,350,001 | 16,550,001 | 350,001 | 400,001 | ||||||||||||
| Shares sold |
2,800,000 | 2,250,000 | 400,000 | — | ||||||||||||
| Shares redeemed |
(5,600,000 | ) | (3,450,000 | ) | (50,000 | ) | (50,000 | ) | ||||||||
|
|
|
|
|
|
|
|
|
|||||||||
| Shares outstanding, end of year |
12,550,001 | 15,350,001 | 700,001 | 350,001 | ||||||||||||
|
|
|
|
|
|
|
|
|
|||||||||
| See Notes to Financial Statements. | 99 |
DBX ETF Trust
Statements of Changes in Net Assets (Continued)
| Xtrackers MSCI Germany Hedged Equity ETF |
Xtrackers MSCI Japan Hedged Equity ETF |
|||||||||||||||
| Year Ended May 31, 2023 |
Year Ended May 31, 2022 |
Year Ended May 31, 2023 |
Year Ended May 31, 2022 |
|||||||||||||
| Increase (Decrease) in Net Assets from Operations |
||||||||||||||||
| Net investment income (loss) |
$ | 241,929 | $ | 260,783 | $ | 4,467,020 | $ | 3,125,480 | ||||||||
| Net realized gain (loss) |
(966,185 | ) | 2,289,243 | 5,284,765 | 31,413,571 | |||||||||||
| Net change in net unrealized appreciation (depreciation) |
1,393,538 | (3,573,222 | ) | 29,562,507 | (31,093,217 | ) | ||||||||||
|
|
|
|
|
|
|
|
|
|||||||||
| Net increase (decrease) in net assets resulting from operations |
669,282 | (1,023,196 | ) | 39,314,292 | 3,445,834 | |||||||||||
|
|
|
|
|
|
|
|
|
|||||||||
| Distributions to Shareholders |
(239,488 | ) | (263,720 | ) | (1,555,170 | ) | (4,701,108 | ) | ||||||||
|
|
|
|
|
|
|
|
|
|||||||||
| Fund Shares Transactions |
||||||||||||||||
| Proceeds from shares sold |
— | — | 89,775,794 | 9,961,877 | ||||||||||||
| Value of shares redeemed |
(1,301,794 | ) | (3,221,344 | ) | (27,037,043 | ) | (16,999,026 | ) | ||||||||
|
|
|
|
|
|
|
|
|
|||||||||
| Net increase (decrease) in net assets resulting from fund share transactions |
(1,301,794 | ) | (3,221,344 | ) | 62,738,751 | (7,037,149 | ) | |||||||||
|
|
|
|
|
|
|
|
|
|||||||||
| Total net increase (decrease) in Net Assets |
(872,000 | ) | (4,508,260 | ) | 100,497,873 | (8,292,423 | ) | |||||||||
| Net Assets |
||||||||||||||||
| Beginning of year |
10,116,350 | 14,624,610 | 190,512,031 | 198,804,454 | ||||||||||||
|
|
|
|
|
|
|
|
|
|||||||||
| End of year |
$ | 9,244,350 | $ | 10,116,350 | $ | 291,009,904 | $ | 190,512,031 | ||||||||
|
|
|
|
|
|
|
|
|
|||||||||
| Changes in Shares Outstanding |
||||||||||||||||
| Shares outstanding, beginning of year |
350,800 | 450,800 | 3,900,800 | 4,050,800 | ||||||||||||
| Shares sold |
— | — | 1,750,000 | 200,000 | ||||||||||||
| Shares redeemed |
(50,799 | ) | (100,000 | ) | (550,799 | ) | (350,000 | ) | ||||||||
|
|
|
|
|
|
|
|
|
|||||||||
| Shares outstanding, end of year |
300,001 | 350,800 | 5,100,001 | 3,900,800 | ||||||||||||
|
|
|
|
|
|
|
|
|
|||||||||
| See Notes to Financial Statements. | 100 |
DBX ETF Trust
| Xtrackers MSCI All World ex US Hedged Equity ETF Selected Per Share Data |
Years Ended May 31, | |||||||||||||||||||
| 2023 | 2022 | 2021 | 2020 | 2019 | ||||||||||||||||
| Net Asset Value, beginning of year |
$ | 31.45 | $ | 33.37 | $ | 25.63 | $ | 26.61 | $ | 27.71 | ||||||||||
|
|
|
|
|
|
|
|
|
|
|
|||||||||||
| Income (loss) from investment operations: | ||||||||||||||||||||
| Net investment income (loss)(a) |
0.81 | 0.88 | 0.64 | 0.62 | 0.73 | |||||||||||||||
| Net realized and unrealized gain (loss) |
0.25 | (2.11 | ) | 7.73 | (0.76 | ) | (1.12 | ) | ||||||||||||
|
|
|
|
|
|
|
|
|
|
|
|||||||||||
| Total from investment operations |
1.06 | (1.23 | ) | 8.37 | (0.14 | ) | (0.39 | ) | ||||||||||||
|
|
|
|
|
|
|
|
|
|
|
|||||||||||
| Less distributions from: |
| |||||||||||||||||||
| Net investment income |
(0.62 | ) | (0.69 | ) | (0.63 | ) | (0.84 | ) | (0.71 | ) | ||||||||||
| Net realized gains |
(3.00 | ) | — | — | — | — | ||||||||||||||
|
|
|
|
|
|
|
|
|
|
|
|||||||||||
| Total distributions |
(3.62 | ) | (0.69 | ) | (0.63 | ) | (0.84 | ) | (0.71 | ) | ||||||||||
|
|
|
|
|
|
|
|
|
|
|
|||||||||||
| Net Asset Value, end of year |
$ | 28.89 | $ | 31.45 | $ | 33.37 | $ | 25.63 | $ | 26.61 | ||||||||||
|
|
|
|
|
|
|
|
|
|
|
|||||||||||
| Total Return (%)(b) |
4.02 | (3.79 | ) | 33.10 | (0.78 | ) | (1.30 | ) | ||||||||||||
| Ratios to Average Net Assets and Supplemental Data |
||||||||||||||||||||
| Net Assets, end of year ($ millions) |
133 | 156 | 125 | 99 | 98 | |||||||||||||||
| Ratio of expenses before fee waiver (%) |
0.41 | 0.40 | 0.40 | 0.41 | 0.41 | |||||||||||||||
| Ratio of expenses after fee waiver (%) |
0.41 | 0.40 | 0.40 | 0.41 | 0.41 | |||||||||||||||
| Ratio of net investment income (loss) (%) |
2.77 | 2.69 | 2.15 | 2.29 | 2.74 | |||||||||||||||
| Portfolio turnover rate (%)(c) |
14 | 6 | 14 | 10 | 13 | |||||||||||||||
| Xtrackers MSCI Emerging Markets Hedged Equity ETF Selected Per Share Data |
Years Ended May 31, | |||||||||||||||||||
| 2023 | 2022 | 2021 | 2020 | 2019 | ||||||||||||||||
| Net Asset Value, beginning of year |
$ | 23.77 | $ | 29.36 | $ | 21.03 | $ | 21.81 | $ | 23.91 | ||||||||||
|
|
|
|
|
|
|
|
|
|
|
|||||||||||
| Income (loss) from investment operations: | ||||||||||||||||||||
| Net investment income (loss)(a) |
0.52 | 0.53 | 0.39 | 0.58 | 0.52 | |||||||||||||||
| Net realized and unrealized gain (loss) |
(1.80 | ) | (5.65 | ) | 8.42 | (0.74 | ) | (2.02 | ) | |||||||||||
|
|
|
|
|
|
|
|
|
|
|
|||||||||||
| Total from investment operations |
(1.28 | ) | (5.12 | ) | 8.81 | (0.16 | ) | (1.50 | ) | |||||||||||
|
|
|
|
|
|
|
|
|
|
|
|||||||||||
| Less distributions from: |
| |||||||||||||||||||
| Net investment income |
(0.57 | ) | (0.47 | ) | (0.48 | ) | (0.62 | ) | (0.60 | ) | ||||||||||
|
|
|
|
|
|
|
|
|
|
|
|||||||||||
| Total distributions |
(0.57 | ) | (0.47 | ) | (0.48 | ) | (0.62 | ) | (0.60 | ) | ||||||||||
|
|
|
|
|
|
|
|
|
|
|
|||||||||||
| Net Asset Value, end of year |
$ | 21.92 | $ | 23.77 | $ | 29.36 | $ | 21.03 | $ | 21.81 | ||||||||||
|
|
|
|
|
|
|
|
|
|
|
|||||||||||
| Total Return (%)(b) |
(5.40 | ) | (17.67 | ) | 42.20 | (1.01 | ) | (6.18 | ) | |||||||||||
| Ratios to Average Net Assets and Supplemental Data |
||||||||||||||||||||
| Net Assets, end of year ($ millions) |
89 | 97 | 117 | 89 | 112 | |||||||||||||||
| Ratio of expenses before fee waiver (%) |
0.66 | 0.65 | 0.65 | 0.66 | 0.66 | |||||||||||||||
| Ratio of expenses after fee waiver (%) |
0.66 | 0.65 | 0.65 | 0.66 | 0.66 | |||||||||||||||
| Ratio of net investment income (loss) (%) |
2.33 | 2.00 | 1.48 | 2.62 | 2.29 | |||||||||||||||
| Portfolio turnover rate (%)(c) |
16 | 14 | 13 | 20 | 13 | |||||||||||||||
| (a) | Based on average shares outstanding during the period. |
| (b) | Total Return would have been lower if certain expenses had not been reimbursed by the Advisor. |
| (c) | Portfolio turnover rate does not include securities received or delivered from processing creations or redemptions. |
| See Notes to Financial Statements. | 101 |
DBX ETF Trust
Financial Highlights (Continued)
| Xtrackers MSCI Europe Hedged Equity ETF Selected Per Share Data |
Years Ended May 31, | |||||||||||||||||||
| 2023 | 2022 | 2021 | 2020 | 2019 | ||||||||||||||||
| Net Asset Value, beginning of year |
$ | 34.31 | $ | 34.02 | $ | 26.91 | $ | 28.31 | $ | 28.71 | ||||||||||
|
|
|
|
|
|
|
|
|
|
|
|||||||||||
| Income (loss) from investment operations: | ||||||||||||||||||||
| Net investment income (loss)(a) |
1.04 | (b) | 0.97 | 0.77 | 0.52 | 0.75 | ||||||||||||||
| Net realized and unrealized gain (loss) |
1.85 | (0.00 | )(c) | 7.07 | (1.06 | ) | (0.26 | ) | ||||||||||||
|
|
|
|
|
|
|
|
|
|
|
|||||||||||
| Total from investment operations |
2.89 | 0.97 | 7.84 | (0.54 | ) | 0.49 | ||||||||||||||
|
|
|
|
|
|
|
|
|
|
|
|||||||||||
| Less distributions from: |
| |||||||||||||||||||
| Net investment income |
(0.65 | ) | (0.68 | ) | (0.73 | ) | (0.86 | ) | (0.89 | ) | ||||||||||
|
|
|
|
|
|
|
|
|
|
|
|||||||||||
| Total distributions |
(0.65 | ) | (0.68 | ) | (0.73 | ) | (0.86 | ) | (0.89 | ) | ||||||||||
|
|
|
|
|
|
|
|
|
|
|
|||||||||||
| Net Asset Value, end of year |
$ | 36.55 | $ | 34.31 | $ | 34.02 | $ | 26.91 | $ | 28.31 | ||||||||||
|
|
|
|
|
|
|
|
|
|
|
|||||||||||
| Total Return (%)(d) |
8.77 | 2.85 | 29.68 | (2.16 | ) | 1.88 | ||||||||||||||
| Ratios to Average Net Assets and Supplemental Data |
||||||||||||||||||||
| Net Assets, end of year ($ millions) |
459 | 527 | 563 | 487 | 849 | |||||||||||||||
| Ratio of expenses before fee waiver (%) |
0.48 | 0.45 | 0.45 | 0.46 | 0.47 | |||||||||||||||
| Ratio of expenses after fee waiver (%) |
0.48 | 0.45 | 0.45 | 0.46 | 0.47 | |||||||||||||||
| Ratio of net investment income (loss) (%) |
3.06 | (b) | 2.77 | 2.58 | 1.79 | 2.67 | ||||||||||||||
| Portfolio turnover rate (%)(e) |
13 | 5 | 9 | 13 | 7 | |||||||||||||||
| Xtrackers MSCI Eurozone Hedged Equity ETF Selected Per Share Data |
Years Ended May 31, | |||||||||||||||||||
| 2023 | 2022 | 2021 | 2020 | 2019 | ||||||||||||||||
| Net Asset Value, beginning of year |
$ | 36.25 | $ | 37.92 | $ | 28.10 | $ | 29.80 | $ | 30.90 | ||||||||||
|
|
|
|
|
|
|
|
|
|
|
|||||||||||
| Income (loss) from investment operations: | ||||||||||||||||||||
| Net investment income (loss)(a) |
1.35 | 0.88 | 0.76 | 0.40 | 0.71 | |||||||||||||||
| Net realized and unrealized gain (loss) |
2.37 | (1.90 | ) | 9.71 | (1.15 | ) | (1.13 | ) | ||||||||||||
|
|
|
|
|
|
|
|
|
|
|
|||||||||||
| Total from investment operations |
3.72 | (1.02 | ) | 10.47 | (0.75 | ) | (0.42 | ) | ||||||||||||
|
|
|
|
|
|
|
|
|
|
|
|||||||||||
| Less distributions from: |
| |||||||||||||||||||
| Net investment income |
(0.59 | ) | (0.65 | ) | (0.65 | ) | (0.95 | ) | (0.68 | ) | ||||||||||
|
|
|
|
|
|
|
|
|
|
|
|||||||||||
| Total distributions |
(0.59 | ) | (0.65 | ) | (0.65 | ) | (0.95 | ) | (0.68 | ) | ||||||||||
|
|
|
|
|
|
|
|
|
|
|
|||||||||||
| Net Asset Value, end of year |
$ | 39.38 | $ | 36.25 | $ | 37.92 | $ | 28.10 | $ | 29.80 | ||||||||||
|
|
|
|
|
|
|
|
|
|
|
|||||||||||
| Total Return (%)(d) |
10.57 | (2.77 | ) | 37.79 | (2.80 | ) | (1.34 | ) | ||||||||||||
| Ratios to Average Net Assets and Supplemental Data |
||||||||||||||||||||
| Net Assets, end of year ($ millions) |
28 | 13 | 15 | 21 | 31 | |||||||||||||||
| Ratio of expenses before fee waiver (%) |
0.45 | 0.45 | 0.45 | 0.47 | 0.47 | |||||||||||||||
| Ratio of expenses after fee waiver (%) |
0.45 | 0.45 | 0.45 | 0.46 | 0.47 | |||||||||||||||
| Ratio of net investment income (loss) (%) |
3.65 | 2.32 | 2.37 | 1.31 | 2.42 | |||||||||||||||
| Portfolio turnover rate (%)(e) |
14 | 7 | 10 | 11 | 5 | |||||||||||||||
| (a) | Based on average shares outstanding during the period. |
| (b) | Net investment income per share and the ratio of net investment income include non-recurring foreign dividend reclaims and related interest amounting to $0.13 per share. Excluding these non-recurring amounts which are included in Unaffiliated dividend income and Other income, respectively in the Statement of Operations, the net investment income ratio would have been 2.70%. |
| (c) | Less than 0.005. |
| (d) | Total Return would have been lower if certain expenses had not been reimbursed by the Advisor. |
| (e) | Portfolio turnover rate does not include securities received or delivered from processing creations or redemptions. |
| See Notes to Financial Statements. | 102 |
DBX ETF Trust
Financial Highlights (Continued)
| Xtrackers MSCI Germany Hedged Equity ETF Selected Per Share Data |
Years Ended May 31, | |||||||||||||||||||
| 2023 | 2022 | 2021 | 2020 | 2019 | ||||||||||||||||
| Net Asset Value, beginning of year |
$ | 28.84 | $ | 32.44 | $ | 25.49 | $ | 25.77 | $ | 27.93 | ||||||||||
|
|
|
|
|
|
|
|
|
|
|
|||||||||||
| Income (loss) from investment operations: | ||||||||||||||||||||
| Net investment income (loss)(a) |
0.79 | 0.66 | 0.95 | 0.24 | 0.53 | |||||||||||||||
| Net realized and unrealized gain (loss) |
1.86 | (3.67 | ) | 6.84 | 0.08 | (2.02 | ) | |||||||||||||
|
|
|
|
|
|
|
|
|
|
|
|||||||||||
| Total from investment operations |
2.65 | (3.01 | ) | 7.79 | 0.32 | (1.49 | ) | |||||||||||||
|
|
|
|
|
|
|
|
|
|
|
|||||||||||
| Less distributions from: |
| |||||||||||||||||||
| Net investment income |
(0.68 | ) | (0.59 | ) | (0.84 | ) | (0.60 | ) | (0.67 | ) | ||||||||||
|
|
|
|
|
|
|
|
|
|
|
|||||||||||
| Total distributions |
(0.68 | ) | (0.59 | ) | (0.84 | ) | (0.60 | ) | (0.67 | ) | ||||||||||
|
|
|
|
|
|
|
|
|
|
|
|||||||||||
| Net Asset Value, end of year |
$ | 30.81 | $ | 28.84 | $ | 32.44 | $ | 25.49 | $ | 25.77 | ||||||||||
|
|
|
|
|
|
|
|
|
|
|
|||||||||||
| Total Return (%)(b) |
9.67 | (9.49 | ) | 31.15 | 1.15 | (5.48 | ) | |||||||||||||
| Ratios to Average Net Assets and Supplemental Data |
||||||||||||||||||||
| Net Assets, end of year ($ millions) |
9 | 10 | 15 | 15 | 23 | |||||||||||||||
| Ratio of expenses before fee waiver (%) |
0.45 | 0.45 | 0.45 | 0.45 | 0.46 | |||||||||||||||
| Ratio of expenses after fee waiver (%) |
0.45 | 0.45 | 0.45 | 0.45 | 0.46 | |||||||||||||||
| Ratio of net investment income (loss) (%) |
2.83 | 2.10 | 3.29 | 0.90 | 2.03 | |||||||||||||||
| Portfolio turnover rate (%)(c) |
20 | 7 | 15 | 14 | 11 | |||||||||||||||
| Xtrackers MSCI Japan Hedged Equity ETF Selected Per Share Data |
Years Ended May 31, | |||||||||||||||||||
| 2023 | 2022 | 2021 | 2020 | 2019 | ||||||||||||||||
| Net Asset Value, beginning of year |
$ | 48.84 | $ | 49.08 | $ | 39.80 | $ | 37.95 | $ | 42.95 | ||||||||||
|
|
|
|
|
|
|
|
|
|
|
|||||||||||
| Income (loss) from investment operations: | ||||||||||||||||||||
| Net investment income (loss)(a) |
1.00 | 0.79 | 0.62 | 0.67 | 0.64 | |||||||||||||||
| Net realized and unrealized gain (loss) |
7.61 | 0.13 | 9.82 | 2.27 | (4.24 | ) | ||||||||||||||
|
|
|
|
|
|
|
|
|
|
|
|||||||||||
| Total from investment operations |
8.61 | 0.92 | 10.44 | 2.94 | (3.60 | ) | ||||||||||||||
|
|
|
|
|
|
|
|
|
|
|
|||||||||||
| Less distributions from: |
| |||||||||||||||||||
| Net investment income |
(0.39 | ) | (1.16 | ) | (1.16 | ) | (1.09 | ) | (1.40 | ) | ||||||||||
|
|
|
|
|
|
|
|
|
|
|
|||||||||||
| Total distributions |
(0.39 | ) | (1.16 | ) | (1.16 | ) | (1.09 | ) | (1.40 | ) | ||||||||||
|
|
|
|
|
|
|
|
|
|
|
|||||||||||
| Net Asset Value, end of year |
$ | 57.06 | $ | 48.84 | $ | 49.08 | $ | 39.80 | $ | 37.95 | ||||||||||
|
|
|
|
|
|
|
|
|
|
|
|||||||||||
| Total Return (%)(b) |
17.78 | 1.87 | 26.96 | 7.88 | (8.59 | ) | ||||||||||||||
| Ratios to Average Net Assets and Supplemental Data |
||||||||||||||||||||
| Net Assets, end of year ($ millions) |
291 | 191 | 199 | 221 | 414 | |||||||||||||||
| Ratio of expenses before fee waiver (%) |
0.47 | 0.45 | 0.45 | 0.46 | 0.47 | |||||||||||||||
| Ratio of expenses after fee waiver (%) |
0.46 | 0.45 | 0.45 | 0.46 | 0.47 | |||||||||||||||
| Ratio of net investment income (loss) (%) |
1.98 | 1.61 | 1.41 | 1.69 | 1.55 | |||||||||||||||
| Portfolio turnover rate (%)(c) |
18 | 6 | 12 | 12 | 15 | |||||||||||||||
| (a) | Based on average shares outstanding during the period. |
| (b) | Total Return would have been lower if certain expenses had not been reimbursed by the Advisor. |
| (c) | Portfolio turnover rate does not include securities received or delivered from processing creations or redemptions. |
| See Notes to Financial Statements. | 103 |
DBX ETF Trust
1. Organization
DBX ETF Trust (the “Trust”) is registered under the Investment Company Act of 1940, as amended (the “1940 Act”), as an open-end registered management investment company organized as a Delaware statutory trust.
As of May 31, 2023, the Trust consists of thirty-nine investment series of exchange-traded funds (“ETFs”) (each a “Fund” and collectively, the “Funds”) in operation and trading. These financial statements report on the Funds listed below:
| Xtrackers MSCI All World ex US Hedged Equity ETF | ||
| Xtrackers MSCI Emerging Markets Hedged Equity ETF | ||
| Xtrackers MSCI Europe Hedged Equity ETF | ||
| Xtrackers MSCI Eurozone Hedged Equity ETF | ||
| Xtrackers MSCI Germany Hedged Equity ETF | ||
| Xtrackers MSCI Japan Hedged Equity ETF |
DBX Advisors LLC (“DBX” or the “Advisor”), an indirect, wholly-owned subsidiary of DWS Group GmbH & Co. KGaA (“DWS Group”), serves as investment advisor to the Funds and has overall responsibility for the general management and administration of the Funds, subject to the supervision of the Funds’ Board of Trustees (“Board”).
Each Fund offers shares that are listed and traded on the NYSE Arca, Inc. (“NYSE Arca”). Unlike conventional mutual funds, each Fund issues and redeems shares on a continuous basis, at net asset value (“NAV”), only in large specified lots consisting of 50,000 shares, each called a “Creation Unit”, to authorized participants who have entered into agreements with the Funds’ distributor. Shares are not individually redeemable securities of the Funds, and owners of the shares may acquire those shares from the Funds, or tender such shares for redemption to the Funds, in Creation Units only.
The investment objective of each Fund is to seek investment results that correspond generally to the performance, before fees and expenses, of a particular index (the “Underlying Index”). The underlying indices for the Funds are:
| Fund |
Underlying Index | |
| Xtrackers MSCI All World ex US Hedged Equity ETF | MSCI ACWI ex USA US Dollar Hedged Index | |
| Xtrackers MSCI Emerging Markets Hedged Equity ETF | MSCI EM US Dollar Hedged Index | |
| Xtrackers MSCI Europe Hedged Equity ETF | MSCI Europe US Dollar Hedged Index | |
| Xtrackers MSCI Eurozone Hedged Equity ETF | MSCI EMU IMI US Dollar Hedged Index | |
| Xtrackers MSCI Germany Hedged Equity ETF | MSCI Germany US Dollar Hedged Index | |
| Xtrackers MSCI Japan Hedged Equity ETF | MSCI Japan US Dollar Hedged Index |
The MSCI ACWI ex USA US Dollar Hedged Index is designed to track the performance of equity securities in developed and emerging stock markets (excluding the United States), while mitigating exposure to fluctuations between the value of the U.S. dollar and the currencies of the countries included in the Underlying Index.
The MSCI EM US Dollar Hedged Index is designed to track emerging market performance while mitigating exposure to fluctuations between the value of the U.S. dollar and the currencies of the countries included in the Underlying Index.
The MSCI Europe US Dollar Hedged Index is designed to track the performance of the developed markets in Europe, while mitigating exposure to fluctuations between the value of the U.S. dollar and the currencies of the countries included in the Underlying Index.
The MSCI EMU IMI US Dollar Hedged Index is designed to track the performance of equity securities based in the countries in the European Monetary Union (the “EMU”), while seeking to mitigate exposure to fluctuations between the value of the U.S. dollar and the euro.
The MSCI Germany US Dollar Hedged Index is designed to track the performance of the German equity market while mitigating exposure to fluctuations between the value of the U.S. dollar and the euro.
The MSCI Japan US Dollar Hedged Index is designed to track the performance of the Japanese equity market while mitigating exposure to fluctuations between the value of the U.S. dollar and Japanese yen.
104
DBX ETF Trust
Notes to Financial Statements (Continued)
The MSCI Hedged Underlying Indices are rebalanced monthly on the last trading day of the month, when the index will take into account the effect of rolling into new 1-month forward contracts based on the newly determined weights of currency to be sold for the next month’s index calculation. The currency weights are determined as of the close of two business days before the first calendar day of the following month and remain constant intra month. This means that no changes in the weights are made during the month to account for changes in the indexes due to price movement of securities, corporate events, additions, deletions or any other changes. The daily calculation of MSCI Hedged Indices marks to market the one-month forward contracts on a daily basis by using an equal and offsetting forward position.
Each Fund is entitled to use its respective Underlying Index pursuant to a licensing agreement between the Index Provider and DBX. There is no charge to the Funds in connection with these licensing agreements.
Xtrackers MSCI All World ex US Hedged Equity ETF, Xtrackers MSCI Emerging Markets Hedged Equity ETF, Xtrackers MSCI Europe Hedged Equity ETF, Xtrackers MSCI Eurozone Hedged Equity ETF and Xtrackers MSCI Japan Hedged Equity ETF are diversified series of the Trust. Xtrackers MSCI Germany Hedged Equity ETF is non-diversified and is not limited by the 1940 Act with regard to the percentage of its assets that may be invested in the securities of a single issuer. This means the securities of a particular issuer (or securities of issuers in particular industries) may dominate the Underlying Index of the Fund and, consequently, the Fund’s investment portfolio. This may adversely affect the Fund’s performance or subject the Fund’s shares to greater price volatility than that experienced by more diversified investment companies. In addition, each Fund may change its diversification status over time and then change it back again, without shareholder approval, solely as a result of a change in relative market capitalization or index weighting of one or more constituents of the index each Fund tracks.
Pursuant to the Trust’s organizational documents, the Trust’s officers and trustees are indemnified against certain liabilities that may arise out of the performance of their duties to the Funds. Additionally, in the normal course of business the Trust enters into contracts that contain a variety of representations that provide indemnification for certain liabilities. The Trust’s maximum exposure under these arrangements is unknown, as this would involve future claims that may be made against the Funds that have not yet occurred. However, the Trust expects the risk of loss to be remote.
2. Significant Accounting Policies
The financial statements have been prepared in conformity with U.S. generally accepted accounting principles (“U.S. GAAP”), which require management to make certain estimates and assumptions that affect the reported amounts and disclosures in the financial statements. Actual results could differ from those estimates. Each Fund qualifies as an investment company under Topic 946 of the Accounting Standards Codification of U.S. GAAP. The following is a summary of significant accounting policies followed by the Funds.
Security Valuation The NAV of each Fund’s shares is calculated each business day as of the close of regular trading on the New York Stock Exchange, generally 4:00 p.m. Eastern Time. NAV per share is calculated by dividing a Fund’s net assets by the number of Fund shares outstanding.
The Funds’ Board has designated the Advisor as the valuation designee for the Funds pursuant to Rule 2a-5 under the 1940 Act. The Advisor’s Pricing Committee (the “Pricing Committee”) typically values securities using readily available market quotations or prices supplied by independent pricing services (which are considered fair values under Rule 2a-5). The Advisor has adopted fair valuation procedures that provide methodologies for fair valuing securities.
Various inputs are used in determining the value of the Funds’ investments. These inputs are summarized in three broad levels. Level 1 includes quoted prices in active markets for identical securities. Level 2 includes other significant observable inputs (including quoted prices for similar securities, interest rates, prepayment speeds, and credit risk). Level 3 includes significant unobservable inputs (including the Funds’ own assumptions in determining the fair value of investments). The level assigned to the securities valuations may not be an indication of the risk or liquidity associated with investing in those securities.
Equity securities and ETFs are valued at the most recent sale price or official closing price reported on the exchange (U.S. or foreign) or over-the-counter market on which they trade. Securities or ETFs for which no sales
105
DBX ETF Trust
Notes to Financial Statements (Continued)
are reported are valued at the calculated mean between the most recent bid and asked quotations on the relevant market or, if a mean cannot be determined, at the most recent bid quotation. Equity securities and ETFs are generally categorized as Level 1.
Investments in open-end investment companies are valued at their NAV each business day and are categorized as Level 1.
Forward currency contracts are valued at the prevailing forward exchange rate of the underlying currencies and are categorized as Level 2.
Futures contracts are generally valued at the settlement prices established each day on the exchange on which they are traded and are categorized as Level 1.
Securities and other assets for which market quotations are not readily available or for which the above valuation procedures are deemed not to reflect fair value are valued in a manner that is intended to reflect their fair value as determined in accordance with procedures approved by the Pricing Committee and are generally categorized as Level 3. In accordance with the Funds’ valuation procedures, factors considered in determining value may include, but are not limited to, the type of the security; the size of the holding; the initial cost of the security; the existence of any contractual restrictions on the security’s disposition; the price and extent of public trading in similar securities of the issuer or of comparable companies; quotations or evaluated prices from broker-dealers and/or pricing services; information obtained from the issuer, analysts, and/or the appropriate stock exchange (for exchange traded securities); an analysis of the company’s or issuer’s financial statements; an evaluation of the forces that influence the issuer and the market(s) in which the security is purchased and sold; and with respect to debt securities, the maturity, coupon, creditworthiness, currency denomination and the movement of the market in which the security is normally traded. The value determined under these procedures may differ from published values for the same securities.
Fair value pricing could result in a difference between the prices used to calculate a Fund’s NAV and the prices used by the Fund’s Underlying Index, which in turn could result in a difference between the Fund’s performance and the performance of the Fund’s Underlying Index.
Disclosure about the classification of the fair value measurements is included in a table following the Fund’s Schedule of Investments.
Cash Cash consists of cash held at banks and is on deposit with major financial institutions.
Investment Transactions and Investment Income Investment transactions are recorded as of the date that the securities are purchased or sold (trade date). Realized gains and losses from the sale or disposition of securities are calculated on the identified cost-method. Dividend income is net of any foreign taxes withheld at source. Certain dividends from foreign securities may be recorded subsequent to the ex-dividend date as soon as the Fund is informed of such dividends. Interest income is recorded on the accrual basis.
Tax Information and Dividends and Distributions to Shareholders It is each Fund’s policy to comply with all requirements of the Internal Revenue Code of 1986, as amended (“the Code”). Each Fund intends to qualify for and to elect treatment as a separate Regulated Investment Company (“RIC”) under Subchapter M of the Code. It is the policy of each Fund to pay out dividends from its net investment income, if any, to investors semi-annually. Taxable net realized gains from investment transactions, reduced by capital loss carryforwards, if any, are declared and distributed to shareholders at least annually. The capital loss carryforward amount, if any, is available to offset future net capital gains. The Funds may occasionally be required to make supplemental distributions at some other time during the year. The Funds reserve the right to declare special distributions if, in their reasonable discretion, such action is necessary or advisable to preserve the status of each Fund as a RIC or to avoid imposition of income or excise taxes on undistributed income. Dividends and distributions to shareholders, if any, are recorded on the ex-dividend date. The amount of dividends and distributions from net investment income and net realized capital gains are determined in accordance with Federal income tax regulations which may differ from U.S. GAAP. These “book/tax” differences are either considered temporary or permanent in nature. To the extent these differences are permanent in nature, such amounts are reclassified at the end of the year within the components of net assets based on their federal tax treatment; temporary differences do not require reclassification. Dividends and distributions, which exceed earnings and profits for the full year for tax purposes, are reported as a tax return of capital.
106
DBX ETF Trust
Notes to Financial Statements (Continued)
In accordance with U.S. GAAP requirements regarding accounting for uncertainties in income taxes, management has analyzed the Funds’ tax positions taken or expected to be taken on foreign, federal and state income tax returns for all open tax years and has concluded that no provision for income tax is required in the Funds’ financial statements.
The Funds recognize interest and penalties, if any, related to uncertain tax positions as income tax expense on the Statements of Operations. For the year ended May 31, 2023, the Funds did not incur any interest or penalties.
As of May 31, 2023, the components of accumulated earnings (losses) on a tax basis were as follows:
| Undistributed Ordinary Income |
Capital and Other Gains (Losses) |
Unrealized Appreciation (Depreciation) |
Total Accumulated Earnings (Losses) |
|||||||||||||
| Xtrackers MSCI All World ex US Hedged Equity ETF |
$ | 4,742,628 | $ | (15,481,939 | ) | $ | 8,024,820 | $ | (2,714,491 | ) | ||||||
| Xtrackers MSCI Emerging Markets Hedged Equity ETF |
1,282,165 | (19,615,257 | ) | 4,748,071 | (13,585,021 | ) | ||||||||||
| Xtrackers MSCI Europe Hedged Equity ETF |
17,118,356 | (85,689,611 | ) | (48,090,956 | ) | (116,662,211 | ) | |||||||||
| Xtrackers MSCI Eurozone Hedged Equity ETF |
687,336 | (1,015,082 | ) | (260,613 | ) | (588,359 | ) | |||||||||
| Xtrackers MSCI Germany Hedged Equity ETF |
274,613 | (7,296,542 | ) | (1,130,506 | ) | (8,152,435 | ) | |||||||||
| Xtrackers MSCI Japan Hedged Equity ETF |
16,665,287 | (132,509,301 | ) | 2,241,421 | (113,602,593 | ) | ||||||||||
The tax character of dividends and distributions declared for the years ended May 31, 2023 and May 31, 2022 were as follows:
| Year Ended May 31, 2023 | ||||||||
| Ordinary Income* | Long Term Capital Gains |
|||||||
| Xtrackers MSCI All World ex US Hedged Equity ETF |
$ | 10,910,436 | $ | 5,741,660 | ||||
| Xtrackers MSCI Emerging Markets Hedged Equity ETF |
2,355,448 | — | ||||||
| Xtrackers MSCI Europe Hedged Equity ETF |
9,814,152 | — | ||||||
| Xtrackers MSCI Eurozone Hedged Equity ETF |
206,409 | — | ||||||
| Xtrackers MSCI Germany Hedged Equity ETF |
239,488 | — | ||||||
| Xtrackers MSCI Japan Hedged Equity ETF |
1,555,170 | — | ||||||
| Year Ended May 31, 2022 |
||||
| Ordinary Income* | ||||
| Xtrackers MSCI All World ex US Hedged Equity ETF |
$ | 2,755,823 | ||
| Xtrackers MSCI Emerging Markets Hedged Equity ETF |
1,932,852 | |||
| Xtrackers MSCI Europe Hedged Equity ETF |
11,268,402 | |||
| Xtrackers MSCI Eurozone Hedged Equity ETF |
261,109 | |||
| Xtrackers MSCI Germany Hedged Equity ETF |
263,720 | |||
| Xtrackers MSCI Japan Hedged Equity ETF |
4,701,108 | |||
| * | For tax purposes short-term capital gain distributions are considered ordinary income distributions. |
107
DBX ETF Trust
Notes to Financial Statements (Continued)
At May 31, 2023, for Federal income tax purposes, the Funds have capital loss carryforwards available as shown in the table below, to the extent provided by regulations, to offset future capital gains for an unlimited period. To the extent that these loss carryforwards are used to offset future capital gains, it is probable that the capital gains so offset will not be distributed to shareholders.
| Short-Term | Long-Term | Total Amount | ||||||||||
| Xtrackers MSCI Emerging Markets Hedged Equity ETF |
$ | 9,138,698 | $ | 10,476,559 | $ | 19,615,257 | ||||||
| Xtrackers MSCI Europe Hedged Equity ETF |
— | 85,689,611 | 85,689,611 | |||||||||
| Xtrackers MSCI Eurozone Hedged Equity ETF |
— | 1,015,082 | 1,015,082 | |||||||||
| Xtrackers MSCI Germany Hedged Equity ETF |
1,081,009 | 6,215,533 | 7,296,542 | |||||||||
| Xtrackers MSCI Japan Hedged Equity ETF |
53,845,220 | 78,664,081 | 132,509,301 | |||||||||
Capital losses incurred after October 31 (“post-October capital losses”) and late year ordinary losses incurred after December 31 within the taxable year are deemed to arise on the first business day of each Fund’s next taxable year. During the fiscal year ended May 31, 2023, the following Funds incurred and will elect to defer post-October capital losses and late year ordinary losses as follows:
| Post-October Losses on Capital |
||||
| Xtrackers MSCI All World ex US Hedged Equity ETF |
$ | 15,481,939 | ||
For the fiscal year ended May 31, 2023, the effect of permanent “book/tax” reclassifications to the components of net assets are included below. These differences are primarily due to redemptions-in-kind and equalization.
| Distributable earnings (loss) |
Paid-In Capital |
|||||||
| Xtrackers MSCI All World ex US Hedged Equity ETF |
$ | (3,524,517 | ) | $ | 3,524,517 | |||
| Xtrackers MSCI Emerging Markets Hedged Equity ETF |
(628,403 | ) | 628,403 | |||||
| Xtrackers MSCI Europe Hedged Equity ETF |
(28,251,988 | ) | 28,251,988 | |||||
| Xtrackers MSCI Eurozone Hedged Equity ETF |
(235,177 | ) | 235,177 | |||||
| Xtrackers MSCI Germany Hedged Equity ETF |
153,454 | (153,454 | ) | |||||
| Xtrackers MSCI Japan Hedged Equity ETF |
(2,187,485 | ) | 2,187,485 | |||||
As of May 31, 2023, the aggregate cost of investments for federal income tax purposes, the net unrealized appreciation or depreciation and the aggregated gross unrealized appreciation (depreciation) on investments were as follows:
| Aggregate Tax Cost |
Net Unrealized Appreciation (Depreciation) |
Aggregate Gross Unrealized Appreciation |
Aggregate Gross Unrealized (Depreciation) |
|||||||||||||
| Xtrackers MSCI All World ex US Hedged Equity ETF |
$ | 126,492,475 | $ | 8,150,502 | $ | 22,225,803 | $ | (14,075,301 | ) | |||||||
| Xtrackers MSCI Emerging Markets Hedged Equity ETF |
83,728,687 | 5,134,697 | 21,668,325 | (16,533,628 | ) | |||||||||||
| Xtrackers MSCI Europe Hedged Equity ETF |
514,413,196 | (48,003,657 | ) | 31,282,387 | (79,286,044 | ) | ||||||||||
| Xtrackers MSCI Eurozone Hedged Equity ETF |
29,240,710 | (260,847 | ) | 2,415,620 | (2,676,467 | ) | ||||||||||
| Xtrackers MSCI Germany Hedged Equity ETF |
10,165,352 | (1,126,400 | ) | 1,300,537 | (2,426,937 | ) | ||||||||||
| Xtrackers MSCI Japan Hedged Equity ETF |
292,938,648 | 2,344,244 | 26,498,113 | (24,153,869 | ) | |||||||||||
Foreign Taxes The Funds may be subject to foreign taxes (a portion of which may be reclaimable) on income, capital gains on investments, certain foreign currency transactions or other corporate events. All foreign taxes are recorded in accordance with the applicable foreign tax regulations and rates that exist in the foreign jurisdictions in which the Funds invest. These foreign taxes, if any, are paid by the Funds and are reflected in their Statements of Operations as follows: foreign taxes withheld at source are presented as a reduction of income, foreign taxes on capital gains from sales of investments and foreign currency transactions are included in their respective net realized gain (loss) categories, and deferred foreign taxes on unrealized gains are included in net change in unrealized appreciation (depreciation). Receivables and payables related to foreign taxes as of May 31, 2023, if any, are disclosed in the Funds’ Statements of Assets and Liabilities.
108
DBX ETF Trust
Notes to Financial Statements (Continued)
In consideration of recent decisions rendered by European courts, Xtrackers MSCI Europe Hedged Equity ETF has filed for additional reclaims (“EU reclaims”) related to prior years. A corresponding receivable is established when both the amount is known and significant contingencies or uncertainties regarding collectability are removed. These amounts, if any, are reported in dividends and interest receivable in the Statement of Assets and Liabilities. For the year ended May 31, 2023, the Fund received reclaims and interest related to EU reclaims, which is reported in unaffiliated dividend income and other income in the Statement of Operations. Expenses incurred related to filing EU reclaims are recorded in other expenses in the Statement of Operations. For U.S. income tax purposes, EU tax reclaims received by the Fund, if any, reduce the amount of foreign taxes Fund shareholders can use as tax credits in their individual income tax returns. In the event that EU tax reclaims received by a fund during the fiscal year exceed foreign withholding taxes paid, and a fund previously passed foreign tax credits on to its shareholders, a fund must either amend historic tax reporting to shareholders or enter into a closing agreement with the Internal Revenue Service (“IRS”) in order to pay the associated tax liability on behalf of the fund’s shareholders. During the fiscal year ended May 31, 2023, the EU reclaims received exceeded the foreign withholding taxes of the Fund. As a result, the Fund intends to enter into a closing agreement with the IRS and has recognized an estimated closing agreement fee of $255,300 recorded under IRS closing agreement fee in the Statement of Operations.
Foreign Currency Translations The books and records of the Funds are maintained in U.S. dollars. Investment securities and other assets and liabilities denominated in a foreign currency are translated into U.S. dollars at the prevailing exchange rates at period end. Purchases and sales of investment securities, income and expenses are translated into U.S. dollars at the prevailing exchange rates on the respective dates of the transactions.
Net realized and unrealized gains and losses on foreign currency transactions represent net gains and losses between trade and settlement dates on securities transactions, the acquisition and disposition of foreign currencies, and the difference between the amount of net investment income accrued and the U.S. dollar amount actually received. The portion of both realized and unrealized gains and losses on investments that results from fluctuations in foreign currency exchange rates is not separately disclosed, but is included with net realized and unrealized gain/appreciation and loss/depreciation on investments.
Securities Lending The Funds may lend securities to certain financial institutions under the terms of their securities lending agreement. During the term of the loans the Funds continue to receive interest and dividends generated by the securities and to participate in any changes in their market value. The Funds require the borrowers of the securities to maintain collateral with the Funds consisting of cash and/or securities issued or guaranteed by the U.S. Government, its agencies or instrumentalities having a value at least equal to the value of the securities loaned. When the collateral falls below specified amounts, the lending agent will use its best effort to obtain additional collateral on the next business day to meet required amounts under the securities lending agreement. During the year ended May 31, 2023, the Funds invested the cash collateral into a joint trading account in DWS Government & Agency Securities Portfolio, an affiliated money market fund managed by DWS Investment Management Americas, Inc. DWS Investment Management Americas, Inc. receives a management/administration fee (0.08% annualized effective rate as of May 31, 2023) on the cash collateral invested in DWS Government & Agency Securities Portfolio. The Funds receive compensation for lending their securities either in the form of fees or by earning interest on invested cash collateral, net of borrower rebates and fees paid to a lending agent. Either the Fund or the borrower may terminate the loan at any time and the borrower, after notice, is required to return borrowed securities within a standard time period. There may be risks of delay and costs in recovery of securities or even loss of rights in the collateral should the borrower of the securities fail financially. If the Funds are not able to recover securities lent, the Funds may sell the collateral and purchase a replacement investment in the market, incurring the risk that the value of the replacement security is greater than the value of the collateral. The Funds are also subject to all investment risks associated with the reinvestment of any cash collateral received, including, but not limited to, interest rate, credit and liquidity risk associated with such investments.
109
DBX ETF Trust
Notes to Financial Statements (Continued)
As of May 31, 2023, the Funds listed below had securities on loan. The value of the related collateral exceeded the value of the securities loaned at year end.
| Remaining Contractual Maturity of the Agreements, as of May 31, 2023 |
||||||||||||||||||||
| Securities Lending Transactions | Overnight and Continuous |
<30 Days | Between 30 & 90 days |
>90 days | Total | |||||||||||||||
| Xtrackers MSCI All World ex US Hedged Equity ETF |
| |||||||||||||||||||
| Common Stocks |
$ | 2,955,267 | $ | — | $ | 17,651 | $ | 2,354,740 | $ | 5,327,658 | ||||||||||
| Preferred Stocks |
$ | 41,217 | $ | — | $ | — | $ | — | $ | 41,217 | ||||||||||
|
|
|
|
|
|
|
|
|
|
|
|||||||||||
| Total Borrowings |
$ | 2,996,484 | $ | — | $ | 17,651 | $ | 2,354,740 | $ | 5,368,875 | ||||||||||
|
|
|
|
|
|
|
|
|
|
|
|||||||||||
| Gross amount of recognized liabilities and non-cash collateral for securities lending transactions |
|
$ | 5,368,875 | |||||||||||||||||
| Xtrackers MSCI Emerging Markets Hedged Equity ETF |
| |||||||||||||||||||
| Common Stocks |
$ | 179,111 | $ | — | $ | 16,833 | $ | 896,044 | $ | 1,091,988 | ||||||||||
|
|
|
|
|
|
|
|
|
|
|
|||||||||||
| Gross amount of recognized liabilities and non-cash collateral for securities lending transactions |
|
$ | 1,091,988 | |||||||||||||||||
| Xtrackers MSCI Europe Hedged Equity ETF |
| |||||||||||||||||||
| Common Stocks |
$ | 15,045,923 | $ | — | $ | 11,842 | $ | 11,485,374 | $ | 26,543,139 | ||||||||||
| Exchange-Traded Funds |
$ | 28,341 | $ | — | $ | — | $ | — | $ | 28,341 | ||||||||||
|
|
|
|
|
|
|
|
|
|
|
|||||||||||
| Total Borrowings |
$ | 15,074,264 | $ | — | $ | 11,842 | $ | 11,485,374 | $ | 26,571,480 | ||||||||||
|
|
|
|
|
|
|
|
|
|
|
|||||||||||
| Gross amount of recognized liabilities and non-cash collateral for securities lending transactions |
|
$ | 26,571,480 | |||||||||||||||||
| Xtrackers MSCI Eurozone Hedged Equity ETF |
| |||||||||||||||||||
| Common Stocks |
$ | 1,438,039 | $ | — | $ | 2,057 | $ | 952,544 | $ | 2,392,640 | ||||||||||
| Preferred Stocks |
$ | 39,207 | $ | — | $ | — | $ | — | $ | 39,207 | ||||||||||
|
|
|
|
|
|
|
|
|
|
|
|||||||||||
| Total Borrowings |
$ | 1,477,246 | $ | — | $ | 2,057 | $ | 952,544 | $ | 2,431,847 | ||||||||||
|
|
|
|
|
|
|
|
|
|
|
|||||||||||
| Gross amount of recognized liabilities and non-cash collateral for securities lending transactions |
|
$ | 2,431,847 | |||||||||||||||||
| Xtrackers MSCI Japan Hedged Equity ETF |
| |||||||||||||||||||
| Common Stocks |
$ | 3,785,348 | $ | — | $ | 15,075 | $ | 3,601,040 | $ | 7,401,463 | ||||||||||
|
|
|
|
|
|
|
|
|
|
|
|||||||||||
| Gross amount of recognized liabilities and non-cash collateral for securities lending transactions |
|
$ | 7,401,463 | |||||||||||||||||
As of May 31, 2023, MSCI Germany Hedged Equity ETF had no securities on loan.
Derivatives
Forward Foreign Currency Contracts Each Fund may enter into forward foreign currency contracts (“forward currency contracts”) designed to offset the Fund’s exposure to non-U.S. currencies. In addition, the Funds may enter into forward currency contracts and foreign currency futures contracts to facilitate local securities settlements or to protect against currency exposure in connection with distributions to shareholders.
A forward currency contract is a commitment to purchase or sell a foreign currency at a future date at a negotiated forward rate. For the year ended May 31, 2023, Xtrackers MSCI All World ex US Hedged Equity ETF, Xtrackers MSCI Emerging Markets Hedged Equity ETF, Xtrackers MSCI Europe Hedged Equity ETF and Xtrackers MSCI Eurozone Hedged Equity ETF, invested in forward currency contracts to hedge against changes in the value of the U.S. dollar against specified non-U.S. currencies. Similarly, the Xtrackers MSCI Germany Hedged Equity ETF and Xtrackers MSCI Japan Hedged Equity ETF each invested in forward currency contracts to hedge against changes in the value of the U.S. dollar against the euro and the Japanese yen, respectively.
The gain or loss arising from the difference between the original contract and the closing of such contract would be included in net realized gain or loss on forward currency contracts. Risks may arise from the potential inability of a counterparty to meet the terms of a contract and from unanticipated movements in the value of a foreign currency relative to the U.S. dollar. The face or contract amount, in U.S. dollars reflects the total exposure the Fund has in that particular currency contract.
A summary of the open forward currency contracts as of May 31, 2023 is included in a table following the Funds’ Schedule of Investments. The investment in forward currency contracts short vs. U.S. dollars had a contract value generally indicative of a range of the total exposure the respective Fund had to the value of non U.S currencies during the year ended May 31, 2023.
110
DBX ETF Trust
Notes to Financial Statements (Continued)
Futures Contracts Each Fund may enter into futures contracts. These futures contracts will be used to simulate investment in the respective Underlying Index, to facilitate trading or to reduce transaction costs. Each Fund will enter into futures contracts that are traded on a U.S. or non-U.S. exchange. No Fund will use futures for speculative purposes. Futures contracts provide for the future sale by one party and purchase by another party of a specified amount of a specific instrument or index at a specified future time and at a specified price. For the year ended May 31, 2023, Xtrackers MSCI All World ex US Hedged Equity ETF, Xtrackers MSCI Emerging Markets Hedged Equity ETF, Xtrackers MSCI Europe Hedged Equity ETF, Xtrackers MSCI Eurozone Hedged Equity ETF, Xtrackers MSCI Germany Hedged Equity ETF and Xtrackers MSCI Japan Hedged Equity ETF utilized futures in order to simulate investments in the Funds’ Underlying Index. To the extent required by law, liquid assets committed to futures contracts will be maintained.
At the time each Fund enters into a futures contract, each Fund deposits and maintains as collateral an initial margin with the broker, as required by the exchange on which the transaction is affected. Pursuant to the contract, each Fund agrees to receive from or pay to the broker an amount of cash equal to the daily fluctuation in the value of the contract. Such receipts or payments are known as variation margin and are recorded by each Fund as unrealized gains or losses. Risks may arise from the potential inability of a counterparty to meet the terms of the contract. The credit/counterparty risk for exchange-traded futures contracts is generally less than privately negotiated futures contracts, since the clearinghouse, which is the issuer or counterparty to each exchange-traded future, provides a guarantee of performance. The guarantee is supported by a daily payment system (i.e., margin requirements).
Use of long futures contracts subjects each Fund to risk of loss in excess of the amounts shown on the Statement of Assets and Liabilities, up to the notional value of the futures contracts. Use of short futures contracts subjects each Fund to unlimited risk of loss. Under some circumstances, futures exchanges may establish daily limits on the amount that the price of a futures contract can vary from the previous day’s settlement price, which could effectively prevent liquidation of unfavorable positions.
A summary of the open futures contracts as of May 31, 2023 is included in a table following the Funds’ Schedule of Investments.
The following tables summarize the value of the Funds’ derivative instruments held as of May 31, 2023 and the related location in the accompanying Statement of Assets and Liabilities, presented by primary underlying risk exposure:
| Asset Derivatives |
Liability Derivatives |
|||||||||||||
| Xtrackers MSCI All World ex US Hedged Equity ETF |
| |||||||||||||
| Equity contracts | Unrealized appreciation on futures contracts* | $ | 2,580 | Unrealized depreciation on futures contracts* | $ | 14,283 | ||||||||
| Foreign exchange contracts | Unrealized appreciation on forward foreign currency contracts | 2,951,993 | Unrealized depreciation on forward foreign currency contracts | 454,850 | ||||||||||
|
|
|
|
|
|||||||||||
| Total | $ | 2,954,573 | Total | $ | 469,133 | |||||||||
|
|
|
|
|
|||||||||||
| Xtrackers MSCI Emerging Markets Hedged Equity ETF |
| |||||||||||||
| Equity contracts | Unrealized appreciation on futures contracts* | $ | — | Unrealized depreciation on futures contracts* | $ | 10,305 | ||||||||
| Foreign exchange contracts | Unrealized appreciation on forward foreign currency contracts | 825,720 | Unrealized depreciation on forward foreign currency contracts | 381,026 | ||||||||||
|
|
|
|
|
|||||||||||
| Total | $ | 825,720 | Total | $ | 391,331 | |||||||||
|
|
|
|
|
|||||||||||
| Xtrackers MSCI Europe Hedged Equity ETF |
| |||||||||||||
| Equity contracts | Unrealized appreciation on futures contracts* | $ | 11,786 | Unrealized depreciation on futures contracts* | $ | 215,196 | ||||||||
| Foreign exchange contracts | Unrealized appreciation on forward foreign currency contracts | 14,836,042 | Unrealized depreciation on forward foreign currency contracts | 1,539,121 | ||||||||||
|
|
|
|
|
|||||||||||
| Total | $ | 14,847,828 | Total | $ | 1,754,317 | |||||||||
|
|
|
|
|
|||||||||||
111
DBX ETF Trust
Notes to Financial Statements (Continued)
| Asset Derivatives |
Liability Derivatives |
|||||||||||||
| Xtrackers MSCI Eurozone Hedged Equity ETF |
| |||||||||||||
| Equity contracts | Unrealized appreciation on futures contracts* | $ | — | Unrealized depreciation on futures contracts* | $ | 3,277 | ||||||||
| Foreign exchange contracts | Unrealized appreciation on forward foreign currency contracts | 1,010,385 | Unrealized depreciation on forward foreign currency contracts | 77,797 | ||||||||||
|
|
|
|
|
|||||||||||
| Total | $ | 1,010,385 | Total | $ | 81,074 | |||||||||
|
|
|
|
|
|||||||||||
| Xtrackers MSCI Germany Hedged Equity ETF |
| |||||||||||||
| Equity contracts | Unrealized appreciation on futures contracts* | $ | 2,644 | Unrealized depreciation on futures contracts* | $ | — | ||||||||
| Foreign exchange contracts | Unrealized appreciation on forward foreign currency contracts | 335,818 | Unrealized depreciation on forward foreign currency contracts | 25,155 | ||||||||||
|
|
|
|
|
|||||||||||
| Total | $ | 338,462 | Total | $ | 25,155 | |||||||||
|
|
|
|
|
|||||||||||
| Xtrackers MSCI Japan Hedged Equity ETF |
| |||||||||||||
| Equity contracts | Unrealized appreciation on futures contracts* | $ | 518,828 | Unrealized depreciation on futures contracts* | $ | — | ||||||||
| Foreign exchange contracts | Unrealized appreciation on forward foreign currency contracts | 7,857,895 | Unrealized depreciation on forward foreign currency contracts | 946,476 | ||||||||||
|
|
|
|
|
|||||||||||
| Total | $ | 8,376,723 | $ | 946,476 | ||||||||||
|
|
|
|
|
|||||||||||
| * | Includes cumulative appreciation or cumulative depreciation on futures contracts as disclosed in the Schedule of Investments. Unsettled variation margin is disclosed separately within the Statement of Assets and Liabilities. |
Additionally, the amount of realized and unrealized gains and losses on derivative instruments recognized in the Funds’ earnings during the year ended May 31, 2023 and the related location in the accompanying Statement of Operations is summarized in the following tables by primary underlying risk exposure:
| Net Realized Gain (Loss) from: |
||||||||||||
| Futures Contracts — Equity Contracts |
Forward Foreign Currency Contracts — Foreign Exchange Contracts |
Total | ||||||||||
| Xtrackers MSCI All World ex US Hedged Equity ETF |
$ | 44,780 | $ | 2,929,910 | $ | 2,974,690 | ||||||
| Xtrackers MSCI Emerging Markets Hedged Equity ETF |
(22,349 | ) | 2,190,323 | 2,167,974 | ||||||||
| Xtrackers MSCI Europe Hedged Equity ETF |
596,849 | (5,975,102 | ) | (5,378,253 | ) | |||||||
| Xtrackers MSCI Eurozone Hedged Equity ETF |
14,871 | (577,215 | ) | (562,344 | ) | |||||||
| Xtrackers MSCI Germany Hedged Equity ETF |
2,938 | (178,382 | ) | (175,444 | ) | |||||||
| Xtrackers MSCI Japan Hedged Equity ETF |
746,219 | 13,411,556 | 14,157,775 | |||||||||
| Net Change in Unrealized Appreciation (Depreciation) on: |
||||||||||||
| Futures Contracts — Equity Contracts |
Forward Foreign Currency Contracts — Foreign Exchange Contracts |
Total | ||||||||||
| Xtrackers MSCI All World ex US Hedged Equity ETF |
$ | (68,845 | ) | $ | 3,833,757 | $ | 3,764,912 | |||||
| Xtrackers MSCI Emerging Markets Hedged Equity ETF |
(37,365 | ) | 1,041,313 | 1,003,948 | ||||||||
| Xtrackers MSCI Europe Hedged Equity ETF |
(326,572 | ) | 19,280,471 | 18,953,899 | ||||||||
| Xtrackers MSCI Eurozone Hedged Equity ETF |
(8,148 | ) | 1,140,897 | 1,132,749 | ||||||||
| Xtrackers MSCI Germany Hedged Equity ETF |
(9 | ) | 475,099 | 475,090 | ||||||||
| Xtrackers MSCI Japan Hedged Equity ETF |
482,857 | 8,001,303 | 8,484,160 | |||||||||
112
DBX ETF Trust
Notes to Financial Statements (Continued)
For the year ended May 31, 2023 the average monthly volume of derivatives was as follows:
| Futures Contracts (Contract Value) |
Forward Foreign Currency Contracts (Contract Value) |
|||||||
| Xtrackers MSCI All World ex US Hedged Equity ETF |
$ | 3,370,852 | $ | (134,001,262 | ) | |||
| Xtrackers MSCI Emerging Markets Hedged Equity ETF |
1,410,191 | (88,579,074 | ) | |||||
| Xtrackers MSCI Europe Hedged Equity ETF |
12,465,272 | (481,243,223 | ) | |||||
| Xtrackers MSCI Eurozone Hedged Equity ETF |
87,517 | (15,754,714 | ) | |||||
| Xtrackers MSCI Germany Hedged Equity ETF |
102,647 | (8,564,427 | ) | |||||
| Xtrackers MSCI Japan Hedged Equity ETF |
6,205,806 | (223,687,392 | ) | |||||
As of May 31, 2023, the Funds have transactions subject to enforceable master netting agreements which govern the terms of certain transactions, and reduce the counterparty risk associated with such transactions. Master netting agreements allow a Fund to close out and net total exposure to a counterparty in the event of a deterioration in the credit quality or contractual default with respect to all of the transactions with a counterparty. As defined by the master netting agreement, the Funds may have collateral agreements with certain counterparties to mitigate risk. Interest expense from collateral received, if any, is included in Interest expense on the Statements of Operations. For financial reporting purposes the Statement of Assets and Liabilities generally shows derivatives assets and liabilities on a gross basis, which reflects the full risks and exposures prior to netting. A reconciliation of the gross amounts on the Statement of Assets and Liabilities to the net amounts by counterparty, including any collateral exposure, is included in the following tables:
| Fund |
Gross Amounts of Assets Presented in the Statement of Assets and Liabilities |
Financial Instruments and Derivatives Available for Offset |
Collateral Received (a) |
Net Amount of Derivatives Assets |
Gross Amounts of Liabilities Presented in the Statements of Assets and Liabilities |
Financial Instruments and Derivatives Available for Offset |
Collateral Pledged (a) |
Net Amount of Derivatives Liabilities |
||||||||||||||||||||||||
| Xtrackers MSCI All World ex US Hedged Equity ETF |
| |||||||||||||||||||||||||||||||
| Goldman Sachs & Co. |
$ | 1,000,237 | $ | (177,760 | ) | $ | — | $ | 822,477 | $ | 177,760 | $ | (177,760 | ) | $ | — | $ | — | ||||||||||||||
| JP Morgan & Chase Co. |
879,719 | (125,978 | ) | — | 753,741 | 125,978 | (125,978 | ) | — | — | ||||||||||||||||||||||
| RBC Capital Markets |
1,072,037 | (151,112 | ) | — | 920,925 | 151,112 | (151,112 | ) | — | — | ||||||||||||||||||||||
|
|
|
|
|
|
|
|
|
|
|
|
|
|
|
|
|
|||||||||||||||||
| $ | 2,951,993 | $ | (454,850 | ) | $ | — | $ | 2,497,143 | $ | 454,850 | $ | (454,850 | ) | $ | — | $ | — | |||||||||||||||
|
|
|
|
|
|
|
|
|
|
|
|
|
|
|
|
|
|||||||||||||||||
| Xtrackers MSCI Emerging Markets Hedged Equity ETF |
| |||||||||||||||||||||||||||||||
| Goldman Sachs & Co. |
$ | 122,557 | $ | (90,218 | ) | $ | — | $ | 32,339 | $ | 90,218 | $ | (90,218 | ) | $ | — | $ | — | ||||||||||||||
| JP Morgan & Chase Co. |
371,764 | (140,406 | ) | 70,000 | 161,358 | 140,406 | (140,406 | ) | — | — | ||||||||||||||||||||||
| RBC Capital Markets |
331,399 | (150,402 | ) | — | 180,997 | 150,402 | (150,402 | ) | — | — | ||||||||||||||||||||||
|
|
|
|
|
|
|
|
|
|
|
|
|
|
|
|
|
|||||||||||||||||
| $ | 825,720 | $ | (381,026 | ) | $ | 70,000 | $ | 374,694 | $ | 381,026 | $ | (381,026 | ) | $ | — | $ | — | |||||||||||||||
|
|
|
|
|
|
|
|
|
|
|
|
|
|
|
|
|
|||||||||||||||||
| Xtrackers MSCI Europe Hedged Equity ETF |
| |||||||||||||||||||||||||||||||
| Goldman Sachs & Co. |
$ | 6,951,361 | $ | (712,953 | ) | $ | — | $ | 6,238,408 | $ | 712,953 | $ | (712,953 | ) | $ | — | $ | — | ||||||||||||||
| JP Morgan & Chase Co. |
708,769 | (78,638 | ) | — | 630,131 | 78,638 | (78,638 | ) | — | — | ||||||||||||||||||||||
| RBC Capital Markets |
7,175,912 | (747,530 | ) | — | 6,428,382 | 747,530 | (747,530 | ) | — | — | ||||||||||||||||||||||
|
|
|
|
|
|
|
|
|
|
|
|
|
|
|
|
|
|||||||||||||||||
| $ | 14,836,042 | $ | (1,539,121 | ) | $ | — | $ | 13,296,921 | $ | 1,539,121 | $ | (1,539,121 | ) | $ | — | $ | — | |||||||||||||||
|
|
|
|
|
|
|
|
|
|
|
|
|
|
|
|
|
|||||||||||||||||
| Xtrackers MSCI Eurozone Hedged Equity ETF |
| |||||||||||||||||||||||||||||||
| Goldman Sachs & Co. |
$ | 236,410 | $ | (20,559 | ) | $ | — | $ | 215,851 | $ | 20,559 | $ | (20,559 | ) | $ | — | $ | — | ||||||||||||||
| JP Morgan & Chase Co. |
113,406 | (8,406 | ) | — | 105,000 | 8,406 | (8,406 | ) | — | — | ||||||||||||||||||||||
| RBC Capital Markets |
660,569 | (48,832 | ) | — | 611,737 | 48,832 | (48,832 | ) | — | — | ||||||||||||||||||||||
|
|
|
|
|
|
|
|
|
|
|
|
|
|
|
|
|
|||||||||||||||||
| $ | 1,010,385 | $ | (77,797 | ) | $ | — | $ | 932,588 | $ | 77,797 | $ | (77,797 | ) | $ | — | $ | — | |||||||||||||||
|
|
|
|
|
|
|
|
|
|
|
|
|
|
|
|
|
|||||||||||||||||
| Xtrackers MSCI Germany Hedged Equity ETF |
| |||||||||||||||||||||||||||||||
| Goldman Sachs & Co. |
$ | 107,852 | $ | (8,281 | ) | $ | — | $ | 99,571 | $ | 8,281 | $ | (8,281 | ) | $ | — | $ | — | ||||||||||||||
| JP Morgan & Chase Co. |
112,468 | (8,336 | ) | — | 104,132 | 8,336 | (8,336 | ) | — | — | ||||||||||||||||||||||
| RBC Capital Markets |
115,498 | (8,538 | ) | — | 106,960 | 8,538 | (8,538 | ) | — | — | ||||||||||||||||||||||
|
|
|
|
|
|
|
|
|
|
|
|
|
|
|
|
|
|||||||||||||||||
| $ | 335,818 | $ | (25,155 | ) | $ | — | $ | 310,663 | $ | 25,155 | $ | (25,155 | ) | $ | — | $ | — | |||||||||||||||
|
|
|
|
|
|
|
|
|
|
|
|
|
|
|
|
|
|||||||||||||||||
113
DBX ETF Trust
Notes to Financial Statements (Continued)
| Fund |
Gross Amounts of Assets Presented in the Statement of Assets and Liabilities |
Financial Instruments and Derivatives Available for Offset |
Collateral Received (a) |
Net Amount of Derivatives Assets |
Gross Amounts of Liabilities Presented in the Statements of Assets and Liabilities |
Financial Instruments and Derivatives Available for Offset |
Collateral Pledged (a) |
Net Amount of Derivatives Liabilities |
||||||||||||||||||||||||
| Xtrackers MSCI Japan Hedged Equity ETF |
| |||||||||||||||||||||||||||||||
| Goldman Sachs & Co. |
$ | 2,667,919 | $ | (294,239 | ) | $ | — | $ | 2,373,680 | $ | 294,239 | $ | (294,239 | ) | $ | — | $ | — | ||||||||||||||
| JP Morgan & Chase Co. |
2,173,798 | (334,588 | ) | — | 1,839,210 | 334,588 | (334,588 | ) | — | — | ||||||||||||||||||||||
| RBC Capital Markets |
3,016,178 | (317,649 | ) | — | 2,698,529 | 317,649 | (317,649 | ) | — | — | ||||||||||||||||||||||
|
|
|
|
|
|
|
|
|
|
|
|
|
|
|
|
|
|||||||||||||||||
| $ | 7,857,895 | $ | (946,476 | ) | $ | — | $ | 6,911,419 | $ | 946,476 | $ | (946,476 | ) | $ | — | $ | — | |||||||||||||||
|
|
|
|
|
|
|
|
|
|
|
|
|
|
|
|
|
|||||||||||||||||
| (a) | The actual collateral received may be more than the amount shown. |
Affiliated Cash Management Vehicles The Funds may invest uninvested cash balances in DWS Government Money Market Series and DWS ESG Liquidity Fund, affiliated money market funds which are managed by DWS Investment Management Americas, Inc. (“DIMA”), also an indirect, wholly owned subsidiary of DWS Group GmbH & Co. KGaA. Each affiliated money market fund is managed in accordance with Rule 2a-7 under the 1940 Act, which governs the quality, maturity, diversity and liquidity of instruments in which a money market fund may invest. DWS Government Money Market Series seeks to maintain a stable NAV, and DWS ESG Liquidity Fund maintains a floating NAV. The Funds indirectly bear their proportionate share of the expenses of each affiliated money market fund in which they invest. The Advisor will waive an amount of the unitary advisory fee payable to the Advisor by the Funds equal to such acquired fund’s fees and expenses on the Funds’ assets invested in the affiliated money market funds.
3. Investment Advisory and Other Agreements
The Advisor has overall responsibility for the general management and administration of the Funds, subject to the supervision of the Funds’ Board of Trustees. Under an investment advisory agreement between the Trust, on behalf of the Funds, and the Advisor (the “Investment Advisory Agreement”), the Advisor is responsible for arranging sub-advisory, transfer agency, custody, fund administration, and all other non-distribution related services for the Funds to operate.
For its investment advisory services to the Funds below, the Advisor was entitled to receive a unitary advisory fee based on each Fund’s average daily net assets, computed and accrued daily and payable monthly, at an annual rate equal to:
| Unitary Advisory Fee |
||||
| Xtrackers MSCI All World ex US Hedged Equity ETF |
0.40 | % | ||
| Xtrackers MSCI Emerging Markets Hedged Equity ETF |
0.65 | % | ||
| Xtrackers MSCI Europe Hedged Equity ETF |
0.45 | % | ||
| Xtrackers MSCI Eurozone Hedged Equity ETF |
0.45 | % | ||
| Xtrackers MSCI Germany Hedged Equity ETF |
0.45 | % | ||
| Xtrackers MSCI Japan Hedged Equity ETF |
0.45 | % | ||
The Advisor for the funds below has contractually agreed to waive a portion of its unitary advisory fee in an amount equal to the acquired fund’s fees and expenses attributable to the Fund’s investments in affiliated cash management vehicles. For the year ended May 31, 2023, the Advisor waived expenses of the Funds as follows:
| Expenses Waived | ||||
| Xtrackers MSCI All World ex US Hedged Equity ETF |
$ | 1,633 | ||
| Xtrackers MSCI Emerging Markets Hedged Equity ETF |
597 | |||
| Xtrackers MSCI Europe Hedged Equity ETF |
4,951 | |||
| Xtrackers MSCI Eurozone Hedged Equity ETF |
27 | |||
| Xtrackers MSCI Germany Hedged Equity ETF |
160 | |||
| Xtrackers MSCI Japan Hedged Equity ETF |
2,792 | |||
114
DBX ETF Trust
Notes to Financial Statements (Continued)
Out of the unitary advisory fee, the Advisor pays substantially all expenses of each Fund, including the cost of transfer agency, custody, fund administration, legal, audit and other services, and expenses of the Independent Trustees. Each Fund is responsible for the payment of interest expense, acquired fund fees and expenses, taxes, brokerage expenses, distribution fees or expenses, if any, litigation expenses and extraordinary expenses.
The Bank of New York Mellon, a wholly-owned subsidiary of The Bank of New York Mellon Corporation, serves as Administrator, Custodian, Accounting Agent, Lending Agent and Transfer Agent for each Fund.
ALPS Distributors, Inc. (the “Distributor”) serves as the distributor of Creation Units for each Fund on an agency basis. The Distributor does not maintain a secondary market in shares of the Funds.
The Board of Trustees is currently comprised of three Independent Trustees. The Advisor paid retainer fees and attendance fees to each Independent Trustee; retainer fees to the Chairman of the Board of Trustees and Chairman of the Audit Committee; and attendance fees to each member of the Audit Committee (which is comprised of all of the Funds’ Independent Trustees.
4. Investment Portfolio Transactions
For the year ended May 31, 2023, the cost of investments purchased and proceeds from sale of investments (excluding in-kind transactions and short-term investments) were as follows:
| Purchases | Sales | |||||||
| Xtrackers MSCI All World ex US Hedged Equity ETF |
$ | 18,863,582 | $ | 29,421,532 | ||||
| Xtrackers MSCI Emerging Markets Hedged Equity ETF |
16,239,271 | 14,158,865 | ||||||
| Xtrackers MSCI Europe Hedged Equity ETF |
82,504,787 | 61,372,394 | ||||||
| Xtrackers MSCI Eurozone Hedged Equity ETF |
3,323,892 | 2,213,246 | ||||||
| Xtrackers MSCI Germany Hedged Equity ETF |
1,733,051 | 1,691,991 | ||||||
| Xtrackers MSCI Japan Hedged Equity ETF |
67,503,946 | 39,989,500 | ||||||
For the year ended May 31, 2023, the cost of in-kind purchases and proceeds from in-kind sales were as follows:
| Purchases | Sales | |||||||
| Xtrackers MSCI All World ex US Hedged Equity ETF |
$ | — | $ | 8,894,655 | ||||
| Xtrackers MSCI Emerging Markets Hedged Equity ETF |
806,716 | 2,173,891 | ||||||
| Xtrackers MSCI Europe Hedged Equity ETF |
97,243,128 | 189,805,146 | ||||||
| Xtrackers MSCI Eurozone Hedged Equity ETF |
15,529,060 | 1,751,909 | ||||||
| Xtrackers MSCI Germany Hedged Equity ETF |
— | 1,224,360 | ||||||
| Xtrackers MSCI Japan Hedged Equity ETF |
85,490,793 | 26,026,388 | ||||||
5. Fund Share Transactions
As of May 31, 2023, there were unlimited Fund shares, no par value, authorized by the Trust. Fund shares are issued and redeemed by each Fund only in Creation Units or multiples thereof. Except when aggregated in Creation Units, shares of each Fund are not redeemable. Transactions in capital shares for each Fund are disclosed in detail in the Statements of Changes in Net Assets. The consideration for the purchase of Creation Units of a Fund generally consists of the in-kind contribution of a designated portfolio of securities constituting a portfolio sampling representation of the securities included in the respective Fund’s Underlying Index and an amount of cash, which under certain circumstances may include cash in lieu of portfolio securities. Investors purchasing and redeeming Creation Units pay a purchase transaction fee and a redemption transaction fee to offset transfer and other transaction costs associated with the issuance and redemption of Creation Units.
6. Payments by Affiliates
During the year ended May 31, 2023, the Advisor agreed to reimburse Xtrackers MSCI Europe Hedged Equity ETF $48 for a loss due to a FX trade executed incorrectly. The amount compensated was less than 0.01% of the Fund’s average net assets, thus having no impact on the Fund’s total return.
115
DBX ETF Trust
Notes to Financial Statements (Continued)
7. Investing in Emerging Markets
Investing in emerging markets may involve special risks and considerations not typically associated with investing in developed markets. These risks include revaluation of currencies, high rates of inflation or deflation, repatriation restrictions on income and capital, and future adverse political, social and economic developments. Moreover, securities issued in these markets may be less liquid, subject to government ownership controls or delayed settlements, and may have prices that are more volatile or less easily assessed than those of comparable securities of issuers in developed markets. There is also substantially less publicly available information about emerging market issuers than there is about issuers in developed countries. Therefore, disclosure of certain material information may not be made, and less information may be available to the Funds and other investors than would be the case if the Funds’ investments were restricted to securities of issuers in developed countries. Investments in emerging markets are often considered speculative.
Investing in securities of Chinese issuers involves certain risks and considerations not typically associated with investing in securities of U.S. issuers, including, among others; more frequent (and potentially widespread) trading suspensions and government interventions with respect to Chinese issuers, resulting in lack of liquidity and in price volatility; currency revaluations and other currency exchange rate fluctuations or blockage; the nature and extent of intervention by the Chinese government in the Chinese securities markets (including both direct and indirect market stabilization efforts, which may affect valuations of Chinese issuers), whether such intervention will continue and the impact of such intervention or its discontinuation; the risk of nationalization or expropriation of assets; the risk that the Chinese government may decide not to continue to support economic reform programs; limitations on the use of brokers (or action by the Chinese government that discourages brokers from serving international clients); higher rates of inflation; greater political, economic and social uncertainty; higher market volatility caused by any potential regional territorial conflicts or natural disasters; the risk of increased trade tariffs, embargoes and other trade limitations; restrictions on foreign ownership; custody risks associated with investing through Shanghai — Hong Kong and Shenzhen — Hong Kong Stock Connect programs, Renminbi Qualified Foreign Institutional Investor program or other programs to access the Chinese securities markets, both interim and permanent market regulations which may affect the ability of certain stockholders to sell Chinese securities when it would otherwise be advisable; and different and less stringent financial reporting standards. In addition, in June 2021, President Biden issued an executive order (“CMIC Order”) prohibiting U.S. persons, including the Funds, from purchasing or selling publicly traded securities (including publicly traded securities that are derivative of, or designed to provide exposure to, such securities) of any Chinese company identified as a “Chinese Military-Industrial Complex Company” (“CMIC”). This prohibition, effective August 2, 2021, expands on similar sanctions imposed by the prior administration on certain designated Chinese military companies (“CCMCs”) that took effect in January 2021. To the extent that any company in an Underlying Index is identified as a CMIC at any time (or was previously designated as a CCMC), it may have material adverse effect on a fund’s ability to track its Underlying Index.
8. Line of Credit
The Trust has entered into a senior unsecured credit facility with a syndication of banks which allows the Xtrackers MSCI All World ex US Hedged Equity ETF, Xtrackers MSCI Emerging Markets Hedged Equity ETF and certain other funds managed by the Advisor to borrow up to $105 million. Each Fund may borrow money under this credit facility to the extent necessary for temporary or emergency purposes, including the funding of shareholder redemption requests, trade settlements, and as necessary to distribute to shareholders any income necessary to maintain each Funds’ status as a regulated investment company. Borrowings are charged an interest rate of 1.25% per annum plus the greater of the Federal Funds Effective Rate or the Secured Overnight Financing Rate plus .10%. Each Fund may borrow up to the lesser of 33 percent of its net assets as permitted by the 1940 Act or 25 percent of adjusted total net assets. The Funds had no outstanding loans at May 31, 2023.
116
DBX ETF Trust
To the Shareholders of
Xtrackers MSCI All World ex US Hedged Equity ETF, Xtrackers MSCI Emerging Markets Hedged Equity ETF, Xtrackers MSCI Europe Hedged Equity ETF, Xtrackers MSCI Eurozone Hedged Equity ETF, Xtrackers MSCI Germany Hedged Equity ETF and Xtrackers MSCI Japan Hedged Equity ETF and the Board of Trustees of DBX ETF Trust
Opinion on the Financial Statements
We have audited the accompanying statements of assets and liabilities of Xtrackers MSCI All World ex US Hedged Equity ETF, Xtrackers MSCI Emerging Markets Hedged Equity ETF, Xtrackers MSCI Europe Hedged Equity ETF, Xtrackers MSCI Eurozone Hedged Equity ETF, Xtrackers MSCI Germany Hedged Equity ETF and Xtrackers MSCI Japan Hedged Equity ETF (collectively referred to as the “Funds”), (six of the funds constituting DBX ETF Trust (the “Trust”)), including the schedules of investments, as of May 31, 2023, and the related statements of operations for the year then ended, the statements of changes in net assets for each of the two years in the period then ended, the financial highlights for each of the five years in the period then ended and the related notes (collectively referred to as the “financial statements”). In our opinion, the financial statements present fairly, in all material respects, the financial position of each of the Funds (six of the funds constituting DBX ETF Trust) at May 31, 2023, and the results of their operations for the year then ended, the changes in their net assets for each of the two years in the period then ended and their financial highlights for each of the five years in the period then ended, in conformity with U.S. generally accepted accounting principles.
Basis for Opinion
These financial statements are the responsibility of the Trust’s management. Our responsibility is to express an opinion on each of the Funds’ financial statements based on our audits. We are a public accounting firm registered with the Public Company Accounting Oversight Board (United States) (“PCAOB”) and are required to be independent with respect to the Trust in accordance with the U.S. federal securities laws and the applicable rules and regulations of the Securities and Exchange Commission and the PCAOB.
We conducted our audits in accordance with the standards of the PCAOB. Those standards require that we plan and perform the audit to obtain reasonable assurance about whether the financial statements are free of material misstatement, whether due to error or fraud. The Trust is not required to have, nor were we engaged to perform, an audit of the Trust’s internal control over financial reporting. As part of our audits we are required to obtain an understanding of the internal control over financial reporting but not for the purpose of expressing an opinion on the effectiveness of the Trust’s internal control over financial reporting. Accordingly, we express no such opinion.
Our audits included performing procedures to assess the risks of material misstatement of the financial statements, whether due to error or fraud, and performing procedures that respond to those risks. Such procedures included examining, on a test basis, evidence regarding the amounts and disclosures in the financial statements. Our procedures included confirmation of securities owned as of May 31, 2023, by correspondence with the custodians, brokers and others; when replies were not received from brokers, we performed other auditing procedures. Our audits also included evaluating the accounting principles used and significant estimates made by management, as well as evaluating the overall presentation of the financial statements. We believe that our audits provide a reasonable basis for our opinion.

We have served as the auditor of one or more investment companies in the DWS family of funds since at least 1979, but we are unable to determine the specific year.
New York, New York
July 25, 2023
117
DBX ETF Trust
Regulatory Update — Tailored Shareholder Report
Effective January 24, 2023, the SEC amended the rules for mutual fund and exchange-traded fund (“ETF”) annual and semi-annual shareholder reports. The amended rules apply to mutual funds and ETFs that are registered on Form N-1A (i.e., open-end funds) and implement a new streamlined disclosure framework requiring “concise and visually engaging” shareholder reports highlighting key information, including a simplified expense presentation, performance information, portfolio holdings and certain fund statistics. The amended rules seek to simplify shareholder reporting by consolidating investor friendly data in one report and moving other data to Form N-CSR, creating a layered disclosure framework. Certain information from the Funds’ current shareholder reports, including the Funds’ investment portfolio, financial statements and financial highlights, will move to Form N-CSR. This information must be available online, delivered free of charge upon request and filed on a semiannual basis on Form N-CSR. Notably, the amended rules will require mutual funds and ETFs to prepare separate individual shareholder reports for each fund share class. The amendments also include a revised definition of “appropriate broad-based securities market index” that will affect performance presentations in the new streamlined reports and mutual fund and ETF prospectuses. The amended rules and related form amendments have a compliance date of July 24, 2024. At this time, management is evaluating the impact of the amended rules and form amendments on the content of the Funds’ current shareholder reports.
118
DBX ETF Trust
In accordance with Rule 22e-4 (the “Liquidity Rule”) under the Investment Company Act of 1940 (the “1940 Act”), your Fund has adopted a liquidity risk management program (the “Program”), and the Board has designated DBX Advisors LLC (the “Advisor”) as Program administrator. The Program is designed to assess and manage your Fund’s liquidity risk (the risk that the Fund would be unable to meet requests to redeem shares of the Fund without significant dilution of remaining investors’ interests in the Fund). The Advisor has designated a committee (the “Committee”) composed of personnel from multiple departments within an affiliate of the Advisor that is responsible for the implementation and ongoing administration of the Program, which includes assessing the Fund’s liquidity risk under both normal and reasonably foreseeable stressed conditions. Under the Program, every investment held by a Fund is classified on a daily basis into one of four liquidity categories based on estimations of the investment’s ability to be sold during designated timeframes in current market conditions without significantly changing the investment’s market value.
Xtrackers MSCI All World ex US Hedged Equity ETF, Xtrackers MSCI Europe Hedged Equity ETF, Xtrackers MSCI Eurozone Hedged Equity ETF, Xtrackers MSCI Germany Hedged Equity ETF and Xtrackers MSCI Japan Hedged Equity ETF
In February 2023, as required by the Program and the Liquidity Rule, the Advisor provided the Board with an annual written report (the “Report”) addressing the operation of the Program and assessing the adequacy and effectiveness of its implementation during the period from December 1, 2021 through November 30, 2022 (the “Reporting Period”). During the Reporting Period, your Fund was primarily invested in highly liquid investments (investments that the Fund anticipates can be converted to cash within three business days or less in current market conditions without significantly changing their market value). As a result, your Fund is not required to adopt, and has not adopted, a “Highly Liquid Investment Minimum” as defined in the Liquidity Rule. During the Reporting Period, your Fund did not approach the 15% limit imposed by the Liquidity Rule on holdings in illiquid investments (investments that cannot be sold or disposed of in seven days or less in current market conditions without the sale of the investment significantly changing the market value of the investment). Your Fund did not experience any issues meeting investor redemptions at any time during the Reporting Period. In the Report, the Advisor stated that it believes the Program has operated adequately and effectively to manage the Fund’s liquidity risk during the Reporting Period. The Advisor also reported that there were no material changes made to the Program during the Reporting Period.
Xtrackers MSCI Emerging Markets Hedged Equity ETF
In February 2023, as required by the Program and the Liquidity Rule, the Advisor provided the Board with an annual written report (the “Report”) addressing the operation of the Program and assessing the adequacy and effectiveness of its implementation during the period from December 1, 2021 through November 30, 2022 (the “Reporting Period”). During the Reporting Period, your Fund was primarily invested in highly liquid investments (investments that the Fund anticipates can be converted to cash within three business days or less in current market conditions without significantly changing their market value). As a result, your Fund is not required to adopt, and has not adopted, a “Highly Liquid Investment Minimum” as defined in the Liquidity Rule. During the Reporting Period, the Fund did experience a temporary breach of the 15% limit imposed by the Liquidity Rule on holdings in illiquid investments (investments that cannot be sold or disposed of in seven days or less in current market conditions without the sale of the investment significantly changing the market value of the investment). The breach was caused by the temporary reclassification of Chinese securities as illiquid due to an extended Chinese and Taiwan holiday market closure in January/February 2022. The temporary reclassification of Chinese securities caused the Fund to exceed the 15% limit on illiquid investments. Because a notification to the Fund’s board of the anticipated extended holiday closure was made before the start of the holiday closure no filing on Form N-RN was required. Also, because the holiday closure was anticipated in advance, no actions were needed to rebalance the Fund’s portfolio. Your Fund did not experience any issues meeting investor redemptions at any time during the Reporting Period. In the Report, the Advisor stated that it believes the Program has operated adequately and effectively to manage the Fund’s liquidity risk during the Reporting Period. The Advisor also reported that there were no material changes made to the Program during the Reporting Period.
119
DBX ETF Trust
Xtrackers MSCI All World ex-US Hedged Equity ETF, Xtrackers MSCI Emerging Markets Hedged Equity ETF, Xtrackers MSCI Europe Hedged Equity ETF, Xtrackers MSCI Eurozone Hedged Equity ETF, Xtrackers MSCI Germany Hedged Equity ETF, and Xtrackers MSCI Japan Hedged Equity ETF
Board Approval of Investment Advisory Agreement with DBX Advisors LLC
After discussions at the meeting of the Board of Trustees (“Board” or “Trustees”) held on February 15-16, 2023 (the “Meeting”), the Trustees, all of whom are the Independent Trustees (those not affiliated with DBX ETF Trust (the “Trust”) or its service providers), unanimously approved the continuance of the Investment Advisory Agreement with respect to Xtrackers MSCI All World ex-US Hedged Equity ETF, Xtrackers MSCI Emerging Markets Hedged Equity ETF, Xtrackers MSCI Europe Hedged Equity ETF, Xtrackers MSCI Eurozone Hedged Equity ETF, Xtrackers MSCI Germany Hedged Equity ETF, and Xtrackers MSCI Japan Hedged Equity ETF (each a “Fund,” and collectively, the “Funds”). The Independent Trustees were advised throughout the review and Meeting by K&L Gates LLP (“Independent Trustee Counsel”).
Before reaching their decision to approve the Investment Advisory Agreement for another annual period, the Independent Trustees evaluated the materials furnished to them in advance of the Meeting from DBX Advisors LLC (“DBX” or the “Advisor”) for purposes of reviewing the agreement’s terms, including statistical information prepared by Broadridge Financial Solutions Inc. (“Broadridge”) regarding (a) fee and expense information for each Fund (including the fee and expense components and any amounts waived or reimbursed) as compared to a peer group of other exchange-traded funds (“ETFs”) selected pursuant to Broadridge’s proprietary methodology (each, a “Peer Group”) and (b) each Fund’s tracking error as compared to its underlying index over the previous five years (or since inception, if shorter). The Independent Trustees met with representatives of the Advisor on February 13, 2023 to review financial reports and other information provided by the Advisor and inquire further with regard to the financial information provided, and asked questions of the Advisor during this meeting. The Independent Trustees also took into consideration the discussions they had with management before and during the Meeting and among themselves during their Executive Sessions held on February 15 and February 16, 2023.
The Independent Trustees also noted that they had received and should take into consideration a substantial amount of information furnished throughout the year at regular Board meetings, which information included, among other things, an analysis of each Fund’s investment performance, tracking error and related financial information, presentations given by DBX, as well as its periodic reports on brokerage commissions, portfolio execution and other services provided to the Funds.
In reaching its decision to continue in effect the Investment Advisory Agreement for another annual period, the Board considered all factors it believed relevant, including (1) the nature, extent and quality of the services provided to the Funds and their shareholders; (2) the financial resources of DBX and its resulting ability to perform its obligations under the Investment Advisory Agreement; (3) the competitiveness of the advisory fee; (4) the total cost of the services provided by and the profits realized by the Advisor from its relationship with the Funds; (5) the extent to which economies of scale have been realized, and if the Funds’ shareholders have benefitted from those economies; and (6) fall out benefits, if any, enjoyed by the Advisor.
The Board reached a determination, with the assistance of Independent Trustee Counsel and Vedder Price P.C. (“Trust Counsel”) and through the exercise of its business judgment, that approval of the Investment Advisory Agreement and the compensation to be received thereunder is in the best interests of each Fund and its shareholders as well as consistent with the Board’s duties under state and federal law. The Board reached this conclusion based on multiple factors.
The Board considered the following in determining whether to approve the Investment Advisory Agreement:
Nature, Extent and Quality of Services. The Board reviewed in detail the nature, extent and quality of services provided and the risks incurred by the Advisor under the Investment Advisory Agreement. In doing so, the Board considered the information it had received from and the discussions it had with the Advisor continuously during the prior year, in addition to the information the Advisor had provided in response to the Board’s requests prior to the Meeting. The Board considered that these services include, among other things, furnishing a continuous investment program for the Funds, including arranging for, or implementing, the
120
DBX ETF Trust
Board Considerations in Approval of Investment Advisory Contracts (Unaudited) (Continued)
purchase and sale of portfolio securities, the provision of general corporate services such as portfolio management compliance services and the preparation and filing of certain reports on behalf of the Trust. The Board also considered, among other things, the professional experience, qualifications and performance of the senior management and key professional personnel of the Advisor, including portfolio management.
The Board considered that the Advisor provides, at its own expense, office facilities and equipment for use by the Funds and supervisory persons responsible for supervising and monitoring the Trust’s service providers. The Board also considered that the Advisor pays or arranges for the compensation of officers of the Trust who are also officers or employees of the Advisor or one of its DWS Group affiliates, except as may otherwise be determined by the Board. In addition, the Board considered that the Advisor arranges for the provision of transfer agency, custody, fund administration and accounting, and other non-distribution services necessary for the Funds’ operations. The Board also considered that in addition to managing the Funds’ portfolios directly, the Advisor provides oversight of day-to-day operations, including monitoring tracking error, providing services in connection with the creation and redemption of creation units and assistance in meeting legal, compliance and regulatory requirements applicable to the Funds.
The Board considered the information regarding each Fund’s tracking error compared to its underlying index that had been provided by the Advisor and by Broadridge. The Board took note of the detailed information provided by the Advisor throughout the year with respect to each Fund’s tracking error and the sources thereof. The Trustees noted that tracking error for each Fund during the year was in an expected range.
Based on its review, the Board concluded that the nature, extent, and quality of services provided by the Advisor under the Investment Advisory Agreement are reasonable and appropriate in relation to the fees paid to the Advisor, taking special consideration of the fact that the advisory fee is a unitary fee and, as a result, a portion of the unitary advisory fee will be used to compensate the Funds’ service providers. The Board considered the staffing of the Advisor, including the training, qualifications and experience of investment personnel in managing the Funds. The Board also considered the expertise of the Advisor in supervising third party service providers to the Funds, such as the administrator and the custodian, noting the Advisor’s extensive work with these service providers (including onsite due diligence sessions) to conduct such supervision. The Board further considered the compliance program of the Advisor, which supports the Funds’ compliance program.
Advisor’s Financial Resources. In connection with the assessment of the ability of the Advisor to perform its duties under the Investment Advisory Agreement, the Board considered the Advisor’s financial condition and whether it has the resources necessary to carry out its functions. The Board concluded that the Advisor has the financial resources necessary to perform its obligations under the Investment Advisory Agreement.
Reasonableness of Advisory Fee. The Board compared each Fund’s advisory fee and total expenses to those of the other ETFs in its Peer Group. The Board noted that due to the special characteristics of certain Funds, there were limitations faced by Broadridge in providing comparable funds in the Peer Groups and the information in the Broadridge reports accordingly may or may not provide meaningful direct comparisons to the Funds. The Board noted that the Peer Groups for currency-hedged Funds included ETFs that were not currency hedged. The Board also noted that the following Funds had advisory fees and/or total expenses (after waivers/reimbursements) that were above the average and/or median of their respective Peer Groups:
| — | Xtrackers MSCI All World ex-US Hedged Equity ETF |
| — | Xtrackers MSCI Emerging Markets Hedged Equity ETF |
| — | Xtrackers MSCI Europe Hedged Equity ETF |
| — | Xtrackers MSCI Eurozone Hedged Equity ETF |
| — | Xtrackers MSCI Germany Hedged Equity ETF |
| — | Xtrackers MSCI Japan Hedged Equity ETF |
The Board considered, however, the following additional factors in connection with those Funds:
| — | The peer group for each of Xtrackers MSCI Emerging Markets Hedged Equity ETF and Xtrackers MSCI All World ex-US Hedged Equity ETF did not contain any other currency-hedged ETFs. In addition, Xtrackers MSCI Emerging Markets Hedged Equity ETF’s advisory fees and total expenses were lower than the largest fund included in its peer group. |
121
DBX ETF Trust
Board Considerations in Approval of Investment Advisory Contracts (Unaudited) (Continued)
| — | The other currency-hedged Funds had advisory fees and total expenses that were competitive with other currency-hedged ETFs in their respective Peer Groups. |
The Board accordingly noted that each Fund’s fee is competitive with the fees of applicable peer ETFs.
The Board considered that the fee for each of the Funds is a unitary fee pursuant to which the Advisor pays all of the Funds’ costs (subject to certain specified exceptions). The Board considered that each Fund’s fee had been priced to scale when it was established. The Board also considered that each Fund’s portfolio is managed on a day-to-day basis by the Advisor and that the Advisor also provides oversight of day-to-day operations, including monitoring tracking error, providing services in connection with creation and redemption units and assistance in meeting legal and regulatory requirements applicable to the Funds. Based on its review, the Board concluded that the advisory fee for each Fund is reasonable in light of the services provided.
Costs of Services and Profitability. The Board considered the expenses of the Advisor in developing and rendering services provided to the Funds and the information provided by the Advisor to the Board regarding the Funds’ profitability. The Board considered that the Advisor had provided extensive information about the Advisor’s profitability and the Advisor’s methodology in determining profitability. While the Advisor had provided information about the Advisor’s expenses relating to marketing the Funds, the Board considered the Advisor’s profitability without accounting for such expenses. The Board determined that, although only some of the Funds were profitable as of this time, the Advisor’s profitability with respect to each profitable Fund was not excessive. The Board considered whether the Advisor would benefit in other ways from its relationships with the Funds and concluded that there were no material fall-out benefits likely to accrue to the Advisor related to the operation of the Funds.
Economies of Scale. The Board considered that certain Funds had attracted a substantial amount of assets, but determined that those Funds were not experiencing economies of scale beyond what was reflected in each Fund’s unitary fee, which the Board noted was very competitive. The Board considered that the other Funds were not experiencing economies of scale at this time and determined to revisit this matter after the Funds had attracted more assets. The Board also acknowledged that the concept of economies of scale is a complex subject as to determining with a fair degree of certainty whether economies of scale exist, to what extent they exist, whether scale can result in additional expenses, and alternative ways advisers can share benefits of economies of scale.
Given all the information available to it and considering all material factors, the Board concluded that the Investment Advisory Agreement was fair and reasonable and it was unanimously approved.
122
DBX ETF Trust
Identification and Background
The Board has responsibility for the overall management and operations of the funds, including general supervision of the duties performed by the Advisor and other service providers. Each Board Member serves until his or her successor is duly elected or appointed and qualified. Each officer serves until he or she resigns, is removed, dies, retires or becomes disqualified.
The Trust currently has three Board Members. The three Independent Board Members have no affiliation or business connection with the Advisor or any of its affiliated persons and do not own any stock or other securities issued by the Advisor.
The Independent Board Members of the Trust, their term of office and length of time served, their principal business occupations during the past five years, the number of portfolios in the fund complex (defined below) overseen by each Independent Board Member, and other directorships, if any, held by the Board Members are shown below. The fund complex includes all registered open- and closed-end funds (including all of their portfolios) advised by the Advisor and any registered funds that have an investment advisor that is an affiliated person of the Advisor. As of the date of this shareholder report, the fund complex consists of the funds in the Trust, as well as the registered funds advised by affiliates of the Advisor.
Shareholder Communications to the Board. Shareholders may send communications to the Trust’s Board by addressing the communications directly to the Board (or individual Board Members) and/or otherwise clearly indicating in the salutation that the communication is for the Board (or individual Board Members). The shareholder may send the communication to either the Trust’s office or directly to such Board members c/o 875 Third Avenue, New York, NY 10022. Other shareholder communications received by the Trust not directly addressed and sent to the Board will be reviewed and generally responded to by management. Such communications will be forwarded to the Board at management’s discretion based on the matters contained therein.
| Independent Board Members |
||||||
| Name, Year of Birth, Position with the Trust and Length of Time Served(1) |
Business Experience and Directorships During the Past 5 Years |
Number of Portfolios in Fund Complex Overseen |
Other Directorships Held by Board Member | |||
| Stephen R. Byers (1953) Chairperson since 2016, and Board Member since 2011 (formerly, Lead Independent Board Member, 2015-2016) |
Independent Director (2011- present); Independent Consultant (2014-present); Director of Investment Management, the Dreyfus Corporation (2000-2006) and Vice Chairman and Chief Investment Officer, the Dreyfus Corporation (2002-2006). | 42 | The Arbitrage Funds, Sierra Income Corporation, Mutual Fund Directors Forum | |||
| George O. Elston (1964) Board Member since 2011, Chairperson of the Audit Committee since 2015 |
Chief Financial Officer, EyePoint Pharmaceuticals, Inc. (2019-present); Chief Financial Officer, Enzyvant (2018-2019); Chief Executive Officer, 2X Oncology, Inc. (2017- 2018); Senior Vice President and Chief Financial Officer, Juniper Pharmaceuticals, Inc. (2014-2016); Senior Vice President and Chief Financial Officer, KBI BioPharma Inc. (2013-2014); Managing Partner, Chatham Street Partners (2010-2013). | 42 | — | |||
| J. David Officer (1948) Board Member since 2011, Chairperson of the Nominating Committee since 2015 | Independent Director (2010- present); Vice Chairman, the Dreyfus Corporation (2006-2009); President, The Dreyfus Family of Funds, Inc. (2006-2009). | 42 | (Chairman of) Ilex Management Ltd; Old Westbury Funds |
123
DBX ETF Trust
Board Members and Officers (Unaudited) (Continued)
| Officers(2) |
||||||
| Name, Year of Birth, Position with the Trust and Length of Time Served(3) |
Business Experience and Directorships During the Past 5 Years | |||||
| Freddi Klassen(4) (1975) President and Chief Executive Officer, 2016-present |
Chief Administrative Officer Investment Division Americas, of DWS Investment Management Americas, Inc. and Manager (since 2023) and Chief Operating Officer of the Advisor (2016-present). Formerly: Programmes (Head 2021-2023), of DWS Investment Management Americas, Inc.; Chief Operating Officer in the Americas for the Traditional Asset Classes Department (2014-2020); Global Chief Operating Officer for Equities Technology in the Investment Bank Division at Deutsche Bank AG (2013-2014); Chief Operating Officer for Exchange Traded Funds and Systematic Funds in Europe (2008-2013). | |||||
| Diane Kenneally(4) (1966) Treasurer, Chief Financial Officer and Controller, 2019-present |
Fund Administration Treasurer’s Office (Co-Head since 2018), of DWS Investment Management Americas, Inc.; Chief Financial Officer and Treasurer for DWS US registered investment companies advised by DWS Investment Management Americas, Inc. (2018- present); Treasurer and Chief Financial Officer, The European Equity Fund, Inc., The New Germany Fund, Inc. and The Central and Eastern Europe Fund, Inc. (2018-present); formerly: Assistant Treasurer for the DWS funds (2007-2018). | |||||
| Frank Gecsedi(4) (1967) Chief Compliance Officer, 2010-present |
AFC Compliance US (Senior Team Lead), of DWS Investment Management Americas, Inc.; Compliance Department (2016-present), Vice President in the Deutsche Asset Management Compliance Department at Deutsche Bank AG (2013-2016) and Chief Compliance Officer of the Advisor (2010-present); Chief Compliance Officer of DWS Distributors, Inc. (2019-2022); Vice President in Deutsche Bank’s Global Markets Legal, Risk and Capital Division (2010-2012). | |||||
| Bryan Richards(4) (1978) Vice President, 2016-present |
Portfolio Engineering, Systematic Investments Solutions (Head), of DWS Investment Management Americas, Inc. (2018-present); Portfolio Manager in the Passive Asset Management Department at DWS (2011-present); Primary Portfolio Manager for the PowerShares DB Commodity ETFs (2011-2015). | |||||
| John Millette(5) (1962) Secretary, 2020-present |
Legal (Associate General Counsel), DWS US Retail Legal (2003-present), of DWS Investment Management Americas, Inc.; Vice President and Secretary of DWS US registered investment companies advised by DWS Investment Management Americas, Inc. (1999-present); Chief Legal Officer, DWS Investment Management Americas, Inc. (2015- present); Director and Vice President of DWS Trust Company (2016-present); Vice President, DBX Advisors LLC (2021-present); Secretary, The European Equity Fund, Inc., The New Germany Fund, Inc. and The Central and Eastern Europe Fund, Inc. (2011- present); formerly: Secretary of Deutsche Investment Management Americas Inc. (2015-2017); and Assistant Secretary of DBX ETF Trust (2019-2020). | |||||
124
DBX ETF Trust
Board Members and Officers (Unaudited) (Continued)
| Name, Year of Birth, Position with the Trust and Length of Time Served(3) |
Business Experience and Directorships During the Past 5 Years | |||||
| Caroline Pearson(5) (1962) Assistant Secretary, 2020-present |
Legal (Senior Team Lead), DWS US Retail Legal, of DWS Investment Management Americas, Inc.; Chief Legal Officer of DWS US registered investment companies advised by DWS Investment Management Americas, Inc. (2010-present); Chief Legal Officer, DBX Advisors LLC and DBX Strategic Advisors LLC (2020- present); Chief Legal Officer, The European Equity Fund, Inc., The New Germany Fund, Inc. and The Central and Eastern Europe Fund, Inc. (2012-present); formerly: Secretary, Deutsche AM Distributors, Inc. (2002-2017); Secretary, Deutsche AM Service Company (2010-2017); and Chief Legal Officer, DBXStrategic Advisors LLC (2020-2021). | |||||
| Paul Antosca(5) (1957) Assistant Treasurer, 2019-present |
Fund Administration Tax (Head), of DWS Investment Management Americas, Inc.; Assistant Treasurer for DWS US registered investment companies advised by DWS Investment Management Americas, Inc. (2007-present). | |||||
| Jeffrey Berry(5) (1959) Assistant Treasurer, 2019-present |
Fund Administration (Senior Specialist), of DWS Investment Management Americas, Inc. | |||||
| Sheila Cadogan(5) (1966) Assistant Treasurer, 2019-present |
Fund Administration Treasurer’s Office (Co-Head since 2018), of DWS Investment Management Americas, Inc.; Assistant Treasurer for DWS US registered investment companies advised by DWS Investment Management Americas, Inc. (2017-present); Director and Vice President, DWS Trust Company (2018- present); Assistant Treasurer, The European Equity Fund, Inc., The New Germany Fund, Inc. and The Central and Eastern Europe Fund, Inc. (2018-present). | |||||
| Christina A. Morse(6) (1964) Assistant Secretary, 2017-present |
Vice President at BNY Mellon Asset Servicing (2014- present); Vice President and Counsel at Lord Abbett & Co. LLC (2013-2014). | |||||
| Christian Rijs(4) (1980) Anti-Money Laundering Compliance Officer, since October 21, 2021 |
Senior Team Lead Anti-Financial Crime and Compliance, DWS Investment Management Americas, Inc.; AML Officer, DWS Trust Company (since November 2, 2021); AML Officer, DWS US registered investment companies advised by DWS Investment Management Americas, Inc. (since October 6, 2021); AML Officer, The European Equity Fund, Inc., The New Germany Fund, Inc. and The Central and Eastern Europe Fund, Inc. (since November 12, 2021); formerly: DWS UK & Ireland Head of Anti-Financial Crime and MLRO. | |||||
| (1) | The length of time served is represented by the year in which the Board Member joined the Board. |
| (2) | As a result of their respective positions held with the Advisor and its affiliates, these individuals are considered “interested persons” of the Advisor within the meaning of the 1940 Act. Interested persons receive no compensation from the Funds. |
| (3) | The length of time served is represented by the year in which the officer was first elected to the Trust in such capacity. |
| (4) | Address: 875 Third Avenue, New York, New York 10022. |
| (5) | Address: 100 Summer Street, Boston, MA 02110. |
| (6) | Address: BNY Mellon Asset Servicing, 240 Greenwich Street, New York, NY 10286. |
The Funds’ Statement of Additional Information (“SAI”) includes additional information about the Funds’ Board Members. The SAI is available by calling 855-329-3837, or on the Company’s website at www.Xtrackers.com.
125
DBX ETF Trust
Proxy Voting Policies and Procedures
The Funds’ policies and procedures for voting proxies for portfolio securities and information about how each Fund voted proxies related to its portfolio securities during the most recent 12-month period ended June 30 are available on our Web site — www.Xtrackers.com (click on “Resources” and “Proxy Voting” at the top of the page) — or on the SEC’s Web site — www.sec.gov. To obtain a written copy of the Funds’ policies and procedures without charge, upon request, call us toll free at 855-329-3837.
Portfolio Holdings Information
The Funds are required to file their complete schedule of portfolio holdings with the SEC for their first and third fiscal quarters on Form N-PORT. Copies of the filings are available without charge, upon request on the SEC’s website at www.sec.gov and are available by calling the Trust at 855-329-3837.
Information about each Fund’s portfolio holdings is available daily at www.Xtrackers.com.
Discount/Premium Information
Information regarding how often shares of each Fund traded on NYSE Arca or Cboe, as applicable, at a price above (i.e., at a premium) or below (i.e., at a discount) the NAV of the Fund can be found at www.Xtrackers.com.
Tax Information
Form 1099-DIV and other year-end tax information provide shareholders with actual calendar year amounts that should be included in their tax returns. Shareholders should consult their tax advisors.
Each Fund designates the following amounts or, if subsequently determined to be different, the maximum allowable for its period ended May 31, 2023.
| Qualified Dividend Income* |
||||
| Xtrackers MSCI All World ex US Hedged Equity ETF |
41% | |||
| Xtrackers MSCI Emerging Markets Hedged Equity ETF |
72% | |||
| Xtrackers MSCI Europe Hedged Equity ETF |
100% | |||
| Xtrackers MSCI Eurozone Hedged Equity ETF |
100% | |||
| Xtrackers MSCI Germany Hedged Equity ETF |
100% | |||
| Xtrackers MSCI Japan Hedged Equity ETF |
100% | |||
* The above percentage is based on ordinary income dividends paid to shareholders during each Fund’s fiscal year.
Each Fund intends to elect to pass through to shareholders the credit for taxes paid to foreign countries. The gross foreign source income and foreign taxes paid are as follows:
| Gross Foreign Income |
Foreign Taxes Paid | |||||||
| Xtrackers MSCI All World ex US Hedged Equity ETF |
$ | 4,653,324 | $ | 386,887 | ||||
| Xtrackers MSCI Emerging Markets Hedged Equity ETF |
3,237,757 | 333,369 | ||||||
| Xtrackers MSCI Eurozone Hedged Equity ETF |
736,719 | 78,759 | ||||||
| Xtrackers MSCI Germany Hedged Equity ETF |
323,719 | 44,777 | ||||||
| Xtrackers MSCI Japan Hedged Equity ETF |
5,862,697 | 422,682 | ||||||
126
DBX ETF Trust
This report is intended for the shareholders of DBX ETF Trust.
This report must be preceded or accompanied by a prospectus.
Investing involves risk, including the possible loss of principal. Stocks may decline in value. Foreign investing involves greater and different risks than investing in U.S companies, including currency fluctuations, less liquidity, less developed or less efficient trading markets, lack of comprehensive company information, political instability and differing auditing and legal standards. Emerging markets tend to be more volatile and less liquid than the markets of more mature economies, and generally have less diverse and less mature economic structures and less stable political systems than those of developed countries. Special risks associated with investments in Chinese companies include exposure to currency fluctuations, less liquidity, less developed or less efficient trading markets, lack of comprehensive company information, political instability and differing auditing and legal standards the nature and extent of intervention by the Chinese government in the Chinese securities markets, and the potential unavailability of A shares. The U.S. government has imposed restrictions on the ability of U.S. investors to hold and/or acquire securities of certain Chinese companies. To the extent that an Underlying Index includes such a security, and the Fund excludes it, the Fund’s tracking error may increase, and the performance of the Fund and Underlying Index may diverge. The European financial markets have recently experienced volatility and adverse trends in recent years due to concerns about economic downturns or rising government debt levels in several European countries, including Greece, Ireland, Italy, Portugal and Spain. A default or debt restructuring by any European country would adversely impact holders of that country’s debt, and sellers of credit default swaps linked to that country’s creditworthiness (which may be located in countries other than those listed in the previous sentence). These events have adversely affected the exchange rate of the euro, the common currency of certain EU countries, and may continue to significantly affect every country in Europe, including countries that do not use the euro. Italy, Portugal and Spain currently have high levels of debt and public spending, which may stifle economic growth, contribute to prolonged periods of recession or lower sovereign debt ratings and adversely impact investments in the Fund. The Funds’ use of forward currency contracts may not be successful in hedging currency exchange rates changes and could eliminate some or all of the benefit of an increase in the value of a foreign currency versus the U.S. dollar. Funds investing in a single industry, country or in a limited geographic region generally are more volatile than more diversified funds. Investing in derivatives entails special risks relating to liquidity, leverage and credit that may reduce returns and/or increase volatility. DBGR is non-diversified and can take larger positions in fewer issues, increasing the Fund’s potential risk. Performance of the Funds may diverge from that of the Underlying Index due to operating expenses, transaction costs, cash flows, use of sampling strategies or operational inefficiencies. An investment in these Funds should be considered only as a supplement to a complete investment program for those investors willing to accept the risks associated with the Funds. Please read the prospectus for more information.
War, terrorism, sanctions, economic uncertainty, trade disputes, public health crises, natural disasters, climate change and related geopolitical events have led and, in the future, may lead to significant disruptions in U.S. and world economies and markets, which may lead to increased market volatility and may have significant adverse effects on the Funds and their investments.
On January 31, 2020, the United Kingdom officially withdrew from the EU pursuant to a withdrawal agreement, providing for a transition period in which the United Kingdom negotiated and finalized a trade deal with the EU, the EU-UK Trade and Cooperation Agreement provisionally applied effective January 1, 2021. As a result, as of January 1, 2021 the United Kingdom is no longer part of the EU customs union and single market, nor is it subject to EU policies and international agreements. The long-term impact of the United Kingdom’s withdrawal from the EU is still unknown and could have adverse economic and political effects on the United Kingdom, the EU and its member countries, and the global economy, including financial markets and asset valuations.
Shares of the Funds are bought and sold at market price (not NAV) throughout the day on the NYSE Arca, Inc. Transactions in Fund shares may result in brokerage commissions and may generate tax consequences. There can be no assurance that an active trading market for shares of a Fund will develop or be maintained.
DBX ETF Trust Funds are distributed by ALPS Distributors, Inc. (“ALPS”). The Funds are managed by DBX Advisors LLC which is not affiliated with ALPS.
The brand DWS represents DWS Group GmbH & Co. KGaA and any of its subsidiaries such as DWS Distributors, Inc. which offers investment products or DWS Investment Management Americas, Inc. and RREEF America L.L.C. which offer advisory services.
The Funds or securities referred to herein are not sponsored, endorsed, issued, sold or promoted by MSCI, and MSCI bears no liability with respect to any such Funds or securities or any index on which such Funds or securities are based. The prospectus contains a more detailed description of the limited relationship MSCI has with DBX Advisors LLC and any related funds.
Copyright © 2022 DWS Group. All rights reserved. XtrackersTM is a trademark of DWS Investment GmbH. All other trademarks, servicemarks or registered trademarks are the property of their respective owners.
Not FDIC Insured | No Bank Guarantee | May Lose Value
DBX ETF Trust
| Investment advisor DBX Advisors LLC 875 Third Avenue New York, NY 10022 |
Administrator, custodian, fund accounting agent, lending The Bank of New York Mellon 240 Greenwich Street New York, NY 10286 |
Distributor ALPS Distributors, Inc. 1290 Broadway Suite 1000 Denver, CO 80203 | ||
| Independent registered public accounting firm Ernst & Young LLP One Manhattan West New York, NY, 10001 |
Legal counsel Vedder Price P.C. 1633 Broadway New York, NY 10019 |
|||
R-35361-10 (7/23) DBX005557 (7/24)
May 31, 2023
Annual Report
DBX ETF Trust
Xtrackers MSCI EAFE Hedged Equity ETF (DBEF)

DBX ETF Trust
| Page | ||||
| 1 | ||||
| 2 | ||||
| 4 | ||||
| 6 | ||||
| 7 | ||||
| 22 | ||||
| 23 | ||||
| 24 | ||||
| 25 | ||||
| 26 | ||||
| 34 | ||||
| 35 | ||||
| 36 | ||||
| Board Considerations in Approval of Investment Advisory Contracts |
37 | |||
| 40 | ||||
| 43 | ||||
To our Shareholders: (Unaudited)
Dear shareholder,
We are pleased to provide this annual report for our Xtrackers MSCI EAFE Hedged Equity ETF for the period ended May 31, 2023.
Globally, economic recovery was the main priority for all economies amid elevated inflation, hawkish monetary policies of central banks, and escalating geopolitical tensions across the globe. Growing inflation in both developed and emerging economies affected the cost of living, prompting major central banks to resort to aggressive interest rate hikes. Market sentiment turned positive during the latter half of the year, as China’s reopening lent hope industrial productivity issues and supply chain bottlenecks in recent years would soon end. Toward the end of the reporting period, concerns around the U.S. defaulting on its debt and negotiations to increase the debt ceiling dominated the headlines.
The U.S. economy expanded during the reporting period, driven by robust consumer spending and solid government investments. The labor market remained resilient even though wage growth slowed, as hiring shifted from the industries that had grown rapidly during the pandemic-induced lockdowns to in-person service industries. Consumer confidence has been dipping since the start of the year amid worries about the near-term trajectory of the economy. Inflation peaked in June 2022 before cooling in second half of 2022, but core CPI1 remained elevated, due to high energy prices, which partially influenced the U.S. Federal Reserve Board’s decision to hike interest rates. Consequently, U.S. equity markets witnessed heightened volatility, but still advanced over the reporting period.
As the war in Ukraine entered its second year, the Eurozone economy continued its battle with heightened inflation in the region. The Eurozone CPI numbers continued to surpass wage growth rate, weighing on consumption demand. The European Central Bank (ECB), like other developed central banks, continued to hike lending rates, which took a toll on the economy. GDP2 numbers were negative quarter-over-quarter in three of the four quarters during the reporting period. Eurozone GDP expanded 0.1% during Q1 2023 on budgetary support measures from the ECB and retreating energy prices. Plans to move to a sustainable mix of fossil fuels and sustainable energy could play a major role in stabilizing the heavily-energy-reliant economy in the months to come.
In the Pacific, the Bank of Japan (BoJ) remained accommodative to prop up economic recovery, while the rest of the developed world’s central banks maintained their tightening stance. The BoJ used yield curve control, the practice of buying bonds at a variable rate to control interest rates, to control the shape of the yield curve and suppress short- to medium-term rates to spur healthy inflation in the country. Consumer confidence in Japan rose significantly since the start of the reporting period. Australia’s CPI peaked and reached the highest level in 20 years. The Reserve Bank of Australia (RBA) announced it wanted to keep inflation within its 2-3% target band. However, it also said it would not raise interest rates too quickly, as this could derail the economic recovery. The RBA has kept the interest rate unchanged since November 2022 — the lowest in the RBA’s history — and plans to maintain it for a while as it assesses the impact of accelerating inflation on the economy.
Central banks worldwide remain cautious about global developments and how they could affect the economic recovery. Given the lag in the effects of interest rate hikes, economies are treading carefully to assess the effects of their decisions on ordinary citizens. The recent banking crisis in the U.S. and Europe has added to worries the Fed and the ECB may not be done with their tightening stance just yet. China’s recovery will likely play an integral role in the recovery, as industrial productivity growth and increased income could buoy further investments.
Sincerely,
/s/ Freddi Klassen
Freddi Klassen
President and Chief Executive Officer
1 The Consumer Price Index (CPI) is a measure of the average change overtime in the prices paid by urban consumers for a market basket of consumer.
2 Gross domestic product (GDP) is the monetary value of all finished goods and services produced within a country’s borders within a specific time period.
Assumptions, estimates and opinions contained in this document constitute our judgment as of the date of the document and are subject to change without notice. Any projections are based on a number of assumptions as to market conditions and there can be no guarantee that any projected results will be achieved. Past performance is not a guarantee of future results.
1
DBX ETF Trust
Xtrackers MSCI EAFE Hedged Equity ETF (DBEF)
The Xtrackers MSCI EAFE Hedged Equity ETF (DBEF) seeks investment results that correspond generally to the performance, before fees and expenses, of the MSCI EAFE US Dollar Hedged Index (the DBEF Index). The DBEF Index is designed to provide exposure to equity securities in developed international stock markets while at the same time mitigating exposure to fluctuation between the value of the U.S. dollar and select non-U.S. currencies. For the 12-month period ended May 31, 2023, DBEF returned 9.62%, compared to the DBEF Index return of 9.82%.
The majority of the sectors contributed positively to performance during the period with the greatest contribution coming from Consumer Discretionary, Industrials and Information Technology, while Materials, Real Estate and Communication Services sectors detracted most from the performance. From a geographical perspective, most countries contributed positively to performance with the greatest contributions coming from France, Japan and Germany. However, Australia, Hong Kong and Norway contributed negatively to the performance. The Fund entered into forward foreign currency contracts during the period to hedge against changes in the value of the U.S. dollar against specified non-U.S. currencies. The currency hedging strategy contributed positively to performance.
*************************
Performance data quoted represents past performance and does not guarantee future results. Investment returns and principal value of an investment will fluctuate so that an investor’s shares, when sold or redeemed, may be worth more or less than their original cost. Current performance may be lower or higher than the performance data quoted. To obtain the most recent month-end performance data visit www.Xtrackers.com. Returns assume that dividends and capital gains distributions have been reinvested. See pages 4-5 of this report for additional performance information, including performance data based on market value. The views expressed in this report reflect those of the portfolio management team only through the end of the period of the report as stated on the cover. The management team’s views are subject to change at any time based on market and other conditions and should not be construed as a recommendation. Current and future portfolio holdings are subject to risk.
2
This Page is Intentionally Left Blank
3
DBX ETF Trust
Xtrackers MSCI EAFE Hedged Equity ETF (DBEF)
The Xtrackers MSCI EAFE Hedged Equity ETF (the “Fund”), using a “passive” or indexing investment approach, seeks investment results that correspond generally to the performance, before fees and expenses, of the MSCI EAFE US Dollar Hedged Index (the “Underlying Index”). The Underlying Index is designed to track developed market performance while mitigating exposure to fluctuations between the value of the U.S. dollar and the currencies of the countries included in the Underlying Index. The MSCI EAFE Index is an equity index which captures large- and mid-cap representation across developed markets countries around the world, excluding the United States and Canada. It is not possible to invest directly into an index.
| Performance as of May 31, 2023 |
| Average Annual Total Return | ||||||||
| Net Asset Value | Market Value | MSCI EAFE US Dollar |
MSCI EAFE Index | |||||
| One Year |
9.62% | 9.93% | 9.82% | 3.06% | ||||
| Five Year |
7.52% | 7.61% | 7.72% | 3.21% | ||||
| Ten Year |
7.91% | 7.99% | 8.20% | 4.56% | ||||
| Cumulative Total Returns | ||||||||
| Net Asset Value | Market Value | MSCI EAFE US Dollar |
MSCI EAFE Index | |||||
| One Year |
9.62% | 9.93% | 9.82% | 3.06% | ||||
| Five Year |
43.71% | 44.28% | 45.02% | 17.11% | ||||
| Ten Year |
114.04% | 115.75% | 120.02% | 56.22% | ||||
Past performance is no guarantee of future results. Current performance may be lower or higher than the performance data quoted. Performance data current to the most recent month-end is available at www.Xtrackers.com. Performance results assume reinvestment of all dividends and capital gain distributions and do not reflect the deduction of taxes that a shareholder would pay on fund distributions or on the sale of fund shares or redemption of fund creation units. The investment return and principal value of shares will vary with changes in market conditions. Shares may be worth more or less than their original cost when they are sold in the market or redeemed. Performance for certain funds may reflect a waiver of a portion of the unitary advisory fee. Without such waiver, performance would have been lower. The gross expense ratio of the Fund, as stated in the fee table of the prospectus dated October 1, 2022, was 0.35%, and may differ from the expense ratio disclosed in the Financial Highlights table in this report.
The Fund’s net asset value or “NAV” is calculated by dividing the value of the Fund’s total assets less total liabilities by the number of shares outstanding. The price used to calculate market return (“Market Price”) is determined by using the midpoint between the highest bid and the lowest offer on the primary stock exchange on which shares of a fund are listed for trading, as of the time that such fund’s NAV is calculated. Since shares of a fund may not have traded in the secondary market until after the fund’s inception, for the period from inception to the first day of secondary trading, the NAV of the fund is used as a proxy for the Market Price to calculate market returns. Market and NAV returns assume that dividends and capital gain distributions have been reinvested at Market Price and NAV, respectively.
An index is a statistical composite that tracks a specified financial market or sector. Unlike a fund, an index does not actually hold a portfolio of securities and therefore does not incur the expenses incurred by a fund. These expenses negatively impact fund performance. Also, market returns do not include brokerage commissions that may be payable on secondary market transactions. If brokerage commissions were included, market returns would be lower.
Generally accepted accounting principles require adjustments to be made to the net assets of the Fund at period end for financial reporting purposes only, and as such, the total return based on the unadjusted net asset value per share may differ from the total return reported in the financial highlights.
4
DBX ETF Trust
Performance Summary (Unaudited)
Xtrackers MSCI EAFE Hedged Equity ETF (DBEF) (Continued)
| Growth of an Assumed $10,000 Investment |

| Sector Diversification* as of May 31, 2023 |
| Financials |
17.9% | |||
| Industrials |
15.9% | |||
| Health Care |
13.6% | |||
| Consumer Discretionary |
12.2% | |||
| Consumer Staples |
10.2% | |||
| Information Technology |
8.5% | |||
| Materials |
7.3% | |||
| Communication Services |
4.3% | |||
| Energy |
4.2% | |||
| Utilities |
3.5% | |||
| Real Estate |
2.4% | |||
|
|
|
|||
| Total |
100.0% |
| Ten Largest Equity Holdings as of May 31, 2023 (14.8% of Net Assets) |
| Description | % of Net Assets | |||
| Nestle SA (Switzerland) |
2.1% | |||
| ASML Holding NV (Netherlands) |
1.9% | |||
| Novo Nordisk A/S (Denmark) |
1.7% | |||
| LVMH Moet Hennessy Louis Vuitton SE (France) |
1.6% | |||
| Roche Holding AG (Switzerland) |
1.5% | |||
| AstraZeneca PLC (United Kingdom) |
1.5% | |||
| Novartis AG (Switzerland) |
1.3% | |||
| Shell PLC (United Kingdom) |
1.2% | |||
| HSBC Holdings PLC (United Kingdom) |
1.0% | |||
| Toyota Motor Corp. (Japan) |
1.0% | |||
| Country Diversification* as of May 31, 2023 |
| Japan |
22.4% | |||
| United Kingdom |
14.1% | |||
| France |
11.8% | |||
| Switzerland |
11.0% | |||
| Germany |
8.5% | |||
| Australia |
7.2% | |||
| Netherlands |
4.8% | |||
| Denmark |
3.1% | |||
| Sweden |
3.1% | |||
| Hong Kong |
2.7% | |||
| Spain |
2.6% | |||
| Italy |
2.0% | |||
| Other |
6.7% | |||
|
|
|
|||
| Total |
100.0% |
* As a percent of total investments excluding securities lending collateral and cash equivalents.
Portfolio holdings and characteristics are subject to change. For more complete details about the Fund’s investment portfolio see page 7.
5
DBX ETF Trust
As a shareholder of the Fund, you incur two types of costs: (1) transaction costs, including brokerage commissions paid on purchases and sales of fund shares, and (2) ongoing costs, including unitary advisory fees and other Fund expenses. In the most recent six-month period the Fund limited these expenses; had it not done so, expenses would have been higher. The expense examples below are intended to help you understand your ongoing costs (in dollars) of investing in the Fund and to compare these costs with the ongoing costs of investing in other funds.
The examples in the tables are based on an investment of $1,000 invested at the beginning of the six-month period and held for the entire period (December 1, 2022 to May 31, 2023).
Actual expenses
The first line in the following tables provides information about actual account values and actual expenses. You may use the information in this line, together with the amount you invested, to estimate the expenses that you paid over the period. Simply divide your account value by $1,000 (for example, an $8,600 account value divided by $1,000 = 8.6), then multiply the result by the number in the first line under the heading “Expenses Paid During the Period” to estimate the expenses you paid on your account during this period.
Hypothetical example for comparison purposes
The second line in the following tables provides information about hypothetical account values and hypothetical expenses based on the Fund’s actual expense ratios and an assumed rate of return of 5% per year before expenses (which is not the Funds’ actual return). The hypothetical account values and expenses may not be used to estimate the actual ending account balance or expenses you paid for the period. You may use this information to compare the ongoing costs of investing in the Fund and other funds. To do so, compare this 5% hypothetical example with the 5% hypothetical examples that appear in the shareholder reports of the other funds.
Please note that the expenses shown in the tables are meant to highlight your ongoing costs only, and do not reflect any transactional costs. Therefore the second line in the table is useful in comparing ongoing costs only, and will not help you determine the relative total costs of owning different funds. In addition, if these transactional costs were included, your costs would have been higher.
| Beginning Account Value December 1, 2022 |
Ending Account Value May 31, 2023 |
Annualized Expense Ratio |
Expenses Paid During the Period Per $1,000(1) |
|||||||||||||
| Xtrackers MSCI EAFE Hedged Equity ETF |
| |||||||||||||||
| Actual |
$ | 1,000.00 | $ | 1,064.50 | 0.35 | % | $ | 1.80 | ||||||||
| Hypothetical (5% return before expenses) |
$ | 1,000.00 | $ | 1,023.19 | 0.35 | % | $ | 1.77 | ||||||||
(1) Expenses are equal to the Fund’s annualized expense ratio, multiplied by the average account value over the period, multiplied by 182 (the number of days in the most recent six-month period), then divided by 365.
6
DBX ETF Trust
Xtrackers MSCI EAFE Hedged Equity ETF
May 31, 2023
| Number |
Value |
|||||||
| COMMON STOCKS — 97.0% | ||||||||
| Australia — 7.0% | ||||||||
| Ampol Ltd. |
59,679 | $ | 1,219,280 | |||||
| ANZ Group Holdings Ltd. |
794,629 | 11,846,584 | ||||||
| APA Group (a) |
315,217 | 2,058,531 | ||||||
| Aristocrat Leisure Ltd. |
152,872 | 3,694,034 | ||||||
| ASX Ltd. |
51,507 | 2,259,090 | ||||||
| Aurizon Holdings Ltd. |
455,910 | 1,055,707 | ||||||
| BHP Group Ltd. |
1,340,505 | 36,638,577 | ||||||
| BlueScope Steel Ltd. |
120,184 | 1,447,777 | ||||||
| Brambles Ltd. |
366,879 | 3,278,866 | ||||||
| Cochlear Ltd. |
17,408 | 2,756,141 | ||||||
| Coles Group Ltd. |
354,316 | 4,143,760 | ||||||
| Commonwealth Bank of Australia |
446,641 | 28,116,310 | ||||||
| Computershare Ltd. |
151,631 | 2,205,332 | ||||||
| CSL Ltd. |
127,688 | 25,447,129 | ||||||
| Dexus REIT |
269,854 | 1,441,074 | ||||||
| EBOS Group Ltd. |
40,855 | 1,035,461 | ||||||
| Endeavour Group Ltd. |
387,098 | 1,553,532 | ||||||
| Fortescue Metals Group Ltd. |
449,618 | 5,620,969 | ||||||
| Goodman Group REIT |
441,920 | 5,642,584 | ||||||
| GPT Group REIT |
490,451 | 1,336,669 | ||||||
| IDP Education Ltd. |
66,330 | 941,410 | ||||||
| IGO Ltd. |
180,775 | 1,676,764 | ||||||
| Insurance Australia Group Ltd. |
626,511 | 2,114,999 | ||||||
| Lendlease Corp. Ltd. (a) |
190,050 | 976,583 | ||||||
| Lottery Corp. Ltd. |
607,365 | 1,967,403 | ||||||
| Macquarie Group Ltd. |
97,158 | 10,790,162 | ||||||
| Medibank Pvt Ltd. |
702,175 | 1,630,526 | ||||||
| Mineral Resources Ltd. |
46,003 | 2,118,225 | ||||||
| Mirvac Group REIT |
996,829 | 1,491,292 | ||||||
| National Australia Bank Ltd. |
830,487 | 14,028,748 | ||||||
| Newcrest Mining Ltd. |
236,640 | 3,954,270 | ||||||
| Northern Star Resources Ltd. |
303,408 | 2,547,812 | ||||||
| Orica Ltd. |
112,059 | 1,114,470 | ||||||
| Origin Energy Ltd. |
442,945 | 2,399,987 | ||||||
| Pilbara Minerals Ltd. |
714,515 | 2,049,576 | ||||||
| Qantas Airways Ltd. * |
224,759 | 972,194 | ||||||
| QBE Insurance Group Ltd. |
393,885 | 3,745,682 | ||||||
| Ramsay Health Care Ltd. |
46,996 | 1,753,718 | ||||||
| REA Group Ltd. |
13,204 | 1,181,183 | ||||||
| Reece Ltd. |
62,817 | 742,006 | ||||||
| Rio Tinto Ltd. |
98,205 | 6,834,889 | ||||||
| Santos Ltd. |
878,270 | 4,164,565 | ||||||
| Scentre Group REIT |
1,372,236 | 2,418,868 | ||||||
| SEEK Ltd. |
89,616 | 1,371,581 | ||||||
| Sonic Healthcare Ltd. |
115,921 | 2,653,356 | ||||||
| South32 Ltd. |
1,211,853 | 3,058,411 | ||||||
| Stockland REIT |
630,253 | 1,746,380 | ||||||
| Suncorp Group Ltd. |
338,353 | 2,927,088 | ||||||
| Telstra Group Ltd. |
1,065,302 | 3,021,157 | ||||||
| Transurban Group (a) |
815,067 | 7,867,583 | ||||||
| Treasury Wine Estates Ltd. |
182,670 | 1,380,662 | ||||||
| Vicinity Ltd. REIT |
978,918 | 1,181,148 | ||||||
| Washington H Soul Pattinson & Co. Ltd. |
62,352 | 1,302,687 | ||||||
| Wesfarmers Ltd. |
299,836 | 9,297,004 | ||||||
| Number |
Value |
|||||||
| Australia (Continued) | ||||||||
| Westpac Banking Corp. |
928,603 | $ | 12,490,929 | |||||
| WiseTech Global Ltd. |
43,881 | 2,135,828 | ||||||
| Woodside Energy Group Ltd. |
502,898 | 11,219,878 | ||||||
| Woolworths Group Ltd. |
322,429 | 7,873,040 | ||||||
|
|
|
|||||||
| (Cost $287,413,148) |
283,939,471 | |||||||
|
|
|
|||||||
| Austria — 0.2% | ||||||||
| Erste Group Bank AG |
89,817 | 2,906,085 | ||||||
| OMV AG |
38,871 | 1,731,773 | ||||||
| Verbund AG |
18,185 | 1,371,348 | ||||||
| voestalpine AG |
29,649 | 918,430 | ||||||
|
|
|
|||||||
| (Cost $6,291,105) |
6,927,636 | |||||||
|
|
|
|||||||
| Belgium — 0.8% | ||||||||
| Ageas SA/NV (b) |
41,442 | 1,653,622 | ||||||
| Anheuser-Busch InBev SA/NV |
230,273 | 12,284,797 | ||||||
| D’ieteren Group |
5,823 | 1,006,455 | ||||||
| Elia Group SA/NV |
8,259 | 998,453 | ||||||
| Groupe Bruxelles Lambert NV |
25,328 | 1,951,431 | ||||||
| KBC Group NV |
66,433 | 4,344,409 | ||||||
| Sofina SA |
3,885 | 801,467 | ||||||
| Solvay SA |
19,041 | 1,987,668 | ||||||
| UCB SA |
33,243 | 2,896,688 | ||||||
| Umicore SA (b) |
53,911 | 1,498,263 | ||||||
| Warehouses De Pauw CVA REIT |
44,326 | 1,243,254 | ||||||
|
|
|
|||||||
| (Cost $39,007,755) |
30,666,507 | |||||||
|
|
|
|||||||
| Chile — 0.0% | ||||||||
| Antofagasta PLC (Cost $1,347,939) |
101,206 | 1,683,849 | ||||||
|
|
|
|||||||
| Denmark — 3.1% | ||||||||
| A.P. Moller — Maersk A/S, Class A |
829 | 1,391,057 | ||||||
| A.P. Moller — Maersk A/S, Class B |
1,313 | 2,207,918 | ||||||
| Carlsberg A/S, Class B |
26,069 | 3,927,198 | ||||||
| Chr Hansen Holding A/S |
27,913 | 2,024,165 | ||||||
| Coloplast A/S, Class B |
31,477 | 3,962,497 | ||||||
| Danske Bank A/S * |
182,605 | 3,714,142 | ||||||
| Demant A/S * |
24,572 | 933,973 | ||||||
| DSV A/S |
49,318 | 9,503,767 | ||||||
| Genmab A/S * |
17,499 | 6,844,721 | ||||||
| Novo Nordisk A/S, Class B |
437,959 | 70,170,001 | ||||||
| Novozymes A/S, Class B |
52,448 | 2,527,297 | ||||||
| Orsted AS, 144A |
50,135 | 4,389,822 | ||||||
| Pandora A/S |
23,249 | 1,852,138 | ||||||
| ROCKWOOL A/S, Class B |
2,379 | 567,205 | ||||||
| Tryg A/S |
95,677 | 2,176,771 | ||||||
| Vestas Wind Systems A/S * |
267,335 | 7,611,007 | ||||||
|
|
|
|||||||
| (Cost $67,997,166) |
123,803,679 | |||||||
|
|
|
|||||||
| Finland — 1.1% | ||||||||
| Elisa OYJ |
37,906 | 2,123,130 | ||||||
| Fortum OYJ |
124,319 | 1,651,757 | ||||||
| Kesko OYJ, Class B |
74,656 | 1,411,261 | ||||||
| Kone OYJ, Class B |
90,585 | 4,596,348 | ||||||
| Metso Corp. (b) |
175,823 | 1,923,539 | ||||||
| Neste OYJ |
109,633 | 4,144,897 | ||||||
| Nokia OYJ |
1,420,836 | 5,763,591 | ||||||
| See Notes to Financial Statements. | 7 |
DBX ETF Trust
Schedule of Investments
Xtrackers MSCI EAFE Hedged Equity ETF (Continued)
May 31, 2023
| Number |
Value |
|||||||
| Finland (Continued) | ||||||||
| Nordea Bank Abp |
859,474 | $ | 8,449,168 | |||||
| Orion OYJ, Class B |
27,343 | 1,157,095 | ||||||
| Sampo OYJ, Class A |
120,812 | 5,555,433 | ||||||
| Stora Enso OYJ, Class R |
154,971 | 1,962,108 | ||||||
| UPM-Kymmene OYJ |
138,385 | 4,152,110 | ||||||
| Wartsila OYJ Abp |
121,686 | 1,377,444 | ||||||
|
|
|
|||||||
| (Cost $46,958,051) |
44,267,881 | |||||||
|
|
|
|||||||
| France — 11.5% | ||||||||
| Accor SA |
48,895 | 1,618,613 | ||||||
| Aeroports de Paris * |
7,505 | 1,139,941 | ||||||
| Air Liquide SA |
138,617 | 23,209,008 | ||||||
| Airbus SE |
156,921 | 20,554,000 | ||||||
| Alstom SA (b) |
84,031 | 2,311,988 | ||||||
| Amundi SA, 144A |
15,411 | 866,471 | ||||||
| Arkema SA |
14,700 | 1,280,597 | ||||||
| AXA SA |
482,165 | 13,613,936 | ||||||
| BioMerieux |
10,317 | 1,032,648 | ||||||
| BNP Paribas SA (b) |
294,202 | 16,984,674 | ||||||
| Bollore SE |
219,968 | 1,408,393 | ||||||
| Bouygues SA |
55,327 | 1,771,807 | ||||||
| Bureau Veritas SA |
78,192 | 1,983,341 | ||||||
| Capgemini SE |
43,699 | 7,604,371 | ||||||
| Carrefour SA (b) |
152,725 | 2,805,415 | ||||||
| Cie de Saint-Gobain |
129,823 | 7,188,178 | ||||||
| Cie Generale des Etablissements Michelin SCA |
180,114 | 5,113,437 | ||||||
| Covivio SA REIT |
12,626 | 617,304 | ||||||
| Credit Agricole SA (b) |
315,412 | 3,604,745 | ||||||
| Danone SA |
170,059 | 10,059,495 | ||||||
| Dassault Aviation SA |
6,306 | 1,066,345 | ||||||
| Dassault Systemes SE |
176,883 | 7,772,683 | ||||||
| Edenred |
65,870 | 4,230,142 | ||||||
| Eiffage SA |
19,725 | 2,100,395 | ||||||
| Engie SA |
483,567 | 7,258,101 | ||||||
| EssilorLuxottica SA |
77,016 | 13,866,396 | ||||||
| Eurazeo SE |
11,746 | 802,284 | ||||||
| Gecina SA REIT |
11,634 | 1,190,708 | ||||||
| Getlink SE |
98,125 | 1,665,588 | ||||||
| Hermes International |
8,381 | 17,037,195 | ||||||
| Ipsen SA * |
9,611 | 1,110,534 | ||||||
| Kering SA |
19,707 | 10,497,657 | ||||||
| Klepierre SA REIT |
58,897 | 1,333,388 | ||||||
| La Francaise des Jeux SAEM, 144A |
26,473 | 1,020,390 | ||||||
| Legrand SA * |
70,751 | 6,689,858 | ||||||
| L’Oreal SA |
63,734 | 27,182,004 | ||||||
| LVMH Moet Hennessy Louis Vuitton SE |
73,044 | 63,546,700 | ||||||
| Orange SA |
493,713 | 5,895,802 | ||||||
| Pernod Ricard SA |
54,634 | 11,802,302 | ||||||
| Publicis Groupe SA |
60,583 | 4,488,970 | ||||||
| Remy Cointreau SA |
5,887 | 904,564 | ||||||
| Renault SA |
49,533 | 1,656,411 | ||||||
| Safran SA |
90,559 | 13,110,401 | ||||||
| Sanofi (b) |
300,279 | 30,453,488 | ||||||
| Sartorius Stedim Biotech |
7,082 | 1,859,181 | ||||||
| Schneider Electric SE |
143,594 | 24,763,712 | ||||||
| Number |
Value |
|||||||
| France (Continued) | ||||||||
| SEB SA |
6,479 | $ | 608,051 | |||||
| Societe Generale SA (b) |
193,117 | 4,464,928 | ||||||
| Sodexo SA |
22,494 | 2,429,632 | ||||||
| Teleperformance |
15,153 | 2,265,968 | ||||||
| Thales SA |
27,409 | 3,817,465 | ||||||
| TotalEnergies SE (b) |
626,017 | 35,518,486 | ||||||
| Unibail-Rodamco-Westfield REIT * (b) |
30,872 | 1,412,362 | ||||||
| Valeo |
55,516 | 1,065,766 | ||||||
| Veolia Environnement SA |
179,908 | 5,296,047 | ||||||
| Vinci SA |
140,653 | 15,984,585 | ||||||
| Vivendi SE |
190,601 | 1,688,951 | ||||||
| Wendel SE |
7,500 | 788,047 | ||||||
| Worldline SA, 144A * |
61,204 | 2,378,054 | ||||||
|
|
|
|||||||
| (Cost $351,938,655) |
465,791,903 | |||||||
|
|
|
|||||||
| Germany — 7.7% | ||||||||
| adidas AG |
42,896 | 6,946,513 | ||||||
| Allianz SE |
106,602 | 22,787,114 | ||||||
| BASF SE |
236,783 | 11,241,327 | ||||||
| Bayer AG |
260,032 | 14,492,230 | ||||||
| Bayerische Motoren Werke AG |
87,404 | 9,521,999 | ||||||
| Bechtle AG |
20,654 | 809,787 | ||||||
| Beiersdorf AG |
26,703 | 3,400,882 | ||||||
| Brenntag SE |
40,989 | 3,215,011 | ||||||
| Carl Zeiss Meditec AG |
10,388 | 1,164,227 | ||||||
| Commerzbank AG * |
273,333 | 2,746,359 | ||||||
| Continental AG |
28,426 | 1,892,351 | ||||||
| Covestro AG, 144A * |
49,757 | 1,917,862 | ||||||
| Daimler Truck Holding AG * |
131,600 | 3,980,886 | ||||||
| Delivery Hero SE, 144A * |
43,695 | 1,634,697 | ||||||
| Deutsche Bank AG (c) |
513,857 | 5,204,808 | ||||||
| Deutsche Boerse AG |
50,268 | 8,677,638 | ||||||
| Deutsche Lufthansa AG * |
151,828 | 1,486,568 | ||||||
| Deutsche Post AG |
266,593 | 11,982,630 | ||||||
| Deutsche Telekom AG |
857,594 | 19,016,587 | ||||||
| E.ON SE |
593,870 | 7,179,454 | ||||||
| Evonik Industries AG * |
57,690 | 1,155,908 | ||||||
| Fresenius Medical Care AG & Co. KGaA |
54,106 | 2,310,466 | ||||||
| Fresenius SE & Co. KGaA |
109,082 | 2,983,739 | ||||||
| GEA Group AG |
40,940 | 1,719,362 | ||||||
| Hannover Rueck SE |
15,966 | 3,416,627 | ||||||
| Heidelberg Materials AG |
38,620 | 2,760,870 | ||||||
| HelloFresh SE * |
45,918 | 1,091,088 | ||||||
| Henkel AG & Co. KGaA |
27,906 | 2,002,106 | ||||||
| Infineon Technologies AG |
345,864 | 12,839,483 | ||||||
| Knorr-Bremse AG |
18,440 | 1,261,080 | ||||||
| LEG Immobilien SE * |
18,892 | 979,595 | ||||||
| Mercedes-Benz Group AG |
226,575 | 16,897,331 | ||||||
| Merck KGaA |
34,250 | 5,958,254 | ||||||
| MTU Aero Engines AG |
14,218 | 3,279,649 | ||||||
| Muenchener Rueckversicherungs-Gesellschaft AG in Muenchen |
37,056 | 13,229,469 | ||||||
| Nemetschek SE |
14,182 | 1,110,256 | ||||||
| Puma SE |
26,788 | 1,274,773 | ||||||
| Rational AG |
1,266 | 849,151 | ||||||
| Rheinmetall AG |
11,216 | 2,834,150 | ||||||
| See Notes to Financial Statements. | 8 |
DBX ETF Trust
Schedule of Investments
Xtrackers MSCI EAFE Hedged Equity ETF (Continued)
May 31, 2023
| Number |
Value |
|||||||
| Germany (Continued) | ||||||||
| RWE AG |
165,860 | $ | 6,935,502 | |||||
| SAP SE |
276,237 | 36,076,083 | ||||||
| Scout24 SE, 144A |
19,907 | 1,276,717 | ||||||
| Siemens AG |
201,659 | 33,052,969 | ||||||
| Siemens Energy AG * |
137,747 | 3,495,427 | ||||||
| Siemens Healthineers AG, 144A |
74,719 | 4,224,975 | ||||||
| Symrise AG |
35,399 | 3,783,045 | ||||||
| Talanx AG |
16,816 | 937,377 | ||||||
| Telefonica Deutschland Holding AG |
261,738 | 737,199 | ||||||
| Volkswagen AG |
7,887 | 1,183,631 | ||||||
| Vonovia SE |
190,209 | 3,488,878 | ||||||
| Wacker Chemie AG |
4,886 | 648,653 | ||||||
| Zalando SE, 144A * |
59,299 | 1,713,924 | ||||||
|
|
|
|||||||
| (Cost $308,923,299) |
314,806,667 | |||||||
|
|
|
|||||||
| Hong Kong — 2.6% | ||||||||
| AIA Group Ltd. |
3,081,289 | 29,551,916 | ||||||
| BOC Hong Kong Holdings Ltd. |
956,375 | 2,839,648 | ||||||
| Budweiser Brewing Co. APAC Ltd., 144A |
418,131 | 1,050,874 | ||||||
| CK Asset Holdings Ltd. |
521,646 | 2,811,264 | ||||||
| CK Hutchison Holdings Ltd. |
699,512 | 4,229,884 | ||||||
| CK Infrastructure Holdings Ltd. |
167,096 | 923,990 | ||||||
| CLP Holdings Ltd. |
434,766 | 3,167,557 | ||||||
| ESR Group Ltd., 144A |
517,395 | 763,824 | ||||||
| Futu Holdings Ltd., ADR * |
15,098 | 556,512 | ||||||
| Galaxy Entertainment Group Ltd. * |
575,467 | 3,567,984 | ||||||
| Hang Lung Properties Ltd. |
500,193 | 792,086 | ||||||
| Hang Seng Bank Ltd. |
197,589 | 2,641,939 | ||||||
| Henderson Land Development Co. Ltd. |
362,162 | 1,149,324 | ||||||
| HKT Trust & HKT Ltd. (a) |
1,016,024 | 1,297,530 | ||||||
| Hong Kong & China Gas Co. Ltd. |
2,951,899 | 2,661,457 | ||||||
| Hong Kong Exchanges & Clearing Ltd. |
318,960 | 11,674,161 | ||||||
| Hongkong Land Holdings Ltd. |
286,500 | 1,229,085 | ||||||
| Jardine Matheson Holdings Ltd. |
41,657 | 1,999,953 | ||||||
| Link REIT |
656,265 | 3,813,326 | ||||||
| MTR Corp. Ltd. |
406,402 | 1,871,003 | ||||||
| New World Development Co. Ltd. |
412,961 | 986,198 | ||||||
| Power Assets Holdings Ltd. |
359,161 | 1,933,303 | ||||||
| Prudential PLC |
728,446 | 9,568,952 | ||||||
| Sino Land Co. Ltd. |
973,604 | 1,265,737 | ||||||
| SITC International Holdings Co. Ltd. |
331,593 | 575,914 | ||||||
| Sun Hung Kai Properties Ltd. |
375,866 | 4,785,656 | ||||||
| Swire Pacific Ltd., Class A |
122,500 | 818,184 | ||||||
| Swire Properties Ltd. |
344,397 | 820,700 | ||||||
| Techtronic Industries Co. Ltd. |
379,551 | 3,521,430 | ||||||
| WH Group Ltd., 144A |
2,061,658 | 1,076,845 | ||||||
| Wharf Real Estate Investment Co. Ltd. |
440,310 | 2,173,308 | ||||||
| Xinyi Glass Holdings Ltd. |
442,666 | 654,633 | ||||||
|
|
|
|||||||
| (Cost $114,354,067) |
106,774,177 | |||||||
|
|
|
|||||||
| Ireland — 1.2% | ||||||||
| AerCap Holdings NV * |
43,304 | 2,471,792 | ||||||
| AIB Group PLC |
353,179 | 1,446,631 | ||||||
| Bank of Ireland Group PLC |
275,250 | 2,587,326 | ||||||
| CRH PLC |
195,851 | 9,232,127 | ||||||
| DCC PLC |
25,425 | 1,453,914 | ||||||
| Number |
Value |
|||||||
| Ireland (Continued) | ||||||||
| Experian PLC |
243,363 | $ | 8,573,357 | |||||
| Flutter Entertainment PLC * |
46,674 | 9,112,386 | ||||||
| James Hardie Industries PLC CDI * |
113,721 | 2,802,718 | ||||||
| Kerry Group PLC, Class A |
42,233 | 4,116,129 | ||||||
| Kingspan Group PLC |
39,786 | 2,640,094 | ||||||
| Smurfit Kappa Group PLC |
69,054 | 2,452,769 | ||||||
|
|
|
|||||||
| (Cost $35,914,079) |
46,889,243 | |||||||
|
|
|
|||||||
| Israel — 0.6% | ||||||||
| Azrieli Group Ltd. |
11,664 | 613,278 | ||||||
| Bank Hapoalim BM |
325,935 | 2,622,119 | ||||||
| Bank Leumi Le-Israel BM |
396,867 | 2,781,169 | ||||||
| Check Point Software Technologies Ltd. * |
25,786 | 3,218,351 | ||||||
| CyberArk Software Ltd. * |
10,341 | 1,600,063 | ||||||
| Elbit Systems Ltd. |
7,045 | 1,439,188 | ||||||
| ICL Group Ltd. |
205,868 | 1,121,045 | ||||||
| Israel Discount Bank Ltd., Class A |
313,132 | 1,507,948 | ||||||
| Mizrahi Tefahot Bank Ltd. |
39,216 | 1,257,964 | ||||||
| Monday.com Ltd. * |
6,033 | 1,087,147 | ||||||
| Nice Ltd. * |
16,350 | 3,288,797 | ||||||
| Teva Pharmaceutical Industries Ltd., ADR * |
285,594 | 2,056,277 | ||||||
| Tower Semiconductor Ltd. * |
27,994 | 1,158,305 | ||||||
| Wix.com Ltd. * |
14,618 | 1,114,184 | ||||||
|
|
|
|||||||
| (Cost $26,625,908) |
24,865,835 | |||||||
|
|
|
|||||||
| Italy — 2.0% | ||||||||
| Amplifon SpA |
33,181 | 1,144,881 | ||||||
| Assicurazioni Generali SpA |
273,434 | 5,177,631 | ||||||
| Davide Campari-Milano NV |
134,679 | 1,757,733 | ||||||
| DiaSorin SpA |
6,296 | 647,407 | ||||||
| Enel SpA |
2,153,392 | 13,483,725 | ||||||
| Eni SpA |
615,226 | 8,187,314 | ||||||
| Ferrari NV |
33,383 | 9,513,119 | ||||||
| FinecoBank Banca Fineco SpA |
156,005 | 2,069,416 | ||||||
| Infrastrutture Wireless Italiane SpA, 144A |
85,607 | 1,088,914 | ||||||
| Intesa Sanpaolo SpA |
4,275,336 | 9,850,441 | ||||||
| Mediobanca Banca di Credito Finanziario SpA |
152,610 | 1,679,371 | ||||||
| Moncler SpA |
54,673 | 3,700,422 | ||||||
| Nexi SpA, 144A * |
162,031 | 1,269,173 | ||||||
| Poste Italiane SpA, 144A |
132,334 | 1,371,518 | ||||||
| Prysmian SpA |
65,154 | 2,414,528 | ||||||
| Recordati Industria Chimica e Farmaceutica SpA |
26,497 | 1,150,467 | ||||||
| Snam SpA |
520,147 | 2,718,769 | ||||||
| Telecom Italia SpA *(b) |
2,664,075 | 705,643 | ||||||
| Terna — Rete Elettrica Nazionale |
373,344 | 3,125,498 | ||||||
| UniCredit SpA |
491,596 | 9,413,222 | ||||||
|
|
|
|||||||
| (Cost $71,419,051) |
80,469,192 | |||||||
|
|
|
|||||||
| Japan — 21.9% | ||||||||
| Advantest Corp. |
50,700 | 6,517,402 | ||||||
| Aeon Co. Ltd. |
173,700 | 3,440,962 | ||||||
| AGC, Inc. (b) |
54,300 | 1,983,757 | ||||||
| See Notes to Financial Statements. | 9 |
DBX ETF Trust
Schedule of Investments
Xtrackers MSCI EAFE Hedged Equity ETF (Continued)
May 31, 2023
| Number |
Value |
|||||||
| Japan (Continued) | ||||||||
| Aisin Corp. |
40,054 | $ | 1,152,819 | |||||
| Ajinomoto Co., Inc. |
118,847 | 4,624,221 | ||||||
| ANA Holdings, Inc. *(b) |
43,600 | 968,541 | ||||||
| Asahi Group Holdings Ltd. |
127,565 | 4,952,443 | ||||||
| Asahi Intecc Co. Ltd. |
57,800 | 1,101,446 | ||||||
| Asahi Kasei Corp. |
345,800 | 2,354,145 | ||||||
| Astellas Pharma, Inc. |
479,432 | 7,596,240 | ||||||
| Azbil Corp. |
28,900 | 915,798 | ||||||
| Bandai Namco Holdings, Inc. |
158,800 | 3,728,224 | ||||||
| BayCurrent Consulting, Inc. |
34,900 | 1,280,022 | ||||||
| Bridgestone Corp. |
151,276 | 6,165,047 | ||||||
| Brother Industries Ltd. |
59,300 | 861,462 | ||||||
| Canon, Inc. (b) |
266,086 | 6,609,895 | ||||||
| Capcom Co. Ltd. |
46,000 | 1,796,088 | ||||||
| Central Japan Railway Co. |
38,354 | 4,675,706 | ||||||
| Chiba Bank Ltd. |
143,700 | 898,351 | ||||||
| Chubu Electric Power Co., Inc. |
163,900 | 1,956,330 | ||||||
| Chugai Pharmaceutical Co. Ltd. |
178,100 | 4,800,039 | ||||||
| Concordia Financial Group Ltd. |
287,715 | 1,115,134 | ||||||
| CyberAgent, Inc. |
117,400 | 832,523 | ||||||
| Dai Nippon Printing Co. Ltd. |
58,000 | 1,654,764 | ||||||
| Daifuku Co. Ltd. |
77,663 | 1,576,951 | ||||||
| Dai-ichi Life Holdings, Inc. |
250,638 | 4,307,574 | ||||||
| Daiichi Sankyo Co. Ltd. |
489,593 | 15,953,721 | ||||||
| Daikin Industries Ltd. |
69,688 | 13,284,861 | ||||||
| Daito Trust Construction Co. Ltd. |
15,813 | 1,503,838 | ||||||
| Daiwa House Industry Co. Ltd. |
156,136 | 4,081,445 | ||||||
| Daiwa House REIT Investment Corp. REIT |
622 | 1,305,832 | ||||||
| Daiwa Securities Group, Inc. |
337,187 | 1,531,953 | ||||||
| Denso Corp. |
114,753 | 7,092,324 | ||||||
| Dentsu Group, Inc. |
53,700 | 1,726,725 | ||||||
| Disco Corp. |
24,300 | 3,549,291 | ||||||
| East Japan Railway Co. |
80,053 | 4,417,351 | ||||||
| Eisai Co. Ltd. |
66,752 | 4,248,747 | ||||||
| ENEOS Holdings, Inc. |
780,728 | 2,598,971 | ||||||
| FANUC Corp. |
254,285 | 8,756,931 | ||||||
| Fast Retailing Co. Ltd. (b) |
46,351 | 10,872,067 | ||||||
| Fuji Electric Co. Ltd. |
32,300 | 1,360,854 | ||||||
| FUJIFILM Holdings Corp. |
98,854 | 6,054,342 | ||||||
| Fujitsu Ltd. |
46,602 | 5,927,059 | ||||||
| GLP J REIT |
1,246 | 1,321,793 | ||||||
| GMO Payment Gateway, Inc. |
10,700 | 846,323 | ||||||
| Hakuhodo DY Holdings, Inc. |
62,259 | 653,312 | ||||||
| Hamamatsu Photonics KK |
36,700 | 1,872,866 | ||||||
| Hankyu Hanshin Holdings, Inc. |
58,040 | 1,847,532 | ||||||
| Hikari Tsushin, Inc. |
4,900 | 709,370 | ||||||
| Hirose Electric Co. Ltd. |
7,866 | 1,068,184 | ||||||
| Hitachi Construction Machinery Co. Ltd. |
29,100 | 720,581 | ||||||
| Hitachi Ltd. |
248,001 | 14,322,024 | ||||||
| Honda Motor Co. Ltd. |
407,699 | 11,719,609 | ||||||
| Hoshizaki Corp. |
29,500 | 1,062,910 | ||||||
| Hoya Corp. |
94,574 | 11,923,146 | ||||||
| Hulic Co. Ltd. |
95,200 | 794,671 | ||||||
| Ibiden Co. Ltd. |
29,600 | 1,618,891 | ||||||
| Idemitsu Kosan Co. Ltd. |
52,884 | 1,027,884 | ||||||
| Number |
Value |
|||||||
| Japan (Continued) | ||||||||
| Iida Group Holdings Co. Ltd. |
42,500 | $ | 702,817 | |||||
| Inpex Corp. |
266,517 | 2,831,115 | ||||||
| Isuzu Motors Ltd. |
149,500 | 1,742,602 | ||||||
| ITOCHU Corp. |
314,654 | 10,661,988 | ||||||
| Itochu Techno-Solutions Corp. |
23,800 | 620,090 | ||||||
| Japan Airlines Co. Ltd. |
34,873 | 667,299 | ||||||
| Japan Exchange Group, Inc. |
132,578 | 2,170,064 | ||||||
| Japan Metropolitan Fund Invest REIT |
1,952 | 1,381,426 | ||||||
| Japan Post Bank Co. Ltd. |
390,558 | 2,918,147 | ||||||
| Japan Post Holdings Co. Ltd. |
580,013 | 4,098,495 | ||||||
| Japan Post Insurance Co. Ltd. |
53,000 | 797,710 | ||||||
| Japan Real Estate Investment Corp. REIT |
354 | 1,346,636 | ||||||
| Japan Tobacco, Inc. (b) |
317,541 | 6,928,582 | ||||||
| JFE Holdings, Inc. |
125,085 | 1,547,795 | ||||||
| JSR Corp. |
48,100 | 1,161,719 | ||||||
| Kajima Corp. |
107,100 | 1,502,821 | ||||||
| Kansai Electric Power Co., Inc. |
179,567 | 2,056,981 | ||||||
| Kao Corp. |
123,704 | 4,330,195 | ||||||
| Kawasaki Kisen Kaisha Ltd. |
36,700 | 825,799 | ||||||
| KDDI Corp. |
396,233 | 12,203,379 | ||||||
| Keio Corp. |
25,860 | 911,341 | ||||||
| Keisei Electric Railway Co. Ltd. |
32,928 | 1,264,416 | ||||||
| Keyence Corp. |
51,470 | 25,046,948 | ||||||
| Kikkoman Corp. |
37,182 | 2,196,360 | ||||||
| Kintetsu Group Holdings Co. Ltd. |
48,440 | 1,604,526 | ||||||
| Kirin Holdings Co. Ltd. |
207,123 | 3,091,421 | ||||||
| Kobayashi Pharmaceutical Co. Ltd. |
13,400 | 757,883 | ||||||
| Kobe Bussan Co. Ltd. |
38,100 | 1,051,459 | ||||||
| Koei Tecmo Holdings Co. Ltd. |
26,100 | 439,668 | ||||||
| Koito Manufacturing Co. Ltd. |
52,300 | 984,250 | ||||||
| Komatsu Ltd. |
245,273 | 5,795,361 | ||||||
| Konami Group Corp. |
26,866 | 1,425,012 | ||||||
| Kose Corp. |
8,600 | 864,167 | ||||||
| Kubota Corp. |
264,781 | 3,662,178 | ||||||
| Kurita Water Industries Ltd. |
26,200 | 1,073,763 | ||||||
| Kyocera Corp. |
85,200 | 4,846,906 | ||||||
| Kyowa Kirin Co. Ltd. |
68,200 | 1,311,868 | ||||||
| Lasertec Corp. |
19,900 | 3,092,302 | ||||||
| Lixil Corp. |
76,500 | 988,337 | ||||||
| M3, Inc. |
114,942 | 2,564,075 | ||||||
| Makita Corp. |
57,300 | 1,554,595 | ||||||
| Marubeni Corp. |
404,400 | 5,781,911 | ||||||
| MatsukiyoCocokara & Co. |
30,300 | 1,624,554 | ||||||
| Mazda Motor Corp. |
145,800 | 1,249,490 | ||||||
| McDonald’s Holdings Co. Japan Ltd. |
22,522 | 926,259 | ||||||
| MEIJI Holdings Co. Ltd. |
57,680 | 1,293,738 | ||||||
| MINEBEA MITSUMI, Inc. |
92,420 | 1,783,724 | ||||||
| MISUMI Group, Inc. |
72,700 | 1,591,495 | ||||||
| Mitsubishi Chemical Group Corp. |
343,200 | 1,929,507 | ||||||
| Mitsubishi Corp. |
328,025 | 13,151,607 | ||||||
| Mitsubishi Electric Corp. |
511,379 | 6,676,464 | ||||||
| Mitsubishi Estate Co. Ltd. |
290,051 | 3,337,174 | ||||||
| Mitsubishi HC Capital, Inc. |
235,900 | 1,281,725 | ||||||
| Mitsubishi Heavy Industries Ltd. |
88,299 | 3,743,003 | ||||||
| Mitsubishi UFJ Financial Group, Inc. |
3,020,852 | 20,218,514 | ||||||
| Mitsui & Co. Ltd. |
347,260 | 10,976,731 | ||||||
| See Notes to Financial Statements. | 10 |
DBX ETF Trust
Schedule of Investments
Xtrackers MSCI EAFE Hedged Equity ETF (Continued)
May 31, 2023
| Number |
Value |
|||||||
| Japan (Continued) | ||||||||
| Mitsui Chemicals, Inc. |
44,400 | $ | 1,123,345 | |||||
| Mitsui Fudosan Co. Ltd. |
240,126 | 4,588,807 | ||||||
| Mitsui OSK Lines Ltd. |
90,500 | 2,062,354 | ||||||
| Mizuho Financial Group, Inc. |
637,858 | 9,399,049 | ||||||
| MonotaRO Co. Ltd. |
63,900 | 889,761 | ||||||
| MS&AD Insurance Group Holdings, Inc. |
111,021 | 3,823,282 | ||||||
| Murata Manufacturing Co. Ltd. |
152,277 | 8,961,200 | ||||||
| NEC Corp. |
65,059 | 3,058,579 | ||||||
| Nexon Co. Ltd. |
103,445 | 2,113,077 | ||||||
| NGK Insulators Ltd. |
63,900 | 771,891 | ||||||
| Nidec Corp. |
110,746 | 5,516,435 | ||||||
| Nintendo Co. Ltd. |
274,910 | 11,712,656 | ||||||
| Nippon Building Fund, Inc. REIT |
406 | 1,626,040 | ||||||
| NIPPON EXPRESS HOLDINGS, Inc. |
19,600 | 1,101,511 | ||||||
| Nippon Paint Holdings Co. Ltd. |
251,910 | 1,936,448 | ||||||
| Nippon Prologis REIT, Inc. REIT (b) |
594 | 1,245,769 | ||||||
| Nippon Sanso Holdings Corp. |
46,200 | 948,373 | ||||||
| Nippon Shinyaku Co. Ltd. |
14,200 | 650,249 | ||||||
| Nippon Steel Corp. |
214,109 | 4,173,070 | ||||||
| Nippon Telegraph & Telephone Corp. |
316,202 | 8,975,984 | ||||||
| Nippon Yusen KK |
128,300 | 2,737,282 | ||||||
| Nissan Chemical Corp. |
32,049 | 1,393,985 | ||||||
| Nissan Motor Co. Ltd. |
613,442 | 2,302,306 | ||||||
| Nisshin Seifun Group, Inc. |
46,700 | 586,243 | ||||||
| Nissin Foods Holdings Co. Ltd. |
15,800 | 1,348,373 | ||||||
| Nitori Holdings Co. Ltd. |
20,601 | 2,512,930 | ||||||
| Nitto Denko Corp. |
39,824 | 2,838,344 | ||||||
| Nomura Holdings, Inc. |
772,554 | 2,711,494 | ||||||
| Nomura Real Estate Holdings, Inc. |
27,636 | 669,453 | ||||||
| Nomura Real Estate Master Fund, Inc. REIT |
1,060 | 1,246,969 | ||||||
| Nomura Research Institute Ltd. |
104,043 | 2,621,144 | ||||||
| NTT Data Corp. |
166,534 | 2,386,997 | ||||||
| Obayashi Corp. |
161,700 | 1,304,510 | ||||||
| Obic Co. Ltd. |
18,300 | 2,967,142 | ||||||
| Odakyu Electric Railway Co. Ltd. |
74,350 | 1,084,365 | ||||||
| Oji Holdings Corp. |
225,668 | 869,792 | ||||||
| Olympus Corp. |
313,816 | 4,769,463 | ||||||
| Omron Corp. |
46,592 | 2,817,424 | ||||||
| Ono Pharmaceutical Co. Ltd. |
103,706 | 1,941,626 | ||||||
| Open House Group Co. Ltd. |
19,600 | 754,036 | ||||||
| Oracle Corp. (b) |
9,700 | 743,556 | ||||||
| Oriental Land Co. Ltd. |
288,500 | 10,823,539 | ||||||
| ORIX Corp. |
305,746 | 5,212,989 | ||||||
| Osaka Gas Co. Ltd. |
99,100 | 1,571,232 | ||||||
| Otsuka Corp. |
28,600 | 1,079,749 | ||||||
| Otsuka Holdings Co. Ltd. |
103,767 | 3,852,766 | ||||||
| Pan Pacific International Holdings Corp. |
97,272 | 1,660,937 | ||||||
| Panasonic Holdings Corp. |
585,085 | 6,133,261 | ||||||
| Persol Holdings Co. Ltd. |
45,300 | 857,067 | ||||||
| Rakuten Group, Inc. (b) |
254,486 | 1,052,101 | ||||||
| Recruit Holdings Co. Ltd. |
381,653 | 11,751,598 | ||||||
| Renesas Electronics Corp. * |
337,100 | 5,540,707 | ||||||
| Resona Holdings, Inc. |
564,325 | 2,565,942 | ||||||
| Ricoh Co. Ltd. |
141,400 | 1,183,366 | ||||||
| Number |
Value |
|||||||
| Japan (Continued) | ||||||||
| Rohm Co. Ltd. |
22,100 | $ | 1,873,325 | |||||
| SBI Holdings, Inc. |
62,325 | 1,167,545 | ||||||
| SCSK Corp. |
40,300 | 638,668 | ||||||
| Secom Co. Ltd. |
55,700 | 3,652,433 | ||||||
| Seiko Epson Corp. |
71,059 | 1,080,739 | ||||||
| Sekisui Chemical Co. Ltd. |
91,200 | 1,260,075 | ||||||
| Sekisui House Ltd. |
158,551 | 3,099,326 | ||||||
| Seven & i Holdings Co. Ltd. |
199,676 | 8,376,861 | ||||||
| SG Holdings Co. Ltd. |
85,600 | 1,258,272 | ||||||
| Sharp Corp. * |
51,273 | 294,408 | ||||||
| Shimadzu Corp. |
61,000 | 1,891,405 | ||||||
| Shimano, Inc. |
20,394 | 3,207,124 | ||||||
| Shimizu Corp. |
132,200 | 802,736 | ||||||
| Shin-Etsu Chemical Co. Ltd. |
482,420 | 14,878,584 | ||||||
| Shionogi & Co. Ltd. |
69,295 | 3,121,446 | ||||||
| Shiseido Co. Ltd. |
106,057 | 4,829,942 | ||||||
| Shizuoka Financial Group, Inc. |
108,300 | 797,530 | ||||||
| SMC Corp. |
15,082 | 8,127,447 | ||||||
| SoftBank Corp. |
759,700 | 8,100,013 | ||||||
| SoftBank Group Corp. |
272,528 | 10,709,426 | ||||||
| Sompo Holdings, Inc. |
81,435 | 3,325,786 | ||||||
| Sony Group Corp. |
333,716 | 31,521,282 | ||||||
| Square Enix Holdings Co. Ltd. |
21,000 | 942,042 | ||||||
| Subaru Corp. |
157,834 | 2,717,702 | ||||||
| SUMCO Corp. (b) |
89,100 | 1,273,268 | ||||||
| Sumitomo Chemical Co. Ltd. |
395,722 | 1,181,556 | ||||||
| Sumitomo Corp. |
298,076 | 5,640,606 | ||||||
| Sumitomo Electric Industries Ltd. |
184,400 | 2,189,109 | ||||||
| Sumitomo Metal Mining Co. Ltd. |
63,200 | 1,918,794 | ||||||
| Sumitomo Mitsui Financial Group, Inc. |
345,315 | 14,072,841 | ||||||
| Sumitomo Mitsui Trust Holdings, Inc. |
87,781 | 3,090,370 | ||||||
| Sumitomo Realty & Development Co. Ltd. |
78,903 | 1,907,943 | ||||||
| Suntory Beverage & Food Ltd. |
35,000 | 1,288,713 | ||||||
| Suzuki Motor Corp. |
96,426 | 3,185,017 | ||||||
| Sysmex Corp. |
43,107 | 2,824,502 | ||||||
| T&D Holdings, Inc. |
137,100 | 1,871,625 | ||||||
| Taisei Corp. |
45,815 | 1,458,385 | ||||||
| Takeda Pharmaceutical Co. Ltd. |
419,011 | 13,295,874 | ||||||
| TDK Corp. |
103,072 | 3,950,508 | ||||||
| Terumo Corp. |
178,144 | 5,429,029 | ||||||
| TIS, Inc. |
57,800 | 1,622,092 | ||||||
| Tobu Railway Co. Ltd. |
50,379 | 1,319,816 | ||||||
| Toho Co. Ltd. |
27,500 | 1,083,617 | ||||||
| Tokio Marine Holdings, Inc. |
477,150 | 10,767,340 | ||||||
| Tokyo Electric Power Co. Holdings, Inc. * |
397,900 | 1,373,694 | ||||||
| Tokyo Electron Ltd. |
118,592 | 16,440,728 | ||||||
| Tokyo Gas Co. Ltd. |
100,380 | 2,139,086 | ||||||
| Tokyu Corp. |
149,810 | 1,937,611 | ||||||
| TOPPAN, Inc. |
66,389 | 1,421,413 | ||||||
| Toray Industries, Inc. |
353,343 | 1,869,618 | ||||||
| Toshiba Corp. |
110,016 | 3,552,571 | ||||||
| Tosoh Corp. |
63,340 | 729,666 | ||||||
| TOTO Ltd. |
36,115 | 1,097,772 | ||||||
| Toyota Industries Corp. |
39,400 | 2,437,667 | ||||||
| Toyota Motor Corp. |
2,807,020 | 38,451,087 | ||||||
| See Notes to Financial Statements. | 11 |
DBX ETF Trust
Schedule of Investments
Xtrackers MSCI EAFE Hedged Equity ETF (Continued)
May 31, 2023
| Number |
Value |
|||||||
| Japan (Continued) | ||||||||
| Toyota Tsusho Corp. |
54,511 | $ | 2,402,279 | |||||
| Trend Micro, Inc. |
35,776 | 1,705,025 | ||||||
| Unicharm Corp. |
107,000 | 4,077,251 | ||||||
| USS Co. Ltd. |
53,700 | 874,540 | ||||||
| Welcia Holdings Co. Ltd. |
23,200 | 490,893 | ||||||
| West Japan Railway Co. |
56,206 | 2,356,356 | ||||||
| Yakult Honsha Co. Ltd. |
32,679 | 2,122,698 | ||||||
| Yamaha Corp. |
35,781 | 1,420,197 | ||||||
| Yamaha Motor Co. Ltd. |
77,074 | 1,902,993 | ||||||
| Yamato Holdings Co. Ltd. |
71,771 | 1,315,136 | ||||||
| Yaskawa Electric Corp. |
61,420 | 2,600,955 | ||||||
| Yokogawa Electric Corp. |
62,044 | 1,172,078 | ||||||
| Z Holdings Corp. |
683,000 | 1,701,556 | ||||||
| ZOZO, Inc. |
33,397 | 681,723 | ||||||
|
|
|
|||||||
| (Cost $766,128,608) |
886,119,967 | |||||||
|
|
|
|||||||
| Jordan — 0.0% | ||||||||
| Hikma Pharmaceuticals PLC |
||||||||
| (Cost $1,202,209) |
40,538 | 903,404 | ||||||
|
|
|
|||||||
| Luxembourg — 0.2% | ||||||||
| ArcelorMittal SA |
128,585 | 3,192,838 | ||||||
| Eurofins Scientific SE (b) |
34,703 | 2,286,478 | ||||||
| Tenaris SA |
122,350 | 1,526,203 | ||||||
|
|
|
|||||||
| (Cost $6,530,199) |
7,005,519 | |||||||
|
|
|
|||||||
| Macau — 0.1% | ||||||||
| Sands China Ltd. * |
||||||||
| (Cost $2,444,564) |
613,590 | 1,986,413 | ||||||
|
|
|
|||||||
| Netherlands — 4.7% | ||||||||
| ABN AMRO Bank NV, 144A |
105,893 | 1,539,938 | ||||||
| Adyen NV, 144A * |
5,744 | 9,374,195 | ||||||
| Aegon NV |
456,738 | 2,008,974 | ||||||
| Akzo Nobel NV |
46,031 | 3,465,829 | ||||||
| Argenx SE * |
14,783 | 5,761,249 | ||||||
| ASM International NV |
12,420 | 5,381,988 | ||||||
| ASML Holding NV |
106,569 | 76,491,700 | ||||||
| Euronext NV, 144A |
21,906 | 1,455,264 | ||||||
| EXOR NV * |
27,903 | 2,316,251 | ||||||
| Heineken Holding NV |
30,021 | 2,552,718 | ||||||
| Heineken NV |
68,679 | 6,935,875 | ||||||
| IMCD NV |
15,179 | 2,280,402 | ||||||
| ING Groep NV |
958,354 | 11,788,627 | ||||||
| JDE Peet’s NV |
33,652 | 977,682 | ||||||
| Just Eat Takeaway.com NV, 144A * |
55,806 | 839,171 | ||||||
| Koninklijke Ahold Delhaize NV |
258,415 | 8,192,685 | ||||||
| Koninklijke KPN NV |
854,333 | 2,938,669 | ||||||
| Koninklijke Philips NV * |
246,874 | 4,656,494 | ||||||
| NN Group NV (b) |
66,566 | 2,399,261 | ||||||
| OCI NV |
26,802 | 595,606 | ||||||
| Prosus NV * |
212,110 | 13,959,431 | ||||||
| QIAGEN NV * |
59,080 | 2,665,589 | ||||||
| Randstad NV |
30,369 | 1,488,682 | ||||||
| Stellantis NV |
596,130 | 9,036,825 | ||||||
| Universal Music Group NV |
217,025 | 4,291,597 | ||||||
| Wolters Kluwer NV |
68,143 | 7,779,110 | ||||||
|
|
|
|||||||
| (Cost $132,049,322) |
191,173,812 | |||||||
|
|
|
|||||||
| Number |
Value |
|||||||
| New Zealand — 0.2% | ||||||||
| Auckland International Airport Ltd. * |
319,314 | $ | 1,706,865 | |||||
| Fisher & Paykel Healthcare Corp. Ltd. |
153,782 | 2,153,482 | ||||||
| Mercury NZ Ltd. |
177,035 | 699,481 | ||||||
| Meridian Energy Ltd. |
323,146 | 1,033,490 | ||||||
| Spark New Zealand Ltd. |
515,043 | 1,600,686 | ||||||
| Xero Ltd. * |
38,055 | 2,721,580 | ||||||
|
|
|
|||||||
| (Cost $8,675,775) |
9,915,584 | |||||||
|
|
|
|||||||
| Norway — 0.6% | ||||||||
| Adevinta ASA * |
69,156 | 484,083 | ||||||
| Aker BP ASA |
81,560 | 1,772,245 | ||||||
| DNB Bank ASA |
245,432 | 4,108,148 | ||||||
| Equinor ASA |
253,213 | 6,472,783 | ||||||
| Gjensidige Forsikring ASA |
47,799 | 803,095 | ||||||
| Kongsberg Gruppen ASA |
22,512 | 901,681 | ||||||
| Mowi ASA |
117,497 | 2,016,466 | ||||||
| Norsk Hydro ASA |
357,437 | 2,160,040 | ||||||
| Orkla ASA |
192,940 | 1,388,100 | ||||||
| Salmar ASA (b) |
19,443 | 856,528 | ||||||
| Telenor ASA |
182,063 | 1,869,803 | ||||||
| Yara International ASA (b) |
42,383 | 1,581,506 | ||||||
|
|
|
|||||||
| (Cost $27,944,280) |
24,414,478 | |||||||
|
|
|
|||||||
| Portugal — 0.2% | ||||||||
| EDP — Energias de Portugal SA |
771,608 | 3,762,612 | ||||||
| Galp Energia SGPS SA |
133,933 | 1,416,722 | ||||||
| Jeronimo Martins SGPS SA |
73,138 | 1,765,243 | ||||||
|
|
|
|||||||
| (Cost $6,076,900) |
6,944,577 | |||||||
|
|
|
|||||||
| Singapore — 1.4% | ||||||||
| CapitaLand Ascendas REIT |
860,999 | 1,719,069 | ||||||
| CapitaLand Integrated Commercial Trust REIT |
1,418,534 | 2,097,958 | ||||||
| CapitaLand Investment Ltd. |
672,200 | 1,645,332 | ||||||
| City Developments Ltd. |
140,500 | 701,305 | ||||||
| DBS Group Holdings Ltd. |
479,387 | 10,741,275 | ||||||
| Genting Singapore Ltd. |
1,634,278 | 1,220,602 | ||||||
| Grab Holdings Ltd., Class A * (b) |
496,220 | 1,478,736 | ||||||
| Jardine Cycle & Carriage Ltd. |
26,500 | 633,547 | ||||||
| Keppel Corp. Ltd. |
369,000 | 1,721,800 | ||||||
| Mapletree Logistics Trust REIT |
883,575 | 1,084,622 | ||||||
| Mapletree Pan Asia Commercial Trust REIT |
628,100 | 766,372 | ||||||
| Oversea-Chinese Banking Corp. Ltd. |
895,687 | 8,126,954 | ||||||
| Sea Ltd., ADR * |
96,593 | 5,545,404 | ||||||
| Seatrium Ltd. * |
10,095,160 | 918,217 | ||||||
| Singapore Airlines Ltd. |
370,150 | 1,754,538 | ||||||
| Singapore Exchange Ltd. |
214,900 | 1,474,726 | ||||||
| Singapore Technologies Engineering Ltd. |
445,800 | 1,206,558 | ||||||
| Singapore Telecommunications Ltd. |
2,146,589 | 3,952,530 | ||||||
| United Overseas Bank Ltd. |
334,754 | 6,918,860 | ||||||
| UOL Group Ltd. |
115,281 | 541,325 | ||||||
| Venture Corp. Ltd. |
75,100 | 842,466 | ||||||
| Wilmar International Ltd. |
490,166 | 1,417,251 | ||||||
|
|
|
|||||||
| (Cost $61,444,487) |
56,509,447 | |||||||
|
|
|
|||||||
| See Notes to Financial Statements. | 12 |
DBX ETF Trust
Schedule of Investments
Xtrackers MSCI EAFE Hedged Equity ETF (Continued)
May 31, 2023
| Number |
Value |
|||||||
| Spain — 2.5% | ||||||||
| Acciona SA |
6,327 | $ | 1,023,232 | |||||
| ACS Actividades de Construccion y Servicios SA |
54,025 | 1,797,098 | ||||||
| Aena SME SA, 144A |
19,956 | 3,118,590 | ||||||
| Amadeus IT Group SA * |
119,271 | 8,529,005 | ||||||
| Banco Bilbao Vizcaya Argentaria SA |
1,597,418 | 10,449,786 | ||||||
| Banco Santander SA |
4,357,935 | 14,184,220 | ||||||
| CaixaBank SA |
1,093,185 | 4,004,471 | ||||||
| Cellnex Telecom SA, 144A * |
150,039 | 6,079,885 | ||||||
| Corp ACCIONA Energias Renovables SA *(b) |
17,845 | 593,600 | ||||||
| EDP Renovaveis SA |
69,612 | 1,382,507 | ||||||
| EDP Renovaveis SA * |
913 | 18,132 | ||||||
| Enagas SA |
63,078 | 1,203,858 | ||||||
| Endesa SA |
81,906 | 1,771,124 | ||||||
| Ferrovial SA |
135,146 | 4,182,049 | ||||||
| Grifols SA *(b) |
79,488 | 921,443 | ||||||
| Iberdrola SA |
1,540,566 | 18,772,520 | ||||||
| Industria de Diseno Textil SA (b) |
288,677 | 9,655,064 | ||||||
| Naturgy Energy Group SA |
33,457 | 951,990 | ||||||
| Red Electrica Corp. SA |
104,389 | 1,768,009 | ||||||
| Repsol SA |
353,243 | 4,791,512 | ||||||
| Telefonica SA |
1,380,265 | 5,857,205 | ||||||
|
|
|
|||||||
| (Cost $112,765,014) |
101,055,300 | |||||||
|
|
|
|||||||
| Sweden — 3.0% | ||||||||
| Alfa Laval AB (b) |
74,644 | 2,681,236 | ||||||
| Assa Abloy AB, Class B |
265,858 | 5,899,354 | ||||||
| Atlas Copco AB, Class A |
715,973 | 10,427,720 | ||||||
| Atlas Copco AB, Class B |
411,109 | 5,174,947 | ||||||
| Beijer Ref AB |
89,716 | 1,326,915 | ||||||
| Boliden AB |
71,231 | 2,169,067 | ||||||
| Boliden AB * |
70,097 | 74,155 | ||||||
| Embracer Group AB *(b) |
163,943 | 377,006 | ||||||
| Epiroc AB, Class A |
169,893 | 2,974,591 | ||||||
| Epiroc AB, Class B |
104,239 | 1,574,372 | ||||||
| EQT AB (b) |
91,861 | 1,736,181 | ||||||
| Essity AB, Class B |
161,836 | 4,300,992 | ||||||
| Evolution AB, 144A |
48,512 | 6,373,017 | ||||||
| Fastighets AB Balder, Class B *(b) |
187,714 | 630,338 | ||||||
| Getinge AB, Class B |
58,611 | 1,347,559 | ||||||
| H & M Hennes & Mauritz AB, Class B (b) |
174,370 | 2,176,291 | ||||||
| Hexagon AB, Class B |
552,165 | 6,400,999 | ||||||
| Holmen AB, Class B (b) |
25,260 | 955,298 | ||||||
| Husqvarna AB, Class B |
108,363 | 799,856 | ||||||
| Industrivarden AB, Class A |
33,406 | 898,888 | ||||||
| Industrivarden AB, Class C (b) |
44,454 | 1,188,384 | ||||||
| Indutrade AB |
70,396 | 1,655,491 | ||||||
| Investment AB Latour, Class B (b) |
35,999 | 712,894 | ||||||
| Investor AB, Class A |
115,609 | 2,376,783 | ||||||
| Investor AB, Class B (b) |
459,138 | 9,335,668 | ||||||
| Kinnevik AB, Class B * |
59,265 | 850,598 | ||||||
| L E Lundbergforetagen AB, Class B (b) |
21,164 | 880,354 | ||||||
| Lifco AB, Class B |
60,789 | 1,283,359 | ||||||
| Nibe Industrier AB, Class B |
401,401 | 3,830,247 | ||||||
| Saab AB, Class B |
21,236 | 1,156,143 | ||||||
| Number |
Value |
|||||||
| Sweden (Continued) | ||||||||
| Sagax AB, Class B (b) |
47,236 | $ | 930,634 | |||||
| Sandvik AB |
284,545 | 4,999,033 | ||||||
| Securitas AB, Class B |
123,786 | 911,644 | ||||||
| Skandinaviska Enskilda Banken AB, Class A |
428,692 | 4,481,755 | ||||||
| Skanska AB, Class B (b) |
87,195 | 1,149,015 | ||||||
| SKF AB, Class B |
99,080 | 1,569,496 | ||||||
| Svenska Cellulosa AB SCA, Class B |
155,180 | 2,057,760 | ||||||
| Svenska Handelsbanken AB, Class A |
375,639 | 2,967,921 | ||||||
| Swedbank AB, Class A |
225,093 | 3,444,285 | ||||||
| Swedish Orphan Biovitrum AB * |
43,064 | 865,106 | ||||||
| Tele2 AB, Class B (b) |
147,404 | 1,339,320 | ||||||
| Telefonaktiebolaget LM Ericsson, Class B |
775,000 | 4,007,907 | ||||||
| Telia Co. AB (b) |
686,928 | 1,599,612 | ||||||
| Volvo AB, Class A |
53,420 | 1,029,826 | ||||||
| Volvo AB, Class B |
403,015 | 7,436,900 | ||||||
| Volvo Car AB, Class B *(b) |
142,032 | 487,933 | ||||||
|
|
|
|||||||
| (Cost $116,152,150) |
120,846,850 | |||||||
|
|
|
|||||||
| Switzerland — 10.7% | ||||||||
| ABB Ltd. |
415,703 | 15,181,204 | ||||||
| Adecco Group AG |
40,357 | 1,203,509 | ||||||
| Alcon, Inc. |
132,265 | 10,261,702 | ||||||
| Bachem Holding AG |
9,002 | 944,926 | ||||||
| Baloise Holding AG |
12,287 | 1,887,402 | ||||||
| Banque Cantonale Vaudoise (b) |
8,132 | 818,334 | ||||||
| Barry Callebaut AG |
957 | 1,934,490 | ||||||
| BKW AG |
5,508 | 987,600 | ||||||
| Chocoladefabriken Lindt & Spruengli AG |
28 | 3,387,977 | ||||||
| Chocoladefabriken Lindt & Spruengli AG Participation Certificates |
267 | 3,192,567 | ||||||
| Cie Financiere Richemont SA, Class A |
138,115 | 21,920,970 | ||||||
| Clariant AG * |
52,771 | 760,783 | ||||||
| Coca-Cola HBC AG * |
58,434 | 1,735,813 | ||||||
| DSM-Firmenich AG * |
46,032 | 5,119,147 | ||||||
| Dufry AG * |
26,273 | 1,187,658 | ||||||
| EMS-Chemie Holding AG |
1,795 | 1,389,487 | ||||||
| Geberit AG |
8,978 | 4,755,407 | ||||||
| Givaudan SA |
2,476 | 8,145,041 | ||||||
| Glencore PLC |
2,826,330 | 14,465,819 | ||||||
| Helvetia Holding AG |
10,557 | 1,498,787 | ||||||
| Holcim AG * |
146,657 | 9,040,158 | ||||||
| Julius Baer Group Ltd. |
56,173 | 3,431,749 | ||||||
| Kuehne + Nagel International AG |
14,093 | 4,009,329 | ||||||
| Logitech International SA |
44,580 | 2,856,644 | ||||||
| Lonza Group AG |
19,728 | 12,333,926 | ||||||
| Nestle SA |
727,584 | 86,199,631 | ||||||
| Novartis AG |
542,350 | 51,903,624 | ||||||
| Partners Group Holding AG |
6,030 | 5,434,449 | ||||||
| Roche Holding AG |
185,910 | 58,829,824 | ||||||
| Roche Holding AG |
8,478 | 2,857,805 | ||||||
| Schindler Holding AG |
6,091 | 1,221,210 | ||||||
| Schindler Holding AG Participation Certificates |
10,849 | 2,246,633 | ||||||
| SGS SA |
39,766 | 3,529,710 | ||||||
| See Notes to Financial Statements. | 13 |
DBX ETF Trust
Schedule of Investments
Xtrackers MSCI EAFE Hedged Equity ETF (Continued)
May 31, 2023
| Number |
Value |
|||||||
| Switzerland (Continued) | ||||||||
| SIG Group AG * |
78,621 | $ | 2,144,327 | |||||
| Sika AG |
38,891 | 10,607,219 | ||||||
| Sonova Holding AG |
13,780 | 3,531,432 | ||||||
| STMicroelectronics NV |
181,105 | 7,858,513 | ||||||
| Straumann Holding AG |
29,616 | 4,328,180 | ||||||
| Swatch Group AG — Bearer |
7,705 | 2,289,292 | ||||||
| Swatch Group AG — Registered |
13,681 | 767,608 | ||||||
| Swiss Life Holding AG (b) |
8,154 | 4,709,310 | ||||||
| Swiss Prime Site AG |
19,204 | 1,620,453 | ||||||
| Swiss Re AG |
79,900 | 8,002,721 | ||||||
| Swisscom AG |
6,853 | 4,340,171 | ||||||
| Temenos AG |
16,429 | 1,384,311 | ||||||
| UBS Group AG |
839,537 | 15,891,977 | ||||||
| VAT Group AG, 144A (b) |
7,176 | 2,957,071 | ||||||
| Zurich Insurance Group AG |
39,734 | 18,585,434 | ||||||
|
|
|
|||||||
| (Cost $340,978,735) |
433,691,334 | |||||||
|
|
|
|||||||
| United Kingdom — 13.7% | ||||||||
| 3i Group PLC |
257,600 | 6,266,237 | ||||||
| abrdn PLC |
524,586 | 1,295,330 | ||||||
| Admiral Group PLC |
56,324 | 1,628,994 | ||||||
| Anglo American PLC |
336,838 | 9,316,683 | ||||||
| Ashtead Group PLC |
116,182 | 7,081,708 | ||||||
| Associated British Foods PLC |
92,055 | 2,090,414 | ||||||
| AstraZeneca PLC |
410,077 | 59,479,467 | ||||||
| Auto Trader Group PLC, 144A |
246,215 | 1,929,559 | ||||||
| Aviva PLC |
726,716 | 3,563,563 | ||||||
| BAE Systems PLC |
807,525 | 9,323,965 | ||||||
| Barclays PLC |
4,117,415 | 7,751,424 | ||||||
| Barratt Developments PLC |
250,798 | 1,443,845 | ||||||
| Berkeley Group Holdings PLC |
30,397 | 1,484,513 | ||||||
| BP PLC |
4,682,575 | 26,404,234 | ||||||
| British American Tobacco PLC |
562,291 | 17,867,761 | ||||||
| British Land Co. PLC REIT |
233,522 | 996,380 | ||||||
| BT Group PLC |
1,791,204 | 3,272,066 | ||||||
| Bunzl PLC |
89,570 | 3,503,065 | ||||||
| Burberry Group PLC |
101,543 | 2,720,814 | ||||||
| Centrica PLC |
1,506,801 | 2,205,215 | ||||||
| CNH Industrial NV |
268,969 | 3,435,639 | ||||||
| Coca-Cola Europacific Partners PLC |
54,561 | 3,404,061 | ||||||
| Compass Group PLC |
461,403 | 12,638,654 | ||||||
| Croda International PLC |
36,591 | 2,776,561 | ||||||
| Diageo PLC |
596,734 | 24,845,034 | ||||||
| Endeavour Mining PLC |
49,528 | 1,325,855 | ||||||
| Entain PLC |
156,886 | 2,574,140 | ||||||
| GSK PLC |
1,083,917 | 18,154,038 | ||||||
| Haleon PLC |
1,345,959 | 5,327,643 | ||||||
| Halma PLC |
100,807 | 3,020,860 | ||||||
| Hargreaves Lansdown PLC |
88,701 | 885,145 | ||||||
| HSBC Holdings PLC |
5,286,624 | 38,833,043 | ||||||
| Imperial Brands PLC |
232,058 | 4,892,934 | ||||||
| Informa PLC |
363,544 | 3,152,048 | ||||||
| InterContinental Hotels Group PLC |
46,520 | 3,048,517 | ||||||
| Intertek Group PLC |
42,739 | 2,208,482 | ||||||
| J Sainsbury PLC |
425,409 | 1,431,982 | ||||||
| JD Sports Fashion PLC |
689,780 | 1,304,239 | ||||||
| Number |
Value |
|||||||
| United Kingdom (Continued) | ||||||||
| Johnson Matthey PLC |
46,349 | $ | 997,446 | |||||
| Kingfisher PLC |
496,167 | 1,425,749 | ||||||
| Land Securities Group PLC REIT |
181,025 | 1,355,621 | ||||||
| Legal & General Group PLC |
1,582,698 | 4,490,828 | ||||||
| Lloyds Banking Group PLC |
17,530,124 | 9,631,978 | ||||||
| London Stock Exchange Group PLC |
106,273 | 11,302,959 | ||||||
| M&G PLC |
604,000 | 1,489,168 | ||||||
| Mondi PLC |
123,770 | 1,916,849 | ||||||
| National Grid PLC |
972,695 | 13,382,428 | ||||||
| NatWest Group PLC |
1,517,919 | 4,901,809 | ||||||
| Next PLC |
33,190 | 2,620,055 | ||||||
| Ocado Group PLC *(b) |
147,128 | 675,344 | ||||||
| Pearson PLC |
169,745 | 1,685,434 | ||||||
| Persimmon PLC |
81,590 | 1,219,449 | ||||||
| Phoenix Group Holdings PLC |
201,190 | 1,382,494 | ||||||
| Reckitt Benckiser Group PLC |
189,539 | 14,726,640 | ||||||
| RELX PLC |
503,369 | 15,716,770 | ||||||
| Rentokil Initial PLC |
658,317 | 5,229,583 | ||||||
| Rio Tinto PLC |
298,006 | 17,727,100 | ||||||
| Rolls-Royce Holdings PLC * |
2,215,379 | 3,949,093 | ||||||
| Sage Group PLC |
271,204 | 2,938,444 | ||||||
| Schroders PLC |
218,324 | 1,237,338 | ||||||
| Segro PLC REIT |
338,283 | 3,356,359 | ||||||
| Severn Trent PLC |
65,879 | 2,272,479 | ||||||
| Shell PLC |
1,812,019 | 50,051,446 | ||||||
| Smith & Nephew PLC |
231,477 | 3,461,110 | ||||||
| Smiths Group PLC |
98,349 | 1,964,801 | ||||||
| Spirax-Sarco Engineering PLC |
18,923 | 2,571,666 | ||||||
| SSE PLC |
288,373 | 6,749,350 | ||||||
| St James’s Place PLC |
143,965 | 1,996,801 | ||||||
| Standard Chartered PLC |
634,210 | 4,998,634 | ||||||
| Taylor Wimpey PLC |
952,741 | 1,353,456 | ||||||
| Tesco PLC |
1,941,066 | 6,297,251 | ||||||
| Unilever PLC |
668,338 | 33,496,276 | ||||||
| United Utilities Group PLC |
173,829 | 2,189,376 | ||||||
| Vodafone Group PLC |
6,085,776 | 5,781,518 | ||||||
| Whitbread PLC |
54,764 | 2,238,545 | ||||||
| Wise PLC, Class A * |
162,920 | 1,176,264 | ||||||
| WPP PLC |
284,348 | 3,020,017 | ||||||
|
|
|
|||||||
| (Cost $578,884,029) |
555,862,040 | |||||||
|
|
|
|||||||
| TOTAL COMMON STOCKS |
3,927,314,765 | |||||||
|
|
|
|||||||
| PREFERRED STOCKS — 0.5% |
| |||||||
| Germany — 0.5% | ||||||||
| Bayerische Motoren Werke AG |
16,009 | 1,645,322 | ||||||
| Dr Ing hc F Porsche AG, 144A * |
30,165 | 3,745,070 | ||||||
| Henkel AG & Co. KGaA |
44,613 | 3,554,579 | ||||||
| Porsche Automobil Holding SE * |
39,356 | 2,183,312 | ||||||
| Sartorius AG (b) |
6,956 | 2,330,958 | ||||||
| Volkswagen AG |
54,661 | 6,811,442 | ||||||
|
|
|
|||||||
| (Cost $23,840,985) |
20,270,683 | |||||||
|
|
|
|||||||
| See Notes to Financial Statements. | 14 |
DBX ETF Trust
Schedule of Investments
Xtrackers MSCI EAFE Hedged Equity ETF (Continued)
May 31, 2023
| Number |
Value |
|||||||
| WARRANTS — 0.0% |
| |||||||
| Switzerland — 0.0% | ||||||||
| Cie Financiere Richemont SA*, |
255,836 | $ | 316,020 | |||||
|
|
|
|||||||
| SECURITIES LENDING COLLATERAL — 1.8% | ||||||||
| DWS Government & Agency Securities Portfolio “DWS Government Cash Institutional Shares”,
5.03% (d)(e) |
72,167,804 | 72,167,804 | ||||||
|
|
|
|||||||
| Number |
Value |
|||||||
| CASH EQUIVALENTS — 1.3% | ||||||||
| DWS ESG Liquidity Fund “Capital Shares”, 5.20% (d) |
11,809,080 | $ | 11,805,537 | |||||
| DWS Government Money Market Series “Institutional Shares”, 5.04% (d) |
42,151,828 | 42,151,828 | ||||||
|
|
|
|||||||
| TOTAL CASH EQUIVALENTS |
||||||||
| (Cost $53,960,908) |
53,957,365 | |||||||
|
|
|
|||||||
| TOTAL INVESTMENTS — 100.6% |
||||||||
| (Cost $3,669,436,192) |
$ | 4,074,026,637 | ||||||
| Other assets and liabilities, net — (0.6%) |
(24,840,980 | ) | ||||||
|
|
|
|||||||
| NET ASSETS — 100.0% |
$ | 4,049,185,657 | ||||||
|
|
|
|||||||
A summary of the Fund’s transactions with affiliated investments during the year ended May 31, 2023 is as follows:
| Value ($) at 5/31/2022 |
Purchases Cost ($) |
Sales Proceeds ($) |
Net Realized Gain/(Loss) ($) |
Net Change in Unrealized Appreciation (Depreciation) ($) |
Income ($) | Capital Gain Distributions ($) |
Number of Shares at 5/31/2023 |
Value ($) at 5/31/2023 |
||||||||||||||||||||||||||||
| COMMON STOCKS — 0.1% |
|
|||||||||||||||||||||||||||||||||||
| Germany — 0.1% |
|
|||||||||||||||||||||||||||||||||||
| Deutsche Bank AG (c) |
| |||||||||||||||||||||||||||||||||||
| 6,384,048 | 1,103,479 | (1,851,999 | ) | (3,604,957 | ) | 3,174,237 | 170,231 | — | 513,857 | 5,204,808 | ||||||||||||||||||||||||||
| SECURITIES LENDING COLLATERAL — 1.8% |
| |||||||||||||||||||||||||||||||||||
| DWS Government & Agency Securities Portfolio “DWS Government Cash Institutional Shares”, 5.03% (d)(e) |
| |||||||||||||||||||||||||||||||||||
| 87,362,002 | — | (15,194,198 | ) (f) | — | — | 906,067 | — | 72,167,804 | 72,167,804 | |||||||||||||||||||||||||||
| CASH EQUIVALENTS — 1.3% |
| |||||||||||||||||||||||||||||||||||
| DWS ESG Liquidity Fund “Capital Shares”, 5.20% (d) |
| |||||||||||||||||||||||||||||||||||
| 11,386,377 | 415,867 | — | — | 3,293 | 417,075 | — | 11,809,080 | 11,805,537 | ||||||||||||||||||||||||||||
| DWS Government Money Market Series “Institutional Shares”, 5.04% (d) |
| |||||||||||||||||||||||||||||||||||
| — | 2,078,936,348 | (2,036,784,520 | ) | — | — | 1,962,811 | — | 42,151,828 | 42,151,828 | |||||||||||||||||||||||||||
|
|
|
|
|
|
|
|
|
|
|
|
|
|
|
|
|
|
|
|||||||||||||||||||
| 105,132,427 | 2,080,455,694 | (2,053,830,717 | ) | (3,604,957 | ) | 3,177,530 | 3,456,184 | — | 126,642,569 | 131,329,977 | ||||||||||||||||||||||||||
|
|
|
|
|
|
|
|
|
|
|
|
|
|
|
|
|
|
|
|||||||||||||||||||
| * | Non-income producing security. |
| (a) | Stapled Security — A security contractually bound to one or more other securities to form a single saleable unit which cannot be sold separately. |
| (b) | All or a portion of these securities were on loan. In addition, “Other assets and liabilities, net” may include pending sales that are also on loan. The value of securities loaned at May 31, 2023 amounted to $114,405,535, which is 2.8% of net assets. |
| (c) | Affiliated issuer. This security is owned in proportion with its representation in the index. |
| (d) | Affiliated fund managed by DWS Investment Management Americas, Inc. The rate shown is the annualized seven-day yield at period end. |
| (e) | Represents cash collateral held in connection with securities lending. Income earned by the Fund is net of borrower rebates. In addition, the Fund held non-cash U.S. Treasury securities collateral having a value of $63,336,398. |
| (f) | Represents the net increase (purchase cost) or decrease (sales proceeds) in the amount invested in cash collateral for the year ended May 31, 2023. |
| ADR: | American Depositary Receipt |
| CDI: | Chess Depositary Interests |
| CVA: | Credit Valuation Adjustment |
| REIT: | Real Estate Investment Trust |
| 144A: | Security exempt from registration under Rule 144A of the Securities Act of 1933. These securities may be resold in transactions exempt from registration, normally to qualified institutional buyers. |
Securities are listed in country of domicile.
| See Notes to Financial Statements. | 15 |
DBX ETF Trust
Schedule of Investments
Xtrackers MSCI EAFE Hedged Equity ETF (Continued)
May 31, 2023
At May 31, 2023, open futures contracts purchased were as follows:
| Contract Description |
Currency | Number of Contracts |
Notional Amount |
Contract Value |
Expiration Date |
Unrealized Appreciation (Depreciation) |
||||||||||||
| AMSTERDAM Index Futures |
EUR | 35 | $ | 5,665,947 | $ | 5,606,791 | 6/16/2023 | $ | (59,156 | ) | ||||||||
| CAC40 10 EURO Futures |
EUR | 135 | 10,642,049 | 10,244,693 | 6/16/2023 | (397,356 | ) | |||||||||||
| DAX Index Futures |
EUR | 22 | 9,139,121 | 9,209,382 | 6/16/2023 | 70,261 | ||||||||||||
| EURO STOXX 50 Futures |
EUR | 225 | 10,317,887 | 10,141,998 | 6/16/2023 | (175,889 | ) | |||||||||||
| FTSE 100 Index Futures |
GBP | 135 | 12,778,717 | 12,514,391 | 6/16/2023 | (264,326 | ) | |||||||||||
| FTSE/MIB Index Futures |
EUR | 6 | 853,814 | 836,725 | 6/16/2023 | (17,089 | ) | |||||||||||
| IBEX 35 Index Futures |
EUR | 30 | 2,959,826 | 2,897,929 | 6/16/2023 | (61,897 | ) | |||||||||||
| MSCI EAFE Futures |
USD | 215 | 21,697,800 | 22,074,050 | 6/16/2023 | 376,250 | ||||||||||||
| MSCI Singapore Index Futures |
SGD | 65 | 1,399,217 | 1,366,764 | 6/28/2023 | (32,453 | ) | |||||||||||
| OMXS30 Index Futures |
SEK | 115 | 2,382,828 | 2,373,005 | 6/16/2023 | (9,823 | ) | |||||||||||
| SPI 200 Futures |
AUD | 65 | 7,560,623 | 7,504,570 | 6/15/2023 | (56,053 | ) | |||||||||||
| SWISS MID CAP Futures |
CHF | 200 | 5,938,002 | 5,889,651 | 6/16/2023 | (48,351 | ) | |||||||||||
| TOPIX Index Futures |
JPY | 115 | 16,761,498 | 17,548,179 | 6/08/2023 | 786,681 | ||||||||||||
|
|
|
|||||||||||||||||
| Total net unrealized appreciation |
$ | 110,799 | ||||||||||||||||
|
|
|
|||||||||||||||||
As of May 31, 2023, the Fund had the following forward foreign currency contracts outstanding:
| Counterparty |
Settlement Date |
Currency To Deliver |
Currency To Receive |
Unrealized Appreciation |
Unrealized Depreciation |
|||||||||||||||||
| Goldman Sachs & Co. |
6/2/2023 | AUD | 149,559,842 | USD | 98,967,486 | $ | 1,686,244 | $ | — | |||||||||||||
| Goldman Sachs & Co. |
6/2/2023 | AUD | 1,562,100 | USD | 1,059,369 | 43,301 | — | |||||||||||||||
| JP Morgan & Chase Co. |
6/2/2023 | AUD | 135,550,200 | USD | 89,693,567 | 1,524,900 | — | |||||||||||||||
| JP Morgan & Chase Co. |
6/2/2023 | AUD | 1,562,100 | USD | 1,016,163 | 95 | — | |||||||||||||||
| JP Morgan & Chase Co. |
6/2/2023 | AUD | 1,562,100 | USD | 1,032,866 | 16,798 | — | |||||||||||||||
| RBC Capital Markets |
6/2/2023 | AUD | 1,562,100 | USD | 1,042,464 | 26,396 | — | |||||||||||||||
| RBC Capital Markets |
6/2/2023 | AUD | 9,055,000 | USD | 5,991,829 | 102,002 | — | |||||||||||||||
| RBC Capital Markets |
6/2/2023 | AUD | 143,216,500 | USD | 94,769,580 | 1,614,366 | — | |||||||||||||||
| Goldman Sachs & Co. |
6/2/2023 | CHF | 1,301,600 | USD | 1,466,901 | 37,749 | — | |||||||||||||||
| Goldman Sachs & Co. |
6/2/2023 | CHF | 123,905,300 | USD | 139,690,304 | 3,642,761 | — | |||||||||||||||
| JP Morgan & Chase Co. |
6/2/2023 | CHF | 1,301,600 | USD | 1,444,251 | 15,099 | — | |||||||||||||||
| JP Morgan & Chase Co. |
6/2/2023 | CHF | 113,188,500 | USD | 127,604,633 | 3,324,095 | — | |||||||||||||||
| JP Morgan & Chase Co. |
6/2/2023 | CHF | 1,301,600 | USD | 1,436,853 | 7,701 | — | |||||||||||||||
| RBC Capital Markets |
6/2/2023 | CHF | 1,301,600 | USD | 1,462,894 | 33,742 | — | |||||||||||||||
| RBC Capital Markets |
6/2/2023 | CHF | 116,976,200 | USD | 131,874,750 | 3,435,332 | — | |||||||||||||||
| RBC Capital Markets |
6/2/2023 | CHF | 10,390,000 | USD | 11,713,140 | 304,960 | — | |||||||||||||||
| Goldman Sachs & Co. |
6/2/2023 | DKK | 2,973,800 | USD | 439,177 | 12,315 | — | |||||||||||||||
| Goldman Sachs & Co. |
6/2/2023 | DKK | 247,309,300 | USD | 36,706,390 | 1,207,362 | — | |||||||||||||||
| Goldman Sachs & Co. |
6/2/2023 | DKK | 2,973,800 | USD | 439,911 | 13,049 | — | |||||||||||||||
| Goldman Sachs & Co. |
6/2/2023 | DKK | 16,946,000 | USD | 2,515,139 | 82,692 | — | |||||||||||||||
| JP Morgan & Chase Co. |
6/2/2023 | DKK | 2,973,800 | USD | 428,089 | 1,227 | — | |||||||||||||||
| JP Morgan & Chase Co. |
6/2/2023 | DKK | 2,973,800 | USD | 430,208 | 3,346 | — | |||||||||||||||
| JP Morgan & Chase Co. |
6/2/2023 | DKK | 242,684,400 | USD | 36,016,741 | 1,181,576 | — | |||||||||||||||
| RBC Capital Markets |
6/2/2023 | DKK | 325,728,400 | USD | 48,345,588 | 1,590,204 | — | |||||||||||||||
| Goldman Sachs & Co. |
6/2/2023 | EUR | 394,013,900 | USD | 435,739,972 | 14,578,194 | — | |||||||||||||||
| Goldman Sachs & Co. |
6/2/2023 | EUR | 4,365,600 | USD | 4,800,060 | 133,667 | — | |||||||||||||||
| Goldman Sachs & Co. |
6/2/2023 | EUR | 19,042,000 | USD | 21,058,243 | 704,234 | — | |||||||||||||||
| JP Morgan & Chase Co. |
6/2/2023 | EUR | 4,365,600 | USD | 4,703,615 | 37,222 | — | |||||||||||||||
| JP Morgan & Chase Co. |
6/2/2023 | EUR | 345,210,100 | USD | 381,781,658 | 12,786,302 | — | |||||||||||||||
| JP Morgan & Chase Co. |
6/2/2023 | EUR | 4,365,600 | USD | 4,681,748 | 15,355 | — | |||||||||||||||
| RBC Capital Markets |
6/2/2023 | EUR | 464,113,100 | USD | 513,285,883 | 17,195,014 | — | |||||||||||||||
| RBC Capital Markets |
6/2/2023 | EUR | 4,365,600 | USD | 4,812,921 | 146,528 | — | |||||||||||||||
| Goldman Sachs & Co. |
6/2/2023 | GBP | 11,363,000 | USD | 14,291,268 | 156,258 | — | |||||||||||||||
| Goldman Sachs & Co. |
6/2/2023 | GBP | 129,163,700 | USD | 162,452,415 | 1,779,164 | — | |||||||||||||||
| Goldman Sachs & Co. |
6/2/2023 | GBP | 1,705,500 | USD | 2,154,357 | 32,799 | — | |||||||||||||||
| JP Morgan & Chase Co. |
6/2/2023 | GBP | 1,705,500 | USD | 2,117,014 | — | (4,543 | ) | ||||||||||||||
| JP Morgan & Chase Co. |
6/2/2023 | GBP | 1,705,500 | USD | 2,100,840 | — | (20,718 | ) | ||||||||||||||
| See Notes to Financial Statements. | 16 |
DBX ETF Trust
Schedule of Investments
Xtrackers MSCI EAFE Hedged Equity ETF (Continued)
May 31, 2023
| Counterparty |
Settlement Date |
Currency To Deliver |
Currency To Receive |
Unrealized Appreciation |
Unrealized Depreciation |
|||||||||||||||||
| JP Morgan & Chase Co. |
6/2/2023 | GBP | 140,458,700 | USD | 176,657,716 | $ | 1,934,044 | $ | — | |||||||||||||
| RBC Capital Markets |
6/2/2023 | GBP | 1,705,500 | USD | 2,129,228 | 7,670 | — | |||||||||||||||
| RBC Capital Markets |
6/2/2023 | GBP | 196,561,300 | USD | 247,219,078 | 2,706,548 | — | |||||||||||||||
| Goldman Sachs & Co. |
6/2/2023 | HKD | 2,838,100 | USD | 362,223 | — | (221 | ) | ||||||||||||||
| Goldman Sachs & Co. |
6/2/2023 | HKD | 2,838,100 | USD | 362,583 | 139 | — | |||||||||||||||
| Goldman Sachs & Co. |
6/2/2023 | HKD | 234,266,900 | USD | 29,880,982 | — | (36,443 | ) | ||||||||||||||
| JP Morgan & Chase Co. |
6/2/2023 | HKD | 2,838,100 | USD | 362,248 | — | (196 | ) | ||||||||||||||
| JP Morgan & Chase Co. |
6/2/2023 | HKD | 239,832,000 | USD | 30,592,143 | — | (35,982 | ) | ||||||||||||||
| RBC Capital Markets |
6/2/2023 | HKD | 320,571,400 | USD | 40,890,983 | — | (48,095 | ) | ||||||||||||||
| RBC Capital Markets |
6/2/2023 | HKD | 2,838,100 | USD | 361,942 | — | (502 | ) | ||||||||||||||
| Goldman Sachs & Co. |
6/2/2023 | ILS | 19,812,600 | USD | 5,452,834 | 143,351 | — | |||||||||||||||
| JP Morgan & Chase Co. |
6/2/2023 | ILS | 20,482,700 | USD | 5,637,570 | 148,510 | — | |||||||||||||||
| RBC Capital Markets |
6/2/2023 | ILS | 227,400 | USD | 62,484 | 1,544 | — | |||||||||||||||
| RBC Capital Markets |
6/2/2023 | ILS | 23,374,200 | USD | 6,433,414 | 169,475 | — | |||||||||||||||
| Goldman Sachs & Co. |
6/2/2023 | JPY | 406,321,900 | USD | 2,987,683 | 71,323 | — | |||||||||||||||
| Goldman Sachs & Co. |
6/2/2023 | JPY | 33,715,322,200 | USD | 248,757,311 | 6,766,842 | — | |||||||||||||||
| Goldman Sachs & Co. |
6/2/2023 | JPY | 406,321,900 | USD | 3,033,928 | 117,568 | — | |||||||||||||||
| JP Morgan & Chase Co. |
6/2/2023 | JPY | 406,321,900 | USD | 2,900,184 | — | (16,177 | ) | ||||||||||||||
| JP Morgan & Chase Co. |
6/2/2023 | JPY | 406,321,900 | USD | 2,934,963 | 18,603 | — | |||||||||||||||
| JP Morgan & Chase Co. |
6/2/2023 | JPY | 31,752,149,800 | USD | 234,273,560 | 6,373,687 | — | |||||||||||||||
| RBC Capital Markets |
6/2/2023 | JPY | 3,060,400,000 | USD | 22,579,805 | 613,898 | — | |||||||||||||||
| RBC Capital Markets |
6/2/2023 | JPY | 45,242,273,200 | USD | 333,805,092 | 9,080,361 | — | |||||||||||||||
| Goldman Sachs & Co. |
6/2/2023 | NOK | 74,833,200 | USD | 7,010,070 | 268,462 | — | |||||||||||||||
| JP Morgan & Chase Co. |
6/2/2023 | NOK | 77,011,200 | USD | 7,214,096 | 276,275 | — | |||||||||||||||
| RBC Capital Markets |
6/2/2023 | NOK | 115,015,300 | USD | 10,774,166 | 412,614 | — | |||||||||||||||
| RBC Capital Markets |
6/2/2023 | NOK | 953,100 | USD | 88,356 | 2,492 | — | |||||||||||||||
| Goldman Sachs & Co. |
6/2/2023 | NZD | 6,422,400 | USD | 3,966,487 | 98,275 | — | |||||||||||||||
| JP Morgan & Chase Co. |
6/2/2023 | NZD | 3,786,300 | USD | 2,338,426 | 57,938 | — | |||||||||||||||
| RBC Capital Markets |
6/2/2023 | NZD | 50,300 | USD | 31,227 | 932 | — | |||||||||||||||
| RBC Capital Markets |
6/2/2023 | NZD | 3,882,000 | USD | 2,397,531 | 59,402 | — | |||||||||||||||
| Goldman Sachs & Co. |
6/2/2023 | SEK | 422,788,300 | USD | 41,282,276 | 2,322,076 | — | |||||||||||||||
| Goldman Sachs & Co. |
6/2/2023 | SEK | 40,835,000 | USD | 3,987,188 | 224,218 | — | |||||||||||||||
| Goldman Sachs & Co. |
6/2/2023 | SEK | 4,951,600 | USD | 485,085 | 28,792 | — | |||||||||||||||
| JP Morgan & Chase Co. |
6/2/2023 | SEK | 377,830,100 | USD | 36,889,905 | 2,072,631 | — | |||||||||||||||
| JP Morgan & Chase Co. |
6/2/2023 | SEK | 4,951,600 | USD | 457,488 | 1,195 | — | |||||||||||||||
| JP Morgan & Chase Co. |
6/2/2023 | SEK | 4,951,600 | USD | 466,044 | 9,751 | — | |||||||||||||||
| RBC Capital Markets |
6/2/2023 | SEK | 544,989,100 | USD | 53,214,316 | 2,993,238 | — | |||||||||||||||
| RBC Capital Markets |
6/2/2023 | SEK | 4,951,600 | USD | 480,979 | 24,686 | — | |||||||||||||||
| Goldman Sachs & Co. |
6/2/2023 | USD | 97,798,565 | AUD | 151,121,942 | 498,746 | — | |||||||||||||||
| JP Morgan & Chase Co. |
6/2/2023 | USD | 89,743,138 | AUD | 138,674,400 | 457,666 | — | |||||||||||||||
| RBC Capital Markets |
6/2/2023 | USD | 99,553,414 | AUD | 153,833,600 | 507,696 | — | |||||||||||||||
| Goldman Sachs & Co. |
6/2/2023 | USD | 136,965,378 | CHF | 125,206,900 | 511,317 | — | |||||||||||||||
| JP Morgan & Chase Co. |
6/2/2023 | USD | 126,665,974 | CHF | 115,791,700 | 472,868 | — | |||||||||||||||
| RBC Capital Markets |
6/2/2023 | USD | 140,751,299 | CHF | 128,667,800 | 525,451 | — | |||||||||||||||
| Goldman Sachs & Co. |
6/2/2023 | USD | 38,682,200 | DKK | 270,202,900 | 102,998 | — | |||||||||||||||
| JP Morgan & Chase Co. |
6/2/2023 | USD | 35,594,113 | DKK | 248,632,000 | 94,776 | — | |||||||||||||||
| RBC Capital Markets |
6/2/2023 | USD | 46,631,220 | DKK | 325,728,400 | 124,164 | — | |||||||||||||||
| Goldman Sachs & Co. |
6/2/2023 | USD | 445,013,061 | EUR | 417,421,500 | 1,169,119 | — | |||||||||||||||
| JP Morgan & Chase Co. |
6/2/2023 | USD | 377,336,820 | EUR | 353,941,300 | 991,323 | — | |||||||||||||||
| RBC Capital Markets |
6/2/2023 | USD | 499,445,142 | EUR | 468,478,700 | 1,312,121 | — | |||||||||||||||
| Goldman Sachs & Co. |
6/2/2023 | USD | 176,282,589 | GBP | 142,232,200 | 647,229 | — | |||||||||||||||
| JP Morgan & Chase Co. |
6/2/2023 | USD | 178,312,106 | GBP | 143,869,700 | 654,681 | — | |||||||||||||||
| RBC Capital Markets |
6/2/2023 | USD | 245,731,872 | GBP | 198,266,800 | 902,216 | — | |||||||||||||||
| Goldman Sachs & Co. |
6/2/2023 | USD | 30,650,925 | HKD | 239,943,100 | — | (8,612 | ) | ||||||||||||||
| JP Morgan & Chase Co. |
6/2/2023 | USD | 30,999,278 | HKD | 242,670,100 | — | (8,709 | ) | ||||||||||||||
| RBC Capital Markets |
6/2/2023 | USD | 41,260,422 | HKD | 323,409,500 | 41,100 | — | |||||||||||||||
| Goldman Sachs & Co. |
6/2/2023 | USD | 5,304,649 | ILS | 19,812,600 | 4,833 | — | |||||||||||||||
| JP Morgan & Chase Co. |
6/2/2023 | USD | 5,484,063 | ILS | 20,482,700 | 4,997 | — | |||||||||||||||
| See Notes to Financial Statements. | 17 |
DBX ETF Trust
Schedule of Investments
Xtrackers MSCI EAFE Hedged Equity ETF (Continued)
May 31, 2023
| Counterparty |
Settlement Date |
Currency To Deliver |
Currency To Receive | Unrealized Appreciation |
Unrealized Depreciation |
|||||||||||||||||
| RBC Capital Markets |
6/2/2023 | USD | 6,319,121 | ILS | 23,601,600 | $ | 5,758 | $ | — | |||||||||||||
| Goldman Sachs & Co. |
6/2/2023 | USD | 247,131,418 | JPY | 34,527,966,000 | 691,773 | — | |||||||||||||||
| JP Morgan & Chase Co. |
6/2/2023 | USD | 233,080,153 | JPY | 32,564,793,600 | 652,440 | — | |||||||||||||||
| RBC Capital Markets |
6/2/2023 | USD | 345,722,887 | JPY | 48,302,673,200 | 967,751 | — | |||||||||||||||
| RBC Capital Markets |
6/2/2023 | USD | 10,407,334 | NOK | 115,968,400 | 40,082 | — | |||||||||||||||
| RBC Capital Markets |
6/2/2023 | USD | 6,911,204 | NOK | 77,011,200 | 26,617 | — | |||||||||||||||
| RBC Capital Markets |
6/2/2023 | USD | 6,715,744 | NOK | 74,833,200 | 25,864 | — | |||||||||||||||
| Goldman Sachs & Co. |
6/2/2023 | USD | 3,849,265 | NZD | 6,422,400 | 18,946 | — | |||||||||||||||
| Goldman Sachs & Co. |
6/2/2023 | USD | 2,269,319 | NZD | 3,786,300 | 11,170 | — | |||||||||||||||
| Goldman Sachs & Co. |
6/2/2023 | USD | 2,356,824 | NZD | 3,932,300 | 11,600 | — | |||||||||||||||
| Goldman Sachs & Co. |
6/2/2023 | USD | 43,053,300 | SEK | 468,574,900 | 126,163 | — | |||||||||||||||
| JP Morgan & Chase Co. |
6/2/2023 | USD | 35,625,464 | SEK | 387,733,300 | 104,396 | — | |||||||||||||||
| RBC Capital Markets |
6/2/2023 | USD | 50,529,301 | SEK | 549,940,700 | 148,070 | — | |||||||||||||||
| Goldman Sachs & Co. |
6/5/2023 | SGD | 236,600 | USD | 174,653 | — | (338 | ) | ||||||||||||||
| Goldman Sachs & Co. |
6/5/2023 | SGD | 236,600 | USD | 175,676 | 684 | — | |||||||||||||||
| Goldman Sachs & Co. |
6/5/2023 | SGD | 236,600 | USD | 178,723 | 3,732 | — | |||||||||||||||
| Goldman Sachs & Co. |
6/5/2023 | SGD | 21,008,600 | USD | 15,764,707 | 226,528 | — | |||||||||||||||
| JP Morgan & Chase Co. |
6/5/2023 | SGD | 22,513,300 | USD | 16,893,823 | 242,752 | — | |||||||||||||||
| RBC Capital Markets |
6/5/2023 | SGD | 236,600 | USD | 177,474 | 2,482 | — | |||||||||||||||
| RBC Capital Markets |
6/5/2023 | SGD | 22,737,200 | USD | 17,061,836 | 245,167 | — | |||||||||||||||
| Goldman Sachs & Co. |
6/5/2023 | USD | 16,030,114 | SGD | 21,718,400 | 33,040 | — | |||||||||||||||
| JP Morgan & Chase Co. |
6/5/2023 | USD | 16,616,821 | SGD | 22,513,300 | 34,250 | — | |||||||||||||||
| RBC Capital Markets |
6/5/2023 | USD | 16,956,711 | SGD | 22,973,800 | 34,950 | — | |||||||||||||||
| Goldman Sachs & Co. |
7/5/2023 | AUD | 151,121,942 | USD | 97,918,707 | — | (511,331 | ) | ||||||||||||||
| JP Morgan & Chase Co. |
7/5/2023 | AUD | 2,401,900 | USD | 1,564,216 | — | (210 | ) | ||||||||||||||
| JP Morgan & Chase Co. |
7/5/2023 | AUD | 138,674,400 | USD | 89,853,107 | — | (469,491 | ) | ||||||||||||||
| JP Morgan & Chase Co. |
7/5/2023 | AUD | 11,121,000 | USD | 7,205,663 | — | (37,762 | ) | ||||||||||||||
| RBC Capital Markets |
7/5/2023 | AUD | 153,833,600 | USD | 99,675,712 | — | (520,506 | ) | ||||||||||||||
| Goldman Sachs & Co. |
7/5/2023 | CHF | 125,206,900 | USD | 137,488,772 | — | (558,900 | ) | ||||||||||||||
| JP Morgan & Chase Co. |
7/5/2023 | CHF | 115,791,700 | USD | 127,150,709 | — | (516,175 | ) | ||||||||||||||
| JP Morgan & Chase Co. |
7/5/2023 | CHF | 1,988,600 | USD | 2,191,722 | — | (821 | ) | ||||||||||||||
| JP Morgan & Chase Co. |
7/5/2023 | CHF | 6,844,000 | USD | 7,515,296 | — | (30,600 | ) | ||||||||||||||
| RBC Capital Markets |
7/5/2023 | CHF | 128,667,800 | USD | 141,289,161 | — | (574,349 | ) | ||||||||||||||
| Goldman Sachs & Co. |
7/5/2023 | DKK | 270,202,900 | USD | 38,768,225 | — | (111,842 | ) | ||||||||||||||
| Goldman Sachs & Co. |
7/5/2023 | DKK | 4,621,500 | USD | 664,806 | — | (192 | ) | ||||||||||||||
| JP Morgan & Chase Co. |
7/5/2023 | DKK | 30,436,000 | USD | 4,366,649 | — | (12,851 | ) | ||||||||||||||
| JP Morgan & Chase Co. |
7/5/2023 | DKK | 248,632,000 | USD | 35,671,736 | — | (104,449 | ) | ||||||||||||||
| RBC Capital Markets |
7/5/2023 | DKK | 325,728,400 | USD | 46,734,924 | — | (134,825 | ) | ||||||||||||||
| Goldman Sachs & Co. |
7/5/2023 | EUR | 417,421,500 | USD | 445,879,211 | — | (1,228,420 | ) | ||||||||||||||
| JP Morgan & Chase Co. |
7/5/2023 | EUR | 353,941,300 | USD | 378,067,709 | — | (1,045,145 | ) | ||||||||||||||
| JP Morgan & Chase Co. |
7/5/2023 | EUR | 6,594,600 | USD | 7,062,296 | — | (1,298 | ) | ||||||||||||||
| JP Morgan & Chase Co. |
7/5/2023 | EUR | 8,734,000 | USD | 9,329,170 | — | (25,974 | ) | ||||||||||||||
| RBC Capital Markets |
7/5/2023 | EUR | 468,478,700 | USD | 500,415,830 | — | (1,380,080 | ) | ||||||||||||||
| Goldman Sachs & Co. |
7/5/2023 | GBP | 142,232,200 | USD | 176,410,598 | — | (651,950 | ) | ||||||||||||||
| Goldman Sachs & Co. |
7/5/2023 | GBP | 2,534,800 | USD | 3,155,273 | — | (258 | ) | ||||||||||||||
| JP Morgan & Chase Co. |
7/5/2023 | GBP | 143,869,700 | USD | 178,440,870 | — | (660,175 | ) | ||||||||||||||
| RBC Capital Markets |
7/5/2023 | GBP | 198,266,800 | USD | 245,910,312 | — | (908,796 | ) | ||||||||||||||
| Goldman Sachs & Co. |
7/5/2023 | HKD | 239,943,100 | USD | 30,675,612 | 5,771 | — | |||||||||||||||
| Goldman Sachs & Co. |
7/5/2023 | HKD | 4,081,700 | USD | 521,650 | — | (78 | ) | ||||||||||||||
| JP Morgan & Chase Co. |
7/5/2023 | HKD | 242,670,100 | USD | 31,024,246 | 5,837 | — | |||||||||||||||
| RBC Capital Markets |
7/5/2023 | HKD | 323,409,500 | USD | 41,293,611 | — | (45,013 | ) | ||||||||||||||
| Goldman Sachs & Co. |
7/5/2023 | ILS | 19,812,600 | USD | 5,312,615 | — | (5,825 | ) | ||||||||||||||
| JP Morgan & Chase Co. |
7/5/2023 | ILS | 20,482,700 | USD | 5,492,298 | — | (6,022 | ) | ||||||||||||||
| RBC Capital Markets |
7/5/2023 | ILS | 23,601,600 | USD | 6,328,610 | — | (6,939 | ) | ||||||||||||||
| Goldman Sachs & Co. |
7/5/2023 | JPY | 34,527,966,000 | USD | 248,402,633 | — | (801,788 | ) | ||||||||||||||
| Goldman Sachs & Co. |
7/5/2023 | JPY | 667,651,400 | USD | 4,816,432 | — | (2,319 | ) | ||||||||||||||
| JP Morgan & Chase Co. |
7/5/2023 | JPY | 32,564,793,600 | USD | 234,279,091 | — | (756,200 | ) | ||||||||||||||
| JP Morgan & Chase Co. |
7/5/2023 | JPY | 11,013,229,000 | USD | 79,230,666 | — | (256,940 | ) | ||||||||||||||
| See Notes to Financial Statements. | 18 |
DBX ETF Trust
Schedule of Investments
Xtrackers MSCI EAFE Hedged Equity ETF (Continued)
May 31, 2023
| Counterparty |
Settlement Date |
Currency To Deliver |
Currency To Receive |
Unrealized Appreciation |
Unrealized Depreciation |
|||||||||||||||||
| RBC Capital Markets |
7/5/2023 | JPY | 48,302,673,200 | USD | 347,499,996 | $ | — | $ | (1,122,906 | ) | ||||||||||||
| JP Morgan & Chase Co. |
7/5/2023 | NOK | 1,414,500 | USD | 127,629 | — | (22 | ) | ||||||||||||||
| RBC Capital Markets |
7/5/2023 | NOK | 74,833,200 | USD | 6,726,640 | — | (26,649 | ) | ||||||||||||||
| RBC Capital Markets |
7/5/2023 | NOK | 77,011,200 | USD | 6,922,417 | — | (27,425 | ) | ||||||||||||||
| RBC Capital Markets |
7/5/2023 | NOK | 115,968,400 | USD | 10,424,220 | — | (41,298 | ) | ||||||||||||||
| Goldman Sachs & Co. |
7/5/2023 | NZD | 3,786,300 | USD | 2,268,978 | — | (11,128 | ) | ||||||||||||||
| Goldman Sachs & Co. |
7/5/2023 | NZD | 6,422,400 | USD | 3,848,687 | — | (18,875 | ) | ||||||||||||||
| Goldman Sachs & Co. |
7/5/2023 | NZD | 3,932,300 | USD | 2,356,470 | — | (11,557 | ) | ||||||||||||||
| Goldman Sachs & Co. |
7/5/2023 | SEK | 468,574,900 | USD | 43,131,156 | — | (133,025 | ) | ||||||||||||||
| JP Morgan & Chase Co. |
7/5/2023 | SEK | 14,795,000 | USD | 1,361,811 | — | (4,233 | ) | ||||||||||||||
| JP Morgan & Chase Co. |
7/5/2023 | SEK | 7,505,500 | USD | 692,868 | — | (126 | ) | ||||||||||||||
| JP Morgan & Chase Co. |
7/5/2023 | SEK | 387,733,300 | USD | 35,689,888 | — | (110,075 | ) | ||||||||||||||
| RBC Capital Markets |
7/5/2023 | SEK | 549,940,700 | USD | 50,620,676 | — | (156,124 | ) | ||||||||||||||
| Goldman Sachs & Co. |
7/5/2023 | SGD | 355,000 | USD | 262,762 | — | (84 | ) | ||||||||||||||
| Goldman Sachs & Co. |
7/5/2023 | SGD | 21,718,400 | USD | 16,046,458 | — | (34,097 | ) | ||||||||||||||
| JP Morgan & Chase Co. |
7/5/2023 | SGD | 22,513,300 | USD | 16,634,095 | — | (35,013 | ) | ||||||||||||||
| RBC Capital Markets |
7/5/2023 | SGD | 22,973,800 | USD | 16,974,339 | — | (35,729 | ) | ||||||||||||||
| RBC Capital Markets |
7/5/2023 | USD | 5,510,808 | GBP | 4,443,000 | 20,210 | — | |||||||||||||||
| RBC Capital Markets |
7/5/2023 | USD | 4,247,311 | HKD | 33,219,000 | — | (1,215 | ) | ||||||||||||||
| RBC Capital Markets |
7/5/2023 | USD | 1,184,825 | ILS | 4,418,000 | 1,131 | — | |||||||||||||||
| Goldman Sachs & Co. |
7/5/2023 | USD | 136,022 | NZD | 227,000 | 677 | — | |||||||||||||||
|
|
|
|
|
|||||||||||||||||||
| Total unrealized appreciation (depreciation) |
$ | 117,189,731 | $ | (13,317,641 | ) | |||||||||||||||||
|
|
|
|
|
|||||||||||||||||||
For information on the Fund’s policy and additional disclosures regarding futures contracts and forward foreign currency contracts, please refer to the Derivatives section of Note 2 in the accompanying Notes to Financial Statements.
Currency Abbreviations
| AUD | Australian Dollar |
| CHF | Swiss Franc |
| DKK | Danish Krone |
| EUR | Euro |
| GBP | Pound Sterling |
| HKD | Hong Kong Dollar |
| ILS | Israeli Shekel |
| JPY | Japanese Yen |
| NOK | Norwegian Krone |
| NZD | New Zealand Dollar |
| SEK | Swedish Krona |
| SGD | Singapore Dollar |
| USD | U.S. Dollar |
| See Notes to Financial Statements. | 19 |
DBX ETF Trust
Schedule of Investments
Xtrackers MSCI EAFE Hedged Equity ETF (Continued)
May 31, 2023
Fair Value Measurements
Various inputs are used in determining the value of the Fund’s investments. These inputs are summarized in three broad levels. Level 1 includes quoted prices in active markets for identical securities. Level 2 includes other significant observable inputs (including quoted prices for similar securities, interest rates, prepayment speeds and credit risk). Level 3 includes significant unobservable inputs (including the Fund’s own assumptions in determining the fair value of investments). The level assigned to the securities valuations may not be an indication of the risk or liquidity associated with investing in those securities.
The following is a summary of the inputs used as of May 31, 2023 in valuing the Fund’s investments. For information on the Fund’s policy regarding the valuation of investments, please refer to the Security Valuation section of Note 2 in the accompanying Notes to Financial Statements.
| Assets |
Level 1 | Level 2 | Level 3 | Total | ||||||||||||
| Common Stocks (a) |
$ | 3,927,314,765 | $ | — | $ | — | $ | 3,927,314,765 | ||||||||
| Preferred Stocks |
20,270,683 | — | — | 20,270,683 | ||||||||||||
| Warrants |
316,020 | — | — | 316,020 | ||||||||||||
| Short-Term Investments (a) |
126,125,169 | — | — | 126,125,169 | ||||||||||||
| Derivatives (b) |
||||||||||||||||
| Forward Foreign Currency Contracts |
— | 117,189,731 | — | 117,189,731 | ||||||||||||
| Futures Contracts |
1,233,192 | — | — | 1,233,192 | ||||||||||||
|
|
|
|
|
|
|
|
|
|||||||||
| TOTAL |
$ | 4,075,259,829 | $ | 117,189,731 | $ | — | $ | 4,192,449,560 | ||||||||
|
|
|
|
|
|
|
|
|
|||||||||
| Liabilities |
Level 1 | Level 2 | Level 3 | Total | ||||||||||||
| Derivatives (b) |
||||||||||||||||
| Forward Foreign Currency Contracts |
$ | — | $ | (13,317,641 | ) | $ | — | $ | (13,317,641 | ) | ||||||
| Futures Contracts |
(1,122,393 | ) | — | — | (1,122,393 | ) | ||||||||||
|
|
|
|
|
|
|
|
|
|||||||||
| TOTAL |
$ | (1,122,393 | ) | $ | (13,317,641 | ) | $ | — | $ | (14,440,034 | ) | |||||
|
|
|
|
|
|
|
|
|
|||||||||
| (a) | See Schedule of Investments for additional detailed categorizations. |
| (b) | Derivatives include unrealized appreciation (depreciation) on open futures contracts and forward foreign currency contracts. |
| See Notes to Financial Statements. | 20 |
This Page is Intentionally Left Blank
DBX ETF Trust
May 31, 2023
| Xtrackers MSCI EAFE Hedged Equity ETF |
||||
| Assets |
||||
| Investment in non-affiliated securities at value |
$ | 3,942,696,660 | ||
| Investment in affiliated securities at value |
5,204,808 | |||
| Investment in DWS ESG Liquidity Fund |
11,805,537 | |||
| Investment in DWS Government Money Market Series |
42,151,828 | |||
| Investment in DWS Government & Agency Securities Portfolio* |
72,167,804 | |||
| Cash |
3,217 | |||
| Foreign currency at value |
24,223,346 | |||
| Unrealized appreciation on forward foreign currency contracts |
117,189,731 | |||
| Deposit with broker for futures contracts |
6,690,701 | |||
| Receivables: | ||||
| Investment securities sold |
16,284,322 | |||
| Capital shares |
21,283,395 | |||
| Dividends |
16,387,875 | |||
| Interest |
180,356 | |||
| Securities lending income |
258,010 | |||
| Foreign tax reclaim |
9,331,005 | |||
|
|
|
|||
| Total assets |
$ | 4,285,858,595 | ||
|
|
|
|||
| Liabilities |
||||
| Payable upon return of securities loaned |
$ | 72,167,804 | ||
| Unrealized depreciation on forward foreign currency contracts |
13,317,641 | |||
| Payables: | ||||
| Investment securities purchased |
148,184,287 | |||
| Investment advisory fees |
1,201,816 | |||
| Variation margin on futures contracts |
1,801,390 | |||
|
|
|
|||
| Total liabilities |
236,672,938 | |||
|
|
|
|||
| Net Assets, at value |
$ | 4,049,185,657 | ||
|
|
|
|||
| Net Assets Consist of |
||||
| Paid-in capital |
$ | 4,098,720,652 | ||
| Distributable earnings (loss) |
(49,534,995 | ) | ||
|
|
|
|||
| Net Assets, at value |
$ | 4,049,185,657 | ||
|
|
|
|||
| Number of Common Shares outstanding |
114,150,001 | |||
|
|
|
|||
| Net Asset Value |
$ | 35.47 | ||
|
|
|
|||
| Investment in non-affiliated securities at cost |
$ | 3,531,364,423 | ||
|
|
|
|||
| Investment in affiliated securities at cost |
$ | 11,943,057 | ||
|
|
|
|||
| Value of securities loaned |
$ | 114,405,535 | ||
|
|
|
|||
| Investment in DWS ESG Liquidity Fund at cost |
$ | 11,809,080 | ||
|
|
|
|||
| Investment in DWS Government Money Market Series at cost |
$ | 42,151,828 | ||
|
|
|
|||
| Investment in DWS Government & Agency Securities Portfolio at cost* |
$ | 72,167,804 | ||
|
|
|
|||
| Non-cash collateral for securities on loan |
$ | 63,336,398 | ||
|
|
|
|||
| Foreign currency at cost |
$ | 24,613,125 | ||
|
|
|
|||
| * | Represents collateral on securities loaned. |
| See Notes to Financial Statements. | 22 |
DBX ETF Trust
For the Year Ended May 31, 2023
| Xtrackers MSCI EAFE Hedged Equity ETF |
||||
| Investment Income |
||||
| Unaffiliated dividend income* |
$ | 129,768,477 | ||
| Affiliated dividend income |
170,231 | |||
| Income distributions from affiliated funds |
2,379,886 | |||
| Affiliated securities lending income |
906,067 | |||
| Other income |
740,942 | |||
|
|
|
|||
| Total investment income** |
133,965,603 | |||
|
|
|
|||
| Expenses |
||||
| Investment advisory fees |
13,981,604 | |||
| Interest expense (see note 2): |
496,763 | |||
| Other expenses |
63,612 | |||
|
|
|
|||
| Total expenses |
14,541,979 | |||
|
|
|
|||
| Less fees waived (see note 3): |
||||
| Waiver |
(39,289 | ) | ||
|
|
|
|||
| Net expenses |
14,502,690 | |||
|
|
|
|||
| Net investment income (loss) |
119,462,913 | |||
|
|
|
|||
| Realized and Unrealized Gain (Loss) |
||||
| Net realized gain (loss) from: |
||||
| Investments |
(279,118,796 | ) | ||
| Investments in affiliates |
(3,655,078 | ) | ||
| In-kind redemptions |
40,378,643 | |||
| In-kind redemptions in affiliates |
50,121 | |||
| Futures contracts |
5,423,047 | |||
| Foreign currency transactions |
(1,792,314 | ) | ||
| Forward foreign currency contracts |
58,546,963 | |||
| Payments by Affiliates (see note 6) |
3,701 | |||
|
|
|
|||
| Net realized gain (loss) |
(180,163,713 | ) | ||
|
|
|
|||
| Net change in unrealized appreciation (depreciation) on: |
||||
| Investments |
275,577,982 | |||
| Investments in affiliates |
3,177,530 | |||
| Futures contracts |
(536,363 | ) | ||
| Foreign currency translations |
(368,860 | ) | ||
| Forward foreign currency contracts |
144,184,679 | |||
|
|
|
|||
| Net change in unrealized appreciation (depreciation) |
422,034,968 | |||
|
|
|
|||
| Net realized and unrealized gain (loss) on investments, futures and foreign currency transactions |
241,871,255 | |||
|
|
|
|||
| Net Increase (Decrease) in Net Assets Resulting from Operations |
$ | 361,334,168 | ||
|
|
|
|||
| * Unaffiliated foreign tax withheld |
$ | 11,851,552 | ||
| ** | Total investment income includes $4,879,474 of non-recurring foreign dividend reclaims and $740,942 of non-recurring related interest which are included in Unaffiliated dividend income and Other income, respectively. |
| See Notes to Financial Statements. | 23 |
DBX ETF Trust
| Xtrackers MSCI EAFE Hedged Equity ETF |
||||||||
| Year Ended May 31, 2023 |
Year Ended May 31, 2022 |
|||||||
| Increase (Decrease) in Net Assets from Operations |
||||||||
| Net investment income (loss) |
$ | 119,462,913 | $ | 123,933,141 | ||||
| Net realized gain (loss) |
(180,163,713 | ) | 495,536,392 | |||||
| Net change in net unrealized appreciation (depreciation) |
422,034,968 | (546,081,819 | ) | |||||
|
|
|
|
|
|||||
| Net increase (decrease) in net assets resulting from operations |
361,334,168 | 73,387,714 | ||||||
|
|
|
|
|
|||||
| Distributions to Shareholders |
(581,458,458 | ) | (95,706,043 | ) | ||||
|
|
|
|
|
|||||
| Fund Shares Transactions |
||||||||
| Proceeds from shares sold |
182,710,242 | 369,115,706 | ||||||
| Value of shares redeemed |
(154,044,627 | ) | (61,152,615 | ) | ||||
|
|
|
|
|
|||||
| Net increase (decrease) in net assets resulting from fund share transactions |
28,665,615 | 307,963,091 | ||||||
|
|
|
|
|
|||||
| Total net increase (decrease) in Net Assets |
(191,458,675 | ) | 285,644,762 | |||||
| Net Assets |
||||||||
| Beginning of year |
$ | 4,240,644,332 | $ | 3,954,999,570 | ||||
|
|
|
|
|
|||||
| End of year |
$ | 4,049,185,657 | $ | 4,240,644,332 | ||||
|
|
|
|
|
|||||
| Changes in Shares Outstanding |
||||||||
| Shares outstanding, beginning of year |
113,350,800 | 105,350,800 | ||||||
| Shares sold |
5,200,000 | 9,600,000 | ||||||
| Shares redeemed |
(4,400,799 | ) | (1,600,000 | ) | ||||
|
|
|
|
|
|||||
| Shares outstanding, end of year |
114,150,001 | 113,350,800 | ||||||
|
|
|
|
|
|||||
| See Notes to Financial Statements. | 24 |
DBX ETF Trust
| Xtrackers MSCI EAFE Hedged Equity ETF Selected Per Share Data |
Years Ended May 31, | |||||||||||||||||||
| 2023 | 2022 | 2021 | 2020 | 2019 | ||||||||||||||||
| Net Asset Value, beginning of year |
$ | 37.41 | $ | 37.54 | $ | 29.75 | $ | 30.87 | $ | 31.86 | ||||||||||
|
|
|
|
|
|
|
|
|
|
|
|||||||||||
| Income (loss) from investment operations: | ||||||||||||||||||||
| Net investment income (loss)(a) |
1.05 | (b) | 1.13 | 0.78 | 0.66 | 0.91 | ||||||||||||||
| Net realized and unrealized gain (loss) |
2.12 | (0.37 | ) | 7.82 | (0.76 | ) | (1.00 | ) | ||||||||||||
|
|
|
|
|
|
|
|
|
|
|
|||||||||||
| Total from investment operations |
3.17 | 0.76 | 8.60 | (0.10 | ) | (0.09 | ) | |||||||||||||
|
|
|
|
|
|
|
|
|
|
|
|||||||||||
| Less distributions from: |
| |||||||||||||||||||
| Net investment income |
(0.64 | ) | (0.89 | ) | (0.81 | ) | (1.02 | ) | (0.90 | ) | ||||||||||
| Net realized gains |
(4.47 | ) | — | — | — | — | ||||||||||||||
|
|
|
|
|
|
|
|
|
|
|
|||||||||||
| Total distributions |
(5.11 | ) | (0.89 | ) | (0.81 | ) | (1.02 | ) | (0.90 | ) | ||||||||||
|
|
|
|
|
|
|
|
|
|
|
|||||||||||
| Net Asset Value, end of year |
$ | 35.47 | $ | 37.41 | $ | 37.54 | $ | 29.75 | $ | 30.87 | ||||||||||
|
|
|
|
|
|
|
|
|
|
|
|||||||||||
| Total Return (%)(c) |
9.62 | 2.01 | 29.41 | (0.56 | ) | (0.14 | ) | |||||||||||||
| Ratios to Average Net Assets and Supplemental Data |
||||||||||||||||||||
| Net Assets, end of year ($ millions) |
4,049 | 4,241 | 3,955 | 3,831 | 4,715 | |||||||||||||||
| Ratio of expenses before fee waiver (%) |
0.36 | 0.35 | 0.35 | 0.36 | 0.36 | |||||||||||||||
| Ratio of expenses after fee waiver (%) |
0.36 | 0.35 | 0.35 | 0.36 | 0.36 | |||||||||||||||
| Ratio of net investment income (loss) (%) |
2.99 | (b) | 2.97 | 2.35 | 2.10 | 2.93 | ||||||||||||||
| Portfolio turnover rate (%)(d) |
19 | 4 | 8 | 9 | 5 | |||||||||||||||
| (a) | Based on average shares outstanding during the period. |
| (b) | Net investment income per share and the ratio of net investment income include non-recurring foreign dividend reclaims and related interest amounting to $0.05 per share. Excluding these non-recurring amounts which are included in Unaffiliated dividend income and Other income, respectively in the Statement of Operations, the net investment income ratio would have been 2.85%. |
| (c) | Total Return would have been lower if certain expenses had not been reimbursed by the Advisor. |
| (d) | Portfolio turnover rate does not include securities received or delivered from processing creations or redemptions. |
| See Notes to Financial Statements. | 25 |
DBX ETF Trust
1. Organization
DBX ETF Trust (the “Trust”) is registered under the Investment Company Act of 1940, as amended (the “1940 Act”), as an open-end registered management investment company organized as a Delaware statutory trust.
As of May 31, 2023, the Trust consists of thirty-nine investment series of exchange-traded funds (“ETFs”) in operation and trading. These financial statements report on Xtrackers MSCI EAFE Hedged Equity ETF (the “Fund”), a diversified series of the Trust. The Fund may change its diversification status over time and then change it back again, without shareholder approval, solely as a result of a change in relative market capitalization or index weighting of one or more constituents of the index each Fund tracks.
DBX Advisors LLC (“DBX” or the “Advisor”), an indirect, wholly-owned subsidiary of DWS Group GmbH & Co. KGaA (“DWS Group”), serves as investment advisor to the Fund and has overall responsibility for the general management and administration of the Fund, subject to the supervision of the Fund’s Board of Trustees (“Board”).
The Fund offers shares that are listed and traded on the NYSE Arca, Inc. (“NYSE Arca”). Unlike conventional mutual funds, the Fund issues and redeems shares on a continuous basis, at net asset value (“NAV”), only in large specified lots consisting of 200,000 shares, each called a “Creation Unit”, to authorized participants who have entered into agreements with the Fund’s distributor. Shares are not individually redeemable securities of the Fund, and owners of shares may acquire those shares from the Fund or tender such shares for redemption to the Fund, in Creation Units only.
The investment objective of the Fund is to seek investment results that correspond generally to the performance, before fees and expenses, of the MSCI EAFE US Dollar Hedged Index (the “Underlying Index”).
MSCI is the creator of the MSCI EAFE US Dollar Hedged Index. The MSCI EAFE US Dollar Hedged Index is designed to track developed market performance while mitigating exposure to fluctuations between the value of the U.S. dollar and the currencies of the countries included in the Underlying Index.
The Underlying Index is rebalanced monthly on the last trading day of the month, when the index will take into account the effect of rolling into new 1-month forward contracts based on the newly determined weights of currency to be sold for the next month’s index calculation. The currency weights are determined as of the close of two business days before the first calendar day of following month and remain constant intra month. This means that no changes in the weights are made during the month to account for changes in the indexes due to price movement of securities, corporate events, additions, deletions or any other changes. The daily calculation of the Underlying Index marks to market the one-month forward contracts on a daily basis by using an equal and offsetting forward position.
The Fund is entitled to use its Underlying Index pursuant to a licensing agreement between the Index Provider and DBX. There is no charge to the Fund in connection with the licensing agreement.
Pursuant to the Trust’s organizational documents, the Trust’s officers and trustees are indemnified against certain liabilities that may arise out of the performance of their duties to the Fund. Additionally, in the normal course of business the Trust enters into contracts that contain a variety of representations that provide indemnification for certain liabilities. The Trust’s maximum exposure under these arrangements is unknown, as this would involve future claims that may be made against the Fund that have not yet occurred. However, the Trust expects the risk of loss to be remote.
2. Significant Accounting Policies
The financial statements have been prepared in conformity with U.S. generally accepted accounting principles (“U.S. GAAP”), which require management to make certain estimates and assumptions that affect the reported amounts and disclosures in the financial statements. Actual results could differ from those estimates. The Fund qualifies as an investment company under Topic 946 of the Accounting Standards Codification of U.S. GAAP. The following is a summary of significant accounting policies followed by the Fund.
Security Valuation The NAV of the Fund’s shares is calculated each business day as of the close of regular trading on the New York Stock Exchange, generally 4:00 p.m. Eastern Time. NAV per share is calculated by dividing a Fund’s net assets by the number of Fund shares outstanding.
26
DBX ETF Trust
Notes to Financial Statements (Continued)
The Fund’s Board has designated the Advisor as the valuation designee for the Fund pursuant to Rule 2a-5 under the 1940 Act. The Advisor’s Pricing Committee (the “Pricing Committee”) typically values securities using readily available market quotations or prices supplied by independent pricing services (which are considered fair values under Rule 2a-5). The Advisor has adopted fair valuation procedures that provide methodologies for fair valuing securities.
Various inputs are used in determining the value of the Fund’s investments. These inputs are summarized in three broad levels. Level 1 includes quoted prices in active markets for identical securities. Level 2 includes other significant observable inputs (including quoted prices for similar securities, interest rates, prepayment speeds, and credit risk). Level 3 includes significant unobservable inputs (including the Fund’s own assumptions in determining the fair value of investments). The level assigned to the securities valuations may not be an indication of the risk or liquidity associated with investing in those securities.
Equity securities are valued at the most recent sale price or official closing price reported on the exchange (U.S. or foreign) or over-the-counter market on which they trade. Securities for which no sales are reported are valued at the calculated mean between the most recent bid and asked quotations on the relevant market or, if a mean cannot be determined, at the most recent bid quotation. Equity securities are generally categorized as Level 1.
Investments in open-ended investment companies are valued at their NAV each business day and are categorized as Level 1.
Futures contracts are generally valued at the settlement prices established each day on the exchange on which they are traded and are categorized as Level 1.
Forward currency contracts are valued at the prevailing forward exchange rate of the underlying currencies and are categorized as Level 2.
Securities and other assets for which market quotations are not readily available or for which the above valuation procedures are deemed not to reflect fair value are valued in a manner that is intended to reflect their fair value as determined in accordance with procedures approved by the Pricing Committee and are generally categorized as Level 3. In accordance with the Fund’s valuation procedures, factors considered in determining value may include, but are not limited to, the type of the security; the size of the holding; the initial cost of the security; the existence of any contractual restrictions on the security’s disposition; the price and extent of public trading in similar securities of the issuer or of comparable companies; quotations or evaluated prices from broker-dealers and/or pricing services; information obtained from the issuer, analysts, and/or the appropriate stock exchange (for exchange traded securities); an analysis of the company’s or issuer’s financial statements; an evaluation of the forces that influence the issuer and the market(s) in which the security is purchased and sold; and with respect to debt securities, the maturity, coupon, creditworthiness, currency denomination and the movement of the market in which the security is normally traded. The value determined under these procedures may differ from published values for the same securities.
Fair value pricing could result in a difference between the prices used to calculate the Fund’s NAV and the prices used by the Fund’s Underlying Index, which in turn could result in a difference between the Fund’s performance and the performance of the Fund’s Underlying Index.
Disclosure about the classification of the fair value measurements is included in a table following the Fund’s Schedule of Investments.
Cash Cash consists of cash held at banks and is on deposit with major financial institutions.
Investment Transactions and Investment Income Investment transactions are recorded as of the date that the securities are purchased or sold (trade date). Realized gains and losses from the sale or disposition of securities are calculated on the identified cost-method. Dividend income is net of any foreign taxes withheld at source. Certain dividends from foreign securities may be recorded subsequent to the ex-dividend date as soon as the fund is informed of such dividends. Interest income is recorded on the accrual basis.
Tax Information and Dividends and Distributions to Shareholders It is the Fund’s policy to comply with all requirements of the Internal Revenue Code of 1986, as amended (“the Code”). The Fund intends to qualify for and to elect treatment as a separate Regulated Investment Company (“RIC”) under Subchapter M of the Code. It is the
27
DBX ETF Trust
Notes to Financial Statements (Continued)
policy of the Fund to pay out dividends from its net investment income, if any, to investors semi-annually. Taxable net realized gains from investment transactions, reduced by capital loss carryforwards, if any, are declared and distributed to shareholders at least annually. The capital loss carryforward amount, if any, is available to offset future net capital gains. The Fund may occasionally be required to make supplemental distributions at some other time during the year. The Fund reserves the right to declare special distributions if, in their reasonable discretion, such action is necessary or advisable to preserve the status of the Fund as a RIC or to avoid imposition of income or excise taxes on undistributed income. Dividends and distributions to shareholders, if any, are recorded on the ex-dividend date. The amount of dividends and distributions from net investment income and net realized capital gains are determined in accordance with Federal income tax regulations which may differ from U.S. GAAP. These “book/tax” differences are either considered temporary or permanent in nature. To the extent these differences are permanent in nature, such amounts are reclassified at the end of the year within the components of net assets based on their federal tax treatment; temporary differences do not require reclassification. Dividends and distributions, which exceed earnings and profits for the full year for tax purposes, are reported as a tax return of capital.
In accordance with U.S. GAAP requirements regarding accounting for uncertainties in income taxes, management has analyzed the Fund’s tax positions taken or expected to be taken on foreign, federal and state income tax returns for all open tax years and has concluded that no provision for income tax is required in the Fund’s financial statements.
The Fund recognizes interest and penalties, if any, related to uncertain tax positions as income tax expense on the Statement of Operations. For the year ended May 31, 2023, the Fund did not incur any interest or penalties.
As of May 31, 2023, the components of accumulated earnings (losses) on a tax basis were as follows:
| Undistributed Ordinary Income* |
Capital and Other Gains (Losses) |
Unrealized Appreciation (Depreciation) |
Total Accumulated Earnings (Losses) |
|||||||||||||
| $ | 190,207,244 | $ | (579,679,232 | ) | $ | 339,936,993 | $ | (49,534,995 | ) | |||||||
The tax character of dividends and distributions declared for the years ended May 31, 2023 and May 31, 2022 were as follows:
| Ordinary Income* | Long-Term Capital Gains |
|||||||
| 2023 |
$ | 332,800,883 | $ | 248,657,575 | ||||
| 2022 |
95,706,043 | — | ||||||
| * | for tax purposes short-term capital gain distributions are considered ordinary income distributions |
Capital losses incurred after October 31 (“post-October capital losses”) and late year ordinary losses incurred after December 31 within the taxable year are deemed to arise on the first business day of the Fund’s next taxable year. During the fiscal year ended May 31, 2023, the Fund incurred and will elect to defer post-October capital losses and late year ordinary losses as follows:
| Post-October Losses on Capital |
||||
| $ | 579,679,232 | |||
For the fiscal year ended May 31, 2023, the effect of permanent “book/tax” reclassifications to the components of net assets are included below. These differences are primarily due to redemptions-in-kind and equalization.
| Distributable earnings (loss) |
Paid-In Capital |
|||||||
| $ | (39,558,327 | ) | $ | 39,558,327 | ||||
28
DBX ETF Trust
Notes to Financial Statements (Continued)
As of May 31, 2023, the aggregate cost of investments for federal income tax purposes, the net unrealized appreciation or depreciation and the aggregated gross unrealized appreciation (depreciation) on investments were as follows:
| Aggregate Tax Cost |
Net Unrealized Appreciation (Depreciation) |
Aggregate Gross Unrealized Appreciation |
Aggregate Gross Unrealized (Depreciation) |
|||||||||||||
| $ | 3,745,892,398 | $ | 340,686,030 | $ | 782,998,791 | $ | (442,312,761 | ) | ||||||||
Foreign Taxes The Fund may be subject to foreign taxes (a portion of which may be reclaimable) on income, capital gains on investments, certain foreign currency transactions or other corporate events. All foreign taxes are recorded in accordance with the applicable foreign tax regulations and rates that exist in the foreign jurisdictions in which the Fund invests. These foreign taxes, if any, are paid by the Fund and are reflected in their Statement of Operations as follows: foreign taxes withheld at source are presented as a reduction of income, foreign taxes on capital gains from sales of investments and foreign currency transactions are included in their respective net realized gain (loss) categories. Receivables and payables related to foreign taxes as of May 31, 2023, if any, are disclosed in the Fund’s Statement of Assets and Liabilities.
In consideration of recent decisions rendered by European courts, the Fund has filed for additional reclaims (“EU reclaims”) related to prior years. A corresponding receivable is established when both the amount is known and significant contingencies or uncertainties regarding collectability are removed. These amounts, if any, are reported in dividends and interest receivable in the Statement of Assets and Liabilities. For the year ended May 31, 2023, the Fund received reclaims and interest related to EU reclaims, which is reported in unaffiliated dividend income and other income in the Statement of Operations. Expenses incurred related to filing EU reclaims are recorded in other expenses in the Statement of Operations. For U.S. income tax purposes, EU reclaims received by the Fund, if any, reduce the amount of foreign taxes Fund shareholders can use as tax credits in their individual income tax returns. In the event that EU reclaims received by a fund during the fiscal year exceed foreign withholding taxes paid, and a fund previously passed foreign tax credits on to its shareholders, a fund must either amend historic tax reporting to shareholders or enter into a closing agreement with the Internal Revenue Service in order to pay the associated tax liability on behalf of the fund’s shareholders. For the year ended May 31, 2023, the EU reclaims received by the Fund did not exceed the foreign withholding taxes of the Fund.
Foreign Currency Translations The books and records of the Fund is maintained in U.S. dollars. Investment securities and other assets and liabilities denominated in a foreign currency are translated into U.S. dollars at the prevailing exchange rates at period end. Purchases and sales of investment securities, income and expenses are translated into U.S. dollars at the prevailing exchange rates on the respective dates of the transactions.
Net realized and unrealized gains and losses on foreign currency transactions represent net gains and losses between trade and settlement dates on securities transactions, the acquisition and disposition of foreign currencies, and the difference between the amount of net investment income accrued and the U.S. dollar amount actually received. The portion of both realized and unrealized gains and losses on investments that results from fluctuations in foreign currency exchange rates is not separately disclosed, but is included with net realized and unrealized gain/appreciation and loss/depreciation on investments.
Securities Lending The Fund may lend securities to certain financial institutions under the terms of its securities lending agreement. During the term of the loans, the Fund continues to receive interest and dividends generated by the securities and to participate in any changes in their market value. The Fund requires the borrowers of the securities to maintain collateral with the Fund consisting of cash and/or securities issued or guaranteed by the U.S. Government, its agencies or instrumentalities having a value at least equal to the value of the securities loaned. When the collateral falls below specified amounts, the lending agent will use its best effort to obtain additional collateral on the next business day to meet required amounts under the securities lending agreement. During the year ended May 31, 2023, the Fund invested the cash collateral into a joint trading account in DWS Government & Agency Securities Portfolio, an affiliated money market fund managed by DWS Investment Management Americas, Inc. DWS Investment Management Americas, Inc. receives a management/administration fee (0.08% annualized effective rate as of May 31, 2023) on the cash collateral invested in DWS Government & Agency Securities Portfolio. The Fund receives compensation for lending its securities either in the form of fees or
29
DBX ETF Trust
Notes to Financial Statements (Continued)
by earning interest on invested cash collateral, net of borrower rebates and fees paid to a lending agent. Either the Fund or the borrower may terminate the loan at any time and the borrower, after notice, is required to return borrowed securities within a standard time period. There may be risks of delay and costs in recovery of securities or even loss of rights in the collateral should the borrower of the securities fail financially. If the Fund is not able to recover securities lent, the Fund may sell the collateral and purchase a replacement investment in the market, incurring the risk that the value of the replacement security is greater than the value of the collateral. The Fund is also subject to all investment risks associated with the reinvestment of any cash collateral received, including, but not limited to, interest rate, credit and liquidity risk associated with such investments.
As of May 31, 2023, the Fund had securities on loan. The value of the related collateral exceeded the value of the securities loaned at period end.
| Remaining Contractual Maturity of the Agreements, as of May 31, 2023 |
||||||||||||||||||||
| Securities Lending Transactions | Overnight and Continuous |
<30 Days | Between 30 & 90 days |
>90 days | Total | |||||||||||||||
| Common Stocks |
$ | 70,741,282 | $ | — | $ | 100,134 | $ | 63,236,264 | $ | 134,077,680 | ||||||||||
| Preferred Stocks |
1,426,522 | — | — | — | 1,426,522 | |||||||||||||||
|
|
|
|
|
|
|
|
|
|
|
|||||||||||
| Total Borrowings |
$ | 72,167,804 | $ | — | $ | 100,134 | $ | 63,236,264 | $ | 135,504,202 | ||||||||||
|
|
|
|
|
|
|
|
|
|
|
|||||||||||
| Gross amount of recognized liabilities and non-cash collateral for securities lending transactions |
|
$ | 135,504,202 | |||||||||||||||||
Derivatives
Forward Foreign Currency Contracts The Fund may enter into forward foreign currency contracts (“forward currency contracts”) designed to offset the Fund’s exposure to non-U.S. currencies. In addition, the Fund may enter into forward currency contracts to facilitate local securities settlements or to protect against currency exposure in connection with distributions to shareholders.
A forward currency contract is a commitment to purchase or sell a foreign currency at a future date at a negotiated forward rate. For the year ended May 31, 2023, the Fund invested in forward currency contracts to hedge against changes in the value of the U.S. dollar against specified non-U.S. currencies.
The gain or loss arising from the difference between the original contract and the closing of such contract would be included in net realized gain or loss on forward currency contracts. Risks may arise from the potential inability of a counterparty to meet the terms of a contract and from unanticipated movements in the value of a foreign currency relative to the U.S. dollar. The face or contract amount, in U.S. dollars reflects the total exposure the Fund has in that particular currency contract.
A summary of the open forward currency contracts as of May 31, 2023 is included in a table following the Fund’s Schedule of Investments. The investment in forward currency contracts short vs. U.S. dollars had a contract value generally indicative of a range of the total exposure the Fund had to the value of non U.S currencies during the year ended May 31, 2023.
Futures Contracts The Fund may enter into futures contracts. These futures contracts will be used to simulate investment in the respective Underlying Index, to facilitate trading or to reduce transaction costs. The Fund will enter into futures contracts that are traded on a U.S. or non-U.S. exchange. The Fund will not use futures for speculative purposes. Futures contracts provide for the future sale by one party and purchase by another party of a specified amount of a specific instrument or index at a specified future time and at a specified price. For the year ended May 31, 2023, the Fund utilized futures in order to simulate investment in the Fund’s Underlying Index. To the extent required by law, liquid assets committed to futures contracts will be maintained.
At the time the Fund enters into a futures contract, the Fund deposits and maintains as collateral an initial margin with the broker, as required by the exchange on which the transaction is affected. Pursuant to the contract, the Fund agrees to receive from or pay to the broker an amount of cash equal to the daily fluctuation in the value of the contract. Such receipts or payments are known as variation margin and are recorded by the Fund as unrealized gains or losses. Risks may arise from the potential inability of a counterparty to meet the terms of the contract. The credit/counterparty risk for exchange-traded futures contracts is generally less than privately
30
DBX ETF Trust
Notes to Financial Statements (Continued)
negotiated futures contracts, since the clearinghouse, which is the issuer or counterparty to each exchange-traded future, provides a guarantee of performance. The guarantee is supported by a daily payment system (i.e., margin requirements).
Use of long futures contracts subjects the Fund to risk of loss in excess of the amounts shown on the Statement of Assets and Liabilities, up to the notional value of the futures contracts. Use of short futures contracts subjects the Fund to unlimited risk of loss. Under some circumstances, futures exchanges may establish daily limits on the amount that the price of a futures contract can vary from the previous day’s settlement price, which could effectively prevent liquidation of unfavorable positions.
A summary of the open futures contracts as of May 31, 2023 is included in a table following the Fund’s Schedule of Investments.
The following table summarizes the value of the Fund’s derivative instruments held as of May 31, 2023 and the related location in the accompanying Statement of Assets and Liabilities, presented by primary underlying risk exposure:
| Asset Derivatives |
Liability Derivatives |
|||||||||||||
| Equity contracts | Unrealized appreciation on futures contracts* | $ | 1,233,192 | Unrealized depreciation on futures contracts* | $ | 1,122,393 | ||||||||
| Foreign exchange contracts | Unrealized appreciation on forward foreign currency contracts | 117,189,731 | Unrealized depreciation on forward foreign currency contracts | 13,317,641 | ||||||||||
|
|
|
|
|
|||||||||||
| Total | $ | 118,422,923 | Total | $ | 14,440,034 | |||||||||
|
|
|
|
|
|||||||||||
| * | Includes cumulative appreciation or cumulative depreciation of futures contracts as disclosed in the Schedule of Investments. Unsettled variation margin is disclosed separately within the Statement of Assets and Liabilities. |
Additionally, the amount of realized and unrealized gains and losses on derivative instruments recognized in the Fund’s earnings during the year ended May 31, 2023 and the related location in the accompanying Statement of Operations is summarized in the following table by primary underlying risk exposure:
| Net Realized Gain (Loss) from: |
||||||||||||
| Futures Contracts — Equity Contracts |
Forward Foreign Currency Contracts — Foreign Exchange Contracts |
Total | ||||||||||
| $ | 5,423,047 | $ | 58,546,963 | $ | 63,970,010 | |||||||
| Net Change in Unrealized Appreciation (Depreciation) on: |
||||||||||||
| Futures Contracts — Equity Contracts |
Forward Foreign Currency Contracts — Foreign Exchange Contracts |
Total | ||||||||||
| $ | (536,363 | ) | $ | 144,184,679 | $ | 143,648,316 | ||||||
For the year ended May 31, 2023 the average monthly volume of derivatives was as follows:
| Futures Contracts (Contract Value) |
Forward Foreign Currency Contracts (Contract Value) |
|||||||
| $ | 88,509,089 | $ | (3,947,793,465 | ) | ||||
31
DBX ETF Trust
Notes to Financial Statements (Continued)
As of May 31, 2023, the Fund has transactions subject to enforceable master netting agreements which govern the terms of certain transactions, and reduce the counterparty risk associated with such transactions. Master netting agreements allow a Fund to close out and net total exposure to a counterparty in the event of a deterioration in the credit quality or contractual default with respect to all of the transactions with a counterparty. As defined by the master netting agreement, the Fund may have collateral agreements with certain counterparties to mitigate risk. Interest expense from collateral received, if any, is included in Interest expense on the Statement of Operations. For financial reporting purposes the Statement of Assets and Liabilities generally shows derivatives assets and liabilities on a gross basis, which reflects the full risks and exposures prior to netting. A reconciliation of the gross amounts on the Statement of Assets and Liabilities to the net amounts by counterparty, including any collateral exposure, is included in the following tables:
| Gross Amounts of Assets Presented in the Statement of Assets and Liabilities |
Financial Instruments and Derivatives Available for Offset |
Collateral Received(a) |
Net Amount of Derivatives Assets |
Gross Amounts of Liabilities Presented in the Statement of Assets and Liabilities |
Financial Instruments and Derivatives Available for Offset |
Collateral Pledged(a) |
Net Amount of Derivatives Liabilities |
|||||||||||||||||||||||||
| Goldman Sachs & Co. |
$ | 38,215,161 | $ | (4,127,283 | ) | $ | — | $ | 34,087,878 | $ | 4,127,283 | $ | (4,127,283 | ) | $ | — | $ | — | ||||||||||||||
| JP Morgan & Chase Co. |
33,522,336 | (4,159,907 | ) | — | 29,362,429 | 4,159,907 | (4,159,907 | ) | — | — | ||||||||||||||||||||||
| RBC Capital Markets |
45,452,234 | (5,030,451 | ) | — | 40,421,783 | 5,030,451 | (5,030,451 | ) | — | — | ||||||||||||||||||||||
|
|
|
|
|
|
|
|
|
|
|
|
|
|
|
|
|
|||||||||||||||||
| $ | 117,189,731 | $ | (13,317,641 | ) | $ | — | $ | 103,872,090 | $ | 13,317,641 | $ | (13,317,641 | ) | $ | — | $ | — | |||||||||||||||
|
|
|
|
|
|
|
|
|
|
|
|
|
|
|
|
|
|||||||||||||||||
| (a) | The actual collateral received or pledged may be more than amount shown. |
Affiliated Cash Management Vehicles The Fund may invest uninvested cash balances in DWS Government Money Market Series and DWS ESG Liquidity Fund, affiliated money market funds which are managed by DWS Investment Management Americas, Inc. (“DIMA”), also an indirect, wholly owned subsidiary of DWS Group GmbH & Co. KGaA. Each affiliated money market fund is managed in accordance with Rule 2a-7 under the 1940 Act, which governs the quality, maturity, diversity and liquidity of instruments in which a money market fund may invest. DWS Government Money Market Series seeks to maintain a stable NAV and DWS ESG Liquidity Fund maintains a floating NAV. The Fund indirectly bears its proportionate share of the expenses of each affiliated money market fund in which it invests. The Advisor will waive an amount of the unitary advisory fee payable to the Advisor by the Funds equal to such acquired fund’s fees and expenses on the Funds’ assets invested in the affiliated money market funds.
3. Investment Advisory and Other Agreements
The Advisor has overall responsibility for the general management and administration of the Fund, subject to the supervision of the Fund’s Board of Trustees. Under an investment advisory agreement between the Trust, on behalf of the Fund, and the Advisor (the “Investment Advisory Agreement”), the Advisor is responsible for arranging sub-advisory, transfer agency, custody, fund administration, and all other non-distribution related services for the Fund to operate.
For its investment advisory services to the Fund, the Advisor is entitled to receive a unitary advisory fee from the Fund based on the Fund’s average daily net assets, computed and accrued daily and payable monthly, at an annual rate equal to 0.35%.
The Advisor for the Fund has contractually agreed to waive a portion of its unitary advisory fee in an amount equal to the acquired fund’s fees and expenses attributable to the Fund’s investments in affiliated cash management vehicles. For the period from June 1, 2022 through May 31, 2023, the Advisor waived $39,289 of expenses to the Fund.
Out of the unitary advisory fee, the Advisor pays substantially all expenses of the Fund, including the cost of transfer agency, custody, fund administration, legal, audit and other services, and expenses of the Independent Trustees. The Fund is responsible for the payment of interest expense, acquired fund fees and expenses, taxes, brokerage expenses, distribution fees or expenses, if any, litigation expenses and extraordinary expenses.
32
DBX ETF Trust
Notes to Financial Statements (Continued)
The Bank of New York Mellon, a wholly-owned subsidiary of The Bank of New York Mellon Corporation, serves as Administrator, Custodian, Accounting Agent, Lending Agent and Transfer Agent for the Fund.
ALPS Distributors, Inc. (the “Distributor”) serves as the distributor of Creation Units for the Fund on an agency basis. The Distributor does not maintain a secondary market in shares of the Fund.
The Board of Trustees is currently comprised of three Independent Trustees. The Advisor paid retainer fees and attendance fees to each Independent Trustee; retainer fees to the Chairman of the Board of Trustees and Chairman of the Audit Committee; and attendance fees to each member of the Audit Committee (which is comprised of all of the Fund’s Independent Trustees).
4. Investment Portfolio Transactions
For the year ended May 31, 2023, the cost of investments purchased and proceeds from sale of investments (excluding in-kind transactions and short-term investments) were as follows:
| Purchases | Sales | |||||||
| $ | 740,400,606 | $ | 1,002,235,474 | |||||
For the year ended May 31, 2023, the cost of in-kind purchases and proceeds from in-kind sales were as follows:
| Purchases | Sales | |||||||
| $ | 172,925,512 | $ | 148,666,382 | |||||
5. Fund Share Transactions
As of May 31, 2023, there were unlimited Fund shares, no par value, authorized by the Trust. Fund shares are issued and redeemed by the Fund only in Creation Units or multiples thereof. Except when aggregated in Creation Units, shares of the Fund are not redeemable. Transactions in capital shares for the Fund are disclosed in detail in the Statement of Changes in Net Assets. The consideration for the purchase of Creation Units of a Fund generally consists of the in-kind contribution of a designated portfolio of securities constituting a portfolio sampling representation of the securities included in the Fund’s Underlying Index and an amount of cash, which under certain circumstances may include cash in lieu of portfolio securities. Investors purchasing and redeeming Creation Units pay a purchase transaction fee and a redemption transaction fee to offset transfer and other transaction costs associated with the issuance and redemption of Creation Units.
6. Payments by Affiliates
During the year ended May 31, 2023, the Advisor agreed to reimburse Xtrackers MSCI EAFE Hedged Equity ETF $3,701 for a loss due to a FX trade executed incorrectly. The amount compensated was less than 0.01% of the Fund’s average net assets, thus having no impact on the Fund’s total return.
33
DBX ETF Trust
To the Shareholders and the Board of Trustees of Xtrackers MSCI EAFE Hedged Equity ETF
Opinion on the Financial Statements
We have audited the accompanying statement of assets and liabilities of Xtrackers MSCI EAFE Hedged Equity ETF (the “Fund”), (one of the funds constituting DBX ETF Trust (the “Trust”)), including the schedule of investments, as of May 31, 2023, and the related statement of operations for the year then ended, the statements of changes in net assets for each of the two years in the period then ended, the financial highlights for each of the five years in the period then ended and the related notes (collectively referred to as the “financial statements”). In our opinion, the financial statements present fairly, in all material respects, the financial position of the Fund (one of the funds constituting DBX ETF Trust) at May 31, 2023, the results of its operations for the year then ended, the changes in its net assets for each of the two years in the period then ended and its financial highlights for each of the five years in the period then ended, in conformity with U.S. generally accepted accounting principles.
Basis for Opinion
These financial statements are the responsibility of the Trust’s management. Our responsibility is to express an opinion on the Fund’s financial statements based on our audits. We are a public accounting firm registered with the Public Company Accounting Oversight Board (United States) (“PCAOB”) and are required to be independent with respect to the Trust in accordance with the U.S. federal securities laws and the applicable rules and regulations of the Securities and Exchange Commission and the PCAOB.
We conducted our audits in accordance with the standards of the PCAOB. Those standards require that we plan and perform the audit to obtain reasonable assurance about whether the financial statements are free of material misstatement, whether due to error or fraud. The Trust is not required to have, nor were we engaged to perform, an audit of the Trust’s internal control over financial reporting. As part of our audits we are required to obtain an understanding of the internal control over financial reporting but not for the purpose of expressing an opinion on the effectiveness of the Trust’s internal control over financial reporting. Accordingly, we express no such opinion.
Our audits included performing procedures to assess the risks of material misstatement of the financial statements, whether due to error or fraud, and performing procedures that respond to those risks. Such procedures included examining, on a test basis, evidence regarding the amounts and disclosures in the financial statements. Our procedures included confirmation of securities owned as of May 31, 2023, by correspondence with the custodians, brokers and others; when replies were not received from brokers, we performed other auditing procedures. Our audits also included evaluating the accounting principles used and significant estimates made by management, as well as evaluating the overall presentation of the financial statements. We believe that our audits provide a reasonable basis for our opinion.

We have served as the auditor of one or more investment companies in the DWS family of funds since at least 1979, but we are unable to determine the specific year.
New York, New York
July 25, 2023
34
DBX ETF Trust
Regulatory Update — Tailored Shareholder Report
Effective January 24, 2023, the SEC amended the rules for mutual fund and exchange-traded fund (“ETF”) annual and semi-annual shareholder reports. The amended rules apply to mutual funds and ETFs that are registered on Form N-1A (i.e., open-end funds) and implement a new streamlined disclosure framework requiring “concise and visually engaging” shareholder reports highlighting key information, including a simplified expense presentation, performance information, portfolio holdings and certain fund statistics. The amended rules seek to simplify shareholder reporting by consolidating investor friendly data in one report and moving other data to Form N-CSR, creating a layered disclosure framework. Certain information from the Fund’s current shareholder reports, including the Fund’s investment portfolio, financial statements and financial highlights, will move to Form N-CSR. This information must be available online, delivered free of charge upon request and filed on a semiannual basis on Form N-CSR. Notably, the amended rules will require mutual funds and ETFs to prepare separate individual shareholder reports for each fund share class. The amendments also include a revised definition of “appropriate broad-based securities market index” that will affect performance presentations in the new streamlined reports and mutual fund and ETF prospectuses. The amended rules and related form amendments have a compliance date of July 24, 2024. At this time, management is evaluating the impact of the amended rules and form amendments on the content of the Fund’s current shareholder reports.
35
DBX ETF Trust
In accordance with Rule 22e-4 (the “Liquidity Rule”) under the Investment Company Act of 1940 (the “1940 Act”), the Fund has adopted a liquidity risk management program (the “Program”), and the Board has designated DBX Advisors LLC (the “Advisor”) as Program administrator. The Program is designed to assess and manage your Fund’s liquidity risk (the risk that the Fund would be unable to meet requests to redeem shares of the Fund without significant dilution of remaining investors’ interests in the Fund). The Advisor has designated a committee (the “Committee”) composed of personnel from multiple departments within an affiliate of the Advisor that is responsible for the implementation and ongoing administration of the Program, which includes assessing the Fund’s liquidity risk under both normal and reasonably foreseeable stressed conditions. Under the Program, every investment held by a Fund is classified on a daily basis into one of four liquidity categories based on estimations of the investment’s ability to be sold during designated timeframes in current market conditions without significantly changing the investment’s market value.
In February 2023, as required by the Program and the Liquidity Rule, the Advisor provided the Board with an annual written report (the “Report”) addressing the operation of the Program and assessing the adequacy and effectiveness of its implementation during the period from December 1, 2021 through November 30, 2022 (the “Reporting Period”). During the Reporting Period, your Fund was primarily invested in highly liquid investments (investments that the Fund anticipates can be converted to cash within three business days or less in current market conditions without significantly changing their market value). As a result, the Fund is not required to adopt, and has not adopted, a “Highly Liquid Investment Minimum” as defined in the Liquidity Rule. During the Reporting Period, your Fund did not approach the 15% limit imposed by the Liquidity Rule on holdings in illiquid investments (investments that cannot be sold or disposed of in seven days or less in current market conditions without the sale of the investment significantly changing the market value of the investment). The Fund did not experience any issues meeting investor redemptions at any time during the Reporting Period. In the Report, the Advisor stated that it believes the Program has operated adequately and effectively to manage the Fund’s liquidity risk during the Reporting Period. The Advisor also reported that there were no material changes made to the Program during the Reporting Period.
36
DBX ETF Trust
Xtrackers MSCI EAFE Hedged Equity ETF
Board Approval of Investment Advisory Agreement with DBX Advisors LLC
After discussions at the meeting of the Board of Trustees (“Board” or “Trustees”) held on February 15-16, 2023 (the “Meeting”), the Trustees, all of whom are the Independent Trustees (those not affiliated with DBX ETF Trust (the “Trust”) or its service providers), unanimously approved the continuance of the Investment Advisory Agreement with respect to Xtrackers International Real Estate ETF, (the “Fund”). The Independent Trustees were advised throughout the review and Meeting by K&L Gates LLP (“Independent Trustee Counsel”).
Before reaching their decision to approve the Investment Advisory Agreement for another annual period, the Independent Trustees evaluated the materials furnished to them in advance of the Meeting from DBX Advisors LLC (“DBX” or the “Advisor”) for purposes of reviewing the agreement’s terms, including statistical information prepared by Broadridge Financial Solutions Inc. (“Broadridge”) regarding (a) fee and expense information for the Fund (including the fee and expense components and any amounts waived or reimbursed) as compared to a peer group of other exchange-traded funds (“ETFs”) selected pursuant to Broadridge’s proprietary methodology (each, a “Peer Group”) and (b) the Fund’s tracking error as compared to its underlying index over the previous five years (or since inception, if shorter). The Independent Trustees met with representatives of the Advisor on February 13, 2023 to review financial reports and other information provided by the Advisor and inquire further with regard to the financial information provided, and asked questions of the Advisor during this meeting. The Independent Trustees also took into consideration the discussions they had with management before and during the Meeting and among themselves during their Executive Sessions held on February 15 and February 16, 2023.
The Independent Trustees also noted that they had received and should take into consideration a substantial amount of information furnished throughout the year at regular Board meetings, which information included, among other things, an analysis of the Fund’s investment performance, tracking error and related financial information, presentations given by DBX, as well as its periodic reports on brokerage commissions, portfolio execution and other services provided to the Fund.
In reaching its decision to continue in effect the Investment Advisory Agreement for another annual period, the Board considered all factors it believed relevant, including (1) the nature, extent and quality of the services provided to the Fund and its shareholders; (2) the financial resources of DBX and its resulting ability to perform its obligations under the Investment Advisory Agreement; (3) the competitiveness of the advisory fee; (4) the total cost of the services provided by and the profits realized by the Advisor from its relationship with the Fund; (5) the extent to which economies of scale have been realized, and if the Fund’s shareholders have benefitted from those economies; and (6) fall out benefits, if any, enjoyed by the Advisor.
The Board reached a determination, with the assistance of Independent Trustee Counsel and Vedder Price P.C. (“Trust Counsel”) and through the exercise of its business judgment, that approval of the Investment Advisory Agreement and the compensation to be received thereunder is in the best interests of the Fund and its shareholders as well as consistent with the Board’s duties under state and federal law. The Board reached this conclusion based on multiple factors.
The Board considered the following in determining whether to approve the Investment Advisory Agreement:
Nature, Extent and Quality of Services. The Board reviewed in detail the nature, extent and quality of services provided and the risks incurred by the Advisor under the Investment Advisory Agreement. In doing so, the Board considered the information it had received from and the discussions it had with the Advisor continuously during the prior year, in addition to the information the Advisor had provided in response to the Board’s requests prior to the Meeting. The Board considered that these services include, among other things, furnishing a continuous investment program for the Fund, including arranging for, or implementing, the purchase and sale of portfolio securities, the provision of general corporate services such as portfolio management compliance services and the preparation and filing of certain reports on behalf of the Trust. The Board also considered, among other things, the professional experience, qualifications and performance of the senior management and key professional personnel of the Advisor, including portfolio management.
37
DBX ETF Trust
Board Considerations in Approval of Investment Advisory Contracts (Unaudited) (Continued)
The Board considered that the Advisor provides, at its own expense, office facilities and equipment for use by the Fund and supervisory persons responsible for supervising and monitoring the Trust’s service providers. The Board also considered that the Advisor pays or arranges for the compensation of officers of the Trust who are also officers or employees of the Advisor or one of its DWS Group affiliates, except as may otherwise be determined by the Board. In addition, the Board considered that the Advisor arranges for the provision of transfer agency, custody, fund administration and accounting, and other non-distribution services necessary for the Fund’s operations. The Board also considered that in addition to managing the Fund’s portfolios directly, the Advisor provides oversight of day-to-day operations, including monitoring tracking error, providing services in connection with the creation and redemption of creation units and assistance in meeting legal, compliance and regulatory requirements applicable to the Fund.
The Board considered the information regarding the Fund’s tracking error compared to its underlying index that had been provided by the Advisor and by Broadridge. The Board took note of the detailed information provided by the Advisor throughout the year with respect to the Fund’s tracking error and the sources thereof. The Trustees noted that tracking error for the Fund during the year was in an expected range.
Based on its review, the Board concluded that the nature, extent, and quality of services provided by the Advisor under the Investment Advisory Agreement are reasonable and appropriate in relation to the fees paid to the Advisor, taking special consideration of the fact that the advisory fee is a unitary fee and, as a result, a portion of the unitary advisory fee will be used to compensate the Fund’s service providers. The Board considered the staffing of the Advisor, including the training, qualifications and experience of investment personnel in managing the Fund. The Board also considered the expertise of the Advisor in supervising third party service providers to the Fund, such as the administrator and the custodian, noting the Advisor’s extensive work with these service providers (including onsite due diligence sessions) to conduct such supervision. The Board further considered the compliance program of the Advisor, which supports the Fund’s compliance program.
Advisor’s Financial Resources. In connection with the assessment of the ability of the Advisor to perform its duties under the Investment Advisory Agreement, the Board considered the Advisor’s financial condition and whether it has the resources necessary to carry out its functions. The Board concluded that the Advisor has the financial resources necessary to perform its obligations under the Investment Advisory Agreement.
Reasonableness of Advisory Fee. The Board compared the Fund’s advisory fee and total expenses to those of the other ETFs in its Peer Group. The Board noted that due to the special characteristics of certain Funds, there were limitations faced by Broadridge in providing comparable funds in the Peer Groups and the information in the Broadridge reports accordingly may or may not provide meaningful direct comparisons to the Fund. The Board noted that the Peer Groups for currency-hedged Funds included ETFs that were not currency hedged. The Board also noted that the advisory fees and total expenses (after waivers/reimbursements) for the Fund were below or equal to the average and/or median of the ETFs in the Fund’s Peer Group compiled by Broadridge.
The Board accordingly noted that the Fund’s fee is competitive with the fees of applicable peer ETFs.
The Board considered that the fee for the Fund is a unitary fee pursuant to which the Advisor pays all of the Fund’s costs (subject to certain specified exceptions). The Board considered that the Fund’s fee had been priced to scale when it was established. The Board also considered that the Fund’s portfolio is managed on a day-to-day basis by the Advisor and that the Advisor also provides oversight of day-to-day operations, including monitoring tracking error, providing services in connection with creation and redemption units and assistance in meeting legal and regulatory requirements applicable to the Fund. Based on its review, the Board concluded that the advisory fee for the Fund is reasonable in light of the services provided.
Costs of Services and Profitability. The Board considered the expenses of the Advisor in developing and rendering services provided to the Fund and the information provided by the Advisor to the Board regarding the Fund’s profitability. The Board considered that the Advisor had provided extensive information about the Advisor’s profitability and the Advisor’s methodology in determining profitability. While the Advisor had provided information about the Advisor’s expenses relating to marketing the Fund, the Board considered the Advisor’s profitability without accounting for such expenses. The Board determined that, although the Fund was profitable as of this time, the Advisor’s profitability with respect to the Fund was not excessive. The Board considered
38
DBX ETF Trust
Board Considerations in Approval of Investment Advisory Contracts (Unaudited) (Continued)
whether the Advisor would benefit in other ways from its relationships with the Fund and concluded that there were no material fall-out benefits likely to accrue to the Advisor related to the operation of the Fund.
Economies of Scale. The Board considered that the Fund had attracted a substantial amount of assets, but determined that the Fund was not experiencing economies of scale beyond what was reflected in the Fund’s unitary fee, which the Board noted was very competitive. The Board also acknowledged that the concept of economies of scale is a complex subject as to determining with a fair degree of certainty whether economies of scale exist, to what extent they exist, whether scale can result in additional expenses, and alternative ways advisers can share benefits of economies of scale.
Given all the information available to it and considering all material factors, the Board concluded that the Investment Advisory Agreement was fair and reasonable and it was unanimously approved.
39
DBX ETF Trust
Identification and Background
The Board has responsibility for the overall management and operations of the funds, including general supervision of the duties performed by the Advisor and other service providers. Each Board Member serves until his or her successor is duly elected or appointed and qualified. Each officer serves until he or she resigns, is removed, dies, retires or becomes disqualified.
The Trust currently has three Board Members. The three Independent Board Members have no affiliation or business connection with the Advisor or any of its affiliated persons and do not own any stock or other securities issued by the Advisor.
The Independent Board Members of the Trust, their term of office and length of time served, their principal business occupations during the past five years, the number of portfolios in the fund complex (defined below) overseen by each Independent Board Member, and other directorships, if any, held by the Board Members are shown below. The fund complex includes all registered open- and closed-end funds (including all of their portfolios) advised by the Advisor and any registered funds that have an investment advisor that is an affiliated person of the Advisor. As of the date of this shareholder report, the fund complex consists of the funds in the Trust, as well as the registered funds advised by affiliates of the Advisor.
Shareholder Communications to the Board. Shareholders may send communications to the Trust’s Board by addressing the communications directly to the Board (or individual Board Members) and/or otherwise clearly indicating in the salutation that the communication is for the Board (or individual Board Members). The shareholder may send the communication to either the Trust’s office or directly to such Board members c/o 875 Third Avenue, New York, NY 10022. Other shareholder communications received by the Trust not directly addressed and sent to the Board will be reviewed and generally responded to by management. Such communications will be forwarded to the Board at management’s discretion based on the matters contained therein.
| Independent Board Members |
||||||
| Name, Year of Birth, Position with the Trust and Length of Time Served(1) |
Business Experience and Directorships During the Past 5 Years |
Number of Portfolios in Fund Complex Overseen |
Other Directorships Held by Board Member | |||
| Stephen R. Byers (1953) Chairperson since 2016, and Board Member since 2011 (formerly, Lead Independent Board Member, 2015-2016) |
Independent Director (2011-present); Independent Consultant (2014-present); Director of Investment Management, the Dreyfus Corporation (2000-2006) and Vice Chairman and Chief Investment Officer, the Dreyfus Corporation (2002-2006). | 42 | The Arbitrage Funds, Sierra Income Corporation, Mutual Fund Directors Forum | |||
| George O. Elston (1964) Board Member since 2011, Chairperson of the Audit Committee since 2015 |
Chief Financial Officer, EyePoint Pharmaceuticals, Inc. (2019-present); Chief Financial Officer, Enzyvant (2018-2019); Chief Executive Officer, 2X Oncology, Inc. (2017-2018); Senior Vice President and Chief Financial Officer, Juniper Pharmaceuticals, Inc. (2014-2016); Senior Vice President and Chief Financial Officer, KBI BioPharma Inc. (2013-2014); Managing Partner, Chatham Street Partners (2010-2013). | 42 | — | |||
| J. David Officer (1948) Board Member since 2011, Chairperson of the Nominating Committee since 2015 |
Independent Director (2010-present); Vice Chairman, the Dreyfus Corporation (2006-2009); President, The Dreyfus Family of Funds, Inc. (2006-2009). | 42 | (Chairman of) Ilex Management Ltd; Old Westbury Funds |
40
DBX ETF Trust
Board Members and Officers (Unaudited) (Continued)
| Officers(2) | ||||||
| Name, Year of Birth, Position with the Trust and Length of Time Served(3) |
Business Experience and Directorships During the Past 5 Years | |||||
| Freddi Klassen(4) (1975) President and Chief Executive Officer, 2016-present |
Chief Administrative Officer Investment Division Americas, of DWS Investment Management Americas, Inc. and Manager (since 2023) and Chief Operating Officer of the Advisor (2016-present). Formerly: Programmes (Head 2021-2023), of DWS Investment Management Americas, Inc.; Chief Operating Officer in the Americas for the Traditional Asset Classes Department (2014-2020); Global Chief Operating Officer for Equities Technology in the Investment Bank Division at Deutsche Bank AG (2013-2014); Chief Operating Officer for Exchange Traded Funds and Systematic Funds in Europe (2008-2013). | |||||
| Diane Kenneally(5) (1966) Treasurer, Chief Financial Officer and Controller, 2019-present |
Fund Administration Treasurer’s Office (Co-Head since 2018), of DWS Investment Management Americas, Inc.; Chief Financial Officer and Treasurer for DWS US registered investment companies advised by DWS Investment Management Americas, Inc. (2018-present); Treasurer and Chief Financial Officer, The European Equity Fund, Inc., The New Germany Fund, Inc. and The Central and Eastern Europe Fund, Inc. (2018-present); formerly: Assistant Treasurer for the DWS funds (2007-2018). | |||||
| Frank Gecsedi(4) (1967) Chief Compliance Officer, 2010-present |
AFC Compliance US (Senior Team Lead), of DWS Investment Management Americas, Inc.; Compliance Department (2016-present), Vice President in the Deutsche Asset Management Compliance Department at Deutsche Bank AG (2013-2016) and Chief Compliance Officer of the Advisor (2010-present); Chief Compliance Officer of DWS Distributors, Inc. (2019-2022); Vice President in Deutsche Bank’s Global Markets Legal, Risk and Capital Division (2010-2012). | |||||
| Bryan Richards(4) (1978) Vice President, 2016-present |
Portfolio Engineering, Systematic Investments Solutions (Head), of DWS Investment Management Americas, Inc. (2018-present); Portfolio Manager in the Passive Asset Management Department at DWS (2011-present); Primary Portfolio Manager for the PowerShares DB Commodity ETFs (2011-2015). | |||||
| John Millette(5) (1962) Secretary, 2020-present |
Legal (Associate General Counsel), DWS US Retail Legal (2003-present), of DWS Investment Management Americas, Inc.; Vice President and Secretary of DWS US registered investment companies advised by DWS Investment Management Americas, Inc. (1999-present); Chief Legal Officer, DWS Investment Management Americas, Inc. (2015-present); Director and Vice President of DWS Trust Company (2016-present); Vice President, DBX Advisors LLC (2021-present); Secretary, The European Equity Fund, Inc., The New Germany Fund, Inc. and The Central and Eastern Europe Fund, Inc. (2011-present); formerly: Secretary of Deutsche Investment Management Americas Inc. (2015-2017); and Assistant Secretary of DBX ETF Trust (2019-2020). | |||||
41
DBX ETF Trust
Board Members and Officers (Unaudited) (Continued)
| Name, Year of Birth, Position with the Trust and Length of Time Served(3) |
Business Experience and Directorships During the Past 5 Years | |||||
| Caroline Pearson(5) (1962) Assistant Secretary, 2020-present |
Legal (Senior Team Lead), DWS US Retail Legal, of DWS Investment Management Americas, Inc.; Chief Legal Officer of DWS US registered investment companies advised by DWS Investment Management Americas, Inc. (2010-present); Chief Legal Officer, DBX Advisors LLC (2020-present); Chief Legal Officer, The European Equity Fund, Inc., The New Germany Fund, Inc. and The Central and Eastern Europe Fund, Inc. (2012-present); formerly: Secretary, Deutsche AM Distributors, Inc. (2002-2017); Secretary, Deutsche AM Service Company (2010-2017); and Chief Legal Officer, DBX Strategic Advisors LLC (2020-2021). | |||||
| Paul Antosca(5) (1957) Assistant Treasurer, 2019-present |
Fund Administration Tax (Head), of DWS Investment Management Americas, Inc.; Assistant Treasurer for DWS US registered investment companies advised by DWS Investment Management Americas, Inc. (2007-present). | |||||
| Jeffrey Berry(5) (1959) Assistant Treasurer, 2019-present |
Fund Administration (Senior Specialist), of DWS Investment Management Americas, Inc. | |||||
| Sheila Cadogan(5) (1966) Assistant Treasurer, 2019-present |
Fund Administration Treasurer’s Office (Co-Head since 2018), of DWS Investment Management Americas, Inc.; Assistant Treasurer for DWS US registered investment companies advised by DWS Investment Management Americas, Inc. (2017-present); Director and Vice President, DWS Trust Company (2018-present); Assistant Treasurer, The European Equity Fund, Inc., The New Germany Fund, Inc. and The Central and Eastern Europe Fund, Inc. (2018-present). | |||||
| Christina A. Morse(6) (1964) Assistant Secretary, 2017-present |
Vice President at BNY Mellon Asset Servicing (2014-present); Vice President and Counsel at Lord Abbett & Co. LLC (2013-2014). | |||||
| Christian Rijs(4) (1980) Anti-Money Laundering Compliance Officer, since October 21, 2021 |
Senior Team Lead Anti-Financial Crime and Compliance, DWS Investment Management Americas, Inc.; AML Officer, DWS Trust Company (since November 2, 2021); AML Officer, DWS US registered investment companies advised by DWS Investment Management Americas, Inc. (since October 6, 2021); AML Officer, The European Equity Fund, Inc., The New Germany Fund, Inc. and The Central and Eastern Europe Fund, Inc. (since November 12, 2021); formerly: DWS UK & Ireland Head of Anti-Financial Crime and MLRO. | |||||
| (1) | The length of time served is represented by the year in which the Board Member joined the Board. |
| (2) | As a result of their respective positions held with the Advisor and its affiliates, these individuals are considered “interested persons” of the Advisor within the meaning of the 1940 Act. Interested persons receive no compensation from the Funds. |
| (3) | The length of time served is represented by the year in which the officer was first elected to the Trust in such capacity. |
| (4) | Address: 875 Third Avenue, New York, New York 10022. |
| (5) | Address: 100 Summer Street, Boston, MA 02110. |
| (6) | Address: BNY Mellon Asset Servicing, 240 Greenwich Street, New York, NY 10286. |
The Funds’ Statement of Additional Information (“SAI”) includes additional information about the Funds’ Board Members. The SAI is available by calling 855-329-3837, or on the Company’s website at www.Xtrackers.com.
42
DBX ETF Trust
Proxy Voting Policies and Procedures
The Fund’s policies and procedures for voting proxies for portfolio securities and information about how the Fund voted proxies related to its portfolio securities during the most recent 12-month period ended June 30 are available on our Web site — www.Xtrackers.com (click on “Resources” and “Proxy Voting” at the top of the page) — or on the SEC’s Web site — www.sec.gov. To obtain a written copy of the Fund’s policies and procedures without charge, upon request, call us toll free at (855) 329-3837.
Portfolio Holdings Information
The Fund is required to file its complete schedule of portfolio holdings with the SEC for its first and third fiscal quarters on Form N-PORT. Copies of the filings are available without charge, upon request on the SEC’s website at www.sec.gov and are available by calling the Trust at 855-329-3837.
Information about the Fund’s portfolio holdings is available daily at www.Xtrackers.com.
Discount & Premium Information
Information regarding how often shares of the Fund traded on NYSE Arca at a price above (i.e., at a premium) or below (i.e., at a discount) the NAV of the Fund can be found at www.Xtrackers.com.
Tax Information
Form 1099-DIV and other year-end tax information provide shareholders with actual calendar year amounts that should be included in their tax returns. Shareholders should consult their tax advisors.
The Fund designates the following amounts or, if subsequently determined to be different, the maximum allowable for its fiscal year ended May 31, 2023.
| Qualified Dividend Income* |
||||
| 44% | ||||
* The above percentage is based on ordinary income dividends paid to shareholders during each Fund’s fiscal year.
The Fund intends to elect to pass through to shareholders the credit for taxes paid to foreign countries. The gross foreign source income and foreign taxes paid are as follows:
| Gross Foreign Income |
Foreign Taxes Paid | |||||||
| $143,032,795 | $2,450,204 | |||||||
43
DBX ETF Trust
This report is intended for the shareholders of DBX ETF Trust.
This report must be preceded or accompanied by a prospectus.
Investing involves risk, including the possible loss of principal. Stocks may decline in value. Foreign investing involves greater and different risks than investing in U.S. companies, including currency fluctuations, less liquidity, less developed or less efficient trading markets, lack of comprehensive company information, political instability and differing auditing and legal standards. The Fund’s use of forward currency contracts may not be successful in hedging currency exchange rates changes and could eliminate some or all of the benefit of an increase in the value of a foreign currency versus the U.S. dollar. Funds investing in a single industry, country or in a limited geographic region generally are more volatile than more diversified funds. Investing in derivatives entails special risks relating to liquidity, leverage and credit that may reduce returns and/or increase volatility. Performance of the Fund may diverge from that of the Underlying Index due to operating expenses, transaction costs, cash flows, use of sampling strategies or operational inefficiencies. An investment in the Fund should be considered only as a supplement to a complete investment program for those investors willing to accept the risks associated with the Fund. Please read the prospectus for more information.
War, terrorism, sanctions, economic uncertainty, trade disputes, public health crises, natural disasters, climate change and related geopolitical events have led and, in the future, may lead to significant disruptions in U.S. and world economies and markets, which may lead to increased market volatility and may have significant adverse effects on the Fund and its investments.
Shares of the Funds are bought and sold at market price (not NAV) throughout the day on the NYSE Arca, Inc. Transactions in Fund shares may result in brokerage commissions and may generate tax consequences. There can be no assurance that an active trading market for shares of a Fund will develop or be maintained.
DBX ETF Trust Funds are distributed by ALPS Distributors, Inc. (“ALPS”). The Funds are managed by DBX Advisors LLC which is not affiliated with ALPS.
The brand DWS represents DWS Group GmbH & Co. KGaA and any of its subsidiaries such as DWS Distributors, Inc. which offers investment products or DWS Investment Management Americas, Inc. and RREEF America L.L.C. which offer advisory services.
The Funds or securities referred to herein are not sponsored, endorsed, issued, sold or promoted by MSCI, and MSCI bears no liability with respect to any such Funds or securities or any index on which such Funds or securities are based. The prospectus contains a more detailed description of the limited relationship MSCI has with DBX Advisors LLC and any related funds.
Copyright © 2023 DWS Group. All rights reserved. XtrackersTM is a trademark of DWS Investment GmbH. All other trademarks, servicemarks or registered trademarks are the property of their respective owners.
Not FDIC Insured | No Bank Guarantee | May Lose Value
DBX ETF Trust
| Investment advisor DBX Advisors LLC 875 Third Avenue New York, NY 10022 |
Administrator, custodian, fund accounting agent, lending agent & transfer agent The Bank of New York Mellon 240 Greenwich Street New York, NY 10286 |
Distributor ALPS Distributors, Inc. 1290 Broadway Suite 1000 Denver, CO 80203 | ||
| Independent registered public accounting firm Ernst & Young LLP One Manhattan West New York, NY, 10001 |
Legal counsel Vedder Price P.C. 1633 Broadway New York, NY 10019 |
|||
R-38753-9 (7/23) DBX005558 (7/24)
May 31, 2023
Annual Report
DBX ETF Trust
Xtrackers Bloomberg US Investment Grade Corporate ESG ETF (ESCR)
Xtrackers J.P. Morgan ESG Emerging Markets Sovereign ETF (ESEB)
Xtrackers J.P. Morgan ESG USD High Yield Corporate Bond ETF (ESHY)
Xtrackers Municipal Infrastructure Revenue Bond ETF (RVNU)
Xtrackers MSCI All World ex US High Dividend Yield Equity ETF (HDAW)
Xtrackers MSCI EAFE High Dividend Yield Equity ETF (HDEF)

DBX ETF Trust
| Page | ||||
| 1 | ||||
| 3 | ||||
| Performance Summary |
||||
| 6 | ||||
| 8 | ||||
| 10 | ||||
| 12 | ||||
| Xtrackers MSCI All World ex US High Dividend Yield Equity ETF |
14 | |||
| 16 | ||||
| 18 | ||||
| Schedule of Investments |
||||
| 19 | ||||
| 28 | ||||
| 33 | ||||
| 51 | ||||
| Xtrackers MSCI All World ex US High Dividend Yield Equity ETF |
58 | |||
| 65 | ||||
| 70 | ||||
| 72 | ||||
| 74 | ||||
| 77 | ||||
| 80 | ||||
| 91 | ||||
| 92 | ||||
| 93 | ||||
| Board Considerations in Approval of Investment Advisory Contracts |
94 | |||
| 97 | ||||
| 99 | ||||
To our Shareholders: (Unaudited)
Dear shareholder,
We are pleased to provide this annual report on six of our ETFs tracking the fixed income market for the period ended May 31, 2023.
The global economy faced several headwinds during the reporting period amid elevated inflation, rising interest rates and heightened economic and geopolitical uncertainties. Persistently high inflation in both developed and developing countries eroded real incomes and prompted aggressive interest rate hikes by the U.S. Federal Reserve (Fed) and other major central banks, except the Bank of Japan. This, in turn, caused financial conditions to tighten and debt-servicing costs to increase. In February 2023, Russia’s invasion of Ukraine passed the one-year mark, with no real signs of a way out of the conflict. Global financial markets remained largely resilient despite the banking-sector turmoil in the U.S. and Europe. The U.S. labor market remained moderately resilient as the unemployment rate stayed stable amid slowing wage growth. Meanwhile, China’s reopening after COVID-19-related restrictions had a positive impact on global market sentiment.
In the U.S., fixed income markets were volatile and posted negative returns during the reporting period due to higher interest rates that caused bond yields to rise. In May 2023, the U.S. Federal Reserve Board (FRB) raised the Fed funds rate by 25Bps1 to a range of 5-5.25%, bringing borrowing costs to their highest level since September 2007, to achieve its 2% inflation target. FRB officials expressed uncertainty about how much more policy tightening may be appropriate in the future. In July 2022, the 10-year versus 2-year Treasury yield spread curve inverted; this is usually considered a predictor of economic recession, as short-term interest rates became higher than long-term interest rates. Both 10-year and 2-year Treasury yields increased during the reporting period amid concerns surrounding the outlook of the U.S. economy and speculation around the debt-ceiling deal.
The Eurozone economy returned to growth in Q1 2023, with an expansion of 0.1% QoQ after recording zero growth in Q4 2022. While Germany’s economy saw no growth, Spain and Italy witnessed strong expansion. The bloc’s economy has been impacted significantly by an increase in consumer prices owing to higher energy and food costs. Furthermore, the European Central Bank’s (ECB’s) aggressive monetary tightening policy added to the economic woes, along with a decline in confidence levels among businesses and consumers. The Bank of Japan’s new governor pledged to keep the loose monetary policy unchanged for now and announced plans to review past monetary policy moves. China’s economy grew 4.5% YoY in Q1 2023 after 2.9% growth in Q4 2022, beating market estimates of 4%, amid Beijing’s efforts to stimulate the post-pandemic recovery. Developing markets faced challenges from elevated inflation amid slowing growth.
We believe central banks around the world will remain wary in their approach to monetary policy and watch for positive signs in the economy before taking any interest rate action. The recent banking system stress and debt-ceiling concerns will also weigh on the U.S. Federal Reserve’s (Fed’s) decisions in the coming months. Unlike the Fed, the ECB has clearly maintained its stance on monetary action and is willing to rates further until inflation is within the comfort level. We will be keenly watching how China recovers from its COVID-19-related restrictions to induce an uptick in industrial activity and income recovery while boosting private sector investment.
Our team appreciates your trust and looks forward to serving your investment needs through innovative index-driven strategies.
Sincerely,
/s/ Freddi Klassen
Freddi Klassen
President and Chief Executive Officer
1 Basis points (Bps) are a unit of measurement equal to 1/100th of 1 percent and a standard measure for interest rates.
Assumptions, estimates and opinions contained in this document constitute our judgment as of the date of the document and are subject to change without notice. Any projections are based on a number of assumptions as to market conditions and there can be no guarantee that any projected results will be achieved. Past performance is not a guarantee of future results.
1
This Page is Intentionally Left Blank
2
DBX ETF Trust
Xtrackers Bloomberg US Investment Grade Corporate ESG ETF
Xtrackers Bloomberg US Investment Grade Corporate ESG ETF (ESCR), seeks Investment results that correspond generally to the performance before the fund’s fees and expenses, of the Bloomberg MSCI US Corporate Sustainability SRI Sector/Credit/Maturity Neutral Index (the ESCR Index). The ESCR Index, which applies environmental, social and governance (“ESG”) considerations to a broader parent index. The Underlying Index generally aims to keep the broad characteristics of its parent index, the Bloomberg US Corporate Index (an investment grade corporate bond universe), resulting in a broad investment grade fixed income market exposure, with ESG aspects. The Bloomberg US Aggregate Bond Index is a broadmeasure, market capitalization-weighted bond market index representing intermediate term investment grade bonds traded in the domestic bond market. For the 12-month period ended May 31, 2023, ESCR returned -2.00%, compared to the ESCR Index return of -1.80%.
All sectors contributed negatively to performance during the period with the Financial Institutions, Consumer Non-Cyclical and Utility sectors detracting the most from performance.
Xtrackers J.P. Morgan ESG Emerging Markets Sovereign ETF
Xtrackers J.P. Morgan ESG Emerging Markets Sovereign ETF (ESEB) seeks investment results that correspond generally to the performance, before fund’s fees and expenses, of the J.P. Morgan ESG EMBI Global Diversified Sovereign Index (the ESEB Index). The Index, which applies J.P. Morgan environmental, social and governance (“JESG”) considerations to a broader parent index. The Underlying Index generally aims to keep the broad characteristics of its parent index, the J.P. Morgan EMBI Global Diversified Sovereign Index, before implementing ESG considerations. For the 12-month period ended May 31, 2023, ESEB returned -1.16%, compared to the ESEB Index return of -1.79%.
From a geographical perspective, Russia, El Salvador and Turkey were the major positive contributors while Ecuador, Egypt and Ghana contributed negatively to performance.
Xtrackers J.P. Morgan ESG USD High Yield Corporate Bond ETF
Xtrackers J.P. Morgan ESG USD High Yield Corporate Bond ETF (ESHY), seek investment results that correspond generally to the performance, before fund’s fees and expenses, of the J.P. Morgan ESG DM Corporate High Yield USD Index (the ESHY Index). The Index generally aims to keep the broad characteristics of its parent index, the J.P. Morgan DM High Yield USD Index (a USD denominated high yield corporate bond index of developed market issuers), resulting in a broad high yield fixed income market exposure with ESG. For the 12-month period ended May 31, 2023, ESHY returned 0.03%, compared to the ESHY Index return of 0.17%.
Consumer Cyclical, Energy and Capital Goods were the major positive contributors, while Communications, Financial Institutions and Consumer Non-Cyclical sectors detracted most from the performance.
Xtrackers Municipal Infrastructure Revenue Bond ETF
The Xtrackers Municipal Infrastructure Revenue Bond ETF (RVNU) seeks investment results that correspond generally to the performance, before fees and expenses, of the Solactive Municipal Infrastructure Revenue Bond Index (the RVNU Index). The RVNU Index is designed to track returns of the segment of the U.S. long-term tax-exempt bond market that consists of infrastructure revenue bonds. For the 12-month period ended May 31, 2023, RVNU returned -0.79%, compared to the RVNU Index return of -0.75%.
The majority of sectors contributed negatively to performance during the period with the greatest negative contributions coming from Transport and Utility. The Tax-Backed and Education sectors were the positive contributors to performance.
Xtrackers MSCI All World ex US High Dividend Yield Equity ETF
The Xtrackers MSCI All World ex US High Dividend Yield Equity ETF (HDAW) seeks investment results that correspond generally to the performance, before fees and expenses, of the MSCI ACWI ex US High Dividend Yield Index (the HDAW Index). The HDAW Index is designed to give investors exposure to equity securities across developed and emerging market countries (excluding the United States), with higher dividend income and quality characteristics than average dividend yields of equities in its parent index (excluding REITs), where such higher
3
DBX ETF Trust
Management’s Discussion of Fund Performance (Unaudited) (Continued)
dividend income and quality characteristics are both sustainable and persistent. For the 12-month period ended May 31, 2023, HDAW returned -1.68%, compared to the HDAW Index return of -1.58%.
Consumer Discretionary, Financials and Consumer Staples were the major positive contributors, while Materials, Energy and Real Estate sectors detracted most from the performance. From a geographical perspective, most of the countries contributed negatively with United Kingdom, Hong Kong and Brazil being the most significant detractors. However, Switzerland, Japan and Germany contributed positively to the performance.
Xtrackers MSCI EAFE High Dividend Yield Equity ETF
The Xtrackers MSCI EAFE High Dividend Yield Equity ETF (HDEF) seeks investment results that correspond generally to the performance, before fees and expenses, of the MSCI EAFE High Dividend Yield Index (the HDEF Index). The HDEF Index is designed to give investors exposure to equity securities in developed international stock markets, with higher dividend income and quality characteristics than average dividend yields of equities in its parent index (excluding REITs), where such higher dividend income and quality characteristics are both sustainable and persistent. For the 12-month period ended May 31, 2023, HDEF returned 0.46%, compared to the HDEF Index return of 0.37%.
Financials, Consumer Discretionary and Consumer Staples were the major positive contributors, while Materials, Health Care and Energy sectors detracted most from the performance. From a geographical perspective, United Kingdom, Norway, and Australia contributed negatively. However, Switzerland, Japan and Germany contributed positively to the performance.
*************************
Performance data quoted represents past performance and does not guarantee future results. Investment returns and principal value of an investment will fluctuate so that an investor’s shares, when sold or redeemed, may be worth more or less than their original cost. Current performance may be lower or higher than the performance data quoted. To obtain the most recent month-end performance data visit www.Xtrackers.com. Returns assume that dividends and capital gains distributions have been reinvested. See pages 6-17 of this report for additional performance information, including performance data based on market value. The views expressed in this report reflect those of the portfolio management team only through the end of the period of the report as stated on the cover. The management team’s views are subject to change at any time based on market and other conditions and should not be construed as a recommendation. Current and future portfolio holdings are subject to risk.
4
This Page is Intentionally Left Blank
5
DBX ETF Trust
Performance Summary (Unaudited)
Xtrackers Bloomberg US Investment Grade Corporate ESG ETF (ESCR)
The Xtrackers Bloomberg US Investment Grade Corporate ESG ETF (the “Fund”), using a “passive” or indexing investment approach, seeks investment results that correspond generally to the performance, before fees and expenses, of the Bloomberg MSCI US Corporate Sustainability SRI Sector/Credit/Maturity Neutral Index (the “Underlying Index”). The Underlying Index is designed to apply environmental, social and governance (“ESG”) considerations to a broader parent index. The Underlying Index generally aims to keep the broad characteristics of its parent index, the Bloomberg US Corporate Index (an investment grade corporate bond universe), resulting in a broad investment grade fixed income market exposure with ESG aspects. It is not possible to invest directly into an index.
| Performance as of May 31, 2023 |
| Average Annual Total Return | ||||||||
| Net Asset Value | Market Value | Bloomberg MSCI US Corporate Sustainability SRI
Sector/Credit/ |
Bloomberg US Aggregate Bond Index | |||||
| One Year |
-2.00% | -1.95% | -1.80% | -2.14% | ||||
| Five Year |
-1.97% | -1.98% | -2.60% | 0.81% | ||||
| Since Inception1 |
-0.52% | -0.51% | -1.01% | 1.02% | ||||
| Cumulative Total Returns | ||||||||
| Net Asset Value | Market Value | Bloomberg MSCI US SRI Sector/Credit/ |
Bloomberg US Aggregate Bond Index | |||||
| One Year |
-2.00% | -1.95% | -1.80% | -2.14% | ||||
| Five Year |
-9.46% | -9.52% | -12.32% | 4.13% | ||||
| Since Inception1 |
-4.21% | -4.16% | -8.01% | 8.77% | ||||
1 Total returns are calculated based on the commencement of operations, March 3, 2015 (“Inception”).
2 On May 12, 2020, the Fund changed its Underlying Index from Solactive Investment Grade Bond — Interest Rate Hedged Index to the Bloomberg MSCI US Corporate Sustainability SRI Sector/Credit/Maturity Neutral Index. Returns reflect performance for the Solactive Investment Grade Bond — Interest Rate Hedged Index through May 11, 2020.
Prior to May 12, 2020, the Fund was known as Xtrackers Investment Grade Bond — Interest Rate Hedged ETF and had a different investment strategy. Past performance may have been different if the Fund’s current investment strategy had been in effect.
Past performance is no guarantee of future results. Current performance may be lower or higher than the performance data quoted. Performance data current to the most recent month-end is available at www.Xtrackers.com. Performance results assume reinvestment of all dividends and capital gain distributions and do not reflect the deduction of taxes that a shareholder would pay on fund distributions or on the sale of fund shares or redemption of fund creation units. The investment return and principal value of shares will vary with changes in market conditions. Shares may be worth more or less than their original cost when they are sold in the market or redeemed. Performance for certain funds may reflect a waiver of a portion of the unitary advisory fee. Without such waiver, performance would have been lower. The gross expense ratio of the Fund, as stated in the fee table of the prospectus dated October 1, 2022, was 0.15%, and may differ from the expense ratio disclosed in the Financial Highlights table in this report.
The Fund’s net asset value or “NAV” is calculated by dividing the value of the Fund’s total assets less total liabilities by the number of shares outstanding. The price used to calculate market return (“Market Price”) is determined by using the midpoint between the highest bid and the lowest offer on the primary stock exchange on which shares of a fund are listed for trading, as of the time that such fund’s NAV is calculated. Since shares of a fund may not have traded in the secondary market until after the fund’s inception, for the period from inception to the first day of secondary trading, the NAV of the fund is used as a proxy for the Market Price to calculate market returns. Market and NAV returns assume that dividends and capital gain distributions have been reinvested at Market Price and NAV, respectively.
An index is a statistical composite that tracks a specified financial market or sector. Unlike a fund, an index does not actually hold a portfolio of securities and therefore does not incur the expenses incurred by a fund. These expenses negatively impact fund performance. Also, market returns do not include brokerage commissions that may be payable on secondary market transactions. If brokerage commissions were included, market returns would be lower.
Generally accepted accounting principles require adjustments to be made to the net assets of the Fund at period end for financial reporting purposes only, and as such, the total return based on the unadjusted net asset value per share may differ from the total return reported in the financial highlights.
6
DBX ETF Trust
Performance Summary (Unaudited)
Xtrackers Bloomberg US Investment Grade Corporate ESG ETF (ESCR) (Continued)
| Growth of an Assumed $10,000 Investment |
1 Based on Net Asset Value from commencement of operations, March 3, 2015.
| Sector Diversification* as of May 31, 2023 |
| Financial |
32.2% | |||
| Consumer, Non-cyclical |
18.0% | |||
| Technology |
11.9% | |||
| Communications |
9.5% | |||
| Utilities |
8.5% | |||
| Consumer, Cyclical |
7.6% | |||
| Industrial |
6.5% | |||
| Energy |
3.8% | |||
| Basic Materials |
2.0% | |||
|
|
|
|||
| Total |
100.0% |
Modified duration to worst as of May 31, 2023: 7.2 years
Modified duration to worst is the measure of sensitivity of the price of a bond to a change in interest rates, assuming worst case scenario.
| Quality* as of May 31, 2023 |
| Description | % of Market Value | |||
| AAA |
3.3% | |||
| AA |
13.0% | |||
| A |
43.1% | |||
| BBB |
40.6% | |||
|
|
|
|||
| Total |
100.0% | |||
The quality ratings represent the higher of Moody’s Investor Services, Inc. (“Moody’s”), S&P Global Ratings (S&P) or Fitch Ratings Inc. (Fitch) credit ratings. The ratings of Moody’s, S&P and Fitch represent their opinions as to the quality of the securities they rate. Credit quality measures a bond issuer’s ability to repay interest and principal in a timely manner and is measured on a scale that ranges from AAA (highest) to D (lowest). Ratings are relative and subjective and are not absolute standards of quality. Credit quality does not remove market risk and is subject to change.
| Country Diversification* as of May 31, 2023 |
| United States |
86.7% | |||
| Canada |
4.1% | |||
| United Kingdom |
3.0% | |||
| Japan |
2.4% | |||
| Other |
3.8% | |||
|
|
|
|||
| Total |
100.0% |
* As a percent of total investments excluding cash equivalents.
Portfolio holdings and characteristics are subject to change. For more complete details about the Fund’s investment portfolio see page 19.
7
DBX ETF Trust
Performance Summary (Unaudited)
Xtrackers J.P. Morgan ESG Emerging Markets Sovereign ETF (ESEB)
The Xtrackers J.P. Morgan ESG Emerging Markets Sovereign ETF (the “Fund”), using a “passive” or indexing investment approach, seeks investment results that correspond generally to the performance, before fees and expenses, of the J.P. Morgan ESG EMBI Global Diversified Sovereign Index (the “Underlying Index”). The Underlying Index is designed to apply environmental, social and governance (“ESG”) considerations to a broader parent index. The Underlying Index generally aims to keep the broad characteristics of its parent index, the J.P. Morgan EMBI Global Diversified Sovereign Index, resulting in a broad emerging markets sovereign debt market exposure with ESG aspects. It is not possible to invest directly into an index.
| Performance as of May 31, 2023 |
| Average Annual Total Return | ||||||||
| Net Asset Value | Market Value | J.P. Morgan ESG EMBI Global Diversified Sovereign Index2 |
J.P. Morgan EMBI Global Diversified Sovereign Index | |||||
| One Year |
-1.16% | -1.12% | -1.79% | -1.94% | ||||
| Five Year |
-2.65% | -2.78% | -3.90% | -0.52% | ||||
| Since Inception1 |
-0.02% | -0.02% | -1.00% | 1.43% | ||||
| Cumulative Total Returns | ||||||||
| Net Asset Value | Market Value | J.P. Morgan ESG EMBI Global Diversified Sovereign Index2 |
J.P. Morgan EMBI Global Diversified Sovereign Index | |||||
| One Year |
-1.16% | -1.12% | -1.79% | -1.94% | ||||
| Five Year |
-12.57% | -13.13% | -18.03% | -2.56% | ||||
| Since Inception1 |
-0.14% | -0.13% | -7.95% | 12.44% | ||||
1 Total returns are calculated based on the commencement of operations, March 3, 2015 (“Inception”).
2 On May 12, 2020, the Fund changed its Underlying Index from Solactive Emerging Markets Bond — Interest Rate Hedged Index to the J.P. Morgan ESG EMBI Global Diversified Sovereign Index. Returns reflect performance for the Solactive Emerging Markets Bond — Interest Rate Hedged Index through May 11, 2020.
Prior to May 12, 2020, the Fund was known as Xtrackers Emerging Markets Bond — Interest Rate Hedged ETF and had a different investment strategy. Past performance may have been different if the Fund’s current investment strategy had been in effect.
Past performance is no guarantee of future results. Current performance may be lower or higher than the performance data quoted. Performance data current to the most recent month-end is available at www.Xtrackers.com. Performance results assume reinvestment of all dividends and capital gain distributions and do not reflect the deduction of taxes that a shareholder would pay on fund distributions or on the sale of fund shares or redemption of fund creation units. The investment return and principal value of shares will vary with changes in market conditions. Shares may be worth more or less than their original cost when they are sold in the market or redeemed. Performance for certain funds may reflect a waiver of a portion of the unitary advisory fee. Without such waiver, performance would have been lower. The gross expense ratio of the Fund, as stated in the fee table of the prospectus dated October 1, 2022, was 0.35%, and may differ from the expense ratio disclosed in the Financial Highlights table in this report.
The Fund’s net asset value or “NAV” is calculated by dividing the value of the Fund’s total assets less total liabilities by the number of shares outstanding. The price used to calculate market return (“Market Price”) is determined by using the midpoint between the highest bid and the lowest offer on the primary stock exchange on which shares of a fund are listed for trading, as of the time that such fund’s NAV is calculated. Since shares of a fund may not have traded in the secondary market until after the fund’s inception, for the period from inception to the first day of secondary trading, the NAV of the fund is used as a proxy for the Market Price to calculate market returns. Market and NAV returns assume that dividends and capital gain distributions have been reinvested at Market Price and NAV, respectively.
An index is a statistical composite that tracks a specified financial market or sector. Unlike a fund, an index does not actually hold a portfolio of securities and therefore does not incur the expenses incurred by a fund. These expenses negatively impact fund performance. Also, market returns do not include brokerage commissions that may be payable on secondary market transactions. If brokerage commissions were included, market returns would be lower.
Generally accepted accounting principles require adjustments to be made to the net assets of the Fund at period end for financial reporting purposes only, and as such, the total return based on the unadjusted net asset value per share may differ from the total return reported in the financial highlights.
8
DBX ETF Trust
Performance Summary (Unaudited)
Xtrackers J.P. Morgan ESG Emerging Markets Sovereign ETF (ESEB) (Continued)
| Growth of an Assumed $10,000 Investment |
1 Based on Net Asset Value from commencement of operations, March 3, 2015.
| Country Diversification* as of May 31, 2023 |
| Saudi Arabia |
5.8% | |||
| Panama |
4.9% | |||
| Hungary |
4.7% | |||
| Brazil |
4.2% | |||
| Qatar |
4.0% | |||
| Philippines |
4.0% | |||
| Indonesia |
3.9% | |||
| Uruguay |
3.8% | |||
| Dominican Republic |
3.5% | |||
| Romania |
3.5% | |||
| United Arab Emirates |
3.5% | |||
| Oman |
3.4% | |||
| Colombia |
3.4% | |||
| Turkey |
3.4% | |||
| Bahrain |
3.2% | |||
| Peru |
3.1% | |||
| Mexico |
3.1% | |||
| Chile |
2.7% | |||
| South Africa |
2.6% | |||
| Other |
29.3% | |||
|
|
|
|||
| Total |
100.0% |
Modified duration to worst as of May 31, 2023: 7.0 years
Modified duration to worst is the measure of sensitivity of the price of a bond to a change in interest rates, assuming worst case scenario.
| Quality* as of May 31, 2023 |
| Description | % of Market Value | |||
| AA |
8.6% | |||
| A |
12.5% | |||
| BBB |
37.1% | |||
| BB |
23.0% | |||
| B |
14.0% | |||
| CCC |
4.0% | |||
| CC |
0.8% | |||
|
|
|
|||
| Total |
100.0% | |||
The quality ratings represent the higher of Moody’s Investor Services, Inc. (“Moody’s”), S&P Global Ratings (S&P) or Fitch Ratings Inc. (Fitch) credit ratings. The ratings of Moody’s, S&P and Fitch represent their opinions as to the quality of the securities they rate. Credit quality measures a bond issuer’s ability to repay interest and principal in a timely manner and is measured on a scale that ranges from AAA (highest) to D (lowest). Ratings are relative and subjective and are not absolute standards of quality. Credit quality does not remove market risk and is subject to change.
* As a percentage of total investments excluding cash equivalents.
Portfolio holdings and characteristics are subject to change. For more complete details about the Fund’s investment portfolio see page 28.
9
DBX ETF Trust
Performance Summary (Unaudited)
Xtrackers J.P. Morgan ESG USD High Yield Corporate Bond ETF (ESHY)
The Xtrackers J.P. Morgan ESG USD High Yield Corporate Bond ETF (the “Fund”), using a “passive” or indexing investment approach, seeks investment results that correspond generally to the performance, before fees and expenses, of the J.P. Morgan ESG DM Corporate High Yield USD Index (the “Underlying Index”). The Underlying Index is designed to apply environmental, social and governance (“ESG”) considerations to a broader parent index. The Underlying Index generally aims to keep the broad characteristics of its parent index, the J.P. Morgan DM High Yield USD Index (a USD denominated high yield corporate bond index of developed market issuers), resulting in a broad high yield fixed income market exposure with ESG aspects. It is not possible to invest directly into an index..
| Performance as of May 31, 2023 |
| Average Annual Total Return | ||||||||
| Net Asset Value | Market Value | J.P. Morgan ESG DM Corporate High Yield USD Index2 |
Baseline JESG DM Corporate HY USD Index | |||||
| One Year |
0.03% | -0.14% | 0.17% | 0.04% | ||||
| Five Year |
1.34% | 1.30% | 0.31% | 3.11% | ||||
| Since Inception1 |
1.91% | 1.89% | 1.49% | 3.82% | ||||
| Cumulative Total Returns | ||||||||
| Net Asset Value | Market Value | J.P. Morgan ESG DM Corporate High Yield USD Index2 |
Baseline JESG DM Corporate HY USD Index | |||||
| One Year |
0.03% | -0.14% | 0.17% | 0.04% | ||||
| Five Year |
6.86% | 6.68% | 1.58% | 16.55% | ||||
| Since Inception1 |
16.90% | 16.75% | 12.95% | 36.24% | ||||
1 Total returns are calculated based on the commencement of operations, March 3, 2015 (“Inception”).
2 On May 12, 2020, the Fund changed its Underlying Index from Solactive High Yield Corporate Bond — Interest Rate Hedged Index to the J.P. Morgan ESG DM Corporate High Yield USD Index. Returns reflect performance for the Solactive High Yield Corporate Bond — Interest Rate Hedged Index through May 11, 2020.
Prior to May 12, 2020, the Fund was known as Xtrackers High Yield Corporate Bond — Interest Rate Hedged ETF and had a different investment strategy. Past performance may have been different if the Fund’s current investment strategy had been in effect.
Past performance is no guarantee of future results. Current performance may be lower or higher than the performance data quoted. Performance data current to the most recent month-end is available at www.Xtrackers.com. Performance results assume reinvestment of all dividends and capital gain distributions and do not reflect the deduction of taxes that a shareholder would pay on fund distributions or on the sale of fund shares or redemption of fund creation units. The investment return and principal value of shares will vary with changes in market conditions. Shares may be worth more or less than their original cost when they are sold in the market or redeemed. Performance for certain funds may reflect a waiver of a portion of the unitary advisory fee. Without such waiver, performance would have been lower. The gross expense ratio of the Fund, as stated in the fee table of the prospectus dated October 1, 2022, was 0.20%, and may differ from the expense ratio disclosed in the Financial Highlights table in this report.
The Fund’s net asset value or “NAV” is calculated by dividing the value of the Fund’s total assets less total liabilities by the number of shares outstanding. The price used to calculate market return (“Market Price”) is determined by using the midpoint between the highest bid and the lowest offer on the primary stock exchange on which shares of a fund are listed for trading, as of the time that such fund’s NAV is calculated. Since shares of a fund may not have traded in the secondary market until after the fund’s inception, for the period from inception to the first day of secondary trading, the NAV of the fund is used as a proxy for the Market Price to calculate market returns. Market and NAV returns assume that dividends and capital gain distributions have been reinvested at Market Price and NAV, respectively.
An index is a statistical composite that tracks a specified financial market or sector. Unlike a fund, an index does not actually hold a portfolio of securities and therefore does not incur the expenses incurred by a fund. These expenses negatively impact fund performance. Also, market returns do not include brokerage commissions that may be payable on secondary market transactions. If brokerage commissions were included, market returns would be lower.
Generally accepted accounting principles require adjustments to be made to the net assets of the Fund at period end for financial reporting purposes only, and as such, the total return based on the unadjusted net asset value per share may differ from the total return reported in the financial highlights.
10
DBX ETF Trust
Performance Summary (Unaudited)
Xtrackers J.P. Morgan ESG USD High Yield Corporate Bond ETF (ESHY) (Continued)
| Growth of an Assumed $10,000 Investment |
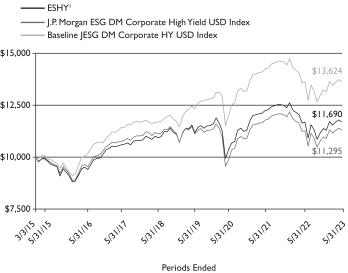
1 Based on Net Asset Value from commencement of operations, March 3, 2015.
| Sector Diversification* as of May 31, 2023 |
| Consumer, Cyclical |
22.9% | |||
| Communications |
15.8% | |||
| Consumer, Non-cyclical |
13.8% | |||
| Energy |
12.6% | |||
| Industrial |
12.1% | |||
| Financial |
10.2% | |||
| Basic Materials |
6.0% | |||
| Technology |
5.0% | |||
| Utilities |
1.5% | |||
| Diversified |
0.1% | |||
|
|
|
|||
| Total |
100.0% |
Modified duration to worst as of May 31, 2023: 3.9 years
Modified duration to worst is the measure of sensitivity of the price of a bond to a change in interest rates, assuming worst case scenario.
| Quality* as of May 31, 2023 |
| Description | % of Market Value | |||
| BBB |
5.2% | |||
| BB |
56.6% | |||
| B |
28.9% | |||
| CCC |
9.0% | |||
| CC |
0.2% | |||
| NR |
0.1% | |||
|
|
|
|||
| Total |
100.0% | |||
The quality ratings represent the higher of Moody’s Investor Services, Inc. (“Moody’s”), S&P Global Ratings (S&P) or Fitch Ratings Inc. (Fitch) credit ratings. The ratings of Moody’s, S&P and Fitch represent their opinions as to the quality of the securities they rate. Credit quality measures a bond issuer’s ability to repay interest and principal in a timely manner and is measured on a scale that ranges from AAA (highest) to D (lowest). Ratings are relative and subjective and are not absolute standards of quality. Credit quality does not remove market risk and is subject to change.
| Country Diversification* as of May 31, 2023 |
| United States |
85.7% | |||
| Canada |
4.3% | |||
| United Kingdom |
2.2% | |||
| Other |
7.8% | |||
|
|
|
|||
| Total |
100.0% |
* As a percentage of total investments excluding cash equivalents.
Portfolio holdings and characteristics are subject to change. For more complete details about the Fund’s investment portfolio see page 33.
11
DBX ETF Trust
Performance Summary (Unaudited)
Xtrackers Municipal Infrastructure Revenue Bond ETF (RVNU)
The Xtrackers Municipal Infrastructure Revenue Bond ETF (the “Fund”), using a “passive” or indexing investment approach, seeks investment results that correspond generally to the performance, before fees and expenses, of the Solactive Municipal Infrastructure Revenue Bond Index (the “Underlying Index”). The Underlying Index is designed to track the performance of the U.S. long-term tax exempt bond market, consisting of infrastructure revenue bonds. It is not possible to invest directly into an index.
| Performance as of May 31, 2023 |
| Average Annual Total Return | ||||||||
| Net Asset Value | Market Value | Solactive Municipal Infrastructure Revenue Bond Index |
S&P Municipal Bond Revenue Index | |||||
| One Year |
-0.79% | -0.38% | -0.75% | -0.04% | ||||
| Five Year |
1.39% | 1.44% | 1.72% | 1.68% | ||||
| Since Inception1 |
2.75% | 2.73% | 3.05% | 2.62% | ||||
| Cumulative Total Returns | ||||||||
| Net Asset Value | Market Value | Solactive Municipal Infrastructure Revenue Bond Index |
S&P Municipal Bond Revenue Index | |||||
| One Year |
-0.79% | -0.38% | -0.75% | -0.04% | ||||
| Five Year |
7.13% | 7.39% | 8.88% | 8.71% | ||||
| Since Inception1 |
31.18% | 30.92% | 34.98% | 29.51% | ||||
1 Total returns are calculated based on the commencement of operations, June 4, 2013 (“Inception”).
Past performance is no guarantee of future results. Current performance may be lower or higher than the performance data quoted. Performance data current to the most recent month-end is available at www.Xtrackers.com. Performance results assume reinvestment of all dividends and capital gain distributions and do not reflect the deduction of taxes that a shareholder would pay on fund distributions or on the sale of fund shares or redemption of fund creation units. The investment return and principal value of shares will vary with changes in market conditions. Shares may be worth more or less than their original cost when they are sold in the market or redeemed. Performance for certain funds may reflect a waiver of a portion of the unitary advisory fee. Without such waiver, performance would have been lower. The gross expense ratio of the Fund, as stated in the fee table of the prospectus dated October 1, 2022, was 0.15%, and may differ from the expense ratio disclosed in the Financial Highlights table in this report.
The Fund’s net asset value or “NAV” is calculated by dividing the value of the Fund’s total assets less total liabilities by the number of shares outstanding. The price used to calculate market return (“Market Price”) is determined by using the midpoint between the highest bid and the lowest offer on the primary stock exchange on which shares of a fund are listed for trading, as of the time that such fund’s NAV is calculated. Since shares of a fund may not have traded in the secondary market until after the fund’s inception, for the period from inception to the first day of secondary trading, the NAV of the fund is used as a proxy for the Market Price to calculate market returns. Market and NAV returns assume that dividends and capital gain distributions have been reinvested at Market Price and NAV, respectively.
An index is a statistical composite that tracks a specified financial market or sector. Unlike a fund, an index does not actually hold a portfolio of securities and therefore does not incur the expenses incurred by a fund. These expenses negatively impact fund performance. Also, market returns do not include brokerage commissions that may be payable on secondary market transactions. If brokerage commissions were included, market returns would be lower.
Generally accepted accounting principles require adjustments to be made to the net assets of the Fund at period end for financial reporting purposes only, and as such, the total return based on the unadjusted net asset value per share may differ from the total return reported in the financial highlights.
12
DBX ETF Trust
Performance Summary (Unaudited)
Xtrackers Municipal Infrastructure Revenue Bond ETF (RVNU) (Continued)
| Growth of an Assumed $10,000 Investment |

1 Based on Net Asset Value from commencement of operations, June 4, 2013.
| Sector Diversification* as of May 31, 2023 |
| Airport |
32.0% | |||
| Transportation |
27.0% | |||
| Water |
14.3% | |||
| General |
13.8% | |||
| Power |
10.4% | |||
| Utilities |
2.4% | |||
| Development |
0.1% | |||
|
|
|
|||
| Total |
100.0% |
Modified duration to worst as of May 31, 2023: 9.5 years
Modified duration to worst is the measure of sensitivity of the price of a bond to a change in interest rates, assuming worst case scenario.
| Quality* as of May 31, 2023 |
| Description | % of Market Value | |||
| AAA |
7.5% | |||
| AA |
54.3% | |||
| A |
36.5% | |||
| BBB |
1.7% | |||
|
|
|
|||
| Total |
100.0% | |||
The quality ratings represent the higher of Moody’s Investor Services, Inc. (“Moody’s”), S&P Global Ratings (S&P) or Fitch Ratings Inc. (Fitch) credit ratings. The ratings of Moody’s, S&P and Fitch represent their opinions as to the quality of the securities they rate. Credit quality measures a bond issuer’s ability to repay interest and principal in a timely manner and is measured on a scale that ranges from AAA (highest) to D (lowest). Ratings are relative and subjective and are not absolute standards of quality. Credit quality does not remove market risk and is subject to change.
* As a percent of total investments.
Portfolio holdings and characteristics are subject to change. For more complete details about the Fund’s investment portfolio see page 51.
13
DBX ETF Trust
Performance Summary (Unaudited)
Xtrackers MSCI All World ex US High Dividend Yield Equity ETF (HDAW)
The Xtrackers MSCI All World ex US High Dividend Yield Equity ETF (the “Fund”), using a “passive” or indexing investment approach, seeks investment results that correspond generally to the performance, before fees and expenses, of the MSCI ACWI ex USA High Dividend Yield Index (the “Underlying Index”). The Underlying Index is designed to reflect the performance of equities (excluding real estate investment trusts (“REITs”)) in developed and emerging stock markets (excluding the United States) in its parent index, the MSCI ACWI ex US Index, with higher dividend income and quality characteristics than average dividend yields of equities in the parent index, where such higher dividend income and quality characteristics are both sustainable and persistent. It is not possible to invest directly into an index.
| Performance as of May 31, 2023 |
| Average Annual Total Return | ||||||||
| Net Asset Value | Market Value | MSCI ACWI ex USA High Dividend Yield Index |
MSCI ACWI ex US Index | |||||
| One Year |
-1.68% | -1.00% | -1.58% | -1.41% | ||||
| Five Year |
2.59% | 2.61% | 2.60% | 2.22% | ||||
| Since Inception1 |
3.00% | 3.04% | 3.15% | 3.80% | ||||
| Cumulative Total Returns | ||||||||
| Net Asset Value | Market Value | MSCI ACWI ex USA High Dividend Yield Index |
MSCI ACWI ex US Index | |||||
| One Year |
-1.68% | -1.00% | -1.58% | -1.41% | ||||
| Five Year |
13.61% | 13.74% | 13.69% | 11.62% | ||||
| Since Inception1 |
25.98% | 26.35% | 27.43% | 33.79% | ||||
1 Total returns are calculated based on the commencement of operations, August 12, 2015 (“Inception”).
Prior to February 13, 2018, the Fund was known as Xtrackers MSCI All World ex US High Dividend Yield Hedged Equity ETF and had a different investment strategy. Past performance may have been different if the Fund’s current investment strategy had been in effect.
Past performance is no guarantee of future results. Current performance may be lower or higher than the performance data quoted. Performance data current to the most recent month-end is available at www.Xtrackers.com. Performance results assume reinvestment of all dividends and capital gain distributions and do not reflect the deduction of taxes that a shareholder would pay on fund distributions or on the sale of fund shares or redemption of fund creation units. The investment return and principal value of shares will vary with changes in market conditions. Shares may be worth more or less than their original cost when they are sold in the market or redeemed. Performance for certain funds may reflect a waiver of a portion of the unitary advisory fee. Without such waiver, performance would have been lower. The gross expense ratio of the Fund, as stated in the fee table of the prospectus dated October 1, 2022, was 0.20%, and may differ from the expense ratio disclosed in the Financial Highlights table in this report.
The Fund’s net asset value or “NAV” is calculated by dividing the value of the Fund’s total assets less total liabilities by the number of shares outstanding. The price used to calculate market return (“Market Price”) is determined by using the midpoint between the highest bid and the lowest offer on the primary stock exchange on which shares of a fund are listed for trading, as of the time that such fund’s NAV is calculated. Since shares of a fund may not have traded in the secondary market until after the fund’s inception, for the period from inception to the first day of secondary trading, the NAV of the fund is used as a proxy for the Market Price to calculate market returns. Market and NAV returns assume that dividends and capital gain distributions have been reinvested at Market Price and NAV, respectively.
An index is a statistical composite that tracks a specified financial market or sector. Unlike a fund, an index does not actually hold a portfolio of securities and therefore does not incur the expenses incurred by a fund. These expenses negatively impact fund performance. Also, market returns do not include brokerage commissions that may be payable on secondary market transactions. If brokerage commissions were included, market returns would be lower.
Generally accepted accounting principles require adjustments to be made to the net assets of the Fund at period end for financial reporting purposes only, and as such, the total return based on the unadjusted net asset value per share may differ from the total return reported in the financial highlights.
14
DBX ETF Trust
Performance Summary (Unaudited)
Xtrackers MSCI All World ex US High Dividend Yield Equity ETF (HDAW) (Continued)
| Growth of an Assumed $10,000 Investment |
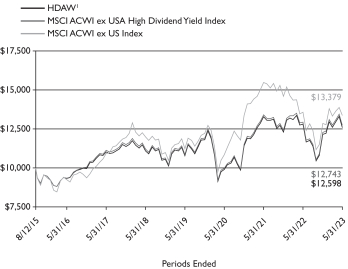
1 Based on Net Asset Value from commencement of operations, August 12, 2015.
| Sector Diversification* as of May 31, 2023 |
| Financials |
25.4% | |||
| Materials |
16.8% | |||
| Consumer Staples |
9.1% | |||
| Energy |
9.0% | |||
| Health Care |
8.3% | |||
| Industrials |
6.7% | |||
| Consumer Discretionary |
6.3% | |||
| Utilities |
6.1% | |||
| Information Technology |
6.0% | |||
| Communication Services |
3.6% | |||
| Real Estate |
2.7% | |||
|
|
|
|||
| Total |
100.0% |
| Ten Largest Equity Holdings as of May 31, 2023 (27.7% of Net Assets) |
| Description | % of Net Assets | |||
| Novartis AG (Switzerland) |
4.9% | |||
| BHP Group Ltd. (Australia) |
3.6% | |||
| TotalEnergies SE (France) |
3.5% | |||
| Unilever PLC (United Kingdom) |
3.3% | |||
| Sanofi (France) |
3.0% | |||
| Allianz SE (Germany) |
2.3% | |||
| Iberdrola SA (Spain) |
1.9% | |||
| Zurich Insurance Group AG (Switzerland) |
1.8% | |||
| Rio Tinto PLC (United Kingdom) |
1.8% | |||
| China Construction Bank Corp. (China) |
1.6% | |||
| Country Diversification* as of May 31, 2023 | ||
| Switzerland |
12.3% | |||
| France |
9.9% | |||
| United Kingdom |
9.3% | |||
| Australia |
8.0% | |||
| Taiwan |
7.6% | |||
| Japan |
6.3% | |||
| China |
6.3% | |||
| Germany |
5.1% | |||
| Canada |
4.0% | |||
| Hong Kong |
3.0% | |||
| Spain |
2.7% | |||
| Brazil |
2.3% | |||
| Netherlands |
2.2% | |||
| Singapore |
2.0% | |||
| Other |
19.0% | |||
|
|
|
|||
| Total |
100.0% |
* As a percent of total investments excluding exchange-traded funds, securities lending collateral and cash equilvants.
Portfolio holdings and characteristics are subject to change. For more complete details about the Fund’s investment portfolio see page 58.
15
DBX ETF Trust
Performance Summary (Unaudited)
Xtrackers MSCI EAFE High Dividend Yield Equity ETF (HDEF)
The Xtrackers MSCI EAFE High Dividend Yield Equity ETF (the “Fund”), using a “passive” or indexing investment approach, seeks investment results that correspond generally to the performance, before fees and expenses, of the MSCI EAFE High Dividend Yield Index (the “Underlying Index”). The Underlying Index is designed to reflect the performance of equities (excluding real estate investment trusts (“REITs”)) in developed markets in its parent index, the MSCI EAFE Index, with higher dividend income and quality characteristics than average dividend yields of equities in the parent index, where such higher dividend income and quality characteristics are both sustainable and persistent. It is not possible to invest directly into an index.
| Performance as of May 31, 2023 |
| Average Annual Total Return | ||||||||
| Net Asset Value | Market Value | MSCI EAFE High Dividend Yield Index |
MSCI EAFE Index | |||||
| One Year |
0.46% | 0.83% | 0.37% | 3.06% | ||||
| Five Year |
3.40% | 3.34% | 3.34% | 3.21% | ||||
| Since Inception1 |
3.49% | 3.55% | 3.59% | 3.92% | ||||
| Cumulative Total Returns | ||||||||
| Net Asset Value | Market Value | MSCI EAFE High Dividend Yield Index |
MSCI EAFE Index | |||||
| One Year |
0.46% | 0.83% | 0.37% | 3.06% | ||||
| Five Year |
18.19% | 17.86% | 17.87% | 17.11% | ||||
| Since Inception1 |
30.73% | 31.31% | 31.68% | 35.02% | ||||
1 Total returns are calculated based on the commencement of operations, August 12, 2015 (“Inception”).
Prior to February 13, 2018, the Fund was known as Xtrackers MSCI EAFE High Dividend Yield Hedged Equity ETF and had a different investment strategy. Past performance may have been different if the Fund’s current investment strategy had been in effect.
Past performance is no guarantee of future results. Current performance may be lower or higher than the performance data quoted. Performance data current to the most recent month-end is available at www.Xtrackers.com. Performance results assume reinvestment of all dividends and capital gain distributions and do not reflect the deduction of taxes that a shareholder would pay on fund distributions or on the sale of fund shares or redemption of fund creation units. The investment return and principal value of shares will vary with changes in market conditions. Shares may be worth more or less than their original cost when they are sold in the market or redeemed. Performance for certain funds may reflect a waiver of a portion of the unitary advisory fee. Without such waiver, performance would have been lower. The gross expense ratio of the Fund, as stated in the fee table of the prospectus dated October 1, 2022, was 0.20%, and may differ from the expense ratio disclosed in the Financial Highlights table in this report.
The Fund’s net asset value or “NAV” is calculated by dividing the value of the Fund’s total assets less total liabilities by the number of shares outstanding. The price used to calculate market return (“Market Price”) is determined by using the midpoint between the highest bid and the lowest offer on the primary stock exchange on which shares of a fund are listed for trading, as of the time that such fund’s NAV is calculated. Since shares of a fund may not have traded in the secondary market until after the fund’s inception, for the period from inception to the first day of secondary trading, the NAV of the fund is used as a proxy for the Market Price to calculate market returns. Market and NAV returns assume that dividends and capital gain distributions have been reinvested at Market Price and NAV, respectively.
An index is a statistical composite that tracks a specified financial market or sector. Unlike a fund, an index does not actually hold a portfolio of securities and therefore does not incur the expenses incurred by a fund. These expenses negatively impact fund performance. Also, market returns do not include brokerage commissions that may be payable on secondary market transactions. If brokerage commissions were included, market returns would be lower.
Generally accepted accounting principles require adjustments to be made to the net assets of the Fund at period end for financial reporting purposes only, and as such, the total return based on the unadjusted net asset value per share may differ from the total return reported in the financial highlights.
16
DBX ETF Trust
Performance Summary (Unaudited)
Xtrackers MSCI EAFE High Dividend Yield Equity ETF (HDEF) (Continued)
| Growth of an Assumed $10,000 Investment |
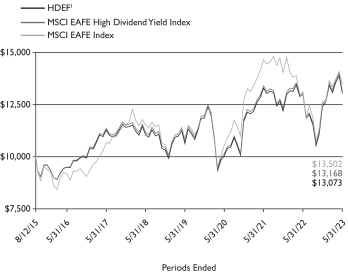
1 Based on Net Asset Value from commencement of operations, August 12, 2015.
| Sector Diversification* as of May 31, 2023 |
| Financials |
21.1% | |||
| Materials |
19.1% | |||
| Consumer Staples |
12.6% | |||
| Health Care |
9.8% | |||
| Consumer Discretionary |
8.2% | |||
| Energy |
8.0% | |||
| Utilities |
7.9% | |||
| Industrials |
7.2% | |||
| Communication Services |
3.1% | |||
| Real Estate |
2.6% | |||
| Information Technology |
0.4% | |||
|
|
|
|||
| Total |
100.0% |
| Ten Largest Equity Holdings as of May 31, 2023 (38.8% of Net Assets) |
| Description | % of Net Assets | |||
| Novartis AG (Switzerland) |
4.9% | |||
| Unilever PLC (United Kingdom) |
4.8% | |||
| TotalEnergies SE (France) |
4.8% | |||
| BHP Group Ltd. (Australia) |
4.7% | |||
| Sanofi (France) |
4.7% | |||
| Allianz SE (Germany) |
3.7% | |||
| Iberdrola SA (Spain) |
3.0% | |||
| Zurich Insurance Group AG (Switzerland) |
3.0% | |||
| Rio Tinto PLC (United Kingdom) |
2.9% | |||
| Glencore PLC (Switzerland) |
2.3% | |||
| Country Diversification* as of May 31, 2023 |
| Switzerland |
16.3% | |||
| United Kingdom |
15.1% | |||
| France |
15.0% | |||
| Australia |
11.9% | |||
| Japan |
10.2% | |||
| Germany |
8.2% | |||
| Spain |
3.9% | |||
| Netherlands |
3.6% | |||
| Singapore |
3.3% | |||
| Hong Kong |
2.7% | |||
| Sweden |
2.2% | |||
| Other |
7.6% | |||
|
|
|
|||
| Total |
100.0% |
* As a percent of total investments excluding securities lending collateral and cash equivalents.
Portfolio holdings and characteristics are subject to change. For more complete details about the Fund’s investment portfolio see page 65.
17
DBX ETF Trust
As a shareholder of one or more of the Funds, you incur two types of costs: (1) transaction costs, including brokerage commissions paid on purchases and sales of fund shares, and (2) ongoing costs, including unitary advisory fees and other Fund expenses. In the most recent six-month period the Funds, except for Xtrackers Municipal Infrastructure Revenue Bond ETF, limited these expenses; had they not done so, expenses would have been higher. The expense examples below are intended to help you understand your ongoing costs (in dollars) of investing in the Funds and to compare these costs with the ongoing costs of investing in other funds.
The examples in the tables are based on an investment of $1,000 invested at the beginning of the six month period and held for the entire period (December 1, 2022 to May 31, 2023).
Actual expenses
The first line in the following tables provides information about actual account values and actual expenses. You may use the information in this line, together with the amount you invested, to estimate the expenses that you paid over the period. Simply divide your account value by $1,000 (for example, an $8,600 account value divided by $1,000 = 8.6), then multiply the result by the number in the first line under the heading “Expenses Paid During the Period” to estimate the expenses you paid on your account during this period.
Hypothetical example for comparison purposes
The second line in the following tables provides information about hypothetical account values and hypothetical expenses based on the Funds’ actual expense ratios and an assumed rate of return of 5% per year before expenses (which is not the Funds’ actual return). The hypothetical account values and expenses may not be used to estimate the actual ending account balance or expenses you paid for the period. You may use this information to compare the ongoing costs of investing in the Fund and other funds. To do so, compare this 5% hypothetical example with the 5% hypothetical examples that appear in the shareholder reports of the other funds.
Please note that the expenses shown in the tables are meant to highlight your ongoing costs only, and do not reflect any transactional costs. Therefore the second line in the table is useful in comparing ongoing costs only, and will not help you determine the relative total costs of owning different funds. In addition, if these transactional costs were included, your costs would have been higher.
| Beginning Account Value December 1, 2022 |
Ending Account Value May 31, 2023 |
Annualized Expense Ratio |
Expenses Paid During the Period Per $1,000(1) |
|||||||||||||
| Xtrackers Bloomberg US Investment Grade Corporate ESG ETF |
|
|||||||||||||||
| Actual |
$ | 1,000.00 | $ | 1,021.30 | 0.15 | % | $ | 0.76 | ||||||||
| Hypothetical (5% return before expenses) |
$ | 1,000.00 | $ | 1,024.18 | 0.15 | % | $ | 0.76 | ||||||||
| Xtrackers J.P. Morgan ESG Emerging Markets Sovereign ETF |
|
|||||||||||||||
| Actual |
$ | 1,000.00 | $ | 1,019.70 | 0.35 | % | $ | 1.76 | ||||||||
| Hypothetical (5% return before expenses) |
$ | 1,000.00 | $ | 1,023.19 | 0.35 | % | $ | 1.77 | ||||||||
| Xtrackers J.P. Morgan ESG USD High Yield Corporate Bond ETF |
|
|||||||||||||||
| Actual |
$ | 1,000.00 | $ | 1,028.00 | 0.20 | % | $ | 1.01 | ||||||||
| Hypothetical (5% return before expenses) |
$ | 1,000.00 | $ | 1,023.93 | 0.20 | % | $ | 1.01 | ||||||||
| Xtrackers Municipal Infrastructure Revenue Bond ETF |
|
|||||||||||||||
| Actual |
$ | 1,000.00 | $ | 1,032.80 | 0.15 | % | $ | 0.76 | ||||||||
| Hypothetical (5% return before expenses) |
$ | 1,000.00 | $ | 1,024.18 | 0.15 | % | $ | 0.76 | ||||||||
| Xtrackers MSCI All World ex US High Dividend Yield Equity ETF |
|
|||||||||||||||
| Actual |
$ | 1,000.00 | $ | 1,035.70 | 0.20 | % | $ | 1.02 | ||||||||
| Hypothetical (5% return before expenses) |
$ | 1,000.00 | $ | 1,023.93 | 0.20 | % | $ | 1.01 | ||||||||
| Xtrackers MSCI EAFE High Dividend Yield Equity ETF |
|
|||||||||||||||
| Actual |
$ | 1,000.00 | $ | 1,052.50 | 0.20 | % | $ | 1.02 | ||||||||
| Hypothetical (5% return before expenses) |
$ | 1,000.00 | $ | 1,023.93 | 0.20 | % | $ | 1.01 | ||||||||
(1) Expenses are equal to each Fund’s annualized expense ratio, multiplied by the average account value over the period, multiplied by 182 (the number of days in the most recent six-month period), then divided by 365.
18
DBX ETF Trust
Schedule of Investments
Xtrackers Bloomberg US Investment Grade Corporate ESG ETF
May 31, 2023
| Principal |
Value |
|||||||
| CORPORATE BONDS — 98.7% | ||||||||
| Basic Materials — 1.9% | ||||||||
| Chemicals — 1.6% | ||||||||
| Dow Chemical Co., |
$ | 10,000 | $ | 8,313 | ||||
| DuPont de Nemours, Inc., |
5,000 | 4,908 | ||||||
| Ecolab, Inc., |
5,000 | 3,238 | ||||||
| LyondellBasell Industries NV, |
8,000 | 6,369 | ||||||
| Nutrien Ltd., |
10,000 | 8,755 | ||||||
| PPG Industries, Inc., |
6,000 | 5,411 | ||||||
| Sherwin-Williams Co., |
7,000 | 5,984 | ||||||
|
|
|
|||||||
| (Cost $53,303) |
42,978 | |||||||
|
|
|
|||||||
| Iron/Steel — 0.0% | ||||||||
| Steel Dynamics, Inc., |
2,000 | 1,914 | ||||||
|
|
|
|||||||
| Mining — 0.3% | ||||||||
| Newmont Corp., |
5,000 | 4,639 | ||||||
| Rio Tinto Finance USA Ltd., |
5,000 | 3,328 | ||||||
|
|
|
|||||||
| (Cost $10,038) |
7,967 | |||||||
|
|
|
|||||||
| Communications — 9.4% | ||||||||
| Internet — 2.1% | ||||||||
| Alibaba Group Holding Ltd., |
5,000 | 3,099 | ||||||
| Alphabet, Inc. |
5,000 | 4,681 | ||||||
| 2.05%, 8/15/50 |
5,000 | 3,073 | ||||||
| Amazon.com, Inc. |
5,000 | 4,536 | ||||||
| 1.65%, 5/12/28 |
5,000 | 4,415 | ||||||
| 1.50%, 6/3/30 |
5,000 | 4,133 | ||||||
| 2.10%, 5/12/31 |
10,000 | 8,462 | ||||||
| 3.10%, 5/12/51 |
10,000 | 7,337 | ||||||
| 4.10%, 4/13/62 |
5,000 | 4,241 | ||||||
| Booking Holdings, Inc., |
8,000 | 7,749 | ||||||
| eBay, Inc., |
5,000 | 4,732 | ||||||
|
|
|
|||||||
| (Cost $68,296) |
56,458 | |||||||
|
|
|
|||||||
| Media — 2.8% | ||||||||
| Comcast Corp. |
10,000 | 9,833 | ||||||
| 4.15%, 10/15/28 |
10,000 | 9,759 | ||||||
| 2.937%, 11/1/56 |
10,000 | 6,406 | ||||||
| 2.987%, 11/1/63 |
20,000 | 12,403 | ||||||
| Discovery Communications LLC |
5,000 | 3,966 | ||||||
| Principal |
Value |
|||||||
| Media (Continued) | ||||||||
| 4.65%, 5/15/50 |
$ | 5,000 | $ | 3,673 | ||||
| Fox Corp., |
5,000 | 4,805 | ||||||
| Paramount Global |
4,000 | 3,589 | ||||||
| 5.85%, 9/1/43 |
6,000 | 5,024 | ||||||
| TWDC Enterprises 18 Corp., MTN, |
5,000 | 4,722 | ||||||
| Walt Disney Co. |
4,000 | 3,839 | ||||||
| 2.75%, 9/1/49 |
8,000 | 5,334 | ||||||
| 3.60%, 1/13/51 |
5,000 | 3,856 | ||||||
|
|
|
|||||||
| (Cost $88,596) |
77,209 | |||||||
|
|
|
|||||||
| Telecommunications — 4.5% | ||||||||
| AT&T, Inc. |
10,000 | 9,681 | ||||||
| 3.50%, 6/1/41 |
30,000 | 22,896 | ||||||
| 3.65%, 9/15/59 |
10,000 | 6,860 | ||||||
| Bell Telephone Co. of Canada or Bell Canada, Series
US-4, |
3,000 | 2,261 | ||||||
| Corning, Inc., |
4,000 | 3,870 | ||||||
| Deutsche Telekom International Finance BV, |
5,000 | 6,021 | ||||||
| Rogers Communications, Inc. |
8,000 | 6,622 | ||||||
| 4.30%, 2/15/48 |
2,000 | 1,550 | ||||||
| Telefonica Europe BV, |
10,000 | 11,709 | ||||||
| Verizon Communications, Inc. |
5,000 | 4,873 | ||||||
| 4.016%, 12/3/29 |
8,000 | 7,538 | ||||||
| 2.355%, 3/15/32 |
10,000 | 8,070 | ||||||
| 4.40%, 11/1/34 |
10,000 | 9,276 | ||||||
| 2.875%, 11/20/50 |
15,000 | 9,592 | ||||||
| 3.55%, 3/22/51 |
5,000 | 3,638 | ||||||
| Vodafone Group PLC |
5,000 | 4,912 | ||||||
| 4.25%, 9/17/50 |
5,000 | 3,939 | ||||||
|
|
|
|||||||
| (Cost $140,868) |
123,308 | |||||||
|
|
|
|||||||
| Consumer, Cyclical — 7.5% | ||||||||
| Apparel — 0.4% | ||||||||
| NIKE, Inc., |
8,000 | 7,583 | ||||||
| VF Corp., |
5,000 | 4,711 | ||||||
|
|
|
|||||||
| (Cost $13,489) |
12,294 | |||||||
|
|
|
|||||||
| Auto Manufacturers — 1.6% | ||||||||
| American Honda Finance Corp., MTN, |
7,000 | 6,736 | ||||||
| General Motors Co. |
10,000 | 10,160 | ||||||
| 6.25%, 10/2/43 |
5,000 | 4,739 | ||||||
| General Motors Financial Co., Inc., |
12,000 | 10,780 | ||||||
| See Notes to Financial Statements. | 19 |
DBX ETF Trust
Schedule of Investments
Xtrackers Bloomberg US Investment Grade Corporate ESG ETF (Continued)
May 31, 2023
| Principal |
Value |
|||||||
| Auto Manufacturers (Continued) | ||||||||
| Toyota Motor Credit Corp. |
$ | 5,000 | $ | 4,764 | ||||
| 1.90%, 9/12/31 |
7,000 | 5,691 | ||||||
|
|
|
|||||||
| (Cost $45,072) |
42,870 | |||||||
|
|
|
|||||||
| Entertainment — 0.4% | ||||||||
| Warnermedia Holdings, Inc. |
10,000 | 8,746 | ||||||
| 5.141%, 3/15/52 |
4,000 | 3,128 | ||||||
|
|
|
|||||||
| (Cost $12,964) |
11,874 | |||||||
|
|
|
|||||||
| Home Builders — 0.2% | ||||||||
| NVR, Inc., |
5,000 | 4,383 | ||||||
|
|
|
|||||||
| Home Furnishings — 0.2% | ||||||||
| Whirlpool Corp., |
6,000 | 4,882 | ||||||
|
|
|
|||||||
| Leisure Time — 0.2% | ||||||||
| Harley-Davidson, Inc., |
5,000 | 4,770 | ||||||
|
|
|
|||||||
| Retail — 4.3% | ||||||||
| AutoNation, Inc., |
5,000 | 4,835 | ||||||
| Dollar General Corp., |
8,000 | 7,751 | ||||||
| Dollar Tree, Inc., |
7,000 | 5,780 | ||||||
| Home Depot, Inc. |
8,000 | 7,726 | ||||||
| 3.90%, 6/15/47 |
2,000 | 1,677 | ||||||
| 4.50%, 12/6/48 |
5,000 | 4,583 | ||||||
| 2.375%, 3/15/51 |
5,000 | 3,054 | ||||||
| 2.75%, 9/15/51 |
5,000 | 3,300 | ||||||
| Lowe’s Cos., Inc. |
10,000 | 9,395 | ||||||
| 2.625%, 4/1/31 |
10,000 | 8,454 | ||||||
| 2.80%, 9/15/41 |
5,000 | 3,442 | ||||||
| McDonald’s Corp. |
10,000 | 8,569 | ||||||
| MTN, 4.45%, 9/1/48 |
5,000 | 4,424 | ||||||
| Starbucks Corp. |
2,000 | 1,941 | ||||||
| 2.55%, 11/15/30 |
2,000 | 1,722 | ||||||
| 3.50%, 11/15/50 |
5,000 | 3,747 | ||||||
| Target Corp. |
7,000 | 6,680 | ||||||
| 2.95%, 1/15/52 |
3,000 | 2,088 | ||||||
| TJX Cos., Inc., |
8,000 | 7,457 | ||||||
| Walgreens Boots Alliance, Inc., |
5,000 | 3,646 | ||||||
| Walmart, Inc. |
10,000 | 9,013 | ||||||
| Principal |
Value |
|||||||
| Retail (Continued) | ||||||||
| 4.50%, 9/9/52 |
$ | 10,000 | $ | 9,600 | ||||
|
|
|
|||||||
| (Cost $139,608) |
118,884 | |||||||
|
|
|
|||||||
| Toys/Games/Hobbies — 0.2% | ||||||||
| Hasbro, Inc., |
6,000 | 5,477 | ||||||
|
|
|
|||||||
| Consumer, Non-cyclical — 17.8% | ||||||||
| Agriculture — 0.1% | ||||||||
| Bunge Ltd. Finance Corp., |
4,000 | 3,348 | ||||||
|
|
|
|||||||
| Beverages — 0.9% | ||||||||
| Coca-Cola Co., |
6,000 | 5,581 | ||||||
| Keurig Dr Pepper, Inc., |
7,000 | 6,513 | ||||||
| PepsiCo, Inc. |
10,000 | 8,336 | ||||||
| 2.75%, 10/21/51 |
5,000 | 3,563 | ||||||
|
|
|
|||||||
| (Cost $29,289) |
23,993 | |||||||
|
|
|
|||||||
| Biotechnology — 1.8% | ||||||||
| Amgen, Inc. |
10,000 | 10,085 | ||||||
| 5.60%, 3/2/43 |
10,000 | 9,918 | ||||||
| 4.663%, 6/15/51 |
4,000 | 3,523 | ||||||
| 3.00%, 1/15/52 |
3,000 | 1,968 | ||||||
| 5.65%, 3/2/53 |
5,000 | 5,001 | ||||||
| Baxalta, Inc., |
5,000 | 4,868 | ||||||
| Biogen, Inc., |
5,000 | 3,432 | ||||||
| Gilead Sciences, Inc. |
2,000 | 1,632 | ||||||
| 4.00%, 9/1/36 |
9,000 | 8,195 | ||||||
| 2.80%, 10/1/50 |
1,000 | 668 | ||||||
|
|
|
|||||||
| (Cost $56,799) |
49,290 | |||||||
|
|
|
|||||||
| Commercial Services — 1.0% | ||||||||
| Equifax, Inc., |
8,000 | 7,513 | ||||||
| Global Payments, Inc., |
5,000 | 4,672 | ||||||
| PayPal Holdings, Inc., |
5,000 | 4,459 | ||||||
| Quanta Services, Inc., |
5,000 | 4,246 | ||||||
| RELX Capital, Inc., |
5,000 | 4,803 | ||||||
| S&P Global, Inc., |
5,000 | 2,805 | ||||||
|
|
|
|||||||
| (Cost $32,992) |
28,498 | |||||||
|
|
|
|||||||
| Cosmetics/Personal Care — 0.8% | ||||||||
| Colgate-Palmolive Co., MTN, |
3,000 | 2,727 | ||||||
| See Notes to Financial Statements. | 20 |
DBX ETF Trust
Schedule of Investments
Xtrackers Bloomberg US Investment Grade Corporate ESG ETF (Continued)
May 31, 2023
| Principal |
Value |
|||||||
| Cosmetics/Personal Care (Continued) | ||||||||
| Estee Lauder Cos., Inc., |
$ | 5,000 | $ | 4,797 | ||||
| Procter & Gamble Co., |
11,000 | 10,478 | ||||||
| Unilever Capital Corp., Series 30Y, |
5,000 | 3,386 | ||||||
|
|
|
|||||||
| (Cost $24,756) |
21,388 | |||||||
|
|
|
|||||||
| Food — 2.0% | ||||||||
| Campbell Soup Co., |
5,000 | 4,859 | ||||||
| Conagra Brands, Inc., |
5,000 | 4,657 | ||||||
| General Mills, Inc., |
6,000 | 5,730 | ||||||
| Hershey Co., |
4,000 | 2,701 | ||||||
| Kellogg Co., |
5,000 | 4,176 | ||||||
| Kraft Heinz Foods Co. |
5,000 | 4,790 | ||||||
| 4.875%, 10/1/49 |
5,000 | 4,512 | ||||||
| Kroger Co. |
3,000 | 2,588 | ||||||
| 3.95%, 1/15/50 |
3,000 | 2,383 | ||||||
| McCormick & Co., Inc., |
5,000 | 4,716 | ||||||
| Mondelez International, Inc., |
5,000 | 4,411 | ||||||
| Sysco Corp., |
5,000 | 5,578 | ||||||
| Tyson Foods, Inc., |
5,000 | 4,101 | ||||||
|
|
|
|||||||
| (Cost $63,414) |
55,202 | |||||||
|
|
|
|||||||
| Healthcare-Products — 0.7% | ||||||||
| Baxter International, Inc., |
7,000 | 6,494 | ||||||
| DH Europe Finance II SARL, |
5,000 | 4,452 | ||||||
| Revvity, Inc., |
5,000 | 3,581 | ||||||
| Thermo Fisher Scientific, Inc., |
4,000 | 3,272 | ||||||
|
|
|
|||||||
| (Cost $21,758) |
17,799 | |||||||
|
|
|
|||||||
| Healthcare-Services — 3.2% | ||||||||
| Aetna, Inc., |
5,000 | 3,832 | ||||||
| Centene Corp., |
10,000 | 8,593 | ||||||
| Elevance Health, Inc. |
10,000 | 8,444 | ||||||
| 3.125%, 5/15/50 |
5,000 | 3,456 | ||||||
| HCA, Inc. |
8,000 | 7,950 | ||||||
| 5.625%, 9/1/28 |
6,000 | 6,051 | ||||||
| 4.125%, 6/15/29 |
2,000 | 1,860 | ||||||
| Principal |
Value |
|||||||
| Healthcare-Services (Continued) | ||||||||
| 3.50%, 9/1/30 |
$ | 5,000 | $ | 4,419 | ||||
| 5.25%, 6/15/49 |
3,000 | 2,648 | ||||||
| Humana, Inc., |
8,000 | 7,163 | ||||||
| Quest Diagnostics, Inc. |
5,000 | 4,420 | ||||||
| 2.80%, 6/30/31 |
3,000 | 2,586 | ||||||
| UnitedHealth Group, Inc. |
15,000 | 15,545 | ||||||
| 4.75%, 5/15/52 |
6,000 | 5,621 | ||||||
| 5.875%, 2/15/53 |
5,000 | 5,475 | ||||||
|
|
|
|||||||
| (Cost $96,522) |
88,063 | |||||||
|
|
|
|||||||
| Household Products/Wares — 0.2% | ||||||||
| Kimberly-Clark Corp., |
5,000 | 4,783 | ||||||
|
|
|
|||||||
| Pharmaceuticals — 7.1% | ||||||||
| AbbVie, Inc. |
5,000 | 4,890 | ||||||
| 3.60%, 5/14/25 |
10,000 | 9,743 | ||||||
| 4.70%, 5/14/45 |
5,000 | 4,504 | ||||||
| 4.25%, 11/21/49 |
12,000 | 10,175 | ||||||
| Astrazeneca Finance LLC, |
5,000 | 4,778 | ||||||
| AstraZeneca PLC, |
3,000 | 2,189 | ||||||
| Becton Dickinson and Co., |
5,000 | 4,500 | ||||||
| Bristol-Myers Squibb Co. |
5,000 | 4,573 | ||||||
| 3.40%, 7/26/29 |
6,000 | 5,655 | ||||||
| 4.25%, 10/26/49 |
8,000 | 6,981 | ||||||
| Cigna Group |
15,000 | 14,624 | ||||||
| 4.90%, 12/15/48 |
4,000 | 3,643 | ||||||
| CVS Health Corp. |
7,000 | 6,854 | ||||||
| 4.30%, 3/25/28 |
3,000 | 2,923 | ||||||
| 3.25%, 8/15/29 |
9,000 | 8,155 | ||||||
| 4.78%, 3/25/38 |
5,000 | 4,629 | ||||||
| 5.05%, 3/25/48 |
8,000 | 7,231 | ||||||
| Eli Lilly & Co. |
5,000 | 4,834 | ||||||
| 3.95%, 3/15/49 |
5,000 | 4,423 | ||||||
| GlaxoSmithKline Capital, Inc., |
5,000 | 4,865 | ||||||
| Johnson & Johnson |
10,000 | 11,485 | ||||||
| 3.50%, 1/15/48 |
3,000 | 2,520 | ||||||
| McKesson Corp., |
5,000 | 4,454 | ||||||
| Merck & Co., Inc. |
10,000 | 8,387 | ||||||
| 4.00%, 3/7/49 |
3,000 | 2,622 | ||||||
| Novartis Capital Corp., |
10,000 | 9,255 | ||||||
| See Notes to Financial Statements. | 21 |
DBX ETF Trust
Schedule of Investments
Xtrackers Bloomberg US Investment Grade Corporate ESG ETF (Continued)
May 31, 2023
| Principal |
Value |
|||||||
| Pharmaceuticals (Continued) | ||||||||
| Pfizer Investment Enterprises Pte Ltd., |
$ | 10,000 | $ | 10,016 | ||||
| Pfizer, Inc. |
5,000 | 4,767 | ||||||
| 7.20%, 3/15/39 |
10,000 | 12,444 | ||||||
| Sanofi, |
3,000 | 2,931 | ||||||
| Zoetis, Inc. |
3,000 | 2,507 | ||||||
| 4.70%, 2/1/43 |
2,000 | 1,834 | ||||||
|
|
|
|||||||
| (Cost $218,067) |
193,391 | |||||||
|
|
|
|||||||
| Energy — 3.8% | ||||||||
| Oil & Gas — 0.5% | ||||||||
| Marathon Petroleum Corp. |
2,000 | 1,882 | ||||||
| 4.50%, 4/1/48 |
3,000 | 2,332 | ||||||
| Phillips 66, |
5,000 | 5,132 | ||||||
| Valero Energy Corp., |
5,000 | 3,437 | ||||||
|
|
|
|||||||
| (Cost $16,440) |
12,783 | |||||||
|
|
|
|||||||
| Oil & Gas Services — 0.4% | ||||||||
| Baker Hughes Holdings LLC / Baker Hughes Co.-Obligor, Inc., |
6,000 | 4,717 | ||||||
| Halliburton Co., |
8,000 | 7,085 | ||||||
|
|
|
|||||||
| (Cost $12,602) |
11,802 | |||||||
|
|
|
|||||||
| Pipelines — 2.9% | ||||||||
| Enbridge, Inc. |
5,000 | 4,772 | ||||||
| 3.40%, 8/1/51 |
5,000 | 3,383 | ||||||
| Enterprise Products Operating LLC |
5,000 | 4,400 | ||||||
| 3.30%, 2/15/53 |
5,000 | 3,493 | ||||||
| Series E, 5.25%, 8/16/77 |
5,000 | 4,337 | ||||||
| MPLX LP, |
15,000 | 13,684 | ||||||
| ONEOK, Inc. |
5,000 | 4,825 | ||||||
| 5.20%, 7/15/48 |
5,000 | 4,176 | ||||||
| Sabine Pass Liquefaction LLC |
10,000 | 9,886 | ||||||
| 4.50%, 5/15/30 |
5,000 | 4,732 | ||||||
| TransCanada PipeLines Ltd. |
2,000 | 1,860 | ||||||
| 7.625%, 1/15/39 |
5,000 | 5,716 | ||||||
| 4.875%, 5/15/48 |
3,000 | 2,633 | ||||||
| Williams Cos., Inc. |
1,000 | 972 | ||||||
| 3.50%, 11/15/30 |
5,000 | 4,486 | ||||||
| 2.60%, 3/15/31 |
5,000 | 4,137 | ||||||
|
|
|
|||||||
| (Cost $89,867) |
77,492 | |||||||
|
|
|
|||||||
| Principal |
Value |
|||||||
| Financial — 31.7% | ||||||||
| Banks — 22.7% | ||||||||
| Banco Santander SA, |
$ | 10,000 | $ | 8,336 | ||||
| Bank of America Corp. |
15,000 | 14,076 | ||||||
| MTN, 1.197%, 10/24/26 |
20,000 | 18,056 | ||||||
| 5.08%, 1/20/27 |
10,000 | 9,929 | ||||||
| 3.419%, 12/20/28 |
20,000 | 18,425 | ||||||
| MTN, 4.083%, 3/20/51 |
10,000 | 8,046 | ||||||
| MTN, 2.831%, 10/24/51 |
10,000 | 6,402 | ||||||
| 2.972%, 7/21/52 |
10,000 | 6,668 | ||||||
| Bank of Montreal, MTN, |
10,000 | 8,844 | ||||||
| Bank of New York Mellon Corp., MTN, |
15,000 | 14,614 | ||||||
| Bank of Nova Scotia, |
5,000 | 4,871 | ||||||
| Barclays PLC, |
25,000 | 19,906 | ||||||
| Canadian Imperial Bank of Commerce, |
10,000 | 9,047 | ||||||
| Citigroup, Inc. |
5,000 | 4,860 | ||||||
| 3.30%, 4/27/25 |
5,000 | 4,855 | ||||||
| 4.45%, 9/29/27 |
15,000 | 14,424 | ||||||
| 2.976%, 11/5/30 |
5,000 | 4,338 | ||||||
| 2.572%, 6/3/31 |
10,000 | 8,383 | ||||||
| 2.561%, 5/1/32 |
5,000 | 4,108 | ||||||
| 4.75%, 5/18/46 |
5,000 | 4,221 | ||||||
| Cooperatieve Rabobank UA, |
5,000 | 5,217 | ||||||
| Credit Suisse AG/New York NY, MTN, |
5,000 | 4,794 | ||||||
| Credit Suisse Group AG, |
5,000 | 4,726 | ||||||
| Deutsche Bank AG, |
5,000 | 4,866 | ||||||
| Deutsche Bank AG/New York NY, |
15,000 | 11,905 | ||||||
| Fifth Third Bancorp, |
5,000 | 4,481 | ||||||
| Goldman Sachs Group, Inc. MTN, |
10,000 | 9,846 | ||||||
| 3.50%, 1/23/25 |
10,000 | 9,709 | ||||||
| 1.542%, 9/10/27 |
5,000 | 4,412 | ||||||
| 2.615%, 4/22/32 |
7,000 | 5,777 | ||||||
| 2.65%, 10/21/32 |
8,000 | 6,561 | ||||||
| 6.25%, 2/1/41 |
10,000 | 10,703 | ||||||
| HSBC Holdings PLC |
10,000 | 8,881 | ||||||
| 6.50%, 9/15/37 |
10,000 | 10,438 | ||||||
| 6.10%, 1/14/42 |
5,000 | 5,286 | ||||||
| HSBC USA, Inc., |
15,000 | 14,648 | ||||||
| ING Groep NV, |
10,000 | 9,547 | ||||||
| See Notes to Financial Statements. | 22 |
DBX ETF Trust
Schedule of Investments
Xtrackers Bloomberg US Investment Grade Corporate ESG ETF (Continued)
May 31, 2023
| Principal |
Value |
|||||||
| Banks (Continued) | ||||||||
| JPMorgan Chase & Co. |
$ | 15,000 | $ | 14,116 | ||||
| 1.578%, 4/22/27 |
15,000 | 13,483 | ||||||
| 2.522%, 4/22/31 |
15,000 | 12,756 | ||||||
| 2.956%, 5/13/31 |
10,000 | 8,558 | ||||||
| 4.912%, 7/25/33 |
15,000 | 14,712 | ||||||
| 3.964%, 11/15/48 |
10,000 | 8,123 | ||||||
| KeyCorp |
5,000 | 4,375 | ||||||
| MTN, 2.55%, 10/1/29 |
5,000 | 3,855 | ||||||
| Lloyds Banking Group PLC, |
10,000 | 8,943 | ||||||
| Mitsubishi UFJ Financial Group, Inc. |
10,000 | 9,364 | ||||||
| 4.05%, 9/11/28 |
12,000 | 11,534 | ||||||
| 3.741%, 3/7/29 |
5,000 | 4,663 | ||||||
| Mizuho Financial Group, Inc., |
10,000 | 7,908 | ||||||
| Morgan Stanley |
5,000 | 4,889 | ||||||
| 0.79%, 5/30/25 |
15,000 | 14,225 | ||||||
| MTN, 2.72%, 7/22/25 |
5,000 | 4,824 | ||||||
| MTN, 3.125%, 7/27/26 |
5,000 | 4,719 | ||||||
| GMTN, 4.35%, 9/8/26 |
5,000 | 4,879 | ||||||
| GMTN, 2.699%, 1/22/31 |
15,000 | 12,842 | ||||||
| 4.30%, 1/27/45 |
5,000 | 4,337 | ||||||
| 4.375%, 1/22/47 |
5,000 | 4,359 | ||||||
| NatWest Group PLC |
5,000 | 4,917 | ||||||
| 1.642%, 6/14/27 |
7,000 | 6,201 | ||||||
| PNC Financial Services Group, Inc., |
5,000 | 4,901 | ||||||
| Royal Bank of Canada, GMTN, |
20,000 | 19,149 | ||||||
| Santander Holdings USA, Inc., |
10,000 | 9,514 | ||||||
| Sumitomo Mitsui Financial Group, Inc. |
5,000 | 4,630 | ||||||
| 3.364%, 7/12/27 |
15,000 | 14,156 | ||||||
| 3.05%, 1/14/42 |
5,000 | 3,642 | ||||||
| Toronto-Dominion Bank, MTN, |
10,000 | 8,919 | ||||||
| Truist Financial Corp., MTN, |
15,000 | 14,429 | ||||||
| US Bancorp |
10,000 | 9,616 | ||||||
| MTN, 1.375%, 7/22/30 |
6,000 | 4,570 | ||||||
| Westpac Banking Corp., |
15,000 | 13,289 | ||||||
|
|
|
|||||||
| (Cost $691,196) |
619,603 | |||||||
|
|
|
|||||||
| Diversified Financial Services — 4.0% | ||||||||
| AerCap Ireland Capital DAC / AerCap Global Aviation Trust |
6,000 | 5,770 | ||||||
| 2.45%, 10/29/26 |
10,000 | 8,926 | ||||||
| Air Lease Corp., |
10,000 | 8,840 | ||||||
| Principal |
Value |
|||||||
| Diversified Financial Services (Continued) | ||||||||
| Ally Financial, Inc., |
$ | 5,000 | $ | 5,221 | ||||
| American Express Co. |
15,000 | 13,473 | ||||||
| 4.05%, 12/3/42 |
3,000 | 2,607 | ||||||
| Capital One Financial Corp., |
10,000 | 9,720 | ||||||
| Charles Schwab Corp., |
10,000 | 9,699 | ||||||
| CME Group, Inc., |
8,000 | 7,782 | ||||||
| Intercontinental Exchange, Inc. |
5,000 | 4,878 | ||||||
| 3.00%, 9/15/60 |
5,000 | 3,174 | ||||||
| Mastercard, Inc., |
6,000 | 5,098 | ||||||
| Nomura Holdings, Inc., |
10,000 | 8,239 | ||||||
| Visa, Inc. |
5,000 | 4,838 | ||||||
| 2.75%, 9/15/27 |
5,000 | 4,717 | ||||||
| 3.65%, 9/15/47 |
4,000 | 3,390 | ||||||
| Voya Financial, Inc., |
5,000 | 4,102 | ||||||
|
|
|
|||||||
| (Cost $127,745) |
110,474 | |||||||
|
|
|
|||||||
| Insurance — 1.9% | ||||||||
| Aflac, Inc., |
5,000 | 4,621 | ||||||
| Allstate Corp., |
5,000 | 4,087 | ||||||
| American International Group, Inc. |
5,000 | 4,451 | ||||||
| 4.375%, 6/30/50 |
3,000 | 2,485 | ||||||
| AXIS Specialty Finance LLC, |
5,000 | 4,004 | ||||||
| Chubb INA Holdings, Inc., |
5,000 | 4,482 | ||||||
| Manulife Financial Corp., |
5,000 | 4,877 | ||||||
| Marsh & McLennan Cos., |
5,000 | 4,182 | ||||||
| MetLife, Inc., |
5,000 | 4,382 | ||||||
| Progressive Corp., |
3,000 | 2,525 | ||||||
| Prudential Financial, Inc., |
8,000 | 6,801 | ||||||
| Willis North America, Inc., |
5,000 | 4,272 | ||||||
|
|
|
|||||||
| (Cost $62,963) |
51,169 | |||||||
|
|
|
|||||||
| Real Estate Investment Trusts — 3.1% | ||||||||
| Alexandria Real Estate Equities, Inc., |
8,000 | 6,923 | ||||||
| American Tower Corp. |
2,000 | 1,846 | ||||||
| 2.90%, 1/15/30 |
10,000 | 8,688 | ||||||
| See Notes to Financial Statements. | 23 |
DBX ETF Trust
Schedule of Investments
Xtrackers Bloomberg US Investment Grade Corporate ESG ETF (Continued)
May 31, 2023
| Principal |
Value |
|||||||
| Real Estate Investment Trusts (Continued) | ||||||||
| AvalonBay Communities, Inc., |
$ | 5,000 | $ | 4,037 | ||||
| Boston Properties LP, |
5,000 | 4,147 | ||||||
| Crown Castle, Inc. |
2,000 | 1,885 | ||||||
| 3.80%, 2/15/28 |
6,000 | 5,647 | ||||||
| Digital Realty Trust LP, |
6,000 | 5,227 | ||||||
| Healthpeak OP LLC, |
5,000 | 4,367 | ||||||
| Host Hotels & Resorts LP, Series J, |
6,000 | 4,717 | ||||||
| Kilroy Realty LP, |
8,000 | 5,304 | ||||||
| Omega Healthcare Investors, Inc., |
10,000 | 9,612 | ||||||
| Prologis LP, |
5,000 | 4,865 | ||||||
| Realty Income Corp., |
5,000 | 4,377 | ||||||
| Simon Property Group LP, |
5,000 | 3,994 | ||||||
| Ventas Realty LP, |
6,000 | 5,665 | ||||||
| Welltower OP LLC, |
5,000 | 4,765 | ||||||
|
|
|
|||||||
| (Cost $99,544) |
86,066 | |||||||
|
|
|
|||||||
| Industrial — 6.5% | ||||||||
| Building Materials — 0.6% | ||||||||
| Carrier Global Corp. |
3,000 | 2,751 | ||||||
| 3.577%, 4/5/50 |
6,000 | 4,324 | ||||||
| Martin Marietta Materials, Inc., |
8,000 | 6,549 | ||||||
| Masco Corp., |
5,000 | 3,969 | ||||||
|
|
|
|||||||
| (Cost $21,269) |
17,593 | |||||||
|
|
|
|||||||
| Electrical Components & Equipment — 0.1% | ||||||||
| Emerson Electric Co., |
5,000 | 3,272 | ||||||
|
|
|
|||||||
| Electronics — 0.8% | ||||||||
| Agilent Technologies, Inc., |
5,000 | 4,145 | ||||||
| Amphenol Corp., |
6,000 | 4,909 | ||||||
| Flex Ltd., |
3,000 | 2,893 | ||||||
| Fortive Corp., |
5,000 | 4,746 | ||||||
| Vontier Corp., |
5,000 | 3,950 | ||||||
|
|
|
|||||||
| (Cost $24,216) |
20,643 | |||||||
|
|
|
|||||||
| Principal |
Value |
|||||||
| Environmental Control — 0.4% | ||||||||
| Republic Services, Inc., |
$ | 5,000 | $ | 4,295 | ||||
| Waste Connections, Inc., |
5,000 | 4,352 | ||||||
| Waste Management, Inc., |
3,000 | 2,842 | ||||||
|
|
|
|||||||
| (Cost $13,760) |
11,489 | |||||||
|
|
|
|||||||
| Hand/Machine Tools — 0.2% | ||||||||
| Stanley Black & Decker, Inc., |
6,000 | 4,500 | ||||||
|
|
|
|||||||
| Machinery-Construction & Mining — 0.4% | ||||||||
| Caterpillar Financial Services Corp., |
5,000 | 4,527 | ||||||
| Caterpillar, Inc., |
7,000 | 5,430 | ||||||
|
|
|
|||||||
| (Cost $11,636) |
9,957 | |||||||
|
|
|
|||||||
| Machinery-Diversified — 0.8% | ||||||||
| CNH Industrial Capital LLC, |
7,000 | 6,424 | ||||||
| Deere & Co., |
8,000 | 7,168 | ||||||
| John Deere Capital Corp., |
10,000 | 9,578 | ||||||
|
|
|
|||||||
| (Cost $26,460) |
23,170 | |||||||
|
|
|
|||||||
| Miscellaneous Manufacturing — 0.7% | ||||||||
| 3M Co., MTN, |
5,000 | 4,008 | ||||||
| Parker-Hannifin Corp., |
10,000 | 9,176 | ||||||
| Teledyne Technologies, Inc., |
5,000 | 4,556 | ||||||
|
|
|
|||||||
| (Cost $21,235) |
17,740 | |||||||
|
|
|
|||||||
| Packaging & Containers — 0.2% | ||||||||
| WRKCo, Inc., |
5,000 | 4,839 | ||||||
|
|
|
|||||||
| Transportation — 2.3% | ||||||||
| Canadian National Railway Co. |
5,000 | 4,760 | ||||||
| 2.45%, 5/1/50 |
5,000 | 3,143 | ||||||
| Canadian Pacific Railway Co. |
5,000 | 3,778 | ||||||
| 3.10%, 12/2/51 |
3,000 | 2,078 | ||||||
| CSX Corp., |
10,000 | 8,677 | ||||||
| FedEx Corp. |
5,000 | 4,818 | ||||||
| 5.25%, 5/15/50 |
5,000 | 4,738 | ||||||
| Norfolk Southern Corp., |
6,000 | 4,884 | ||||||
| Ryder System, Inc., MTN, |
5,000 | 4,612 | ||||||
| See Notes to Financial Statements. | 24 |
DBX ETF Trust
Schedule of Investments
Xtrackers Bloomberg US Investment Grade Corporate ESG ETF (Continued)
May 31, 2023
| Principal |
Value |
|||||||
| Transportation (Continued) | ||||||||
| Union Pacific Corp. |
$ | 10,000 | $ | 8,528 | ||||
| 3.839%, 3/20/60 |
9,000 | 7,010 | ||||||
| United Parcel Service, Inc., |
7,000 | 5,804 | ||||||
|
|
|
|||||||
| (Cost $77,340) |
62,830 | |||||||
|
|
|
|||||||
| Technology — 11.7% | ||||||||
| Computers — 4.0% | ||||||||
| Apple, Inc. |
10,000 | 9,726 | ||||||
| 3.20%, 5/13/25 |
12,000 | 11,712 | ||||||
| 3.85%, 8/4/46 |
15,000 | 13,158 | ||||||
| 3.75%, 11/13/47 |
15,000 | 12,895 | ||||||
| 2.95%, 9/11/49 |
2,000 | 1,475 | ||||||
| Dell International LLC / EMC Corp., |
15,000 | 15,360 | ||||||
| Hewlett Packard Enterprise Co. |
7,000 | 6,423 | ||||||
| 6.35%, 10/15/45 |
3,000 | 3,065 | ||||||
| HP, Inc., |
10,000 | 8,769 | ||||||
| International Business Machines Corp. |
15,000 | 14,021 | ||||||
| 4.25%, 5/15/49 |
5,000 | 4,201 | ||||||
| NetApp, Inc., |
5,000 | 4,665 | ||||||
| Western Digital Corp., |
5,000 | 4,042 | ||||||
|
|
|
|||||||
| (Cost $123,512) |
109,512 | |||||||
|
|
|
|||||||
| Semiconductors — 3.4% | ||||||||
| Analog Devices, Inc., |
5,000 | 3,506 | ||||||
| Applied Materials, Inc., |
3,000 | 2,098 | ||||||
| Broadcom, Inc. |
12,000 | 9,157 | ||||||
| 144A,3.187%, 11/15/36 |
10,000 | 7,502 | ||||||
| Intel Corp. |
15,000 | 14,685 | ||||||
| 4.10%, 5/11/47 |
5,000 | 4,084 | ||||||
| 3.05%, 8/12/51 |
6,000 | 3,948 | ||||||
| 3.10%, 2/15/60 |
7,000 | 4,318 | ||||||
| Lam Research Corp., |
2,000 | 1,913 | ||||||
| Marvell Technology, Inc., |
6,000 | 5,423 | ||||||
| Micron Technology, Inc., |
10,000 | 7,903 | ||||||
| NVIDIA Corp., |
4,000 | 3,167 | ||||||
| NXP BV / NXP Funding LLC / NXP USA, Inc., |
5,000 | 4,642 | ||||||
| QUALCOMM, Inc. |
5,000 | 4,875 | ||||||
| 1.65%, 5/20/32 |
10,000 | 7,841 | ||||||
| Principal |
Value |
|||||||
| Semiconductors (Continued) | ||||||||
| Texas Instruments, Inc., |
$ | 5,000 | $ | 4,447 | ||||
| TSMC Arizona Corp., |
5,000 | 4,226 | ||||||
|
|
|
|||||||
| (Cost $111,519) |
93,735 | |||||||
|
|
|
|||||||
| Software — 4.3% | ||||||||
| Activision Blizzard, Inc. |
7,000 | 6,730 | ||||||
| 2.50%, 9/15/50 |
2,000 | 1,265 | ||||||
| Adobe, Inc., |
7,000 | 6,477 | ||||||
| Autodesk, Inc., |
5,000 | 4,115 | ||||||
| Broadridge Financial Solutions, Inc., |
5,000 | 4,102 | ||||||
| Electronic Arts, Inc., |
5,000 | 4,068 | ||||||
| Fidelity National Information Services, Inc., |
7,000 | 5,618 | ||||||
| Fiserv, Inc., |
10,000 | 9,659 | ||||||
| Microsoft Corp. |
10,000 | 9,486 | ||||||
| 2.525%, 6/1/50 |
10,000 | 6,897 | ||||||
| 2.921%, 3/17/52 |
10,000 | 7,404 | ||||||
| 3.95%, 8/8/56 |
2,000 | 1,789 | ||||||
| Oracle Corp. |
5,000 | 4,769 | ||||||
| 2.95%, 5/15/25 |
5,000 | 4,799 | ||||||
| 2.80%, 4/1/27 |
5,000 | 4,615 | ||||||
| 2.95%, 4/1/30 |
9,000 | 7,881 | ||||||
| 4.30%, 7/8/34 |
15,000 | 13,522 | ||||||
| 3.60%, 4/1/50 |
7,000 | 4,840 | ||||||
| 3.95%, 3/25/51 |
5,000 | 3,671 | ||||||
| VMware, Inc., |
6,000 | 5,711 | ||||||
|
|
|
|||||||
| (Cost $137,674) |
117,418 | |||||||
|
|
|
|||||||
| Utilities — 8.4% | ||||||||
| Electric — 6.6% | ||||||||
| AEP Texas, Inc., |
4,000 | 3,768 | ||||||
| Avangrid, Inc., |
7,000 | 6,703 | ||||||
| Baltimore Gas and Electric Co., |
5,000 | 3,803 | ||||||
| CenterPoint Energy Houston Electric LLC |
5,000 | 4,655 | ||||||
| Series AF, 3.35%, 4/1/51 |
5,000 | 3,764 | ||||||
| Commonwealth Edison Co. |
10,000 | 9,388 | ||||||
| 4.00%, 3/1/48 |
5,000 | 4,152 | ||||||
| 3.00%, 3/1/50 |
6,000 | 4,119 | ||||||
| Series 130, 3.125%, 3/15/51 |
15,000 | 10,431 | ||||||
| Consolidated Edison Co. of New York, Inc. |
10,000 | 10,388 | ||||||
| See Notes to Financial Statements. | 25 |
DBX ETF Trust
Schedule of Investments
Xtrackers Bloomberg US Investment Grade Corporate ESG ETF (Continued)
May 31, 2023
| Principal |
Value |
|||||||
| Electric (Continued) | ||||||||
| 3.20%, 12/1/51 |
$ | 5,000 | $ | 3,445 | ||||
| 3.60%, 6/15/61 |
5,000 | 3,584 | ||||||
| Consumers Energy Co., |
6,000 | 5,052 | ||||||
| Eversource Energy Series L, |
15,000 | 14,494 | ||||||
| 3.45%, 1/15/50 |
13,000 | 9,425 | ||||||
| Exelon Corp., |
10,000 | 9,569 | ||||||
| ITC Holdings Corp., |
10,000 | 9,385 | ||||||
| National Rural Utilities Cooperative Finance Corp., |
10,000 | 8,498 | ||||||
| NSTAR Electric Co., |
2,000 | 1,386 | ||||||
| Ohio Power Co., Series Q, |
5,000 | 3,966 | ||||||
| Oncor Electric Delivery Co. LLC, |
5,000 | 4,437 | ||||||
| PPL Electric Utilities Corp., |
10,000 | 7,050 | ||||||
| Public Service Electric and Gas Co. |
||||||||
| MTN, 1.90%, 8/15/31 |
10,000 | 8,123 | ||||||
| MTN, 2.05%, 8/1/50 |
5,000 | 2,857 | ||||||
| San Diego Gas & Electric Co. |
||||||||
| Series VVV, 1.70%, 10/1/30 |
10,000 | 8,087 | ||||||
| Series RRR, 3.75%, 6/1/47 |
10,000 | 7,842 | ||||||
| Sempra Energy |
8,000 | 7,458 | ||||||
| 4.125%, 4/1/52 |
5,000 | 4,047 | ||||||
|
|
|
|||||||
| (Cost $217,815) |
179,876 | |||||||
|
|
|
|||||||
| Principal |
Value |
|||||||
| Gas — 1.1% | ||||||||
| Atmos Energy Corp. |
$ | 6,000 | $ | 4,761 | ||||
| 2.85%, 2/15/52 |
4,000 | 2,693 | ||||||
| Piedmont Natural Gas Co., Inc., |
5,000 | 4,121 | ||||||
| Southern California Gas Co. |
||||||||
| Series XX, 2.55%, 2/1/30 |
10,000 | 8,683 | ||||||
| Series VV, 4.30%, 1/15/49 |
5,000 | 4,169 | ||||||
| Southwest Gas Corp., |
8,000 | 5,153 | ||||||
|
|
|
|||||||
| (Cost $38,366) |
29,580 | |||||||
|
|
|
|||||||
| Water — 0.7% | ||||||||
| American Water Capital Corp. |
6,000 | 5,841 | ||||||
| 3.45%, 5/1/50 |
11,000 | 8,125 | ||||||
| Essential Utilities, Inc.,2.40%, 5/1/31 |
8,000 | 6,576 | ||||||
|
|
|
|||||||
| (Cost $27,883) |
20,542 | |||||||
|
|
|
|||||||
| TOTAL CORPORATE BONDS |
2,697,108 | |||||||
|
|
|
|||||||
| Number |
||||||||
| CASH EQUIVALENTS — 0.7% | ||||||||
| DWS Government Money Market Series “Institutional Shares”, 5.04% (b) |
18,520 | 18,520 | ||||||
|
|
|
|||||||
| TOTAL INVESTMENTS — 99.4% (Cost $3,136,780) |
$ | 2,715,628 | ||||||
| Other assets and liabilities, net — 0.6% |
16,857 | |||||||
|
|
|
|||||||
| NET ASSETS — 100.0% |
$ | 2,732,485 | ||||||
|
|
|
|||||||
A summary of the Fund’s transactions with affiliated investments during the year ended May 31, 2023 is as follows:
| Value ($) at 5/31/2022 |
Purchases Cost ($) |
Sales Proceeds ($) |
Net Realized Gain/(Loss) ($) |
Net Change in Unrealized Appreciation (Depreciation) ($) |
Income ($) | Capital Gain Distributions ($) |
Number of Shares at 5/31/2023 |
Value ($) at 5/31/2023 |
||||||||||||||||||||||||||||
| CORPORATE BONDS — 0.6% |
|
|||||||||||||||||||||||||||||||||||
| Financial — 0.6% |
|
|||||||||||||||||||||||||||||||||||
| Deutsche Bank AG, 3.700%, 5/30/24 (a) |
|
|||||||||||||||||||||||||||||||||||
| 10,033 | 36 | (4,851 | ) | (130 | ) | (222 | ) | 363 | — | 5,000 | 4,866 | |||||||||||||||||||||||||
| Deutsche Bank AG/New York NY, 3.961%, 11/26/25 (a) |
|
|||||||||||||||||||||||||||||||||||
| — | 14,042 | (14,359 | ) | 317 | — | 301 | — | — | — | |||||||||||||||||||||||||||
| Deutsche Bank AG/New York NY, 3.035%, 5/28/32 (a) |
|
|||||||||||||||||||||||||||||||||||
| 12,535 | — | (9 | ) | — | (621 | ) | 455 | — | 15,000 | 11,905 | ||||||||||||||||||||||||||
| SECURITIES LENDING COLLATERAL — 0.0% |
|
|||||||||||||||||||||||||||||||||||
| DWS Government & Agency Securities Portfolio “DWS Government Cash Institutional Shares, 5.03% (b)(c) |
|
|||||||||||||||||||||||||||||||||||
| 30,582 | — | (30,582 | )(d) | — | — | 985 | — | — | — | |||||||||||||||||||||||||||
| CASH EQUIVALENTS — 0.7% |
|
|||||||||||||||||||||||||||||||||||
| DWS Government Money Market Series “Institutional Shares”, 5.04% (b) |
|
|||||||||||||||||||||||||||||||||||
| 19,380 | 343,410 | (344,270) | — | — | 1,027 | — | 18,520 | 18,520 | ||||||||||||||||||||||||||||
|
|
|
|
|
|
|
|
|
|
|
|
|
|
|
|
|
|
|
|||||||||||||||||||
| 72,530 | 357,488 | (394,071 | ) | 187 | (843 | ) | 3,131 | — | 38,520 | 35,291 | ||||||||||||||||||||||||||
|
|
|
|
|
|
|
|
|
|
|
|
|
|
|
|
|
|
|
|||||||||||||||||||
| See Notes to Financial Statements. | 26 |
DBX ETF Trust
Schedule of Investments
Xtrackers Bloomberg US Investment Grade Corporate ESG ETF (Continued)
May 31, 2023
| (a) | Affiliated issuer. This security is owned in proportion with its representation in the index. |
| (b) | Affiliated fund managed by DWS Investment Management Americas, Inc. The rate shown is the annualized seven-day yield at period end. |
| (c) | Represents collateral held in connection with securities lending. Income earned by the Fund is net of borrower rebates. |
| (d) | Represents the net increase (purchase cost) or decrease (sales proceeds) in the amount invested in cash collateral for the year ended May 31, 2023. |
| GMTN: | Global Medium Term Note |
| MTN: | Medium Term Note |
| 144A: | Security exempt from registration under Rule 144A of the Securities Act of 1933. These securities may be resold in transactions exempt from registration, normally to qualified institutional buyers. |
Fair Value Measurements
Various inputs are used in determining the value of the Fund’s investments. These inputs are summarized in three broad levels. Level 1 includes quoted prices in active markets for identical securities. Level 2 includes other significant observable inputs (including quoted prices for similar securities, interest rates, prepayment speeds and credit risk). Level 3 includes significant unobservable inputs (including the Fund’s own assumptions in determining the fair value of investments). The level assigned to the securities valuations may not be an indication of the risk or liquidity associated with investing in those securities.
The following is a summary of the inputs used as of May 31, 2023 in valuing the Fund’s investments. For information on the Fund’s policy regarding the valuation of investments, please refer to the Security Valuation section of Note 2 in the accompanying Notes to Financial Statements.
| Assets |
Level 1 | Level 2 | Level 3 | Total | ||||||||||||
| Corporate Bonds (a) |
$ | — | $ | 2,697,108 | $ | — | $ | 2,697,108 | ||||||||
| Short-Term Investments (a) |
18,520 | — | — | 18,520 | ||||||||||||
|
|
|
|
|
|
|
|
|
|||||||||
| TOTAL |
$ | 18,520 | $ | 2,697,108 | $ | — | $ | 2,715,628 | ||||||||
|
|
|
|
|
|
|
|
|
|||||||||
| (a) | See Schedule of Investments for additional detailed categorizations. |
| See Notes to Financial Statements. | 27 |
DBX ETF Trust
Schedule of Investments
Xtrackers J.P. Morgan ESG Emerging Markets Sovereign ETF
May 31, 2023
| Principal |
Value |
|||||||
| SOVEREIGN BONDS — 98.1% | ||||||||
| Argentina — 1.8% | ||||||||
| Argentine Republic Government International Bond |
$ | 55,589 | $ | 14,262 | ||||
| 0.50% - 1.75%, 7/9/30 (a) |
340,000 | 89,738 | ||||||
| 1.50% - 5.00%, 7/9/35 (a) |
370,000 | 86,719 | ||||||
| 3.875% - 5.00%, 1/9/38 (a) |
210,000 | 60,667 | ||||||
| 3.50% - 4.875%, 7/9/41 (a) |
190,000 | 49,163 | ||||||
| 1.50% - 5.00%, 7/9/46 (a) |
44,000 | 10,450 | ||||||
|
|
|
|||||||
| (Cost $588,502) |
310,999 | |||||||
|
|
|
|||||||
| Armenia — 1.2% | ||||||||
| Republic of Armenia International Bond, |
200,000 | 202,267 | ||||||
|
|
|
|||||||
| Bahrain — 3.2% | ||||||||
| Bahrain Government International Bond |
200,000 | 204,176 | ||||||
| REGS, 6.00%, 9/19/44 |
200,000 | 153,664 | ||||||
| CBB International Sukuk Programme Co WLL |
200,000 | 191,899 | ||||||
|
|
|
|||||||
| (Cost $610,491) |
549,739 | |||||||
|
|
|
|||||||
| Barbados — 0.2% | ||||||||
| Barbados Government International Bond, |
||||||||
| (Cost $30,319) |
32,000 | 29,898 | ||||||
|
|
|
|||||||
| Bolivia — 0.3% | ||||||||
| Bolivian Government International Bond, |
||||||||
| (Cost $65,723) |
75,000 | 45,516 | ||||||
|
|
|
|||||||
| Brazil — 4.1% | ||||||||
| Brazilian Government International Bond |
15,000 | 14,814 | ||||||
| 2.875%, 6/6/25 |
80,000 | 76,568 | ||||||
| 4.625%, 1/13/28 |
100,000 | 97,982 | ||||||
| 4.50%, 5/30/29 |
100,000 | 95,187 | ||||||
| 3.875%, 6/12/30 |
100,000 | 89,063 | ||||||
| 3.75%, 9/12/31 |
60,000 | 51,675 | ||||||
| 8.25%, 1/20/34 |
75,000 | 86,108 | ||||||
| 7.125%, 1/20/37 |
50,000 | 53,031 | ||||||
| 5.625%, 1/7/41 |
50,000 | 43,750 | ||||||
| 5.00%, 1/27/45 |
71,000 | 55,025 | ||||||
| 5.625%, 2/21/47 |
50,000 | 41,594 | ||||||
|
|
|
|||||||
| (Cost $784,137) |
704,797 | |||||||
|
|
|
|||||||
| Cayman Islands — 1.0% | ||||||||
| Sharjah Sukuk Program Ltd., REGS, |
200,000 | 172,791 | ||||||
|
|
|
|||||||
| Chile — 2.6% | ||||||||
| Chile Government International Bond |
45,000 | 43,481 | ||||||
| 2.55%, 7/27/33 |
100,000 | 82,414 | ||||||
| 3.10%, 5/7/41 |
100,000 | 74,986 | ||||||
| 4.34%, 3/7/42 |
150,000 | 132,613 | ||||||
| 3.86%, 6/21/47 |
150,000 | 120,747 | ||||||
|
|
|
|||||||
| (Cost $561,406) |
454,241 | |||||||
|
|
|
|||||||
| Principal |
Value |
|||||||
| China — 1.1% | ||||||||
| China Government International Bond, |
$ | 200,000 | $ | 197,039 | ||||
|
|
|
|||||||
| Colombia — 3.4% | ||||||||
| Colombia Government International Bond |
75,000 | 76,564 | ||||||
| 3.875%, 4/25/27 |
80,000 | 72,348 | ||||||
| 3.00%, 1/30/30 |
80,000 | 61,712 | ||||||
| 3.25%, 4/22/32 |
115,000 | 83,555 | ||||||
| 7.375%, 9/18/37 |
40,000 | 37,254 | ||||||
| 6.125%, 1/18/41 |
80,000 | 62,806 | ||||||
| 5.625%, 2/26/44 |
80,000 | 57,999 | ||||||
| 5.00%, 6/15/45 |
100,000 | 66,750 | ||||||
| 5.20%, 5/15/49 |
90,000 | 60,185 | ||||||
|
|
|
|||||||
| (Cost $682,385) |
579,173 | |||||||
|
|
|
|||||||
| Costa Rica — 1.1% | ||||||||
| Costa Rica Government International Bond |
90,000 | 90,108 | ||||||
| REGS, 7.158%, 3/12/45 |
100,000 | 99,438 | ||||||
|
|
|
|||||||
| (Cost $164,145) |
189,546 | |||||||
|
|
|
|||||||
| Dominican Republic — 3.5% | ||||||||
| Dominican Republic International Bond |
100,000 | 101,080 | ||||||
| REGS, 6.00%, 7/19/28 |
100,000 | 96,626 | ||||||
| REGS, 4.50%, 1/30/30 |
100,000 | 86,562 | ||||||
| REGS, 4.875%, 9/23/32 |
30,000 | 25,221 | ||||||
| REGS, 5.30%, 1/21/41 |
150,000 | 116,719 | ||||||
| REGS, 7.45%, 4/30/44 |
150,000 | 143,719 | ||||||
| REGS, 5.875%, 1/30/60 |
42,000 | 31,264 | ||||||
|
|
|
|||||||
| (Cost $666,485) |
601,191 | |||||||
|
|
|
|||||||
| Ecuador — 1.0% | ||||||||
| Ecuador Government International Bond |
50,000 | 24,313 | ||||||
| 144A, 2.50% - 6.90%, 7/31/35 (a) |
157,000 | 54,165 | ||||||
| REGS, 2.50% - 6.90%, 7/31/35 (a) |
120,000 | 41,553 | ||||||
| 144A, 1.50% - 6.90%, 7/31/40 (a) |
119,000 | 37,336 | ||||||
| REGS, 1.50% - 6.90%, 7/31/40 (a) |
75,000 | 23,531 | ||||||
|
|
|
|||||||
| (Cost $307,608) |
180,898 | |||||||
|
|
|
|||||||
| Egypt — 1.3% | ||||||||
| Egypt Government International Bond |
||||||||
| REGS, 7.600%, 3/1/29 |
200,000 | 123,850 | ||||||
| REGS, 5.875%, 2/16/31 |
200,000 | 108,776 | ||||||
|
|
|
|||||||
| (Cost $355,398) |
232,626 | |||||||
|
|
|
|||||||
| El Salvador — 0.7% | ||||||||
| El Salvador Government International Bond |
||||||||
| REGS, 6.375%, 1/18/27 |
50,000 | 32,033 | ||||||
| REGS, 8.625%, 2/28/29 |
60,000 | 36,113 | ||||||
| REGS, 7.65%, 6/15/35 |
72,000 | 38,273 | ||||||
| REGS, 7.125%, 1/20/50 |
15,000 | 7,462 | ||||||
|
|
|
|||||||
| (Cost $164,369) |
113,881 | |||||||
|
|
|
|||||||
| Gabon — 1.1% | ||||||||
| Gabon Government International Bond, |
200,000 | 191,377 | ||||||
|
|
|
|||||||
| See Notes to Financial Statements. | 28 |
DBX ETF Trust
Schedule of Investments
Xtrackers J.P. Morgan ESG Emerging Markets Sovereign ETF (Continued)
May 31, 2023
| Principal |
Value |
|||||||
| Ghana — 1.0% | ||||||||
| Ghana Government International Bond |
$ | 100,000 | $ | 40,704 | ||||
| REGS, 10.75%, 10/14/30 |
200,000 | 137,426 | ||||||
|
|
|
|||||||
| (Cost $282,237) |
178,130 | |||||||
|
|
|
|||||||
| Guatemala — 0.7% | ||||||||
| Guatemala Government Bond |
75,000 | 69,703 | ||||||
| REGS, 6.125%, 6/1/50 |
50,000 | 45,313 | ||||||
|
|
|
|||||||
| (Cost $143,005) |
115,016 | |||||||
|
|
|
|||||||
| Honduras — 0.1% | ||||||||
| Honduras Government International Bond |
15,000 | 13,574 | ||||||
| REGS, 5.625%, 6/24/30 |
13,000 | 10,457 | ||||||
|
|
|
|||||||
| (Cost $24,172) |
24,031 | |||||||
|
|
|
|||||||
| Hungary — 4.6% | ||||||||
| Hungary Government International Bond |
76,000 | 75,949 | ||||||
| REGS, 6.125%, 5/22/28 |
200,000 | 203,810 | ||||||
| REGS, 2.125%, 9/22/31 |
200,000 | 152,700 | ||||||
| 7.625%, 3/29/41 |
214,000 | 237,879 | ||||||
| REGS, 3.125%, 9/21/51 |
200,000 | 119,945 | ||||||
|
|
|
|||||||
| (Cost $890,269) |
790,283 | |||||||
|
|
|
|||||||
| Indonesia — 3.8% | ||||||||
| Indonesia Government International Bond |
60,000 | 60,383 | ||||||
| REGS, 4.35%, 1/8/27 |
80,000 | 79,373 | ||||||
| REGS, 8.50%, 10/12/35 |
150,000 | 196,006 | ||||||
| REGS, 6.625%, 2/17/37 |
150,000 | 172,821 | ||||||
| REGS, 7.75%, 1/17/38 |
100,000 | 126,176 | ||||||
| 3.05%, 3/12/51 |
25,000 | 18,177 | ||||||
|
|
|
|||||||
| (Cost $741,320) |
652,936 | |||||||
|
|
|
|||||||
| Ivory Coast (Cote D’Ivoire) — 0.6% | ||||||||
| Ivory Coast Government International Bond, |
119,389 | 110,568 | ||||||
|
|
|
|||||||
| Jamaica — 1.5% | ||||||||
| Jamaica Government International Bond |
150,000 | 158,084 | ||||||
| 7.875%, 7/28/45 |
93,000 | 107,822 | ||||||
|
|
|
|||||||
| (Cost $271,250) |
265,906 | |||||||
|
|
|
|||||||
| Jordan — 1.1% | ||||||||
| Jordan Government International Bond, |
200,000 | 189,825 | ||||||
|
|
|
|||||||
| Kazakhstan — 1.2% | ||||||||
| Kazakhstan Government International Bond, |
200,000 | 207,766 | ||||||
|
|
|
|||||||
| Kenya — 1.0% | ||||||||
| Republic of Kenya Government International Bond, REGS, |
200,000 | 167,725 | ||||||
|
|
|
|||||||
| Principal |
Value |
|||||||
| Kuwait — 1.1% | ||||||||
| Kuwait International Government Bond, |
$ | 200,000 | $ | 195,958 | ||||
|
|
|
|||||||
| Malaysia — 1.2% | ||||||||
| Malaysia Sovereign Sukuk Bhd |
100,000 | 97,234 | ||||||
| Malaysia Wakala Sukuk Bhd |
||||||||
| REGS, 2.07%, 4/28/31 |
80,000 | 69,597 | ||||||
| REGS, 3.075%, 4/28/51 |
45,000 | 34,481 | ||||||
|
|
|
|||||||
| (Cost $213,588) |
201,312 | |||||||
|
|
|
|||||||
| Mexico — 3.0% | ||||||||
| Mexico Government International Bond |
21,000 | 18,771 | ||||||
| MTN, 8.30%, 8/15/31 |
75,000 | 88,522 | ||||||
| Series A, MTN, 7.50%, 4/8/33 |
50,000 | 57,495 | ||||||
| Series A, MTN, 6.75%, 9/27/34 |
40,000 | 43,845 | ||||||
| 6.05%, 1/11/40 |
96,000 | 97,063 | ||||||
| MTN, 4.75%, 3/8/44 |
90,000 | 76,225 | ||||||
| 5.55%, 1/21/45 |
40,000 | 37,741 | ||||||
| 4.60%, 1/23/46 |
25,000 | 20,458 | ||||||
| 4.60%, 2/10/48 |
30,000 | 24,391 | ||||||
| 4.50%, 1/31/50 |
25,000 | 20,083 | ||||||
| 3.771%, 5/24/61 |
25,000 | 16,710 | ||||||
| GMTN, 5.75%, 10/12/10 |
20,000 | 17,542 | ||||||
|
|
|
|||||||
| (Cost $613,372) |
518,846 | |||||||
|
|
|
|||||||
| Mongolia — 0.7% | ||||||||
| Mongolia Government International Bond |
||||||||
| REGS, 5.125%, 4/7/26 |
50,000 | 44,760 | ||||||
| REGS, 8.65%, 1/19/28 |
70,000 | 69,359 | ||||||
|
|
|
|||||||
| (Cost $119,014) |
114,119 | |||||||
|
|
|
|||||||
| Morocco — 1.0% | ||||||||
| Morocco Government International Bond, |
200,000 | 170,341 | ||||||
|
|
|
|||||||
| Oman — 3.4% | ||||||||
| Oman Government International Bond |
||||||||
| REGS, 5.375%, 3/8/27 |
200,000 | 196,973 | ||||||
| REGS, 5.625%, 1/17/28 |
200,000 | 198,645 | ||||||
| REGS, 6.75%, 1/17/48 |
200,000 | 188,815 | ||||||
|
|
|
|||||||
| (Cost $532,034) |
584,433 | |||||||
|
|
|
|||||||
| Panama — 4.8% | ||||||||
| Panama Government International Bond |
50,000 | 48,825 | ||||||
| 7.125%, 1/29/26 |
100,000 | 105,785 | ||||||
| 3.875%, 3/17/28 |
150,000 | 143,709 | ||||||
| 9.375%, 4/1/29 |
25,000 | 30,511 | ||||||
| 3.16%, 1/23/30 |
50,000 | 44,088 | ||||||
| 6.40%, 2/14/35 |
60,000 | 62,812 | ||||||
| 6.70%, 1/26/36 |
100,000 | 107,110 | ||||||
| 4.50%, 4/16/50 |
20,000 | 15,274 | ||||||
| 4.30%, 4/29/53 |
50,000 | 36,634 | ||||||
| 4.50%, 4/1/56 |
150,000 | 111,325 | ||||||
| 3.87%, 7/23/60 |
146,000 | 95,281 | ||||||
| 4.50%, 1/19/63 |
50,000 | 36,032 | ||||||
|
|
|
|||||||
| (Cost $1,057,141) |
837,386 | |||||||
|
|
|
|||||||
| See Notes to Financial Statements. | 29 |
DBX ETF Trust
Schedule of Investments
Xtrackers J.P. Morgan ESG Emerging Markets Sovereign ETF (Continued)
May 31, 2023
| Principal |
Value |
|||||||
| Papua New Guinea — 0.1% | ||||||||
| Papua New Guinea Government International Bond, REGS, |
||||||||
| (Cost $10,147) |
$ | 11,000 | $ | 10,074 | ||||
|
|
|
|||||||
| Paraguay — 1.2% | ||||||||
| Paraguay Government International Bond |
||||||||
| REGS, 3.849%, 6/28/33 |
200,000 | 172,176 | ||||||
| REGS, 5.40%, 3/30/50 |
37,000 | 31,144 | ||||||
|
|
|
|||||||
| (Cost $210,813) |
203,320 | |||||||
|
|
|
|||||||
| Peru — 3.1% | ||||||||
| Peruvian Government International Bond |
25,000 | 26,268 | ||||||
| 4.125%, 8/25/27 |
25,000 | 24,537 | ||||||
| 2.783%, 1/23/31 |
112,000 | 95,602 | ||||||
| 8.75%, 11/21/33 |
100,000 | 126,380 | ||||||
| 3.00%, 1/15/34 |
100,000 | 81,954 | ||||||
| 6.55%, 3/14/37 |
40,000 | 43,919 | ||||||
| 3.30%, 3/11/41 |
75,000 | 56,141 | ||||||
| 5.625%, 11/18/50 |
50,000 | 50,135 | ||||||
| 2.78%, 12/1/60 |
47,000 | 27,348 | ||||||
|
|
|
|||||||
| (Cost $667,412) |
532,284 | |||||||
|
|
|
|||||||
| Philippines — 3.9% | ||||||||
| Philippine Government International Bond |
100,000 | 96,310 | ||||||
| 9.50%, 2/2/30 |
160,000 | 203,246 | ||||||
| 1.648%, 6/10/31 |
80,000 | 64,252 | ||||||
| 3.95%, 1/20/40 |
50,000 | 43,322 | ||||||
| 3.70%, 3/1/41 |
100,000 | 82,924 | ||||||
| 3.70%, 2/2/42 |
150,000 | 123,932 | ||||||
| 4.20%, 3/29/47 |
75,000 | 65,025 | ||||||
|
|
|
|||||||
| (Cost $800,647) |
679,011 | |||||||
|
|
|
|||||||
| Poland — 1.8% | ||||||||
| Republic of Poland Government International Bond |
150,000 | 145,789 | ||||||
| 5.75%, 11/16/32 |
67,000 | 71,247 | ||||||
| 4.875%, 10/4/33 |
27,000 | 26,992 | ||||||
| 5.50%, 4/4/53 |
60,000 | 60,464 | ||||||
|
|
|
|||||||
| (Cost $315,261) |
304,492 | |||||||
|
|
|
|||||||
| Qatar — 3.9% | ||||||||
| Qatar Government International Bond |
||||||||
| REGS, 4.00%, 3/14/29 |
200,000 | 197,896 | ||||||
| 144A, 9.75%, 6/15/30 |
160,000 | 213,573 | ||||||
| 144A, 6.40%, 1/20/40 |
60,000 | 70,326 | ||||||
| REGS, 5.103%, 4/23/48 |
200,000 | 198,856 | ||||||
|
|
|
|||||||
| (Cost $798,451) |
680,651 | |||||||
|
|
|
|||||||
| Romania — 3.4% | ||||||||
| Romanian Government International Bond |
||||||||
| REGS, 4.875%, 1/22/24 |
100,000 | 99,822 | ||||||
| REGS, 3.00%, 2/14/31 |
100,000 | 82,802 | ||||||
| REGS, 3.625%, 3/27/32 |
80,000 | 67,640 | ||||||
| REGS, 7.125%, 1/17/33 |
36,000 | 37,972 | ||||||
| REGS, 6.00%, 5/25/34 |
50,000 | 49,259 | ||||||
| Principal |
Value |
|||||||
| Romania (Continued) | ||||||||
| 144A, 6.125%, 1/22/44 |
$ | 70,000 | $ | 65,441 | ||||
| REGS, 6.125%, 1/22/44 |
50,000 | 46,743 | ||||||
| REGS, 5.125%, 6/15/48 |
40,000 | 32,865 | ||||||
| REGS, 4.00%, 2/14/51 |
164,000 | 112,221 | ||||||
|
|
|
|||||||
| (Cost $688,703) |
594,765 | |||||||
|
|
|
|||||||
| Saudi Arabia — 5.7% | ||||||||
| KSA Sukuk Ltd. |
300,000 | 255,798 | ||||||
| Saudi Government International Bond |
200,000 | 174,165 | ||||||
| REGS, 2.25%, 2/2/33 |
200,000 | 163,030 | ||||||
| REGS, 4.875%, 7/18/33 |
200,000 | 201,814 | ||||||
| REGS, 5.00%, 4/17/49 |
200,000 | 185,628 | ||||||
|
|
|
|||||||
| (Cost $1,161,476) |
980,435 | |||||||
|
|
|
|||||||
| Serbia — 0.9% | ||||||||
| Serbia International Bond, |
200,000 | 150,673 | ||||||
|
|
|
|||||||
| South Africa — 2.5% | ||||||||
| Republic of South Africa Government International Bond |
70,000 | 69,239 | ||||||
| 4.85%, 9/27/27 |
65,000 | 60,139 | ||||||
| 4.30%, 10/12/28 |
100,000 | 86,473 | ||||||
| 5.65%, 9/27/47 |
125,000 | 85,396 | ||||||
| 6.30%, 6/22/48 |
100,000 | 74,111 | ||||||
| 5.75%, 9/30/49 |
95,000 | 64,652 | ||||||
|
|
|
|||||||
| (Cost $507,113) |
440,010 | |||||||
|
|
|
|||||||
| Sri Lanka — 0.6% | ||||||||
| Sri Lanka Government International Bond |
100,000 | 36,685 | ||||||
| 144A, 7.85%, 3/14/29 (b) |
75,000 | 27,750 | ||||||
| REGS, 7.55%, 3/28/30 (b) |
100,000 | 36,845 | ||||||
|
|
|
|||||||
| (Cost $216,207) |
101,280 | |||||||
|
|
|
|||||||
| Trinidad and Tobago — 0.4% | ||||||||
| Trinidad & Tobago Government International Bond, REGS, |
75,000 | 73,291 | ||||||
|
|
|
|||||||
| Turkey — 3.3% | ||||||||
| Turkey Government International Bond |
25,000 | 24,390 | ||||||
| 7.375%, 2/5/25 |
30,000 | 29,113 | ||||||
| 4.75%, 1/26/26 |
70,000 | 62,754 | ||||||
| 4.25%, 4/14/26 |
110,000 | 96,220 | ||||||
| 4.875%, 10/9/26 |
100,000 | 87,482 | ||||||
| 9.875%, 1/15/28 |
20,000 | 19,993 | ||||||
| 5.125%, 2/17/28 |
25,000 | 21,268 | ||||||
| 6.125%, 10/24/28 |
100,000 | 87,165 | ||||||
| 5.25%, 3/13/30 |
20,000 | 15,935 | ||||||
| 8.00%, 2/14/34 |
15,000 | 13,807 | ||||||
| 6.875%, 3/17/36 |
50,000 | 40,433 | ||||||
| 6.00%, 1/14/41 |
10,000 | 7,055 | ||||||
| See Notes to Financial Statements. | 30 |
DBX ETF Trust
Schedule of Investments
Xtrackers J.P. Morgan ESG Emerging Markets Sovereign ETF (Continued)
May 31, 2023
| Principal |
Value |
|||||||
| Turkey (Continued) | ||||||||
| 4.875%, 4/16/43 |
$ | 50,000 | $ | 30,916 | ||||
| 5.75%, 5/11/47 |
60,000 | 39,485 | ||||||
|
|
|
|||||||
| (Cost $606,695) |
576,016 | |||||||
|
|
|
|||||||
| Ukraine — 0.6% | ||||||||
| Ukraine Government International Bond |
250,000 | 48,702 | ||||||
| 144A, 9.75%, 11/1/30* |
60,000 | 12,202 | ||||||
| REGS, 9.75%, 11/1/30* |
200,000 | 40,672 | ||||||
|
|
|
|||||||
| (Cost $486,559) |
101,576 | |||||||
|
|
|
|||||||
| United Arab Emirates — 3.4% | ||||||||
| Abu Dhabi Government International Bond |
430,000 | 411,533 | ||||||
| REGS, 4.125%, 10/11/47 |
200,000 | 175,863 | ||||||
|
|
|
|||||||
| (Cost $680,223) |
587,396 | |||||||
|
|
|
|||||||
| Uruguay — 3.8% | ||||||||
| Uruguay Government International Bond |
77,000 | 77,001 | ||||||
| 4.375%, 1/23/31 |
124,000 | 123,840 | ||||||
| 7.875%, 1/15/33 |
42,000 | 52,250 | ||||||
| 7.625%, 3/21/36 |
54,000 | 67,260 | ||||||
| 4.125%, 11/20/45 |
37,000 | 33,458 | ||||||
| Principal |
Value |
|||||||
| Uruguay (Continued) | ||||||||
| 5.10%, 6/18/50 |
$ | 170,000 | $ | 167,487 | ||||
| 4.975%, 4/20/55 |
132,000 | 127,354 | ||||||
|
|
|
|||||||
| (Cost $773,959) |
648,650 | |||||||
|
|
|
|||||||
| Uzbekistan — 1.1% | ||||||||
| Republic of Uzbekistan International Bond, |
200,000 | 197,716 | ||||||
|
|
|
|||||||
| TOTAL SOVEREIGN BONDS | ||||||||
| (Cost $20,310,204) |
16,942,200 | |||||||
|
|
|
|||||||
| Number |
||||||||
| CASH EQUIVALENTS — 0.2% | ||||||||
| DWS Government Money Market Series “Institutional Shares”, 5.04% (c) |
||||||||
| (Cost $29,514) |
29,514 | 29,514 | ||||||
|
|
|
|||||||
| TOTAL INVESTMENTS — 98.3% (Cost $20,339,718) |
$ | 16,971,714 | ||||||
| Other assets and liabilities, net — 1.7% |
297,336 | |||||||
|
|
|
|||||||
| NET ASSETS — 100.0% |
$ | 17,269,050 | ||||||
|
|
|
|||||||
A summary of the Fund’s transactions with affiliated investments during the year ended May 31, 2023 is as follows:
| Value ($) at 5/31/2022 |
Purchases Cost ($) |
Sales Proceeds ($) |
Net Realized Gain/(Loss) ($) |
Net Change in Unrealized Appreciation (Depreciation) ($) |
Income ($) | Capital Gain Distributions ($) |
Number of Shares at 5/31/2023 |
Value ($) at 5/31/2023 |
||||||||||||||||||||||||||||
| SECURITIES LENDING COLLATERAL — 0.0% |
| |||||||||||||||||||||||||||||||||||
| DWS Government & Agency Securities Portfolio “DWS Government Cash Institutional Shares, 5.03% (c)(d) |
| |||||||||||||||||||||||||||||||||||
| 482,208 | — | (482,208 | )(e) | — | — | 7,703 | — | — | — | |||||||||||||||||||||||||||
| CASH EQUIVALENTS — 0.2% |
| |||||||||||||||||||||||||||||||||||
| DWS Government Money Market Series “Institutional Shares”, 5.04% (c) |
| |||||||||||||||||||||||||||||||||||
| 166,057 | 2,404,758 | (2,541,301 | ) | — | — | 5,202 | — | 29,514 | 29,514 | |||||||||||||||||||||||||||
|
|
|
|
|
|
|
|
|
|
|
|
|
|
|
|
|
|
|
|||||||||||||||||||
| 648,265 | 2,404,758 | (3,023,509 | ) | — | — | 12,905 | — | 29,514 | 29,514 | |||||||||||||||||||||||||||
|
|
|
|
|
|
|
|
|
|
|
|
|
|
|
|
|
|
|
|||||||||||||||||||
| * | Non-income producing security. |
| (a) | Security is a “step-up” bond where the coupon increases or steps-up at a predetermined date.The range of rates shown is the current coupon rate through the final coupon rate, date shown is the final maturity date. |
| (b) | Defaulted security or security for which income has been deemed uncollectible. |
| (c) | Affiliated fund managed by DWS Investment Management Americas, Inc. The rate shown is the annualized seven-day yield at period end. |
| (d) | Represents collateral held in connection with securities lending. Income earned by the Fund is net of borrower rebates. |
| (e) | Represents the net increase (purchase cost) or decrease (sales proceeds) in the amount invested in cash collateral for the year ended May 31, 2023. |
| GMTN: | Global Medium Term Note |
| MTN: | Medium Term Note |
| REGS: | Securities sold under Regulation S may not be offered, sold or delivered within the United States or to, or for the account or benefit of, U.S. persons, except pursuant to an exemption from, or in a transaction not subject to, the registration requirements of the Securities Act of 1933. |
| 144A: | Security exempt from registration under Rule 144A of the Securities Act of 1933. These securities may be resold in transactions exempt from registration, normally to qualified institutional buyers. |
| See Notes to Financial Statements. | 31 |
DBX ETF Trust
Schedule of Investments
Xtrackers J.P. Morgan ESG Emerging Markets Sovereign ETF (Continued)
May 31, 2023
Fair Value Measurements
Various inputs are used in determining the value of the Fund’s investments. These inputs are summarized in three broad levels. Level 1 includes quoted prices in active markets for identical securities. Level 2 includes other significant observable inputs (including quoted prices for similar securities, interest rates, prepayment speeds and credit risk). Level 3 includes significant unobservable inputs (including the Fund’s own assumptions in determining the fair value of investments). The level assigned to the securities valuations may not be an indication of the risk or liquidity associated with investing in those securities.
The following is a summary of the inputs used as of May 31, 2023 in valuing the Fund’s investments. For information on the Fund’s policy regarding the valuation of investments, please refer to the Security Valuation section of Note 2 in the accompanying Notes to Financial Statements.
| Assets |
Level 1 | Level 2 | Level 3 | Total | ||||||||||||
| Sovereign Bonds (a) |
$ | — | $ | 16,942,200 | $ | — | $ | 16,942,200 | ||||||||
| Short-Term Investments (a) |
29,514 | — | — | 29,514 | ||||||||||||
|
|
|
|
|
|
|
|
|
|||||||||
| TOTAL |
$ | 29,514 | $ | 16,942,200 | $ | — | $ | 16,971,714 | ||||||||
|
|
|
|
|
|
|
|
|
|||||||||
| (a) | See Schedule of Investments for additional detailed categorizations. |
| See Notes to Financial Statements. | 32 |
DBX ETF Trust
Schedule of Investments
Xtrackers J.P. Morgan ESG USD High Yield Corporate Bond ETF
May 31, 2023
| Principal |
Value |
|||||||
| CORPORATE BONDS — 97.6% | ||||||||
| Basic Materials — 5.8% | ||||||||
| Chemicals — 3.3% | ||||||||
| Ashland LLC, |
$ | 10,000 | $ | 10,055 | ||||
| ASP Unifrax Holdings, Inc., 144A, |
10,000 | 7,613 | ||||||
| Avient Corp., 144A, |
50,000 | 50,025 | ||||||
| Axalta Coating Systems LLC, 144A, |
10,000 | 8,617 | ||||||
| Axalta Coating Systems LLC / Axalta Coating Systems Dutch Holding B BV, 144A, |
10,000 | 9,537 | ||||||
| Cerdia Finanz GmbH, 144A, |
17,000 | 16,325 | ||||||
| Chemours Co., 144A, |
25,000 | 22,125 | ||||||
| Consolidated Energy Finance SA, 144A, 5.625%, 10/15/28 |
10,000 | 8,650 | ||||||
| CVR Partners LP / CVR Nitrogen Finance Corp., 144A, |
12,000 | 10,470 | ||||||
| Diamond BC BV, 144A, |
10,000 | 10,138 | ||||||
| Element Solutions, Inc., 144A, |
21,000 | 18,501 | ||||||
| HB Fuller Co., |
10,000 | 9,029 | ||||||
| Illuminate Buyer LLC / Illuminate Holdings IV, Inc., 144A, |
10,000 | 8,812 | ||||||
| INEOS Quattro Finance 2 PLC, 144A, |
15,000 | 13,800 | ||||||
| Ingevity Corp., 144A, |
10,000 | 8,303 | ||||||
| Iris Holding, Inc., 144A, |
10,000 | 7,500 | ||||||
| LSF11 A5 HoldCo LLC, 144A, |
10,000 | 8,592 | ||||||
| Methanex Corp., |
10,000 | 8,050 | ||||||
| NOVA Chemicals Corp. 144A, |
40,000 | 39,100 | ||||||
| 144A,5.25%, 6/1/27 |
20,000 | 18,150 | ||||||
| Olympus Water US Holding Corp., 144A, 6.25%, 10/1/29 |
10,000 | 7,513 | ||||||
| Rain CII Carbon LLC / CII Carbon Corp., 144A, 7.25%, 4/1/25 |
10,000 | 9,818 | ||||||
| SCIH Salt Holdings, Inc. 144A, |
15,000 | 13,372 | ||||||
| 144A,6.625%, 5/1/29 |
5,000 | 4,173 | ||||||
| SCIL IV LLC / SCIL USA Holdings LLC, 144A, 5.375%, 11/1/26 |
15,000 | 13,913 | ||||||
| SK Invictus Intermediate II SARL, 144A, |
10,000 | 7,989 | ||||||
| SPCM SA, 144A, |
10,000 | 9,205 | ||||||
| Principal |
Value |
|||||||
| Chemicals (Continued) | ||||||||
| Trinseo Materials Operating SCA / Trinseo Materials Finance, Inc., 144A, |
$ | 10,000 | $ | 5,511 | ||||
| Tronox, Inc., 144A, |
20,000 | 16,325 | ||||||
| Valvoline, Inc., 144A, |
20,000 | 19,700 | ||||||
| Venator Finance Sarl / Venator Materials LLC, 144A,5.75%, 7/15/25 (a) |
10,000 | 1,242 | ||||||
| Vibrantz Technologies, Inc., 144A, |
10,000 | 7,573 | ||||||
| WR Grace Holdings LLC |
15,000 | 13,949 | ||||||
| 144A,5.625%, 8/15/29 |
10,000 | 8,338 | ||||||
| 144A,7.375%, 3/1/31 |
10,000 | 9,825 | ||||||
|
|
|
|||||||
| (Cost $487,865) |
441,838 | |||||||
|
|
|
|||||||
| Forest Products & Paper — 0.2% | ||||||||
| Ahlstrom Holding 3 Oy, 144A, |
10,000 | 8,295 | ||||||
| Domtar Corp., 144A, |
10,000 | 8,725 | ||||||
| Glatfelter Corp., 144A, |
10,000 | 6,450 | ||||||
| Mercer International, Inc., |
10,000 | 7,950 | ||||||
|
|
|
|||||||
| (Cost $36,755) |
31,420 | |||||||
|
|
|
|||||||
| Iron/Steel — 0.9% | ||||||||
| ATI, Inc., |
10,000 | 8,825 | ||||||
| Big River Steel LLC / BRS Finance Corp., 144A, |
15,000 | 14,963 | ||||||
| Carpenter Technology Corp., |
10,000 | 9,700 | ||||||
| Cleveland-Cliffs, Inc. |
12,000 | 11,640 | ||||||
| 144A,6.75%, 4/15/30 |
12,000 | 11,366 | ||||||
| Commercial Metals Co., |
10,000 | 8,600 | ||||||
| Infrabuild Australia Pty Ltd., 144A, |
7,000 | 6,738 | ||||||
| Mineral Resources Ltd. 144A, |
20,000 | 20,103 | ||||||
| 144A,8.00%, 11/1/27 |
20,000 | 20,045 | ||||||
| United States Steel Corp., |
10,000 | 9,687 | ||||||
|
|
|
|||||||
| (Cost $125,721) |
121,667 | |||||||
|
|
|
|||||||
| Mining — 1.4% | ||||||||
| Arconic Corp., 144A, |
18,000 | 18,261 | ||||||
| Coeur Mining, Inc., 144A, |
10,000 | 8,525 | ||||||
| Compass Minerals International, Inc., 144A, 6.75%, 12/1/27 |
10,000 | 9,575 | ||||||
| Constellium SE, 144A, |
15,000 | 12,991 | ||||||
| See Notes to Financial Statements. | 33 |
DBX ETF Trust
Schedule of Investments
Xtrackers J.P. Morgan ESG USD High Yield Corporate Bond ETF (Continued)
May 31, 2023
| Principal |
Value |
|||||||
| Mining (Continued) | ||||||||
| Eldorado Gold Corp., |
$ | 10,000 | $ | 9,019 | ||||
| FMG Resources August 2006 Pty Ltd. 144A, |
25,000 | 25,031 | ||||||
| 144A,4.375%, 4/1/31 |
23,000 | 19,492 | ||||||
| 144A,6.125%, 4/15/32 |
26,000 | 24,621 | ||||||
| Hudbay Minerals, Inc., 144A, |
10,000 | 9,088 | ||||||
| JW Aluminum Continuous Cast Co., 144A, |
15,000 | 15,019 | ||||||
| Kaiser Aluminum Corp., 144A, |
15,000 | 11,861 | ||||||
| Novelis Corp. 144A, |
10,000 | 8,925 | ||||||
| 144A,3.875%, 8/15/31 |
20,000 | 16,463 | ||||||
|
|
|
|||||||
| (Cost $204,264) |
188,871 | |||||||
|
|
|
|||||||
| Communications — 15.5% | ||||||||
| Advertising — 0.8% | ||||||||
| Advantage Sales & Marketing, Inc., 144A, 6.50%, 11/15/28 |
10,000 | 8,441 | ||||||
| Clear Channel International BV, 144A, |
10,000 | 9,850 | ||||||
| Clear Channel Outdoor Holdings, Inc. |
12,000 | 8,968 | ||||||
| 144A,7.50%, 6/1/29 |
21,000 | 15,041 | ||||||
| CMG Media Corp., 144A, |
10,000 | 6,550 | ||||||
| Lamar Media Corp., |
10,000 | 9,088 | ||||||
| National CineMedia LLC, 144A, |
10,000 | 3,000 | ||||||
| Outfront Media Capital LLC / Outfront Media Capital Corp., 144A, |
36,000 | 32,535 | ||||||
| Stagwell Global LLC, 144A, |
20,000 | 17,379 | ||||||
|
|
|
|||||||
| (Cost $138,608) |
110,852 | |||||||
|
|
|
|||||||
| Internet — 1.6% | ||||||||
| ANGI Group LLC, 144A, |
10,000 | 8,269 | ||||||
| Arches Buyer, Inc., 144A, |
15,000 | 13,012 | ||||||
| Cablevision Lightpath LLC, 144A, |
10,000 | 7,367 | ||||||
| Cogent Communications Group, Inc., 144A, |
15,000 | 13,875 | ||||||
| EquipmentShare.com, Inc., 144A, |
10,000 | 9,238 | ||||||
| Gen Digital, Inc. |
28,000 | 27,434 | ||||||
| 144A,6.75%, 9/30/27 |
15,000 | 15,020 | ||||||
| Go Daddy Operating Co. LLC / GD Finance Co., Inc. |
10,000 | 9,625 | ||||||
| 144A,3.50%, 3/1/29 |
10,000 | 8,700 | ||||||
| Principal |
Value |
|||||||
| Internet (Continued) | ||||||||
| ION Trading Technologies SARL, 144A, |
$ | 10,000 | $ | 8,350 | ||||
| Match Group Holdings II LLC, 144A, |
20,000 | 18,350 | ||||||
| Millennium Escrow Corp., 144A, |
10,000 | 7,000 | ||||||
| Newfold Digital Holdings Group, Inc., 144A, |
10,000 | 7,300 | ||||||
| Northwest Fiber LLC / Northwest Fiber Finance Sub, Inc., 144A, |
10,000 | 8,550 | ||||||
| Photo Holdings Merger Sub, Inc., 144A, |
14,000 | 8,155 | ||||||
| Rakuten Group, Inc. 144A, |
15,000 | 10,468 | ||||||
| 144A,10.25%, 11/30/24 |
20,000 | 20,350 | ||||||
| Ziff Davis, Inc., 144A, |
14,000 | 12,001 | ||||||
|
|
|
|||||||
| (Cost $236,191) |
213,064 | |||||||
|
|
|
|||||||
| Media — 7.8% | ||||||||
| AMC Networks, Inc. |
13,000 | 11,554 | ||||||
| 4.25%, 2/15/29 |
10,000 | 5,737 | ||||||
| Cable One, Inc., 144A, |
10,000 | 7,825 | ||||||
| CCO Holdings LLC / CCO Holdings Capital Corp. 144A, |
43,000 | 40,044 | ||||||
| 144A,5.00%, 2/1/28 |
10,000 | 9,109 | ||||||
| 144A,6.375%, 9/1/29 |
10,000 | 9,365 | ||||||
| 144A,4.75%, 3/1/30 |
27,000 | 22,849 | ||||||
| 144A,4.50%, 8/15/30 |
34,000 | 28,085 | ||||||
| 144A,4.25%, 2/1/31 |
46,000 | 37,109 | ||||||
| 144A,4.75%, 2/1/32 |
15,000 | 12,070 | ||||||
| 4.50%, 5/1/32 |
25,000 | 19,625 | ||||||
| 144A,4.50%, 6/1/33 |
14,000 | 10,710 | ||||||
| 144A,4.25%, 1/15/34 |
32,000 | 23,837 | ||||||
| CSC Holdings LLC |
30,000 | 27,975 | ||||||
| 144A,5.50%, 4/15/27 |
23,000 | 18,894 | ||||||
| 144A,5.375%, 2/1/28 |
18,000 | 14,211 | ||||||
| 144A,6.50%, 2/1/29 |
20,000 | 15,778 | ||||||
| 144A,5.75%, 1/15/30 |
5,000 | 2,231 | ||||||
| 144A,4.625%, 12/1/30 |
42,000 | 17,850 | ||||||
| 144A,4.50%, 11/15/31 |
20,000 | 13,950 | ||||||
| 144A,5.00%, 11/15/31 |
19,000 | 8,391 | ||||||
| Cumulus Media New Holdings, Inc., 144A, 6.75%, 7/1/26 |
10,000 | 7,300 | ||||||
| Directv Financing LLC / Directv Financing Co.-Obligor, Inc., 144A, 5.875%, 8/15/27 |
45,000 | 39,764 | ||||||
| DISH DBS Corp. |
45,000 | 38,756 | ||||||
| 7.75%, 7/1/26 |
35,000 | 20,169 | ||||||
| 144A,5.25%, 12/1/26 |
46,000 | 36,512 | ||||||
| 144A,5.75%, 12/1/28 |
41,000 | 30,042 | ||||||
| See Notes to Financial Statements. | 34 |
DBX ETF Trust
Schedule of Investments
Xtrackers J.P. Morgan ESG USD High Yield Corporate Bond ETF (Continued)
May 31, 2023
| Principal |
Value |
|||||||
| Media (Continued) | ||||||||
| DISH Network Corp., 144A, |
$ | 10,000 | $ | 9,605 | ||||
| GCI LLC, 144A, |
13,000 | 11,034 | ||||||
| Gray Escrow II, Inc., 144A, |
25,000 | 16,219 | ||||||
| Gray Television, Inc., 144A, |
10,000 | 6,450 | ||||||
| iHeartCommunications, Inc. |
12,000 | 9,131 | ||||||
| 8.375%, 5/1/27 |
20,000 | 11,350 | ||||||
| 144A,4.75%, 1/15/28 |
15,000 | 10,453 | ||||||
| LCPR Senior Secured Financing DAC, 144A, 5.125%, 7/15/29 |
21,000 | 17,430 | ||||||
| Liberty Interactive LLC, |
10,000 | 3,641 | ||||||
| McGraw-Hill Education, Inc. |
10,000 | 8,575 | ||||||
| 144A,8.00%, 8/1/29 |
10,000 | 8,350 | ||||||
| News Corp., 144A, |
35,000 | 30,846 | ||||||
| Nexstar Media, Inc., 144A, |
36,000 | 33,210 | ||||||
| Paramount Global, |
10,000 | 8,019 | ||||||
| Radiate Holdco LLC / Radiate Finance, Inc., 144A, 6.50%, 9/15/28 |
11,000 | 5,610 | ||||||
| Scripps Escrow II, Inc., 144A, |
10,000 | 7,000 | ||||||
| Sinclair Television Group, Inc., 144A, |
15,000 | 8,869 | ||||||
| Sirius XM Radio, Inc. |
18,000 | 16,425 | ||||||
| 144A,4.00%, 7/15/28 |
27,000 | 22,680 | ||||||
| 144A,5.50%, 7/1/29 |
17,000 | 14,875 | ||||||
| 144A,4.125%, 7/1/30 |
10,000 | 7,831 | ||||||
| 144A,3.875%, 9/1/31 |
18,000 | 13,415 | ||||||
| TEGNA, Inc. |
18,000 | 15,795 | ||||||
| 5.00%, 9/15/29 |
23,000 | 19,780 | ||||||
| Univision Communications, Inc. |
26,000 | 24,691 | ||||||
| 144A,4.50%, 5/1/29 |
18,000 | 15,205 | ||||||
| UPC Broadband Finco BV, 144A, |
10,000 | 8,499 | ||||||
| UPC Holding BV, 144A, |
20,000 | 17,600 | ||||||
| Urban One, Inc., 144A, |
10,000 | 9,050 | ||||||
| Videotron Ltd. |
10,000 | 9,925 | ||||||
| 144A,5.125%, 4/15/27 |
10,000 | 9,675 | ||||||
| 144A,3.625%, 6/15/29 |
10,000 | 8,653 | ||||||
| Virgin Media Finance PLC, 144A, |
18,000 | 14,310 | ||||||
| Virgin Media Secured Finance PLC |
20,000 | 18,075 | ||||||
| 144A,4.50%, 8/15/30 |
13,000 | 10,790 | ||||||
| Principal |
Value |
|||||||
| Media (Continued) | ||||||||
| Virgin Media Vendor Financing Notes IV DAC, |
$ | 5,000 | $ | 4,362 | ||||
| VZ Secured Financing BV, 144A, |
32,000 | 25,766 | ||||||
| Ziggo Bond Co. BV, 144A, |
10,000 | 9,261 | ||||||
| Ziggo BV, 144A, |
10,000 | 8,350 | ||||||
|
|
|
|||||||
| (Cost $1,264,695) |
1,040,547 | |||||||
|
|
|
|||||||
| Telecommunications — 5.3% | ||||||||
| Altice France Holding SA |
16,000 | 9,640 | ||||||
| 144A,6.00%, 2/15/28 |
18,000 | 9,000 | ||||||
| Altice France SA |
30,000 | 26,062 | ||||||
| 144A,5.50%, 1/15/28 |
40,000 | 30,600 | ||||||
| 144A,5.125%, 7/15/29 |
10,000 | 7,148 | ||||||
| British Telecommunications PLC, 144A, 4.875%, 11/23/81 |
10,000 | 8,150 | ||||||
| CommScope Technologies LLC |
35,000 | 32,987 | ||||||
| 144A,5.00%, 3/15/27 |
15,000 | 10,166 | ||||||
| CommScope, Inc. |
25,000 | 23,591 | ||||||
| 144A,8.25%, 3/1/27 |
10,000 | 7,837 | ||||||
| 144A,7.125%, 7/1/28 |
12,000 | 8,220 | ||||||
| 144A,4.75%, 9/1/29 |
20,000 | 15,953 | ||||||
| Connect Finco SARL / Connect US Finco LLC, |
20,000 | 19,350 | ||||||
| Consolidated Communications, Inc., 144A, 6.50%, 10/1/28 |
15,000 | 11,306 | ||||||
| Embarq Corp., |
18,000 | 8,910 | ||||||
| Frontier Communications Holdings LLC |
15,000 | 13,425 | ||||||
| 144A,6.75%, 5/1/29 |
13,000 | 9,652 | ||||||
| 144A,6.00%, 1/15/30 |
15,000 | 10,600 | ||||||
| GoTo Group, Inc., 144A, |
15,000 | 8,676 | ||||||
| Hughes Satellite Systems Corp., |
18,000 | 16,852 | ||||||
| Iliad Holding SASU, 144A, |
18,000 | 17,005 | ||||||
| Intelsat Jackson Holdings SA, 144A, |
33,000 | 30,439 | ||||||
| Level 3 Financing, Inc. |
25,000 | 15,758 | ||||||
| 144A,4.25%, 7/1/28 |
25,000 | 14,276 | ||||||
| 144A,3.625%, 1/15/29 |
16,000 | 8,680 | ||||||
| 144A,3.75%, 7/15/29 |
15,000 | 8,100 | ||||||
| 144A,3.875%, 11/15/29 |
10,000 | 7,400 | ||||||
| 144A,10.50%, 5/15/30 |
23,000 | 21,973 | ||||||
| Ligado Networks LLC |
21,952 | 7,326 | ||||||
| 144A, 17.50%, 5/1/24 PIK |
34,926 | 3,624 | ||||||
| Lumen Technologies, Inc., 144A, |
15,000 | 9,881 | ||||||
| See Notes to Financial Statements. | 35 |
DBX ETF Trust
Schedule of Investments
Xtrackers J.P. Morgan ESG USD High Yield Corporate Bond ETF (Continued)
May 31, 2023
| Principal |
Value |
|||||||
| Telecommunications (Continued) | ||||||||
| SoftBank Group Corp., REGS, |
$ | 80,000 | $ | 72,178 | ||||
| Sprint Capital Corp., |
12,000 | 12,832 | ||||||
| Telecom Italia Capital SA |
18,000 | 15,714 | ||||||
| 6.00%, 9/30/34 |
10,000 | 8,535 | ||||||
| 7.20%, 7/18/36 |
19,000 | 17,046 | ||||||
| 7.721%, 6/4/38 |
10,000 | 9,175 | ||||||
| Telesat Canada / Telesat LLC, 144A, |
10,000 | 6,075 | ||||||
| Viasat, Inc., 144A, |
27,000 | 26,077 | ||||||
| Vmed O2 UK Financing I PLC 144A, |
12,000 | 9,712 | ||||||
| 144A,4.75%, 7/15/31 |
20,000 | 16,525 | ||||||
| Vodafone Group PLC |
25,000 | 25,389 | ||||||
| 3.25%, 6/4/81 |
10,000 | 8,863 | ||||||
| 4.125%, 6/4/81 |
19,000 | 15,153 | ||||||
| 5.125%, 6/4/81 |
15,000 | 11,175 | ||||||
| Windstream Escrow LLC / Windstream Escrow Finance Corp., 144A, |
18,000 | 14,755 | ||||||
| Zayo Group Holdings, Inc., 144A, |
20,000 | 12,150 | ||||||
|
|
|
|||||||
| (Cost $874,419) |
713,941 | |||||||
|
|
|
|||||||
| Consumer, Cyclical — 22.4% | ||||||||
| Airlines — 1.8% | ||||||||
| Air Canada, 144A, |
15,000 | 14,003 | ||||||
| Allegiant Travel Co., 144A, |
12,000 | 11,940 | ||||||
| American Airlines Inc/AAdvantage Loyalty IP Ltd. 144A, |
35,000 | 34,702 | ||||||
| 144A,5.75%, 4/20/29 |
30,000 | 28,987 | ||||||
| American Airlines, Inc., 144A, |
36,000 | 39,510 | ||||||
| Delta Air Lines, Inc., |
30,000 | 31,500 | ||||||
| Hawaiian Brand Intellectual Property Ltd. / HawaiianMiles Loyalty Ltd., 144A, |
20,000 | 18,675 | ||||||
| United Airlines Holdings, Inc., |
40,000 | 39,539 | ||||||
| VistaJet Malta Finance PLC / Vista Management Holding, Inc., 144A, |
10,000 | 9,202 | ||||||
| VistaJet Malta Finance PLC / Vista Management Holding, Inc., 144A, |
10,000 | 8,000 | ||||||
|
|
|
|||||||
| (Cost $237,031) |
236,058 | |||||||
|
|
|
|||||||
| Apparel — 0.2% | ||||||||
| Crocs, Inc., 144A, |
15,000 | 12,187 | ||||||
| Principal |
Value |
|||||||
| Apparel (Continued) | ||||||||
| Hanesbrands, Inc., 144A, |
$ | 10,000 | $ | 9,338 | ||||
| Wolverine World Wide, Inc., 144A, |
10,000 | 7,986 | ||||||
|
|
|
|||||||
| (Cost $30,403) |
29,511 | |||||||
|
|
|
|||||||
| Auto Manufacturers — 2.5% | ||||||||
| Allison Transmission, Inc. 144A, |
15,000 | 14,606 | ||||||
| 144A,3.75%, 1/30/31 |
5,000 | 4,225 | ||||||
| Aston Martin Capital Holdings Ltd., 144A, 10.50%, 11/30/25 |
15,000 | 15,056 | ||||||
| Ford Motor Co. |
22,000 | 21,258 | ||||||
| 6.625%, 10/1/28 |
22,000 | 22,541 | ||||||
| 9.625%, 4/22/30 |
18,000 | 20,579 | ||||||
| 7.45%, 7/16/31 |
35,000 | 36,659 | ||||||
| 3.25%, 2/12/32 |
20,000 | 15,250 | ||||||
| 6.10%, 8/19/32 |
25,000 | 23,531 | ||||||
| 4.75%, 1/15/43 |
10,000 | 7,400 | ||||||
| 5.291%, 12/8/46 |
15,000 | 11,964 | ||||||
| Ford Motor Credit Co. LLC |
15,000 | 14,557 | ||||||
| 5.125%, 6/16/25 |
73,000 | 71,137 | ||||||
| 4.95%, 5/28/27 |
31,000 | 29,063 | ||||||
| Jaguar Land Rover Automotive PLC, 144A, 4.50%, 10/1/27 |
12,000 | 10,260 | ||||||
| Mclaren Finance PLC, 144A, |
12,000 | 10,200 | ||||||
| PM General Purchaser LLC, 144A, |
5,000 | 4,725 | ||||||
| Wabash National Corp., 144A, |
10,000 | 8,688 | ||||||
|
|
|
|||||||
| (Cost $354,006) |
341,699 | |||||||
|
|
|
|||||||
| Auto Parts & Equipment — 1.8% | ||||||||
| Adient Global Holdings Ltd. |
20,000 | 18,984 | ||||||
| 144A,8.25%, 4/15/31 |
8,000 | 8,000 | ||||||
| American Axle & Manufacturing, Inc., |
30,000 | 28,138 | ||||||
| Clarios Global LP / Clarios US Finance Co., 144A, 8.50%, 5/15/27 |
40,000 | 40,300 | ||||||
| Cooper-Standard Automotive, Inc., 144A, |
10,000 | 5,700 | ||||||
| Dana, Inc. |
25,000 | 23,479 | ||||||
| 4.25%, 9/1/30 |
10,000 | 8,127 | ||||||
| Dealer Tire LLC / DT Issuer LLC, 144A, |
10,000 | 9,225 | ||||||
| Dornoch Debt Merger Sub, Inc., 144A, |
10,000 | 7,550 | ||||||
| Goodyear Tire & Rubber Co. |
10,000 | 9,812 | ||||||
| 5.25%, 4/30/31 |
10,000 | 8,749 | ||||||
| 5.625%, 4/30/33 |
16,000 | 13,973 | ||||||
| See Notes to Financial Statements. | 36 |
DBX ETF Trust
Schedule of Investments
Xtrackers J.P. Morgan ESG USD High Yield Corporate Bond ETF (Continued)
May 31, 2023
| Principal |
Value |
|||||||
| Auto Parts & Equipment (Continued) | ||||||||
| Real Hero Merger Sub 2, Inc., 144A, |
$ | 12,000 | $ | 9,120 | ||||
| Titan International, Inc., |
10,000 | 9,147 | ||||||
| Wheel Pros, Inc., 144A, |
7,000 | 3,143 | ||||||
| ZF North America Capital, Inc. |
30,000 | 29,175 | ||||||
| 144A,7.125%, 4/14/30 |
15,000 | 15,120 | ||||||
|
|
|
|||||||
| (Cost $260,858) |
247,742 | |||||||
|
|
|
|||||||
| Distribution/Wholesale — 0.7% | ||||||||
| American Builders & Contractors Supply Co., Inc., 144A, |
10,000 | 9,100 | ||||||
| BCPE Empire Holdings, Inc., 144A, |
14,000 | 12,845 | ||||||
| G-III Apparel Group Ltd., 144A, |
10,000 | 9,500 | ||||||
| H&E Equipment Services, Inc., 144A, |
10,000 | 8,616 | ||||||
| OPENLANE, Inc., 144A, |
5,000 | 4,975 | ||||||
| Ritchie Bros Holdings, Inc., 144A, |
25,000 | 25,360 | ||||||
| Univar Solutions USA Inc., 144A, |
20,000 | 20,125 | ||||||
| Wesco Aircraft Holdings, Inc., 144A, |
2 | 0 | ||||||
|
|
|
|||||||
| (Cost $95,186) |
90,521 | |||||||
|
|
|
|||||||
| Entertainment — 3.2% | ||||||||
| Affinity Interactive, 144A, |
12,000 | 10,530 | ||||||
| Allen Media LLC / Allen Media Co.-Issuer, Inc., |
10,000 | 5,400 | ||||||
| AMC Entertainment Holdings, Inc., 144A, |
15,000 | 10,650 | ||||||
| Caesars Entertainment, Inc. |
50,000 | 50,125 | ||||||
| 144A,8.125%, 7/1/27 |
35,000 | 35,765 | ||||||
| 144A,4.625%, 10/15/29 |
15,000 | 13,007 | ||||||
| CDI Escrow Issuer, Inc., 144A, |
13,000 | 12,220 | ||||||
| Cedar Fair LP / Canada’s Wonderland Co. / Magnum Management Corp. / Millennium Op, |
25,000 | 23,877 | ||||||
| Churchill Downs, Inc., 144A, |
10,000 | 9,300 | ||||||
| Cinemark USA, Inc., 144A, |
10,000 | 8,875 | ||||||
| International Game Technology PLC |
20,000 | 20,250 | ||||||
| 144A,4.125%, 4/15/26 |
10,000 | 9,550 | ||||||
| 144A,6.25%, 1/15/27 |
20,000 | 20,061 | ||||||
| Jacobs Entertainment, Inc., 144A, |
10,000 | 8,775 | ||||||
| Principal |
Value |
|||||||
| Entertainment (Continued) | ||||||||
| Lions Gate Capital Holdings LLC, 144A, |
$ | 10,000 | $ | 7,150 | ||||
| Merlin Entertainments Ltd., 144A, |
19,000 | 18,383 | ||||||
| Midwest Gaming Borrower LLC / Midwest Gaming Finance Corp., 144A, |
18,000 | 15,958 | ||||||
| Mohegan Tribal Gaming Authority, 144A, |
15,000 | 13,129 | ||||||
| Penn Entertainment, Inc., 144A, |
22,000 | 20,688 | ||||||
| Premier Entertainment Sub LLC / Premier Entertainment Finance Corp. |
10,000 | 7,113 | ||||||
| 144A,5.875%, 9/1/31 |
10,000 | 6,886 | ||||||
| Resorts World Las Vegas LLC / RWLV Capital, Inc., 144A, |
10,000 | 8,071 | ||||||
| Scientific Games Holdings LP/Scientific Games US FinCo, Inc., 144A, |
15,000 | 13,256 | ||||||
| Scientific Games International, Inc., 144A, 7.25%, 11/15/29 |
22,000 | 21,973 | ||||||
| Six Flags Entertainment Corp., 144A, |
8,000 | 7,710 | ||||||
| Speedway Motorsports LLC / Speedway Funding II, Inc., 144A, |
15,000 | 13,875 | ||||||
| WMG Acquisition Corp., 144A, |
25,000 | 20,281 | ||||||
| Wynn Resorts Finance LLC / Wynn Resorts Capital Corp., 144A, |
12,000 | 10,744 | ||||||
|
|
|
|||||||
| (Cost $455,659) |
423,602 | |||||||
|
|
|
|||||||
| Food Service — 0.4% | ||||||||
| Aramark Services, Inc. |
10,000 | 9,775 | ||||||
| 144A,6.375%, 5/1/25 |
20,000 | 20,000 | ||||||
| 144A,5.00%, 2/1/28 |
16,000 | 15,201 | ||||||
| TKC Holdings, Inc., 144A, |
8,000 | 5,500 | ||||||
|
|
|
|||||||
| (Cost $54,220) |
50,476 | |||||||
|
|
|
|||||||
| Home Builders — 1.3% | ||||||||
| Ashton Woods USA LLC / Ashton Woods Finance Co., 144A, |
15,000 | 12,560 | ||||||
| Beazer Homes USA, Inc., |
10,000 | 9,271 | ||||||
| Brookfield Residential Properties, Inc. / Brookfield Residential US LLC, 144A, |
12,000 | 9,226 | ||||||
| Century Communities, Inc. |
10,000 | 10,043 | ||||||
| 144A,3.875%, 8/15/29 |
10,000 | 8,600 | ||||||
| Forestar Group, Inc., 144A, |
10,000 | 9,263 | ||||||
| See Notes to Financial Statements. | 37 |
DBX ETF Trust
Schedule of Investments
Xtrackers J.P. Morgan ESG USD High Yield Corporate Bond ETF (Continued)
May 31, 2023
| Principal |
Value |
|||||||
| Home Builders (Continued) | ||||||||
| K Hovnanian Enterprises, Inc., |
$ | 18,000 | $ | 18,398 | ||||
| KB Home, |
12,000 | 10,338 | ||||||
| M/I Homes, Inc., |
10,000 | 9,404 | ||||||
| Mattamy Group Corp., |
10,000 | 9,267 | ||||||
| Meritage Homes Corp., |
10,000 | 10,050 | ||||||
| Shea Homes LP / Shea Homes Funding Corp., |
10,000 | 8,871 | ||||||
| Taylor Morrison Communities, Inc., |
26,000 | 25,350 | ||||||
| Thor Industries, Inc., |
10,000 | 8,201 | ||||||
| TRI Pointe Group, Inc. / TRI Pointe Homes, Inc., |
20,000 | 19,846 | ||||||
|
|
|
|||||||
| (Cost $186,901) |
178,688 | |||||||
|
|
|
|||||||
| Home Furnishings — 0.1% | ||||||||
| Tempur Sealy International, Inc., |
||||||||
| (Cost $15,032) |
15,000 | 12,086 | ||||||
|
|
|
|||||||
| Housewares — 0.6% | ||||||||
| CD&R Smokey Buyer, Inc., |
10,000 | 8,850 | ||||||
| Newell Brands, Inc. |
20,000 | 18,600 | ||||||
| 5.875%, 4/1/36 |
10,000 | 8,050 | ||||||
| 6.00%, 4/1/46 |
11,000 | 8,140 | ||||||
| Scotts Miracle-Gro Co. |
25,000 | 23,875 | ||||||
| 4.00%, 4/1/31 |
10,000 | 7,989 | ||||||
| SWF Escrow Issuer Corp., |
10,000 | 6,063 | ||||||
|
|
|
|||||||
| (Cost $98,104) |
81,567 | |||||||
|
|
|
|||||||
| Leisure Time — 2.2% | ||||||||
| Carnival Corp. |
30,000 | 25,894 | ||||||
| 144A,9.875%, 8/1/27 |
30,000 | 31,125 | ||||||
| 144A,10.50%, 6/1/30 |
30,000 | 30,169 | ||||||
| Life Time, Inc., |
30,000 | 29,175 | ||||||
| MajorDrive Holdings IV LLC, |
10,000 | 7,700 | ||||||
| NCL Corp. Ltd. |
35,000 | 33,561 | ||||||
| 144A,5.875%, 3/15/26 |
27,000 | 24,705 | ||||||
| 144A,7.75%, 2/15/29 |
8,000 | 7,240 | ||||||
| Royal Caribbean Cruises Ltd. |
25,000 | 26,469 | ||||||
| 144A,5.50%, 8/31/26 |
15,000 | 14,175 | ||||||
| 144A,5.375%, 7/15/27 |
26,000 | 24,310 | ||||||
| 3.70%, 3/15/28 |
15,000 | 12,806 | ||||||
| 144A,5.50%, 4/1/28 |
12,000 | 11,055 | ||||||
| Principal |
Value |
|||||||
| Leisure Time (Continued) | ||||||||
| Viking Cruises Ltd., |
$ | 15,000 | $ | 13,256 | ||||
|
|
|
|||||||
| (Cost $288,888) |
291,640 | |||||||
|
|
|
|||||||
| Lodging — 2.0% | ||||||||
| Boyd Gaming Corp., |
10,000 | 8,912 | ||||||
| Genting New York LLC / GENNY Capital, Inc., |
11,000 | 9,834 | ||||||
| Hilton Domestic Operating Co., Inc. |
20,000 | 19,900 | ||||||
| 4.875%, 1/15/30 |
28,000 | 26,110 | ||||||
| 144A,4.00%, 5/1/31 |
16,000 | 13,907 | ||||||
| 144A,3.625%, 2/15/32 |
25,000 | 20,756 | ||||||
| Hilton Grand Vacations Borrower Escrow LLC / Hilton Grand Vacations Borrower Esc, |
26,000 | 23,231 | ||||||
| Las Vegas Sands Corp. |
15,000 | 14,471 | ||||||
| 3.90%, 8/8/29 |
20,000 | 17,763 | ||||||
| MGM Resorts International |
10,000 | 9,612 | ||||||
| 4.75%, 10/15/28 |
10,000 | 9,163 | ||||||
| Station Casinos LLC, |
15,000 | 13,463 | ||||||
| Travel + Leisure Co., |
40,000 | 38,666 | ||||||
| Wynn Las Vegas LLC / Wynn Las Vegas Capital Corp., |
45,000 | 44,246 | ||||||
|
|
|
|||||||
| (Cost $277,042) |
270,034 | |||||||
|
|
|
|||||||
| Office Furnishings — 0.1% | ||||||||
| Steelcase, Inc., |
||||||||
| (Cost $14,486) |
15,000 | 12,980 | ||||||
|
|
|
|||||||
| Retail — 5.4% | ||||||||
| 1011778 BC ULC / New Red Finance, Inc. |
24,000 | 22,067 | ||||||
| 144A,4.00%, 10/15/30 |
42,000 | 36,331 | ||||||
| Asbury Automotive Group, Inc., |
30,000 | 26,535 | ||||||
| At Home Group, Inc., |
8,000 | 8,040 | ||||||
| Bath & Body Works, Inc. |
40,000 | 38,192 | ||||||
| 6.875%, 11/1/35 |
16,000 | 14,600 | ||||||
| BCPE Ulysses Intermediate, Inc., |
10,000 | 8,697 | ||||||
| Beacon Roofing Supply, Inc., |
15,000 | 13,050 | ||||||
| Brinker International, Inc., |
25,000 | 24,687 | ||||||
| Carvana Co. |
5,000 | 2,888 | ||||||
| 144A,10.25%, 5/1/30 |
30,000 | 20,440 | ||||||
| See Notes to Financial Statements. | 38 |
DBX ETF Trust
Schedule of Investments
Xtrackers J.P. Morgan ESG USD High Yield Corporate Bond ETF (Continued)
May 31, 2023
| Principal |
Value |
|||||||
| Retail (Continued) | ||||||||
| eG Global Finance PLC, |
$ | 15,000 | $ | 14,455 | ||||
| Evergreen Acqco 1 LP / TVI, Inc., |
8,000 | 8,020 | ||||||
| Ferrellgas LP / Ferrellgas Finance Corp., |
10,000 | 8,350 | ||||||
| Fertitta Entertainment LLC / Fertitta Entertainment Finance Co., Inc. |
15,000 | 13,167 | ||||||
| 144A,6.75%, 1/15/30 |
16,000 | 13,060 | ||||||
| FirstCash, Inc., |
10,000 | 9,131 | ||||||
| Gap, Inc., |
10,000 | 7,063 | ||||||
| GPS Hospitality Holding Co. LLC / GPS Finco, Inc., |
10,000 | 6,350 | ||||||
| Group 1 Automotive, Inc., |
10,000 | 8,800 | ||||||
| IRB Holding Corp., |
20,000 | 20,108 | ||||||
| KFC Holding Co./Pizza Hut Holdings LLC/Taco Bell of America LLC, |
15,000 | 14,512 | ||||||
| Kohl’s Corp., |
10,000 | 5,632 | ||||||
| LBM Acquisition LLC, |
10,000 | 8,018 | ||||||
| LCM Investments Holdings II LLC, |
21,000 | 17,745 | ||||||
| Lithia Motors, Inc. |
15,000 | 14,044 | ||||||
| 144A,4.375%, 1/15/31 |
13,000 | 11,131 | ||||||
| LSF9 Atlantis Holdings LLC / Victra Finance Corp., |
17,000 | 15,810 | ||||||
| Macy’s Retail Holdings LLC |
5,000 | 4,337 | ||||||
| 144A,6.125%, 3/15/32 |
10,000 | 8,500 | ||||||
| 4.50%, 12/15/34 |
10,000 | 6,984 | ||||||
| Michaels Cos., Inc., |
23,000 | 14,330 | ||||||
| Murphy Oil USA, Inc., |
10,000 | 8,475 | ||||||
| NMG Holding Co, Inc. / Neiman Marcus Group LLC, |
15,000 | 13,552 | ||||||
| Nordstrom, Inc., |
30,000 | 23,922 | ||||||
| Park River Holdings, Inc., |
10,000 | 7,550 | ||||||
| Penske Automotive Group, Inc., |
10,000 | 9,515 | ||||||
| PetSmart, Inc. / PetSmart Finance Corp. 144A,4.75%, 2/15/28 |
25,000 | 23,156 | ||||||
| 144A,7.75%, 2/15/29 |
12,000 | 11,690 | ||||||
| Principal |
Value |
|||||||
| Retail (Continued) | ||||||||
| QVC, Inc. |
$ | 28,000 | $ | 24,080 | ||||
| 4.75%, 2/15/27 |
8,000 | 4,940 | ||||||
| Rite Aid Corp., |
8,000 | 4,280 | ||||||
| Sally Holdings LLC / Sally Capital, Inc., |
11,000 | 10,813 | ||||||
| Sizzling Platter LLC / Sizzling Platter Finance Corp., |
10,000 | 9,375 | ||||||
| Sonic Automotive, Inc. |
10,000 | 8,324 | ||||||
| 144A,4.875%, 11/15/31 |
10,000 | 8,006 | ||||||
| Specialty Building Products Holdings LLC / SBP Finance Corp., |
8,000 | 7,240 | ||||||
| SRS Distribution, Inc. |
11,000 | 9,185 | ||||||
| 144A,6.00%, 12/1/29 |
10,000 | 8,300 | ||||||
| Staples, Inc., |
39,000 | 32,370 | ||||||
| Suburban Propane Partners LP/Suburban Energy Finance Corp., |
10,000 | 8,628 | ||||||
| Superior Plus LP / Superior General Partner, Inc., |
10,000 | 8,841 | ||||||
| White Cap Buyer LLC, |
13,000 | 11,245 | ||||||
| Yum! Brands, Inc. |
20,000 | 18,850 | ||||||
| 5.35%, 11/1/43 |
10,000 | 8,842 | ||||||
|
|
|
|||||||
| (Cost $801,396) |
726,253 | |||||||
|
|
|
|||||||
| Toys/Games/Hobbies — 0.1% | ||||||||
| Mattel, Inc. |
5,000 | 4,876 | ||||||
| 5.45%, 11/1/41 |
10,000 | 8,258 | ||||||
|
|
|
|||||||
| (Cost $14,075) |
13,134 | |||||||
|
|
|
|||||||
| Consumer, Non-cyclical — 13.5% | ||||||||
| Agriculture — 0.2% | ||||||||
| Darling Ingredients, Inc. |
9,000 | 8,775 | ||||||
| 144A,6.00%, 6/15/30 |
20,000 | 19,780 | ||||||
|
|
|
|||||||
| (Cost $29,866) |
28,555 | |||||||
|
|
|
|||||||
| Beverages — 0.2% | ||||||||
| Primo Water Holdings, Inc., |
15,000 | 12,977 | ||||||
| Triton Water Holdings, Inc., |
10,000 | 8,400 | ||||||
|
|
|
|||||||
| (Cost $24,446) |
21,377 | |||||||
|
|
|
|||||||
| Biotechnology — 0.1% | ||||||||
| Emergent BioSolutions, Inc., |
5,000 | 2,800 | ||||||
| Grifols Escrow Issuer SA, |
10,000 | 8,500 | ||||||
|
|
|
|||||||
| (Cost $14,055) |
11,300 | |||||||
|
|
|
|||||||
| See Notes to Financial Statements. | 39 |
DBX ETF Trust
Schedule of Investments
Xtrackers J.P. Morgan ESG USD High Yield Corporate Bond ETF (Continued)
May 31, 2023
| Principal |
Value |
|||||||
| Commercial Services — 5.0% | ||||||||
| ADT Security Corp., |
$ | 10,000 | $ | 8,637 | ||||
| Adtalem Global Education, Inc., |
10,000 | 9,392 | ||||||
| Albion Financing 2SARL, |
10,000 | 8,675 | ||||||
| Allied Universal Holdco LLC / Allied Universal Finance Corp. |
25,000 | 23,698 | ||||||
| 144A,9.75%, 7/15/27 |
16,000 | 14,160 | ||||||
| 144A,6.00%, 6/1/29 |
15,000 | 11,175 | ||||||
| AMN Healthcare, Inc., |
20,000 | 18,600 | ||||||
| APi Group DE, Inc., |
10,000 | 8,753 | ||||||
| APX Group, Inc., |
18,000 | 15,521 | ||||||
| ASGN, Inc., |
10,000 | 9,087 | ||||||
| Avis Budget Car Rental LLC / Avis Budget Finance, Inc. |
10,000 | 8,966 | ||||||
| 144A,5.375%, 3/1/29 |
20,000 | 18,111 | ||||||
| Block, Inc., |
10,000 | 8,243 | ||||||
| Brink’s Co., |
10,000 | 9,375 | ||||||
| Cimpress PLC, |
5,000 | 4,387 | ||||||
| CoreLogic, Inc., |
12,000 | 9,712 | ||||||
| Deluxe Corp., |
8,000 | 6,160 | ||||||
| Garda World Security Corp. |
10,000 | 9,138 | ||||||
| 144A,6.00%, 6/1/29 |
12,000 | 9,630 | ||||||
| Gartner, Inc. |
10,000 | 9,424 | ||||||
| 144A,3.75%, 10/1/30 |
25,000 | 22,000 | ||||||
| Grand Canyon University, |
10,000 | 9,025 | ||||||
| Herc Holdings, Inc., |
20,000 | 19,095 | ||||||
| Hertz Corp. |
10,000 | 8,967 | ||||||
| 144A,5.00%, 12/1/29 |
10,000 | 8,079 | ||||||
| Metis Merger Sub LLC, |
10,000 | 8,400 | ||||||
| MPH Acquisition Holdings LLC |
10,000 | 8,002 | ||||||
| 144A,5.75%, 11/1/28 |
21,000 | 15,120 | ||||||
| Neptune Bidco US, Inc., |
40,000 | 36,800 | ||||||
| NESCO Holdings II, Inc., |
10,000 | 8,893 | ||||||
| Paysafe Finance PLC / Paysafe Holdings US Corp., |
11,000 | 8,971 | ||||||
| Principal |
Value |
|||||||
| Commercial Services (Continued) | ||||||||
| PECF USS Intermediate Holding III Corp., |
$ | 6,000 | $ | 3,165 | ||||
| Prime Security Services Borrower LLC / Prime Finance, Inc. |
30,000 | 29,438 | ||||||
| 144A,3.375%, 8/31/27 |
20,000 | 17,659 | ||||||
| 144A,6.25%, 1/15/28 |
25,000 | 23,025 | ||||||
| PROG Holdings, Inc., |
10,000 | 8,862 | ||||||
| RR Donnelley & Sons Co., |
15,000 | 16,575 | ||||||
| Sabre GLBL, Inc., |
15,000 | 12,825 | ||||||
| Service Corp. International |
10,000 | 9,500 | ||||||
| 4.00%, 5/15/31 |
30,000 | 25,763 | ||||||
| Sotheby’s/Bidfair Holdings, Inc., |
10,000 | 7,898 | ||||||
| TriNet Group, Inc., |
10,000 | 8,625 | ||||||
| United Rentals North America, Inc. |
25,000 | 23,920 | ||||||
| 5.25%, 1/15/30 |
15,000 | 14,292 | ||||||
| 3.875%, 2/15/31 |
10,000 | 8,640 | ||||||
| 3.75%, 1/15/32 |
27,000 | 22,754 | ||||||
| Upbound Group, Inc., |
10,000 | 8,843 | ||||||
| Verscend Escrow Corp., |
25,000 | 25,169 | ||||||
| WASH Multifamily Acquisition, Inc., |
10,000 | 8,950 | ||||||
| Williams Scotsman International, Inc., |
17,000 | 17,000 | ||||||
| ZipRecruiter, Inc., |
10,000 | 8,453 | ||||||
|
|
|
|||||||
| (Cost $727,809) |
675,552 | |||||||
|
|
|
|||||||
| Cosmetics/Personal Care — 0.3% | ||||||||
| Coty, Inc., |
25,000 | 24,687 | ||||||
| Edgewell Personal Care Co. |
10,000 | 9,400 | ||||||
| 144A,4.125%, 4/1/29 |
10,000 | 8,675 | ||||||
|
|
|
|||||||
| (Cost $43,628) |
42,762 | |||||||
|
|
|
|||||||
| Food — 1.5% | ||||||||
| B&G Foods, Inc., |
10,000 | 9,450 | ||||||
| Chobani LLC / Chobani Finance Corp., Inc., |
10,000 | 9,075 | ||||||
| Lamb Weston Holdings, Inc., |
20,000 | 17,925 | ||||||
| Performance Food Group, Inc. |
15,000 | 14,512 | ||||||
| 144A,4.25%, 8/1/29 |
15,000 | 13,275 | ||||||
| Post Holdings, Inc. |
10,000 | 9,690 | ||||||
| 144A,5.50%, 12/15/29 |
13,000 | 12,122 | ||||||
| See Notes to Financial Statements. | 40 |
DBX ETF Trust
Schedule of Investments
Xtrackers J.P. Morgan ESG USD High Yield Corporate Bond ETF (Continued)
May 31, 2023
| Principal |
Value |
|||||||
| Food (Continued) | ||||||||
| 144A,4.625%, 4/15/30 |
$ | 15,000 | $ | 13,162 | ||||
| 144A,4.50%, 9/15/31 |
18,000 | 15,278 | ||||||
| Safeway, Inc., |
10,000 | 10,213 | ||||||
| Sigma Holdco BV, |
12,000 | 10,230 | ||||||
| TreeHouse Foods, Inc., |
10,000 | 8,632 | ||||||
| United Natural Foods, Inc., |
10,000 | 9,352 | ||||||
| US Foods, Inc. |
30,000 | 30,075 | ||||||
| 144A,4.75%, 2/15/29 |
20,000 | 18,306 | ||||||
|
|
|
|||||||
| (Cost $214,599) |
201,297 | |||||||
|
|
|
|||||||
| Healthcare-Products — 1.2% | ||||||||
| Avantor Funding, Inc., |
46,000 | 42,669 | ||||||
| Embecta Corp., |
10,000 | 8,414 | ||||||
| Hologic, Inc., |
15,000 | 13,148 | ||||||
| Medline Borrower LP |
58,000 | 50,260 | ||||||
| 144A,5.25%, 10/1/29 |
30,000 | 25,837 | ||||||
| Teleflex, Inc., |
25,000 | 23,713 | ||||||
|
|
|
|||||||
| (Cost $185,218) |
164,041 | |||||||
|
|
|
|||||||
| Healthcare-Services — 3.4% | ||||||||
| Acadia Healthcare Co., Inc., |
5,000 | 4,606 | ||||||
| AHP Health Partners, Inc., |
10,000 | 8,650 | ||||||
| Air Methods Corp., |
10,000 | 650 | ||||||
| Akumin, Inc., |
6,000 | 4,875 | ||||||
| Catalent Pharma Solutions, Inc. |
10,000 | 9,175 | ||||||
| 144A,3.50%, 4/1/30 |
20,000 | 16,350 | ||||||
| Charles River Laboratories International, Inc., |
15,000 | 12,963 | ||||||
| CHS/Community Health Systems, Inc. |
10,000 | 9,359 | ||||||
| 144A,5.625%, 3/15/27 |
20,000 | 17,211 | ||||||
| 144A,6.875%, 4/1/28 |
10,000 | 5,650 | ||||||
| 144A,6.00%, 1/15/29 |
16,000 | 12,977 | ||||||
| 144A,6.875%, 4/15/29 |
21,000 | 12,020 | ||||||
| 144A,6.125%, 4/1/30 |
10,000 | 5,500 | ||||||
| 144A,5.25%, 5/15/30 |
15,000 | 11,325 | ||||||
| 144A,4.75%, 2/15/31 |
10,000 | 7,236 | ||||||
| DaVita, Inc. |
20,000 | 17,181 | ||||||
| 144A,3.75%, 2/15/31 |
5,000 | 3,976 | ||||||
| Encompass Health Corp. |
17,000 | 15,697 | ||||||
| 4.75%, 2/1/30 |
10,000 | 9,171 | ||||||
| 4.625%, 4/1/31 |
10,000 | 8,777 | ||||||
| Principal |
Value |
|||||||
| Healthcare-Services (Continued) | ||||||||
| Global Medical Response, Inc., |
$ | 10,000 | $ | 6,825 | ||||
| IQVIA, Inc., |
40,000 | 38,600 | ||||||
| Legacy LifePoint Health LLC |
10,000 | 8,925 | ||||||
| 144A,4.375%, 2/15/27 |
10,000 | 7,634 | ||||||
| LifePoint Health, Inc., |
10,000 | 4,975 | ||||||
| ModivCare Escrow Issuer, Inc., |
10,000 | 7,625 | ||||||
| Molina Healthcare, Inc. |
5,000 | 4,600 | ||||||
| 144A,3.875%, 11/15/30 |
10,000 | 8,592 | ||||||
| 144A,3.875%, 5/15/32 |
10,000 | 8,377 | ||||||
| Radiology Partners, Inc., |
10,000 | 2,850 | ||||||
| RegionalCare Hospital Partners Holdings, Inc. / LifePoint Health, Inc., |
10,000 | 7,500 | ||||||
| Select Medical Corp., |
15,000 | 14,625 | ||||||
| Team Health Holdings, Inc., |
11,000 | 4,895 | ||||||
| Tenet Healthcare Corp. |
10,000 | 10,025 | ||||||
| 4.875%, 1/1/26 |
20,000 | 19,475 | ||||||
| 5.125%, 11/1/27 |
10,000 | 9,562 | ||||||
| 6.125%, 10/1/28 |
30,000 | 28,584 | ||||||
| 4.25%, 6/1/29 |
15,000 | 13,543 | ||||||
| 4.375%, 1/15/30 |
15,000 | 13,388 | ||||||
| 144A,6.125%, 6/15/30 |
15,000 | 14,485 | ||||||
| 6.875%, 11/15/31 |
11,000 | 10,642 | ||||||
| Toledo Hospital, |
10,000 | 6,950 | ||||||
| US Acute Care Solutions LLC, |
15,000 | 12,750 | ||||||
| US Renal Care, Inc., |
10,000 | 2,950 | ||||||
|
|
|
|||||||
| (Cost $546,337) |
461,726 | |||||||
|
|
|
|||||||
| Household Products/Wares — 0.3% | ||||||||
| ACCO Brands Corp., |
10,000 | 8,475 | ||||||
| Central Garden & Pet Co., |
10,000 | 8,413 | ||||||
| Kronos Acquisition Holdings, Inc. / KIK Custom Products, Inc., |
10,000 | 9,175 | ||||||
| Spectrum Brands, Inc., |
10,000 | 8,268 | ||||||
|
|
|
|||||||
| (Cost $38,035) |
34,331 | |||||||
|
|
|
|||||||
| Pharmaceuticals — 1.3% | ||||||||
| AdaptHealth LLC, |
8,000 | 6,240 | ||||||
| Bausch Health Americas, Inc., |
5,000 | 4,175 | ||||||
| See Notes to Financial Statements. | 41 |
DBX ETF Trust
Schedule of Investments
Xtrackers J.P. Morgan ESG USD High Yield Corporate Bond ETF (Continued)
May 31, 2023
| Principal |
Value |
|||||||
| Pharmaceuticals (Continued) | ||||||||
| Bausch Health Cos., Inc. |
$ | 16,000 | $ | 14,340 | ||||
| 144A,5.00%, 1/30/28 |
3,000 | 1,365 | ||||||
| 144A,4.875%, 6/1/28 |
10,000 | 6,049 | ||||||
| 144A,11.00%, 9/30/28 |
12,000 | 9,105 | ||||||
| 144A,5.00%, 2/15/29 |
2,000 | 900 | ||||||
| 144A,6.25%, 2/15/29 |
3,000 | 1,350 | ||||||
| 144A,7.25%, 5/30/29 |
4,000 | 1,800 | ||||||
| 144A,5.25%, 2/15/31 |
4,000 | 1,740 | ||||||
| BellRing Brands, Inc., |
10,000 | 10,140 | ||||||
| Elanco Animal Health, Inc., |
10,000 | 9,613 | ||||||
| HLF Financing Sarl LLC / Herbalife International, Inc., |
12,000 | 8,280 | ||||||
| Jazz Securities DAC, |
15,000 | 13,452 | ||||||
| Lannett Co., Inc., |
7,000 | 455 | ||||||
| Mallinckrodt International Finance SA / Mallinckrodt CB LLC, |
15,000 | 11,278 | ||||||
| Option Care Health, Inc., |
10,000 | 8,675 | ||||||
| Organon & Co. / Organon Foreign Debt Co.-Issuer BV |
5,000 | 4,462 | ||||||
| 144A,5.125%, 4/30/31 |
40,000 | 34,150 | ||||||
| Owens & Minor, Inc., |
5,000 | 4,125 | ||||||
| P&L Development LLC / PLD Finance Corp., |
3,000 | 2,408 | ||||||
| Perrigo Finance Unlimited Co., |
10,000 | 8,722 | ||||||
| Prestige Brands, Inc., |
10,000 | 9,550 | ||||||
|
|
|
|||||||
| (Cost $218,547) |
172,374 | |||||||
|
|
|
|||||||
| Diversified — 0.1% | ||||||||
| Holding Companies-Diversified — 0.1% | ||||||||
| Stena International SA, |
||||||||
| (Cost $14,997) |
15,000 | 14,719 | ||||||
|
|
|
|||||||
| Energy — 12.3% | ||||||||
| Coal — 0.0% | ||||||||
| SunCoke Energy, Inc., |
||||||||
| (Cost $8,653) |
10,000 | 8,281 | ||||||
|
|
|
|||||||
| Energy-Alternate Sources — 0.2% | ||||||||
| Sunnova Energy Corp., |
10,000 | 8,803 | ||||||
| TerraForm Power Operating LLC, |
18,000 | 16,200 | ||||||
|
|
|
|||||||
| (Cost $27,324) |
25,003 | |||||||
|
|
|
|||||||
| Principal |
Value |
|||||||
| Oil & Gas — 6.3% | ||||||||
| Aethon United BR LP / Aethon United Finance Corp., |
$ | 10,000 | $ | 9,702 | ||||
| Antero Resources Corp., |
24,000 | 24,486 | ||||||
| Apache Corp. |
20,000 | 16,542 | ||||||
| 5.35%, 7/1/49 |
12,000 | 9,265 | ||||||
| Ascent Resources Utica Holdings LLC / ARU Finance Corp., |
25,000 | 24,199 | ||||||
| Callon Petroleum Co. |
10,000 | 9,775 | ||||||
| 144A,7.50%, 6/15/30 |
10,000 | 9,300 | ||||||
| Calumet Specialty Products Partners LP / Calumet Finance Corp., |
25,000 | 25,729 | ||||||
| Chesapeake Energy Corp., |
30,000 | 29,419 | ||||||
| CNX Resources Corp. |
2,000 | 1,986 | ||||||
| 144A,6.00%, 1/15/29 |
15,000 | 13,867 | ||||||
| Comstock Resources, Inc., |
31,000 | 27,357 | ||||||
| Crescent Energy Finance LLC, |
15,000 | 13,950 | ||||||
| CrownRock LP / CrownRock Finance, Inc., |
35,000 | 34,562 | ||||||
| CVR Energy, Inc., |
10,000 | 9,537 | ||||||
| Earthstone Energy Holdings LLC, |
10,000 | 9,752 | ||||||
| Encino Acquisition Partners Holdings LLC, |
10,000 | 9,237 | ||||||
| Endeavor Energy Resources LP / EER Finance, Inc., |
10,000 | 9,980 | ||||||
| Ensign Drilling, Inc., |
10,000 | 9,650 | ||||||
| Gulfport Energy Corp., |
20,000 | 20,180 | ||||||
| Hilcorp Energy I LP / Hilcorp Finance Co., |
20,000 | 18,258 | ||||||
| Ithaca Energy North Sea PLC, |
10,000 | 9,563 | ||||||
| Matador Resources Co., |
10,000 | 9,700 | ||||||
| Moss Creek Resources Holdings, Inc., |
10,000 | 9,244 | ||||||
| Murphy Oil Corp., |
7,000 | 5,763 | ||||||
| Nabors Industries Ltd., |
25,000 | 22,938 | ||||||
| Nabors Industries, Inc., |
20,000 | 18,890 | ||||||
| Neptune Energy Bondco PLC, |
27,000 | 26,582 | ||||||
| See Notes to Financial Statements. | 42 |
DBX ETF Trust
Schedule of Investments
Xtrackers J.P. Morgan ESG USD High Yield Corporate Bond ETF (Continued)
May 31, 2023
| Principal |
Value |
|||||||
| Oil & Gas (Continued) | ||||||||
| Northern Oil and Gas, Inc., |
$ | 10,000 | $ | 9,750 | ||||
| Occidental Petroleum Corp. |
16,000 | 16,008 | ||||||
| 3.50%, 8/15/29 |
15,000 | 13,063 | ||||||
| Parkland Corp. |
10,000 | 9,625 | ||||||
| 144A,4.625%, 5/1/30 |
25,000 | 21,673 | ||||||
| Patterson-UTI Energy, Inc. |
10,000 | 8,845 | ||||||
| 5.15%, 11/15/29 |
10,000 | 8,836 | ||||||
| PBF Holding Co. LLC / PBF Finance Corp., |
10,000 | 9,394 | ||||||
| Permian Resources Operating LLC, |
15,000 | 14,119 | ||||||
| Precision Drilling Corp., |
20,000 | 19,785 | ||||||
| Range Resources Corp., |
50,000 | 49,438 | ||||||
| Rockcliff Energy II LLC, |
10,000 | 9,200 | ||||||
| SM Energy Co., |
20,000 | 18,800 | ||||||
| Southwestern Energy Co. |
16,000 | 15,980 | ||||||
| 4.75%, 2/1/32 |
28,000 | 24,375 | ||||||
| Sunoco LP / Sunoco Finance Corp. |
10,000 | 9,850 | ||||||
| 4.50%, 5/15/29 |
10,000 | 8,925 | ||||||
| Tap Rock Resources LLC, |
10,000 | 9,375 | ||||||
| Transocean Poseidon Ltd., |
12,188 | 11,974 | ||||||
| Transocean, Inc. |
25,000 | 23,219 | ||||||
| 144A,8.00%, 2/1/27 |
10,000 | 8,875 | ||||||
| 144A,8.75%, 2/15/30 |
10,000 | 10,008 | ||||||
| 6.80%, 3/15/38 |
15,000 | 10,350 | ||||||
| Valaris Ltd., |
10,000 | 10,001 | ||||||
| Vermilion Energy, Inc., |
10,000 | 9,150 | ||||||
| Viper Energy Partners LP, |
10,000 | 9,643 | ||||||
| Vital Energy, Inc., |
40,000 | 39,800 | ||||||
|
|
|
|||||||
| (Cost $856,197) |
849,474 | |||||||
|
|
|
|||||||
| Oil & Gas Services — 0.9% | ||||||||
| Archrock Partners LP / Archrock Partners Finance Corp. |
10,000 | 9,638 | ||||||
| 144A,6.25%, 4/1/28 |
20,000 | 18,586 | ||||||
| CGG SA, |
8,000 | 6,880 | ||||||
| Enerflex Ltd., |
12,000 | 11,730 | ||||||
| Principal |
Value |
|||||||
| Oil & Gas Services (Continued) | ||||||||
| Oceaneering International, Inc., |
$ | 19,000 | $ | 18,585 | ||||
| USA Compression Partners LP / USA Compression Finance Corp., |
10,000 | 9,625 | ||||||
| Weatherford International Ltd., |
30,000 | 30,291 | ||||||
| Welltec International ApS, |
15,000 | 15,150 | ||||||
|
|
|
|||||||
| (Cost $123,682) |
120,485 | |||||||
|
|
|
|||||||
| Pipelines — 4.9% | ||||||||
| Antero Midstream Partners LP / Antero Midstream Finance Corp., |
50,000 | 48,023 | ||||||
| Blue Racer Midstream LLC / Blue Racer Finance Corp., |
15,000 | 15,262 | ||||||
| Buckeye Partners LP |
25,000 | 22,046 | ||||||
| 144A,4.50%, 3/1/28 |
25,000 | 22,072 | ||||||
| CQP Holdco LP / BIP-V Chinook Holdco LLC, |
20,000 | 17,928 | ||||||
| Crestwood Midstream Partners LP / Crestwood Midstream Finance Corp. |
30,000 | 29,593 | ||||||
| 144A,6.00%, 2/1/29 |
15,000 | 13,912 | ||||||
| 144A,7.375%, 2/1/31 |
18,000 | 17,666 | ||||||
| DT Midstream, Inc., |
30,000 | 25,312 | ||||||
| EnLink Midstream LLC, |
15,000 | 14,981 | ||||||
| EnLink Midstream Partners LP |
12,000 | 11,640 | ||||||
| 5.60%, 4/1/44 |
20,000 | 15,923 | ||||||
| 5.45%, 6/1/47 |
10,000 | 7,987 | ||||||
| EQM Midstream Partners LP |
25,000 | 24,432 | ||||||
| 144A,6.50%, 7/1/27 |
15,000 | 14,737 | ||||||
| 144A,4.50%, 1/15/29 |
15,000 | 13,202 | ||||||
| 144A,4.75%, 1/15/31 |
25,000 | 21,576 | ||||||
| 6.50%, 7/15/48 |
10,000 | 8,249 | ||||||
| Genesis Energy LP / Genesis Energy Finance Corp., |
25,000 | 24,101 | ||||||
| Global Partners LP / GLP Finance Corp., |
15,000 | 14,475 | ||||||
| Harvest Midstream I LP, |
15,000 | 14,395 | ||||||
| Hess Midstream Operations LP, |
30,000 | 26,063 | ||||||
| Holly Energy Partners LP / Holly Energy Finance Corp., |
15,000 | 13,913 | ||||||
| Howard Midstream Energy Partners LLC, |
10,000 | 9,303 | ||||||
| ITT Holdings LLC, |
20,000 | 16,050 | ||||||
| See Notes to Financial Statements. | 43 |
DBX ETF Trust
Schedule of Investments
Xtrackers J.P. Morgan ESG USD High Yield Corporate Bond ETF (Continued)
May 31, 2023
| Principal |
Value |
|||||||
| Pipelines (Continued) | ||||||||
| Kinetik Holdings LP, |
$ | 10,000 | $ | 9,500 | ||||
| New Fortress Energy, Inc. |
10,000 | 9,253 | ||||||
| 144A,6.50%, 9/30/26 |
10,000 | 8,891 | ||||||
| NGL Energy Operating LLC / NGL Energy Finance Corp., |
40,000 | 38,200 | ||||||
| NuStar Logistics LP, |
15,000 | 14,306 | ||||||
| Rockies Express Pipeline LLC, |
35,000 | 31,500 | ||||||
| Summit Midstream Holdings LLC / Summit Midstream Finance Corp., |
10,000 | 9,550 | ||||||
| Tallgrass Energy Partners LP / Tallgrass Energy Finance Corp. |
10,000 | 10,013 | ||||||
| 144A,6.00%, 12/31/30 |
20,000 | 17,475 | ||||||
| Venture Global Calcasieu Pass LLC |
12,000 | 10,500 | ||||||
| 144A,4.125%, 8/15/31 |
10,000 | 8,678 | ||||||
| 144A,3.875%, 11/1/33 |
20,000 | 16,431 | ||||||
| Western Midstream Operating LP, |
10,000 | 8,910 | ||||||
|
|
|
|||||||
| (Cost $682,448) |
656,048 | |||||||
|
|
|
|||||||
| Financial — 10.0% | ||||||||
| Banks — 0.3% | ||||||||
| First Republic Bank,4.625%, 2/13/47 |
10,000 | 175 | ||||||
| Freedom Mortgage Corp. |
10,000 | 9,590 | ||||||
| 144A,7.625%, 5/1/26 |
15,000 | 13,162 | ||||||
| Intesa Sanpaolo SpA |
10,000 | 7,574 | ||||||
| 144A,4.95%, 6/1/42 |
14,000 | 9,067 | ||||||
| Pacific Western Bank, |
10,000 | 3,250 | ||||||
|
|
|
|||||||
| (Cost $60,175) |
42,818 | |||||||
|
|
|
|||||||
| Diversified Financial Services — 3.9% | ||||||||
| Advisor Group Holdings, Inc., |
5,000 | 4,837 | ||||||
| AerCap Holdings NV, |
10,000 | 9,375 | ||||||
| AG Issuer LLC, |
10,000 | 9,275 | ||||||
| AG TTMT Escrow Issuer LLC, |
10,000 | 10,062 | ||||||
| Ally Financial, Inc., |
10,000 | 8,806 | ||||||
| Armor Holdco, Inc., |
10,000 | 8,473 | ||||||
| Burford Capital Global Finance LLC, |
10,000 | 9,325 | ||||||
| Castlelake Aviation Finance DAC, |
14,000 | 12,499 | ||||||
| Principal |
Value |
|||||||
| Diversified Financial Services (Continued) | ||||||||
| Cobra AcquisitionCo LLC, |
$ | 8,000 | $ | 4,870 | ||||
| Enact Holdings, Inc., |
10,000 | 9,879 | ||||||
| Finance of America Funding LLC, |
7,000 | 5,896 | ||||||
| Global Aircraft Leasing Co. Ltd., |
20,304 | 18,223 | ||||||
| goeasy Ltd., |
25,000 | 24,000 | ||||||
| Home Point Capital, Inc., |
10,000 | 9,000 | ||||||
| Jane Street Group / JSG Finance, Inc., |
10,000 | 8,575 | ||||||
| Jefferies Finance LLC / JFIN Co.-Issuer Corp., |
10,000 | 8,163 | ||||||
| Jefferson Capital Holdings LLC, |
10,000 | 8,076 | ||||||
| LD Holdings Group LLC |
5,000 | 4,006 | ||||||
| 144A,6.125%, 4/1/28 |
5,000 | 3,287 | ||||||
| LPL Holdings, Inc., |
25,000 | 21,947 | ||||||
| Midcap Financial Issuer Trust |
10,000 | 8,848 | ||||||
| 144A,5.625%, 1/15/30 |
12,000 | 9,420 | ||||||
| Nationstar Mortgage Holdings, Inc. |
20,000 | 18,340 | ||||||
| 144A,5.50%, 8/15/28 |
20,000 | 17,400 | ||||||
| Navient Corp. |
10,000 | 9,792 | ||||||
| MTN, 5.625%, 8/1/33 |
15,000 | 10,819 | ||||||
| NFP Corp. |
14,000 | 12,530 | ||||||
| 144A,6.875%, 8/15/28 |
30,000 | 25,032 | ||||||
| OneMain Finance Corp. |
70,000 | 67,638 | ||||||
| 7.125%, 3/15/26 |
10,000 | 9,614 | ||||||
| 5.375%, 11/15/29 |
20,000 | 16,400 | ||||||
| PennyMac Financial Services, Inc. |
5,000 | 4,030 | ||||||
| 144A,5.75%, 9/15/31 |
15,000 | 12,075 | ||||||
| PRA Group, Inc., |
11,000 | 8,305 | ||||||
| Rocket Mortgage LLC / Rocket Mortgage Co.-Issuer, Inc. |
18,000 | 15,817 | ||||||
| 144A,3.625%, 3/1/29 |
10,000 | 8,275 | ||||||
| 144A,3.875%, 3/1/31 |
20,000 | 15,850 | ||||||
| 144A,4.00%, 10/15/33 |
10,000 | 7,606 | ||||||
| SLM Corp., |
10,000 | 9,179 | ||||||
| StoneX Group, Inc., |
10,000 | 10,110 | ||||||
| Synchrony Financial, |
9,000 | 7,989 | ||||||
| See Notes to Financial Statements. | 44 |
DBX ETF Trust
Schedule of Investments
Xtrackers J.P. Morgan ESG USD High Yield Corporate Bond ETF (Continued)
May 31, 2023
| Principal |
Value |
|||||||
| Diversified Financial Services (Continued) | ||||||||
| United Wholesale Mortgage LLC |
$ | 10,000 | $ | 9,030 | ||||
| 144A,5.50%, 4/15/29 |
15,000 | 12,563 | ||||||
|
|
|
|||||||
| (Cost $566,624) |
525,236 | |||||||
|
|
|
|||||||
| Insurance — 1.8% | ||||||||
| Acrisure LLC / Acrisure Finance, Inc. |
32,000 | 30,400 | ||||||
| 144A,4.25%, 2/15/29 |
6,000 | 5,078 | ||||||
| Alliant Holdings Intermediate LLC / Alliant Holdings Co.-Issuer, |
10,000 | 8,600 | ||||||
| Alliant Holdings Intermediate LLC / Alliant Holdings
Co-Issuer |
12,000 | 10,857 | ||||||
| 144A,6.75%, 10/15/27 |
20,000 | 18,650 | ||||||
| AmWINS Group, Inc., |
15,000 | 13,462 | ||||||
| AssuredPartners, Inc., |
10,000 | 8,625 | ||||||
| BroadStreet Partners, Inc., |
14,000 | 12,077 | ||||||
| Genworth Holdings, Inc., |
5,000 | 3,324 | ||||||
| Global Atlantic Fin Co., |
10,000 | 7,875 | ||||||
| HUB International Ltd., |
46,000 | 45,540 | ||||||
| Jones Deslauriers Insurance Management, Inc., |
6,000 | 6,023 | ||||||
| Liberty Mutual Group, Inc. |
10,000 | 10,387 | ||||||
| 144A,4.30%, 2/1/61 |
10,000 | 5,981 | ||||||
| MBIA, Inc., |
10,000 | 9,275 | ||||||
| MGIC Investment Corp., |
15,000 | 14,288 | ||||||
| Ohio National Financial Services, Inc., |
12,000 | 11,229 | ||||||
| Ryan Specialty LLC, |
10,000 | 8,900 | ||||||
| USI, Inc., |
10,000 | 9,875 | ||||||
|
|
|
|||||||
| (Cost $257,435) |
240,446 | |||||||
|
|
|
|||||||
| Real Estate — 0.7% | ||||||||
| Cushman & Wakefield US Borrower LLC, |
10,000 | 8,925 | ||||||
| Five Point Operating Co. LP / Five Point Capital Corp., |
10,000 | 8,953 | ||||||
| Howard Hughes Corp. |
20,000 | 17,846 | ||||||
| 144A,4.375%, 2/1/31 |
10,000 | 8,052 | ||||||
| Hunt Cos., Inc., |
8,000 | 6,231 | ||||||
| Principal |
Value |
|||||||
| Real Estate (Continued) | ||||||||
| Kennedy-Wilson, Inc. |
$ | 15,000 | $ | 11,775 | ||||
| 5.00%, 3/1/31 |
10,000 | 7,480 | ||||||
| Newmark Group, Inc., |
10,000 | 9,950 | ||||||
| Realogy Group LLC / Realogy Co.-Issuer Corp., |
15,000 | 10,457 | ||||||
|
|
|
|||||||
| (Cost $106,906) |
89,669 | |||||||
|
|
|
|||||||
| Real Estate Investment Trusts — 3.0% | ||||||||
| Apollo Commercial Real Estate Finance, Inc., |
10,000 | 7,650 | ||||||
| Brookfield Property REIT, Inc. / BPR Cumulus LLC / BPR Nimbus LLC / GGSI Sellco LL, |
30,000 | 26,850 | ||||||
| Diversified Healthcare Trust |
6,000 | 5,850 | ||||||
| 4.375%, 3/1/31 |
15,000 | 10,875 | ||||||
| Global Net Lease, Inc. / Global Net Lease Operating Partnership LP, |
10,000 | 7,202 | ||||||
| HAT Holdings I LLC / HAT Holdings II LLC, |
10,000 | 7,600 | ||||||
| Iron Mountain, Inc. |
25,000 | 23,531 | ||||||
| 144A,5.25%, 7/15/30 |
25,000 | 22,500 | ||||||
| 144A,4.50%, 2/15/31 |
10,000 | 8,562 | ||||||
| 144A,5.625%, 7/15/32 |
20,000 | 17,900 | ||||||
| Ladder Capital Finance Holdings LLLP / Ladder Capital Finance Corp., |
20,000 | 17,042 | ||||||
| MPT Operating Partnership LP / MPT Finance Corp. |
25,000 | 20,594 | ||||||
| 3.50%, 3/15/31 |
15,000 | 10,162 | ||||||
| Office Properties Income Trust, |
10,000 | 4,850 | ||||||
| Park Intermediate Holdings LLC / PK Domestic Property LLC / PK Finance Co.-Issuer |
10,000 | 10,093 | ||||||
| 144A,5.875%, 10/1/28 |
11,000 | 10,082 | ||||||
| 144A,4.875%, 5/15/29 |
10,000 | 8,625 | ||||||
| RHP Hotel Properties LP / RHP Finance Corp., |
10,000 | 8,875 | ||||||
| RLJ Lodging Trust LP, |
10,000 | 8,410 | ||||||
| SBA Communications Corp. |
25,000 | 23,172 | ||||||
| 3.125%, 2/1/29 |
25,000 | 21,063 | ||||||
| Service Properties Trust |
10,000 | 9,890 | ||||||
| 7.50%, 9/15/25 |
12,000 | 11,790 | ||||||
| 4.95%, 2/15/27 |
15,000 | 12,502 | ||||||
| 4.95%, 10/1/29 |
10,000 | 7,600 | ||||||
| Starwood Property Trust, Inc. |
10,000 | 9,406 | ||||||
| 4.75%, 3/15/25 |
10,000 | 9,425 | ||||||
| 144A,4.375%, 1/15/27 |
10,000 | 8,475 | ||||||
| See Notes to Financial Statements. | 45 |
DBX ETF Trust
Schedule of Investments
Xtrackers J.P. Morgan ESG USD High Yield Corporate Bond ETF (Continued)
May 31, 2023
| Principal |
Value |
|||||||
| Real Estate Investment Trusts (Continued) | ||||||||
| Uniti Group LP / Uniti Group Finance, Inc. / CSL Capital LLC |
$ | 25,000 | $ | 24,242 | ||||
| 144A,4.75%, 4/15/28 |
13,000 | 10,494 | ||||||
| 144A,6.50%, 2/15/29 |
12,000 | 7,821 | ||||||
| XHR LP, |
10,000 | 8,613 | ||||||
|
|
|
|||||||
| (Cost $453,070) |
401,746 | |||||||
|
|
|
|||||||
| Venture Capital — 0.3% | ||||||||
| Compass Group Diversified Holdings LLC, |
18,000 | 15,903 | ||||||
| Icahn Enterprises LP / Icahn Enterprises Finance Corp. |
20,000 | 17,550 | ||||||
| 5.25%, 5/15/27 |
10,000 | 8,268 | ||||||
|
|
|
|||||||
| (Cost $49,049) |
41,721 | |||||||
|
|
|
|||||||
| Industrial — 11.8% | ||||||||
| Aerospace/Defense — 1.9% | ||||||||
| Bombardier, Inc. |
4,000 | 4,010 | ||||||
| 144A,7.125%, 6/15/26 |
20,000 | 19,713 | ||||||
| 144A,7.875%, 4/15/27 |
20,000 | 19,792 | ||||||
| 144A,7.45%, 5/1/34 |
10,000 | 11,150 | ||||||
| Howmet Aerospace, Inc. |
20,000 | 20,538 | ||||||
| 3.00%, 1/15/29 |
10,000 | 8,775 | ||||||
| 5.95%, 2/1/37 |
11,000 | 11,110 | ||||||
| Spirit AeroSystems, Inc. |
22,000 | 21,780 | ||||||
| 4.60%, 6/15/28 |
10,000 | 8,227 | ||||||
| 144A,9.375%, 11/30/29 |
15,000 | 16,044 | ||||||
| TransDigm, Inc. |
25,000 | 24,813 | ||||||
| 7.50%, 3/15/27 |
50,000 | 50,000 | ||||||
| 4.875%, 5/1/29 |
35,000 | 31,062 | ||||||
| Triumph Group, Inc., |
12,000 | 11,548 | ||||||
|
|
|
|||||||
| (Cost $258,626) |
258,562 | |||||||
|
|
|
|||||||
| Building Materials — 1.4% | ||||||||
| Builders FirstSource, Inc. |
10,000 | 9,312 | ||||||
| 144A,4.25%, 2/1/32 |
15,000 | 12,900 | ||||||
| Cornerstone Building Brands, Inc., |
12,000 | 8,910 | ||||||
| CP Atlas Buyer, Inc., |
10,000 | 7,400 | ||||||
| Emerald Debt Merger Sub LLC, |
20,000 | 19,875 | ||||||
| Griffon Corp., |
10,000 | 9,242 | ||||||
| James Hardie International Finance Dac, |
15,000 | 14,400 | ||||||
| JELD-WEN, Inc., |
15,000 | 13,106 | ||||||
| Principal |
Value |
|||||||
| Building Materials (Continued) | ||||||||
| Masonite International Corp., |
$ | 10,000 | $ | 8,500 | ||||
| New Enterprise Stone & Lime Co., Inc., |
10,000 | 8,875 | ||||||
| Oscar AcquisitionCo LLC / Oscar Finance, Inc., |
6,000 | 5,115 | ||||||
| Smyrna Ready Mix Concrete LLC, |
10,000 | 9,342 | ||||||
| Standard Industries, Inc. |
20,000 | 18,417 | ||||||
| 144A,4.375%, 7/15/30 |
17,000 | 14,433 | ||||||
| 144A,3.375%, 1/15/31 |
17,000 | 13,356 | ||||||
| Summit Materials LLC / Summit Materials Finance Corp., |
10,000 | 9,410 | ||||||
| Victors Merger Corp., |
10,000 | 6,476 | ||||||
|
|
|
|||||||
| (Cost $204,406) |
189,069 | |||||||
|
|
|
|||||||
| Electrical Components & Equipment — 0.4% | ||||||||
| Energizer Holdings, Inc., |
15,000 | 12,919 | ||||||
| WESCO Distribution, Inc., |
40,000 | 41,123 | ||||||
|
|
|
|||||||
| (Cost $54,908) |
54,042 | |||||||
|
|
|
|||||||
| Electronics — 0.7% | ||||||||
| Atkore, Inc., |
10,000 | 8,650 | ||||||
| Coherent Corp., |
20,000 | 17,886 | ||||||
| Imola Merger Corp., |
20,000 | 17,200 | ||||||
| Sensata Technologies BV, |
22,000 | 19,717 | ||||||
| Sensata Technologies, Inc., |
20,000 | 17,050 | ||||||
| TTM Technologies, Inc., |
12,000 | 10,216 | ||||||
|
|
|
|||||||
| (Cost $97,753) |
90,719 | |||||||
|
|
|
|||||||
| Engineering & Construction — 0.6% | ||||||||
| AECOM, |
10,000 | 9,700 | ||||||
| Artera Services LLC, |
15,000 | 12,896 | ||||||
| Brand Industrial Services, Inc., |
16,000 | 14,880 | ||||||
| Cellnex Finance Co. SA, |
12,000 | 8,981 | ||||||
| Global Infrastructure Solutions, Inc., |
10,000 | 8,550 | ||||||
| Railworks Holdings LP / Railworks Rally, Inc., |
10,000 | 9,400 | ||||||
| TopBuild Corp., |
10,000 | 8,500 | ||||||
| Tutor Perini Corp., |
5,000 | 3,835 | ||||||
|
|
|
|||||||
| (Cost $85,012) |
76,742 | |||||||
|
|
|
|||||||
| See Notes to Financial Statements. | 46 |
DBX ETF Trust
Schedule of Investments
Xtrackers J.P. Morgan ESG USD High Yield Corporate Bond ETF (Continued)
May 31, 2023
| Principal |
Value |
|||||||
| Environmental Control — 0.8% | ||||||||
| Clean Harbors, Inc. |
$ | 11,000 | $ | 10,574 | ||||
| 144A,5.125%, 7/15/29 |
5,000 | 4,750 | ||||||
| Covanta Holding Corp., |
18,000 | 15,480 | ||||||
| GFL Environmental, Inc. |
10,000 | 9,651 | ||||||
| 144A,3.75%, 8/1/25 |
10,000 | 9,550 | ||||||
| 144A,4.00%, 8/1/28 |
18,000 | 16,110 | ||||||
| 144A,3.50%, 9/1/28 |
10,000 | 8,975 | ||||||
| 144A,4.75%, 6/15/29 |
10,000 | 9,112 | ||||||
| Madison IAQ LLC, |
20,000 | 15,200 | ||||||
| Stericycle, Inc., |
10,000 | 8,850 | ||||||
|
|
|
|||||||
| (Cost $122,078) |
108,252 | |||||||
|
|
|
|||||||
| Machinery-Construction & Mining — 0.2% | ||||||||
| Terex Corp., |
10,000 | 9,317 | ||||||
| Vertiv Group Corp., |
10,000 | 8,981 | ||||||
| Weir Group PLC, |
15,000 | 13,444 | ||||||
|
|
|
|||||||
| (Cost $33,606) |
31,742 | |||||||
|
|
|
|||||||
| Machinery-Diversified — 0.5% | ||||||||
| Chart Industries, Inc., |
15,000 | 15,726 | ||||||
| GrafTech Finance, Inc., |
5,000 | 4,040 | ||||||
| Mueller Water Products, Inc., |
10,000 | 9,030 | ||||||
| SPX FLOW, Inc., |
11,000 | 9,598 | ||||||
| Titan Acquisition Ltd. / Titan Co-Borrower LLC, |
10,000 | 8,975 | ||||||
| TK Elevator Holdco GmbH, |
10,000 | 8,750 | ||||||
| TK Elevator US Newco, Inc., |
20,000 | 18,470 | ||||||
|
|
|
|||||||
| (Cost $74,936) |
74,589 | |||||||
|
|
|
|||||||
| Metal Fabricate/Hardware — 0.2% | ||||||||
| Advanced Drainage Systems, Inc., |
15,000 | 14,779 | ||||||
| Roller Bearing Co. of America, Inc., |
10,000 | 8,875 | ||||||
|
|
|
|||||||
| (Cost $24,023) |
23,654 | |||||||
|
|
|
|||||||
| Miscellaneous Manufacturing — 0.6% | ||||||||
| Amsted Industries, Inc., |
10,000 | 9,705 | ||||||
| Calderys Financing LLC, |
10,000 | 10,156 | ||||||
| FXI Holdings, Inc. |
10,000 | 9,287 | ||||||
| 144A,12.25%, 11/15/26 |
9,000 | 8,123 | ||||||
| Principal |
Value |
|||||||
| Miscellaneous Manufacturing (Continued) | ||||||||
| Gates Global LLC / Gates Corp., |
$ | 10,000 | $ | 9,875 | ||||
| Hillenbrand, Inc. |
15,000 | 14,909 | ||||||
| 3.75%, 3/1/31 |
10,000 | 8,413 | ||||||
| LSB Industries, Inc., |
15,000 | 13,650 | ||||||
|
|
|
|||||||
| (Cost $86,262) |
84,118 | |||||||
|
|
|
|||||||
| Packaging & Containers — 3.8% | ||||||||
| ARD Finance SA, |
18,000 | 14,030 | ||||||
| Ardagh Metal Packaging Finance USA LLC / Ardagh Metal Packaging Finance PLC |
15,000 | 14,771 | ||||||
| 144A,4.00%, 9/1/29 |
26,000 | 20,489 | ||||||
| Ardagh Packaging Finance PLC / Ardagh Holdings USA, Inc. |
10,000 | 9,812 | ||||||
| 144A,4.125%, 8/15/26 |
22,000 | 20,584 | ||||||
| 144A,5.25%, 8/15/27 |
15,000 | 12,619 | ||||||
| 144A,5.25%, 8/15/27 |
10,000 | 8,430 | ||||||
| Ball Corp. |
20,000 | 19,800 | ||||||
| 5.25%, 7/1/25 |
20,000 | 19,984 | ||||||
| 4.875%, 3/15/26 |
16,000 | 15,680 | ||||||
| 2.875%, 8/15/30 |
30,000 | 24,916 | ||||||
| 3.125%, 9/15/31 |
10,000 | 8,291 | ||||||
| Berry Global, Inc., |
10,000 | 9,900 | ||||||
| Cascades, Inc./Cascades USA, Inc., |
8,000 | 7,540 | ||||||
| Clearwater Paper Corp., |
10,000 | 8,865 | ||||||
| Clydesdale Acquisition Holdings, Inc., |
20,000 | 17,375 | ||||||
| Crown Americas LLC / Crown Americas Capital Corp. |
20,000 | 19,100 | ||||||
| Crown Cork & Seal Co., Inc., |
10,000 | 10,425 | ||||||
| Graphic Packaging International LLC |
46,000 | 45,278 | ||||||
| 144A,3.50%, 3/1/29 |
10,000 | 8,850 | ||||||
| 144A,3.75%, 2/1/30 |
10,000 | 8,825 | ||||||
| Intelligent Packaging Ltd Finco, Inc. / Intelligent Packaging Ltd Co.-Issuer LLC, |
10,000 | 8,297 | ||||||
| LABL, Inc. |
10,000 | 9,325 | ||||||
| 144A,5.875%, 11/1/28 |
15,000 | 13,612 | ||||||
| Mauser Packaging Solutions Holding Co., |
25,000 | 24,844 | ||||||
| OI European Group BV, |
10,000 | 9,056 | ||||||
| Owens-Brockway Glass Container, Inc., |
13,000 | 13,049 | ||||||
| See Notes to Financial Statements. | 47 |
DBX ETF Trust
Schedule of Investments
Xtrackers J.P. Morgan ESG USD High Yield Corporate Bond ETF (Continued)
May 31, 2023
| Principal |
Value |
|||||||
| Packaging & Containers (Continued) | ||||||||
| Pactiv Evergreen Group Issuer LLC / Pactiv Evergreen Group Issuer, Inc., |
$ | 15,000 | $ | 13,130 | ||||
| Pactiv Evergreen Group Issuer, Inc. /Pactiv Evergreen Group Issuer LLC, |
20,000 | 17,718 | ||||||
| Sealed Air Corp., |
27,000 | 26,933 | ||||||
| Sealed Air Corp./Sealed Air Corp., |
12,000 | 11,917 | ||||||
| Trident TPI Holdings, Inc., |
8,000 | 8,200 | ||||||
| TriMas Corp., |
10,000 | 8,928 | ||||||
| Trivium Packaging Finance BV, |
20,000 | 19,085 | ||||||
|
|
|
|||||||
| (Cost $542,512) |
509,658 | |||||||
|
|
|
|||||||
| Transportation — 0.4% | ||||||||
| Cargo Aircraft Management, Inc., |
10,000 | 8,787 | ||||||
| First Student Bidco, Inc. / First Transit Parent, Inc., |
10,000 | 8,372 | ||||||
| Navios South American Logistics, Inc. / Navios Logistics Finance US, Inc., |
10,000 | 9,725 | ||||||
| Rand Parent LLC, |
10,000 | 8,650 | ||||||
| Watco Cos. LLC / Watco Finance Corp., |
13,000 | 12,513 | ||||||
|
|
|
|||||||
| (Cost $52,761) |
48,047 | |||||||
|
|
|
|||||||
| Trucking & Leasing — 0.3% | ||||||||
| AerCap Global Aviation Trust, |
10,000 | 9,587 | ||||||
| Fortress Transportation and Infrastructure Investors LLC |
10,000 | 9,750 | ||||||
| 144A,5.50%, 5/1/28 |
18,000 | 16,249 | ||||||
|
|
|
|||||||
| (Cost $38,016) |
35,586 | |||||||
|
|
|
|||||||
| Technology — 4.8% | ||||||||
| Computers — 1.4% | ||||||||
| Ahead DB Holdings LLC, |
10,000 | 8,175 | ||||||
| Conduent Business Services LLC / Conduent State & Local Solutions, Inc., |
7,000 | 5,847 | ||||||
| Crowdstrike Holdings, Inc., |
15,000 | 13,144 | ||||||
| Diebold Nixdorf, Inc., |
10,000 | 2,306 | ||||||
| Exela Intermediate LLC / Exela Finance, Inc., |
15,000 | 1,875 | ||||||
| McAfee Corp., |
20,000 | 16,865 | ||||||
| Principal |
Value |
|||||||
| Computers (Continued) | ||||||||
| NCR Corp. |
$ | 20,000 | $ | 17,505 | ||||
| 144A,6.125%, 9/1/29 |
25,000 | 24,924 | ||||||
| Presidio Holdings, Inc., |
17,000 | 15,725 | ||||||
| Seagate HDD Cayman |
13,000 | 13,047 | ||||||
| 4.875%, 6/1/27 |
10,000 | 9,650 | ||||||
| 4.091%, 6/1/29 |
14,000 | 12,166 | ||||||
| 144A,9.625%, 12/1/32 |
20,625 | 22,584 | ||||||
| 5.75%, 12/1/34 |
10,000 | 8,651 | ||||||
| Unisys Corp., |
5,000 | 3,792 | ||||||
| Vericast Corp., |
10,000 | 10,475 | ||||||
| Virtusa Corp., |
10,000 | 8,025 | ||||||
|
|
|
|||||||
| (Cost $224,982) |
194,756 | |||||||
|
|
|
|||||||
| Office/Business Equipment — 0.2% | ||||||||
| Pitney Bowes, Inc., |
12,000 | 9,299 | ||||||
| Xerox Corp. |
10,000 | 9,663 | ||||||
| 6.75%, 12/15/39 |
16,000 | 11,575 | ||||||
|
|
|
|||||||
| (Cost $37,892) |
30,537 | |||||||
|
|
|
|||||||
| Semiconductors — 0.4% | ||||||||
| Amkor Technology, Inc., |
15,000 | 15,066 | ||||||
| Entegris Escrow Corp., |
10,000 | 9,685 | ||||||
| Entegris, Inc. |
10,000 | 9,240 | ||||||
| 144A,3.625%, 5/1/29 |
10,000 | 8,680 | ||||||
| ON Semiconductor Corp., |
15,000 | 13,621 | ||||||
|
|
|
|||||||
| (Cost $59,927) |
56,292 | |||||||
|
|
|
|||||||
| Software — 2.8% | ||||||||
| AthenaHealth Group, Inc., |
28,000 | 23,124 | ||||||
| Black Knight InfoServ LLC, |
12,000 | 10,800 | ||||||
| Boxer Parent Co., Inc. |
12,000 | 12,127 | ||||||
| 144A,9.125%, 3/1/26 |
10,000 | 9,863 | ||||||
| Camelot Finance SA, |
15,000 | 14,062 | ||||||
| Central Parent, Inc. / CDK Global, Inc., |
10,000 | 9,812 | ||||||
| Clarivate Science Holdings Corp., |
20,000 | 17,275 | ||||||
| Cloud Software Group, Inc. |
50,000 | 44,225 | ||||||
| 144A,9.00%, 9/30/29 |
50,000 | 42,469 | ||||||
| See Notes to Financial Statements. | 48 |
DBX ETF Trust
Schedule of Investments
Xtrackers J.P. Morgan ESG USD High Yield Corporate Bond ETF (Continued)
May 31, 2023
| Principal |
Value |
|||||||
| Software (Continued) | ||||||||
| Consensus Cloud Solutions, Inc., |
$ | 16,000 | $ | 13,982 | ||||
| Fair Isaac Corp., |
20,000 | 18,500 | ||||||
| MSCI, Inc. |
10,000 | 9,019 | ||||||
| 144A,3.875%, 2/15/31 |
10,000 | 8,634 | ||||||
| Open Text Corp., |
22,000 | 18,480 | ||||||
| Open Text Holdings, Inc., |
20,000 | 17,081 | ||||||
| PTC, Inc., |
25,000 | 24,161 | ||||||
| Rackspace Technology Global, Inc., |
10,000 | 2,650 | ||||||
| ROBLOX Corp., |
10,000 | 8,572 | ||||||
| Rocket Software, Inc., |
10,000 | 8,198 | ||||||
| SS&C Technologies, Inc., |
20,000 | 19,187 | ||||||
| Twilio, Inc., |
10,000 | 8,546 | ||||||
| Veritas US, Inc. / Veritas Bermuda Ltd., |
28,000 | 21,000 | ||||||
| West Technology Group LLC, |
10,000 | 8,937 | ||||||
|
|
|
|||||||
| (Cost $414,779) |
370,704 | |||||||
|
|
|
|||||||
| Utilities — 1.4% | ||||||||
| Electric — 1.3% | ||||||||
| Algonquin Power & Utilities Corp., |
15,000 | 11,963 | ||||||
| Atlantica Sustainable Infrastructure PLC, |
10,000 | 8,959 | ||||||
| Calpine Corp. |
21,000 | 20,399 | ||||||
| 144A,5.125%, 3/15/28 |
15,000 | 13,475 | ||||||
| 144A,4.625%, 2/1/29 |
10,000 | 8,500 | ||||||
| 144A,5.00%, 2/1/31 |
5,000 | 4,044 | ||||||
| 144A,3.75%, 3/1/31 |
17,000 | 13,912 | ||||||
| Clearway Energy Operating LLC |
20,000 | 18,675 | ||||||
| 144A,3.75%, 2/15/31 |
21,000 | 17,726 | ||||||
| NextEra Energy Operating Partners LP, |
28,000 | 26,075 | ||||||
| Pattern Energy Operations LP / Pattern Energy Operations, Inc., |
20,000 | 18,143 | ||||||
| Pike Corp., 144A, |
10,000 | 8,950 | ||||||
|
|
|
|||||||
| (Cost $184,666) |
170,821 | |||||||
|
|
|
|||||||
| Principal Amount |
Value | |||||||
| Gas — 0.1% | ||||||||
| AmeriGas Partners LP / AmeriGas Finance Corp., |
||||||||
| (Cost $18,963) |
$ | 20,000 | $ | 18,714 | ||||
|
|
|
|||||||
| TOTAL CORPORATE BONDS | ||||||||
| (Cost $14,417,013) |
13,123,756 | |||||||
|
|
|
|||||||
| Number |
||||||||
| CASH EQUIVALENTS — 0.7% | ||||||||
| DWS Government Money Market Series “Institutional Shares”, 5.04% (c) |
||||||||
| (Cost $91,008) |
91,008 | 91,008 | ||||||
|
|
|
|||||||
| TOTAL INVESTMENTS — 98.3% (Cost $14,508,021) |
$ | 13,214,764 | ||||||
| Other assets and liabilities, net — 1.7% |
231,762 | |||||||
|
|
|
|||||||
| NET ASSETS — 100.0% |
$ | 13,446,526 | ||||||
|
|
|
|||||||
| See Notes to Financial Statements. | 49 |
DBX ETF Trust
Schedule of Investments
Xtrackers J.P. Morgan ESG USD High Yield Corporate Bond ETF (Continued)
May 31, 2023
A summary of the Fund’s transactions with affiliated investments during the year ended May 31, 2023 is as follows:
| Value ($) at 5/31/2022 |
Purchases Cost ($) |
Sales Proceeds ($) |
Net Realized Gain/(Loss) ($) |
Net Change in Unrealized Appreciation (Depreciation) ($) |
Income ($) | Capital Gain Distributions ($) |
Number of Shares at 5/31/2023 |
Value ($) at 5/31/2023 |
||||||||||||||||||||||||||||
| CORPORATE BONDS — 0.0% |
|
|||||||||||||||||||||||||||||||||||
| Financial — 0.0% |
|
|||||||||||||||||||||||||||||||||||
| Deutsche Bank AG, 4.500%, 4/01/25 (e) |
|
|||||||||||||||||||||||||||||||||||
| 49,978 | — | (46,853 | ) | (5,709 | ) | 2,584 | 948 | — | — | — | ||||||||||||||||||||||||||
| Deutsche Bank AG, 3.729%, 1/14/32 (e) |
|
|||||||||||||||||||||||||||||||||||
| 25,278 | — | (20,917 | ) | (3,952 | ) | (409 | ) | 467 | — | — | — | |||||||||||||||||||||||||
| Deutsche Bank AG, 3.742%, 1/07/33 (e) |
| |||||||||||||||||||||||||||||||||||
| 24,707 | — | (20,817 | ) | (7,330 | ) | 3,440 | 429 | — | — | — | ||||||||||||||||||||||||||
| SECURITIES LENDING COLLATERAL — 0.0% |
| |||||||||||||||||||||||||||||||||||
| DWS Government & Agency Securities Portfolio “DWS Government Cash Institutional Shares”, 5.03% (c)(d) |
| |||||||||||||||||||||||||||||||||||
| 302,229 | — | (302,229 | )(f) | — | — | 6,635 | — | — | — | |||||||||||||||||||||||||||
| CASH EQUIVALENTS — 0.7% |
| |||||||||||||||||||||||||||||||||||
| DWS Government Money Market Series “Institutional Shares”, 5.04% (c) |
| |||||||||||||||||||||||||||||||||||
| 412,215 | 2,157,760 | (2,478,967 | ) | — | — | 4,170 | — | 91,008 | 91,008 | |||||||||||||||||||||||||||
|
|
|
|
|
|
|
|
|
|
|
|
|
|
|
|
|
|
|
|||||||||||||||||||
| 814,407 | 2,157,760 | (2,869,783 | ) | (16,991 | ) | 5,615 | 12,649 | — | 91,008 | 91,008 | ||||||||||||||||||||||||||
|
|
|
|
|
|
|
|
|
|
|
|
|
|
|
|
|
|
|
|||||||||||||||||||
| (a) | Defaulted security or security for which income has been deemed uncollectible. |
| (b) | Perpetual, callable security with no stated maturity date. |
| (c) | Affiliated fund managed by DWS Investment Management Americas, Inc. The rate shown is the annualized seven-day yield at period end. |
| (d) | Represents collateral held in connection with securities lending. Income earned by the Fund is net of borrower rebates. |
| (e) | Affiliated issuer. This security is owned in proportion with its representation in the index. |
| (f) | Represents the net increase (purchase cost) or decrease (sales proceeds) in the amount invested in cash collateral for the year ended May 31, 2023. |
| MTN: | Medium Term Note |
| PIK: | Denotes that all or a portion of the income is paid in-kind in the form of additional principal. |
| REIT: | Real Estate Investment Trust |
| REGS: | Securities sold under Regulation S may not be offered, sold or delivered within the United States or to, or for the account or benefit of, U.S. persons, except pursuant to an exemption from, or in a transaction not subject to, the registration requirements of the Securities Act of 1933. |
| 144A: | Security exempt from registration under Rule 144A of the Securities Act of 1933. These securities may be resold in transactions exempt from registration, normally to qualified institutional buyers. |
Fair Value Measurements
Various inputs are used in determining the value of the Fund’s investments. These inputs are summarized in three broad levels. Level 1 includes quoted prices in active markets for identical securities. Level 2 includes other significant observable inputs (including quoted prices for similar securities, interest rates, prepayment speeds and credit risk). Level 3 includes significant unobservable inputs (including the Fund’s own assumptions in determining the fair value of investments). The level assigned to the securities valuations may not be an indication of the risk or liquidity associated with investing in those securities.
The following is a summary of the inputs used as of May 31, 2023 in valuing the Fund’s investments. For information on the Fund’s policy regarding the valuation of investments, please refer to the Security Valuation section of Note 2 in the accompanying Notes to Financial Statements.
| Assets |
Level 1 | Level 2 | Level 3 | Total | ||||||||||||
| Corporate Bonds (a) |
$ | — | $ | 13,123,756 | $ | — | $ | 13,123,756 | ||||||||
| Short-Term Investments (a) |
91,008 | — | — | 91,008 | ||||||||||||
|
|
|
|
|
|
|
|
|
|||||||||
| TOTAL |
$ | 91,008 | $ | 13,123,756 | $ | — | $ | 13,214,764 | ||||||||
|
|
|
|
|
|
|
|
|
|||||||||
| (a) | See Schedule of Investments for additional detailed categorizations. |
| See Notes to Financial Statements. | 50 |
DBX ETF Trust
Schedule of Investments
Xtrackers Municipal Infrastructure Revenue Bond ETF
May 31, 2023
| Principal |
Value |
|||||||
| MUNICIPAL BONDS — 98.5% | ||||||||
| Arizona — 1.7% | ||||||||
| City of Mesa AZ Utility System Revenue, Multiple Utility Revenue, Series A, |
$ | 500,000 | $ | 537,335 | ||||
| City of Phoenix Civic Improvement Corp., Intergovernmental, Series A, |
705,000 | 771,664 | ||||||
| Salt River Project Agricultural Improvement & Power District, Electric, Power & Light
Revenue, |
500,000 | 536,484 | ||||||
| Series A, 3.00%, 1/1/49 |
65,000 | 50,886 | ||||||
|
|
|
|||||||
| (Cost $1,994,899) |
1,896,369 | |||||||
|
|
|
|||||||
| California — 18.9% | ||||||||
| Bay Area Toll Authority, Highway Revenue Tolls, |
535,000 | 396,643 | ||||||
| Series F-2, 2.60%, 4/1/56 |
160,000 | 107,453 | ||||||
| City of Los Angeles Department of Airports, Private Airport & Marina Revenue, |
25,000 | 28,256 | ||||||
| Series A, 5.00%, 5/15/36 |
35,000 | 39,194 | ||||||
| 5.00%, 5/15/37 |
45,000 | 49,914 | ||||||
| Series A, 5.00%, 5/15/38 |
300,000 | 332,189 | ||||||
| 5.00%, 5/15/39 |
40,000 | 44,177 | ||||||
| 5.00%, 5/15/40 |
55,000 | 60,547 | ||||||
| Series D, AMT, 5.00%, 5/15/43 |
125,000 | 129,947 | ||||||
| Series A, AMT, 4.00%, 5/15/44 |
700,000 | 665,129 | ||||||
| Series E, 5.00%, 5/15/44 |
25,000 | 26,712 | ||||||
| Series F, AMT, 5.00%, 5/15/44 |
200,000 | 207,545 | ||||||
| Series B, 5.00%, 5/15/45 |
260,000 | 283,877 | ||||||
| Series C, AMT, 5.00%, 5/15/45 |
50,000 | 52,180 | ||||||
| Series A, AMT, 5.00%, 5/15/46 |
600,000 | 627,431 | ||||||
| Series B, 5.00%, 5/15/48 |
250,000 | 271,299 | ||||||
| Series E, 5.00%, 5/15/48 |
20,000 | 21,289 | ||||||
| Series F, AMT, 3.00%, 5/15/49 |
330,000 | 239,603 | ||||||
| Series F, AMT, 4.00%, 5/15/49 |
200,000 | 184,497 | ||||||
| Series D, AMT, 5.00%, 5/15/49 |
100,000 | 102,393 | ||||||
| Series C, AMT, 4.00%, 5/15/50 |
500,000 | 460,720 | ||||||
| Series A, AMT, 5.00%, 5/15/51 |
135,000 | 140,270 | ||||||
| City of Sacramento CA Transient Occupancy Tax Revenue, Hotel Occupancy Tax, Series A, |
25,000 | 25,926 | ||||||
| City of San Francisco CA Public Utilities Commission Water Revenue, Water Revenue, |
340,000 | 259,898 | ||||||
| Series C, 4.00%, 11/1/50 |
600,000 | 586,370 | ||||||
| Los Angeles County Metropolitan Transportation Authority Sales Tax Revenue, Sales Tax
Revenue, |
40,000 | 41,226 | ||||||
| Series A, 5.00%, 7/1/44 |
430,000 | 459,872 | ||||||
| Principal |
Value |
|||||||
| California (Continued) | ||||||||
| Los Angeles Department of Water & Power Power System Revenue, Electric, Power & Light
Revenue, |
$ | 45,000 | $ | 49,656 | ||||
| Series B, 5.00%, 7/1/40 |
260,000 | 285,387 | ||||||
| Series D, 5.00%, 7/1/44 |
125,000 | 135,079 | ||||||
| Series A, 5.00%, 7/1/45 |
60,000 | 64,404 | ||||||
| Series C, 5.00%, 7/1/49 |
635,000 | 682,079 | ||||||
| Los Angeles Department of Water & Power Water System Revenue, Water Revenue, |
270,000 | 296,110 | ||||||
| Series B, 5.00%, 7/1/43 |
315,000 | 337,411 | ||||||
| Series A, 5.00%, 7/1/50 |
210,000 | 227,050 | ||||||
| Los Angeles Department of Water & Power, Electric, Power & Light Revenue, |
45,000 | 48,735 | ||||||
| Series B, 5.00%, 7/1/48 |
500,000 | 542,584 | ||||||
| Series A, 5.00%, 7/1/51 |
1,000,000 | 1,086,978 | ||||||
| Metropolitan Water District of Southern California, Water Revenue, |
25,000 | 27,904 | ||||||
| Series C, 5.00%, 7/1/40 |
100,000 | 111,025 | ||||||
| Series A, 5.00%, 10/1/45 |
225,000 | 244,959 | ||||||
| Riverside County Transportation Commission, Highway Revenue Tolls, |
50,000 | 47,599 | ||||||
| Series B-1, 4.00%, 6/1/46 |
10,000 | 9,188 | ||||||
| Series B-1, 3.00%, 6/1/49 |
600,000 | 433,461 | ||||||
| Sacramento County Sanitation Districts Financing Authority, Intergovernmental, |
30,000 | 35,465 | ||||||
| Sacramento Municipal Utility District, Electric, Power & Light Revenue, Series H, |
40,000 | 43,375 | ||||||
| San Diego County Regional Airport Authority, Private Airport & Marina Revenue, |
200,000 | 210,367 | ||||||
| Series B, AMT, 4.00%, 7/1/51 |
250,000 | 230,092 | ||||||
| Series A, 5.00%, 7/1/51 |
500,000 | 533,426 | ||||||
| Series B, AMT, 5.00%, 7/1/51 |
500,000 | 516,000 | ||||||
| Series A, 5.00%, 7/1/56 |
1,300,000 | 1,380,770 | ||||||
| San Francisco City & County Airport Commission-San Francisco
International Airport, Private Airport & Marina Revenue, |
515,000 | 542,596 | ||||||
| Series A, AMT, 5.00%, 5/1/39 |
50,000 | 52,324 | ||||||
| AMT, 5.00%, 5/1/43 |
320,000 | 329,240 | ||||||
| Series A, AMT, 5.00%, 5/1/44 |
810,000 | 838,655 | ||||||
| Series E, AMT, 5.00%, 5/1/45 |
1,225,000 | 1,266,186 | ||||||
| Series D, AMT, 5.00%, 5/1/48 |
75,000 | 76,400 | ||||||
| Series E, 5.00%, 5/1/48 |
25,000 | 26,263 | ||||||
| Series D, AMT, 5.25%, 5/1/48 |
870,000 | 898,027 | ||||||
| Series A, AMT, 4.00%, 5/1/49 |
1,000,000 | 916,809 | ||||||
| Series A, AMT, 5.00%, 5/1/49 |
200,000 | 205,765 | ||||||
| Series E, AMT, 5.00%, 5/1/50 |
370,000 | 380,344 | ||||||
| Series F, 5.00%, 5/1/50 |
900,000 | 947,618 | ||||||
| See Notes to Financial Statements. | 51 |
DBX ETF Trust
Schedule of Investments
Xtrackers Municipal Infrastructure Revenue Bond ETF (Continued)
May 31, 2023
| Principal |
Value |
|||||||
| California (Continued) | ||||||||
| San Francisco Municipal Transportation Agency, Transit Revenue, |
$ | 40,000 | $ | 38,541 | ||||
| Series C, 5.00%, 3/1/51 |
500,000 | 531,550 | ||||||
| Southern California Public Power Authority, Natural Gas Revenue, Series A, |
570,000 | 611,934 | ||||||
| State of California Department of Water Resources, Water Revenue, |
45,000 | 52,356 | ||||||
| Series BB, 5.00%, 12/1/34 |
25,000 | 29,039 | ||||||
| Series BB, 5.00%, 12/1/35 |
45,000 | 51,918 | ||||||
|
|
|
|||||||
| (Cost $23,952,572) |
21,219,226 | |||||||
|
|
|
|||||||
| Colorado — 4.2% | ||||||||
| Arkansas River Power Authority, Electric, Power & Light Revenue, Series A, |
215,000 | 213,892 | ||||||
| City & County of Denver Co. Airport System Revenue, Private Airport & Marina
Revenue, |
650,000 | 684,433 | ||||||
| Sub-Series A, AMT, 5.00%, 12/1/36 |
300,000 | 329,311 | ||||||
| Series A, AMT, 5.00%, 12/1/37 |
20,000 | 20,841 | ||||||
| Series A, AMT, 5.00%, 12/1/38 |
320,000 | 332,941 | ||||||
| Series A, AMT, 4.00%, 12/1/43 |
650,000 | 609,249 | ||||||
| Series A, AMT, 5.00%, 12/1/43 |
325,000 | 333,946 | ||||||
| Series A, AMT, 5.00%, 12/1/48 |
700,000 | 714,459 | ||||||
| Sub-Series B, 5.00%, 12/1/48 |
40,000 | 41,734 | ||||||
| Series D, 5.00%, 11/15/53 |
600,000 | 623,870 | ||||||
| City & County of Denver Co. Dedicated Excise Tax Revenue, Hotel Occupancy Tax,
Series A, |
700,000 | 675,793 | ||||||
| City of Colorado Springs CO Utilities System Revenue, Multiple Utility Revenue, Series B, |
100,000 | 95,653 | ||||||
|
|
|
|||||||
| (Cost $5,055,188) |
4,676,122 | |||||||
|
|
|
|||||||
| Connecticut — 0.3% | ||||||||
| State of Connecticut Special Tax Revenue, Fuel Sales Tax Revenue, |
25,000 | 28,174 | ||||||
| 5.00%, 5/1/37 |
100,000 | 110,146 | ||||||
| 5.00%, 5/1/38 |
100,000 | 109,593 | ||||||
| 5.00%, 5/1/40 |
120,000 | 130,472 | ||||||
|
|
|
|||||||
| (Cost $422,377) |
378,385 | |||||||
|
|
|
|||||||
| Delaware — 0.3% | ||||||||
| Delaware River & Bay Authority, Highway Revenue Tolls, |
330,000 | 321,080 | ||||||
|
|
|
|||||||
| District of Columbia — 4.8% | ||||||||
| District of Columbia Water & Sewer Authority, Water Revenue, Series B, |
250,000 | 263,230 | ||||||
| Principal |
Value |
|||||||
| District of Columbia (Continued) | ||||||||
| District of Columbia, Income Tax Revenue, |
$ | 110,000 | $ | 111,049 | ||||
| Series C, 4.00%, 5/1/45 |
500,000 | 492,916 | ||||||
| Series C, 5.00%, 5/1/45 |
170,000 | 183,278 | ||||||
| Metropolitan Washington Airports Authority Aviation Revenue, Private Airport & Marina
Revenue, |
850,000 | 882,529 | ||||||
| Series A, AMT, 5.00%, 10/1/48 |
175,000 | 178,922 | ||||||
| Metropolitan Washington Airports Authority Dulles Toll Road Revenue, Highway Revenue Tolls, |
1,000,000 | 941,651 | ||||||
| Series B, 5.00%, 10/1/47 |
500,000 | 516,715 | ||||||
| Series B, 4.00%, 10/1/49 |
300,000 | 274,827 | ||||||
| Series B, 3.00%, 10/1/50 |
600,000 | 445,845 | ||||||
| Series B, 4.00%, 10/1/53 |
1,200,000 | 1,081,217 | ||||||
|
|
|
|||||||
| (Cost $6,191,670) |
5,372,179 | |||||||
|
|
|
|||||||
| Florida — 9.5% | ||||||||
| Broward County FL Water & Sewer Utility Revenue, Water Revenue, Series A, |
240,000 | 234,927 | ||||||
| Central Florida Expressway Authority, Highway Revenue Tolls, Series D, |
40,000 | 45,281 | ||||||
| City of Gainesville FL Utilities System Revenue, Multiple Utility Revenue, |
380,000 | 402,898 | ||||||
| Series A, 5.00%, 10/1/47 |
215,000 | 227,051 | ||||||
| City of Tampa FL Water & Wastewater System Revenue, Water Revenue, Series A, |
1,000,000 | 1,069,572 | ||||||
| County of Broward FL Airport System Revenue, Private Airport & Marina Revenue, |
100,000 | 93,118 | ||||||
| Series A, AMT, 4.00%, 10/1/49 |
150,000 | 135,705 | ||||||
| County of Broward Fl Port Facilities Revenue, Private Airport & Marina Revenue,
Series B, |
55,000 | 50,526 | ||||||
| County of Broward FL Port Facilities Revenue, Private Airport & Marina Revenue, Series B,
AMT, |
500,000 | 471,493 | ||||||
| County of Miami-Dade FL Aviation Revenue, Private Airport & Marina Revenue, |
400,000 | 367,322 | ||||||
| Series A, AMT, 5.00%, 10/1/44 |
1,000,000 | 1,029,710 | ||||||
| Series A, AMT, 5.00%, 10/1/49 |
380,000 | 388,668 | ||||||
| County of Miami-Dade FL Transit System, Sales Tax Revenue, |
500,000 | 473,596 | ||||||
| Series A, 4.00%, 7/1/50 |
90,000 | 85,368 | ||||||
| See Notes to Financial Statements. | 52 |
DBX ETF Trust
Schedule of Investments
Xtrackers Municipal Infrastructure Revenue Bond ETF (Continued)
May 31, 2023
| Principal |
Value |
|||||||
| Florida (Continued) | ||||||||
| County of Miami-Dade Fl Water & Sewer System Revenue, Water Revenue, |
$ | 100,000 | $ | 91,396 | ||||
| County of Miami-Dade FL Water & Sewer System Revenue, Water Revenue, |
475,000 | 463,169 | ||||||
| 4.00%, 10/1/46 |
255,000 | 243,392 | ||||||
| 4.00%, 10/1/48 |
400,000 | 378,155 | ||||||
| 4.00%, 10/1/48 |
40,000 | 37,816 | ||||||
| Series B, 4.00%, 10/1/49 |
500,000 | 472,230 | ||||||
| 4.00%, 10/1/51 |
275,000 | 258,836 | ||||||
| County of Miami-Dade Seaport Department, Private Airport & Marina Revenue, Series A, |
300,000 | 316,362 | ||||||
| County of Osceola Fl Transportation Revenue, Highway Revenue Tolls,
Series A-1, |
400,000 | 344,403 | ||||||
| Greater Orlando Aviation Authority, Private Airport & Marina Revenue, |
165,000 | 171,007 | ||||||
| Series A, AMT, 4.00%, 10/1/49 |
500,000 | 456,612 | ||||||
| Series A, AMT, 4.00%, 10/1/52 |
300,000 | 275,413 | ||||||
| Sub-Series A, AMT, 5.00%, 10/1/52 |
605,000 | 613,512 | ||||||
| Series A, AMT, 3.25%, 10/1/54 |
250,000 | 186,292 | ||||||
| Hillsborough County Aviation Authority, Private Airport & Marina Revenue, Series F, |
195,000 | 204,165 | ||||||
| Hillsborough County Aviation Authority, Private Airport & Marina Revenue, Series A,
AMT, |
500,000 | 459,021 | ||||||
| Putnam County Development Authority, Electric, Power & Light Revenue, |
40,000 | 41,551 | ||||||
| State of Florida Department of Transportation Turnpike System Revenue, Highway Revenue Tolls,
Series C, |
200,000 | 158,559 | ||||||
| Tampa-Hillsborough County Expressway Authority, Highway Revenue Tolls, Series B, |
400,000 | 383,095 | ||||||
|
|
|
|||||||
| (Cost $11,987,669) |
10,630,221 | |||||||
|
|
|
|||||||
| Georgia — 2.6% | ||||||||
| City of Atlanta GA Department of Aviation, Private Airport & Marina Revenue, Series B,
AMT, |
200,000 | 182,735 | ||||||
| Development Authority of Burke County, Electric, Power & Light Revenue, |
25,000 | 22,386 | ||||||
| Series D, 4.125%, 11/1/45 |
355,000 | 317,883 | ||||||
| Georgia Ports Authority, Private Airport & Marina Revenue, |
765,000 | 747,014 | ||||||
| Principal |
Value |
|||||||
| Georgia (Continued) | ||||||||
| Georgia Ports Authority, Private Airport & Marina Revenue, |
$ | 320,000 | $ | 312,138 | ||||
| Main Street Natural Gas, Inc., Natural Gas Revenue, Series A, |
30,000 | 29,699 | ||||||
| Municipal Electric Authority of Georgia, Nuclear Revenue, |
500,000 | 515,842 | ||||||
| Series A, 5.50%, 7/1/63 |
750,000 | 769,425 | ||||||
|
|
|
|||||||
| (Cost $3,001,078) |
2,897,122 | |||||||
|
|
|
|||||||
| Hawaii — 0.8% | ||||||||
| State of Hawaii Airports System Revenue, Private Airport & Marina Revenue, Series A, AMT, |
400,000 | 410,801 | ||||||
| State of Hawaii Airports System Revenue, Private Airport & Marina Revenue, Series A,
AMT, |
500,000 | 517,986 | ||||||
|
|
|
|||||||
| (Cost $972,945) |
928,787 | |||||||
|
|
|
|||||||
| Illinois — 6.3% | ||||||||
| Chicago O’hare International Airport, Private Airport & Marina Revenue, |
200,000 | 204,476 | ||||||
| Series A, AMT, 5.00%, 1/1/55 |
500,000 | 510,868 | ||||||
| Chicago O’Hare International Airport, Private Airport & Marina Revenue, |
250,000 | 276,134 | ||||||
| Series A, AMT, 4.00%, 1/1/43 |
115,000 | 108,276 | ||||||
| Series B, 5.00%, 1/1/48 |
1,285,000 | 1,334,927 | ||||||
| Series B, 4.00%, 1/1/53 |
130,000 | 122,696 | ||||||
| Series A, AMT, 4.375%, 1/1/53 |
25,000 | 23,484 | ||||||
| Series B, 5.00%, 1/1/53 |
500,000 | 516,212 | ||||||
| Chicago Transit Authority Sales Tax Receipts Fund, Sales Tax Revenue, Series A, |
1,200,000 | 1,234,394 | ||||||
| City of Chicago IL Waterworks Revenue, Water Revenue, Series A, |
200,000 | 219,896 | ||||||
| Illinois Finance Authority, Water Revenue, |
25,000 | 25,033 | ||||||
| Illinois State Toll Highway Authority, Highway Revenue Tolls, |
30,000 | 32,788 | ||||||
| Series A, 4.00%, 1/1/44 |
850,000 | 821,665 | ||||||
| Series A, 5.00%, 1/1/44 |
800,000 | 842,993 | ||||||
| Series A, 5.00%, 1/1/45 |
775,000 | 824,265 | ||||||
|
|
|
|||||||
| (Cost $7,604,100) |
7,098,107 | |||||||
|
|
|
|||||||
| Louisiana — 0.3% | ||||||||
| East Baton Rouge Sewerage Commission, Sewer Revenue, Series A, |
245,000 | 236,470 | ||||||
| See Notes to Financial Statements. | 53 |
DBX ETF Trust
Schedule of Investments
Xtrackers Municipal Infrastructure Revenue Bond ETF (Continued)
May 31, 2023
| Principal |
Value |
|||||||
| Louisiana (Continued) | ||||||||
| Jefferson Sales Tax District, Sales Tax Revenue, Series B, |
$ | 115,000 | $ | 112,028 | ||||
|
|
|
|||||||
| (Cost $409,385) |
348,498 | |||||||
|
|
|
|||||||
| Maine — 0.0% | ||||||||
| Maine Turnpike Authority, Highway Revenue Tolls, |
40,000 | 41,993 | ||||||
|
|
|
|||||||
| Maryland — 0.6% | ||||||||
| Maryland State Transportation Authority, Highway Revenue Tolls, |
650,000 | 622,349 | ||||||
|
|
|
|||||||
| Massachusetts — 1.7% | ||||||||
| Commonwealth of Massachusetts, Hotel Occupancy Tax, |
185,000 | 216,258 | ||||||
| Massachusetts Bay Transportation Authority Sales Tax Revenue, Sales Tax Revenue, |
35,000 | 36,764 | ||||||
| Series A-1, 4.00%, 7/1/51 |
205,000 | 198,855 | ||||||
| Massachusetts Port Authority, Private Airport & Marina Revenue, |
400,000 | 413,636 | ||||||
| Series E, AMT, 5.00%, 7/1/46 |
500,000 | 521,427 | ||||||
| Series E, AMT, 5.00%, 7/1/51 |
505,000 | 523,236 | ||||||
|
|
|
|||||||
| (Cost $2,130,135) |
1,910,176 | |||||||
|
|
|
|||||||
| Michigan — 1.3% | ||||||||
| Lansing Board of Water & Light, Electric, Power & Light Revenue, |
600,000 | 634,235 | ||||||
| Series A, 5.00%, 7/1/48 |
90,000 | 94,759 | ||||||
| State of Michigan Trunk Line Revenue, Fuel Sales Tax Revenue, Series B, |
800,000 | 781,609 | ||||||
|
|
|
|||||||
| (Cost $1,676,437) |
1,510,603 | |||||||
|
|
|
|||||||
| Nevada — 1.6% | ||||||||
| City of Reno NV, Sales Tax Revenue, Series A, |
145,000 | 126,001 | ||||||
| County of Clark NV, Fuel Sales Tax Revenue, |
500,000 | 496,608 | ||||||
| County of Washoe NV, Fuel Sales Tax Revenue, |
50,000 | 52,952 | ||||||
| Las Vegas Convention & Visitors Authority, Hotel Occupancy Tax, |
840,000 | 873,927 | ||||||
| Series B, 4.00%, 7/1/49 |
290,000 | 266,727 | ||||||
|
|
|
|||||||
| (Cost $1,904,922) |
1,816,215 | |||||||
|
|
|
|||||||
| Principal |
Value |
|||||||
| New Jersey — 1.6% | ||||||||
| New Jersey Turnpike Authority, Highway Revenue Tolls, |
$ | 75,000 | $ | 76,636 | ||||
| Series G, 5.00%, 1/1/37 |
40,000 | 42,774 | ||||||
| Series G, 4.00%, 1/1/43 |
700,000 | 692,590 | ||||||
| Series A, 4.00%, 1/1/48 |
45,000 | 43,450 | ||||||
| Series A, 5.00%, 1/1/48 |
740,000 | 780,417 | ||||||
| Series B, 5.25%, 1/1/52 |
55,000 | 60,489 | ||||||
| South Jersey Transportation Authority, Highway Revenue Tolls, |
100,000 | 101,266 | ||||||
|
|
|
|||||||
| (Cost $1,854,360) |
1,797,622 | |||||||
|
|
|
|||||||
| New York — 17.8% | ||||||||
| Long Island Power Authority, Electric, Power & Light Revenue, |
50,000 | 55,020 | ||||||
| 5.00%, 9/1/38 |
90,000 | 96,911 | ||||||
| Metropolitan Transportation Authority, Transit Revenue, |
25,000 | 26,540 | ||||||
| Series C-1, 5.00%, 11/15/33 |
30,000 | 31,804 | ||||||
| Series C-1, 5.00%, 11/15/34 |
50,000 | 52,800 | ||||||
| Series C-1, 4.00%, 11/15/35 |
30,000 | 29,473 | ||||||
| Series C-1, 4.00%, 11/15/37 |
155,000 | 150,756 | ||||||
| Series C-1, 4.00%, 11/15/38 |
180,000 | 174,336 | ||||||
| Series D, 4.00%, 11/15/42 |
430,000 | 404,656 | ||||||
| Series A, Sub-Series A-2, 5.00%, 11/15/44 |
100,000 | 103,368 | ||||||
| Series E, 4.00%, 11/15/45 |
1,000,000 | 927,490 | ||||||
| Series C-1, 4.75%, 11/15/45 |
500,000 | 506,189 | ||||||
| Sub-Series A, 5.00%, 11/15/45 |
75,000 | 76,841 | ||||||
| Series D, 4.00%, 11/15/46 |
790,000 | 730,597 | ||||||
| Series D-2, 4.00%, 11/15/48 |
630,000 | 576,351 | ||||||
| Series A-1-GROUP 1, 5.00%, 11/15/48 |
600,000 | 613,161 | ||||||
| Series D-3, 4.00%, 11/15/49 |
140,000 | 127,468 | ||||||
| Series A-1, 4.00%, 11/15/50 |
35,000 | 33,503 | ||||||
| Series D-3, 4.00%, 11/15/50 |
250,000 | 226,638 | ||||||
| Series C-1, 5.00%, 11/15/50 |
700,000 | 714,813 | ||||||
| Series A-1, 4.00%, 11/15/52 |
550,000 | 494,706 | ||||||
| Series B, 5.00%, 11/15/52 |
115,000 | 117,489 | ||||||
| Series C-1, 5.25%, 11/15/55 |
250,000 | 258,186 | ||||||
| New York City Municipal Water Finance Authority, Water Revenue, |
35,000 | 37,494 | ||||||
| Series EE-2, 4.00%, 6/15/40 |
30,000 | 30,137 | ||||||
| Series AA, 5.00%, 6/15/40 |
95,000 | 103,235 | ||||||
| Series FF, 5.00%, 6/15/40 |
100,000 | 106,802 | ||||||
| Sub-Series EE-2, 5.00%, 6/15/40 |
535,000 | 578,188 | ||||||
| 4.00%, 6/15/42 |
400,000 | 400,008 | ||||||
| Series AA-2, 4.00%, 6/15/42 |
100,000 | 100,002 | ||||||
| Series BB2, 4.00%, 6/15/42 |
40,000 | 40,001 | ||||||
| Series CC-2, 4.00%, 6/15/42 |
25,000 | 25,000 | ||||||
| Series BB-1, 5.00%, 6/15/44 |
140,000 | 152,413 | ||||||
| Series BB-1, 4.00%, 6/15/45 |
255,000 | 251,743 | ||||||
| Series BB-1, 4.00%, 6/15/49 |
200,000 | 195,572 | ||||||
| Series CC-1, 4.00%, 6/15/49 |
200,000 | 195,572 | ||||||
| Series FF-1, 4.00%, 6/15/49 |
15,000 | 14,668 | ||||||
| See Notes to Financial Statements. | 54 |
DBX ETF Trust
Schedule of Investments
Xtrackers Municipal Infrastructure Revenue Bond ETF (Continued)
May 31, 2023
| Principal |
Value |
|||||||
| New York (Continued) | ||||||||
| Series BB-1, 5.00%, 6/15/49 |
$ | 270,000 | $ | 287,954 | ||||
| Series DD-1, 5.00%, 6/15/49 |
400,000 | 421,439 | ||||||
| Series DD-1, 5.25%, 6/15/49 |
70,000 | 74,944 | ||||||
| Series BB-1, 4.00%, 6/15/50 |
285,000 | 277,806 | ||||||
| Series GG-1, 4.00%, 6/15/50 |
305,000 | 297,301 | ||||||
| Sub-Series DD-1, 4.00%, 6/15/50 |
600,000 | 584,854 | ||||||
| Series AA-1, 5.00%, 6/15/50 |
140,000 | 149,722 | ||||||
| Series AA-1, 3.00%, 6/15/51 |
300,000 | 222,746 | ||||||
| Series CC-1, 5.00%, 6/15/51 |
250,000 | 268,058 | ||||||
| Series CC-1, 5.00%, 6/15/52 |
100,000 | 107,499 | ||||||
| New York Power Authority, Electric, Power & Light Revenue, |
35,000 | 34,649 | ||||||
| Series A, 4.00%, 11/15/47 |
115,000 | 110,913 | ||||||
| Series A, 4.00%, 11/15/50 |
75,000 | 73,331 | ||||||
| Series A, 4.00%, 11/15/55 |
500,000 | 479,892 | ||||||
| Series A, 3.25%, 11/15/60 |
1,150,000 | 886,958 | ||||||
| Series A, 4.00%, 11/15/60 |
675,000 | 640,010 | ||||||
| New York State Environmental Facilities Corp., Water Revenue, Series A, |
500,000 | 546,228 | ||||||
| Port Authority of New York & New Jersey, Private Airport & Marina Revenue,
Series 224, |
15,000 | 14,478 | ||||||
| Triborough Bridge & Tunnel Authority Sales Tax Revenue, Sales Tax Revenue, Series A, |
1,000,000 | 945,163 | ||||||
| Series A, 4.25%, 5/15/58 |
600,000 | 590,444 | ||||||
| Series A, 4.50%, 5/15/63 |
450,000 | 450,390 | ||||||
| Triborough Bridge & Tunnel Authority, Fuel Sales Tax Revenue,
Series D-2, |
300,000 | 338,499 | ||||||
| Triborough Bridge & Tunnel Authority, Miscellaneous
Taxes, |
600,000 | 576,061 | ||||||
| Series C-3, 3.00%, 5/15/51 |
600,000 | 447,811 | ||||||
| Series A-1, 5.00%, 5/15/51 |
2,000,000 | 2,138,953 | ||||||
| Series C-1A, 5.00%, 5/15/51 |
225,000 | 241,461 | ||||||
|
|
|
|||||||
| (Cost $22,247,936) |
19,967,495 | |||||||
|
|
|
|||||||
| North Carolina — 0.2% | ||||||||
| County of Union NC Enterprise System Revenue, Water Revenue, |
300,000 | 227,498 | ||||||
|
|
|
|||||||
| Ohio — 0.6% | ||||||||
| Franklin County Convention Facilities Authority, Industrial Revenue, |
100,000 | 91,609 | ||||||
| Northeast Ohio Regional Sewer District, Sewer Revenue, |
60,000 | 57,722 | ||||||
| Ohio Turnpike & Infrastructure Commission, Highway Revenue Tolls, |
10,000 | 9,604 | ||||||
| Series A, 5.00%, 2/15/46 |
275,000 | 298,096 | ||||||
| Principal |
Value |
|||||||
| Ohio (Continued) | ||||||||
| Ohio Water Development Authority, Intergovernmental, |
$ | 225,000 | $ | 246,772 | ||||
|
|
|
|||||||
| (Cost $796,553) |
703,803 | |||||||
|
|
|
|||||||
| Oregon — 0.8% | ||||||||
| Port of Portland OR Airport Revenue, Private Airport & Marina Revenue, |
315,000 | 324,382 | ||||||
| Series 28, AMT, 4.00%, 7/1/47 |
500,000 | 462,875 | ||||||
| State of Oregon Department of Transportation, Fuel Sales Tax Revenue, |
60,000 | 60,156 | ||||||
|
|
|
|||||||
| (Cost $883,732) |
847,413 | |||||||
|
|
|
|||||||
| Pennsylvania — 6.8% | ||||||||
| Allegheny County Airport Authority, Private Airport & Marina Revenue, |
700,000 | 653,085 | ||||||
| Series A, AMT, 5.00%, 1/1/51 |
500,000 | 515,168 | ||||||
| Series A, AMT, 4.00%, 1/1/56 |
500,000 | 450,457 | ||||||
| Chester County Industrial Development Authority, Recreational Revenue, |
245,000 | 231,997 | ||||||
| City of Philadelphia PA Water & Wastewater, Water Revenue, |
25,000 | 26,298 | ||||||
| Series A, 5.00%, 11/1/45 |
515,000 | 542,727 | ||||||
| Series A, 5.00%, 10/1/48 |
35,000 | 36,423 | ||||||
| Series A, 5.00%, 11/1/50 |
500,000 | 524,062 | ||||||
| Pennsylvania Turnpike Commission, Fran. Tax & Bus. LIC Fees, |
115,000 | 120,508 | ||||||
| Series A, 5.25%, 12/1/44 |
565,000 | 602,554 | ||||||
| Series A, 5.00%, 12/1/48 |
480,000 | 501,531 | ||||||
| Pennsylvania Turnpike Commission, Highway Revenue Tolls, |
230,000 | 241,500 | ||||||
| Series A, 4.00%, 12/1/46 |
20,000 | 19,129 | ||||||
| Series B, 4.00%, 12/1/46 |
390,000 | 373,012 | ||||||
| Series C, 5.00%, 12/1/46 |
45,000 | 47,701 | ||||||
| Series A, 5.00%, 12/1/47 |
55,000 | 58,662 | ||||||
| Sub-Series A, 4.00%, 12/1/49 |
285,000 | 274,154 | ||||||
| Series A, 5.00%, 12/1/49 |
15,000 | 15,676 | ||||||
| Series A, 4.00%, 12/1/50 |
255,000 | 237,179 | ||||||
| Series B, 5.00%, 12/1/50 |
1,705,000 | 1,792,371 | ||||||
| Series A, 4.00%, 12/1/51 |
65,000 | 61,755 | ||||||
| Series B, 4.00%, 12/1/51 |
300,000 | 276,701 | ||||||
| Series B, 5.00%, 12/1/51 |
15,000 | 15,795 | ||||||
|
|
|
|||||||
| (Cost $8,515,539) |
7,618,445 | |||||||
|
|
|
|||||||
| South Carolina — 1.0% | ||||||||
| South Carolina Ports Authority, Private Airport & Marina Revenue, Series B, |
200,000 | 179,405 | ||||||
| South Carolina Public Service Authority, Electric, Power & Light Revenue, |
475,000 | 448,065 | ||||||
| Series A, 4.00%, 12/1/52 |
600,000 | 543,620 | ||||||
|
|
|
|||||||
| (Cost $1,265,581) |
1,171,090 | |||||||
|
|
|
|||||||
| See Notes to Financial Statements. | 55 |
DBX ETF Trust
Schedule of Investments
Xtrackers Municipal Infrastructure Revenue Bond ETF (Continued)
May 31, 2023
| Principal |
Value |
|||||||
| Tennessee — 2.0% | ||||||||
| Metropolitan Government of Nashville & Davidson County TN Electric Revenue, Electric,
Power & Light Revenue, Series A, |
$ | 245,000 | $ | 266,512 | ||||
| Metropolitan Nashville Airport Authority, Private Airport & Marina Revenue, |
125,000 | 128,981 | ||||||
| Series B, AMT, 4.00%, 7/1/54 |
550,000 | 500,872 | ||||||
| Series A, 5.00%, 7/1/54 |
805,000 | 851,702 | ||||||
| Series B, AMT, 5.00%, 7/1/54 |
500,000 | 512,290 | ||||||
|
|
|
|||||||
| (Cost $2,516,280) |
2,260,357 | |||||||
|
|
|
|||||||
| Texas — 6.3% | ||||||||
| Central Texas Regional Mobility Authority, Highway Revenue Tolls, |
100,000 | 104,564 | ||||||
| Series B, 5.00%, 1/1/46 |
300,000 | 315,147 | ||||||
| Series B, 4.00%, 1/1/51 |
50,000 | 45,686 | ||||||
| City of Austin TX Electric Utility Revenue, Electric, Power & Light Revenue, |
125,000 | 133,325 | ||||||
| Series B, 5.00%, 11/15/49 |
125,000 | 132,558 | ||||||
| City of Austin TX Water & Wastewater System Revenue, Water Revenue, Series C, |
305,000 | 324,761 | ||||||
| City of Dallas TX Waterworks & Sewer System Revenue, Water Revenue, Series C, |
110,000 | 107,892 | ||||||
| City of Georgetown TX Utility System Revenue, Multiple Utility Revenue, |
500,000 | 494,688 | ||||||
| City of Houston TX Airport System Revenue, Private Airport & Marina Revenue, Sub-Series A, AMT, |
575,000 | 535,187 | ||||||
| City of Houston TX Combined Utility System, Water Revenue, |
165,000 | 161,599 | ||||||
| Series D, 5.00%, 11/15/43 |
30,000 | 31,802 | ||||||
| Series C, 3.00%, 11/15/47 |
145,000 | 109,849 | ||||||
| Series C, 4.00%, 11/15/49 |
55,000 | 53,087 | ||||||
| City of Lubbock TX Electric Light & Power System Revenue, Electric, Power & Light
Revenue, |
400,000 | 372,044 | ||||||
| City of San Antonio TX Electric & Gas Systems Revenue, Electric, Power & Light Revenue,
Series A, |
10,000 | 10,671 | ||||||
| Dallas Fort Worth International Airport, Private Airport & Marina Revenue, |
60,000 | 62,290 | ||||||
| 4.00%, 11/1/35 |
85,000 | 87,702 | ||||||
| Harris County Toll Road Authority, Highway Revenue Tolls, Series A, |
555,000 | 524,115 | ||||||
| 4.00%, 8/15/50 |
670,000 | 629,109 | ||||||
| Principal |
Value |
|||||||
| Texas (Continued) | ||||||||
| Harris County-Houston Sports Authority, Hotel Occupancy Tax, Series A, |
$ | 110,000 | $ | 80,631 | ||||
| Lower Colorado River Authority, Intergovernmental, |
250,000 | 265,510 | ||||||
| North Fort Bend Water Authority, Water Revenue, Series A, |
25,000 | 22,207 | ||||||
| North Texas Tollway Authority, Highway Revenue Tolls, |
25,000 | 25,193 | ||||||
| Series A, 5.00%, 1/1/38 |
65,000 | 69,260 | ||||||
| Series A, 5.00%, 1/1/43 |
385,000 | 402,591 | ||||||
| Series A, 5.00%, 1/1/48 |
500,000 | 519,857 | ||||||
| 4.25%, 1/1/49 |
30,000 | 29,069 | ||||||
| Series B, 3.00%, 1/1/51 |
250,000 | 182,815 | ||||||
| San Antonio Water System, Water Revenue, |
25,000 | 26,874 | ||||||
| Series A, 4.00%, 5/15/51 |
335,000 | 308,438 | ||||||
| Texas Water Development Board, Water Revenue, |
320,000 | 315,490 | ||||||
| 4.00%, 4/15/51 |
525,000 | 515,792 | ||||||
| West Harris County Regional Water Authority, Water Revenue, |
85,000 | 57,189 | ||||||
|
|
|
|||||||
| (Cost $8,091,428) |
7,056,992 | |||||||
|
|
|
|||||||
| Utah — 2.5% | ||||||||
| City of Salt Lake City UT Airport Revenue, Private Airport & Marina Revenue, |
400,000 | 410,435 | ||||||
| Series A, AMT, 5.00%, 7/1/48 |
1,000,000 | 1,019,681 | ||||||
| Series A, AMT, 5.25%, 7/1/48 |
225,000 | 231,953 | ||||||
| Intermountain Power Agency, Electric, Power & Light Revenue, Series A, |
1,000,000 | 1,093,748 | ||||||
|
|
|
|||||||
| (Cost $2,828,275) |
2,755,817 | |||||||
|
|
|
|||||||
| Virginia — 1.3% | ||||||||
| Hampton Roads Transportation Accountability Commission, Appropriations, |
275,000 | 267,549 | ||||||
| Series A, 5.00%, 7/1/50 |
40,000 | 42,938 | ||||||
| Series A, 4.00%, 7/1/55 |
700,000 | 671,117 | ||||||
| Series A, 5.00%, 7/1/60 |
500,000 | 535,682 | ||||||
|
|
|
|||||||
| (Cost $1,774,126) |
1,517,286 | |||||||
|
|
|
|||||||
| Washington — 2.3% | ||||||||
| Central Puget Sound Regional Transit Authority, Sales Tax
Revenue, |
20,000 | 19,989 | ||||||
| Series S-1, 4.00%, 11/1/46 |
700,000 | 677,778 | ||||||
| County of King WA Sewer Revenue, Sewer Revenue, Series A, |
500,000 | 473,392 | ||||||
| See Notes to Financial Statements. | 56 |
DBX ETF Trust
Schedule of Investments
Xtrackers Municipal Infrastructure Revenue Bond ETF (Continued)
May 31, 2023
| Principal |
Value |
|||||||
| Washington (Continued) | ||||||||
| Energy Northwest, Nuclear Revenue, Series A, |
$ | 300,000 | $ | 327,205 | ||||
| Port of Seattle WA, Private Airport & Marina Revenue, |
500,000 | 519,286 | ||||||
| Series B, AMT, 5.00%, 8/1/47 |
500,000 | 520,926 | ||||||
|
|
|
|||||||
| (Cost $2,778,829) |
2,538,576 | |||||||
|
|
|
|||||||
| West Virginia — 0.2% | ||||||||
| West Virginia Parkways Authority, Highway Revenue Tolls, |
250,000 | 271,630 | ||||||
|
|
|
|||||||
| Principal |
Value |
|||||||
| Wisconsin — 0.2% | ||||||||
| Wisconsin Health & Educational Facilities Authority, Electric, Power & Light Revenue, |
$ | 245,000 | $ | 257,182 | ||||
|
|
|
|||||||
| TOTAL MUNICIPAL BONDS |
||||||||
| (Cost $122,800,563) |
110,658,638 | |||||||
|
|
|
|||||||
| TOTAL INVESTMENTS — 98.5% (Cost $122,800,563) |
$ | 110,658,638 | ||||||
| Other assets and liabilities, net — 1.5% |
1,651,766 | |||||||
|
|
|
|||||||
| NET ASSETS — 100.0% |
$ | 112,310,404 | ||||||
|
|
|
|||||||
| AMT: | Alternative Minimum Tax |
Fair Value Measurements
Various inputs are used in determining the value of the Fund’s investments. These inputs are summarized in three broad levels. Level 1 includes quoted prices in active markets for identical securities. Level 2 includes other significant observable inputs (including quoted prices for similar securities, interest rates, prepayment speeds and credit risk). Level 3 includes significant unobservable inputs (including the Fund’s own assumptions in determining the fair value of investments). The level assigned to the securities valuations may not be an indication of the risk or liquidity associated with investing in those securities.
The following is a summary of the inputs used as of May 31, 2023 in valuing the Fund’s investments. For information on the Fund’s policy regarding the valuation of investments, please refer to the Security Valuation section of Note 2 in the accompanying Notes to Financial Statements.
| Assets |
Level 1 | Level 2 | Level 3 | Total | ||||||||||||
| Municipal Bonds (a) |
$ | — | $ | 110,658,638 | $ | — | $ | 110,658,638 | ||||||||
|
|
|
|
|
|
|
|
|
|||||||||
| TOTAL |
$ | — | $ | 110,658,638 | $ | — | $ | 110,658,638 | ||||||||
|
|
|
|
|
|
|
|
|
|||||||||
| (a) | See Schedule of Investments for additional detailed categorizations. |
| See Notes to Financial Statements. | 57 |
DBX ETF Trust
Schedule of Investments
Xtrackers MSCI All World ex US High Dividend Yield Equity ETF
May 31, 2023
| Number |
Value |
|||||||
| COMMON STOCKS — 97.3% | ||||||||
| Australia — 7.9% | ||||||||
| BHP Group Ltd. |
13,590 | $ | 369,556 | |||||
| Coles Group Ltd. |
3,496 | 40,679 | ||||||
| Fortescue Metals Group Ltd. |
4,568 | 56,818 | ||||||
| Medibank Pvt Ltd. |
7,029 | 16,239 | ||||||
| Rio Tinto Ltd. |
1,000 | 69,245 | ||||||
| Santos Ltd. |
8,889 | 41,936 | ||||||
| Wesfarmers Ltd. |
3,049 | 94,061 | ||||||
| Woodside Energy Group Ltd. |
5,096 | 113,117 | ||||||
|
|
|
|||||||
| (Cost $926,370) |
801,651 | |||||||
|
|
|
|||||||
| Austria — 0.2% | ||||||||
| OMV AG (Cost $20,462) |
386 | 17,152 | ||||||
|
|
|
|||||||
| Belgium — 0.2% | ||||||||
| Ageas SA/NV (a) (Cost $21,248) |
423 | 16,834 | ||||||
|
|
|
|||||||
| Brazil — 2.1% | ||||||||
| Ambev SA |
12,517 | 35,216 | ||||||
| B3 SA — Brasil Bolsa Balcao |
15,603 | 40,577 | ||||||
| BB Seguridade Participacoes SA |
1,870 | 11,293 | ||||||
| Engie Brasil Energia SA |
565 | 4,636 | ||||||
| TIM SA |
2,424 | 6,607 | ||||||
| Vale SA |
9,122 | 113,644 | ||||||
|
|
|
|||||||
| (Cost $230,303) |
211,973 | |||||||
|
|
|
|||||||
| Canada — 3.9% | ||||||||
| BCE, Inc. |
183 | 8,245 | ||||||
| Brookfield Asset Management Ltd., Class A |
937 | 28,607 | ||||||
| Canadian Tire Corp. Ltd., Class A |
135 | 16,194 | ||||||
| Great-West Lifeco, Inc. |
741 | 20,949 | ||||||
| IGM Financial, Inc. |
242 | 7,100 | ||||||
| Lundin Mining Corp. |
1,715 | 11,973 | ||||||
| Manulife Financial Corp. |
4,975 | 92,048 | ||||||
| Quebecor, Inc., Class B |
432 | 10,288 | ||||||
| Sun Life Financial, Inc. (a) |
1,576 | 76,232 | ||||||
| Suncor Energy, Inc. |
3,567 | 99,796 | ||||||
| TELUS Corp. |
1,280 | 24,220 | ||||||
|
|
|
|||||||
| (Cost $396,578) |
395,652 | |||||||
|
|
|
|||||||
| Cayman Islands — 0.1% | ||||||||
| Parade Technologies Ltd. (Cost $6,871) |
209 | 6,938 | ||||||
|
|
|
|||||||
| Chile — 0.2% | ||||||||
| Antofagasta PLC |
1,018 | 16,875 | ||||||
| Cia Sud Americana de Vapores SA |
46,532 | 3,404 | ||||||
|
|
|
|||||||
| (Cost $25,102) |
20,279 | |||||||
|
|
|
|||||||
| China — 6.1% | ||||||||
| Anhui Conch Cement Co. Ltd., Class A |
500 | 1,758 | ||||||
| Baoshan Iron & Steel Co. Ltd., Class A |
3,600 | 2,971 | ||||||
| China Coal Energy Co. Ltd., Class H |
5,027 | 3,802 | ||||||
| China Communications Services Corp. Ltd., Class H |
6,134 | 2,915 | ||||||
| China Conch Venture Holdings Ltd. |
4,169 | 5,240 | ||||||
| China Construction Bank Corp., Class A |
1,500 | 1,347 | ||||||
| Number |
Value |
|||||||
| China (Continued) | ||||||||
| China Construction Bank Corp., Class H |
258,074 | $ | 165,165 | |||||
| China Feihe Ltd., 144A |
10,000 | 5,812 | ||||||
| China Hongqiao Group Ltd. |
5,933 | 4,214 | ||||||
| China Lesso Group Holdings Ltd. |
2,634 | 1,740 | ||||||
| China Merchants Bank Co. Ltd., Class A |
3,200 | 14,505 | ||||||
| China Merchants Bank Co. Ltd., Class H |
10,586 | 49,223 | ||||||
| China Pacific Insurance Group Co. Ltd., Class A |
1,200 | 4,690 | ||||||
| China Pacific Insurance Group Co. Ltd., Class H |
7,200 | 18,211 | ||||||
| China Petroleum & Chemical Corp., Class H |
66,655 | 41,977 | ||||||
| China Railway Group Ltd., Class H |
11,350 | 7,481 | ||||||
| China Shenhua Energy Co. Ltd., Class A |
1,156 | 4,580 | ||||||
| China Shenhua Energy Co. Ltd., Class H |
8,945 | 28,281 | ||||||
| China State Construction Engineering Corp. Ltd., Class A |
7,000 | 5,796 | ||||||
| China Vanke Co. Ltd., Class A |
900 | 1,799 | ||||||
| China Vanke Co. Ltd., Class H |
6,895 | 9,107 | ||||||
| COSCO SHIPPING Holdings Co. Ltd., Class A |
2,000 | 2,930 | ||||||
| COSCO SHIPPING Holdings Co. Ltd., Class H |
8,151 | 7,185 | ||||||
| CRRC Corp. Ltd., Class H |
10,902 | 6,754 | ||||||
| Daan Gene Co. Ltd., Class A (b) |
400 | 687 | ||||||
| Daqin Railway Co. Ltd., Class A |
2,300 | 2,466 | ||||||
| Gree Electric Appliances, Inc. of Zhuhai, Class A |
400 | 1,851 | ||||||
| Guanghui Energy Co. Ltd., Class A |
1,300 | 1,325 | ||||||
| Henan Shuanghui Investment & Development Co. Ltd., Class A |
600 | 2,070 | ||||||
| Hengli Petrochemical Co. Ltd., Class A |
944 | 2,092 | ||||||
| Huaibei Mining Holdings Co. Ltd., Class A |
600 | 1,102 | ||||||
| Huaxin Cement Co. Ltd., Class A |
459 | 819 | ||||||
| Hunan Valin Steel Co. Ltd., Class A |
1,600 | 1,091 | ||||||
| Industrial & Commercial Bank of China Ltd., Class A |
9,500 | 6,439 | ||||||
| Industrial & Commercial Bank of China Ltd., Class H |
152,046 | 81,381 | ||||||
| Inner Mongolia Junzheng Energy & Chemical Industry Group Co. Ltd., Class A |
1,253 | 772 | ||||||
| Jiangsu Expressway Co. Ltd., Class H |
2,966 | 2,868 | ||||||
| Jiangxi Copper Co. Ltd., Class H |
3,278 | 4,933 | ||||||
| LB Group Co. Ltd., Class A |
500 | 1,101 | ||||||
| Lenovo Group Ltd. |
19,695 | 18,517 | ||||||
| Livzon Pharmaceutical Group, Inc., Class A (b) |
107 | 588 | ||||||
| New China Life Insurance Co. Ltd., Class A |
300 | 1,549 | ||||||
| New China Life Insurance Co. Ltd., Class H |
2,455 | 6,351 | ||||||
| People’s Insurance Co. Group of China Ltd., Class H |
21,542 | 8,145 | ||||||
| PICC Property & Casualty Co. Ltd., Class H |
18,026 | 21,484 | ||||||
| Pingdingshan Tianan Coal Mining Co. Ltd., Class A |
600 | 673 | ||||||
| See Notes to Financial Statements. | 58 |
DBX ETF Trust
Schedule of Investments
Xtrackers MSCI All World ex US High Dividend Yield Equity ETF (Continued)
May 31, 2023
| Number |
Value |
|||||||
| China (Continued) | ||||||||
| Postal Savings Bank of China Co. Ltd., Class A |
4,926 | $ | 3,553 | |||||
| Postal Savings Bank of China Co. Ltd., Class H, 144A |
22,487 | 14,133 | ||||||
| Qifu Technology, Inc., ADR |
279 | 3,836 | ||||||
| Shaanxi Coal Industry Co. Ltd., Class A |
1,800 | 4,234 | ||||||
| Shanxi Coking Coal Energy Group Co. Ltd., Class A |
700 | 968 | ||||||
| Sinopharm Group Co. Ltd., Class H |
3,378 | 11,068 | ||||||
| Topsports International Holdings Ltd., 144A |
5,059 | 3,929 | ||||||
| Uni-President China Holdings Ltd. (b) |
3,016 | 2,620 | ||||||
| Yankuang Energy Group Co. Ltd., Class A |
400 | 1,523 | ||||||
| Yankuang Energy Group Co. Ltd., Class H (a) |
3,937 | 9,978 | ||||||
| Youngor Group Co. Ltd., Class A |
1,100 | 1,061 | ||||||
| Zangge Mining Co. Ltd., Class A |
300 | 967 | ||||||
| Zhejiang NHU Co. Ltd., Class A (b) |
700 | 1,483 | ||||||
| Zhuzhou Kibing Group Co. Ltd., Class A (b) |
800 | 907 | ||||||
|
|
|
|||||||
| (Cost $768,142) |
626,047 | |||||||
|
|
|
|||||||
| Cyprus — 0.0% | ||||||||
| Polymetal International PLC (b)(c) (Cost $33,157) |
1,987 | 0 | ||||||
|
|
|
|||||||
| Czech Republic — 0.3% | ||||||||
| CEZ AS |
421 | 18,856 | ||||||
| Komercni Banka AS |
207 | 6,142 | ||||||
| Moneta Money Bank AS, 144A |
933 | 3,314 | ||||||
|
|
|
|||||||
| (Cost $23,777) |
28,312 | |||||||
|
|
|
|||||||
| Denmark — 0.4% | ||||||||
| A.P. Moller — Maersk A/S, Class A |
9 | 15,062 | ||||||
| A.P. Moller — Maersk A/S, Class B |
13 | 21,802 | ||||||
|
|
|
|||||||
| (Cost $62,584) |
36,864 | |||||||
|
|
|
|||||||
| Egypt — 0.0% | ||||||||
| Eastern Co. SAE (Cost $2,753) |
2,931 | 1,809 | ||||||
|
|
|
|||||||
| Finland — 1.6% | ||||||||
| Elisa OYJ |
369 | 20,614 | ||||||
| Fortum OYJ |
1,203 | 15,942 | ||||||
| Kesko OYJ, Class B |
733 | 13,820 | ||||||
| Kone OYJ, Class B |
915 | 46,306 | ||||||
| Stora Enso OYJ, Class R |
1,555 | 19,636 | ||||||
| UPM-Kymmene OYJ |
1,444 | 43,212 | ||||||
|
|
|
|||||||
| (Cost $172,891) |
159,530 | |||||||
|
|
|
|||||||
| France — 9.7% | ||||||||
| Amundi SA, 144A (a) |
155 | 8,692 | ||||||
| AXA SA |
4,925 | 138,693 | ||||||
| Bouygues SA |
590 | 18,845 | ||||||
| Cie Generale des Etablissements Michelin SCA |
1,832 | 51,874 | ||||||
| Danone SA |
1,735 | 102,362 | ||||||
| Sanofi (a) |
3,041 | 307,602 | ||||||
| TotalEnergies SE |
6,341 | 358,828 | ||||||
|
|
|
|||||||
| (Cost $1,012,760) |
986,896 | |||||||
|
|
|
|||||||
| Number |
Value |
|||||||
| Germany — 4.6% | ||||||||
| Allianz SE |
1,082 | $ | 230,681 | |||||
| Bayerische Motoren Werke AG |
889 | 96,596 | ||||||
| Deutsche Post AG |
2,700 | 121,040 | ||||||
| Evonik Industries AG (b) |
550 | 10,991 | ||||||
| Wacker Chemie AG |
49 | 6,488 | ||||||
|
|
|
|||||||
| (Cost $468,409) |
465,796 | |||||||
|
|
|
|||||||
| Greece — 0.2% | ||||||||
| Hellenic Telecommunications Organization SA |
516 | 7,877 | ||||||
| JUMBO SA |
340 | 7,866 | ||||||
| OPAP SA |
512 | 8,723 | ||||||
|
|
|
|||||||
| (Cost $22,930) |
24,466 | |||||||
|
|
|
|||||||
| Hong Kong — 2.9% | ||||||||
| Beijing Enterprises Holdings Ltd. |
1,330 | 5,139 | ||||||
| Bosideng International Holdings Ltd. |
8,446 | 3,506 | ||||||
| China Everbright Environment Group Ltd. |
9,888 | 3,865 | ||||||
| China Gas Holdings Ltd. |
7,380 | 8,372 | ||||||
| China Medical System Holdings Ltd. |
3,469 | 4,875 | ||||||
| China Merchants Port Holdings Co. Ltd. |
3,566 | 5,175 | ||||||
| China Overseas Land & Investment Ltd. |
10,015 | 20,316 | ||||||
| China Resources Gas Group Ltd. |
2,361 | 7,766 | ||||||
| China Resources Land Ltd. |
8,498 | 31,807 | ||||||
| China State Construction International Holdings Ltd. |
5,170 | 5,845 | ||||||
| China Taiping Insurance Holdings Co. Ltd. |
3,936 | 4,103 | ||||||
| CK Asset Holdings Ltd. |
5,195 | 28,005 | ||||||
| CK Infrastructure Holdings Ltd. |
1,651 | 9,132 | ||||||
| Guangdong Investment Ltd. |
7,997 | 6,814 | ||||||
| Hang Lung Properties Ltd. |
5,139 | 8,140 | ||||||
| Henderson Land Development Co. Ltd. |
3,929 | 12,472 | ||||||
| HKT Trust & HKT Ltd. (d) |
9,898 | 12,644 | ||||||
| Kingboard Holdings Ltd. |
1,732 | 4,668 | ||||||
| Kingboard Laminates Holdings Ltd. |
2,763 | 2,527 | ||||||
| Orient Overseas International Ltd. (a) |
360 | 4,389 | ||||||
| Power Assets Holdings Ltd. |
3,631 | 19,551 | ||||||
| Sino Land Co. Ltd. |
9,321 | 12,121 | ||||||
| Sun Hung Kai Properties Ltd. |
3,930 | 50,052 | ||||||
| Swire Properties Ltd. |
3,065 | 7,306 | ||||||
| Want Want China Holdings Ltd. |
12,284 | 8,223 | ||||||
| Xinyi Glass Holdings Ltd. |
4,718 | 6,979 | ||||||
| Yuexiu Property Co. Ltd. (a) |
5,023 | 5,441 | ||||||
|
|
|
|||||||
| (Cost $382,987) |
299,233 | |||||||
|
|
|
|||||||
| Hungary — 0.1% | ||||||||
| Richter Gedeon Nyrt |
||||||||
| (Cost $9,586) |
382 | 9,583 | ||||||
|
|
|
|||||||
| India — 1.9% | ||||||||
| Coal India Ltd. |
4,026 | 11,740 | ||||||
| GAIL India Ltd. |
5,914 | 7,492 | ||||||
| HCL Technologies Ltd. |
2,602 | 36,015 | ||||||
| Hero MotoCorp Ltd. |
290 | 9,674 | ||||||
| Indian Oil Corp. Ltd. |
7,526 | 8,187 | ||||||
| NTPC Ltd. |
11,754 | 24,700 | ||||||
| Oil & Natural Gas Corp. Ltd. |
8,482 | 15,881 | ||||||
| Petronet LNG Ltd. |
2,143 | 5,850 | ||||||
| See Notes to Financial Statements. | 59 |
DBX ETF Trust
Schedule of Investments
Xtrackers MSCI All World ex US High Dividend Yield Equity ETF (Continued)
May 31, 2023
| Number |
Value |
|||||||
| India (Continued) | ||||||||
| Power Grid Corp. of India Ltd. |
9,607 | $ | 27,155 | |||||
| Tata Steel Ltd. |
18,912 | 24,185 | ||||||
| Tech Mahindra Ltd. |
1,435 | 19,349 | ||||||
|
|
|
|||||||
| (Cost $174,289) |
190,228 | |||||||
|
|
|
|||||||
| Indonesia — 1.4% | ||||||||
| PT Adaro Energy Indonesia Tbk |
36,118 | 4,915 | ||||||
| PT Astra International Tbk |
52,469 | 22,577 | ||||||
| PT Bank Mandiri Persero Tbk |
97,152 | 32,730 | ||||||
| PT Bank Rakyat Indonesia Persero Tbk |
183,702 | 68,321 | ||||||
| PT Indofood Sukses Makmur Tbk |
11,419 | 5,409 | ||||||
| PT United Tractors Tbk |
4,550 | 6,746 | ||||||
|
|
|
|||||||
| (Cost $105,866) |
140,698 | |||||||
|
|
|
|||||||
| Israel — 0.4% | ||||||||
| Bank Leumi Le-Israel BM |
4,048 | 28,342 | ||||||
| ICL Group Ltd. |
2,102 | 11,436 | ||||||
|
|
|
|||||||
| (Cost $56,528) |
39,778 | |||||||
|
|
|
|||||||
| Italy — 1.1% | ||||||||
| Assicurazioni Generali SpA |
2,723 | 51,426 | ||||||
| Snam SpA |
5,486 | 28,600 | ||||||
| Terna — Rete Elettrica Nazionale |
3,678 | 30,710 | ||||||
|
|
|
|||||||
| (Cost $106,189) |
110,736 | |||||||
|
|
|
|||||||
| Japan — 6.2% | ||||||||
| AGC, Inc. (a) |
550 | 20,037 | ||||||
| Aisin Corp. |
400 | 11,481 | ||||||
| Asahi Kasei Corp. |
3,300 | 22,403 | ||||||
| Daiwa House Industry Co. Ltd. |
1,600 | 41,708 | ||||||
| Iida Group Holdings Co. Ltd. |
400 | 6,596 | ||||||
| Isuzu Motors Ltd. |
1,600 | 18,598 | ||||||
| Japan Tobacco, Inc. |
3,200 | 69,628 | ||||||
| Mitsui Chemicals, Inc. |
500 | 12,615 | ||||||
| Mitsui OSK Lines Ltd. (a) |
900 | 20,452 | ||||||
| MS&AD Insurance Group Holdings, Inc. |
1,178 | 40,454 | ||||||
| Nippon Yusen KK |
1,269 | 26,999 | ||||||
| Nomura Real Estate Holdings, Inc. |
300 | 7,247 | ||||||
| Obayashi Corp. |
1,700 | 13,677 | ||||||
| Sekisui House Ltd. |
1,675 | 32,651 | ||||||
| SoftBank Corp. |
7,700 | 81,869 | ||||||
| Sompo Holdings, Inc. |
848 | 34,536 | ||||||
| SUMCO Corp. |
900 | 12,825 | ||||||
| Sumitomo Metal Mining Co. Ltd. |
650 | 19,679 | ||||||
| Tokio Marine Holdings, Inc. |
4,820 | 108,464 | ||||||
| Tosoh Corp. |
700 | 8,041 | ||||||
| Yamaha Motor Co. Ltd. |
800 | 19,697 | ||||||
|
|
|
|||||||
| (Cost $624,366) |
629,657 | |||||||
|
|
|
|||||||
| Kuwait — 0.1% | ||||||||
| Mobile Telecommunications Co. KSCP |
||||||||
| (Cost $11,182) |
5,865 | 9,910 | ||||||
|
|
|
|||||||
| Malaysia — 1.0% | ||||||||
| Inari Amertron Bhd |
7,300 | 3,986 | ||||||
| Kuala Lumpur Kepong Bhd |
1,200 | 5,429 | ||||||
| Malayan Banking Bhd |
14,711 | 27,570 | ||||||
| MISC Bhd |
3,500 | 5,536 | ||||||
| Petronas Chemicals Group Bhd |
7,700 | 10,944 | ||||||
| Number |
Value |
|||||||
| Malaysia (Continued) | ||||||||
| Petronas Gas Bhd |
2,100 | $ | 7,616 | |||||
| Public Bank Bhd |
38,200 | 31,533 | ||||||
| RHB Bank Bhd |
3,931 | 4,556 | ||||||
| Sime Darby Bhd |
7,500 | 3,364 | ||||||
|
|
|
|||||||
| (Cost $104,121) |
100,534 | |||||||
|
|
|
|||||||
| Mexico — 1.0% | ||||||||
| Arca Continental SAB de CV |
1,419 | 14,290 | ||||||
| Banco del Bajio SA, 144A |
2,082 | 6,496 | ||||||
| Coca-Cola Femsa SAB de CV |
1,468 | 12,011 | ||||||
| Grupo Aeroportuario del Pacifico SAB de CV, Class B |
1,030 | 18,153 | ||||||
| Grupo Mexico SAB de CV, Series B |
8,494 | 37,552 | ||||||
| Kimberly-Clark de Mexico SAB de CV, Class A |
3,767 | 7,632 | ||||||
| Orbia Advance Corp. SAB de CV |
2,594 | 5,364 | ||||||
| Promotora y Operadora de Infraestructura SAB de CV |
525 | 5,049 | ||||||
|
|
|
|||||||
| (Cost $88,399) |
106,547 | |||||||
|
|
|
|||||||
| Netherlands — 2.1% | ||||||||
| Koninklijke Ahold Delhaize NV |
2,619 | 82,814 | ||||||
| NN Group NV |
673 | 24,194 | ||||||
| OCI NV |
274 | 6,073 | ||||||
| Randstad NV |
310 | 15,156 | ||||||
| Stellantis NV |
6,020 | 91,019 | ||||||
|
|
|
|||||||
| (Cost $229,288) |
219,256 | |||||||
|
|
|
|||||||
| New Zealand — 0.1% | ||||||||
| Spark New Zealand Ltd. (Cost $14,433) |
4,796 | 14,832 | ||||||
|
|
|
|||||||
| Norway — 0.8% | ||||||||
| Aker BP ASA |
850 | 18,399 | ||||||
| Gjensidige Forsikring ASA |
526 | 8,804 | ||||||
| Orkla ASA |
2,021 | 14,485 | ||||||
| Salmar ASA |
195 | 8,557 | ||||||
| Telenor ASA |
1,892 | 19,356 | ||||||
| Yara International ASA (a) |
431 | 16,021 | ||||||
|
|
|
|||||||
| (Cost $111,913) |
85,622 | |||||||
|
|
|
|||||||
| Philippines — 0.2% | ||||||||
| International Container Terminal Services, Inc. |
2,730 | 9,479 | ||||||
| Manila Electric Co. |
760 | 4,425 | ||||||
| Metropolitan Bank & Trust Co. |
4,810 | 4,934 | ||||||
|
|
|
|||||||
| (Cost $18,848) |
18,838 | |||||||
|
|
|
|||||||
| Poland — 0.2% | ||||||||
| Cyfrowy Polsat SA |
565 | 2,052 | ||||||
| Polski Koncern Naftowy ORLEN SA (a) |
1,553 | 21,977 | ||||||
|
|
|
|||||||
| (Cost $29,494) |
24,029 | |||||||
|
|
|
|||||||
| Qatar — 0.4% | ||||||||
| Dukhan Bank |
5,044 | 5,425 | ||||||
| Industries Qatar QSC |
3,942 | 12,974 | ||||||
| Mesaieed Petrochemical Holding Co. |
11,780 | 6,372 | ||||||
| Qatar Electricity & Water Co. QSC |
1,214 | 5,703 | ||||||
| Qatar Fuel QSC |
1,620 | 7,059 | ||||||
|
|
|
|||||||
| (Cost $46,792) |
37,533 | |||||||
|
|
|
|||||||
| See Notes to Financial Statements. | 60 |
DBX ETF Trust
Schedule of Investments
Xtrackers MSCI All World ex US High Dividend Yield Equity ETF (Continued)
May 31, 2023
| Number |
Value |
|||||||
| Russia — 0.0% | ||||||||
| Alrosa PJSC* (c) |
14,479 | $ | 0 | |||||
| Inter RAO UES PJSC* (c) |
188,952 | 0 | ||||||
| LUKOIL PJSC* (c) |
2,350 | 0 | ||||||
| MMC Norilsk Nickel PJSC* (c) |
361 | 0 | ||||||
| Mobile TeleSystems PJSC, ADR* (c) |
2,615 | 0 | ||||||
| Novolipetsk Steel PJSC* (c) |
8,593 | 0 | ||||||
| PhosAgro PJSC* (c) |
258 | 0 | ||||||
| PhosAgro PJSC, GDR* (c) |
2 | 0 | ||||||
| PhosAgro PJSC, GDR* (c) |
4 | 0 | ||||||
| Polyus PJSC* (c) |
192 | 0 | ||||||
| Severstal PAO* (c) |
1,174 | 0 | ||||||
| Tatneft PJSC* (c) |
7,791 | 0 | ||||||
|
|
|
|||||||
| (Cost $520,076) |
0 | |||||||
|
|
|
|||||||
| Saudi Arabia — 0.9% | ||||||||
| Advanced Petrochemical Co. |
355 | 4,136 | ||||||
| Jarir Marketing Co. |
1,500 | 7,039 | ||||||
| SABIC Agri-Nutrients Co. |
626 | 20,862 | ||||||
| Saudi Telecom Co. |
5,367 | 61,886 | ||||||
|
|
|
|||||||
| (Cost $92,545) |
93,923 | |||||||
|
|
|
|||||||
| Singapore — 1.9% | ||||||||
| Jardine Cycle & Carriage Ltd. |
300 | 7,159 | ||||||
| Oversea-Chinese Banking Corp. Ltd. |
9,108 | 82,485 | ||||||
| Singapore Exchange Ltd. |
2,441 | 16,719 | ||||||
| Singapore Technologies Engineering Ltd. |
4,000 | 10,806 | ||||||
| United Overseas Bank Ltd. |
3,400 | 70,141 | ||||||
| Venture Corp. Ltd. |
700 | 7,838 | ||||||
|
|
|
|||||||
| (Cost $184,605) |
195,148 | |||||||
|
|
|
|||||||
| South Africa — 1.5% | ||||||||
| African Rainbow Minerals Ltd. |
318 | 3,310 | ||||||
| Anglo American Platinum Ltd. |
181 | 10,374 | ||||||
| Exxaro Resources Ltd. |
615 | 4,971 | ||||||
| FirstRand Ltd. |
13,650 | 41,516 | ||||||
| Impala Platinum Holdings Ltd. |
2,221 | 17,751 | ||||||
| Kumba Iron Ore Ltd. |
162 | 3,544 | ||||||
| Mr Price Group Ltd. |
653 | 4,088 | ||||||
| Nedbank Group Ltd. |
1,277 | 13,415 | ||||||
| Sanlam Ltd. |
4,700 | 12,310 | ||||||
| Standard Bank Group Ltd. |
3,633 | 27,782 | ||||||
| Vodacom Group Ltd. |
1,655 | 9,218 | ||||||
|
|
|
|||||||
| (Cost $205,797) |
148,279 | |||||||
|
|
|
|||||||
| South Korea — 1.6% | ||||||||
| DB Insurance Co. Ltd. |
116 | 6,468 | ||||||
| Kia Corp. |
697 | 45,110 | ||||||
| Korea Zinc Co. Ltd. |
22 | 7,965 | ||||||
| KT Corp. |
190 | 4,516 | ||||||
| KT&G Corp. |
286 | 18,014 | ||||||
| Kumho Petrochemical Co. Ltd. |
41 | 3,920 | ||||||
| LG Uplus Corp. |
580 | 4,912 | ||||||
| POSCO Holdings, Inc. |
194 | 52,620 | ||||||
| Samsung Fire & Marine Insurance Co. Ltd. |
79 | 13,422 | ||||||
| Samsung Life Insurance Co. Ltd. |
216 | 10,790 | ||||||
|
|
|
|||||||
| (Cost $158,245) |
167,737 | |||||||
|
|
|
|||||||
| Number |
Value |
|||||||
| Spain — 2.7% | ||||||||
| Endesa SA |
831 | $ | 17,922 | |||||
| Iberdrola SA |
15,647 | 190,167 | ||||||
| Red Electrica Corp. SA |
1,064 | 17,974 | ||||||
| Repsol SA |
3,588 | 48,541 | ||||||
|
|
|
|||||||
| (Cost $197,835) |
274,604 | |||||||
|
|
|
|||||||
| Sweden — 1.4% | ||||||||
| Boliden AB |
718 | 21,800 | ||||||
| Boliden AB* |
718 | 757 | ||||||
| Skanska AB, Class B |
935 | 12,285 | ||||||
| SKF AB, Class B |
903 | 14,262 | ||||||
| Tele2 AB, Class B |
1,474 | 13,354 | ||||||
| Volvo AB, Class A |
550 | 10,572 | ||||||
| Volvo AB, Class B |
4,060 | 74,701 | ||||||
|
|
|
|||||||
| (Cost $164,053) |
147,731 | |||||||
|
|
|
|||||||
| Switzerland — 12.0% | ||||||||
| Adecco Group AG |
437 | 12,984 | ||||||
| Baloise Holding AG |
125 | 19,130 | ||||||
| Glencore PLC |
28,651 | 146,106 | ||||||
| Helvetia Holding AG |
100 | 14,144 | ||||||
| Holcim AG (b) |
1,487 | 91,320 | ||||||
| Kuehne + Nagel International AG |
148 | 41,948 | ||||||
| Novartis AG |
5,191 | 494,938 | ||||||
| Partners Group Holding AG |
61 | 54,771 | ||||||
| SGS SA |
401 | 35,461 | ||||||
| Swiss Re AG |
810 | 80,827 | ||||||
| Swisscom AG |
68 | 42,906 | ||||||
| Zurich Insurance Group AG |
403 | 187,801 | ||||||
|
|
|
|||||||
| (Cost $1,177,306) |
1,222,336 | |||||||
|
|
|
|||||||
| Taiwan — 7.5% | ||||||||
| Acer, Inc. |
8,095 | 8,127 | ||||||
| ASE Technology Holding Co. Ltd. |
8,283 | 30,056 | ||||||
| Asia Cement Corp. |
6,100 | 8,725 | ||||||
| Asustek Computer, Inc. |
1,923 | 19,088 | ||||||
| Cathay Financial Holding Co. Ltd. |
25,758 | 37,136 | ||||||
| Compal Electronics, Inc. |
10,834 | 9,819 | ||||||
| CTBC Financial Holding Co. Ltd. |
46,509 | 36,780 | ||||||
| Formosa Plastics Corp. |
10,399 | 31,846 | ||||||
| Fubon Financial Holding Co. Ltd. |
19,746 | 39,071 | ||||||
| Giant Manufacturing Co. Ltd. |
859 | 5,759 | ||||||
| Hon Hai Precision Industry Co. Ltd. |
33,526 | 116,200 | ||||||
| Largan Precision Co. Ltd. |
273 | 20,124 | ||||||
| Lite-On Technology Corp. |
5,462 | 15,820 | ||||||
| MediaTek, Inc. |
4,021 | 99,323 | ||||||
| Micro-Star International Co. Ltd. |
1,752 | 9,465 | ||||||
| Nan Ya Plastics Corp. |
12,914 | 32,655 | ||||||
| Nien Made Enterprise Co. Ltd. |
541 | 6,206 | ||||||
| Novatek Microelectronics Corp. |
1,550 | 21,464 | ||||||
| Pegatron Corp. |
5,396 | 13,223 | ||||||
| Quanta Computer, Inc. |
7,159 | 27,143 | ||||||
| Realtek Semiconductor Corp. |
1,206 | 14,993 | ||||||
| Shanghai Commercial & Savings Bank Ltd. |
9,786 | 14,379 | ||||||
| Shin Kong Financial Holding Co. Ltd. |
33,815 | 9,486 | ||||||
| SinoPac Financial Holdings Co. Ltd. |
28,790 | 16,209 | ||||||
| Synnex Technology International Corp. |
3,738 | 7,773 | ||||||
| See Notes to Financial Statements. | 61 |
DBX ETF Trust
Schedule of Investments
Xtrackers MSCI All World ex US High Dividend Yield Equity ETF (Continued)
May 31, 2023
| Number |
Value |
|||||||
| Taiwan (Continued) | ||||||||
| Taishin Financial Holding Co. Ltd. |
28,280 | $ | 16,888 | |||||
| United Microelectronics Corp. |
30,021 | 50,609 | ||||||
| Vanguard International Semiconductor Corp. |
2,532 | 7,655 | ||||||
| WPG Holdings Ltd. |
3,911 | 6,771 | ||||||
| Yuanta Financial Holding Co. Ltd. |
26,344 | 20,448 | ||||||
| Zhen Ding Technology Holding Ltd. |
1,771 | 6,686 | ||||||
|
|
|
|||||||
| (Cost $722,933) |
759,927 | |||||||
|
|
|
|||||||
| Thailand — 0.3% | ||||||||
| Intouch Holdings PCL, NVDR |
3,100 | 6,659 | ||||||
| PTT Exploration & Production PCL, NVDR |
3,500 | 14,030 | ||||||
| SCB X PCL, NVDR |
2,300 | 6,840 | ||||||
| Srisawad Corp. PCL, NVDR |
1,900 | 3,044 | ||||||
|
|
|
|||||||
| (Cost $28,790) |
30,573 | |||||||
|
|
|
|||||||
| Turkey — 0.2% | ||||||||
| Akbank TAS |
8,378 | 6,395 | ||||||
| Haci Omer Sabanci Holding AS |
2,760 | 5,147 | ||||||
| Turkiye Is Bankasi AS, Class C |
9,410 | 5,069 | ||||||
| Yapi ve Kredi Bankasi AS |
7,973 | 3,929 | ||||||
|
|
|
|||||||
| (Cost $20,545) |
20,540 | |||||||
|
|
|
|||||||
| United Arab Emirates — 0.7% | ||||||||
| Abu Dhabi Islamic Bank PJSC |
3,824 | 10,411 | ||||||
| Abu Dhabi National Oil Co. for Distribution PJSC |
8,386 | 9,452 | ||||||
| Emaar Properties PJSC |
17,853 | 29,893 | ||||||
| Emirates NBD Bank PJSC |
4,918 | 18,277 | ||||||
|
|
|
|||||||
| (Cost $60,032) |
68,033 | |||||||
|
|
|
|||||||
| United Kingdom — 9.1% | ||||||||
| Admiral Group PLC |
569 | 16,396 | ||||||
| Anglo American PLC |
3,410 | 93,973 | ||||||
| Hargreaves Lansdown PLC |
923 | 9,177 | ||||||
| Imperial Brands PLC |
2,379 | 49,978 | ||||||
| Kingfisher PLC |
5,029 | 14,398 | ||||||
| National Grid PLC |
9,862 | 135,186 | ||||||
| Rio Tinto PLC |
3,016 | 178,753 | ||||||
| Schroders PLC |
2,316 | 13,078 | ||||||
| St James’s Place PLC |
1,423 | 19,665 | ||||||
| Tesco PLC |
19,818 | 64,059 | ||||||
| Unilever PLC |
6,769 | 338,013 | ||||||
|
|
|
|||||||
| (Cost $1,099,813) |
932,676 | |||||||
|
|
|
|||||||
| United States — 0.1% | ||||||||
| Southern Copper Corp. |
||||||||
| (Cost $12,854) |
219 | 14,623 | ||||||
|
|
|
|||||||
| TOTAL COMMON STOCKS | ||||||||
| (Cost $10,954,047) |
9,913,343 | |||||||
|
|
|
|||||||
| PREFERRED STOCKS — 0.6% | ||||||||
| Brazil — 0.2% | ||||||||
| Cia Energetica de Minas Gerais |
3,555 | 8,121 | ||||||
| Gerdau SA |
3,186 | 14,910 | ||||||
|
|
|
|||||||
| (Cost $20,981) |
23,031 | |||||||
|
|
|
|||||||
| Number |
Value |
|||||||
| Germany — 0.4% | ||||||||
| Bayerische Motoren Werke AG |
155 | $ | 15,888 | |||||
| Porsche Automobil Holding SE (b) |
421 | 23,294 | ||||||
|
|
|
|||||||
| (Cost $38,357) |
39,182 | |||||||
|
|
|
|||||||
| TOTAL PREFERRED STOCKS |
62,213 | |||||||
|
|
|
|||||||
| EXCHANGE-TRADED FUNDS — 0.7% | ||||||||
| WisdomTree Emerging Markets High Dividend Fund (a) |
500 | 18,650 | ||||||
| Xtrackers MSCI EAFE High Dividend Yield Equity ETF (a)(e) |
2,250 | 50,737 | ||||||
|
|
|
|||||||
| (Cost $68,768) |
69,387 | |||||||
|
|
|
|||||||
| SECURITIES LENDING COLLATERAL — 5.8% | ||||||||
| DWS Government & Agency Securities Portfolio “DWS Government Cash Institutional Shares”,
5.03% (f)(g) |
595,473 | 595,473 | ||||||
|
|
|
|||||||
| CASH EQUIVALENTS — 0.0% | ||||||||
| DWS Government Money Market Series “Institutional Shares”, 5.04% (f) |
1,070 | 1,070 | ||||||
|
|
|
|||||||
| TOTAL INVESTMENTS — 104.4% (Cost $11,678,696) |
$ | 10,641,486 | ||||||
| Other assets and liabilities, net — (4.4%) |
(449,264 | ) | ||||||
|
|
|
|||||||
| NET ASSETS — 100.0% |
$ | 10,192,222 | ||||||
|
|
|
|||||||
| See Notes to Financial Statements. | 62 |
DBX ETF Trust
Schedule of Investments
Xtrackers MSCI All World ex US High Dividend Yield Equity ETF (Continued)
May 31, 2023
A summary of the Fund’s transactions with affiliated investments during the year ended May 31, 2023 is as follows:
| Value ($) at 5/31/2022 |
Purchases Cost ($) |
Sales Proceeds ($) |
Net Realized Gain/(Loss) ($) |
Net Change in Unrealized Appreciation (Depreciation) ($) |
Income ($) | Capital Gain Distributions ($) |
Number of Shares at 5/31/2023 |
Value ($) at 5/31/2023 |
||||||||||||||||||||||||||||
| EXCHANGE-TRADED FUNDS — 0.5% |
|
|||||||||||||||||||||||||||||||||||
| Xtrackers MSCI EAFE High Dividend Yield Equity ETF(e) |
|
|||||||||||||||||||||||||||||||||||
| 5,858 | 222,356 | (169,218 | ) | (8,476 | ) | 217 | 1,216 | — | 2,250 | 50,737 | ||||||||||||||||||||||||||
| SECURITIES LENDING COLLATERAL — 5.8% |
|
|||||||||||||||||||||||||||||||||||
| DWS Government & Agency Securities Portfolio “DWS Government Cash Institutional Shares”, 5.03% (f)(g) |
|
|||||||||||||||||||||||||||||||||||
| 403,253 | 192,220 | (h) | — | — | — | 4,199 | — | 595,473 | 595,473 | |||||||||||||||||||||||||||
| CASH EQUIVALENTS — 0.0% |
|
|||||||||||||||||||||||||||||||||||
| DWS Government Money Market Series “Institutional Shares”, 5.04% (f) |
|
|||||||||||||||||||||||||||||||||||
| 89,424 | 1,040,459 | (1,128,813 | ) | — | — | 450 | — | 1,070 | 1,070 | |||||||||||||||||||||||||||
|
|
|
|
|
|
|
|
|
|
|
|
|
|
|
|
|
|
|
|||||||||||||||||||
| 498,535 | 1,455,035 | (1,298,031 | ) | (8,476 | ) | 217 | 5,865 | — | 598,793 | 647,280 | ||||||||||||||||||||||||||
|
|
|
|
|
|
|
|
|
|
|
|
|
|
|
|
|
|
|
|||||||||||||||||||
| * | Non-income producing security. |
| (a) | All or a portion of these securities were on loan. In addition, “Other assets and liabilities, net” may include pending sales that are also on loan. The value of securities loaned at May 31, 2023 amounted to $519,075, which is 5.1% of net assets. |
| (b) | Company declared its annual dividend during the 12-month period ended May, 31 2023, the scheduled payment date was subsequent to May, 31 2023. |
| (c) | Investment was valued using significant unobservable inputs. |
| (d) | Stapled Security — A security contractually bound to one or more other securities to form a single saleable unit which cannot be sold separately. |
| (e) | Affiliated fund advised by DBX Advisors LLC. |
| (f) | Affiliated fund managed by DWS Investment Management Americas, Inc. The rate shown is the annualized seven-day yield at period end. |
| (g) | Represents cash collateral held in connection with securities lending. Income earned by the Fund is net of borrower rebates. In addition, the Fund held non-cash U.S. Treasury securities collateral having a value of $75,041. |
| (h) | Represents the net increase (purchase cost) or decrease (sales proceeds) in the amount invested in cash collateral for the year ended May 31, 2023. |
| ADR: | American Depositary Receipt |
| GDR: | Global Depositary Receipt |
| KSCP: | Kuwait Shareholding Company Public |
| NVDR: | Non Voting Depositary Receipt |
| PJSC: | Public Joint Stock Company |
| QSC: | Qatari Shareholders Company |
| SAE: | Societe Anonyme Egyptienne |
| 144A: | Security exempt from registration under Rule 144A of the Securities Act of 1933. These securities may be resold in transactions exempt from registration, normally to qualified institutional buyers. |
Securities are listed in country of domicile.
At May 31, 2023, open futures contracts purchased were as follows:
| Contract Description |
Currency | Number of Contracts |
Notional Amount |
Contract Value |
Expiration Date |
Unrealized Appreciation |
||||||||||||
| EURO STOXX 50 Futures |
EUR | 2 | $ | 86,105 | $ | 89,915 | 6/16/2023 | $ | 3,810 | |||||||||
| MINI TOPIX Index Futures |
JPY | 3 | 43,982 | 45,650 | 6/08/2023 | 1,668 | ||||||||||||
|
|
|
|||||||||||||||||
| Total unrealized appreciation |
$ | 5,478 | ||||||||||||||||
|
|
|
|||||||||||||||||
For information on the Fund’s policy and additional disclosures regarding open futures contracts, please refer to the Derivatives section of Note 2 in the accompanying Notes to Financial Statements.
Currency Abbreviations
| EUR | Euro |
| JPY | Japanese Yen |
| See Notes to Financial Statements. | 63 |
DBX ETF Trust
Schedule of Investments
Xtrackers MSCI All World ex US High Dividend Yield Equity ETF (Continued)
May 31, 2023
Fair Value Measurements
Various inputs are used in determining the value of the Fund’s investments. These inputs are summarized in three broad levels. Level 1 includes quoted prices in active markets for identical securities. Level 2 includes other significant observable inputs (including quoted prices for similar securities, interest rates, prepayment speeds and credit risk). Level 3 includes significant unobservable inputs (including the Fund’s own assumptions in determining the fair value of investments). The level assigned to the securities valuations may not be an indication of the risk or liquidity associated with investing in those securities.
The following is a summary of the inputs used as of May 31, 2023 in valuing the Fund’s investments. For information on the Fund’s policy regarding the valuation of investments, please refer to the Security Valuation section of Note 2 in the accompanying Notes to Financial Statements.
| Assets |
Level 1 | Level 2 | Level 3 | Total | ||||||||||||
| Common Stocks (a) |
$ | 9,913,343 | $ | — | $ | 0 | $ | 9,913,343 | ||||||||
| Preferred Stocks (a) |
62,213 | — | — | 62,213 | ||||||||||||
| Exchange-Traded Funds |
69,387 | — | — | 69,387 | ||||||||||||
| Short-Term Investments (a) |
596,543 | — | — | 596,543 | ||||||||||||
| Derivatives (b) |
||||||||||||||||
| Futures Contracts |
5,478 | — | — | 5,478 | ||||||||||||
|
|
|
|
|
|
|
|
|
|||||||||
| TOTAL |
$ | 10,646,964 | $ | — | $ | 0 | $ | 10,646,964 | ||||||||
|
|
|
|
|
|
|
|
|
|||||||||
| (a) | See Schedule of Investments for additional detailed categorizations. |
| (b) | Derivatives include unrealized appreciation (depreciation) on open futures contracts. |
| See Notes to Financial Statements. | 64 |
DBX ETF Trust
Schedule of Investments
Xtrackers MSCI EAFE High Dividend Yield Equity ETF
May 31, 2023
| Number |
Value |
|||||||
| COMMON STOCKS — 97.2% | ||||||||
| Australia — 11.7% | ||||||||
| BHP Group Ltd. |
2,178,308 | $ | 59,235,271 | |||||
| Coles Group Ltd. |
717,989 | 8,354,347 | ||||||
| Fortescue Metals Group Ltd. |
908,441 | 11,299,394 | ||||||
| Medibank Pvt Ltd. |
1,477,384 | 3,413,239 | ||||||
| Rio Tinto Ltd. |
199,139 | 13,789,393 | ||||||
| Santos Ltd. |
1,771,063 | 8,355,387 | ||||||
| Wesfarmers Ltd. |
608,613 | 18,775,496 | ||||||
| Woodside Energy Group Ltd. |
1,018,580 | 22,609,674 | ||||||
|
|
|
|||||||
| (Cost $157,630,036) |
145,832,201 | |||||||
|
|
|
|||||||
| Austria — 0.3% | ||||||||
| OMV AG (Cost $4,002,621) |
79,005 | 3,510,592 | ||||||
|
|
|
|||||||
| Belgium — 0.3% | ||||||||
| Ageas SA/NV (a) (Cost $4,069,763) |
86,513 | 3,443,003 | ||||||
|
|
|
|||||||
| Chile — 0.3% | ||||||||
| Antofagasta PLC (Cost $3,749,090) |
211,546 | 3,506,795 | ||||||
|
|
|
|||||||
| Denmark — 0.6% | ||||||||
| A.P. Moller — Maersk A/S, Class A |
1,663 | 2,783,094 | ||||||
| A.P. Moller — Maersk A/S, Class B |
2,695 | 4,519,831 | ||||||
|
|
|
|||||||
| (Cost $11,201,654) |
7,302,925 | |||||||
|
|
|
|||||||
| Finland — 1.5% | ||||||||
| Elisa OYJ |
76,300 | 4,262,397 | ||||||
| Fortum OYJ |
240,668 | 3,189,243 | ||||||
| Kesko OYJ, Class B |
146,524 | 2,762,561 | ||||||
| UPM-Kymmene OYJ |
286,322 | 8,568,311 | ||||||
|
|
|
|||||||
| (Cost $20,386,342) |
18,782,512 | |||||||
|
|
|
|||||||
| France — 14.6% | ||||||||
| Amundi SA, 144A (a) |
32,809 | 1,839,826 | ||||||
| AXA SA (a) |
984,144 | 27,714,519 | ||||||
| Bouygues SA |
110,483 | 3,528,868 | ||||||
| Cie Generale des Etablissements Michelin SCA |
363,941 | 10,305,217 | ||||||
| Danone SA |
344,425 | 20,320,384 | ||||||
| Sanofi (a) |
584,180 | 59,090,743 | ||||||
| TotalEnergies SE |
1,057,810 | 59,859,994 | ||||||
|
|
|
|||||||
| (Cost $177,650,146) |
182,659,551 | |||||||
|
|
|
|||||||
| Germany — 7.5% | ||||||||
| Allianz SE |
216,357 | 46,127,042 | ||||||
| Bayerische Motoren Werke AG |
177,618 | 19,299,430 | ||||||
| Deutsche Post AG |
539,907 | 24,203,771 | ||||||
| Evonik Industries AG (b) |
112,498 | 2,248,166 | ||||||
| Wacker Chemie AG |
9,792 | 1,296,555 | ||||||
|
|
|
|||||||
| (Cost $88,612,839) |
93,174,964 | |||||||
|
|
|
|||||||
| Hong Kong — 2.7% | ||||||||
| CK Asset Holdings Ltd. |
1,059,918 | 5,713,734 | ||||||
| CK Infrastructure Holdings Ltd. |
337,877 | 1,868,882 | ||||||
| Hang Lung Properties Ltd. |
965,295 | 1,529,034 | ||||||
| Henderson Land Development Co. Ltd. |
779,334 | 2,473,918 | ||||||
| HKT Trust & HKT Ltd. (c) |
2,032,791 | 2,596,737 | ||||||
| Number |
Value |
|||||||
| Hong Kong (Continued) | ||||||||
| Power Assets Holdings Ltd. |
743,323 | $ | 4,002,308 | |||||
| Sino Land Co. Ltd. |
1,959,885 | 2,548,670 | ||||||
| Sun Hung Kai Properties Ltd. |
777,364 | 9,900,449 | ||||||
| Swire Properties Ltd. |
627,648 | 1,496,109 | ||||||
| Xinyi Glass Holdings Ltd. |
885,000 | 1,309,143 | ||||||
|
|
|
|||||||
| (Cost $35,849,388) |
33,438,984 | |||||||
|
|
|
|||||||
| Ireland — 0.4% | ||||||||
| Smurfit Kappa Group PLC (Cost $4,993,352) |
139,554 | 4,943,912 | ||||||
|
|
|
|||||||
| Israel — 0.5% | ||||||||
| Bank Leumi Le-Israel BM (Cost $7,836,387) |
828,173 | 5,798,397 | ||||||
|
|
|
|||||||
| Italy — 1.8% | ||||||||
| Assicurazioni Generali SpA |
543,703 | 10,268,357 | ||||||
| Snam SpA |
1,081,756 | 5,639,444 | ||||||
| Terna — Rete Elettrica Nazionale |
754,778 | 6,302,168 | ||||||
|
|
|
|||||||
| (Cost $20,329,376) |
22,209,969 | |||||||
|
|
|
|||||||
| Japan — 10.0% | ||||||||
| AGC, Inc. (a) |
109,700 | 3,996,514 | ||||||
| Aisin Corp. |
79,000 | 2,267,401 | ||||||
| Asahi Kasei Corp. |
672,974 | 4,568,699 | ||||||
| Daiwa House Industry Co. Ltd. |
321,671 | 8,385,111 | ||||||
| Iida Group Holdings Co. Ltd. |
85,100 | 1,403,360 | ||||||
| Isuzu Motors Ltd. |
312,800 | 3,635,882 | ||||||
| Japan Tobacco, Inc. (a) |
643,700 | 14,005,998 | ||||||
| Mitsui Chemicals, Inc. |
91,500 | 2,308,539 | ||||||
| Mitsui OSK Lines Ltd. (a) |
184,500 | 4,192,732 | ||||||
| MS&AD Insurance Group Holdings, Inc. |
230,000 | 7,898,508 | ||||||
| Nippon Yusen KK (a) |
260,000 | 5,531,618 | ||||||
| Obayashi Corp. |
349,200 | 2,809,296 | ||||||
| Sekisui House Ltd. |
330,524 | 6,442,988 | ||||||
| SoftBank Corp. |
1,540,800 | 16,382,338 | ||||||
| Sompo Holdings, Inc. |
167,900 | 6,837,856 | ||||||
| SUMCO Corp. |
187,800 | 2,676,232 | ||||||
| Sumitomo Metal Mining Co. Ltd. |
132,600 | 4,014,587 | ||||||
| Tokio Marine Holdings, Inc. |
966,828 | 21,756,484 | ||||||
| Tosoh Corp. |
139,520 | 1,602,760 | ||||||
| Yamaha Motor Co. Ltd. |
159,700 | 3,932,062 | ||||||
|
|
|
|||||||
| (Cost $120,089,576) |
124,648,965 | |||||||
|
|
|
|||||||
| Netherlands — 3.5% | ||||||||
| Koninklijke Ahold Delhaize NV |
523,406 | 16,550,379 | ||||||
| NN Group NV (a) |
134,515 | 4,835,667 | ||||||
| OCI NV |
56,596 | 1,254,407 | ||||||
| Randstad NV |
59,212 | 2,894,955 | ||||||
| Stellantis NV |
1,206,708 | 18,244,743 | ||||||
|
|
|
|||||||
| (Cost $42,573,305) |
43,780,151 | |||||||
|
|
|
|||||||
| New Zealand — 0.2% | ||||||||
| Spark New Zealand Ltd. |
||||||||
| (Cost $3,009,843) |
1,003,913 | 3,104,748 | ||||||
|
|
|
|||||||
| Norway — 1.3% | ||||||||
| Aker BP ASA |
169,523 | 3,669,490 | ||||||
| Gjensidige Forsikring ASA |
107,280 | 1,795,550 | ||||||
| See Notes to Financial Statements. | 65 |
DBX ETF Trust
Schedule of Investments
Xtrackers MSCI EAFE High Dividend Yield Equity ETF (Continued)
May 31, 2023
| Number |
Value |
|||||||
| Norway (Continued) | ||||||||
| Norsk Hydro ASA |
721,444 | $ | 4,343,057 | |||||
| Orkla ASA |
402,907 | 2,887,579 | ||||||
| Yara International ASA (a) |
88,823 | 3,301,683 | ||||||
|
|
|
|||||||
| (Cost $21,130,446) |
15,997,359 | |||||||
|
|
|
|||||||
| Portugal — 0.3% | ||||||||
| Jeronimo Martins SGPS SA (Cost $3,179,321) |
151,911 | 3,656,885 | ||||||
|
|
|
|||||||
| Singapore — 3.2% | ||||||||
| Oversea-Chinese Banking Corp. Ltd. |
1,816,507 | 16,450,929 | ||||||
| Singapore Exchange Ltd. |
459,850 | 3,149,727 | ||||||
| Singapore Technologies Engineering Ltd. |
837,500 | 2,262,428 | ||||||
| United Overseas Bank Ltd. |
678,300 | 13,993,051 | ||||||
| Venture Corp. Ltd. |
148,800 | 1,666,085 | ||||||
| Wilmar International Ltd. |
1,030,500 | 2,973,949 | ||||||
|
|
|
|||||||
| (Cost $39,080,684) |
40,496,169 | |||||||
|
|
|
|||||||
| Spain — 3.8% | ||||||||
| Enagas SA (a) |
133,515 | 2,541,488 | ||||||
| Endesa SA |
170,389 | 3,674,815 | ||||||
| Iberdrola SA |
3,122,835 | 37,953,513 | ||||||
| Red Electrica Corp. SA |
217,698 | 3,677,433 | ||||||
|
|
|
|||||||
| (Cost $44,978,064) |
47,847,249 | |||||||
|
|
|
|||||||
| Sweden — 2.1% | ||||||||
| Boliden AB |
146,726 | 4,454,924 | ||||||
| Boliden AB * |
146,884 | 154,933 | ||||||
| Skanska AB, Class B |
182,508 | 2,397,979 | ||||||
| Tele2 AB, Class B |
286,581 | 2,596,281 | ||||||
| Volvo AB, Class A |
107,339 | 2,063,225 | ||||||
| Volvo AB, Class B |
809,602 | 14,896,064 | ||||||
|
|
|
|||||||
| (Cost $28,618,721) |
26,563,406 | |||||||
|
|
|
|||||||
| Switzerland — 15.9% | ||||||||
| Adecco Group AG |
85,839 | 2,550,333 | ||||||
| Baloise Holding AG |
24,569 | 3,759,999 | ||||||
| Glencore PLC |
5,725,806 | 29,198,831 | ||||||
| Helvetia Holding AG |
19,911 | 2,816,269 | ||||||
| Holcim AG (b) |
297,374 | 18,262,404 | ||||||
| Kuehne + Nagel International AG |
29,150 | 8,262,063 | ||||||
| Novartis AG |
638,277 | 60,856,778 | ||||||
| Partners Group Holding AG |
12,175 | 10,931,729 | ||||||
| Swiss Re AG |
161,803 | 16,145,785 | ||||||
| Swisscom AG |
13,895 | 8,767,310 | ||||||
| Zurich Insurance Group AG |
80,714 | 37,613,263 | ||||||
|
|
|
|||||||
| (Cost $185,835,048) |
199,164,764 | |||||||
|
|
|
|||||||
| United Kingdom — 14.7% | ||||||||
| Admiral Group PLC |
113,866 | 3,281,170 | ||||||
| Anglo American PLC |
681,667 | 18,785,432 | ||||||
| Hargreaves Lansdown PLC |
190,836 | 1,897,382 | ||||||
| Imperial Brands PLC |
470,953 | 9,893,707 | ||||||
| Kingfisher PLC |
1,040,073 | 2,977,745 | ||||||
| National Grid PLC |
1,972,728 | 27,041,707 | ||||||
| Next PLC |
65,497 | 5,151,495 | ||||||
| Rio Tinto PLC |
603,906 | 35,792,389 | ||||||
| Schroders PLC |
432,709 | 2,443,382 | ||||||
| Number |
Value |
|||||||
| United Kingdom (Continued) | ||||||||
| St James’s Place PLC |
294,037 | $ | 4,063,391 | |||||
| Tesco PLC |
3,925,896 | 12,689,899 | ||||||
| Unilever PLC |
1,205,492 | 60,196,795 | ||||||
|
|
|
|||||||
| (Cost $189,787,365) |
184,214,494 | |||||||
|
|
|
|||||||
| TOTAL COMMON STOCKS |
1,214,077,995 | |||||||
|
|
|
|||||||
| PREFERRED STOCKS — 0.6% | ||||||||
| Germany — 0.6% | ||||||||
| Bayerische Motoren Werke AG |
31,868 | 3,266,647 | ||||||
| Porsche Automobil Holding SE (b) |
82,145 | 4,545,133 | ||||||
|
|
|
|||||||
| (Cost $7,672,884) |
7,811,780 | |||||||
|
|
|
|||||||
| SECURITIES LENDING COLLATERAL — 7.4% | ||||||||
| DWS Government & Agency Securities Portfolio “DWS Government Cash Institutional Shares”,
5.03% (d)(e) |
92,172,040 | 92,172,040 | ||||||
|
|
|
|||||||
| CASH EQUIVALENTS — 0.2% | ||||||||
| DWS Government Money Market Series “Institutional Shares”, 5.04% (d) |
1,988,411 | 1,988,411 | ||||||
|
|
|
|||||||
| TOTAL INVESTMENTS — 105.4% (Cost $1,316,426,702) |
$ | 1,316,050,226 | ||||||
| Other assets and liabilities, net — (5.4%) |
(67,513,196 | ) | ||||||
|
|
|
|||||||
| NET ASSETS — 100.0% |
$ | 1,248,537,030 | ||||||
|
|
|
|||||||
| See Notes to Financial Statements. | 66 |
DBX ETF Trust
Schedule of Investments
Xtrackers MSCI EAFE High Dividend Yield Equity ETF (Continued)
May 31, 2023
A summary of the Fund’s transactions with affiliated investments during the year ended May 31, 2023 is as follows:
| Value ($) at 5/31/2022 |
Purchases Cost ($) |
Sales Proceeds ($) |
Net Realized Gain/(Loss) ($) |
Net Change in Unrealized Appreciation (Depreciation) ($) |
Income ($) | Capital Gain Distributions ($) |
Number of Shares at 5/31/2023 |
Value ($) at 5/31/2023 |
||||||||||||||||||||||||||||
| SECURITIES LENDING COLLATERAL — 7.4% |
|
|||||||||||||||||||||||||||||||||||
| DWS Government & Agency Securities Portfolio “DWS Government Cash Institutional Shares”, 5.03% (d)(e) |
|
|||||||||||||||||||||||||||||||||||
| 5,263,643 | 86,908,397 | (f) | — | — | — | 329,488 | — | 92,172,040 | 92,172,040 | |||||||||||||||||||||||||||
| CASH EQUIVALENTS — 0.2% |
|
|||||||||||||||||||||||||||||||||||
| DWS Government Money Market Series “Institutional Shares”, 5.04% (d) |
|
|||||||||||||||||||||||||||||||||||
| 2,365,904 | 63,525,635 | (63,903,128 | ) | — | — | 65,798 | — | 1,988,411 | 1,988,411 | |||||||||||||||||||||||||||
|
|
|
|
|
|
|
|
|
|
|
|
|
|
|
|
|
|
|
|||||||||||||||||||
| 7,629,547 | 150,434,032 | (63,903,128 | ) | — | — | 395,286 | — | 94,160,451 | 94,160,451 | |||||||||||||||||||||||||||
|
|
|
|
|
|
|
|
|
|
|
|
|
|
|
|
|
|
|
|||||||||||||||||||
| * | Non-income producing security. |
| (a) | All or a portion of these securities were on loan. In addition, “Other assets and liabilities, net” may include pending sales that are also on loan. The value of securities loaned at May 31, 2023 amounted to $77,093,638, which is 6.2% of net assets. |
| (b) | Company declared its annual dividend during the 12-month period ended May, 31 2023, the scheduled payment date was subsequent to May, 31 2023. |
| (c) | Stapled Security — A security contractually bound to one or more other securities to form a single saleable unit which cannot be sold separately. |
| (d) | Affiliated fund managed by DWS Investment Management Americas, Inc. The rate shown is the annualized seven-day yield at period end. |
| (e) | Represents cash collateral held in connection with securities lending. Income earned by the Fund is net of borrower rebates. In addition, the Fund held non-cash U.S. Treasury securities collateral having a value of $16,157,243. |
| (f) | Represents the net increase (purchase cost) or decrease (sales proceeds) in the amount invested in cash collateral for the year ended May 31, 2023. |
| 144A: | Security exempt from registration under Rule 144A of the Securities Act of 1933. These securities may be resold in transactions exempt from registration, normally to qualified institutional buyers. |
Securities are listed in country of domicile.
At May 31, 2023, open futures contracts purchased were as follows:
| Contract Description |
Currency | Number of Contracts |
Notional Amount |
Contract Value |
Expiration Date |
Unrealized Depreciation |
||||||||||||
| FTSE 100 Index Futures |
GBP | 69 | $ | 6,550,462 | $ | 6,372,850 | 6/16/2023 | $ | (177,612 | ) | ||||||||
| MSCI EAFE Futures |
USD | 186 | 19,470,740 | 19,096,620 | 6/16/2023 | (374,120 | ) | |||||||||||
|
|
|
|||||||||||||||||
| Total unrealized depreciation |
$ | (551,732 | ) | |||||||||||||||
|
|
|
|||||||||||||||||
For information on the Fund’s policy and additional disclosures regarding open futures contracts, please refer to the Derivatives section of Note 2 in the accompanying Notes to Financial Statements.
Currency Abbreviations
| GBP | Pound Sterling |
| USD | U.S. Dollar |
| See Notes to Financial Statements. | 67 |
DBX ETF Trust
Schedule of Investments
Xtrackers MSCI EAFE High Dividend Yield Equity ETF (Continued)
May 31, 2023
Fair Value Measurements
Various inputs are used in determining the value of the Fund’s investments. These inputs are summarized in three broad levels. Level 1 includes quoted prices in active markets for identical securities. Level 2 includes other significant observable inputs (including quoted prices for similar securities, interest rates, prepayment speeds and credit risk). Level 3 includes significant unobservable inputs (including the Fund’s own assumptions in determining the fair value of investments). The level assigned to the securities valuations may not be an indication of the risk or liquidity associated with investing in those securities.
The following is a summary of the inputs used as of May 31, 2023 in valuing the Fund’s investments. For information on the Fund’s policy regarding the valuation of investments, please refer to the Security Valuation section of Note 2 in the accompanying Notes to Financial Statements.
| Assets |
Level 1 | Level 2 | Level 3 | Total | ||||||||||||
| Common Stocks (a) |
$ | 1,214,077,995 | $ | — | $ | — | $ | 1,214,077,995 | ||||||||
| Preferred Stocks |
7,811,780 | — | — | 7,811,780 | ||||||||||||
| Short-Term Investments (a) |
94,160,451 | — | — | 94,160,451 | ||||||||||||
|
|
|
|
|
|
|
|
|
|||||||||
| TOTAL |
$ | 1,316,050,226 | $ | — | $ | — | $ | 1,316,050,226 | ||||||||
|
|
|
|
|
|
|
|
|
|||||||||
| Liabilities |
Level 1 | Level 2 | Level 3 | Total | ||||||||||||
| Derivatives (b) |
||||||||||||||||
| Futures Contracts |
$ | (551,732 | ) | $ | — | $ | — | $ | (551,732 | ) | ||||||
|
|
|
|
|
|
|
|
|
|||||||||
| TOTAL |
$ | (551,732 | ) | $ | — | $ | — | $ | (551,732 | ) | ||||||
|
|
|
|
|
|
|
|
|
|||||||||
| (a) | See Schedule of Investments for additional detailed categorizations. |
| (b) | Derivatives include unrealized appreciation (depreciation) on open futures contracts. |
| See Notes to Financial Statements. | 68 |
This Page is Intentionally Left Blank
69
DBX ETF Trust
May 31, 2023
| Xtrackers Bloomberg US Investment Grade Corporate ESG ETF |
Xtrackers J.P. Morgan ESG Emerging Markets Sovereign ETF |
Xtrackers J.P. Morgan ESG USD High Yield Corporate Bond ETF |
Xtrackers Municipal Infrastructure Revenue Bond ETF |
|||||||||||||
| Assets |
||||||||||||||||
| Investment in non-affiliated securities at value |
$ | 2,680,337 | $ | 16,942,200 | $ | 13,123,756 | $ | 110,658,638 | ||||||||
| Investment in affiliated securities at value |
16,771 | — | — | — | ||||||||||||
| Investment in DWS Government Money Market Series |
18,520 | 29,514 | 91,008 | — | ||||||||||||
| Cash |
— | — | — | 479,510 | ||||||||||||
| Foreign currency at value |
— | 43 | — | — | ||||||||||||
| Receivables: | ||||||||||||||||
| Investment securities sold |
24,998 | 76,282 | 173,676 | — | ||||||||||||
| Interest |
24,813 | 260,585 | 225,282 | 1,406,855 | ||||||||||||
| Securities lending income |
11 | 22 | 78 | — | ||||||||||||
|
|
|
|
|
|
|
|
|
|||||||||
| Total assets |
$ | 2,765,450 | $ | 17,308,646 | $ | 13,613,800 | $ | 112,545,003 | ||||||||
|
|
|
|
|
|
|
|
|
|||||||||
| Liabilities |
||||||||||||||||
| Payables: | ||||||||||||||||
| Investment securities purchased |
32,540 | 34,446 | 164,991 | 220,239 | ||||||||||||
| Investment advisory fees |
425 | 5,150 | 2,283 | 14,360 | ||||||||||||
|
|
|
|
|
|
|
|
|
|||||||||
| Total liabilities |
32,965 | 39,596 | 167,274 | 234,599 | ||||||||||||
|
|
|
|
|
|
|
|
|
|||||||||
| Net Assets, at value |
$ | 2,732,485 | $ | 17,269,050 | $ | 13,446,526 | $ | 112,310,404 | ||||||||
|
|
|
|
|
|
|
|
|
|||||||||
| Net Assets Consist of |
||||||||||||||||
| Paid-in capital |
$ | 4,576,477 | $ | 23,232,717 | $ | 17,005,470 | $ | 128,464,710 | ||||||||
| Distributable earnings (loss) |
(1,843,992 | ) | (5,963,667 | ) | (3,558,944 | ) | (16,154,306 | ) | ||||||||
|
|
|
|
|
|
|
|
|
|||||||||
| Net Assets, at value |
$ | 2,732,485 | $ | 17,269,050 | $ | 13,446,526 | $ | 112,310,404 | ||||||||
|
|
|
|
|
|
|
|
|
|||||||||
| Number of Common Shares outstanding |
150,001 | 1,050,001 | 750,001 | 4,500,001 | ||||||||||||
|
|
|
|
|
|
|
|
|
|||||||||
| Net Asset Value |
$ | 18.22 | $ | 16.45 | $ | 17.93 | $ | 24.96 | ||||||||
|
|
|
|
|
|
|
|
|
|||||||||
| Investment in non-affiliated securities at cost |
$ | 3,098,194 | $ | 20,310,204 | $ | 14,417,013 | $ | 122,800,563 | ||||||||
|
|
|
|
|
|
|
|
|
|||||||||
| Investment in affiliated securities at cost |
$ | 20,066 | $ | — | $ | — | $ | — | ||||||||
|
|
|
|
|
|
|
|
|
|||||||||
| Investment in DWS Government Money Market Series at cost |
$ | 18,520 | $ | 29,514 | $ | 91,008 | $ | — | ||||||||
|
|
|
|
|
|
|
|
|
|||||||||
| Foreign currency at cost |
$ | — | $ | 43 | $ | — | $ | — | ||||||||
|
|
|
|
|
|
|
|
|
|||||||||
| * | Represents collateral on securities loaned. |
| See Notes to Financial Statements. | 70 |
DBX ETF Trust
Statements of Assets and Liabilities (Continued)
May 31, 2023
| Xtrackers MSCI All World ex US High Dividend Yield Equity ETF |
Xtrackers MSCI EAFE High Dividend Yield Equity ETF |
|||||||
| Assets |
||||||||
| Investment in non-affiliated securities at value |
$ | 9,994,206 | $ | 1,221,889,775 | ||||
| Investment in affiliated securities at value |
50,737 | — | ||||||
| Investment in DWS Government Money Market Series |
1,070 | 1,988,411 | ||||||
| Investment in DWS Government & Agency Securities Portfolio* |
595,473 | 92,172,040 | ||||||
| Foreign currency at value |
59,245 | 11,380,382 | ||||||
| Deposit with broker for futures contracts |
8,889 | 1,043,075 | ||||||
| Receivables: | ||||||||
| Investment securities sold |
1,239,978 | 233,908,538 | ||||||
| Dividends |
44,435 | 7,671,128 | ||||||
| Interest |
47 | 4,339 | ||||||
| Securities lending income |
882 | 154,231 | ||||||
| Foreign tax reclaim |
53,588 | 4,116,881 | ||||||
|
|
|
|
|
|||||
| Total assets |
$ | 12,048,550 | $ | 1,574,328,800 | ||||
|
|
|
|
|
|||||
| Liabilities |
||||||||
| Payable upon return of securities loaned |
$ | 595,473 | $ | 92,172,040 | ||||
| Payables: | ||||||||
| Investment securities purchased |
1,252,418 | 180,360,059 | ||||||
| Capital shares |
— | 52,770,646 | ||||||
| Investment advisory fees |
1,785 | 220,146 | ||||||
| Variation margin on futures contracts |
2,293 | 268,879 | ||||||
| Deferred foreign tax payable |
4,359 | — | ||||||
|
|
|
|
|
|||||
| Total liabilities |
1,856,328 | 325,791,770 | ||||||
|
|
|
|
|
|||||
| Net Assets, at value |
$ | 10,192,222 | $ | 1,248,537,030 | ||||
|
|
|
|
|
|||||
| Net Assets Consist of |
||||||||
| Paid-in capital |
$ | 15,775,096 | $ | 1,347,542,480 | ||||
| Distributable earnings (loss) |
(5,582,874 | ) | (99,005,450 | ) | ||||
|
|
|
|
|
|||||
| Net Assets, at value |
$ | 10,192,222 | $ | 1,248,537,030 | ||||
|
|
|
|
|
|||||
| Number of Common Shares outstanding |
450,001 | 55,600,001 | ||||||
|
|
|
|
|
|||||
| Net Asset Value |
$ | 22.65 | $ | 22.46 | ||||
|
|
|
|
|
|||||
| Investment in non-affiliated securities at cost |
$ | 11,031,945 | $ | 1,222,266,251 | ||||
|
|
|
|
|
|||||
| Investment in affiliated securities at cost |
$ | 50,208 | $ | — | ||||
|
|
|
|
|
|||||
| Value of securities loaned |
$ | 519,075 | $ | 77,093,638 | ||||
|
|
|
|
|
|||||
| Investment in DWS Government Money Market Series at cost |
$ | 1,070 | $ | 1,988,411 | ||||
|
|
|
|
|
|||||
| Investment in DWS Government & Agency Securities Portfolio at cost* |
$ | 595,473 | $ | 92,172,040 | ||||
|
|
|
|
|
|||||
| Non-cash collateral for securities on loan |
$ | 75,041 | $ | 16,157,243 | ||||
|
|
|
|
|
|||||
| Foreign currency at cost |
$ | 60,588 | $ | 11,624,053 | ||||
|
|
|
|
|
|||||
| * | Represents collateral on securities loaned. |
| See Notes to Financial Statements. | 71 |
DBX ETF Trust
For the Year Ended May 31, 2023
| Xtrackers Bloomberg US Investment Grade Corporate ESG ETF |
Xtrackers J.P. Morgan ESG Emerging Markets Sovereign ETF |
Xtrackers J.P. Morgan ESG USD High Yield Corporate Bond ETF |
Xtrackers Municipal Infrastructure Revenue Bond ETF |
|||||||||||||
| Investment Income |
||||||||||||||||
| Unaffiliated interest income |
$ | 202,858 | $ | 853,679 | $ | 1,139,506 | $ | 3,734,532 | ||||||||
| Affiliated interest income |
1,119 | — | 1,844 | — | ||||||||||||
| Income distributions from affiliated funds |
1,027 | 5,202 | 4,170 | — | ||||||||||||
| Affiliated securities lending income |
985 | 7,703 | 6,635 | — | ||||||||||||
| Unaffiliated securities lending income, net of borrower rebates |
— | — | 953 | — | ||||||||||||
|
|
|
|
|
|
|
|
|
|||||||||
| Total investment income |
205,989 | 866,584 | 1,153,108 | 3,734,532 | ||||||||||||
|
|
|
|
|
|
|
|
|
|||||||||
| Expenses |
||||||||||||||||
| Investment advisory fees |
9,234 | 59,841 | 34,836 | 190,265 | ||||||||||||
| Other expenses |
45 | 45 | 45 | 58 | ||||||||||||
|
|
|
|
|
|
|
|
|
|||||||||
| Total expenses |
9,279 | 59,886 | 34,881 | 190,323 | ||||||||||||
|
|
|
|
|
|
|
|
|
|||||||||
| Less fees waived (see note 3): |
||||||||||||||||
| Waiver |
(40 | ) | (120 | ) | (92 | ) | — | |||||||||
|
|
|
|
|
|
|
|
|
|||||||||
| Net expenses |
9,239 | 59,766 | 34,789 | 190,323 | ||||||||||||
|
|
|
|
|
|
|
|
|
|||||||||
| Net investment income (loss) |
196,750 | 806,818 | 1,118,319 | 3,544,209 | ||||||||||||
|
|
|
|
|
|
|
|
|
|||||||||
| Realized and Unrealized Gain (Loss) |
||||||||||||||||
| Net realized gain (loss) from: |
||||||||||||||||
| Investments |
(253,503 | ) | (1,294,345 | ) | (588,200 | ) | (2,625,485 | ) | ||||||||
| Investments in affiliates |
(130 | ) | — | (16,144 | ) | — | ||||||||||
| In-kind redemptions |
(370,468 | ) | (288,108 | ) | (392,440 | ) | (4,128,537 | ) | ||||||||
| In-kind redemptions in affiliates |
317 | — | (847 | ) | — | |||||||||||
| Foreign currency transactions |
— | — | — | — | ||||||||||||
| Payments by Affiliates (see note 7) |
— | — | 188 | — | ||||||||||||
|
|
|
|
|
|
|
|
|
|||||||||
| Net realized gain (loss) |
(623,784 | ) | (1,582,453 | ) | (997,443 | ) | (6,754,022 | ) | ||||||||
|
|
|
|
|
|
|
|
|
|||||||||
| Net change in unrealized appreciation (depreciation) on: |
||||||||||||||||
| Investments |
323,065 | 523,279 | (120,536 | ) | 665,530 | |||||||||||
| Investments in affiliates |
(843 | ) | — | 5,615 | — | |||||||||||
|
|
|
|
|
|
|
|
|
|||||||||
| Net change in unrealized appreciation (depreciation) |
322,222 | 523,279 | (114,921 | ) | 665,530 | |||||||||||
|
|
|
|
|
|
|
|
|
|||||||||
| Net realized and unrealized gain (loss) on investments and foreign currency transactions |
(301,562 | ) | (1,059,174 | ) | (1,112,364 | ) | (6,088,492 | ) | ||||||||
|
|
|
|
|
|
|
|
|
|||||||||
| Net Increase (Decrease) in Net Assets Resulting from Operations |
$ | (104,812 | ) | $ | (252,356 | ) | $ | 5,955 | $ | (2,544,283 | ) | |||||
|
|
|
|
|
|
|
|
|
|||||||||
| See Notes to Financial Statements. | 72 |
DBX ETF Trust
Statements of Operations (Continued)
For the Year Ended May 31, 2023
| Xtrackers MSCI All World ex US High Dividend Yield Equity ETF |
Xtrackers MSCI EAFE High Dividend Yield Equity ETF |
|||||||
| Investment Income |
||||||||
| Unaffiliated dividend income* |
$ | 538,902 | $ | 58,914,835 | ||||
| Income distributions from affiliated funds |
1,666 | 65,798 | ||||||
| Affiliated securities lending income |
4,199 | 329,488 | ||||||
|
|
|
|
|
|||||
| Total investment income |
544,767 | 59,310,121 | ||||||
|
|
|
|
|
|||||
| Expenses |
||||||||
| Investment advisory fees |
20,260 | 2,149,850 | ||||||
| Other expenses |
58 | 1,150 | ||||||
|
|
|
|
|
|||||
| Total expenses |
20,318 | 2,151,000 | ||||||
|
|
|
|
|
|||||
| Less fees waived (see note 3): |
||||||||
| Waiver |
(74 | ) | (1,039 | ) | ||||
|
|
|
|
|
|||||
| Net expenses |
20,244 | 2,149,961 | ||||||
|
|
|
|
|
|||||
| Net investment income (loss) |
524,523 | 57,160,160 | ||||||
|
|
|
|
|
|||||
| Realized and Unrealized Gain (Loss) |
||||||||
| Net realized gain (loss) from: | ||||||||
| Investments |
(293,350 | ) | (40,786,122 | ) | ||||
| Investments in affiliates |
(8,476 | ) | — | |||||
| In-kind redemptions |
(8,755 | ) | 30,904,997 | |||||
| Futures contracts |
10,915 | 268,738 | ||||||
| Foreign currency transactions |
(29,736 | ) | (230,553 | ) | ||||
|
|
|
|
|
|||||
| Net realized gain (loss) |
(329,402 | ) | (9,842,940 | ) | ||||
|
|
|
|
|
|||||
| Net change in unrealized appreciation (depreciation) on: |
||||||||
| Investments** |
(532,336 | ) | (17,805,460 | ) | ||||
| Investments in affiliates |
217 | — | ||||||
| Futures contracts |
686 | (777,169 | ) | |||||
| Foreign currency translations |
(4,564 | ) | (302,899 | ) | ||||
|
|
|
|
|
|||||
| Net change in unrealized appreciation (depreciation) |
(535,997 | ) | (18,885,528 | ) | ||||
|
|
|
|
|
|||||
| Net realized and unrealized gain (loss) on investments, futures and foreign currency transactions |
(865,399 | ) | (28,728,468 | ) | ||||
|
|
|
|
|
|||||
| Net Increase (Decrease) in Net Assets Resulting from Operations |
$ | (340,876 | ) | $ | 28,431,692 | |||
|
|
|
|
|
|||||
| * Unaffiliated foreign tax withheld |
$ | 59,668 | $ | 5,553,552 | ||||
| ** Including change in deferred foreign taxes |
$ | 1,766 | $ | — | ||||
| See Notes to Financial Statements. | 73 |
DBX ETF Trust
| Xtrackers Bloomberg US Investment Grade Corporate ESG ETF |
Xtrackers J.P. Morgan ESG Emerging Markets Sovereign ETF |
|||||||||||||||
| Year Ended May 31, | Year Ended May 31, | |||||||||||||||
| 2023 | 2022 | 2023 | 2022 | |||||||||||||
| Increase (Decrease) in Net Assets from Operations |
||||||||||||||||
| Net investment income (loss) |
$ | 196,750 | $ | 175,650 | $ | 806,818 | $ | 1,159,925 | ||||||||
| Net realized gain (loss) |
(623,784 | ) | 73,762 | (1,582,453 | ) | (1,696,232 | ) | |||||||||
| Net change in net unrealized appreciation (depreciation) |
322,222 | (1,009,974 | ) | 523,279 | (4,349,089 | ) | ||||||||||
|
|
|
|
|
|
|
|
|
|||||||||
| Net increase (decrease) in net assets resulting from operations |
(104,812 | ) | (760,562 | ) | (252,356 | ) | (4,885,396 | ) | ||||||||
|
|
|
|
|
|
|
|
|
|||||||||
| Distributions to Shareholders |
(203,344 | ) | (180,073 | ) | (867,961 | ) | (1,220,031 | ) | ||||||||
|
|
|
|
|
|
|
|
|
|||||||||
| Fund Shares Transactions |
||||||||||||||||
| Proceeds from shares sold |
— | 1,097,308 | 1,664,481 | — | ||||||||||||
| Value of shares redeemed |
(3,672,018 | ) | (1,119,611 | ) | (2,510,949 | ) | (5,144,046 | ) | ||||||||
|
|
|
|
|
|
|
|
|
|||||||||
| Net increase (decrease) in net assets resulting from fund share transactions |
(3,672,018 | ) | (22,303 | ) | (846,468 | ) | (5,144,046 | ) | ||||||||
|
|
|
|
|
|
|
|
|
|||||||||
| Total net increase (decrease) in Net Assets |
(3,980,174 | ) | (962,938 | ) | (1,966,785 | ) | (11,249,473 | ) | ||||||||
| Net Assets |
||||||||||||||||
| Beginning of year |
6,712,659 | 7,675,597 | 19,235,835 | 30,485,308 | ||||||||||||
|
|
|
|
|
|
|
|
|
|||||||||
| End of year |
$ | 2,732,485 | $ | 6,712,659 | $ | 17,269,050 | $ | 19,235,835 | ||||||||
|
|
|
|
|
|
|
|
|
|||||||||
| Changes in Shares Outstanding |
||||||||||||||||
| Shares outstanding, beginning of year |
350,001 | 350,001 | 1,100,001 | 1,400,001 | ||||||||||||
| Shares sold |
— | 50,000 | 100,000 | — | ||||||||||||
| Shares redeemed |
(200,000 | ) | (50,000 | ) | (150,000 | ) | (300,000 | ) | ||||||||
|
|
|
|
|
|
|
|
|
|||||||||
| Shares outstanding, end of year |
150,001 | 350,001 | 1,050,001 | 1,100,001 | ||||||||||||
|
|
|
|
|
|
|
|
|
|||||||||
| See Notes to Financial Statements. | 74 |
DBX ETF Trust
Statements of Changes in Net Assets (Continued)
| Xtrackers J.P. Morgan ESG USD High Yield Corporate Bond ETF |
Xtrackers Municipal Infrastructure Revenue Bond ETF |
|||||||||||||||
| Year Ended May 31, | Year Ended May 31, | |||||||||||||||
| 2023 | 2022 | 2023 | 2022 | |||||||||||||
| Increase (Decrease) in Net Assets from Operations |
||||||||||||||||
| Net investment income (loss) |
$ | 1,118,319 | $ | 1,163,039 | $ | 3,544,209 | $ | 3,538,149 | ||||||||
| Net realized gain (loss) |
(997,443 | ) | (158,672 | ) | (6,754,022 | ) | (1,453,152 | ) | ||||||||
| Net change in net unrealized appreciation (depreciation) |
(114,921 | ) | (2,204,323 | ) | 665,530 | (19,965,660 | ) | |||||||||
|
|
|
|
|
|
|
|
|
|||||||||
| Net increase (decrease) in net assets resulting from operations |
5,955 | (1,199,956 | ) | (2,544,283 | ) | (17,880,663 | ) | |||||||||
|
|
|
|
|
|
|
|
|
|||||||||
| Distributions to Shareholders |
(1,154,340 | ) | (1,190,482 | ) | (3,631,610 | ) | (3,438,355 | ) | ||||||||
|
|
|
|
|
|
|
|
|
|||||||||
| Fund Shares Transactions |
||||||||||||||||
| Proceeds from shares sold |
— | 7,440,810 | 8,803,399 | 45,128,404 | ||||||||||||
| Value of shares redeemed |
(7,412,053 | ) | — | (52,057,833 | ) | — | ||||||||||
|
|
|
|
|
|
|
|
|
|||||||||
| Net increase (decrease) in net assets resulting from fund share transactions |
(7,412,053 | ) | 7,440,810 | (43,254,434 | ) | 45,128,404 | ||||||||||
|
|
|
|
|
|
|
|
|
|||||||||
| Total net increase (decrease) in Net Assets |
(8,560,438 | ) | 5,050,372 | (49,430,327 | ) | 23,809,386 | ||||||||||
| Net Assets |
||||||||||||||||
| Beginning of year |
22,006,964 | 16,956,592 | 161,740,731 | 137,931,345 | ||||||||||||
|
|
|
|
|
|
|
|
|
|||||||||
| End of year |
$ | 13,446,526 | $ | 22,006,964 | $ | 112,310,404 | $ | 161,740,731 | ||||||||
|
|
|
|
|
|
|
|
|
|||||||||
| Changes in Shares Outstanding |
||||||||||||||||
| Shares outstanding, beginning of year |
1,150,001 | 800,001 | 6,250,001 | 4,700,001 | ||||||||||||
| Shares sold |
— | 350,000 | 350,000 | 1,550,000 | ||||||||||||
| Shares redeemed |
(400,000 | ) | — | (2,100,000 | ) | — | ||||||||||
|
|
|
|
|
|
|
|
|
|||||||||
| Shares outstanding, end of year |
750,001 | 1,150,001 | 4,500,001 | 6,250,001 | ||||||||||||
|
|
|
|
|
|
|
|
|
|||||||||
| See Notes to Financial Statements. | 75 |
DBX ETF Trust
Statements of Changes in Net Assets (Continued)
| Xtrackers MSCI All World ex US High Dividend Yield Equity ETF |
Xtrackers MSCI EAFE High Dividend Yield Equity ETF |
|||||||||||||||
| Year Ended May 31, | Year Ended May 31, | |||||||||||||||
| 2023 | 2022 | 2023 | 2022 | |||||||||||||
| Increase (Decrease) in Net Assets from Operations |
||||||||||||||||
| Net investment income (loss) |
$ | 524,523 | $ | 1,166,348 | $ | 57,160,160 | $ | 41,752,472 | ||||||||
| Net realized gain (loss) |
(329,402 | ) | 607,009 | (9,842,940 | ) | 2,815,309 | ||||||||||
| Net change in net unrealized appreciation (depreciation) |
(535,997 | ) | (3,066,821 | ) | (18,885,528 | ) | (58,165,110 | ) | ||||||||
|
|
|
|
|
|
|
|
|
|||||||||
| Net increase (decrease) in net assets resulting from operations |
(340,876 | ) | (1,293,464 | ) | 28,431,692 | (13,597,329 | ) | |||||||||
|
|
|
|
|
|
|
|
|
|||||||||
| Distributions to Shareholders |
(648,129 | ) | (1,163,325 | ) | (44,880,584 | ) | (37,386,297 | ) | ||||||||
|
|
|
|
|
|
|
|
|
|||||||||
| Fund Shares Transactions |
||||||||||||||||
| Proceeds from shares sold |
— | 7,568,045 | 529,031,423 | 442,165,658 | ||||||||||||
| Value of shares redeemed |
(1,083,943 | ) | (15,475,443 | ) | (219,450,948 | ) | (174,417,168 | ) | ||||||||
|
|
|
|
|
|
|
|
|
|||||||||
| Net increase (decrease) in net assets resulting from fund share transactions |
(1,083,943 | ) | (7,907,398 | ) | 309,580,475 | 267,748,490 | ||||||||||
|
|
|
|
|
|
|
|
|
|||||||||
| Total net increase (decrease) in Net Assets |
(2,072,948 | ) | (10,364,187 | ) | 293,131,583 | 216,764,864 | ||||||||||
| Net Assets |
||||||||||||||||
| Beginning of year |
12,265,170 | 22,629,357 | 955,405,447 | 738,640,583 | ||||||||||||
|
|
|
|
|
|
|
|
|
|||||||||
| End of year |
$ | 10,192,222 | $ | 12,265,170 | $ | 1,248,537,030 | $ | 955,405,447 | ||||||||
|
|
|
|
|
|
|
|
|
|||||||||
| Changes in Shares Outstanding |
||||||||||||||||
| Shares outstanding, beginning of year |
500,001 | 850,001 | 40,700,001 | 29,550,001 | ||||||||||||
| Shares sold |
— | 300,000 | 24,950,000 | 18,750,000 | ||||||||||||
| Shares redeemed |
(50,000 | ) | (650,000 | ) | (10,050,000 | ) | (7,600,000 | ) | ||||||||
|
|
|
|
|
|
|
|
|
|||||||||
| Shares outstanding, end of year |
450,001 | 500,001 | 55,600,001 | 40,700,001 | ||||||||||||
|
|
|
|
|
|
|
|
|
|||||||||
| See Notes to Financial Statements. | 76 |
DBX ETF Trust
| Xtrackers Bloomberg US Investment Grade Corporate ESG ETF Selected Per Share Data |
Years Ended May 31, | |||||||||||||||||||
| 2023 | 2022 | 2021 | 2020 | 2019 | ||||||||||||||||
| Net Asset Value, beginning of year |
$ | 19.18 | $ | 21.93 | $ | 22.02 | $ | 23.04 | $ | 23.84 | ||||||||||
|
|
|
|
|
|
|
|
|
|
|
|||||||||||
| Income (loss) from investment operations: | ||||||||||||||||||||
| Net investment income (loss)(a) |
0.59 | 0.52 | 0.53 | 0.73 | 0.83 | |||||||||||||||
| Net realized and unrealized gain (loss) |
(0.97 | ) | (2.74 | ) | (0.10 | ) | (0.98 | ) | (0.32 | ) | ||||||||||
|
|
|
|
|
|
|
|
|
|
|
|||||||||||
| Total from investment operations |
(0.38 | ) | (2.22 | ) | 0.43 | (0.25 | ) | 0.51 | ||||||||||||
|
|
|
|
|
|
|
|
|
|
|
|||||||||||
| Less distributions from: |
| |||||||||||||||||||
| Net investment income |
(0.58 | ) | (0.53 | ) | (0.52 | ) | (0.77 | ) | (0.83 | ) | ||||||||||
| Net realized gains |
— | — | — | — | (0.48 | ) | ||||||||||||||
|
|
|
|
|
|
|
|
|
|
|
|||||||||||
| Total distributions |
(0.58 | ) | (0.53 | ) | (0.52 | ) | (0.77 | ) | (1.31 | ) | ||||||||||
|
|
|
|
|
|
|
|
|
|
|
|||||||||||
| Net Asset Value, end of year |
$ | 18.22 | $ | 19.18 | $ | 21.93 | $ | 22.02 | $ | 23.04 | ||||||||||
|
|
|
|
|
|
|
|
|
|
|
|||||||||||
| Total Return (%)(b) |
(1.95 | ) | (10.36 | ) | 1.95 | (1.16 | ) | 2.28 | ||||||||||||
| Ratios to Average Net Assets and Supplemental Data |
||||||||||||||||||||
| Net Assets, end of year ($ millions) |
3 | 7 | 8 | 10 | 7 | |||||||||||||||
| Ratio of expenses before fee waiver (%) |
0.15 | 0.15 | 0.15 | 0.24 | 0.25 | |||||||||||||||
| Ratio of expenses after fee waiver (%) |
0.15 | 0.15 | 0.15 | 0.24 | 0.25 | |||||||||||||||
| Ratio of net investment income (loss) (%) |
3.20 | 2.42 | 2.34 | 3.18 | 3.53 | |||||||||||||||
| Portfolio turnover rate (%)(c) |
17 | 30 | 29 | 57 | 25 | |||||||||||||||
| Xtrackers J.P. Morgan ESG Emerging Markets Sovereign ETF Selected Per Share Data |
Years Ended May 31, | |||||||||||||||||||
| 2023 | 2022 | 2021 | 2020 | 2019 | ||||||||||||||||
| Net Asset Value, beginning of year |
$ | 17.49 | $ | 21.78 | $ | 20.63 | $ | 23.10 | $ | 24.36 | ||||||||||
|
|
|
|
|
|
|
|
|
|
|
|||||||||||
| Income (loss) from investment operations: | ||||||||||||||||||||
| Net investment income (loss)(a) |
0.78 | 0.84 | 0.84 | 0.89 | 1.05 | |||||||||||||||
| Net realized and unrealized gain (loss) |
(0.99 | ) | (4.26 | ) | 1.12 | (2.37 | ) | (0.29 | ) | |||||||||||
|
|
|
|
|
|
|
|
|
|
|
|||||||||||
| Total from investment operations |
(0.21 | ) | (3.42 | ) | 1.96 | (1.48 | ) | 0.76 | ||||||||||||
|
|
|
|
|
|
|
|
|
|
|
|||||||||||
| Less distributions from: |
| |||||||||||||||||||
| Net investment income |
(0.83 | ) | (0.87 | ) | (0.81 | ) | (0.99 | ) | (1.04 | ) | ||||||||||
| Net realized gains |
— | — | — | — | (0.98 | ) | ||||||||||||||
|
|
|
|
|
|
|
|
|
|
|
|||||||||||
| Total distributions |
(0.83 | ) | (0.87 | ) | (0.81 | ) | (0.99 | ) | (2.02 | ) | ||||||||||
|
|
|
|
|
|
|
|
|
|
|
|||||||||||
| Net Asset Value, end of year |
$ | 16.45 | $ | 17.49 | $ | 21.78 | $ | 20.63 | $ | 23.10 | ||||||||||
|
|
|
|
|
|
|
|
|
|
|
|||||||||||
| Total Return (%)(b) |
(1.11 | ) | (16.21 | ) | 9.57 | (6.79 | ) | 3.31 | ||||||||||||
| Ratios to Average Net Assets and Supplemental Data |
||||||||||||||||||||
| Net Assets, end of year ($ millions) |
17 | 19 | 30 | 14 | 7 | |||||||||||||||
| Ratio of expenses before fee waiver (%) |
0.35 | 0.35 | 0.35 | 0.44 | 0.45 | |||||||||||||||
| Ratio of expenses after fee waiver (%) |
0.35 | 0.35 | 0.35 | 0.44 | 0.45 | |||||||||||||||
| Ratio of net investment income (loss) (%) |
4.72 | 4.09 | 3.87 | 3.85 | 4.37 | |||||||||||||||
| Portfolio turnover rate (%)(c) |
20 | 24 | 35 | 26 | 31 | |||||||||||||||
| (a) | Based on average shares outstanding during the period. |
| (b) | Total Return would have been lower if certain expenses had not been reimbursed by the Advisor. |
| (c) | Portfolio turnover rate does not include securities received or delivered from processing creations or redemptions. |
| See Notes to Financial Statements. | 77 |
DBX ETF Trust
Financial Highlights (Continued)
| Xtrackers J.P. Morgan ESG USD High Yield Corporate Bond ETF Selected Per Share Data |
Years Ended May 31, | |||||||||||||||||||
| 2023 | 2022 | 2021 | 2020 | 2019 | ||||||||||||||||
| Net Asset Value, beginning of year |
$ | 19.14 | $ | 21.20 | $ | 19.55 | $ | 21.72 | $ | 22.68 | ||||||||||
|
|
|
|
|
|
|
|
|
|
|
|||||||||||
| Income (loss) from investment operations: | ||||||||||||||||||||
| Net investment income (loss)(a) |
1.16 | 1.03 | 1.23 | 1.26 | 1.32 | |||||||||||||||
| Net realized and unrealized gain (loss) |
(1.18 | ) | (2.01 | ) | 1.67 | (2.19 | ) | (0.82 | ) | |||||||||||
|
|
|
|
|
|
|
|
|
|
|
|||||||||||
| Total from investment operations |
(0.02 | ) | (0.98 | ) | 2.90 | (0.93 | ) | 0.50 | ||||||||||||
|
|
|
|
|
|
|
|
|
|
|
|||||||||||
| Less distributions from: |
| |||||||||||||||||||
| Net investment income |
(1.19 | ) | (1.08 | ) | (1.25 | ) | (1.24 | ) | (1.46 | ) | ||||||||||
|
|
|
|
|
|
|
|
|
|
|
|||||||||||
| Total distributions |
(1.19 | ) | (1.08 | ) | (1.25 | ) | (1.24 | ) | (1.46 | ) | ||||||||||
|
|
|
|
|
|
|
|
|
|
|
|||||||||||
| Net Asset Value, end of year |
$ | 17.93 | $ | 19.14 | $ | 21.20 | $ | 19.55 | $ | 21.72 | ||||||||||
|
|
|
|
|
|
|
|
|
|
|
|||||||||||
| Total Return (%)(b) |
0.03 | (4.90 | ) | 15.22 | (4.58 | ) | 2.18 | |||||||||||||
| Ratios to Average Net Assets and Supplemental Data |
||||||||||||||||||||
| Net Assets, end of year ($ millions) |
13 | 22 | 17 | 19 | 7 | |||||||||||||||
| Ratio of expenses before fee waiver (%) |
0.20 | 0.20 | 0.20 | 0.33 | (c) | 0.35 | (c) | |||||||||||||
| Ratio of expenses after fee waiver (%) |
0.20 | 0.20 | 0.20 | 0.19 | (c) | 0.14 | (c) | |||||||||||||
| Ratio of net investment income (loss) (%) |
6.42 | 5.03 | 5.94 | 6.06 | 5.91 | |||||||||||||||
| Portfolio turnover rate (%)(d) |
29 | 47 | 56 | 113 | 19 | |||||||||||||||
| Xtrackers Municipal Infrastructure Revenue Bond ETF Selected Per Share Data |
Years Ended May 31, | |||||||||||||||||||
| 2023 | 2022 | 2021 | 2020 | 2019 | ||||||||||||||||
| Net Asset Value, beginning of year |
$ | 25.88 | $ | 29.35 | $ | 27.75 | $ | 27.70 | $ | 26.52 | ||||||||||
|
|
|
|
|
|
|
|
|
|
|
|||||||||||
| Income (loss) from investment operations: | ||||||||||||||||||||
| Net investment income (loss)(a) |
0.69 | 0.63 | 0.70 | 0.76 | 0.75 | |||||||||||||||
| Net realized and unrealized gain (loss) |
(0.91 | ) | (3.48 | ) | 1.63 | (0.00 | )(e) | 1.18 | ||||||||||||
|
|
|
|
|
|
|
|
|
|
|
|||||||||||
| Total from investment operations |
(0.22 | ) | (2.85 | ) | 2.33 | 0.76 | 1.93 | |||||||||||||
|
|
|
|
|
|
|
|
|
|
|
|||||||||||
| Less distributions from: |
| |||||||||||||||||||
| Net investment income |
(0.70 | ) | (0.62 | ) | (0.73 | ) | (0.71 | ) | (0.75 | ) | ||||||||||
|
|
|
|
|
|
|
|
|
|
|
|||||||||||
| Total distributions |
(0.70 | ) | (0.62 | ) | (0.73 | ) | (0.71 | ) | (0.75 | ) | ||||||||||
|
|
|
|
|
|
|
|
|
|
|
|||||||||||
| Net Asset Value, end of year |
$ | 24.96 | $ | 25.88 | $ | 29.35 | $ | 27.75 | $ | 27.70 | ||||||||||
|
|
|
|
|
|
|
|
|
|
|
|||||||||||
| Total Return (%) |
(0.79 | ) | (9.87 | ) | 8.50 | 2.77 | 7.45 | (b) | ||||||||||||
| Ratios to Average Net Assets and Supplemental Data |
||||||||||||||||||||
| Net Assets, end of year ($ millions) |
112 | 162 | 138 | 97 | 68 | |||||||||||||||
| Ratio of expenses (%) |
0.15 | 0.15 | 0.15 | 0.15 | 0.25 | |||||||||||||||
| Ratio of expenses after fee waiver (%) |
0.15 | 0.15 | 0.15 | 0.15 | 0.22 | |||||||||||||||
| Ratio of net investment income (loss) (%) |
2.79 | 2.24 | 2.42 | 2.72 | 2.85 | |||||||||||||||
| Portfolio turnover rate (%)(d) |
12 | 27 | 10 | 12 | 25 | |||||||||||||||
| (a) | Based on average shares outstanding during the period. |
| (b) | Total Return would have been lower if certain expenses had not been reimbursed by the Advisor. |
| (c) | The Fund invests in other ETFs and indirectly bears its proportionate shares of fees and expenses incurred by the Underlying Funds in which the Fund is invested. This ratio does not included these indirect fees and expenses. |
| (d) | Portfolio turnover rate does not include securities received or delivered from processing creations or redemptions. |
| (e) | Less than 0.005. |
| See Notes to Financial Statements. | 78 |
DBX ETF Trust
Financial Highlights (Continued)
| Xtrackers MSCI All World ex US High Dividend Yield Equity ETF Selected Per Share Data |
Years Ended May 31, | |||||||||||||||||||
| 2023 | 2022 | 2021 | 2020 | 2019 | ||||||||||||||||
| Net Asset Value, beginning of year |
$ | 24.53 | $ | 26.62 | $ | 20.87 | $ | 23.69 | $ | 25.42 | ||||||||||
|
|
|
|
|
|
|
|
|
|
|
|||||||||||
| Income (loss) from investment operations: | ||||||||||||||||||||
| Net investment income (loss)(a) |
1.14 | 1.22 | 1.16 | 0.94 | 1.21 | |||||||||||||||
| Net realized and unrealized gain (loss) |
(1.66 | ) | (2.13 | ) | 5.75 | (2.78 | ) | (1.92 | ) | |||||||||||
|
|
|
|
|
|
|
|
|
|
|
|||||||||||
| Total from investment operations |
(0.52 | ) | (0.91 | ) | 6.91 | (1.84 | ) | (0.71 | ) | |||||||||||
|
|
|
|
|
|
|
|
|
|
|
|||||||||||
| Less distributions from: |
| |||||||||||||||||||
| Net investment income |
(1.36 | ) | (1.18 | ) | (1.16 | ) | (0.98 | ) | (1.02 | ) | ||||||||||
|
|
|
|
|
|
|
|
|
|
|
|||||||||||
| Total distributions |
(1.36 | ) | (1.18 | ) | (1.16 | ) | (0.98 | ) | (1.02 | ) | ||||||||||
|
|
|
|
|
|
|
|
|
|
|
|||||||||||
| Net Asset Value, end of year |
$ | 22.65 | $ | 24.53 | $ | 26.62 | $ | 20.87 | $ | 23.69 | ||||||||||
|
|
|
|
|
|
|
|
|
|
|
|||||||||||
| Total Return (%)(b) |
(1.68 | ) | (3.46 | ) | 34.16 | (8.19 | ) | (2.82 | ) | |||||||||||
| Ratios to Average Net Assets and Supplemental Data |
||||||||||||||||||||
| Net Assets, end of year ($ millions) |
10 | 12 | 23 | 20 | 24 | |||||||||||||||
| Ratio of expenses before fee waiver (%) |
0.20 | 0.20 | 0.20 | 0.20 | 0.20 | |||||||||||||||
| Ratio of expenses after fee waiver (%) |
0.20 | 0.20 | 0.20 | 0.20 | 0.20 | |||||||||||||||
| Ratio of net investment income (loss) (%) |
5.18 | 4.80 | 4.92 | 3.94 | 4.96 | |||||||||||||||
| Portfolio turnover rate (%)(c) |
29 | 38 | 57 | 40 | 30 | |||||||||||||||
| Xtrackers MSCI EAFE High Dividend Yield Equity ETF Selected Per Share Data |
Years Ended May 31, | |||||||||||||||||||
| 2023 | 2022 | 2021 | 2020 | 2019 | ||||||||||||||||
| Net Asset Value, beginning of year |
$ | 23.47 | $ | 25.00 | $ | 19.89 | $ | 22.00 | $ | 23.69 | ||||||||||
|
|
|
|
|
|
|
|
|
|
|
|||||||||||
| Income (loss) from investment operations: | ||||||||||||||||||||
| Net investment income (loss)(a) |
1.15 | 1.17 | 1.21 | 0.85 | 1.36 | |||||||||||||||
| Net realized and unrealized gain (loss) |
(1.14 | ) | (1.60 | ) | 4.94 | (2.00 | ) | (2.25 | ) | |||||||||||
|
|
|
|
|
|
|
|
|
|
|
|||||||||||
| Total from investment operations |
0.01 | (0.43 | ) | 6.15 | (1.15 | ) | (0.89 | ) | ||||||||||||
|
|
|
|
|
|
|
|
|
|
|
|||||||||||
| Less distributions from: |
| |||||||||||||||||||
| Net investment income |
(1.02 | ) | (1.10 | ) | (1.04 | ) | (0.96 | ) | (0.80 | ) | ||||||||||
|
|
|
|
|
|
|
|
|
|
|
|||||||||||
| Total distributions |
(1.02 | ) | (1.10 | ) | (1.04 | ) | (0.96 | ) | (0.80 | ) | ||||||||||
|
|
|
|
|
|
|
|
|
|
|
|||||||||||
| Net Asset Value, end of year |
$ | 22.46 | $ | 23.47 | $ | 25.00 | $ | 19.89 | $ | 22.00 | ||||||||||
|
|
|
|
|
|
|
|
|
|
|
|||||||||||
| Total Return (%)(b) |
0.46 | (1.72 | ) | 31.74 | (5.58 | ) | (3.76 | ) | ||||||||||||
| Ratios to Average Net Assets and Supplemental Data |
||||||||||||||||||||
| Net Assets, end of year ($ millions) |
1,249 | 955 | 739 | 409 | 244 | |||||||||||||||
| Ratio of expenses before fee waiver (%) |
0.20 | 0.20 | 0.20 | 0.20 | 0.20 | |||||||||||||||
| Ratio of expenses after fee waiver (%) |
0.20 | 0.20 | 0.20 | 0.20 | 0.20 | |||||||||||||||
| Ratio of net investment income (loss) (%) |
5.32 | 4.92 | 5.38 | 3.86 | 6.06 | |||||||||||||||
| Portfolio turnover rate (%)(c) |
29 | 30 | 57 | 57 | 20 | |||||||||||||||
| (a) | Based on average shares outstanding during the period. |
| (b) | Total Return would have been lower if certain expenses had not been reimbursed by the Advisor. |
| (c) | Portfolio turnover rate does not include securities received or delivered from processing creations or redemptions. |
| See Notes to Financial Statements. | 79 |
DBX ETF Trust
1. Organization
DBX ETF Trust (the “Trust”) is registered under the Investment Company Act of 1940, as amended (the “1940 Act”), as an open-end registered management investment company organized as a Delaware statutory trust.
As of May 31, 2023, the Trust consists of thirty-nine investment series of exchange-traded funds (“ETFs”)(each a “Fund” and collectively, the “Funds”) in operation and trading. These financial statements report on the Funds listed below:
Xtrackers Bloomberg US Investment Grade Corporate ESG ETF
Xtrackers J.P. Morgan ESG Emerging Markets Sovereign ETF
Xtrackers J.P. Morgan ESG USD High Yield Corporate Bond ETF
Xtrackers Municipal Infrastructure Revenue Bond ETF
Xtrackers MSCI All World ex US High Dividend Yield Equity ETF
Xtrackers MSCI EAFE High Dividend Yield Equity ETF
DBX Advisors LLC (“DBX” or the “Advisor”), an indirect, wholly-owned subsidiary of DWS Group GmbH & Co. KGaA (“DWS Group”), serves as investment advisor to the Funds and has overall responsibility for the general management and administration of the Funds, subject to the supervision of the Funds’ Board of Trustees (“Board”).
Xtrackers Bloomberg US Investment Grade Corporate ESG ETF, Xtrackers J.P. Morgan ESG Emerging Markets Sovereign ETF and Xtrackers J.P. Morgan ESG USD High Yield Corporate Bond ETF offer shares that are listed and traded on the Cboe Bats BZX Exchange. Inc. (“Cboe”). Xtrackers Municipal Infrastructure Revenue Bond ETF, Xtrackers MSCI All World ex US High Dividend Yield Equity ETF and Xtrackers MSCI EAFE High Dividend Yield Equity ETF offer shares that are listed and traded on the NYSE Arca, Inc. (“NYSE Arca”). Unlike conventional mutual funds, each Fund issues and redeems shares on a continuous basis, at net asset value, (“NAV”) only in large specified lots consisting of 50,000 shares, each called a “Creation Unit”, to authorized participants who have entered into agreements with the Funds’ distributor. Shares are not individually redeemable securities of the Funds, and owners of the shares may acquire those shares from the Funds, or tender such shares for redemption to the Funds, in Creation Units only.
The investment objective of each Fund is to seek investment results that correspond generally to the performance, before fees and expenses, of a particular index (the “Underlying Index”). The underlying indices for the Funds are:
| Fund |
Underlying Index | |
| Xtrackers Bloomberg US Investment Grade Corporate ESG ETF | Bloomberg MSCI US Corporate Sustainability SRI Sector/Credit/Maturity Neutral Index | |
| Xtrackers J.P. Morgan ESG Emerging Markets Sovereign ETF | J.P. Morgan ESG EMBI Global Diversified Sovereign Index | |
| Xtrackers J.P. Morgan ESG USD High Yield Corporate Bond ETF | J.P. Morgan ESG DM Corporate High Yield USD Index | |
| Xtrackers Municipal Infrastructure Revenue Bond ETF | Solactive Municipal Infrastructure Revenue Bond Index | |
| Xtrackers MSCI All World ex US High Dividend Yield Equity ETF | MSCI ACWI ex USA High Dividend Yield Index | |
| Xtrackers MSCI EAFE High Dividend Yield Equity ETF | MSCI EAFE High Dividend Yield Index |
The Bloomberg MSCI US Corporate Sustainability SRI Sector/Credit/Maturity Neutral Index is designed to apply environmental, social and governance (“ESG”) considerations to a broader parent index. The Underlying Index generally aims to keep the broad characteristics of its parent index, the Bloomberg US Corporate Index (an investment grade corporate bond universe), resulting in a broad investment grade fixed income market exposure with ESG aspects. Under normal circumstances, the Bloomberg MSCI US Corporate Sustainability SRI Sector/Credit/Maturity Neutral Index is reconstituted and rebalanced on a monthly basis.
The J.P. Morgan ESG EMBI Global Diversified Sovereign Index is designed to apply environmental, social and governance (“ESG”) considerations to a broader parent index. The Underlying Index generally aims to keep the broad characteristics of its parent index, the J.P. Morgan EMBI Global Diversified Sovereign Index, resulting in a broad emerging markets sovereign debt market exposure with ESG aspects.
80
DBX ETF Trust
Notes to Financial Statements (Continued)
The J.P. Morgan ESG DM Corporate High Yield USD Index is designed to apply environmental, social and governance considerations to a broader parent index. The Underlying Index generally aims to keep the broad characteristics of its parent index, the J.P. Morgan DM High Yield USD Index (a USD denominated high yield corporate bond index of developed market issuers), resulting in a broad high yield fixed income market exposure with ESG aspects. Under normal circumstances, the J.P. Morgan Indices are reconstituted and rebalanced on a monthly basis.
The Solactive Municipal Infrastructure Revenue Bond Index is designed to track the performance of the segment of the U.S. long term tax-exempt bond market, consisting of infrastructure revenue bonds. It is comprised of tax-exempt municipal securities issued by states, cities, counties, districts, their respective agencies and other tax-exempt issuers. The Underlying Index is intended to track bonds that have been issued with the intention of funding federal, state and local infrastructure projects such as water and sewer systems, public power systems, toll roads, bridges, tunnels and many other public use projects. It is designed to only hold bonds issued by state and local municipalities where the interest and principal repayments are generated from dedicated revenue streams or a double-barreled revenue stream (pledged revenue stream and a general obligation pledge). Under normal circumstances, the Solactive Municipal Infrastructure Revenue Bond Index is rebalanced monthly on the last business day of each month.
The MSCI ACWI ex USA High Dividend Yield Index is designed to track the performance of equity securities (excluding real estate investment trusts (“REITs”)) in developed and emerging stock markets (excluding the United States) in its parent index, the MSCI ACWI ex US Index, with higher dividend income and quality characteristics than average dividend yields of equities in the parent index, where such higher dividend income and quality characteristics are both sustainable and persistent. The MSCI EAFE High Dividend Yield Index is designed to reflect the performance of equities (excluding REITs) in developed markets in its parent index, the MSCI EAFE Index, with higher dividend income and quality characteristics than average dividend yields of equities in the parent index, where such higher dividend income and quality characteristics are both sustainable and persistent. Under normal circumstances, the MSCI High Dividend Yield Indices are rebalanced semi-annually in May and November.
Each Fund is entitled to use its respective Underlying Index pursuant to a licensing agreement between the Index Provider and DBX. There is no charge to the Funds in connection with these licensing agreements.
Each Fund is a diversified series of the Trust. In addition, Xtrackers MSCI All World ex US High Dividend Yield Equity ETF and Xtrackers MSCI EAFE High Dividend Yield Equity ETF may change their diversification status over time and then change it back again, without shareholder approval, solely as a result of a change in relative market capitalization or index weighting of one or more constituents of the index each Fund tracks.
Pursuant to the Trust’s organizational documents, the Trust’s officers and trustees are indemnified against certain liabilities that may arise out of the performance of their duties to the Funds. Additionally, in the normal course of business the Trust enters into contracts that contain a variety of representations that provide indemnification for certain liabilities. The Trust’s maximum exposure under these arrangements is unknown, as this would involve future claims that may be made against the Funds that have not yet occurred. However, the Trust expects the risk of loss to be remote.
81
DBX ETF Trust
Notes to Financial Statements (Continued)
2. Significant Accounting Policies
The financial statements have been prepared in conformity with U.S. generally accepted accounting principles (“U.S. GAAP”), which require management to make certain estimates and assumptions that affect the reported amounts and disclosures in the financial statements. Actual results could differ from those estimates. Each Fund qualifies as an investment company under Topic 946 of the Accounting Standards Codification of U.S. GAAP. The following is a summary of significant accounting policies followed by the Funds.
Security Valuation The NAV of each Fund’s shares is calculated each business day as of the close of regular trading on the New York Stock Exchange, generally 4:00 p.m. Eastern Time. NAV per share is calculated by dividing a Fund’s net assets by the number of Fund shares outstanding.
The Funds’ Board has designated the Advisor as the valuation designee for the Funds pursuant to Rule 2a-5 under the 1940 Act. The Advisor’s Pricing Committee (the “Pricing Committee”) typically values securities using readily available market quotations or prices supplied by independent pricing services (which are considered fair values under Rule 2a-5). The Advisor has adopted fair valuation procedures that provide methodologies for fair valuing securities.
Various inputs are used in determining the value of the Funds’ investments. These inputs are summarized in three broad levels. Level 1 includes quoted prices in active markets for identical securities. Level 2 includes other significant observable inputs (including quoted prices for similar securities, interest rates, prepayment speeds, and credit risk). Level 3 includes significant unobservable inputs (including the Funds’ own assumptions in determining the fair value of investments). The level assigned to the securities valuations may not be an indication of the risk or liquidity associated with investing in those securities.
Municipal debt securities are valued at prices supplied by independent pricing services approved by the Pricing Committee. Such services may use various pricing techniques which take into account appropriate factors such as yield, quality, coupon rate, maturity, type of issue, trading characteristics and other data, as well as broker quotes. If the pricing services are unable to provide valuations, securities are valued at the mean between the bid and ask quotations or evaluated prices, as applicable, obtained from broker-dealers. These securities are generally categorized as Level 2.
Corporate and sovereign debt securities are valued at prices supplied by independent pricing services approved by the Pricing Committee. Such services may use various pricing techniques which take into account appropriate factors such as yield, quality, coupon rate, maturity, type of issue, trading characteristics and other data, as well as broker quotes. If the pricing services are unable to provide valuations, securities are valued at the mean between the bid and ask quotations or evaluated prices, as applicable, obtained from broker-dealers. These securities are generally categorized as Level 2.
Equity securities and ETFs are valued at the most recent sale price or official closing price reported on the exchange (U.S. or foreign) or over-the-counter market on which they trade. Securities or ETFs for which no sales are reported are valued at the calculated mean between the most recent bid and asked quotations on the relevant market or, if a mean cannot be determined, at the most recent bid quotation. Equity securities and ETFs are generally categorized as Level 1.
Investments in open-end investment companies are valued at their NAV each business day and are categorized as Level 1.
Futures contracts are generally valued at the settlement prices established each day on the exchange on which they are traded and are categorized as Level 1.
Securities and other assets for which market quotations are not readily available or for which the above valuation procedures are deemed not to reflect fair value are valued in a manner that is intended to reflect their fair value as determined in accordance with procedures approved by the Pricing Committee and are generally categorized as Level 3. In accordance with the Funds’ valuation procedures, factors considered in determining value may include, but are not limited to, the type of the security; the size of the holding; the initial cost of the security; the existence of any contractual restrictions on the security’s disposition; the price and extent of public trading in similar securities of the issuer or of comparable companies; quotations or evaluated prices from broker-dealers and/or
82
DBX ETF Trust
Notes to Financial Statements (Continued)
pricing services; information obtained from the issuer, analysts, and/or the appropriate stock exchange (for exchange traded securities); an analysis of the company’s or issuer’s financial statements; an evaluation of the forces that influence the issuer and the market(s) in which the security is purchased and sold; and with respect to debt securities, the maturity, coupon, creditworthiness, currency denomination and the movement of the market in which the security is normally traded. The value determined under these procedures may differ from published values for the same securities.
Fair value pricing could result in a difference between the prices used to calculate a Fund’s NAV and the prices used by the Fund’s Underlying Index, which in turn could result in a difference between the Fund’s performance and the performance of the Fund’s Underlying Index.
Disclosure about the classification of the fair value measurements is included in a table following the Fund’s Schedule of Investments.
Cash Cash consists of cash held at banks and is on deposit with major financial institutions.
Investment Transactions and Investment Income Investment transactions are recorded as of the date that the securities are purchased or sold (trade date). Realized gains and losses from the sale or disposition of securities are calculated on the identified cost-method. Dividend income is net of any foreign taxes withheld at source. Certain dividends from foreign securities may be recorded subsequent to the ex-dividend date as soon as the Fund is informed of such dividends. Interest income is recorded on the accrual basis. All premiums and discounts are amortized/accreted for both tax and financial reporting purposes.
Tax Information and Dividends and Distributions to Shareholders It is each Fund’s policy to comply with all requirements of the Internal Revenue Code of 1986, as amended (“the Code”). Each Fund intends to qualify for and to elect treatment as a separate Regulated Investment Company (“RIC”) under Subchapter M of the Code. It is the policy of Xtrackers Bloomberg US Investment Grade Corporate ESG ETF, Xtrackers J.P. Morgan ESG Emerging Markets Sovereign ETF, Xtrackers J.P. Morgan ESG USD High Yield Corporate Bond ETF and Xtrackers Municipal Infrastructure Revenue Bond ETF to pay out dividends from its net investment income monthly and Xtrackers MSCI All World ex US High Dividend Yield Equity ETF and Xtrackers MSCI EAFE High Dividend Yield Equity ETF to pay out dividends from net investment income quarterly. Taxable net realized gains from investment transactions, reduced by capital loss carryforwards, if any, are declared and distributed to shareholders at least annually. The capital loss carryforward amount, if any, is available to offset future net capital gains. The Funds may occasionally be required to make supplemental distributions at some other time during the year. The Funds reserve the right to declare special distributions if, in their reasonable discretion, such action is necessary or advisable to preserve the status of each Fund as a RIC or to avoid imposition of income or excise taxes on undistributed income. Dividends and distributions to shareholders, if any, are recorded on the ex-dividend date. The amount of dividends and distributions from net investment income and net realized capital gains are determined in accordance with Federal income tax regulations which may differ from U.S. GAAP. These “book/tax” differences are either considered temporary or permanent in nature. To the extent these differences are permanent in nature, such amounts are reclassified at the end of the year within the components of net assets based on their federal tax treatment; temporary differences do not require reclassification. Dividends and distributions, which exceed earnings and profits for the full year for tax purposes, are reported as a tax return of capital.
In accordance with U.S. GAAP requirements regarding accounting for uncertainties in income taxes, management has analyzed the Funds’ tax positions taken or expected to be taken on foreign, federal and state income tax returns for all open tax years and has concluded that no provision for income tax is required in the Funds’ financial statements.
The Funds recognize interest and penalties, if any, related to uncertain tax positions as income tax expense on the Statements of Operations. For the year ended May 31, 2023, the Funds did not incur any interest or penalties.
83
DBX ETF Trust
Notes to Financial Statements (Continued)
As of May 31, 2023, the components of accumulated earnings (losses) on a tax basis were as follows:
| Undistributed Ordinary Income* |
Capital and Other Gains (Losses) |
Unrealized Appreciation (Depreciation) |
Total Accumulated Earnings (Losses) |
|||||||||||||
| Xtrackers Bloomberg US Investment Grade Corporate ESG ETF |
$ | 9,084 | $ | (1,429,095 | ) | $ | (423,981 | ) | $ | (1,843,992 | ) | |||||
| Xtrackers J.P. Morgan ESG Emerging Markets Sovereign ETF |
90,359 | (2,633,001 | ) | (3,421,025 | ) | (5,963,667 | ) | |||||||||
| Xtrackers J.P. Morgan ESG USD High Yield Corporate Bond ETF |
91,688 | (2,313,577 | ) | (1,337,055 | ) | (3,558,944 | ) | |||||||||
| Xtrackers Municipal Infrastructure Revenue Bond ETF |
267,980 | (4,280,361 | ) | (12,141,925 | ) | (16,154,306 | ) | |||||||||
| Xtrackers MSCI All World ex US High Dividend Yield Equity ETF |
277,983 | (4,611,481 | ) | (1,249,376 | ) | (5,582,874 | ) | |||||||||
| Xtrackers MSCI EAFE High Dividend Yield Equity ETF |
35,388,890 | (100,858,277 | ) | (33,536,063 | ) | (99,005,450 | ) | |||||||||
The tax character of dividends and distributions declared for the years ended May 31, 2023 and May 31, 2022 were as follows:
| Year Ended May 31, 2023 | ||||||||
| Ordinary Income* |
Tax-Exempt | |||||||
| Xtrackers Bloomberg US Investment Grade Corporate ESG ETF |
$ | 203,344 | $ | — | ||||
| Xtrackers J.P. Morgan ESG Emerging Markets Sovereign ETF |
867,961 | — | ||||||
| Xtrackers J.P. Morgan ESG USD High Yield Corporate Bond ETF |
1,154,340 | — | ||||||
| Xtrackers Municipal Infrastructure Revenue Bond ETF |
903 | 3,630,707 | ||||||
| Xtrackers MSCI All World ex US High Dividend Yield Equity ETF |
648,129 | — | ||||||
| Xtrackers MSCI EAFE High Dividend Yield Equity ETF |
44,880,584 | — | ||||||
| Year Ended May 31, 2022 | ||||||||
| Ordinary Income* |
Tax-Exempt | |||||||
| Xtrackers Bloomberg US Investment Grade Corporate ESG ETF |
$ | 180,073 | $ | — | ||||
| Xtrackers J.P. Morgan ESG Emerging Markets Sovereign ETF |
1,220,031 | — | ||||||
| Xtrackers J.P. Morgan ESG USD High Yield Corporate Bond ETF |
1,190,482 | — | ||||||
| Xtrackers Municipal Infrastructure Revenue Bond ETF |
574 | 3,437,781 | ||||||
| Xtrackers MSCI All World ex US High Dividend Yield Equity ETF |
1,163,325 | — | ||||||
| Xtrackers MSCI EAFE High Dividend Yield Equity ETF |
37,386,297 | — | ||||||
| * | For tax purposes short-term capital gain distributions are considered ordinary income distributions. |
At May 31, 2023, for Federal income tax purposes, the Funds have capital loss carryforwards available as shown in the table below, to the extent provided by regulations, to offset future capital gains for an unlimited period. To the extent that these loss carryforwards are used to offset future capital gains, it is probable that the capital gains so offset will not be distributed to shareholders.
| Short-Term | Long-Term | Total Amount | ||||||||||
| Xtrackers Bloomberg US Investment Grade Corporate ESG ETF |
$ | 498,533 | $ | 930,562 | $ | 1,429,095 | ||||||
| Xtrackers J.P. Morgan ESG Emerging Markets Sovereign ETF |
374,510 | 2,213,999 | 2,588,509 | |||||||||
| Xtrackers J.P. Morgan ESG USD High Yield Corporate Bond ETF |
451,614 | 1,861,500 | 2,313,114 | |||||||||
| Xtrackers Municipal Infrastructure Revenue Bond ETF |
2,273,188 | 2,007,173 | 4,280,361 | |||||||||
| Xtrackers MSCI All World ex US High Dividend Yield Equity ETF |
999,902 | 3,611,579 | 4,611,481 | |||||||||
| Xtrackers MSCI EAFE High Dividend Yield Equity ETF |
28,086,660 | 72,771,617 | 100,858,277 | |||||||||
84
DBX ETF Trust
Notes to Financial Statements (Continued)
For the fiscal year ended May 31, 2023, the effect of permanent “book/tax” reclassifications to the components of net assets are included below. These differences are primarily due to redemptions-in-kind.
| Distributable earnings (loss) |
Paid-In Capital |
|||||||
| Xtrackers Bloomberg US Investment Grade Corporate ESG ETF |
$ | 370,618 | $ | (370,618 | ) | |||
| Xtrackers J.P. Morgan ESG Emerging Markets Sovereign ETF |
304,305 | (304,305 | ) | |||||
| Xtrackers J.P. Morgan ESG USD High Yield Corporate Bond ETF |
395,254 | (395,254 | ) | |||||
| Xtrackers Municipal Infrastructure Revenue Bond ETF |
4,128,537 | (4,128,537 | ) | |||||
| Xtrackers MSCI All World ex US High Dividend Yield Equity ETF |
55,699 | (55,699 | ) | |||||
| Xtrackers MSCI EAFE High Dividend Yield Equity ETF |
(27,318,378 | ) | 27,318,378 | |||||
As of May 31, 2023, the aggregate cost of investments for federal income tax purposes, the net unrealized appreciation or depreciation and the aggregated gross unrealized appreciation (depreciation) on investments were as follows:
| Aggregate Tax Cost |
Net Unrealized Appreciation (Depreciation) |
Aggregate Gross Unrealized Appreciation |
Aggregate Gross Unrealized (Depreciation) |
|||||||||||||
| Xtrackers Bloomberg US Investment Grade Corporate ESG ETF |
$ | 3,139,609 | $ | (423,981 | ) | $ | 3,212 | $ | (427,193 | ) | ||||||
| Xtrackers J.P. Morgan ESG Emerging Markets Sovereign ETF |
20,392,739 | (3,421,025 | ) | 128,733 | (3,549,758 | ) | ||||||||||
| Xtrackers J.P. Morgan ESG USD High Yield Corporate Bond ETF |
14,551,819 | (1,337,055 | ) | 128,756 | (1,465,811 | ) | ||||||||||
| Xtrackers Municipal Infrastructure Revenue Bond ETF |
122,800,563 | (12,141,925 | ) | 170,397 | (12,312,322 | ) | ||||||||||
| Xtrackers MSCI All World ex US High Dividend Yield Equity ETF |
11,860,968 | (1,217,814 | ) | 485,482 | (1,703,296 | ) | ||||||||||
| Xtrackers MSCI EAFE High Dividend Yield Equity ETF |
1,349,139,956 | (33,089,730 | ) | 42,558,070 | (75,647,800 | ) | ||||||||||
Foreign Taxes The Funds may be subject to foreign taxes (a portion of which may be reclaimable) on income, capital gains on investments, certain foreign currency transactions or other corporate events. All foreign taxes are recorded in accordance with the applicable foreign tax regulations and rates that exist in the foreign jurisdictions in which the Funds invest. These foreign taxes, if any, are paid by the Funds and are reflected in their Statements of Operations as follows: foreign taxes withheld at source are presented as a reduction of income, foreign taxes on capital gains from sales of investments and foreign currency transactions are included in their respective net realized gain (loss) categories, and deferred foreign taxes on unrealized gains are included in net change in unrealized appreciation (depreciation). Receivables and payables related to foreign taxes as of May 31, 2023, if any, are disclosed in the Funds’ Statements of Assets and Liabilities.
Foreign Currency Translations The books and records of the Funds are maintained in U.S. dollars. Investment securities and other assets and liabilities denominated in a foreign currency are translated into U.S. dollars at the prevailing exchange rates at period end. Purchases and sales of investment securities, income and expenses are translated into U.S. dollars at the prevailing exchange rates on the respective dates of the transactions.
Net realized and unrealized gains and losses on foreign currency transactions represent net gains and losses between trade and settlement dates on securities transactions, the acquisition and disposition of foreign currencies, and the difference between the amount of net investment income accrued and the U.S. dollar amount actually received. The portion of both realized and unrealized gains and losses on investments that results from fluctuations in foreign currency exchange rates is not separately disclosed, but is included with net realized and unrealized gain/appreciation and loss/depreciation on investments.
Securities Lending The Funds, except the Xtrackers Municipal Infrastructure Revenue Bond ETF, may lend securities to certain financial institutions under the terms of their securities lending agreement. During the term of
85
DBX ETF Trust
Notes to Financial Statements (Continued)
the loans, the Funds continue to receive interest and dividends generated by the securities and to participate in any changes in their market value. The Funds require the borrowers of the securities to maintain collateral with the Funds consisting of cash and/or securities issued or guaranteed by the U.S. Government, its agencies or instrumentalities having a value at least equal to the value of the securities loaned. When the collateral falls below specified amounts, the lending agent will use its best effort to obtain additional collateral on the next business day to meet required amounts under the securities lending agreement. During the year ended May 31, 2023, Funds invested the cash collateral into a joint trading account in DWS Government & Agency Securities Portfolio, an affiliated money market fund managed by DWS Investment Management Americas, Inc. DWS Investment Management Americas, Inc. receives a management/administration fee (0.08% annualized effective rate as of May 31, 2023) on the cash collateral invested in DWS Government & Agency Securities Portfolio. The Funds receive compensation for lending their securities either in the form of fees or by earning interest on invested cash collateral, net of borrower rebates and fees paid to a lending agent. Either the Fund or the borrower may terminate the loan at any time and the borrower, after notice, is required to return borrowed securities within a standard time period. There may be risks of delay and costs in recovery of securities or even loss of rights in the collateral should the borrower of the securities fail financially. If the Funds are not able to recover securities lent, the Funds may sell the collateral and purchase a replacement investment in the market, incurring the risk that the value of the replacement security is greater than the value of the collateral. The Funds are also subject to all investment risks associated with the reinvestment of any cash collateral received, including, but not limited to, interest rate, credit and liquidity risk associated with such investments.
As of May 31, 2023, the Funds listed below had securities on loan. The value of the related collateral exceeded the value of the securities loaned at year end.
| Remaining Contractual Maturity of the Agreements, as of May 31, 2023 |
||||||||||||||||||||
| Securities Lending Transactions | Overnight and Continuous |
<30 Days | Between 30 & 90 days |
>90 days | Total | |||||||||||||||
| Xtrackers MSCI All World ex US High Dividend Yield Equity ETF |
| |||||||||||||||||||
| Common Stocks |
$ | 528,033 | $ | — | $ | 538 | $ | 74,503 | $ | 603,074 | ||||||||||
| Exchange-Traded Funds |
67,440 | — | — | — | $ | 67,440 | ||||||||||||||
|
|
|
|
|
|
|
|
|
|
|
|||||||||||
| Total Borrowings |
$ | 595,473 | $ | — | $ | 538 | $ | 74,503 | $ | 670,514 | ||||||||||
|
|
|
|
|
|
|
|
|
|
|
|||||||||||
| Gross amount of recognized liabilities and non-cash collateral for securities lending transactions |
|
$ | 670,514 | |||||||||||||||||
| Xtrackers MSCI EAFE High Dividend Yield Equity ETF |
|
|||||||||||||||||||
| Common Stocks |
$ | 92,172,040 | $ | — | $ | 58,074 | $ | 16,099,169 | $ | 108,329,283 | ||||||||||
|
|
|
|
|
|
|
|
|
|
|
|||||||||||
| Gross amount of recognized liabilities and non-cash collateral for securities lending transactions |
|
$ | 108,329,283 | |||||||||||||||||
Derivatives
Futures Contracts Each Fund may enter into futures contracts. These futures contracts will be used to simulate investment in the respective Underlying Index, to facilitate trading or to reduce transaction costs. Each Fund will enter into futures contracts that are traded on a U.S. or non-U.S. exchange. No Fund will use futures for speculative purposes. Futures contracts provide for the future sale by one party and purchase by another party of a specified amount of a specific instrument or index at a specified future time and at a specified price. For the year ended May 31, 2023, Xtrackers MSCI All World ex US High Dividend Yield Equity ETF and Xtrackers MSCI EAFE High Dividend Yield Equity ETF utilized futures in order to simulate investment in the Underlying Index. To the extent required by law, liquid assets committed to futures contracts will be maintained.
At the time each Fund enters into a futures contract, each Fund deposits and maintains as collateral an initial margin with the broker, as required by the exchange on which the transaction is affected. Pursuant to the contract, each Fund agrees to receive from or pay to the broker an amount of cash equal to the daily fluctuation in the value of the contract. Such receipts or payments are known as variation margin and are recorded by each Fund as unrealized gains or losses. Risks may arise from the potential inability of a counterparty to meet the terms of the contract. The credit/counterparty risk for exchange-traded futures contracts is generally less than
86
DBX ETF Trust
Notes to Financial Statements (Continued)
privately negotiated futures contracts, since the clearinghouse, which is the issuer or counterparty to each exchange-traded future, provides a guarantee of performance. The guarantee is supported by a daily payment system (i.e., margin requirements).
Use of long futures contracts subjects each Fund to risk of loss in excess of the amounts shown on the Statement of Assets and Liabilities, up to the notional value of the futures contracts. Use of short futures contracts subjects each Fund to unlimited risk of loss. Under some circumstances, futures exchanges may establish daily limits on the amount that the price of a futures contract can vary from the previous day’s settlement price, which could effectively prevent liquidation of unfavorable positions.
A summary of the open futures contracts as of May 31, 2023 is included in a table following the Funds’ Schedule of Investments.
The following tables summarize the value of the Funds’ derivative instruments held as of May 31, 2023 and the related location in the accompanying Statement of Assets and Liabilities, presented by primary underlying risk exposure:
| Asset Derivatives |
Liability Derivatives |
|||||||||||||
| Xtrackers MSCI All World ex US High Dividend Yield Equity ETF |
| |||||||||||||
| Equity contracts | Unrealized appreciation on futures contracts* | $ | 5,478 | Unrealized depreciation on futures contracts* | $ | — | ||||||||
| Xtrackers MSCI EAFE High Dividend Yield Equity ETF |
| |||||||||||||
| Equity contracts | Unrealized appreciation on futures contracts* | $ | — | Unrealized depreciation on futures contracts* | $ | 551,732 | ||||||||
| * | Includes cumulative appreciation or cumulative depreciation on futures contracts as disclosed in the Schedule of Investments. Unsettled variation margin is disclosed separately within the Statement of Assets and Liabilities. |
Additionally, the amount of realized and unrealized gains and losses on derivative instruments recognized in the Funds’ earnings during the year ended May 31, 2023 and the related location in the accompanying Statement of Operations is summarized in the following tables by primary underlying risk exposure:
| Net Realized Gain (Loss) from: |
||||
| Futures Contracts — Equity Contracts |
||||
| Xtrackers MSCI All World ex US High Dividend Yield Equity ETF |
$ | 10,915 | ||
| Xtrackers MSCI EAFE High Dividend Yield Equity ETF |
268,738 | |||
| Net Change in Unrealized Appreciation (Depreciation) on: |
||||
| Xtrackers MSCI All World ex US High Dividend Yield Equity ETF |
$ | 686 | ||
| Xtrackers MSCI EAFE High Dividend Yield Equity ETF |
(777,169 | ) | ||
For the year ended May 31, 2023 the average monthly volume of derivatives was as follows:
| Futures Contracts (Contract Value) |
||||
| Xtrackers MSCI All World ex US High Dividend Yield Equity ETF |
$ | 130,830 | ||
| Xtrackers MSCI EAFE High Dividend Yield Equity ETF |
9,807,694 | |||
Affiliated Cash Management Vehicles The Funds may invest uninvested cash balances in DWS Government Money Market Series and DWS ESG Liquidity Fund, affiliated money market funds which are managed by DWS Investment Management Americas, Inc. (“DIMA”), also an indirect, wholly owned subsidiary of DWS Group GmbH & Co. KGaA. Each affiliated money market fund is managed in accordance with Rule 2a-7 under the 1940 Act, which governs the quality, maturity, diversity and liquidity of instruments in which a money market fund may invest. DWS Government Money Market Series seeks to maintain a stable NAV, and DWS ESG Liquidity Fund maintains a floating NAV. The Funds indirectly bear their proportionate share of the expenses of each affiliated money market fund in which they invest. The Advisor will waive an amount of the unitary advisory fee payable to the Advisor by the Funds equal to such acquired fund’s fees and expenses on the Funds’ assets invested in the affiliated money market funds.
87
DBX ETF Trust
Notes to Financial Statements (Continued)
3. Investment Advisory and Other Agreements
The Advisor has overall responsibility for the general management and administration of the Funds, subject to the supervision of the Funds’ Board of Trustees. Under an investment advisory agreement between the Trust, on behalf of the Funds, and the Advisor (the “Investment Advisory Agreement”), the Advisor is responsible for arranging sub-advisory, transfer agency, custody, fund administration, and all other non-distribution related services for the Funds to operate.
For its investment advisory services to the Funds below, the Advisor is entitled to receive a unitary advisory fee based on each Fund’s average daily net assets, computed and accrued daily and payable monthly, at an annual rate equal to:
| Unitary Advisory Fee |
||||
| Xtrackers Bloomberg US Investment Grade Corporate ESG ETF |
0.15 | % | ||
| Xtrackers J.P. Morgan ESG Emerging Markets Sovereign ETF |
0.35 | % | ||
| Xtrackers J.P. Morgan ESG USD High Yield Corporate Bond ETF |
0.20 | % | ||
| Xtrackers Municipal Infrastructure Revenue Bond ETF |
0.15 | % | ||
| Xtrackers MSCI All World ex US High Dividend Yield Equity ETF |
0.20 | % | ||
| Xtrackers MSCI EAFE High Dividend Yield Equity ETF |
0.20 | % | ||
The Advisor for Xtrackers MSCI All World ex US High Dividend Yield Equity ETF has contractually agreed to waive a portion of its unitary advisory fee in an amount equal to the acquired fund’s fees and expenses attributable to the Fund’s investments in affiliated funds. For the year ended May 31, 2023, the Advisor waived $65 of the expenses of the Fund.
The Advisor for the Funds below has contractually agreed to waive a portion of its unitary advisory fee in an amount equal to the acquired fund’s fees and expenses attributable to the Funds’ investments in affiliated cash management vehicles. For the year ended May 31, 2023, the Advisor waived expenses of the Funds as follows:
| Expenses Waived |
||||
| Xtrackers Bloomberg US Investment Grade Corporate ESG ETF |
$ | 40 | ||
| Xtrackers J.P. Morgan ESG Emerging Markets Sovereign ETF |
120 | |||
| Xtrackers J.P. Morgan ESG USD High Yield Corporate Bond ETF |
92 | |||
| Xtrackers MSCI All World ex US High Dividend Yield Equity ETF |
9 | |||
| Xtrackers MSCI EAFE High Dividend Yield Equity ETF |
1,039 | |||
Out of the unitary advisory fee, the Advisor pays substantially all expenses of each Fund, including the cost of transfer agency, custody, fund administration, legal, audit and other services, and expenses of the Independent Trustees. Each Fund is responsible for the payment of interest expense, acquired fund fees and expenses, taxes, brokerage expenses distribution fees or expenses (if any), litigation expenses and extraordinary expenses.
The Bank of New York Mellon, a wholly-owned subsidiary of The Bank of New York Mellon Corporation, serves as Administrator, Custodian, Accounting Agent, Lending Agent and Transfer Agent for each Fund.
ALPS Distributors, Inc. (the “Distributor”) serves as the distributor of Creation Units for each Fund on an agency basis. The Distributor does not maintain a secondary market in shares of the Funds.
The Board of Trustees is currently comprised of three Independent Trustees. The Advisor paid retainer fees and attendance fees to each Independent Trustee; retainer fees to the Chairman of the Board of Trustees and the Chairman of the Audit Committee; and attendance fees to each member of the Audit Committee (which is comprised of all of the Funds’ Independent Trustees).
88
DBX ETF Trust
Notes to Financial Statements (Continued)
4. Investment Portfolio Transactions
For the year ended May 31, 2023, the cost of investments purchased and proceeds from sale of investments (excluding in-kind transactions and short-term investments) were as follows:
| Purchases | Sales | |||||||
| Xtrackers Bloomberg US Investment Grade Corporate ESG ETF |
$ | 1,029,361 | $ | 1,937,270 | ||||
| Xtrackers J.P. Morgan ESG Emerging Markets Sovereign ETF |
3,382,399 | 4,038,055 | ||||||
| Xtrackers J.P. Morgan ESG USD High Yield Corporate Bond ETF |
4,904,778 | 6,981,451 | ||||||
| Xtrackers Municipal Infrastructure Revenue Bond ETF |
15,358,715 | 28,034,974 | ||||||
| Xtrackers MSCI All World ex US High Dividend Yield Equity ETF |
2,922,556 | 3,219,831 | ||||||
| Xtrackers MSCI EAFE High Dividend Yield Equity ETF |
383,130,860 | 309,006,249 | ||||||
For the year ended May 31, 2023, the cost of in-kind purchases and proceeds from in-kind sales were as follows:
| Purchases | Sales | |||||||
| Xtrackers Bloomberg US Investment Grade Corporate ESG ETF |
$ | — | $ | 2,695,660 | ||||
| Xtrackers J.P. Morgan ESG Emerging Markets Sovereign ETF |
1,645,889 | 1,695,968 | ||||||
| Xtrackers J.P. Morgan ESG USD High Yield Corporate Bond ETF |
— | 5,300,462 | ||||||
| Xtrackers Municipal Infrastructure Revenue Bond ETF |
3,892,137 | 31,122,303 | ||||||
| Xtrackers MSCI All World ex US High Dividend Yield Equity ETF |
— | 922,967 | ||||||
| Xtrackers MSCI EAFE High Dividend Yield Equity ETF |
445,162,438 | 218,817,202 | ||||||
5. Fund Share Transactions
As of May 31, 2023, there were unlimited Fund shares, no par value, authorized by the Trust. Fund shares are issued and redeemed by each Fund only in Creation Units or multiples thereof. Except when aggregated in Creation Units, shares of each Fund are not redeemable. Transactions in capital shares for each Fund are disclosed in detail in the Statements of Changes in Net Assets. The consideration for the purchase of Creation Units of a Fund generally consists of the in-kind contribution of a designated portfolio of securities constituting a portfolio sampling representation of the securities included in the respective Fund’s Underlying Index and an amount of cash, which under certain circumstances may include cash in lieu of portfolio securities. Investors purchasing and redeeming Creation Units pay a purchase transaction fee and a redemption transaction fee to offset transfer and other transaction costs associated with the issuance and redemption of Creation Units.
6. Payments by Affiliates
During the year ended May 31, 2023, the Advisor agreed to reimburse Xtrackers J.P Morgan ESG USD High Yield Corporate Bond ETF $188 for a loss due to a FX trade executed incorrectly. The amount compensated was less than 0.01% of the Fund’s average net assets, thus having no impact on the Fund’s total return.
7. Investing in Emerging Markets
Investing in emerging markets may involve special risks and considerations not typically associated with investing in developed markets. These risks include revaluation of currencies, high rates of inflation or deflation, repatriation restrictions on income and capital, and future adverse political, social and economic developments. Moreover, securities issued in these markets may be less liquid, subject to government ownership controls or delayed settlements, and may have prices that are more volatile or less easily assessed than those of comparable securities of issuers in developed markets. There is also substantially less publicly available information about emerging market issuers than there is about issuers in developed countries. Therefore, disclosure of certain
89
DBX ETF Trust
Notes to Financial Statements (Continued)
material information may not be made, and less information may be available to the Funds and other investors than would be the case if the Funds’ investments were restricted to securities of issuers in developed countries. Investments in emerging markets are often considered speculative.
8. Investing in High-Yield Debt Securities
High-yield debt securities or junk bonds are generally regarded as speculative with respect to the issuer’s continuing ability to meet principal and interest payments. A fund’s performance could be hurt if an issuer of a debt security suffers an adverse change in financial condition that results in the issuer not making timely payments of interest or principal, a security downgrade or an inability to meet a financial obligation. High-yield debt securities’ total return and yield may generally be expected to fluctuate more than the total return and yield of investment-grade debt securities. A real or perceived economic downturn or an increase in market interest rates could cause a decline in the value of high-yield debt securities, result in increased redemptions and/or result in increased portfolio turnover, which could result in a decline in NAV of a fund, reduce liquidity for certain investments and/or increase costs. High-yield debt securities are often thinly traded and can be more difficult to sell and value accurately than investment-grade debt securities as there may be no established secondary market. Investments in high-yield debt securities could increase liquidity risk for a fund. In addition, the market for high-yield debt securities can experience sudden and sharp volatility which is generally associated more with investments in stocks.
9. Line of Credit
The Trust has entered into a senior unsecured credit facility with a syndication of banks which allows the Xtrackers Bloomberg US Investment Grade Corporate ESG ETF, Xtrackers J.P. Morgan ESG Emerging Markets Sovereign ETF, Xtrackers MSCI All World ex US High Dividend Yield Equity ETF and certain other funds managed by the Advisor to borrow up to $105 million. Each Fund may borrow money under this credit facility to the extent necessary for temporary or emergency purposes, including the funding of shareholder redemption requests, trade settlements, and as necessary to distribute to shareholders any income necessary to maintain each Funds’ status as a regulated investment company. Borrowings are charged an interest rate of 1.25% per annum plus the greater of the Federal Funds Effective Rate or the Secured Overnight Financing Rate plus .10%. Each Fund may borrow up to the lesser of 33 percent of its net assets as permitted by the Act or 25 percent of adjusted total net assets. The Funds had no outstanding loans at May 31, 2023.
90
DBX ETF Trust
To the Shareholders of Xtrackers Bloomberg US Investment Grade Corporate ESG ETF, Xtrackers J.P. Morgan ESG Emerging Markets Sovereign ETF, Xtrackers J.P. Morgan ESG USD High Yield Corporate Bond ETF, Xtrackers Municipal Infrastructure Revenue Bond ETF, Xtrackers MSCI All World ex US High Dividend Yield Equity ETF and Xtrackers MSCI EAFE High Dividend Yield Equity ETF and the Board of Trustees of DBX ETF Trust
Opinion on the Financial Statements
We have audited the accompanying statements of assets and liabilities of Xtrackers Bloomberg US Investment Grade Corporate ESG ETF, Xtrackers J.P. Morgan ESG Emerging Markets Sovereign ETF, Xtrackers J.P. Morgan ESG USD High Yield Corporate Bond ETF, Xtrackers Municipal Infrastructure Revenue Bond ETF, Xtrackers MSCI All World ex US High Dividend Yield Equity ETF and Xtrackers MSCI EAFE High Dividend Yield Equity ETF (collectively referred to as the “Funds”), (six of the funds constituting DBX ETF Trust (the “Trust”)), including the schedules of investments, as of May 31, 2023, and the related statements of operations for the year ended, the statements of changes in net assets for each of the two years in the period then ended, the financial highlights for each of the five years in the period then ended and the related notes (collectively referred to as the “financial statements”). In our opinion, the financial statements present fairly, in all material respects, the financial position of each of the Funds (six of the funds constituting DBX ETF Trust) at May 31, 2023, the results of their operations for the year then ended, the changes in their net assets for each of the two years in the period then ended and their financial highlights for each of the five years in the period then ended, in conformity with U.S. generally accepted accounting principles.
Basis for Opinion
These financial statements are the responsibility of the Trust’s management. Our responsibility is to express an opinion on each of the Funds’ financial statements based on our audits. We are a public accounting firm registered with the Public Company Accounting Oversight Board (United States) (“PCAOB”) and are required to be independent with respect to the Trust in accordance with the U.S. federal securities laws and the applicable rules and regulations of the Securities and Exchange Commission and the PCAOB.
We conducted our audits in accordance with the standards of the PCAOB. Those standards require that we plan and perform the audit to obtain reasonable assurance about whether the financial statements are free of material misstatement, whether due to error or fraud. The Trust is not required to have, nor were we engaged to perform, an audit of the Trust’s internal control over financial reporting. As part of our audits we are required to obtain an understanding of the internal control over financial reporting but not for the purpose of expressing an opinion on the effectiveness of the Trust’s internal control over financial reporting. Accordingly, we express no such opinion.
Our audits included performing procedures to assess the risks of material misstatement of the financial statements, whether due to error or fraud, and performing procedures that respond to those risks. Such procedures included examining, on a test basis, evidence regarding the amounts and disclosures in the financial statements. Our procedures included confirmation of securities owned as of May 31, 2023, by correspondence with the custodians, brokers and others; when replies were not received from brokers, we performed other auditing procedures. Our audits also included evaluating the accounting principles used and significant estimates made by management, as well as evaluating the overall presentation of the financial statements. We believe that our audits provide a reasonable basis for our opinion.

We have served as the auditor of one or more investment companies in the DWS family of funds since at least 1979, but we are unable to determine the specific year.
New York, New York
July 25, 2023
91
DBX ETF Trust
Regulatory Update — Tailored Shareholder Report
Effective January 24, 2023, the SEC amended the rules for mutual fund and exchange-traded fund (“ETF”) annual and semi-annual shareholder reports. The amended rules apply to mutual funds and ETFs that are registered on Form N-1A (i.e., open-end funds) and implement a new streamlined disclosure framework requiring “concise and visually engaging” shareholder reports highlighting key information, including a simplified expense presentation, performance information, portfolio holdings and certain fund statistics. The amended rules seek to simplify shareholder reporting by consolidating investor friendly data in one report and moving other data to Form N-CSR, creating a layered disclosure framework. Certain information from the Funds’ current shareholder reports, including the Funds’ investment portfolio, financial statements and financial highlights, will move to Form N-CSR. This information must be available online, delivered free of charge upon request and filed on a semiannual basis on Form N-CSR. Notably, the amended rules will require mutual funds and ETFs to prepare separate individual shareholder reports for each fund share class. The amendments also include a revised definition of “appropriate broad-based securities market index” that will affect performance presentations in the new streamlined reports and mutual fund and ETF prospectuses. The amended rules and related form amendments have a compliance date of July 24, 2024. At this time, management is evaluating the impact of the amended rules and form amendments on the content of the Funds’ current shareholder reports.
92
DBX ETF Trust
In accordance with Rule 22e-4 (the “Liquidity Rule”) under the Investment Company Act of 1940 (the “1940 Act”), your Fund has adopted a liquidity risk management program (the “Program”), and the Board has designated DBX Advisors LLC (the “Advisor”) as Program administrator. The Program is designed to assess and manage your Fund’s liquidity risk (the risk that the Fund would be unable to meet requests to redeem shares of the Fund without significant dilution of remaining investors’ interests in the Fund). The Advisor has designated a committee (the “Committee”) composed of personnel from multiple departments within an affiliate of the Advisor that is responsible for the implementation and ongoing administration of the Program, which includes assessing the Fund’s liquidity risk under both normal and reasonably foreseeable stressed conditions. Under the Program, every investment held by a Fund is classified on a daily basis into one of four liquidity categories based on estimations of the investment’s ability to be sold during designated timeframes in current market conditions without significantly changing the investment’s market value.
In February 2023, as required by the Program and the Liquidity Rule, the Advisor provided the Board with an annual written report (the “Report”) addressing the operation of the Program and assessing the adequacy and effectiveness of its implementation during the period from December 1, 2021 through November 30, 2022 (the “Reporting Period”). During the Reporting Period, your Fund was primarily invested in highly liquid investments (investments that the Fund anticipates can be converted to cash within three business days or less in current market conditions without significantly changing their market value). As a result, your Fund is not required to adopt, and has not adopted, a “Highly Liquid Investment Minimum” as defined in the Liquidity Rule. During the Reporting Period, your Fund did not approach the 15% limit imposed by the Liquidity Rule on holdings in illiquid investments (investments that cannot be sold or disposed of in seven days or less in current market conditions without the sale of the investment significantly changing the market value of the investment). Your Fund did not experience any issues meeting investor redemptions at any time during the Reporting Period. In the Report, the Advisor stated that it believes the Program has operated adequately and effectively to manage the Fund’s liquidity risk during the Reporting Period. The Advisor also reported that there were no material changes made to the Program during the Reporting Period.
93
DBX ETF Trust
Xtrackers Bloomberg US Investment Grade Corporate ESG ETF, Xtrackers J.P. Morgan ESG Emerging Markets Sovereign ETF, Xtrackers J.P Morgan ESG USD High Yield Corporate Bond ETF, Xtrackers MSCI All World ex US High Dividend Yield Equity ETF, Xtrackers MSCI EAFE High Dividend Yield Equity ETF, and Xtrackers Municipal Infrastructure Revenue Bond ETF
Board Approval of Investment Advisory Agreement with DBX Advisors LLC
After discussions at the meeting of the Board of Trustees (“Board” or “Trustees”) held on February 15-16, 2023 (the “Meeting”), the Trustees, all of whom are the Independent Trustees (those not affiliated with DBX ETF Trust (the “Trust”) or its service providers), unanimously approved the continuance of the Investment Advisory Agreement with respect to Xtrackers Bloomberg US Investment Grade Corporate ESG ETF, Xtrackers J.P. Morgan ESG Emerging Markets Sovereign ETF, Xtrackers J.P. Morgan ESG USD High Yield Corporate Bond ETF, Xtrackers MSCI All World ex US High Dividend Yield Equity ETF, Xtrackers MSCI EAFE High Dividend Yield Equity ETF, and Xtrackers Municipal Infrastructure Revenue Bond ETF (each a “Fund,” and collectively, the “Funds”). The Independent Trustees were advised throughout the review and Meeting by K&L Gates LLP (“Independent Trustee Counsel”).
Before reaching their decision to approve the Investment Advisory Agreement for another annual period, the Independent Trustees evaluated the materials furnished to them in advance of the Meeting from DBX Advisors LLC (“DBX” or the “Advisor”) for purposes of reviewing the agreement’s terms, including statistical information prepared by Broadridge Financial Solutions Inc. (“Broadridge”) regarding (a) fee and expense information for each Fund (including the fee and expense components and any amounts waived or reimbursed) as compared to a peer group of other exchange-traded funds (“ETFs”) selected pursuant to Broadridge’s proprietary methodology (each, a “Peer Group”) and (b) each Fund’s tracking error as compared to its underlying index over the previous five years (or since inception, if shorter). The Independent Trustees met with representatives of the Advisor on February 13, 2023 to review financial reports and other information provided by the Advisor and inquire further with regard to the financial information provided, and asked questions of the Advisor during this meeting. The Independent Trustees also took into consideration the discussions they had with management before and during the Meeting and among themselves during their Executive Sessions held on February 15 and February 16, 2023.
The Independent Trustees also noted that they had received and should take into consideration a substantial amount of information furnished throughout the year at regular Board meetings, which information included, among other things, an analysis of each Fund’s investment performance, tracking error and related financial information, presentations given by DBX, as well as its periodic reports on brokerage commissions, portfolio execution and other services provided to the Funds.
In reaching its decision to continue in effect the Investment Advisory Agreement for another annual period, the Board considered all factors it believed relevant, including (1) the nature, extent and quality of the services provided to the Funds and their shareholders; (2) the financial resources of DBX and its resulting ability to perform its obligations under the Investment Advisory Agreement; (3) the competitiveness of the advisory fee; (4) the total cost of the services provided by and the profits realized by the Advisor from its relationship with the Funds; (5) the extent to which economies of scale have been realized, and if the Funds’ shareholders have benefitted from those economies; and (6) fall out benefits, if any, enjoyed by the Advisor.
The Board reached a determination, with the assistance of Independent Trustee Counsel and Vedder Price P.C. (“Trust Counsel”) and through the exercise of its business judgment, that approval of the Investment Advisory Agreement and the compensation to be received thereunder is in the best interests of each Fund and its shareholders as well as consistent with the Board’s duties under state and federal law. The Board reached this conclusion based on multiple factors.
The Board considered the following in determining whether to approve the Investment Advisory Agreement:
Nature, Extent and Quality of Services. The Board reviewed in detail the nature, extent and quality of services provided and the risks incurred by the Advisor under the Investment Advisory Agreement. In doing so, the Board considered the information it had received from and the discussions it had with the Advisor continuously during the prior year, in addition to the information the Advisor had provided in response to the Board’s requests prior to
94
DBX ETF Trust
Board Considerations in Approval of Investment Advisory
Contracts (Unaudited) (Continued)
the Meeting. The Board considered that these services include, among other things, furnishing a continuous investment program for the Funds, including arranging for, or implementing, the purchase and sale of portfolio securities, the provision of general corporate services such as portfolio management compliance services and the preparation and filing of certain reports on behalf of the Trust. The Board also considered, among other things, the professional experience, qualifications and performance of the senior management and key professional personnel of the Advisor, including portfolio management.
The Board considered that the Advisor provides, at its own expense, office facilities and equipment for use by the Funds and supervisory persons responsible for supervising and monitoring the Trust’s service providers. The Board also considered that the Advisor pays or arranges for the compensation of officers of the Trust who are also officers or employees of the Advisor or one of its DWS Group affiliates, except as may otherwise be determined by the Board. In addition, the Board considered that the Advisor arranges for the provision of transfer agency, custody, fund administration and accounting, and other non-distribution services necessary for the Funds’ operations. The Board also considered that in addition to managing the Funds’ portfolios directly, the Advisor provides oversight of day-to-day operations, including monitoring tracking error, providing services in connection with the creation and redemption of creation units and assistance in meeting legal, compliance and regulatory requirements applicable to the Funds.
The Board considered the information regarding each Fund’s tracking error compared to its underlying index that had been provided by the Advisor and by Broadridge. The Board took note of the detailed information provided by the Advisor throughout the year with respect to each Fund’s tracking error and the sources thereof. The Trustees noted that tracking error for each Fund during the year was in an expected range.
Based on its review, the Board concluded that the nature, extent, and quality of services provided by the Advisor under the Investment Advisory Agreement are reasonable and appropriate in relation to the fees paid to the Advisor, taking special consideration of the fact that the advisory fee is a unitary fee and, as a result, a portion of the unitary advisory fee will be used to compensate the Funds’ service providers. The Board considered the staffing of the Advisor, including the training, qualifications and experience of investment personnel in managing the Funds. The Board also considered the expertise of the Advisor in supervising third party service providers to the Funds, such as the administrator and the custodian, noting the Advisor’s extensive work with these service providers (including onsite due diligence sessions) to conduct such supervision. The Board further considered the compliance program of the Advisor, which supports the Funds’ compliance program.
Advisor’s Financial Resources. In connection with the assessment of the ability of the Advisor to perform its duties under the Investment Advisory Agreement, the Board considered the Advisor’s financial condition and whether it has the resources necessary to carry out its functions. The Board concluded that the Advisor has the financial resources necessary to perform its obligations under the Investment Advisory Agreement.
Reasonableness of Advisory Fee. The Board compared each Fund’s advisory fee and total expenses to those of the other ETFs in its Peer Group. The Board noted that due to the special characteristics of certain Funds, there were limitations faced by Broadridge in providing comparable funds in the Peer Groups and the information in the Broadridge reports accordingly may or may not provide meaningful direct comparisons to the Funds. The Board also noted that the advisory fees and total expenses (after waivers/reimbursements) for many of the Funds were below or equal to the average and/or median of the ETFs in each Fund’s respective Peer Group compiled by Broadridge, but the following Fund had advisory fees and/or total expenses (after waivers/reimbursements) that were above the average and/or median of its respective Peer Group:
| — | Xtrackers J.P. Morgan ESG Emerging Markets Sovereign ETF |
The Board considered, however, the following additional factors in connection with this Fund:
| — | The peer group for Xtrackers J.P. Morgan ESG Emerging Markets Sovereign ETF did not include any other sovereign debt ETFs. |
95
DBX ETF Trust
Board Considerations in Approval of Investment Advisory
Contracts (Unaudited) (Continued)
The Board accordingly noted that each Fund’s fee is competitive with the fees of applicable peer ETFs.
The Board considered that the fee for each of the Funds is a unitary fee pursuant to which the Advisor pays all of the Funds’ costs (subject to certain specified exceptions). The Board considered that each Fund’s fee had been priced to scale when it was established. The Board also considered that each Fund’s portfolio is managed on a day-to-day basis by the Advisor and that the Advisor also provides oversight of day-to-day operations, including monitoring tracking error, providing services in connection with creation and redemption units and assistance in meeting legal and regulatory requirements applicable to the Funds. Based on its review, the Board concluded that the advisory fee for each Fund is reasonable in light of the services provided.
Costs of Services and Profitability. The Board considered the expenses of the Advisor in developing and rendering services provided to the Funds and the information provided by the Advisor to the Board regarding the Funds’ profitability. The Board considered that the Advisor had provided extensive information about the Advisor’s profitability and the Advisor’s methodology in determining profitability. While the Advisor had provided information about the Advisor’s expenses relating to marketing the Funds, the Board considered the Advisor’s profitability without accounting for such expenses. The Board determined that, although only some of the Funds were profitable as of this time, the Advisor’s profitability with respect to each profitable Fund was not excessive. The Board considered whether the Advisor would benefit in other ways from its relationships with the Funds and concluded that there were no material fall-out benefits likely to accrue to the Advisor related to the operation of the Funds.
Economies of Scale. The Board considered that certain Funds had attracted a substantial amount of assets, but determined that those Funds were not experiencing economies of scale beyond what was reflected in each Fund’s unitary fee, which the Board noted was very competitive. The Board considered that the other Funds were not experiencing economies of scale at this time and determined to revisit this matter after the Funds had attracted more assets. The Board also acknowledged that the concept of economies of scale is a complex subject as to determining with a fair degree of certainty whether economies of scale exist, to what extent they exist, whether scale can result in additional expenses, and alternative ways advisers can share benefits of economies of scale.
Given all the information available to it and considering all material factors, the Board concluded that the Investment Advisory Agreement was fair and reasonable and it was unanimously approved.
96
DBX ETF Trust
Identification and Background
The Board has responsibility for the overall management and operations of the funds, including general supervision of the duties performed by the Advisor and other service providers. Each Board Member serves until his or her successor is duly elected or appointed and qualified. Each officer serves until he or she resigns, is removed, dies, retires or becomes disqualified.
The Trust currently has three Board Members. The three Independent Board Members have no affiliation or business connection with the Advisor or any of its affiliated persons and do not own any stock or other securities issued by the Advisor.
The Independent Board Members of the Trust, their term of office and length of time served, their principal business occupations during the past five years, the number of portfolios in the fund complex (defined below) overseen by each Independent Board Member, and other directorships, if any, held by the Board Members are shown below. The fund complex includes all registered open- and closed-end funds (including all of their portfolios) advised by the Advisor and any registered funds that have an investment advisor that is an affiliated person of the Advisor. As of the date of this shareholder report, the fund complex consists of the funds in the Trust, as well as the registered funds advised by affiliates of the Advisor.
Shareholder Communications to the Board. Shareholders may send communications to the Trust’s Board by addressing the communications directly to the Board (or individual Board Members) and/or otherwise clearly indicating in the salutation that the communication is for the Board (or individual Board Members). The shareholder may send the communication to either the Trust’s office or directly to such Board members c/o 875 Third Avenue, New York, NY 10022. Other shareholder communications received by the Trust not directly addressed and sent to the Board will be reviewed and generally responded to by management. Such communications will be forwarded to the Board at management’s discretion based on the matters contained therein.
| Independent Board Members | ||||||
| Name, Year of Birth, Position with the Trust and Length of Time Served(1) |
Business Experience and Directorships During the Past 5 Years |
Number of Portfolios in Fund Complex Overseen |
Other Directorships Held by Board Member | |||
| Stephen R. Byers (1953) Chairperson since 2016, and Board Member since 2011 (formerly, Lead Independent Board Member, 2015-2016) |
Independent Director (2011- present); Independent Consultant (2014-present); Director of Investment Management, the Dreyfus Corporation (2000-2006) and Vice Chairman and Chief Investment Officer, the Dreyfus Corporation (2002-2006). | 42 | The Arbitrage Funds, Sierra Income Corporation, Mutual Fund Directors Forum | |||
| George O. Elston (1964) Board Member since 2011, Chairperson of the Audit Committee since 2015 |
Chief Financial Officer, EyePoint Pharmaceuticals, Inc. (2019-present); Chief Financial Officer, Enzyvant (2018-2019); Chief Executive Officer, 2X Oncology, Inc. (2017-2018); Senior Vice President and Chief Financial Officer, Juniper Pharmaceuticals, Inc. (2014-2016); Senior Vice President and Chief Financial Officer, KBI BioPharma Inc. (2013-2014); Managing Partner, Chatham Street Partners (2010-2013). | 42 | — | |||
| J. David Officer (1948) Board Member since 2011, Chairperson of the Nominating Committee since 2015 |
Independent Director (2010- present); Vice Chairman, the Dreyfus Corporation (2006-2009); President, The Dreyfus Family of Funds, Inc. (2006-2009). | 42 | (Chairman of) Ilex Management Ltd; Old Westbury Funds | |||
97
DBX ETF Trust
Board Members and Officers (Unaudited) (Continued)
| Officers(2) |
||||||
| Name, Year of Birth, Position with the Trust and Length of Time Served(3) |
Business Experience and Directorships During the Past 5 Years | |||||
| Freddi Klassen(4) (1975) President and Chief Executive Officer, 2016-present |
Chief Administrative Officer Investment Division Americas, of DWS Investment Management Americas, Inc. and Manager (since 2023) and Chief Operating Officer of the Advisor (2016-present). Formerly: Programmes (Head 2021-2023), of DWS Investment Management Americas, Inc.; Chief Operating Officer in the Americas for the Traditional Asset Classes Department (2014-2020); Global Chief Operating Officer for Equities Technology in the Investment Bank Division at Deutsche Bank AG (2013-2014); Chief Operating Officer for Exchange Traded Funds and Systematic Funds in Europe (2008-2013). | |||||
| Diane Kenneally(4) (1966) Treasurer, Chief Financial Officer and Controller, 2019-present |
Fund Administration Treasurer’s Office (Co-Head since 2018), of DWS Investment Management Americas, Inc.; Chief Financial Officer and Treasurer for DWS US registered investment companies advised by DWS Investment Management Americas, Inc. (2018-present); Treasurer and Chief Financial Officer, The European Equity Fund, Inc., The New Germany Fund, Inc. and The Central and Eastern Europe Fund, Inc. (2018-present); formerly: Assistant Treasurer for the DWS funds (2007-2018). | |||||
| Frank Gecsedi(4) (1967) Chief Compliance Officer, 2010-present |
AFC Compliance US (Senior Team Lead), of DWS Investment Management Americas, Inc.; Compliance Department (2016-present), Vice President in the Deutsche Asset Management Compliance Department at Deutsche Bank AG (2013-2016) and Chief Compliance Officer of the Advisor (2010-present); Chief Compliance Officer of DWS Distributors, Inc. (2019-2022); Vice President in Deutsche Bank’s Global Markets Legal, Risk and Capital Division (2010-2012). | |||||
| Bryan Richards(4) (1978) Vice President, 2016-present |
Portfolio Engineering, Systematic Investments Solutions (Head), of DWS Investment Management Americas, Inc.(2018-present); Portfolio Manager in the Passive Asset Management Department at DWS (2011-present); Primary Portfolio Manager for the PowerShares DB Commodity ETFs (2011-2015). | |||||
| John Millette(5) (1962) Secretary, 2020-present |
Legal (Associate General Counsel), DWS US Retail Legal (2003-present), of DWS Investment Management Americas, Inc.; Vice President and Secretary of DWS US registered investment companies advised by DWS Investment Management Americas, Inc. (1999-present); Chief Legal Officer, DWS Investment Management Americas, Inc. (2015-present); Director and Vice President of DWS Trust Company (2016-present); Vice President, DBX Advisors LLC (2021-present); Secretary, The European Equity Fund, Inc., The New Germany Fund, Inc. and The Central and Eastern Europe Fund, Inc. (2011-present); formerly: Secretary of Deutsche Investment Management Americas Inc. (2015-2017); and Assistant Secretary of DBX ETF Trust (2019-2020). | |||||
| Caroline Pearson(5) (1962) Assistant Secretary, 2020-present |
Legal (Senior Team Lead), DWS US Retail Legal, of DWS Investment Management Americas, Inc.; Chief Legal Officer of DWS US registered investment companies advised by DWS Investment Management Americas, Inc. (2010-present); Chief Legal Officer, DBX Advisors LLC and DBX Strategic Advisors LLC (2020- present); Chief Legal Officer, The European Equity Fund, Inc., The New Germany Fund, Inc. and The Central and Eastern Europe Fund, Inc. (2012-present); formerly: Secretary, Deutsche AM Distributors, Inc. (2002-2017); Secretary, Deutsche AM Service Company (2010-2017); and Chief Legal Officer, DBXStrategic Advisors LLC (2020-2021) | |||||
98
DBX ETF Trust
Board Members and Officers (Unaudited) (Continued)
| Name, Year of Birth, Position with the Trust and Length of Time Served(3) |
Business Experience and Directorships During the Past 5 Years | |||||
| Paul Antosca(5) (1957) Assistant Treasurer, 2019-present |
Fund Administration Tax (Head), of DWS Investment Management Americas, Inc.; Assistant Treasurer for DWS US registered investment companies advised by DWS Investment Management Americas, Inc. (2007-present). | |||||
| Jeffrey Berry(5) (1959) Assistant Treasurer, 2019-present |
Fund Administration (Senior Specialist), of DWS Investment Management Americas, Inc. | |||||
| Sheila Cadogan(5) (1966) Assistant Treasurer, 2019-present |
Fund Administration Treasurer’s Office (Co-Head since 2018), of DWS Investment Management Americas, Inc.; Assistant Treasurer for DWS US registered investment companies advised by DWS Investment Management Americas, Inc. (2017-present); Director and Vice President, DWS Trust Company (2018-present); Assistant Treasurer, The European Equity Fund, Inc., The New Germany Fund, Inc. and The Central and Eastern Europe Fund, Inc. (2018-present). | |||||
| Christina A. Morse(6) (1964) Assistant Secretary, 2017-present |
Vice President at BNY Mellon Asset Servicing (2014- present); Vice President and Counsel at Lord Abbett & Co. LLC (2013-2014). | |||||
| Christian Rijs(4) (1980) Anti-Money Laundering Compliance Officer, since October 21, 2021 |
Senior Team Lead Anti-Financial Crime and Compliance, DWS Investment Management Americas, Inc.; AML Officer, DWS Trust Company (since November 2, 2021); AML Officer, DWS US registered investment companies advised by DWS Investment Management Americas, Inc. (since October 6, 2021); AML Officer, The European Equity Fund, Inc., The New Germany Fund, Inc. and The Central and Eastern Europe Fund, Inc. (since November 12, 2021); formerly: DWS UK & Ireland Head of Anti-Financial Crime and MLRO. | |||||
| (1) | The length of time served is represented by the year in which the Board Member joined the Board. |
| (2) | As a result of their respective positions held with the Advisor and its affiliates, these individuals are considered “interested persons” of the Advisor within the meaning of the 1940 Act. Interested persons receive no compensation from the Funds. |
| (3) | The length of time served is represented by the year in which the officer was first elected to the Trust in such capacity. |
| (4) | Address: 875 Third Avenue, New York, New York 10022. |
| (5) | Address: 100 Summer Street, Boston, MA 02110. |
| (6) | Address: BNY Mellon Asset Servicing, 240 Greenwich Street, New York, NY 10286. |
The Funds’ Statement of Additional Information (“SAI”) includes additional information about the Funds’ Board Members. The SAI is available by calling 855-329-3837, or on the Company’s website at www.Xtrackers.com.
99
DBX ETF Trust
Proxy Voting Policies and Procedures
The Funds’ policies and procedures for voting proxies for portfolio securities and information about how each Fund voted proxies related to its portfolio securities during the most recent 12-month period ended June 30 are available on our Web site — www.Xtrackers.com (click on “Resources” and “Proxy Voting” at the top of the page) — or on the SEC’s Web site — www.sec.gov. To obtain a written copy of the Funds’ policies and procedures without charge, upon request, call us toll free at 855-329-3837.
Portfolio Holdings Information
The Funds are required to file their complete schedule of portfolio holdings with the SEC for their first and third fiscal quarters on Form N-PORT. Copies of the filings are available without charge, upon request on the SEC’s website at www.sec.gov and are available by calling the Trust at 855-329-3837.
Information about each Fund’s portfolio holdings is available daily at www.Xtrackers.com.
Discount/Premium Information
Information regarding how often shares of each Fund traded on NYSE Arca or Cboe, as applicable, at a price above (i.e., at a premium) or below (i.e., at a discount) the NAV of the Fund can be found at www.Xtrackers.com.
Tax Information
Form 1099-DIV and other year-end tax information provide shareholders with actual calendar year amounts that should be included in their tax returns. Shareholders should consult their tax advisors.
Each Fund designates the following amounts or, if subsequently determined to be different, the maximum allowable for its year ended May 31, 2023.
| Qualified Dividend Income* |
||||
| Xtrackers MSCI All World ex US High Dividend Yield Equity ETF |
78% | |||
| Xtrackers MSCI EAFE High Dividend Yield Equity ETF |
90% | |||
* The above percentage is based on ordinary income dividends paid to shareholders during each Fund’s fiscal year.
Each Fund intends to elect to pass through to shareholders the credit for taxes paid to foreign countries. The gross foreign source income and foreign taxes paid are as follows:
| Gross Foreign Income | Foreign Taxes Paid | |||||||
| Xtrackers MSCI All World ex US High Dividend Yield Equity ETF |
$ | 600,085 | $ | 46,931 | ||||
| Xtrackers MSCI EAFE High Dividend Yield Equity ETF |
64,460,507 | 4,333,802 | ||||||
100
DBX ETF Trust
This report is intended for the shareholders of DBX ETF Trust.
This report must be preceded or accompanied by a prospectus.
Investing involves risk, including possible loss of principal. Bond investments are subject to interest-rate, credit, liquidity and market risks to varying degrees. When interest rates rise, bond prices generally fall. Credit risk refers to the ability of an issuer to make timely payments of principal and interest. Funds investing in a single industry, country or in a limited geographic region generally are more volatile than more diversified funds. In certain situations, it may be difficult or impossible to sell an investment at an acceptable price. Foreign investing involves greater and different risks than investing in U.S. companies, including currency fluctuations, less liquidity, less developed or less efficient trading markets, lack of comprehensive company information, political instability and differing auditing and legal standards. Emerging markets tend to be more volatile and less liquid than the markets of more mature economies, and generally have less diverse and less mature economic structures and less stable political systems than those of developed countries. Investments in lower-quality (“junk bonds”) and non-rated securities present greater risk of loss than investments in higher-quality securities. Municipal securities are subject to the risk that litigation, legislation or other political events, local business or economic conditions or the bankruptcy of the issuer could have a significant effect on an issuer’s ability to make payments of principal and/or interest. The market for municipal bonds may be less liquid than for taxable bonds and there may be less information available on the financial condition of issuers of municipal securities than for public corporations. Income from municipal bonds may be subject to state and local taxes and at times the alternative minimum tax. Incorporation of ESG criteria in a fund’s investment strategy does not guarantee a return or protect against a loss, limits the types and number of investment opportunities available to the Fund and, as a result, the Fund may underperform other funds that do not have an ESG focus. Stocks may decline in value. Dividends are not guaranteed. If the dividend-paying stocks held by the Fund reduce or stop paying dividends, the Fund’s ability to generate income may be adversely affected. Performance of the Funds may diverge from that of the Underlying Index due to operating expenses, transaction costs, cash flows, use of sampling strategies or operational inefficiencies. An investment in these Funds should be considered only as a supplement to a complete investment program for those investors willing to accept the risks associated with the Funds. Please read the prospectus for more information.
Environmental, social and governance (ESG) criteria are a set of standards for a company’s operations that socially conscious investors use to screen potential investments: Environmental (how a company performs as a steward of nature); Social (how a company manages relationships with employee, suppliers, customers and communities); Governance (company’s leadership, executive pay, shareholder rights, etc).
War, terrorism, sanctions, economic uncertainty, trade disputes, public health crises, natural disasters, climate change and related geopolitical events have led and, in the future, may lead to significant disruptions in U.S. and world economies and markets, which may lead to increased market volatility and may have significant adverse effects on the Funds and their investments.
Shares of the Funds are bought and sold at market price (not NAV) throughout the day on the NYSE Arca, Inc. or CBOE BZX Exchange, Inc., as applicable. Transactions in Fund shares may result in brokerage commissions and may generate tax consequences. There can be no assurance that an active trading market for shares of a Fund will develop or be maintained.
DBX ETF Trust Funds are distributed by ALPS Distributors, Inc. (“ALPS”). The Funds are managed by DBX Advisors LLC which is not affiliated with ALPS.
The brand DWS represents DWS Group GmbH & Co. KGaA and any of its subsidiaries such as DWS Distributors, Inc. which offers investment products or DWS Investment Management Americas, Inc. and RREEF America L.L.C. which offer advisory services.
ESHY and ESEB are not sponsored, endorsed, or promoted by JP Morgan Chase & Co. (“JP Morgan”) and JP Morgan bears no liability with respect to any index on which such fund is based. The accuracy, completeness or relevance of the information which has been obtained from external sources cannot be guaranteed, although it has been obtained from sources reasonably believed to be reliable. Subject to any applicable law, JP Morgan shall not assume any liability in this respect. The index described herein is a proprietary J.P. Morgan index. The prospectus contains a detailed description of the limited relationship that JP Morgan has with DBX Advisors, LLC. Index provider website: www.jpmorgan.com/country/US/en/jpmorgan/investbk/solutioins/research/indices/composition.
“Bloomberg®” and Bloomberg MSCI US Corporate Sustainability SRI Sector/Credit/Maturity Neutral Index are service marks of Bloomberg Finance L.P. and its affiliates, including Bloomberg Index Services Limited (“BISL”), the administrator of the index (collectively, “Bloomberg”) and have been licensed for use for certain purposes by DBX Advisors LLC (the “Adviser”). Bloomberg is not affiliated with the Adviser, and Bloomberg does not approve, endorse, review, or recommend the Xtrackers Bloomberg US Investment Grade Corporate ESG ETF (the “Fund”). Bloomberg does not guarantee the timeliness, accurateness, or completeness of any data or information relating to the Fund.
RVNU (the “Fund”) is not sponsored, endorsed, sold or promoted by Solactive. Neither Solactive nor any other party makes any representation or warranty, express or implied, to the owners of the Fund or any member of the public regarding advisability of investing in funds generally or in this Fund particularly or the ability of the Underlying Index to track general stock market performance. Neither Solactive nor any other party makes any express or implied warranties, and Solactive hereby expressly disclaims all warranties of merchantability or fitness for a particular purpose with respect to the Underlying Index or any data included therein. The prospectus contains a more detailed description of the limited relationship Solactive has with DBX Advisors LLC and any related funds.
The Funds or securities referred to herein are not sponsored, endorsed, issued, sold or promoted by MSCI, and MSCI bears no liability with respect to any such Funds or securities or any index on which such funds or securities are based. The prospectus contains a more detailed description of the limited relationship MSCI has with DBX Advisors LLC and any related funds.
Copyright © 2023 DWS Group. All rights reserved. XtrackersTM is a trademark of DWS Investment GmbH. All other trademarks, servicemarks or registered trademarks are the property of their respective owners.
Not FDIC Insured | No Bank Guarantee | May Lose Value
DBX ETF Trust
| Investment advisor DBX Advisors LLC 875 Third Avenue New York, NY 10022 |
Administrator, custodian, The Bank of New York Mellon 240 Greenwich Street New York, NY 10286 |
Distributor ALPS Distributors, Inc. 1290 Broadway Suite 1000 Denver, CO 80203 | ||
| Independent registered public accounting firm Ernst & Young LLP One Manhattan West New York, NY, 10001 |
Legal counsel Vedder Price P.C. 1633 Broadway New York, NY 10019 |
|||
R-35362-10 (7/23) DBX005559 (7/24)
| (b) | Not applicable |
| Item 2. | Code of Ethics. |
| (a) | The registrant, as of the end of the period covered by this report, has adopted a code of ethics that applies to the registrant’s principal executive officer, principal financial officer, principal accounting officer or controller, or persons performing similar functions, regardless of whether these individuals are employed by the registrant or a third party. |
| (b) | There have been no amendments, during the period covered by this report, to a provision of the code of ethics that applies to the registrant’s principal executive officer, principal financial officer, principal accounting officer or controller, or persons performing similar functions, regardless of whether these individuals are employed by the registrant or a third party, and that relates to any element of the code of ethics description. |
| (c) | The registrant has not granted any waivers, including an implicit waiver, from a provision of the code of ethics that applies to the registrant’s principal executive officer, principal financial officer, principal accounting officer or controller, or persons performing similar functions, regardless of whether these individuals are employed by the registrant or a third party, that relates to one or more of the items set forth in paragraph (b) of this item’s instructions. |
| Item 3. | Audit Committee Financial Expert. |
Stephen R. Byers, George O. Elston, and J. David Officer are the designated financial experts on the Audit Committee of DBX ETF Trust. With respect to DBX ETF Trust, Stephen Byers, George O. Elston, and J. David Officer are not “interested persons” as such terms are defined by Section 2(a)(19) of the Act (15 U.S.C. 80a-2(a)(19)).
| Item 4. | Principal Accountant Fees and Services. |
Audit Fees
| (a) | The aggregate fees billed for each of the last two fiscal years for professional services rendered by the principal accountant for the audit of the registrant’s annual financial statements or services that are normally provided by the accountant in connection with statutory and regulatory filings or engagements for those fiscal years are $437,583 for 2023 and $424,838 for 2022. |
Audit-Related Fees
| (b) | The aggregate fees billed in each of the last two fiscal years for assurance and related services by the principal accountant that are reasonably related to the performance of the audit of the registrant’s financial statements and are not reported under paragraph (a) of this Item are $0 for 2023 and $0 for 2022. |
Tax Fees
| (c) | The aggregate fees billed in each of the last two fiscal years for professional services rendered by the principal accountant for tax compliance, tax advice, and tax planning are $123,771 for 2023 and $181,106 for 2022. |
All Other Fees
| (d) | The aggregate fees billed in each of the last two fiscal years for products and services provided by the principal accountant, other than the services reported in paragraphs (a) through (c) of this Item are $0 for 2023 and $0 for 2022. |
| (e)(1) | Disclose the audit committee’s pre-approval policies and procedures described in paragraph (c)(7) of Rule 2-01 of Regulation S-X. |
In accordance with Rule 2-01(c)(7)(A), the Audit Committee pre-approves all of the audit and permissible non-audit services of the Registrant.
| (e)(2) | All of the services described in paragraphs (b) through (d) above were approved by the Audit Committee in accordance with paragraph (c) (7) (i) (c) of Rule 2-01 of Regulation S-X. |
| (f) | Not Applicable. |
| (g) | The aggregate non-audit fees billed by the registrant’s accountant for services rendered to the registrant, and rendered to the registrant’s investment adviser (not including any sub-adviser whose role is primarily portfolio management and is subcontracted with or overseen by another investment adviser), and any entity controlling, controlled by, or under common control with the adviser that provides ongoing services to the registrant for each of the last two fiscal years of the registrant was $0 for 2023 and $0 for 2022. |
| (h) | The registrant’s audit committee of the board of directors has considered whether the provision of non-audit services that were rendered to the registrant’s investment adviser (not including any sub-adviser whose role is primarily portfolio management and is subcontracted with or overseen by another investment adviser), and any entity controlling, controlled by, or under common control with the investment adviser that provides ongoing services to the registrant that were not pre-approved pursuant to paragraph (c)(7)(ii) of Rule 2-01 of Regulation S-X is compatible with maintaining the principal accountant’s independence. |
| (i) | Not applicable. |
| (j) | Not applicable. |
Pursuant to PCAOB Rule 3526, EY is required to describe in writing to the Funds’ Audit Committee, on at least an annual basis, all relationships between EY, or any of its affiliates, and the Xtrackers ETFs, or persons in financial reporting oversight roles at DWS that, as of the date of the communication, may reasonably be thought to bear on EY’s independence. Pursuant to PCAOB Rule 3526, EY has reported the matters set forth below that may reasonably be thought to bear on EY’s independence. With respect to each reported matter in the aggregate, EY advised the Audit Committee that, after careful consideration of the facts and circumstances and the applicable independence rules, it concluded that the matters do not and will not impair EY’s ability to exercise objective and impartial judgement in connection with the audits of the financial statements for the Funds and a reasonable investor with knowledge of all relevant facts and circumstances would conclude that EY has been and is capable of exercising objective and impartial judgment on all issues encompassed within EY’s audit engagements. EY also confirmed to the Audit Committee that it can continue to act as the Independent Registered Public Accounting Firm for the Funds.
| • | EY advised the Funds’ Audit Committee that various covered persons within EY and EY’s affiliates held investments in, or had other financial relationships with, entities within the Xtrackers ETFs “investment company complex” (as defined in Regulation S-X). EY informed the Audit Committee that these investments and financial relationships were inconsistent with Rule 2-01(c)(1) of Regulation S-X. EY reported that all breaches have been resolved and that none of the breaches involved any professionals who were part of the audit engagement team for the Funds ETFs or in the position to influence the audit engagement team for the Funds. |
| Item 5. | Audit Committee of Listed Registrants. |
The Registrant is a listed issuer as defined in Rule 10A-3 under the Exchange Act and has a separately-designated standing audit committee established in accordance with Section 3(a)(58)(A) of the Exchange Act. The Registrant’s audit committee members are Stephen R. Byers, George O. Elston, and J. David Officer.
| Item 6. | Investments. |
| (a) | Schedule of Investments in securities of unaffiliated issuers as of the close of the reporting period is included as part of the report to shareholders filed under Item 1(a) of this form. |
| (b) | Not applicable. |
| Item 7. | Disclosure of Proxy Voting Policies and Procedures for Closed-End Management Investment Companies. |
Not applicable.
| Item 8. | Portfolio Managers of Closed-End Management Investment Companies. |
Not applicable.
| Item 9. | Purchases of Equity Securities by Closed-End Management Investment Company and Affiliated Purchasers. |
Not applicable.
| Item 10. | Submission of Matters to a Vote of Security Holders. |
There were no material changes to the procedures by which shareholders may recommend nominees to the Registrant’s Board of Trustees.
| Item 11. | Controls and Procedures. |
| (a) | The Chief Executive and Financial Officers concluded that the Registrant’s Disclosure Controls and Procedures are effective based on the evaluation of the Disclosure Controls and Procedures as of a date within 90 days of the filing date of this report. |
| (b) | There have been no changes in the registrant’s internal control over financial reporting that occurred during the period covered by this report that has materially affected, or is reasonably likely to materially affect, the registrant’s internal controls over financial reporting. |
| Item 12. | Disclosure of Securities Lending Activities for Closed-End Management Investment Companies. |
Not applicable.
| Item 13. | Exhibits. |
SIGNATURES
Pursuant to the requirements of the Securities Exchange Act of 1934 and the Investment Company Act of 1940, the registrant has duly caused this report to be signed on its behalf by the undersigned, thereunto duly authorized.
| (Registrant) | DBX ETF Trust | |
| By (Signature and Title) | /s/ Freddi Klassen | |
| Freddi Klassen | ||
| President and Chief Executive Officer | ||
Date August 4, 2023
Pursuant to the requirements of the Securities Exchange Act of 1934 and the Investment Company Act of 1940, this report has been signed below by the following persons on behalf of the registrant and in the capacities and on the dates indicated.
| By (Signature and Title) | /s/ Freddi Klassen | |
| Freddi Klassen | ||
| President and Chief Executive Officer | ||
| Date August 4, 2023 | ||
| By (Signature and Title) | /s/ Diane Kenneally | |
| Diane Kenneally | ||
| Treasurer and Chief Financial Officer | ||
| Date August 4, 2023 | ||