EX-99.2
Exhibit 99.2


02 / www.interxion.com

Forward-Looking Statements
This annual report contains forward-looking statements within the meaning of Section 27A of the
Securities Act of 1933, as amended, and Section 21E of the Securities Exchange Act of 1934, as amended, with respect to all statements other than statements of historical fact regarding our business, financial condition, results of operations
and certain of our plans, objectives, assumptions, projections, expectations or beliefs with respect to these items and statements regarding other future events or prospects. These statements include, without limitation, those concerning: our
strategy and our ability to achieve it; expectations regarding sales, profitability and growth; plans for the construction of new data centers; our ability to integrate new acquisitions; our possible or assumed future results of operations; research
and development, capital expenditure and investment plans; adequacy of capital; and financing plans. The words “aim”, “may”, “will”, “expect”, “anticipate”, “believe”, “future”,
“continue”, “help”, “estimate”, “plan”, “schedule”, “intend”, “should”, “shall” or the negative or other variations thereof, as well as other statements regarding
matters that are not historical fact, are or may constitute forward-looking statements.
In addition, this annual report includes
forward-looking statements relating to our potential exposure to various types of market risks, such as foreign exchange rate risk, interest rate risks and other risks related to financial assets and liabilities. We have based these forward-looking
statements on our management’s current view of future events and financial performance. These views reflect the best judgment of our management but involve a number of risks and uncertainties which could cause actual results to differ
materially from those predicted in our forward-looking statements and from past results, performance or achievements. Although we believe that the estimates reflected in the forward-looking statements are reasonable, those estimates may prove to be
incorrect. By their nature, forward-looking statements involve risk and uncertainty because they relate to events and depend on circumstances that will occur in the future. There are a number of factors that could cause actual results and
developments to differ materially from these expressed or implied by these forward-looking statements.
These factors include, among other things:
| ∎ |
|
operating expenses cannot be easily reduced in the short term; |
| ∎ |
|
inability to utilize the capacity of newly planned or acquired data centers and data center expansions; |
| ∎ |
|
significant competition; |
| ∎ |
|
cost and supply of electrical power; |
| ∎ |
|
overcapacity in the data center industry; and |
| ∎ |
|
performance under service level agreements. |
These and other risks
described under “Risk Factors” (page 27), are not exhaustive. Other sections of this annual report describe additional factors that could adversely affect our business, financial condition or results of operations including delays in
remediating the material weakness in internal control over financial reporting and/or making disclosure controls and procedures effective. In addition, new risk factors may emerge from time to time, and it is not possible for us to predict all such
risk factors, nor can we assess the impact of all such risk factors to differ materially from those contained in any forward-looking statements. Given these risks and uncertainties, you should not place undue reliance on forward-looking statements
as a prediction of actual results.
All forward-looking statements included in this annual report are based on information available to
us at the date of this annual report. We undertake no obligation to update publicly or revise any forward-looking statement, whether as a result of new information, future events or otherwise, except as may be required by applicable law. All
subsequent written and oral forward-looking statements attributable to us or to persons acting on our behalf are expressly qualified in their entirety by the cautionary statements contained throughout this annual report.
www.interxion.com / 03

IN THIS REPORT
|
|
|
| Operational review |
|
|
| 07 |
|
Our 2018 performance at a glance |
|
|
| 08 |
|
Information on the Company |
|
|
| 10 |
|
Innovation and technical excellence |
|
|
| 10 |
|
Our commitment to sustainability |
|
|
| 10 |
|
Organisational structure |
|
|
| 12 |
|
Our people |
|
| Financial review |
|
|
| 15 |
|
Income statement highlights |
|
|
| 17 |
|
Balance sheet highlights |
|
|
| 18 |
|
Cash flow highlights |
|
| Report of the Board of Directors |
|
|
| 21 |
|
Structure |
|
|
| 21 |
|
Board of Directors |
|
|
| 24 |
|
Directors’ Insurance and Indemnification |
|
|
| 24 |
|
Executive Committee |
|
|
| 24 |
|
General Meetings of Shareholders and voting rights |
|
|
| 25 |
|
Compensation |
|
|
| 26 |
|
Shares beneficially owned |
|
|
| 26 |
|
Risk management |
|
|
| 27 |
|
Risk factors |
|
|
| 29 |
|
Controls and procedures |
|
|
| 30 |
|
Dutch Corporate Governance Code |
|
|
| 31 |
|
Outlook for 2019 |
|
|
|
| Report of the Non-executive Directors |
|
|
| 33 |
|
Evaluation |
|
|
| 33 |
|
Independence Non-executive Directors |
|
|
| 33 |
|
Internal control function |
|
|
| 33 |
|
Board committees |
|
| Consolidated financial statements |
|
|
| 35 |
|
Consolidated income statements |
|
|
| 35 |
|
Consolidated statements of comprehensive income |
|
|
| 37 |
|
Consolidated statements of changes in shareholders’ equity |
|
|
| 38 |
|
Consolidated statements of cash flows |
|
|
| 39 |
|
Notes to the 2018 Consolidated financial statements |
|
| Company financial statements |
|
|
| 101 |
|
InterXion Holding N.V. Company financial statements |
|
|
| 102 |
|
Notes to the 2017 Company financial statements |
|
| Other information |
|
|
| 110 |
|
Independent auditor’s report |
|
|
| 120 |
|
Appendix |
|
| Find out more |
|
|
| 123 |
|
Our locations |
|
|
| 123 |
|
Contact us |
|
|
| 124 |
|
Definitions |

04 / www.interxion.com

www.interxion.com / 05

06 / www.interxion.com
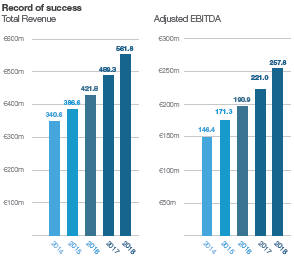
Our 2018 performance at a glance
Interxion delivered strong financial and strategic progress in 2018. Revenue and Adjusted EBITDA1
each saw a strong uplift over 2017 accompanied by solid bookings growth across market segments. Our extensive expansion plans continued to be driven by customer demand, especially from our existing major cloud and digital media platform
customers.
Across all our data centers we seek to create vibrant communities of interest where our customers,
including core connectivity providers cloud and digital media platforms, and enterprise customers can gain value from being colocated with one another. Alongside these efforts to foster communities, we seek to invest, expand capacity and deliver the
highest-quality infrastructure suitable for high-density computing and advanced applications. This strategic and disciplined approach to investment has yielded strong growth rates and returns across the markets where we operate, and we expect these
trends to continue.
Technology continues to fundamentally change the way we live and work. Our data centers will remain central to the
digitization trends as locations where data is processed, gathered and transmitted around the world. High density of connectivity is a key attribute in this context and our highly connected data center campuses continue to attract customer
deployments from a range of segments and across the spectrum of capacity requirements.
Customer focus has always been at the heart of
everything we do. By understanding our customers’ requirements and how these are evolving, not only have we been able to differentiate our company and sustain its growth, but we have also been able to gain important customer insights,
anticipate future directions and make the appropriate investments to expand our footprint.
In response to healthy customer demand, we
opened two new data centers and expanded capacity in 9 of our 11 countries during the year, with the remaining 2 countries scheduled to open new capacity in the first half of 2019. We also announced additions to our equipped space capacity of over
28% through to the end of 2020. Of this new capacity, over 70% is scheduled to open between mid-2019 and the end of the year.
As 2019 gets underway, I would like to thank all our employees for their ongoing contributions and customer focus. Their dedication and commitment
are fundamental to Interxion’s continuing success.
David Ruberg, Chief Executive Officer
May 27, 2019
|
|
|

|

|
|
Interxion delivered strong financial and operational results for 2018. We remain in expansion
mode in response to healthy customer demand across our data center footprint.”
David Ruberg
Chief Executive Officer |
1. Adjusted EBITDA is a non-IFRS measure. Refer to “Definitions” for a detailed explanation of
this measure. Note 5 of the Consolidated Financial Statements shows a reconciliation from net income and operating income to Adjusted EBITDA.
www.interxion.com / 07
Selected Financial Data
|
|
|
|
|
|
|
|
|
|
|
|
|
|
|
|
|
|
|
|
|
| |
|
2018 |
|
|
2017 |
|
|
2016 |
|
|
2015 |
|
|
2014 |
|
| Recurring revenue |
|
|
533.1 |
|
|
|
462.5 |
|
|
|
400.0 |
|
|
|
365.2 |
|
|
|
319.2 |
|
| Non-recurring
revenue |
|
|
28.7 |
|
|
|
26.8 |
|
|
|
21.8 |
|
|
|
21.4 |
|
|
|
21.4 |
|
| Revenue |
|
|
561.8 |
|
|
|
489.3 |
|
|
|
421.8 |
|
|
|
386.6 |
|
|
|
340.6 |
|
| Adjusted EBITDA |
|
|
257.8 |
|
|
|
221.0 |
|
|
|
190.9 |
|
|
|
171.3 |
|
|
|
146.4 |
|
| Adjusted EBITDA margin |
|
|
45.9% |
|
|
|
45.2% |
|
|
|
45.3% |
|
|
|
44.3% |
|
|
|
43.0% |
|
| Capital expenditures (including intangibles) |
|
|
451.2 |
|
|
|
256.0 |
|
|
|
250.9 |
|
|
|
192.6 |
|
|
|
216.3 |
|
| Cash generated from operations |
|
|
251.0 |
|
|
|
209.0 |
|
|
|
183.4 |
|
|
|
169.4 |
|
|
|
135.4 |
|
| Revenue-generating space |
|
|
115.0 |
|
|
|
99.8 |
|
|
|
87.2 |
|
|
|
79.1 |
|
|
|
71.0 |
|
| Equipped space |
|
|
144.8 |
|
|
|
122.5 |
|
|
|
110.8 |
|
|
|
101.2 |
|
|
|
93.5 |
|
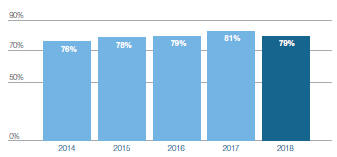
| Utilisation rate |
|
|
79% |
|
|
|
81% |
|
|
|
79% |
|
|
|
78% |
|
|
|
76% |
|
Financial figures are expressed as millions of euros; space figures in ‘000 sqm.
Information on the Company
We are a leading provider of carrier and cloud-neutral colocation data center services in Europe. We support over 2,000 customers through 51 data
centers (as of December 31, 2018) in 11 countries, enabling them to create value by housing, protecting and connecting their most valuable content and applications. We enable our customers to connect to a broad range of telecommunications
carriers, cloud platforms, internet service providers and other customers. Our data centers act as content, cloud and connectivity hubs that facilitate the processing, storage, sharing and distribution of data between our customers, creating an
environment that we refer to as a community of interest.
Our core offering of carrier and cloud neutral colocation services includes
space, power, cooling, connectivity and a physically secure environment in which to house our customers’ computing, network, storage and IT infrastructure. We enable our customers to reduce operational and capital costs while improving
application performance and flexibility. We supplement our core colocation offering with a number of additional services, including network monitoring, remote monitoring of customer equipment, systems management, engineering support services, cross
connect and cloud connect, data backup and storage.
Our headquarters are located in Hoofddorp, The Netherlands, and we operate in major
metropolitan areas, including Amsterdam, Frankfurt, Paris and London, Europe’s main data center markets. Our data centers are located in close proximity to the intersection of telecommunications fiber routes, and we house more than 700
individual carriers and internet service providers, 21 European Internet exchanges and all the leading global cloud platforms. Our data centers allow our customers to lower their telecommunications costs and reduce latency, thereby improving the
response time of their applications. This high level of connectivity fosters the development of communities of interest.
Our strategy
Target new customers in high growth industry segments to further develop our communities of interest
We categorize our customers into industry segments, and we will continue to target new and existing customers in high growth industry segments,
including Connectivity Providers, Platform Providers and Enterprises. Winning new customers in these target industries enables us to expand existing and build new high value communities of interest within our data centers. We expect the high value
and reduced cost benefits of our communities of interest to continue to attract new customers and generate expansion from existing customers, which will lead to decreased customer acquisition costs for us. For example, customers in the digital media
segment benefit from the close proximity to content delivery network providers, Internet exchanges and cloud platforms in order to create and deliver content to consumers reliably and quickly.
Increase share of spend from existing customers
We
focus on increasing revenue from our existing customers in our target-market segments. New revenue from our existing customers comprises a substantial portion of our new business, comprising the majority of our new bookings. Our sales and marketing
teams focus on proactively working with customers to identify expansion opportunities in new or existing markets.
Maintain connectivity leadership
We seek to increase the number of carriers in each of our data centers by expanding the presence of our existing carriers into additional
data centers and targeting new carriers. We will also continue to develop our relationships with Internet exchanges and work to increase the number of internet service providers in these exchanges. In countries where there is no significant Internet
exchange, we will work with internet service providers and other parties to create an appropriate exchange.
08 / www.interxion.com
Adjusted EBITDA
Cash generated from operations
Capital expenditure
Utilisation rate
Our sales and business development teams will continue to work with our existing carriers and
internet service providers, and target new carriers and internet service providers, to maximize their presence in our data centers, and to achieve the highest level of connectivity in each of them, with the right connectivity providers to support
the requirements of each of our communities of interest.
Continue to deliver
best-in-class customer service
We will continue to provide
a high level of customer service in order to maximize customer satisfaction and minimize churn. Our European Customer Service Center, which operates 24 hours a day, 365 days a year, provides continuous monitoring and troubleshooting and reduces
customers’ internal support costs by giving them one-call access to full, multilingual technical support. In addition, we will continue to develop our customer tools, which include an online customer
portal to provide our customers with real-time access to information. We will continue to invest in our local service delivery and assurance teams, which provide flexibility and responsiveness to customer needs.
Disciplined expansion and prudent financial management
We plan to invest in our data center capacity while maintaining our disciplined investment approach and prudent financial policy. We will continue
to determine the size of our expansions based on selling patterns, pipeline and trends in existing demand as well as working with our customers to identify future capacity requirements. We plan to build larger data centers and secure land banks in
anticipation of future demand, as providing line of sight to our long-term expansion plans is increasingly important to our largest customers. In order to reduce risk and improve our return on capital to meet our target internal rates of return,
we manage the timing and scale of our capital expenditure obligations by phasing our expansions. Finally, we will continue to manage our capital deployment and financial management decisions
based on adhering to our target internal rate of return on new expansions and target leverage ratios.
Our services
We offer carrier and cloud neutral colocation data center and connectivity services to our customers.
Colocation
We provide clients with the space and power
to deploy IT infrastructure in world-class data centers. Through a number of redundant subsystems, including power, fiber and cooling, we are able to provide our customers with highly reliable services. Our scalable colocation services enable our
customers to upgrade space and power, connectivity and services as their requirements expand and evolve. Our data centers employ a wide range of physical security features, including biometric scanners, man traps, smoke detection, fire suppression
systems, and secure access. Our colocation facilities include the following services:
Space
Each of our data centers houses our customers’ IT infrastructure in a highly connected facility, designed and fitted to ensure a high level of
network reliability. We provide the space and power for our clients to deploy their own IT infrastructures. Depending on their space and security needs, customers can choose individual cabinets, a secure cage or an individual private room.
www.interxion.com / 09
Power
Each of our data centers offers our customers high power availability. Generators, in combination with uninterrupted power supply (UPS) systems, ensure maximum availability. We provide a full range of output voltages and currents
and offer our customers a choice of guaranteed levels of availability between 99.9% and 99.999%.
Connectivity
We provide connectivity services that enable our customers to connect their IT infrastructure to exchange traffic and access cloud platforms. These
services, which offer connectivity with more than 700 individual carriers and internet service providers and all the leading cloud providers, enable our customers to reduce costs while improving the reliability and performance associated with the
exchange of Internet and cloud data traffic. Our connectivity options offer customers a key strategic advantage by providing direct, high-speed connections to peers, partners, customers, cloud platforms and some of the most important sources of IP
data, content and distribution in the world.
Cross connects
We install and manage physical connections running from our customers’ equipment to the equipment of our telecommunications carriers, internet
service providers and Internet exchange customers, as well as to other customers. Cross connects are physically secured in dedicated Meet-Me rooms. Our staff test and install cables and patches and maintain
cable trays and patch panels according to industry best practice.
Additional services
In addition to providing colocation services, we provide a number of additional services, including systems monitoring, systems management and
engineering support services. Some managed services are only performed on an ad hoc basis, as and when requested by the customer, while others are more recurring in nature. These services are provided either directly by us, or in conjunction with
third parties.
Innovation and technical excellence
For well over a decade we have been at the forefront of data center design and management and we continue to focus on innovation and improvements in
energy efficiency and cooling efficiency. Our design leadership includes evaluating the latest energy efficiency techniques, options for green power, reduction is water consumption, and testing and implementing new design practices.
Our dedicated Datacenter Technology and Engineering Group (DTEG), has pioneered many of today’s key data center design approaches, such as
modular design and build, design for power usage effectiveness (PUE), cold aisle containment, seawater and ground water cooling and other design innovations.
Our data centers are operated and maintained in a consistent manner and all our data centers are
based on a consistent design. The consistency in design, operation and maintenance contributes to high levels of technical excellence, reliability and performance.
Our commitment to sustainability
Today, all our energy is from renewable sources. We deliver efficient, cost-effective services by minimising waste and energy use, without compromising reliability and performance. Our modular data center design – which enables
us to build large systems from smaller subsystems – optimises our use of space, power and cooling, and helps us to continue to improve PUE.
As part of our sustainability commitment, we contribute to recognized industry bodies. For example, we hold the position of Chair at the Governmental Engagement Committee and we have a seat at the Advisory Council of The Green Grid
(the leading energy efficiency and sustainability association for the data center industry) and contribute to the EC Joint Research Centre on sustainability.
Organizational structure
European Telecom Exchange B.V. was incorporated on April 6, 1998. After being renamed InterXion Holding B.V. on June 12, 1998, it was
converted into InterXion Holding N.V. on January 11, 2000. From inception until the acquisition of Interxion Science Park (formerly known as Vancis B.V., “Interxion Science Park”) in 2017, we grew our colocation business organically.
Since 2001, we developed our geographic footprint in 13 cities where we have established data center campuses. The only changes to our geographic footprint have been the addition of Marseille in 2014 and the closing of Hilversum at the end of 2014.
Following the industry downturn that began in 2001 as a result of a sharp decline in demand for Internet-based businesses, we restructured within our geographic base to refocus on a broader and more stable customer base. We have since focused on
shifting our customer base from primarily emerging Internet companies and carriers to a wide variety of established businesses that seek to house their IT infrastructure.
Our subsidiaries perform various tasks, such as servicing our clients, operating our data centers, customers support, and providing management,
sales and marketing support to the Group. The following table sets forth the name, country of incorporation and (direct and indirect) ownership interest of our subsidiaries as of December 31, 2018:
10 / www.interxion.com
|
|
|
|
|
|
|
| Entity |
|
Country of incorporation |
|
Ownership |
|
Activity |
| |
|
|
|
% |
|
|
| |
|
|
|
|
|
|
| |
|
|
|
| InterXion HeadQuarters B.V. |
|
The Netherlands |
|
100% |
|
Management |
| |
|
|
|
|
|
|
| |
|
|
|
| Interxion Europe Ltd |
|
United Kingdom |
|
100% |
|
Management |
| |
|
|
|
|
|
|
| |
|
|
|
| InterXion Operational B.V. |
|
The Netherlands |
|
100% |
|
Management/Holding |
| |
|
|
|
|
|
|
| |
|
|
|
| InterXion Participation 1 B.V. |
|
The Netherlands |
|
100% |
|
Holding |
| |
|
|
|
|
|
|
| |
|
|
|
| InterXion Nederland B.V. |
|
The Netherlands |
|
100% |
|
Provision of co-location services |
| |
|
|
|
|
|
|
| |
|
|
|
| InterXion Datacenters B.V. |
|
The Netherlands |
|
100% |
|
Data center sales & marketing |
| |
|
|
|
|
|
|
| |
|
|
|
| InterXion Science Park B.V. |
|
The Netherlands |
|
100% |
|
Provision of colocation services |
| |
|
|
|
|
|
|
| |
|
|
|
| InterXion Real Estate Holding B.V. |
|
The Netherlands |
|
100% |
|
Real estate management/Holding |
| |
|
|
|
|
|
|
| |
|
|
|
| InterXion Real Estate I B.V. |
|
The Netherlands |
|
100% |
|
Real estate |
| |
|
|
|
|
|
|
| |
|
|
|
| InterXion Real Estate IV B.V. |
|
The Netherlands |
|
100% |
|
Real estate |
| |
|
|
|
|
|
|
| |
|
|
|
| InterXion Real Estate V B.V. |
|
The Netherlands |
|
100% |
|
Real estate |
| |
|
|
|
|
|
|
| |
|
|
|
| InterXion Real Estate X B.V. |
|
The Netherlands |
|
100% |
|
Real estate |
| |
|
|
|
|
|
|
| |
|
|
|
| InterXion Real Estate XII B.V. |
|
The Netherlands |
|
100% |
|
Real estate |
| |
|
|
|
|
|
|
| |
|
|
|
| InterXion Real Estate XIII B.V. |
|
The Netherlands |
|
100% |
|
Real estate |
| |
|
|
|
|
|
|
| |
|
|
|
| InterXion Real Estate XIV B.V. |
|
The Netherlands |
|
100% |
|
Real estate |
| |
|
|
|
|
|
|
| |
|
|
|
| InterXion Real Estate XVI B.V. |
|
The Netherlands |
|
100% |
|
Real estate |
| |
|
|
|
|
|
|
| |
|
|
|
| InterXion Österreich GmbH |
|
Austria |
|
100% |
|
Provision of colocation services |
| |
|
|
|
|
|
|
| |
|
|
|
| InterXion Real Estate VII GmbH |
|
Austria |
|
100% |
|
Real estate |
| |
|
|
|
|
|
|
| |
|
|
|
| InterXion Belgium N.V. |
|
Belgium |
|
100% |
|
Provision of colocation services |
| |
|
|
|
|
|
|
| |
|
|
|
| InterXion Real Estate IX N.V. |
|
Belgium |
|
100% |
|
Real estate |
| |
|
|
|
|
|
|
| |
|
|
|
| InterXion Danmark ApS |
|
Denmark |
|
100% |
|
Provision of colocation services |
| |
|
|
|
|
|
|
| |
|
|
|
| InterXion Real Estate VI ApS |
|
Denmark |
|
100% |
|
Real estate |
| |
|
|
|
|
|
|
| |
|
|
|
| InterXion Real Estate XVII ApS |
|
Denmark |
|
100% |
|
Real estate |
| |
|
|
|
|
|
|
| |
|
|
|
| Interxion France SAS |
|
France |
|
100% |
|
Provision of colocation services |
| |
|
|
|
|
|
|
| |
|
|
|
| Interxion Real Estate II SARL |
|
France |
|
100% |
|
Real estate |
| |
|
|
|
|
|
|
| |
|
|
|
| Interxion Real Estate III SARL |
|
France |
|
100% |
|
Real estate |
| |
|
|
|
|
|
|
| |
|
|
|
| Interxion Real Estate XI SARL |
|
France |
|
100% |
|
Real estate |
| |
|
|
|
|
|
|
| |
|
|
|
| InterXion Deutschland GmbH |
|
Germany |
|
100% |
|
Provision of colocation services |
| |
|
|
|
|
|
|
| |
|
|
|
| InterXion Ireland DAC |
|
Ireland |
|
100% |
|
Provision of colocation services |
| |
|
|
|
|
|
|
| |
|
|
|
| Interxion España SA |
|
Spain |
|
100% |
|
Provision of colocation services |
| |
|
|
|
|
|
|
| |
|
|
|
| Interxion Real Estate XV SL |
|
Spain |
|
100% |
|
Real estate |
| |
|
|
|
|
|
|
| |
|
|
|
| InterXion Sverige AB |
|
Sweden |
|
100% |
|
Provision of colocation services |
| |
|
|
|
|
|
|
| |
|
|
|
| InterXion (Schweiz) AG |
|
Switzerland |
|
100% |
|
Provision of colocation services |
| |
|
|
|
|
|
|
| |
|
|
|
| InterXion Real Estate VIII AG |
|
Switzerland |
|
100% |
|
Real estate |
| |
|
|
|
|
|
|
| |
|
|
|
| InterXion Carrier Hotel Ltd. |
|
United Kingdom |
|
100% |
|
Provision of colocation services |
| |
|
|
|
|
|
|
www.interxion.com / 11
Our people
Our Executive Committee
Our people, led by a management team (“Executive Committee”) with considerable experience in the technology sector, are a major element
in what differentiates us. The team focuses on customers and on driving Interxion towards the heart of the digital economy, adding value and making it easier for our customers to do business.
|
|
|
| DAVID RUBERG |
|
|
|
|
David Ruberg, Chief Executive Officer, Vice-Chairman and Executive Director
|

|
|
Mr. Ruberg joined us as President and Chief Executive Officer in November 2007 and became Vice-Chairman of the Board of Directors when it became a
one-tier board in 2011. Mr. Ruberg served as Chairman of the Supervisory Board from 2002 to 2007 and on the Management Board from 2007 until its conversion into a
one-tier board. He was affiliated with Baker Capital, a private equity firm, from January 2002 to October 2007. From April 1993 to October 2001 he was Chairman, President and CEO of Intermedia Communications,
a NASDAQ-listed broadband communications services provider, as well as Chairman of its majority-owned subsidiary, Digex, Inc., a NASDAQ-listed managed web hosting company. He began his career as a scientist at AT&T Bell Labs, where he
contributed to the development of operating systems and computer languages. He holds a bachelor’s degree from Middlebury College and a master’s degree in Computer and Communication Sciences from the University of Michigan. |
| |
|
|
| |
|
|
| JOHN |
|
|
| DOHERTY |
|
John Doherty, Chief Financial Officer
|

|
|
Mr. Doherty joined Interxion as Chief Financial Officer in November, 2018 and is responsible for providing leadership to corporate strategy and development activities and overall
financial operations. He joined from Verizon, where he worked for over the past 30 years, and held various senior management roles including from 2012 - 2018 as Senior Vice President, Corporate Development and President & Chief Investment
Officer for Verizon Ventures. He was also Chief Financial Officer for Verizon’s Shared Services, Enterprise and International Organizations. He has previously worked in Bangkok for TelecomAsia and in the U.K. for NYNEX Cablecomms.
Mr. Doherty holds a degree in economics from Stonybrook University and has attended the MBA program at Baruch College as well as Wharton’s Executive Education program. |
| |
|
|
| |
|
|
| GIULIANO DI |
|
|
| VITANTONIO |
|
Giuliano Di Vitantonio, Chief Marketing and Strategy Officer
|

|
|
Mr. Di Vitantonio joined Interxion in January 2015 and is responsible for our market and product
strategies, including product management, product. marketing, segment strategy and business development. He joined from Cisco Systems, where he held the position of Vice President Marketing, Data Center and Cloud.
Mr. Di Vitantonio has more than 20 years’ experience in the IT
industry, including 17 years at Hewlett-Packard, where he held a broad range of positions in R&D, strategy, consulting, business development and marketing. His areas of expertise include IT management software, enterprise applications, data
center infrastructure and business intelligence solutions. He holds a master’s degree in EE/Telecommunications from the University of Bologna and an MBA from the London Business School. |
| |
|
|
12 / www.interxion.com
|
|
|
| JAN-PIETER |
|
|
| ANTEN |
|
Jan-Pieter Anten, Senior Vice President Human
Resources |

|
|
Mr. Anten joined us as Vice President Human Resources in October 2011. Before joining us, he worked for Hay Group, a global management consulting firm, as Director International Strategic
Clients Europe, where he led major accounts within the European market. Before that, he held the position of Vice President Human Resources at Synthon, an international organization with worldwide affiliates. He previously worked for Hay Group as a
Senior Consultant. Mr. Anten holds a degree from the University of Utrecht. |
| |
|
|
| |
|
|
| JAAP CAMMAN |
|
|
|
|
|

|
|
Jaap Camman, Senior Vice President, Legal
Mr. Camman is responsible for all legal and corporate affairs across the
Group. He joined us in November 1999 as Manager Legal and has been a member of our Executive Committee since July 2002.
Before joining us, he worked for the Dutch Government from February 1994 to October 1999. His latest position was Deputy Head of the Insurance
Division within The Netherlands Ministry of Finance. Mr. Camman holds a Law Degree from the University of Utrecht. |
| |
|
|
| |
|
|
| ADRIAAN
OOSTHOEK |
|
Adriaan Oosthoek,
Senior Vice President Operations & ICT Mr. Oosthoek has held senior management positions in the IT and Telecom industry for a number of years. He initially joined Interxion in 2014 as Managing Director for our UK business and joined the Executive Committee in 2015.
Before joining Interxion, he was the Executive Vice President at Colt, responsible for its global Data Center footprint. Before joining Colt, he spent 11 years at Telecity Group plc, the last seven years as the Managing Director of the UK and
Ireland operation for Telecity Group plc where he significantly grew the business. Preceding his tenure in the UK, he ran the Dutch operation of data center operator, Redbus Interhouse, and was a founder and Managing Director of the Dutch subsidiary
of Teles AG, a Berlin-headquartered provider of telecoms and data com products. He studied Information Sciences at the University of Applied Sciences in The Hague and holds marketing certificates NIMA A and NIMA B from The Netherlands Institute of Marketing. In addition to his formal roles, Mr. Oosthoek is
also Chairman of the Board of Governors of the Data Center Alliance, a European industry association for the data center industry. |

|
| |
|
|
www.interxion.com / 13

14 / www.interxion.com
|
|
|
|
|
|
|
| Financial review |
|
|
|
|
|
|

|
|

|
|
In 2018, Interxion continued its consistent record of profitable revenue growth. We continue to focus on
increasing our footprint in a disciplined manner and secured the required funding to enable future expansion, while delivering attractive long-term cash returns for our shareowners.”
John Doherty
Chief Financial Officer |
|
|
|
|
|
|
|
|
|
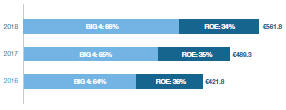
Interxion delivered another year of strong financial performance. Total revenue increased by 15% to €561.8 million while recurring revenue was also up 15% to €533.1 million,
year-on-year. Non-recurring revenue, which increased by 7% to
€28.7 million, was driven by the ongoing volume of customer installations. Adjusted EBITDA increased by 17%, to
€257.8 million, with a resulting Adjusted EBITDA margin of 45.9%, compared with 45.2% in 2017.
During 2018 we refinanced our balance sheet with the issue of
€1,200 million 4.75% senior notes due in 2025 and the redemption of our €625.0 million Senior
Secured Notes and €250.0 million drawn under our revolving credit facilities. This refinancing together with our undrawn €200 million Revolving Credit Facility, which was increased to €300 million in the first quarter of 2019,
provides us with the funding required to meet the ongoing investment in our data center portfolio through 2019.
Net income for the year
was €31.1 million (2017: €39.1 million), a 20% decrease compared with 2017, while Adjusted net income1 for the year was consistent with the prior year at €40.2 million (2017: €40.2 million).
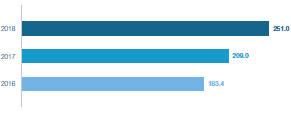
We continue to generate significant cash from our
operations: €251.0 million in 2018, representing a 20% increase over 2017. At the same time, we are allocating capital to meet the strong customer demand that we see across
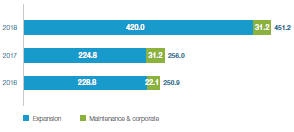
our markets and continue to deliver attractive and sustainable long-term returns for our shareowners. During 2018, we invested €451.2 million in capital expenditure. Of this
capital expenditure, €420.0 million, or 93%, was invested in discretionary expansion and upgrade projects. Approximately 70% of overall capital expenditure was deployed in
the Big4 segment2.
Over the last 3 years Interxion has invested approximately €960 million in capex and increased equipped capacity by approximately 44,000 square meters, an increase of 43%. During this time our utilization rates have remained close to 80%.
These metrics demonstrate the discipline that we exercise when we deploy capital.
John Doherty, Chief Financial Officer
May 27, 2019
Income statement highlights
|
|
|
|
|
|
|
|
|
|
|
|
|
| (€ millions) |
|
2018 |
|
|
2017 |
|
|
2016 |
| Total revenue |
|
|
561.8 |
|
|
|
489.3 |
|
|
|
421.8 |
|
| Recurring revenue percentage |
|
|
95% |
|
|
|
95% |
|
|
|
94% |
|
| Cost of sales |
|
|
(219.5) |
|
|
|
(190.5) |
|
|
|
(162.6) |
|
| Gross profit |
|
|
342.3 |
|
|
|
298.8 |
|
|
|
259.2 |
|
| Gross profit margin |
|
|
61% |
|
|
|
61% |
|
|
|
61% |
|
| Other income |
|
|
0.1 |
|
|
|
0.1 |
|
|
|
0.3 |
|
| Sales and marketing costs |
|
|
(36.5) |
|
|
|
(33.5) |
|
|
|
(29.9) |
|
| General and administrative costs |
|
|
(194.6) |
|
|
|
(167.1) |
|
|
|
(138.5) |
|
| Operating profit |
|
|
111.2 |
|
|
|
98.3 |
|
|
|
91.1 |
|
| Adjusted EBITDA |
|
|
257.8 |
|
|
|
221.0 |
|
|
|
190.9 |
|
| Adjusted EBITDA margin |
|
|
45% |
|
|
|
45% |
|
|
|
44% |
|
| Net income |
|
|
31.1 |
|
|
|
39.1 |
|
|
|
38.3 |
|
| Diluted earnings per share (€) |
|
|
0.43 |
|
|
|
0.55 |
|
|
|
0.54 |
|
(1) Adjusted net income is a non-IFRS measure. Refer to
“Definitions” for a detailed explanation of this measure.
(2) The Big4 segment includes France, Germany, the Netherlands and
the UK
Revenue
Our business model benefits from a high proportion of recurring revenue. Our total revenue for the year of €561.8 million, €533.1 million or 95% was recurring. This percentage was in line with 2017, when €462.5 million out of €489.3 million total revenue, was recurring. In our Big4 segment, €352.7 million or 95%, of €370.3 million of total revenue was recurring compared with €302.3 million or 95% of the €318.6 million of total revenue in 2017. Recurring revenue in the Big4
segment grew 17%, with strong performances from our operations in Germany and France. In our Rest of Europe (“ROE”) segment3,
€180.4 million or 94% of €191.4 million of total revenue was recurring, compared with €160.2 million or 94% of the €170.7 million of total revenue in 2017. Recurring revenue in the Rest of
Europe segment grew 13%, in particular driven by Austria, Belgium and Ireland.
Non-recurring
revenue increased by 7% to €28.7 million compared to €26.8 million in 2017. The increase in the
level of non-recurring revenue was driven by the on-going high volume of customer installations during the year, particularly in Germany, Denmark, Sweden and Spain.
(3) The ROE segment includes Austria, Belgium, Denmark, Ireland, Spain, Sweden and Switzerland.
www.interxion.com / 15
Consistent growth across our segments
Total revenue (x €1.0 million); segment percentage of total revenue
Cost of sales
Cost of sales increased by 15% in 2018 to €219.5 million (2017: €190.5 million). During the year we continued to make investments in new data centers, operations staff and in upgrading operational processes and systems, consistent with scaling our
infrastructure to support future growth.
Gross profit
Gross profit for the year was €342.3 million, up 15% year-over-year with
a gross profit margin of 60.9%, representing a reduction from 61.1% in 2017, this modest reduction is primarily due to the expansion drag associated with bringing on new capacity.
Sales and marketing costs
Sales and marketing costs increased by 9%, to €36.5 million (2017: €33.5 million),
representing approximately 7% of total revenue, consistent with 2017. The increase in sales and marketing costs was primarily due to increased compensation and related costs as a result of increases in employee headcount and marketing expenses
associated with our continued investment in our go to market strategy. Our sales and marketing teams continue to focus on identifying and converting opportunities both for existing customers and for prospects in our target segments, to expand our
customers’ deployments within our data center portfolio and enhance our connected Communities of Interest.
Our approach based on
connected Communities of Interest leads to attractive and sustainable investment returns, because it attracts and retains high value customers. Our customers derive long term benefits from being in our data centers, which results in higher levels of
customer satisfaction and lower churn rates.
General and administrative costs
General and administrative costs increased by 16% in 2018, to
€194.6 million (2017: €167.2 million) and amounted to 35% of total revenue (2017: 34%). General and
administrative costs consist of depreciation and amortization, share-based payments, M&A transaction costs and other general and administrative costs.
Depreciation and amortization increased to €129.0 million for the year ended December 31, 2018, from €108.3 million for the year ended December 31, 2017, an increase of 19% which is consistent with our ongoing investment in new data
centers and data center expansions. The increase in other general and administrative costs was due to
growth in our headcount and increases in professional advisory services and in software licenses.
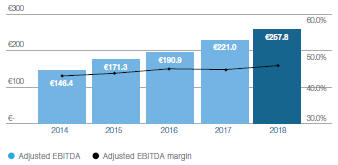
Adjusted EBITDA
Adjusted EBITDA increased by 17% during the year to
€257.8 million (2017: €221.0 million). Adjusted EBITDA margin increased by 70 basis points to 45.9%
(2017: 45.2%).
Adjusted EBITDA in the Big4 segment increased by 17% to
€203.8 million (2016: €174.8 million), representing a 55.0% margin (2017: 54.9%). Adjusted EBITDA in the
Rest of Europe totaled €113.7 million (2017: €99.7 million), representing a 59.4% margin (2017: 58.4%).
Employees
We employ the majority of our personnel in operations and support roles to operate our data centers 24 hours a day, 365 days a year. As of
December 31, 2018, we employed 768 full-time equivalent employees (the average for the year was 720 compared with 638 in 2017), of which 474 were employed in operations and support, 153 in sales and marketing and 141 in general and
administrative roles.
Operating profit
Operating profit increased by 13%, to €111.2 million in 2018 (2017: €98.3 million), reflecting the ongoing profitable growth of the business in 2018.
Net finance expense
Net finance expense increased to
€61.8 million for the year ended December 31, 2018 from €44.4 million for the year ended
December 31, 2017, an increase of 39%. Net finance expense was 11% of revenue for the year ended December 31, 2018 and 9% of revenue for the year ended December 31, 2017. The increase in net finance expense for the year ended
December 31, 2018 was primarily due to the increase in the level of borrowings following the refinancing of our capital structure together with associated one-time financing charges during 2018. In the
year ended December 31, 2018, we capitalized €4.9 million of borrowing costs in connection with the construction of new data center space, compared to €3.1 million in the year ended December 31, 2017.
Income tax expense
Income tax expense was €18.3 million for the year ended December 31,
2018, compared with €14.8 million for the year ended December 31, 2017. The effective income tax rate of 37% in the year ended December 31, 2018, compared with 28%
for the year ended December 31, 2017. This increase reflects the effect of decreased statutory tax rates in several of the jurisdictions in which we operate, resulting in a revaluation of deferred tax assets, increased non-deductible costs and limitations on interest deductibility in certain European jurisdictions.
16 / www.interxion.com
Net income
Net income increased to €31.1 million from €39.1 million in 2017. Net income, adjusted for M&A transaction costs, capitalized interest, re-assessment of indirect taxes, charges
related to termination of financing arrangements and certain other items, was consistent with the prior year at €40.2 million, (2017: €40.2 million).
Diluted Earnings per share
Diluted earnings per share (Diluted EPS) at €0.43 per share in 2018 was
unchanged from the prior year (2017: €0.43 per share) on a diluted share count of 72.1 million shares.
Net income reconciliation
|
|
|
|
|
|
|
|
|
|
|
|
|
| (€ millions) |
|
2018 |
|
|
2017 |
|
|
2016 |
| Net profit - as reported |
|
|
31.1 |
|
|
|
39.1 |
|
|
|
38.3 |
|
| Add back |
|
|
|
|
|
|
|
|
|
|
|
|
| + Charges related to termination of financing arrangements (a) |
|
|
11.2 |
|
|
|
— |
|
|
|
— |
|
| + Re-assessment of indirect taxes (b) |
|
|
2.5 |
|
|
|
— |
|
|
|
— |
|
| + M&A transaction costs |
|
|
3.2 |
|
|
|
4.6 |
|
|
|
2.4 |
|
| |
|
|
16.9 |
|
|
|
4.6 |
|
|
|
2.4 |
|
| Reverse |
|
|
|
|
|
|
|
|
|
|
|
|
| - Interest capitalised |
|
|
(4.9) |
|
|
|
(3.1) |
|
|
|
(3.4) |
|
| - Profit on sale of financial asset |
|
|
— |
|
|
|
— |
|
|
|
(0.3) |
|
| - Adjustments to site restoration |
|
|
— |
|
|
|
— |
|
|
|
(0.2) |
|
| - Adjustment of financial lease
obligation |
|
|
— |
|
|
|
— |
|
|
|
(1.4) |
|
| - Deferred tax asset adjustment |
|
|
— |
|
|
|
— |
|
|
|
(0.8) |
|
| |
|
|
(4.9) |
|
|
|
(3.1) |
|
|
|
(6.1) |
|
| Tax effect of above add backs & reversals |
|
|
(2.9) |
|
|
|
(0.4) |
|
|
|
0.4 |
|
| Adjusted net income |
|
|
40.2 |
|
|
|
40.2 |
|
|
|
35.0 |
|
| |
|
|
|
|
|
|
|
|
|
|
|
|
| Reported Basic EPS: (€) |
|
|
0.43 |
|
|
|
0.55 |
|
|
|
0.54 |
|
| Reported Diluted EPS: (€) |
|
|
0.43 |
|
|
|
0.55 |
|
|
|
0.54 |
|
| Adjusted Basic EPS: (€) |
|
|
0.56 |
|
|
|
0.57 |
|
|
|
0.50 |
|
| Adjusted Diluted EPS: (€) |
|
|
0.56 |
|
|
|
0.56 |
|
|
|
0.49 |
|
| (a): |
These charges relate to the repayment of our 6.00% Senior Secured Notes due 2020 and the termination
of our revolving credit facility agreements in 2018. |
| (b): |
This re-assessment relates to years prior to 2018 and is
therefore not representative of our current ongoing business.
|
Balance sheet highlights
|
|
|
|
|
|
|
|
|
|
|
|
|
| (€ millions) |
|
2018 |
|
|
2017(i) |
|
|
2016(i) |
|
| PP&E and intangible assets |
|
|
1,824.3 |
|
|
|
1,442.0 |
|
|
|
1,184.7 |
|
| Cash and cash equivalents |
|
|
186.1 |
|
|
|
38.5 |
|
|
|
115.9 |
|
| Other current and non-current assets |
|
|
252.2 |
|
|
|
221.6 |
|
|
|
182.1 |
|
| Total assets |
|
|
2,262.6 |
|
|
|
1,702.1 |
|
|
|
1,482.7 |
|
|
|
|
|
| Borrowings |
|
|
1,290.1 |
|
|
|
832.8 |
|
|
|
735.5 |
|
| Other current and non-current liabilities |
|
|
339.1 |
|
|
|
279.6 |
|
|
|
205.7 |
|
| Total liabilities |
|
|
1,629.2 |
|
|
|
1,112.4 |
|
|
|
941.2 |
|
| Shareholders’ equity |
|
|
633.4 |
|
|
|
589.7 |
|
|
|
541.5 |
|
| Total liabilities and shareholders’ equity |
|
|
2,262.6 |
|
|
|
1,702.1 |
|
|
|
1,482.7 |
|
| (i): |
Comparative figures for the years ended December 31, 2017 and 2016 were restated. For further
information on the errors, see Notes 2 and 28 of these 2018 consolidated financial statements. |
Balance
sheet
The Company maintained a solid balance sheet at the end of the 2018 financial year, with growing assets, (including increased cash
balances) and increasing shareholders’ equity compared to the prior year.
During 2018, we invested €451.2 million in capital expenditure of which €420.0 million was for discretionary expansion and upgrade
projects. Two new data centers were opened, accompanied by expansions in a total of seven countries, increasing equipped space by 22,300 square meters to 144,800 square meters.
Net of depreciation, this resulted in a €378.6 million increase in
property, plant and equipment. As at December 31, 2018, the total book value of the Company’s property, plant and equipment was €1,721.1 million.
Intangible assets increased on a net basis by €3.7 million to end the
year at €103.2 million.
The Company’s deferred tax
assets represent tax loss carry-forwards and temporary differences between the carrying amounts of assets for financial reporting purposes and the amounts for taxation purposes. At December 31, 2018, the balance of these deferred tax assets was
€21.8 million (December 31, 2017: €24.5 million). This decrease includes the impact of the decrease of
several European statutory tax rates, resulting in a revaluation and a reduction of deferred tax balances.
Cash and cash equivalents
increased to €186.1 million (December 31, 2017: €38.5 million), reflecting the net impact of the cash
flows relating to the balance sheet refinancing and increased cash generated from operations , partly offset by increased capital expenditure.
Other current and non-current assets increased to €252.2 million (December 31, 2017: €221.6 million).
www.interxion.com / 17
This amount comprises:
| ∎ |
|
trade and other current assets of €205.6 million (December 31, 2017: €179.8 million). Our fees are normally invoiced quarterly in advance, with the exception of metered power usage which is invoiced monthly in arrears and cross connects which are
invoiced quarterly in arrears; |
| ∎ |
|
deferred tax assets, which decreased as described above; |
| ∎ |
|
other investments of €7.9 million (December 31, 2017:
€3.7 million), representing a convertible loan provided by InterXion Participation I B.V. to Icolo, a company that is building and operating a data center business in Kenya
through its wholly owned Kenyan subsidiary; and, |
| ∎ |
|
other non-current assets, which increased to €16.8 million (December 31, 2017: €13.7 million). These assets include prepaid expenses, collateralized cash related to bank guarantees, and customer deposits. |
Borrowings at December 31, 2018 increased by €457.3 million to €1,290.1 million (December 31, 2017: €832.8 million), which was primarily the result of the balance sheet
refinancing during 2018. This was partly offset by regular mortgage repayments. As part of the refinancing we entered into a new €200 million Revolving Credit Facility which
was undrawn as at December 31, 2018. We increased the facility by €100 million to €300 million
after the year-end.
Total trade payables and other liabilities increased to €288.1 million (2017: €236.1 million). Of this,
€280.9 million (2017: €229.9 million), comprised current liabilities. Other liabilities include deferred
revenue, customer deposits, tax and social security liabilities, and accrued expenses.
We have remained in full compliance with all
covenants under the Indenture for our Senior Notes and our Revolving Credit Facility. In addition, we do not anticipate, in the next twelve months, any breach or failure that would negatively impact our ability to borrow funds under the Revolving
Facility Agreement.
Our net debt leverage ratio at year-end 2018 was 4.4x last twelve months
Adjusted EBITDA compared with a covenant requirement under our Revolving Credit Facility of less than 5.0x, which is tested only upon utilization of 35% or more of the Revolving Credit Facility. Of the Company’s total debt of €1,290.1 million, 98% matures in 2021 or beyond. Our €1,200 million 4.75% Senior Notes mature in June
2025.
Shareholders’ equity increased by €43.8 million
in 2018 to €633.4 million, as a result of total comprehensive income for 2018 of €29.8 million and
an increase of €14.0 million relating to new shares issued in respect of share-based payments and share options exercised.
| 1. |
Cash generated from operations is a non-IFRS measure. Refer
to “Definitions” for a detailed explanation of this measure.
|
Cash flow highlights
|
|
|
|
|
|
|
|
|
|
|
|
|
| (€ millions) |
|
2018 |
|
|
2017 |
|
|
2016 |
| Cash generated from operations |
|
|
251.0 |
|
|
|
209.0 |
|
|
|
183.4 |
|
| Net cash flows from operating activities |
|
|
164.9 |
|
|
|
155.2 |
|
|
|
139.4 |
|
| Capital expenditures, including intangible assets |
|
|
(451.2) |
|
|
|
(256.0) |
|
|
|
(250.9 |
) |
| Net cash flows used in investing activities |
|
|
(466.5) |
|
|
|
(335.6) |
|
|
|
(251.4 |
) |
| Net cash flows from financing activities |
|
|
449.5 |
|
|
|
104.6 |
|
|
|
174.0 |
|
| Net movement in cash and cash equivalents |
|
|
147.6 |
|
|
|
(77.4) |
|
|
|
62.2 |
|
| Cash and cash equivalents end of period |
|
|
186.1 |
|
|
|
38.5 |
|
|
|
115.9 |
|
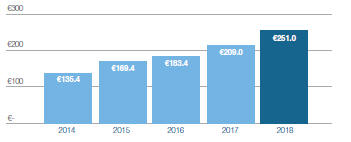
Cash flow
Cash generated from operations in 2018 was €251.0 million, an increase of 20% compared with 2017 (2017: €209.0 million), primarily due to the ongoing profitable growth of the business.
Cash interest paid in 2018 was €69.0 million (2017: €41.9 million). In accordance with
IFRS, the Company is required to capitalize interest costs during the data center construction phases. Accordingly, during 2018, €4.9 million of borrowing costs were
capitalized (2017: €3.1 million).
The cash interest paid,
reported in “purchase of property, plant and equipment”, was €6.2 million (2017: €3.9
million).
Strong cash generation
Cash generated from operations (€m)
Net cash flow from operating activities increased by 6% to €164.9 million (2017: €155.2 million). This increase is reflecting the ongoing growth of our business partly
offset by increased cash outflow from interest payments of €69.0 million (2017: €41.9 million).
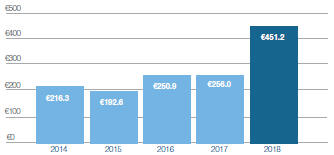
Net cash flow from investing activities increased by 39% to
€466.5 million (2017: €335.6 million). Capital expenditure for 2018, including the purchase of property,
plant and equipment, and the purchase of intangible assets, totaled €451.2 million. Of this capital expenditure
€318.6 million (71%) was deployed in the Big4 segment and €113.8 million (25%) in the Rest of
Europe segment compared to €174.8 million (68%) and €69.8 million (28%) in 2017. Of the total
capital expenditure, €420.0 million was invested in expansion and upgrade projects to facilitate future growth.
18 / www.interxion.com
These investments were financed through the cash generated from operations and through the
refinancing which was completed in 2018 and which was the principal reason for the Net cash flow from financing activities of €449.5 million (2017: €104.6 million).
This refinancing included the issuance of €1,200 million Senior Notes and the redemption of €625.0 million Senior Secured Notes and €250 million drawn under our revolving credit facilities. Cash flows relating to transaction costs associated with the issuance of Senior Notes and the Revolving Facility amounted
to €9.7 million.
In addition, we entered into a €6.0 million financing agreement, consisting of a loan that is secured by a mortgage on certain data center property in The Netherlands owned by Interxion Real Estate V B.V. and a
pledge on rights under the intergroup lease agreement between Interxion Real Estate V B.V., as lessor, and Interxion Nederland B.V., as lessee.
Scheduled repayments for our mortgages amounted to €8.3 million in 2018. The Company also received
€1.7 million from the exercise of stock options. The Company does not currently hedge its foreign exchange exposure and exchange rates had a negative impact of €0.2 million on cash balances during the year.
Cash and cash
equivalents increased by €147.6 million in 2018 from €38.5 million at the beginning of the year
to €186.1 million at the year-end.
Capital expenditure
Capital expenditure, including intangibles (€m)
Events subsequent to the balance sheet date
Increased capacity under Revolving Credit Facility
During the first quarter of 2019, the Group increased the capacity under the Revolving Credit Facility by €100.0 million for total commitment of €300.0 million.
Purchase of shares in Icolo Ltd.
During 2019, the Group
entered into an agreement to purchase 40% of the share capital of Icolo Ltd., and certain convertible loans which were previously granted to Icolo Ltd. by the sellers. The transaction price for both the shares and the convertible loans amounts to
USD 5.7 million. After completion of this transaction, the Group will apply IAS 28 – Investments in Associates and Joint Ventures and account for the shares as an investment in an associate.
www.interxion.com / 19

20 / www.interxion.com
|
|
|
|
|
|
|
REPORT OF THE BOARD OF DIRECTORS |
Structure
InterXion Holding N.V. (the “Company”) is a public limited liability company incorporated under the laws of The Netherlands and is the
direct or indirect parent company of all companies that form the Interxion group of companies (the “Group”). Our corporate seat is in Amsterdam, The Netherlands. Our principal office is located at Scorpius 30, 2132 LR, Hoofddorp, The
Netherlands. The Company was incorporated on April 6, 1998 as European Telecom Exchange B.V. and was renamed InterXion Holding B.V. on June 12, 1998. The Company is registered with the Dutch Chamber of Commerce under number 33301892. On January 11,
2000 the Company was converted into a Naamloze Vennootschap. Since January 28, 2011, the Company’s shares have been listed on the New York Stock Exchange (“NYSE”).
The Company has one class of shares, of which 71,707,841 had been issued and paid-up as of
December 31, 2018. Of these shares, 20,375,252 were issued in 2011 as part of the Company’s initial public offering.
Board of Directors
Board powers and function
The Company has a one-tier management structure with one Board of Directors, which currently consist of one
Executive Director and five Non-executive Directors. The Board is responsible for the overall conduct of our business and has the powers, authorities and duties vested in it by and pursuant to the relevant
laws of The Netherlands and our Articles of Association. In all its dealings, the Board shall be guided by the interests of our Group as a whole, including our shareholders and other stakeholders. The Board has the final responsibility for the
management, direction and performance of the Company and the Group. Our Executive Director is responsible for the day-to-day management of the Company. Our Non-executive Directors supervise the Executive Director and our general affairs and provide general advice to the Executive Director.
Our Chief Executive Officer (“CEO”), the Executive Director, is the general manager of our business, subject to the control of the Board,
and is entrusted with all the Board’s powers, authorities and discretions (including the power to sub-delegate) delegated by the full Board from time to time by a resolution of the Board. Matters
expressly delegated to our CEO are validly resolved on by our CEO and no further resolutions, approvals or other involvement of the Board is required. The Board may also delegate authorities to its committees. On any such delegation, the Board
supervises the execution of its responsibilities by our CEO and/or our Board committees. The Board remains ultimately responsible for the fulfilment of its duties. Moreover, its members remain accountable for the actions and decision of the Board
and have ultimate responsibility for the Company’s management and external reporting. The Board’s members are accountable to the shareholders of the Company at its Annual General Meeting.
Board meetings and decisions
All resolutions of the Board are adopted by a simple majority of votes cast in a meeting at which at least the majority of the Directors are present or represented. A member of the Board may authorize another member of the Board to
represent him/her at the Board meeting and vote on his/her behalf.
Each Director is entitled to one vote (provided that, for the avoidance of doubt, a member
representing one or more absent members of the Board by written power of attorney will be entitled to cast the vote of each such absent member). If there is a tie, the Chairman has the casting vote.
The Board meets as often as it deems necessary or appropriate, or on the request of any of its members. During 2018, the Board met twelve times.
With the exception of one meeting in which one Director was absent, all Directors attended all Board meetings. The Board has adopted rules, which contain additional requirements for our decision-making process, the convening of meetings and, through
separate resolution by the Board, details on the assignment of duties and a division of responsibilities between Executive Directors and Non-executive Directors. The Board has appointed one of the Directors as
Chairman and one of the Directors as Vice- Chairman of the Board. The Board appoints, and is assisted by, a Corporate Secretary, who may be a member of the Board or of the Executive Committee.
Composition of the Board
The Board consists of a minimum of one Executive Director and a minimum of three Non-executive Directors,
provided that it comprises of a maximum of seven members. The number of Executive Directors and Non-executive Directors is determined by our Annual General Meeting, with the proviso that the majority of the
Board must comprise Non-executive Directors. Only natural persons can be Non-executive Directors. The Executive Directors and
Non-executive Directors are appointed by our General Meeting, provided that the Board is classified, with respect to the term for which each member of the Board will severally be appointed and serve as a
member of the Board, into three classes that are as nearly equal in number as is reasonably possible.
Our Directors are appointed for a
period of three years. The Class I Directors serve for a term that expires at the Annual General Meeting to be held in 2020; the Class II Directors serve for a term that expires at the Annual General Meeting to be held in 2021; and the
Class III Directors are serving for a term that
www.interxion.com / 21
|
|
|
|
|
| REPORT OF THE BOARD OF DIRECTORS |
|
|
expires at the Annual General Meeting to be held in 2019. At each Annual General Meeting, Directors
appointed to succeed those Directors whose terms expire are appointed to serve for a term of office to expire at the third Annual General Meeting following their appointment. Notwithstanding the foregoing, the Directors appointed to each class
continue to serve their term in office until their successors are duly appointed and qualified or until their earlier resignation, death or removal. If a vacancy occurs, any Director appointed to fill that vacancy serves its term in office for the
remainder of the full term of the class of Directors in which the vacancy occurred.
The Board has nomination rights with respect to the
appointment of a Director. Any nomination by the Board may consist of one or more candidates for any vacant seat. If a nomination consists of two or more candidates, it is binding: the appointment to the vacant seat concerned will be from the
persons placed on the binding list of candidates and will be effected through election. Notwithstanding the foregoing, our General Meeting may, at all times, by a resolution passed with a two-thirds majority
of the votes cast that represent more than half of our issued and outstanding capital, resolve that such list of candidates will not be binding.
The majority of our Directors are independent as required by the NYSE Manual. Our Non-executive Directors are all independent.
Directors may be suspended or dismissed at any time by our General Meeting. A resolution to suspend or dismiss a Director must be adopted by at
least a two-thirds majority of the votes cast, provided that the majority represents more than half of our issued and outstanding share capital. In addition, Executive Directors may be suspended by the Board.
Pursuant to Section 2:166 of the Dutch Civil Code, which came into force on 13 April 2017,
boards of large Dutch public companies, such as the Company, are deemed to have a balanced composition if they consist of at least 30% female and 30% male members. “Large” companies must take this into account:
| ∎ |
|
on appointment and, where applicable, recommendation for nomination or nomination for appointment of Directors; and |
| ∎ |
|
when drawing up the profile for the size and composition of the Board. |
A company is considered “large” if, on two consecutive balance sheet dates, at least two of the following three criteria are met:
| ∎ |
|
the value of the company’s assets according to its balance sheet, based on the acquisition and manufacturing price, exceeds
€20,000,000; |
| ∎ |
|
the net turnover exceeds €40,000,000; and |
| ∎ |
|
the average number of employees is at least 250. |
The Company is
committed to making an effort to increase the number of women on its Board of Directors, which it will primarily do by focusing on female candidates for Director positions. The main focus of the Company will continue to be on ensuring that those
persons best qualified for a position on the Board of Directors are nominated, irrespective of their gender.
Directors
|
|
|
|
|
|
|
|
|
|
|
| Name |
|
Age |
|
Gender |
|
Nationality |
|
Position |
|
Term
Expiration |
|
|
|
|
|
|
| Jean F.H.P.
Mandeville |
|
59 |
|
Male |
|
Belgian |
|
Chairman and Non-executive Director |
|
2019 |
|
|
|
|
|
|
| David C.
Ruberg |
|
73 |
|
Male |
|
American |
|
President, Chief Executive Officer
Vice-Chairman and Executive Director |
|
2019 |
|
|
|
|
|
|
| Frank
Esser |
|
60 |
|
Male |
|
German |
|
Non-executive Director |
|
2020 |
|
|
|
|
|
|
| Mark
Heraghty |
|
55 |
|
Male |
|
Irish |
|
Non-executive Director |
|
2020 |
|
|
|
|
|
|
| David
Lister |
|
60 |
|
Male |
|
British |
|
Non-executive Director |
|
2021 |
|
|
|
|
|
|
|
Rob Ruijter
|
|
67 |
|
Male |
|
Dutch |
|
Non-executive
Director |
|
2021 |
22 / www.interxion.com
|
|
|
|
|
|
|
REPORT OF THE BOARD OF DIRECTORS |
Jean F.H.P. Mandeville
Chairman and Non-executive Director
Mr. Mandeville was appointed to our Board of Directors in January 2011. Since June 8, 2015, Mr. Mandeville has served as the Chairman
of the Board. From October 2008 to December 2010, he served as Chief Financial Officer and Board member of MACH S.à.r.l. He served as an Executive Vice President and Chief Financial Officer of Global Crossing Holdings Ltd/ Global Crossing
Ltd. from February 2005 to September 2008. Mr. Mandeville joined Global Crossing in February 2005, where he was responsible for all its financial operations. He served as Chief Financial Officer of Singapore Technologies Telemedia Pte. Ltd./ST
Telemedia from July 2002 to January 2005. In 1992, he joined British Telecom and served in various capacities covering all sectors of the telecommunications market (including wireline, wireless and multi-media) in Europe, Asia and the Americas. From
1992 to June 2002, Mr. Mandeville served in various capacities at British Telecom PLC, including President of Asia Pacific from July 2000 to June 2002, Director of International Development Asia Pacific from June 1999 to July 2000 and General
Manager, Special Projects from January 1998 to July 1999. He was a Senior Consultant with Coopers & Lybrand, Belgium from 1989 to 1992. Mr. Mandeville graduated from the University Saint-Ignatius Antwerp with a Masters degree in
Applied Economics in 1982 and a Special degree in Sea Law in 1985.
David Ruberg, President
President, Chief Executive Officer, Vice-Chairman and
Executive Director
Mr. Ruberg joined us as President and Chief Executive Officer in November 2007 and became Vice-Chairman of the Board of Directors when it
became a one-tier board in 2011. He served as Chairman of the Supervisory Board from 2002 to 2007 and on the Management Board from 2007 until its conversion into a
one-tier board. He was affiliated with Baker Capital, a private equity firm from January 2002 to October 2007. From April 1993 to October 2001 he was Chairman, President and CEO of Intermedia Communications, a
NASDAQ-listed broadband communications services provider, as well as Chairman of its majority-owned subsidiary, Digex, Inc., a NASDAQ-listed managed web hosting company. He began his career as a scientist at AT&T Bell Labs, where he contributed
to the development of operating systems and computer languages. He holds a Bachelor’s Degree from Middlebury College and a Masters in Computer and Communication Sciences from the University of Michigan.
Frank Esser
Non-executive Director
Mr. Esser was appointed to our Board of Directors in June 2014. Since
2000, he has held various positions with the French telecom operator SFR, where, from 2002 to 2012, he was President and CEO. From 2005 to 2012, he was a member of the Board of Vivendi Management. Before that he was a Senior Vice President of
Mannesmann International Operations until 2000. Mr. Esser serves on the board of Swisscom AG. Mr. Esser is a Business Administration graduate from Cologne University and he holds a Doctorate in Business Administration from Cologne
University.
Mark Heraghty
Non-executive Director
Mr. Heraghty was appointed to our Board of Directors in June 2014. He is a Director of Ravenscourt Consulting Services Ltd which he established
in December 2018. In February 2019 Mr. Heraghty was appointed as a Non-Executive Director of Jurassic Fibre Holdings Ltd. and before that he served as Chairman of John Henry Group Ltd from December 2016
until October 2018. His most recent executive role was as Managing Director of Virgin Media Business. From 2006 to 2009, he was President EMEA for Reliance Globalcom with regional responsibility for the former FLAG Telecom and Vanco businesses which
Reliance acquired. From 2000 to 2003, he was the CEO Europe for Cable & Wireless. Mr. Heraghty graduated from Trinity College Dublin with a degree in Mechanical Engineering (1985) and holds an MBA from Warwick University (1992).
David Lister
Non-executive director
Mr. Lister serves on our Board of Directors, to which he was appointed in June 2018. He has numerous years of experience working for a number
of large multi-national businesses in the area of Operations and Technology Management. In particular, leading and developing large-scale Global IT organizations and designing and delivering complex business and technology change. Many of
Mr. Lister’s roles focused on delivering the integration of business processes and organizational structures underpinned by technology standardization and followed the acquisition or merger of businesses. More recently, he has been focused
on delivering cloud based digital solutions to create new products and services and creating defensive capabilities to protect businesses from the threat of Cyber Terrorism and Information Security breaches. Mr. Lister also currently sits on
the Board of FDM Group plc., Weatherby’s, HSBC Bank plc and Nuffield Health. Mr. Lister studied Architecture at the University of Edinburgh.
Rob Ruijter
Non-executive director
Mr. Ruijter was appointed to our Board of Directors in November 2014.
He was the Chief Financial Officer of KLM Royal Dutch Airlines from 2001 until its merger with Air France in 2004, and Chief Financial Officer of VNU N.V. (a publicly listed marketing and publishing company now the Nielsen company), between 2004 and
2007. In 2009 and 2010 he served as the CFO of ASM International N.V. (a publicly listed manufacturer of electronic components), and in 2013 as the interim CEO of Vion Food Group N.V.
Mr. Ruijter currently serves on the Supervisory Board and as Chairman of the Audit Committee of Wavin N.V. (a piping manufacturer). He is a Non-executive Director of Inmarsat Plc and the Chairman of its Audit Committee. He also serves as a member of the Supervisory Board of NN Group N.V. and as a member of the Remuneration Committee and the Audit
Committee. Mr. Ruijter is a Certified Public Accountant in the United States and in The Netherlands and is a member of the Association of Corporate Treasurers (“ACT”) in the UK.
www.interxion.com / 23
|
|
|
|
|
| REPORT OF THE BOARD OF DIRECTORS |
|
|
Directors’ insurance and indemnification
In order to attract and retain qualified and talented persons to serve as members of the Board or of our Executive Committee, we currently provide
such persons with protection through a directors’ and officers’ insurance policy and expect to continue to do so. Under this policy, any of our past, present or future Directors and members of our Executive Committee will be insured
against any claim made against any one of them for any wrongful act in their respective capacities.
Under our Articles of Association,
we are required to indemnify each current and former member of the Board who was or is involved in that capacity as a party to any actions or proceedings, against all conceivable financial loss or harm suffered in connection with those actions or
proceedings, unless it is ultimately determined by a court having jurisdiction that the damage was caused by intent (opzet), wilful recklessness (bewuste roekeloosheid) or serious culpability (ernstige verwijtbaarheid) on the part of such member.
Insofar as indemnification of liabilities arising under the Securities Act may be permitted to members of the Board, officers or
persons controlling us pursuant to the foregoing provisions, we have been informed that, in the opinion of the SEC, such indemnification is against public policy as expressed in the Securities Act and is therefore unenforceable.
Executive Committee
The Executive Director is supported by an Executive Committee to manage the operations of the Company. The Executive Committee is actively involved
in all important issues related to strategy, business, integration, sustainability, innovation, culture, leadership and communication. Members of the Executive Committee are, where relevant, present in the meetings of the Board and exercise their
duties in accordance with the instructions from the Board. When deemed necessary, Non-executive Directors can discuss any issues with each of the members of the Executive Committee
General Meetings of Shareholders and voting rights
Our Annual General Meeting must be held within six months of the end of the previous financial year. It must be held in The Netherlands in
Amsterdam, Haarlemmermeer (Schiphol Airport) or Hoofddorp. Our financial year coincides with the calendar year. The notice convening the Annual General Meeting, together with the agenda for the meeting, shall be sent to the addresses of the
shareholders shown in the register of shareholders. An extraordinary General Meeting may be convened whenever the Board or CEO deem it necessary.
In addition, shareholders and/or persons having the rights conferred by the laws of The Netherlands
on holders of depositary receipts issued with a company’s cooperation for shares in its capital representing in the aggregate at least one-tenth of the Company’s issued capital, may request the Board
to convene a General Meeting, specifically stating the business to be discussed. If the Board has not given proper notice of a General Meeting within the four weeks following receipt of the request, the applicants shall be authorised to convene a
meeting themselves. Each of the shares confers the right to cast one vote. Each shareholder entitled to participate in a General Meeting, either in person or through a written proxy, is entitled to attend and address the meeting and, to the extent
that the voting rights accrue to him or her, to exercise his or her voting rights in accordance with our Articles. The voting rights attached to any shares, or shares for which depositary receipts have been issued, are suspended as long as they are
held in treasury.
At the Annual General Meeting the following items are discussed and/or approved as a minimum:
| ∎ |
|
the adoption of the annual accounts; |
| ∎ |
|
the appointment of the auditor to audit the annual accounts; |
| ∎ |
|
discharge of the Directors from certain liabilities; |
| ∎ |
|
the appointment of Directors; and |
| ∎ |
|
the allocation of profits. |
The Board of Directors requires the
approval of the General Meeting for resolutions of the Board that entail a significant change in the identity or character of the Company or the business connected with it, which significant changes in any case include:
| ∎ |
|
the transfer of (nearly) the entire business of the Company to a third party; |
| ∎ |
|
the entering into or termination of a long-term co-operation of the Company or one of its subsidiaries with another legal entity or company or as fully
liable partner in a limited or general partnership, if this co-operation or termination is of major significance for the Company; and |
| ∎ |
|
the acquisition or disposal by the Company or by one of its subsidiaries of participating interests in the capital of a company representing at least
one-third of the sum of the assets of the Company as shown on its balance sheet according to the last adopted annual accounts of the Company. |
Shareholders holding at least 3% of our issued share capital may submit agenda proposals for the General Meeting, provided we receive such proposals
no later than 60 days before the date of the General Meeting.
24 / www.interxion.com
|
|
|
|
|
|
|
REPORT OF THE BOARD OF DIRECTORS |
Pursuant to the provisions in our Articles of Association, the General Meeting may only on a proposal
of the Board resolve to amend the Company’s Articles of Association, change the Company’s corporate form, enter into a Dutch statutory (de) merger or dissolve and liquidate the Company. In addition, these decisions require a resolution
passed with a two-thirds majority of the votes cast representing at least one-half of the Company’s issued share capital.
Anti-takeover measures
The Company has no anti-takeover measures in place. Although we do not envisage adopting any specific anti-takeover measures, the Board of
Directors, pursuant to the Articles of Association as adopted at the General Meeting on January 26, 2011 and as amended at the General Meeting on January 20, 2012, was designated for a period of five years, which terminated on
January 28, 2016, as the corporate body of the Company authorized to issue shares and grant rights to subscribe for shares up to the amount of our authorized share capital with the power to limit or exclude the rights of pre-emption thereto. On June 29, 2018, the General Meeting designated the Board of Directors for a period of 18 months, which will terminate on December 28, 2019, as the corporate body of the Company
authorized to issue shares or grant rights to subscribe for shares, up to 10% of the issued share capital of the Company as it stands at the date of the resolution, without pre-emptive rights accruing to our
shareholders.
Issue of shares
The General Meeting is authorized to decide on the issue of new shares or to designate another body of the Company to issue shares for a fixed period of a maximum of five years. On such designation, the number of shares that may be
issued must be specified. The designation may be extended for a period not exceeding five years. A resolution of the General Meeting to issue shares or to designate another body of the Company as the competent body to issue shares can only be
adopted at the proposal of the Board. Shareholders have a right of pre-emption in case of the issuance of shares, unless shares are issued against payment in kind or shares are issued to employees pursuant to
a plan applicable to such employees.
On June 29, 2018, the General Meeting designated the Board of Directors for a period of 18
months, which terminated on December 28, 2019, as the corporate body of the Company authorized to, (i) issue shares or grant rights to subscribe for up to 2,441,601 shares without pre-emption rights
accruing to the shareholders for the purpose of the Company’s employee incentive schemes, and in addition to (ii) issue shares or grant rights to subscribe for shares, up to 10% of the issued share capital of the Company as it stands at
the date of the resolution, for general corporate purposes without pre-emption rights accruing to the shareholders.
Acquisition by the Company of shares in its issued capital
The Company may acquire shares in its issued capital only if all the following requirements are met:
| 1. |
the distributable equity of the Company must be at least equal to the purchase price; |
| 2. |
the aggregate nominal value of the shares already held by the Company and its subsidiaries and of the shares held
in pledge by the Company does not exceed one-half of the Company’s issued capital; and |
| 3. |
at the General Meeting, the Board has been authorized thereto. Such authorization shall be valid for not more than
18 months and the General Meeting must specify in the authorization the number of shares which may be acquired, the manner in which they may be acquired and the limits within which the price must be set. This authorization is not required insofar as
shares in the Company’s issued share capital are acquired in order to transfer them to employees of the Company or of its subsidiaries as referred to in section 2:24b of the Dutch Civil Code pursuant to a plan applicable to such employees.
|
Compensation
Process
In compliance
with Dutch law, the General Meeting has adopted a directors’ compensation policy for the Board of Directors. The compensation of our Non-executive Directors shall be determined at the General Meeting
based on proposal of the Board. The Executive Director’s compensation shall be determined by the Board, which determination shall be on the basis of recommendations made by the Board’s Compensation Committee. This, in turn, is based on
consultation with our independent compensation advisor Mercer and market data within the Company’s peer group (as defined below) and performance against predetermined targets.
Policy goal
The goal of
the Company’s compensation policy is to provide remuneration to its Directors in a form that will attract, retain and motivate qualified industry professionals in an international, fast growing and highly competitive labor market, and to align
the compensation of the Directors with the short- and long-term elements of the tasks of the Directors as well as with interests of the stakeholders of the Company. The compensation of our Directors will be reviewed regularly.
www.interxion.com / 25
|
|
|
|
|
| REPORT OF THE BOARD OF DIRECTORS |
|
|
Compensation
Non-executive Director Compensation
The annual compensation to our Non-executive Directors for the year ended December 31, 2018 was €40,000. In addition, the Chairman of the Board received €50,000 gross per annum. Each Non-executive Director who was member of the Company’s Audit Committee received an additional €20,000 gross per annum, and the Chairman of
the Company’s Audit Committee received a further €10,000 gross per annum. Each Non-executive Director who was a member of the
Company’s Compensation Committee received an additional €5,000 gross per annum, and the Chairman of the Company’s Compensation Committee received a further €5,000 gross per annum. No other cash incentives were paid to our Non-executive Directors. An overview of the annual compensation of our Non-executive Directors is disclosed in note 26.
In 2016, each of our
Non-executive Directors was awarded 1,234 restricted shares equivalent to a value of €40,000. The number of restricted shares was set on
the basis of the Company’s share price at the closing of the New York Stock Exchange on the day of the 2016 Annual General Meeting. For each Non-executive Director who served for the entire period from
the day of the 2016 General Meeting to the day of the 2017 General Meeting these restricted shares vested at the General Meeting held at June 30, 2017. All these restricted shares will be locked up for a period ending three years after the date
of award (with the exception of a cash settlement to cover taxes due) or the date the Non-executive Director ceases to be a director of the Company, whichever is sooner.
In 2017, each of our Non-executive Directors was awarded 996 restricted shares equivalent to a value of €40,000. The number of restricted shares was set on the basis of the Company’s share price at the closing of the New York Stock Exchange on the day of the 2017 Annual General
Meeting. For each Non-executive Director these restricted shares will vest on the day of the 2018 Annual General Meeting, subject to such Non-executive Director having
served the entire period. All these restricted shares will be locked-up for a period ending three years after the date of award (with the exception of a cash settlement to cover taxes due), or the date the Non-executive Director ceases to be a director of the Company, whichever is sooner.
In 2018, each of
our Non-executive Directors was awarded 746 restricted shares equivalent to a value of €40,000. The number of restricted shares was set on
the basis of the Company’s share price at the closing of the New York Stock Exchange on the day of the 2018 Annual General Meeting. For each Non-executive Director these restricted shares will vest on the
day of the 2019 Annual General Meeting, subject to such Non-executive Director having served the entire period. All these restricted shares will be locked-up for a
period ending three years after the date of award (with the exception of a cash settlement to cover taxes due), or the date the Non-executive Director ceases to be a director of the Company, whichever is
sooner.
The Company does not contribute to any pension scheme for its Directors. None of the Non-executive Directors is entitled to any contractually agreed benefit on termination.
The Dutch
Corporate Governance Code requires Dutch companies to disclose the internal pay ratio between Executive Directors and other employees. Such pay ratios are specific to a company’s industry, geographical footprint and organizational model, and
can be volatile over time due to exchange rate movements and the company’s annual performance and stock performance.
The 2018 the
pay ratio between our Executive Director and other Interxion employees was 49.6:1 (2017: 29.7:1). The pay ratio has been calculated by dividing our Executive Director’s 2018 total remuneration by the 2018 company-wide average total remuneration
paid per Interxion employee. Total remuneration includes salaries, bonuses, equity compensation (defined as the value of equity awards on vesting date) and contributions to defined contribution pension plans, as derived from note 8 in the
Consolidated Financial Statements, included elsewhere in this Annual Report. Furthermore, the total remuneration includes sales commissions, as captured in sales and marketing expenses. The company-wide average total remuneration per Interxion
employee has been calculated based on an average of 719 full time equivalents employed in 2018, being 720 minus the Executive Director (2017: 637 full time equivalents employed, being 638 minus the Executive Director).
Further details of the compensation of our Executive Director are disclosed as part of Note 26 to this document.
Shares beneficially owned
In the table below, beneficial ownership includes any shares over which a person exercises sole voting and/or investment power. Shares subject to options and/or restricted shares exercisable, as at December 31, 2018, are deemed
outstanding and have therefore been included in the number of shares beneficially owned.
|
|
|
| Directors |
|
Shares beneficially owned as
at December 31, 2018 |
| David
Ruberg |
|
997,000 |
| Jean F.H.P.
Mandeville |
|
11,318 |
| Frank
Esser |
|
4,845 |
| Mark
Heraghty |
|
4,845 |
| David
Lister |
|
— |
| Rob
Ruijter |
|
4,845 |
Risk management
Risk management approach
The Board has the ultimate responsibility for the risk management and internal control structure. Local subsidiary management teams are responsible
for implementing the strategy, achieving results, identifying underlying opportunities
26 / www.interxion.com
|
|
|
|
|
|
|
REPORT OF THE BOARD OF DIRECTORS |
and risks, and ensuring effective operations. They have to act in accordance with the policy and
standards set by the Board, in which they are supported by the corporate departments. Compliance to standards and policies is discussed regularly between subsidiary management and representatives of the Board and is subject to review by corporate
departments.
Risk management and the internal control structure
The aim of our risk management and internal control structure is to find the right balance between an effective, professional enterprise and the
risk profile that we are aiming for as a business. Our risk management and internal controls, based on the Committee of Sponsoring Organizations (COSO) of the Treadway Commission Enterprise Risk Management Framework (2013), make a significant
contribution to the prompt identification and adequate management of strategic and market risks. They also support us in achieving our operational and financial targets and in complying with the applicable laws and regulations. The risk management
and internal control structure have been designed to meet the Sarbanes-Oxley 404 requirements, as mandatory under SEC listing requirements.
This report provides sufficient insights into any failures in the effectiveness of the internal risk management and control systems. Based on the current state of affairs, it is justified that the financial reporting is prepared on
a going concern basis. The report states those material risks and uncertainties that are relevant to the expectation of the Company’s continuity for the period of twelve months after the preparation of the report. In addition, the Board is of
the view that the aforementioned risk management and internal control systems provide reasonable assurances that the financial reporting does not contain any material inaccuracies.
Internal audit function
In 2018, an internal audit function was not in place.
Financial instruments
For the Company’s risk management procedures related to financial instruments we refer to the Group’s accounting policies and note 20 of
the financial statements, as included in this annual report.
Code of Conduct
Our Code of Conduct and Business Ethics is a reflection of our commitment to act as a responsible social partner and of the way we try to interact
with all our stakeholders.
All transactions, in which there are conflicts of interest with one or more Directors, shall be agreed on
terms that are customary in the sector concerned. Such transactions must be published in the annual report, together with a statement of the conflict of interest and a declaration that the relevant best practice provisions of the Dutch Corporate
Governance Code have been complied with. A director may not take part in any discussion or decision making with regard to topics where such director is conflicted.
Risk factors
Risks related to our business
| ∎ |
|
We cannot easily reduce our operating expenses in the short term, which could have a material adverse effect on our business in the event of a slowdown in demand for our services or a decrease in
revenue for any reason. |
| ∎ |
|
Our inability to utilize the capacity of newly planned or acquired data centers and data center expansions in line with our business plan would have a material adverse effect on our business,
financial condition and results of operations. |
| ∎ |
|
If we are unable to expand our existing data centers or locate and secure suitable sites for additional data centers on commercially acceptable terms, our ability to grow our business may be
limited. |
| ∎ |
|
Failure to renew or maintain real estate leases for our existing data centers on commercially acceptable terms, or at all, could harm our business. |
| ∎ |
|
Our leases may obligate us to make payments beyond our use of the property. |
| ∎ |
|
We may experience unforeseen delays and expenses when fitting out and upgrading data centers, and the costs could be greater than anticipated. |
| ∎ |
|
We may incur non-cash impairment charges to our assets, in particular to our property, plant and equipment, which could result in a reduction in our
earnings. |
| ∎ |
|
We face significant competition and we may not be able to compete successfully against current and future competitors. |
| ∎ |
|
Our services may have a long sales cycle that may materially adversely affect our business, financial condition and results of operations. |
| ∎ |
|
Our business is dependent on the adequate supply of electrical power and could be harmed by prolonged electrical power outages or increases in the cost of power. |
| ∎ |
|
A general lack of electrical power resources sufficient to meet our customers’ demands may impair our ability to utilize fully the available space at our existing data centers or our plans to
open new data centers. |
| ∎ |
|
A significant percentage of our Monthly Recurring Revenue is generated by contracts with terms of one year or less remaining. If those contracts are not renewed, or if their pricing terms are
negotiated downwards, our business, financial condition and results of operations would be materially adversely affected. |
| ∎ |
|
Our inability to use all or part of our net deferred tax assets could cause us to pay taxes at an earlier date and in greater amounts than expected.
|
www.interxion.com / 27
|
|
|
|
|
| REPORT OF THE BOARD OF DIRECTORS |
|
|
| ∎ |
|
Our operating results have fluctuated in the past and may fluctuate in the future, which may make it difficult to evaluate our business and prospects. |
| ∎ |
|
We are dependent on third-party suppliers for equipment, technology and other services. |
| ∎ |
|
We depend on the ongoing service of our personnel and executive committee and may not be able to attract, train and retain a sufficient number of qualified personnel to maintain and grow our
business. |
| ∎ |
|
Disruptions to our physical infrastructure could lead to significant costs, reduce our revenues, and harm our business reputation and financial results. |
| ∎ |
|
Our insurance may not be adequate to cover all losses. |
| ∎ |
|
Our failure to meet the performance standards under our service level agreements may subject us to liability to our customers, which could have a material adverse effect on our reputation,
business, financial condition or results of operations. |
| ∎ |
|
We could be subject to costs, as well as claims, litigation or other potential liability, in connection with risks associated with the security of our data centers and our Information technology
systems. We may also be subject to information technology systems failures, network disruptions and breaches of data security, which could have an adverse effect on our reputation and a material adverse impact on our business.
|
| ∎ |
|
We face risks relating to foreign currency exchange rate fluctuations. |
| ∎ |
|
The lingering effects of the European debt crisis or any future slowdown in global economies may have an impact on our business and financial condition in ways that we cannot currently predict.
|
| ∎ |
|
Political uncertainty may impact economic conditions which could adversely affect our liquidity and financial condition. |
| ∎ |
|
The United Kingdom invoking the process to withdraw from the European Union could have a negative effect on global economic conditions, financial markets and our business, which could adversely
affect our results of operations. |
| ∎ |
|
Acquisitions, business combinations and other transactions present many risks, and we may not realize the financial or strategic goals that were contemplated at the time of any transaction, and
such transactions may alter our financial or strategic goals. |
| ∎ |
|
We focus on the development of Communities of Interest within customer segments and the attraction of magnetic customers. Our failure to attract, grow and retain these Communities of Interest could
harm our business and operating results. |
| ∎ |
|
Consolidation may have a negative impact on our business model. |
| ∎ |
|
Our operations are highly dependent on the proper functioning of our information technology systems. We routinely upgrade our information technology systems. The failure or unavailability of such
systems during or after an upgrade process could result in the loss of existing or potential customers and harm our reputation, business and operating results. |
| ∎ |
|
Substantial indebtedness could adversely affect our financial condition and our ability to operate our business, and we may not be able to generate sufficient cash flows to meet our debt service
obligations. |
| ∎ |
|
We require a significant amount of cash to service our debt, which may limit available cash to fund working capital and capital expenditure. Our ability to generate sufficient cash depends on many
factors beyond our control. |
| ∎ |
|
We may need to refinance our outstanding debt. |
| ∎ |
|
We are subject to restrictive debt covenants, which limit our operating flexibility. |
Risks related to our industry
| ∎ |
|
The European data center industry has suffered from over-capacity in the past, and a substantial increase in the supply of new data center capacity and/or a general decrease in demand for data
center services could have an adverse impact on industry pricing and profit margins. |
| ∎ |
|
If we do not keep pace with technological changes, evolving industry standards and customer requirements, our competitive position will suffer. |
| ∎ |
|
Terrorist activity throughout the world, and military action to counter terrorism, could have an adverse impact on our business. |
| ∎ |
|
Our carrier-neutral business model depends on the presence of numerous telecommunications carrier networks in our data centers. |
| ∎ |
|
We may be subject to reputational damage and legal action, in connection with information disseminated by our customers. |
Risks related to regulation
| ∎ |
|
Laws and government regulations that govern Internet-related services, related communication services and information technology and electronic commerce across the European countries in which we
operate, continue to evolve and, depending on the evolution of such regulations, may adversely affect our business. |
| ∎ |
|
We, and the industry in which we operate, are subject to environmental, and health and safety laws and regulations, and may be subject to more stringent efficiency, environmental, and health and
safety laws and regulations in the future, including in respect of energy consumption and greenhouse gas emissions.
|
28 / www.interxion.com
|
|
|
|
|
|
|
REPORT OF THE BOARD OF DIRECTORS |
| ∎ |
|
Changes in Dutch or foreign tax laws and regulations, or interpretations thereof may adversely affect our financial position. |
| ∎ |
|
Laws and government regulations governing the licences or permits we need across the European countries in which we operate may change, which could adversely affect our business.
|
Risks related to our ordinary shares
| ∎ |
|
The market price for our shares may continue to be volatile. |
| ∎ |
|
A substantial portion of our total outstanding shares may be sold into the market at any time. Such future sales or issuances, or perceived future sales or issues, could adversely affect the price
of our shares. |
| ∎ |
|
You may not be able to exercise pre-emptive rights. |
| ∎ |
|
We may need additional capital and may sell additional ordinary shares or other equity securities, or incur indebtedness, which could result in additional dilution to our shareholders or increase
our debt service obligations. |
| ∎ |
|
We have never paid, do not currently intend to pay, and may not be able to pay any dividends on our ordinary shares. |
| ∎ |
|
Your rights and responsibilities as a shareholder will be governed by Dutch law and will differ in some respects from the rights and responsibilities of shareholders under U.S. law, and your
shareholder rights under Dutch law may not be as clearly established as shareholder rights are established under the laws of some U.S. jurisdictions. |
| ∎ |
|
We are a foreign private issuer and, as a result, and as permitted by the listing requirements of the NYSE, we may rely on certain home-country governance practices rather than the corporate
governance requirements of the NYSE. |
| ∎ |
|
You may be unable to enforce judgements obtained in US courts against us. |
| ∎ |
|
We incur increased costs as a result of being a public company. |
| ∎ |
|
Any failure or weakness in our internal controls could materially and adversely affect our financial condition, results of operation and our stock price. |
Controls and procedures
Disclosure controls and procedures
Under the supervision and with the participation of the Chief Executive Officer
(CEO) and Chief Financial Officer (CFO), the effectiveness of the Company’s disclosure controls and procedures (as defined in Rules 13a-15(e) and 15d-15(e) under
the Securities Exchange Act of 1934, as amended (the “Exchange Act”)), has been evaluated as of December 31, 2018. Based on their evaluation of the Company’s disclosure controls and procedures, our CEO and CFO identified a
material weakness in our internal control over financial reporting (as further described below), and
further concluded that our disclosure controls and procedures were not effective as of December 31, 2018.
Management’s annual report on internal control over financial reporting
Management is responsible for establishing and maintaining adequate internal control over financial reporting (as defined in Rules 13a-15(f) and 15d-15(f) under the Exchange Act), and for the assessment of the effectiveness of internal control over financial reporting. Internal control over financial
reporting includes maintaining records that, in reasonable detail, accurately and fairly reflect our transactions; providing reasonable assurance that transactions are recorded as necessary for preparation of our financial statements; providing
reasonable assurance that receipts and expenditure of Company assets are made in accordance with management authorization; and providing reasonable assurance that unauthorized acquisition, use or disposition of Company assets that could have a
material effect on our financial statements would be prevented or detected on a timely basis. The Company’s internal control over financial reporting is a process designed to provide reasonable, but not absolute, assurance regarding the
reliability of financial reporting and the preparation of the consolidated financial statements in accordance with generally accepted accounting principles. Due to its inherent limitations, however, internal control over financial reporting may not
prevent or detect misstatements.
In connection with the preparation of the Company’s annual consolidated financial statements,
management has undertaken an assessment of the effectiveness of the Company’s internal control over financial reporting as of December 31, 2018, based on criteria established in the “Internal-Control Integrated Framework (2013)”,
established by the Committee of Sponsoring Organizations of the Treadway Commission (the COSO Framework).
Management identified a
material weakness relating to insufficient coverage of Assurance Reports on Controls at a Service Organization or Service Organization Controls (“SOC”) reports from a service provider which operates a platform for processing payments and
which we use to pay the majority of our operating and capital expenses (the “Payments Vendor”). By using the Payments Vendor’s service, we are required to obtain its SOC reports for the assurance of effectiveness of internal control
over their platform system and/or obtain alternative evidence to conclude on the effectiveness of internal control over their platform systems. Despite our requests, we were unable to obtain SOC reports from the Payments Vendor or obtain alternative
evidence to conclude on the effectiveness of internal control over their platform system for the year ended December 31, 2018 and therefore, we did not receive sufficient evidence of the operating effectiveness of the relevant internal controls
at the Payments Vendor prior to submission of the annual report on Form 20-F. Although, we performed additional testing subsequent
www.interxion.com / 29
|
|
|
|
|
| REPORT OF THE BOARD OF DIRECTORS |
|
|
to year end, including enquiring whether our vendors and other payees received payments, such testing
was performed after the year ended December 31, 2018 and therefore such testing was not performed in a timely manner. Based on our communication with the Payments Vendor, our extensive testing subsequent to the year ended December 31, 2018
and the amount of time that elapsed since December 31, 2018, we are unaware that any of our vendors and payees have not received the correct payments through the Payments Vendor and thus our financial results, financial position and cash flows
as of and for the year ended December 31, 2018 have not been affected. Therefore, management does not believe that the material weakness described above has caused our financial statements as of and for the year ended December 31, 2018 to
contain a material misstatement.
Based on this assessment, management identified a deficiency in the internal control over financial
reporting that constitutes a material weakness, and therefore concluded that our internal control over financial reporting was not effective as of December 31, 2018. A material weakness is a deficiency, or a combination of deficiencies, in
internal control over financial reporting, such that there is a reasonable possibility that a material misstatement of the annual or interim financial statements will not be prevented or detected on a timely basis.
Remediation efforts to address material weakness identified as of December 31, 2018
The Company began to remediate the identified material weakness in the first quarter of 2019 once we were made aware that the SOC reports would not
be available prior to the submission of the annual report on Form 20-F for the year ended December 31, 2018. A series of remedial measures were performed and continue to be taken, including updating our
internal policies and assessing procedures to enhance control over services from the Payments Vendor, and monitoring over its services. The Company has also received confirmation from the Payments Vendor regarding rectification, including an
indication from the Payments Vendor that it anticipates providing the Company with SOC reports for future reporting periods that will satisfy our internal control requirements. In addition, the Company intends to enhance internal requirements and
criteria in selecting future third-party service providers
Based on discussion with the Payments Vendor, the Company anticipates
receiving the SOC reports in the second quarter of 2019, covering the period from January 1, 2019 to March 31, 2019, and will review and check for any deficiency or access control issue. We will monitor progress toward that delivery and,
if necessary, consider alternative arrangements. In addition, we are reviewing related existing internal controls to consider additional and modified controls to strengthen the control environment without regard to whether we obtain the SOC reports
from our Payments Vendor.
Remediation efforts to address material weakness identified as of December 31, 2017
The material weakness disclosed in our annual report on Form 20-F for the year ended
December 31, 2017 pertaining to a deficiency in the design of internal controls relating to the technical accounting of share-based payments has been remediated during the year ended December 31, 2018. The specific remediation actions
taken by management included:
| ∎ |
|
strengthening our existing review process for the complex area of share-based payments by adding additional independent outside specialists to both evaluate the assumptions applied in the
calculations of share-based payments and checking our resulting valuations; |
| ∎ |
|
conducting a review of the application of IFRS 2 requirements on individual share awards each quarter, as opposed to solely conducting the analysis at the time new incentive plans and/or
modifications to existing incentive plans are made and/or implemented; and; |
| ∎ |
|
strengthening our existing control procedures relating to changes in existing share award plans and the forfeitures of share awards by designing and implementing additional controls.
|
Changes in internal control over financial reporting
Except for the remediation efforts described above in respect of the material weakness identified with respect to the year ended December 31,
2017, there were no other changes that occurred during the period covered by this report that have materially affected, or are reasonably likely to materially affect, our internal control over financial reporting.
Dutch Corporate
Governance Code
In addition to the “Structure” section of this report on page 21, a further description of
our corporate governance is below.
Since our initial public offering on January 28, 2011, we have been required to comply with the
Dutch Corporate Governance Code, that applies to all companies with a registered office in the Netherlands whose shares or depositary receipts for shares are admitted for trading on a regulated market or a comparable system, such as the New York
Stock Exchange (NYSE) which is the listing venue of the Company. The current Dutch Corporate Governance Code is dated December 8, 2016 and replaces the former 2008 Code. Because the Company is listed on the NYSE it is also required to comply
with the US Sarbanes-Oxley Act of 2002, as well as with NYSE listing rules, and the rules and regulations promulgated by the US Securities and Exchange Commission (SEC).
30 / www.interxion.com
|
|
|
|
|
|
|
REPORT OF THE BOARD OF DIRECTORS |
The full text of the Dutch Corporate Governance Code can be found at the website of the Monitoring
Commission Corporate Governance Code (www.commissiecorporategovernance.nl).
The Code is based on a “comply or explain”
principle. Material changes in the corporate governance structure of the Company, and in its compliance with the Code, will be discussed at the Annual General Meeting as a separate agenda item. The discussion below summarizes the deviations from the
best practice provisions of the Code.
| ∎ |
|
Best practice provision 2.1.1 states that a profile for the Non-executive Directors should be prepared, which profile should be posted on the Company’s
website. The Company continues to review this matter and the process towards preparing such profile and aims to adopt this and post it on its website in due course. |
| ∎ |
|
Best practice provision 2.2.2 states that a supervisory board member is appointed for a period of four years and may then be reappointed once for another four-year period. The supervisory board
member may then subsequently be reappointed again for a period of two years, which appointment may be extended by at most two years. In the event of a reappointment after an eight-year period, reasons should be given in the report of the supervisory
board. The provisions of the Code relating to supervisory board members apply mutatis mutandis to Non-executive Directors. The Board contemplates to nominate Mr. Mandeville for reappointment at the 2019
Annual General Meeting. Mr. Mandeville was first appointed as member of the Board as per 28 January 2011 and an extension of his term would result in a deviation from this best practice provision. For the reasons mentioned hereafter, the
Company feels this deviation is in the best interest of the Company and its stakeholders. Secondly, the Company is part of a relatively new and fast-growing industry that is rapidly evolving and developing. This rapid development of the Company and
the industry means that it is critical for the Company to ensure it has the right industry expertise in its Board required to guide the Company, as this is a stabilizing factor for the Company and its management. The pool of persons with this
expertise and talent is limited. Mr. Mandeville in his capacity as Chairman of the Company plays a pivotal role in enabling the Company to continue to grow and is able to perform this role due to his financial and industry expertise. The
Company and Company’s management greatly benefits from his knowledge and support. The Company will again have to assess whether it deems deviation from best practice provision 2.2.2 necessary by the end of Mr. Mandeville’s upcoming 3-year term. |
| ∎ |
|
Best practice provision 2.2.4 states that the Company has a sound plan in place for the succession of the Board that is aimed at retaining the balance in the requisite expertise, experience and
diversity. The Company acknowledges this provision and continues to work on such plan.
|
| ∎ |
|
Best practice provision 3.1.2 (vi) states that shares granted without financial consideration shall be retained for a period of five years or the end of employment if this period is shorter. The
Company is operating long-term incentive plans whereby the beneficiary of the shares can currently, (i; in case of shares awarded to our Executive Director) start trading 50% of the shares after the third anniversary following the Annual General
Meeting approving the award and 50% after the fourth anniversary, or (ii; in case of shares awarded to Non-executive Directors) trade all shares after the third anniversary. The Company considers these
timeframes to be in line with international industry practice and to align the interests of its Directors with the interests of its shareholders. |
| ∎ |
|
Best practice provision 3.3.2 states that a Non-executive Director may not be granted any shares and/or rights to shares by way of remuneration. The Company
has granted shares to all, and options to some, of its Non-executive Directors as it believes this is a valuable instrument to align the interests of the Non-executive
Directors concerned with those of the Company. |
| ∎ |
|
Best practice provision 4.3.3 states that the General Meeting may pass a resolution to cancel the binding nature of a nomination for the appointment of an Executive Director or a Non-executive Director, by an absolute majority, which may have to represent at most one-third of the issued capital. To cancel the binding nature of such a nomination, the
Company’s Articles require a two-thirds majority representing more than 50% of the issued capital. |
Management is responsible for establishing and maintaining adequate internal control over financial reporting and for the assessment of the effectiveness of internal control over financial reporting. For management’s internal
control statement, we refer to “Management’s annual report on internal control over financial reporting” on page 29.
Outlook for 2019
For 2019, we expect revenue to be between
€632 and €647 million, Adjusted EBITDA to range between €324 and €334 million and Capital expenditure (including intangibles) to range between €570 and €600 million. We expect to have sufficient access to capital to fund such capital expenditure. In
2018, the Company employed an average of 720 full-time equivalent employees. We expect this number to increase in 2019, in line with new data center capacity becoming available.
The Board of Directors
Hoofddorp, The Netherlands,
May 27, 2019
www.interxion.com / 31

32 / www.interxion.com
|
|
|
|
|
|
|
REPORT OF THE NONE EXECUTIVE DIRECTORS |
On an ongoing basis the
Board reviews and discusses the Company’s strategy and developments impacting the strategy. The Board is informed regularly by the Executive Director and the Executive Committee about the implementation of the strategy and the results thereof.
When deemed necessary Non-executive Directors can discuss any issues amongst themselves.
For
the bios of the Non-executive Directors reference is made to the Report of the Board of Directors.
Evaluation
During 2018 the Board, its committees and its members have worked effectively and efficiently supporting the Company in its rapid development and
growth as evidenced in this annual report.
Independence Non-executive
Directors
In the opinion of the Non-executive Directors, the independence requirements referred
to in best practice provisions 2.1.7 to 2.1.9 of the Dutch Corporate Governance Code inclusive have been fulfilled, as each Non-executive Director is considered to be independent.
Internal control function
The Company’s internal risk management and control systems are designed to mitigate risks on material misstatements. The internal control function is performed by the Company with support of a specialised consultancy firm. The
Board evaluates the effectiveness of the internal control framework on an ongoing basis.
Board committees
The Board has established an audit committee, a compensation committee and a nominating committee. Each committee evaluates its performance annually
to determine whether it is functioning effectively.
Audit Committee
Our Audit Committee consists of three independent Directors, Rob Ruijter (Chair), Frank Esser and Mark Heraghty. The Audit Committee is independent
as defined under and required by rule 10A-3 under the U.S. Securities Exchange Act of 1934, as amended (“rule 10A-3”) and the NYSE Manual. The Audit Committee
is responsible for the appointment (subject to Board and shareholders’ approval) of independent registered public accounting firm KPMG Accountants N.V. as our statutory auditors, for its compensation and retention, and for oversight of its
work. In addition, the Audit Committee’s approval is required before we enter into any related-party transaction. It is also responsible for “whistleblowing” procedures, certain other compliance matters, and the evaluation of the
Company’s policies with respect to risk assessment and risk management. The Audit Committee met six times during 2018, during these meetings all committee members were present. Most of its time was dedicated to reviewing, with management and
with the independent auditor, the unaudited quarterly interim reports and the audited annual Dutch statutory financial statements as well
as the Annual Report on Form 20-F. This included reviewing
the effectiveness of the internal controls and of the Company’s disclosure controls and procedures (as defined in rules 13a-15(e) and 15d-15(e) under the Securities
Exchange Act of 1934) and overseeing the Company’s compliance with its legal and regulatory requirements.
Compensation
Committee
Our Compensation Committee consists of four independent Directors, Mark Heraghty (Chair), Rob Ruijter, Frank Esser and David
Lister. Among other things, the Compensation Committee reviews, and makes recommendations to the Board regarding the compensation and benefits of our CEO and the Board. The committee also administers the issue of shares and stock options and other
awards under our equity incentive plan and evaluates and reviews policies relating to the compensation and benefits of our employees and consultants. The Compensation Committee met two times during 2018, with a focus on approving the 2017 Senior
Management bonus pay-out, reviewing the long-term compensation philosophy of the Company, and reviewing and approving the Company’s share and option grants and reviewing Senior Management’s
short-term and long-term compensation. During these meeting all committee members were present.
Nominating Committee
Our Nominating Committee consists of four independent Directors, Frank Esser (Chair), Jean Mandeville, Mark Heraghty and David Lister.
The Nominating Committee is responsible for, among other things, developing and recommending our corporate governance guidelines to our Board, identifying individuals qualified to become Directors, overseeing the evaluation of the performance of the
Board, selecting the Director nominees for the next Annual General Meeting, and selecting Director candidates to fill any vacancies on the Board. As the members of our Nominating Committee discussed matters under the responsibility of the Nominating
Committee, including the nomination of Non-executive directors, at multiple occasions during the year, the Nominating Committee choose not to have an in person meeting during 2018 to formalize their decision
on the nomination of the Non-executive Directors, but to take this decision in writing.
The Non-executive Directors
Hoofddorp, The Netherlands,
May 27, 2019
www.interxion.com / 33

34 / www.interxion.com
|
|
|
|
|
|
|
CONSOLIDATED FINANCIAL STATEMENTS |
Consolidated income statements
|
|
|
|
|
|
|
|
|
|
|
|
|
|
|
|
|
|
|
|
|
| |
|
|
|
|
|
|
|
For the year ended December 31, |
|
| |
|
Note |
|
|
|
|
|
2018 |
|
|
2017
(€’000) |
|
|
2016 |
|
| Revenues |
|
|
5,6 |
|
|
|
|
|
|
|
561,752 |
|
|
|
489,302 |
|
|
|
421,788 |
|
| Cost of sales |
|
|
5,8 |
|
|
|
|
|
|
|
(219,462 |
) |
|
|
(190,471 |
) |
|
|
(162,568 |
) |
| Gross profit |
|
|
|
|
|
|
|
|
|
|
342,290 |
|
|
|
298,831 |
|
|
|
259,220 |
|
| Other income |
|
|
5 |
|
|
|
|
|
|
|
86 |
|
|
|
97 |
|
|
|
333 |
|
| Sales and marketing costs |
|
|
5,8 |
|
|
|
|
|
|
|
(36,494 |
) |
|
|
(33,465 |
) |
|
|
(29,941 |
) |
| General and administrative
costs |
|
|
5,7,8 |
|
|
|
|
|
|
|
(194,646 |
) |
|
|
(167,190 |
) |
|
|
(138,557 |
) |
| Operating income |
|
|
5 |
|
|
|
|
|
|
|
111,236 |
|
|
|
98,273 |
|
|
|
91,055 |
|
| Finance income |
|
|
9 |
|
|
|
|
|
|
|
4,094 |
|
|
|
1,411 |
|
|
|
1,206 |
|
| Finance expense |
|
|
9 |
|
|
|
|
|
|
|
(65,878 |
) |
|
|
(45,778 |
) |
|
|
(37,475 |
) |
| Profit before taxation |
|
|
|
|
|
|
|
|
|
|
49,452 |
|
|
|
53,906 |
|
|
|
54,786 |
|
| Income tax expense |
|
|
10 |
|
|
|
|
|
|
|
(18,334 |
) |
|
|
(14,839 |
) |
|
|
(16,450 |
) |
| Net income |
|
|
|
|
|
|
|
|
|
|
31,118 |
|
|
|
39,067 |
|
|
|
38,336 |
|
| Earnings per share attributable to
shareholders: |
|
|
|
|
|
|
|
|
|
|
|
|
|
|
|
|
|
|
|
|
| Basic earnings per share: (€) |
|
|
17 |
|
|
|
|
|
|
|
0.43 |
|
|
|
0.55 |
|
|
|
0.54 |
|
| Diluted earnings per share: (€) |
|
|
17 |
|
|
|
|
|
|
|
0.43 |
|
|
|
0.55 |
|
|
|
0.54 |
|
|
|
|
|
|
|
| Consolidated statements of comprehensive income |
|
|
|
|
|
|
|
|
|
|
|
|
|
|
|
|
|
|
|
| |
|
|
|
|
|
|
|
For the year ended December 31, |
|
| |
|
|
|
|
|
|
|
2018 |
|
|
2017(i)
(€’000) |
|
|
2016(i) |
|
| Net income |
|
|
|
|
|
|
|
|
|
|
31,118 |
|
|
|
39,067 |
|
|
|
38,336 |
|
| Other comprehensive income |
|
|
|
|
|
|
|
|
|
|
|
|
|
|
|
|
|
|
|
|
| Items that are, or may be, reclassified subsequently to profit
or loss |
|
|
|
|
|
|
|
|
|
|
|
|
|
|
|
|
|
|
|
|
| Foreign currency translation differences |
|
|
|
|
|
|
|
|
|
|
(1,067 |
) |
|
|
(7,029 |
) |
|
|
(11,613 |
) |
| Initial recognition of pension provision1 |
|
|
|
|
|
|
|
|
|
|
(909 |
) |
|
|
— |
|
|
|
— |
|
| Effective portion of changes in fair value of cash flow
hedge |
|
|
|
|
|
|
|
|
|
|
7 |
|
|
|
110 |
|
|
|
(45 |
) |
| Tax on items that are, or may be, reclassified subsequently to profit
or loss |
|
|
|
|
|
|
|
|
|
|
|
|
|
|
|
|
|
|
|
|
| Foreign currency translation differences |
|
|
|
|
|
|
|
|
|
|
428 |
|
|
|
205 |
|
|
|
1,836 |
|
| Initial recognition of pension provision1 |
|
|
|
|
|
|
|
|
|
|
179 |
|
|
|
— |
|
|
|
— |
|
| Effective portion of changes in fair value of cash flow
hedge |
|
|
|
|
|
|
|
|
|
|
(3 |
) |
|
|
(36 |
) |
|
|
15 |
|
| Other comprehensive income/(loss), net of tax |
|
|
|
|
|
|
|
|
|
|
(1,365 |
) |
|
|
(6,750 |
) |
|
|
(9,807 |
) |
| Total comprehensive income attributable to
shareholders |
|
|
|
|
|
|
|
|
|
|
29,753 |
|
|
|
32,317 |
|
|
|
28,529 |
|
Note: The accompanying notes form an integral part of these consolidated financial statements.
| (i): |
Certain figures as of December 31, 2017 and 2016 have been corrected compared to those previously
reported. For further information on these corrections, see Notes 2 and 28 of these 2018 consolidated financial statements. |
| (1): |
The “Initial recognition of pension provision” relates to a pension plan that qualifies as
a defined benefit plan in accordance with IAS 19 – Employee Benefits, but was previously accounted for as a defined contribution plan for which the impact to the (interim) financial statements of previous periods and the current period is
inconsequential. As from 2018, management elected to change this by recognizing a corresponding entry in “Other comprehensive income”. |
www.interxion.com / 35
|
|
|
|
|
| CONSOLIDATED FINANCIAL STATEMENTS |
|
|
Consolidated statements of financial position
|
|
|
|
|
|
|
|
|
|
|
|
|
|
|
|
|
|
|
|
|
| |
|
|
|
|
As at
December 31, |
|
| |
|
Note |
|
|
|
|
|
2018 |
|
|
2017(i)
(€’000) |
|
|
2016(i) |
|
| Non-current
assets |
|
|
|
|
|
|
|
|
|
|
|
|
|
|
|
|
|
|
|
|
| Property, plant and equipment |
|
|
11 |
|
|
|
|
|
|
|
1,721,064 |
|
|
|
1,342,471 |
|
|
|
1,156,031 |
|
| Intangible assets |
|
|
12 |
|
|
|
|
|
|
|
64,331 |
|
|
|
60,593 |
|
|
|
28,694 |
|
| Goodwill |
|
|
12 |
|
|
|
|
|
|
|
38,900 |
|
|
|
38,900 |
|
|
|
– |
|
| Deferred tax assets |
|
|
10 |
|
|
|
|
|
|
|
21,807 |
|
|
|
24,470 |
|
|
|
20,370 |
|
| Other investments |
|
|
13 |
|
|
|
|
|
|
|
7,906 |
|
|
|
3,693 |
|
|
|
1,942 |
|
| Other
non-current assets |
|
|
14 |
|
|
|
|
|
|
|
16,843 |
|
|
|
13,674 |
|
|
|
11,914 |
|
| |
|
|
|
|
|
|
|
|
|
|
1,870,851 |
|
|
|
1,483,801 |
|
|
|
1,218,951 |
|
| Current assets |
|
|
|
|
|
|
|
|
|
|
|
|
|
|
|
|
|
|
|
|
| Trade and other current
assets |
|
|
14 |
|
|
|
|
|
|
|
205,613 |
|
|
|
179,786 |
|
|
|
147,821 |
|
| Cash and cash equivalents |
|
|
15 |
|
|
|
|
|
|
|
186,090 |
|
|
|
38,484 |
|
|
|
115,893 |
|
| |
|
|
|
|
|
|
|
|
|
|
391,703 |
|
|
|
218,270 |
|
|
|
263,714 |
|
| Total assets |
|
|
|
|
|
|
|
|
|
|
2,262,554 |
|
|
|
1,702,071 |
|
|
|
1,482,665 |
|
| Shareholders’ equity |
|
|
|
|
|
|
|
|
|
|
|
|
|
|
|
|
|
|
|
|
| Share capital |
|
|
16 |
|
|
|
|
|
|
|
7,170 |
|
|
|
7,141 |
|
|
|
7,060 |
|
| Share premium |
|
|
16 |
|
|
|
|
|
|
|
553,425 |
|
|
|
539,448 |
|
|
|
523,671 |
|
| Foreign currency translation
reserve |
|
|
16 |
|
|
|
|
|
|
|
3,541 |
|
|
|
4,180 |
|
|
|
11,004 |
|
| Hedging reserve, net of tax |
|
|
16 |
|
|
|
|
|
|
|
(165 |
) |
|
|
(169 |
) |
|
|
(243 |
) |
| Accumulated profit/(deficit) |
|
|
16 |
|
|
|
|
|
|
|
69,449 |
|
|
|
39,061 |
|
|
|
(6 |
) |
| |
|
|
|
|
|
|
|
|
|
|
633,420 |
|
|
|
589,661 |
|
|
|
541,486 |
|
| Non-current
liabilities |
|
|
|
|
|
|
|
|
|
|
|
|
|
|
|
|
|
|
|
|
| Borrowings |
|
|
19 |
|
|
|
|
|
|
|
1,266,813 |
|
|
|
724,052 |
|
|
|
723,975 |
|
| Deferred tax liability |
|
|
10 |
|
|
|
|
|
|
|
16,875 |
|
|
|
19,778 |
|
|
|
8,025 |
|
| Other
non-current liabilities |
|
|
18 |
|
|
|
|
|
|
|
34,054 |
|
|
|
23,671 |
|
|
|
20,570 |
|
| |
|
|
|
|
|
|
|
|
|
|
1,317,742 |
|
|
|
767,501 |
|
|
|
752,570 |
|
| Current liabilities |
|
|
|
|
|
|
|
|
|
|
|
|
|
|
|
|
|
|
|
|
| Trade payables and other
liabilities |
|
|
18 |
|
|
|
|
|
|
|
280,877 |
|
|
|
229,912 |
|
|
|
171,433 |
|
| Income tax liabilities |
|
|
|
|
|
|
|
|
|
|
7,185 |
|
|
|
6,237 |
|
|
|
5,694 |
|
| Borrowings |
|
|
19 |
|
|
|
|
|
|
|
23,330 |
|
|
|
108,760 |
|
|
|
11,482 |
|
| |
|
|
|
|
|
|
|
|
|
|
311,392 |
|
|
|
344,909 |
|
|
|
188,609 |
|
| Total liabilities |
|
|
|
|
|
|
|
|
|
|
1,629,134 |
|
|
|
1,112,410 |
|
|
|
941,179 |
|
| Total liabilities and shareholders’ equity |
|
|
|
|
|
|
|
|
|
|
2,262,554 |
|
|
|
1,702,071 |
|
|
|
1,482,665 |
|
Note: The accompanying notes form an integral part of these consolidated financial statements.
| (i): |
Certain figures as of December 31, 2017 and 2016 have been corrected compared to those
previously reported. For further information on these corrections, see Notes 2 and 28 of these 2018 consolidated financial statements. |
36 / www.interxion.com
|
|
|
|
|
|
|
CONSOLIDATED FINANCIAL STATEMENTS |
Consolidated statements of changes in shareholders’ equity
|
|
|
|
|
|
|
|
|
|
|
|
|
|
|
|
|
|
|
|
|
|
|
|
|
|
|
|
|
| |
|
Note |
|
|
Share
capital |
|
|
Share
premium |
|
|
Foreign
currency
translation reserve(i) |
|
|
Hedging
reserve |
|
|
Accumulated
profit/(deficit)(i) |
|
|
Total
equity(i) |
|
| |
|
|
|
|
|
|
|
|
|
|
(€’000) |
|
|
|
|
|
|
|
| Balance at January 1, 2018 |
|
|
|
|
|
|
7,141 |
|
|
|
539,448 |
|
|
|
4,180 |
|
|
|
(169 |
) |
|
|
39,061 |
|
|
|
589,661 |
|
| Profit for the
year |
|
|
|
|
|
|
— |
|
|
|
— |
|
|
|
— |
|
|
|
— |
|
|
|
31,118 |
|
|
|
31,118 |
|
| Hedging result, net of
tax |
|
|
|
|
|
|
— |
|
|
|
— |
|
|
|
— |
|
|
|
4 |
|
|
|
— |
|
|
|
4 |
|
| Other comprehensive income/(loss), net of tax |
|
|
|
|
|
|
— |
|
|
|
— |
|
|
|
(639 |
) |
|
|
— |
|
|
|
(730 |
) |
|
|
(1,369 |
) |
| Total comprehensive income/(loss), net of
tax |
|
|
|
|
|
|
— |
|
|
|
— |
|
|
|
(639 |
) |
|
|
4 |
|
|
|
30,388 |
|
|
|
29,753 |
|
| Exercise of
options |
|
|
|
|
|
|
10 |
|
|
|
1,726 |
|
|
|
— |
|
|
|
— |
|
|
|
— |
|
|
|
1,736 |
|
| Issue of performance shares and restricted shares |
|
|
|
|
|
|
19 |
|
|
|
(19 |
) |
|
|
— |
|
|
|
— |
|
|
|
— |
|
|
|
— |
|
| Share-based
payments |
|
|
21 |
|
|
|
— |
|
|
|
12,270 |
|
|
|
— |
|
|
|
— |
|
|
|
— |
|
|
|
12,270 |
|
| Total contribution by, and distributions
to, owners of the Company |
|
|
|
|
|
|
29 |
|
|
|
13,977 |
|
|
|
— |
|
|
|
— |
|
|
|
— |
|
|
|
14,006 |
|
| Balance as at December 31,
2018 |
|
|
|
|
|
|
7,170 |
|
|
|
553,425 |
|
|
|
3,541 |
|
|
|
(165 |
) |
|
|
69,449 |
|
|
|
633,420 |
|
| |
|
|
|
|
|
|
|
|
|
|
|
|
|
|
|
|
|
|
|
|
|
| Balance at 1 January 2017(i) |
|
|
|
|
|
|
7,060 |
|
|
|
523,671 |
|
|
|
11,004 |
|
|
|
(243 |
) |
|
|
(6 |
) |
|
|
541,486 |
|
| Net income |
|
|
|
|
|
|
— |
|
|
|
— |
|
|
|
— |
|
|
|
— |
|
|
|
39,067 |
|
|
|
39,067 |
|
| Hedging result, net of tax |
|
|
|
|
|
|
— |
|
|
|
— |
|
|
|
— |
|
|
|
74 |
|
|
|
— |
|
|
|
74 |
|
| Other comprehensive income/(loss), net
of tax |
|
|
|
|
|
|
— |
|
|
|
— |
|
|
|
(6,824 |
) |
|
|
— |
|
|
|
— |
|
|
|
(7,040 |
) |
| Total comprehensive income/(loss), net of
tax |
|
|
|
— |
|
|
|
— |
|
|
|
(6,824 |
) |
|
|
74 |
|
|
|
39,067 |
|
|
|
32,317 |
|
| Exercise of options |
|
|
|
|
|
|
55 |
|
|
|
6,914 |
|
|
|
— |
|
|
|
— |
|
|
|
— |
|
|
|
6,969 |
|
| Issue of performance shares and
restricted shares |
|
|
|
26 |
|
|
|
(26 |
) |
|
|
— |
|
|
|
— |
|
|
|
— |
|
|
|
— |
|
| Share-based payments |
|
|
21 |
|
|
|
— |
|
|
|
8,889 |
|
|
|
— |
|
|
|
— |
|
|
|
— |
|
|
|
8,889 |
|
| Total contribution by, and distributions to,
owners of the Company |
|
|
|
|
|
|
81 |
|
|
|
15,777 |
|
|
|
— |
|
|
|
— |
|
|
|
— |
|
|
|
15,858 |
|
| Balance at December 31, 2017(i) |
|
|
|
|
|
|
7,141 |
|
|
|
539,448 |
|
|
|
4,180 |
|
|
|
(169 |
) |
|
|
39,061 |
|
|
|
589,661 |
|
| |
|
|
|
|
|
|
|
|
|
|
|
|
|
|
|
|
|
|
|
|
|
| Balance at 1 January 2016(i) |
|
|
|
|
|
|
6,992 |
|
|
|
509,816 |
|
|
|
20,781 |
|
|
|
(213 |
) |
|
|
(38,342 |
) |
|
|
499,034 |
|
| Profit for the year |
|
|
|
|
|
|
— |
|
|
|
— |
|
|
|
— |
|
|
|
— |
|
|
|
38,336 |
|
|
|
38,336 |
|
| Hedging result, net of tax |
|
|
|
|
|
|
— |
|
|
|
— |
|
|
|
— |
|
|
|
(30 |
) |
|
|
— |
|
|
|
(30 |
) |
| Other comprehensive income/(loss),
net of tax |
|
|
|
— |
|
|
|
— |
|
|
|
(9,777 |
) |
|
|
— |
|
|
|
— |
|
|
|
(9,777 |
) |
| Total comprehensive income/(loss), net of
tax |
|
|
|
— |
|
|
|
— |
|
|
|
(9,777 |
) |
|
|
(30 |
) |
|
|
38,336 |
|
|
|
28,529 |
|
| Exercise of options |
|
|
|
|
|
|
48 |
|
|
|
6,284 |
|
|
|
— |
|
|
|
— |
|
|
|
— |
|
|
|
6,332 |
|
| Issue of performance shares and
restricted shares |
|
|
|
20 |
|
|
|
(20 |
) |
|
|
— |
|
|
|
— |
|
|
|
— |
|
|
|
— |
|
| Share-based payments |
|
|
21 |
|
|
|
— |
|
|
|
7,591 |
|
|
|
— |
|
|
|
— |
|
|
|
— |
|
|
|
7,591 |
|
| Total contribution by, and distributions
to, owners of the Company |
|
|
|
|
|
|
68 |
|
|
|
13,855 |
|
|
|
— |
|
|
|
— |
|
|
|
— |
|
|
|
13,923 |
|
| Balance at December 31, 2016(i) |
|
|
|
|
|
|
7,060 |
|
|
|
523,671 |
|
|
|
11,004 |
|
|
|
(243 |
) |
|
|
(6 |
) |
|
|
541,486 |
|
Since no minority shareholders in Group equity exist, the Group equity is entirely attributable to the parent’s
shareholders.
Note: The accompanying notes form an integral part of these consolidated financial statements.
(i) Certain figures as of December 31, 2017 and 2016 have been corrected compared to those previously reported. For further information on these corrections, see
Notes 2 and 28 of these 2018 consolidated financial statements.
www.interxion.com / 37
|
|
|
|
|
| CONSOLIDATED FINANCIAL STATEMENTS |
|
|
Consolidated statements of cash flows
|
|
|
|
|
|
|
|
|
|
|
|
|
|
|
|
|
|
|
|
|
| |
|
|
|
|
For the years ended
December 31, |
|
| |
|
Note |
|
|
|
|
|
2018 |
|
|
2017(i)
(€’000) |
|
|
2016(i) |
|
| Net income |
|
|
|
|
|
|
|
|
|
|
31,118 |
|
|
|
39,067 |
|
|
|
38,336 |
|
| Depreciation and amortization |
|
|
11, 12 |
|
|
|
|
|
|
|
128,954 |
|
|
|
108,252 |
|
|
|
89,835 |
|
| Provision for onerous lease
contracts |
|
|
19 |
|
|
|
|
|
|
|
— |
|
|
|
— |
|
|
|
(1,533 |
) |
| Share-based payments |
|
|
21 |
|
|
|
|
|
|
|
12,270 |
|
|
|
8,889 |
|
|
|
7,652 |
|
| Net finance expense |
|
|
9 |
|
|
|
|
|
|
|
61,784 |
|
|
|
44,367 |
|
|
|
36,269 |
|
| Income tax expense |
|
|
10 |
|
|
|
|
|
|
|
18,334 |
|
|
|
14,839 |
|
|
|
16,450 |
|
| |
|
|
|
|
|
|
|
|
|
|
252,460 |
|
|
|
215,414 |
|
|
|
187,009 |
|
| Movements in trade receivables and other
assets |
|
|
|
|
|
|
|
|
|
|
(13,647 |
) |
|
|
(30,667 |
) |
|
|
(11,126 |
) |
| Movements in trade payables and other
liabilities |
|
|
|
|
|
|
|
|
|
|
12,187 |
|
|
|
24,266 |
|
|
|
7,505 |
|
| Cash generated from operations |
|
|
|
|
|
|
|
|
|
|
250,984 |
|
|
|
209,013 |
|
|
|
183,388 |
|
| Interest and fees paid |
|
|
|
|
|
|
|
|
|
|
(69,005 |
) |
|
|
(41,925 |
) |
|
|
(36,003 |
) |
| Interest received |
|
|
|
|
|
|
|
|
|
|
1 |
|
|
|
143 |
|
|
|
136 |
|
| Income tax paid |
|
|
|
|
|
|
|
|
|
|
(17,126 |
) |
|
|
(11,985 |
) |
|
|
(8,124 |
) |
| Net cash flow from operating
activities |
|
|
|
|
|
|
|
|
|
|
164,854 |
|
|
|
155,246 |
|
|
|
139,397 |
|
| Cash flows from investing activities |
|
|
|
|
|
|
|
|
|
|
|
|
|
|
|
|
|
|
|
|
| Purchase of property, plant and
equipment |
|
|
|
|
|
|
|
|
|
|
(439,733 |
) |
|
|
(247,228 |
) |
|
|
(241,958 |
) |
| Financial investments -
deposits |
|
|
|
|
|
|
|
|
|
|
(12,366 |
) |
|
|
(324 |
) |
|
|
1,139 |
|
| Acquisition Interxion Science
Park |
|
|
|
|
|
|
|
|
|
|
— |
|
|
|
(77,517 |
) |
|
|
— |
|
| Purchase of intangible assets |
|
|
|
|
|
|
|
|
|
|
(11,446 |
) |
|
|
(8,787 |
) |
|
|
(8,920 |
) |
| Loan provided to third
parties |
|
|
|
|
|
|
|
|
|
|
(2,988 |
) |
|
|
(1,764 |
) |
|
|
(1,942 |
) |
| Proceeds from sale of financial
asset |
|
|
|
|
|
|
|
|
|
|
— |
|
|
|
— |
|
|
|
281 |
|
| Net cash flow used in investing
activities |
|
|
|
|
|
|
|
|
|
|
(466,503 |
) |
|
|
(335,620 |
) |
|
|
(251,400 |
) |
| Cash flows from financing
activities |
|
|
|
|
|
|
|
|
|
|
|
|
|
|
|
|
|
|
|
|
| Proceeds from exercised
options |
|
|
|
|
|
|
|
|
|
|
1,736 |
|
|
|
6,969 |
|
|
|
6,332 |
|
| Proceeds from mortgages |
|
|
|
|
|
|
|
|
|
|
5,969 |
|
|
|
9,950 |
|
|
|
14,625 |
|
| Repayment of mortgages |
|
|
|
|
|
|
|
|
|
|
(8,335 |
) |
|
|
(10,848 |
) |
|
|
(4,031 |
) |
| Proceeds from Revolving
Facilities |
|
|
|
|
|
|
|
|
|
|
148,814 |
|
|
|
129,521 |
|
|
|
— |
|
| Repayments of Revolving
Facilities |
|
|
|
|
|
|
|
|
|
|
(250,724 |
) |
|
|
(30,000 |
) |
|
|
— |
|
| Proceeds 6.00% Senior Secured
Notes |
|
|
|
|
|
|
|
|
|
|
— |
|
|
|
— |
|
|
|
154,808 |
|
| Repayment 6.00% Senior Secured
Notes |
|
|
|
|
|
|
|
|
|
|
(634,375 |
) |
|
|
— |
|
|
|
— |
|
| Proceeds 4.75% Senior Notes |
|
|
|
|
|
|
|
|
|
|
1,194,800 |
|
|
|
— |
|
|
|
— |
|
| Finance lease obligation |
|
|
|
|
|
|
|
|
|
|
(1,170 |
) |
|
|
(995 |
) |
|
|
— |
|
| Interest received at issuance of Additional
Notes |
|
|
|
|
|
|
|
|
|
|
2,428 |
|
|
|
— |
|
|
|
2,225 |
|
| Transaction costs 4.75% Senior
Notes |
|
|
|
|
|
|
|
|
|
|
(7,122 |
) |
|
|
— |
|
|
|
— |
|
| Transaction costs 2018 Revolving
Facility |
|
|
|
|
|
|
|
|
|
|
(2,542 |
) |
|
|
— |
|
|
|
— |
|
| Net cash flow from financing
activities |
|
|
|
|
|
|
|
|
|
|
449,479 |
|
|
|
104,597 |
|
|
|
173,959 |
|
| Effect of exchange rate changes on
cash |
|
|
|
|
|
|
|
|
|
|
(224 |
) |
|
|
(1,632 |
) |
|
|
251 |
|
| Net movement in cash and cash
equivalents |
|
|
|
|
|
|
|
|
|
|
147,606 |
|
|
|
(77,409 |
) |
|
|
62,207 |
|
| Cash and cash equivalents,
beginning of year |
|
|
|
|
|
|
|
|
|
|
38,484 |
|
|
|
115,893 |
|
|
|
53,686 |
|
| Cash and cash equivalents, end of
year |
|
|
15 |
|
|
|
|
|
|
|
186,090 |
|
|
|
38,484 |
|
|
|
115,893 |
|
Note: The accompanying notes form an integral part of these consolidated financial statements.
38 / www.interxion.com
|
|
|
|
|
|
|
CONSOLIDATED FINANCIAL STATEMENTS |
Notes to the 2018
Consolidated financial
statements
1. The Company
InterXion Holding N.V. (the “Company”) is domiciled in The Netherlands. The Company’s registered office is at Scorpius 30, 2132 LR
Hoofddorp, The Netherlands. The consolidated financial statements of the Company for the year ended December 31, 2018 comprise the Company and its subsidiaries (together referred to as the “Group”). The Group is a leading pan-European operator of carrier-neutral Internet data centers.
The financial statements, which were
approved and authorized for issue by the Board of Directors on May 27, 2019, are subject to adoption at the Annual General Meeting.
The following sections of this annual report form the Management report within the meaning of section 2:391 of the Dutch Civil Code:
| ∎ |
|
Report of the Board of Directors |
2. Basis of
preparation
Statement of compliance
The
consolidated financial statements have been prepared in accordance with International Financial Reporting Standards (“IFRS”), effective as of December 31, 2018, as issued by the International Accounting Standards Board
(“IASB”), and IFRS as endorsed by the European Union (“EU”), and also comply with the financial reporting requirements included in Part 9 of Book 2 of The Netherlands Civil Code.
Basis of measurement
The Group prepared its
consolidated financial statements on a going-concern basis and under the historical cost convention except for certain financial instruments that have been measured at fair value.
IFRS basis of presentation
The audited consolidated
financial statements as of December 31, 2018, 2017 and 2016 have been prepared in accordance with IFRS as endorsed by the EU. All standards and interpretations issued by the IASB and the IFRS Interpretations Committee effective for the year
ended 2018 have been endorsed by the EU, except that the EU historically did not adopt certain paragraphs of IAS 39 applicable to hedge transactions. The Group has historically not entered into hedge transactions to which these paragraphs have been
applicable. Under IFRS 9, this disparity is no longer in place. Consequently, the accounting policies applied by the Group
also comply with IFRS as issued by the IASB. The changes in accounting policies that became effective
as from January 1, 2018 (IFRS 9 and IFRS 15) are discussed in Note 3.
Correction of errors
Certain comparative amounts in the consolidated statements of financial position, consolidated statements of shareholders’ equity and
consolidated statements of comprehensive income have been corrected for immaterial errors with respect to historic application of IAS 17 – Leases. The impact of this correction is disclosed in Note 28 – Correction of errors. Throughout the
consolidated financial statements, columns including comparative figures that have been corrected, are indicated with ‘(i)’.
Use of estimates
and judgements
The preparation of financial statements in conformity with IFRS requires management to make judgments, estimates and
assumptions that affect the application of accounting policies and the reported amounts of assets, liabilities, income and expenses. Actual results may differ from these estimates, which together with underlying assumptions, are reviewed on an
ongoing basis. Revisions to accounting estimates are recognized in the period in which the estimates are revised and in any future periods affected.
Judgments, estimates and assumptions applied by management in preparing these financial statements are based on circumstances as of December 31, 2018, and the Group operating as a stand-alone company.
In particular, information about significant areas of estimation uncertainty and critical judgments in applying accounting policies that have the
most significant effect on amounts recognized in the financial statements are discussed below:
Property, plant and equipment
depreciation (see also Note 11) - Estimated remaining useful lives and residual values of property plant and equipment, including assets recognized upon a business combination, are reviewed annually. The carrying values of property, plant
and equipment are also reviewed for impairment, where there has been a triggering event, by assessing the fair value less costs to sell or the value in use, compared with net book value. The calculation of estimated future cash flows and residual
values is based on the Group’s best estimates of future prices, output and costs and is, therefore, subjective. In addition, the valuation of some of the assets under construction requires judgments that are related to the probability of
signing lease contracts and obtaining planning permits. Regarding the properties acquired as part of the acquisition of InterXion Science Park B.V. we recognized fair value at acquisition date, based on the highest and best use.
Intangible assets amortization (see also Note 12) - Estimated remaining useful lives of intangible assets, including those recognized
upon a business combination, are reviewed annually. The carrying values of intangible assets are also reviewed for impairment where there has been a triggering event by assessing the fair value less costs to sell or the value in use, compared with
net book value. The calculation of estimated
www.interxion.com / 39
|
|
|
|
|
| CONSOLIDATED FINANCIAL STATEMENTS |
|
|
future cash flows is based on the Group’s best estimates of future prices, output and costs and
is, therefore, subjective. The customer portfolio acquired as part of the acquisition of InterXion Science Park B.V. was valued based on the multi-period excess earnings method, which considers the present value of net cash flows expected to be
generated by the customer portfolio, excluding any cash flows related to contributory assets.
Goodwill (see also Note 12) -
Goodwill is recognized as the amount by which the purchase price of an acquisition exceeds the fair values of the assets and liabilities identified as part of the purchase price allocation. Goodwill is not being amortized, but subject to an annual
impairment test.
Lease accounting (see also Note 22) - At inception or modification of an arrangement, the Group
determines whether such an arrangement is, or contains, a lease. Classification of a lease contract is based on the extent to which risks and rewards incidental to ownership of a leased asset lie with the lessor or the lessee. The classification of
lease contracts includes the use of judgments and estimates.
Costs of site restoration (see also Note 24) - Liabilities
in respect of obligations to restore premises to their original condition are estimated at the commencement of the lease and reviewed annually, based on the rent period, contracted extension possibilities, the probability of lease terminations and
the probability of incurrence of costs for restoring leasehold premises to their original condition at the end of the lease.
Deferred tax (see also Note 10) - Provision is made for deferred tax at the rates of tax prevailing at the period-end dates unless future rates have been substantively enacted. Deferred tax assets are recognized where it is probable that they will be recovered based on estimates of future taxable profits for each tax
jurisdiction. The actual profitability may be different depending on local financial performance in each tax jurisdiction.
Share-based payments (see also Note 21) - The Group issues equity-settled share-based payments to certain employees under the terms
of the long-term incentive plans. The charges related to equity-settled share-based payments, options to purchase ordinary shares and restricted and performance shares, are measured at fair value at the grant date. Fair values are being redetermined
for market conditions as of each reporting date, until final grant date. The fair value at the grant date of options is determined using the Black Scholes model and is expensed over the vesting period. The fair value at grant date of the performance
shares is determined using the Monte Carlo model and is expensed over the vesting period. The value of the expense is dependent upon certain assumptions including the expected future volatility of the Group’s share price at the grant date and,
for the performance shares, the relative performance of the Group’s share price compared with a group of peer companies.
Senior
debt (see also Note 19) - Senior debt, including in 2018 the Senior Notes due 2025 and in 2017 and 2016 the Senior Secured Notes due 2020, is valued at amortized cost. The indentures under which senior debt was issued, include specific
early redemption clauses. As part of the initial measurement of the amortized costs value of senior debt it is assumed that it will
be held to maturity. If an early redemption of all or part of the senior debt is expected, the
liabilities will be re-measured based on the original effective interest rate. The difference between liabilities, excluding a change in assumed early redemption and liabilities, including a change in assumed
early redemption, will be recorded through profit and loss.
Functional and presentation currency
These consolidated financial statements are presented in euro, the Company’s functional and presentation currency. All information presented
in euros has been rounded to the nearest thousand, except when stated otherwise.
3. Significant accounting policies
Basis of consolidation
The consolidated
financial statements incorporate the financial statements of the Company and all entities that are directly or indirectly controlled by the Company. Subsidiaries are entities that are controlled by the Group. The Group controls an entity when it is
exposed to, or has the right to, variable returns from its involvement with the entity and has the ability to affect those returns through its power over the entity. The financial statements of subsidiaries are included in the consolidated financial
statements from the date on which control commences until the date on which control ceases.
The accounting policies set out below have
been applied consistently by all subsidiaries.
Loss of control
When the Group loses control over a subsidiary, the Company de-recognizes the assets and liabilities of the
subsidiary, any non-controlling interests and the other components of equity related to the subsidiary. Any surplus or deficit arising on the loss of control is recognized in profit or loss.
Transactions eliminated on consolidation
Intercompany balances and transactions, and any unrealized income and expenses arising from intercompany transactions, are eliminated in preparing
the consolidated financial statements.
Subsidiaries
With the exception of Stichting Administratiekantoor Management InterXion, all the subsidiary undertakings of the Group, as set out below are wholly owned as of December 31, 2018. Stichting Administratiekantoor Management
InterXion is part of the consolidation based on the Group’s control over the entity.
| ∎ |
|
InterXion HeadQuarters B.V., Amsterdam, The Netherlands; |
| ∎ |
|
InterXion Nederland B.V., Amsterdam, The Netherlands; |
| ∎ |
|
InterXion Trademarks B.V., Amsterdam, The Netherlands; |
| ∎ |
|
InterXion Participation 1 B.V., Amsterdam, The Netherlands;
|
40 / www.interxion.com
|
|
|
|
|
|
|
CONSOLIDATED FINANCIAL STATEMENTS |
| ∎ |
|
InterXion Österreich GmbH, Vienna, Austria; |
| ∎ |
|
InterXion Real Estate VII GmbH, Vienna, Austria; |
| ∎ |
|
InterXion Belgium N.V., Brussels, Belgium; |
| ∎ |
|
InterXion Real Estate IX N.V., Brussels, Belgium; |
| ∎ |
|
InterXion Denmark ApS, Copenhagen, Denmark; |
| ∎ |
|
InterXion Real Estate VI ApS, Copenhagen, Denmark; |
| ∎ |
|
InterXion Real Estate XVII ApS, Copenhagen, Denmark; |
| ∎ |
|
Interxion France SAS, Paris, France; |
| ∎ |
|
Interxion Real Estate II SARL, Paris, France; |
| ∎ |
|
Interxion Real Estate III SARL, Paris, France; |
| ∎ |
|
Interxion Real Estate XI SARL, Paris, France; |
| ∎ |
|
InterXion Deutschland GmbH, Frankfurt, Germany; |
| ∎ |
|
InterXion Ireland DAC, Dublin, Ireland; |
| ∎ |
|
Interxion Telecom SRL, Milan, Italy; |
| ∎ |
|
InterXion España SA, Madrid, Spain; |
| ∎ |
|
InterXion Real Estate XV SL, Madrid, Spain; |
| ∎ |
|
InterXion Sverige AB, Stockholm, Sweden; |
| ∎ |
|
InterXion (Schweiz) AG, Zurich, Switzerland; |
| ∎ |
|
InterXion Real Estate VIII AG, Zurich, Switzerland; |
| ∎ |
|
InterXion Carrier Hotel Ltd., London, United Kingdom; |
| ∎ |
|
InterXion Europe Ltd., London, United Kingdom; |
| ∎ |
|
InterXion Real Estate Holding B.V., Amsterdam, The Netherlands; |
| ∎ |
|
InterXion Real Estate I B.V., Amsterdam, The Netherlands; |
| ∎ |
|
InterXion Real Estate IV B.V., Amsterdam, The Netherlands; |
| ∎ |
|
InterXion Real Estate V B.V., Amsterdam, The Netherlands; |
| ∎ |
|
InterXion Real Estate X B.V., Amsterdam, The Netherlands; |
| ∎ |
|
InterXion Real Estate XII B.V., Amsterdam, The Netherlands; |
| ∎ |
|
InterXion Real Estate XIII B.V., Amsterdam, The Netherlands; |
| ∎ |
|
InterXion Real Estate XIV B.V., Amsterdam, The Netherlands; |
| ∎ |
|
InterXion Science Park B.V., Amsterdam, The Netherlands; |
| ∎ |
|
InterXion Operational B.V., Amsterdam, The Netherlands; |
| ∎ |
|
InterXion Datacenters B.V., The Hague, The Netherlands; |
| ∎ |
|
InterXion Consultancy Services B.V., Amsterdam, The Netherlands (dormant); |
| ∎ |
|
Interxion Telecom B.V., Amsterdam, The Netherlands (dormant); |
| ∎ |
|
Interxion Trading B.V., Amsterdam, The Netherlands (dormant); |
| ∎ |
|
InterXion B.V., Amsterdam, The Netherlands (dormant); |
| ∎ |
|
InterXion Telecom Ltd., London, United Kingdom (dormant); |
| ∎ |
|
Stichting Administratiekantoor Management InterXion, Amsterdam, The Netherlands.
|
Foreign currency
Foreign
currency transactions
The individual financial statements of each Group entity are presented in the currency of the primary economic
environment in which the entity operates (its functional currency). For the purpose of the consolidated financial statements, the results and the financial position of each entity are expressed in euros, which is the functional currency of the
Company and the presentation currency for the consolidated financial statements.
In preparing the financial statements of the
individual entities, transactions in foreign currencies other than the entity’s functional currency are recorded at the rates of exchange prevailing at the dates of the transactions. At each balance sheet date, monetary assets and liabilities
denominated in foreign currencies are retranslated at the rates prevailing at the balance sheet date. Non-monetary items that are measured in terms of historical cost in a foreign currency are not
retranslated. The income and expenses of foreign operations are translated to euros at average exchange rates.
Foreign operations
For the purpose of presenting consolidated financial statements, the assets and liabilities of the Group’s foreign operations are expressed in
euros using exchange rates prevailing at the balance sheet date. Income and expense items are translated at average exchange rates for the period. Exchange differences, if any, arising on net investments including receivables from or payables to a
foreign operation for which settlement is neither planned nor likely to occur, are recognized directly in the foreign currency translation reserve (“FCTR”) within equity. When control over a foreign operation is lost, in part or in full,
the relevant amount in the FCTR is transferred to profit or loss.
Borrowing costs
Borrowing costs attributable to the acquisition, construction or production of qualifying assets, which are assets that necessarily take a
substantial period of time to get ready for their intended use or sale, are added to the cost of those assets, until such time as the assets are substantially ready for their intended use or sale. All other borrowing costs are recognized in profit
or loss in the period in which they are incurred.
Borrowing costs are capitalized based on the effective interest rate of the Senior
debt.
Statement of cash flows
The
consolidated statement of cash flows is prepared using the indirect method. The cash flow statement distinguishes between operating, investing and financing activities.
Cash flows in foreign currencies are converted at the exchange rate at the dates of the transactions. Currency exchange differences on cash held
are separately shown. Payments and receipts of corporate income taxes and interest paid are included as cash flow from operating activities.
www.interxion.com / 41
|
|
|
|
|
| CONSOLIDATED FINANCIAL STATEMENTS |
|
|
Financial instruments
Derivative financial instruments
Up until December 31, 2017
Derivatives are initially recognized at fair value; any attributable transaction costs are recognized in profit and loss as they are
incurred. Subsequent to initial recognition, derivatives are measured at their fair value, and changes therein are generally recognized in profit and loss.
When a derivative is designated as a cash flow hedging instrument, the effective portion of changes in the fair value of the derivative is recognized in other comprehensive income and accumulated in the hedging reserve. Any
ineffective portion of changes in the fair value of the derivative is recognized immediately in profit or loss.
The amount accumulated
in equity is retained in other comprehensive income and reclassified to the profit or loss in the same period, or periods, during which the hedged item affects profit or loss.
If the hedging instrument no longer meets the criteria for hedge accounting, expires, is sold, terminated or exercised, or the designation is
revoked, hedge accounting is discontinued prospectively. If the forecast transaction is no longer expected to occur, the amount accumulated in equity is reclassified to profit or loss.
Fair values are obtained from quoted market prices in active markets or, where an active market does not exist, by using valuation techniques.
Valuation techniques include discounted cash flow models.
As from January 1, 2018
Derivatives are initially recognized at fair value; any attributable transaction costs are recognized in profit and loss as they are incurred.
Subsequent to initial recognition, derivatives are measured at their fair value, and changes therein are generally recognized in profit and loss.
When a derivative is designated as a cash flow hedging instrument, the effective portion of changes in the fair value of the derivative is recognized in other comprehensive income and accumulated in the hedging reserve. Any
ineffective portion of changes in the fair value of the derivative is recognized immediately in profit or loss.
The amount accumulated
in equity is retained in other comprehensive income and reclassified to the profit or loss in the same period, or periods, during which the hedged item affects profit or loss.
If the hedging instrument no longer meets the criteria for hedge accounting, expires, is sold, terminated or exercised, or the designation is
revoked, hedge accounting is discontinued prospectively. If the forecast transaction is no longer expected to occur, the amount accumulated in equity is reclassified to profit or loss.
Financial instruments that contain embedded derivatives that cannot or should not be separated from the host contract, are recognized at Fair Value
through Profit and Loss (“FVTPL”).
Fair values are obtained from
quoted market prices in active markets or, where an active market does not exist, by using valuation techniques. Valuation techniques include discounted cash flow models.
Non-derivative financial instruments
Non-derivative financial instruments comprise trade and other receivables, cash and cash equivalents, loans
and borrowings, and trade and other payables.
Up until December 31, 2017
Non-derivative financial instruments are recognized initially at fair value, net of any directly
attributable transaction costs. Subsequent to initial recognition, non-derivative financial instruments are measured at amortized cost using the effective interest method, less any impairment losses.
The Group de-recognizes a financial asset when the contractual rights to the cash flows from
the asset expire, or it transfers the right to receive the contractual cash flows in a transaction in which substantially all the risk and rewards of ownership of the financial asset are transferred. Any interest in such transferred financial assets
that is created or retained by the Group is recognized as a separate asset or liability.
Financial assets and liabilities are offset,
and the net amount presented in the statement of financial position when, and only when, the Group has a legal right to offset the amounts and intends either to settle on a net basis or to realize the asset and settle the liability simultaneously.
Financial assets are designated as of fair value through profit and loss if the Group manages such investments and makes purchase and
sale decisions based on their fair value in accordance with the Group’s risk management or investment strategy. Attributable transaction costs are recognized in profit and loss as incurred. Financial assets at fair value through profit and loss
are measured at fair value and changes therein, which takes into account any dividend income, are recognized in profit and loss.
The
convertible loan given, is presented as ‘Other investment’ on the balance sheet. This loan is initially measured at fair value plus any directly attributable transaction costs. Subsequent to initial recognition, it is measured at amortized
costs using the effective interest method.
As from January 1, 2018
A financial asset is measured at amortized cost (or in case of debt investments at Fair Value through Other Comprehensive Income
(“FVOCI”)) if it meets the following conditions and is not designated as of FVTPL:
| ∎ |
|
It is held within a business model whose objective is to hold assets to collect contractual cash flows; and |
| ∎ |
|
Its contractual terms give rise on specified dates to cash flows that are solely payments of principal and interest on the principal amount outstanding.
|
42 / www.interxion.com
|
|
|
|
|
|
|
CONSOLIDATED FINANCIAL STATEMENTS |
All financial assets not
classified as measured at amortized cost or FVOCI, are measured at FVTPL. This includes all derivative financial assets and assets that contain an embedded derivative instrument, such as the convertible loan the Group has given to Icolo Ltd.
The Group de-recognizes a financial asset when the contractual rights to the cash flows from
the asset expire, or it transfers the right to receive the contractual cash flows in a transaction in which substantially all the risk and rewards of ownership of the financial asset are transferred.
Financial assets and liabilities are offset, and the net amount presented in the statement of financial position when, and only when, the Group has
a legal right to offset the amounts and intends either to settle on a net basis or to realize the asset and settle the liability simultaneously.
Trade
receivables
Up until December 31, 2017
Trade receivables were recognized initially at fair value and subsequently measured at amortized cost using the effective interest method, less provision for impairment.
A provision for impairment of trade receivables and other current assets is established when there is objective evidence that the Group will not be
able to collect all amounts due according to the original term of the receivables. Significant financial difficulties of the debtor, probability that the debtor will enter bankruptcy or financial reorganization, and default or delinquency in
payments are considered indicators that the trade receivable is impaired.
The amount of the provision is the difference between the
asset’s carrying amount and the present value of estimated future cash flows, discounted at the original effective interest rate. The carrying amount of the asset is reduced through the use of an allowance account, and the amount of the loss is
recognized in the income statement.
When a trade receivable and other current asset is uncollectable, it is written off against the
allowance account for trade receivables. Subsequent recoveries of amounts previously written off are credited in the income statement.
As from
January 1, 2018
Trade receivables are initially recognized when they are originated. Trade receivables (unless they include a
significant financing component) are initially measured at the transaction price (as defined in IFRS 15), minus a loss allowance equal to lifetime expected credit losses.
An allowance for expected credit losses is established when at the date the trade receivable originated, there is objective evidence that the Group
will not be able to collect all amounts due according to the original term of the receivables. Significant financial difficulties of the debtor, probability that the debtor will enter bankruptcy or financial reorganization, and default or
delinquency in payments are considered indicators that there is a credit loss allowance necessary.
The amount of the allowance is
the difference between the transaction price and the present value of estimated future cash flows, discounted at the original effective interest rate.
When a trade receivable and other current asset is uncollectable, it is written off against the allowance account for trade receivables. Subsequent recoveries of amounts previously written off are credited in the income statement.
Other current assets
Other current
assets are recognized initially at fair value and subsequently measured at amortized cost using the effective interest method, less provision for impairment.
Cash and cash equivalents
Cash and cash
equivalents include cash in hand, deposits held at call with banks and other short-term highly liquid investments with original maturities of three months or less. Cash and cash equivalents, including short-term investments, is valued at face value,
which equals its fair value. Collateralized cash is included in other (non-) current assets and accounted for at face value, which equals its fair value, taking into account any expected credit losses.
Trade payables and other current liabilities
Trade payables and other current liabilities are recognized initially at fair value and subsequently measured at amortized cost using the effective interest method.
Share capital
Ordinary shares are classified as equity.
Incremental costs directly attributable to the issue of ordinary shares and share options are recognized as a deduction from equity, net of any tax effects.
Property, plant and equipment
Property, plant and
equipment are measured at cost less accumulated depreciation and accumulated impairment losses.
Cost includes expenditure that is
directly attributable to the acquisition or construction of the asset and comprises purchase cost, together with the incidental costs of installation and commissioning. These costs include external consultancy fees, capitalized borrowing costs, rent
and associated costs attributable to bringing the assets to a working condition for their intended use and internal employment costs that are directly and exclusively related to the underlying asset. In case of operating leases where it is probable
that the lease contract will not be renewed, the cost of self-constructed assets includes the estimated costs of dismantling and removing the items and restoring the site on which they are located.
When parts of an item of property, plant and equipment have different useful lives, they are accounted for as separate items (major components) of
property, plant and equipment.
Gains and losses on disposal of an item of property, plant and equipment are determined by comparing the
proceeds
www.interxion.com / 43
|
|
|
|
|
| CONSOLIDATED FINANCIAL STATEMENTS |
|
|
from disposal with the carrying amount of property, plant and equipment and are recognized within income.
The cost of replacing part of an item of property, plant and equipment is recognized in the carrying amount of the item if it is probable that the
future economic benefits embodied within the part will flow to the Group and its cost can be measured reliably. The carrying amount of the replaced part is de-recognized. The costs of the day-to-day servicing of property, plant and equipment are recognized in profit or loss as incurred.
Depreciation is calculated from the date an asset becomes available for use and is depreciated on a straight-line basis over the estimated useful
life of each part of an item of property, plant and equipment. Leased assets are depreciated on the same basis as owned assets over the shorter of the lease term and their useful lives. The principal periods used for this purpose are:
|
|
|
| Data center
freehold land |
|
Not depreciated |
| Data center
buildings |
|
15-30 years |
| Data center
infrastructure and equipment |
|
5-20 years |
| Office equipment
and other |
|
3-15 years |
Depreciation methods, useful lives and residual values are reviewed annually.
Data center freehold land consists of the land owned by the Company and land leased by the Company under finance lease agreements. The data center
buildings consist of the core and shell in which we have constructed a data center. Data center infrastructure and equipment comprises data center structures, leasehold improvements, data center cooling and power infrastructure, including
infrastructure for advanced environmental controls such as ventilation and air conditioning, specialized heating, fire detection and suppression equipment and monitoring equipment. Office equipment and other is comprised of office leasehold
improvements and office equipment consisting of furniture and computer equipment.
Intangible assets and goodwill
Intangible assets represent power grid rights, software, a customer portfolio previously identified as part of a business combination, and other
intangible assets. Intangible assets are recognized at cost less accumulated amortization and accumulated impairment losses. Other intangible assets principally consist of lease premiums (paid in addition to obtain rental contracts).
Software includes development expenditure, which is capitalized only if development costs can be measured reliably, the product or process is
technically and commercially feasible, future economic benefits are probable, and the Group intends to and has sufficient resources to complete development and to use the asset. The expenditure capitalized includes the cost of material, services and
direct labor costs that are directly attributable to preparing the asset for its intended use.
Amortization is calculated on a
straight-line basis over the estimated useful lives of the intangible asset. Amortization methods, useful lives are reviewed annually.
The estimated useful lives are:
|
|
|
| Power grid
rights (except for those with an indefinite life) |
|
10–15 years |
|
Software |
|
3–5 years |
| Customer
portfolio |
|
20 years |
|
Other |
|
3–12 years |
Goodwill represents the goodwill related to business combinations, which is determined based on purchase price
allocation. Goodwill is not being amortized, and subject to an annual impairment test.
Impairment of non-financial
assets
The carrying amounts of the Group’s non-financial assets, excluding goodwill, are
reviewed at each reporting date to determine whether there is any indication of impairment. If any such indication exists, then the asset’s recoverable amount is estimated. For goodwill, intangible assets with an indefinite useful life and
intangible assets that are not yet available for use, the recoverable amount is estimated annually.
The recoverable amount of an asset
or cash-generating unit is the greater of either its value in use or its fair value less costs to sell. In assessing value in use, the estimated future cash flows are discounted to their present value using a
pre-tax discount rate that reflects current market assessments of the time value of money and the risks specific to the asset. For the purpose of impairment testing, assets are grouped together into the
smallest group of assets that generates cash inflows from continuing use that are largely independent of the cash inflows of other assets or groups of assets (the “cash-generating unit”).
Considering the Company manages its data centers by country, and, given the data center campus-structures, the financial performance of data
centers within a country is highly inter-dependent, the Company has determined that the cash-generating unit for impairment-testing purposes should be the group of data centers per country, unless specific circumstances would indicate that a single
data center is a cash-generating unit.
An impairment loss is recognized if the carrying amount of an asset or its cash-generating unit
exceeds its estimated recoverable amount. Impairment losses are recognized in profit or loss. Impairment losses recognized in respect of cash-generating units are to reduce the carrying amount of the assets in the unit (group of units) on a pro-rata basis.
Impairment losses recognized in prior periods are assessed at each reporting date for
any indications that the loss has decreased or no longer exists. An impairment loss is reversed if there has been a change in the estimates used to determine the recoverable amount. An impairment loss previously recognized on assets other than
goodwill, is reversed only to the extent that the asset’s carrying amount does not exceed the carrying amount that would have been determined, net of depreciation or amortization, if no impairment loss had been recognized.
44 / www.interxion.com
|
|
|
|
|
|
|
CONSOLIDATED FINANCIAL STATEMENTS |
Borrowings
Borrowings are recognized initially at fair value, net of transaction costs incurred. Borrowings are subsequently stated at amortized cost; with
any difference between the proceeds (net of transaction costs) and the redemption value recognized in the income statement over the period of the borrowings using the effective interest method.
Borrowings are classified as current liabilities unless the Group has an unconditional right to defer settlement of the liability for at least 12
months after the balance sheet date. The Group de-recognizes a borrowing when its contractual obligations are discharged, cancelled or expired.
As part of the initial measurement of the amortized cost value of debt, it is assumed that it will be held to maturity. If an early redemption of
all or part of certain debt is expected, the liability will be re-measured based on the original effective interest rate. The difference between the liability, excluding a change in assumed early redemption
and the liability, including a change in assumed early redemption, will be recognized in profit and loss.
Provisions
A provision is recognized in the statement of financial position when the Group has a present legal or constructive obligation as a result of a
past event; it is probable that an outflow of economic benefits will be required to settle the obligation and the amount can be estimated reliably. Provisions are determined by discounting the expected future cash flows at a pre-tax rate that reflects current market assessments of the time value of money and, where appropriate, the risks specific to the liability. The discount rate arising on the provision is amortized in future years
through interest.
A provision for site restoration is recognized when costs for restoring leasehold premises to their original
condition at the end of the lease are probable to be incurred and it is possible to make an accurate estimate of these costs. The discounted cost of the liability is included in the related assets and is depreciated over the remaining estimated term
of the lease. If the likelihood of this liability is estimated to be possible, rather than probable, it is disclosed as a contingent liability in Note 25.
A provision for onerous lease contracts is recognized when the expected benefits to be derived by the Group from a contract are lower than the unavoidable cost of meeting its obligations under the contract. The provision is measured
at the discounted amount of future losses expected to be incurred in respect of unused data center sites over the term of the leases. Where unused sites can be sublet or partly sublet, management has taken account of the sublease income expected to
be received over the minimum sublease term, which meets the Group’s revenue recognition criteria in arriving at the amount of future losses. Before a provision is established, the Group recognizes any impairment loss on the assets associated
with that contract.
Leases
Leases, in which
the Group assumes substantially all the risks and rewards of ownership, are classified as finance leases. On initial recognition, the leased asset is measured at an amount
equal to the lower of either
its fair value or the present value of the minimum lease payments. Subsequent to initial recognition, the asset is accounted for in accordance with the accounting policy applicable to that asset. The finance lease obligations are presented as part
of the long-term liabilities and, as far as amounts need to be repaid within one year, as part of current liabilities.
Other leases are
operating leases and the leased assets are not recognized on the Group’s statement of financial position. Payments made under operating leases are recognized in the income statement, or capitalized during construction, on a straight-line basis
over the term of the lease. Lease incentives received are recognized as an integral part of the total lease expense, over the term of the lease.
Minimum finance lease payments are apportioned between the finance charge and the reduction of the outstanding liability. The finance charge is allocated to each period during the lease term so as to produce a constant periodic rate
of interest on the remaining balance of the liability.
At inception or modification of an arrangement, the Group determines whether
such an arrangement is, or contains, a lease. This will be the case if the following two criteria are met:
| ∎ |
|
the fulfilment of the arrangement is dependent on the use of a specific asset or assets; and |
| ∎ |
|
the arrangement contains the right to use an asset. |
For leased
properties on which our data centers are located, we generally seek to secure property leases for terms of 20 to 25 years. Where possible, we try to mitigate the long-term financial commitment by contracting for initial lease terms for a minimum
period of 10 to 15 years with the option for us either to (i) extend the leases for additional five-year terms or (ii) terminate the leases upon expiration of the initial 10- to 15-year term. Our leases generally have consumer price index based annual rent increases over the full term of the lease. Certain of our leases contain options to
purchase the asset.
Segment reporting
The
segments are reported in a manner that is consistent with internal reporting provided to the chief operating decision-maker, identified as the Board of Directors. There are two segments: the first is Big4, which comprises France, Germany, The
Netherlands and the United Kingdom, the second is Rest of Europe, which comprises Austria, Belgium, Denmark, Ireland, Spain, Sweden and Switzerland. Shared expenses such as corporate management, general and administrative expenses, loans and
borrowings and related expenses and income tax assets and liabilities are stated in Corporate and other. The Big4 and Rest of Europe are different segments as management believes that the Big4 countries represent the largest opportunities for
Interxion, from market trends and growth perspective to drive the development of its communities of interest strategy within customer segments and the attraction of magnetic customers. As a result, over the past three years we have invested between
68% and 71% of our capital expenditure in the Big4 segment while revenue constituted an average of 65% of total revenue over the same period.
www.interxion.com / 45
|
|
|
|
|
| CONSOLIDATED FINANCIAL STATEMENTS |
|
|
Segment results, assets and
liabilities include items directly attributable to a segment as well as those that can be allocated on a reasonable basis. Unallocated items presented as Corporate and other principally comprise loans and borrowings and related expenses; corporate
assets and expenses (primarily the Company’s headquarters); and income tax assets and liabilities.
Segment capital expenditure is
defined as the net cash outflow during the period to acquire property, plant and equipment, and intangible assets other than goodwill, during the period.
Adjusted EBITDA, Recurring revenue and Cash generated from operations, are additional indicators of our operating performance, and are not required by or presented in accordance with IFRS. We define Adjusted EBITDA as Operating
income adjusted for the following items, which may occur in any period, and which management believes are not representative of our operating performance:
| ∎ |
|
Depreciation and amortization – property, plant and equipment and intangible assets (except goodwill) are depreciated on a straight-line basis over the estimated useful life. We believe that
these costs do not represent our operating performance. |
| ∎ |
|
Share-based payments – represents primarily the fair value at the date of grant of employee equity awards, which is recognized as an expense over the vesting period. In certain cases, the fair
value is redetermined for market conditions at each reporting date, until the final date of grant is achieved. We believe that this expense does not represent our operating performance. |
| ∎ |
|
Income or expense related to the evaluation and execution of potential mergers or acquisitions (“M&A”) – under IFRS, gains and losses associated with M&A activity are
recognized in the period in which such gains or losses are incurred. We exclude these effects because we believe they are not reflective of our ongoing operating performance. |
| ∎ |
|
Adjustments related to terminated and unused data center sites – these gains and losses relate to historical leases entered into for certain brownfield sites, with the intention of developing
data centers, which were never developed, and for which management has no intention of developing into data centers. We believe the impact of gains and losses related to unused data centers are not reflective of our business activities and our
ongoing operating performance. |
In certain circumstances, we may also adjust for items that management believes are not
representative of our current ongoing performance. Examples of this would include: adjusting for the cumulative effect of a change in accounting principle or estimate, impairment losses, litigation gains and losses or windfall gains and losses.
We define Recurring revenue as revenue incurred from colocation and associated power charges, office space, amortized set-up fees, cross-connects and certain recurring managed services (but excluding any ad hoc managed services) provided by us
directly or through third
parties, excluding rents received for the sublease of unused sites.
Cash generated from operations is defined as net cash flows from
operating activities, excluding interest and corporate income tax payments and receipts. Management believe that the exclusion of these items provides useful supplemental information to net cash flows from operating activities to aid investors in
evaluating the cash generating performance of our business.
We believe Adjusted EBITDA, Recurring revenue and Cash generated from
operations provide useful supplemental information to investors regarding our ongoing operational performance because these measures help us and our investors evaluate the ongoing operating performance of the business after removing the impact of
our capital structure (primarily interest expense) and our asset base (primarily depreciation and amortization). Management believes that the presentation of Adjusted EBITDA, when combined with the primary IFRS presentation of net income, provides a
more complete analysis of our operating performance. Management also believes the use of Adjusted EBITDA facilitates comparisons between us and other data center operators (including other data center operators that are REITs) and other
infrastructure-based businesses. Adjusted EBITDA is also a relevant measure used in the financial covenants of our revolving credit facility (the “Revolving Facility”) and our 4.75% Senior Notes due 2025 (the “Senior Notes”).
This information, provided to the chief operating decision-maker, is disclosed to permit a more complete analysis of our operating
performance. Exceptional items are those significant items that are separately disclosed by virtue of their size, nature or incidence to enable a full understanding of the Group’s financial performance.
Revenue recognition under IAS 18 - Revenue
In the
comparative periods 2017 and 2016, the Group applied the following accounting policies for recognition of revenue under IAS 18.
Revenue
is recognized when it is probable that future economic benefits will flow to the Group and that these benefits, together with their related costs, can be measured reliably. Revenue is measured at the fair value of the consideration received or
receivable considering any discounts or volume rebates.
The Group reviews transactions for separately identifiable components and, if
necessary, applies individual recognition treatment, revenues are allocated to separately identifiable components based on their relative fair values.
The Group earns colocation revenue as a result of providing data center services to customers at its data centers. Colocation revenue and lease income are recognized in profit or loss on a straight-line basis over the term of the
customer contract. Incentives granted are recognized as an integral part of the total income, over the term of the customer contract. Customers are usually invoiced quarterly in advance and income is recognized on a straight-line basis over the
quarter. Initial setup fees payable at the beginning of customer contracts are deferred at inception
46 / www.interxion.com
|
|
|
|
|
|
|
CONSOLIDATED FINANCIAL STATEMENTS |
and recognized in the income
statement on a straight-line basis over the initial term of the customer contract. Power revenue is recognized based on customers’ usage.
Other services revenue, including managed services, connectivity and customer installation services including equipment sales are recognized when the services are rendered. Certain installation services and equipment sales, which by
their nature have a non-recurring character, are presented as non-recurring revenues and are recognized on delivery of service.
Deferred revenues relating to invoicing in advance and initial setup fees are considered contract liabilities and carried on the statement of
financial position as part of trade payables and other liabilities. Deferred revenues due to be recognized after more than one year are held in non-current liabilities.
Revenue recognition under IFRS 15 – Revenues from contracts with customers
The Group has initially applied IFRS 15 from January 1, 2018, and recognized revenues based on applying the recognition model prescribed by
IFRS 15. Due to the transition method chosen in applying IFRS 15, comparative information has not been restated to reflect the new requirements.
Identification of contracts with customers
Contracts that are in scope of IFRS 15 include mutually approved service agreements and customer order forms. Based on these contracts and forms,
both parties can identify their rights and obligations. In certain circumstances two or more agreements and customer order forms may be considered a combined contract.
Identification of performance obligations
Under
IFRS 15 the Group identified four performance obligations:
| 1. |
Primary data center services |
This performance obligation includes providing space, power capacity, connectivity, required setup and installation services and energy to
customers. These services are not capable of being distinct from each other and therefore considered one performance obligation. Since customers simultaneously receive and consume the benefits as the Group meets its performance obligation, revenues
are being recognized over time. Each month we deliver services which are substantially similar. Customers can benefit from each individual month of service. Therefore, and since an individual month of providing primary data center services is
separately identifiable, each month of providing primary data center services is considered a distinct performance obligation. Most of our contracts include price indexation clauses which in general apply as of January each year.
Under the new standard, a series of distinct goods or services will be accounted for as a single performance obligation if they are substantially
the same, have the same pattern of transfer and both of the following criteria are met:
(i) each distinct good or service in
the series represents a performance obligation that would be satisfied over time; and
(ii) the entity
would measure its progress towards satisfaction of the performance obligation using the same measure of progress for each distinct good or service in the series.
The principles in IFRS 15 therefore apply to each single performance obligation when the series criteria are met, rather than the individual
services that make up the single performance obligation. As a result, revenue is allocated to the relative standalone selling price of the series as one performance obligation, rather than to each distinct service within it., except for allocating
variable considerations.
| 2. |
Hands and eyes recurring |
This performance obligation represents remote hands and eyes activities for which the customer is being charged a recurring monthly fee.
| 3. |
Additional setup and installation |
This performance obligation relates to selling goods and one-off installation services to the customer,
which are not part of providing primary data center services.
| 4. |
Hands and eyes on demand |
This type of remote hands and eyes support is being provided upon the customers’ specific request and charged on an as-incurred basis. This performance obligation is fulfilled as soon as the requested support is provided.
Determination of the transaction price
The
transaction price is the amount of consideration to which the Group expects to be entitled in exchange for transferring the goods and providing the services to customers.
Allocation of revenue
Revenue from contracts
with customers is being allocated to separate performance obligations, based on the relative standalone selling price of each performance obligation. This includes the allocation of discounts given to customers.
Recognition of revenue
Revenue from primary data
center services and from Hands and eyes recurring is being recognized over time, considering one month of providing service as a separate performance obligation. Incentives granted are recognized as an integral part of the total income, over the
term of the customer contract. Initial setup fees payable at the beginning of customer contracts are deferred at inception and recognized in the income statement on a straight-line basis over the initial term of the customer contract. Power revenue
is recognized based on customers’ usage.
Hands and eyes on demand and additional setup and installation, which have a non-recurring character, are presented as non-recurring revenues and are recognized at the point in time of the delivery of the service.
Delivery of these goods and providing these services triggers transfer of control and is the point in time at which revenue is recognized.
www.interxion.com / 47
|
|
|
|
|
| CONSOLIDATED FINANCIAL STATEMENTS |
|
|
Contract balances
Under IFRS 15 the Group recognizes three types of contract balances:
A contract asset is the right to consideration in exchange for goods or services transferred to the customer. If the Group performs services to a
customer before the customer pays consideration or before payment is due, a contract asset is recognized. In our consolidated statement of financial position, these assets are included as accrued revenue in trade and other current assets (see also
note 14).
A receivable represents the Group’s right to an amount of consideration that is unconditional (i.e. only the passage of time is required
before payment of the consideration is due).
A contract liability is the obligation to transfer goods or services to a customer for which the Group has received consideration (or an amount of
consideration is that is unconditionally due) from the customer. If the customer pays consideration before the Group transfers the services to the customer, a contract liability is recognized when the payment is made by the customer or when the
payment is due (whichever is earlier). Contract liabilities are recognized as flow to revenue in line with the fulfilling of the performance obligations under the contract. In our consolidated statement of financial position, these liabilities are
presented as deferred revenue in trade payables and other liabilities (see also note 18).
Cost of sales
Cost of sales consists mainly of rental costs for the data centers and offices, power costs, maintenance costs relating to the data center
equipment, operation and support personnel costs and costs related to installations and other customer requirements. In general, maintenance and repairs are expensed as incurred. In cases where maintenance contracts are in place, the costs are
recorded on a straight-line basis over the contractual period.
Sales and marketing costs
The operating expenses related to sales and marketing consist of costs for personnel (including sales commissions), marketing and other costs
directly related to the sales process. Costs of advertising and promotion are expensed as incurred.
General and administrative costs
General and administrative costs are expensed as incurred and include amortization and depreciation expenses.
Employee benefits
Defined contribution pension plans
A defined
contribution pension plan is a post-employment plan under which an entity pays fixed contributions into a separate entity and has no legal or constructive obligation to pay further amounts. Obligations for contributions to defined contribution plans
are recognized as an employee benefit expense in the income statement in the periods during which the related services are rendered by employees. Prepaid contributions are recognized as an asset to the extent that a cash refund or a reduction in
future payments is available. Contributions to a defined contribution plan, which are due more than 12 months after the end of the period in which the employees render the service, are discounted to their present value.
Termination benefits
Termination benefits are
recognized as an expense when the Group is demonstrably committed, without realistic possibility of withdrawal, to a formal detailed plan to either terminate employment before the normal retirement date, or to provide termination benefits as a
result of an offer made to encourage voluntary redundancy. Termination benefits for voluntary redundancy are recognized as an expense if the Group has made an offer of voluntary redundancy, it is probable that the offer will be accepted, and the
number of acceptances can be estimated reliably. If benefits are payable more than 12 months after the reporting date, they are discounted to their present value.
Share-based payments
The long-term incentive
plans enable Group employees to earn and/or acquire shares of the Group. The fair value at the date of grant of share options, restricted shares and performance shares is recognized over the vesting period, with a corresponding increase in equity.
The fair value of options is determined using the Black Scholes model, the fair value of performance shares is determined using the Monte Carlo model. Restricted shares are valued based on the market value at the date of grant. Based on the actual
performance on non-market conditions the number of performance shares that will vest is updated after the performance period. The fair value of performance share awards which are conditionally granted and are
subject to market conditions is redetermined at each reporting date until the final date of grant is achieved. The amount recognized as an expense is adjusted to reflect the actual number of share options, restricted and performance shares that
vest.
Finance income and expense
Finance
income and expense include interest payable on borrowings calculated using the effective interest rate method, gains on financial assets recognized at fair value through profit and loss and foreign exchange gains and losses. Borrowing costs
attributable to the acquisition or construction of data center assets, which are assets that necessarily take a substantial period of time to get ready for their intended use, are added to the costs of those assets, until such time as the assets are
ready for their intended use.
48 / www.interxion.com
|
|
|
|
|
|
|
CONSOLIDATED FINANCIAL STATEMENTS |
Interest income is recognized
in the income statement as it accrues, using the effective interest method. The interest expense component of finance lease payments is recognized in the income statement using the effective interest rate method.
Foreign currency gains and losses are reported on a net basis, as either finance income or expenses, depending on whether the foreign currency
movements are in a net gain or a net loss position.
Other financial income and expense may include the changes in fair value of
financial instruments carried at fair value through profit and loss.
Income tax
Income tax on the profit or loss for the year comprises current and deferred tax. Income tax is recognized in the income statement except to the
extent that it relates to items recognized directly in equity, in which case it is recognized in equity.
Current tax is the expected
tax payable on the taxable income for the year, using tax rates enacted or substantially enacted at the balance sheet date, and any adjustment to tax payable in respect of previous years.
Deferred tax is recognized in respect of temporary differences between the carrying amount of assets and liabilities for financial reporting
purposes and the amounts used for taxation purposes. The following temporary differences are not provided for: the initial recognition of assets or liabilities that affect neither accounting nor taxable profit, nor differences relating to
investments in subsidiaries to the extent that they will probably not reverse in the foreseeable future. The amount of deferred tax provided is based on the expected manner of realization or settlement of the carrying amount of assets and
liabilities, using tax rates enacted or substantially enacted at the balance sheet date that are expected to be applied to temporary differences when they reverse, or loss carry forwards when they are utilized.
A deferred tax asset is also recognized for unused tax losses and tax credits. A deferred tax asset is recognized only to the extent that it is
probable that future taxable profits will be available against which the asset can be utilized. Deferred tax assets are reduced to the extent that it is no longer probable that the related tax benefit will be realized.
Additional income taxes that arise from the distribution of dividends are recognized at the same time as the liability to pay the related dividend.
In determining the amount of current and deferred tax, the Company takes into account the impact of uncertain tax positions and whether
additional taxes, penalties and interest may be due. The Company believes that its accruals for tax liabilities are adequate for all open tax years based on its assessment of many factors, including interpretations of tax law and prior experience.
This assessment relies on estimates and assumptions and may involve a series of judgments about future events. New information may become available that causes the Company to change its judgment regarding the adequacy of existing tax liabilities;
such changes to tax liabilities will have an impact on tax expense in the period that such a determination is made.
Deferred tax assets and
liabilities are offset if there is a legally enforceable right to offset current tax liabilities and assets, and they relate to taxes levied by the same tax authority on the same taxable entity, or on different tax entities, but they intend to
settle current tax liabilities and assets on a net basis or their tax assets and liabilities will be realized simultaneously.
Earnings per share
The Group presents basic and diluted earnings per share (“EPS”) data for its ordinary shares. Basic EPS is calculated by dividing the
profit or loss attributable to ordinary and preference shareholders of the Company by the weighted average number of ordinary shares outstanding during the year. Diluted EPS is determined by adjusting the basic earnings per share for the effects of
all dilutive potential ordinary shares.
Changes in accounting policies
This is the first set of consolidated financial statements in which IFRS 9 – Financial Instruments and IFRS 15 – Revenue
from Contracts with Customers have been reflected. The nature and effect of the changes as a result of adoption of these new accounting standards is described below.
Several other amendments and interpretations, including Amendments to IFRS 2 – Classification and Measurement of Share-based Payment
Transactions, apply for the first time in 2018, but do not have an impact on the consolidated financial statements of the Group. The Group has not adopted any standards, interpretations or amendments that have been issued but are not yet
effective.
IFRS 9 – Financial instruments
IFRS 9 sets out requirements for recognizing and measuring financial assets, financial liabilities and some contracts to buy or sell non-financial items. This standard replaces IAS 39 –
Financial Instruments: Recognition and measurement.
As a result of the adoption of IFRS 9, the Company has adopted consequential
amendments to IAS 1 – Presentation of Financial Statements, which require impairment of financial assets to be presented in a separate line item in the consolidated income statement, as far as these impairment losses are material. Impairment
losses on other financial assets, if any, are presented under ‘Finance expense’, similar to the presentation under IAS 39, and not presented separately in the consolidated income statement due to materiality considerations.
Additionally, the Company had adopted consequential amendments to IFRS 7 – Financial Instruments: Disclosures that are applied to
disclosures about 2018 but have not been generally applied to comparative information.
IFRS 9 contains three principal classification
categories for financial assets: measured at amortized cost, at fair value through other comprehensive income (“FVOCI”) and at fair value through profit and loss (“FVTPL”). The standard eliminates the IAS 39 categories of held
to maturity, loans and receivables and available for sale. Under IFRS 9, derivatives embedded in
www.interxion.com / 49
|
|
|
|
|
| CONSOLIDATED FINANCIAL STATEMENTS |
|
|
contracts where the host is a financial asset in the scope of the standard, are never separated.
Instead, the hybrid financial instrument as a whole is assessed for classification.
IFRS 9 largely retains the requirements in IAS 39 for the classification and measurement of financial liabilities. The adoption of IFRS 9 has not had a significant effect on the Group’s accounting policies related to financial
liabilities and derivative financial instruments.
IFRS 15 – Revenue from Contracts with Customers
IFRS 15 establishes a comprehensive framework for determining whether, how much and when revenue from contracts with customers is recognized. It
replaced IAS 18 – Revenue, IAS 11 – Construction Contracts and related interpretations. Under IFRS 15, revenue is recognized when a customer obtains control of the goods or services. Determining the timing of the transfer of
control – at a point in time or over time – requires judgment.
The Group has adopted IFRS 15 using the cumulative effect
method, applying the practical expedient that allows to only apply IFRS 15 to contracts that are not completed as per the initial date of application. Accordingly, the information presented for 2017 and 2016 has not been restated, i.e., it is
presented, as previously reported, under IAS 18 and related interpretations. Additionally, the disclosure requirements in IFRS 15 have not generally been applied to comparative information.
IFRS 15 does not have a significant impact on the way the Group accounts for revenues from primary data center services, because the services
provided to customers meet the requirements to apply the series guidance under IFRS 15. Revenues relating to non-recurring performance obligations are being recognized at a point in time upon the Group
fulfilling its performance obligation, which is similar to how the Group historically recognized such revenues in the past. Accordingly, there would not be material adjustments to be reported in the retained earnings of the comparative period.
New standards and interpretations not yet adopted
Of the new and amended standards and interpretations that are issued, but not yet effective, up to the date of issuance of the Group’s
financial statements, IFRS 16 – Leases is disclosed below. This is the only standard becoming effective in the future, that will significantly impact the Group’s financial statements.
IFRS 16 – Leases
In January 2016, the IASB issued
IFRS 16 - Leases, the new accounting standard for leases. The new standard is effective for annual periods beginning on or after January 1, 2019 and will replace IAS 17 – Leases and IFRIC 4 – Determining whether an
Arrangement contains a Lease. IFRS 16 has been endorsed by the EU in October 2017.
Leases in which the Group is a lessee
The new standard requires lessees to apply a single, on-balance sheet accounting model to all its leases,
unless a lessee elects the recognition exemptions for short-term leases and/or leases of low-value assets. A lessee must recognize a
right-of-use asset representing its right to use the underlying asset and a lease obligation representing its obligation to make lease payments. The standard permits a
lessee to elect either a full retrospective or a modified retrospective transition approach.
The most significant impact on the income
statement is that operating lease expenses will no longer be recognized, except for those lease contracts for which the Group is going to apply the practical expedients mentioned hereafter. The impact of lease contracts on the consolidated income
will move from cost of sales to amortization of the right of use asset and interest relating to the lease liability. As a result, certain key metrics such as operating profit and Adjusted EBITDA will change significantly. Compared to lease
accounting under IAS 17, total expenses will be higher in the earlier years of a lease and lower in the later years.
The lease
liability will be calculated based on the minimum future lease payments under the lease contract, discounted at the incremental borrowing rate, which is calculated per class of leased assets (e.g. real estate, ducts, cars and office equipment) and
per country in which the relevant asset is operating. Additionally, the incremental borrowing rate will be the rate at which the interest charges relating to the lease liability are calculated.
Implementation of IFRS 16 is not expected to have a significant impact on the Group’s compliance with the debt covenants in the Revolving
Facility Agreement and Indenture, because the relevant definitions in the Revolving Facility Agreement and Indenture exclude the impact of IFRS 16.
The Group elected to apply the practical expedients for lease contracts with lease terms ending within twelve months from the date of initial contract start date, and lease contracts for which the underlying asset is of low value.
As a result, it will not apply lease accounting to these contracts. Furthermore, the payments under lease contracts in which the Group is a lessee will not be separated into lease- and non-lease elements.
Leases in which the Group is a lessor
The Company has investigated which elements of its contracts with customers will be subject to lessor accounting under the requirements of IFRS 16.
The portion of the contracts with customers that meet the criteria for recognition of a lease (primarily real estate) based on guidance in IFRS 16 will be identified as lease elements and fall within the scope of IFRS 16 and no longer within the
scope of IFRS 15 – Revenue from contracts with customers as from January 1, 2019, since leases are specifically excluded from that standard. Therefore, as of January 1, 2019, the Group will account for the lease-elements in its
contracts with customers in accordance with IFRS 16. Non-lease elements which are included in those contracts will continue to be accounted for in accordance with IFRS 15.
50 / www.interxion.com
|
|
|
|
|
|
|
CONSOLIDATED FINANCIAL STATEMENTS |
Transition
The Group will adopt IFRS 16 on January 1, 2019, using the modified retrospective approach, and will apply the practical expedient to
grandfather the definition of a lease on transition and therefore will not apply IFRS 16 to all contracts entered into before January 1, 2019 which were not identified as leases in accordance with IAS 17 and IFRIC 4.
Impact analysis
The adoption of IFRS 16 will
have the following significant impact on the opening balance of 2019 compared to the consolidated statement of financial position as of December 31, 2018:
| ∎ |
|
a €420 million increase in non-current assets due to the recognition of right-of-use assets relating to leases that were accounted for under IAS 17 as operating leases; |
| ∎ |
|
a €20 million decrease in current assets due to reclassification of certain prepayments to the right-of-use assets; |
| ∎ |
|
a €422 million increase in financial liabilities due to the recognition of lease liabilities relating to leases that were
accounted for under IAS 17 as operating leases; and |
| ∎ |
|
a €22 million decrease in current liabilities due to the reclassification of certain accruals to lease liabilities.
|
In addition to the above impact, the adoption of IFRS 16 will also result in a reclassification of finance lease
liabilities from borrowings to lease liabilities and impact the consolidated income statement and certain of the Company’s key financial metrics as a result of changes in the classification of charges recognized in the consolidated income
statement and the consolidated statement of cash flows. The application of the new standard will decrease both cost of sales and operating costs (excluding depreciation) in the income statement, giving rise to an increase of the underlying Adjusted
EBITDA, but this will largely be offset by corresponding increases in depreciation and finance expenses, and hence the impact on the Company’s Net income for the year will not be material. Net cash flows from operating activities will increase
due to certain lease expenses no longer being recognized as operating cash outflows, however this will be offset by a corresponding decrease in Net cash flows from financing activities due to repayments of the principal amount of lease liabilities.
4. Financial risk management
Overview
The Group has exposure to the following risks
from its use of financial instruments:
This note presents information
about the Group’s exposure to each of the above risks, the Group’s goals, policies and processes for measuring and managing risk, and its management of capital. Further quantitative disclosures are included throughout these consolidated
financial statements.
The Board of Directors has overall responsibility for the oversight of the Group’s risk management
framework.
The Group continues developing and evaluating the Group’s risk management policies with a view to identifying and
analyzing the risks faced, to setting appropriate risk limits and controls, and to monitoring risks and adherence to limits. Risk management policies and systems are reviewed regularly to reflect changes in market conditions and the Group’s
activities. The Group, through its training and management standards and procedures, aims to develop a disciplined and constructive control environment in which all employees understand their roles and obligations.
The Board of Directors oversees the way management monitors compliance with the Group’s risk management policies and procedures and reviews
the adequacy of the risk management framework in relation to the risks the Group faces.
Credit risk
Credit risk is the risk of financial loss to the Group if a customer, bank or other counterparty to a financial instrument were to fail to meet its
contractual obligations. It principally arises from the Group’s receivables from customers. The Group’s most significant customer, which is serviced from multiple locations and under a number of service contracts, accounted for 14% of
revenues in 2018, for 14% of revenues in 2017, and for 13% in 2016.
Trade and other receivables
The Group’s exposure to credit risk is mainly influenced by the individual characteristics of each customer. The makeup of the Group’s
customer base, including the default risk of the industry and the country in which customers operate, has less of an influence on credit risk.
The Group has an established credit policy under which each new customer is analyzed individually for creditworthiness before it begins to trade with the Group. If customers are independently rated, these ratings are used. If there
is no independent rating, the credit quality of the customer is analyzed taking its financial position, past experience and other factors into account.
www.interxion.com / 51
|
|
|
|
|
| CONSOLIDATED FINANCIAL STATEMENTS |
|
|
The Group’s standard terms
require invoices for contracted services to be settled before the services are delivered. In addition to the standard terms, the Group provides service-fee holidays on long-term customer contracts, for which
an accrued revenue balance is accounted. In the event that a customer fails to pay amounts that are due, the Group has a clearly defined escalation policy that can result in a customer’s access to their equipment being denied or in service to
the customer being suspended.
In 2018, 95% (2017: 95% and 2016: 95%) of the Group’s revenue was derived from contracts under which
customers paid an agreed contracted amount, including power on a regular basis (usually monthly or quarterly) or from deferred initial setup fees paid at the outset of the customer contract.
As a result of the Group’s credit policy and the contracted nature of the revenues, losses have been infrequent (see Note 20). Prior to the
transition to IFRS 9, the Group established an allowance that represents its estimate of potential incurred losses in respect of trade and other receivables. This allowance is entirely composed of a specific loss component relating to individually
significant exposures. After the transition to IFRS 9, the Group recognizes trade receivables at the transaction price, minus a loss allowance at an amount equal to lifetime expected credit losses.
Loans granted
The Group has granted USD
7.5 million (excluding accrued interest) in convertible loans to Icolo, a company that is investing in a green field and operating a data center business in Kenya. Interxion has the option to convert the loan into equity on the maturity date or
upon occurrence of an enforcement event. Upon implementation of IFRS 9 – Financial Instruments, the convertible loan is considered a single instrument, to be carried at fair value through profit and loss. Since January 1, 2018, it
has been accounted for as such.
Bank counterparties
The Group has certain obligations under the terms of its Revolving Facility Agreement and Senior Notes which limit disposal of surplus cash balances. The Group monitors its cash position, including counterparty and term risk, on a
daily basis.
Guarantees
Certain of
our subsidiaries have granted guarantees to our lending banks in relation to our facilities. The Company grants rent guarantees to landlords of certain of the Group’s property leases (see Note 24).
Liquidity risk
Liquidity risk is the risk that
the Group will not be able to meet its financial obligations as they fall due. The Group’s approach to managing liquidity is to ensure, as far as possible, that it will always have sufficient liquidity to meet its liabilities when due, under
both normal and stressed conditions, without incurring unacceptable losses or risking damage to its reputation or jeopardizing its future.
The majority of the
Group’s revenues and operating costs are contracted, which assists it in monitoring cash flow requirements, which it does on a daily and weekly basis. Typically, the Group ensures that it has sufficient cash on demand to meet expected normal
operational expenses, including the servicing of financial obligations, for a period of 60 days; this excludes the potential impact of extreme circumstances, such as natural disasters, that cannot reasonably be predicted.
All significant capital expansion projects are subject to formal approval by the Board of Directors, and material expenditure or customer
commitments are made only once the management is satisfied that the Group has adequate committed funding to cover the anticipated expenditure (see Note 22).
Senior Notes
On June 18, 2018, the Company
issued an aggregate principal amount of €1,000 million 4.75% Senior Notes due 2025 (the “Initial Notes”). The net proceeds of the offering were used to redeem the
entire amounts relating to the €625 million Senior Secured Notes due 2020, to repay amounts drawn under our former revolving credit facilities, to pay all related fees,
expenses and premiums and for other general corporate purposes. On September 20, 2018, the Company issued a further €200.0 million aggregate principal amount of 4.75%
Senior Notes due 2025 (the “Additional Notes” and together with the Initial Notes, the “Senior Notes”).
The Senior
Notes are governed by an indenture dated June 18, 2018, between the Company, as issuer, and The Bank of New York Mellon, London Branch, as Trustee (the “Indenture”). The Indenture contains customary restrictive covenants including,
but not limited to, limitations or restrictions on our ability to incur debt, grant liens and sell assets. The restrictive covenants are subject to customary exceptions including, in relation to the incurrence of certain additional debt, a
consolidated fixed charge coverage ratio (calculated as a ratio of Adjusted EBITDA to consolidated interest expense) of at least 2.00 to 1.00 on a pro forma basis for the four full fiscal quarters (taken as one period) for which financial statements
are available immediately preceding the incurrence of such debt. The Senior Notes are guaranteed by certain of the Company’s subsidiaries
On September 20, 2018, the Company issued a further €200.0 million aggregate principal amount of Senior Notes. The net proceeds of the offering amounted
to €203.8 million, net of offering fees and expenses of €2.2 million. The net proceeds contained
the nominal value of the Additional Notes, plus an issuance premium of 103.00%. The Additional Notes, which are guaranteed by certain subsidiaries of the Company, were issued under the Indenture pursuant to which, on June 18, 2018, the Company
issued the Initial Notes.
Revolving Facility Agreements
On June 18, 2018, the Company entered into the €200.0 million revolving facility agreement (the “Revolving Facility Agreement”) between, among
others, InterXion Holding N.V., the arrangers named therein and ABN AMRO Bank N.V. as agent (for the purpose of this section, the “Agent”), pursuant to which the Revolving Facility has been made available to the Company.
52 / www.interxion.com
|
|
|
|
|
|
|
CONSOLIDATED FINANCIAL STATEMENTS |
As at December 31, 2018,
the Revolving Facility was undrawn. In the first quarter of 2019, this facility was increased by €100.0 million for a total commitment of €300.0 million.
Covenants regarding Revolving Facility Agreement
The Revolving Facility Agreement requires us to maintain a specified financial ratio. The restrictive covenants are subject to customary exceptions
including, in relation to the incurrence of certain debt, a consolidated fixed charge coverage ratio (calculated as a ratio of Adjusted EBITDA to consolidated interest expense) of at least 2.00 to 1.00 on a pro forma basis for the four full fiscal
quarters (taken as one period) for which financial statements are available immediately preceding the incurrence of such debt.
The
Revolving Facility Agreement also includes a net leverage ratio (tested on a quarterly basis provided that the aggregate base currency amount of the outstanding loans (excluding any non-cash ancillary
outstandings and any non-cash utilization) exceeds 35% of the total commitments thereunder on the applicable quarter date (the “Test Condition”)), which requires total net debt (calculated as a ratio
to pro forma Adjusted EBITDA of consecutive four quarters) not to exceed 5.00 to 1.00. In addition, the Revolving Facility Agreement permits us to elect, on a one-time basis and subject to certain conditions,
to adjust the financial covenant to 5.50 to 1.00 for two consecutive quarter periods (including the quarter such election is made). In addition, the Company must ensure, under the Revolving Facility Agreement, that the guarantors represent a certain
percentage of Adjusted EBITDA, and a certain percentage of the consolidated net assets of the Group.
The breach of any of these
covenants by the Company or the failure by the Company to maintain its leverage ratio could result in a default under the Revolving Facility Agreement. As of December 31, 2018, the Company’s consolidated fixed charge ratio was 4.01 to 1.00
and the Consolidated Total Net Leverage Ratio was 4.39 to 1.00.
The Company has remained in full compliance with all its covenants. In
addition, the Company does not anticipate, in the next twelve months, any breach or failure that would negatively impact its ability to borrow funds under the Revolving Facility Agreement.
Mortgages
On January 18, 2013, the Group
completed a €10.0 million financing agreement, consisting of two loans that are secured by mortgages on the PAR3 land owned by Interxion Real Estate II Sarl and the PAR5 land
owned by Interxion Real Estate III Sarl and a pledge on the rights under the intergroup lease agreements between Interxion Real Estate II Sarl and Interxion Real Estate III Sarl, as lessors, and Interxion France SAS, as lessee, and are guaranteed by
Interxion France SAS. The principal amounts of the mortgage loans are required to be repaid in quarterly installments collectively amounting to €167,000 of which the first
quarterly installment was paid on April 18, 2013. The mortgage loans have a maturity of 15 years and a variable interest rate based on EURIBOR plus an individual margin ranging from 240 to 280 basis points. The financing agreement requires the
interest rate to be fixed for a minimum
of 40% of the principal
outstanding amount for a minimum of six years. In April 2013, the interest rate was fixed for approximately 75% of the principal outstanding amount for a period of ten years. The financing agreement does not include any financial covenants.
On April 1, 2014, the Group completed a €9.2 million
financing agreement, consisting of a loan that is secured by a mortgage on the data center property in Belgium owned by Interxion Real Estate IX N.V. and a pledge on the rights under the intergroup lease agreement between InterXion Real Estate IX
N.V., as lessor, and InterXion Belgium N.V., as lessee, and is guaranteed by Interxion Real Estate Holding B.V. The principal amount of the mortgage loan is required to be repaid in quarterly installments of €153,330 of which the first quarterly installment was paid on July 31, 2014. The mortgage loan has a maturity of 15 years and a variable interest rate based on EURIBOR plus 200
basis points. The financing agreement does not include any financial covenants.
On October 13, 2015, the Group completed a €15.0 million financing agreement, consisting of a loan that is secured by a mortgage on certain data center property (FRA8 and FRA10) in Germany owned by Interxion Real Estate I
B.V. and a pledge on the rights under the intergroup lease agreement between InterXion Real Estate I B.V., as lessor, and Interxion Deutschland GmbH, as lessee. The principal amount of the mortgage loan is required to be repaid in four annual
installments of €1.0 million of which the first annual installment was paid on September 30, 2016, and a final installment of €11.0 million which is due on September 30, 2020. The mortgage loan has a maturity of five years and has a variable interest rate based on EURIBOR plus 225 basis points. The
financing agreement includes a minimum required debt service capacity ratio of 1.20 to 1.00, based on the operations of Interxion Real Estate I B.V.
On April 8, 2016, the Group completed a €14.6 million financing agreement, consisting of a loan that is secured by a mortgage on certain data center
property in Austria owned by Interxion Real Estate VII GmbH and a pledge on the rights under the intergroup lease agreement between InterXion Real Estate VII GmbH, as lessor, and Interxion Österreich GmbH, as lessee. The principal amount of the
mortgage loan is required to be repaid in 177 monthly installments, increasing from €76,000 to €91,750. The
mortgage loan has a maturity of fourteen years and nine months and has a variable interest rate based on EURIBOR plus 195 basis points. The financing agreement includes a minimum required debt service capacity ratio of 1.20 to 1.00, based on the
operations of Interxion Real Estate VII GmbH.
On December 1, 2017, the Group renewed a €10.0 million financing agreement, entered into in 2012, consisting of a loan that is secured by a mortgage on certain data center property in The Netherlands owned by Interxion
Real Estate IV B.V. The principal amount of the mortgage loan is required to be repaid in four annual instalments of €667,000 commencing in December 2018 and a final installment
of €7,332,000 which is due on December 31, 2022. The mortgage loan has a variable interest rate based on EURIBOR (subject to a zero percent EURIBOR floor) plus 225 basis
points. The financing agreement includes a minimum required debt service capacity ratio of 1.20 to 1.00, based on the operations of Interxion Real Estate IV B.V.
www.interxion.com / 53
|
|
|
|
|
| CONSOLIDATED FINANCIAL STATEMENTS |
|
|
On July 12, 2018, the
Group completed a €6.0 million financing agreement, consisting of a loan that is secured by a mortgage on certain data center property in The Netherlands owned by Interxion
Real Estate V B.V. and a pledge on rights under the intergroup lease agreement between Interxion Real Estate V B.V., as lessor, and Interxion Nederland B.V., as lessee. The principal amount of the mortgage loan is required to be repaid in four
annual instalments of €400,000 commencing July 12, 2019 and a final installment of €4,400,000 which is
due on July 1, 2023. The mortgage loan has a variable interest rate based on EURIBOR plus 225 basis points. The financing agreement includes a minimum required debt service capacity ratio of 1.20 to 1.00, based on the operations of Interxion Real
Estate V B.V.
Further details are in the Borrowing section (see Note 19).
Market risk
Currency risk
The Group is exposed to currency risk on sales, purchases and borrowings that are denominated in a currency other than the respective functional
currencies of Group entities, primarily the euro, but also pounds sterling (GBP), Swiss francs (CHF), Danish kroner (DKK) and Swedish kronor (SEK). The currencies in which these transactions are primarily denominated are EUR, GBP, CHF, DKK, SEK and
USD.
Historically, the revenues and operating costs of each of the Group’s entities have provided an economic hedge against
foreign currency exposure and have not required foreign currency hedging.
It is anticipated that a number of capital expansion projects
will be funded in a currency that is not the functional currency of the entity in which the associated expenditure will be incurred. In the event that this occurs and is material to the Group, the Group will seek to implement an appropriate hedging
strategy.
The majority of the Group’s borrowings are euro denominated and the Company believes that the interest on these
borrowings will be serviced from the cash flows generated by the underlying operations of the Group, the functional currency of which is the euro. The Group’s investments in subsidiaries are not hedged.
Interest rate risk
Following the issue of the
Senior Notes, the Group is not exposed to significant variable interest rate expense for borrowings.
The Group has a number of
mortgages which have variable interest rates, based on EURIBOR plus individual margins. These mortgages are disclosed in “Liquidity Risk—Mortgages” and Note 20 “Financial Instruments”.
Other risks
Price risk
There is a risk that changes in
market circumstances, such as strong unanticipated increases in operational costs, construction of new data centers or churn in customer contracts, will negatively affect the Group’s income. Customers individually have short-term contracts that
require notice before termination. The objective of market risk management is to manage and control market risk exposures within acceptable parameters, while optimizing the return.
The Group is a significant user of power and is exposed to increases in power prices. It uses independent consultants to monitor price changes in
electricity and seeks to negotiate fixed-price term agreements with the power supply companies, not more than for own use, where possible. The risk to the Group is mitigated by the contracted ability to
recover power price increases through adjustments in the pricing for power services.
Capital management
The Group has a capital base comprising its equity, including reserves, Senior Notes, mortgage loans, finance leases and committed debt facilities.
It monitors its solvency ratio, financial leverage, funds from operations and net debt with reference to multiples of its previous 12 months’ Adjusted EBITDA levels. The Company’s policy is to maintain a strong capital base and access to
capital in order to sustain the future development of the business and maintain shareholders’, creditors’ and customers’ confidence.
The principal use of capital in the development of the business is through capital expansion projects for the deployment of further Equipped space in new and existing data centers. Major capital expansion projects are not initiated
unless the Company has access to adequate capital resources to complete the project, and the projects are evaluated against target internal rates of return before approval. Capital expansion projects are continually monitored before and after
completion.
There were no changes in the Group’s approach to capital management during the year.
54 / www.interxion.com
|
|
|
|
|
|
|
CONSOLIDATED FINANCIAL STATEMENTS |
5. Information by
segment
Operating segments are to be identified on the basis of internal reports about components of the Group that are regularly
reviewed by the chief operating decision maker in order to allocate resources to the segments and to assess their performance. The Board of Directors monitors the operating results of its business units separately for the purpose of making decisions
about performance assessments.
There are two segments: the first, Big4, comprises France, Germany, The Netherlands and the United
Kingdom; the second, Rest of Europe, comprises Austria, Belgium, Denmark, Ireland, Spain, Sweden and Switzerland. Shared expenses, such as corporate management, general and administrative expenses, expenses relating to loans and borrowings, and
income tax assets and liabilities, are stated in Corporate and other.
The evaluation of the
performance of the operating segments is primarily based on the measures of revenue and Adjusted EBITDA. Other information, except as noted below, provided to the Board of Directors is measured in a manner consistent with that in the financial
statements.
The geographic information analyzes the Group’s revenues and non-current
assets by country of domicile and other individually material countries. In presenting the geographic information, both revenue and assets excluding deferred tax assets and financial instruments are based on geographic location.
|
|
|
|
|
|
|
|
|
|
|
|
|
|
|
|
|
|
|
|
|
|
|
|
|
|
|
| |
|
Revenues |
|
|
|
|
Non-Current assets excluding deferred
tax assets and
financial instruments |
|
| |
|
2018 |
|
|
2017 |
|
|
2016 |
|
|
|
|
2018 |
|
|
2017 |
|
|
2016 |
|
| France |
|
|
100,391 |
|
|
|
86,180 |
|
|
|
68,816 |
|
|
|
|
|
349,312 |
|
|
|
261,558 |
|
|
|
223,917 |
|
| Germany |
|
|
138,016 |
|
|
|
106,069 |
|
|
|
84,449 |
|
|
|
|
|
442,681 |
|
|
|
374,893 |
|
|
|
281,935 |
|
| The Netherlands |
|
|
84,019 |
|
|
|
80,411 |
|
|
|
70,678 |
|
|
|
|
|
475,757 |
|
|
|
373,390 |
|
|
|
286,604 |
|
| United Kingdom |
|
|
47,882 |
|
|
|
45,977 |
|
|
|
45,831 |
|
|
|
|
|
103,893 |
|
|
|
87,955 |
|
|
|
81,156 |
|
| Other countries |
|
|
191,444 |
|
|
|
170,665 |
|
|
|
152,014 |
|
|
|
|
|
462,168 |
|
|
|
350,624 |
|
|
|
316,644 |
|
| Total |
|
|
561,752 |
|
|
|
489,302 |
|
|
|
421,788 |
|
|
|
|
|
1,833,783 |
|
|
|
1,448,420 |
|
|
|
1,190,256 |
|
|
|
|
|
|
|
|
|
|
|
|
|
|
|
|
|
|
|
|
|
|
|
|
|
|
| Information by segment, 2018 |
|
Big4 |
|
|
Rest of Europe |
|
|
Subtotal |
|
|
Corporate |
|
|
Total |
|
| |
|
|
|
|
|
|
|
|
|
|
|
|
|
and other |
|
|
|
|
| |
|
|
|
|
|
|
|
|
|
|
(€’000) |
|
|
|
|
|
|
|
| Recurring revenue |
|
|
352,692 |
|
|
|
180,391 |
|
|
|
|
|
|
|
533,083 |
|
|
|
— |
|
|
|
533,083 |
|
|
Non-recurring revenue |
|
|
17,616 |
|
|
|
11,053 |
|
|
|
|
|
|
|
28,669 |
|
|
|
— |
|
|
|
28,669 |
|
| Total revenue |
|
|
370,308 |
|
|
|
191,444 |
|
|
|
|
|
|
|
561,752 |
|
|
|
— |
|
|
|
561,752 |
|
| Cost of sales |
|
|
(141,312 |
) |
|
|
(63,464 |
) |
|
|
|
|
|
|
(204,776 |
) |
|
|
(14,686 |
) |
|
|
(219,462 |
) |
| Gross profit/(loss) |
|
|
228,996 |
|
|
|
127,980 |
|
|
|
|
|
|
|
356,976 |
|
|
|
(14,686 |
) |
|
|
342,290 |
|
| Other income |
|
|
86 |
|
|
|
— |
|
|
|
|
|
|
|
86 |
|
|
|
— |
|
|
|
86 |
|
| Sales and marketing costs |
|
|
(10,562 |
) |
|
|
(6,380 |
) |
|
|
|
|
|
|
(16,942 |
) |
|
|
(19,552 |
) |
|
|
(36,494 |
) |
| General and administrative
costs |
|
|
(100,660 |
) |
|
|
(44,543 |
) |
|
|
|
|
|
|
(145,203 |
) |
|
|
(49,443 |
) |
|
|
(194,646 |
) |
| Operating income |
|
|
117,860 |
|
|
|
77,057 |
|
|
|
|
|
|
|
194,917 |
|
|
|
(83,681 |
) |
|
|
111,236 |
|
| Net finance expense |
|
|
|
|
|
|
|
|
|
|
|
|
|
|
|
|
|
|
|
|
|
|
(61,784 |
) |
| Profit before taxation |
|
|
|
|
|
|
|
|
|
|
|
|
|
|
|
|
|
|
|
|
|
|
49,452 |
|
| |
|
|
|
|
|
|
|
|
|
|
|
|
|
|
|
|
|
|
|
|
|
|
|
|
| Total assets |
|
|
1,508,967 |
|
|
|
520,834 |
|
|
|
|
|
|
|
2,029,801 |
|
|
|
232,753 |
|
|
|
2,262,554 |
|
| Total liabilities |
|
|
311,140 |
|
|
|
111,762 |
|
|
|
|
|
|
|
422,902 |
|
|
|
1,206,232 |
|
|
|
1,629,134 |
|
| Capital expenditures, including intangible
assets(1) |
|
|
(318,595 |
) |
|
|
(113,775 |
) |
|
|
|
|
|
|
(432,370 |
) |
|
|
(18,809 |
) |
|
|
(451,179 |
) |
| Depreciation and amortization |
|
|
84,943 |
|
|
|
33,964 |
|
|
|
|
|
|
|
118,907 |
|
|
|
10,047 |
|
|
|
108,252 |
|
| Adjusted EBITDA(2)
|
|
|
203,796 |
|
|
|
113,653 |
|
|
|
|
|
|
|
317,449 |
|
|
|
(59,651 |
) |
|
|
257,798 |
|
www.interxion.com / 55
|
|
|
|
|
| CONSOLIDATED FINANCIAL STATEMENTS |
|
|
|
|
|
|
|
|
|
|
|
|
|
|
|
|
|
|
|
|
|
|
|
|
|
|
|
|
|
|
|
|
|
|
|
| Information by segment, 2017 |
|
Big4 |
|
|
Rest of Europe |
|
|
Subtotal |
|
|
Corporate
and other |
|
|
Total |
|
| |
|
|
|
|
|
|
|
|
|
|
(€’000) |
|
|
|
|
|
|
|
|
|
|
|
|
|
| Recurring revenue |
|
|
302,346 |
|
|
|
160,170 |
|
|
|
|
|
|
|
462,516 |
|
|
|
|
|
|
|
— |
|
|
|
|
|
|
|
462,516 |
|
|
Non-recurring revenue |
|
|
16,291 |
|
|
|
10,495 |
|
|
|
|
|
|
|
26,786 |
|
|
|
|
|
|
|
— |
|
|
|
|
|
|
|
26,786 |
|
| Total revenue |
|
|
318,637 |
|
|
|
170,665 |
|
|
|
|
|
|
|
489,302 |
|
|
|
|
|
|
|
— |
|
|
|
|
|
|
|
489,302 |
|
| Cost of sales |
|
|
(119,931 |
) |
|
|
(57,810 |
) |
|
|
|
|
|
|
(177,741 |
) |
|
|
|
|
|
|
(12,730 |
) |
|
|
|
|
|
|
(190,471 |
) |
| Gross profit/(loss) |
|
|
198,706 |
|
|
|
112,855 |
|
|
|
|
|
|
|
311,561 |
|
|
|
|
|
|
|
(12,730 |
) |
|
|
|
|
|
|
298,831 |
|
| Other income |
|
|
97 |
|
|
|
— |
|
|
|
|
|
|
|
97 |
|
|
|
|
|
|
|
— |
|
|
|
|
|
|
|
97 |
|
| Sales and marketing costs |
|
|
(9,780 |
) |
|
|
(5,891 |
) |
|
|
|
|
|
|
(15,671 |
) |
|
|
|
|
|
|
(17,794 |
) |
|
|
|
|
|
|
(33,465 |
) |
| General and administrative
costs |
|
|
(87,903 |
) |
|
|
(37,045 |
) |
|
|
|
|
|
|
(124,948 |
) |
|
|
|
|
|
|
(42,242 |
) |
|
|
|
|
|
|
(167,190 |
) |
| Operating income |
|
|
101,120 |
|
|
|
69,919 |
|
|
|
|
|
|
|
171,039 |
|
|
|
|
|
|
|
(72,766 |
) |
|
|
|
|
|
|
98,273 |
|
| Net finance expense |
|
|
|
|
|
|
|
|
|
|
|
|
|
|
|
|
|
|
|
|
|
|
|
|
|
|
|
|
|
|
(44,367 |
) |
| Profit before taxation |
|
|
|
|
|
|
|
|
|
|
|
|
|
|
|
|
|
|
|
|
|
|
|
|
|
|
|
|
|
|
53,906 |
|
| |
|
|
|
|
|
|
|
|
|
|
|
|
|
|
|
|
|
|
|
|
|
|
|
|
|
|
|
|
|
|
|
|
| Total assets |
|
|
1,229,960 |
|
|
|
393,644 |
|
|
|
|
|
|
|
1,623,604 |
|
|
|
|
|
|
|
78,467 |
|
|
|
|
|
|
|
1,702,071 |
|
| Total liabilities |
|
|
274,076 |
|
|
|
78,247 |
|
|
|
|
|
|
|
352,323 |
|
|
|
|
|
|
|
760,087 |
|
|
|
|
|
|
|
1,112,410 |
|
| Capital expenditures, including intangible
assets(1) |
|
|
(174,818 |
) |
|
|
(69,832 |
) |
|
|
|
|
|
|
(244,650 |
) |
|
|
|
|
|
|
(11,365 |
) |
|
|
|
|
|
|
(256,015 |
) |
| Depreciation and amortization |
|
|
72,721 |
|
|
|
29,365 |
|
|
|
|
|
|
|
102,086 |
|
|
|
|
|
|
|
6,166 |
|
|
|
|
|
|
|
108,252 |
|
| Adjusted
EBITDA(2) |
|
|
174,818 |
|
|
|
99,665 |
|
|
|
|
|
|
|
274,483 |
|
|
|
|
|
|
|
(53,522 |
) |
|
|
|
|
|
|
220,961 |
|
|
|
|
|
|
|
| Information by segment, 2016 |
|
Big4 |
|
|
Rest of Europe |
|
|
Subtotal |
|
|
Corporate
and other |
|
|
Total |
|
| |
|
|
|
|
|
|
|
|
|
|
(€’000) |
|
|
|
|
|
|
|
|
|
|
|
|
|
| Recurring revenue |
|
|
256,004 |
|
|
|
143,954 |
|
|
|
|
|
|
|
399,958 |
|
|
|
|
|
|
|
— |
|
|
|
|
|
|
|
399,958 |
|
|
Non-recurring revenue |
|
|
13,770 |
|
|
|
8,060 |
|
|
|
|
|
|
|
21,830 |
|
|
|
|
|
|
|
— |
|
|
|
|
|
|
|
21,830 |
|
| Total revenue |
|
|
269,774 |
|
|
|
152,014 |
|
|
|
|
|
|
|
421,788 |
|
|
|
|
|
|
|
— |
|
|
|
|
|
|
|
421,788 |
|
| Cost of sales |
|
|
(100,921 |
) |
|
|
(51,769 |
) |
|
|
|
|
|
|
(152,690 |
) |
|
|
|
|
|
|
(9,878 |
) |
|
|
|
|
|
|
(162,568 |
) |
| Gross profit/(loss) |
|
|
168,853 |
|
|
|
100,245 |
|
|
|
|
|
|
|
269,098 |
|
|
|
|
|
|
|
(9,878 |
) |
|
|
|
|
|
|
259,220 |
|
| Other income |
|
|
333 |
|
|
|
— |
|
|
|
|
|
|
|
333 |
|
|
|
|
|
|
|
— |
|
|
|
|
|
|
|
333 |
|
| Sales and marketing costs |
|
|
(8,390 |
) |
|
|
(5,209 |
) |
|
|
|
|
|
|
(13,599 |
) |
|
|
|
|
|
|
(16,342 |
) |
|
|
|
|
|
|
(29,941 |
) |
| General and administrative
costs |
|
|
(73,238 |
) |
|
|
(32,632 |
) |
|
|
|
|
|
|
(105,870 |
) |
|
|
|
|
|
|
(32,687 |
) |
|
|
|
|
|
|
(138,557 |
) |
| Operating income |
|
|
87,558 |
|
|
|
62,404 |
|
|
|
|
|
|
|
149,962 |
|
|
|
|
|
|
|
(58,907 |
) |
|
|
|
|
|
|
91,055 |
|
| Net finance expense |
|
|
|
|
|
|
|
|
|
|
|
|
|
|
|
|
|
|
|
|
|
|
|
|
|
|
|
|
|
|
(36,269 |
) |
| Profit before taxation |
|
|
|
|
|
|
|
|
|
|
|
|
|
|
|
|
|
|
|
|
|
|
|
|
|
|
|
|
|
|
56,333 |
|
| |
|
|
|
|
|
|
|
|
|
|
|
|
|
|
|
|
|
|
|
|
|
|
|
|
|
|
|
|
|
|
|
|
| Total assets |
|
|
990,406 |
|
|
|
363,444 |
|
|
|
|
|
|
|
1,353,850 |
|
|
|
|
|
|
|
128,815 |
|
|
|
|
|
|
|
1,482,665 |
|
| Total liabilities |
|
|
202,330 |
|
|
|
73,613 |
|
|
|
|
|
|
|
275,943 |
|
|
|
|
|
|
|
657,953 |
|
|
|
|
|
|
|
933,896 |
|
| Capital expenditures, including intangible
assets(1) |
|
|
(170,707 |
) |
|
|
(69,650 |
) |
|
|
|
|
|
|
(240,357 |
) |
|
|
|
|
|
|
(10,521 |
) |
|
|
|
|
|
|
(250,878 |
) |
| Depreciation and amortization |
|
|
60,128 |
|
|
|
25,371 |
|
|
|
|
|
|
|
85,499 |
|
|
|
|
|
|
|
4,336 |
|
|
|
|
|
|
|
89,835 |
|
| Adjusted
EBITDA(2) |
|
|
148,191 |
|
|
|
88,195 |
|
|
|
|
|
|
|
236,386 |
|
|
|
|
|
|
|
(45,510 |
) |
|
|
|
|
|
|
190,876 |
|
(i) Certain figures as of December 31, 2017 and 2016 have been corrected compared to those previously
reported. For further information on these corrections, see Notes 2 and 28 of these 2018 consolidated financial statements.
56 / www.interxion.com
|
|
|
|
|
|
|
CONSOLIDATED FINANCIAL STATEMENTS |
Reconciliation to adjusted EBITDA
|
|
|
|
|
|
|
|
|
|
|
|
|
| Consolidated |
|
2018 |
|
|
2017 |
|
|
2016 |
|
| |
|
|
|
|
(€’000) |
|
|
|
|
| Net income |
|
|
31,118 |
|
|
|
39,067 |
|
|
|
38,336 |
|
| Income tax expense |
|
|
18,334 |
|
|
|
14,839 |
|
|
|
16,450 |
|
| Profit before taxation |
|
|
49,452 |
|
|
|
53,906 |
|
|
|
54,786 |
|
| Finance income |
|
|
(4,094 |
) |
|
|
(1,411 |
) |
|
|
(1,206 |
) |
| Finance expense |
|
|
65,878 |
|
|
|
45,778 |
|
|
|
37,475 |
|
| Operating income |
|
|
111,236 |
|
|
|
98,273 |
|
|
|
91,055 |
|
| Depreciation and amortization |
|
|
128,954 |
|
|
|
108,252 |
|
|
|
89,835 |
|
| Share-based payments |
|
|
12,704 |
|
|
|
9,929 |
|
|
|
7,890 |
|
| M&A transaction costs(3) |
|
|
3,235 |
|
|
|
4,604 |
|
|
|
2,429 |
|
| Re-assessment of indirect
taxes(4) |
|
|
1,755 |
|
|
|
— |
|
|
|
— |
|
| Income from sub-leases of
unused data center sites(5) |
|
|
(86 |
) |
|
|
(97 |
) |
|
|
(95 |
) |
| Increase/(decrease) in provision for site restoration(6) |
|
|
— |
|
|
|
— |
|
|
|
(238 |
) |
| Adjusted EBITDA(2) |
|
|
257,798 |
|
|
|
220,961 |
|
|
|
190,876 |
|
|
|
|
|
|
|
|
|
|
|
|
|
|
| Big4 |
|
2018 |
|
|
2017 |
|
|
2016 |
|
| |
|
|
|
|
(€’000) |
|
|
|
|
| Operating income |
|
|
117,860 |
|
|
|
101,120 |
|
|
|
87,558 |
|
| Depreciation and amortization |
|
|
84,943 |
|
|
|
72,721 |
|
|
|
60,128 |
|
| Share-based payments |
|
|
1,079 |
|
|
|
1,074 |
|
|
|
838 |
|
| Income from sub-leases of
unused data center sites(5) |
|
|
(86 |
) |
|
|
(97 |
) |
|
|
(95 |
) |
| Increase/(decrease) in provision for site restoration(6) |
|
|
— |
|
|
|
— |
|
|
|
(238 |
) |
| Adjusted EBITDA(2) |
|
|
203,796 |
|
|
|
174,818 |
|
|
|
148,191 |
|
|
|
|
|
|
|
|
|
|
|
|
|
|
| Rest of Europe |
|
2018 |
|
|
2017 |
|
|
2016 |
|
| |
|
|
|
|
(€’000) |
|
|
|
|
| Operating income |
|
|
77,057 |
|
|
|
69,919 |
|
|
|
62,404 |
|
| Depreciation and amortization |
|
|
33,964 |
|
|
|
29,365 |
|
|
|
25,371 |
|
| Re-assessment of indirect
taxes(4) |
|
|
1,755 |
|
|
|
— |
|
|
|
— |
|
| Share-based payments |
|
|
877 |
|
|
|
381 |
|
|
|
420 |
|
| Adjusted
EBITDA(2) |
|
|
113,653 |
|
|
|
99,665 |
|
|
|
88,195 |
|
|
|
|
|
|
|
|
|
|
|
|
|
|
| Corporate and other |
|
|
2018 |
|
|
|
2017 |
|
|
|
2016 |
|
| |
|
|
|
|
(€’000) |
|
|
|
|
| Operating income |
|
|
(83,681 |
) |
|
|
(72,766) |
|
|
|
(58,907 |
) |
| Depreciation and amortization |
|
|
10,047 |
|
|
|
6,166 |
|
|
|
4,336 |
|
| Share-based payments |
|
|
10,748 |
|
|
|
8,474 |
|
|
|
6,632 |
|
| M&A transaction costs (3) |
|
|
3,235 |
|
|
|
4,604 |
|
|
|
2,429 |
|
| Adjusted EBITDA(2) |
|
|
(59,651 |
) |
|
|
(53,522) |
|
|
|
(45,510 |
) |
www.interxion.com / 57
|
|
|
|
|
| CONSOLIDATED FINANCIAL STATEMENTS |
|
|
Notes:
| 1) |
Capital expenditure, including intangible assets, represent payments to acquire property, plant
and equipment and intangible assets, as recorded in the consolidated statement of cash flows as “Purchase of property, plant and equipment” and “Purchase of intangible assets” respectively. |
| 2) |
“Adjusted EBITDA” is a non-IFRS financial
measure. See “Non-IFRS Financial Measures” for more information on this measure, including why we believe that this supplemental measure is useful, and the limitations on the use of this supplemental
measure. |
| 3) |
“M&A transaction costs” are costs associated with the evaluation, diligence and
conclusion or termination of merger or acquisition activity. These costs are included in “General and administrative costs”
|
| 4) |
This re-assessment relates to years prior to 2018 and is
therefore not representative of our current ongoing business. |
| 5) |
“Income from sub-leases of unused data center
sites” represents the income on sub-lease of portions of unused data center sites to third parties. This income is treated as “Other income”. |
| 6) |
“Increase/(decrease) in provision for site restoration” represents income or expense
related to the termination of data center sites. This item is treated as “Other income”. |
6. Revenue from
contracts with customers
Disaggregated revenue information
Revenue consists of colocation revenue derived from the rendering of data center services, which includes customer installation services and
equipment sales.
|
|
|
|
|
|
|
|
|
|
|
|
|
| |
|
For the year ended December 31, 2018 |
|
|
|
|
| |
|
Recurring revenues,
mainly from primary
data center services
and recurring hands
and eyes services |
|
Non-recurring revenues,
from additional setup
and installations and
hands and eyes services
on demand |
|
Total |
| Geographical region |
|
|
|
|
|
|
|
|
(€’000) |
|
|
|
| France |
|
|
|
94,165 |
|
|
|
|
6,226 |
|
|
100,391 |
| Germany |
|
|
|
130,139 |
|
|
|
|
7,877 |
|
|
138,016 |
| The Netherlands |
|
|
|
82,467 |
|
|
|
|
1,552 |
|
|
84,019 |
| United Kingdom |
|
|
|
45,921 |
|
|
|
|
1,961 |
|
|
47,882 |
| Other countries |
|
|
|
180,391 |
|
|
|
|
11,053 |
|
|
191,444 |
| Total revenue from contracts with customers |
|
|
|
533,083 |
|
|
|
|
28,669 |
|
|
561,752 |
|
|
| |
|
For the year ended December 31, 2017 |
|
|
|
|
| |
|
Recurring revenues,
mainly from primary
data center services
and recurring hands
and eyes services |
|
Non-recurring revenues,
from additional setup
and installations and
hands and eyes services
on demand |
|
Total |
| Geographical region |
|
|
|
|
|
|
|
|
(€’000) |
|
|
|
| France |
|
|
|
79,816 |
|
|
|
|
6,364 |
|
|
86,180 |
| Germany |
|
|
|
99,478 |
|
|
|
|
6,591 |
|
|
106,069 |
| The Netherlands |
|
|
|
78,712 |
|
|
|
|
1,699 |
|
|
80,411 |
| United Kingdom |
|
|
|
44,340 |
|
|
|
|
1,637 |
|
|
45,977 |
| Other countries |
|
|
|
160,170 |
|
|
|
|
10,495 |
|
|
170,665 |
| Total revenue from contracts with customers |
|
|
|
462,516 |
|
|
|
|
26,786 |
|
|
489,302 |
58 / www.interxion.com
|
|
|
|
|
|
|
CONSOLIDATED FINANCIAL STATEMENTS |
|
|
|
|
|
|
|
|
|
|
|
|
|
| |
|
For the year ended December 31, 2016 |
|
|
|
|
| |
|
Recurring revenues,
mainly from primary
data center services
and recurring hands
and eyes services |
|
Non-recurring revenues,
from additional setup
and installations and
hands and eyes services
on demand |
|
Total |
| Geographical region |
|
|
|
|
|
|
|
|
(€’000) |
|
|
|
| France |
|
|
|
65,333 |
|
|
|
|
3,483 |
|
|
68,816 |
| Germany |
|
|
|
78,439 |
|
|
|
|
6,010 |
|
|
84,449 |
| The Netherlands |
|
|
|
68,206 |
|
|
|
|
2,472 |
|
|
70,678 |
| United Kingdom |
|
|
|
44,025 |
|
|
|
|
1,806 |
|
|
45,831 |
| Other countries |
|
|
|
143,954 |
|
|
|
|
8,060 |
|
|
152,014 |
| Total revenue from contracts with customers |
|
|
|
399,957 |
|
|
|
|
21,831 |
|
|
421,788 |
Considerations from contracts with customers which have been received or which are receivable at reporting date,
have not been adjusted for any financing component, since the period between fulfilling performance obligations and receipt of the consideration is less than one year.
The Group did not incur significant incremental costs to obtain contracts with customers. There are no significant assets relating to costs to
fulfil contracts with customers.
Contract balances
The following table provides information about receivables, contract assets and contracts liabilities from contracts with customers.
|
|
|
|
|
|
|
| |
|
December 31, 2018 |
|
January 1, 2018
(€’000) |
|
| Trade receivables |
|
99,904 |
|
|
113,518 |
|
| Contract assets |
|
41,754 |
|
|
36,575 |
|
| Contract liabilities (current) |
|
(60,472) |
|
|
(73,262 |
) |
| Contract liabilities
(non-current) |
|
(11,045) |
|
|
(7,557 |
) |
The contract assets primarily relate to the Group’s rights to consideration for services provided but not
billed at the reporting date. The contract assets are transferred to Trade receivables when the rights become unconditional, which is usually when the Group issues an invoice to the customer.
The contract liabilities primarily relate to the advance consideration received from customers for setup and installation work that is directly
related to primary data center services and has been executed close to commencement date of the customer contracts. The amounts included in the current contract liability balance at the beginning of 2018, have been recognized as revenue during the
year.
7. General and administrative costs
The general and administrative costs consist of the following components:
|
|
|
|
|
|
|
|
|
|
|
|
|
| |
|
2018 |
|
|
2017 |
|
|
2016 |
|
| |
|
|
|
|
(€’000) |
|
|
|
|
| Depreciation and amortization |
|
|
128,954 |
|
|
|
108,252 |
|
|
|
89,835 |
|
| Share-based payments |
|
|
12,704 |
|
|
|
9,929 |
|
|
|
7,890 |
|
| M&A transaction costs |
|
|
3,235 |
|
|
|
4,604 |
|
|
|
2,429 |
|
| Employee benefit expenses (excluding share-based payments) |
|
|
18,407 |
|
|
|
16,918 |
|
|
|
16,279 |
|
| Other general and administrative costs |
|
|
31,346 |
|
|
|
27,487 |
|
|
|
22,124 |
|
| |
|
|
194,646 |
|
|
|
167,190 |
|
|
|
138,557 |
|
www.interxion.com / 59
|
|
|
|
|
| CONSOLIDATED FINANCIAL STATEMENTS |
|
|
8. Employee
benefit expenses
The Group employed an average of 720 employees (full-time equivalents) during 2018 (2017: 638 and 2016: 574). Costs
incurred in respect of these employees were:
|
|
|
|
|
|
|
|
|
|
|
|
|
| |
|
2018 |
|
|
2017 |
|
|
2016 |
|
| |
|
|
|
|
(€’000) |
|
|
|
|
| Salaries and bonuses |
|
|
57,689 |
|
|
|
50,580 |
|
|
|
44,556 |
|
| Social security charges |
|
|
9,424 |
|
|
|
8,147 |
|
|
|
7,113 |
|
| Contributions to defined contribution pension plans |
|
|
3,303 |
|
|
|
3,063 |
|
|
|
2,571 |
|
| Other personnel-related costs |
|
|
9,243 |
|
|
|
8,572 |
|
|
|
7,844 |
|
| Share-based payments |
|
|
12,704 |
|
|
|
9,929 |
|
|
|
7,890 |
|
| |
|
|
92,363 |
|
|
|
80,291 |
|
|
|
69,974 |
|
The following income statement line items include employee benefit expenses of:
|
|
|
|
|
|
|
|
|
|
|
|
|
| |
|
2018 |
|
|
2017 |
|
|
2016 |
|
| |
|
|
|
|
(€’000) |
|
|
|
|
| Costs of sales |
|
|
38,027 |
|
|
|
31,877 |
|
|
|
26,539 |
|
| Sales and marketing costs |
|
|
23,225 |
|
|
|
21,567 |
|
|
|
19,274 |
|
| General and administrative costs |
|
|
31,111 |
|
|
|
26,847 |
|
|
|
24,161 |
|
| |
|
|
92,363 |
|
|
|
80,291 |
|
|
|
69,974 |
|
The Group operates a defined contribution scheme for most of its employees. The contributions are made in
accordance with the scheme and are expensed in the income statement as incurred.
9. Finance income and expense
|
|
|
|
|
|
|
|
|
|
|
|
|
| |
|
2018 |
|
|
2017 |
|
|
2016 |
|
| |
|
|
|
|
(€’000) |
|
|
|
|
| Bond premium and fees in income |
|
|
3,140 |
|
|
|
1,188 |
|
|
|
790 |
|
| Bank and other interest |
|
|
477 |
|
|
|
223 |
|
|
|
135 |
|
| Profit from sale of financial asset |
|
|
— |
|
|
|
— |
|
|
|
281 |
|
| Fair value adjustment of convertible loan |
|
|
469 |
|
|
|
— |
|
|
|
— |
|
| Net foreign currency exchange gain |
|
|
8 |
|
|
|
— |
|
|
|
— |
|
| Finance income |
|
|
4,094 |
|
|
|
1,411 |
|
|
|
1,206 |
|
| Interest expense on Senior (Secured) Notes, bank and other
loans |
|
|
(49,262) |
|
|
|
(37,706 |
) |
|
|
(33,095 |
) |
| Interest expense on finance leases |
|
|
(3,375) |
|
|
|
(3,667 |
) |
|
|
(1,750 |
) |
| Bond premium and fees in expense |
|
|
(945) |
|
|
|
— |
|
|
|
— |
|
| Interest expense on provision for onerous lease contracts |
|
|
— |
|
|
|
— |
|
|
|
(16 |
) |
| Other financial expenses |
|
|
(12,296) |
|
|
|
(2,707 |
) |
|
|
(1,765 |
) |
| Net foreign currency exchanges loss |
|
|
— |
|
|
|
(1,698 |
) |
|
|
(849 |
) |
| Finance expense |
|
|
(65,878) |
|
|
|
(45,778 |
) |
|
|
(37,475 |
) |
| Net finance expense |
|
|
(61,784) |
|
|
|
(44,367 |
) |
|
|
(36,269 |
) |
60 / www.interxion.com
|
|
|
|
|
|
|
CONSOLIDATED FINANCIAL STATEMENTS |
In 2018, the “Interest expense on Senior (Secured) Notes, bank loans and other loans”
increased principally as result of the impact of the refinancing completed in June 2018 and the bond tap completed in September 2018.
In 2018, “Other financial expenses” includes the impact of gains and losses recognized with respect to the redemption of the Senior
Secured Notes due 2020 and the termination of three revolving credit facility agreements.
“Fair value adjustment of convertible
loans” reflects the changes in the fair value of convertible loans given to Icolo Ltd., which are carried at FVTPL. Interest income relating to these convertible loans are included in “Bank and other interest”.
“Profit from sale of financial asset” reflects the profit realized in 2016 on the sale of the Group’s shares in iStreamPlanet Co.
“Interest expense on finance leases” in 2016 was impacted by a
€1.4 million adjustment reducing the finance lease obligations.
10. Income taxes
|
|
|
|
|
|
|
|
|
|
|
|
|
| INCOME TAX EXPENSE |
|
|
|
|
|
|
|
|
|
| |
|
2018 |
|
|
2017 |
|
|
2016 |
|
| |
|
|
|
|
(€’000) |
|
|
|
|
| Current taxes |
|
|
(17,990) |
|
|
|
(13,814 |
) |
|
|
(11,421 |
) |
| Deferred taxes |
|
|
(344) |
|
|
|
(1,025 |
) |
|
|
(5,029 |
) |
| Total income tax expense |
|
|
(18,334) |
|
|
|
(14,839 |
) |
|
|
(16,450 |
) |
Reconciliation of effective tax rate
A reconciliation between income taxes calculated at the Dutch statutory tax rate of 25% in 2018 (25% in 2017 and 2016) and the actual tax
benefit/(expense) with an effective tax rate of 37.1% (27.5% in 2017 and 30.0% in 2016) is as follows:
|
|
|
|
|
|
|
|
|
|
|
|
|
|
|
|
|
|
|
|
|
|
|
|
|
| |
|
2018
(€’000) |
|
|
|
|
|
2017
(€’000) |
|
|
|
|
|
2016
(€’000) |
|
|
|
|
| Net income |
|
|
31,118 |
|
|
|
|
|
|
|
39,067 |
|
|
|
|
|
|
|
38,336 |
|
|
|
|
|
| Income tax expense |
|
|
18,334 |
|
|
|
|
|
|
|
14,839 |
|
|
|
|
|
|
|
16,450 |
|
|
|
|
|
| Profit before taxation |
|
|
49,452 |
|
|
|
|
|
|
|
53,906 |
|
|
|
|
|
|
|
54,786 |
|
|
|
|
|
| Income tax using Company’s domestic tax rate |
|
|
(12,363 |
) |
|
|
25.0% |
|
|
|
(13,477) |
|
|
|
25.0% |
|
|
|
(13,697) |
|
|
|
25.0% |
|
| Effect of tax rates in foreign jurisdictions |
|
|
(24 |
) |
|
|
0.0% |
|
|
|
(99) |
|
|
|
0.2% |
|
|
|
(844) |
|
|
|
1.5% |
|
| Change in tax rate and legislation |
|
|
(2,768 |
) |
|
|
5.6% |
|
|
|
554 |
|
|
|
(1.0%) |
|
|
|
367 |
|
|
|
(0.7%) |
|
| Non-deductible
expenses |
|
|
(3,329 |
) |
|
|
6.7% |
|
|
|
(2,496) |
|
|
|
4.6% |
|
|
|
(2,197) |
|
|
|
4.0% |
|
| Recognition of previously unrecognized tax losses |
|
|
— |
|
|
|
0.0% |
|
|
|
— |
|
|
|
0.0% |
|
|
|
147 |
|
|
|
(0.3%) |
|
| Prior year adjustments included in current year tax |
|
|
657 |
|
|
|
(1.3% |
) |
|
|
201 |
|
|
|
(0.4%) |
|
|
|
(354) |
|
|
|
0.7% |
|
| Other |
|
|
(507 |
) |
|
|
1.1% |
|
|
|
478 |
|
|
|
(0.9%) |
|
|
|
128 |
|
|
|
(0.0%) |
|
| Income tax expense |
|
|
(18,334 |
) |
|
|
37.1% |
|
|
|
(14,839) |
|
|
|
27.5% |
|
|
|
(16,450) |
|
|
|
30.0% |
|
www.interxion.com / 61
|
|
|
|
|
| CONSOLIDATED FINANCIAL STATEMENTS |
|
|
Recognized deferred tax assets/(liabilities)
The movement in recognized deferred tax assets during the year is as follows:
|
|
|
|
|
|
|
|
|
|
|
|
|
|
|
|
|
|
|
|
|
|
|
|
|
|
|
|
|
|
|
|
|
|
|
|
|
| |
|
Property,
plant and
equipment,
and
Intangibles |
|
|
Provision
onerous
contracts |
|
|
Other |
|
|
Tax loss
carry-
forward |
|
|
|
|
|
Total |
|
|
|
|
|
Of which
reported
as
Deferred
tax
assets |
|
|
Of which
reported
as
Deferred
tax
liabilities |
|
| |
|
|
|
|
|
|
|
(€’000) |
|
|
|
|
|
|
|
|
|
|
|
|
|
|
|
|
|
|
|
| Net deferred tax assets/ (liabilities) January 1, 2016(i) |
|
|
(6,790 |
) |
|
|
484 |
|
|
|
2,855 |
|
|
|
18,356 |
|
|
|
|
|
|
|
14,905 |
|
|
|
|
|
|
|
23,024 |
|
|
|
(8,119 |
) |
| Recognized in profit/(loss) for 2016 |
|
|
(856 |
) |
|
|
(484 |
) |
|
|
(618 |
) |
|
|
(3,071 |
) |
|
|
|
|
|
|
(5,029 |
) |
|
|
|
|
|
|
|
|
|
|
|
|
| Recognized in equity |
|
|
— |
|
|
|
— |
|
|
|
— |
|
|
|
1,835 |
|
|
|
|
|
|
|
1,835 |
|
|
|
|
|
|
|
|
|
|
|
|
|
| Effects of movements in exchange rates |
|
|
985 |
|
|
|
— |
|
|
|
(228 |
) |
|
|
(123 |
) |
|
|
|
|
|
|
635 |
|
|
|
|
|
|
|
|
|
|
|
|
|
| Net deferred tax assets/ (liabilities) December 31, 2016(i) |
|
|
(6,661 |
) |
|
|
— |
|
|
|
2,009 |
|
|
|
16,997 |
|
|
|
|
|
|
|
12,345 |
|
|
|
|
|
|
|
20,370 |
|
|
|
(8,025 |
) |
| Recognized in profit/(loss) for 2017 |
|
|
(4,019 |
) |
|
|
— |
|
|
|
639 |
|
|
|
2,355 |
|
|
|
|
|
|
|
(1,025 |
) |
|
|
|
|
|
|
|
|
|
|
|
|
| Recognized in equity |
|
|
— |
|
|
|
— |
|
|
|
(37 |
) |
|
|
205 |
|
|
|
|
|
|
|
168 |
|
|
|
|
|
|
|
|
|
|
|
|
|
| Acquisitions through business combinations |
|
|
(7,790 |
) |
|
|
— |
|
|
|
70 |
|
|
|
915 |
|
|
|
|
|
|
|
(6,805 |
) |
|
|
|
|
|
|
|
|
|
|
|
|
| Effects of movements in exchange rates |
|
|
174 |
|
|
|
— |
|
|
|
(76 |
) |
|
|
(89 |
) |
|
|
|
|
|
|
9 |
|
|
|
|
|
|
|
|
|
|
|
|
|
| Net deferred tax assets/ (liabilities) December 31, 2017(i) |
|
|
(18,296 |
) |
|
|
— |
|
|
|
2,605 |
|
|
|
20,383 |
|
|
|
|
|
|
|
4,692 |
|
|
|
|
|
|
|
24,470 |
|
|
|
(19,778 |
) |
| Recognized in profit/(loss) for 2018 |
|
|
(3,707 |
) |
|
|
— |
|
|
|
489 |
|
|
|
2,875 |
|
|
|
|
|
|
|
(343 |
) |
|
|
|
|
|
|
24,470 |
|
|
|
(19,778 |
) |
| Recognized in equity |
|
|
— |
|
|
|
— |
|
|
|
601 |
|
|
|
— |
|
|
|
|
|
|
|
601 |
|
|
|
|
|
|
|
|
|
|
|
|
|
| Effects of movements in exchange rates |
|
|
80 |
|
|
|
— |
|
|
|
(6 |
) |
|
|
(92 |
) |
|
|
|
|
|
|
(18 |
) |
|
|
|
|
|
|
|
|
|
|
|
|
| Net deferred tax assets/ (liabilities) December 31, 2018 |
|
|
(21,923 |
) |
|
|
— |
|
|
|
3,689 |
|
|
|
23,166 |
|
|
|
|
|
|
|
4,932 |
|
|
|
|
|
|
|
21,807 |
|
|
|
(16,875 |
) |
(i) Certain figures as of December 31, 2017 and 2016 have been corrected compared to those previously reported.
For further information on these corrections, see Notes 2 and 28 of these 2018 consolidated financial statements.
62 / www.interxion.com
|
|
|
|
|
|
|
CONSOLIDATED FINANCIAL STATEMENTS |
The deferred tax assets and liabilities are presented as net amounts per tax jurisdiction as far
as the amounts can be offset.
The estimated utilization of carried-forward tax losses in future years is based on management’s
forecasts of future profitability by tax jurisdiction. In the years presented there were no unrecognized deferred tax assets.
The
accumulated recognized and unrecognized tax losses expire as follows:
|
|
|
|
|
|
|
|
|
|
|
|
|
| |
|
2018 |
|
|
2017 |
|
|
2016 |
|
| |
|
|
|
|
(€’000) |
|
|
|
|
| Within one year |
|
|
— |
|
|
|
— |
|
|
|
— |
|
| Between 1 and 5 years |
|
|
23,458 |
|
|
|
25,352 |
|
|
|
3,517 |
|
| After 5 years |
|
|
74,623 |
|
|
|
35,164 |
|
|
|
28,146 |
|
| Unlimited |
|
|
14,559 |
|
|
|
27,748 |
|
|
|
47,081 |
|
| Total recognized and unrecognized tax losses |
|
|
112,640 |
|
|
|
88,264 |
|
|
|
78,744 |
|
www.interxion.com / 63
|
|
|
|
|
| CONSOLIDATED FINANCIAL STATEMENTS |
|
|
11. Property, plant and equipment
|
|
|
|
|
|
|
|
|
|
|
|
|
|
|
|
|
|
|
|
|
|
|
|
|
|
|
|
|
|
|
| |
|
Freehold
land and
buildings |
|
Infrastructure
and
equipment |
|
Assets
under
construction |
|
Total
data center
assets |
|
Office
equipment and other |
|
Total |
| |
|
|
|
(€’000) |
|
|
|
|
|
|
| Cost: |
|
|
|
|
|
|
|
|
|
|
|
|
|
|
|
|
|
|
|
|
|
|
|
|
|
|
|
|
|
|
| As at January 1, 2018 |
|
|
|
227,715 |
|
|
|
|
1,534,440 |
|
|
|
|
116,437 |
|
|
|
|
1,878,592 |
|
|
|
|
55,065 |
|
|
|
|
1,933,657 |
|
| Additions |
|
|
|
45,598 |
|
|
|
|
99,406 |
|
|
|
|
353,254 |
|
|
|
|
488,258 |
|
|
|
|
13,035 |
|
|
|
|
501,293 |
|
| Exchange differences |
|
|
|
225 |
|
|
|
|
(790 |
) |
|
|
|
(526 |
) |
|
|
|
(1,091 |
) |
|
|
|
67 |
|
|
|
|
(1,024 |
) |
| Disposals |
|
|
|
— |
|
|
|
|
(7,538 |
) |
|
|
|
— |
|
|
|
|
(7,538 |
) |
|
|
|
(1,094 |
) |
|
|
|
(8,632 |
) |
| Transfers |
|
|
|
5,704 |
|
|
|
|
183,289 |
|
|
|
|
(189,507 |
) |
|
|
|
(514 |
) |
|
|
|
514 |
|
|
|
|
— |
|
| As at December 31, 2018 |
|
|
|
279,242 |
|
|
|
|
1,808,807 |
|
|
|
|
269,658 |
|
|
|
|
2,357,707 |
|
|
|
|
67,587 |
|
|
|
|
2,425,294 |
|
| Accumulated depreciation and impairment: |
|
|
|
|
|
|
|
|
|
|
|
|
|
|
|
|
|
|
|
|
|
|
|
|
|
|
| As at January 1, 2017 |
|
|
|
(21,098 |
) |
|
|
|
(537,035 |
) |
|
|
|
— |
|
|
|
|
(558,133 |
) |
|
|
|
(33,053 |
) |
|
|
|
(591,186 |
) |
| Depreciation |
|
|
|
(4,448 |
) |
|
|
|
(108,252 |
) |
|
|
|
— |
|
|
|
|
(112,700 |
) |
|
|
|
(8,030 |
) |
|
|
|
(120,730 |
) |
| Exchange differences |
|
|
|
1 |
|
|
|
|
(275 |
) |
|
|
|
— |
|
|
|
|
(274 |
) |
|
|
|
(59 |
) |
|
|
|
(333 |
) |
| Disposals |
|
|
|
— |
|
|
|
|
7,227 |
|
|
|
|
— |
|
|
|
|
7,227 |
|
|
|
|
792 |
|
|
|
|
8,019 |
|
| As at December 31, 2018 |
|
|
|
(25,545 |
) |
|
|
|
(638,335 |
) |
|
|
|
— |
|
|
|
|
(663,880 |
) |
|
|
|
(40,350 |
) |
|
|
|
(704,230 |
) |
| Carrying amount as at December 31, 2018 |
|
|
|
253,697 |
|
|
|
|
1,170,472 |
|
|
|
|
269,658 |
|
|
|
|
1,693,827 |
|
|
|
|
27,237 |
|
|
|
|
1,721,064 |
|
| Cost: |
|
|
|
|
|
|
|
|
|
|
|
|
|
|
|
|
|
|
|
|
|
|
|
|
|
|
|
|
|
|
| As at January 1, 2017 |
|
|
|
176,421 |
|
|
|
|
1,315,971 |
|
|
|
|
111,803 |
|
|
|
|
1,604,195 |
|
|
|
|
46,761 |
|
|
|
|
1,650,956 |
|
| Additions |
|
|
|
28,712 |
|
|
|
|
83,216 |
|
|
|
|
160,004 |
|
|
|
|
271,932 |
|
|
|
|
8,765 |
|
|
|
|
280,697 |
|
| Acquisitions through business combinations |
|
|
|
5,440 |
|
|
|
|
11,272 |
|
|
|
|
— |
|
|
|
|
16,712 |
|
|
|
|
109 |
|
|
|
|
16,821 |
|
| Exchange differences |
|
|
|
(1 |
) |
|
|
|
(11,181 |
) |
|
|
|
(1,020 |
) |
|
|
|
(12,202 |
) |
|
|
|
(510 |
) |
|
|
|
(12,712 |
) |
| Disposals |
|
|
|
— |
|
|
|
|
(2,045 |
) |
|
|
|
— |
|
|
|
|
(2,045 |
) |
|
|
|
(60 |
) |
|
|
|
(2,105 |
) |
| Transfers |
|
|
|
17,143 |
|
|
|
|
137,207 |
|
|
|
|
(154,350 |
) |
|
|
|
— |
|
|
|
|
— |
|
|
|
|
— |
|
| As at December 31, 2017 |
|
|
|
227,715 |
|
|
|
|
1,534,440 |
|
|
|
|
116,437 |
|
|
|
|
1,878,592 |
|
|
|
|
55,065 |
|
|
|
|
1,933,657 |
|
| Accumulated depreciation and impairment: |
|
|
|
|
|
|
|
|
|
|
|
|
|
|
|
|
|
|
|
|
|
| As at January 1, 2017 |
|
|
|
(16,237 |
) |
|
|
|
(452,054 |
) |
|
|
|
— |
|
|
|
|
(468,291 |
) |
|
|
|
(26,634 |
) |
|
|
|
(494,925 |
) |
| Depreciation |
|
|
|
(4,861 |
) |
|
|
|
(91,912 |
) |
|
|
|
— |
|
|
|
|
(96,773 |
) |
|
|
|
(6,812 |
) |
|
|
|
(103,585 |
) |
| Exchange differences |
|
|
|
— |
|
|
|
|
5,050 |
|
|
|
|
— |
|
|
|
|
5,050 |
|
|
|
|
333 |
|
|
|
|
5,383 |
|
| Disposals |
|
|
|
— |
|
|
|
|
1,881 |
|
|
|
|
— |
|
|
|
|
1,881 |
|
|
|
|
60 |
|
|
|
|
1,941 |
|
| As at December 31, 2017 |
|
|
|
(21,098 |
) |
|
|
|
(537,035 |
) |
|
|
|
— |
|
|
|
|
(558,133 |
) |
|
|
|
(33,053 |
) |
|
|
|
(591,186 |
) |
| Carrying amount as at December 31, 2017 |
|
|
|
206,617 |
|
|
|
|
997,405 |
|
|
|
|
116,437 |
|
|
|
|
1,320,459 |
|
|
|
|
22,012 |
|
|
|
|
1,342,471 |
|
| Cost: |
|
|
|
|
|
|
|
|
|
|
|
|
|
|
|
|
|
|
|
|
|
|
|
|
|
|
|
|
|
|
| As at January 1, 2016 |
|
|
|
174,935 |
|
|
|
|
1,127,883 |
|
|
|
|
77,664 |
|
|
|
|
1,380,482 |
|
|
|
|
38,219 |
|
|
|
|
1,418,701 |
|
| Additions |
|
|
|
— |
|
|
|
|
64,369 |
|
|
|
|
184,603 |
|
|
|
|
248,972 |
|
|
|
|
9,274 |
|
|
|
|
258,246 |
|
| Exchange differences |
|
|
|
6 |
|
|
|
|
(17,010 |
) |
|
|
|
(2,454 |
) |
|
|
|
(19,458 |
) |
|
|
|
(501 |
) |
|
|
|
(19,959 |
) |
| Disposals |
|
|
|
— |
|
|
|
|
(5,801 |
) |
|
|
|
— |
|
|
|
|
(5,801 |
) |
|
|
|
(231 |
) |
|
|
|
(6,032 |
) |
| Transfers |
|
|
|
1,480 |
|
|
|
|
146,530 |
|
|
|
|
(148,010 |
) |
|
|
|
— |
|
|
|
|
— |
|
|
|
|
— |
|
| As at December 31, 2016 |
|
|
|
176,421 |
|
|
|
|
1,315,971 |
|
|
|
|
111,803 |
|
|
|
|
1,604,195 |
|
|
|
|
46,761 |
|
|
|
|
1,650,956 |
|
| Accumulated depreciation and impairment: |
|
|
|
|
|
|
|
|
|
|
|
|
|
|
|
|
|
|
|
|
|
| As at January 1, 2016 |
|
|
|
(12,652 |
) |
|
|
|
(385,095 |
) |
|
|
|
— |
|
|
|
|
(397,747 |
) |
|
|
|
(21,882 |
) |
|
|
|
(419,629 |
) |
| Depreciation |
|
|
|
(3,584 |
) |
|
|
|
(78,680 |
) |
|
|
|
— |
|
|
|
|
(82,264 |
) |
|
|
|
(5,302 |
) |
|
|
|
(87,566 |
) |
| Exchange differences |
|
|
|
(1 |
) |
|
|
|
5,920 |
|
|
|
|
— |
|
|
|
|
5,919 |
|
|
|
|
319 |
|
|
|
|
6,238 |
|
| Disposals |
|
|
|
— |
|
|
|
|
5,801 |
|
|
|
|
— |
|
|
|
|
5,801 |
|
|
|
|
231 |
|
|
|
|
6,032 |
|
| As at December 31, 2016 |
|
|
|
(16,237 |
) |
|
|
|
(452,054 |
) |
|
|
|
— |
|
|
|
|
(468,291 |
) |
|
|
|
(26,634 |
) |
|
|
|
(494,925 |
) |
| Carrying amount as at December 31, 2016 |
|
|
|
160,184 |
|
|
|
|
863,917 |
|
|
|
|
111,803 |
|
|
|
|
1,135,904 |
|
|
|
|
20,127 |
|
|
|
|
1,156,031 |
|
64 / www.interxion.com
|
|
|
|
|
|
|
CONSOLIDATED FINANCIAL STATEMENTS |
In December 2017, the Group completed a transaction to purchase approximately 22,000 sqm of land in
close proximity to the AMS8 datacenter. As of December 31, 2018, the carrying value of the land amounted to €14.8 million.
In October 2017, the Group completed a transaction to purchase a parcel of land in Frankfurt, Germany. As of December 31, 2018, the carrying
value of the land amounted to €10.7 million.
On
September 29, 2015, the Group entered into a contract to lease the properties related to the AMS8 data center. The lease, which covers land and building, commenced during the third quarter of 2016. The land component has been treated as an
operating lease, the building as a financial lease. As of December 31, 2018, the carrying value of the building amounted to €15.9 million.
In December 2012, the Group exercised its option to purchase the PAR7 data center land. The actual legal transaction will become effective in 2019.
As a result of this modification, the lease is reported as a financial lease. Per December 31, 2018, the carrying amount of the land amounted to €20.9 million.
As at December 31, 2018, the carrying value of freehold land included in the category “Freehold land and buildings”
amounted to €145.9 million (2017: €104.6 million; 2016: €76.9 million).
Depreciation of property, plant and equipment is disclosed as general and administrative cost in the
consolidated statement of income.
At December 31, 2018, properties with a carrying value of €96.7 million (2017: €102.9 million; 2016:
€90.2 million) were subject to a registered debenture to secure mortgages (see Note 19). At December 31, 2018, properties with a carrying value of €49.1 million (2017: €50.2 million and 2016:
€51.3 million) were subject to a finance lease agreement (see Note 19).
Capitalized interest relating to borrowing costs for 2018 amounted to €4.9 million (2017:
€3.1 million; 2016: €3.4 million). The cash effect of the interest capitalized for 2018 amounted to €6.2 million, which is presented in the Statement of Cash Flows under “Purchase of property, plant and equipment” (2017: €3.9 million; 2016: €2.2 million).
www.interxion.com / 65
|
|
|
|
|
| CONSOLIDATED FINANCIAL STATEMENTS |
|
|
12. Intangible assets
The components of intangible assets are as follows:
|
|
|
|
|
|
|
|
|
|
|
|
|
|
|
|
|
|
|
|
|
|
|
|
|
|
|
|
|
|
|
| |
|
Power grid
rights |
|
Software |
|
Goodwill |
|
Customer
Portfolio |
|
Other |
|
Total |
| |
|
(€’000) |
| Cost: |
|
|
|
|
|
|
|
|
|
|
|
|
|
|
|
|
|
|
|
|
|
|
|
|
|
|
|
|
|
|
| As at January 1, 2018 |
|
|
|
21,820 |
|
|
|
|
26,810 |
|
|
|
|
38,900 |
|
|
|
|
28,005 |
|
|
|
|
2,165 |
|
|
|
|
117,700 |
|
| Additions |
|
|
|
6,699 |
|
|
|
|
4,747 |
|
|
|
|
— |
|
|
|
|
— |
|
|
|
|
— |
|
|
|
|
11,446 |
|
| Exchange differences |
|
|
|
(73 |
) |
|
|
|
(9 |
) |
|
|
|
— |
|
|
|
|
— |
|
|
|
|
— |
|
|
|
|
(82 |
) |
| Disposals |
|
|
|
— |
|
|
|
|
(255 |
) |
|
|
|
— |
|
|
|
|
— |
|
|
|
|
— |
|
|
|
|
(255 |
) |
| As at December 31, 2018 |
|
|
|
28,446 |
|
|
|
|
31,293 |
|
|
|
|
38,900 |
|
|
|
|
28,005 |
|
|
|
|
2,165 |
|
|
|
|
128,809 |
|
| Accumulated amortization and impairment: |
|
|
|
|
|
|
|
|
|
|
|
|
|
|
|
|
|
|
|
|
|
|
|
|
|
|
|
|
|
|
| As at January 1, 2018 |
|
|
|
(3,005 |
) |
|
|
|
(12,403 |
) |
|
|
|
— |
|
|
|
|
(1,167 |
) |
|
|
|
(1,632 |
) |
|
|
|
(18,207 |
) |
| Amortization |
|
|
|
(932 |
) |
|
|
|
(5,213 |
) |
|
|
|
— |
|
|
|
|
(1,417 |
) |
|
|
|
(74 |
) |
|
|
|
(7,636 |
) |
| Exchange differences |
|
|
|
— |
|
|
|
|
10 |
|
|
|
|
— |
|
|
|
|
— |
|
|
|
|
— |
|
|
|
|
10 |
|
| Disposals |
|
|
|
— |
|
|
|
|
— |
|
|
|
|
— |
|
|
|
|
— |
|
|
|
|
— |
|
|
|
|
— |
|
| As at December 31, 2018 |
|
|
|
(3,937 |
) |
|
|
|
(17,351 |
) |
|
|
|
— |
|
|
|
|
(2,584 |
) |
|
|
|
(1,706 |
) |
|
|
|
(25,578 |
) |
| Carrying amount as at December 31, 2018 |
|
|
|
24,509 |
|
|
|
|
13,942 |
|
|
|
|
38,900 |
|
|
|
|
25,421 |
|
|
|
|
459 |
|
|
|
|
103,231 |
|
| Cost: |
|
|
|
|
|
|
|
|
|
|
|
|
|
|
|
|
|
|
|
|
|
|
|
|
|
|
|
|
|
|
| As at January 1, 2017 |
|
|
|
18,582 |
|
|
|
|
21,519 |
|
|
|
|
— |
|
|
|
|
— |
|
|
|
|
2,165 |
|
|
|
|
42,266 |
|
| Additions |
|
|
|
3,466 |
|
|
|
|
5,326 |
|
|
|
|
— |
|
|
|
|
— |
|
|
|
|
— |
|
|
|
|
8,792 |
|
| Acquisitions through business
combinations |
|
|
|
— |
|
|
|
|
— |
|
|
|
|
38,900 |
|
|
|
|
28,005 |
|
|
|
|
— |
|
|
|
|
66,905 |
|
| Exchange differences |
|
|
|
(228 |
) |
|
|
|
(35 |
) |
|
|
|
— |
|
|
|
|
— |
|
|
|
|
— |
|
|
|
|
(263 |
) |
| Disposals |
|
|
|
— |
|
|
|
|
— |
|
|
|
|
— |
|
|
|
|
— |
|
|
|
|
— |
|
|
|
|
— |
|
| As at December 31, 2017 |
|
|
|
21,820 |
|
|
|
|
26,810 |
|
|
|
|
38,900 |
|
|
|
|
28,005 |
|
|
|
|
2,165 |
|
|
|
|
117,700 |
|
| Accumulated amortization and impairment: |
|
|
|
|
|
|
|
|
|
|
|
|
|
|
|
|
|
|
|
|
|
|
|
|
|
|
| As at January 1, 2017 |
|
|
|
(2,232 |
) |
|
|
|
(9,816 |
) |
|
|
|
— |
|
|
|
|
— |
|
|
|
|
(1,524 |
) |
|
|
|
(13,572 |
) |
| Amortization |
|
|
|
(773 |
) |
|
|
|
(2,619 |
) |
|
|
|
— |
|
|
|
|
(1,167 |
) |
|
|
|
(108 |
) |
|
|
|
(4,667 |
) |
| Exchange differences |
|
|
|
— |
|
|
|
|
32 |
|
|
|
|
— |
|
|
|
|
— |
|
|
|
|
— |
|
|
|
|
32 |
|
| Disposals |
|
|
|
— |
|
|
|
|
— |
|
|
|
|
— |
|
|
|
|
— |
|
|
|
|
— |
|
|
|
|
— |
|
| As at December 31, 2017 |
|
|
|
(3,005 |
) |
|
|
|
(12,403 |
) |
|
|
|
— |
|
|
|
|
(1,167 |
) |
|
|
|
(1,632 |
) |
|
|
|
(18,207 |
) |
| Carrying amount as at December 31, 2017 |
|
|
|
18,815 |
|
|
|
|
14,407 |
|
|
|
|
38,900 |
|
|
|
|
26,838 |
|
|
|
|
533 |
|
|
|
|
99,493 |
|
| Cost: |
|
|
|
|
|
|
|
|
|
|
|
|
|
|
|
|
|
|
|
|
|
|
|
|
|
|
|
|
|
|
| As at January 1, 2016 |
|
|
|
16,091 |
|
|
|
|
16,322 |
|
|
|
|
— |
|
|
|
|
— |
|
|
|
|
2,165 |
|
|
|
|
34,578 |
|
| Additions |
|
|
|
3,647 |
|
|
|
|
5,282 |
|
|
|
|
— |
|
|
|
|
— |
|
|
|
|
— |
|
|
|
|
8,929 |
|
| Exchange differences |
|
|
|
(1,156 |
) |
|
|
|
(85 |
) |
|
|
|
— |
|
|
|
|
— |
|
|
|
|
— |
|
|
|
|
(1,241 |
) |
| Disposals |
|
|
|
— |
|
|
|
|
— |
|
|
|
|
— |
|
|
|
|
— |
|
|
|
|
— |
|
|
|
|
— |
|
| As at December 31, 2016 |
|
|
|
18,582 |
|
|
|
|
21,519 |
|
|
|
|
— |
|
|
|
|
— |
|
|
|
|
2,165 |
|
|
|
|
42,266 |
|
| Accumulated amortization and impairment: |
|
|
|
|
|
|
|
|
|
|
|
|
|
|
|
|
|
|
|
|
|
|
|
|
|
|
| As at 1 January 2016 |
|
|
|
(1,688 |
) |
|
|
|
(8,285 |
) |
|
|
|
— |
|
|
|
|
— |
|
|
|
|
(1,411 |
) |
|
|
|
(11,384 |
) |
| Amortization |
|
|
|
(544 |
) |
|
|
|
(1,612 |
) |
|
|
|
— |
|
|
|
|
— |
|
|
|
|
(113 |
) |
|
|
|
(2,269 |
) |
| Exchange differences |
|
|
|
— |
|
|
|
|
81 |
|
|
|
|
— |
|
|
|
|
— |
|
|
|
|
— |
|
|
|
|
81 |
|
| Disposals |
|
|
|
— |
|
|
|
|
— |
|
|
|
|
— |
|
|
|
|
— |
|
|
|
|
— |
|
|
|
|
— |
|
| As at December 31, 2016 |
|
|
|
(2,232 |
) |
|
|
|
(9,816 |
) |
|
|
|
— |
|
|
|
|
— |
|
|
|
|
(1,524 |
) |
|
|
|
(13,572 |
) |
| Carrying amount as at December 31, 2016 |
|
|
|
16,350 |
|
|
|
|
11,703 |
|
|
|
|
— |
|
|
|
|
— |
|
|
|
|
641 |
|
|
|
|
28,694 |
|
Amortization of intangible assets is disclosed as general and administrative cost in the consolidated income
statement.
66 / www.interxion.com
|
|
|
|
|
|
|
CONSOLIDATED FINANCIAL STATEMENTS |
Impairment test on goodwill
The goodwill relates to the acquisition of Interxion Science Park in February 2017. This business has been integrated in the Dutch operating
company and is as such considered part of the Dutch cash generating unit (“CGU”). As such, the annual impairment test on acquisition goodwill is carried out on this CGU in October of each year.
The recoverable amount of the Dutch CGU was based on value in use, estimated using discounted cash flows.
The key assumptions used in the estimation of the recoverable amount are set out below. The values assigned to the key assumptions represent
management’s assessment of future trends in the relevant industries and have been based on historical data from both external and internal sources.
|
|
|
|
|
|
|
|
|
|
|
|
|
| |
|
2018 |
|
|
2017
(€’000) |
|
|
2016 |
|
| Percentages |
|
|
|
|
|
|
|
|
|
|
|
|
| Discount rate
(pre-tax) |
|
|
8.4% |
|
|
|
8.2% |
|
|
|
n/a |
|
| Terminal value growth rate |
|
|
0.9% |
|
|
|
1.1% |
|
|
|
n/a |
|
| Budgeted Adjusted EBITDA growth rate throughout the
forecast |
|
|
0.0% |
|
|
|
0.0% |
|
|
|
n/a |
|
The cash flow projections included specific estimates for 2019 and a terminal growth rate thereafter. The terminal
growth rate was determined based on management’s estimate.
The budgeted Adjusted EBITDA for 2019 and in steady state was based on
expectations of future outcomes taking into account past experience.
Customer portfolio
The customer portfolio was identified as a separate asset after the acquisition of InterXion Science Park B.V. in 2017. It has been initially
recognized at fair value and is being amortized in 20 years.
13. Other investments
The other investments represent a convertible loan with a principal amount of USD 7.5 million provided by InterXion Participation 1 B.V. to
Icolo, a company that is running a data center business in Kenya through its wholly owned Kenyan subsidiary. Interxion has the option to convert the loan into equity on the maturity date or upon occurrence of an enforcement event. Upon
implementation of IFRS 9 – Financial Instruments, the convertible loan is considered a single instrument, to be carried at fair value through profit and loss. Accordingly, since January 1, 2018, it has been accounted for as such.
14. Other non-current assets and Trade and other current assets
|
|
|
|
|
|
|
|
|
|
|
|
|
| |
|
2018 |
|
|
2017
(€’000) |
|
|
2018 |
|
| Other non-current
assets |
|
|
|
|
|
|
|
|
|
|
|
|
| Data-center-related prepaid expenses |
|
|
4,305 |
|
|
|
2,708 |
|
|
|
3,507 |
|
| Rental and other supplier deposits |
|
|
4,069 |
|
|
|
3,736 |
|
|
|
3,056 |
|
| Collateralised cash |
|
|
3,524 |
|
|
|
3,529 |
|
|
|
— |
|
| Deferred setup cost |
|
|
2,413 |
|
|
|
2,806 |
|
|
|
1,502 |
|
| Deferred financing costs |
|
|
1,741 |
|
|
|
— |
|
|
|
142 |
|
| Deferred rent related stamp duties |
|
|
791 |
|
|
|
895 |
|
|
|
379 |
|
| |
|
|
16,843 |
|
|
|
13,674 |
|
|
|
11,914 |
|
|
|
|
|
| Trade and other current assets |
|
|
|
|
|
|
|
|
|
|
|
|
| Trade receivables – net (Note 20) |
|
|
99,904 |
|
|
|
113,518 |
|
|
|
91,451 |
|
| Accrued revenue |
|
|
41,754 |
|
|
|
36,575 |
|
|
|
34,560 |
|
| Prepaid expenses and other current assets |
|
|
27,061 |
|
|
|
16,745 |
|
|
|
15,992 |
|
| Taxes receivable |
|
|
24,029 |
|
|
|
12,415 |
|
|
|
5,416 |
|
| Collateralised cash |
|
|
12,865 |
|
|
|
533 |
|
|
|
402 |
|
| |
|
|
205,613 |
|
|
|
179,786 |
|
|
|
147,821 |
|
www.interxion.com / 67
|
|
|
|
|
| CONSOLIDATED FINANCIAL STATEMENTS |
|
|
Accrued revenue relates to service-fee holidays provided
in relation to our long-term customer contracts. As of December 31, 2018, €16.5 million of the accrued revenue balance will not be realized within 12 months.
Prepaid expenses and other current assets principally comprise accrued income, prepaid insurances, rental and other related operational data center
and construction-related prepayments.
As at December 31, 2018, collateralized cash amounting to €16.4 million is held to support the issuance of bank guarantees on behalf of a number of subsidiary companies (2017:
€4.1 million; 2016: €3.7 million).
15. Cash and cash equivalents
Cash and cash equivalents are at free disposal of the Company. Cash held as collateral is presented as other current and non-current assets.
16. Shareholders’ equity
Share capital and share premium
|
|
|
|
|
|
|
|
|
|
|
| |
|
|
2018 |
|
|
2017
(in thousands of shares) |
|
|
2016 |
|
| As at January 1, |
|
|
71,415 |
|
|
70,603 |
|
|
69,919 |
|
| Issue / conversion of shares |
|
|
293 |
|
|
812 |
|
|
684 |
|
| On issue as at December 31, |
|
|
71,708 |
|
|
71,415 |
|
|
70,603 |
|
On January 28, 2011, the Company issued 16,250 thousand new shares (post reverse stock split) at the New
York Stock Exchange under the ticker symbol INXN. On completion of the offering, the Company did a reverse stock split 5:1, which resulted in nominal value of €0.10 per ordinary
shares. The 34,808 thousand Preferred Shares were converted into ordinary shares and the Liquidation Price of €1.00 (post reverse stock split) per Preferred A Share was
either paid out in cash or converted in ordinary shares (3.3 million ordinary shares). In 2018, a total of 0.3 million (2017: 0.8 million, 2016: 0.7 million) options were exercised and restricted and performance shares were vested.
At December 31, 2018, 2017 and 2016, the authorized share capital comprised 200,000,000 ordinary shares at par value of €0.10. All issued shares are fully paid.
Foreign currency
translation reserve
The foreign currency translation reserve comprises of all foreign exchange differences arising from the
translation of the financial statements of foreign operations as well as from the translation of intergroup balances with a permanent nature.
17. Earnings per share
Profit attributable to ordinary shareholders
|
|
|
|
|
|
|
|
|
|
|
|
|
| |
|
2018 |
|
|
2017
(€’000) |
|
|
2016 |
|
| Profit attributable to ordinary
shareholders |
|
|
31,118 |
|
|
|
39,067 |
|
|
|
38,336 |
|
Basic earnings per share
The calculation of basic earnings per share at December 31, 2017, was based on the profit attributable to ordinary shareholders and a weighted
average number of ordinary shares outstanding during the year ended December 31, 2017, of 71,089,000 (for the years; 2016: 70,349,000 and 2015: 69,579,000). Profit is attributable to ordinary shareholders on an equal basis.
68 / www.interxion.com
|
|
|
|
|
|
|
CONSOLIDATED FINANCIAL STATEMENTS |
Diluted earnings per share
The calculation of diluted earnings per share at December 31, 2018, was based on the profit attributable to ordinary shareholders and a
weighted average number of ordinary shares and the impact of dilutive options, restricted shares and performance shares outstanding during the year ended December 31, 2018, of 72,056,000 (for the years; 2017: 71,521,000 and 2016: 71,213,000).
Weighted average number of ordinary shares
|
|
|
|
|
|
|
|
|
|
|
|
|
| |
|
2018 |
|
|
2017 |
|
|
2016 |
|
|
|
|
| |
|
|
|
|
(in thousands of shares) |
|
| Weighted average number of ordinary shares at
December 31 |
|
|
71,562 |
|
|
|
71,089 |
|
|
|
70,349 |
|
| Dilution effect of share options, restricted and performance shares
on issue |
|
|
494 |
|
|
|
432 |
|
|
|
864 |
|
| Weighted average number of ordinary shares
(diluted) at December 31 |
|
|
72,056 |
|
|
|
71,521 |
|
|
|
71,213 |
|
18. Trade payables and other liabilities
|
|
|
|
|
|
|
|
|
|
|
|
|
| |
|
2018 |
|
|
2017(i)
(€’000) |
|
|
2016(i) |
|
| Non-current |
|
|
|
|
|
|
|
|
|
|
|
|
| Deferred revenue |
|
|
11,056 |
|
|
|
7,557 |
|
|
|
6,282 |
|
| Other non-current
liabilities |
|
|
22,998 |
|
|
|
16,114 |
|
|
|
14,288 |
|
| |
|
|
34,054 |
|
|
|
23,671 |
|
|
|
20,570 |
|
| Current |
|
|
|
|
|
|
|
|
|
|
|
|
| Trade payables |
|
|
109,463 |
|
|
|
47,489 |
|
|
|
23,076 |
|
| Tax and social security |
|
|
7,989 |
|
|
|
9,357 |
|
|
|
6,528 |
|
| Customer deposits |
|
|
20,098 |
|
|
|
20,878 |
|
|
|
20,671 |
|
| Deferred revenue |
|
|
60,472 |
|
|
|
73,262 |
|
|
|
63,974 |
|
| Accrued expenses |
|
|
81,074 |
|
|
|
78,804 |
|
|
|
57,077 |
|
| Other current liabilities |
|
|
1,781 |
|
|
|
122 |
|
|
|
107 |
|
| |
|
|
280,877 |
|
|
|
229,912 |
|
|
|
171,433 |
|
Trade payables include €87.9 million
(2017: €28.8 million; 2016: €10.6 million) accounts payable in respect of purchases of property, plant
and equipment.
Accrued expenses are analysed as follows:
|
|
|
|
|
|
|
|
|
|
|
|
|
| |
|
2018 |
|
|
2017(i)
(€’000) |
|
|
2016(i) |
|
| Data-center-related costs |
|
|
51,912 |
|
|
|
36,838 |
|
|
|
18,785 |
|
| Personnel and related costs |
|
|
14,746 |
|
|
|
13,273 |
|
|
|
12,261 |
|
| Professional services |
|
|
3,207 |
|
|
|
2,486 |
|
|
|
1,871 |
|
| Customer implementation and related costs |
|
|
4,484 |
|
|
|
4,492 |
|
|
|
3,081 |
|
| Financing-related costs |
|
|
2,780 |
|
|
|
17,909 |
|
|
|
17,498 |
|
| Other |
|
|
3,945 |
|
|
|
3,806 |
|
|
|
3,581 |
|
| |
|
|
81,074 |
|
|
|
78,804 |
|
|
|
57,077 |
|
| (i) |
Certain figures as of December 31, 2017 and 2016 have been corrected compared to those
previously reported. For further information on these corrections, see Notes 2 and 28 of these 2018 consolidated financial statements. |
www.interxion.com / 69
|
|
|
|
|
| CONSOLIDATED FINANCIAL STATEMENTS |
|
|
19. Borrowings
|
|
|
|
|
|
|
|
|
|
|
|
|
| |
|
2018 |
|
|
2017
(€’000)
|
|
|
2016 |
|
|
Non-current
|
|
|
|
|
|
|
|
|
|
|
|
|
| |
|
|
1,188,387 |
|
|
|
— |
|
|
|
— |
|
|
Senior Secured Notes 6.0%, due 2020 |
|
|
— |
|
|
|
628,141
|
|
|
|
629,327 |
|
|
Mortgages |
|
|
47,124 |
|
|
|
45,386
|
|
|
|
43,508
|
|
|
Finance lease liabilities |
|
|
31,302 |
|
|
|
50,525
|
|
|
|
51,140
|
|
|
|
|
|
| |
|
|
1,266,813 |
|
|
|
724,052 |
|
|
|
723,975 |
|
|
Current |
|
|
|
|
|
|
|
|
|
|
|
|
|
Mortgages |
|
|
4,258 |
|
|
|
8,254
|
|
|
|
10,904
|
|
|
Finance lease liabilities |
|
|
19,072 |
|
|
|
602
|
|
|
|
578
|
|
|
2017 Senior Secured Revolving Facility |
|
|
— |
|
|
|
99,904
|
|
|
|
— |
|
|
|
|
|
| |
|
|
23,330 |
|
|
|
108,760 |
|
|
|
11,482 |
|
|
Total borrowings |
|
|
1,290,143 |
|
|
|
832,812
|
|
|
|
735,457 |
|
The carrying amounts of the Group’s borrowings are principally denominated in euros. The face value of the Senior Notes as of
December 31, 2018 was €1,200.0 million. The face value of the Senior Secured Notes as of December 31, 2017 was
€625.0 million (2016: €625.0 million).
The face
value of the mortgages amounted to €52.0 million as of December 31, 2018 (2017: €54.3 million and 2016: €55.2 million).
Senior Notes and bank borrowings
Mortgages
On January 18, 2013, the Group completed a €10.0 million financing agreement, consisting of two loans that are secured by mortgages on the PAR3 land owned by Interxion Real Estate II Sarl and the PAR5 land owned by Interxion Real Estate
III Sarl and a pledge on the rights under the intergroup lease agreements between Interxion Real Estate II Sarl and Interxion Real Estate III Sarl, as lessors, and Interxion France SAS, as lessee, and are guaranteed by Interxion France SAS. The
principal amounts of the mortgage loans are required to be repaid in quarterly installments collectively amounting to €167,000 of which the first quarterly installment was paid on April 18,
2013. The mortgage loans have a maturity of 15 years and a variable interest rate based on EURIBOR plus an individual margin ranging from 240 to 280 basis points. The financing agreement requires the interest rate to be fixed for a minimum of 40% of
the principal outstanding amount for a minimum of six years. In April 2013, the interest rate was fixed for approximately 75% of the principal outstanding amount for a period of ten years. The financing agreement does not include any financial
covenants.
On April 1, 2014, the Group completed a €9.2 million financing agreement, consisting of a
loan that is secured by a mortgage on the data center property in Belgium owned by Interxion Real Estate IX N.V. and a pledge on the rights under the intergroup lease agreement between InterXion Real Estate IX N.V., as lessor, and InterXion Belgium
N.V., as lessee, and is guaranteed by Interxion Real Estate Holding B.V. The principal amount of the mortgage loan is required to be repaid in quarterly installments of €153,330 of which the
first quarterly installment was paid on July 31, 2014. The mortgage loan has a maturity of 15 years and a variable interest rate based on EURIBOR plus 200 basis points. The financing agreement does not include any financial covenants.
On October 13, 2015, the Group completed a €15.0 million financing agreement, consisting of a loan that
is secured by a mortgage on certain data center property (FRA8 and FRA10) in Germany owned by Interxion Real Estate I B.V. and a pledge on the rights under the intergroup lease agreement between InterXion Real Estate I B.V., as lessor, and Interxion
Deutschland GmbH, as lessee. The principal amount of the mortgage loan is required to be repaid in four annual installments of €1.0 million of which the first annual installment was paid on
September 30, 2016, and a final installment of €11.0 million which is due on September 30, 2020. The mortgage loan has a maturity of five years and has a variable interest rate
based on EURIBOR plus 225 basis points. The financing agreement includes a minimum required debt service capacity ratio of 1.20 to 1.00, based on the operations of Interxion Real Estate I B.V.
70 / www.interxion.com
|
|
|
|
|
|
|
CONSOLIDATED FINANCIAL STATEMENTS |
On April 8, 2016, the Group completed a €14.6 million
financing agreement, consisting of a loan that is secured by a mortgage on certain data center property in Austria owned by Interxion Real Estate VII GmbH and a pledge on the rights under the intergroup lease agreement between InterXion Real Estate
VII GmbH, as lessor, and Interxion Österreich GmbH, as lessee. The principal amount of the mortgage loan is required to be repaid in 177 monthly installments, increasing from €76,000 to €91,750. The mortgage loan has a maturity of fourteen years and nine months and has a variable interest rate based on EURIBOR plus 195 basis points. The financing agreement includes a minimum required
debt service capacity ratio of 1.20 to 1.00, based on the operations of Interxion Real Estate VII GmbH.
On December 1, 2017, the Group renewed a €10.0 million financing agreement, entered into in 2012, consisting of a loan that is secured by a mortgage on certain data center property in The Netherlands owned by Interxion Real Estate IV
B.V. The principal amount of the mortgage loan is required to be repaid in four annual instalments of €667,000 commencing in December 2018 and a final installment of €7,332,000 which is due on December 31, 2022. The mortgage loan has a variable interest rate based on EURIBOR (subject to a zero percent EURIBOR floor) plus 225 basis points. The financing
agreement includes a minimum required debt service capacity ratio of 1.20 to 1.00, based on the operations of Interxion Real Estate IV B.V.
On July 12, 2018,
the Group completed a €6.0 million financing agreement, consisting of a loan that is secured by mortgage on certain data center property in The Netherlands owned by Interxion Real Estate V
B.V. and a pledge on rights under the intergroup lease agreement between Interxion Real Estate V B.V., as lessor, and Interxion Nederland B.V., as lessee. The principal amount of the mortgage loan is required to be repaid in four annual instalments
of €400,000 commencing July 12, 2019 and a final installment of €4,400,000 which is due on July 1, 2023. The mortgage loan has a
variable interest rate based on EURIBOR plus 225 basis points. The financing agreement includes a minimum required debt service capacity ratio of 1.20 to 1.00, based on the operations of Interxion Real Estate V B.V.
These mortgages do not conflict with the restrictions of the Indenture and the Revolving Facility.
Senior Notes
On June 18, 2018, the Company issued an aggregate
principal amount of €1,000 million 4.75% Senior Notes due 2025 (the “Senior Notes”). The net proceeds of the offering were used to redeem the entire amounts relating to the €625 million Senior Secured Notes due 2020, to repay amounts drawn under revolving credit facilities, to pay all related fees, expenses and premiums and for other general corporate purposes.
The Senior Notes are governed by an indenture dated June 18, 2018, between the Company, as issuer, the guarantors named therein, The Bank of New York Mellon, London
Branch, as trustee and paying agent and The Bank of New York Mellon SA/NV, Luxembourg Branch as transfer agent and registrar (the “Indenture”). The Indenture contains customary restrictive covenants, including but not limited to
limitations or restrictions on our ability to incur debt, grant liens, and sell assets. The restrictive covenants are subject to customary exceptions including, in relation to the incurrence of certain additional debt, a consolidated fixed charge
coverage ratio (calculated as a ratio of Adjusted EBITDA to consolidated interest expense) of at least 2.00 to 1.00 on a pro forma basis for the four full fiscal quarters (taken as one period) for which financial statements are available immediately
preceding the incurrence of such debt.
The Senior Notes are guaranteed by certain of the Company’s subsidiaries.
On September 20, 2018, the Company issued a further €200.0 million aggregate principal amount of its
Senior Notes (the “Additional Notes”). The net proceeds of the offering amounted to €203.8 million, net of offering fees and expenses of
€2.2 million. The net proceeds contained the nominal value of the Additional Notes, plus an issuance premium of 103.00%. The Additional Notes, which are guaranteed by certain subsidiaries of
the Company, were issued under the Indenture pursuant to which, on June 18, 2018, the Company issued the Senior Notes.
The Company may redeem all or part of
the Senior Notes. The Company has the following redemption rights:
Optional redemption prior to June 15, 2021 upon an equity offering
At any time and from time to time prior to June 15, 2021, upon not less than 10 and not more than 60 days’ notice, we may on any or more occasions redeem up to
40% of the original aggregate principal amount of the Senior Notes (including any additional notes), with funds in an aggregate amount not exceeding the net cash proceeds received from one or more equity offerings at a redemption price equal to
104.75% of the principle amount of any such Senior Notes, plus accrued and unpaid interest and additional amounts, if any, on the Senior Notes redeemed to but excluding the redemption date, provided that:
| a. |
the redemption takes place not later than 180 days after the closing of the related equity offering; and
|
| b. |
at least 50% of the original aggregate principal amount of the Senior Notes (including any additional notes) issued under
the Indenture remains outstanding immediately thereafter. |
www.interxion.com / 71
|
|
|
|
|
| CONSOLIDATED FINANCIAL STATEMENTS |
|
|
Optional redemption prior to June 15,
2021
At any time prior to June 15, 2021, upon not less than 10 and not more than 60 days’ notice, we may on any one or more occasions redeem the
Senior Notes, in whole or in part, at our option, at a redemption price equal to 100% of the principal amount thereof plus the applicable premium (as defined in the Indenture)as of, and accrued and unpaid interest and additional amounts, if any, on
the Senior Notes redeemed to, but excluding, the redemption date.
Optional redemption prior to June 15, 2021
At any time and from time to time on or after June 15, 2021, upon not less than 10 and not more than 60 days’ notice, we may on any one or more occasions redeem
the Senior Notes in whole or in part, at a redemption price equal to the percentage of principal amount set forth below plus accrued and unpaid interest, if any, on the Senior Notes redeemed, to, but excluding, the applicable redemption date and
additional amounts, if any, if redeemed during the twelve-month period beginning on June 15 of the year indicated below:
|
|
|
| Year |
|
Redemption price |
|
2021 |
|
102.3750% |
|
2022 |
|
101.1875% |
|
2023 and thereafter |
|
100.0000% |
Change of control
The Senior Notes and
the Indenture also contain a change of control provision, which requires the Company to make an offer to purchase the Senior Notes at a price equal to 101% of the principal amount thereof, plus accrued and unpaid interest and Additional Amounts, if
any, to the date of purchase, upon the occurrence of certain events constituting a change of control (as defined in the Indenture) and a ratings event (as defined in the Indenture).
Revolving Facility Agreement
On June 18, 2018, the Company entered
into the €200.0 million 2018 revolving facility agreement (the “Revolving Facility Agreement”) between, among others, the Company, the arrangers named therein and ABN AMRO Bank
N.V. as agent (for the purpose of this section, the “Agent”), pursuant to which the Revolving Facility has been made available to the Company.
As at
December 31, 2018, the Revolving Facility was undrawn. In the first quarter of 2019, this facility was increased by €100.0 million for a total commitment of €300.0 million.
Covenants regarding Revolving Facility Agreement
The Revolving Facility Agreement requires us to maintain a specified financial ratio. The restrictive covenants are subject to customary exceptions including, in relation
to the incurrence of certain additional debt, a consolidated fixed charge coverage ratio (calculated as a ratio of Adjusted EBITDA to consolidated interest expense) of at least 2.00 to 1.00 on a pro forma basis for the four full fiscal quarters
(taken as one period) for which financial statements are available immediately preceding the incurrence of such debt. The Revolving Facility Agreement also includes a net leverage ratio financial covenant (tested on a quarterly basis provided that
the Test Condition applies), which requires total net debt (calculated as a ratio to pro forma Adjusted EBITDA) not to exceed 5.00 to 1.00. In addition, the Revolving Facility Agreement permits us to elect, on a
one-time basis and subject to certain conditions, to adjust the financial covenant to 5.50 to 1.00 for two consecutive quarter periods (including the quarter in which such election is made).
The breach of any of these covenants by the Company or the failure by the Company to maintain its net leverage ratio could result in a default under the Revolving
Facility Agreement. As of December 31, 2018, the Company’s consolidated fixed charge coverage ratio was 4.01 to 1.00 and the leverage ratio was stood at 4.39 to 1.00.
The Company has remained in full compliance with all its covenants. In addition, the Company does not anticipate, in the next twelve months, any breach or failure that
would negatively impact its ability to borrow funds under the Revolving Facility Agreemen
Change of control or sale of assets
If, there is a sale of all or substantially all the assets of the Group whether in a single transaction or a series of related transactions, or a change of control that
any beneficial owner gains control of the Company, then a lender under the Revolving Facility Agreement shall not be obliged to fund a loan to the Company.
In
addition, if within 15 business days of the Company notifying the Agent of a change of control or sale of assets as described above, a lender wishes to cancel its commitment under the Revolving Facility Agreement as a result of that event, such
lender’s commitments will be immediately cancelled and its participation in all outstanding loans shall, together with the accrued and unpaid interest and all other amounts accrued and outstanding under the agreement, become due and payable
within five business days of the date on which the relevant lender notifies the applicable agent thereunder.
72 / www.interxion.com
|
|
|
|
|
|
|
CONSOLIDATED FINANCIAL STATEMENTS |
Reconciliation to cash flow statement
The reconciliation of movements of liabilities to cash flows arising from financing activities is set out below:
|
|
|
|
|
|
|
|
|
|
|
|
|
|
|
|
|
|
|
|
|
|
|
|
|
|
|
|
|
|
|
|
|
|
|
|
|
|
|
|
|
|
|
|
|
| |
|
Senior
Secured
Notes
due 2020 |
|
|
4.75%
Senior
Notes
due 2020 |
|
|
Mortgages |
|
|
Finance
lease liabilities |
|
|
Revolving
Credit
facilities |
|
|
Share
capital |
|
|
Share
premium |
|
|
Foreign
currency translation
reserve |
|
|
Hedging
Reserve |
|
|
Accumulated
profit/
(deficit) |
|
|
Total |
|
| |
|
|
|
|
|
|
|
|
|
|
|
|
|
(€’000) |
|
|
|
|
|
|
|
|
|
|
|
|
|
|
|
|
|
|
|
| Balance as at
January 1, 2018 |
|
|
628,141 |
|
|
|
— |
|
|
|
53,640 |
|
|
|
51,127 |
|
|
|
99,904 |
|
|
|
7,141 |
|
|
|
539,448 |
|
|
|
4,180 |
|
|
|
(169 |
) |
|
|
39,061 |
|
|
|
1,422,473 |
|
| Changes from financing cash flows |
|
|
|
|
|
|
|
|
|
|
|
|
|
|
|
|
|
|
|
|
|
|
|
|
|
|
|
|
|
|
|
|
|
|
|
|
|
|
|
|
|
|
|
|
| Proceeds from exercised options |
|
|
— |
|
|
|
— |
|
|
|
— |
|
|
|
— |
|
|
|
— |
|
|
|
29 |
|
|
|
1,707 |
|
|
|
— |
|
|
|
— |
|
|
|
— |
|
|
|
1,736 |
|
| Proceeds from mortgages |
|
|
— |
|
|
|
— |
|
|
|
5,969 |
|
|
|
— |
|
|
|
— |
|
|
|
— |
|
|
|
— |
|
|
|
— |
|
|
|
— |
|
|
|
— |
|
|
|
5,969 |
|
| Repayment of mortgages |
|
|
— |
|
|
|
— |
|
|
|
(8,335 |
) |
|
|
— |
|
|
|
— |
|
|
|
— |
|
|
|
— |
|
|
|
— |
|
|
|
— |
|
|
|
— |
|
|
|
(8,335 |
) |
| Proceeds from |
|
|
|
|
|
|
|
|
|
|
|
|
|
|
|
|
|
|
|
|
|
|
|
|
|
|
|
|
|
|
|
|
|
|
|
|
|
|
|
|
|
|
|
|
| Revolving Facilities |
|
|
— |
|
|
|
— |
|
|
|
— |
|
|
|
— |
|
|
|
148,814 |
|
|
|
— |
|
|
|
— |
|
|
|
— |
|
|
|
— |
|
|
|
— |
|
|
|
148,814 |
|
| Repayment of |
|
|
|
|
|
|
|
|
|
|
|
|
|
|
|
|
|
|
|
|
|
|
|
|
|
|
|
|
|
|
|
|
|
|
|
|
|
|
|
|
|
|
|
|
| Revolving Facilities |
|
|
— |
|
|
|
— |
|
|
|
— |
|
|
|
— |
|
|
|
(250,724 |
) |
|
|
— |
|
|
|
— |
|
|
|
— |
|
|
|
— |
|
|
|
— |
|
|
|
(250,724 |
) |
| Proceeds from 4.75% |
|
|
|
|
|
|
|
|
|
|
|
|
|
|
|
|
|
|
|
|
|
|
|
|
|
|
|
|
|
|
|
|
|
|
|
|
|
|
|
|
|
|
|
|
| Senior Notes |
|
|
— |
|
|
|
1,194,800 |
|
|
|
— |
|
|
|
— |
|
|
|
— |
|
|
|
— |
|
|
|
— |
|
|
|
— |
|
|
|
— |
|
|
|
— |
|
|
|
1,194,800 |
|
| Finance lease obligation |
|
|
— |
|
|
|
— |
|
|
|
— |
|
|
|
(1,170 |
) |
|
|
— |
|
|
|
— |
|
|
|
— |
|
|
|
— |
|
|
|
— |
|
|
|
— |
|
|
|
(1,170 |
) |
| Repayment 6.00% |
|
|
|
|
|
|
|
|
|
|
|
|
|
|
|
|
|
|
|
|
|
|
|
|
|
|
|
|
|
|
|
|
|
|
|
|
|
|
|
|
|
|
|
|
| Senior Secured Notes |
|
|
(634,375 |
) |
|
|
— |
|
|
|
— |
|
|
|
— |
|
|
|
— |
|
|
|
— |
|
|
|
— |
|
|
|
— |
|
|
|
— |
|
|
|
— |
|
|
|
(634,375 |
) |
| Interest received at issuance of additional notes |
|
|
— |
|
|
|
2,428 |
|
|
|
— |
|
|
|
— |
|
|
|
— |
|
|
|
— |
|
|
|
— |
|
|
|
— |
|
|
|
— |
|
|
|
— |
|
|
|
2,428 |
|
| Transaction costs |
|
|
|
|
|
|
|
|
|
|
|
|
|
|
|
|
|
|
|
|
|
|
|
|
|
|
|
|
|
|
|
|
|
|
|
|
|
|
|
|
|
|
|
|
| Senior Notes |
|
|
— |
|
|
|
(7,122 |
) |
|
|
— |
|
|
|
— |
|
|
|
— |
|
|
|
— |
|
|
|
— |
|
|
|
— |
|
|
|
— |
|
|
|
— |
|
|
|
(7,122 |
) |
| Transaction costs |
|
|
|
|
|
|
|
|
|
|
|
|
|
|
|
|
|
|
|
|
|
|
|
|
|
|
|
|
|
|
|
|
|
|
|
|
|
|
|
|
|
|
|
|
| Revolving Facility |
|
|
— |
|
|
|
— |
|
|
|
— |
|
|
|
— |
|
|
|
(2,542 |
) |
|
|
— |
|
|
|
— |
|
|
|
— |
|
|
|
— |
|
|
|
— |
|
|
|
(2,542 |
) |
| Total changes from financing cash flows |
|
|
(634,375 |
) |
|
|
1,190,106 |
|
|
|
(2,366 |
) |
|
|
(1,170 |
) |
|
|
(104,452 |
) |
|
|
29 |
|
|
|
1,707 |
|
|
|
— |
|
|
|
— |
|
|
|
— |
|
|
|
449,479 |
|
| |
|
|
|
|
|
|
|
|
|
|
|
|
|
|
|
|
|
|
|
|
|
|
|
|
|
|
|
|
|
|
|
|
|
|
|
|
|
|
|
|
|
|
|
|
| Other changes |
|
|
|
|
|
|
|
|
|
|
|
|
|
|
|
|
|
|
|
|
|
|
|
|
|
|
|
|
|
|
|
|
|
|
|
|
|
|
|
|
|
|
|
|
| Liability-related |
|
|
|
|
|
|
|
|
|
|
|
|
|
|
|
|
|
|
|
|
|
|
|
|
|
|
|
|
|
|
|
|
|
|
|
|
|
|
|
|
|
|
|
|
| Capitalized borrowing costs/bond premiums |
|
|
(3,141 |
) |
|
|
709 |
|
|
|
108 |
|
|
|
— |
|
|
|
4,548 |
|
|
|
— |
|
|
|
— |
|
|
|
— |
|
|
|
— |
|
|
|
— |
|
|
|
2,224 |
|
| Redemption fee repayment 6.00% Senior Secured Notes |
|
|
9,375 |
|
|
|
— |
|
|
|
— |
|
|
|
— |
|
|
|
— |
|
|
|
— |
|
|
|
— |
|
|
|
— |
|
|
|
— |
|
|
|
— |
|
|
|
9,375 |
|
| Interest expense |
|
|
— |
|
|
|
— |
|
|
|
— |
|
|
|
417 |
|
|
|
— |
|
|
|
— |
|
|
|
— |
|
|
|
— |
|
|
|
— |
|
|
|
— |
|
|
|
417 |
|
| Interest paid |
|
|
— |
|
|
|
(2,428 |
) |
|
|
— |
|
|
|
— |
|
|
|
— |
|
|
|
— |
|
|
|
— |
|
|
|
— |
|
|
|
— |
|
|
|
— |
|
|
|
(2,428 |
) |
| Total liability-related |
|
|
6,234 |
|
|
|
(1,719 |
) |
|
|
108 |
|
|
|
417 |
|
|
|
4,548 |
|
|
|
— |
|
|
|
— |
|
|
|
— |
|
|
|
— |
|
|
|
— |
|
|
|
9,588 |
|
| Total equity-related other changes |
|
|
— |
|
|
|
— |
|
|
|
— |
|
|
|
— |
|
|
|
— |
|
|
|
— |
|
|
|
12,270 |
|
|
|
(639 |
) |
|
|
4 |
|
|
|
30,388 |
|
|
|
42,023 |
|
| Balance as at December 31, 2018 |
|
|
— |
|
|
|
1,188,387 |
|
|
|
51,382 |
|
|
|
50,374 |
|
|
|
— |
|
|
|
7,170 |
|
|
|
553,425 |
|
|
|
3,541 |
|
|
|
(165 |
) |
|
|
69,449 |
|
|
|
1,923,563 |
|
www.interxion.com / 73
|
|
|
|
|
| CONSOLIDATED FINANCIAL STATEMENTS |
|
|
|
|
|
|
|
|
|
|
|
|
|
|
|
|
|
|
|
|
|
|
|
|
|
|
|
|
|
|
|
|
|
|
|
|
|
|
|
|
|
|
|
|
|
|
|
| |
|
Senior
Secured
Notes
due 2020 |
|
|
4.75%
Senior
Notes due 2020 |
|
|
Mortgages |
|
|
Finance
lease
liabilities |
|
|
Revolving
Credit
facilities |
|
|
Share
capital |
|
|
Share
premium |
|
|
Foreign
currency translation
reserve |
|
|
Hedging
Reserve |
|
|
Accumulated
profit/
(deficit) |
|
|
Total |
|
| |
|
|
|
|
|
|
|
|
|
|
|
|
|
(€’000)
|
|
|
|
|
|
|
|
|
|
|
|
|
|
|
|
|
|
|
|
| Balance as at January 1, 2017 |
|
|
629,327 |
|
|
|
|
|
|
|
54,412 |
|
|
|
51,718 |
|
|
|
— |
|
|
|
7,060 |
|
|
|
523,671 |
|
|
|
11,004 |
|
|
|
(243 |
) |
|
|
(6 |
) |
|
|
1,276,943 |
|
| Changes from financing cash flows |
|
|
|
|
|
|
|
|
|
|
|
|
|
|
|
|
|
|
|
|
|
|
|
|
|
|
|
|
|
|
|
|
|
|
|
|
|
|
|
|
|
|
|
|
| Proceeds from exercised options |
|
|
— |
|
|
|
|
|
|
|
— |
|
|
|
— |
|
|
|
— |
|
|
|
55 |
|
|
|
6,914 |
|
|
|
— |
|
|
|
— |
|
|
|
— |
|
|
|
6,969 |
|
| Proceeds from mortgages |
|
|
— |
|
|
|
|
|
|
|
9,950 |
|
|
|
— |
|
|
|
— |
|
|
|
— |
|
|
|
— |
|
|
|
— |
|
|
|
— |
|
|
|
— |
|
|
|
9,950 |
|
| Repayment of mortgages |
|
|
— |
|
|
|
|
|
|
|
(10,848 |
) |
|
|
— |
|
|
|
— |
|
|
|
— |
|
|
|
— |
|
|
|
— |
|
|
|
— |
|
|
|
— |
|
|
|
(10,848 |
) |
| Proceeds from Revolving Facilities |
|
|
— |
|
|
|
|
|
|
|
— |
|
|
|
— |
|
|
|
129,521 |
|
|
|
— |
|
|
|
— |
|
|
|
— |
|
|
|
— |
|
|
|
— |
|
|
|
129,521 |
|
| Repayment of Revolving Facilities |
|
|
— |
|
|
|
|
|
|
|
— |
|
|
|
— |
|
|
|
(30,000 |
) |
|
|
— |
|
|
|
— |
|
|
|
— |
|
|
|
— |
|
|
|
— |
|
|
|
(30,000 |
) |
| Finance lease obligation |
|
|
— |
|
|
|
|
|
|
|
— |
|
|
|
(995 |
) |
|
|
— |
|
|
|
— |
|
|
|
— |
|
|
|
— |
|
|
|
— |
|
|
|
— |
|
|
|
(995 |
) |
| Total changes from financing cash flows |
|
|
— |
|
|
|
|
|
|
|
(898 |
) |
|
|
(995 |
) |
|
|
99,521 |
|
|
|
55 |
|
|
|
6,914 |
|
|
|
— |
|
|
|
— |
|
|
|
— |
|
|
|
104,597 |
|
| |
|
|
|
|
|
|
|
|
|
|
|
|
|
|
|
|
|
|
|
|
|
|
|
|
|
|
|
|
|
|
|
|
|
|
|
|
|
|
|
|
|
|
|
|
| Other changes |
|
|
|
|
|
|
|
|
|
|
|
|
|
|
|
|
|
|
|
|
|
|
|
|
|
|
|
|
|
|
|
|
|
|
|
|
|
|
|
|
|
|
|
|
| Liability-related |
|
|
|
|
|
|
|
|
|
|
|
|
|
|
|
|
|
|
|
|
|
|
|
|
|
|
|
|
|
|
|
|
|
|
|
|
|
|
|
|
|
|
|
|
| Amortized borrowing costs |
|
|
(1,186 |
) |
|
|
|
|
|
|
126 |
|
|
|
— |
|
|
|
383 |
|
|
|
— |
|
|
|
— |
|
|
|
— |
|
|
|
— |
|
|
|
— |
|
|
|
(677 |
) |
| Interest expense |
|
|
— |
|
|
|
|
|
|
|
— |
|
|
|
404 |
|
|
|
— |
|
|
|
— |
|
|
|
— |
|
|
|
— |
|
|
|
— |
|
|
|
— |
|
|
|
404 |
|
| Total liability-related |
|
|
(1,186 |
) |
|
|
|
|
|
|
126 |
|
|
|
404 |
|
|
|
383 |
|
|
|
— |
|
|
|
— |
|
|
|
— |
|
|
|
— |
|
|
|
— |
|
|
|
(273 |
) |
| Total equity-related other changes |
|
|
— |
|
|
|
|
|
|
|
— |
|
|
|
— |
|
|
|
— |
|
|
|
26 |
|
|
|
8,863 |
|
|
|
(6,824 |
) |
|
|
74 |
|
|
|
39,067 |
|
|
|
41,206 |
|
| Balance as at December 31, 2017 |
|
|
628,141 |
|
|
|
|
|
|
|
53,640 |
|
|
|
51,127 |
|
|
|
99,904 |
|
|
|
7,141 |
|
|
|
539,448 |
|
|
|
4,180 |
|
|
|
(169 |
) |
|
|
39,061 |
|
|
|
1,422,473 |
|
(i) Certain figures as of December 31, 2017 and 2016 have been corrected compared to those previously reported. For further
information on these corrections, see Notes 2 and 28 of these 2018 consolidated financial statements.
Maturity profile
The maturity profile of the gross amounts of Senior Notes, Senior Secured Notes, the 2017 Senior Secured Revolving Facility and Mortgages are set out below:
|
|
|
|
|
|
|
|
|
|
|
|
|
| |
|
2018 |
|
|
2017
(€’000) |
|
|
2016 |
|
| Within one year |
|
|
— |
|
|
|
104,400 |
|
|
|
7,332 |
|
| Between 1 and 5 years |
|
|
27,333 |
|
|
|
648,000 |
|
|
|
643,800 |
|
| Over 5 years |
|
|
1,224,648 |
|
|
|
26,916 |
|
|
|
29,107 |
|
| |
|
|
1,251,981 |
|
|
|
779,316 |
|
|
|
680,239 |
|
The Group has the following undrawn bank borrowing facilities:
|
|
|
|
|
|
|
|
|
|
|
|
|
| |
|
2018 |
|
|
2017
(€’000) |
|
|
2016 |
|
| Expiring within one year |
|
|
— |
|
|
|
100,000 |
|
|
|
100,000 |
|
| Expiring between 1 and 5 years |
|
|
200,000 |
|
|
|
— |
|
|
|
100,000 |
|
| |
|
|
200,000 |
|
|
|
100,000 |
|
|
|
100,000 |
|
74 / www.interxion.com
|
|
|
|
|
|
|
CONSOLIDATED FINANCIAL STATEMENTS |
Covenants
The Revolving
Facility Agreement contains various covenants that restrict, among other things and subject to certain exceptions, the ability of the Company and its subsidiaries to:
| ∎ |
|
incur debt and/or guarantees; |
| ∎ |
|
sell certain kinds of assets; |
| ∎ |
|
designate unrestricted subsidiaries; and |
| ∎ |
|
effect mergers, consolidate or sell assets. |
Our Revolving Facility Agreement also requires us to maintain a specified financial ratio. The restrictive covenants are subject to customary exceptions including, in
relation to the incurrence of certain debt, a consolidated fixed charge coverage ratio (calculated as a ratio of Adjusted EBITDA to consolidated interest expense) of at least 2.00 to 1.00 on a pro forma basis for the four full fiscal quarters (taken
as one period) for which financial statements are available immediately preceding the incurrence.
The Revolving Facility Agreement also includes a net leverage ratio
financial covenant (tested on a quarterly basis provided that the Test Condition applies), which requires total net debt (calculated as a ratio to pro forma Adjusted EBITDA) not to exceed a leverage ratio of 5.00 to 1.00. In addition, the Revolving
Facility Agreement permits us to elect, on a one-time basis and subject to certain conditions, to adjust the financial covenant to 5.50 to 1.00 for up to two consecutive quarter periods (including the quarter
such election is made). In addition, the Company must ensure, under the Revolving Facility Agreement, that the guarantors represent a certain percentage of Adjusted EBITDA of the Group as a whole and a certain percentage of the consolidated net
assets of the Group. Our ability to meet these covenants may be affected by events beyond our control and, as a result, we cannot assure you that we will be able to meet the covenants. In the event of a continuing default under our Revolving
Facility Agreement, the lenders could terminate their commitments and declare all amounts owed to them to be due and payable. Borrowings under other debt instruments that contain cross acceleration or cross default provisions, including the Senior
Notes, may as a result also be accelerated and become due and payable. The breach of any of these covenants by the Company or the failure by the Company to maintain its leverage ratio could result in a default under the Revolving Facility Agreement.
The Indenture contains covenants for the benefit of the holders of the Notes that restrict, among other things and subject to certain exceptions, the ability of the
Company and its subsidiaries to:
| ∎ |
|
create or incur certain liens; |
| ∎ |
|
sell certain kinds of assets; |
| ∎ |
|
designate unrestricted subsidiaries; |
| ∎ |
|
effect mergers, consolidations or sale of assets; and |
| ∎ |
|
guarantees certain debt. |
The restrictive covenants are subject to customary exceptions including, in relation to the incurrence of certain additional debt, a consolidated fixed charge coverage
ratio (calculated as a ratio of Adjusted EBITDA to consolidated interest expense) of at least 2.00 to 1.00 on a pro forma basis for the four full fiscal quarters (taken as one period) for which financial statements are available immediately
preceding the incurrence of such debt. The breach of any of these covenants by the Company could result in a default under the Indenture. The Company remained in full compliance with all its covenants. As of December 31, 2018, the
Company’s consolidated fixed charge ratio was 4.11 to 1.00 (2017: 4.92 to 1.00; 2016: 4.51 to 1.00).
www.interxion.com / 75
|
|
|
|
|
| CONSOLIDATED FINANCIAL STATEMENTS |
|
|
Financial lease liabilities
Financial lease liabilities relate to the acquisition of property, plant and equipment with the following payment schedule:
|
|
|
|
|
|
|
|
|
|
|
|
|
| |
|
2018 |
|
|
2017
(€’000) |
|
|
2016 |
|
| Gross lease liabilities: |
|
|
|
|
|
|
|
|
|
|
|
|
| Within one year |
|
|
21,686 |
|
|
|
4,389 |
|
|
|
4,346 |
|
| Between 1 and 5 years |
|
|
26,719 |
|
|
|
29,625 |
|
|
|
31,904 |
|
| More than 5 years |
|
|
17,680 |
|
|
|
36,478 |
|
|
|
39,144 |
|
| |
|
|
66,085 |
|
|
|
70,492 |
|
|
|
75,394 |
|
| |
|
|
|
|
|
|
|
|
|
|
|
|
| Interest |
|
|
|
|
|
|
|
|
|
|
|
|
| Within one year |
|
|
3,034 |
|
|
|
3,693 |
|
|
|
3,898 |
|
| Between 1 and 5 years |
|
|
8,595 |
|
|
|
10,218 |
|
|
|
11,897 |
|
| More than 5 years |
|
|
4,082 |
|
|
|
5,454 |
|
|
|
7,881 |
|
| |
|
|
15,711 |
|
|
|
19,365 |
|
|
|
23,676 |
|
| |
|
|
|
|
|
|
|
|
|
|
|
|
| Present value of minimum lease payments |
|
|
|
|
|
|
|
|
|
|
|
|
| Within one year |
|
|
18,652 |
|
|
|
696 |
|
|
|
448 |
|
| Between 1 and 5 years |
|
|
18,124 |
|
|
|
19,407 |
|
|
|
20,007 |
|
| More than 5 years |
|
|
13,598 |
|
|
|
31,024 |
|
|
|
31,263 |
|
| Present value of minimum lease
payments |
|
|
50,374 |
|
|
|
51,127 |
|
|
|
51,718 |
|
In September 2015, the Group entered into a contract to lease the properties related to the AMS8 data center. The lease, which covers
land and building, commenced during the third quarter of 2016. The land component has been treated as an operating lease, the building as a finance lease. As of December 31, 2018, the carrying value of the building amounted to €15.9 million.
In August 2014, the Group exercised its option to purchase the AMS7 data center land and
building. The actual legal transaction will become effective in 2023. As a result of this modification, in accordance with IAS17, as of 22 August 2014, the lease, which was previously reported as an operating lease is reported as a financial
lease. The carrying amount of the land amounts to €5.8 million, the carrying value of the building amounted to €6.5 million. The
actual legal transfer of ownership will become effective in 2023.
In December 2012, the Group exercised its option to purchase the PAR7 data center land. The actual
legal transaction will come into effect in 2019. As a result of this modification, in accordance with IAS17, as of December 20, 2012, the lease, which was previously reported as an operating lease is treated as a financial lease. The carrying
amount of the land amounts to €20.9 million.
76 / www.interxion.com
|
|
|
|
|
|
|
CONSOLIDATED FINANCIAL STATEMENTS |
20. Financial instruments
Credit risk
Exposure to credit risk
The carrying amount of financial assets represents the maximum credit exposure. The total balance exposed to credit risk at the reporting date was:
|
|
|
|
|
|
|
|
|
|
|
|
|
| |
|
2018 |
|
2017
(€’000) |
|
|
2016 |
|
| Trade receivables |
|
|
99,904 |
|
|
|
113,518 |
|
|
|
91,451 |
|
| Accrued revenue |
|
|
41,754 |
|
|
|
36,575 |
|
|
|
34,560 |
|
| Collateralized cash |
|
|
16,389 |
|
|
|
4,053 |
|
|
|
3,729 |
|
| Rental and other supplier deposits |
|
|
4,069 |
|
|
|
3,736 |
|
|
|
3,056 |
|
| Other investments |
|
|
7,906 |
|
|
|
3,693 |
|
|
|
1,942 |
|
| Cash and cash equivalents |
|
|
186,090 |
|
|
|
38,484 |
|
|
|
115,893 |
|
| |
|
|
356,112 |
|
|
|
200,059 |
|
|
|
250,631 |
|
The Group assessed its risks relating to cash and cash equivalents. Based on the outcome of this assessment, the group elected its main
relationship bank to hold the majority of its cash and cash equivalents. Term risk is limited to deposits of no more than two weeks. The Group monitors its cash position, including counterparty and term risk, daily.
The Group seeks to minimize the credit risk related to customers by analyzing new customers individually for creditworthiness before it begins to trade. If customers are
independently rated, these ratings are used. If there is no independent rating, the credit quality of the customer is analyzed taking its financial position, past experience and other factors into account.
The Group’s largest financial asset balance exposed to credit risk is with a financial institution, one of the Company’s relationships banks, which accounts
for approximately 48% of the €356.1 million total balance exposed to credit risk as of December 31, 2018.
The Group’s largest customer balance exposed to credit risk is with a customer, serviced from multiple locations under multiple service contracts, which accounts
for approximately 11% of the total balance exposed to credit risk as of December 31, 2018.
The maximum credit exposure on the trade receivables is reduced by
the deferred revenue balance of €71.5 million, as presented in Note 18 (2017: €80.8 million and 2016: €70.3 million).
The exposure to credit risk for trade receivables at the reporting date by geographic region was:
|
|
|
|
|
|
|
|
|
|
|
|
|
| |
|
2018 |
|
2017
(€’000) |
|
|
2016 |
|
| UK, France, Germany and The Netherlands |
|
|
76,213 |
|
|
|
88,634 |
|
|
|
71,099 |
|
| Rest of Europe |
|
|
22,840 |
|
|
|
23,995 |
|
|
|
19,807 |
|
| Corporate |
|
|
851 |
|
|
|
889 |
|
|
|
545 |
|
| |
|
|
99,904 |
|
|
|
113,518 |
|
|
|
91,451 |
|
www.interxion.com / 77
|
|
|
|
|
| CONSOLIDATED FINANCIAL STATEMENTS |
|
|
The Company uses an allowance matrix to measure the Expected Credit Losses of trade receivables from individual
customers, which comprise a very large number of small balances. The aging and the allowance per aging category of trade receivables as of the reporting date was:
|
|
|
|
|
|
|
|
|
|
|
|
|
|
|
|
|
|
|
|
|
|
|
|
|
| |
|
2018 |
|
|
2017 |
|
|
2016 |
|
| |
|
Gross |
|
|
Allowance |
|
|
Gross |
|
|
Allowance |
|
|
Gross |
|
|
Allowance |
|
| |
|
|
|
|
|
|
|
(€’000)
|
|
|
|
|
|
|
|
| Not past due |
|
|
71,139 |
|
|
|
— |
|
|
|
88,530 |
|
|
|
— |
|
|
|
69,771 |
|
|
|
— |
|
| Past due 1–30 days |
|
|
12,312 |
|
|
|
— |
|
|
|
9,448 |
|
|
|
— |
|
|
|
12,027 |
|
|
|
— |
|
| Past due 31–120 days |
|
|
10,830 |
|
|
|
36 |
|
|
|
13,111 |
|
|
|
39 |
|
|
|
7,329 |
|
|
|
8 |
|
| Past due 121 days–1 year |
|
|
4,739 |
|
|
|
317 |
|
|
|
2,295 |
|
|
|
223 |
|
|
|
2,358 |
|
|
|
234 |
|
| More than 1 year |
|
|
1,628 |
|
|
|
391 |
|
|
|
725 |
|
|
|
329 |
|
|
|
324 |
|
|
|
116 |
|
| |
|
|
100,648 |
|
|
|
744 |
|
|
|
114,109 |
|
|
|
591 |
|
|
|
91,809 |
|
|
|
358 |
|
The movement in the loss allowance for expected credit losses in respect of trade receivables during the year was as follows:
|
|
|
|
|
|
|
|
|
|
|
|
|
| |
|
2018 |
|
|
2017 (€’000) |
|
|
2016 |
|
| Balance as at January 1, |
|
|
591 |
|
|
|
358 |
|
|
|
192 |
|
| Impairment loss recognized |
|
|
174 |
|
|
|
316 |
|
|
|
285 |
|
| Write-offs |
|
|
(21 |
) |
|
|
(83 |
) |
|
|
(119 |
) |
| Balance as at December 31, |
|
|
744 |
|
|
|
591 |
|
|
|
358 |
|
Liquidity risk
The following are the
contractual maturities of financial liabilities, including interest payments and excluding the impact of netting agreements.
|
|
|
|
|
|
|
|
|
|
|
|
|
|
|
|
|
|
|
|
|
| |
|
Carrying
amount |
|
|
Contractual
cash flows
(€’000) |
|
|
Less than
1 year |
|
|
Between
1-5 years |
|
|
More than
5 years |
|
| December 31, 2018
|
|
|
|
|
|
|
|
|
|
|
|
|
|
|
|
|
|
|
|
|
| Financial liabilities |
|
|
|
|
|
|
|
|
|
|
|
|
|
|
|
|
|
|
|
|
| Senior Notes |
|
|
1,188,387 |
|
|
|
1,542,000 |
|
|
|
57,000 |
|
|
|
228,000 |
|
|
|
1,257,000 |
|
| Finance lease liabilities |
|
|
50,374 |
|
|
|
66,094 |
|
|
|
21,695 |
|
|
|
26,720 |
|
|
|
17,679 |
|
| Mortgages |
|
|
51,382 |
|
|
|
56,739 |
|
|
|
5,372 |
|
|
|
36,872 |
|
|
|
14,495 |
|
| Trade and other payables(1) |
|
|
226,116 |
|
|
|
226,116 |
|
|
|
225,879 |
|
|
|
31 |
|
|
|
206 |
|
| |
|
|
1,516,259 |
|
|
|
1,890,949 |
|
|
|
309,946 |
|
|
|
291,623 |
|
|
|
1,289,380 |
|
|
|
|
|
|
|
| December 31, 2017 |
|
|
|
|
|
|
|
|
|
|
|
|
|
|
|
|
|
|
|
|
|
|
|
|
|
|
| Financial liabilities |
|
|
|
|
|
|
|
|
|
|
|
|
|
|
|
|
|
|
|
|
|
|
|
|
|
|
| Senior Secured Notes |
|
|
628,141 |
|
|
|
737,500 |
|
|
|
37,500 |
|
|
|
700,000 |
|
|
|
— |
|
| Finance lease liabilities |
|
|
51,127 |
|
|
|
70,492 |
|
|
|
4,389 |
|
|
|
29,625 |
|
|
|
36,478 |
|
| Mortgages |
|
|
53,640 |
|
|
|
59,684 |
|
|
|
9,380 |
|
|
|
33,149 |
|
|
|
17,155 |
|
| 2017 Senior Secured Revolving Facility |
|
|
100,000 |
|
|
|
100,000 |
|
|
|
100,000 |
|
|
|
|
|
|
|
|
|
| Trade and other payables(1) |
|
|
145,412 |
|
|
|
145,412 |
|
|
|
145,225 |
|
|
|
26 |
|
|
|
161 |
|
| |
|
|
978,320 |
|
|
|
1,113,088 |
|
|
|
296,494 |
|
|
|
762,800 |
|
|
|
53,794 |
|
78 / www.interxion.com
|
|
|
|
|
|
|
CONSOLIDATED FINANCIAL STATEMENTS |
|
|
|
|
|
|
|
|
|
|
|
|
|
|
|
|
|
|
|
|
|
| December 31, 2016 |
|
Carrying
amount |
|
|
Contractual
cash flows
|
|
|
Less than
1 year |
|
|
Between
1-5 years |
|
|
More than
5 years |
|
| |
|
|
|
|
(€’000) |
|
|
|
|
|
|
|
|
|
|
| Financial liabilities |
|
|
|
|
|
|
|
|
|
|
|
|
|
|
|
|
|
|
|
|
| Senior Secured Notes |
|
|
629,327 |
|
|
|
775,000 |
|
|
|
37,500 |
|
|
|
737,500 |
|
|
|
— |
|
| Finance lease liabilities |
|
|
51,718 |
|
|
|
75,394 |
|
|
|
4,346 |
|
|
|
31,904 |
|
|
|
39,144 |
|
| Mortgages |
|
|
54,412 |
|
|
|
60,792 |
|
|
|
12,137 |
|
|
|
28,980 |
|
|
|
19,675 |
|
| Trade and other payables(1) |
|
|
95,803 |
|
|
|
95,803 |
|
|
|
95,624 |
|
|
|
26 |
|
|
|
153 |
|
| |
|
|
831,260
|
|
|
|
1,006,989
|
|
|
|
149,607
|
|
|
|
798,410
|
|
|
|
58,972 |
|
| (1) |
The carrying amount excludes accrued interest on Senior Notes, Senior Secured Notes and mortgages, deferred revenues and
rental holidays. |
| (i) |
Certain figures as of December 31, 2017 and 2016 have been corrected compared to those previously reported. For
further information on these corrections, see Notes 2 and 28 of these 2018 consolidated financial statements. |
Market risk
Exposure to currency risk
The following significant exchange rates
applied during the year:
|
|
|
|
|
|
|
|
|
|
|
|
|
|
|
|
|
|
|
|
|
|
|
|
|
| |
|
|
|
Average rate
(EUR)
|
|
|
|
|
|
Report date mid-spot rate
(EUR)
|
| |
|
2018 |
|
2017 |
|
|
2016 |
|
|
2018 |
|
2017 |
|
|
2016 |
|
| GBP 1 |
|
|
1.131 |
|
|
|
1.141 |
|
|
|
1.220 |
|
|
|
1.115 |
|
|
|
1.126 |
|
|
|
1.167 |
|
| CHF 1 |
|
|
0.864 |
|
|
|
0.897 |
|
|
|
0.918 |
|
|
|
0.888 |
|
|
|
0.855 |
|
|
|
0.931 |
|
| DKK 1 |
|
|
0.134 |
|
|
|
0.134 |
|
|
|
0.134 |
|
|
|
0.134 |
|
|
|
0.134 |
|
|
|
0.135 |
|
| SEK 1 |
|
|
0.098 |
|
|
|
0.104 |
|
|
|
0.106 |
|
|
|
0.098 |
|
|
|
0.102 |
|
|
|
0.104 |
|
Sensitivity analysis
A 10%
strengthening of the euro against the following currencies at December 31, would have increased (decreased) equity and profit or loss by approximately the amounts shown below. This analysis assumes that all other variables, in particular interest
rates, remained constant and was performed on the same basis for 2017 and 2016.
|
|
|
|
|
|
|
|
|
|
|
|
|
| |
|
Equity |
|
|
|
|
|
Profit or loss |
|
| |
|
|
|
|
(€’000) |
|
|
|
|
|
|
|
|
| December 31, 2018 |
|
|
|
|
|
|
|
|
|
|
|
|
| GBP |
|
|
(6,295 |
) |
|
|
|
|
|
|
(1,656 |
) |
| CHF |
|
|
(5,131 |
) |
|
|
|
|
|
|
(252 |
) |
| DKK |
|
|
(2,679 |
) |
|
|
|
|
|
|
(164 |
) |
| SEK |
|
|
(1,319 |
) |
|
|
|
|
|
|
(24 |
) |
|
|
|
|
| December 31, 2017 |
|
|
|
|
|
|
|
|
|
|
|
|
| GBP |
|
|
(4,573 |
) |
|
|
|
|
|
|
(1,712 |
) |
| CHF |
|
|
(4,755 |
) |
|
|
|
|
|
|
(148 |
) |
| DKK |
|
|
(2,512 |
) |
|
|
|
|
|
|
(246 |
) |
| SEK |
|
|
(1,348 |
) |
|
|
|
|
|
|
(196 |
) |
|
|
|
|
| December 31, 2016 |
|
|
|
|
|
|
|
|
|
|
|
|
| GBP |
|
|
(2,895 |
) |
|
|
|
|
|
|
(127 |
) |
| CHF |
|
|
(4,990 |
) |
|
|
|
|
|
|
(186 |
) |
| DKK |
|
|
(2,268 |
) |
|
|
|
|
|
|
(211 |
) |
| SEK |
|
|
(1,179 |
) |
|
|
|
|
|
|
38 |
|
| (i) |
Certain figures as of December 31, 2017 and 2016 have been corrected compared to those previously reported. For
further information on these corrections, see Notes 2 and 28 of these 2018 consolidated financial statements. |
A 10% weakening of the euro against
the above currencies at December 31, would have had the equal, but opposite, effect to the amounts shown above, on the basis that all other variables remained constant.
www.interxion.com / 79
|
|
|
|
|
| CONSOLIDATED FINANCIAL STATEMENTS |
|
|
Interest rate risk
Profile
At the reporting date, the interest rate profile of the
Group’s interest-bearing financial instruments was:
|
|
|
|
|
|
|
|
|
|
|
|
|
| |
|
Carrying amount
|
|
|
|
|
| |
|
2018 |
|
2017
(€’000) |
|
|
2016 |
|
| Fixed-rate instrument |
|
|
|
|
|
|
|
|
|
|
|
|
| Senior Secured Notes |
|
|
— |
|
|
|
628,141 |
|
|
|
629,327 |
|
| Senior Notes |
|
|
1,188,387 |
|
|
|
— |
|
|
|
— |
|
| Finance lease liabilities |
|
|
50,374 |
|
|
|
51,127 |
|
|
|
51,718 |
|
| Mortgages |
|
|
4,451 |
|
|
|
4,927 |
|
|
|
5,400 |
|
| |
|
|
1,243,212 |
|
|
|
684,195 |
|
|
|
686,445 |
|
| Variable-rate instruments |
|
|
|
|
|
|
|
|
|
|
|
|
| Mortgages |
|
|
46,931 |
|
|
|
48,713 |
|
|
|
49,012 |
|
| 2017 Senior Secured Revolving Facility |
|
|
— |
|
|
|
99,904 |
|
|
|
— |
|
| |
|
|
46,931 |
|
|
|
148,617 |
|
|
|
49,012 |
|
| |
|
|
1,290,143 |
|
|
|
832,812 |
|
|
|
735,457 |
|
The mortgages on the PAR3 land, owned by Interxion Real Estate II Sarl, and the PAR5 land, owned by Interxion Real Estate III Sarl have
variable interest rates based on EURIBOR plus an individual margin ranging from 240 to 280 basis points. The interest rates have been fixed for 75% of the principal outstanding amount for a period of ten years, which has been reflected in the table
above.
Cash flow sensitivity analysis for fixed-rate instruments
Except for the convertible loan granted to Icolo Ltd., the Group does not account for any fixed-rate financial assets and
liabilities at fair value through profit and loss and does designate derivatives (interest rate swaps) as hedging instruments under a fair value hedge accounting model. A change in interest rates at the end of the reporting period would, therefore,
not affect profit or loss.
Cash flow sensitivity analysis for variable rate instruments
A change of 100 basis points in interest rates payable during the reporting period would have increased (decreased) equity and profit or loss by the amounts shown below.
This analysis assumes that all other variables, in particular foreign currency rates, remained constant.
|
|
|
|
|
|
|
|
|
|
|
|
|
|
|
|
|
|
|
|
|
| |
|
Profit or loss |
|
|
|
|
|
Equity |
|
| |
|
100 bp increase |
|
|
100 bp decrease |
|
|
|
|
|
100 bp increase |
|
|
100 bp decrease |
|
| |
|
|
|
|
|
|
|
(€’000) |
|
|
|
|
|
|
|
| December 31, 2018 |
|
|
|
|
|
|
|
|
|
|
|
|
|
|
|
|
|
|
|
|
| Variable-rate instruments |
|
|
(1,692) |
|
|
|
1,692 |
|
|
|
|
|
|
|
(69) |
|
|
|
69 |
|
| |
|
|
|
|
|
|
|
|
|
|
|
|
|
|
|
|
|
|
|
|
| December 31, 2017 |
|
|
|
|
|
|
|
|
|
|
|
|
|
|
|
|
|
|
|
|
| Variable-rate instruments |
|
|
(1,021) |
|
|
|
1,021 |
|
|
|
|
|
|
|
(76) |
|
|
|
76 |
|
| |
|
|
|
|
|
|
|
|
|
|
|
|
|
|
|
|
|
|
|
|
| December 31, 2016 |
|
|
|
|
|
|
|
|
|
|
|
|
|
|
|
|
|
|
|
|
| Variable-rate instruments |
|
|
(478) |
|
|
|
478 |
|
|
|
|
|
|
|
(84) |
|
|
|
84 |
|
80 / www.interxion.com
|
|
|
|
|
|
|
CONSOLIDATED FINANCIAL STATEMENTS |
Fair values and hierarchy
Fair values versus carrying amounts
As at December 31, 2018, the
market price of the Senior Notes was 102.641. Using this market price, the fair value of the Senior Notes would have been approximately €1,231.7 million, compared with their nominal value of
€1,200.0 million. As of December 31, 2017, the market price of the 6.00% Senior Secured Notes due 2020 was 103.552 (2016: 105.045). Using this market price, the fair value of the Senior
Secured Notes due 2020 would have been approximately €647.0 million (2016: €657.0 million), compared with their nominal value of €625.0 million (2016: €625.0 million).
The Group had a
cash flow hedge in place to hedge the interest rate risk of part of two mortgages. This instrument is carried at fair value through profit and loss.
As at
December 31, 2018, the fair value of all mortgages was equal to their carrying amount of €51.4 million. As of December 31, 2018, the fair value of the financial lease liabilities
was €54.1 million compared with its carrying amount of €50.4 million.
Fair value hierarchy
The Company regularly reviews significant
unobservable inputs and valuation adjustments. If third-party information, such as broker quotes or pricing services, is used to measure fair values, then the Company assesses the evidence obtained from the third parties to support the conclusion
that such valuations meet the requirements of IFRS, including the level in the fair value hierarchy in which such valuations should be classified. Significant valuation issues are reported to the Company’s Audit Committee.
When measuring the fair value of an asset or a liability, the Company uses observable market data as far as possible. Fair values are categorized into different levels in
a fair-value hierarchy based on the inputs used in the valuation techniques as follows:
|
|
|
| Level 1: |
|
quoted prices (unadjusted) in active markets for identical assets or liabilities; |
|
|
| Level 2: |
|
inputs other than quoted prices included within Level 1 that are observable for the asset or liability, either directly (i.e. as prices) or indirectly (i.e. derived from prices); |
|
|
| Level 3: |
|
inputs for the asset or liability that are not based on observable market data (unobservable inputs). |
If the inputs used to measure the fair-value of an asset or a liability fall into different levels of the fair-value hierarchy, then the
fair-value measurement is categorized in its entirety at the same level of the fair-value hierarchy as the lowest level input that is significant to the entire measurement. The Company recognizes transfers between levels of the fair-value hierarchy
at the end of the reporting period during which the change has occurred.
The values of the instruments are:
|
|
|
|
|
|
|
|
|
|
|
|
|
|
|
|
|
| |
|
Carrying value |
|
|
|
|
|
Fair value |
|
|
|
|
| |
|
|
|
|
|
|
|
|
|
|
|
|
| |
|
|
|
|
Level 1 |
|
|
Level 2 |
|
|
Level 3 |
|
| |
|
|
|
|
|
|
|
(€’000) |
|
|
|
|
| December 31, 2018 |
|
|
|
|
|
|
|
|
|
|
|
|
|
|
|
|
| Senior notes |
|
|
(1,188,387) |
|
|
|
(1,231,692 |
) |
|
|
— |
|
|
|
— |
|
| Finance leases |
|
|
(50,374) |
|
|
|
— |
|
|
|
(54,092 |
) |
|
|
— |
|
| Mortgages |
|
|
(51,382) |
|
|
|
— |
|
|
|
(51,382 |
) |
|
|
— |
|
| Other investments |
|
|
7,906 |
|
|
|
— |
|
|
|
— |
|
|
|
7,906 |
|
| Interest rate swap |
|
|
(226) |
|
|
|
— |
|
|
|
(226 |
) |
|
|
— |
|
| |
|
|
|
|
|
|
|
|
|
|
|
|
|
|
|
|
| December 31, 2017 |
|
|
|
|
|
|
|
|
|
|
|
|
|
|
|
|
| Senior secured notes 6.00% due 2020 |
|
|
(628,141) |
|
|
|
(647,000 |
) |
|
|
— |
|
|
|
— |
|
| 2017 Senior Secured Revolving Facility |
|
|
(99,904) |
|
|
|
— |
|
|
|
(99,904 |
) |
|
|
— |
|
| Finance leases |
|
|
(51,127) |
|
|
|
— |
|
|
|
(54,282 |
) |
|
|
— |
|
| Mortgages |
|
|
(53,640) |
|
|
|
— |
|
|
|
(53,640 |
) |
|
|
— |
|
| Other investments |
|
|
3,693 |
|
|
|
— |
|
|
|
3,693 |
|
|
|
— |
|
| Interest rate swap |
|
|
(255) |
|
|
|
— |
|
|
|
(255 |
) |
|
|
— |
|
| Conversion option |
|
|
0 |
|
|
|
— |
|
|
|
— |
|
|
|
0 |
|
www.interxion.com / 81
|
|
|
|
|
| CONSOLIDATED FINANCIAL STATEMENTS |
|
|
|
|
|
|
|
|
|
|
|
|
|
|
|
|
|
|
|
| December 31,
2016 |
|
|
|
|
|
|
|
|
|
|
|
|
|
|
|
|
| Senior secured notes 6.00% due 2020 |
|
|
(629,327) |
|
|
|
(657,000 |
) |
|
|
— |
|
|
|
— |
|
| Finance leases |
|
|
(51,718) |
|
|
|
— |
|
|
|
(55,625 |
) |
|
|
— |
|
| Mortgages |
|
|
(54,412) |
|
|
|
— |
|
|
|
(54,412 |
) |
|
|
— |
|
| Other investments |
|
|
1,942 |
|
|
|
— |
|
|
|
1,942 |
|
|
|
— |
|
| Interest rate swap |
|
|
(367) |
|
|
|
— |
|
|
|
(367 |
) |
|
|
— |
|
| Conversion option |
|
|
0 |
|
|
|
— |
|
|
|
— |
|
|
|
0 |
|
The Level 3 financial assets represent convertible loans with a principal amount of USD 7.5 million (excluding accrued interest)
provided by InterXion Participation 1 B.V. Interxion has the option to convert the loans into equity on the maturity date or upon occurrence of an enforcement event. Upon implementation of IFRS 9 – Financial Instruments, the convertible loans
are considered instruments to be carried at FVTPL. Changes in the fair value of these loans are recognized in Net finance expense. Accordingly, since 1 January 2018, they have been presented in Level 3. There have been no further transfers
between levels of hierarchy.
Fair values were obtained from quoted market prices in active markets or, where no active market exists, by using valuation techniques.
Valuation techniques include discounted cash flow models using inputs as market interest rates and cash flows.
Capital management
The Board’s policy is to maintain a strong capital base to maintain investor, creditor and market confidence and to sustain future development of the business. The
Board of Directors monitors the return on capital based on a ratio calculated as Total liabilities minus Cash and cash equivalents, divided by Shareholders’ equity:
|
|
|
|
|
|
|
|
|
|
|
|
|
| |
|
2018 |
|
|
2017(i)
(€’000) |
|
|
2016(i) |
|
| Net debt |
|
|
|
|
|
|
|
|
|
|
|
|
| Total liabilities |
|
|
1,629,134 |
|
|
|
1,112,410 |
|
|
|
941,179 |
|
| Less: cash and cash equivalents |
|
|
(186,090 |
) |
|
|
(38,484 |
) |
|
|
(115,893 |
) |
| |
|
|
1,443,044 |
|
|
|
1,073,926 |
|
|
|
825,286 |
|
| Equity |
|
|
|
|
|
|
|
|
|
|
|
|
| Total equity |
|
|
633,420 |
|
|
|
589,661 |
|
|
|
541,486 |
|
| Net debt to equity ratio |
|
|
2.28 |
|
|
|
1.82 |
|
|
|
1.52 |
|
| (i) |
Certain figures as of December 31, 2017 and 2016 have been corrected compared to those previously reported. For
further information on these corrections, see Notes 2 and 28 of these 2018 consolidated financial statements. |
21. Share-based payments
Summary of outstanding options and restricted shares as of December 31, 2017
The terms and conditions of the grants (excluding restricted shares and performance share grants), under the 2011 and 2013 Option Plans with an USD exercise price, were
as follows:
|
|
|
|
|
|
|
|
|
|
|
|
|
| Grant date |
|
Employees entitled |
|
Exercise price
(in $) |
|
Outstanding
(in thousands) |
|
|
Exercisable
(in thousands) |
|
| 2011 |
|
Senior employees |
|
13.00 |
|
|
36 |
|
|
|
36 |
|
| 2012 |
|
Senior employees |
|
20.50 |
|
|
1 |
|
|
|
1 |
|
| 2013 |
|
Senior employees |
|
10.00-15.00 |
|
|
3 |
|
|
|
3 |
|
| 2014 |
|
Senior employees |
|
17.50 |
|
|
76 |
|
|
|
76 |
|
| 2015 |
|
Senior employees |
|
24.60-27.26 |
|
|
42 |
|
|
|
36 |
|
| 2016 |
|
Senior employees |
|
27.14-34.00 |
|
|
45 |
|
|
|
23 |
|
| 2017 |
|
Senior employees |
|
35.60-45.84 |
|
|
22 |
|
|
|
8 |
|
| 2018 |
|
Senior employees |
|
55.90 |
|
|
38 |
|
|
|
— |
|
| |
|
Total share options |
|
|
|
|
263 |
|
|
|
183 |
|
82 / www.interxion.com
|
|
|
|
|
|
|
CONSOLIDATED FINANCIAL STATEMENTS |
Share options granted from 2011 onwards, under the 2011 and 2013 Option Plans, generally vest over four years and can
be exercised up to eight years after the grant date. Vesting typically is over a 4-year period with 25% vesting after one year after the grant date and 6.25% per quarter thereafter. Options are settled with
common shares of Interxion stock. If the employee is terminated prior to the contractual term of the award, all unvested options are forfeited.
The number and
weighted average exercise prices of outstanding share options under the 2011 and 2013 Option Plans, excluding the restricted shares and performance share grants, with U.S. dollar exercise prices are as follows:
|
|
|
|
|
|
|
|
|
|
|
|
|
|
|
|
|
|
|
|
|
|
|
|
|
| |
|
Weighted average exercise price in € |
|
Number of options in thousands |
|
| |
|
2018 |
|
2017 |
|
|
2016 |
|
|
2018 |
|
|
2017 |
|
|
2016 |
|
| Outstanding at 1 January |
|
|
22.30 |
|
|
|
16.70 |
|
|
|
14.98 |
|
|
|
330 |
|
|
|
865 |
|
|
|
1,264 |
|
| Granted |
|
|
55.90 |
|
|
|
37.91 |
|
|
|
31.20 |
|
|
|
37 |
|
|
|
30 |
|
|
|
94 |
|
| Exercised |
|
|
20.27 |
|
|
|
14.13 |
|
|
|
14.90 |
|
|
|
(100) |
|
|
|
(550) |
|
|
|
(479) |
|
| Expired |
|
|
— |
|
|
|
— |
|
|
|
— |
|
|
|
— |
|
|
|
— |
|
|
|
— |
|
| Forfeited |
|
|
26.00 |
|
|
|
30.67 |
|
|
|
20.49 |
|
|
|
(4) |
|
|
|
(15) |
|
|
|
(14) |
|
| Outstanding –
December 31, |
|
|
27.80 |
|
|
|
22.30 |
|
|
|
16.70 |
|
|
|
263 |
|
|
|
330 |
|
|
|
865 |
|
| Exercisable –
December 31, |
|
|
20.65 |
|
|
|
18.34 |
|
|
|
14.22 |
|
|
|
183 |
|
|
|
228 |
|
|
|
689 |
|
The options outstanding at December 31, 2018 have a weighted average remaining contractual life of 4.3 years (2017: 4.4 years and
2016: 3.9 years).
Restricted Share Awards to Non-executive Directors
On June 30, 2015, the Annual General Meeting of Shareholders approved to award restricted shares equivalent to a value of
€40,000 under the terms and conditions of the Interxion Holding N.V. 2013 Amended International Equity Based Incentive Plan (the “Amended 2013 Plan”) to each of our Non-executive Directors (1,615 restricted shares each) for their services to be provided for the period between the 2015 Annual General Meeting and the 2016 Annual General Meeting. A total of 6,460 restricted shares
were granted.
On June 24, 2016, the Annual General Meeting of Shareholders approved the award of restricted shares, equivalent to a value of €40,000 under the terms and conditions of the Amended 2013 Plan, to each of our Non-executive Directors (1,234 restricted shares each) for their services to be
provided for the period between the 2016 Annual General Meeting and the 2017 Annual General Meeting. A total of 4,936 restricted shares were granted.
On
June 30, 2017, the Annual General Meeting of Shareholders approved the award of restricted shares equivalent to a value of €40,000 under the terms and conditions of the Amended 2013 Plan to
each of our Non-executive Directors (996 restricted shares each) for their services to be provided for the period between the 2017 Annual General Meeting and the 2018 Annual General Meeting. A total of 3,984
restricted shares were granted.
On June 29, 2018, the Annual General Meeting of Shareholders approved the award of restricted shares equivalent to a value of €40,000 under the terms and conditions of the Amended 2013 Plan to each of our Non-executive Directors (746 restricted shares each) for their services to be
provided for the period between the 2018 Annual General Meeting and the 2019 Annual General Meeting. A total of 3,730 restricted shares were granted.
2015
Performance Share Awards
With regard to the performance period of 2015, the Board of Directors approved the conditional award of performance shares in March
2015 for certain members of key management and the Executive Director under the terms and conditions of the Company’s 2013 Amended International Equity Based Incentive Plan on the basis of the predetermined, on target equity value for 2015 and
the Company’s average closing share price during the month of January 2015. The actual initial award of 149,600 performance shares, based on the level of the actual Company and individual performance from January 1, 2015, to
December 31, 2015, was approved by the Board of Directors in February 2016.
With regard to the Executive Director, the first 50% (38,286 performance shares) of
the initial award was approved at the 2016 Annual General Meeting. Of these 38,286 shares, 19,143 performance shares vested on approval but were locked up until December 31, 2016, and 19,143 performance shares vested on January 1, 2017.
www.interxion.com / 83
|
|
|
|
|
| CONSOLIDATED FINANCIAL STATEMENTS |
|
|
With retroactive effect, all performance shares from the 2015 conditional performance share award to our Executive
Director that were unvested at the time of the adoption of the 2017 Executive Director Long-Term Incentive Plan (the ‘2017 Plan”) on May 13, 2017, were deemed to have been awarded under the terms and conditions of the 2017 Plan. As a
result, 50% of the original 2015 conditional performance share award, 34,320 shares, were subject to the terms of the 2017 Plan. In accordance with the rules of the plan, the shares were subject to the Company’s three-year TSR performance
relative to the three-year TSR performance of the constituents of the S&P SmallCap 600 over the period January 1, 2015 through December 31, 2017.
Based on the Company’s actual three-year TSR performance (105%) relative to the three-year TSR performance of the constituents of S&P SmallCap 600 over the
period January 1, 2015 through December 31, 2017, the Company ranked at the 85th percentile of the S&P SmallCap 600. Based on this ranking and in accordance with the plan performance and the payout table, a final performance share
award of 60,060 shares was earned and approved by the Board in April 2018. The final performance share award was approved at the Annual General Meeting on June 29, 2018 and vested in two equal instalments. The first instalment of 30,030 shares
(50% of the final performance share award) vested on August 8, 2018, the second instalment of 30,030 shares (50% of the final performance share award) vested on March 11, 2019.
With regard to key members of management, the first 50% of the initial award (36,514 performance shares) was awarded after the 2016 Annual General Meeting. A number of
18,257 performance shares vested on award but were locked up until December 31, 2016 and 18,257 performance shares vested on January 1, 2017. The remaining 50% of the initial award (36,512 performance shares) was subject to the
Company’s two-year TSR performance relative to the two-year performance of the S&P SmallCap 600 Index over the period January 1, 2015 through
December 31, 2016.
The Company’s actual two-year TSR performance relative to the
two-year performance of the S&P SmallCap 600 Index over the period January 1, 2015 through December 31, 2016 was reviewed in March 2017. Based on the Company’s relative TSR performance the
Compensation Committee approved a final performance share award of 33,292 performance shares. Of these performance shares, 6,004 were forfeited on January 31, 2018, 6,004 shares vested on May 4, 2018 and 10,642 vested on June 5, 2018.
The remaining 10,642 shares vested on January 1, 2019.
Upon a change of control and (1) in the event the performance share plan or the individual award
agreement is terminated, or (2) the management agreement or employment agreement between the participant and the company is terminated by the company other than for cause, or (3) the participant is offered a position which is a material
demotion to the current position, all performance shares will vest immediately and any lock up provisions will expire.
2016 Performance Share Awards
With regard to the performance period of 2016, the Board of Directors approved the conditional award of performance shares in February 2016 for certain members of key
management and the Executive Director under the terms and conditions of the Company’s 2013 Amended International Equity Based Incentive Plan on the basis of the predetermined on-target equity value for
2016 and the Company’s average closing share price during the month of January 2016.
With regard to the Executive Director, with retroactive effect, all 61,469
performance shares from the 2016 conditional performance share award were deemed to have been awarded under the terms and conditions of the 2017 Plan. In accordance with the rules of the 2017 Plan, these shares were subject to the Company’s
three-year TSR performance relative to the three-year TSR performance of the constituents of the S&P SmallCap 600 over the period January 1, 2016 through December 31, 2018. The Company’s actual three-year TSR performance relative
to the three-year TSR performance of the constituents of the S&P SmallCap 600 over the period January 1, 2016 through December 31, 2018 was reviewed in January 2019. Based on the Company’s actual three-year TSR performance (96%)
relative to the three-year TSR performance of the constituents of S&P SmallCap 600 over the period January 1, 2016 through December 31, 2018, the Company ranked at the 82nd percentile of the S&P SmallCap 600. Based on this ranking and
in accordance with the plan performance and the payout table, a final performance share award of 107,571 shares was earned and approved by the Board in April 2019. The final performance share award will be subject to shareholder approval at the 2019
Annual General Meeting. Should it be approved, 50% of the performance shares will vest upon approval at the Annual General Meeting and 50% will vest on January 1, 2020.
With regard to key members of management, an initial award of 76,456 performance shares was approved by the Compensation Committee in February 2017, based on the level
of actual company performance and individual performance from January 1, 2016, to December 31, 2016. The first 50% of the initial award (38,228 performance shares) was awarded after the 2017 Annual General Meeting. Of the 38,228
performance shares, 19,114 performance shares vested on award but were locked up until December 31, 2017, 5,612 shares vested on May 4, 2018 and 13,502 shares vested on June 5, 2018.
Of the remaining 38,228 performance shares, 27,004 shares were subject to relative TSR performance adjustment, as 11,224 of the 38,228 shares were forfeited on
January 31, 2018. The 27,004 shares were subject to the Company’s two-year TSR performance
84 / www.interxion.com
|
|
|
|
|
|
|
CONSOLIDATED FINANCIAL STATEMENTS |
relative to the two-year performance of S&P SmallCap 600 Index over the
period January 1, 2016 through December 31, 2017. The Company’s actual two-year TSR performance relative to the performance of the S&P SmallCap 600 Index over the period January 1, 2016
through December 31, 2017 was reviewed in January 2018. Based on the Company’s relative TSR performance over the two-year performance period, a final performance share award of 40,507 shares (150% of
27,004 shares) was earned and approved by the Compensation Committee in April 2018. Of the final performance share award, 50% (20,255 shares) vested on January 1, 2019 and 50% (20,252 shares) will vest on January 1, 2020.
Upon a change of control and (1) in the event the performance share plan or the individual award agreement is terminated, or (2) the management agreement or
employment agreement between the participant and the company is terminated by the company other than for cause, or (3) the participant is offered a position which is a material demotion to the current position, all performance shares will vest
immediately and any lock up provisions will expire.
2017 Performance Share Awards
With regard to the performance period of 2017, the Board of Directors approved the conditional award of 108,213 performance shares in April 2017 for certain members of
key management, under the terms and conditions of the Company’s 2013 Amended International Equity Based Incentive Plan, and for the Executive Director under the Company’s 2017 Executive Director Long-Term Incentive Plan, on the basis of
the predetermined on-target equity value for 2017 and the Company’s average closing share price during the month of January 2017.
With regard to the Executive Director, in accordance with the rules of the 2017 Plan, 100% of the conditional performance share award of 46,808 performance shares is
subject to the Company’s three-year TSR performance relative to the three-year TSR performance of the constituents of the S&P SmallCap 600 over the period January 1, 2017 through December 31, 2019. The Company’s actual
three-year TSR performance relative to the three-year TSR performance of the constituents of the S&P SmallCap 600 over the period January 1, 2017 through December 31, 2019 will be reviewed in early 2020. The final award will be subject
to Board and then Shareholder approval at the 2020 Annual General Meeting. Should it be approved, 50% of the performance shares will vest upon approval at the Annual General Meeting and 50% will vest on January 1, 2021.
With regard to the 61,405 performance shares conditionally awarded to key members of management, 46,577 shares were subject to initial adjustment, based on company and
individual performance over the performance year 2017, as 14,828 of the 61,405 performance shares were forfeited on January 31, 2018.
Based on the actual level
of Company and individual performance from January 1, 2017 through December 31, 2017 an initial award of 48,720 performance shares was earned and approved by the Compensation Committee in April 2018. The first 50% of the initial award
(24,362 performance shares) was awarded after the 2018 Annual General Meeting. Of the 24,362 performance shares 12,181 shares vested on award but were locked up until December 31, 2018 and 12,181 performance shares vested on January 1,
2019.
The remaining 50% of the initial award (24,358 performance shares) was subject to the Company’s two-year TSR
performance relative to the two-year performance of S&P SmallCap 600 Index over the period January 1, 2017 through December 31, 2018. The Company’s actual
two-year TSR performance relative to the two-year performance of the S&P SmallCap 600 Index over the period January 1, 2017 through December 31, 2018 was
reviewed in January 2019. A final award of 36,538 performance shares was approved by the Compensation Committee in March 2019. Of the final performance share award of 36,538 shares, 50% (18,270 shares) will vest on January 1, 2020. Due to
resignation of one of the members of key management subsequent to reporting date, the number of shares that will vest on January 1, 2021, amounts to 15,028.
Upon a change of control and (1) in the event the performance share plan or the individual award agreement is terminated, or (2) the management agreement or
employment agreement between the participant and the company is terminated by the company other than for cause, or (3) the participant is offered a position which is a material demotion to the current position, all performance shares will vest
immediately and any lock up provisions will expire.
www.interxion.com / 85
|
|
|
|
|
| CONSOLIDATED FINANCIAL STATEMENTS |
|
|
2018 Performance Share Awards
With regard to the performance period of 2018, on the basis of the predetermined on-target equity value for 2018 and the
Company’s average closing share price during the month of January 2018, the Board of Directors approved the conditional award of 39,311 performance shares in March 2018 for certain members of key management under the terms and conditions of the
Company’s 2013 Amended International Equity Based Incentive Plan, and a conditional award of 45,116 performance shares in June 2018 for the Executive Director under the Company’s 2017 Executive Director Long-Term Incentive Plan.
With regard to the Executive Director, in accordance with the rules of the 2017 Plan, 100% of the conditional performance share award of 45,116 performance shares is
subject to the Company’s three-year TSR performance relative to the three-year TSR performance of the constituents of the S&P SmallCap 600 over the period January 1, 2018 through December 31, 2020. The Company’s actual
three-year TSR performance relative to the three-year TSR performance of the constituents of the S&P SmallCap 600 over the period January 1, 2018 through December 31, 2020 will be reviewed in early 2021. The final award will be subject
to Board and then Shareholder approval at the 2021 Annual General Meeting. Should it be approved, 50% of the performance shares will vest upon approval at the Annual General Meeting and 50% will vest on January 1, 2022.
The 39,311 performance shares conditionally awarded to key members of management are subject to initial adjustment based on company and individual performance over the
performance year 2018.
Based on the actual level of Company and individual performance from January 1, 2018 through December 31, 2018 an initial award of
42,955 performance shares has been earned and was approved by the Compensation Committee in March 2019. The first 50% of the initial award (21,480 performance shares) will be awarded after the 2019 Annual General Meeting. Of the 21,480 performance
shares 10,740 shares will vest on award but will be locked up until December 31, 2019 and 10,740 performance shares will vest on January 1, 2020.
Due to
resignation of one of the members of key management subsequent to reporting date, the number of performance shares from the initial award that will vest after January 1, 2020, was reduced to 18,145. These shares are subject to the
Company’s two-year TSR performance relative to the two-year performance of S&P SmallCap 600 Index over the period January 1, 2018 through December 31,
2019. The Company’s actual two-year TSR performance relative to the two-year performance of the S&P SmallCap 600 Index over the period January 1, 2018
through December 31, 2019 will be reviewed in early 2020. Subject to the Compensation Committee’s approval of the final performance share award, 50% of the final performance share award will vest on January 1, 2021, and 50% will vest
on January 1, 2022.
Upon a change of control and (1) in the event the performance share plan or the individual award agreement is terminated, or
(2) the management agreement or employment agreement between the participant and the company is terminated by the company other than for cause, or (3) the participant is offered a position which is a material demotion to the current
position, all performance shares will vest immediately and any lock up provisions will expire.
Summary of outstanding performance shares at December 31,
2018
The number and weighted average fair value of performance shares that were finally awarded as at December 31, 2018, 2017 and 2016 is broken down as
follows:
|
|
|
|
|
|
|
|
|
|
|
|
|
|
|
|
|
|
|
|
|
|
|
|
|
| |
|
2018 |
|
|
2017 |
|
|
2016 |
|
|
|
|
|
|
|
|
| |
|
Shares |
|
|
Weighted
Average Grant
date value
(USD) |
|
|
Shares |
|
|
Weighted
Average Grant
date value
(USD) |
|
|
Shares |
|
|
Weighted
Average Grant
date value
(USD) |
|
| Outstanding at 1 January |
|
|
204 |
|
|
|
33.45 |
|
|
|
253 |
|
|
|
30.68 |
|
|
|
129 |
|
|
|
26.07 |
|
| Granted |
|
|
115 |
|
|
|
59.64 |
|
|
|
62 |
|
|
|
43.83 |
|
|
|
196 |
|
|
|
33.67 |
|
| Vested |
|
|
(130) |
|
|
|
40.79 |
|
|
|
(108) |
|
|
|
33.18 |
|
|
|
(72) |
|
|
|
30.585 |
|
| Forfeited |
|
|
(32) |
|
|
|
38.26 |
|
|
|
(3) |
|
|
|
23.95 |
|
|
|
— |
|
|
|
— |
|
| Outstanding at December 31, |
|
|
157 |
|
|
|
45.58 |
|
|
|
204 |
|
|
|
33.45 |
|
|
|
253 |
|
|
|
30.68 |
|
The performance share plan was modified during 2017, see the disclosure on Executive Director Compensation, which is included in Note 26
— Related-party transactions, for details about the modification.
86 / www.interxion.com
|
|
|
|
|
|
|
CONSOLIDATED FINANCIAL STATEMENTS |
Restricted Share Awards
In
2015, 75,000 restricted shares were awarded to a key member of management (not the Executive Director) of which 25,000 shares vested in the first quarter of 2015. Half of the remaining 50,000 restricted shares vested on March 1, 2016 and the
other 25,000 shares vested on March 1, 2017. On a change of control, these restricted shares would have vested immediately.
In 2016, 20,000 restricted shares
were awarded to key members of management (not the Executive Director) of which 5,000 shares vested in January 2017, 5,000 shares vested in June 2018 and 5,000 shares vested in January 2019. The remaining 5,000 restricted shares will vest on
January 1, 2020. On a change of control, these restricted shares will vest and become exercisable immediately.
In 2017, 10,000 restricted shares were awarded
to a key member of management (not the Executive Director) of which 5,000 shares vested in January 2018 and 5,000 shares vested in January 2019. On a change of control, these restricted shares would have vested and would have become exercisable
immediately.
In 2018, 30,000 restricted shares were awarded to a key member of management (not the Executive Director) of which 10,000 shares vested in February
2019. Of the remaining 20,000 restricted shares, 10,000 will vest on November 1, 2019, and 10,000 will vest on November 1, 2020. On a change of control, these restricted shares will vest and become exercisable immediately.
Summary of outstanding restricted shares at December 31, 2018
The number
and weighted average fair value of restricted shares that were awarded as at December 31, 2018, 2017 and 2016 is broken down as follows:
|
|
|
|
|
|
|
|
|
|
|
|
|
|
|
|
|
|
|
|
|
|
|
|
|
| |
|
2018 |
|
|
2017 |
|
|
2016 |
|
|
|
|
|
|
|
|
| |
|
Shares |
|
|
Weighted
Average Grant
date value
(USD) |
|
|
Shares |
|
|
Weighted
Average Grant
date value
(USD) |
|
|
Shares |
|
|
Weighted
Average Grant
date value
(USD) |
|
| Outstanding at 1 January |
|
|
170 |
|
|
|
41.39 |
|
|
|
253 |
|
|
|
29.51 |
|
|
|
308 |
|
|
|
25.76 |
|
| Granted |
|
|
180 |
|
|
|
58.31 |
|
|
|
104 |
|
|
|
47.14 |
|
|
|
92 |
|
|
|
35.49 |
|
| Vested |
|
|
(63) |
|
|
|
39.16 |
|
|
|
(147) |
|
|
|
27.84 |
|
|
|
(124) |
|
|
|
25.66 |
|
| Forfeited |
|
|
(8) |
|
|
|
36.77 |
|
|
|
(40) |
|
|
|
30.98 |
|
|
|
(23) |
|
|
|
23.67 |
|
|
Outstanding at December 31, |
|
|
279 |
|
|
|
52.96 |
|
|
|
170 |
|
|
|
41.39 |
|
|
|
253 |
|
|
|
29.51 |
|
Restricted share awards granted under the Amended 2013 Plan, generally vest over four years with 25% of the award vesting each year.
Restricted share awards are settled with common Interxion stock. If the employee is terminated prior to the contractual term of the award, all unvested restricted shares are forfeited. Restricted shares awarded to our
Non-executive Directors for their services, vest annually at the Annual General Meeting.
The restricted shares outstanding
at December 31, 2018 have a weighted average remaining contractual life of 2.4 years (2017: 2.5 years; 2016: 1.9 years).
Employee expenses
In 2018, the Company recorded employee expenses of €12.7 million related to share-based payments (2017: €9.9 million and 2016: €7.9 million). The 2018 share-based payments related expenses include an amount of €0.3 million related to taxes and social security charges (2017: €1.0 million and 2016:
€0.2 million). The weighted average fair value at grant date of options granted during the period was determined using the Black-Scholes valuation model. The following inputs were used:
|
|
|
|
|
|
|
|
|
|
|
|
|
| |
|
2018 |
|
|
2017 |
|
|
2016 |
|
| Share price in
€ at grant date (post reverse-stock split) |
|
|
52.58-53.28 |
|
|
|
37.48-48.38 |
|
|
|
28.09-33.89 |
|
| Exercise price in
€ (post-reverse stock split) |
|
|
45.42 |
|
|
|
31.68-39.08 |
|
|
|
24.27-30.47 |
|
| Dividend yield |
|
|
0% |
|
|
|
0% |
|
|
|
0% |
|
| Expected volatility |
|
|
22% |
|
|
|
26% |
|
|
|
30% |
|
| Risk-free interest rate |
|
|
2.5% |
|
|
|
1.8%-2.1% |
|
|
|
1.2% |
|
| Expected life weighted average |
|
|
3.0 years |
|
|
|
5.1 years |
|
|
|
5.0 years |
|
www.interxion.com / 87
|
|
|
|
|
| CONSOLIDATED FINANCIAL STATEMENTS |
|
|
The significant inputs into the model were:
| ∎ |
|
expected volatility, based on a combination of the share performance of the Company over a
5-year period; |
| ∎ |
|
the risk-free interest rate, based on the yield on U.S. Treasury Strips with a maturity similar to the
expected life of the options; |
| ∎ |
|
dividend yield, considered to be nil; |
| ∎ |
|
expected life, considered to be equal to the average of the share option exercise and vesting periods.
|
The weighted average fair value at grant date of the performance shares granted during the period was determined using the Monte Carlo
valuation model. In addition to the above-mentioned inputs a one year holding discount of 5.5% was used as input for the performance shares.
Change of control
clauses
Some awards to key management contain change of control clauses. Upon a change of control and (i) in the event the performance share plan or the
individual award agreement is terminated, or (ii) the management agreement or employment agreement between the participant and the company is terminated by the company other than for cause, or (iii) the participant is offered a position
which is a material demotion to the current position, all performance shares will vest immediately and any lock up provisions will expire.
22. Financial commitments
Non-cancellable operating lease commitments
At December 31, the Group has future minimum commitments for non-cancellable operating leases with terms in excess of one
year as follows:
|
|
|
|
|
|
|
|
|
|
|
|
|
| |
|
2018 |
|
|
2017 |
|
|
2016 |
|
| |
|
|
|
|
(€’000) |
|
|
|
|
| Within 1 year |
|
|
35,739 |
|
|
|
35,107 |
|
|
|
28,698 |
|
| Between 1 and 5 years |
|
|
147,251 |
|
|
|
136,143 |
|
|
|
118,115 |
|
| After 5 years |
|
|
254,826 |
|
|
|
189,298 |
|
|
|
171,313 |
|
| |
|
|
437,816 |
|
|
|
360,548 |
|
|
|
318,126 |
|
The total gross operating lease expense for the year 2018 was €31.7 million
(2017: €29.6 million; 2016: € 27.5 million).
Future committed revenues receivable
The Group enters into initial contracts
with its customers for periods of at least one year and generally between three and five years, resulting in future committed revenues from customers. At December 31 the Group had contracts with customers for future committed revenue receivable as
follows:
|
|
|
|
|
|
|
|
|
|
|
|
|
| |
|
2018 |
|
|
2017 |
|
|
2016 |
|
| |
|
|
|
|
(€’000) |
|
|
|
|
| Within 1 year |
|
|
380,300 |
|
|
|
327,500 |
|
|
|
296,600 |
|
| Between 1 and 5 years |
|
|
543,800 |
|
|
|
449,500 |
|
|
|
434,900 |
|
| After 5 years |
|
|
376,500 |
|
|
|
35,600 |
|
|
|
52,700 |
|
| |
|
|
1,300,600 |
|
|
|
812,600 |
|
|
|
784,200 |
|
88 / www.interxion.com
|
|
|
|
|
|
|
CONSOLIDATED FINANCIAL STATEMENTS |
Commitments to purchase energy
Where possible, for its own use, the Group seeks to purchase power on fixed-price term agreements with local power supply
companies in the cities in which it operates. In some cases, the Group also commits to purchase certain minimum volumes of energy at fixed prices. At December 31, the Group had entered into
non-cancellable energy purchase commitments as follows:
|
|
|
|
|
|
|
|
|
|
|
|
|
| |
|
2018 |
|
|
2017 |
|
|
2016 |
|
| |
|
|
|
|
(€’000) |
|
|
|
|
| Within 1 year |
|
|
24,032 |
|
|
|
16,480 |
|
|
|
16,330 |
|
| Between 1 and 5 years |
|
|
— |
|
|
|
12,378 |
|
|
|
10,460 |
|
| |
|
|
24,032 |
|
|
|
28,858 |
|
|
|
26,790 |
|
As from 2018, commitments to purchase energy exclude the energy-related taxes which first become due upon usage of the committed energy.
Comparative figures for 2017 and 2016 have been adjusted accordingly
Other commitments
The Group has entered into several other commitments, which in general relate to operating expenses. As at December 31, 2018, the outstanding commitments amount to €36.3 million (2017: €43.7 million, 2016: €40.6 million).
23. Capital commitments
At December 31,
2018, the Group had outstanding capital commitments totaling €357.5 million (2017: €285.9 million and 2016: €114.1 million). These commitments are expected to be settled in the following financial year. The increase results from the timing of expansion projects.
24. Contingencies
Guarantees
Certain of our subsidiaries have granted guarantees to our lending banks in relation to our borrowings. The Company has granted rent guarantees to landlords of certain of
the Group’s property leases. Financial guarantees granted by the Group’s banks in respect of leases amount to €3.8 million (2017:
€5.1 million; 2016: €4.6 million), and one guarantee in respect of a real estate purchase amounts to €12.6 million (2017 and 2016: €nil). No other guarantees were granted (2017: €nil and
2016: €1.0 million).
Site restoration costs
As at December 31, 2018, the estimated discounted cost and recognized provision relating to the restoration of data center leasehold premises was €0.3 million (2017: €0.3 million and 2016: €nil).
In accordance with the Group’s accounting policy site restoration costs have been provided in the financial statements only in respect of premises where the
liability is considered probable and the related costs can be estimated reliably. As of December 31, 2018, the Group estimated the possible liability to range from nil to €31.9 million
(2017: nil to €29.2 million and 2016: nil to €24.7 million).
www.interxion.com / 89
|
|
|
|
|
| CONSOLIDATED FINANCIAL STATEMENTS |
|
|
25. Business combinations
Acquisition Interxion Science Park
On February 24, 2017, the Group
completed the acquisition of 100% of the share capital of Vancis B.V. (“Vancis”), a company that historically provided colocation services from a data center at Science Park, Amsterdam, The Netherlands, and a satellite facility in Almere,
The Netherlands. After the acquisition, Vancis B.V. was renamed InterXion Science Park B.V. (“Interxion Science Park”). Total consideration was €77.5 million of cash, which was
paid immediately upon completion. The transaction was accounted for as a business combination, which requires that assets acquired and liabilities assumed be recognized at their respective fair values at the acquisition date.
The table below summarizes the purchase price allocation for the acquisition of Interxion Science Park:
|
|
|
|
|
| |
|
(€’000) |
|
| Property, plant and equipment |
|
|
16,821 |
|
| Trade receivables(1)
|
|
|
1,165 |
|
| Other current assets |
|
|
959 |
|
| Trade payables and other liabilities |
|
|
(1,249) |
|
| Provisions |
|
|
(280) |
|
| Goodwill |
|
|
38,900 |
|
| Customer portfolio |
|
|
28,005 |
|
| Deferred taxes |
|
|
(6,804) |
|
| Total purchase price |
|
|
77,517 |
|
(1) Trade and other receivables represent contractual gross amounts less
€30 thousand, which was determined to be uncollectble at the date of acquisition.
Goodwill is the excess
consideration remaining after allocating the fair value of the other acquired assets and liabilities and represents expected future economic benefits, to be achieved by operating a data center in close proximity to the virtual connectivity hub at
Science Park and is not expected to be deductible for tax purposes.
In connection with this acquisition, the Company recorded M&A transaction costs of
approximately €1.2 million, which have been included in General and administrative costs as incurred (€0.5 million in 2017 and €0.7 million in 2016).
In 2017, Interxion Science Park contributed
€6.5 million to total revenues and €0.1 million loss to the Group’s net income. If the acquisition had occurred on
January 1, 2017, management estimates that consolidated revenue in 2017 would have been €490.6 million, and net income in 2017 would have been
€42.3 million. Interxion Science Park is included in the Big4 segment.
26. Related-party transactions
There are no
material transactions with related parties, other than those related to our investment disclosed in note 13 and the information disclosed below.
Key management
compensation
The total compensation of key management was as follows:
|
|
|
|
|
|
|
|
|
|
|
|
|
| |
|
2018 |
|
|
2017 |
|
|
2016 |
|
| |
|
|
|
|
(€’000) |
|
|
|
|
| Short-term employee benefits (salaries and bonuses) |
|
|
3,525 |
|
|
|
3,454 |
|
|
|
3,473 |
|
| Post-employment benefits |
|
|
65 |
|
|
|
62 |
|
|
|
74 |
|
| Share-based payments |
|
|
6,866 |
|
|
|
6,386 |
|
|
|
4,700 |
|
| |
|
|
10,456 |
|
|
|
9,902 |
|
|
|
8,247 |
|
Key management’s share-based payment compensation is disclosed in Note 21.
90 / www.interxion.com
|
|
|
|
|
|
|
CONSOLIDATED FINANCIAL STATEMENTS |
Remuneration of the Executive Director and Non-executive Directors of the
Board
The aggregate reported compensation expense of our Executive Director and the Non-Executive Directors of the Board
for the years ended December 31, 2018, 2017 and 2016, is set forth below. The “Share-based payment charges” and the “Total” numbers included in the following tables are calculated in accordance with IFRS and reflect the
current year charges for shares that started their vesting period in prior years and those that started to vest in 2018.
|
|
|
|
|
|
|
|
|
|
|
|
|
|
|
|
|
|
|
|
|
| |
|
|
|
|
|
2018
|
|
|
| |
|
Salaries |
|
Bonus |
|
Share-based payment charges
(€’000)
|
|
Total |
| D.C. Ruberg |
|
|
|
590(1) |
|
|
|
|
735(2) |
|
|
|
|
4,198 |
|
|
|
|
5,626 |
|
| F. Esser |
|
|
|
65 |
|
|
|
|
— |
|
|
|
|
40 |
|
|
|
|
105 |
|
| M. Heraghty |
|
|
|
70 |
|
|
|
|
— |
|
|
|
|
40 |
|
|
|
|
110 |
|
| D. Lister |
|
|
|
23 |
|
|
|
|
— |
|
|
|
|
20 |
|
|
|
|
43(3) |
|
| J.F.H.P. Mandeville |
|
|
|
90 |
|
|
|
|
— |
|
|
|
|
40 |
|
|
|
|
130 |
|
| R. Ruijter |
|
|
|
75 |
|
|
|
|
— |
|
|
|
|
40 |
|
|
|
|
115 |
|
| |
|
|
|
913 |
|
|
|
|
735 |
|
|
|
|
4,481 |
|
|
|
|
6,129 |
|
|
|
|
|
|
| |
|
|
|
|
|
2017
|
|
|
| |
|
Salaries |
|
Bonus |
|
Share-based payment charges
(€’000)
|
|
Total |
| D.C. Ruberg |
|
|
|
590(1) |
|
|
|
|
668(2) |
|
|
|
|
4,198 |
|
|
|
|
5,456 |
|
| F. Esser |
|
|
|
65 |
|
|
|
|
— |
|
|
|
|
40 |
|
|
|
|
105 |
|
| M. Heraghty |
|
|
|
70 |
|
|
|
|
— |
|
|
|
|
40 |
|
|
|
|
110 |
|
| J.F.H.P. Mandeville |
|
|
|
90 |
|
|
|
|
— |
|
|
|
|
40 |
|
|
|
|
130 |
|
| R. Ruijter |
|
|
|
75 |
|
|
|
|
— |
|
|
|
|
40 |
|
|
|
|
115 |
|
| |
|
|
|
890 |
|
|
|
|
668 |
|
|
|
|
4,358 |
|
|
|
|
5,916 |
|
|
|
|
|
|
| |
|
|
|
|
|
2016
|
|
|
| |
|
Salaries |
|
Bonus |
|
Share-based payment charges(i)
(€’000)
|
|
Total |
| D.C. Ruberg |
|
|
|
590(1) |
|
|
|
|
597 |
|
|
|
|
2,044 |
|
|
|
|
3,231 |
|
| F. Esser |
|
|
|
65 |
|
|
|
|
— |
|
|
|
|
40 |
|
|
|
|
105 |
|
| M. Heraghty |
|
|
|
70 |
|
|
|
|
— |
|
|
|
|
40 |
|
|
|
|
110 |
|
| J.F.H.P. Mandeville |
|
|
|
115(3) |
|
|
|
|
— |
|
|
|
|
40 |
|
|
|
|
155 |
|
| R. Ruijter |
|
|
|
75 |
|
|
|
|
— |
|
|
|
|
40 |
|
|
|
|
115 |
|
| |
|
|
|
915 |
|
|
|
|
597 |
|
|
|
|
2,204 |
|
|
|
|
3,716 |
|
(1) Includes allowances of €40,000.
(2) Based on performance achievements during 2018, this amount is calculated as 133.6% of base salary.
(3) David Lister was appointed to our Board of Directors in June 2018. His compensation is calculated on a pro rata basis
(4) Includes €25,000 that has additionally been awarded in relation to the period of July 1, 2015 –
December 31, 2015.
In 2018, 3,730 restricted shares were granted to the Non-executive Directors (746 restricted shares
each). Costs related to these grants are reflected as part of share-based payment charges.
The goal of the Company’s remuneration policy is to provide
remuneration to its Directors in a form that will attract, retain and motivate qualified industry professionals in an international labor market, and to align the remuneration of the Directors with their short- and long-term performance as well as
with interests of the stakeholders of the Company. The compensation of our Directors will be reviewed regularly.
www.interxion.com / 91
|
|
|
|
|
| CONSOLIDATED FINANCIAL STATEMENTS |
|
|
Executive Director Compensation
The total direct compensation program for our Executive Director consists of (i) a base salary, (ii) short-term incentives (“STI”) in the form of an
annual cash bonus, (iii) long term incentives (“LTI”) in the form of performance shares, and (iv) perquisites consisting of a car allowance. Our goal is to provide the Executive Director with a base salary around the 50th
percentile and STI and LTI in the range of the 50th to 75th percentile of our peer group discussed below.
Overall, for 2016 and 2017, at risk compensation was 79%
of total direct compensation at target pay-out of both STI and LTI and 86% of total direct compensation at maximum pay-out of both STI and LTI. For 2018, at risk
compensation was 83% of total direct compensation at target pay-out of both STI and LTI and 89% of total direct compensation at maximum pay-out of both STI and LTI. The
actual value of the annual LTI award to the Executive Director is dependent on (1) the number of shares actually earned based on the Company’s relative Total Shareholder Return (“TSR”) performance against the constituents of the
S&P SmallCap 600 and (2) the Company’s share price on the vesting date. The charts included below have been based on (i) the number of shares awarded at target and at maximum pay-out and
(ii) have been valued based on the Company’s January average closing share price in the award years 2016, 2017 and 2018, respectively. In each of these award years the Conditional Award date was February 1. These charts do not take into
account any appreciation or depreciation of the Company share price that may occur over the performance period.
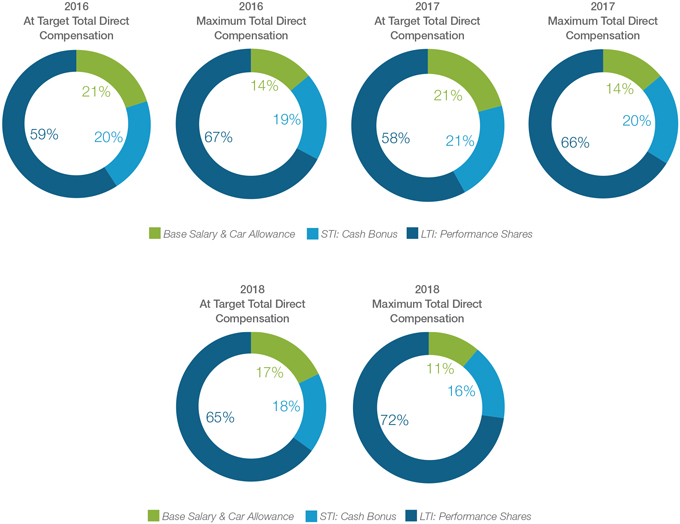
The Company operates in a highly competitive and fast-growing environment where most of our peers are U.S. headquartered companies. We
therefore fashion our compensation structures and pay mix to blend both European and U.S. practices. We assess the compensation of the Executive Director against the compensation of executive directors at peer companies based on data provided by
Mercer. Our peer group consists of the companies listed below, most of which have European operations and with whom we compete for talent and/or customers and capital. The benchmarking analysis takes into consideration the relative Company size, the
Company’s European aspects, and the growth trajectory of our Company. We benchmark our compensation levels every three years, under the guidance of the Compensation Committee, with the most recent analysis performed by Mercer in March 2017.
92 / www.interxion.com
|
|
|
|
|
|
|
CONSOLIDATED FINANCIAL STATEMENTS |
Our peer group consists of the following companies:
|
|
|
|
|
| |
|
|
| Akamai
Technologies |
|
Digital Realty Trust(1) |
|
Internap Network Services
|
| |
|
|
|
Autodesk |
|
Equinix
|
|
Red Hat
|
| |
|
|
| Coresite
Realty |
|
F5 Networks
|
|
Synopsys
|
| |
|
|
|
CyrusOne |
|
Factset Research
Systems |
|
Trimble Navigation
|
Short-term incentive
The STI plan for our
Executive Director provides for an annual cash bonus. The annual at target value of the cash bonus is 110% of base salary (the “Target Cash Bonus”) for 2017 and 2018 (compared to 100% of base salary for 2016), with a maximum pay-out opportunity of 145% of the Target Cash Bonus. The actual pay-out from the STI plan depends on the achievement of Revenue, Adjusted EBITDA Margin, and individual
objectives, all measured over the performance year. These performance objectives are set each year by the Compensation Committee at the beginning of the performance period and are based on the Company’s operating plan. Individual objectives are
focused on internal organizational improvements.
The performance achievement on each of these measures, together with their weighting, determine the pay-out of the cash bonus in accordance with the table below, with pay-outs for performance between the levels shown determined based on linear interpolation.
|
|
|
|
|
|
|
|
|
|
|
|
|
| |
|
Pay-out at Threshold
Performance |
|
|
Pay-out at Target
Performance |
|
|
Pay-out at Maximum
Performance |
|
| |
|
|
|
|
|
|
|
|
|
| Revenue |
|
|
0% |
|
|
|
40% |
|
|
|
60% |
|
| Adjusted EBITDA Margin |
|
|
0% |
|
|
|
40% |
|
|
|
60% |
|
| Individual Performance Objectives |
|
|
0% |
|
|
|
20% |
|
|
|
25% |
|
| Pay-out as % of at
target cash bonus |
|
|
0% |
|
|
|
100% |
|
|
|
145% |
|
The cash bonus is paid once Shareholders approve the annual accounts for the performance year at the Annual General Meeting in the
following year.
Long-term incentive
On May 13, 2017 the Board
adopted the InterXion Holding N.V. 2017 Executive Director Long-Term Incentive Plan (the “2017 Plan”), which was subsequently approved by the Annual General Meeting. The 2017 Plan provides for a number of changes in our Executive
Director’s long-term incentive plan to further align his long-term incentive compensation (as formerly awarded under the terms and conditions of the InterXion Holding N.V. 2013 Amended International Equity Based Incentive Plan, the “2013
Plan”) with best practices1.
Pursuant to the 2017 Plan, performance shares are conditionally awarded on an
annual basis at the beginning of each performance year. The number of performance shares conditionally awarded per annum (the “Conditional Award”) is determined by the target value for the year, and the average Company closing share price
and USD/EUR exchange rate during the month of January in the first performance year.
The annual at target value of the conditional award to our Executive Director
in 2016 and 2017 was 300% of base salary. In June 2018 the Board approved an increase of the Target LTI Award from 300% to 400% of annual salary to better align his target total compensation package and its individual compensation elements with the
industry (peer group) benchmark and Interxion’s executive compensation philosophy.
1. The
terms and conditions of the 2017 Plan not only apply to the 2017 and 2018 conditional performance share award and future awards to our Executive Director, but also retroactively to shares from the conditional performance share awards made to the
Executive Director in 2015 and 2016, that were unvested at the time of the adoption of the 2017 Plan
www.interxion.com / 93
|
|
|
|
|
| CONSOLIDATED FINANCIAL STATEMENTS |
|
|
The Conditional Award of performance shares to the Executive Director is granted at target and subject to the
Company’s TSR performance relative to the TSR performance of the constituents of the S&P Small Cap 600 over a three-year period. The three-year performance period runs from January 1 in the first performance year through
December 31 in the third performance year. The basis for the performance achievement calculation is the average closing share price in the month of January in the first performance year, and the average closing share price in the month of
December in the third performance year. Performance is measured on a percentile ranking basis, with Final Award pay-outs in accordance with the performance/pay-out table
below:
|
|
|
TSR Performance Categories
(S&P SmallCap 600 Constituents) |
|
Final Award pay-out
(% of number of performance shares conditionally awarded) |
| |
|
|
| 75th Percentile or greater |
|
175% |
| 50th Percentile |
|
100% |
| 25th Percentile |
|
25% |
| Less than 25th Percentile |
|
0% |
For performance between percentile levels shown, pay-outs are linearly interpolated.
This pay-out scale was developed to achieve an approach that is consistent with common practices at US companies and those
companies in our peer group.
Subject to the relative TSR performance threshold being met, the performance shares will vest in two equal instalments. The first
instalment (50% of the Final Award) will vest upon approval at the Company’s Annual General Meeting in the year following the end of the three-year performance period. The second instalment (50% of the Final Award) will vest on the fourth
anniversary of the Conditional Award.
The 2017 Plan has no additional holding requirements. The Compensation Committee carefully considered whether implementation
of a holding period or stock ownership requirement was appropriate at the time of the adoption of the plan. Considering that our Executive Director has a substantial personal shareholding in the Company’s shares, the Committee decided that such
provisions are not currently necessary. The Board and the Compensation Committee are constantly striving to ensure strong alignment of our Executive Director’s interests with long-term shareholder value throughout his employment with the
Company and will keep this matter under regular review. Upon a change of control AND (i) in the event the performance share plan or the individual award agreement is terminated, or (ii) the management agreement between the Executive
Director and the Company is terminated by the Company other than for cause, or (iii) the Executive Director is offered a position which is a material demotion to the current position, all performance shares will vest and become exercisable
immediately.
Upon retirement, permanent disability or death of the Executive Director, all outstanding and unvested portions of awards will be pro-rated for the period served during the performance period. The pro-rated number of shares will then be adjusted for relative TSR performance over the three-year
performance period, and vest in accordance with the vesting schedule of the plan.
In the event the management agreement between the Executive Director and the
Company is terminated for cause, all vested and unvested parts of awards made pursuant to the 2017 Plan will be forfeited immediately.
Potential compensation pay-outs
The tables below summarize our Executive Director’s potential compensation amounts in 2016, 2017 and 2018,
including both at target and at maximum payout of STI and LTI (amounts in €’000).
|
|
|
|
|
|
|
| |
|
2016 - Annual at
target amounts |
|
2017 - Annual at
target amounts |
|
2018 - Annual at
target amounts |
| Base Salary |
|
550 |
|
550 |
|
550 |
| Car Allowance |
|
40 |
|
40 |
|
40 |
| STI: Cash Bonus |
|
550 (100% of base salary) |
|
605 (110% of base salary) |
|
605 (110% of base salary) |
| LTI: Performance Shares |
|
1,650 (300% of base salary)* |
|
1,650 (300% of base salary) |
|
2,200 (400% of base salary) |
| Total direct compensation |
|
2,790 |
|
2,845 |
|
3,395 |
94 / www.interxion.com
|
|
|
|
|
|
|
CONSOLIDATED FINANCIAL STATEMENTS |
|
|
|
|
|
|
|
|
|
|
|
|
|
|
|
|
|
|
|
|
|
|
|
|
|
| |
|
2016 - Annual
maximum amounts |
|
|
2017 - Annual
maximum amounts |
|
|
2018 - Annual
maximum amounts |
|
| Base Salary |
|
|
550 |
|
|
|
|
|
|
|
550 |
|
|
|
|
|
|
|
550 |
|
|
|
|
|
| Car Allowance |
|
|
40 |
|
|
|
|
|
|
|
40 |
|
|
|
|
|
|
|
40 |
|
|
|
|
|
| STI: Cash Bonus |
|
|
798 |
|
|
|
(145% of target
cash bonus) |
|
|
|
577 |
|
|
|
(145% of target
cash bonus) |
|
|
|
877 |
|
|
|
(145% of target
cash bonus) |
|
| LTI: Performance Shares |
|
|
2,887 |
|
|
|
(175% of at target
award in #shares) |
|
|
|
2,887 |
|
|
|
(175% of at target
award in #shares) |
|
|
|
3,850 |
|
|
|
(175% of at target
award in #shares) |
|
| Total direct compensation |
|
|
4,275 |
|
|
|
|
|
|
|
4,354 |
|
|
|
|
|
|
|
5,317 |
|
|
|
|
|
* The 2016, 2017 and 2018 Conditional Awards of performance shares were calculated at 61,469, 46,808 and 45,116 performance shares,
respectively, based on the annual at target LTI value of 300% of the Executive Director’s base salary for 2016 and 2017, the annual at target LTI value of 400% of the Executive Director’s base salary for 2018, and the January averages of
the Company’s closing share price and the USD/EURO exchange rate in the award years 2016, 2017 and 2018. The LTI values are the values at target and at maximum pay-out and do not take into account any
appreciation or depreciation of the Company’s share price that may occur over the performance period.
STI: Actual short-term incentive pay-outs: 2016 achievement against target
In 2016, the Target Cash Bonus for our Executive Director was €550,000, or 100% of base salary, with a maximum pay-out opportunity of 145% of the Target Cash Bonus. The table below sets out the performance targets set for
2016 and the achievement against them.
|
|
|
|
|
|
|
|
|
|
|
|
|
|
|
|
|
| |
|
Target
Weighting |
|
|
Target
Performance |
|
|
Actual
Performance |
|
|
Pay-out (% of at
target cash bonus) |
|
| Revenue (in million
€) |
|
|
40% |
|
|
|
424.0 |
|
|
|
421.8 |
|
|
|
28.6% |
|
| Adjusted EBITDA Margin |
|
|
40% |
|
|
|
44.9% |
|
|
|
45.3% |
|
|
|
60.0% |
|
| Individual Performance Objectives |
|
|
20% |
|
|
|
|
|
|
|
Met |
|
|
|
20.0% |
|
| Overall Performance Achievement % |
|
|
100% |
|
|
|
|
|
|
|
|
|
|
|
108.6% |
|
Based on actual performance delivered in the performance year 2016, an STI cash bonus pay-out of €597,143 (108.6% of the Target Cash Bonus) was approved by the Board in February 2017. The STI cash bonus was paid upon Shareholder approval of the 2016 annual accounts at the Annual General Meeting in
June 2017. The Revenue and the Adjusted EBITDA Margin targets were set for Revenue and Adjusted EBITDA based on the definition of these financial measures as set out in the Consolidated Financial Statements.
Actual short-term incentive pay-outs: 2017 achievement against target
In 2017, the Target Cash Bonus for our Executive Director was €605,000, or 110% of base salary, with a maximum pay-out opportunity of 145% of the Target Cash Bonus. The table below sets out the performance targets set for 2017 and the achievement against them.
|
|
|
|
|
|
|
|
|
|
|
|
|
|
|
|
|
| |
|
Target
Weighting |
|
|
Target
Performance |
|
|
Actual
Performance |
|
|
Pay-out (% of at
target cash bonus) |
|
| Revenue (in million
€) |
|
|
40% |
|
|
|
473.5 |
|
|
|
493.5 |
|
|
|
60.0% |
|
| Adjusted EBITDA Margin |
|
|
40% |
|
|
|
45.5% |
|
|
|
45.0% |
|
|
|
27.3% |
|
| Individual Performance Objectives |
|
|
20% |
|
|
|
|
|
|
|
115.0% |
|
|
|
23.0% |
|
| Overall Performance Achievement % |
|
|
100% |
|
|
|
|
|
|
|
|
|
|
|
110.3% |
|
For 2017, the performance against the Revenue and Adjusted EBITDA Margin target was calculated based on constant currency. Current and
comparative prior period results for entities reporting in currencies other than Euro are converted into Euro using the YTD average exchange rates from the prior period rather than the actual exchange rates in effect during the current period.
Reported Revenue and Adjusted EBITDA Margin were €489.3 million and 45.2%, respectively.
Based on actual
performance delivered in the performance year 2017, an STI cash bonus pay-out of €667,585 (110.3% of the Target Cash Bonus) was approved by the Board in
April 2018. The cash bonus was paid upon Shareholder approval of the 2017 annual accounts at the Annual General Meeting in June 2018.
www.interxion.com / 95
|
|
|
|
|
| CONSOLIDATED FINANCIAL STATEMENTS |
|
|
Actual short-term incentive pay-outs: 2018 achievement against target
In 2018, the Target Cash Bonus for our Executive Director was €605,000, or 110% of base salary, with a
maximum pay-out opportunity of 145% of the Target Cash Bonus. The table below sets out the performance targets set for 2018 and the achievement against them.
|
|
|
|
|
|
|
|
|
|
|
|
|
|
|
|
|
| |
|
Target
Weighting |
|
|
Target
Performance |
|
|
Actual
Performance |
|
|
Pay-out (% of at
target cash bonus) |
|
| Revenue (in million
€) |
|
|
40% |
|
|
|
561.5 |
|
|
|
564.7 |
|
|
|
54.1% |
|
| Adjusted EBITDA Margin |
|
|
40% |
|
|
|
45.8% |
|
|
|
45.9% |
|
|
|
43.4% |
|
| Individual Performance Objectives |
|
|
20% |
|
|
|
|
|
|
|
120.0% |
|
|
|
24.0% |
|
|
Overall Performance Achievement % |
|
|
100% |
|
|
|
|
|
|
|
|
|
|
|
121.5% |
|
For 2018, the performance against the Revenue and Adjusted EBITDA Margin target was calculated based on constant currency. Current and
comparative prior period results for entities reporting in currencies other than Euro are converted into Euro using the YTD average exchange rates from the prior period rather than the actual exchange rates in effect during the current period.
Reported Revenue and Adjusted EBITDA Margin were €561.8 million and 45.9%, respectively.
Based on actual
performance delivered in the performance year 2018, an STI cash bonus pay-out of €735,015 (121.5% of the Target Cash Bonus) was approved by the Board in
April 2019. The cash bonus will be paid upon Shareholder approval of the 2018 annual accounts at the Annual General Meeting in 2019.
LTI: Performance shares
vested from 2014 and 2015 performance years
On June 6, 2018, a tranche of 35,432 performance shares vested with a value of €1.982 million (vesting share price $65.77). These shares related to the 2014 performance year and were awarded in accordance with the terms and conditions of the previous 2013 Plan. They received
shareholder approval at the 2016 Annual General Meeting.
With regards to the 2015 performance year, the unvested portion of the 2015 Conditional Award (50% of the
Conditional Award, or 34,320 performance shares) was subject to three-year relative TSR performance, in accordance with the terms and conditions of the 2017 Plan.
The following table provides the TSR performance of the constituents of the S&P SmallCap 600 and Interxion’s stock over the period January 1, 2015 through
December 31, 2017. Interxion’s stock increased from $27.95 to $57.41 over the three-year performance period, which equals a three-year cumulative TSR performance of 105%. Based on Interxion stock’s three-year cumulative TSR
performance of 105%, Interxion ranked at the 85th percentile of the S&P SmallCap 600.
|
|
|
| TSR performance categories |
|
2015-2017 actual cumulative TSR performance * |
| S&P SmallCap 600 |
|
|
| 75th
Percentile |
|
74% |
| 50th
Percentile |
|
32% |
| 25th
Percentile |
|
-9% |
| INXN |
|
105% |
* Starting price is the average closing share price in the month of January 2015, ending price is the average closing share price in
the month of December 2017. Includes share price appreciation/depreciation, re-investment of dividends and the compounding effect of dividends paid on re-invested
dividends, all over the relevant performance period.
Based on Interxion’s 85th percentile performance and
in accordance with the plan performance/pay-out table, 175% of the Conditional Award to the Executive Director (60,060 shares) was earned. The Final Award of 60,060 performance shares was approved by the Board
in April 2018 and by the shareholders at the 2018 Annual General Meeting. 50% of the Final Award (30,030 performance shares) vested on August 8, 2018 at the value of €1.664 million
(vesting share price $64.28). The remaining 50% of the Final Award (30,030 performance shares) vested on March 11, 2019 at the value of €1.682 million (vesting share price U.S. $
62.96).
96 / www.interxion.com
|
|
|
|
|
|
|
CONSOLIDATED FINANCIAL STATEMENTS |
2016 – 2018 Long-term incentive awards
The following table provides the number of performance shares Conditionally Awarded in 2016, 2017 and 2018 and the number of shares that would potentially be awarded
(subject to Board and Shareholder approval at the relevant Annual General Meeting) based on the Company’s three-year TSR performance at the 25th, 50th, and 75th percentile performance of the constituents of the S&P SmallCap 600.
|
|
|
|
|
|
|
|
|
|
|
|
|
|
|
|
|
| |
|
# Performance shares to be awarded based on relative
TSR performance |
|
| Conditional award year |
|
# Performance
shares
conditionally
awarded * |
|
|
At 25th
percentile |
|
|
At 50th
percentile |
|
|
At 75th
percentile |
|
| 2016 |
|
|
61,469 |
|
|
|
15,367 |
|
|
|
61,469 |
|
|
|
107,571 |
|
| 2017 |
|
|
46,808 |
|
|
|
11,702 |
|
|
|
46,808 |
|
|
|
81,914 |
|
| 2018 |
|
|
45,116 |
|
|
|
11,279 |
|
|
|
45,116 |
|
|
|
78,953 |
|
* Calculated based on the Company’s January average closing share price of $29.16 (2016), $37.42 (2017) and $59.49 (2018).
With respect to the 61,469 performance shares conditionally awarded in 2016, the following table provides the TSR performance of the constituents of the S&P SmallCap
600 and Interxion’s stock over the period January 1, 2016 through December 31, 2018. Interxion’s stock increased from $29.16 to $57.02 over the three-year performance period, which equals a three-year cumulative TSR performance
of 96%. Based on Interxion stock’s three-year cumulative TSR performance of 96%, Interxion ranked at the 82nd percentile of the S&P SmallCap 600.
|
|
|
|
|
| TSR performance categories |
|
2016-2018 actual cumulative TSR performance * |
|
| S&P SmallCap 600 |
|
|
|
|
| 75th
Percentile |
|
|
75% |
|
| 50th
Percentile |
|
|
35% |
|
| 25th
Percentile |
|
|
-6% |
|
| INXN |
|
|
96% |
|
* Starting price is the average closing share price in the month of January 2016, ending price is the average closing share price in the
month of December 2018. Includes share price appreciation/depreciation, re-investment of dividends and the compounding effect of dividends paid on reinvested dividends, all over the relevant performance
period.
Based on Interxion’s 82nd percentile performance and in accordance with the performance/pay-out table in the 2017 Plan, 175% of the performance shares conditionally awarded in 2016, was earned. The Final Award has been calculated at 107,571 shares and was approved by the Board in April
2019. The Final Award will be subject to shareholder approval at the 2019 Annual General Meeting. Should the Final Award be approved, the shares will vest in two equal instalments. The first instalment of 53,786 shares (50% of the Final Award of
performance shares) will vest upon approval at the 2019 Annual General Meeting, the second instalment of 53,785 shares (50% of the Final Award of performance shares) will vest on January 1, 2020.
With respect to the performance shares conditionally awarded in 2017 and 2018, the Company’s three-year TSR performance over the 2017-2019 and 2018-2020 performance
periods will be reviewed in early 2020 and 2021, respectively. The Final Awards will be subject to Board approval and shareholder approval at the Annual General Meetings in 2020 and 2021. Should the final awards be approved, then each Final Award
will vest in two equal instalments. The first instalment (50% of the Final Award) will vest upon shareholder approval at the relevant Annual General Meeting. The second instalment will vest on January 1 of the following year.
www.interxion.com / 97
|
|
|
|
|
| CONSOLIDATED FINANCIAL STATEMENTS |
|
|
Internal pay ratio
The
Dutch Corporate Governance Code requires Dutch companies to disclose the internal pay ratio between Executive Directors and other employees. Such pay ratios are specific to a company’s industry, geographical footprint and organizational model,
and can be volatile over time due to exchange rate movements and the company’s annual performance and stock performance.
The 2018 the pay ratio between our
Executive Director and other Interxion employees was 49.6:1 (2017: 29.7:1). The pay ratio has been calculated by dividing our Executive Director’s 2018 total remuneration by the 2018 company-wide average total remuneration paid per Interxion
employee. Total remuneration includes salaries, bonuses, equity compensation (defined as the value of equity awards on vesting date) and contributions to defined contribution pension plans, as derived from note 8 in the Consolidated Financial
Statements, included elsewhere in this Annual Report. Furthermore, the total remuneration includes sales commissions, as captured in sales and marketing expenses. The company-wide average total remuneration per Interxion employee has been calculated
based on an average of 719 full time equivalents employed in 2018, being 720 minus the Executive Director (2017: 637 full time equivalents employed, being 638 minus the Executive Director).
27. Events subsequent to the balance sheet date
Increased capacity under Revolving Facility
During the first quarter of 2019,
the Group increased capacity under the Revolving Facility by €100.0 million for total commitment of €300.0 million.
Purchase of share in Icolo Ltd.
During 2019, the Group entered into an
agreement to purchase 40% of the share capital of Icolo Ltd., and certain convertible loans which were previously granted to Icolo Ltd. by the sellers. The transaction price for both the shares and the convertible loans amounts to USD
5.7 million. After completion of this transaction, the Group will apply IAS 28 – Investments in Associates and Joint Ventures and account for the shares as an investment in an associate.
28. Correction of errors
During the
implementation of IFRS 16 – Leases the Company identified that for a limited number of data center leases entered into since 2000, with fixed or minimum annual indexation, the lease costs recognized in prior periods had not been
recognized in accordance with IAS 17 – Leases. IAS 17 requires that total minimum lease costs be recognized on a straight-line basis over the term of the relevant lease. The identified error relates to the timing of the recognition of
certain lease costs in the period since 2000 and does not result in an increase in the total costs recognized over the term of the relevant leases nor does it impact cash flows. While the impact of the error was inconsequential to and has therefore
not been adjusted in the Income Statement for 2017 and 2016, certain comparative balance sheet figures as of December 31, 2017, December 31, 2016 and January 1, 2016 have been corrected for the cumulative impact of this error as
follows:
Consolidated statement of financial position
|
|
|
|
|
|
|
|
|
|
|
|
|
| |
|
Impact of correction of error |
|
| January 1, 2016 |
|
(€’000) |
|
| |
|
As previously
reported |
|
|
Adjustments |
|
|
As corrected |
|
| Total liabilities and shareholders’ equity |
|
|
1,252,064 |
|
|
|
— |
|
|
|
1,252,064 |
|
| Other non-current
liabilities |
|
|
12,049 |
|
|
|
10,182 |
|
|
|
22,231 |
|
| Deferred tax liability |
|
|
9,951 |
|
|
|
(1,832) |
|
|
|
8,119 |
|
| Trade payables and other liabilities |
|
|
162,629 |
|
|
|
33 |
|
|
|
162,662 |
|
| Total liabilities |
|
|
744,647 |
|
|
|
8,383 |
|
|
|
753,030 |
|
| Foreign currency translation reserve |
|
|
20,865 |
|
|
|
(84) |
|
|
|
20,781 |
|
| Accumulated profit/(deficit) |
|
|
(30,043) |
|
|
|
(8,299) |
|
|
|
(38,342) |
|
| Total Shareholder’s equity |
|
|
507,417 |
|
|
|
(8,383) |
|
|
|
499,034 |
|
98 / www.interxion.com
|
|
|
|
|
|
|
CONSOLIDATED FINANCIAL STATEMENTS |
|
|
|
|
|
|
|
|
|
|
|
|
|
| |
|
Impact of correction of error |
|
| December 31, 2016 |
|
(€’000) |
|
| |
|
As previously
reported |
|
|
Adjustments |
|
|
As corrected |
|
| Total liabilities and shareholders’ equity |
|
|
1,482,665 |
|
|
|
— |
|
|
|
1,482,665 |
|
| Other non-current
liabilities |
|
|
11,718 |
|
|
|
8,852 |
|
|
|
20,570 |
|
| Deferred tax liability |
|
|
9,628 |
|
|
|
(1,603) |
|
|
|
8,025 |
|
| Trade payables and other liabilities |
|
|
171,399 |
|
|
|
34 |
|
|
|
171,433 |
|
| Total liabilities |
|
|
933,896 |
|
|
|
7,283 |
|
|
|
941,179 |
|
| Foreign currency translation reserve |
|
|
9,988 |
|
|
|
1,016 |
|
|
|
11,004 |
|
| Accumulated profit/(deficit) |
|
|
8,293 |
|
|
|
(8,299) |
|
|
|
(6) |
|
| Total Shareholder’s equity |
|
|
548,769 |
|
|
|
(7,283) |
|
|
|
541,486 |
|
|
|
| |
|
Impact of correction of error |
|
| December 31, 2017 |
|
(€’000) |
|
| |
|
As previously
reported |
|
|
Adjustments |
|
|
As corrected |
|
| Total liabilities and shareholders’ equity |
|
|
1,702,071 |
|
|
|
— |
|
|
|
1,702,071 |
|
| Other non-current
liabilities |
|
|
15,080 |
|
|
|
8,591 |
|
|
|
23,671 |
|
| Deferred tax liability |
|
|
21,336 |
|
|
|
(1,558) |
|
|
|
19,778 |
|
| Trade payables and other liabilities |
|
|
229,878 |
|
|
|
34 |
|
|
|
229,912 |
|
| Total liabilities |
|
|
1,105,343 |
|
|
|
7,067 |
|
|
|
1,112,410 |
|
| Foreign currency translation reserve |
|
|
2,948 |
|
|
|
1,232 |
|
|
|
4,180 |
|
| Accumulated profit/(deficit) |
|
|
47,360 |
|
|
|
(8,299) |
|
|
|
39,061 |
|
| Total Shareholder’s equity |
|
|
596,728 |
|
|
|
(7,067) |
|
|
|
589,661 |
|
www.interxion.com / 99

|
|
|
|
|
|
|
COMPANY FINANCIAL STATEMENTS |
InterXion Holding
N.V. Company financial statements
Company statement of financial position
(before appropriation of results)
|
|
|
|
|
|
|
|
|
|
|
|
|
|
|
|
|
|
|
|
|
| |
|
|
|
As at December 31, |
|
| |
|
Note |
|
|
|
2018 |
|
|
2017(i)
(€’000) |
|
|
2016(i) |
|
| Non-current
assets |
|
|
|
|
|
|
|
|
|
|
|
|
|
|
|
|
|
|
|
|
| Financial assets |
|
|
36 |
|
|
|
|
|
|
|
1,713,141 |
|
|
|
1,314,793 |
(i) |
|
|
1,148,120 |
(i) |
| Deferred tax assets |
|
|
37 |
|
|
|
|
|
|
|
20,497 |
|
|
|
21,105 |
|
|
|
14,960 |
|
| Other
non-current assets |
|
|
|
|
|
|
|
|
|
|
1,741 |
|
|
|
204 |
|
|
|
141 |
|
| |
|
|
|
|
|
|
|
|
|
|
1,735,379 |
|
|
|
1,336,102 |
|
|
|
1,163,221 |
|
| Current assets |
|
|
|
|
|
|
|
|
|
|
|
|
|
|
|
|
|
|
|
|
| Trade and other current
assets |
|
|
38 |
|
|
|
|
|
|
|
2,627 |
|
|
|
1,621 |
|
|
|
1,225 |
|
| Cash and cash equivalents |
|
|
|
|
|
|
|
|
|
|
90,569 |
|
|
|
2,518 |
|
|
|
27,939 |
|
| |
|
|
|
|
|
|
|
|
|
|
93,196 |
|
|
|
4,139 |
|
|
|
29,164 |
|
| Total assets |
|
|
|
|
|
|
|
|
|
|
1,828,575 |
|
|
|
1,340,241 |
|
|
|
1,192,385 |
|
| Shareholders’ equity |
|
|
|
|
|
|
|
|
|
|
|
|
|
|
|
|
|
|
|
|
| Share capital |
|
|
39 |
|
|
|
|
|
|
|
7,170 |
|
|
|
7,141 |
|
|
|
7,060 |
|
| Share premium |
|
|
39 |
|
|
|
|
|
|
|
553,425 |
|
|
|
539,448 |
|
|
|
523,671 |
|
| Foreign currency translation
reserve |
|
|
39 |
|
|
|
|
|
|
|
3,541 |
|
|
|
4,180 |
(i) |
|
|
11,004 |
(i) |
| Hedging reserve |
|
|
39 |
|
|
|
|
|
|
|
(165 |
) |
|
|
(169 |
) |
|
|
(243) |
|
| Accumulated deficit |
|
|
39 |
|
|
|
|
|
|
|
38,331 |
|
|
|
(6 |
)(i) |
|
|
(38,342) |
(i) |
| Net income |
|
|
39 |
|
|
|
|
|
|
|
31,118 |
|
|
|
39,067 |
|
|
|
38,336 |
|
| |
|
|
39 |
|
|
|
|
|
|
|
633,420 |
|
|
|
589,661 |
(i) |
|
|
541,486 |
(i) |
| Non-current
liabilities |
|
|
|
|
|
|
|
|
|
|
|
|
|
|
|
|
|
|
|
|
| Borrowings |
|
|
19/20 |
|
|
|
|
|
|
|
1,188,387 |
|
|
|
628,141 |
|
|
|
629,327 |
|
| |
|
|
|
|
|
|
|
|
|
|
1,188,387 |
|
|
|
628,141 |
|
|
|
629,327 |
|
| Current liabilities |
|
|
|
|
|
|
|
|
|
|
|
|
|
|
|
|
|
|
|
|
| Trade payables and other
liabilities |
|
|
|
|
|
|
|
|
|
|
6,768 |
|
|
|
122,439 |
|
|
|
21,572 |
|
| Total liabilities |
|
|
|
|
|
|
|
|
|
|
1,195,155 |
|
|
|
750,580 |
|
|
|
650,899 |
|
| Total liabilities and shareholders’
equity |
|
|
|
|
|
|
|
|
|
|
1,828,575 |
|
|
|
1,340,241 |
|
|
|
1,192,385 |
|
Note: The accompanying notes form an integral part of the Company financial statements.
(i): Certain figures as of December 31, 2017 and 2016 have been corrected compared to those previously reported. For further information on
these corrections, see Notes 2 and 28 of these 2018 consolidated financial statements. This restatement impacts certain of InterXion Holding N.V.’s subsidiaries. Amounts in the company-only figures consequently impacted by this restatement are
indicated with ‘(i)’.
www.interxion.com / 101
|
|
|
|
|
| COMPANY FINANCIAL STATEMENTS |
|
|
Company income statement
|
|
|
|
|
|
|
|
|
|
|
|
|
|
|
|
|
|
|
|
|
| |
|
For the years ended December 31,
|
|
| |
|
Note |
|
|
|
|
|
2018 |
|
|
2017(i)
(€’000) |
|
|
2016(i) |
|
| Revenue |
|
|
|
|
|
|
|
|
|
|
— |
|
|
|
— |
|
|
|
— |
|
| Cost of sales |
|
|
|
|
|
|
|
|
|
|
(628 |
) |
|
|
(577 |
) |
|
|
(424 |
) |
| Gross profit |
|
|
|
|
|
|
|
|
|
|
(628 |
) |
|
|
(577 |
) |
|
|
(424 |
) |
| Management fees |
|
|
31 |
|
|
|
|
|
|
|
7,932 |
|
|
|
8,379 |
|
|
|
7,039 |
|
| Sales and marketing costs |
|
|
|
|
|
|
|
|
|
|
(892 |
) |
|
|
(771 |
) |
|
|
(735 |
) |
| General and administrative
costs |
|
|
32 |
|
|
|
|
|
|
|
(17,324 |
) |
|
|
(16,810 |
) |
|
|
(11,214 |
) |
| Operating result |
|
|
|
|
|
|
|
|
|
|
(10,912 |
) |
|
|
(9,779 |
) |
|
|
(5,334 |
) |
| Finance income |
|
|
33 |
|
|
|
|
|
|
|
46,635 |
|
|
|
37,839 |
|
|
|
39,423 |
|
| Finance expense |
|
|
33 |
|
|
|
|
|
|
|
(63,518 |
) |
|
|
(43,338 |
) |
|
|
(37,624 |
) |
| Result before taxation |
|
|
|
|
|
|
|
|
|
|
(27,795 |
) |
|
|
(15,278 |
) |
|
|
(3,535 |
) |
| Income tax benefit/(expense) |
|
|
34 |
|
|
|
|
|
|
|
(726 |
) |
|
|
5,940 |
|
|
|
(1,542 |
) |
| Result after taxation |
|
|
|
|
|
|
|
|
|
|
(28,521 |
) |
|
|
(9,338 |
) |
|
|
(5,077 |
) |
| Profit relating to investments in
subsidiaries after taxation |
|
|
35 |
|
|
|
|
|
|
|
59,639 |
|
|
|
48,405 |
|
|
|
43,413 |
|
| Net income |
|
|
|
|
|
|
|
|
|
|
31,118 |
|
|
|
39,067 |
|
|
|
38,336 |
|
Note: The accompanying notes form an integral part of the Company financial statements.
Notes to the 2018 Company financial statements
29. Basis of presentation
The structure of the Company statement of financial position and Company income statement are aligned as much as possible with the Consolidated financial statements in order to achieve optimal transparency between the Group
financial statements and the Company financial statements.
The Company statement of financial position has been prepared before the
appropriation of results.
30. Accounting policies
The financial statements of Interxion Holding N.V. are prepared in accordance with the Netherlands Civil Code, Book 2, Part 9, applying the
regulations of section 362.8 and allowing the use of the same accounting policies as those adopted for the consolidated financial statements as set out in Note 3.
Subsidiaries are valued using the equity method, applying EU-IFRS, as set out in Note 3 to the consolidated
financial statements. Any related-party transactions between subsidiaries and with members of the Board of Directors and the (ultimate) parent company Interxion Holding N.V. are conducted at an
arm’s-length basis on terms comparable to transactions with third parties.
31.
Management fees
Management fees relates to transactions with Group companies regarding intercompany agreements.
102 / www.interxion.com
|
|
|
|
|
|
|
COMPANY FINANCIAL STATEMENTS |
32. General and
administrative costs
The general and administrative costs consist of the following components:
|
|
|
|
|
|
|
|
|
|
|
|
|
| |
|
2018 |
|
|
2017
(€’000) |
|
|
2016 |
|
| Share-based payments |
|
|
7,195 |
|
|
|
6,729 |
|
|
|
4,974 |
|
| M&A transaction costs |
|
|
2,974 |
|
|
|
3,772 |
|
|
|
1,765 |
|
| Employee benefit expenses (excluding
share-based payments) |
|
|
2,790 |
|
|
|
3,166 |
|
|
|
2,864 |
|
| Professional services |
|
|
4,074 |
|
|
|
3,004 |
|
|
|
1,457 |
|
| Other general and administrative
costs |
|
|
290 |
|
|
|
139 |
|
|
|
154 |
|
| |
|
|
17,324 |
|
|
|
16,810 |
|
|
|
11,214 |
|
33. Finance income and expense
Finance income mainly consists of interest received from intercompany financing transactions.
Finance expense mainly relates to interest charges on external debt (please refer to note 9).
34. Income taxes
InterXion Holding N.V. is head of the fiscal unity that exists for Dutch corporate income tax purposes. The income tax expense of €0.7 million reported in the Company income statement represents the company-only current and deferred tax expense for InterXion Holding N.V.
35. Employees
The
number of persons employed by the Company at year-end 2018 was 6 (2017: 6). For the remuneration of past and present members, both of key management and the Board of Directors, please refer to note 26 –
Related-party transactions, which is deemed incorporated and repeated herein by reference.
36. Financial assets
|
|
|
|
|
|
|
|
|
|
|
|
|
|
|
|
|
|
|
|
|
|
|
|
|
| |
|
Investments in
subsidiaries |
|
|
Receivables from
subsidiaries |
|
|
|
|
|
2018
(€’000) |
|
2017 |
|
|
2016 |
|
| As at January 1, |
|
|
218,427 |
|
|
|
1,096,366 |
|
|
|
|
|
|
|
1,314,793 |
|
|
|
1,148,120 |
(i) |
|
|
968,607 |
(i) |
| Movement in receivables |
|
|
— |
|
|
|
334,160 |
|
|
|
|
|
|
|
334,160 |
|
|
|
122,803 |
|
|
|
134,821 |
|
| Profit after tax |
|
|
59,639 |
|
|
|
— |
|
|
|
|
|
|
|
59,639 |
|
|
|
48,405 |
|
|
|
43,413 |
|
| (Repayment capital) /
Recapitalisation |
|
|
5,188 |
|
|
|
— |
|
|
|
|
|
|
|
5,188 |
|
|
|
2,494 |
|
|
|
12,892 |
|
| Foreign currency translation
differences |
|
|
(639 |
) |
|
|
— |
|
|
|
|
|
|
|
(639) |
|
|
|
(7,029 |
)(i) |
|
|
(11,613 |
)(i) |
| As at December 31, |
|
|
282,615 |
|
|
|
1,430,526 |
|
|
|
|
|
|
|
1,713,141 |
|
|
|
1,314,793 |
(i) |
|
|
1,148,120 |
(i) |
(i): Certain figures as of December 31, 2017 and 2016 have been corrected compared to those previously
reported. For further information on these corrections, see Notes 2 and 28 of these 2018 consolidated financial statements. This restatement impacts certain of InterXion Holding N.V.’s subsidiaries. Amounts in the company-only figures
consequently impacted by this restatement are indicated with ‘(i)’.
All financial assets have a maturity of more than twelve
months.
37. Deferred tax assets
The deferred tax asset of €20.5 million (2017: €21.1 million; 2016: €15.0 million) relates to tax losses available in the Dutch fiscal unity.
38. Trade and other current assets
Trade and other current assets consist of payments to creditors for costs that
relate to future periods (for example rent, maintenance contracts and insurance premiums) and VAT. All have a maturity of less than twelve months. At December 31, 2018,
€1.9 million was related to the VAT receivable (2017: €1.5 million; 2016: €0.9 million).
www.interxion.com / 103
|
|
|
|
|
| COMPANY FINANCIAL STATEMENTS |
|
|
39.
Shareholders’ equity
|
|
|
|
|
|
|
|
|
|
|
|
|
|
|
|
|
|
|
|
|
|
|
|
|
|
|
| |
|
Note |
|
Share |
|
|
Share |
|
|
Foreign |
|
|
Hedge |
|
|
Accumulated |
|
|
Total |
|
| |
|
|
|
capital |
|
|
premium |
|
|
currency |
|
|
reserve |
|
|
deficit |
|
|
equity |
|
| |
|
|
|
|
|
|
|
|
|
translation |
|
|
|
|
|
|
|
|
|
|
| |
|
|
|
|
|
|
|
|
|
reserve |
|
|
|
|
|
|
|
|
|
|
| |
|
|
|
|
|
|
|
|
|
(€’000) |
|
|
|
|
|
|
|
| Balance at January 1, 2018 |
|
|
|
|
7,141 |
|
|
|
539,448 |
|
|
|
4,180(i) |
|
|
|
(169) |
|
|
|
39,061 |
(i) |
|
|
589,661 |
|
| Profit for the year |
|
|
|
|
— |
|
|
|
— |
|
|
|
— |
|
|
|
— |
|
|
|
31,118 |
|
|
|
31,118 |
|
| Hedging result, net of tax |
|
|
|
|
— |
|
|
|
— |
|
|
|
— |
|
|
|
4 |
|
|
|
— |
|
|
|
4 |
|
| Other comprehensive income/(loss) |
|
|
|
|
— |
|
|
|
— |
|
|
|
(639 |
) |
|
|
— |
|
|
|
(730 |
)(ii) |
|
|
(1,369 |
) |
| Total comprehensive income/(loss), net of tax |
|
|
|
|
— |
|
|
|
— |
|
|
|
(639 |
) |
|
|
4 |
|
|
|
30,388 |
|
|
|
29,753 |
|
| Exercise of options |
|
10 |
|
|
1,726 |
|
|
|
— |
|
|
|
— |
|
|
|
— |
|
|
|
1,736 |
|
|
|
|
|
| Issue of performance shares and restricted shares |
|
|
|
|
19 |
|
|
|
(19 |
) |
|
|
— |
|
|
|
— |
|
|
|
— |
|
|
|
— |
|
| Share-based payments |
|
21 |
|
|
— |
|
|
|
12,270 |
|
|
|
— |
|
|
|
— |
|
|
|
— |
|
|
|
12,270 |
|
| Total contribution by, and distributions to, owners of the Company |
|
|
|
|
29 |
|
|
|
13,977 |
|
|
|
— |
|
|
|
— |
|
|
|
— |
|
|
|
14,006 |
|
| Balance at December 31, 2018 |
|
|
|
|
7,170 |
|
|
|
553,425 |
|
|
|
3,541 |
|
|
|
(165) |
|
|
|
69,449 |
|
|
|
633,420 |
|
| |
|
|
|
|
|
|
|
|
|
|
|
|
|
|
|
|
|
|
|
|
|
|
|
|
|
|
| Balance at January 1, 2017 |
|
|
|
|
7,060 |
|
|
|
523,671 |
|
|
|
11,004 |
(i) |
|
|
(243) |
|
|
|
(6 |
)(i) |
|
|
541,486 |
|
| Profit for the year |
|
|
|
|
— |
|
|
|
— |
|
|
|
— |
|
|
|
— |
|
|
|
39,067 |
|
|
|
39,067 |
|
| Hedging result, net of tax |
|
|
|
|
— |
|
|
|
— |
|
|
|
— |
|
|
|
74 |
|
|
|
— |
|
|
|
74 |
|
| Other comprehensive income/(loss) |
|
|
|
|
— |
|
|
|
— |
|
|
|
(6,824 |
)(i) |
|
|
— |
|
|
|
— |
|
|
|
(6,824 |
) |
| Total comprehensive income/(loss), net of tax |
|
|
|
|
— |
|
|
|
— |
|
|
|
(6,824 |
) |
|
|
74 |
|
|
|
39,067 |
|
|
|
32,317 |
|
| Exercise of options |
|
|
|
|
55 |
|
|
|
6,914 |
|
|
|
— |
|
|
|
— |
|
|
|
— |
|
|
|
6,969 |
|
| Issue of performance shares and restricted shares |
|
|
|
|
26 |
|
|
|
(26 |
) |
|
|
— |
|
|
|
— |
|
|
|
— |
|
|
|
— |
|
| Share-based payments |
|
21 |
|
|
— |
|
|
|
8,889 |
|
|
|
— |
|
|
|
— |
|
|
|
— |
|
|
|
8,889 |
|
| Total contribution by, and distributions to, owners of the Company |
|
|
|
|
81 |
|
|
|
15,777 |
|
|
|
— |
|
|
|
— |
|
|
|
— |
|
|
|
15,858 |
|
| Balance at December 31, 2017 |
|
|
|
|
7,141 |
|
|
|
539,448 |
|
|
|
4,180 |
(i) |
|
|
(169) |
|
|
|
39,061 |
(i) |
|
|
589,661 |
|
| |
|
|
|
|
|
|
|
|
|
|
|
|
|
|
|
|
|
|
|
|
|
|
|
|
|
|
| Balance at January 1, 2016(i) |
|
|
|
|
6,992 |
|
|
|
509,816 |
(i) |
|
|
20,865 |
|
|
|
(213) |
|
|
|
(38,342 |
)(i) |
|
|
499,034 |
|
| Net income |
|
|
|
|
— |
|
|
|
— |
|
|
|
— |
|
|
|
— |
|
|
|
38,336 |
(i) |
|
|
38,336 |
|
| Hedging result, net of tax |
|
|
|
|
— |
|
|
|
— |
|
|
|
— |
|
|
|
(30) |
|
|
|
— |
|
|
|
(30 |
) |
| Other comprehensive income/(loss) |
|
|
|
|
— |
|
|
|
— |
|
|
|
(9,777 |
)(i) |
|
|
— |
|
|
|
— |
|
|
|
(9,777 |
) |
| Total comprehensive income/(loss), net of tax |
|
|
|
|
— |
|
|
|
— |
|
|
|
(9,777 |
) |
|
|
(30) |
|
|
|
38,336 |
|
|
|
28,529 |
|
| Exercise of options |
|
|
|
|
48 |
|
|
|
6,284 |
|
|
|
— |
|
|
|
— |
|
|
|
— |
|
|
|
6,332 |
|
| Issue of performance shares and restricted shares |
|
|
|
|
20 |
|
|
|
(20 |
) |
|
|
— |
|
|
|
— |
|
|
|
— |
|
|
|
— |
|
| Share-based payments |
|
21 |
|
|
— |
|
|
|
7,591 |
(i) |
|
|
— |
|
|
|
— |
|
|
|
— |
|
|
|
7,591 |
|
| Total contribution by, and distributions to, owners of the Company |
|
|
|
|
68 |
|
|
|
13,855 |
|
|
|
— |
|
|
|
— |
|
|
|
— |
|
|
|
13,923 |
|
| Balance at December 31, 2016(i) |
|
|
|
|
7,060 |
|
|
|
523,671 |
|
|
|
11,004 |
(i) |
|
|
(243) |
|
|
|
(6 |
)(i) |
|
|
541,486 |
|
Note: Foreign currency translation reserve qualifies as a legal reserve.
(i): Certain figures as of December 31, 2017 and 2016 have been corrected compared to those previously reported. For further information on
these corrections, see Notes 2 and 28 of these 2018 consolidated financial statements. This restatement impacts certain of InterXion Holding N.V.’s subsidiaries. Amounts in the company-only figures consequently impacted by this restatement are
indicated with ‘(i)’.
(ii): The Other comprehensive loss, recognized in Accumulated profit in 2018 relates to a pension plan
of one of the Company’s subsidiaries that qualifies as a defined benefit plan in accordance with IAS 19 – Employee Benefits, but was previously accounted for as a defined contribution plan for which the impact to the (interim) financial
statements of previous periods and the current period is inconsequential. As from 2018, management elected to change this by recognizing a corresponding entry in “Other comprehensive income”.
104 / www.interxion.com
|
|
|
|
|
|
|
COMPANY FINANCIAL STATEMENTS |
40. Financial commitments
The Company has entered into several other commitments, which in general relate to operating expenses. As at December 31, 2018 the outstanding
commitments amount to €0.9 million (2017: €2.0 million, 2016: €2.9 million). These commitments are expected to be settled in the following financial year.
41. Obligations not appearing in the statement of financial position
Declarations of joint and several liability as defined in Book 2, section 403 of The Netherlands Civil Code have been given by InterXion Holding
N.V. on behalf of the following Dutch subsidiaries: InterXion Telecom B.V., InterXion Nederland B.V., InterXion Consultancy Services B.V., InterXion Trading B.V., InterXion HeadQuarters B.V., InterXion B.V., InterXion Datacenters B.V., InterXion
Trademarks B.V., InterXion Real Estate Holding B.V., InterXion Real Estate I B.V., InterXion Real Estate IV B.V., InterXion Real Estate V B.V., InterXion Real Estate X B.V., InterXion Real Estate XII B.V., InterXion Real Estate XIII B.V., InterXion
Real Estate XIV B.V., InterXion Real Estate XVI B.V., InterXion Science Park B.V., InterXion Operational B.V. and InterXion Participation 1 B.V.
The liabilities of these companies to third parties totaled €117.3 million at December 31, 2018 (2017: €97.9 million; 2016: €91.9 million).
From time to time we provide guarantees to third parties in connection with transactions entered into by our subsidiaries in the ordinary course of
business. The Company, together with InterXion B.V., InterXion Consultancy Services B.V., InterXion HeadQuarters B.V., InterXion Nederland B.V., InterXion Datacenters B.V., InterXion Telecom B.V., InterXion Trademarks B.V., InterXion Trading B.V.,
InterXion Real Estate Holding B.V., InterXion Real Estate I B.V., InterXion Real Estate IV B.V, InterXion Real Estate V B.V., InterXion Real Estate X B.V., InterXion Real Estate XII B.V., InterXion Real Estate XIII B.V., InterXion Real Estate XIV
B.V., InterXion Real Estate XVI B.V., InterXion Science Park B.V., InterXion Operational B.V. and InterXion Participation 1 B.V. forms a fiscal group for corporate income tax purposes and is considered to be jointly responsible for the obligations
of the fiscal group.
42. Fees of the auditor
With reference to section 2:382a (1) and (2) of the Netherlands Civil Code, the following fees for the financial years 2018, 2017 and 2016 were
charged by KPMG Accountants N.V. or other KPMG network companies to the Company, its subsidiaries and other consolidated entities:
|
|
|
|
|
|
|
|
|
|
|
|
|
|
|
|
|
|
|
|
|
|
|
|
|
|
|
|
|
|
|
|
|
|
|
|
|
|
|
|
|
|
|
|
|
|
|
|
|
|
| |
|
|
|
2018 |
|
|
|
|
|
|
|
2017 |
|
|
|
|
|
|
|
2016 |
|
|
| |
|
KPMG |
|
Other |
|
Total |
|
|
|
KPMG |
|
Other |
|
Total |
|
|
|
KPMG |
|
Other |
|
Total |
| |
|
Accountants |
|
KPMG |
|
KPMG |
|
|
|
Accountants |
|
KPMG |
|
KPMG |
|
|
|
Accountants |
|
KPMG |
|
KPMG |
| |
|
N.V. |
|
network |
|
|
|
|
|
N.V. |
|
network |
|
|
|
|
|
N.V. |
|
network |
|
|
| |
|
|
|
|
|
|
|
|
|
|
|
(€’000) |
|
|
|
|
|
|
|
|
|
|
| Statutory audit of annual accounts |
|
|
|
1,653 |
|
|
|
|
539 |
|
|
|
|
2,192 |
|
|
|
|
|
|
1,182 |
|
|
|
|
469 |
|
|
|
|
1,651 |
|
|
|
|
|
|
757 |
|
|
|
|
433 |
|
|
|
|
1,190 |
|
| Audit-related fees |
|
|
|
430 |
|
|
|
|
139 |
|
|
|
|
569 |
|
|
|
|
|
|
196 |
|
|
|
|
135 |
|
|
|
|
331 |
|
|
|
|
|
|
359 |
|
|
|
|
131 |
|
|
|
|
490 |
|
| Tax services |
|
|
|
— |
|
|
|
|
— |
|
|
|
|
— |
|
|
|
|
|
|
— |
|
|
|
|
— |
|
|
|
|
— |
|
|
|
|
|
|
— |
|
|
|
|
— |
|
|
|
|
— |
|
| Other services |
|
|
|
— |
|
|
|
|
22 |
|
|
|
|
22 |
|
|
|
|
|
|
— |
|
|
|
|
22 |
|
|
|
|
22 |
|
|
|
|
|
|
— |
|
|
|
|
16 |
|
|
|
|
16 |
|
| |
|
|
|
2,083 |
|
|
|
|
700 |
|
|
|
|
2,783 |
|
|
|
|
|
|
1,378 |
|
|
|
|
626 |
|
|
|
|
2,004 |
|
|
|
|
|
|
1,116 |
|
|
|
|
580 |
|
|
|
|
1,696 |
|
www.interxion.com / 105
|
|
|
|
|
| COMPANY FINANCIAL STATEMENTS |
|
|
43. Events
subsequent to the balance sheet date
Increased capacity under Revolving Facility
During the first quarter of 2019, the Company increased capacity under the Revolving Facility by €100.0 million for total commitment of €300.0 million.
Purchase of share in Icolo Ltd.
During 2019, one of the
Company’s subsidiaries entered into an agreement to purchase 40% of the share capital of Icolo Ltd., and certain convertible loans which were previously granted to Icolo Ltd. by the sellers. The transaction price for both the shares and the
convertible loans amounts to USD 5.7 million. After completion of this transaction, this subsidiary will apply IAS 28 – Investments in Associates and Joint Ventures and account for the shares as an investment in an associate.
44. Appropriation of result
Statutory regulation governing the distribution of profit (in accordance with article 23 paragraph 1 and 2 of the Articles of Association).
Paragraph 1: The Board shall, in its sole discretion, determine the amounts of the profits accrued in a financial year that shall be added to the reserves of the Company.
Paragraph 2: The allocation of profits accrued in a financial year remaining after application of article 23.1 shall be determined at the General
Meeting.
106 / www.interxion.com
|
|
|
|
|
|
|
COMPANY FINANCIAL STATEMENTS |
Proposed
appropriation of results for the year 2018
The Board of Directors proposes to add the profit for the year, amounting to €31,118,000, to the other reserves (“accumulated profit”).
Board of Directors:
|
|
|
|
|
| |
|
|
|
|
|
|
|
| D.C. Ruberg |
|
|
|
J.F.H.P. Mandeville |
|
|
|
| (Chief Executive Officer, Vice-Chairman and Executive Director) |
|
|
|
(Chairman and Non-executive Director) |
|
|
|
| |
|
|
|
|
|
|
|
| F. Esser |
|
|
|
M. Heraghty |
|
|
|
| (Non-executive Director) |
|
|
|
(Non-executive Director) |
|
|
|
| |
|
|
|
|
|
|
|
| R. Ruijter |
|
|
|
D. Lister |
|
|
|
| (Non-executive Director) |
|
|
|
(Non-executive Director) |
Hoofddorp, May 27, 2019
www.interxion.com / 107

108
/ www.interxion.com
Independent
auditor’s report
The independent auditor’s report from KPMG is included on the next page.
www.interxion.com / 109

Independent auditor’s report
To: the General Meeting of Shareholders of InterXion Holding N.V.
Report on the audit of the financial statements 2018 included in the annual report
Our opinion
In our opinion:
| — |
the accompanying consolidated financial statements give a true and fair view of the financial position of InterXion
Holding N.V. as at December 31, 2018 and of its result and its cash flows for the year then ended, in accordance with International Financial Reporting Standards as adopted by the European Union (EU-IFRS)
and with Part 9 of Book 2 of the Dutch Civil Code. |
| — |
the accompanying company financial statements give a true and fair view of the financial position of InterXion Holding
N.V. as at December 31, 2018 and of its result for the year then ended in accordance with Part 9 of Book 2 of the Dutch Civil Code. |
What we have audited
We have audited the financial statements 2018 of InterXion Holding N.V. (the Company) based in Amsterdam,
the Netherlands. The financial statements include the consolidated financial statements and the company financial statements.
The consolidated financial statements
comprise:
| 1 |
the consolidated statement of financial position as at December 31, 2018; |
| 2 |
the following consolidated statements for 2018: the income statements, the statements of comprehensive income, statements
of changes in shareholders’ equity and statements of cash flows; and |
| 3 |
the notes comprising a summary of the significant accounting policies and other explanatory information.
|
The company financial statements comprise:
| 1 |
the company statement of financial position as at December 31, 2018; |
| 2 |
the company income statement for 2018; and |
| 3 |
the notes comprising a summary of the accounting policies and other explanatory information.
|
KPMG
Accountants N.V., registered with the trade register in the Netherlands under number 33263683, is a member firm of the KPMG network of independent member firms affiliated with KPMG International Cooperative (‘KPMG International’), a Swiss
entity.
110 / www.interxion.com
Basis for our opinion
We conducted our audit in accordance with Dutch law, including the Dutch Standards on Auditing. Our responsibilities under those standards are further described in the
‘Our responsibilities for the audit of the financial statements’ section of our report.
We are independent of InterXion Holding N.V. in accordance with
the ‘Wet toezicht accountantsorganisaties’ (Wta, Audit firms supervision act), the ‘Verordening inzake de onafhankelijkheid van accountants bij assurance-opdrachten’ (ViO, Code of Ethics for Professional Accountants, a regulation
with respect to independence) and other relevant independence regulations in the Netherlands. Furthermore, we have complied with the ‘Verordening gedrags- en beroepsregels accountants’ (VGBA, Dutch Code of Ethics).
We believe the audit evidence we have obtained is sufficient and appropriate to provide a basis for our opinion.
Audit approach
Summary
|
|
Materiality
|
|
— Materiality of EUR 2.5 million
— 5% of profit before taxation
|
|
| Group
audit |
|
— 96% of total assets
— 99% of revenue
— 97% of profit before taxation
|
|
| Key audit
matters |
|
— Revenue recognition
— Data center expansion and acquisition
— Disclosure of the estimated impact of IFRS 16
|
Materiality
Based on our professional judgement we determined the materiality for the financial statements as a whole at EUR 2.5 million (2017: EUR 2.5 million).
KPMG Accountants N.V., registered with the trade register in the Netherlands under number 33263683,
is a member firm of the KPMG network of independent member firms affiliated with KPMG International Cooperative (‘KPMG International’), a Swiss entity.
www.interxion.com / 111
The materiality is determined with reference to the consolidated profit before taxation (5%). We consider profit before
taxation as an appropriate benchmark based on the nature of the business and size of the company and presumed attention of the users of the financial statements on results for the purpose of evaluating the Company’s financial performance. We
have also taken into account misstatements and/or possible misstatements that in our opinion are material for the users of the financial statements for qualitative reasons.
We agreed with the Audit Committee that misstatements in excess of EUR 110 thousand, which are identified during the audit, would be reported to them, as well as
smaller misstatements that in our view must be reported on qualitative grounds.
Scope of the group audit
InterXion Holding N.V. is the parent company of a group of entities. The financial information of this group is included in the financial statements
of InterXion Holding N.V..
Considering our ultimate responsibility for the opinion, we are also responsible for directing, supervising, and performing the group
audit. In this context, we have determined the nature and extent of the audit procedures to be performed for group entities (or “components”). Decisive factors were the significance and / or the risk profile of the components. On this
basis, we selected the components for which an audit had to be performed. Furthermore, on the request of the Audit Committee and the Board of Directors, we have scoped into the group audit all components that are subject to a statutory audit.
Based on these scoping criteria we performed the following procedures:
| ● |
|
audits for group reporting purposes were carried out for nearly all operating companies (11 components), out of which 1 operating component that was audited by ourselves; and |
| ● |
|
audits for group reporting purposes were carried out at 16 real estate components and 4 holding components, of which 10 real estate components and 3 holding components that were audited by ourselves. |
In addition, we performed centralized audit procedures in a number of audit areas such as goodwill impairment testing, share-based payments, financial covenants,
evaluation of relevant IT systems and the implementation of IFRS 16 Leases.
The audits at the components were performed at component materiality levels that
are lower than group materiality, as determined by the group auditor based on judgement. Component materiality did not exceed EUR 1.3 million (2017: EUR 1.75 million) and the majority of the component audits were performed at an individual
component materiality that is significantly less than this threshold.
We sent detailed instructions to all component auditors, covering the significant areas that
should be audited and set out the information to be reported to us. All components in scope for group reporting are audited by KPMG member firms. For all components we had various discussions with the component auditor. We communicated the
identified risks, the audit approach and instructions, the component auditors reported their audit findings and observations to the group auditor and we attended the closing meetings of all components.
KPMG
Accountants N.V., registered with the trade register in the Netherlands under number 33263683, is a member firm of the KPMG network of independent member firms affiliated with KPMG International Cooperative (‘KPMG International’), a Swiss
entity.
112 / www.interxion.com
Based on our risk assessment, we visited component locations in France and the United Kingdom for site visits and file
reviews and performed a remote file review for Germany. For other components we use a rotational approach to perform remote file reviews, which for 2018 included the components in Spain, Sweden and Switzerland.
By performing the procedures mentioned above at group components, together with additional procedures at group level, we have been able to obtain sufficient and
appropriate audit evidence about the group’s financial information to provide an opinion about the consolidated financial statements.
The audit coverage as
stated in the section summary can be further specified as follows:
Audit coverage
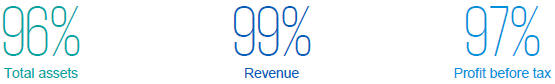
Audit scope in relation to fraud
In accordance with the Dutch Standards on Auditing we are responsible for obtaining reasonable assurance that the financial statements taken as a whole are free from
material misstatement, whether caused by fraud or error. In determining the audit procedures we will make use of the evaluation of management in relation to fraud risk management (prevention, detection and response), including ethical standards to
create a culture of honesty.
In our process of identifying fraud risks we assessed fraud risk factors, which we discussed with management and the Audit Committee.
Fraud risk factors are events or conditions that indicate an incentive or pressure to commit fraud or provide an opportunity to commit fraud.
Based on the auditing
standards we addressed the following presumed fraud risks that were relevant to our audit:
| — |
fraud risk in relation to the revenue recognition for new revenue contracts, as further described in the Key Audit
Matters section below; |
| — |
fraud risk in relation to management override of controls. |
Furthermore, we identified and addressed the following other fraud risk which could have a material impact on the financial statements:
| — |
Fraud risk in relation to new data center expansion, as further described in the Key Audit Matters section below under
‘Data Center Expansion and Acquisition’. |
KPMG Accountants N.V., registered with the trade register in the Netherlands under number 33263683,
is a member firm of the KPMG network of independent member firms affiliated with KPMG International Cooperative (‘KPMG International’), a Swiss entity.
www.interxion.com / 113
Our audit procedures included an evaluation of the internal controls relevant to mitigate these risks and supplementary
substantive audit procedures, including detailed testing of journal entries and documentation in relation to new revenue contracts and data center expansion approvals. We discussed with our forensic specialists our audit approach when deemed
relevant for our audit of the annual accounts.
Our audit procedures differ from a specific forensic fraud investigation, which investigation often has a more in-depth character.
Our procedures to address fraud risks did not result in findings other than included in the Key Audit Matters.
Audit scope in relation to laws and regulations
We identified laws and regulations that could reasonably be expected to have a material effect on the financial statements from our general and sector experience,
through discussion with the directors, those charged with governance and/or other management (as required by auditing standards) and discussed the policies and procedures regarding compliance with laws and regulations. We communicated identified
laws and regulations within our audit team and remained alert to any indications of non-compliance throughout the audit. This included communication from the group to component audit teams of relevant laws and
regulations identified at group level.
The potential effect of these laws and regulations on the financial statements varies considerably.
Firstly, the Company is subject to laws and regulations that directly affect the financial statements, such as relevant tax laws and financial reporting standards and we
assessed the extent of compliance with these laws and regulations as part of our procedures on the related financial statement items.
Secondly, the Company is
subject to other laws and regulations where the consequences of non-compliance could have a material effect on amounts or disclosures in the financial statements, for instance through the imposition of fines
or litigation. Auditing standards limit the required audit procedures to identify non-compliance with these laws and regulations to inquiry of the directors, those charged with governance and other management
and inspection of (board) minutes and regulatory and legal correspondence, if any. These are part of our procedures on the related financial statement items.
We are
not responsible for preventing non-compliance and cannot be expected to detect non-compliance with all laws and regulations.
Our key audit matters
Key audit matters
are those matters that, in our professional judgement, were of most significance in our audit of the financial statements. We have communicated the key audit matters to the Audit Committee. The key audit matters are not a comprehensive reflection of
all matters discussed.
These matters were addressed in the context of our audit of the financial statements as a whole and in forming our opinion thereon, and we do
not provide a separate opinion on these matters.
KPMG
Accountants N.V., registered with the trade register in the Netherlands under number 33263683, is a member firm of the KPMG network of independent member firms affiliated with KPMG International Cooperative (‘KPMG International’), a Swiss
entity.
114 / www.interxion.com
Description
The
Group’s revenue consists of revenue derived from the rendering of data center services, which includes colocation, power supply, cross connect and customer installation services (primary data center services), equipment sales and hands and eyes
services. Following the implementation of IFRS 15 – Revenue from Contracts with Customers as from 1 January 2018 and application of the series guidance for primary data center services and recurring hands and eyes services, revenue
has been recognized on a monthly basis in line with the satisfaction of the monthly increment of service, which is substantially in line with the historical accounting for these revenues. Additional customer installation services and equipment sales
as well as hands and eyes services on demand are recognized at the point in time that the services are rendered. There is a presumed risk that revenue may be deliberately overstated as a result of management override to achieve external
expectations.
Due to the significance of revenue recognition from data centers, we consider this as a key audit matter.
Our response
Our audit procedures on revenue
included testing the relevant IT systems and the operating effectiveness of the key internal controls over the existence, accuracy and completeness, as relevant, for the different types of revenue from existing contracts included in the Group’s
contract database, including the reconciliations between the revenue systems and the financial ledgers.
To specifically address the risk of deliberately overstating
revenue, we tested new sales contracts, on a sample basis, to assess whether revenue existed and was recognized in the accounting period in which the services were rendered, in accordance with the relevant accounting standards. In addition,
depending on the specific audit approach for a component, the audit approach includes, where relevant, procedures such as analytical procedures, and comparing the total cash received from customers (adjusted for the movement in accounts receivable,
accrued revenue, deferred revenue and VAT) with the revenue recognized in the period.
Our approach regarding the risk of management override of controls included
evaluating internal controls over the recording of journal entries and testing of management’s accounting estimates. In addition, we tested journal entries to identify unusual or irregular items and to assess that these were properly authorized
and supported by proper underlying documentation such as third-party invoices and contracts. Furthermore, we assessed the nature of transactions and impact analysis related to the first year of adoption of IFRS 15. We also focused on the adequacy of
the company’s disclosure in respect of IFRS 15 (refer to – Note 6 – Revenue from contracts with customers).
Our observation
The results of our procedures relating to revenue from data center services were satisfactory.
KPMG Accountants N.V., registered with the trade register in the Netherlands under number 33263683,
is a member firm of the KPMG network of independent member firms affiliated with KPMG International Cooperative (‘KPMG International’), a Swiss entity.
www.interxion.com / 115
|
| Data center expansion and
acquisition |
Description
The
Group incurs capital expenditure relating to the acquisition and expansion of data centers (refer to Note 11 Property, Plant and Equipment). As significant amounts are involved with this capital expenditure, there is a risk related to the
appropriateness of the amounts capitalized and payments made as there is a risk of collusion with the Group’s employees and/or possible irregularities in the bidding process. Due to the significance of the data center expansion and
acquisitions, we consider this as a key audit matter.
Our response
We have tested the relevant internal controls such as internal review of invoices received based on the underlying purchase order and/or contract, including review and
authorization of the respective purchase orders and/or contracts, and internal approval of business cases which includes the evaluation of the bidding process and supplier selection, where applicable.
Furthermore, we performed procedures to assess that the additions to fixed assets were appropriately capitalized and were supported by evidence such as supplier invoice
and approved purchase order or contract, and internal approval of business cases which includes the evaluation of the bidding process and supplier selection, where applicable. We also obtained for certain plots of land third party evidence (e.g.
land register) to verify that land recorded in the balance sheet is owned by the Group.
To specifically address the risk related to collusion with the Group’s
employees and/or possible irregularities in the bidding process, we performed vendor searches based on publicly available sources for main vendors used by the Group for its data center expansion activities. In addition We compared the main vendors
to the related parties identified by the Group, both to identify potential links to irregularities.
Our observation
The results of our procedures relating to data center expansion and acquisition were satisfactory.
|
| Disclosure of the estimated
impact of IFRS 16 |
Description
IFRS
16 – Leases becomes effective for annual periods beginning on or after January 1, 2019. The application of this new standard as disclosed in Note 3 (Significant accounting policies, IFRS 16 leases) has been determined to cause an increase
in total non-current assets of EUR 420 million due to the recognition of right-of-use assets and an increase in total
financial liabilities of EUR 422 million due to the recognition of lease liabilities. The implementation of IFRS 16 Leases requires accounting policy selections and key judgment by management in determining matters such as discount rates,
extension options to be included in the lease term, and practical expedients to be applied in adoption of the standard. Due to the significance of this new standard, we consider this as a key audit matter.
KPMG
Accountants N.V., registered with the trade register in the Netherlands under number 33263683, is a member firm of the KPMG network of independent member firms affiliated with KPMG International Cooperative (‘KPMG International’), a Swiss
entity.
116 / www.interxion.com
Our response
Our audit procedures on IFRS 16 – Leases implementation included evaluating the design and testing the operating effectiveness of the key internal controls around
the completeness and accuracy of the contractual lease agreements recognized in the lease register.
Furthermore we have reviewed management’s accounting
position papers and key policy decisions which will be adopted as of January 1, 2019, to determine whether these have been set up in accordance with the requirements of IFRS 16. For critical positions taken by the Company on IFRS 16, we
consulted with subject matter experts and we challenged management on their accounting policy choices and judgments and obtained evidence supporting their judgments.
We involved our valuation experts to assist us in evaluating the discount rates applied.
We selected a sample of lessee contracts to validate the accuracy of the data inputs used to calculate the transition adjustment. We have also recalculated the right-of-use asset and lease liability for each material type lease contract. Further, we have determined that the relevant disclosures have been prepared in accordance with
IFRS 16.
Our observation
The results of
our procedures relating to the disclosure of the impact of IFRS 16 – Leases were satisfactory.
Report on the other information
included in the annual report
In addition to the financial statements and our auditor’s report thereon, the annual report contains other information
that consists of:
| — |
Report of the Board of Directors; |
| — |
Report of the Non-executive Directors |
— The other information pursuant to Part 9 of Book 2 of the Dutch Civil Code.
Based on the following procedures performed, we conclude that the other information:
— is consistent with the financial statements and does not contain material misstatements; and
— contains the information as required by Part 9 of Book 2 of the Dutch Civil Code.
We have read the other information. Based on our knowledge and understanding obtained through our audit of the financial statements or otherwise, we have considered
whether the other information contains material misstatements.
By performing these procedures, we comply with the requirements of Part 9 of Book 2 of the Dutch
Civil Code and the Dutch Standard 720. The scope of the procedures performed is substantially less than the scope of those performed in our audit of the financial statements.
KPMG Accountants N.V., registered with the trade register in the Netherlands under number 33263683,
is a member firm of the KPMG network of independent member firms affiliated with KPMG International Cooperative (‘KPMG International’), a Swiss entity.
www.interxion.com / 117
The Board of Directors of InterXion Holding N.V. is responsible for the preparation of the other information, including
the Report of the Board of Directors in accordance with Part 9 of Book 2 of the Dutch Civil Code and the other information pursuant to Part 9 of Book 2 of the Dutch Civil Code.
Report on other legal and regulatory requirements
Engagement
We were engaged
by the Annual General Meeting of Shareholders as auditor of InterXion Holding N.V. on June 29, 2018. We were first appointed as of the audit for the year 2000 and have operated as statutory auditor ever since that financial year.
Description of responsibilities regarding the financial statements
Responsibilities of the Board of Directors and the Audit Committee of InterXion Holding N.V. for the financial statements
The Board of Directors of InterXion Holding N.V. is responsible for the preparation and fair presentation of the financial statements in accordance with EU-IFRS and Part 9 of Book 2 of the Dutch Civil Code. Furthermore, the Board of Directors of InterXion Holding N.V. is responsible for such internal control as management determines is necessary to enable the
preparation of the financial statements that are free from material misstatement, whether due to fraud or error.
As part of the preparation of the financial
statements, the Board of Directors of InterXion Holding N.V. is responsible for assessing the Company’s ability to continue as a going concern. Based on the financial reporting frameworks mentioned, the Board of Directors of InterXion Holding
N.V. should prepare the financial statements using the going concern basis of accounting unless the Board of Directors of InterXion Holding N.V. either intends to liquidate the Company or to cease operations, or has no realistic alternative but to
do so. The Board of Directors of InterXion Holding N.V. should disclose events and circumstances that may cast significant doubt on the company’s ability to continue as a going concern in the financial statements.
The Audit Committee is responsible for overseeing the Company’s financial reporting process.
Our responsibilities for the audit of the financial statements
Our objective is to plan and perform the audit engagement in a manner that allows us to obtain sufficient and appropriate audit evidence for our opinion.
Our audit has been performed with a high, but not absolute, level of assurance, which means we may not detect all material errors and fraud during our audit.
Misstatements can arise from fraud or error and are considered material if, individually or in the aggregate, they could reasonably be expected to influence the economic
decisions of users taken on the basis of these financial statements. The materiality affects the nature, timing and extent of our audit procedures and the evaluation of the effect of identified misstatements on our opinion.
KPMG
Accountants N.V., registered with the trade register in the Netherlands under number 33263683, is a member firm of the KPMG network of independent member firms affiliated with KPMG International Cooperative (‘KPMG International’), a Swiss
entity.
118 / www.interxion.com
A further description of our responsibilities for the audit of the financial statements is included in the appendix of
this auditor’s report. This description forms part of our auditor’s report.
Amstelveen, May 27, 2019
KPMG Accountants N.V.
H.A.P.M. van Meel RA
Appendix:
Description of our responsibilities for the audit of the financial
statements
KPMG Accountants N.V., registered with the trade register in the Netherlands under number 33263683,
is a member firm of the KPMG network of independent member firms affiliated with KPMG International Cooperative (‘KPMG International’), a Swiss entity.
www.interxion.com / 119
Appendix
We have exercised professional judgement and have maintained professional scepticism throughout the audit, in accordance with Dutch Standards on Auditing, ethical
requirements and independence requirements. Our audit included among others:
| — |
identifying and assessing the risks of material misstatement of the financial statements, whether due to fraud or error,
designing and performing audit procedures responsive to those risks, and obtaining audit evidence that is sufficient and appropriate to provide a basis for our opinion. The risk of not detecting a material misstatement resulting from fraud is higher
than the risk resulting from error, as fraud may involve collusion, forgery, intentional omissions, misrepresentations, or the override of internal control; |
| — |
obtaining an understanding of internal control relevant to the audit in order to design audit procedures that are
appropriate in the circumstances, but not for the purpose of expressing an opinion on the effectiveness of the company’s internal control; |
| — |
evaluating the appropriateness of accounting policies used and the reasonableness of accounting estimates and related
disclosures made by the Board of Directors of InterXion Holding N.V.; |
| — |
concluding on the appropriateness of the Board of Directors of InterXion Holding N.V.’s use of the going concern
basis of accounting, and based on the audit evidence obtained, whether a material uncertainty exists related to events or conditions that may cast significant doubt on the company’s ability to continue as a going concern. If we conclude that a
material uncertainty exists, we are required to draw attention in our auditor’s report to the related disclosures in the financial statements or, if such disclosures are inadequate, to modify our opinion. Our conclusions are based on the audit
evidence obtained up to the date of our auditor’s report. However, future events or conditions may cause a company to cease to continue as a going concern; |
| — |
evaluating the overall presentation, structure and content of the financial statements, including the disclosures; and
|
| — |
evaluating whether the financial statements represent the underlying transactions and events in a manner that achieves
fair presentation. |
Because we are ultimately responsible for the opinion, we are also responsible for directing, supervising and performing the
group audit. In this respect we have determined the nature and extent of the audit procedures to be carried out for group components. Decisive were the size and/or the risk profile of the group components or operations. On this basis, we selected
group components for which an audit or review had to be carried out on the complete set of financial information or specific items.
We communicate with the Audit
Committee regarding, among other matters, the planned scope and timing of the audit and significant audit findings, including any significant findings in internal control that we identify during our audit.
KPMG
Accountants N.V., registered with the trade register in the Netherlands under number 33263683, is a member firm of the KPMG network of independent member firms affiliated with KPMG International Cooperative (‘KPMG International’), a Swiss
entity.
120 / www.interxion.com
We provide the Audit Committee with a statement that we have complied with relevant ethical requirements regarding
independence, and to communicate with them all relationships and other matters that may reasonably be thought to bear on our independence, and where applicable, related safeguards.
From the matters communicated with the Audit Committee, we determine the key audit matters: those matters that were of most significance in the audit of the financial
statements. We describe these matters in our auditor’s report unless law or regulation precludes public disclosure about the matter or when, in extremely rare circumstances, not communicating the matter is in the public interest.
KPMG Accountants N.V., registered with the trade register in the Netherlands under number 33263683,
is a member firm of the KPMG network of independent member firms affiliated with KPMG International Cooperative (‘KPMG International’), a Swiss entity.
www.interxion.com / 121

122 / www.interxion.com
|
|
|
| FIND OUT MORE
You can keep up with the latest news and publications from us via our website at www.interxion.com.
Our Locations
We operate over 51 state-of-the-art facilities across Europe. 20 years of experience means we guarantee consistent design and operational excellence across our footprint, allowing
our customers to easily scale their services across Europe. Our data center campuses are gateways to emerging markets and landing stations for major continental subsea cables.
Learn more about our locations at
http://www.interxion.com/Locations/ |
|

|
|
|
|
|
|
|
|
| You can also follow us on social media |
|
|
|
|
|
|
|
|

|
|
http://www.linkedin.com/company/interxion |
|

|
|
http://www.youtube.com/user/interxiontube |
|
|
|
|

|
|
https://twitter.com/interxion |
|

|
|
https://www.facebook.com/Interxion |
|
|
|
| Contact Us |
|
|
|
|
| INTERNATIONAL HEADQUARTERS |
|
EUROPEAN CUSTOMER SERVICE CENTRE (ECSC) |
|
|
| Main: + 44 207 375 7070 |
|
Toll free from Europe: + 800 00 999 222 |
| Fax: + 44 207 375 7059 |
|
Toll free from the US: 185 55 999 222 |
| Email: hq.info@interxion.com |
|
Email: customer.services@interxion.com |
www.interxion.com / 123
Definitions
| 1. |
We define Adjusted EBITDA as Operating income adjusted for the following items, which may occur in
any period, and which management believes are not representative of our operating performance: |
| |
∎ |
|
Depreciation and amortization – property, plant and equipment and intangible assets (except goodwill) are depreciated and amortized on a straight-line basis over the estimated useful life. We
believe that these costs do not represent our operating performance. |
| |
∎ |
|
Share-based payments – represents primarily the fair value at the date of grant of employee equity awards, which is recognized as an expense over the vesting period. In certain cases, the fair
value is redetermined for market conditions at each reporting date, until the final date of grant is achieved. We believe that this expense does not represent our operating performance. |
| |
∎ |
|
Income or expense related to the evaluation and execution of potential mergers or acquisitions (“M&A”) – under IFRS, gains and losses associated with M&A activity are
recognized in the period in which such gains or losses are incurred. We exclude these effects because we believe they are not reflective of our ongoing operating performance. |
| |
∎ |
|
Adjustments related to terminated and unused data center sites – these gains and losses relate to historical leases entered into for certain brownfield sites, with the intention of
developing data centers, which were never developed and for which management has no intention of developing into data centers. We believe the impact of gains and losses related to unused data centers are not reflective of our business activities and
our ongoing operating performance. |
In certain circumstances, we may also adjust for other items that
management believes are not representative of our current ongoing performance. Examples include: adjustments for the cumulative effect of a change in accounting principle or estimate, impairment losses, litigation gains and losses or windfall gains
and losses.
| 2. |
We define Recurring revenue as revenue incurred from colocation and associated power charges,
office space, amortized set-up fees, cross-connects and certain recurring managed services (but excluding any ad hoc managed services) provided by us directly or through third parties, excluding rents received
for the sublease of unused sites. |
We believe Adjusted EBITDA and Recurring revenue provide useful
supplemental information to investors regarding our ongoing operational performance. These measures help us, and our investors, evaluate the ongoing operating performance of the business after removing the impact of our capital structure (primarily
interest expense) and our asset base (primarily depreciation and amortization). Management believes that the presentation of Adjusted EBITDA, when combined with the primary IFRS presentation of net income, provides a more complete analysis of our
operating performance. Management also believes the use of Adjusted EBITDA facilitates comparisons between us and other data center operators (including other data center operators that are REITs) and other infrastructure-based businesses. Adjusted
EBITDA is also a relevant measure used in the financial covenants of our Revolving Facility Agreement and our Senior Notes.
| 3. |
Capital expenditure, including intangible assets, represent payments to acquire property, plant,
and equipment and intangible assets, as recorded in the consolidated statement of cash flows as “Purchase of property, plant and equipment” and “Purchase of intangible assets”, respectively. |
| 4. |
“Other general administrative costs” represents general and administrative costs
excluding depreciation, amortization, impairments, share based payments, M&A transaction costs, and increase/(decrease) in provision for onerous lease contracts. |
| 5. |
We define Adjusted net income as net income adjusted for the following items and the related
income tax effect, which may occur in any period, and which management believes are not reflective of our operating performance: |
| |
∎ |
|
Income or expense related to the evaluation and execution of potential mergers or acquisitions (“M&A”) – under IFRS, gains and losses associated with M&A activity are
recognized in the period in which such gains or losses are incurred. We exclude these effects because we believe they are not reflective of our ongoing operating performance. |
| |
∎ |
|
Adjustments related to provisions – these adjustments are made for adjustments in provisions that are not reflective of the ongoing operating performance of Interxion. These adjustments may
include changes in provisions for onerous lease contracts. |
| |
∎ |
|
Adjustments related to capitalized interest – under IFRS, we are required to calculate and capitalize interest allocated to the investment in data centers and exclude it from net income. We
believe that reversing the impact of capitalized interest provides information about the impact of the total interest costs and facilitates comparisons with other data center operators. |
In certain circumstances, we may also adjust for other items that management believes are not representative of our current on-going performance. Examples include: adjustments for the cumulative effect of a change in accounting principle or estimate, impairment losses, litigation gains and losses or windfall gains and losses.
Management believes that the exclusion of certain items listed above provides useful supplemental information to net income to
aid investors in evaluating the operating performance of our business and comparing our operating performance with other data center operators and infrastructure companies. We believe the presentation of Adjusted net income, when combined with net
income prepared in accordance with IFRS, is beneficial to a complete understanding of our performance. A reconciliation from reported net income to Adjusted net income is provided in the notes included in this Annual Report.
Adjusted basic earnings per share and Adjusted diluted earnings per share amounts are determined on Adjusted net income.
| 6. |
Cash generated from operations is defined as net cash flow from operating activities, excluding
interest and corporate income tax payments and receipts. Management believe that the exclusion of these items provides useful supplemental information to net cash flows from operating activities, to aid investors in evaluating the cash generating
performance of our business. |
124 / www.interxion.com