
Managed distribution plan
The fund has adopted a managed
distribution plan (Plan). Under the Plan, the fund makes quarterly distributions of an amount equal to $0.2900 per share. The fund may make additional distributions: (i) for purposes of not incurring federal income
tax at the fund level of investment company taxable income and net capital gain, if any, not included in such regular distributions; and (ii) for purposes of not incurring federal excise tax on ordinary income and
capital gain net income, if any, not included in such regular distributions.
The Plan provides that the Board of
Trustees of the fund may amend the terms of the Plan or terminate the Plan at any time without prior notice to the fund’s shareholders. The Plan is subject to periodic review by the fund’s Board of
Trustees.
You should not draw any conclusions
about the fund’s investment performance from the amount of the fund’s distributions or from the terms of the fund’s Plan. The fund’s total return at net asset value (NAV) is presented in the
"Financial highlights" section.
With each distribution that does not
consist solely of net income, the fund will issue a notice to shareholders and an accompanying press release that will provide detailed information regarding the amount and composition of the distribution and other
related information. The amounts and sources of distributions reported in the notice to shareholders are only estimates and are not provided for tax reporting purposes. The actual amounts and sources of the amounts
for tax reporting purposes will depend upon the fund’s investment experience during the remainder of its fiscal year and may be subject to changes based on tax regulations. The fund will send you a Form 1099-DIV
for the calendar year that will tell you how to report these distributions for federal income-tax purposes. The fund may, at times, distribute more than its net investment income and net realized capital gains;
therefore, a portion of your distribution may result in a return of capital. A return of capital may occur, for example, when some or all of the money that you invested in the fund is paid back to you. A return of
capital does not necessarily reflect the fund’s investment performance and should not be confused with "yield" or "income".
A message to shareholders

John Hancock
Hedged Equity & Income Fund
Table of contents
| 1 | JOHN HANCOCK HEDGED EQUITY & INCOME FUND | ANNUAL REPORT |
Your fund at a glance
INVESTMENT OBJECTIVE
The fund seeks to provide total
return with a focus on current income and gains and also consisting of long-term capital appreciation.
AVERAGE ANNUAL TOTAL RETURNS AS
OF 12/31/2021 (%)
The MSCI All Country World Index
(ACWI) tracks the performance of publicly traded large- and mid-cap stocks of companies in both developed and emerging markets.
It is not possible to invest
directly in an index. Index figures do not reflect expenses, which would result in lower returns.
The performance data contained
within this material represents past performance, which does not guarantee future results.
Investment returns and principal
value will fluctuate and a shareholder may sustain losses. Further, the fund’s performance at net asset value (NAV) is different from the fund’s performance at closing market price because the closing
market price is subject to the dynamics of secondary market trading. Market risk may increase when shares are purchased at a premium to NAV or sold at a discount to NAV. Current month-end performance may be higher or
lower than the performance cited. The fund’s most recent performance can be found at jhinvestments.com or by calling 800-852-0218.
| ANNUAL REPORT | JOHN HANCOCK HEDGED EQUITY & INCOME FUND | 2 |
PERFORMANCE HIGHLIGHTS OVER THE
LAST TWELVE MONTHS
Vaccine rollouts
and improving growth supported equities
Markets advanced
amid the accelerating global rollout of COVID-19 vaccines as well as a favorable outlook for global economic growth and solid corporate earnings.
The fund’s
equity strategy contributed to relative results
The fund’s
equity strategy contributed to performance; however, the fund underperformed its comparative index, the MSCI All Country World Index.
The fund’s
supporting strategies hurt performance
The premium
income generated by the fund’s options and beta hedge strategies were unable to offset losses on calls given a rising U.S. equity market.
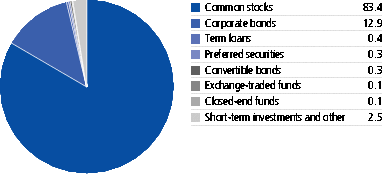
PORTFOLIO COMPOSITION AS OF
12/31/2021 (% of net assets)
| 3 | JOHN HANCOCK HEDGED EQUITY & INCOME FUND | ANNUAL REPORT |
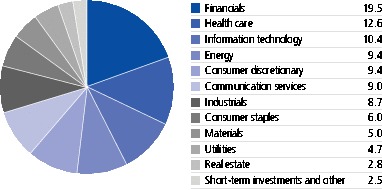
SECTOR COMPOSITION AS OF 12/31/21
(% of net assets)
| ANNUAL REPORT | JOHN HANCOCK HEDGED EQUITY & INCOME FUND | 4 |
Manager’s discussion of fund performance
What factors affected global equity
markets during the 12 months ended December 31, 2021?
Global equities advanced, as
measured by the fund’s comparative index, the MSCI All Country World Index, amid the accelerating global rollout of COVID-19 vaccines, a favorable outlook for global economic growth, strong corporate earnings,
and substantial support from governments and central banks. The combination of surging commodity prices, pent-up demand, global supply chain disruptions, and stimulus-powered economic growth drove inflation higher, a
situation worsened by a resurgence of COVID-19 cases in the second half of the year that further snarled production and transportation of goods. In response to persistent inflation, many central bank policymakers in
developed markets began unwinding their stimulus measures and setting a course for higher interest rates.
The fund underperformed its
comparative index for the period. What led to these results?
Underperformance was driven by the
fund’s call option and beta hedge strategies during a period of a rising equity market. Within the equity strategy, stock selection in the utilities, consumer discretionary, and industrials sectors, as well as
positive allocation effects from an underweight in consumer discretionary and overweights to energy and financials, contributed to relative performance. These were slightly
| 5 | JOHN HANCOCK HEDGED EQUITY & INCOME FUND | ANNUAL REPORT |
offset by an underweight allocation to the
information technology (IT) sector as well as stock selection in the IT and materials sectors.
The fund’s options and
hedging strategies are designed to generate income and reduce equity exposure through selling futures on the S&P 500 Index, MSCI EAFE Index, FTSE Index, and STOXX 50 Index. Although the fund received premiums from
writing call options during the period, the premiums collected weren’t enough to offset the losses on the calls given the rising U.S. equity market indexes during the year.
Which holdings had the most
significant positive and negative impacts?
The top relative contributors were
global pharmaceuticals and healthcare products maker Pfizer, Inc. and a lack of exposure to Alibaba Group Holding, Ltd., a Chinese e-commerce and payments company. The top relative detractors included underweight
exposures to smartphone designer and digital media services provider Apple, Inc. and software maker Microsoft Corp. We sold both holdings prior to period end.
How was the fund positioned at the
end of the period?
At the end of the period, the
fund’s largest overweights were in financials and energy, while the largest underweights were in IT and consumer discretionary. From a regional perspective, the fund ended the period most overweight Europe and
most underweight North America. We continue to maintain allocations across differentiated fundamental and systematic investment styles as we seek to diversify the portfolio’s income generation.
MANAGED BY

The views expressed in
this report are exclusively those of Gregg R. Thomas, CFA, and Roberto J. Isch, CFA, Wellington Management Company LLP, and are subject to change. They are not meant as investment advice. Please note that the holdings
discussed in this report may not have been held by the fund for the entire period. Portfolio composition is subject to review in accordance with the fund’s investment strategy and may vary in the future. Current
and future portfolio holdings are subject to risk.
| ANNUAL REPORT | JOHN HANCOCK HEDGED EQUITY & INCOME FUND | 6 |
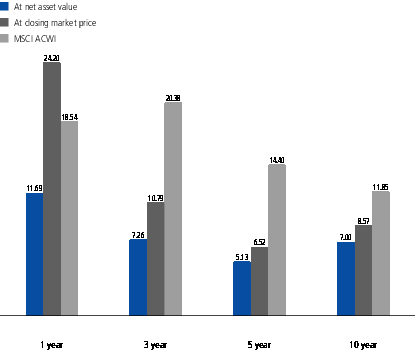
A look at performance
TOTAL RETURNS FOR THE PERIOD
ENDED DECEMBER 31, 2021
| Average annual total returns (%) | Cumulative total returns (%) | ||||
| 1-Year | 5-Year | 10-Year | 5-year | 10-Year | |
| At Net asset value | 11.69 | 5.13 | 7.00 | 28.44 | 96.72 |
| At Market price | 24.20 | 6.52 | 8.57 | 37.17 | 127.51 |
| MSCI ACWI | 18.54 | 14.40 | 11.85 | 95.92 | 206.49 |
Performance figures assume all
distributions have been reinvested.
The returns reflect past results
and should not be considered indicative of future performance. Investment returns and principal value will fluctuate and a shareholder may sustain losses. Further, the fund’s performance at net asset value (NAV)
is different from the fund’s performance at closing market price because the closing market price is subject to the dynamics of secondary market trading. Market risk may be augmented when shares are purchased at
a premium to NAV or sold at a discount to NAV. Current month-end performance may be higher or lower than the performance cited. The fund’s most recent performance can be found at jhinvestments.com or by calling
800-852-0218.
The performance table above and
the chart on the next page do not reflect the deduction of taxes that a shareholder would pay on fund distributions or the sale of fund shares. The fund’s performance results reflect any applicable fee waivers
or expense reductions, without which the expenses would increase and results would have been less favorable.
| 7 | JOHN HANCOCK HEDGED EQUITY & INCOME FUND | ANNUAL REPORT |
This chart shows what happened to a
hypothetical $10,000 investment in John Hancock Hedged Equity & Income Fund for the periods indicated, assuming all distributions were reinvested. For comparison, we’ve shown the same investment in the MSCI
ACWI.
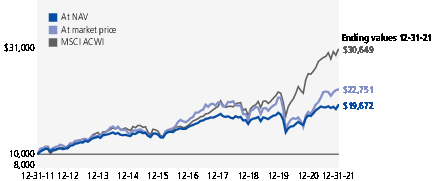
The MSCI All Country World Index
(ACWI) tracks the performance of publicly traded large- and mid-cap stocks of companies in both developed and emerging markets.
It is not possible to invest
directly in an index. Index figures do not reflect expenses, which would result in lower returns.
The returns reflect past results
and should not be considered indicative of future performance.
| ANNUAL REPORT | JOHN HANCOCK HEDGED EQUITY & INCOME FUND | 8 |
Fund’s investments
AS OF
12-31-21
| Shares | Value | ||||
| Common stocks 83.4% | $132,832,872 | ||||
| (Cost $124,879,524) | |||||
| Communication services 6.9% | 10,976,439 | ||||
| Diversified telecommunication services 3.4% | |||||
| AT&T, Inc. | 21,191 | 521,299 | |||
| BT Group PLC | 49,792 | 114,546 | |||
| Frontier Communications Parent, Inc. (A) | 1,784 | 52,610 | |||
| Hellenic Telecommunications Organization SA | 55,379 | 1,023,079 | |||
| Koninklijke KPN NV | 275,268 | 853,503 | |||
| KT Corp. | 4,912 | 126,003 | |||
| Magyar Telekom Telecommunications PLC | 25,587 | 32,516 | |||
| Orange SA | 10,330 | 110,347 | |||
| Swisscom AG | 333 | 187,853 | |||
| Telefonica Brasil SA | 6,913 | 60,012 | |||
| Telenor ASA | 24,445 | 384,252 | |||
| Telkom Indonesia Persero Tbk PT | 137,641 | 39,283 | |||
| Turk Telekomunikasyon AS | 77,401 | 56,310 | |||
| Verizon Communications, Inc. | 35,091 | 1,823,328 | |||
| Entertainment 0.1% | |||||
| DeNA Company, Ltd. | 4,680 | 72,067 | |||
| Nintendo Company, Ltd. | 385 | 180,125 | |||
| Interactive media and services 0.0% | |||||
| Gree, Inc. | 1,460 | 10,734 | |||
| Media 2.4% | |||||
| Comcast Corp., Class A | 23,107 | 1,162,975 | |||
| Criteo SA, ADR (A) | 831 | 32,301 | |||
| Dentsu Group, Inc. | 19,527 | 695,029 | |||
| Fuji Media Holdings, Inc. | 3,145 | 30,263 | |||
| Metropole Television SA | 3,785 | 74,065 | |||
| Nippon Television Holdings, Inc. | 5,910 | 59,967 | |||
| Omnicom Group, Inc. | 5,050 | 370,014 | |||
| RTL Group SA | 1,843 | 97,682 | |||
| Television Francaise 1 | 9,933 | 98,698 | |||
| The Interpublic Group of Companies, Inc. | 22,548 | 844,423 | |||
| TV Asahi Holdings Corp. | 3,930 | 48,920 | |||
| ViacomCBS, Inc., Class B | 1,083 | 32,685 | |||
| WPP PLC | 13,772 | 209,716 | |||
| Zee Entertainment Enterprises, Ltd. | 9,846 | 42,267 | |||
| Wireless telecommunication services 1.0% | |||||
| America Movil SAB de CV, Series L, ADR | 4,052 | 85,538 | |||
| KDDI Corp. | 28,406 | 830,697 | |||
| MTN Group, Ltd. (A) | 3,401 | 36,455 | |||
| 9 | JOHN HANCOCK HEDGED EQUITY & INCOME FUND | ANNUAL REPORT | SEE NOTES TO FINANCIAL STATEMENTS |
| Shares | Value | ||||
| Communication services (continued) | |||||
| Wireless telecommunication services (continued) | |||||
| SK Telecom Company, Ltd. | 2,205 | $107,155 | |||
| SoftBank Corp. | 29,453 | 372,008 | |||
| Turkcell Iletisim Hizmetleri AS | 30,068 | 41,836 | |||
| VEON, Ltd., ADR (A) | 32,677 | 55,878 | |||
| Consumer discretionary 6.6% | 10,605,918 | ||||
| Auto components 0.8% | |||||
| Bridgestone Corp. | 15,646 | 671,724 | |||
| Continental AG (A) | 895 | 94,034 | |||
| Exedy Corp. | 1,825 | 26,420 | |||
| Hankook Tire & Technology Company, Ltd. (A) | 1,625 | 54,287 | |||
| Hyundai Mobis Company, Ltd. | 144 | 30,781 | |||
| NOK Corp. | 6,415 | 69,875 | |||
| Sumitomo Electric Industries, Ltd. | 8,840 | 115,371 | |||
| Sumitomo Riko Company, Ltd. | 3,060 | 15,803 | |||
| Tachi-S Company, Ltd. | 3,170 | 34,844 | |||
| Tokai Rika Company, Ltd. | 4,750 | 64,017 | |||
| Toyota Boshoku Corp. | 1,000 | 19,620 | |||
| TS Tech Company, Ltd. | 5,100 | 62,778 | |||
| Unipres Corp. | 5,000 | 34,955 | |||
| Automobiles 2.3% | |||||
| Astra International Tbk PT | 182,546 | 73,064 | |||
| Daimler AG | 1,624 | 124,080 | |||
| Dongfeng Motor Group Company, Ltd., H Shares | 113,426 | 94,291 | |||
| Hero MotoCorp, Ltd. | 5,095 | 168,344 | |||
| Honda Motor Company, Ltd. | 8,670 | 246,668 | |||
| Isuzu Motors, Ltd. | 69,632 | 866,673 | |||
| Kia Corp. (A) | 9,602 | 662,664 | |||
| Mitsubishi Motors Corp. (A) | 9,220 | 25,692 | |||
| Nissan Motor Company, Ltd. (A) | 19,500 | 93,923 | |||
| Renault SA (A) | 1,947 | 67,542 | |||
| Subaru Corp. | 6,190 | 110,602 | |||
| Toyota Motor Corp. | 22,231 | 410,886 | |||
| XPeng, Inc., ADR (A) | 822 | 41,371 | |||
| Yamaha Motor Company, Ltd. | 25,239 | 606,218 | |||
| Diversified consumer services 0.0% | |||||
| Benesse Holdings, Inc. | 420 | 8,248 | |||
| Hotels, restaurants and leisure 0.9% | |||||
| Darden Restaurants, Inc. | 1,770 | 266,633 | |||
| McDonald’s Corp. | 1,103 | 295,681 | |||
| OPAP SA | 18,758 | 265,678 | |||
| Sands China, Ltd. (A) | 203,200 | 471,586 | |||
| Starbucks Corp. | 1,663 | 194,521 | |||
| SEE NOTES TO FINANCIAL STATEMENTS | ANNUAL REPORT | JOHN HANCOCK HEDGED EQUITY & INCOME FUND | 10 |
| Shares | Value | ||||
| Consumer discretionary (continued) | |||||
| Household durables 0.4% | |||||
| Coway Company, Ltd. (A) | 1,124 | $70,420 | |||
| Garmin, Ltd. | 3,259 | 443,778 | |||
| Nikon Corp. | 6,345 | 68,350 | |||
| Tamron Company, Ltd. | 780 | 19,352 | |||
| Leisure products 0.2% | |||||
| Bandai Namco Holdings, Inc. | 2,394 | 187,183 | |||
| Hasbro, Inc. | 982 | 99,948 | |||
| Multiline retail 0.1% | |||||
| Marks & Spencer Group PLC (A) | 13,822 | 43,481 | |||
| Target Corp. | 703 | 162,702 | |||
| Specialty retail 1.9% | |||||
| CECONOMY AG (A) | 10,054 | 43,254 | |||
| Chow Tai Fook Jewellery Group, Ltd. (A) | 331,888 | 598,022 | |||
| Industria de Diseno Textil SA | 17,881 | 576,663 | |||
| Kingfisher PLC | 15,628 | 71,885 | |||
| Shimamura Company, Ltd. | 1,070 | 89,795 | |||
| The Home Depot, Inc. | 3,230 | 1,340,482 | |||
| USS Company, Ltd. | 19,396 | 303,038 | |||
| Xebio Holdings Company, Ltd. | 5,075 | 40,702 | |||
| Textiles, apparel and luxury goods 0.0% | |||||
| Sanyo Shokai, Ltd. (A) | 1,860 | 14,369 | |||
| Yue Yuen Industrial Holdings, Ltd. (A) | 26,058 | 43,620 | |||
| Consumer staples 5.5% | 8,721,553 | ||||
| Beverages 0.5% | |||||
| Anadolu Efes Biracilik Ve Malt Sanayii AS | 21,894 | 49,039 | |||
| Coca-Cola Icecek AS | 6,665 | 44,706 | |||
| Embotelladora Andina SA, Series B, ADR | 3,918 | 50,503 | |||
| PepsiCo, Inc. | 1,736 | 301,561 | |||
| The Coca-Cola Company | 5,119 | 303,096 | |||
| Food and staples retailing 0.1% | |||||
| Carrefour SA | 4,836 | 88,661 | |||
| J Sainsbury PLC | 30,371 | 113,526 | |||
| METRO AG | 2,069 | 21,705 | |||
| Food products 1.8% | |||||
| Astral Foods, Ltd. | 3,471 | 37,601 | |||
| General Mills, Inc. | 3,432 | 231,248 | |||
| Kellogg Company | 14,820 | 954,704 | |||
| Mondelez International, Inc., Class A | 997 | 66,111 | |||
| Nestle SA | 8,410 | 1,174,181 | |||
| Perusahaan Perkebunan London Sumatra Indonesia Tbk PT | 104,784 | 8,726 | |||
| 11 | JOHN HANCOCK HEDGED EQUITY & INCOME FUND | ANNUAL REPORT | SEE NOTES TO FINANCIAL STATEMENTS |
| Shares | Value | ||||
| Consumer staples (continued) | |||||
| Food products (continued) | |||||
| The Hershey Company | 427 | $82,612 | |||
| The J.M. Smucker Company | 499 | 67,774 | |||
| The Kraft Heinz Company | 4,156 | 149,200 | |||
| Ulker Biskuvi Sanayi AS | 22,594 | 29,795 | |||
| Household products 1.1% | |||||
| Colgate-Palmolive Company | 1,953 | 166,669 | |||
| Kimberly-Clark Corp. | 1,291 | 184,510 | |||
| The Clorox Company | 621 | 108,278 | |||
| The Procter & Gamble Company | 7,724 | 1,263,492 | |||
| Unilever Indonesia Tbk PT | 376,852 | 108,677 | |||
| Personal products 0.1% | |||||
| Unilever PLC | 1,732 | 92,916 | |||
| Tobacco 1.9% | |||||
| Altria Group, Inc. | 12,997 | 615,928 | |||
| British American Tobacco PLC | 7,631 | 283,352 | |||
| KT&G Corp. | 2,627 | 174,532 | |||
| Philip Morris International, Inc. | 20,510 | 1,948,450 | |||
| Energy 7.7% | 12,257,291 | ||||
| Energy equipment and services 0.1% | |||||
| Fugro NV (A) | 3,899 | 30,596 | |||
| Saipem SpA (A) | 16,722 | 35,061 | |||
| Trican Well Service, Ltd. (A) | 16,508 | 36,149 | |||
| Oil, gas and consumable fuels 7.6% | |||||
| Adaro Energy Tbk PT | 5,902,380 | 936,038 | |||
| ARC Resources, Ltd. | 4,777 | 43,429 | |||
| BP PLC | 65,900 | 295,273 | |||
| Cameco Corp. | 3,629 | 79,124 | |||
| Canadian Natural Resources, Ltd. | 15,303 | 646,623 | |||
| Chevron Corp. | 2,103 | 246,787 | |||
| Coal India, Ltd. | 102,617 | 201,449 | |||
| Devon Energy Corp. | 15,186 | 668,943 | |||
| Enbridge, Inc. | 31,403 | 1,226,627 | |||
| Eni SpA | 15,027 | 208,842 | |||
| EOG Resources, Inc. | 7,192 | 638,865 | |||
| Exxon Mobil Corp. | 7,090 | 433,837 | |||
| Foresight Energy LLC (A) | 191 | 2,477 | |||
| Galp Energia SGPS SA | 3,004 | 29,148 | |||
| Gazprom PJSC, ADR | 17,587 | 161,625 | |||
| Inpex Corp. | 92,110 | 800,951 | |||
| Japan Petroleum Exploration Company, Ltd. | 2,105 | 45,838 | |||
| LUKOIL PJSC, ADR | 339 | 30,442 | |||
| SEE NOTES TO FINANCIAL STATEMENTS | ANNUAL REPORT | JOHN HANCOCK HEDGED EQUITY & INCOME FUND | 12 |
| Shares | Value | ||||
| Energy (continued) | |||||
| Oil, gas and consumable fuels (continued) | |||||
| Lundin Energy AB | 17,207 | $615,714 | |||
| Oil & Natural Gas Corp., Ltd. | 36,403 | 69,538 | |||
| Ovintiv, Inc. | 1,285 | 43,235 | |||
| Pioneer Natural Resources Company | 3,651 | 664,044 | |||
| Royal Dutch Shell PLC, B Shares | 19,036 | 417,965 | |||
| Suncor Energy, Inc. | 25,804 | 645,635 | |||
| Surgutneftegas PJSC, ADR (London Stock Exchange) | 14,506 | 77,583 | |||
| TC Energy Corp. | 23,924 | 1,112,652 | |||
| The Williams Companies, Inc. | 9,820 | 255,713 | |||
| TotalEnergies SE | 28,596 | 1,455,542 | |||
| Tourmaline Oil Corp. | 1,517 | 48,978 | |||
| Ultrapar Participacoes SA | 13,893 | 36,837 | |||
| YPF SA, ADR (A) | 4,118 | 15,731 | |||
| Financials 18.0% | 28,616,066 | ||||
| Banks 8.7% | |||||
| ABN AMRO Bank NV (B) | 7,579 | 111,409 | |||
| AIB Group PLC (A) | 38,558 | 93,956 | |||
| Bank Mandiri Persero Tbk PT | 214,809 | 106,068 | |||
| Bank of America Corp. | 40,849 | 1,817,372 | |||
| Bank of Ireland Group PLC (A) | 15,541 | 88,016 | |||
| Bank of Montreal | 5,853 | 630,159 | |||
| BNP Paribas SA | 2,912 | 201,339 | |||
| BPER Banca | 29,030 | 59,997 | |||
| CaixaBank SA | 54,071 | 147,702 | |||
| Canara Bank (A) | 17,210 | 46,016 | |||
| CIMB Group Holdings BHD | 65,944 | 86,260 | |||
| Dah Sing Financial Holdings, Ltd. | 11,819 | 35,797 | |||
| DGB Financial Group, Inc. (A) | 8,439 | 66,498 | |||
| DNB Bank ASA | 44,997 | 1,029,249 | |||
| Erste Group Bank AG | 1,921 | 90,057 | |||
| Huntington Bancshares, Inc. | 9,211 | 142,034 | |||
| Industrial Bank of Korea | 4,034 | 34,897 | |||
| ING Groep NV | 12,165 | 169,130 | |||
| Kasikornbank PCL | 17,152 | 72,620 | |||
| Kasikornbank PCL, NVDR | 14,682 | 62,163 | |||
| KB Financial Group, Inc. | 3,429 | 158,572 | |||
| Mitsubishi UFJ Financial Group, Inc. | 185,189 | 1,007,849 | |||
| Resona Holdings, Inc. | 34,860 | 135,472 | |||
| Royal Bank of Canada | 16,217 | 1,721,121 | |||
| Sberbank of Russia PJSC, ADR | 3,353 | 52,810 | |||
| Shinhan Financial Group Company, Ltd. | 4,445 | 137,346 | |||
| Skandinaviska Enskilda Banken AB, A Shares | 41,245 | 572,627 | |||
| 13 | JOHN HANCOCK HEDGED EQUITY & INCOME FUND | ANNUAL REPORT | SEE NOTES TO FINANCIAL STATEMENTS |
| Shares | Value | ||||
| Financials (continued) | |||||
| Banks (continued) | |||||
| Societe Generale SA | 5,001 | $171,878 | |||
| Standard Chartered PLC | 125,022 | 760,232 | |||
| Sumitomo Mitsui Financial Group, Inc. | 5,230 | 178,590 | |||
| Sumitomo Mitsui Trust Holdings, Inc. | 3,850 | 128,738 | |||
| The Bank of Nova Scotia | 31,375 | 2,221,140 | |||
| The Tochigi Bank, Ltd. | 9,810 | 19,691 | |||
| The Toronto-Dominion Bank | 8,377 | 642,240 | |||
| Truist Financial Corp. | 6,858 | 401,536 | |||
| Unicaja Banco SA (B) | 63,988 | 62,954 | |||
| UniCredit SpA | 13,955 | 214,507 | |||
| Woori Financial Group, Inc. | 12,623 | 134,616 | |||
| Capital markets 2.9% | |||||
| BlackRock, Inc. | 173 | 158,392 | |||
| CME Group, Inc. | 3,038 | 694,061 | |||
| GAM Holding AG (A) | 3,875 | 5,772 | |||
| Hargreaves Lansdown PLC | 1,101 | 20,232 | |||
| Ichiyoshi Securities Company, Ltd. | 4,250 | 24,363 | |||
| IGM Financial, Inc. | 18,145 | 654,393 | |||
| Intercontinental Exchange, Inc. | 493 | 67,428 | |||
| Julius Baer Group, Ltd. | 513 | 34,305 | |||
| Magellan Financial Group, Ltd. | 801 | 12,377 | |||
| MarketAxess Holdings, Inc. | 65 | 26,733 | |||
| Meritz Securities Company, Ltd. (A) | 154,292 | 668,037 | |||
| Nomura Holdings, Inc. | 10,073 | 43,874 | |||
| Partners Group Holding AG | 28 | 46,223 | |||
| T. Rowe Price Group, Inc. | 2,021 | 397,409 | |||
| The Blackstone Group, Inc. | 2,162 | 279,741 | |||
| UBS Group AG | 83,566 | 1,499,950 | |||
| Consumer finance 0.0% | |||||
| Provident Financial PLC (A) | 12,942 | 63,108 | |||
| Diversified financial services 0.1% | |||||
| FirstRand, Ltd. | 24,108 | 91,975 | |||
| G-Resources Group, Ltd. (A) | 20,130 | 7,236 | |||
| Insurance 6.2% | |||||
| Admiral Group PLC | 9,783 | 418,756 | |||
| Ageas SA/NV | 2,058 | 106,578 | |||
| Allianz SE | 904 | 213,216 | |||
| Arthur J. Gallagher & Company | 469 | 79,575 | |||
| Assicurazioni Generali SpA | 26,792 | 566,241 | |||
| Aviva PLC | 28,618 | 159,522 | |||
| AXA SA | 73,360 | 2,183,433 | |||
| Caixa Seguridade Participacoes S/A | 32,753 | 48,923 | |||
| SEE NOTES TO FINANCIAL STATEMENTS | ANNUAL REPORT | JOHN HANCOCK HEDGED EQUITY & INCOME FUND | 14 |
| Shares | Value | ||||
| Financials (continued) | |||||
| Insurance (continued) | |||||
| China Reinsurance Group Corp., H Shares | 691,754 | $66,566 | |||
| Dai-ichi Life Holdings, Inc. | 6,365 | 128,382 | |||
| DB Insurance Company, Ltd. (A) | 14,110 | 640,631 | |||
| Gjensidige Forsikring ASA | 2,078 | 50,414 | |||
| MS&AD Insurance Group Holdings, Inc. | 1,960 | 60,353 | |||
| Old Mutual, Ltd. | 93,155 | 76,521 | |||
| Phoenix Group Holdings PLC | 39,951 | 353,647 | |||
| Power Corp. of Canada | 19,990 | 660,565 | |||
| Sanlam, Ltd. | 35,789 | 133,375 | |||
| SCOR SE | 2,858 | 89,222 | |||
| Swiss Re AG | 2,115 | 208,779 | |||
| T&D Holdings, Inc. | 12,615 | 161,166 | |||
| The Progressive Corp. | 15,538 | 1,594,976 | |||
| Tokio Marine Holdings, Inc. | 20,700 | 1,152,361 | |||
| Tongyang Life Insurance Company, Ltd. (A) | 5,633 | 31,242 | |||
| Zurich Insurance Group AG | 1,488 | 651,862 | |||
| Mortgage real estate investment trusts 0.1% | |||||
| Annaly Capital Management, Inc. | 21,930 | 171,493 | |||
| Health care 11.2% | 17,906,449 | ||||
| Biotechnology 1.0% | |||||
| AbbVie, Inc. | 10,767 | 1,457,852 | |||
| Amgen, Inc. | 994 | 223,620 | |||
| Health care equipment and supplies 0.8% | |||||
| Abbott Laboratories | 2,127 | 299,354 | |||
| Becton, Dickinson and Company | 286 | 71,923 | |||
| Medtronic PLC | 7,659 | 792,324 | |||
| Paramount Bed Holdings Company, Ltd. | 2,570 | 43,596 | |||
| Health care providers and services 0.4% | |||||
| Alfresa Holdings Corp. | 4,680 | 62,365 | |||
| Cardinal Health, Inc. | 1,836 | 94,536 | |||
| CVS Health Corp. | 1,390 | 143,392 | |||
| Fresenius SE & Company KGaA | 3,888 | 156,272 | |||
| Netcare, Ltd. (A) | 19,585 | 19,529 | |||
| UnitedHealth Group, Inc. | 379 | 190,311 | |||
| Health care technology 0.0% | |||||
| AGFA-Gevaert NV (A) | 7,366 | 31,801 | |||
| Life sciences tools and services 0.0% | |||||
| CMIC Holdings Company, Ltd. | 1,420 | 18,898 | |||
| Pharmaceuticals 9.0% | |||||
| AstraZeneca PLC | 11,824 | 1,380,681 | |||
| Bristol-Myers Squibb Company | 14,304 | 891,854 | |||
| 15 | JOHN HANCOCK HEDGED EQUITY & INCOME FUND | ANNUAL REPORT | SEE NOTES TO FINANCIAL STATEMENTS |
| Shares | Value | ||||
| Health care (continued) | |||||
| Pharmaceuticals (continued) | |||||
| Eisai Company, Ltd. | 770 | $43,711 | |||
| Eli Lilly & Company | 571 | 157,722 | |||
| GlaxoSmithKline PLC | 217 | 4,725 | |||
| Johnson & Johnson | 16,068 | 2,748,753 | |||
| Kissei Pharmaceutical Company, Ltd. | 1,840 | 36,106 | |||
| Merck & Company, Inc. | 26,339 | 2,018,621 | |||
| Novartis AG | 20,680 | 1,817,192 | |||
| Ono Pharmaceutical Company, Ltd. | 6,230 | 154,849 | |||
| Pfizer, Inc. | 68,907 | 4,068,942 | |||
| Roche Holding AG | 1,626 | 674,564 | |||
| Sanofi | 1,140 | 114,392 | |||
| Takeda Pharmaceutical Company, Ltd. | 6,905 | 188,564 | |||
| Industrials 6.8% | 10,904,487 | ||||
| Aerospace and defense 1.8% | |||||
| Austal, Ltd. | 15,157 | 21,499 | |||
| Babcock International Group PLC (A) | 17,337 | 75,085 | |||
| BAE Systems PLC | 167,941 | 1,252,368 | |||
| Dassault Aviation SA | 791 | 85,552 | |||
| Lockheed Martin Corp. | 3,812 | 1,354,823 | |||
| Northrop Grumman Corp. | 85 | 32,901 | |||
| Air freight and logistics 0.3% | |||||
| bpost SA (A) | 2,754 | 24,038 | |||
| CH Robinson Worldwide, Inc. | 1,163 | 125,174 | |||
| PostNL NV | 12,549 | 54,565 | |||
| United Parcel Service, Inc., Class B | 1,022 | 219,055 | |||
| Airlines 0.1% | |||||
| easyJet PLC (A) | 4,953 | 37,623 | |||
| Japan Airlines Company, Ltd. (A) | 4,870 | 92,449 | |||
| Building products 0.5% | |||||
| AGC, Inc. | 13,457 | 642,882 | |||
| Cie de Saint-Gobain | 3,452 | 242,836 | |||
| Commercial services and supplies 0.2% | |||||
| Aeon Delight Company, Ltd. | 2,179 | 63,866 | |||
| Prosegur Cia de Seguridad SA | 20,161 | 52,882 | |||
| Republic Services, Inc. | 693 | 96,639 | |||
| Toppan, Inc. | 3,360 | 63,053 | |||
| Waste Management, Inc. | 603 | 100,641 | |||
| Construction and engineering 0.7% | |||||
| Chiyoda Corp. (A) | 6,515 | 19,913 | |||
| Implenia AG (A) | 1,769 | 40,237 | |||
| JGC Holdings Corp. | 10,655 | 89,009 | |||
| SEE NOTES TO FINANCIAL STATEMENTS | ANNUAL REPORT | JOHN HANCOCK HEDGED EQUITY & INCOME FUND | 16 |
| Shares | Value | ||||
| Industrials (continued) | |||||
| Construction and engineering (continued) | |||||
| Vinci SA | 9,735 | $1,028,160 | |||
| Electrical equipment 0.1% | |||||
| Cosel Company, Ltd. | 4,470 | 33,199 | |||
| Emerson Electric Company | 312 | 29,007 | |||
| Ushio, Inc. | 2,770 | 46,022 | |||
| Zumtobel Group AG | 2,577 | 22,574 | |||
| Industrial conglomerates 0.6% | |||||
| 3M Company | 1,940 | 344,602 | |||
| Alfa SAB de CV, Class A | 895,670 | 657,465 | |||
| Machinery 0.8% | |||||
| Caterpillar, Inc. | 391 | 80,835 | |||
| Daimler Truck Holding AG (A) | 812 | 29,851 | |||
| Hino Motors, Ltd. | 11,910 | 98,209 | |||
| Hisaka Works, Ltd. | 2,930 | 21,991 | |||
| Kone OYJ, B Shares | 5,859 | 420,434 | |||
| Makino Milling Machine Company, Ltd. | 1,040 | 37,218 | |||
| Mitsubishi Heavy Industries, Ltd. | 1,655 | 38,264 | |||
| OKUMA Corp. | 930 | 41,389 | |||
| PACCAR, Inc. | 2,210 | 195,055 | |||
| Stanley Black & Decker, Inc. | 349 | 65,828 | |||
| Sumitomo Heavy Industries, Ltd. | 2,860 | 69,420 | |||
| THK Company, Ltd. | 4,770 | 115,740 | |||
| Marine 0.1% | |||||
| D/S Norden A/S | 2,794 | 70,932 | |||
| Pacific Basin Shipping, Ltd. | 172,846 | 63,540 | |||
| Professional services 0.8% | |||||
| Adecco Group AG | 3,416 | 174,070 | |||
| Bureau Veritas SA | 27,838 | 924,192 | |||
| Hays PLC | 42,292 | 83,973 | |||
| Pagegroup PLC | 8,006 | 68,812 | |||
| SThree PLC | 5,643 | 35,421 | |||
| Road and rail 0.0% | |||||
| The Go-Ahead Group PLC (A) | 2,208 | 19,977 | |||
| Trading companies and distributors 0.8% | |||||
| Mitsubishi Corp. | 8,743 | 277,617 | |||
| Mitsui & Company, Ltd. | 5,071 | 120,172 | |||
| Rexel SA (A) | 2,700 | 54,682 | |||
| SIG PLC (A) | 21,698 | 13,979 | |||
| Triton International, Ltd. | 12,753 | 768,113 | |||
| Transportation infrastructure 0.0% | |||||
| Kamigumi Company, Ltd. | 3,520 | 66,654 | |||
| 17 | JOHN HANCOCK HEDGED EQUITY & INCOME FUND | ANNUAL REPORT | SEE NOTES TO FINANCIAL STATEMENTS |
| Shares | Value | ||||
| Information technology 9.6% | $15,249,113 | ||||
| Communications equipment 1.2% | |||||
| Cisco Systems, Inc. | 25,844 | 1,637,734 | |||
| Motorola Solutions, Inc. | 130 | 35,321 | |||
| Nokia OYJ (A) | 29,818 | 188,858 | |||
| Electronic equipment, instruments and components 0.3% | |||||
| Alps Alpine Company, Ltd. | 5,850 | 55,177 | |||
| Citizen Watch Company, Ltd. | 16,685 | 72,220 | |||
| Delta Electronics Thailand PCL | 1,344 | 16,638 | |||
| Enplas Corp. | 380 | 9,012 | |||
| Foxconn Technology Company, Ltd. | 26,935 | 63,076 | |||
| Hon Hai Precision Industry Company, Ltd. | 25,351 | 95,070 | |||
| Nichicon Corp. | 2,430 | 26,701 | |||
| Nippon Chemi-Con Corp. (A) | 3,450 | 53,629 | |||
| PAX Global Technology, Ltd. | 32,173 | 22,776 | |||
| IT services 1.4% | |||||
| Automatic Data Processing, Inc. | 1,101 | 271,485 | |||
| Broadridge Financial Solutions, Inc. | 1,225 | 223,955 | |||
| Fidelity National Information Services, Inc. | 930 | 101,510 | |||
| IBM Corp. | 3,439 | 459,657 | |||
| Itochu Techno-Solutions Corp. | 2,169 | 69,772 | |||
| Jack Henry & Associates, Inc. | 553 | 92,345 | |||
| Mastercard, Inc., Class A | 952 | 342,073 | |||
| Paychex, Inc. | 864 | 117,936 | |||
| Sopra Steria Group SACA | 139 | 24,945 | |||
| The Western Union Company | 5,607 | 100,029 | |||
| Visa, Inc., Class A | 1,907 | 413,266 | |||
| Semiconductors and semiconductor equipment 4.3% | |||||
| Analog Devices, Inc. | 2,412 | 423,957 | |||
| Broadcom, Inc. | 773 | 514,362 | |||
| Disco Corp. | 806 | 246,356 | |||
| Intel Corp. | 13,864 | 713,996 | |||
| KLA Corp. | 655 | 281,722 | |||
| Miraial Company, Ltd. | 2,090 | 35,012 | |||
| NVIDIA Corp. | 430 | 126,467 | |||
| QUALCOMM, Inc. | 1,965 | 359,340 | |||
| Skyworks Solutions, Inc. | 893 | 138,540 | |||
| Taiwan Semiconductor Manufacturing Company, Ltd. | 91,998 | 2,035,087 | |||
| Texas Instruments, Inc. | 10,523 | 1,983,270 | |||
| Tokyo Seimitsu Company, Ltd. | 815 | 36,099 | |||
| Software 1.1% | |||||
| Intuit, Inc. | 565 | 363,419 | |||
| The Sage Group PLC | 57,669 | 667,284 | |||
| Trend Micro, Inc. | 13,877 | 770,396 | |||
| SEE NOTES TO FINANCIAL STATEMENTS | ANNUAL REPORT | JOHN HANCOCK HEDGED EQUITY & INCOME FUND | 18 |
| Shares | Value | ||||
| Information technology (continued) | |||||
| Technology hardware, storage and peripherals 1.3% | |||||
| Canon, Inc. | 38,344 | $935,350 | |||
| Catcher Technology Company, Ltd. | 13,607 | 76,923 | |||
| HP, Inc. | 7,595 | 286,104 | |||
| Maxell, Ltd. | 3,410 | 40,588 | |||
| Quadient SA | 2,923 | 63,659 | |||
| Samsung Electronics Company, Ltd. | 10,019 | 657,997 | |||
| Materials 3.9% | 6,154,392 | ||||
| Chemicals 0.4% | |||||
| BASF SE | 3,357 | 235,612 | |||
| China BlueChemical, Ltd., H Shares | 133,156 | 37,070 | |||
| EMS-Chemie Holding AG | 113 | 126,287 | |||
| PhosAgro PJSC, GDR | 9,100 | 196,378 | |||
| Construction materials 0.2% | |||||
| Holcim, Ltd. (A) | 3,911 | 198,910 | |||
| Imerys SA | 1,379 | 57,289 | |||
| Taiheiyo Cement Corp. | 3,580 | 70,696 | |||
| Vicat SA | 1,230 | 50,393 | |||
| Containers and packaging 0.1% | |||||
| International Paper Company | 2,774 | 130,323 | |||
| Nampak, Ltd. (A) | 49,556 | 12,155 | |||
| Metals and mining 3.2% | |||||
| African Rainbow Minerals, Ltd. | 6,478 | 93,917 | |||
| Anglo American Platinum, Ltd. | 576 | 65,697 | |||
| Anglo American PLC | 4,404 | 181,146 | |||
| Barrick Gold Corp. | 5,257 | 99,949 | |||
| BHP Group PLC | 7,250 | 215,722 | |||
| BHP Group, Ltd. | 13,743 | 414,925 | |||
| Centamin PLC | 31,933 | 38,664 | |||
| Centerra Gold, Inc. | 6,235 | 48,058 | |||
| Chubu Steel Plate Company, Ltd. | 1,386 | 11,330 | |||
| Eldorado Gold Corp. (A) | 3,731 | 34,885 | |||
| Endeavour Mining PLC | 2,739 | 60,044 | |||
| Eregli Demir ve Celik Fabrikalari TAS | 41,542 | 88,378 | |||
| Gold Fields, Ltd. | 2,737 | 30,283 | |||
| Harmony Gold Mining Company, Ltd., ADR | 10,372 | 42,629 | |||
| Impala Platinum Holdings, Ltd. | 5,943 | 83,836 | |||
| Kinross Gold Corp. (New York Stock Exchange) | 12,455 | 72,364 | |||
| Korea Zinc Company, Ltd. (A) | 1,946 | 837,307 | |||
| Kyoei Steel, Ltd. | 4,160 | 51,196 | |||
| Maruichi Steel Tube, Ltd. | 3,150 | 69,795 | |||
| MMC Norilsk Nickel PJSC, ADR | 10,311 | 316,238 | |||
| Nakayama Steel Works, Ltd. | 5,890 | 21,846 | |||
| 19 | JOHN HANCOCK HEDGED EQUITY & INCOME FUND | ANNUAL REPORT | SEE NOTES TO FINANCIAL STATEMENTS |
| Shares | Value | ||||
| Materials (continued) | |||||
| Metals and mining (continued) | |||||
| Neturen Company, Ltd. | 4,120 | $20,894 | |||
| Newmont Corp. | 1,387 | 86,008 | |||
| Norsk Hydro ASA | 5,730 | 45,087 | |||
| Nucor Corp. | 752 | 85,841 | |||
| OceanaGold Corp. (A) | 21,643 | 37,641 | |||
| Pacific Metals Company, Ltd. | 1,630 | 30,295 | |||
| Polyus PJSC, GDR | 252 | 22,258 | |||
| Polyus PJSC, GDR (London Stock Exchange) | 29 | 2,561 | |||
| Resolute Mining, Ltd. (A) | 35,460 | 10,093 | |||
| Rio Tinto PLC | 24,323 | 1,604,010 | |||
| Rio Tinto, Ltd. | 1,018 | 74,286 | |||
| Tokyo Steel Manufacturing Company, Ltd. | 4,350 | 52,178 | |||
| Yamato Kogyo Company, Ltd. | 1,845 | 59,797 | |||
| Yodogawa Steel Works, Ltd. | 1,360 | 30,121 | |||
| Real estate 2.6% | 4,177,375 | ||||
| Equity real estate investment trusts 1.9% | |||||
| Digital Realty Trust, Inc. | 1,780 | 314,829 | |||
| Extra Space Storage, Inc. | 177 | 40,131 | |||
| Iron Mountain, Inc. | 2,648 | 138,570 | |||
| Land Securities Group PLC | 7,012 | 74,004 | |||
| Medical Properties Trust, Inc. | 58,992 | 1,393,981 | |||
| Public Storage | 837 | 313,507 | |||
| Simon Property Group, Inc. | 4,031 | 644,033 | |||
| The British Land Company PLC | 10,233 | 73,896 | |||
| WP Carey, Inc. | 1,081 | 88,696 | |||
| Real estate management and development 0.7% | |||||
| Agile Group Holdings, Ltd. | 3,170 | 1,721 | |||
| CK Asset Holdings, Ltd. | 17,558 | 110,755 | |||
| Jinke Properties Group Company, Ltd., Class A | 13,100 | 9,215 | |||
| Mitsubishi Estate Company, Ltd. | 7,830 | 108,622 | |||
| Nexity SA | 17,419 | 820,271 | |||
| Shimao Group Holdings, Ltd. | 68,955 | 45,144 | |||
| Utilities 4.6% | 7,263,789 | ||||
| Electric utilities 2.9% | |||||
| Alliant Energy Corp. | 1,084 | 66,633 | |||
| American Electric Power Company, Inc. | 1,623 | 144,398 | |||
| CEZ AS | 4,778 | 180,841 | |||
| Duke Energy Corp. | 12,985 | 1,362,127 | |||
| Edison International | 22,836 | 1,558,557 | |||
| Entergy Corp. | 502 | 56,550 | |||
| Exelon Corp. | 15,979 | 922,947 | |||
| SEE NOTES TO FINANCIAL STATEMENTS | ANNUAL REPORT | JOHN HANCOCK HEDGED EQUITY & INCOME FUND | 20 |
| Shares | Value | ||||
| Utilities (continued) | |||||
| Electric utilities (continued) | |||||
| FirstEnergy Corp. | 1,270 | $52,819 | |||
| NextEra Energy, Inc. | 844 | 78,796 | |||
| PPL Corp. | 6,434 | 193,406 | |||
| Gas utilities 0.1% | |||||
| Enagas SA | 3,040 | 70,623 | |||
| Naturgy Energy Group SA | 3,511 | 114,196 | |||
| Multi-utilities 1.5% | |||||
| Centrica PLC (A) | 44,674 | 43,322 | |||
| CMS Energy Corp. | 378 | 24,589 | |||
| Consolidated Edison, Inc. | 4,215 | 359,624 | |||
| Dominion Energy, Inc. | 1,139 | 89,480 | |||
| Engie SA | 14,620 | 216,455 | |||
| National Grid PLC | 110,254 | 1,589,784 | |||
| WEC Energy Group, Inc. | 514 | 49,894 | |||
| Water utilities 0.1% | |||||
| Cia de Saneamento Basico do Estado de Sao Paulo | 12,153 | 88,748 | |||
| Preferred securities 0.3% | $536,725 | ||||
| (Cost $607,571) | |||||
| Consumer discretionary 0.2% | 394,334 | ||||
| Automobiles 0.2% | |||||
| Volkswagen AG | 1,963 | 394,334 | |||
| Information technology 0.1% | 124,294 | ||||
| Technology hardware, storage and peripherals 0.1% | |||||
| Samsung Electronics Company, Ltd. | 2,079 | 124,294 | |||
| Materials 0.0% | 18,097 | ||||
| Chemicals 0.0% | |||||
| LG Chem, Ltd. (A) | 75 | 18,097 | |||
| Exchange-traded funds 0.1% | $192,422 | ||||
| (Cost $194,238) | |||||
| iShares Core MSCI EAFE ETF | 2,578 | 192,422 | |||
| Closed-end funds 0.1% | $49,445 | ||||
| (Cost $42,097) | |||||
| Sprott Physical Uranium Trust (A) | 4,490 | 49,445 | |||
| Other equity investments 0.0% | $0 | ||||
| (Cost $240,553) | |||||
| Allstar Co-Invest LLC (LLC Interest) (A)(C)(D) | 236,300 | 0 | |||
| 21 | JOHN HANCOCK HEDGED EQUITY & INCOME FUND | ANNUAL REPORT | SEE NOTES TO FINANCIAL STATEMENTS |
| Rate (%) | Maturity date | Par value^ | Value | ||
| Foreign government obligations 0.0% | $50,439 | ||||
| (Cost $60,976) | |||||
| Argentina 0.0% | 50,439 | ||||
| Republic of Argentina | |||||
| Bond (1.125% to 7-9-22, then 1.500% to 7-9-23, then 3.625% to 7-9-24, then 4.125% to 7-9-27, then 4.750% to 7-9-28, then 5.000% thereafter) | 1.125 | 07-09-35 | 75,000 | 24,001 | |
| Bond (2.500% to 7-9-22, then 3.500% to 7-9-29, then 4.875% thereafter) | 2.500 | 07-09-41 | 75,000 | 26,438 | |
| Corporate bonds 12.9% | $20,654,282 | ||||
| (Cost $20,154,926) | |||||
| Communication services 2.1% | 3,294,476 | ||||
| Diversified telecommunication services 0.6% | |||||
| Embarq Corp. | 7.995 | 06-01-36 | 70,000 | 78,400 | |
| Frontier Communications Holdings LLC (B) | 5.000 | 05-01-28 | 65,000 | 66,950 | |
| Frontier Communications Holdings LLC (B) | 5.875 | 10-15-27 | 65,000 | 68,738 | |
| Frontier Communications Holdings LLC | 5.875 | 11-01-29 | 90,473 | 90,473 | |
| Frontier Communications Holdings LLC (B) | 6.750 | 05-01-29 | 105,000 | 109,200 | |
| Kaixo Bondco Telecom SA (B) | 5.125 | 09-30-29 | EUR | 100,000 | 114,397 |
| Lorca Telecom Bondco SA (B) | 4.000 | 09-18-27 | EUR | 120,000 | 138,840 |
| WP/AP Telecom Holdings IV BV (B) | 3.750 | 01-15-29 | EUR | 100,000 | 114,937 |
| Ziggo BV (B) | 5.500 | 01-15-27 | 150,000 | 154,125 | |
| Entertainment 0.2% | |||||
| Cinemark USA, Inc. (B) | 5.250 | 07-15-28 | 180,000 | 175,500 | |
| Cinemark USA, Inc. (B) | 5.875 | 03-15-26 | 45,000 | 45,563 | |
| ROBLOX Corp. (B) | 3.875 | 05-01-30 | 100,000 | 101,435 | |
| Interactive media and services 0.2% | |||||
| Arches Buyer, Inc. (B) | 4.250 | 06-01-28 | 95,000 | 94,951 | |
| Arches Buyer, Inc. (B) | 6.125 | 12-01-28 | 90,000 | 90,562 | |
| Endure Digital, Inc. (B) | 6.000 | 02-15-29 | 125,000 | 116,250 | |
| Media 0.8% | |||||
| Altice France SA (B) | 3.375 | 01-15-28 | EUR | 100,000 | 110,640 |
| Altice France SA | 5.875 | 02-01-27 | EUR | 165,000 | 196,071 |
| CCO Holdings LLC (B) | 4.250 | 02-01-31 | 45,000 | 45,395 | |
| CCO Holdings LLC (B) | 4.250 | 01-15-34 | 125,000 | 122,978 | |
| CCO Holdings LLC (B) | 4.500 | 08-15-30 | 45,000 | 46,044 | |
| DISH DBS Corp. | 5.000 | 03-15-23 | 175,000 | 179,375 | |
| DISH DBS Corp. | 5.875 | 07-15-22 | 75,000 | 76,219 | |
| DISH DBS Corp. | 5.875 | 11-15-24 | 30,000 | 30,818 | |
| DISH DBS Corp. | 7.750 | 07-01-26 | 30,000 | 31,650 | |
| SEE NOTES TO FINANCIAL STATEMENTS | ANNUAL REPORT | JOHN HANCOCK HEDGED EQUITY & INCOME FUND | 22 |
| Rate (%) | Maturity date | Par value^ | Value | ||
| Communication services (continued) | |||||
| Media (continued) | |||||
| Scripps Escrow, Inc. (B) | 5.875 | 07-15-27 | 125,000 | $131,320 | |
| Sirius XM Radio, Inc. (B) | 4.000 | 07-15-28 | 65,000 | 65,363 | |
| United Group BV | 3.625 | 02-15-28 | EUR | 100,000 | 110,374 |
| Virgin Media Secured Finance PLC (B) | 4.125 | 08-15-30 | GBP | 100,000 | 133,325 |
| Wireless telecommunication services 0.3% | |||||
| Sprint Corp. | 7.125 | 06-15-24 | 50,000 | 56,133 | |
| Sprint Corp. | 7.875 | 09-15-23 | 100,000 | 110,125 | |
| T-Mobile USA, Inc. | 2.250 | 02-15-26 | 35,000 | 35,088 | |
| T-Mobile USA, Inc. (B) | 2.250 | 02-15-26 | 90,000 | 90,225 | |
| T-Mobile USA, Inc. | 2.625 | 04-15-26 | 50,000 | 50,250 | |
| Vmed O2 UK Financing I PLC (B) | 3.250 | 01-31-31 | EUR | 100,000 | 112,762 |
| Consumer discretionary 2.5% | 4,021,885 | ||||
| Auto components 0.1% | |||||
| Adient Global Holdings, Ltd. | 3.500 | 08-15-24 | EUR | 200,000 | 230,275 |
| Automobiles 0.3% | |||||
| Ford Motor Company | 4.346 | 12-08-26 | 50,000 | 54,538 | |
| Ford Motor Credit Company LLC | 3.339 | 03-28-22 | 200,000 | 200,350 | |
| Ford Motor Credit Company LLC | 4.542 | 08-01-26 | 200,000 | 217,250 | |
| Diversified consumer services 0.1% | |||||
| Q-Park Holding I BV (B) | 2.000 | 03-01-27 | EUR | 100,000 | 107,341 |
| SRS Distribution, Inc. (B) | 4.625 | 07-01-28 | 65,000 | 65,244 | |
| Hotels, restaurants and leisure 1.0% | |||||
| Caesars Entertainment, Inc. (B) | 6.250 | 07-01-25 | 95,000 | 99,714 | |
| Caesars Entertainment, Inc. (B) | 8.125 | 07-01-27 | 105,000 | 116,281 | |
| Caesars Resort Collection LLC (B) | 5.750 | 07-01-25 | 30,000 | 31,329 | |
| Carnival Corp. (B) | 5.750 | 03-01-27 | 15,000 | 15,000 | |
| Carnival Corp. (B) | 6.000 | 05-01-29 | 180,000 | 179,100 | |
| Carnival Corp. (B) | 7.625 | 03-01-26 | 20,000 | 20,965 | |
| Cirsa Finance International Sarl (B) | 4.500 | 03-15-27 | EUR | 100,000 | 111,192 |
| Jacobs Entertainment, Inc. (B) | 7.875 | 02-01-24 | 165,000 | 168,300 | |
| New Red Finance, Inc. (B) | 3.500 | 02-15-29 | 160,000 | 158,352 | |
| New Red Finance, Inc. (B) | 4.000 | 10-15-30 | 60,000 | 58,950 | |
| Penn National Gaming, Inc. (B) | 4.125 | 07-01-29 | 30,000 | 29,100 | |
| Penn National Gaming, Inc. (B) | 5.625 | 01-15-27 | 186,000 | 189,720 | |
| Royal Caribbean Cruises, Ltd. (B) | 5.500 | 08-31-26 | 125,000 | 127,100 | |
| Sugarhouse HSP Gaming Prop Mezz LP (B) | 5.875 | 05-15-25 | 55,000 | 54,725 | |
| Wheel Bidco, Ltd. (B) | 6.750 | 07-15-26 | GBP | 100,000 | 132,648 |
| Yum! Brands, Inc. (B) | 4.750 | 01-15-30 | 30,000 | 32,475 | |
| Household durables 0.3% | |||||
| Ashton Woods USA LLC (B) | 4.625 | 04-01-30 | 20,000 | 19,650 | |
| 23 | JOHN HANCOCK HEDGED EQUITY & INCOME FUND | ANNUAL REPORT | SEE NOTES TO FINANCIAL STATEMENTS |
| Rate (%) | Maturity date | Par value^ | Value | ||
| Consumer discretionary (continued) | |||||
| Household durables (continued) | |||||
| Ashton Woods USA LLC (B) | 6.625 | 01-15-28 | 95,000 | $100,225 | |
| Empire Communities Corp. (B) | 7.000 | 12-15-25 | 60,000 | 62,100 | |
| KB Home | 4.800 | 11-15-29 | 30,000 | 32,745 | |
| M/I Homes, Inc. | 3.950 | 02-15-30 | 40,000 | 39,400 | |
| M/I Homes, Inc. | 4.950 | 02-01-28 | 70,000 | 72,800 | |
| Taylor Morrison Communities, Inc. (B) | 5.750 | 01-15-28 | 140,000 | 156,450 | |
| Leisure products 0.1% | |||||
| MajorDrive Holdings IV LLC (B) | 6.375 | 06-01-29 | 130,000 | 125,775 | |
| Mattel, Inc. (B) | 5.875 | 12-15-27 | 40,000 | 42,998 | |
| Specialty retail 0.6% | |||||
| Bath & Body Works, Inc. | 5.250 | 02-01-28 | 5,000 | 5,525 | |
| Bath & Body Works, Inc. (B) | 6.625 | 10-01-30 | 50,000 | 56,625 | |
| Parts Europe SA (B) | 6.500 | 07-16-25 | EUR | 100,000 | 117,828 |
| Parts Europe SA | 6.500 | 07-16-25 | EUR | 100,000 | 117,828 |
| Specialty Building Products Holdings LLC (B) | 6.375 | 09-30-26 | 175,000 | 183,412 | |
| Staples, Inc. (B) | 7.500 | 04-15-26 | 200,000 | 205,500 | |
| The Gap, Inc. (B) | 3.625 | 10-01-29 | 75,000 | 74,183 | |
| The Gap, Inc. (B) | 3.875 | 10-01-31 | 75,000 | 73,969 | |
| The Michaels Companies, Inc. (B) | 5.250 | 05-01-28 | 75,000 | 75,033 | |
| The Michaels Companies, Inc. (B) | 7.875 | 05-01-29 | 50,000 | 49,250 | |
| Textiles, apparel and luxury goods 0.0% | |||||
| G-III Apparel Group, Ltd. (B) | 7.875 | 08-15-25 | 10,000 | 10,640 | |
| Consumer staples 0.4% | 710,794 | ||||
| Food and staples retailing 0.2% | |||||
| Bellis Acquisition Company PLC (B) | 3.250 | 02-16-26 | GBP | 100,000 | 130,136 |
| Performance Food Group, Inc. (B) | 4.250 | 08-01-29 | 65,000 | 64,484 | |
| Performance Food Group, Inc. (B) | 5.500 | 10-15-27 | 45,000 | 46,969 | |
| Food products 0.1% | |||||
| B&G Foods, Inc. | 5.250 | 09-15-27 | 55,000 | 56,859 | |
| Post Holdings, Inc. (B) | 5.625 | 01-15-28 | 70,000 | 74,182 | |
| Post Holdings, Inc. (B) | 5.750 | 03-01-27 | 50,000 | 51,625 | |
| Household products 0.1% | |||||
| Diamond BC BV (B) | 4.625 | 10-01-29 | 15,000 | 14,880 | |
| Energizer Gamma Acquisition BV (B) | 3.500 | 06-30-29 | EUR | 200,000 | 219,596 |
| Personal products 0.0% | |||||
| Prestige Brands, Inc. (B) | 5.125 | 01-15-28 | 50,000 | 52,063 | |
| Energy 1.7% | 2,694,545 | ||||
| Energy equipment and services 0.0% | |||||
| Transocean, Inc. | 6.800 | 03-15-38 | 60,000 | 32,400 | |
| SEE NOTES TO FINANCIAL STATEMENTS | ANNUAL REPORT | JOHN HANCOCK HEDGED EQUITY & INCOME FUND | 24 |
| Rate (%) | Maturity date | Par value^ | Value | ||
| Energy (continued) | |||||
| Oil, gas and consumable fuels 1.7% | |||||
| Antero Midstream Partners LP (B) | 5.750 | 01-15-28 | 90,000 | $94,377 | |
| Apache Corp. | 4.375 | 10-15-28 | 50,000 | 54,400 | |
| Apache Corp. | 4.625 | 11-15-25 | 105,000 | 112,744 | |
| Apache Corp. | 5.100 | 09-01-40 | 8,000 | 9,040 | |
| Buckeye Partners LP (B) | 4.125 | 03-01-25 | 45,000 | 46,463 | |
| Buckeye Partners LP | 4.125 | 12-01-27 | 15,000 | 15,459 | |
| Buckeye Partners LP (B) | 4.500 | 03-01-28 | 40,000 | 40,300 | |
| Cheniere Energy Partners LP | 4.500 | 10-01-29 | 71,000 | 75,260 | |
| Continental Resources, Inc. | 4.375 | 01-15-28 | 10,000 | 10,811 | |
| Continental Resources, Inc. | 4.900 | 06-01-44 | 25,000 | 27,706 | |
| Continental Resources, Inc. (B) | 5.750 | 01-15-31 | 35,000 | 41,217 | |
| DCP Midstream Operating LP | 5.375 | 07-15-25 | 45,000 | 49,163 | |
| DT Midstream, Inc. (B) | 4.125 | 06-15-29 | 124,000 | 126,945 | |
| EG Global Finance PLC | 6.250 | 10-30-25 | EUR | 100,000 | 116,696 |
| EnLink Midstream LLC (B) | 5.625 | 01-15-28 | 91,000 | 94,640 | |
| EQM Midstream Partners LP (B) | 4.500 | 01-15-29 | 40,000 | 41,600 | |
| EQM Midstream Partners LP (B) | 4.750 | 01-15-31 | 30,000 | 31,725 | |
| EQM Midstream Partners LP (B) | 6.000 | 07-01-25 | 15,000 | 16,313 | |
| EQM Midstream Partners LP (B) | 6.500 | 07-01-27 | 15,000 | 16,800 | |
| EQM Midstream Partners LP | 6.500 | 07-15-48 | 50,000 | 60,750 | |
| EQT Corp. (B) | 3.125 | 05-15-26 | 45,000 | 46,194 | |
| Occidental Petroleum Corp. | 3.000 | 02-15-27 | 140,000 | 142,100 | |
| Occidental Petroleum Corp. | 3.200 | 08-15-26 | 25,000 | 25,763 | |
| Occidental Petroleum Corp. | 3.400 | 04-15-26 | 60,000 | 61,541 | |
| Occidental Petroleum Corp. | 4.200 | 03-15-48 | 121,000 | 121,000 | |
| Occidental Petroleum Corp. | 4.400 | 04-15-46 | 29,000 | 29,725 | |
| Occidental Petroleum Corp. | 5.500 | 12-01-25 | 20,000 | 22,187 | |
| Occidental Petroleum Corp. | 6.125 | 01-01-31 | 20,000 | 24,300 | |
| Occidental Petroleum Corp. | 6.375 | 09-01-28 | 5,000 | 5,937 | |
| Ovintiv Exploration, Inc. | 5.375 | 01-01-26 | 25,000 | 27,713 | |
| Ovintiv Exploration, Inc. | 5.625 | 07-01-24 | 80,000 | 88,062 | |
| Petrobras Global Finance BV | 5.093 | 01-15-30 | 45,000 | 46,803 | |
| Petrobras Global Finance BV | 5.600 | 01-03-31 | 50,000 | 52,950 | |
| Petrobras Global Finance BV | 5.750 | 02-01-29 | 105,000 | 113,006 | |
| Petrobras Global Finance BV | 6.900 | 03-19-49 | 50,000 | 53,250 | |
| Petroleos Mexicanos | 6.750 | 09-21-47 | 125,000 | 110,938 | |
| Petroleos Mexicanos | 6.840 | 01-23-30 | 175,000 | 181,050 | |
| Southwestern Energy Company | 4.750 | 02-01-32 | 15,000 | 15,797 | |
| Venture Global Calcasieu Pass LLC (B) | 3.875 | 08-15-29 | 65,000 | 67,438 | |
| Venture Global Calcasieu Pass LLC (B) | 4.125 | 08-15-31 | 45,000 | 47,700 | |
| Western Midstream Operating LP | 5.300 | 02-01-30 | 150,000 | 164,856 | |
| Western Midstream Operating LP | 6.500 | 02-01-50 | 50,000 | 59,125 | |
| YPF SA | 7.000 | 12-15-47 | 120,000 | 72,301 | |
| 25 | JOHN HANCOCK HEDGED EQUITY & INCOME FUND | ANNUAL REPORT | SEE NOTES TO FINANCIAL STATEMENTS |
| Rate (%) | Maturity date | Par value^ | Value | ||
| Financials 1.3% | $2,142,221 | ||||
| Banks 0.2% | |||||
| Banco de Credito Social Cooperativo SA (5.250% to 5-27-26, then 5 Year Euro Swap Rate + 5.419%) | 5.250 | 11-27-31 | EUR | 100,000 | 118,119 |
| Banco do Brasil SA | 4.625 | 01-15-25 | 200,000 | 208,502 | |
| Capital markets 0.1% | |||||
| Credit Suisse Group AG (5.250% to 2-11-27, then 5 Year CMT + 4.889%) (B)(E) | 5.250 | 02-11-27 | 200,000 | 206,500 | |
| Consumer finance 0.3% | |||||
| Credit Acceptance Corp. (B) | 5.125 | 12-31-24 | 75,000 | 76,875 | |
| Credit Acceptance Corp. | 6.625 | 03-15-26 | 70,000 | 72,859 | |
| FirstCash, Inc. (B) | 5.625 | 01-01-30 | 70,000 | 71,343 | |
| goeasy, Ltd. (B) | 5.375 | 12-01-24 | 95,000 | 97,613 | |
| OneMain Finance Corp. | 4.000 | 09-15-30 | 60,000 | 59,003 | |
| OneMain Finance Corp. | 5.375 | 11-15-29 | 85,000 | 92,420 | |
| OneMain Finance Corp. | 6.125 | 03-15-24 | 5,000 | 5,301 | |
| OneMain Finance Corp. | 6.875 | 03-15-25 | 60,000 | 66,750 | |
| Insurance 0.1% | |||||
| Acrisure LLC (B) | 10.125 | 08-01-26 | 75,000 | 82,594 | |
| AssuredPartners, Inc. (B) | 5.625 | 01-15-29 | 45,000 | 43,763 | |
| Genworth Holdings, Inc. | 4.800 | 02-15-24 | 5,000 | 5,200 | |
| Genworth Holdings, Inc. | 6.500 | 06-15-34 | 50,000 | 51,854 | |
| Thrifts and mortgage finance 0.6% | |||||
| Enact Holdings, Inc. (B) | 6.500 | 08-15-25 | 125,000 | 136,563 | |
| Home Point Capital, Inc. (B) | 5.000 | 02-01-26 | 125,000 | 115,938 | |
| LD Holdings Group LLC (B) | 6.125 | 04-01-28 | 35,000 | 32,988 | |
| LD Holdings Group LLC (B) | 6.500 | 11-01-25 | 120,000 | 118,398 | |
| MGIC Investment Corp. | 5.250 | 08-15-28 | 115,000 | 120,750 | |
| Nationstar Mortgage Holdings, Inc. (B) | 5.125 | 12-15-30 | 70,000 | 69,125 | |
| PennyMac Financial Services, Inc. (B) | 4.250 | 02-15-29 | 125,000 | 120,175 | |
| PennyMac Financial Services, Inc. (B) | 5.375 | 10-15-25 | 60,000 | 61,650 | |
| United Wholesale Mortgage LLC (B) | 5.500 | 04-15-29 | 110,000 | 107,938 | |
| Health care 1.3% | 2,006,567 | ||||
| Biotechnology 0.1% | |||||
| Grifols Escrow Issuer SA (B) | 3.875 | 10-15-28 | EUR | 100,000 | 114,234 |
| Health care equipment and supplies 0.2% | |||||
| Hill-Rom Holdings, Inc. (B) | 4.375 | 09-15-27 | 80,000 | 83,600 | |
| Mozart Debt Merger Sub, Inc. (B) | 3.875 | 04-01-29 | 180,000 | 179,365 | |
| Mozart Debt Merger Sub, Inc. (B) | 5.250 | 10-01-29 | 85,000 | 86,159 | |
| Health care providers and services 0.5% | |||||
| Chrome Bidco SASU (B) | 3.500 | 05-31-28 | EUR | 100,000 | 114,667 |
| Community Health Systems, Inc. (B) | 4.750 | 02-15-31 | 155,000 | 156,356 | |
| SEE NOTES TO FINANCIAL STATEMENTS | ANNUAL REPORT | JOHN HANCOCK HEDGED EQUITY & INCOME FUND | 26 |
| Rate (%) | Maturity date | Par value^ | Value | ||
| Health care (continued) | |||||
| Health care providers and services (continued) | |||||
| Community Health Systems, Inc. (B) | 5.625 | 03-15-27 | 20,000 | $21,167 | |
| Community Health Systems, Inc. (B) | 6.625 | 02-15-25 | 95,000 | 98,325 | |
| HCA, Inc. | 5.375 | 02-01-25 | 200,000 | 219,800 | |
| HCA, Inc. | 5.375 | 09-01-26 | 60,000 | 67,425 | |
| HCA, Inc. | 5.625 | 09-01-28 | 10,000 | 11,685 | |
| HCA, Inc. | 5.875 | 02-01-29 | 5,000 | 5,958 | |
| HCA, Inc. | 7.500 | 11-15-95 | 35,000 | 51,013 | |
| Health care technology 0.1% | |||||
| CAB SELAS (B) | 3.375 | 02-01-28 | EUR | 100,000 | 113,635 |
| Life sciences tools and services 0.1% | |||||
| Avantor Funding, Inc. (B) | 3.875 | 07-15-28 | EUR | 100,000 | 118,406 |
| Pharmaceuticals 0.3% | |||||
| Bausch Health Companies, Inc. (B) | 5.000 | 01-30-28 | 135,000 | 124,200 | |
| Bausch Health Companies, Inc. (B) | 5.000 | 02-15-29 | 225,000 | 198,563 | |
| Bausch Health Companies, Inc. (B) | 6.125 | 04-15-25 | 78,000 | 79,448 | |
| Catalent Pharma Solutions, Inc. (B) | 3.125 | 02-15-29 | 30,000 | 29,592 | |
| Catalent Pharma Solutions, Inc. (B) | 3.500 | 04-01-30 | 20,000 | 19,943 | |
| Teva Pharmaceutical Finance Netherlands II BV | 3.750 | 05-09-27 | EUR | 100,000 | 113,026 |
| Industrials 1.6% | 2,489,183 | ||||
| Aerospace and defense 0.1% | |||||
| TransDigm, Inc. | 5.500 | 11-15-27 | 55,000 | 56,650 | |
| TransDigm, Inc. (B) | 6.250 | 03-15-26 | 150,000 | 155,906 | |
| Air freight and logistics 0.0% | |||||
| First Student Bidco, Inc. (B) | 4.000 | 07-31-29 | 55,000 | 53,460 | |
| Building products 0.3% | |||||
| Advanced Drainage Systems, Inc. (B) | 5.000 | 09-30-27 | 25,000 | 25,844 | |
| Builders FirstSource, Inc. (B) | 5.000 | 03-01-30 | 45,000 | 48,280 | |
| LBM Acquisition LLC (B) | 6.250 | 01-15-29 | 185,000 | 182,919 | |
| Signal Parent, Inc. (B) | 6.125 | 04-01-29 | 109,000 | 96,738 | |
| Victors Merger Corp. (B) | 6.375 | 05-15-29 | 85,000 | 79,900 | |
| Commercial services and supplies 0.3% | |||||
| American Builders & Contractors Supply Company, Inc. (B) | 4.000 | 01-15-28 | 85,000 | 86,975 | |
| APX Group, Inc. (B) | 6.750 | 02-15-27 | 50,000 | 52,500 | |
| Arena Luxembourg Finance Sarl (B) | 1.875 | 02-01-28 | EUR | 100,000 | 107,242 |
| Clean Harbors, Inc. (B) | 4.875 | 07-15-27 | 49,000 | 50,470 | |
| Scientific Games International, Inc. | 5.500 | 02-15-26 | EUR | 100,000 | 116,125 |
| Electrical equipment 0.1% | |||||
| Sensata Technologies BV (B) | 5.000 | 10-01-25 | 100,000 | 108,500 | |
| Sensata Technologies BV (B) | 5.625 | 11-01-24 | 10,000 | 10,993 | |
| 27 | JOHN HANCOCK HEDGED EQUITY & INCOME FUND | ANNUAL REPORT | SEE NOTES TO FINANCIAL STATEMENTS |
| Rate (%) | Maturity date | Par value^ | Value | ||
| Industrials (continued) | |||||
| Electrical equipment (continued) | |||||
| Techem Verwaltungsgesellschaft 675 mbH (B) | 2.000 | 07-15-25 | EUR | 100,000 | $112,549 |
| Machinery 0.2% | |||||
| Meritor, Inc. (B) | 4.500 | 12-15-28 | 95,000 | 95,238 | |
| TK Elevator Midco GmbH (B) | 4.375 | 07-15-27 | EUR | 100,000 | 117,530 |
| Verisure Holding AB (B) | 3.250 | 02-15-27 | EUR | 100,000 | 113,370 |
| Professional services 0.3% | |||||
| La Financiere Atalian SASU | 4.000 | 05-15-24 | EUR | 100,000 | 111,801 |
| La Financiere Atalian SASU (B) | 4.000 | 05-15-24 | EUR | 100,000 | 111,801 |
| Nielsen Finance LLC (B) | 4.500 | 07-15-29 | 163,000 | 160,350 | |
| The Dun & Bradstreet Corp. (B) | 5.000 | 12-15-29 | 25,000 | 25,576 | |
| Trading companies and distributors 0.2% | |||||
| Herc Holdings, Inc. (B) | 5.500 | 07-15-27 | 140,000 | 145,600 | |
| Loxam SAS | 3.250 | 01-14-25 | EUR | 100,000 | 114,089 |
| Transportation infrastructure 0.1% | |||||
| Imola Merger Corp. (B) | 4.750 | 05-15-29 | 145,000 | 148,777 | |
| Information technology 0.6% | 1,007,823 | ||||
| Electronic equipment, instruments and components 0.0% | |||||
| II-VI, Inc. (B) | 5.000 | 12-15-29 | 30,000 | 30,637 | |
| IT services 0.3% | |||||
| Black Knight InfoServ LLC (B) | 3.625 | 09-01-28 | 70,000 | 69,908 | |
| CDW LLC | 2.670 | 12-01-26 | 95,000 | 97,337 | |
| Go Daddy Operating Company LLC (B) | 3.500 | 03-01-29 | 100,000 | 99,235 | |
| Presidio Holdings, Inc. (B) | 4.875 | 02-01-27 | 125,000 | 128,750 | |
| Presidio Holdings, Inc. (B) | 8.250 | 02-01-28 | 60,000 | 63,900 | |
| Software 0.2% | |||||
| CDK Global, Inc. (B) | 5.250 | 05-15-29 | 60,000 | 63,600 | |
| Open Text Corp. (B) | 3.875 | 02-15-28 | 85,000 | 86,636 | |
| Open Text Corp. (B) | 3.875 | 12-01-29 | 20,000 | 20,250 | |
| Open Text Holdings, Inc. (B) | 4.125 | 12-01-31 | 30,000 | 30,300 | |
| SS&C Technologies, Inc. (B) | 5.500 | 09-30-27 | 150,000 | 156,750 | |
| Technology hardware, storage and peripherals 0.1% | |||||
| Xerox Corp. | 4.375 | 03-15-23 | 140,000 | 144,620 | |
| Xerox Holdings Corp. (B) | 5.000 | 08-15-25 | 15,000 | 15,900 | |
| Materials 1.1% | 1,760,874 | ||||
| Construction materials 0.0% | |||||
| Standard Industries, Inc. (B) | 4.375 | 07-15-30 | 50,000 | 51,025 | |
| Containers and packaging 0.7% | |||||
| ARD Finance SA (5.000% Cash or 5.750% PIK) (B) | 5.000 | 06-30-27 | EUR | 195,000 | 227,669 |
| SEE NOTES TO FINANCIAL STATEMENTS | ANNUAL REPORT | JOHN HANCOCK HEDGED EQUITY & INCOME FUND | 28 |
| Rate (%) | Maturity date | Par value^ | Value | ||
| Materials (continued) | |||||
| Containers and packaging (continued) | |||||
| Ardagh Packaging Finance PLC (B) | 2.125 | 08-15-26 | EUR | 105,000 | $116,864 |
| Crown European Holdings SA | 2.875 | 02-01-26 | EUR | 125,000 | 150,285 |
| Mauser Packaging Solutions Holding Company (B) | 7.250 | 04-15-25 | 50,000 | 50,127 | |
| Owens-Brockway Glass Container, Inc. (B) | 5.875 | 08-15-23 | 165,000 | 172,838 | |
| Silgan Holdings, Inc. | 2.250 | 06-01-28 | EUR | 100,000 | 112,763 |
| Titan Holdings II BV (B) | 5.125 | 07-15-29 | EUR | 100,000 | 112,953 |
| Trivium Packaging Finance BV | 3.750 | 08-15-26 | EUR | 100,000 | 115,273 |
| Metals and mining 0.3% | |||||
| ABJA Investment Company Pte, Ltd. | 5.450 | 01-24-28 | 200,000 | 218,511 | |
| Constellium SE | 4.250 | 02-15-26 | EUR | 125,000 | 143,408 |
| Novelis Corp. (B) | 3.250 | 11-15-26 | 30,000 | 30,263 | |
| Novelis Corp. (B) | 3.875 | 08-15-31 | 35,000 | 34,781 | |
| Novelis Corp. (B) | 4.750 | 01-30-30 | 75,000 | 78,844 | |
| Paper and forest products 0.1% | |||||
| Flex Acquisition Company, Inc. (B) | 6.875 | 01-15-25 | 145,000 | 145,270 | |
| Real estate 0.2% | 314,063 | ||||
| Equity real estate investment trusts 0.1% | |||||
| VICI Properties LP (B) | 3.500 | 02-15-25 | 10,000 | 10,150 | |
| VICI Properties LP (B) | 3.750 | 02-15-27 | 5,000 | 5,164 | |
| VICI Properties LP (B) | 4.250 | 12-01-26 | 60,000 | 62,488 | |
| VICI Properties LP (B) | 4.625 | 12-01-29 | 50,000 | 53,211 | |
| Real estate management and development 0.1% | |||||
| CIFI Holdings Group Company, Ltd. | 4.375 | 04-12-27 | 200,000 | 183,050 | |
| Utilities 0.1% | 211,851 | ||||
| Gas utilities 0.1% | |||||
| AmeriGas Partners LP | 5.500 | 05-20-25 | 102,000 | 109,268 | |
| AmeriGas Partners LP | 5.625 | 05-20-24 | 20,000 | 21,623 | |
| AmeriGas Partners LP | 5.875 | 08-20-26 | 10,000 | 11,185 | |
| Independent power and renewable electricity producers 0.0% | |||||
| Clearway Energy Operating LLC (B) | 3.750 | 02-15-31 | 60,000 | 59,850 | |
| Clearway Energy Operating LLC (B) | 3.750 | 01-15-32 | 10,000 | 9,925 | |
| Convertible bonds 0.3% | $460,058 | ||||
| (Cost $422,859) | |||||
| Consumer discretionary 0.1% | 165,226 | ||||
| Automobiles 0.0% | |||||
| Ford Motor Company, Zero Coupon (B) | 0.000 | 03-15-26 | 55,000 | 75,659 | |
| Hotels, restaurants and leisure 0.1% | |||||
| DraftKings, Inc. (B)(F) | 4.610 | 03-15-28 | 64,000 | 48,192 | |
| 29 | JOHN HANCOCK HEDGED EQUITY & INCOME FUND | ANNUAL REPORT | SEE NOTES TO FINANCIAL STATEMENTS |
| Rate (%) | Maturity date | Par value^ | Value | ||
| Consumer discretionary (continued) | |||||
| Hotels, restaurants and leisure (continued) | |||||
| Shake Shack, Inc. (B)(F) | 3.073 | 03-01-28 | 50,000 | $41,375 | |
| Energy 0.0% | 44,547 | ||||
| Oil, gas and consumable fuels 0.0% | |||||
| Pioneer Natural Resources Company | 0.250 | 05-15-25 | 25,000 | 44,547 | |
| Health care 0.1% | 62,319 | ||||
| Health care equipment and supplies 0.1% | |||||
| NuVasive, Inc. | 0.375 | 03-15-25 | 65,000 | 62,319 | |
| Industrials 0.1% | 132,909 | ||||
| Airlines 0.0% | |||||
| JetBlue Airways Corp. (B) | 0.500 | 04-01-26 | 62,000 | 57,797 | |
| Machinery 0.1% | |||||
| The Middleby Corp. | 1.000 | 09-01-25 | 47,000 | 75,112 | |
| Real estate 0.0% | 55,057 | ||||
| Equity real estate investment trusts 0.0% | |||||
| Pebblebrook Hotel Trust | 1.750 | 12-15-26 | 50,000 | 55,057 | |
| Term loans (G) 0.4% | $570,042 | ||||
| (Cost $588,846) | |||||
| Consumer staples 0.1% | 111,343 | ||||
| Food products 0.1% | |||||
| Froneri Lux FinCo SARL, 2020 EUR Term Loan B1 (6 month EURIBOR + 2.375%) | 2.375 | 01-29-27 | EUR | 100,000 | 111,343 |
| Financials 0.1% | 258,892 | ||||
| Diversified financial services 0.1% | |||||
| Crown Finance US, Inc., 2018 USD Term Loan (6 month LIBOR + 2.500%) | 3.500 | 02-28-25 | 200,145 | 154,388 | |
| Crown Finance US, Inc., 2021 Incremental Term Loan B1 (6 month LIBOR + 8.250%) | 9.250 | 05-23-24 | 8,658 | 9,188 | |
| Insurance 0.0% | |||||
| HUB International, Ltd., 2018 Term Loan B (3 month LIBOR + 2.750%) | 2.875 | 04-25-25 | 96,500 | 95,316 | |
| Industrials 0.1% | 100,036 | ||||
| Commercial services and supplies 0.1% | |||||
| PECF USS Intermediate Holding III Corp., Term Loan B (H) | TBD | 12-15-28 | 100,000 | 100,036 | |
| SEE NOTES TO FINANCIAL STATEMENTS | ANNUAL REPORT | JOHN HANCOCK HEDGED EQUITY & INCOME FUND | 30 |
| Rate (%) | Maturity date | Par value^ | Value | ||
| Information technology 0.1% | $99,771 | ||||
| Software 0.1% | |||||
| Ascend Learning LLC, 2021 Term Loan (H) | TBD | 12-11-28 | 100,000 | 99,771 | |
| Par value^ | Value | ||||
| Escrow certificates 0.0% | $0 | ||||
| (Cost $194) | |||||
| Texas Competitive Electric Holdings Company LLC (A)(D) | 500,000 | 0 | |||
| Short-term investments 0.8% | $1,300,000 | ||||
| (Cost $1,300,000) | |||||
| Repurchase agreement 0.8% | 1,300,000 | ||||
| Goldman Sachs Tri-Party Repurchase Agreement dated 12-31-21 at 0.050% to be repurchased at $1,300,005 on 1-3-22, collateralized by $592,663 Federal Home Loan Mortgage Corp., 2.500% - 4.500% due 2-1-26 to 12-1-51 (valued at $611,801) and $682,392 Government National Mortgage Association, 3.000% - 5.500% due 10-15-27 to 2-20-43 (valued at $714,199) | 1,300,000 | 1,300,000 |
| Total investments (Cost $148,491,784) 98.3% | $156,646,285 | ||||
| Other assets and liabilities, net 1.7% | 2,702,981 | ||||
| Total net assets 100.0% | $159,349,266 | ||||
| The percentage shown for each investment category is the total value of the category as a percentage of the net assets of the fund unless otherwise indicated. | |
| ^All par values are denominated in U.S. dollars unless otherwise indicated. | |
| Currency Abbreviations | |
| EUR | Euro |
| GBP | Pound Sterling |
| Security Abbreviations and Legend | |
| ADR | American Depositary Receipt |
| CMT | Constant Maturity Treasury |
| EURIBOR | Euro Interbank Offered Rate |
| GDR | Global Depositary Receipt |
| LIBOR | London Interbank Offered Rate |
| NVDR | Non-Voting Depositary Receipt |
| PIK | Pay-in-Kind Security - Represents a payment-in-kind which may pay interest in additional par and/or cash. Rates shown are the current rate and most recent payment rate. |
| (A) | Non-income producing security. |
| (B) | These securities are exempt from registration under Rule 144A of the Securities Act of 1933. Such securities may be resold, normally to qualified institutional buyers, in transactions exempt from registration. |
| 31 | JOHN HANCOCK HEDGED EQUITY & INCOME FUND | ANNUAL REPORT | SEE NOTES TO FINANCIAL STATEMENTS |
| (C) | Restricted security as to resale, excluding 144A securities. For more information on this security refer to the Notes to financial statements. |
| (D) | Security is valued using significant unobservable inputs and is classified as Level 3 in the fair value hierarchy. Refer to Note 2 to the financial statements. |
| (E) | Perpetual bonds have no stated maturity date. Date shown as maturity date is next call date. |
| (F) | Zero coupon bonds are issued at a discount from their principal amount in lieu of paying interest periodically. Rate shown is the effective yield at period end. |
| (G) | Term loans are variable rate obligations. The coupon rate shown represents the rate at period end. |
| (H) | This position represents an unsettled loan commitment at period end. Certain details associated with this purchase are not known prior to the settlement date, including coupon rate, which is disclosed as TBD (To Be Determined). |
| SEE NOTES TO FINANCIAL STATEMENTS | ANNUAL REPORT | JOHN HANCOCK HEDGED EQUITY & INCOME FUND | 32 |
DERIVATIVES
FUTURES
| Open contracts | Number of contracts | Position | Expiration date | Notional basis^ | Notional value^ | Unrealized appreciation (depreciation) |
| Euro STOXX 50 Index Futures | 184 | Short | Mar 2022 | $(8,766,525) | $(8,981,623) | $(215,098) |
| FTSE 100 Index Futures | 19 | Short | Mar 2022 | (1,853,681) | (1,883,546) | (29,865) |
| MSCI EAFE Index Futures | 86 | Short | Mar 2022 | (9,828,395) | (9,983,735) | (155,340) |
| S&P/TSX 60 Index Futures | 17 | Short | Mar 2022 | (3,386,361) | (3,442,871) | (56,510) |
| $(456,813) |
^ Notional basis refers to the
contractual amount agreed upon at inception of open contracts; notional value represents the current value of the open contract.
FORWARD FOREIGN CURRENCY CONTRACTS
| Contract to buy | Contract to sell | Counterparty (OTC) | Contractual settlement date | Unrealized appreciation | Unrealized depreciation | ||
| CAD | 155,000 | USD | 121,058 | BNP | 1/11/2022 | $1,476 | — |
| CAD | 20,000 | USD | 15,599 | DB | 1/11/2022 | 212 | — |
| EUR | 136,000 | USD | 153,384 | BNP | 1/11/2022 | 1,473 | — |
| EUR | 101,000 | USD | 113,815 | CITI | 1/11/2022 | 1,189 | — |
| EUR | 54,000 | USD | 61,443 | MSI | 1/31/2022 | 69 | — |
| GBP | 102,000 | USD | 136,136 | BNP | 1/11/2022 | 1,925 | — |
| GBP | 14,000 | USD | 18,537 | DB | 1/11/2022 | 412 | — |
| USD | 1,580,358 | CAD | 2,005,000 | GSI | 3/16/2022 | — | $(4,452) |
| USD | 475,368 | EUR | 423,000 | BNP | 1/11/2022 | — | (6,282) |
| USD | 112,988 | EUR | 100,000 | DB | 1/11/2022 | — | (877) |
| USD | 85,916 | EUR | 76,000 | SCB | 1/11/2022 | — | (622) |
| USD | 7,650,470 | EUR | 6,746,000 | DB | 3/16/2022 | — | (41,130) |
| USD | 18,526 | GBP | 14,000 | BNP | 1/11/2022 | — | (424) |
| USD | 2,877,645 | GBP | 2,177,000 | BNP | 3/16/2022 | — | (68,140) |
| USD | 1,439,877 | JPY | 163,800,000 | MSI | 3/16/2022 | 15,088 | — |
| $21,844 | $(121,927) | ||||||
| Derivatives Currency Abbreviations | |
| CAD | Canadian Dollar |
| EUR | Euro |
| GBP | Pound Sterling |
| JPY | Japanese Yen |
| USD | U.S. Dollar |
| Derivatives Abbreviations | |
| BNP | BNP Paribas |
| CITI | Citibank, N.A. |
| DB | Deutsche Bank AG |
| GSI | Goldman Sachs International |
| MSI | Morgan Stanley & Co. International PLC |
| OTC | Over-the-counter |
| 33 | JOHN HANCOCK HEDGED EQUITY & INCOME FUND | ANNUAL REPORT | SEE NOTES TO FINANCIAL STATEMENTS |
| SCB | Standard Chartered Bank |
At 12-31-21, the aggregate cost
of investments for federal income tax purposes was $148,770,079. Net unrealized appreciation aggregated to $7,319,310, of which $15,239,596 related to gross unrealized appreciation and $7,920,286 related to gross
unrealized depreciation.
See Notes to financial statements
regarding investment transactions and other derivatives information.
| SEE NOTES TO FINANCIAL STATEMENTS | ANNUAL REPORT | JOHN HANCOCK HEDGED EQUITY & INCOME FUND | 34 |
Financial statements
STATEMENT OF ASSETS AND
LIABILITIES 12-31-21
| Assets | |
| Unaffiliated investments, at value (Cost $148,491,784) | $156,646,285 |
| Unrealized appreciation on forward foreign currency contracts | 21,844 |
| Receivable for futures variation margin | 19,395 |
| Cash | 83,259 |
| Foreign currency, at value (Cost $254,032) | 256,015 |
| Collateral held at broker for futures contracts | 1,503,766 |
| Collateral segregated at custodian for OTC derivative contracts | 70,000 |
| Dividends and interest receivable | 1,010,509 |
| Receivable for investments sold | 159,226 |
| Other assets | 6,234 |
| Total assets | 159,776,533 |
| Liabilities | |
| Unrealized depreciation on forward foreign currency contracts | 121,927 |
| Payable for investments purchased | 199,250 |
| Payable to affiliates | |
| Accounting and legal services fees | 6,037 |
| Trustees’ fees | 4 |
| Other liabilities and accrued expenses | 100,049 |
| Total liabilities | 427,267 |
| Net assets | $159,349,266 |
| Net assets consist of | |
| Paid-in capital | $172,687,940 |
| Total distributable earnings (loss) | (13,338,674) |
| Net assets | $159,349,266 |
| Net asset value per share | |
| Based on 12,223,813 shares of beneficial interest outstanding - unlimited number of shares authorized with $0.01 par value | $13.04 |
| 35 | JOHN HANCOCK Hedged Equity & Income Fund | ANNUAL REPORT | SEE NOTES TO FINANCIAL STATEMENTS |
STATEMENT OF OPERATIONS For the year ended 12-31-21
| Investment income | |
| Dividends | $7,776,988 |
| Interest | 1,138,782 |
| Less foreign taxes withheld | (615,135) |
| Total investment income | 8,300,635 |
| Expenses | |
| Investment management fees | 1,536,285 |
| Accounting and legal services fees | 23,117 |
| Transfer agent fees | 17,657 |
| Trustees’ fees | 42,525 |
| Custodian fees | 75,958 |
| Printing and postage | 72,114 |
| Professional fees | 74,431 |
| Stock exchange listing fees | 23,749 |
| Other | 18,437 |
| Total expenses | 1,884,273 |
| Less expense reductions | (14,528) |
| Net expenses | 1,869,745 |
| Net investment income | 6,430,890 |
| Realized and unrealized gain (loss) | |
| Net realized gain (loss) on | |
| Unaffiliated investments and foreign currency transactions | 11,979,806 |
| Futures contracts | (4,448,569) |
| Forward foreign currency contracts | 802,974 |
| Written options | (432,230) |
| 7,901,981 | |
| Change in net unrealized appreciation (depreciation) of | |
| Unaffiliated investments and translation of assets and liabilities in foreign currencies | 3,168,312 |
| Futures contracts | 29,727 |
| Forward foreign currency contracts | 5,305 |
| 3,203,344 | |
| Net realized and unrealized gain | 11,105,325 |
| Increase in net assets from operations | $17,536,215 |
| SEE NOTES TO FINANCIAL STATEMENTS | ANNUAL REPORT | JOHN HANCOCK Hedged Equity & Income Fund | 36 |
STATEMENTS OF CHANGES IN NET
ASSETS
| Year ended 12-31-21 | Year ended 12-31-20 | |
| Increase (decrease) in net assets | ||
| From operations | ||
| Net investment income | $6,430,890 | $4,820,054 |
| Net realized gain (loss) | 7,901,981 | (22,285,878) |
| Change in net unrealized appreciation (depreciation) | 3,203,344 | 8,219,727 |
| Increase (decrease) in net assets resulting from operations | 17,536,215 | (9,246,097) |
| Distributions to shareholders | ||
| From earnings | (7,598,557) | (5,112,494) |
| From tax return of capital | (6,581,066) | (11,169,625) |
| Total distributions | (14,179,623) | (16,282,119) |
| Total increase (decrease) | 3,356,592 | (25,528,216) |
| Net assets | ||
| Beginning of year | 155,992,674 | 181,520,890 |
| End of year | $159,349,266 | $155,992,674 |
| Share activity | ||
| Shares outstanding | ||
| Beginning of year | 12,223,813 | 12,223,813 |
| End of year | 12,223,813 | 12,223,813 |
| 37 | JOHN HANCOCK Hedged Equity & Income Fund | ANNUAL REPORT | SEE NOTES TO FINANCIAL STATEMENTS |
Financial highlights
| Period ended | 12-31-21 | 12-31-20 | 12-31-19 | 12-31-18 | 12-31-17 |
| Per share operating performance | |||||
| Net asset value, beginning of period | $12.76 | $14.85 | $14.46 | $17.64 | $16.84 |
| Net investment income1 | 0.53 | 0.39 | 0.59 | 0.63 | 0.52 |
| Net realized and unrealized gain (loss) on investments | 0.91 | (1.15) | 1.30 | (2.31) | 1.94 |
| Total from investment operations | 1.44 | (0.76) | 1.89 | (1.68) | 2.46 |
| Less distributions | |||||
| From net investment income | (0.62) | (0.42) | (0.67) | (0.86) | (0.49) |
| From net realized gain | — | — | — | (0.39) | (1.17) |
| From tax return of capital | (0.54) | (0.91) | (0.83) | (0.25) | — |
| Total distributions | (1.16) | (1.33) | (1.50) | (1.50) | (1.66) |
| Net asset value, end of period | $13.04 | $12.76 | $14.85 | $14.46 | $17.64 |
| Per share market value, end of period | $13.00 | $11.44 | $14.91 | $13.08 | $17.41 |
| Total return at net asset value (%)2,3 | 11.69 | (2.99) | 13.89 | (9.61) | 15.15 |
| Total return at market value (%)2 | 24.20 | (13.37) | 26.41 | (17.16) | 21.74 |
| Ratios and supplemental data | |||||
| Net assets, end of period (in millions) | $159 | $156 | $182 | $177 | $215 |
| Ratios (as a percentage of average net assets): | |||||
| Expenses before reductions | 1.17 | 1.18 | 1.15 | 1.14 | 1.13 |
| Expenses including reductions | 1.16 | 1.18 | 1.14 | 1.13 | 1.13 |
| Net investment income | 3.98 | 3.14 | 3.97 | 3.83 | 2.99 |
| Portfolio turnover (%) | 120 | 117 | 125 | 96 | 93 |
| 1 | Based on average daily shares outstanding. |
| 2 | Total return based on net asset value reflects changes in the fund’s net asset value during each period. Total return based on market value reflects changes in market value. Each figure assumes that distributions from income, capital gains and tax return of capital, if any, were reinvested. |
| 3 | Total returns would have been lower had certain expenses not been reduced during the applicable periods. |
| SEE NOTES TO FINANCIAL STATEMENTS | ANNUAL REPORT | JOHN HANCOCK Hedged Equity & Income Fund | 38 |
Notes to financial statements
Note 1—Organization
John Hancock Hedged Equity &
Income Fund (the fund) is a closed-end management investment company organized as a Massachusetts business trust and registered under the Investment Company Act of 1940, as amended (the 1940 Act).
Note 2—Significant accounting policies
The financial statements have been
prepared in conformity with accounting principles generally accepted in the United States of America (US GAAP), which require management to make certain estimates and assumptions as of the date of the financial
statements. Actual results could differ from those estimates and those differences could be significant. The fund qualifies as an investment company under Topic 946 of Accounting Standards Codification of US GAAP.
Events or transactions occurring
after the end of the fiscal period through the date that the financial statements were issued have been evaluated in the preparation of the financial statements. The following summarizes the significant accounting
policies of the fund:
Security valuation. Investments are stated at value as of the scheduled close of regular trading on the New York Stock Exchange (NYSE), normally at 4:00 P.M., Eastern Time. In case of emergency or other
disruption resulting in the NYSE not opening for trading or the NYSE closing at a time other than the regularly scheduled close, the net asset value (NAV) may be determined as of the regularly scheduled close of the
NYSE pursuant to the fund’s Valuation Policies and Procedures.
In order to value the securities,
the fund uses the following valuation techniques: Equity securities, including exchange-traded or closed-end funds, are typically valued at the last sale price or official closing price on the exchange or principal
market where the security trades. In the event there were no sales during the day or closing prices are not available, the securities are valued using the last available bid price. Debt obligations are typically
valued based on evaluated prices provided by an independent pricing vendor. Independent pricing vendors utilize matrix pricing, which takes into account factors such as institutional-size trading in similar groups of
securities, yield, quality, coupon rate, maturity, type of issue, trading characteristics and other market data, as well as broker supplied prices. Futures contracts whose settlement prices are determined as of the
close of the NYSE are typically valued based on the settlement price while other futures contracts are typically valued at the last traded price on the exchange on which they trade. Foreign equity index futures that
trade in the electronic trading market subsequent to the close of regular trading may be valued at the last traded price in the electronic trading market as of 4:00 P.M. ET, or may be fair valued based on fair value
adjustment factors provided by an independent pricing vendor in order to adjust for events that may occur between the close of foreign exchanges or markets and the close of the NYSE. Forward foreign currency contracts
are valued at the prevailing forward rates which are based on foreign currency exchange spot rates and forward points supplied by an independent pricing vendor. Foreign securities and currencies are valued in U.S.
dollars based on foreign currency exchange rates supplied by an independent pricing vendor.
In certain instances, the Pricing
Committee may determine to value equity securities using prices obtained from another exchange or market if trading on the exchange or market on which prices are typically obtained did not open for trading as
scheduled, or if trading closed earlier than scheduled, and trading occurred as normal on another exchange or market.
Other portfolio securities and
assets, for which reliable market quotations are not readily available, are valued at fair value as determined in good faith by the fund’s Pricing Committee following procedures established by the Board of
Trustees. The frequency with which these fair valuation procedures are used cannot be predicted and fair value of securities may differ significantly from the value that would have been used had a ready market for
such securities existed. Trading in foreign securities may be completed before the scheduled daily close of trading on the NYSE. Significant events at the issuer or market level may affect the values of securities
between the time when the valuation of the securities is generally determined and the close of the NYSE. If a significant event occurs,
| 39 | JOHN HANCOCK Hedged Equity & Income Fund | ANNUAL REPORT |
these securities may be fair valued, as determined
in good faith by the fund’s Pricing Committee, following procedures established by the Board of Trustees. The fund uses fair value adjustment factors provided by an independent pricing vendor to value certain
foreign securities in order to adjust for events that may occur between the close of foreign exchanges or markets and the close of the NYSE.
The fund uses a three-tier hierarchy
to prioritize the pricing assumptions, referred to as inputs, used in valuation techniques to measure fair value. Level 1 includes securities valued using quoted prices in active markets for identical securities,
including registered investment companies. Level 2 includes securities valued using other significant observable inputs. Observable inputs may include quoted prices for similar securities, interest rates, prepayment
speeds and credit risk. Prices for securities valued using these inputs are received from independent pricing vendors and brokers and are based on an evaluation of the inputs described. Level 3 includes securities
valued using significant unobservable inputs when market prices are not readily available or reliable, including the fund’s own assumptions in determining the fair value of investments. Factors used in
determining value may include market or issuer specific events or trends, changes in interest rates and credit quality. The inputs or methodology used for valuing securities are not necessarily an indication of the
risks associated with investing in those securities. Changes in valuation techniques and related inputs may result in transfers into or out of an assigned level within the disclosure hierarchy.
The following is a summary of the
values by input classification of the fund’s investments as of December 31, 2021, by major security category or type:
| Total value at 12-31-21 | Level 1 quoted price | Level 2 significant observable inputs | Level 3 significant unobservable inputs | |
| Investments in securities: | ||||
| Assets | ||||
| Common stocks | ||||
| Communication services | $10,976,439 | $4,981,051 | $5,995,388 | — |
| Consumer discretionary | 10,605,918 | 2,845,116 | 7,760,802 | — |
| Consumer staples | 8,721,553 | 6,494,136 | 2,227,417 | — |
| Energy | 12,257,291 | 6,998,439 | 5,258,852 | — |
| Financials | 28,616,066 | 12,413,178 | 16,202,888 | — |
| Health care | 17,906,449 | 13,159,204 | 4,747,245 | — |
| Industrials | 10,904,487 | 4,070,138 | 6,834,349 | — |
| Information technology | 15,249,113 | 8,986,488 | 6,262,625 | — |
| Materials | 6,154,392 | 1,210,358 | 4,944,034 | — |
| Real estate | 4,177,375 | 2,933,747 | 1,243,628 | — |
| Utilities | 7,263,789 | 4,959,820 | 2,303,969 | — |
| Preferred securities | 536,725 | — | 536,725 | — |
| Exchange-traded funds | 192,422 | 192,422 | — | — |
| Closed-end funds | 49,445 | 49,445 | — | — |
| Foreign government obligations | 50,439 | — | 50,439 | — |
| Corporate bonds | 20,654,282 | — | 20,654,282 | — |
| Convertible bonds | 460,058 | — | 460,058 | — |
| Term loans | 570,042 | — | 570,042 | — |
| Short-term investments | 1,300,000 | — | 1,300,000 | — |
| Total investments in securities | $156,646,285 | $69,293,542 | $87,352,743 | — |
| ANNUAL REPORT | JOHN HANCOCK Hedged Equity & Income Fund | 40 |
| Total value at 12-31-21 | Level 1 quoted price | Level 2 significant observable inputs | Level 3 significant unobservable inputs | |
| Derivatives: | ||||
| Assets | ||||
| Forward foreign currency contracts | $21,844 | — | $21,844 | — |
| Liabilities | ||||
| Futures | (456,813) | $(456,813) | — | — |
| Forward foreign currency contracts | (121,927) | — | (121,927) | — |
| Level 3 includes securities valued at $0. Refer to Fund’s investments. | ||||
Repurchase agreements. The fund may enter into repurchase agreements. When the fund enters into a repurchase agreement, it receives collateral that is held in a segregated account by the fund’s custodian,
or for tri-party repurchase agreements, collateral is held at a third-party custodian bank in a segregated account for the benefit of the fund. The collateral amount is marked-to-market and monitored on a daily basis
to ensure that the collateral held is in an amount not less than the principal amount of the repurchase agreement plus any accrued interest. Collateral received by the fund for repurchase agreements is disclosed in
the Fund’s investments as part of the caption related to the repurchase agreement.
Repurchase agreements are typically
governed by the terms and conditions of the Master Repurchase Agreement and/or Global Master Repurchase Agreement (collectively, MRA). Upon an event of default, the non-defaulting party may close out all transactions
traded under the MRA and net amounts owed. Absent an event of default, assets and liabilities resulting from repurchase agreements are not offset in the Statement of assets and liabilities. In the event of a default
by the counterparty, realization of the collateral proceeds could be delayed, during which time the collateral value may decline or the counterparty may have insufficient assets to pay claims resulting from close-out
of the transactions.
Real estate investment trusts. The fund may invest in real estate investment trusts (REITs). Distributions from REITs may be recorded as income and subsequently characterized by the REIT at the end of their fiscal year
as a reduction of cost of investments and/or as a realized gain. As a result, the fund will estimate the components of distributions from these securities. Such estimates are revised when the actual components of the
distributions are known.
Security transactions and related
investment income. Investment security transactions are accounted for on a trade date plus one basis for daily NAV calculations. However, for financial reporting purposes, investment transactions are
reported on trade date. Interest income is accrued as earned. Interest income includes coupon interest and amortization/accretion of premiums/discounts on debt securities. Debt obligations may be placed in a
non-accrual status and related interest income may be reduced by stopping current accruals and writing off interest receivable when the collection of all or a portion of interest has become doubtful. Dividend income
is recorded on ex-date, except for dividends of certain foreign securities where the dividend may not be known until after the ex-date. In those cases, dividend income, net of withholding taxes, is recorded when the
fund becomes aware of the dividends. Non-cash dividends, if any, are recorded at the fair market value of the securities received. Distributions received on securities that represent a tax return of capital and/or
capital gain, if any, are recorded as a reduction of cost of investments and/or as a realized gain, if amounts are estimable. Gains and losses on securities sold are determined on the basis of identified cost and may
include proceeds from litigation.
Foreign investing. Assets, including investments, and liabilities denominated in foreign currencies are translated into U.S. dollar values each day at the prevailing exchange rate. Purchases and sales of
securities, income and expenses are translated into U.S. dollars at the prevailing exchange rate on the date of the transaction. The effect of changes in foreign currency exchange rates on the value of securities is
reflected as a component of the realized and unrealized gains (losses) on investments. Foreign investments are subject to a decline in the value of a foreign currency versus the U.S. dollar, which reduces the dollar
value of securities denominated in that currency.
| 41 | JOHN HANCOCK Hedged Equity & Income Fund | ANNUAL REPORT |
Funds that invest internationally
generally carry more risk than funds that invest strictly in U.S. securities. These risks are heightened for investments in emerging markets. Risks can result from differences in economic and political conditions,
regulations, market practices (including higher transaction costs), accounting standards and other factors.
Foreign taxes. The fund may be subject to withholding tax on income, capital gains or repatriations imposed by certain countries, a portion of which may be recoverable. Foreign taxes are accrued based
upon the fund’s understanding of the tax rules and rates that exist in the foreign markets in which it invests. Taxes are accrued based on gains realized by the fund as a result of certain foreign security
sales. In certain circumstances, estimated taxes are accrued based on unrealized appreciation of such securities. Investment income is recorded net of foreign withholding taxes.
Overdrafts. Pursuant to the custodian agreement, the fund’s custodian may, in its discretion, advance funds to the fund to make properly authorized payments. When such payments result in an
overdraft, the fund is obligated to repay the custodian for any overdraft, including any costs or expenses associated with the overdraft. The custodian may have a lien, security interest or security entitlement in any
fund property that is not otherwise segregated or pledged, to the maximum extent permitted by law, to the extent of any overdraft.
Expenses. Within the John Hancock group of funds complex, expenses that are directly attributable to an individual fund are allocated to such fund. Expenses that are not readily attributable to a
specific fund are allocated among all funds in an equitable manner, taking into consideration, among other things, the nature and type of expense and the fund’s relative net assets. Expense estimates are accrued
in the period to which they relate and adjustments are made when actual amounts are known.
Federal income taxes. The fund intends to continue to qualify as a regulated investment company by complying with the applicable provisions of the Internal Revenue Code and will not be subject to federal income
tax on taxable income that is distributed to shareholders. Therefore, no federal income tax provision is required.
For federal income tax purposes, as
of December 31, 2021, the fund has a short-term capital loss carryforward of $8,088,419 and a long-term capital loss carryforward of $12,580,512 available to offset future net realized capital gains. These
carryforwards do not expire.
As of December 31, 2021, the fund
had no uncertain tax positions that would require financial statement recognition, derecognition or disclosure. The fund’s federal tax returns are subject to examination by the Internal Revenue Service for a
period of three years.
Managed distribution plan. The fund has adopted a managed distribution plan (Plan). Under the current Plan, the fund makes quarterly distributions of an amount equal to $0.2900 per share, which will be paid
quarterly until further notice.
Distributions under the Plan may
consist of net investment income, net realized capital gains and, to the extent necessary, return of capital. Return of capital distributions may be necessary when the fund’s net investment income and net
capital gains are insufficient to meet the minimum distribution. In addition, the fund may also make additional distributions for the purpose of not incurring federal income and excise taxes.
The Board of Trustees may terminate
or reduce the amount paid under the Plan at any time. The termination or reduction may have an adverse effect on the market price of the fund’s shares.
Distribution of income and
gains. Distributions to shareholders from net investment income and net realized gains, if any, are recorded on the ex-date. The fund generally declares and pays dividends quarterly pursuant to
the Managed Distribution Plan described above. Capital gain distributions, if any, are typically distributed annually.
| ANNUAL REPORT | JOHN HANCOCK Hedged Equity & Income Fund | 42 |
The tax character of distributions
for the years ended December 31, 2021 and 2020 was as follows:
| December 31, 2021 | December 31, 2020 | |
| Ordinary income | $7,598,557 | $5,112,494 |
| Return of capital | 6,581,066 | 11,169,625 |
| Total | $14,179,623 | $16,282,119 |
As of December 31, 2021, there were
no distributable earnings on a tax basis.
Such distributions and distributable
earnings, on a tax basis, are determined in conformity with income tax regulations, which may differ from US GAAP. Distributions in excess of tax basis earnings and profits, if any, are reported in the fund’s
financial statements as a return of capital.
Capital accounts within the
financial statements are adjusted for permanent book-tax differences. These adjustments have no impact on net assets or the results of operations. Temporary book-tax differences, if any, will reverse in a subsequent
period. Book-tax differences are primarily attributable to foreign currency transactions, investments in passive foreign investment companies, derivative transactions, partnerships and wash sale loss deferrals.
Note 3—Derivative instruments
The fund may invest in derivatives
in order to meet its investment objective. Derivatives include a variety of different instruments that may be traded in the over-the-counter (OTC) market, on a regulated exchange or through a clearing facility. The
risks in using derivatives vary depending upon the structure of the instruments, including the use of leverage, optionality, the liquidity or lack of liquidity of the contract, the creditworthiness of the counterparty
or clearing organization and the volatility of the position. Some derivatives involve risks that are potentially greater than the risks associated with investing directly in the referenced securities or other
referenced underlying instrument. Specifically, the fund is exposed to the risk that the counterparty to an OTC derivatives contract will be unable or unwilling to make timely settlement payments or otherwise honor
its obligations. OTC derivatives transactions typically can only be closed out with the other party to the transaction.
Derivatives which are typically
traded through the OTC market are regulated by the Commodity Futures Trading Commission (the CFTC). Derivative counterparty risk is managed through an ongoing evaluation of the creditworthiness of all potential
counterparties and, if applicable, designated clearing organizations. The fund attempts to reduce its exposure to counterparty risk for derivatives traded in the OTC market, whenever possible, by entering into an
International Swaps and Derivatives Association (ISDA) Master Agreement with each of its OTC counterparties. The ISDA gives each party to the agreement the right to terminate all transactions traded under the
agreement if there is certain deterioration in the credit quality or contractual default of the other party, as defined in the ISDA. Upon an event of default or a termination of the ISDA, the non-defaulting party has
the right to close out all transactions and to net amounts owed.
As defined by the ISDA, the fund may
have collateral agreements with certain counterparties to mitigate counterparty risk on OTC derivatives. Subject to established minimum levels, collateral for OTC transactions is generally determined based on the net
aggregate unrealized gain or loss on contracts with a particular counterparty. Collateral pledged to the fund, if any, is held in a segregated account by a third-party agent or held by the custodian bank for the
benefit of the fund and can be in the form of cash or debt securities issued by the U.S. government or related agencies; collateral posted by the fund, if any, for OTC transactions is held in a segregated account at
the fund’s custodian and is noted in the accompanying Fund’s investments, or if cash is posted, on the Statement of assets and liabilities. The fund’s risk of loss due to counterparty risk is equal
to the asset value of outstanding contracts offset by collateral received.
| 43 | JOHN HANCOCK Hedged Equity & Income Fund | ANNUAL REPORT |
Certain derivatives are traded or
cleared on an exchange or central clearinghouse. Exchange-traded or centrally-cleared transactions generally present less counterparty risk to a fund than OTC transactions. The exchange or clearinghouse stands between
the fund and the broker to the contract and therefore, credit risk is generally limited to the failure of the exchange or clearinghouse and the clearing member.
Futures. A futures contract is a contractual agreement to buy or sell a particular currency or financial instrument at a pre-determined price in the future. Futures are traded on an exchange and
cleared through a central clearinghouse. Risks related to the use of futures contracts include possible illiquidity of the futures markets and contract prices that can be highly volatile and imperfectly correlated to
movements in the underlying financial instrument and potential losses in excess of the amounts recognized on the Statement of assets and liabilities. Use of long futures contracts subjects the fund to the risk of loss
up to the notional value of the futures contracts. Use of short futures contracts subjects the fund to unlimited risk of loss.
Upon entering into a futures
contract, the fund is required to deposit initial margin with the broker in the form of cash or securities. The amount of required margin is set by the broker and is generally based on a percentage of the contract
value. The margin deposit must then be maintained at the established level over the life of the contract. Cash that has been pledged by the fund, if any, is detailed in the Statement of assets and liabilities as
Collateral held at broker for futures contracts. Securities pledged by the fund, if any, are identified in the Fund’s investments. Subsequent payments, referred to as variation margin, are made or received by
the fund periodically and are based on changes in the market value of open futures contracts. Futures contracts are marked-to-market daily and unrealized gain or loss is recorded by the fund. Receivable for futures
variation margin is included on the Statement of assets and liabilities. When the contract is closed, the fund records a realized gain or loss equal to the difference between the value of the contract at the time it
was opened and the value at the time it was closed.
During the year ended December 31,
2021, the fund used futures contracts to manage against changes in certain securities markets. The fund held futures contracts with USD notional values ranging from $21.3 million to $32.7 million as measured at each
quarter end.
Forward foreign currency
contracts. A forward foreign currency contract is an agreement between two parties to buy and sell specific currencies at a price that is set on the date of the contract. The forward contract calls
for delivery of the currencies on a future date that is specified in the contract. Forwards are typically traded OTC. Risks related to the use of forwards include the possible failure of counterparties to meet the
terms of the forward agreement, the failure of the counterparties to timely post collateral if applicable, and the risk that currency movements will not favor the fund thereby reducing the fund’s total return,
and the potential for losses in excess of the amounts recognized on the Statement of assets and liabilities.
The market value of a forward
foreign currency contract fluctuates with changes in foreign currency exchange rates. Forward foreign currency contracts are marked-to-market daily and the change in value is recorded by the fund as an unrealized gain
or loss. Realized gains or losses, equal to the difference between the value of the contract at the time it was opened and the value at the time it was closed, are recorded upon delivery or receipt of the currency or
settlement with the counterparty.
During the year ended December 31,
2021, the fund used forward foreign currency contracts to manage against changes in foreign currency exchange rates and to gain exposure to foreign currencies. The fund held forward foreign currency contracts with USD
notional values ranging from $11.5 million to $15.4 million as measured at each quarter end.
Options. There are two types of options, put options and call options. Options are traded either OTC or on an exchange. A call option gives the purchaser of the option the right to buy (and the
seller the obligation to sell) the underlying asset at the exercise price. A put option gives the purchaser of the option the right to sell (and the writer the obligation to buy) the underlying asset at the exercise
price. Writing puts and buying calls may increase the fund’s exposure to changes in the value of the underlying instrument. Buying puts and writing calls may decrease the fund’s exposure to such changes.
Risks related to the use of options include the loss of premiums on
| ANNUAL REPORT | JOHN HANCOCK Hedged Equity & Income Fund | 44 |
purchased options, possible illiquidity of the
options markets, trading restrictions imposed by an exchange and movements in underlying security values, and for written options, potential losses in excess of the amounts recognized on the Statement of assets and
liabilities. In addition, OTC options are subject to the risks of all OTC derivatives contracts.
Purchased options are included in
the Fund’s investments and are subsequently “marked-to-market” to reflect current market value. If a purchased option expires, the fund realizes a loss equal to the premium paid for the option.
Premiums paid for purchased options which are exercised or closed are added to the amounts paid or offset against the proceeds on the underlying asset transaction to determine the realized gain (loss). Written options
are included as liabilities in the Statement of assets and liabilities and are “marked-to-market” to reflect the current market value. If the written option expires, the fund realizes a gain equal to the
premium received. Premiums received from writing options which are exercised or closed are added to the proceeds or offset against amounts paid on the underlying asset transaction to determine the realized gain
(loss).
During the year ended December 31,
2021, the fund wrote option contracts to generate income from options premiums. The fund held written option contracts with market values ranging up to $236,000 as measured at each quarter end. There were no open
written option contracts as of December 31, 2021.
Fair value of derivative instruments
by risk category
The table below summarizes the fair
value of derivatives held by the fund at December 31, 2021 by risk category:
| Risk | Statement of assets and liabilities location | Financial instruments location | Assets derivatives fair value | Liabilities derivatives fair value |
| Equity | Receivable/payable for futures variation margin1 | Futures | — | $(456,813) |
| Currency | Unrealized appreciation (depreciation) on forward foreign currency contracts | Forward foreign currency contracts | $21,844 | (121,927) |
| $21,844 | $(578,740) |
| 1 | Reflects cumulative appreciation/depreciation on open futures as disclosed in the Derivatives section of Fund’s investments. Only the year end variation margin receivable/payable is separately reported on the Statement of assets and liabilities. |
For financial reporting purposes,
the fund does not offset OTC derivative assets or liabilities that are subject to master netting arrangements, as defined by the ISDAs, in the Statement of assets and liabilities. In the event of default by the
counterparty or a termination of the agreement, the ISDA allows an offset of amounts across the various transactions between the fund and the applicable counterparty.
Effect of derivative instruments on
the Statement of operations
The table below summarizes the net
realized gain (loss) included in the net increase (decrease) in net assets from operations, classified by derivative instrument and risk category, for the year ended December 31, 2021:
| Statement of operations location - Net realized gain (loss) on: | ||||
| Risk | Futures contracts | Forward foreign currency contracts | Written options | Total |
| Currency | — | $802,974 | — | $802,974 |
| Equity | $(4,448,569) | — | $(432,230) | (4,880,799) |
| Total | $(4,448,569) | $802,974 | $(432,230) | $(4,077,825) |
| 45 | JOHN HANCOCK Hedged Equity & Income Fund | ANNUAL REPORT |
The table below summarizes the net
change in unrealized appreciation (depreciation) included in the net increase (decrease) in net assets from operations, classified by derivative instrument and risk category, for the year ended December 31, 2021:
| Statement of operations location - Change in net unrealized appreciation (depreciation) of: | |||
| Risk | Futures contracts | Forward foreign currency contracts | Total |
| Currency | — | $5,305 | $5,305 |
| Equity | $29,727 | — | 29,727 |
| Total | $29,727 | $5,305 | $35,032 |
Note 4—Guarantees and indemnifications
Under the fund’s
organizational documents, its Officers and Trustees are indemnified against certain liabilities arising out of the performance of their duties to the fund. Additionally, in the normal course of business, the fund
enters into contracts with service providers that contain general indemnification clauses. The fund’s maximum exposure under these arrangements is unknown, as this would involve future claims that may be made
against the fund that have not yet occurred. The risk of material loss from such claims is considered remote.
Note 5—Fees and transactions with affiliates
John Hancock Investment Management
LLC (the Advisor) serves as investment advisor for the fund. The Advisor is an indirect, principally owned subsidiary of John Hancock Life Insurance Company (U.S.A), which in turn is a subsidiary of Manulife Financial
Corporation (MFC).
Management fee. The fund has an investment management agreement with the Advisor under which the fund pays a daily management fee to the Advisor equivalent on an annual basis to 0.95% of the
fund’s average daily gross assets. The Advisor has a subadvisory agreement with Wellington Management Company LLP. The fund is not responsible for payment of the subadvisory fees.
The Advisor has contractually agreed
to waive a portion of its management fee and/or reimburse expenses for certain funds of the John Hancock group of funds complex, including the fund (the participating portfolios). This waiver is based upon aggregate
net assets of all the participating portfolios. The amount of the reimbursement is calculated daily and allocated among all the participating portfolios in proportion to the daily net assets of each fund. During the
year ended December 31, 2021, this waiver amounted to 0.01% of the fund’s average daily net assets. This arrangement expires on July 31, 2023, unless renewed by mutual agreement of the fund and the Advisor based
upon a determination that this is appropriate under the circumstances at that time.
The expense reductions described
above amounted to $14,528 for the year ended December 31, 2021.
Expenses waived or reimbursed in the
current fiscal period are not subject to recapture in future fiscal periods.
The investment management fees,
including the impact of the waivers and reimbursements as described above, incurred for the year ended December 31, 2021, were equivalent to a net annual effective rate of 0.94% of the fund’s average daily
managed net assets.
Accounting and legal services. Pursuant to a service agreement, the fund reimburses the Advisor for all expenses associated with providing the administrative, financial, legal, compliance, accounting and recordkeeping
services to the fund, including the preparation of all tax returns, periodic reports to shareholders and regulatory reports, among other services. These accounting and legal services fees incurred, for the year ended
December 31, 2021, amounted to an annual rate of 0.01% of the fund’s average daily managed net assets.
| ANNUAL REPORT | JOHN HANCOCK Hedged Equity & Income Fund | 46 |
Trustee expenses. The fund compensates each Trustee who is not an employee of the Advisor or its affiliates. These Trustees receive from the fund and the other John Hancock closed-end funds an annual
retainer. In addition, Trustee out-of-pocket expenses are allocated to each fund based on its net assets relative to other funds within the John Hancock group of funds complex.
Note 6—Fund share transactions
On December 6, 2011, the Board of
Trustees approved a share repurchase plan, which is subsequently reviewed by the Board of Trustees each year in December. Under the current share repurchase plan, the fund may purchase in the open market, between
January 1, 2022 and December 31, 2022 up to 10% of its outstanding common shares as of December 31, 2021. The current share repurchase plan will remain in effect between January 1, 2022 and December 31, 2022.
During the years ended December 31,
2021 and 2020, the fund had no activities under the repurchase program. Shares repurchased and corresponding dollar amounts, if any, are included on the Statements of changes in net assets. The anti-dilutive impacts
of these share repurchases, if any, are included on the Financial highlights.
Note 7—Purchase and sale of securities
Purchases and sales of securities,
other than short-term investments, amounted to $184,971,418 and $194,684,100, respectively, for the year ended December 31, 2021.
Note 8—Restricted securities
The fund may hold restricted
securities which are restricted as to resale and the fund has limited rights to registration under the Securities Act of 1933. Disposal may involve time-consuming negotiations and expenses, and prompt sale at an
acceptable price may be difficult to achieve. The following table summarizes the restricted securities held at December 31, 2021:
| Issuer, Description | Original acquisition date | Acquisition cost | Beginning share amount | Shares purchased | Shares sold | Ending share amount | Value as a percentage of net assets | Ending value |
| Allstar Co-Invest LLC (LLC Interest) | 8-1-11 | $240,553 | 236,300 | — | — | 236,300 | 0.0% | $0 |
Note 9—LIBOR discontinuation risk
LIBOR (London Interbank Offered
Rate) is a measure of the average interest rate at which major global banks can borrow from one another. Following allegations of rate manipulation and concerns regarding its thin liquidity, in July 2017, the U.K.
Financial Conduct Authority, which regulates LIBOR, announced that it will stop encouraging banks to provide the quotations needed to sustain LIBOR. As market participants transition away from LIBOR, LIBOR’s
usefulness may deteriorate. The transition process may lead to increased volatility and illiquidity in markets that currently rely on LIBOR to determine interest rates. LIBOR’s deterioration may adversely affect
the liquidity and/or market value of securities that use LIBOR as a benchmark interest rate.
The ICE Benchmark Administration
Limited, the administrator of LIBOR, ceased publishing most LIBOR maturities, including some US LIBOR maturities, on December 31, 2021, and is expected to cease publishing the remaining and most liquid US LIBOR
maturities on June 30, 2023. It is expected that market participants will transition to the use of alternative reference or benchmark rates prior to the applicable LIBOR publication cessation date. However, although
regulators have encouraged the development and adoption of alternative rates such as the Secured Overnight Financing Rate ("SOFR"), the future utilization of LIBOR or of any particular replacement rate remains
uncertain.
The impact on the transition away
from LIBOR referenced financial instruments remains uncertain. It is expected that market participants will amend such financial instruments to include fallback provisions and other measures that contemplate the
discontinuation of LIBOR. To facilitate the transition of legacy derivatives contracts
| 47 | JOHN HANCOCK Hedged Equity & Income Fund | ANNUAL REPORT |
referencing LIBOR, the International Swaps and
Derivatives Association, Inc. launched a protocol to incorporate fallback provisions. There are obstacles to converting certain longer term securities to a new benchmark or benchmarks and the effectiveness of one
versus multiple alternative reference rates has not been determined. Certain proposed replacement rates, such as SOFR, are materially different from LIBOR, and will require changes to the applicable spreads.
Furthermore, the risks associated with the conversion from LIBOR may be exacerbated if an orderly transition is not completed in a timely manner.
Note 10—Coronavirus (COVID-19) pandemic
The novel COVID-19 disease has
resulted in significant disruptions to global business activity. A widespread health crisis such as a global pandemic could cause substantial market volatility, exchange trading suspensions and closures, which may
lead to less liquidity in certain instruments, industries, sectors or the markets generally, and may ultimately affect fund performance.
Note 11—New accounting pronouncement
In March 2020, the Financial
Accounting Standards Board (FASB) issued an Accounting Standards Update (ASU), ASU 2020-04, which provides optional, temporary relief with respect to the financial reporting of contracts subject to certain types of
modifications due to the planned discontinuation of the LIBOR and other IBOR-based reference rates as of the end of 2021. The temporary relief provided by ASU 2020-04 is effective for certain reference rate-related
contract modifications that occur during the period March 12, 2020 through December 31, 2022. Management expects that the adoption of the guidance will not have a material impact to the financial statements.
| ANNUAL REPORT | JOHN HANCOCK Hedged Equity & Income Fund | 48 |
Report of Independent Registered
Public Accounting Firm
To the Board of Trustees and
Shareholders of John Hancock Hedged Equity & Income Fund
Opinion on the Financial Statements
We have audited the accompanying
statement of assets and liabilities, including the fund’s investments, of John Hancock Hedged Equity & Income Fund (the "Fund") as of December 31, 2021, the related statement of operations for the year ended
December 31, 2021, the statements of changes in net assets for each of the two years in the period ended December 31, 2021, including the related notes, and the financial highlights for each of the five years in the
period ended December 31, 2021 (collectively referred to as the “financial statements”). In our opinion, the financial statements present fairly, in all material respects, the financial position of the
Fund as of December 31, 2021, the results of its operations for the year then ended, the changes in its net assets for each of the two years in the period ended December 31, 2021 and the financial highlights for each
of the five years in the period ended December 31, 2021 in conformity with accounting principles generally accepted in the United States of America.
Basis for Opinion
These financial statements are the
responsibility of the Fund’s management. Our responsibility is to express an opinion on the Fund’s financial statements based on our audits. We are a public accounting firm registered with the Public
Company Accounting Oversight Board (United States) (PCAOB) and are required to be independent with respect to the Fund in accordance with the U.S. federal securities laws and the applicable rules and regulations of
the Securities and Exchange Commission and the PCAOB.
We conducted our audits of these
financial statements in accordance with the standards of the PCAOB. Those standards require that we plan and perform the audit to obtain reasonable assurance about whether the financial statements are free of material
misstatement, whether due to error or fraud.
Our audits included performing
procedures to assess the risks of material misstatement of the financial statements, whether due to error or fraud, and performing procedures that respond to those risks. Such procedures included examining, on a test
basis, evidence regarding the amounts and disclosures in the financial statements. Our audits also included evaluating the accounting principles used and significant estimates made by management, as well as evaluating
the overall presentation of the financial statements. Our procedures included confirmation of securities owned as of December 31, 2021 by correspondence with the custodian, agent banks and brokers; when replies were
not received from brokers, we performed other auditing procedures. We believe that our audits provide a reasonable basis for our opinion.
/s/ PricewaterhouseCoopers LLP
Boston, Massachusetts
February 9, 2022
We have served as the auditor of one
or more investment companies in the John Hancock group of funds since 1988.
| 49 | JOHN HANCOCK HEDGED EQUITY & INCOME FUND | ANNUAL REPORT |
Tax information
(Unaudited)
For federal income tax purposes, the
following information is furnished with respect to the distributions of the fund, if any, paid during its taxable year ended December 31, 2021.
The fund reports the maximum amount
allowable of its net taxable income as eligible for the corporate dividends-received deduction.
The fund reports the maximum amount
allowable of its net taxable income as qualified dividend income as provided in the Jobs and Growth Tax Relief Reconciliation Act of 2003.
The fund reports the maximum amount
allowable as Section 163(j) Interest Dividends.
Income derived from foreign sources
was $5,691,627. The fund intends to pass through foreign tax credits of $672,858.
The fund reports the maximum amount
allowable of its Section 199A dividends as defined in Proposed Treasury Regulation §1.199A-3(d).
Eligible shareholders will be mailed
a 2021 Form 1099-DIV in early 2022. This will reflect the tax character of all distributions paid in calendar year 2021.
Please consult a tax advisor regarding
the tax consequences of your investment in the fund.
| ANNUAL REPORT | JOHN HANCOCK HEDGED EQUITY & INCOME FUND | 50 |
Investment objective, principal
investment strategies, and principal risks
Unaudited
Investment Objectives
The Fund’s investment
objective is to provide total return with a focus on current income and gains and also consisting of long-term capital appreciation.
Principal Investment Strategies
Under normal circumstances, the Fund
will invest at least 80% of its net assets (assets plus borrowings for investment purposes) in equity and equity-related securities, including common stock, preferred stock, depositary receipts (including American
Depositary Receipts and Global Depositary Receipts), index-related securities (including exchange traded funds (“ETFs”), options on equity securities and equity indexes, real estate investment structures
(including real estate investment trusts (“REITs”)), convertible securities, private placements, convertible preferred stock, rights, warrants, derivatives linked to equity securities or indexes and other
similar equity equivalents. The Fund may invest in listed and unlisted domestic and foreign equity and equity-related securities or instruments. These equity and equity-related instruments may include equity
securities of, or derivatives linked to, foreign issuers and indexes (including emerging market issuers or indexes). The Fund may invest in foreign issuers and foreign-currency securities without any limitation. The
Fund will notify shareholders at least 60 days prior to any change in this 80% policy.
The Fund uses an equity strategy
(the “Equity Strategy”) and an actively managed option overlay strategy (the “Option Strategy”) to pursue its investment objective. By combining these two strategies, the Fund seeks to provide
investors with a portfolio that will generate attractive long-term total returns with significant downside equity market protection.
The Equity Strategy will seek to
provide broad-based exposure to equity markets, while emphasizing downside equity market protection. The goal of the Equity Strategy is a broadly diversified equity portfolio that is generally fully invested and seeks
value across all market capitalization ranges, industries and sectors that seeks to participate in and capture the broader equity market returns in rising market conditions, while limiting losses relative to the
broader equity markets in declining market circumstances through an effective combination of equity investment strategies.
The Option Strategy will pursue two
goals: (i) to generate earnings for current distribution from option premiums; and (ii) downside equity market protection (through the use of U.S. equity index put options). The Option Strategy will seek to enhance
risk-adjusted returns, generate earnings from option premiums and reduce overall portfolio volatility. The Fund expects to write index call options on a substantial portion of the Fund’s common stock portfolio,
although this amount is expected to vary over time based upon U.S. equity market conditions and other factors, including the Advisor’s and Subadvisor’s assessment of market conditions and the liquidity
needs of the Fund to meet quarterly distributions.
The Fund anticipates writing index
call options on the S&P 500 Index (the “S&P 500”) with a typical expiration of approximately one month and with call strikes typically set slightly “out-of-the-money” (ranging from
approximately 0%-7% above the then-current value of the index). The Fund typically will limit notional exposure of the index call options from 0%-50% of the value of the Fund’s portfolio securities. In certain
circumstances or market conditions (including to meet distribution payments), the Subadvisor may write index call options on a lower percentage of the Fund’s portfolio.
The Option Strategy typically will
maintain an overall short position on the S&P 500 through its use of index call options. In certain circumstances, the Fund may trade out of its index option positions during an intra-month period to lock in a
gain, to limit risk, or to meet distribution payments. The Subadvisor retains the discretion to write call options on indices other than the S&P 500 if it deems this appropriate in particular market circumstances
or based upon the Fund’s stock holdings. A meaningful portion of the Fund’s stock holdings will normally consist
| 51 | JOHN HANCOCK HEDGED EQUITY & INCOME FUND | ANNUAL REPORT |
of stocks not included in the indices on which it
writes call options. The Fund expects to primarily use listed/exchange-traded options contracts but may also use over-the-counter (“OTC”) options. OTC options may be utilized to obtain exposure to specific
strike prices, expiration dates and/or exposure to underlying indices not available in the exchange-traded options market. The Fund may also invest in derivatives such as futures contracts and foreign currency forward
contracts.
The Fund may also invest up to 20%
of its net assets (plus borrowings for investment purposes) in fixed-income securities and fixed-income related instruments. These fixed-income securities may include non-investment grade (“high yield” or
“junk bond”) instruments.”
The manager may also take into
consideration environmental, social, and/or governance (“ESG”) factors, alongside other relevant factors, as part of its investment selection process. The ESG characteristics utilized in the Fund’s
investment process may change over time and one or more characteristics may not be relevant with respect to all issuers that are eligible Fund investments.
Principal Risks
As is the case with all
exchange-listed closed-end funds, shares of this fund may trade at a discount or a premium to the fund’s net asset value (NAV). An investment in the fund is subject to investment and market risks, including the
possible loss of the entire principal invested.
The fund’s main risks are
listed below in alphabetical order, not in order of importance.
Changing distribution level &
return of capital risk. There is no guarantee prior distribution levels will be maintained, and distributions may include a substantial tax return of capital. A return of capital is the return of all or a portion
of a shareholder’s investment in the fund. For the fiscal year ended December 31, 2021, the fund’s aggregate distributions included a return of capital of $0.54 per share, or 46.41% of aggregate
distributions, which could impact the tax treatment of a subsequent sale of fund shares.
Credit and counterparty risk. The issuer or guarantor of a fixed-income security, the counterparty to an over-the-counter derivatives contract, or a borrower of fund securities may not make timely payments or otherwise
honor its obligations. A downgrade or default affecting any of the fund’s securities could affect the fund’s performance.
Economic and market events risk. Events in the U.S. and global financial markets, including actions taken by the U.S. Federal Reserve or foreign central banks to stimulate or stabilize economic growth, may at times result
in unusually high market volatility, which could negatively impact performance. Reduced liquidity in credit and fixed-income markets could adversely affect issuers worldwide. Banks and financial services companies
could suffer losses if interest rates rise or economic conditions deteriorate.
A widespread health crisis such as a
global pandemic could cause substantial market volatility, exchange trading suspensions and closures, and affect fund performance. For example, the novel coronavirus disease (COVID-19) has resulted in significant
disruptions to global business activity. The impact of a health crisis and other epidemics and pandemics that may arise in the future, could affect the global economy in ways that cannot necessarily be foreseen at the
present time. A health crisis may exacerbate other preexisting political, social, and economic risks. Any such impact could adversely affect the fund’s performance, resulting in losses to your investment.
Equity securities risk. The price of equity securities may decline due to changes in a company’s financial condition or overall market conditions. Securities the manager believes are undervalued may never
realize their full potential value, and in certain markets value stocks may underperform the market as a whole.
ESG integration risk. The manager may consider ESG factors that it deems relevant or additive, along with other material factors and analysis, when selecting investments for the fund. ESG factors may include,
but are not limited to, matters regarding board diversity, climate change policies, and supply chain and human rights policies. The ESG characteristics utilized in the fund’s investment process may change over
time, and different ESG
| ANNUAL REPORT | JOHN HANCOCK HEDGED EQUITY & INCOME FUND | 52 |
characteristics may be relevant to different
investments. Incorporating ESG criteria and investing in instruments that have certain ESG characteristics, as determined by the Advisor, carries the risk that the fund may perform differently, including
underperforming, funds that do not utilize ESG criteria or an ESG investment strategy.
Exchange-traded funds (ETFs)
risk. The risks of owning shares of an ETF include the risks of owning the underlying securities the ETF holds. Lack of liquidity in an ETF could result in the ETF being more volatile than its
underlying securities. An ETF’s shares could trade at a significant premium or discount to its NAV. A fund bears ETF fees and expenses indirectly.
Fixed-income securities risk. A rise in interest rates typically causes bond prices to fall. The longer the average maturity or duration of the bonds held by a fund, the more sensitive it will likely be to
interest-rate fluctuations. An issuer may not make all interest payment or repay all or any of the principal borrowed. Changes in a security’s credit qualify may adversely affect fund performance. Increases in
real interest rates generally cause the price of inflation-protected debt securities to decrease.
Foreign securities risk. Less information may be publicly available regarding foreign issuers, including foreign government issuers. Foreign securities may be subject to foreign taxes and may be more volatile than
U.S. securities. Currency fluctuations and political and economic developments may adversely impact the value of foreign securities. The risks of investing in foreign securities are magnified in emerging markets. If
applicable, depositary receipts are subject to most of the risks associated with investing in foreign securities directly because the value of a depositary receipt is dependent upon the market price of the underlying
foreign equity security. Depositary receipts are also subject to liquidity risk.
Hedging, derivatives, and other
strategic transactions risk. Hedging, derivatives, and other strategic transactions may increase a fund’s volatility and could produce disproportionate losses, potentially more than the fund’s principal
investment. Risks of these transactions are different from and possibly greater than risks of investing directly in securities and other traditional instruments. Under certain market conditions, derivatives could
become harder to value or sell and may become subject to liquidity risk (i.e., the inability to enter into closing transactions). Derivatives and other strategic transactions that the fund intends to utilize include:
foreign currency forward contracts, futures contracts and options. Foreign currency forward contracts, futures contracts and options generally are subject to counterparty risk. Derivatives associated with foreign
currency transactions are subject to currency risk.
Illiquid and restricted
securities risk. Illiquid and restricted securities may be difficult to value and may involve greater risks than liquid securities. Illiquidity may have an adverse impact on a particular security’s
market price and the fund’s ability to sell the security.
Large company risk. Larger companies may grow more slowly than smaller companies or be slower to respond to business developments. Large-capitalization securities may underperform the market as a
whole.
LIBOR discontinuation risk. The publication of the London Interbank Offered Rate (LIBOR), which many debt securities, derivatives and other financial instruments use as the reference or benchmark rate for interest
rate calculations, was discontinued for most maturities at the end of 2021, and is expected to be discontinued on June 30, 2023 for the remaining maturities. The transition process away from LIBOR may lead to
increased volatility and illiquidity in markets that currently rely on LIBOR to determine interest rates, and the eventual use of an alternative reference rate may adversely affect the fund’s performance. In
addition, the usefulness of LIBOR may deteriorate in the period leading up to its discontinuation, which could adversely affect the liquidity or market value of securities that use LIBOR.
Liquidity risk. The extent (if at all) to which a security may be sold or a derivative position closed without negatively impacting its market value may be impaired by reduced market activity or
participation, legal restrictions, or other economic and market impediments. Widespread selling of fixed-income securities to satisfy
| 53 | JOHN HANCOCK HEDGED EQUITY & INCOME FUND | ANNUAL REPORT |
redemptions during periods of reduced demand may
adversely impact the price or salability of such securities. Periods of heavy redemption could cause the fund to sell assets at a loss or depressed value, which could negatively affect performance. Redemption risk is
heightened during periods of declining or illiquid markets.
Lower-rated and high-yield
fixed-income securities risk. Lower-rated and high-yield fixed-income securities (junk bonds) are subject to greater credit quality risk, risk of default, and price volatility than higher-rated fixed-income securities,
may be considered speculative, and can be difficult to resell.
Operational and cybersecurity
risk. Cybersecurity breaches may allow an unauthorized party to gain access to fund assets, customer data, or proprietary information, or cause a fund or its service providers to suffer data
corruption or lose operational functionality. Similar incidents affecting issuers of a fund’s securities may negatively impact performance. Operational risk may arise from human error, error by third parties,
communication errors, or technology failures, among other causes.
Preferred and convertible securities
risk. Preferred stock dividends are payable only if declared by the issuer’s board. Preferred stock may be subject to redemption provisions. The market values of convertible securities
tend to fall as interest rates rise and rise as interest rates fall. Convertible preferred stock’s value can depend heavily upon the underlying common stock’s value.
Real estate investment trust
risk. REITs, pooled investment vehicles that typically invest in real estate directly or in loans collateralized by real estate, carry risks associated with owning real estate, including the
potential for a decline in value due to economic or market conditions.
Real estate securities risk. Securities of companies in the real estate industry carry risks associated with owning real estate, including the potential for a decline in value due to economic or market
conditions.
Small and mid-sized company
risk. Small and mid-sized companies are generally less established and may be more volatile than larger companies. Small and/or mid-capitalization securities may underperform the market as a
whole.
| ANNUAL REPORT | JOHN HANCOCK HEDGED EQUITY & INCOME FUND | 54 |
ADDITIONAL INFORMATION
Unaudited
The fund is a closed-end,
diversified management investment company, common shares of which were initially offered to the public on May 26, 2011 and are publicly traded on the New York Stock Exchange (the NYSE).
Dividends and distributions
During the year ended December 31,
2021, distributions from net investment income totaling $0.6200 per share and tax return of capital totalling $0.5400 per share were paid to shareholders. The dates of payments and the amounts per share were as
follows:
| Payment Date | Income Distributions |
| March 31, 2021 | $0.2900 |
| June 30, 2021 | 0.2900 |
| September 30, 2021 | 0.2900 |
| December 31, 2021 | 0.2900 |
| Total | $1.1600 |
Dividend reinvestment plan
The fund’s Dividend
Reinvestment Plan (the Plan) provides that distributions of dividends and capital gains are automatically reinvested in common shares of the fund by Computershare Trust Company, N.A. (the Plan Agent). Every
shareholder holding at least one full share of the fund is entitled to participate in the Plan. In addition, every shareholder who became a shareholder of the fund after June 30, 2011, and holds at least one full
share of the fund will be automatically enrolled in the Plan. Shareholders may withdraw from the Plan at any time and shareholders who do not participate in the Plan will receive all distributions in cash.
If the fund declares a dividend or
distribution payable either in cash or in common shares of the fund and the market price of shares on the payment date for the distribution or dividend equals or exceeds the fund’s net asset value per share
(NAV), the fund will issue common shares to participants at a value equal to the higher of NAV or 95% of the market price. The number of additional shares to be credited to each participant’s account will be
determined by dividing the dollar amount of the distribution or dividend by the higher of NAV or 95% of the market price. If the market price is lower than NAV, or if dividends or distributions are payable only in
cash, then participants will receive shares purchased by the Plan Agent on participants’ behalf on the NYSE or otherwise on the open market. If the market price exceeds NAV before the Plan Agent has completed
its purchases, the average per share purchase price may exceed NAV, resulting in fewer shares being acquired than if the fund had issued new shares.
There are no brokerage charges with
respect to common shares issued directly by the fund. However, whenever shares are purchased or sold on the NYSE or otherwise on the open market, each participant will pay a pro rata portion of brokerage trading fees,
currently $0.05 per share purchased or sold. Brokerage trading fees will be deducted from amounts to be invested.
The reinvestment of dividends and
net capital gains distributions does not relieve participants of any income tax that may be payable on such dividends or distributions.
Shareholders participating in the
Plan may buy additional shares of the fund through the Plan at any time in amounts of at least $50 per investment, up to a maximum of $10,000, with a total calendar year limit of $100,000. Shareholders will be charged
a $5 transaction fee plus $0.05 per share brokerage trading fee for each order. Purchases of additional shares of the fund will be made on the open market. Shareholders who elect to utilize monthly electronic fund
transfers to buy additional shares of the fund will be charged a $2 transaction fee plus $0.05 per share brokerage trading fee for each automatic purchase. Shareholders can also sell fund shares held in the Plan
account at any time by contacting the Plan Agent by telephone, in writing or by visiting the Plan
| 55 | JOHN HANCOCK HEDGED EQUITY & INCOME FUND | ANNUAL REPORT |
Agent’s website at
www.computershare.com/investor. The Plan Agent will mail a check (less applicable brokerage trading fees) on settlement date. Pursuant to regulatory changes, effective September 5, 2017, the settlement date is changed
from three business days after the shares have been sold to two business days after the shares have been sold. If shareholders choose to sell shares through their stockbroker, they will need to request that the Plan
Agent electronically transfer those shares to their stockbroker through the Direct Registration System.
Shareholders participating in the
Plan may withdraw from the Plan at any time by contacting the Plan Agent by telephone, in writing or by visiting the Plan Agent’s website at www.computershare.com/investor. Such termination will be effective
immediately if the notice is received by the Plan Agent prior to any dividend or distribution record date; otherwise, such termination will be effective on the first trading day after the payment date for such
dividend or distribution, with respect to any subsequent dividend or distribution. If shareholders withdraw from the Plan, their shares will be credited to their account; or, if they wish, the Plan Agent will sell
their full and fractional shares and send the shareholders the proceeds, less a transaction fee of $5 and less brokerage trading fees of $0.05 per share. If a shareholder does not maintain at least one whole share of
common stock in the Plan account, the Plan Agent may terminate such shareholder’s participation in the Plan after written notice. Upon termination, shareholders will be sent a check for the cash value of any
fractional share in the Plan account, less any applicable broker commissions and taxes.
Shareholders who hold at least one
full share of the fund may join the Plan by notifying the Plan Agent by telephone, in writing or by visiting the Plan Agent’s website at www.computershare.com/investor. If received in proper form by the Plan
Agent before the record date of a dividend, the election will be effective with respect to all dividends paid after such record date. If shareholders wish to participate in the Plan and their shares are held in the
name of a brokerage firm, bank or other nominee, shareholders should contact their nominee to see if it will participate in the Plan. If shareholders wish to participate in the Plan, but their brokerage firm, bank or
other nominee is unable to participate on their behalf, they will need to request that their shares be re-registered in their own name, or they will not be able to participate. The Plan Agent will administer the Plan
on the basis of the number of shares certified from time to time by shareholders as representing the total amount registered in their name and held for their account by their nominee.
Experience under the Plan may
indicate that changes are desirable. Accordingly, the fund and the Plan Agent reserve the right to amend or terminate the Plan. Participants generally will receive written notice at least 90 days before the effective
date of any amendment. In the case of termination, participants will receive written notice at least 90 days before the record date for the payment of any dividend or distribution by the fund.
All correspondence or requests for
additional information about the Plan should be directed to Computershare Trust Company, N.A., at the address stated below, or by calling 800-852-0218, 201-680-6578 (For International Telephone Inquiries) and
800-952-9245 (For the Hearing Impaired (TDD)).
Shareholder communication and
assistance
If you have any questions concerning
the fund, we will be pleased to assist you. If you hold shares in your own name and not with a brokerage firm, please address all notices, correspondence, questions or other communications regarding the fund to the
transfer agent at:
Regular Mail:
Computershare
P.O. Box 505000
Louisville, KY 40233
Computershare
P.O. Box 505000
Louisville, KY 40233
Registered or Overnight Mail:
Computershare
462 South 4th Street, Suite 1600
Louisville, KY 40202
Computershare
462 South 4th Street, Suite 1600
Louisville, KY 40202
If your shares are held with a
brokerage firm, you should contact that firm, bank or other nominee for assistance.
| ANNUAL REPORT | JOHN HANCOCK HEDGED EQUITY & INCOME FUND | 56 |
Trustees and Officers
This chart
provides information about the Trustees and Officers who oversee your John Hancock fund. Officers elected by the Trustees manage the day-to-day operations of the fund and execute policies formulated by the
Trustees.
| Independent Trustees | ||
| Name, year of birth Position(s) held with fund Principal occupation(s) and other directorships during past 5 years | Trustee of the Trust since1 | Number of John Hancock funds overseen by Trustee |
| Hassell H. McClellan, Born: 1945 | 2012 | 191 |
| Trustee and Chairperson of the Board | ||
| Director/Trustee, Virtus Funds (2008-2020); Director, The Barnes Group (2010-2021); Associate Professor, The Wallace E. Carroll School of Management, Boston College (retired 2013). Trustee (since 2005) and Chairperson of the Board (since 2017) of various trusts within the John Hancock Fund Complex. | ||
| James R. Boyle, Born: 1959 | 2015 | 191 |
| Trustee | ||
| Foresters Financial, Chief Executive Officer (since 2018) and board member (since 2017). Manulife Financial and John Hancock, more than 20 years, retiring in 2012 as Chief Executive Officer, John Hancock and Senior Executive Vice President, Manulife Financial. Trustee of various trusts within the John Hancock Fund Complex (2005–2014 and since 2015). | ||
| Peter S. Burgess,2 Born: 1942 | 2012 | 191 |
| Trustee | ||
| Consultant (financial, accounting, and auditing matters) (since 1999); Certified Public Accountant; Partner, Arthur Andersen (independent public accounting firm) (prior to 1999); Director, Lincoln Educational Services Corporation (2004-2021); Director, Symetra Financial Corporation (2010–2016); Director, PMA Capital Corporation (2004–2010). Trustee of various trusts within the John Hancock Fund Complex (since 2005). | ||
| William H. Cunningham,2 Born: 1944 | 2011 | 191 |
| Trustee | ||
| Professor, University of Texas, Austin, Texas (since 1971); former Chancellor, University of Texas System and former President of the University of Texas, Austin, Texas; Chairman (since 2009) and Director (since 2006), Lincoln National Corporation (insurance); Director, Southwest Airlines (since 2000). Trustee of various trusts within the John Hancock Fund Complex (since 1986). | ||
| Grace K. Fey, Born: 1946 | 2012 | 191 |
| Trustee | ||
| Chief Executive Officer, Grace Fey Advisors (since 2007); Director and Executive Vice President, Frontier Capital Management Company (1988–2007); Director, Fiduciary Trust (since 2009). Trustee of various trusts within the John Hancock Fund Complex (since 2008). | ||
| Deborah C. Jackson, Born: 1952 | 2011 | 191 |
| Trustee | ||
| President, Cambridge College, Cambridge, Massachusetts (since 2011); Board of Directors, Amwell Corporation (since 2020); Board of Directors, Massachusetts Women’s Forum (2018-2020); Board of Directors, National Association of Corporate Directors/New England (2015-2020); Board of Directors, Association of Independent Colleges and Universities of Massachusetts (2014-2017); Chief Executive Officer, American Red Cross of Massachusetts Bay (2002–2011); Board of Directors of Eastern Bank Corporation (since 2001); Board of Directors of Eastern Bank Charitable Foundation (since 2001); Board of Directors of American Student Assistance Corporation (1996–2009); Board of Directors of Boston Stock Exchange (2002–2008); Board of Directors of Harvard Pilgrim Healthcare (health benefits company) (2007–2011). Trustee of various trusts within the John Hancock Fund Complex (since 2008). | ||
| 57 | JOHN HANCOCK HEDGED EQUITY & INCOME FUND | ANNUAL REPORT |
| Independent Trustees (continued) | ||
| Name, year of birth Position(s) held with fund Principal occupation(s) and other directorships during past 5 years | Trustee of the Trust since1 | Number of John Hancock funds overseen by Trustee |
| Steven R. Pruchansky, Born: 1944 | 2011 | 191 |
| Trustee and Vice Chairperson of the Board | ||
| Managing Director, Pru Realty (since 2017); Chairman and Chief Executive Officer, Greenscapes of Southwest Florida, Inc. (2014-2020); Director and President, Greenscapes of Southwest Florida, Inc. (until 2000); Member, Board of Advisors, First American Bank (until 2010); Managing Director, Jon James, LLC (real estate) (since 2000); Partner, Right Funding, LLC (2014-2017); Director, First Signature Bank & Trust Company (until 1991); Director, Mast Realty Trust (until 1994); President, Maxwell Building Corp. (until 1991). Trustee (since 1992), Chairperson of the Board (2011–2012), and Vice Chairperson of the Board (since 2012) of various trusts within the John Hancock Fund Complex. | ||
| Frances G. Rathke,2 Born: 1960 | 2020 | 191 |
| Trustee | ||
| Director, Audit Committee Chair, Oatly Group AB (plant-based drink company) (since 2021); Director, Audit Committee Chair and Compensation Committee Member, Green Mountain Power Corporation (since 2016); Director, Treasurer and Finance & Audit Committee Chair, Flynn Center for Performing Arts (since 2016); Director, Audit Committee Chair and Compensation Committee Member, Planet Fitness (since 2016); Chief Financial Officer and Treasurer, Keurig Green Mountain, Inc. (2003-retired 2015). Trustee of various trusts within the John Hancock Fund Complex (since 2020). | ||
| Gregory A. Russo, Born: 1949 | 2011 | 191 |
| Trustee | ||
| Director and Audit Committee Chairman (2012-2020), and Member, Audit Committee and Finance Committee (2011-2020), NCH Healthcare System, Inc. (holding company for multi-entity healthcare system); Director and Member (2012-2018) and Finance Committee Chairman (2014-2018), The Moorings, Inc. (nonprofit continuing care community); Vice Chairman, Risk & Regulatory Matters, KPMG LLP (KPMG) (2002–2006); Vice Chairman, Industrial Markets, KPMG (1998–2002); Chairman and Treasurer, Westchester County, New York, Chamber of Commerce (1986–1992); Director, Treasurer, and Chairman of Audit and Finance Committees, Putnam Hospital Center (1989–1995); Director and Chairman of Fundraising Campaign, United Way of Westchester and Putnam Counties, New York (1990–1995). Trustee of various trusts within the John Hancock Fund Complex (since 2008). | ||
| Non-Independent Trustees3 | ||
| Name, year of birth Position(s) held with fund Principal occupation(s) and other directorships during past 5 years | Trustee of the Trust since1 | Number of John Hancock funds overseen by Trustee |
| Andrew G. Arnott, Born: 1971 | 2017 | 191 |
| President and Non-Independent Trustee | ||
| Head of Wealth and Asset Management, United States and Europe, for John Hancock and Manulife (since 2018); Director and Executive Vice President, John Hancock Investment Management LLC (since 2005, including prior positions); Director and Executive Vice President, John Hancock Variable Trust Advisers LLC (since 2006, including prior positions); President, John Hancock Investment Management Distributors LLC (since 2004, including prior positions); President of various trusts within the John Hancock Fund Complex (since 2007, including prior positions). Trustee of various trusts within the John Hancock Fund Complex (since 2017). | ||
| ANNUAL REPORT | JOHN HANCOCK HEDGED EQUITY & INCOME FUND | 58 |
| Non-Independent Trustees3 (continued) | ||
| Name, year of birth Position(s) held with fund Principal occupation(s) and other directorships during past 5 years | Trustee of the Trust since1 | Number of John Hancock funds overseen by Trustee |
| Marianne Harrison, Born: 1963 | 2018 | 191 |
| Non-Independent Trustee | ||
| President and CEO, John Hancock (since 2017); President and CEO, Manulife Canadian Division (2013–2017); Member, Board of Directors, Boston Medical Center (since 2021); Member, Board of Directors, CAE Inc. (since 2019); Member, Board of Directors, MA Competitive Partnership Board (since 2018); Member, Board of Directors, American Council of Life Insurers (ACLI) (since 2018); Member, Board of Directors, Communitech, an industry-led innovation center that fosters technology companies in Canada (2017-2019); Member, Board of Directors, Manulife Assurance Canada (2015-2017); Board Member, St. Mary’s General Hospital Foundation (2014-2017); Member, Board of Directors, Manulife Bank of Canada (2013- 2017); Member, Standing Committee of the Canadian Life & Health Assurance Association (2013-2017); Member, Board of Directors, John Hancock USA, John Hancock Life & Health, John Hancock New York (2012–2013). Trustee of various trusts within the John Hancock Fund Complex (since 2018). | ||
| Principal officers who are not Trustees | |
| Name, year of birth Position(s) held with fund Principal occupation(s) during past 5 years | Current Position(s) with the Trust since |
| Charles A. Rizzo, Born: 1957 | 2011 |
| Chief Financial Officer | |
| Vice President, John Hancock Financial Services (since 2008); Senior Vice President, John Hancock Investment Management LLC and John Hancock Variable Trust Advisers LLC (since 2008); Chief Financial Officer of various trusts within the John Hancock Fund Complex (since 2007). | |
| Salvatore Schiavone, Born: 1965 | 2011 |
| Treasurer | |
| Assistant Vice President, John Hancock Financial Services (since 2007); Vice President, John Hancock Investment Management LLC and John Hancock Variable Trust Advisers LLC (since 2007); Treasurer of various trusts within the John Hancock Fund Complex (since 2007, including prior positions). | |
| Christopher (Kit) Sechler, Born: 1973 | 2018 |
| Secretary and Chief Legal Officer | |
| Vice President and Deputy Chief Counsel, John Hancock Investment Management (since 2015); Assistant Vice President and Senior Counsel (2009–2015), John Hancock Investment Management; Assistant Secretary of John Hancock Investment Management LLC and John Hancock Variable Trust Advisers LLC (since 2009); Chief Legal Officer and Secretary of various trusts within the John Hancock Fund Complex (since 2009, including prior positions). | |
| Trevor Swanberg, Born: 1979 | 2020 |
| Chief Compliance Officer | |
| Chief Compliance Officer, John Hancock Investment Management LLC and John Hancock Variable Trust Advisers LLC (since 2020); Deputy Chief Compliance Officer, John Hancock Investment Management LLC and John Hancock Variable Trust Advisers LLC (2019–2020); Assistant Chief Compliance Officer, John Hancock Investment Management LLC and John Hancock Variable Trust Advisers LLC (2016–2019); Vice President, State Street Global Advisors (2015–2016); Chief Compliance Officer of various trusts within the John Hancock Fund Complex (since 2016, including prior positions). | |
The business
address for all Trustees and Officers is 200 Berkeley Street, Boston, Massachusetts 02116-5023.
| 59 | JOHN HANCOCK HEDGED EQUITY & INCOME FUND | ANNUAL REPORT |
| 1 | Mr. Arnott, Ms. Jackson and Mr. Pruchansky serve as Trustees for a term expiring in 2022; Mr. Boyle, Dr. Cunningham, Ms. Fey, Dr. McClellan and Mr. Russo serve as Trustees for a term expiring in 2023; Mr. Burgess, Ms. Harrison and Ms. Rathke serve as Trustees for a term expiring in 2024; Mr. Boyle has served as Trustee at various times prior to date listed in the table. |
| 2 | Member of the Audit Committee. |
| 3 | The Trustee is a Non-Independent Trustee due to current or former positions with the Advisor and certain of its affiliates. |
| ANNUAL REPORT | JOHN HANCOCK HEDGED EQUITY & INCOME FUND | 60 |
More information
The fund’s proxy
voting policies and procedures, as well as the fund proxy voting record for the most recent twelve-month period ended June 30, are available free of charge on the Securities and Exchange Commission (SEC) website at
sec.gov or on our website.
All of the fund’s
holdings as of the end of the third month of every fiscal quarter are filed with the SEC on Form N-PORT within 60 days of the end of the fiscal quarter. The fund’s Form N-PORT filings are available on our
website and the SEC’s website, sec.gov.
We make this information
on your fund, as well as monthly portfolio holdings, and other fund details available on our website at jhinvestments.com or by calling 800-852-0218.
The report is certified
under the Sarbanes-Oxley Act, which requires closed-end funds and other public companies to affirm that, to the best of their knowledge, the information in their financial reports is fairly and accurately stated in
all material respects.
| You can also contact us: | ||
| 800-852-0218 | Regular mail: | Express mail: |
| jhinvestments.com | Computershare P.O.Box 505000 Louisville, KY 40233 | Computershare 462 South 4th Street, Suite 1600 Louisville, KY 40202 |
| 61 | JOHN HANCOCK HEDGED EQUITY & INCOME FUND | ANNUAL REPORT |
John Hancock family of funds
The fund’s
investment objectives, risks, charges, and expenses are included in the prospectus and should be considered carefully before investing. For a prospectus, contact your financial professional, call John Hancock
Investment Management at 800-852-0218, or visit the fund’s website at jhinvestments.com. Please read the prospectus carefully before investing or sending money.
The John Hancock funds are
distributed by John Hancock Investment Management Distributors LLC. Member FINRA SIPC.
John Hancock ETF shares are bought
and sold at market price (not NAV), and are not individually redeemed from the fund. Brokerage commissions will reduce returns.
John Hancock ETFs are distributed by
Foreside Fund Services, LLC, and are subadvised by Manulife Investment Management (US) LLC or Dimensional Fund Advisors LP. Foreside is not affiliated with John Hancock Investment Management Distributors LLC, Manulife
Investment Management (US) LLC or Dimensional Fund Advisors LP.
Dimensional Fund Advisors LP
receives compensation from John Hancock in connection with licensing rights to the John Hancock Dimensional indexes. Dimensional Fund Advisors LP does not sponsor, endorse, or sell, and makes no representation as to
the advisability of investing in, John Hancock Multifactor ETFs.
A trusted brand
John Hancock Investment Management
is a premier asset manager
with a heritage of financial stewardship dating back to 1862. Helping
our shareholders pursue their financial goals is at the core of everything
we do. It’s why we support the role of professional financial advice
and operate with the highest standards of conduct and integrity.
with a heritage of financial stewardship dating back to 1862. Helping
our shareholders pursue their financial goals is at the core of everything
we do. It’s why we support the role of professional financial advice
and operate with the highest standards of conduct and integrity.
A better way to invest
We serve investors globally through
a unique multimanager approach:
We search the world to find proven portfolio teams with specialized
expertise for every strategy we offer, then we apply robust investment
oversight to ensure they continue to meet our uncompromising
standards and serve the best interests of our shareholders.
We search the world to find proven portfolio teams with specialized
expertise for every strategy we offer, then we apply robust investment
oversight to ensure they continue to meet our uncompromising
standards and serve the best interests of our shareholders.
Results for investors
Our unique approach to asset
management enables us to provide
a diverse set of investments backed by some of the world’s best
managers, along with strong risk-adjusted returns across asset classes.
a diverse set of investments backed by some of the world’s best
managers, along with strong risk-adjusted returns across asset classes.
“A trusted brand” is
based on a survey of 6,651 respondents conducted by Medallia between 3/18/20 and 5/13/20.

John Hancock Investment Management
LLC, 200 Berkeley Street, Boston, MA 02116-5010, 800-225-5291, jhinvestments.com
Manulife Investment Management, the
Stylized M Design, and Manulife Investment Management & Stylized M Design are trademarks of The Manufacturers Life Insurance Company and are used by its affiliates under license.

| MF1976907 | P15A 12/21 |
2/2022


