UNITED STATES
SECURITIES AND EXCHANGE COMMISSION
WASHINGTON, D.C. 20549
FORM 10-K
(Mark One)
ý | ANNUAL REPORT PURSUANT TO SECTION 13 OR 15(d) OF THE SECURITIES EXCHANGE ACT OF 1934 |
For the fiscal year ended December 31, 2017
OR
¨ | TRANSITION REPORT PURSUANT TO SECTION 13 OR 15(d) OF THE SECURITIES EXCHANGE ACT OF 1934 |
For the transition period from _______________ to _______________
Commission file number: 001-35795
GLADSTONE LAND CORPORATION
(Exact name of registrant as specified in its charter)
MARYLAND | 54-1892552 | |
(State or Other Jurisdiction of Incorporation or Organization) | (I.R.S. Employer Identification No.) | |
1521 WESTBRANCH DRIVE, SUITE 100 MCLEAN, VIRGINIA | 22102 | |
(Address of Principal Executive Offices) | (Zip Code) | |
(703) 287-5800
Registrant’s Telephone Number, Including Area Code
Securities registered pursuant to Section 12(b) of the Act:
Title of each class | Name of each exchange on which registered | |
Common Stock, $0.001 par value per share | The Nasdaq Stock Market, LLC | |
6.375% Series A Cumulative Term Preferred Stock, $0.001 par value per share | The Nasdaq Stock Market, LLC | |
Securities registered pursuant to Section 12(g) of the Act: None
Indicate by check mark if the registrant is a well-known seasoned issuer, as defined in Rule 405 of the Securities Act. YES ¨ NO ý
Indicate by check mark if the registrant is not required to file reports pursuant to Section 13 or Section 15(d) of the Act. YES ¨ NO ý
Indicate by check mark whether the registrant (1) has filed all reports required to be filed by Section 13 or 15(d) of the Securities Exchange Act of 1934 during the preceding 12 months (or for such shorter period that the registrant was required to file such reports), and (2) has been subject to such filing requirements for the past 90 days. YES ý NO ¨
Indicate by check mark whether the registrant has submitted electronically and posted on its corporate Web site, if any, every Interactive Data File required to be submitted and posted pursuant to Rule 405 of Regulation S-T (§ 232.405 of this chapter) during the preceding 12 months (or for such shorter period that the registrant was required to submit and post such files). YES ý NO ¨
Indicate by check mark if disclosure of delinquent filers pursuant to Item 405 of Regulation S-K (§ 232.405 of this chapter) is not contained herein, and will not be contained, to the best of registrant’s knowledge, in definitive proxy or information statements incorporated by reference in Part III of this Form 10-K or any amendment to this Form 10-K. ý
Indicate by check mark whether the registrant is a large accelerated filer, an accelerated filer, a non-accelerated filer, a smaller reporting company, or emerging growth company. See the definitions of “large accelerated filer,” “accelerated filer,” “smaller reporting company,” and “emerging growth company” in Rule 12b-2 of the Exchange Act.
Large accelerated filer | ¨ | Accelerated filer | x | ||
Non-accelerated filer | ¨ | (Do not check if a smaller reporting company) | Smaller reporting company | ¨ | |
Emerging growth company | x | ||||
If an emerging growth company, indicate by check mark if the registrant has elected not to use the extended transition period for complying with any new or revised financial accounting standards provided pursuant to Section 13(a) of the Exchange Act. ¨
Indicate by check mark whether the registrant is a shell company (as defined in Rule 12b-2 of the Act). YES ¨ NO ý
The aggregate market value of the voting stock held by non-affiliates of the registrant on June 30, 2017, based on the closing price on that date of $11.67 on the Nasdaq Global Market, was approximately $112.2 million. For the purposes of calculating this amount only, all directors and executive officers of the registrant have been deemed to be affiliates.
The number of shares of the registrant’s Common Stock, $0.001 par value per share, outstanding as of February 19, 2018, was 13,895,864.
Documents Incorporated by Reference: Portions of the Registrant’s Proxy Statement, to be filed no later than April 30, 2018, relating to the Registrant’s 2018 Annual Meeting of Stockholders are incorporated by reference into Part III of this Annual Report on Form 10-K.
1
GLADSTONE LAND CORPORATION
FORM 10-K FOR THE YEAR ENDED
DECEMBER 31, 2017
TABLE OF CONTENTS
PAGE | ||||||
PART I | ITEM 1 | |||||
ITEM 1A | ||||||
ITEM 1B | ||||||
ITEM 2 | ||||||
ITEM 3 | ||||||
ITEM 4 | ||||||
PART II | ITEM 5 | |||||
ITEM 6 | ||||||
ITEM 7 | ||||||
ITEM 7A | ||||||
ITEM 8 | ||||||
ITEM 9 | ||||||
ITEM 9A | ||||||
ITEM 9B | ||||||
PART III | ITEM 10 | |||||
ITEM 11 | ||||||
ITEM 12 | ||||||
ITEM 13 | ||||||
ITEM 14 | ||||||
PART IV | ITEM 15 | |||||
ITEM 16 | ||||||
SIGNATURES | ||||||
2
FORWARD-LOOKING STATEMENTS
Our disclosure and analysis in this Annual Report on Form 10-K (the “Form 10-K”) and the documents that are incorporated by reference herein contain “forward-looking statements” within the meaning of Section 27A of the Securities Act of 1933, as amended (the “Securities Act”), and Section 21E of the Securities Exchange Act of 1934, as amended (the “Exchange Act”). We intend such forward-looking statements to be covered by the safe harbor provisions for forward-looking statements contained in the Private Securities Litigation Reform Act of 1995 and include this statement for purposes of complying with these safe harbor provisions. Forward-looking statements relate to expectations, beliefs, projections, future plans, and strategies, anticipated events, or trends concerning matters that are not historical facts. These forward-looking statements include information about possible or assumed future events, including, among other things, discussion and analysis of our business, financial condition, results of operations (including funds from operations, core funds from operations, and adjusted funds from operations (each as defined herein)), our strategic plans and objectives, cost management, occupancy and leasing rates and trends, liquidity and ability to refinance our indebtedness as it matures, anticipated capital expenditures (and access to capital) required to complete projects, amounts of anticipated cash distributions to our stockholders in the future, and other matters. Words such as “may,” “might,” “believe,” “will,” “provided,” “anticipate,” “future,” “could,” “growth,” “plan,” “intend,” “expect,” “should,” “would,” “if,” “seek,” “possible,” “potential,” “likely” and variations of these words and similar expressions are intended to identify forward-looking statements, though not all forward-looking statements contain these words. These statements are not guarantees of future performance and are subject to known and unknown risks, uncertainties, and other factors, some of which are beyond our control, that are difficult to predict and could cause actual results to differ materially from those expressed, implied or forecasted by such forward-looking statements. Statements regarding the following subjects, among others, are forward-looking by their nature:
• | our business strategy; |
• | our ability to implement our business plan, including our ability to continue to expand both geographically and by crop type; |
• | pending and future transactions; |
• | our projected operating results; |
• | our ability to obtain future financing arrangements on favorable terms; |
• | estimates relating to our future distributions; |
• | estimates regarding potential rental rate increases and occupancy rates; |
• | our understanding of our competition and our ability to compete effectively; |
• | market and industry trends; |
• | estimates of future operating expenses, including payments to our Adviser and Administrator (each as defined herein) under the terms of our Advisory Agreement and our Administration Agreement (each as defined herein), respectively; |
• | our compliance with tax laws, including our ability to maintain our qualification as a real estate investment trust (“REIT”) for federal income tax purposes; |
• | projected capital expenditures; and |
• | use of proceeds and availability of our line of credit, long-term borrowings, current and future stock offerings, and other future capital resources, if any. |
Forward-looking statements involve inherent uncertainty and may ultimately prove to be incorrect or false. You are cautioned to not place undue reliance on forward-looking statements. Except as otherwise may be required by law, we undertake no obligation to update or revise forward-looking statements to reflect changes to our assumptions, the occurrence of unanticipated events or actual operating results. Our actual results could differ materially from those anticipated in these forward-looking statements as a result of various factors, including, but not limited to:
• | our ability to successfully complete pending and future property acquisitions; |
• | general volatility of the capital markets and the market price of our capital stock; |
• | failure to maintain our qualification as a REIT and risks of changes in laws that affect REITs; |
• | risks associated with negotiation and consummation of pending and future transactions; |
• | changes in our business and investment strategy; |
• | the adequacy of our cash reserves and working capital; |
• | our failure to successfully integrate and operate acquired properties and operations; |
• | defaults upon or non-renewal of leases by tenants; |
• | decreased rental rates or increased vacancy rates; |
• | the degree and nature of our competition, including other agricultural REITs; |
• | availability, terms, and deployment of capital, including the ability to maintain and borrow under our line of credit, arrange for long-term mortgages on our properties, and raise equity capital; |
• | our Adviser’s and our Administrator's ability to identify, hire, and retain highly-qualified personnel in the future; |
• | changes in the environment, our industry, interest rates, or the general economy; |
• | changes in real estate and zoning laws and increases in real property tax rates; |
3
• | changes in governmental regulations, tax rates, and similar matters; |
• | environmental liabilities for certain of our properties and uncertainties and risks related to natural disasters or climactic changes impacting the regions in which our tenants operate; and |
• | the loss of any of our key officers, such as Mr. David Gladstone, our chairman, president, and chief executive officer, or Mr. Terry Lee Brubaker, our vice chairman and chief operating officer. |
This list of risks and uncertainties, however, is only a summary of some of the most important factors to us and is not intended to be exhaustive. You should carefully review the risks set forth herein under Item 1A, “Risk Factors.” New factors may also emerge from time to time that could materially and adversely affect us.
All references to “we,” “our,” “us,” and the “Company” in this Form 10-K mean Gladstone Land Corporation and its consolidated subsidiaries, except where it is made clear that the term refers only to Gladstone Land Corporation.
4
PART I
ITEM 1. | BUSINESS |
Overview
We are an externally-managed, agricultural REIT that is engaged primarily in the business of owning and leasing farmland. We were re-incorporated in Maryland on March 24, 2011, having been originally incorporated in California on June 14, 1997. We typically do not farm the properties we own; however, we currently lease (on a temporary basis) one of our farms in California to a wholly-owned subsidiary of ours. Upon the pricing of our initial public offering (the “IPO”), on January 29, 2013, our shares of common stock began trading on the Nasdaq Global Market (“Nasdaq”) under the symbol “LAND.” Our shares of 6.375% Series A Cumulative Term Preferred Stock (the “Series A Term Preferred Stock”) are traded on Nasdaq under the symbol “LANDP.” In addition, we have registered our 6.00% Series B Cumulative Redeemable Preferred Stock, par value $0.001 per share (the “Series B Preferred Stock”). The Series B Preferred Stock is not listed on a national securities change, and there is currently no public market for shares of the Series B Preferred Stock.
Prior to 2004, we were engaged in the owning and leasing of farmland, as well as an agricultural operating business whereby we engaged in the farming, contract growing, packaging, marketing and distribution of fresh berries, including commission selling and contract cooling services to independent berry growers. In 2004, we sold our agricultural operating business, and since then, our operations have consisted solely of leasing our farms to third-party tenants.
We currently own 74 farms comprised of 63,175 total acres across 9 states in the U.S. (Arizona, California, Colorado, Florida, Michigan, Nebraska, North Carolina, Oregon, and Washington). We also own several farm-related facilities, such as cooling facilities, packinghouses, processing facilities, and various storage facilities. These farms and facilities are currently leased to 52 different, third-party tenants that are either independent or corporate farming operations, and, as of October 17, 2017, one farm is leased to our taxable REIT subsidiary (“TRS”). Historically, our farmland has predominantly been concentrated in locations where tenants are able to grow fresh produce annual row crops (e.g., certain berries and vegetables), which are typically planted and harvested annually. However, since our IPO, we have diversified the variety of crops grown on our farms, and we now own several farms that grow permanent crops (e.g., almonds, blueberries, pistachios, and wine vineyards), as well as some farms that grow commodity crops (e.g., corn and beans). While our focus remains on farmland growing fresh produce annual row crops, in the future, we expect to acquire additional farmland that grows permanent crops, and, to a lesser extent, commodity crops. We also expect to acquire more farm-related facilities that are necessary to the farming operations on the underlying farmland.
We generally lease our properties on a triple-net basis, an arrangement under which, in addition to rent, the tenant is required to pay the related taxes, insurance costs (including drought insurance if we were to acquire properties that depend upon rainwater for irrigation), maintenance, and other operating costs. Except in unique circumstances, we do not currently intend to enter into the business of growing, packing, or marketing farmed products; however, if we do so in the future, we expect that it would again be through our TRS. We may also elect to sell farmland at certain times, such as when the land could be developed by others for urban or suburban uses.
We conduct substantially all of our business activities through an Umbrella Partnership Real Estate Investment Trust (“UPREIT”) structure, by which all of our properties are held, directly or indirectly, by Gladstone Land Limited Partnership (the “Operating Partnership”). We control the sole general partner of the Operating Partnership and currently own, directly or indirectly, approximately 93.2% of the common units of limited partnership interest in the Operating Partnership (“OP Units”). We have in the past, and may in the future, offer equity ownership in our Operating Partnership by issuing OP Units to farmland owners in consideration for acquiring their farms. See “Our Investment Process—Types of Investments” below for additional information regarding OP Units.
On September 3, 2014, we filed our 2013 federal income tax return, on which we elected to be taxed as a REIT for federal tax purposes beginning with the year ended December 31, 2013. As a REIT, we generally will not be subject to U.S. federal income taxes on amounts that we distribute to our stockholders, provided that, on an annual basis, we distribute at least 90% of our REIT taxable income to our stockholders. In addition, we have elected for Gladstone Land Advisers, Inc. (“Land Advisers”), a wholly-owned subsidiary of our Operating Partnership, to be taxed as a TRS. We may own or manage our assets and engage in other activities through Land Advisers or another TRS we form or acquire when we deem it necessary or advisable. On October 17, 2017, Land Advisers took over the farming operations on one of our farms in California under a lease that is scheduled to expire on July 31, 2018. There was no taxable income from Land Advisers for the year ended December 31, 2017; however, any taxable income generated by Land Advisers or any other TRS in the future will be subject to regular corporate income taxes.
5
Gladstone Management Corporation (our “Adviser”), a Delaware corporation and a registered investment adviser with the Securities and Exchange Commission (the “SEC”), manages our real estate portfolio pursuant to an advisory agreement, and Gladstone Administration, LLC (our “Administrator”), a Delaware limited liability company, provides administrative services to us pursuant to an administration agreement. Our Adviser and Administrator collectively employ all of our personnel and pay directly their salaries, benefits, and general expenses. Both our Adviser and our Administrator are affiliates of ours and each other.
Fiscal Year 2017 Highlights
During 2017, we:
• | Acquired 16 new farms, totaling 12,641 acres across 6 different states, for approximately $128.7 million; |
• | Executed 10 separate leases on 9 different farms for total annualized rents of approximately $2.2 million, all without incurring any downtime on the farms; |
• | Maintained 100% occupancy on all of our properties throughout the year (including one farm that was leased to our TRS for a portion of the year); |
• | Grew adjusted funds from operations (“AFFO”) by 28.2%, from approximately $5.8 million in 2016 to $7.5 million in 2017 (Net (loss) income for the years ended December 31, 2017 and 2016 was approximately $(34,000) and $473,000, respectively); and |
• | Through two public offerings of our common stock and our ATM Program (as defined herein), raised approximately $39.9 million of net proceeds. |
Refer to Item 6, “Selected Financial Data,” for a definition of AFFO and a reconciliation of net (loss) income to AFFO.
Our Investment Objectives and Our Strategy
Our principal business objective is to maximize stockholder returns through a combination of: (i) monthly cash distributions to our stockholders, which we hope to sustain and increase through long-term growth in cash flows from increased rents; (ii) appreciation of our land; and (iii) capital gains derived from the sale of our properties. Our primary strategy to achieve our business objective is to invest in and diversify our current portfolio of primarily triple-net-leased farmland and properties related to farming operations. This strategy includes the following components:
• | Owning Farms and Farm-Related Real Estate for Income. We own and intend to acquire additional farms and farm-related properties and lease them to independent and corporate farming operations, including sellers who desire to continue farming the land after we acquire the property from them. We expect to hold most acquired properties for many years and to generate stable and increasing rental income from leasing these properties. |
• | Owning Farms and Farm-Related Real Estate for Appreciation. We intend to lease acquired properties over the long term. However, from time to time, we may sell one or more properties if we believe it to be in the best interests of our stockholders and best to maintain the overall value of our farmland portfolio. Potential purchasers may include real estate developers desiring to develop the property or financial purchasers seeking to acquire property for investment purposes. Accordingly, we will seek to acquire properties that we believe have potential for long-term appreciation in value. To date, we have sold one farm for a net gain of approximately $85,000. |
• | Continue Expanding our Operations Geographically. Our properties are currently located in nine states across the U.S., and we expect that we will acquire properties in other farming regions of the U.S. in the future. While our primary regions of focus are the Pacific West and the Southeastern regions of the United States, we believe other regions of the U.S., such as the Northwest and Mid-Atlantic regions, offer attractive locations for expansion, and, to a lesser extent, we also expect to seek farmland acquisitions in certain regions of the Midwest, as well as other areas in the U.S. |
• | Continue Expanding our Crop Varieties. Currently, the majority of tenants who farm our properties grow annual row crops dedicated to fresh produce, such as berries (e.g., strawberries and raspberries) and fresh vegetables (e.g., tomatoes, lettuce, and bell peppers). We have also expanded further into certain permanent crops (e.g., almonds, pistachios, blueberries, and wine grape vineyards) and, to a lesser extent, commodity crops (e.g., corn and beans). We will seek to continue our recent expansion into other permanent crops and, to a lesser extent, commodity crops, while maintaining our focus on annual row-crop farms growing fresh produce. |
• | Using Leverage. To maximize our number of investments, we intend to borrow through loans secured by long-term mortgages on our properties, and we may also borrow funds on a short-term basis or incur other indebtedness. |
We intend to acquire more farmland and farm-related properties in our regions of focus that is already or will be leased to farmers, and we expect that most of our future tenants will be independent or corporate farming operations that are all unrelated to us. We intend to continue to lease the majority of our farms and farm-related facilities on a triple-net lease basis to tenants
6
who sell their products through national corporate marketers-distributors. We expect to continue to earn rental income from our farmland investments.
Our Investment Process
Types of Investments
We expect that substantially all of our investments will be in income-producing agricultural real property, and we expect that the majority of our leases will be structured as triple-net leases. Investments will not be restricted as to geographical areas, but we expect that most of our investments in farmland real estate will continue to be made within the United States. Currently, our properties are located across nine states in the U.S.
We anticipate that we will make substantially all of our investments through our Operating Partnership. Our Operating Partnership may acquire interests in real property in exchange for the issuance of common shares, OP Units, cash, or through a combination of the three. OP Units issued by our Operating Partnership will be redeemable at the option of the holder for cash or, at our election, shares of our common stock on a one-for-one basis at any time after holding the OP Units for one year. We currently, and may in the future, hold some or all of our interests in real properties through one or more wholly-owned subsidiaries, each classified as a qualified REIT subsidiary.
Property Acquisitions and Leasing
We anticipate that many of the farms and farm-related facilities we purchase will be acquired from independent farmers or agricultural companies and that they will simultaneously lease the properties back from us. These transactions will provide the tenants with an alternative to other financing sources, such as borrowing, mortgaging real property, or selling securities. We anticipate that some of our transactions will be in conjunction with acquisitions, recapitalizations, or other corporate transactions affecting our tenants. We also expect that many of the farms and farm-related facilities we acquire will be purchased from owners that do not farm the property but rather lease the property to tenant-farmers. In situations such as these, we intend to have a lease in place prior to or simultaneously with acquiring the property. For a discussion of the risks associated with leasing property to leveraged tenants, see “Risk Factors—Risks Relating to Our Business and Operations—Some of our tenants may be unable to pay rent, which could adversely affect our cash available to make distributions to our stockholders or otherwise impair the value of your investment.”
We intend to own primarily single-tenant, agricultural real property. Generally, we will lease properties to tenants that our Adviser deems creditworthy under triple-net leases that will be full-recourse obligations of our tenants or their affiliates. Most of our agricultural leases have original terms ranging from 3 to 10 years for farms growing annual row crops and 5 to 15 years for properties growing permanent crops, often with options to extend the lease further. Rent is generally payable to us on either an annual or semi-annual basis. Further, most of our leases contain provisions that provide for annual increases in the rental amounts payable by the tenants, often referred to as escalation clauses. The escalation clauses may specify fixed dollar amounts or percentage increases each year, or they may be variable, based on standard cost of living or inflation indices. In addition, some leases that are longer-term in nature may require a regular survey of comparable land rents, with the rent owed per the lease being adjusted to reflect then-current market rents. We also have leases that include variable rents based on the success of the harvest each year. In these types of agreements, we will generally require the lease to include the guarantee of a minimum amount of rental income that satisfies our investment return criteria. Currently, our 74 farms are leased under agricultural leases with original terms ranging from 1 to 20 years, with 48 farms leased on a pure triple-net basis, 23 farms leased on a partial-net basis (with the landlord responsible for all or a portion of the related property taxes), and 2 farms leased on a gross basis (with the landlord responsible for the related property taxes, insurance, and maintenance on the property). One of our farms is currently vacant. Additionally, 13 of our farms are leased under agreements that include a variable rent component.
We believe that we can acquire farmland that we will be able to lease at annual rental rates providing net capitalization rates ranging from 4.5% to 6.5% of the properties’ market values. However, there can be no assurance that we will be able to achieve this level of rental rates. Since rental contracts in the farming business for annual row crops are customarily short-term agreements, rental rates are typically renegotiated regularly to then-current market rates.
Underwriting Criteria and Due Diligence Process
Selecting the Property
We consider selecting the right properties to purchase or finance as the most important aspect of our business. Buying quality farmland that can be used to grow a variety of different crops and that is located in desirable locations is essential to our success.
7
Our Adviser works with real estate contacts in agricultural markets throughout the U.S. to assess available properties and farming areas. We believe that our Adviser is experienced in selecting valuable farmland and will use this expertise to identify promising properties. The following is a list of important factors in our selection of farmland:
• | Water availability. Availability of water is essential to farming. We seek to purchase properties with ample access to water through an operating well on site or rights to use a well or other source that is located nearby. Additionally, we may, in the future, consider acquiring properties that rely on rainfall for water if the tenant on that property mitigates the drought risk by purchasing drought insurance. Typically, leases on properties that would rely on rainfall would be longer term in nature. Currently, we do not own any properties that rely on rainfall for water, nor do we have any plans to acquire such properties. |
• | Soil composition. In addition to water, for farming efforts to be successful, the soil must be suitable for growing crops. We will not buy or finance any real property that does not have soil conditions that we believe are favorable for growing the crops farmed on the property, except to the extent that a portion of an otherwise suitable property, while not favorable for growing the crops farmed on the property, may be utilized to build structures used in the farming business, such as cooling facilities, packinghouses, silos, greenhouses, storage facilities, and distribution centers. |
• | Location. Farming also requires optimal climate and growing seasons. We typically seek to purchase properties in locations that take advantage of climate conditions that are needed to grow fresh produce row crops. We intend to continue to expand throughout the U.S. in locations with productive farmland and financially sound farming tenants. |
• | Price. We intend to purchase and finance properties that we believe are a good value and that we will be able to profitably rent for farming over the long term. Generally, the closer a property is located to urban developments, the higher the value of the property. As a result, properties that are currently located in close proximity to urban developments are likely to be too expensive to justify farming over an extended period of time, and, therefore, we are unlikely to invest in such properties. |
Our Adviser will perform a due diligence review with respect to each potential property acquisition. Such review will include an evaluation of the physical condition of a property and an environmental site assessment to determine potential environmental liabilities associated with a property prior to its acquisition. One of the criteria that we look for is whether mineral rights to such property, which constitute a separate estate from the surface rights to the property, have been sold to a third party. We generally seek to invest in properties where mineral rights have not been sold to third parties; however, in cases where access to mineral rights would not affect the surface farming operations, we may enter into a lease agreement for the extraction of minerals or other subterranean resources, as we have done in the past on a few of our properties. We may seek to acquire mineral rights in connection with the acquisition of future properties to the extent such mineral rights have been sold off and the investment acquisition of such rights is considered to be favorable after our due diligence review. Despite the conduct of these reviews, there can be no assurance that hazardous substances or waste, as determined under present or future federal or state laws or regulations, will not be discovered on the property after we acquire it. See Item 1A, “Risk Factors — Risks Relating to our Business and Operations — Potential liability for environmental matters could adversely affect our financial condition.”
Our Adviser will also physically inspect each property and the real estate surrounding it to estimate its value. Our Adviser’s due diligence will be primarily focused on valuing each property independent of its rental value to particular tenants to whom we plan to rent. The real estate valuations our Adviser performs will consider one or more of the following items:
• | The comparable value of similar real property in the same general area of the prospective property, to the extent possible. |
• | The comparable real estate rental rates for similar properties in the same general area of the prospective property. |
• | Alternative uses for the property to determine if there is another use for the property that would give it higher value, including potential future conversion to urban or suburban uses, such as commercial or residential development. |
• | The assessed value as determined by the local real estate taxing authority. |
In addition, our Adviser may supplement its valuation estimate with an independent real estate appraisal in connection with each investment that it considers. These appraisals may take into consideration, among other things, the terms and conditions of the particular lease transaction, the quality of the tenant’s credit and the conditions of the credit markets at the time the lease transaction is negotiated. However, the actual purchase price of a property may be greater or less than its appraised value. When appropriate, our Adviser may engage experts to undertake some or all of the due diligence efforts described above.
Underwriting the Tenant, Due Diligence Process and Negotiating Lease Provisions
In addition to property selection, underwriting the tenant that will lease the property is also an important aspect of our investment process. Our Adviser will evaluate the creditworthiness of the tenant and assess its ability to generate sufficient cash flow from its agricultural operations to cover its payment obligations to us pursuant to our lease. The following is a list of
8
criteria that our Adviser may consider when evaluating potential tenants for our properties, although not all criteria may be present for each lease:
• | Experience. We believe that experience is the most significant characteristic when determining the creditworthiness of a tenant. Therefore, we seek to rent our properties to farmers that have an extensive track record of farming their property and particular crops successfully. |
• | Financial Strength. We seek to rent to farming operations that have financial resources to invest in planting and harvesting their crops. We generally require annual financial statements of new tenants to evaluate the financial capability of the tenant and its ability to perform its obligations under the lease. |
• | Adherence to Quality Standards. We seek to lease our properties to those farmers that are committed to farming in a manner that will generate high-quality crops. We intend to identify such commitment through their track records of selling produce into established distribution chains and outlets. |
• | Lease Provisions that Enhance and Protect Value. When appropriate, our Adviser attempts to include lease provisions that require our consent to specified tenant activity or require the tenant to satisfy specific operating tests. These provisions may include, for example, requiring the tenant to meet operational or financial covenants or to indemnify us against environmental and other contingent liabilities. We believe that these provisions serve to protect our investments from adverse changes in the operating and financial characteristics of a tenant that may impact its ability to satisfy its obligations to us or that could reduce the value of our properties. Our Adviser generally also seeks covenants requiring tenants to receive our consent prior to any change in control of the tenant. |
• | Credit Enhancement. To mitigate risk and enhance the likelihood of tenants satisfying their lease obligations, our Adviser may also seek cross-default provisions if a tenant has multiple obligations to us or seek a letter of credit or a guaranty of lease obligations from each tenant’s corporate affiliates, if any. We believe that these types of credit enhancements, if obtained, provide us with additional financial security. |
• | Diversification. Our Adviser will seek to diversify our portfolio to avoid dependence on any one particular tenant, geographic location, or crop type. By diversifying our portfolio, our Adviser intends to reduce the adverse effect on our portfolio of a single underperforming investment or a downturn in any particular geographic region. Many of the areas in which we purchase or finance properties are likely to have their own microclimates and, although they appear to be in close proximity to one another, generally will not be similarly affected by weather or other natural occurrences at the same time. We currently own properties in nine different states across the U.S., and over time, we expect to expand our geographic focus to other areas of the Southeast, Pacific Northwest, Midwest, and Mid-Atlantic. We will also attempt to continue diversifying our portfolio of properties by seeking additional farmland that grows permanent crops and commodity crops, while maintaining our current focus of owning and leasing farmland that grows fresh produce annual row crops. Refer to Note 3, “Real Estate and Lease Intangibles,” in the accompanying notes to our Consolidated Financial Statements for a summary of our portfolio diversification and concentrations. |
While our Adviser seeks tenants it believes to be creditworthy, tenants are not required to meet any minimum rating established by an independent credit rating agency. Our Adviser’s standards for determining whether a particular tenant is creditworthy will vary in accordance with a variety of factors relating to specific prospective tenants. The creditworthiness of a tenant is determined on a tenant-by-tenant and case-by-case basis. Therefore, general standards for creditworthiness cannot be applied. We monitor our tenants’ credit quality on an ongoing basis by, among other things, periodically conducting site visits to the properties to ensure farming operations are taking place and to assess the general maintenance of the properties. To date, no changes to credit quality of our tenants have been identified, and all tenants continue to pay pursuant to the terms of their respective leases.
Use of Leverage
Our strategy is to use borrowings as a financing mechanism in amounts that we believe will maximize the return to our stockholders. We generally expect to enter into borrowing arrangements directly or indirectly through our Operating Partnership. Our governing documents and policies do not impose a limitation on the amount we may borrow against any single investment property, nor do they impose a limitation on our overall level of borrowing.
We believe that, by operating on a leveraged basis, we will have more funds available and, therefore, will be able to make more investments than would otherwise be possible. We believe that this will allow us to pursue a more diversified portfolio. Our Adviser and Administrator use their best efforts to obtain financing on the most favorable terms available to us.
We anticipate that our prospective lenders may also seek to include loan provisions whereby the termination or replacement of our Adviser would result in an event of default or an event requiring the immediate repayment of the full outstanding balance of the loan. The replacement or termination of our Adviser may, however, require the prior consent of a lender.
We may refinance properties during the term of a loan when, in the opinion of our Adviser, a decline in interest rates makes it advisable to prepay an existing mortgage loan, when an existing mortgage loan matures or if an attractive investment becomes
9
available and the proceeds from the refinancing can be used to make such investment. The benefits of the refinancing may include an increase in cash flow resulting from reduced debt service requirements, an increase in distributions to stockholders from proceeds of the refinancing, if any, or an increase in property ownership if some refinancing proceeds are reinvested in real estate.
Investment Limitations
There are numerous limitations on the manner in which we may invest our funds. We have adopted a policy that without the permission of our Board of Directors, we will not:
• | invest 50% or more of our total assets in a single property at the time of investment; |
• | invest in real property owned by our Adviser, any of its affiliates or any entity in which our Adviser or any of its affiliates have invested; |
• | invest in commodities or commodity futures contracts, with this limitation not being applicable to futures contracts when used solely for the purpose of hedging in connection with our ordinary business of investing in properties and making mortgage loans; |
• | invest in contracts for the sale of real estate unless the contract is in recordable form and is appropriately recorded in the chain of title; |
• | issue equity securities on a deferred payment basis or other similar arrangement; |
• | grant warrants or options to purchase shares of our stock to our Adviser or its affiliates; |
• | engage in trading, as compared with investment activities, or engage in the business of underwriting, or the agency distribution of, securities issued by other persons; |
• | invest more than 5% of the value of our assets in the securities of any one issuer if the investment would cause us to fail to maintain our qualification as a REIT; |
• | invest in securities representing more than 10% of the outstanding securities (by vote or value) of any one issuer if the investment would cause us to fail to maintain our qualification as a REIT; or |
• | acquire securities in any company holding investments or engaging in activities prohibited in the foregoing clauses. |
Conflict of Interest Policy
We have adopted policies to reduce potential conflicts of interest. In addition, our directors are subject to certain provisions of Maryland law that are designed to minimize conflicts. However, we cannot assure you that these policies or provisions of law will reduce or eliminate the influence of these conflicts.
We have adopted a policy that, without the approval of a majority of our independent directors, we will not:
• | acquire from or sell to any of our officers or directors, the employees of our Adviser or Administrator, or any entity in which any of our officers, directors, or such employees has an interest of more than 5%, any assets or other property; |
• | borrow from any of our directors or officers, the employees of our Adviser or Administrator, or any entity in which any of our officers, directors, or such employees has an interest of more than 5%; or |
• | engage in any other transaction with any of our directors or officers, the employees of our Adviser or Administrator, or any entity in which any of our directors, officers, or such employees has an interest of more than 5%. |
Consistent with the provisions of the Sarbanes-Oxley Act of 2002, we will not extend credit, or arrange for the extension of credit, to any of our directors and officers. Under the Maryland General Corporation Law, a contract or other transaction between us and one of our directors or officers or any other entity in which one of our directors or officers is also a director or officer or has a material financial interest is not void or voidable solely on the grounds of the common directorship or interest, the fact that the director or officer was present at the meeting at which the contract or transaction was approved or the fact that the director’s vote was counted in favor of the contract or transaction if:
• | the material facts relating to the common directorship or interest and as to the transaction are disclosed to our Board of Directors or a committee of our Board, and our Board or the committee in good faith authorizes the contract or transaction by the affirmative vote of a majority of the directors not interested in the contract or transaction, even if the disinterested directors do not constitute a quorum of the Board or committee; |
• | the fact of the common directorship or interest is disclosed to our stockholders entitled to vote on the contract or transaction, and the contract or transaction is approved or ratified by a majority of the votes cast by the stockholders entitled to vote on the matter, other than shares owned of record or beneficially by the interested director, corporation or entity; or |
10
• | the contract or transaction is fair and reasonable to us as of the time authorized, approved or ratified by the Board of Directors, a committee or the stockholders. |
Our policy also prohibits us from purchasing any real property from, or co-investing in any real property with, our Adviser, any of its affiliates, or any business in which our Adviser or any of its subsidiaries have invested. If we decide to change this policy on co-investments with our Adviser or its affiliates, we will seek approval of our independent directors.
Future Revisions in Policies and Strategies
Our independent directors will review our investment policies at least annually to determine whether the policies continue to be in the best interest of our stockholders. The methods of implementing our investment policies also may vary as new investment techniques are developed. The methods of implementing our investment procedures, objectives and policies, except as otherwise provided in our bylaws or charter, may be altered by a majority of our directors, including a majority of our independent directors, without the approval of our stockholders, to the extent that our Board of Directors and the independent directors thereon determine that such modification is in the best interest of the stockholders.
Code of Ethics
The Company and its affiliates, including, but not limited to, Gladstone Capital Corporation (“Gladstone Capital”), Gladstone Investment Corporation (“Gladstone Investment”), Gladstone Commercial Corporation (“Gladstone Commercial”), our Adviser, our Administrator, and Gladstone Securities, LLC (“Gladstone Securities”), have adopted a code of ethics and business conduct applicable to all personnel, including our Chief Executive Officer and Chief Financial Officer, of such companies that complies with the guidelines set forth in Item 406 of Regulation S-K under the Securities Act and the rules promulgated by Nasdaq. This code, among other things, establishes procedures for personal investments, restricts certain transactions by such personnel and requires the reporting of certain transactions and holdings by such personnel. A copy of this code is available for review, free of charge, at our website at www.GladstoneLand.com. We intend to provide any required disclosure of any amendments to or waivers of the provisions of this code by posting information regarding any such amendment or waiver to our website within four days of its effectiveness.
Our Adviser and Administrator
We are externally managed by our Adviser. The officers, directors and employees of our Adviser have significant experience in making investments in and lending to businesses of all sizes, including investing in real estate and making mortgage loans. We entered into an investment advisory agreement with our Adviser, as most recently amended on April 11, 2017 (the “Amended Advisory Agreement”), under which our Adviser is responsible for managing our assets and liabilities, for operating our business on a day-to-day basis, and for identifying, evaluating, negotiating, and consummating investment transactions consistent with our investment policies as determined by our Board of Directors from time to time.
Our Administrator employs our chief financial officer, treasurer, chief compliance officer, general counsel and secretary (who also serves as our Administrator’s president, general counsel, and secretary), and their respective staffs and provides administrative services to us under the amended and restated Administration Agreement entered into on February 1, 2013 (the “Administration Agreement”).
David Gladstone, our chairman, chief executive officer, president, and largest stockholder, is also the chairman, chief executive officer, and the controlling stockholder of our Adviser and our Administrator. Terry Lee Brubaker, our vice chairman and chief operating officer and a member of our Board of Directors, also serves in the same capacities for our Adviser and Administrator.
Our Adviser has an investment committee that evaluates and approves each of our investments. This investment committee is currently comprised of Messrs. Gladstone and Brubaker. We believe that the review process of our Adviser’s investment committee gives us a unique competitive advantage over other agricultural real estate companies because of the substantial experience that the members possess and their unique perspective in evaluating the blend of corporate credit, real estate, and lease terms that collectively combine to provide an acceptable risk for our investments.
Our Adviser’s board of directors has empowered the investment committee to authorize and approve our investments, subject to the terms of the Amended Advisory Agreement. Before we acquire any property, the proposed transaction is be reviewed by the investment committee to ensure that, in its view, the transaction satisfies our investment criteria and is within our investment policies. Approval by the investment committee will generally be the final step in the property acquisition approval process, although the separate approval of our Board of Directors is required in certain circumstances, which are described below.
11
Our Adviser and Administrator are headquartered in McLean, Virginia, a suburb of Washington D.C., and our Adviser also has offices in several other states. Refer to Item 7, “Management Discussion and Analysis of Financial Condition and Results of Operations,” for a detailed discussion on the fee structure of each of the Adviser and Administrator.
Adviser Duties and Authority under the Amended Advisory Agreement
Under the terms of the Amended Advisory Agreement, our Adviser is required to present to us investment opportunities consistent with our investment policies and objectives as adopted by our Board of Directors. In performing its duties, our Adviser, either directly or indirectly by engaging an affiliate:
• | finds, evaluates, presents, and recommends to us a continuing series of real estate investment opportunities consistent with our investment policies and objectives; |
• | provides advice to us and acts on our behalf with respect to the negotiation, acquisition, financing, refinancing, holding, leasing, and disposition of real estate investments; |
• | enters into contracts to purchase real estate on our behalf in compliance with our investment procedures, objectives, and policies, subject to approval of our Board of Directors, where required; |
• | takes the actions and obtains the services necessary to effect the negotiation, acquisition, financing, refinancing holding, leasing, and disposition of real estate investments; and |
• | provides day-to-day management of our real estate activities and other administrative services. |
Our Board of Directors has authorized our Adviser to make investments in any property on our behalf without the prior approval of our Board if the following conditions are satisfied:
• | our Adviser has determined that the total cost of the property does not exceed its determined value; and |
• | our Adviser has provided us with a representation that the property, in conjunction with our other investments and proposed investments, is reasonably expected to fulfill our investment objectives and policies as established by our Board of Directors then in effect. |
The actual terms and conditions of transactions involving investments in properties shall be determined in the sole discretion of our Adviser, subject at all times to compliance with the foregoing requirements. Some types of transactions, however, will require the prior approval of our Board of Directors, including a majority of our independent directors, including, but not limited to, the following:
• | any acquisition which at the time of investment would have a cost exceeding 50% of our total assets; and |
• | transactions that involve conflicts of interest with our Adviser (other than reimbursement of expenses in accordance with the Amended Advisory Agreement). |
Our Adviser and Administrator also engage in other business ventures and, as a result, certain (but not all) of their resources are not dedicated exclusively to our business. For example, our Adviser and Administrator also serve as the external adviser and administrator, respectively, to Gladstone Capital and Gladstone Investment, both publicly-traded business development companies affiliated with us, and Gladstone Commercial, a publicly-traded REIT, also affiliated with us. However, under the Amended Advisory Agreement, our Adviser is required to devote sufficient resources to the administration of our affairs to discharge its obligations under the agreement. The Amended Advisory Agreement is not assignable or transferable by either us or our Adviser without the consent of the other party, except that our Adviser may assign the Amended Advisory Agreement to an affiliate for whom our Adviser agrees to guarantee its obligations to us.
Gladstone Securities
Gladstone Securities is a privately-held broker-dealer registered with the Financial Industry Regulatory Authority and insured by the Securities Investor Protection Corporation. Gladstone Securities is an affiliate of ours, as its parent company is controlled by David Gladstone, our chairman, chief executive officer, and president. Mr. Gladstone also serves on the board of managers of Gladstone Securities.
Dealer-Manager Agreement
On January 10, 2018, in connection with the continuous offering of our newly-designated Series B Preferred Stock, we entered into a dealer-manager agreement (the “Dealer-Manager Agreement”) with Gladstone Securities, whereby Gladstone Securities will serve as our exclusive dealer-manager in connection with the offering of our Series B Preferred Stock (the “Series B Offering”). Pursuant to the Dealer-Manager Agreement, Gladstone Securities will provide certain sales, promotional, and marketing services to us in connection with the Series B Offering. Refer to Item 7, “Management Discussion and Analysis of Financial Condition and Results of Operations,” for a discussion of the fees and commissions to be paid to Gladstone Securities in connection with the Series B Offering.
12
Financing Arrangement Agreement
On April 11, 2017, we entered into an agreement with Gladstone Securities for it to act as our non-exclusive agent to assist us with arranging financing for our properties (the “Financing Arrangement Agreement”). Pursuant to the Financing Arrangement Agreement, Gladstone Securities may, from time to time, solicit the interest of various agricultural or commercial real estate lenders and/or recommend to us third-party lenders offering credit products or packages that are responsive to our needs. Refer to Item 7, “Management Discussion and Analysis of Financial Condition and Results of Operations,” for a discussion of the fees to be paid to Gladstone Securities in connection with the Financing Arrangement Agreement.
Employees
We do not currently have any employees and do not expect to have any employees in the foreseeable future. Currently, services necessary for our business are provided by individuals who are employees of our Adviser and our Administrator pursuant to the terms of the Amended Advisory Agreement and the Administration Agreement, respectively. Each of our executive officers is an executive officer of each our Adviser and our Administrator. We expect that approximately 15% to 20% of the full-time employees of our Adviser and our Administrator will spend substantial time on our matters during the 2018 calendar year. To the extent that we acquire more investments, we anticipate that the number of employees of our Adviser and our Administrator who devote time to our matters will increase and the number of our Adviser’s employees working out of local offices, if any, where we buy land will also increase.
As of December 31, 2017, our Adviser and our Administrator, collectively, had 65 full-time employees. A breakdown thereof is summarized by functional area in the table below:
Number of Individuals | Functional Area | |
12 | Executive Management | |
36 | Investment Management, Portfolio Management and Due Diligence | |
17 | Administration, Accounting, Compliance, Human Resources, Legal and Treasury | |
Competition
We face competition for farmland acreage from many different entities, including, but not limited to, developers, municipalities, individual farmers, agriculture corporations, institutional investors, and others. Investment firms that we might compete directly against could include agricultural investment firms, such as Hancock Agricultural Investment Group, Prudential Agricultural Investments, and UBS Agrivest, LLC. These firms engage in the acquisition, asset management, valuation, and disposition of farmland properties. Further competition may also come from other agricultural REITs, both publicly-traded (e.g., Farmland Partners, Inc.) and privately-held (e.g., Iroquois Valley Farms), and other agricultural-focused privately-held funds, such as AgIS Capital, LLC, and Homestead Capital.
Environmental Matters
As an owner of real estate, we are subject to various federal, state, and local environmental laws, regulations, and ordinances and also could be liable to third parties resulting from environmental contamination or noncompliance at our properties. Environmental laws often impose liability without regard to whether the owner or operator knew of or was responsible for the presence of the contaminants, and the costs of any required investigation or cleanup of these substances could be substantial. The liability is generally not limited under such laws and could exceed the property’s value and the aggregate assets of the liable party. The presence of contamination or the failure to remediate contamination at our properties also may expose us to third-party liability for personal injury or property damage or adversely affect our ability to lease the real property or to borrow using the real estate as collateral. These and other risks related to environmental matters are described in more detail in Item 1A, “Risk Factors.”
Other Required Financial Information
For other required financial information related to our properties, concentrations, segments, and operations, refer to our consolidated financial statements, including the notes thereto, included within this Form 10-K.
Available Information
Copies of each of our annual report on Form 10-K, quarterly reports on Form 10-Q, current reports on Form 8-K, proxy statements and amendments, if any, to those reports filed or furnished with the SEC, pursuant to Section 13(a) or 15(d) of the Exchange Act are available free of charge through our website at www.GladstoneLand.com. A request for any of these reports
13
may also be submitted to us by sending a written request addressed to Investor Relations, Gladstone Land Corporation, 1521 Westbranch Drive, Suite 100, McLean, VA, 22102, or by calling our toll-free investor relations line at 1-866-366-5745. The public may read and copy materials that we file with the SEC at the SEC’s Public Reference Room at 100 F Street, NE, Washington, DC, 20549. Information on the operation of the Public Reference Room may be obtained by calling the SEC at 1-800-SEC-0330. The SEC also maintains a website that contains reports, proxy and information statements, and other information regarding issuers that file electronically with the SEC at www.SEC.gov.
ITEM 1A. | RISK FACTORS |
An investment in our securities involves a number of significant risks and other factors relating to our structure and investment objectives. As a result, we cannot assure you that we will achieve our investment objectives. You should consider carefully the following information before making an investment in our securities.
Risks Relating to Our Business and Operations
Certain of our current properties are leased to the same tenants. If these tenants are no longer able to make rental payments or choose to terminate their leases prior to or upon expiration, it could have a material adverse effect on our financial performance and our ability to make distributions to our stockholders.
Five of our farms are currently leased to one unrelated tenant (“Tenant A”), and aggregate rental revenue attributable to Tenant A accounted for approximately 17.3% of the rental revenue recorded during the year ended December 31, 2017. In addition, throughout 2017, Dole Food Company ("Dole") leased two of our farms, and aggregate rental revenue attributable to Dole accounted for approximately 11.8% of the rental revenue recorded during the year ended December 31, 2017. Both of the leases with Dole were originally scheduled to expire in 2020; however, one of the leases was terminated on December 31, 2017, and re-leased to a new tenant, with the new lease commencing on January 1, 2018. Therefore, we do not expect rental revenues attributable to leases with Dole to make up more than 10.0% of our total rental revenues during 2018. However, if Tenant A fails to make rental payments, elects to terminate its leases prior to or upon their expirations, or does not renew its leases, and we cannot re-lease the land on satisfactory terms, or if Tenant A were to experience financial problems or declare bankruptcy, it could have a material adverse effect on our financial performance and our ability to make dividend payments to our stockholders.
Our real estate portfolio is concentrated in a limited number of properties and states, which subjects us to an increased risk of significant loss if any property declines in value, if we are unable to lease a property or adverse weather, economic or regulatory changes or developments in the markets in which our properties are located.
We currently own 74 farms located in 9 different states across the U.S. that are leased to 52 different, unrelated tenants and one related-party tenant (on a temporary basis). One consequence of a limited number of investments is that the aggregate returns we realize may be substantially adversely affected by the unfavorable performance of a small number of leases or a significant decline in the value of any single property. In addition, while we do not intend to invest more than 25% of our total assets in a particular property at the time of investment, it is possible that, as the values of our properties change over time, one property may comprise a significant percentage of the value of our total assets. Lack of diversification and investment concentration will increase the potential that a single underperforming investment could have a material adverse effect on our cash flows and the price we could realize from the sale of our properties. Since our current real estate profile is concentrated across only nine states, we are also currently subject to adverse changes in the political or regulatory climate in those states or specific counties where our properties are located that could adversely affect our real estate portfolio and our ability to lease properties. Finally, the geographic concentration of our portfolio could cause us to be more susceptible to adverse weather, economic or regulatory changes, or developments in the markets in which our properties are located than if we owned a more geographically-diverse portfolio, which could materially and adversely affect the value of our farms and our ability to lease our farms on favorable terms or at all.
We may not be successful in identifying and consummating additional suitable acquisitions that meet our investment criteria, which may impede our growth and negatively affect our results of operations.
We continue to actively seek and evaluate other farm properties for potential purchase, but there is no guarantee that we will be able to continue to find and acquire properties that meet our investment criteria. We expect that a significant number of our future tenants will be independent farming operations, about which there is generally little or no publicly available operating and financial information. As a result, we will rely on our Adviser to perform due diligence investigations of these tenants, their operations, and their prospects. We may not learn all of the material information we need to know regarding these
14
businesses through our investigations. As a result, it is possible that we could lease properties to tenants that ultimately are unable to pay rent to us, which could adversely impact the amount available for distributions.
Investments in development farmland, or farmland planted with immature permanent crops rather than annual crops or mature permanent crops, may have inherent risks, including those relating to the longer period between development and commercial productivity for certain permanent crop development farms, the cost of development, profitability of newly-developed farms, higher ongoing costs, and delayed development, all of which could adversely impact our results of operations and cash flow.
On a limited basis, we have invested in certain properties requiring further development before reaching commercial productivity, such as the development of an almond orchard, or in properties with immature permanent plantings. Such investments, and any future investments in property developments, involves risks that are different and, in most cases, greater than the risks associated with our acquisition of fully-developed and commercially-productive farms. In addition to the risks associated with real estate investments in general, as described elsewhere in this Form 10-K, the risks associated with our development farms include, among other things:
• | significant time lag between commencement of development and commercial productivity for permanent crop development farms subjects us to greater risks due to fluctuations in the general economy and adverse weather conditions; |
• | expenditure of money and time on development that may not be completed; |
• | inability to achieve rental rents per acre at newly-developed farms to make the properties profitable; |
• | higher than estimated costs, including labor and planting, irrigation or other related costs; and |
• | possible delays in development due to a number of factors, including weather, labor disruptions, regulatory approvals, acts of terror or other acts of violence, or acts of God (such as fires, earthquakes, or floods). |
All of our properties undergoing development or planted with immature permanent crops are currently leased and earning income. However, with regard to future acquisitions of such properties, the time frame required for development and for the farms to become commercially productive means that we may not be able to lease the farms and, in turn, generate revenue with respect to such farms for several years. If any of the above events occur, the development of such farms may hinder our growth and have a material adverse effect on our results of operations and cash flow. In addition, new development farms, regardless of whether or not they are ultimately productive, typically require substantial time and attention from management.
We currently lease many of our properties to medium-sized, independent farming operations and agricultural businesses, which may have limited financial and personnel resources and, therefore, may be less stable than larger companies, which could impact our ability to generate rental revenue.
We expect to lease a significant number of our properties to medium-sized farming operations and related agricultural businesses, which will expose us to a number of unique risks related to these entities. For example, medium-sized agricultural businesses may be more likely than larger farming operations to have difficulty making lease payments when they experience adverse events. They also tend to experience significant fluctuations in their operating results and to be more vulnerable to competitors’ actions and market conditions, as well as general economic downturns. In addition, our target tenants may face intense competition, including competition from companies with greater financial resources, which could lead to price pressure on crops that could lower our tenants’ income.
Furthermore, the success of a medium-sized business may also depend on the management talents and efforts of one or a small group of persons. The death, disability or resignation of one or more of these persons could have a material adverse impact on our tenant and, in turn, on us.
Our Adviser has broad authority to make acquisitions and dispositions of properties, and there can be no assurance that, in the future, we will be able to continue to enter into definitive agreements to purchase properties, complete acquisitions, or dispose of properties on favorable terms. Our stockholders are unable to evaluate the economic merits of our investments or the terms of any dispositions of properties.
Our Adviser has broad authority to make acquisitions of properties and dispositions of properties. There can be no assurance that our Adviser will be able to continue to identify or negotiate acceptable terms for the acquisition or dispositions of properties or that we will be able to continue to acquire or dispose of such properties on favorable terms. We may compete with other purchasers for attractive properties. Further factors that could cause us not to purchase one or more properties that initially meet our investment criteria include our potential inability to agree to definitive purchase terms with the prospective sellers and our discovery of problems with the properties in our due diligence investigations. Factors that could cause us to be unable to dispose of a property on favorable terms include market conditions and competition. Any significant impediment to continue to identify and make investments that fit into our investment criteria or dispose of investments during suitable market conditions would have a material adverse effect on our ability to continue to generate cash flow and make distributions to our stockholders.
15
Our cash available for distribution to stockholders may not be sufficient to pay anticipated distributions, nor can we assure you of our ability to make distributions in the future, and we may need to borrow to make such distributions or may not be able to make such distributions at all.
To remain competitive with alternative investments, our distribution rate may exceed our cash available for distribution, including cash generated from operations. In the event this happens, we intend to fund the difference out of any excess cash on hand or from borrowings under our revolving credit facility. If we do not have sufficient cash available for distribution generated by our assets to pay the annual distribution set by our Board of Directors, or if cash available for distribution decreases in future periods, the market price of our common stock could decrease.
All distributions will be made at the discretion of our Board of Directors and will depend on our earnings, our financial condition, whether we are able to maintain our qualification as a REIT, and other factors as our Board of Directors may deem relevant from time to time. We may not be able to make distributions in the future. In addition, some of our distributions may include a return of capital. To the extent that our Board of Directors approves distributions in excess of our then current and accumulated earnings and profits, these excess distributions would generally be considered a return of capital for federal income tax purposes to the extent of your adjusted tax basis in your shares. A return of capital is not taxable, but it has the effect of reducing your adjusted tax basis in your investment. To the extent that distributions exceed the adjusted tax basis of your shares, such excess will be treated for tax purposes as a gain from the sale or exchange of your shares. If we borrow to fund distributions, our future interest costs would increase, thereby reducing our earnings and cash available for distribution from what they otherwise would have been.
The timing and amount of prepayments could adversely affect the yields on our investments, therefore affecting our liquidity and profitability.
The yields of our assets may be affected by rates of prepayments that differ from our projections. Prepayments by our tenants may be influenced by changes in current interest rates and a variety of economic, geographic, and other factors beyond our control, and, consequently, such prepayment rates cannot be predicted with certainty. If we are unable to invest the proceeds of any significant prepayments we receive in assets with at least an equivalent yield, the overall yield on our portfolio will decline. In addition, we may acquire assets at a discount or premium, and if the asset does not repay when expected, our anticipated yield may be impacted. Under certain interest rate and prepayment scenarios, we may fail to fully recoup our cost of acquisition of certain investments, particularly with respect to short-term investments. An increase in prepayment rates could have a materially adverse effect on our results of operations, our liquidity and our ability to make distributions to our stockholders.
Some of our tenants may be unable to pay rent, which could adversely affect our cash available to make distributions to our stockholders or otherwise impair the value of your investment.
We expect that single tenants will continue to occupy most of our farms, and, therefore, the success of our investments will continue to be materially dependent on the financial stability of these tenants. Some of our tenants may have been recently restructured using leverage acquired in a leveraged transaction or may otherwise be subject to significant debt obligations. Tenants that are subject to significant debt obligations may be unable to make their rent payments if there are adverse changes in their businesses or in general economic conditions. Tenants that have experienced leveraged restructurings or acquisitions will generally have substantially greater debt and substantially lower net worth than they had prior to the leveraged transaction. In addition, the payment of rent and debt service may reduce the working capital available to leveraged entities and prevent them from devoting the resources necessary to remain competitive in their industries. In situations where management of the tenant will change after a transaction, it may be difficult for our Adviser to determine with certainty the likelihood of the tenant’s business success and of it being able to pay rent throughout the lease term. These companies are more vulnerable to adverse conditions in their businesses or industries and economic conditions generally, as well as to increases in interest rates. In addition, these companies’ revenues and expenses may fluctuate according to the growing season, which may impact their ability to make regular lease payments.
Any lease payment defaults by a tenant could adversely affect our cash flows and cause us to reduce the amount of distributions to stockholders. In the event of a default by a tenant, we may also experience delays in enforcing our rights as landlord and may incur substantial costs in protecting our investment and re-leasing our property.
Some of our tenants could be susceptible to bankruptcy, which would affect our ability to generate rents from them and therefore negatively affect our results of operations.
In addition to the risk of tenants being unable to make regular rent payments, certain of our tenants who may depend on debt and leverage could be especially susceptible to bankruptcy in the event that their cash flows are insufficient to satisfy their debt. Any bankruptcy of one of our tenants would result in a loss of lease payments to us, as well as an increase in our costs to carry the property.
16
Additionally, under bankruptcy law, a tenant who is the subject of bankruptcy proceedings has the option of continuing or terminating any unexpired lease. If a bankrupt tenant terminates a lease with us, any claim we might have for breach of the lease, excluding a claim against collateral securing the lease, would be treated as a general unsecured claim. Our claim would likely be capped at the amount the tenant owed us for unpaid rent prior to the bankruptcy unrelated to the termination, plus the greater of one year of lease payments or 15% of the remaining lease payments payable under the lease, but in no case more than three years of lease payments. In addition, a bankruptcy court could re-characterize a net lease transaction as a secured lending transaction. If that were to occur, we would not be treated as the owner of the property, but might have additional rights as a secured creditor. This would mean our claim in bankruptcy court would only be for the amount we paid for the property, which could adversely impact our financial condition.
Because we expect to continue to enter into some short-term leases, we may continue to be more susceptible to any decreases in prevailing market rental rates than would be the case with long-term leases, which could have a material adverse effect on our results of operations.
For our properties that are farmed for annual row crops, we intend to primarily enter into leases with independent and corporate farming operations having terms ranging from 3 to 10 years. As a result, we will be required to frequently re-lease our properties upon the expiration of our leases. This will subject our business to near term fluctuations in market rental rates, and we will be more susceptible to declines in market rental rates than we would be if we were to enter into longer term leases. As a result, any decreases in the prevailing market rental rates in the geographic areas in which we own properties could have a material adverse effect on our results of operations and cash available for distribution to stockholders.
Our investments in properties with long-term leases, such as properties farmed for permanent crops, could expose us to various risks, including interest rate risk and the risk of being unable to take advantage of prevailing market rates, which could have a material adverse effect on our results of operations and cash available for distribution to stockholders.
Currently, 28 of our 57 leases have original terms in excess of five years. In the future, we may continue to enter into long-term leases in which the rental rate is generally fixed, subject to annual rent escalations or market reset periods. Annual rent escalations may be a fixed amount each year or be variable based on standard cost of living or inflation indices. In addition, some long-term leases may require a regular survey of comparable land rents, with the rent owed per the lease being adjusted to reflect current market rents. If, in the future, we receive a significant portion of our revenues under long-term leases in which the rental rate is generally fixed, subject to annual rent escalations, we would be subject to interest rate risk in the event interest rates rise at a greater rate than any potential annual rent escalations. In addition, by entering into long-term leases, we would be subject to the risk that we would not be able to increase our rental rates if prevailing land values or rental rates have increased. Any inability to take advantage of increases in prevailing land values or rental rates could have a material adverse effect on our results of operations and cash available for distribution to stockholders.
Our investments in properties with leases with variable rent based on the success of the tenant’s harvest means that a portion of our cash flow is exposed to various risks, including risks related to declining crop prices and lower-than-average crop production, which could have a material adverse effect on the amount of rent we can collect and, consequently, our cash flow and ability to make distributions to our stockholders.
Currently, 13 of our 74 farms are subject to variable rent leases that are based on the success of the tenants' harvests each year; however, they also include guarantees of a minimum amount of rental income that satisfy our investment return criteria. While we do not expect variable rent leases based on crop harvest to make up a significant portion of our overall leased portfolio, we intend to enter into additional variable rent leases. We anticipate that each variable rent lease will have a floor that guarantees a minimum amount of rental income that satisfies our investment return criteria; however, such leases will still be impacted by factors related to the success of the tenant’s harvest, including, but not limited to, declining crop prices and lower-than-average crop production, that may result in us receiving less rent than anticipated or projected when entering into such leases. A reduction in the rent we receive could have a material adverse effect on our cash flow and ability to make distributions to our stockholders.
Our investments in farmland used for permanent crops have a higher risk profile than farmland used for annual row crops.
Currently, 29 of our 74 farms are used for permanent crops, and, in the future, we may add to our investments in farmland used for permanent crops, as opposed to annual row crops. Permanent crops have plant structures (such as trees, vines, or bushes) that produce yearly crops without being replanted. Examples include almonds, apples, blueberries, grapes, and oranges. Permanent crops involve more risk than annual row crops because permanent crops require more time and capital to plant. As a result, permanent crops are more expensive to replace and more susceptible to disease and poor weather. If a farmer loses a permanent crop to any natural disaster, such as drought, flooding, fire, or disease, there would generally be significant time and capital needed to return the land to production because a tree or vine may take years to grow before bearing fruit.
17
Permanent crop farmland also prevents the farmer from being able to rotate crop types to keep up with changing market conditions or changes to the weather or soil. If demand for one type of permanent crop decreases, the permanent crop farmer cannot easily convert the farm to another type of crop because permanent crop farmland is dedicated to one crop during the lifespan of the trees or vines and therefore cannot easily be rotated to adapt to changing environmental or market conditions.
In addition, permanent crops, which can generally endure long periods of time from harvest to consumption, allow for global shipment and trade. As a result, permanent crops are usually less insulated from the global market volatility than annual row crops. This will generally provide for less price stability of the harvested crop and therefore less stability of the underlying land value for cropland producing permanent crops. As a result, permanent crop farms typically have a higher risk profile than annual row crop farms.
Our real estate investments will consist of agricultural properties that may be difficult to sell or re-lease upon tenant defaults or early lease terminations, either of which would adversely affect returns to stockholders.
We intend to focus our investments on agricultural properties. These types of properties are relatively illiquid compared to other types of real estate and financial assets. This illiquidity could limit our ability to quickly dispose of properties in response to changes in economic or other conditions. With these kinds of properties, if the current lease is terminated or not renewed, we may be required to renovate the property to the extent we have buildings on the property, or to make rent concessions to lease the property to another tenant or sell the property. In addition, in the event we are forced to sell the property, we may have difficulty finding qualified purchasers who are willing to buy the property. These and other limitations may affect our ability to sell or re-lease properties without adversely affecting returns to our stockholders.
If we sell properties and provide financing to purchasers, defaults by the purchasers would decrease our cash flows and limit our ability to make distributions.
In some instances, we may sell our properties by providing financing to purchasers who may then also operate the farm. When we provide financing to purchasers, we may bear the risk that the purchaser may default, which could negatively impact our liquidity and thus our ability to either distribute the proceeds from the sale to our stockholders or reinvest the sale proceeds in other property acquisitions.
If our properties do not have access to adequate water supplies, it could harm our ability to lease the properties for farming, thereby adversely affecting our ability to generate returns on our properties.
In order to lease the cropland that we intend to acquire, these properties will require access to sufficient water to make them suitable for farming. Additionally, the ability of our current tenants to be able to make their rental payments is also dependent upon sufficient access to water. Although we expect to acquire properties with sufficient water access, should the need arise for additional wells from which to obtain water, we would be required to obtain permits prior to drilling such wells. Permits for drilling water wells are required by state and county regulations, and such permits may be difficult to obtain due to the limited supply of water in areas where we expect to acquire properties, such as the farming regions of California. Similarly, our properties may be subject to governmental regulations relating to the quality and disposition of rainwater runoff or other water to be used for irrigation. In such case, we could incur costs necessary to retain this water. If we are unable to obtain or maintain sufficient water supply for our properties, our ability to lease them for farming would be seriously impaired, which would have a material adverse impact on the value of our assets and our results of operations. If in the future we invest in farmland that depends upon rain water rather than local water access, our tenants on that farmland may be susceptible to extended droughts, and any failure on the part of such tenants to procure adequate drought insurance would impact the ability of such tenants to make rental payments, which would have a material adverse impact on our ability to generate returns on our properties.
Our agricultural properties are subject to adverse weather conditions, seasonal variability, crop disease and other contaminants, which may affect our tenants’ ability to pay rent and thereby have an adverse effect on our results of operations and our ability to make distributions to stockholders.
Fresh produce, including produce used in canning and other packaged food operations, is vulnerable to adverse weather conditions, including windstorms, floods, drought and temperature extremes, which are quite common but difficult to predict. Because fresh produce is highly perishable and generally must be brought to market and sold soon after harvest, unfavorable growing conditions can reduce both crop size and crop quality. Seasonal factors, including supply and consumer demand, may also have an effect on the crops grown by our tenants. In extreme cases, entire harvests may be lost in some geographic areas.
Further, certain of our properties are reliant upon groundwater, as they are not located within any state or federal water districts and, thus, are not limited by any government-regulated restrictions. While recent heavy rainfall has helped to alleviate drought concerns across most of California, parts of the state remain in varying degrees of drought categorizations, and if the severity of the drought were to return to prior levels, it could have a materially adverse impact on our farming operations on our properties in these regions.
18
Fresh produce is also vulnerable to crop disease, pests and other contaminants. Damages to tenants’ crops from crop disease and pests may vary in severity and effect, depending on the stage of production at the time of infection or infestation, the type of treatment applied and climatic conditions. The costs to control these infestations vary depending on the severity of the damage and the extent of the plantings affected. These infestations can increase costs and decrease revenues of our tenants. Tenants may also incur losses from product recalls due to other contaminants that may cause food borne illness. It is difficult to predict the occurrence or severity of such product recalls as well as the impact of these upon our tenants. Although we do not expect that a significant portion our rental payments will be based on the quality of our tenants’ harvests, any of these factors could have a material adverse effect on our tenants’ ability to pay rent to us, which in turn could have a material adverse effect on our ability to make distributions to our stockholders.
As permanent crops produce yearly crops without being replanted, they are more expensive to replace and more susceptible to disease and poor weather than annual row crops. If a farmer loses a permanent crop to any natural disaster, such as drought, flooding, fire or disease, there would generally be significant time and capital needed to return the land to production because a tree or vine may take years to grow before bearing fruit. Permanent crop farmland also prevents the farmer from being able to rotate crop types to keep up with changing market conditions or changes to the weather or soil. If demand for one type of permanent crop decreases, the permanent crop farmer cannot easily convert the farm to another type of crop because permanent crop farmland is dedicated to one crop during the lifespan of the trees or vines and therefore cannot easily be rotated to adapt to changing environmental or market conditions. As a result, the risks associated with weather conditions, seasonal variability, crop disease and other contaminants are magnified in the case of permanent crops.
Our operating results and the value of our properties may be impacted by future climate changes, adversely impacting the value of our properties and our ability to generate rental revenue.
In addition to the general risks that adverse weather conditions will pose for the tenants of our properties and their subsequent ability to comply with the terms of their leases, the value of our properties will potentially be subject to risks associated with long-term effects of climate change. Many climatologists predict increases in average temperatures, more extreme temperatures and increases in volatile weather over time. The effects of climate change may be more significant along coastlines, such as in the California coastal areas where we intend to partially focus our initial acquisition efforts, due to rising sea levels resulting from melting of polar ice caps, which could result in increased risk of coastal erosion, flooding, degradation in the quality of groundwater aquifers and expanding agricultural weed and pest populations. As a result, the effects of climate change could make our properties less suitable for farming or other alternative uses, which could adversely impact the value of our properties, our ability to generate rental revenue from leasing our properties and our cash available for distribution to stockholders. Climate change may also have indirect effects on our business by increasing the cost of, or availability of, property insurance on terms we find acceptable and increasing the cost of energy at our properties.
Because we must distribute a substantial portion of our net income to maintain our qualification as a REIT, we will be largely dependent on third-party sources of capital to fund our future capital needs.
To maintain our qualification as a REIT, we generally must distribute to our stockholders at least 90% of our taxable income each year, excluding capital gains. Because of this distribution requirement, it is not likely that we will be able to fund a significant portion of our future capital needs, including property acquisitions, from retained earnings. Therefore, we may acquire additional capital from the issuance of securities senior to our common shares, including borrowings or other indebtedness, preferred shares (such as our Series A Term Preferred Stock or Series B Preferred Stock) or the issuance of other securities. This capital may not be available on favorable terms or at all. Our access to additional capital depends on a number of things, including the market’s perception of our growth potential and our current and potential future earnings.
To the extent we issue debt securities, other instruments of indebtedness or additional preferred stock or borrow additional money from banks or other financial institutions, we will be additionally exposed to risks associated with leverage, including increased risk of loss. If we issue additional preferred securities that rank senior to our common shares in our capital structure, the holders of such preferred securities may have separate voting rights and other rights, preferences, or privileges, economic and otherwise, more favorable than those of our common shares and our currently-designated preferred securities (including our Series A Term Preferred Stock and Series B Preferred Stock), and the issuance of such preferred securities could have the effect of delaying, deferring, or preventing a transaction or a change of control that might involve a premium price for common stockholders.
Any inability to access additional financing on terms that are favorable to us may adversely affect our ability to grow and our business generally.
We may not be able to raise sufficient capital or borrow money in sufficient amounts or on sufficiently favorable terms necessary to attain the optimal degree of leverage to operate our business, which may have an adverse effect on our operations and ability to pay distributions.
19
Our ability to raise additional capital in the markets may be limited due to market conditions and applicable SEC regulations. Our business and acquisition strategies rely heavily on borrowing funds, so that we may make more investments than would otherwise be possible to maximize potential returns to stockholders. We may borrow on a secured or unsecured basis. Our charter and bylaws do not impose any limitation on our borrowing. Our ability to achieve our investment objectives will be affected by our ability to borrow money in sufficient amounts and on favorable terms, which may result in us becoming highly leveraged. We expect that we will borrow money that will be secured by our properties and that these financing arrangements will contain customary covenants such as those that limit our ability, without the prior consent of the lender, to further mortgage the applicable property or to discontinue insurance coverage. In addition, any credit facility we might enter into is likely to contain certain customary restrictions, requirements and other limitations on our ability to incur indebtedness, and will specify debt ratios that we will be required to maintain. Accordingly, we may be unable to obtain the degree of leverage that we believe to be optimal, which may cause us to have less cash for distributions to stockholders. Our use of leverage could also make us more vulnerable to a downturn in our business or the economy generally and a significant increase in the ratio of our indebtedness to our assets may have an adverse effect on the market price of our common stock.
Our income from operations may not be enough to cover our debt service obligations, which may affect distributions to stockholders or cause us to incur losses.
If the income generated by our properties and other assets fails to cover our debt service, we could be forced to reduce or eliminate distributions to our stockholders and may experience losses. Some of our debt financing arrangements may require us to make lump-sum, or balloon, payments at maturity. If our income from operations does not cover a balloon payment, our ability to make the balloon payment at maturity could depend upon our ability to obtain additional financing or to sell the financed property. At the time the balloon payment is due, we may not be able to refinance the balloon payment on terms as favorable as the original loan or sell the property at a price sufficient to make the balloon payment, which would likely have a material adverse effect on our financial condition.
We have secured borrowings, which would have a risk of loss of the property securing such loan upon foreclosure.
We currently have various borrowing facilities in place that are secured by certain of our farms. As of December 31, 2017, our total borrowings of $303.0 million, which had a blended annual stated interest rate before interest patronage, or refunded interest, of 3.48%, were secured by all 73 of the farms we owned as of that date. If we are unable to make our debt payments as required, either under our current credit facilities or any future facilities, a lender could foreclose on certain of the properties securing its loan. This could cause us to lose part or all of our investment in the property, which in turn could cause the value of our common stock, Series A Term Preferred Stock, or Series B Preferred Stock or the distributions to our stockholders to be reduced or delayed.
As we consider additional debt financing from third-party lenders, our assets may become highly leveraged, which may result in losses.
There is no limitation imposed by our charter or bylaws on our borrowings. An increased amount of leverage may expose us to cash flow problems if rental income decreases. Under those circumstances, in order to pay our debt obligations, including distribution and dividend payments to holders of our common stock and Series A Term Preferred Stock, we might be required to sell properties at a loss or be unable to make distributions or decrease distributions to our stockholders. A failure to pay amounts due to lenders and holders of our Series A Term Preferred Stock may result in a default on our obligations and result in certain penalties, such as increased interest rates. Additionally, our degree of leverage could adversely affect our ability to obtain additional financing and may have an adverse effect on the market price of our common shares and Series A Term Preferred Stock.
We face a risk from the fact that certain of our properties are cross-collateralized.
As of December 31, 2017, the mortgages on certain of our properties were cross-collateralized. To the extent that any of the properties in which we have an interest are cross-collateralized, any default by the property owner subsidiary under the mortgage note relating to the one property will result in a default under the financing arrangements relating to any other property that also provides security for that mortgage note or is cross-collateralized or cross-defaulted with such mortgage note. Such a default may adversely affect our financial condition, results of operations and ability to pay distributions to our stockholders.
Competition for the acquisition of agricultural real estate may impede our ability to make acquisitions, increase the cost of these acquisitions or decrease or prevent increases in the occupancy and rental rates of our current properties.
We will compete for the acquisition of properties with many other entities engaged in agricultural and real estate investment activities, including corporate agriculture companies, financial institutions, institutional pension funds, real estate companies, private equity funds and private real estate investors. These competitors may prevent us from acquiring desirable properties or
20
may cause an increase in the price we must pay for real estate. Our competitors may have greater resources than we do and may be willing to pay more for certain assets or may have a more compatible operating philosophy with our acquisition targets. In particular, larger institutions may enjoy significant competitive advantages that result from, among other things, a lower cost of capital and enhanced operating efficiencies. Our competitors may also adopt transaction structures similar to, or more favorable than ours, offering rental rates below current market rates or below rates we currently charge our tenants, which would decrease our competitive advantage in offering flexible transaction terms. In addition, the number of entities and the amount of funds competing for suitable investment properties may increase, resulting in increased demand and increased prices paid for these properties. If we pay higher prices for properties, our profitability may decrease, and you may experience a lower return on your investment. Increased competition for properties may also preclude us from acquiring those properties that would generate attractive returns to us, as well as prevent us from achieving diversification by geography and crop type, having a material adverse effect on our results of operations and available cash for distributions to stockholders.
We operate as a holding company dependent upon the assets and operations of our subsidiaries, and because of our structure, we may not be able to generate the funds necessary to make distributions on our common stock.
We generally operate as a holding company that conducts its businesses primarily through our Operating Partnership, which in turn is a holding company conducting its business through its subsidiaries. These subsidiaries conduct all of our operations and are our only source of income. Accordingly, we are dependent on cash flows and payments of funds to us by our subsidiaries as distributions, loans, advances, leases or other payments from our subsidiaries to generate the funds necessary to make distributions on our common stock. Our subsidiaries’ ability to pay such distributions and/or make such loans, advances, leases or other payments may be restricted by, among other things, applicable laws and regulations, current and future debt agreements and management agreements into which our subsidiaries may enter, which may impair our ability to make cash payments on our common stock. In addition, such agreements may prohibit or limit the ability of our subsidiaries to transfer any of their property or assets to us, any of our other subsidiaries or to third parties. Our future indebtedness or our subsidiaries’ future indebtedness may also include restrictions with similar effects.
In addition, because we are a holding company, stockholders’ claims will be structurally subordinated to all existing and future liabilities and obligations (whether or not for borrowed money) of our Operating Partnership and its subsidiaries. Therefore, in the event of our bankruptcy, liquidation or reorganization, claims of our stockholders will be satisfied only after all of our and our operating partnership’s and its subsidiaries’ liabilities and obligations have been paid in full.
Some state laws prohibit or restrict the ownership of agricultural land by business entities, which could impede the growth of our portfolio and our ability to diversify geographically.
Certain states, including Iowa, North Dakota, South Dakota, Minnesota, Oklahoma, Wisconsin, Missouri, and Kansas have laws that prohibit or restrict to varying degrees the ownership of agricultural land by corporations or business entities like us. Additional states may, in the future, pass similar or more restrictive laws, and we may not be legally permitted, or it may become overly burdensome or expensive, to acquire properties in these states, which could impede the growth of our portfolio and our ability to diversify geographically in states that might otherwise have attractive investment opportunities.
Failure to succeed in new markets may have adverse consequences.
As we expand and diversify our geographic portfolio, we may acquire properties located in new markets, exposing us to risks associated with a lack of market knowledge or understanding of the local market. This includes the availability and identity of quality tenant farmers, forging new business relationships in the area and unfamiliarity with local government requirements and procedures. Furthermore, the evaluation and negotiation of a potential expansion into new markets would divert management time and other resources. As a result, we may have difficulties executing our business strategy in these new markets, which could have a negative impact on our results of operations and ability to make distributions to stockholders.
We may not ultimately be able to sell our agricultural real estate to developers in connection with the conversion of such properties to urban or suburban uses, especially in light of the current uncertain market for real estate development.
Our business plan in part contemplates purchasing agricultural real property that we believe is located in the path of urban and suburban growth and ultimately will increase in value over the long term as a result. Pending the sale of such real property to developers for conversion to urban, suburban and other more intensive uses, such as residential or commercial development, we intend to lease the property for agricultural uses, particularly farming. Urban and suburban development is subject to a number of uncertainties, including land zoning and environmental issues, infrastructure development and demand. These uncertainties are particularly pronounced in light of the current economic environment, in which the pace of future development is unclear. Although the current development market contains uncertainties, these uncertainties may be more acute over time, since we do not intend to acquire properties that are expected to be converted to urban or suburban uses in the near term. As a result, there can be no guarantee that increased development will actually occur and that we will be able to sell any
21
of the properties that we own or acquire in the future for such conversion. Our inability to sell these properties in the future at an appreciated value for conversion to urban or suburban uses could result in a reduced return on your investment.
Liability for uninsured or underinsured losses could adversely affect our financial condition.
Losses from disaster-type occurrences, such as wars, earthquakes and weather-related disasters, may be either uninsurable or not insurable on economically viable terms. Should an uninsured loss occur, we could lose our capital investment or anticipated profits and cash flows from one or more properties. If any such loss is insured, we may be required to pay a significant deductible on any claim for recovery of such a loss prior to our insurer being obligated to issue reimbursement. Further, the amount of losses may exceed our coverage, which could have an adverse effect on our cash flow.
Potential liability for environmental matters could adversely affect our financial condition.
We intend to purchase agricultural properties and will be subject to the risk of liabilities under federal, state and local environmental laws. Some of these laws could subject us to:
• | responsibility and liability for the cost of removal or remediation of hazardous substances released on our properties, which may include herbicides and pesticides, generally without regard to our knowledge of or responsibility for the presence of the contaminants; |
• | liability for the costs of removal or remediation of hazardous substances at disposal facilities for persons who arrange for the disposal or treatment of these substances; and |
• | potential liability for claims by third parties for damages resulting from environmental contaminants. |
We will generally include provisions in our leases making tenants responsible for all environmental liabilities and for compliance with environmental regulations, and we will seek to require tenants to reimburse us for damages or costs for which we have been found liable. However, these provisions will not eliminate our statutory liability or preclude third-party claims against us. Even if we were to have a legal claim against a tenant to enable us to recover any amounts we are required to pay, there are no assurances that we would be able to collect any money from the tenant. Our costs of investigation, remediation or removal of hazardous substances may be substantial. In addition, the presence of hazardous substances on one of our properties, or the failure to properly remediate a contaminated property, could adversely affect our ability to sell or lease the property or to borrow using the property as collateral. Additionally, we could become subject to new, stricter environmental regulations, which could diminish the utility of our properties and have a material adverse impact on our results of operations.
If our tenants fail to comply with applicable labor regulations, it could have an adverse effect on our ability to make distributions to our stockholders.
State, county and federal governments have also implemented a number of regulations governing labor practices used in connection with farming operations. For example, these regulations seek to provide for minimum wages and minimum and maximum work hours, as well as to restrict the hiring of illegal immigrants. If one of our tenants is accused of violating, or found to have violated such regulations, it could have a material adverse effect on the tenant’s operating results, which could adversely affect its ability to make its rental payments to us and, in turn, our ability to make distributions to our stockholders.
The presence of endangered or threatened species on or near our acquired farmland could restrict the activities of our agricultural tenants, which could in turn have a material adverse impact on the value of our assets and our results of operations.
Federal, state and local laws and regulations intended to protect threatened or endangered species could restrict certain activities on our farmland. The size of any area subject to restriction would vary depending on the protected species at issue, the time of year and other factors, and there can be no assurance that such federal, state and local laws will not become more restrictive over time. If portions of our farmland are deemed to be part of or bordering habitats for such endangered or threatened species that could be disturbed by the agricultural activities of our tenants, it could impair the ability of the land to be used for farming, which in turn could have a material adverse impact on the value of our assets and our results of operations.
We may be required to permit the owners of the mineral rights to our properties to enter and occupy parts of the properties for the purposes of drilling and operating oil or gas wells, which could adversely impact the rental value of our properties.
Although we will own the surface rights to the properties that we acquire, other persons may own the rights to any minerals, such as oil and natural gas, that may be located under the surfaces of these properties. Under agreements with any such mineral rights owners, we expect that we would be required to permit third parties to enter our properties for the purpose of drilling and operating oil or gas wells on the premises. We will also be required to set aside a reasonable portion of the surface area of our properties to accommodate these oil and gas operations. The devotion of a portion of our properties to these oil and gas operations would reduce the amount of the surface available for farming or farm-related uses, which could adversely impact the rents that we receive from leasing these properties.
22
Failure to hedge effectively against interest rate changes may adversely affect our results of operations.
We may experience interest rate volatility in connection with mortgage loans on our properties or other variable-rate debt that we may obtain from time to time. The interest rate on our existing line of credit is variable, and, although we seek to mitigate this risk by structuring such provisions to contain a minimum interest rate or escalation rate, as applicable, these features do not eliminate this risk. We are also exposed to the effects of interest rate changes as a result of holding cash and cash equivalents in short-term, interest-bearing investments. We have not entered into any derivative contracts to attempt to further manage our exposure to interest rate fluctuations. A significant change in interest rates could have an adverse impact on our results of operations.
Joint venture investments could be adversely affected by our lack of sole decision making authority, our reliance on co-venturers’ financial condition and disputes between our co-venturers and us.
We may invest with third parties through partnerships, joint ventures or other entities, acquiring non-controlling interests in or sharing responsibility for managing the affairs of a property, partnership, joint venture or other entity. In such event, we will not have sole decision-making authority regarding the property, partnership, joint venture or other entity. Investments in partnerships, joint ventures or other entities may, under certain circumstances, involve risks not present were a third party not involved, including the possibility that partners or co-venturers may become bankrupt or fail to fund their share of required capital contributions. Partners or co-venturers also may have economic or other business interests or goals that are inconsistent with our business interests or goals and may be in a position to take actions contrary to our preferences, policies or objectives, which could result in our premature exit of such investment and reduce any expected returns or result in a loss. Any such adverse actions could also jeopardize our qualification as a REIT or the tax status of the joint venture, requiring us to pay taxes or subjecting properties owned by the joint venture to liabilities greater than those contemplated by the terms of the agreements governing the investment relationship. Such investments also will have the potential risk of our reaching impasses with our partners or co-venturers on key decisions, such as a sale, because neither we nor the partner or co-venturer would have full control over the partnership or joint venture. Disputes between us and partners or co-venturers may result in litigation or arbitration that would increase our expenses and prevent our management team from focusing its time and effort exclusively on our business. In addition, we may in some circumstances be liable for the actions of our third-party partners or co-venturers.
Continued disruptions in the U.S. financial markets could affect our ability to obtain debt financing on reasonable terms or have other adverse effects on us.
Over the last several years, the U.S. capital markets have experienced significant price volatility, which have caused market prices of many stocks and debt securities to fluctuate substantially and the spreads on prospective debt financings to widen considerably. These circumstances have materially impacted liquidity in the financial markets, making terms for certain financings less attractive, and in certain cases have resulted in the lack of availability of certain types of financing. Continued uncertainty in the stock and credit markets may negatively impact our ability to access additional financing at reasonable terms, which may negatively affect our ability to make acquisitions. These disruptions in the financial markets also may have a material adverse effect on the market value of our common stock and the lease rates we can charge for our properties, as well as other unknown adverse effects on us or the economy in general. In addition, credit market constraints may increase the operating expenses of our tenants and decrease their ability to make lease payments and may adversely affect our liquidity, financial condition, results of operations and ability to pay distributions to our stockholders.
We cannot predict the impact future actions by regulators or government bodies, including the U.S. Federal Reserve, will have on real estate debt markets, the market value of our capital stock or on our business, and any such actions may negatively impact us.
Regulators and U.S. government bodies have a major impact on our business. The U.S. Federal Reserve is a major participant in, and its actions significantly impact, the real estate dcebt markets. Over the past year, the Federal Reserve has made gradual increases in the federal funds rate. These increases in the federal funds rate and any future increases due to other key economic indicators, such as the unemployment rate or inflation, may cause interest rates and borrowing costs to rise, which may negatively impact our ability to access the debt markets on favorable terms and the market value of our capital stock. This may result in future acquisitions by us generating lower overall economic returns and increasing the costs associated with refinancing current debt, which could potentially reduce future cash flow available for distributions. It is difficult to predict future legislation, regulation, and actions under the new presidential administration, and we cannot predict or control the impact future actions by regulators or government bodies, such as the U.S. Federal Reserve, will have on our business.
Cybersecurity risks and cyber incidents may adversely affect our business by causing a disruption to our operations or the operations of businesses in which we invest, a compromise or corruption of our confidential information, and/or damage to our business relationships, all of which could negatively impact our business, financial condition, and operating results.
23
In the normal course of business, we and our service providers collect and retain certain personal information provided by our tenants, employees of our Administrator and Adviser, and vendors. We also rely extensively on computer systems to process transactions and manage our business. A cyber incident is considered to be any adverse event that threatens the confidentiality, integrity, or availability of our information resources. These incidents may be an intentional attack or an unintentional event and could involve gaining unauthorized access to our information systems for purposes of misappropriating assets, stealing confidential information, corrupting data, or causing operational disruption. The result of these incidents may include disrupted operations, misstated or unreliable financial data, liability for stolen assets or information, increased cybersecurity protection and insurance costs, litigation, and damage to our business relationships. As our reliance on technology has increased, so have the risks posed to our information systems, both internal and those provided to us by third-party service providers. We have implemented or plan on implementing additional processes, procedures, and internal controls to help mitigate cybersecurity risks and cyber intrusions, but these measures, as well as our increased awareness of the nature and extent of a risk of a cyber-incident, do not guarantee that a cyber-incident will not occur and/or that our financial results, operations, or confidential information will not be negatively impacted by such an incident.
Upcoming changes in U.S. generally-accepted accounting principles (“GAAP”) regarding operating leases may make the leasing of our properties less attractive to prospective tenants and reduce potential lease terms.
In February 2016, the Financial Accounting Standards Board (“FASB”) issued ASU 2016-02, “Leases (Topic 842): An Amendment to the FASB Accounting Standards Codification” (“ASU 2016-02”). Under the new leasing standard, a lessee is required to record a right-of-use asset and a lease liability for all leases with a term greater than 12 months, regardless of their classification. The upcoming standard is effective for fiscal years (and interim periods within those fiscal years) beginning after December 15, 2018, and will affect lessee accounting for most current and prospective tenants. This standard may encourage current and prospective tenants to either enter into shorter term leases or acquire real estate outright in order to lessen the impact to their balance sheets, both of which may adversely impact our operations.
Risks Associated With Our Use of an Adviser to Manage Our Business
We are dependent upon our key management personnel for our future success, particularly David Gladstone and Terry Lee Brubaker.
We are dependent on our senior management and other key management members to carry out our business and investment strategies. Our future success depends to a significant extent on the continued service and coordination of our senior management team, particularly David Gladstone, our chairman, chief executive officer and president, and Terry Lee Brubaker, our vice chairman and chief operating officer. Mr. Gladstone also serves as the chief executive officer of our Adviser and our Administrator, and Mr. Brubaker is also an executive officer of our Adviser and our Administrator. The departure of any of our executive officers or key personnel of our Adviser could have a material adverse effect on our ability to implement our business strategy and to achieve our investment objectives.
Our success will continue to depend on the performance of our Adviser and if our Adviser makes inadvisable investment or management decisions, our operations could be materially adversely impacted.
Our ability to achieve our investment objectives and to pay distributions to our stockholders is substantially dependent upon the performance of our Adviser in evaluating potential investments, selecting and negotiating property purchases and dispositions on our behalf, selecting tenants and borrowers, setting lease terms and determining financing arrangements. You will have no opportunity to evaluate the terms of transactions or other economic or financial data concerning our investments. You must rely entirely on the analytical and management abilities of our Adviser and the oversight of our Board of Directors. If our Adviser or our Board of Directors makes inadvisable investment or management decisions, our operations could be materially adversely impacted.
We may have conflicts of interest with our Adviser and other affiliates, which could result in investment decisions that are not in the best interests of our stockholders.
Our Adviser manages our real estate portfolio and locates, evaluates, recommends and negotiates the acquisition of our real estate investments and mortgage loans. At the same time, our Advisory Agreement permits our Adviser to conduct other commercial activities and to provide management and advisory services to other entities, including, but not limited to, Gladstone Capital, Gladstone Commercial and Gladstone Investment, each of which is affiliated with us. Each of our executive officers are also executive officers of Gladstone Commercial, which actively makes real estate investments, and each of our executive officers, other than Messrs. Beckhorn and Parrish, and each of our directors are also executive officers and directors, as applicable, of Gladstone Capital and Gladstone Investment, which actively make loans to and invest in small- and medium-sized companies. As a result, we may from time to time have conflicts of interest with our Adviser in its management of our business and that of Gladstone Commercial, Gladstone Investment or Gladstone Capital, which may arise primarily from the
24
involvement of our Adviser, Gladstone Capital, Gladstone Commercial, Gladstone Investment and their affiliates in other activities that may conflict with our business. Examples of these potential conflicts include:
• | our Adviser may realize substantial compensation on account of its activities on our behalf and may be motivated to approve acquisitions solely on the basis of increasing its compensation from us; |
• | our agreements with our Adviser are not arm’s-length agreements, which could result in terms in those agreements that are less favorable than we could obtain from independent third parties; |
• | we may experience competition with our affiliates for potential financing transactions; and |
• | our Adviser and other affiliates, such as Gladstone Capital, Gladstone Commercial and Gladstone Investment, could compete for the time and services of our officers and directors and reduce the amount of time they are able to devote to management of our business. |
These and other conflicts of interest between us and our Adviser could have a material adverse effect on the operation of our business and the selection or management of our real estate investments.
Our financial condition and results of operations will depend on our Adviser’s ability to effectively manage our future growth.
Our ability to achieve our investment objectives will depend on our ability to sustain continued growth, which will, in turn, depend on our Adviser’s ability to find, select and negotiate property purchases and net leases that meet our investment criteria. Accomplishing this result on a cost-effective basis is largely a function of our Adviser’s marketing capabilities, management of the investment process, ability to provide competent, attentive and efficient services and our access to financing sources on acceptable terms. As we grow, our Adviser may be required to hire, train, supervise and manage new employees. Our Adviser’s failure to effectively manage our future growth could have a material adverse effect on our business, financial condition and results of operations.
Our Adviser is not obligated to provide a waiver of the incentive fee, which could negatively impact our earnings and our ability to maintain our current level of, or increase, distributions to our stockholders.
The Amended Advisory Agreement contemplates a quarterly incentive fee based on our funds from operation (“FFO”). Our Adviser has the ability to issue a full or partial waiver of the incentive fee for current and future periods; however, our Adviser is not required to issue any waiver. Any waiver issued by our Adviser is an unconditional and irrevocable waiver. If our Adviser does not issue this waiver in future quarters, it could negatively impact our earnings and may compromise our ability to maintain our current level of, or increase, distributions to our stockholders.
We may be obligated to pay our Adviser quarterly incentive compensation even if we incur a net loss during a particular quarter.
The Amended Advisory Agreement entitles our Adviser to incentive compensation based on our FFO, which rewards our Adviser if our quarterly pre-incentive fee FFO exceeds 1.75% (7.0% annualized) of our adjusted stockholders’ equity. Our pre-incentive fee FFO for a particular quarter for incentive compensation purposes excludes the effect of any unrealized gains, losses or other items during that quarter that do not affect realized net income, even if these adjustments result in a net loss on our statement of operations for that quarter. Thus, we may be required to pay our Adviser incentive compensation for a fiscal quarter even if we incur a net loss for that quarter as determined in accordance with GAAP.
Risks Associated With Ownership of Our Common Stock and OP Units and Our Tax Status
Certain provisions contained in our charter and bylaws and under Maryland law may prohibit or restrict attempts by our stockholders to change our management and hinder efforts to effect a change of control of us, and the market price of our common stock may be lower as a result.
There are provisions in our charter and bylaws that may make it difficult for a third party to acquire, or attempt to acquire, control of our company, even if a change in control was considered favorable by you and other stockholders. For example:
• | Our articles of incorporation prohibit ownership of more than 3.3% of the outstanding shares of our capital stock by one person, except for certain qualified institutional investors, which are limited to holding 9.8% of our common stock. Currently, our chairman, chief executive officer and president, David Gladstone, owns approximately 14.4% of our common stock, and the Gladstone Future Trust, for the benefit of Mr. Gladstone’s children, owns approximately 4.8% of our common stock, in each case pursuant to an exception approved by our Board of Directors and in compliance with our charter. In addition, the David and Lorna Gladstone Foundation, of which David Gladstone is the CEO and Chairman, owns 1.6% of our common stock. The ownership restriction may discourage a change of control and may deter individuals or entities from making tender offers for our capital stock, which offers might otherwise be financially attractive to our stockholders or which might cause a change in our management. |
25
• | Our Board is divided into three classes, with the term of the directors in each class expiring every third year. At each annual meeting of stockholders, the successors to the class of directors whose term expires at such meeting will be elected to hold office for a term expiring at the annual meeting of stockholders held in the third year following the year of their election. After election, a director may only be removed by our stockholders for cause. Election of directors for staggered terms with limited rights to remove directors makes it more difficult for a hostile bidder to acquire control of us. The existence of this provision may negatively impact the price of our securities and may discourage third-party bids to acquire our securities. This provision may reduce any premiums paid to stockholders in a change in control transaction. |
• | The Control Share Acquisition Act provides that “control shares” of a Maryland corporation acquired in a “control share acquisition” have no voting rights except to the extent approved by the corporation’s disinterested stockholders by a vote of two-thirds of the votes entitled to be cast on the matter. Shares of stock owned by interested stockholders, that is, by the acquirer, by officers or by directors who are employees of the corporation, are excluded from shares entitled to vote on the matter. “Control shares” are voting shares of stock that would entitle the acquirer to exercise voting power in electing directors within one of three increasing ranges of voting power. The control share acquisition statute does not apply (a) to shares acquired in a merger, consolidation or share exchange if the corporation is a party to the transaction or (b) to acquisitions approved or exempted by the charter or bylaws of the corporation. Our bylaws contain a provision exempting from the Control Share Acquisition Act any and all acquisitions of our common stock by David Gladstone or any of his affiliates. This statute could have the effect of discouraging offers from third parties to acquire us and increasing the difficulty of successfully completing this type of offer by anyone other than Mr. Gladstone or any of his affiliates. |
• | Certain provisions of Maryland law applicable to us prohibit business combinations with: |
• | any person who beneficially owns 10% or more of the voting power of our common stock, referred to as an “interested stockholder;” |
• | an affiliate of ours who, at any time within the two-year period prior to the date in question, was an interested stockholder; or |
• | an affiliate of an interested stockholder. |
These prohibitions last for five years after the most recent date on which the interested stockholder became an interested stockholder. Thereafter, any business combination with the interested stockholder must be recommended by our Board and approved by the affirmative vote of at least 80% of the votes entitled to be cast by holders of our outstanding shares of common stock and two-thirds of the votes entitled to be cast by holders of our common stock other than shares held by the interested stockholder. These requirements could have the effect of inhibiting a change in control even if a change in control were in our stockholders’ interest. These provisions of Maryland law do not apply, however, to business combinations that are approved or exempted by our Board of Directors prior to the time that someone becomes an interested stockholder.
Our rights and the rights of our stockholders to take action against our directors and officers are limited.
Maryland law provides that a director or officer has no liability in that capacity if he or she performs his or her duties in good faith, in a manner he or she reasonably believes to be advisable and in our best interests and with the care that an ordinarily prudent person in a like position would use under similar circumstances. In addition, our charter (i) eliminates our directors’ and officers’ liability to us and our stockholders for money damages except for liability resulting from actual receipt of an improper benefit in money, property or services or active and deliberate dishonesty established by a final judgment and that is material to the cause of action and (ii) requires us to indemnify directors and officers for liability resulting from actions taken by them in those capacities to the maximum extent permitted by Maryland law. As a result, our stockholders and we may have more limited rights against our directors and officers than might otherwise exist under common law. In addition, we may be obligated to fund the defense costs incurred by our directors and officers.
We may enter into tax protection agreements in the future if we issue OP Units in connection with the acquisition of properties, which could limit our ability to sell or otherwise dispose of certain properties.
Our Operating Partnership may enter into tax protection agreements in connection with issuing OP Units to acquire additional properties which could provide that if we dispose of any interest in the protected acquired property prior to a certain time, we will indemnify the other party for its tax liabilities attributable to the built-in gain that exists with respect to such property. Therefore, although it may be in our stockholders’ best interests that we sell one of these properties, it may be economically prohibitive for us to do so if we are a party to such a tax protection agreement. While we do not currently have any of these tax protection agreements in place currently, we cannot guarantee that we will not enter into such agreements in the future.
Our redemption of OP Units could result in the issuance of a large number of new shares of our common stock and/or force us to expend significant cash, which may limit our funds necessary to make distributions on our common stock.
26
As of the date of this filing, unaffiliated third parties owned approximately 6.5% of the outstanding OP Units. Following any contractual lock-up provisions, including the one-year mandatory holding period, a non-controlling limited partner of our Operating Partnership may require us to redeem the OP Units it holds for cash. At our election, we may satisfy the redemption through the issuance of shares of our common stock on a one-for-one basis. However, the limited partners’ redemption right may not be exercised if and to the extent that the delivery of the shares upon such exercise would result in any person violating the ownership and transfer restrictions set forth in our charter. If a large number of OP Units were redeemed, it could result in the issuance of a large number of new shares of our common stock, which could dilute our existing stockholders’ ownership. Alternatively, if we were to redeem a large number of OP Units for cash, we may be required to expend significant amounts to pay the redemption price, which may limit our funds necessary to make distributions on our common stock. Further, if we do not have sufficient cash on hand at the time the OP Units are tendered for redemption, we may be forced to sell additional shares of our common stock in order to raise cash, which could cause dilution to our existing stockholders and adversely affect the market price of our common stock.
Our charter grants our Board of Directors the right to classify or reclassify any unissued shares of capital stock, increase or decrease the authorized number of shares and establish the preference and rights of any preferred stock without stockholder approval.
Under our charter, we currently have authority to issue 91,500,000 shares of common stock and 8,500,000 shares of preferred stock. Of the 8,500,000 authorized shares of preferred stock, 2,000,000 have been designated for our Series A Term Preferred Stock, and 6,500,000 have been designated for our Series B Preferred Stock. Our Board of Directors has the authority, without a stockholders’ vote, to classify or reclassify any unissued shares of stock, including common stock, into preferred stock (or vice versa), to increase or decrease the authorized number of shares of common stock and preferred stock and to establish the preferences and rights of any preferred stock or other class or series of shares to be issued. Because our Board of Directors has the power to establish the preferences and rights of additional classes or series of stock without a stockholders’ vote, our Board of Directors may give the holders of any class or series of stock preferences, powers and rights, including voting rights, senior to the rights of holders of existing stock.
Holders of our Series A Term Preferred Stock, Series B Preferred Stock, and future holders of any securities ranking senior to our common stock have dividend and/or liquidation rights that are senior to the rights of the holders of our common stock. Additional issuances of securities senior to our common stock may negatively impact the value of our common stock and further restrict the ability of holders of our common stock to receive dividends and/or liquidation rights.
In addition to our common stock, our capital structure also includes our Series A Term Preferred Stock (of which 1,150,000 shares are currently outstanding) and our Series B Preferred Stock (of which no shares are currently outstanding). In the future, we may attempt to increase our capital resources by making additional offerings of our Series A Term Preferred Stock, Series B Preferred Stock, or other equity securities or issue debt securities. Upon liquidation, holders of our Series A Term Preferred Stock, Series B Preferred Stock, and other preferred stock with parity ranking we may issue in the future, holders of our debt securities, if any, and lenders with respect to other borrowings, including our line of credit, would receive a distribution of our available assets in full prior to the holders of our common stock. Because our decision to issue securities in any future offering will depend on market conditions and other factors beyond our control, we cannot predict or estimate the amount, timing or nature of our future offerings. Holders of our common stock are not entitled to preemptive rights or other protection against dilutions. As additional acquisition opportunities arise, we may issue additional shares of common stock or preferred stock or may issue OP Units, which are redeemable for cash or, at our option, our common stock on a one-to-one basis, to raise the capital necessary to finance these acquisitions and further diluting stockholders’ equity. Thus, our common stockholders bear the risk of our future offerings reducing the per share trading price of our common stock and diluting their interest in us. Further, holders of our Series A Term Preferred Stock and Series B Preferred Stock rank senior in priority of dividend payments, which may restrict our ability to declare and pay dividends to our common stockholders at the current rate, or at all.
We may not have sufficient earnings and profits in order for distributions on the Series A Term Preferred Stock or Series B Preferred Stock to be treated as dividends.
The dividends payable by us on the Series A Term Preferred Stock or Series B Preferred Stock (if and when issued) may exceed our current and accumulated earnings and profits, as calculated for U.S. federal income tax purposes, at the time of payment. If that were to occur, it would result in the amount of dividends that exceed our earnings and profits being treated first as a return of capital to the extent of the holder’s adjusted tax basis in the Series A Term Preferred Stock or Series B Preferred Stock and then, to the extent of any excess over such adjusted tax basis, as capital gain.
We may not be able to maintain our qualification as a REIT for federal income tax purposes, which would subject us to federal income tax on our taxable income at regular corporate rates, thereby reducing the amount of funds available for paying distributions to stockholders.
27
On September 3, 2014, we filed our 2013 federal income tax return, on which we elected to be taxed as a REIT for federal income tax purposes beginning with our tax year ended December 31, 2013. Our ability to maintain our qualification as a REIT depends on our ability to satisfy requirements set forth in the Code, concerning, among other things, the ownership of our outstanding common stock, the nature of our assets, the sources of our income and the amount of our distributions to our
stockholders. The REIT qualification requirements are extremely complex, and interpretations of the federal income tax laws governing qualification as a REIT are limited. Accordingly, we cannot be certain that we will be successful in continuing to operate so as to qualify as a REIT. At any time, new laws, interpretations or court decisions may change the federal tax laws relating to, or the federal income tax consequences of, qualification as a REIT. It is possible that future economic, market, legal, tax or other considerations may cause our Board of Directors to revoke our REIT election, which it may do without stockholder approval.
If we lose our REIT status or if it was revoked, we would face serious tax consequences that would substantially reduce the funds available for distribution to our stockholders because:
• | we would not be allowed a deduction for distributions to stockholders in computing our taxable income; |
• | we would be subject to federal income tax at regular corporate rates and might need to borrow money or sell assets to pay any such tax; |
• | we also could be subject to the federal alternative minimum tax and possibly increased state and local taxes; and |
• | unless we are entitled to relief under statutory provisions, we would be disqualified from taxation as a REIT for the four taxable years following the year during which we ceased to qualify. |
If we fail to maintain our qualification as a REIT, domestic stockholders will be subject to tax as “qualified dividends” to the extent of our current and accumulated earnings and profits. The maximum U.S. federal income tax rate on such “qualified dividends” is 20%. If we fail to maintain our qualification as a REIT, we would not be required to make distributions to stockholders, and any distributions to stockholders that are U.S. corporations might be eligible for the dividends received deduction.
As a result of all these factors, our failure to maintain our qualification as a REIT could impair our ability to expand our business and raise capital and could adversely affect the value of our capital stock.
Complying with REIT requirements may cause us to forgo or liquidate otherwise attractive investments.
To maintain our qualification as a REIT for federal income tax purposes, we must continually satisfy various tests regarding the sources of our income, the nature and diversification of our assets, the amounts we distribute to our stockholders and the ownership of our stock. In order to meet these tests, we may be required to forgo investments we might otherwise make.
In particular, we must ensure that at the end of each calendar quarter at least 75% of the value of our assets consists of cash, cash items, government securities and qualified REIT real estate assets. The remainder of our investment in securities other than government securities, securities of TRSs and qualified real estate assets generally cannot include more than 10% of the outstanding voting securities of any one issuer or more than 10% of the total value of the outstanding securities of any one issuer. In addition, in general, no more than 5% of the value of our assets other than government securities, securities of TRSs and qualified real estate assets can consist of the securities of any one issuer, and no more than 25% (or 20% beginning with our taxable year commencing January 1, 2018) of the value of our total assets can be represented by securities of one or more TRSs.
If we fail to comply with these requirements, we must correct the failure within 30 days after the end of the calendar quarter or qualify for certain statutory relief provisions to avoid losing our REIT qualification and suffering adverse tax consequences. As a result, we may be required to dispose of otherwise attractive investments to satisfy REIT requirements. These actions could have the effect of reducing our income and amounts available for distribution to our stockholders.
We may have corporate income tax liabilities for taxes attributable to taxable years prior to our REIT election, which taxes will reduce our cash available for distribution to stockholders.
We were subject to regular corporate income taxation up to and for our taxable year ended December 31, 2012. If we were determined, as the result of a tax audit or otherwise, to have an unpaid corporate income tax liability for any taxable years during which we were classified as a C corporation for U.S. federal income tax purposes, we would be responsible for paying such tax liability, notwithstanding our subsequent qualification as a REIT. In such a case, the payment of taxes would cause us to have less cash on hand to make distributions to stockholders.
Failure to make required distributions, both prior to and following our REIT election, would jeopardize our REIT status, which could require us to pay taxes and negatively impact our cash available for future distribution.
28
To qualify as a REIT, we were required to distribute our non-REIT earnings and profits accumulated before the effective date of our REIT election. As of December 31, 2013, we estimated that our non-REIT accumulated earnings and profits were approximately $9.6 million, which included approximately $4.0 million of net earnings and profits associated with a deferred intercompany gain resulting from land transfers in prior years. We believe that we distributed all non-REIT earnings and profits, including the profits associated with the deferred intercompany gain, to stockholders prior to December 31, 2013; however, we can provide no assurances that our determination of our non-REIT earnings and profits at that time was accurate. If we did not distribute all of our non-REIT earnings and profits prior to December 31, 2013, then we would not have qualified to be taxed as a REIT for our taxable year ended December 31, 2013, or subsequent taxable years.
In addition, to qualify and to maintain our qualification as a REIT, each year we must distribute to our stockholders at least 90% of our taxable income, other than any net capital gains. To the extent that we satisfy the distribution requirement but distribute less than 100% of our taxable income, we will be subject to federal corporate income tax on our undistributed income. In addition, we will incur a 4% nondeductible excise tax on the amount, if any, by which our distributions in any year are less than the sum of:
• | 85% of our ordinary income for that year; |
• | 95% of our capital gain net income for that year; and |
• | 100% of our undistributed taxable income from prior years. |
We intend to pay out our income to our stockholders in a manner intended to satisfy the distribution requirement applicable to REITs and to avoid corporate income tax and the 4% excise tax. Differences in timing between the recognition of income and the related cash receipts or the effect of required debt amortization payments could require us to borrow money or sell assets to pay out enough of our taxable income to satisfy the distribution requirement and to avoid corporate income tax and the 4% excise tax in a particular year.
Dividends payable by REITs do not qualify for the reduced tax rates available for some dividends.
The maximum federal income tax rate applicable to individuals with respect to income from “qualified dividends” is 20%. Dividends payable by REITs, however, generally are not eligible for the reduced rates. More favorable rates applicable to regular corporate qualified dividends may cause investors who are taxed at individual rates to perceive investments in REITs to be relatively less attractive than investments in the stocks of non-REIT corporations that pay dividends.
If we fail to meet stock ownership diversification requirements, we would fail to maintain our qualification as a REIT, which could require us to pay taxes and negatively impact our cash available for future distribution.
In order to maintain our qualification as a REIT, no more than 50% of the value of our outstanding stock may be owned, directly or indirectly, by five or fewer individuals during the last half of a taxable year, beginning with the second year after our election to be treated as a REIT. To facilitate compliance with this requirement, our charter prohibits any individual from owning more than 3.3% in value of our outstanding stock. Pursuant to an exception from this limit contained in our charter, as of December 31, 2017, David Gladstone owned approximately 14.4% of our outstanding common stock, and the Gladstone Future Trust, for the benefit of Mr. Gladstone’s children, owned approximately 4.8% of our outstanding common stock. For purposes of the REIT stock ownership diversification requirements, the shares owned by the Gladstone Future Trust are attributed to Mr. Gladstone, resulting in Mr. Gladstone having an aggregate beneficial ownership of 19.2% of our outstanding common stock. Our Board of Directors may also reduce the 3.3% ownership limitation if it determines that doing so is necessary for us to maintain our qualification for REIT treatment. However, such a reduction would not be effective for any stockholder who beneficially owns more than the reduced ownership limit. We believe that we have satisfied the ownership diversification requirements, including with respect to our taxable year ended December 31, 2017. However, if, at any point in time, we are unable to comply with the ownership diversification requirements, we could fail to maintain our qualification as a REIT, which could require us to pay taxes and negatively impact our cash available for future distribution.
We will not seek to obtain a ruling from the Internal Revenue Service (the “IRS”) that we qualify as a REIT for federal income tax purposes.
We have not requested, and do not expect to request, a ruling from the IRS that we qualify as a REIT. An IRS determination that we do not qualify as a REIT would deprive our stockholders of the tax benefits of our REIT status only if the IRS determination is upheld in court or otherwise becomes final. To the extent that we challenge an IRS determination that we do not qualify as a REIT, we may incur legal expenses that would reduce our funds available for distribution to stockholders.
The IRS may treat sale-leaseback transactions as loans, which could jeopardize our REIT status.
The IRS may take the position that transactions in which we acquire a property and lease it back to the seller do not qualify as leases for federal income tax purposes but are, instead, financing arrangements or loans. If a sale-leaseback transaction were so re-characterized, we might fail to satisfy the asset or income tests required for REIT qualification and consequently could lose
29
our REIT status. Alternatively, the amount of our REIT taxable income could be recalculated, which could cause us to fail the distribution test for REIT qualification.
Investments in our common stock may not be suitable for pension or profit-sharing trusts, Keogh Plans or individual retirement accounts, or IRAs.
If you are investing the assets of a pension, profit sharing, 401(k), Keogh or other retirement plan, IRA or benefit plan in us, you should consider:
• | whether your investment is consistent with the applicable provisions of the Employee Retirement Income Security Act (“ERISA”), or the Code; |
• | whether your investment will produce unrelated business taxable income to the benefit plan; and |
• | your need to value the assets of the benefit plan annually. |
We do not believe that under current ERISA law and regulations that our assets would be treated as “plan assets” for purposes of ERISA. However, if our assets were considered to be plan assets, our assets would be subject to ERISA and/or Section 4975 of the Code, and some of the transactions we have entered into with our Adviser and its affiliates could be considered “prohibited transactions” which could cause us, our Adviser and its affiliates to be subject to liabilities and excise taxes. In addition, our officers and directors, our Adviser and its affiliates could be deemed to be fiduciaries under ERISA and subject to other conditions, restrictions and prohibitions under Part 4 of Title I of ERISA. Even if our assets are not considered to be plan assets, a prohibited transaction could occur if we or any of our affiliates is a fiduciary within the meaning of ERISA with respect to a purchase by a benefit plan.
If our Operating Partnership fails to maintain its status as a disregarded entity or partnership for federal income tax purposes, its income may be subject to taxation.
We intend to maintain the status of the Operating Partnership as a disregarded entity or a partnership for federal income tax purposes. However, if the IRS were to successfully challenge the status of the Operating Partnership as a disregarded entity or a partnership, it would be taxable as a corporation. In such event, this would reduce the amount of distributions that the Operating Partnership could make to us. This would also result in our losing REIT status and becoming subject to a corporate level tax on our own income. This would substantially reduce our cash available to pay distributions and the return on your investment. In addition, if any of the entities through which the Operating Partnership owns its properties, in whole or in part, loses its characterization as a disregarded entity or a partnership for federal income tax purposes, it would be subject to taxation as a corporation, thereby reducing distributions to the Operating Partnership. Such a re-characterization of an underlying property owner could also threaten our ability to maintain REIT status.
Our ownership of, and relationship with, TRSs will be limited, and our failure to comply with the limits would jeopardize our REIT status and could result in the application of a 100% excise tax.
We have elected to treat Land Advisers as a TRS. We may also form other TRSs as part of our overall business strategy. A TRS may earn income that would not be qualifying income if earned directly by the parent REIT. Both the subsidiary and the REIT must jointly elect to treat the subsidiary as a TRS. A corporation of which a TRS directly or indirectly owns more than 35% of the voting power or value of the stock will automatically be treated as a TRS. Overall, no more than 20% of the value of a REIT’s assets may consist of stock or securities of one or more TRSs. A TRS will pay federal, state and local income tax at regular corporate rates on any income that it earns. In addition, the TRS rules limit the deductibility of interest paid or accrued by a TRS to its parent REIT to ensure that the TRS is subject to an appropriate level of corporate taxation. The rules also impose a 100% excise tax on certain transactions between a TRS and its parent REIT that are not conducted on an arm’s-length basis.
Our TRSs will pay federal, state, and local income tax on their taxable income, and their after-tax net income will be available for distribution to us but is not required to be distributed to us. We anticipate that the aggregate value of any TRS stock and securities owned by us will be less than 20% of the value of our total assets, including the TRS stock and securities. We will evaluate all of our transactions with TRSs to ensure that they are entered into on arm’s-length terms to avoid incurring the 100% excise tax. There can be no assurance, however, that we will be able to comply with the 20% limitation or to avoid application of the 100% excise tax.
Tax legislation impacts certain U.S. federal income tax rules applicable to REITs and could adversely affect our current tax positions.
The Protecting Americans from Tax Hikes Act of 2015 (the “PATH Act”) contains changes to certain aspects of the U.S. federal income tax rules applicable to us. The PATH Act is the most recent example of changes to the REIT rules, and additional legislative changes may occur that could adversely affect our current tax positions. The PATH Act modifies various rules that apply to our ownership of, and business relationship with, our TRSs and reduces the maximum allowable value of our assets
30
attributable to TRSs from 25% to 20%, which could impact our ability to enter into future investments. The PATH Act also makes multiple changes related to the Foreign Investment in Real Property Tax Act, expands prohibited transaction safe harbors and qualifying hedges and repeals the preferential dividend rule for public REITs previously applicable to us. Lastly, the PATH Act adjusts the way we may calculate certain earnings and profits calculations to avoid double taxation at the stockholder level and expands the types of qualifying assets and income for purposes of the REIT requirements. The provisions enacted by the PATH Act could result in changes in our tax positions or investments, and future legislative changes related to those rules described above could have a materially adverse impact on our results of operations and financial condition.
Legislative or regulatory income tax changes related to REITs could materially and adversely affect us.
The U.S. federal income tax laws and regulations governing REITs and their stockholders, as well as the administrative interpretations of those laws and regulations, are constantly under review and may be changed at any time, possibly with retroactive effect. No assurance can be given as to whether, when, or in what form the U.S. federal income tax laws applicable to us and our stockholders may be enacted. Changes to the U.S. federal income tax laws and interpretations of U.S. federal tax laws could adversely affect an investment in our common stock.
On December 22, 2017, President Donald J. Trump signed into law P.L. 115-97, informally titled the “Tax Cuts and Jobs Act” (the “TCJA”). The TCJA makes significant changes to U.S. federal income tax laws applicable to businesses and their owners, including REITs and their stockholders, and may lessen the relative competitive advantage of operating as a REIT rather than as a corporation.
Certain key provisions of the TCJA that could impact us and our stockholders beginning in 2018 include:
• | temporarily reducing the U.S. federal income tax rates applicable to ordinary income of individuals (the highest individual U.S. federal income tax rate is reduced from 39.6% to 37% for taxable years beginning in 2018 through taxable years ending in 2025); |
• | reducing the maximum corporate income tax rate from 35% to 21%; |
• | permitting a new deduction for certain pass-through business income, including dividends received by our shareholders that are not designated by us as capital gain dividends or qualified dividend income, which will allow individuals, trusts, and estates to deduct up to 20% of such amounts, generally resulting in an effective minimum U.S. federal income tax rate of 29.6% on such dividends from us (through taxable years ending in 2025); |
• | reducing the highest rate of withholding from 35% to 21% with respect to our distributions to non-U.S. stockholders that are treated as attributable to gains from the sale or exchange of U.S. real property interests; |
• | limiting our deduction for net operating losses to 80% of taxable income (prior to the application of the dividends paid deduction); |
• | amending the limitation on the deduction of net interest expense, other than certain businesses that are eligible to elect out of such limitation; and |
• | eliminating the corporate alternative minimum tax. |
Our stockholders should consult with their tax advisers regarding the effects of the TCJA or other legislative, regulatory, or administrative developments on their investment in our stock.
Risks Relating to the Market for our Common Stock, Series A Term Preferred Stock, and Series B Preferred Stock
Future issuances and sales of shares of our common stock, Series A Term Preferred Stock, Series B Preferred Stock, other series of preferred securities, or the perception that such issuances will occur, may have adverse effects on the trading prices of our shares.
We cannot predict the effect, if any, of future issuances and sales of our common stock, Series A Term Preferred Stock, Series B Preferred Stock, possible other series of preferred securities, or the availability of shares for future sales, on the market price of our common stock, Series A Term Preferred Stock, or Series B Preferred Stock. Sales of substantial amounts of our common stock (including shares of our common stock issuable upon the conversion of OP Units that we may issue from time to time), Series A Term Preferred Stock, or Series B Preferred Stock or the perception that these sales could occur may adversely affect prevailing market prices for our common stock, Series A Term Preferred Stock, or Series B Preferred Stock (if and when listed on a national securities exchange).
An increase in market interest rates may have an adverse effect on the market price of our common stock.
One of the factors that investors may consider in deciding whether to buy or sell our common stock is our distribution yield, which is our distribution rate as a percentage of our share price, relative to market interest rates. If market interest rates increase, prospective investors may desire a higher distribution yield on our common stock or may seek securities paying
31
higher dividends or interest. The market price of our common stock likely will be based primarily on the earnings that we derive from rental income with respect to our properties and our related distributions to stockholders, and not from the underlying appraised value of the properties themselves. As a result, interest rate fluctuations and capital market conditions are likely to affect the market price of our common stock, and such effects could be significant. For instance, if interest rates rise without an increase in our distribution rate, the market price of our common stock could decrease because potential investors may require a higher distribution yield on our common stock as market rates on interest-bearing securities, such as bonds, rise.
Shares of the Series A Term Preferred Stock and Series B Preferred Stock are subordinated to existing and future debt, and your interests could be diluted by the issuance of additional preferred stock or by other transactions.
Payment of accrued dividends on the Series A Term Preferred Stock or Series B Preferred Stock will be subordinated to all of our existing and future debt and will be structurally subordinate to the obligations of our subsidiaries. In addition, we may issue additional shares of another class or series of preferred stock ranking on parity with the Series A Term Preferred Stock or Series B Preferred Stock with respect to the payment of dividends and the distribution of assets upon liquidation, dissolution or winding up. None of the provisions relating to the Series A Term Preferred Stock or Series B Preferred Stock relate to or limit our indebtedness or afford the holders of the Series A Term Preferred Stock or Series B Preferred Stock protection in the event of a highly-leveraged or other transaction, including a merger or the sale, lease or conveyance of all or substantially all our assets or business, that might adversely affect the holders of the Series A Term Preferred Stock or Series B Preferred Stock, other than in connection with a Change of Control Triggering Event (as defined by the Certificate of Designations). These factors may affect the trading price of the Series A Term Preferred Stock or Series B Preferred Stock (if and when listed on a national securities exchange).
We operate as a holding company dependent upon the assets and operations of our subsidiaries, and because of our structure, we may not be able to generate the funds necessary to make distributions on the Series A Term Preferred Stock or Series B Preferred Stock.
We generally operate as a holding company that conducts its businesses primarily through the Operating Partnership, which, in turn, is a holding company conducting its business through its subsidiaries. These subsidiaries conduct all of our operations and are our only sources of income. Accordingly, we are dependent on cash flows and payments of funds to us by our subsidiaries as distributions, loans, advances, leases, or other payments from our subsidiaries to generate the funds necessary to make distributions or dividends on our securities. Our subsidiaries’ ability to pay such distributions and/or make such loans, advances, leases, or other payments may be restricted by, among other things, applicable laws and regulations, current and future debt agreements, and management agreements into which our subsidiaries may enter, which may impair our ability to make cash payments on our securities, including the Series A Term Preferred Stock and Series B Preferred Stock. In addition, such agreements may prohibit or limit the ability of our subsidiaries to transfer any of their property or assets to us, any of our other subsidiaries, or to third parties. Our future indebtedness or our subsidiaries’ future indebtedness may also include restrictions with similar effects.
In addition, because we are a holding company, stockholders’ claims will be structurally subordinated to all existing and future liabilities and obligations (whether or not for borrowed money) of the Operating Partnership and its subsidiaries. Therefore, in the event of our bankruptcy, liquidation, or reorganization, claims of holders of the Series A Term Preferred Stock and Series B Preferred Stock will be satisfied only after all of our and the Operating Partnership’s and its subsidiaries’ liabilities and obligations have been paid in full.
There will initially be no public market for the Series B Preferred Stock, as we do not intend to apply for quotation on Nasdaq until after the offering's Termination Date (as defined elsewhere in this Form 10-K), and even after listing, if achieved, a liquid secondary trading market may not develop, and the features of the Series B Preferred Stock may not provide you with favorable liquidity options.
There is currently no public market for the Series B Preferred Stock, and we do not intend to apply to list the Series B Preferred Stock on Nasdaq or another national securities exchange or to include these shares for quotation on any national securities market until the calendar year following the offering's Termination Date. Until shares of the Series B Preferred Stock are listed on Nasdaq or another national securities exchange, if ever, holders of such shares may be unable to sell them at all or, if they are able to, only at substantial discounts from the liquidation preference. Even if the Series B Preferred Stock is listed on Nasdaq or another national securities exchange within one calendar year of the offering's Termination Date, as anticipated, there is a risk that such shares may be thinly traded, and the market for such shares may be relatively illiquid compared to the market for other types of securities, with the spread between the bid and asked prices considerably greater than the spreads of other securities with comparable terms and features. Additionally, our charter contains restrictions on the ownership and transfer of our securities, including the Series B Preferred Stock, and these restrictions may inhibit your ability to sell the Series B Preferred Stock promptly, or at all. Also, since the Series B Preferred Stock does not have a stated maturity date, you may be forced to hold your Series B Preferred Stock and receive stated dividends on the shares of Series B Preferred Stock when, as,
32
and if authorized by our Board of Directors and declared by us with no assurance as to ever receiving the liquidation preference.
We will be required to terminate the Series B Offering (as herein defined) if both our common stock and the Series A Preferred Stock are no longer listed on Nasdaq or another national securities exchange.
The Series B Preferred Stock is a “covered security” and therefore is not subject to registration under the state securities, or “Blue Sky,” regulations in the various states in which it may be sold due to its seniority to our common stock, which is listed on Nasdaq. If both our common stock and Series A Preferred Stock are no longer listed on Nasdaq or another national securities exchange, we will be required to register this offering in any state in which we offer shares of the Series B Preferred Stock. This would require the termination of this offering and could result in our raising an amount of gross proceeds that is substantially less than the amount of the gross proceeds we expect to raise if the maximum amount of the Series B Offering is sold. This would reduce our ability to make additional investments and limit the further diversification of our portfolio.
The Series B Preferred Stock will bear a risk of redemption by us.
We may voluntarily redeem some or all of the Series B Preferred Stock on or after the first anniversary of the offering's Termination Date. Any such redemptions may occur at a time that is unfavorable to holders of the Series B Preferred Stock. We may have an incentive to redeem the Series B Preferred Stock voluntarily if market conditions allow us to issue other preferred stock or debt securities at a dividend or interest rate that is lower than the dividend rate on the Series B Preferred Stock.
We are an “emerging growth company” and we cannot be certain if the reduced disclosure requirements applicable to emerging growth companies will make our common stock less attractive to investors. We elected to take advantage of the option to delay adoption of new or revised accounting standards until they are required to be adopted by private companies; consequently, our current and prior financial statements may not be comparable to those of other public companies.
We are an “emerging growth company,” as defined in the Jumpstart Our Business Startups Act (the “JOBS Act”), and we may take advantage of certain exemptions from various reporting requirements that are applicable to other public companies that are not “emerging growth companies” including, but not limited to, not being required to comply with the auditor attestation requirements of section 404 of the Sarbanes-Oxley Act, reduced disclosure obligations regarding executive compensation in our periodic reports and proxy statements, and exemptions from the requirements of holding a nonbinding advisory vote on executive compensation and stockholder approval of any golden parachute payments not previously approved. We will remain an “emerging growth company” through December 30, 2018, unless the market value of our common stock that is held by non-affiliates exceeds $700.0 million as of any June 30 before that time. We cannot predict if investors will find our common stock, Series A Term Preferred Stock, or Series B Preferred Stock less attractive because we may rely on these exemptions. If some investors find our common stock, Series A Term Preferred Stock, or Series B Preferred Stock less attractive as a result, there may be a less active trading market for our common stock, Series A Term Preferred Stock, or Series B Preferred Stock, and the price of our common stock, Series A Term Preferred Stock, or Series B Preferred Stock may be more volatile.
In addition, Section 107 of the JOBS Act also provides that an emerging growth company can take advantage of the extended transition period provided in Section 7(a)(2)(B) of the Securities Act for complying with new or revised accounting standards, meaning that the company can delay the adoption of certain accounting standards until those standards would otherwise apply to private companies. We have chosen to take advantage of this extended transition period and, as a result, we will comply with new or revised accounting standards on the relevant dates on which adoption of such standards is required for private companies for as long as we maintain our emerging company status and do not revoke this election. Accordingly, the accounting standards that we apply while we remain an emerging growth company may differ materially from the accounting standards applied by other similar public companies, including emerging growth companies that have elected to opt out of this extended transition period. This election could have a material impact on our financial statements and the comparability of our financial statements to the financial statements of similar public companies. This potential lack of comparability could make it more difficult for investors to value our securities, which could have a material impact on the price of our common stock, Series A Term Preferred Stock, or Series B Preferred Stock.
ITEM 1B. | UNRESOLVED STAFF COMMENTS |
None.
ITEM 2. | PROPERTIES |
33
All of our properties are wholly-owned on a fee-simple basis, except where noted. The following table provides certain summary information about our 73 farms as of December 31, 2017 (dollars in thousands, except for footnotes):
Location | No. of Farms | Total Acres | Farm Acres | Net Cost Basis(1) | Encumbrances(2) | |||||||||
California | 28 | 8,080 | 7,308 | $ | 208,774 | $ | 152,860 | |||||||
Florida | 16 | 11,006 | 8,846 | 114,225 | 73,264 | |||||||||
Colorado | 10 | 31,450 | 24,513 | 42,409 | 25,579 | |||||||||
Arizona(3) | 6 | 6,280 | 5,228 | 41,341 | 23,333 | |||||||||
Oregon | 4 | 2,313 | 2,003 | 19,806 | 12,978 | |||||||||
Nebraska | 2 | 2,559 | 2,101 | 10,626 | 6,602 | |||||||||
Washington | 1 | 746 | 417 | 9,386 | 5,412 | |||||||||
Michigan | 4 | 270 | 183 | 2,936 | 1,659 | |||||||||
North Carolina | 2 | 310 | 295 | 2,361 | 1,301 | |||||||||
73 | 63,014 | 50,894 | $ | 451,864 | $ | 302,988 | ||||||||
(1) | Consists of the initial acquisition price (including the costs allocated to both tangible and intangible assets acquired and liabilities assumed), plus subsequent improvements and other capitalized costs associated with the properties, and adjusted for accumulated depreciation and amortization. Includes Investments in real estate, net (excluding improvements paid for by tenants), and Lease intangibles, net; plus net above-market lease values and lease incentives included in Other assets, net; and less net below-market lease values and deferred revenue included in Other liabilities, net, each as shown on the accompanying Consolidated Balance Sheet. |
(2) | Excludes approximately $2.0 million of deferred financing costs related to mortgage notes and bonds payable included in Mortgage notes and bonds payable, net on the accompanying Consolidated Balance Sheet. |
(3) | Includes two farms in which we own a leasehold interest via ground leases with the State of Arizona that expire in February 2022 and February 2025, respectively. In total, these two farms consist of 1,368 total acres and 1,221 farm acres and had a net cost basis of approximately $3.2 million as of December 31, 2017 (included in Lease intangibles, net on the accompanying Consolidated Balance Sheet). |
See Schedule III, Real Estate and Accumulated Depreciation, included elsewhere in this Form 10-K, for a detailed listing of the properties in our portfolio.
ITEM 3. | LEGAL PROCEEDINGS |
In the ordinary course of business, we may be involved in legal proceedings from time to time. We are not currently subject to any material legal proceedings, nor, to our knowledge, are any material legal proceedings threatened against us.
ITEM 4. | MINE SAFETY DISCLOSURES |
Not applicable.
34
PART II
ITEM 5. | MARKET FOR REGISTRANT’S COMMON EQUITY, RELATED STOCKHOLDER MATTERS AND ISSUER PURCHASES OF EQUITY SECURITIES |
OP Unit Redemption
Since January 1, 2017, through the date of this filing, a total of 478,653 OP Units were tendered for redemption. As a result, we issued 254,575 shares of common stock (in exchange for 254,575 of the tendered OP Units), and we satisfied the redemption of the remaining 224,078 tendered OP Units with an aggregate cash payment of approximately $3.0 million (approximately $13.25 per OP Unit). Currently, there are 970,605 OP Units held by non-controlling limited partners outstanding and eligible to be tendered for redemption.
Market Information
Our common stock began being traded on Nasdaq under the symbol “LAND” on January 29, 2013. The following table reflects the range of the high and low sale prices of our common stock on Nasdaq and the distributions per common share for the periods indicated. Distributions to common stockholders are declared quarterly and paid monthly; amounts presented below represent the cumulative amount of the monthly common stock distributions declared during the respective quarters.
Price Range | Distributions per | ||||||||||||
Period | Low | High | Common Share | ||||||||||
2017: | Q1 | $ | 10.83 | $ | 12.89 | $ | 0.12900 | ||||||
Q2 | 10.77 | 11.78 | 0.13050 | ||||||||||
Q3 | 11.26 | 14.09 | 0.13200 | ||||||||||
Q4 | 12.97 | 14.29 | 0.13230 | ||||||||||
2016: | Q1 | $ | 6.72 | $ | 10.16 | $ | 0.12000 | ||||||
Q2 | 9.61 | 11.10 | 0.12375 | ||||||||||
Q3 | 10.54 | 12.00 | 0.12375 | ||||||||||
Q4 | 9.51 | 11.40 | 0.12750 | ||||||||||
Distribution Information
Since our IPO in 2013, we have never missed a payment of a scheduled distribution on our common stock. Our Board of Directors regularly evaluates our per-share distribution payments as they monitor the capital markets and the impact that the economy has on the Company. The decision as to whether to authorize and pay distributions on shares of our common stock in the future, as well as the timing, amount and composition thereof, will be at the sole and absolute discretion of our Board of Directors in light of conditions then existing, including our earnings, taxable income, FFO, adjusted FFO, financial condition, liquidity, capital requirements, debt maturities, the availability of capital, contractual prohibitions or other restrictions, and legal requirements (including applicable requirements that we must satisfy to qualify and to maintain our qualification to be taxed as a REIT) and general overall economic conditions and other factors. While the statements above concerning our distribution policy represent our current expectations, any actual distribution payable will be determined by our Board of Directors based upon the circumstances at the time of declaration and the actual number of common shares then outstanding, and any common distribution payable may vary from such expected amounts.
For federal income tax purposes, distributions to our stockholders generally consist of ordinary income, capital gains, nontaxable return of capital, or a combination of those items. Distributions that exceed our current and accumulated earnings and profits (calculated for tax purposes) constitute a non-taxable return of capital rather than a distribution and will not be taxable to the extent of the stockholder’s basis in its shares of our stock, which basis will be reduced by an amount equal to such non-taxable distribution. To the extent a distribution exceeds the stockholder’s share of both our current and accumulated earnings and profits and the stockholder’s basis in its shares of our stock, that distribution will be treated as a gain from the sale or exchange of that stockholder’s shares of our stock. Every year, we notify stockholders of the taxability of distributions paid to stockholders during the preceding year.
35
Stockholder Information
As of February 13, 2018:
• | with regards to our common stock, there were 12 registered holders of record and approximately 10,271 beneficial owners; |
• | with regards to our Series A Term Preferred Stock, there was 1 registered holder of record and approximately 1,521 beneficial owners; |
• | with regards to our Series B Preferred Stock, there were no holders of record or beneficial owners; and |
• | with regards to our OP Units, other than the Company, there were four holders of record and beneficial owners. After a mandatory one-year holding period, our OP Units are redeemable at the option of the holder for cash or, at our election, shares of our common stock on a one-for-one basis. |
The closing stock prices of our common stock and Series A Term Preferred Stock as of December 31, 2017, were $13.43 and $25.86, respectively.
Stock Performance Graph
The following graph compares the total cumulative stockholder return of our common stock against that of the Standard & Poor's 500 Index (the “S&P 500”) and the National Association of Real Estate Investment Trusts (“NAREIT”) Composite Index (the “NAREIT Index”), assuming an initial investment of $100 in cash made in each on January 29, 2013. All values assume full reinvestment of any distributions.
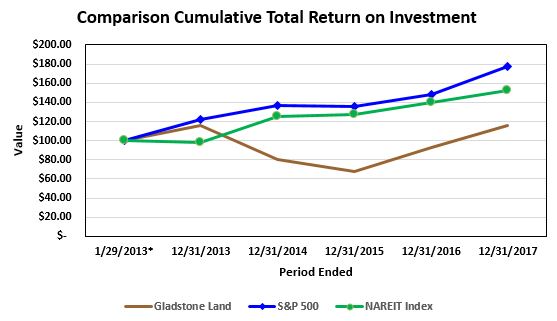
The total return performance shown in this graph is not necessarily indicative of and is not intended to suggest future total return performance.
As of December 31, | |||||||||||||||||||
1/29/2013* | 2014 | 2015 | 2016 | 2017 | |||||||||||||||
LAND | $ | 100.00 | $ | 80.57 | $ | 68.18 | $ | 93.02 | $ | 115.94 | |||||||||
S&P 500 | 100.00 | 136.55 | 135.55 | 148.48 | 177.31 | ||||||||||||||
NAREIT Index | 100.00 | 124.85 | 127.41 | 139.36 | 152.31 | ||||||||||||||
* Our common stock began trading on Nasdaq on January 29, 2013. The returns on investment for the S&P 500 and the NAREIT Index were calculated using data based on a purchase date of January 31, 2013.
ITEM 6. | SELECTED FINANCIAL DATA |
The following selected financial data as of and for the fiscal years ended December 31, 2017, 2016, 2015, 2014, and 2013 is derived from our audited and unaudited consolidated financial statements and from internal records. The data should be read in conjunction with, and is qualified in its entirety by reference to, our consolidated financial statements and notes thereto,
36
included elsewhere in this report, and “Management’s Discussion and Analysis of Financial Condition and Results of Operations,” included in Item 7 of this report (dollars in thousands, except per-share data).
As of and For the Years Ended December 31, | |||||||||||||||||||
2017 | 2016 | 2015 | 2014 | 2013 | |||||||||||||||
Balance Sheet Data: | |||||||||||||||||||
Net investments in real estate, at cost(1) | $ | 451,864 | $ | 325,747 | $ | 222,197 | $ | 144,575 | $ | 75,476 | |||||||||
Total assets(2) | $ | 462,278 | $ | 333,985 | $ | 228,684 | $ | 150,804 | $ | 93,391 | |||||||||
Total indebtedness(3) | $ | 302,988 | $ | 208,759 | $ | 142,733 | $ | 86,417 | $ | 43,154 | |||||||||
Total equity | $ | 117,951 | $ | 87,777 | $ | 78,007 | $ | 59,969 | $ | 48,512 | |||||||||
Total common shares outstanding(4) | 13,791,574 | 10,024,875 | 9,992,941 | 7,753,717 | 6,530,264 | ||||||||||||||
Operating Data: | |||||||||||||||||||
Total operating revenues | $ | 25,122 | $ | 17,317 | $ | 11,901 | $ | 7,185 | $ | 4,038 | |||||||||
Operating income | $ | 11,376 | $ | 7,056 | $ | 4,569 | $ | 1,600 | $ | 1,357 | |||||||||
Net (loss) income | $ | (34 | ) | $ | 473 | $ | 569 | $ | (125 | ) | $ | (1,225 | ) | ||||||
Funds from operations(5) | $ | 7,224 | $ | 5,660 | $ | 3,668 | $ | 1,611 | $ | (502 | ) | ||||||||
Adjusted funds from operations(6) | $ | 7,463 | $ | 5,823 | $ | 3,440 | $ | 1,713 | $ | 998 | |||||||||
Share and Per-Share Data: | |||||||||||||||||||
Diluted weighted-average total shares outstanding(4) | 13,414,581 | 10,773,701 | 8,639,397 | 6,852,917 | 6,214,557 | ||||||||||||||
Diluted net (loss) income | $ | (0.003 | ) | $ | 0.045 | $ | 0.070 | $ | (0.020 | ) | $ | (0.200 | ) | ||||||
Diluted funds from operations(5) | $ | 0.539 | $ | 0.525 | $ | 0.420 | $ | 0.240 | $ | (0.080 | ) | ||||||||
Diluted adjusted funds from operations(5) | $ | 0.556 | $ | 0.541 | $ | 0.400 | $ | 0.250 | $ | 0.160 | |||||||||
Distributions per total share(7) | $ | 0.524 | $ | 0.495 | $ | 0.465 | $ | 0.360 | $ | 1.490 | |||||||||
Supplemental Data: | |||||||||||||||||||
Cash flows from (used in) operations | $ | 6,515 | $ | 8,403 | $ | 4,754 | $ | 3,544 | $ | (460 | ) | ||||||||
Number of farms owned | 73 | 58 | 43 | 32 | 21 | ||||||||||||||
Total acres owned | 63,014 | 50,592 | 16,810 | 8,039 | 6,000 | ||||||||||||||
Occupancy rate(8) | 100 | % | 100 | % | 100 | % | 100 | % | 100 | % | |||||||||
Farmland portfolio value(9) | $ | 533,297 | $ | 401,122 | $ | 285,316 | $ | 192,953 | $ | 115,977 | |||||||||
Net asset value per share(9) | $ | 13.96 | $ | 14.21 | $ | 14.20 | $ | 13.94 | $ | 13.51 | |||||||||
(1) | Consists of the initial acquisition price (including the costs allocated to both tangible and intangible assets acquired and liabilities assumed), plus subsequent improvements and other capitalized costs associated with the properties, and adjusted for accumulated depreciation and amortization. Includes Investments in real estate, net (excluding improvements paid for by tenants), and Lease intangibles, net; plus net above-market lease values and lease incentives included in Other assets, net; and less net below-market lease values and deferred revenue included in Other liabilities, net, each as shown on the accompanying Consolidated Balance Sheet. |
(2) | We adopted Accounting Standards Update 2015-03 during the year ended December 31, 2016, which, collectively, require the presentation of debt issuance costs (other than line of credit arrangements) on the balance sheet as a deduction from the carrying amount of the related debt liability instead of a deferred financing costs. All periods presented have been retroactively adjusted. |
(3) | Representative of the principal balances outstanding of all borrowings, including mortgage notes and bonds payable and borrowings under our lines of credit, plus our Series A Term Preferred Stock. |
(4) | Includes shares of common stock and OP Units held by third parties. As of December 31, 2017 and 2016, there were 1,008,105 and 1,449,258, respectively, OP Units held by third parties; there were no OP Units held outside of the Company prior to 2016. |
(5) | Funds from operations is a term developed by NAREIT and is defined below. A reconciliation of net income to funds from operation is also below. |
(6) | Adjusted funds from operations is defined below. A reconciliation of net income to adjusted funds from operation is also below. |
(7) | 2013 distributions included a one-time declaration to distribute the final amount of remaining earnings and profits from prior years. |
(8) | As of December 31, 2017, includes one farm temporarily leased to our TRS. |
(9) | As presented in Item 7, “Management’s Discussion and Analysis of Financial Condition and Results of Operations—Net Asset Value.” |
Funds from Operations, Core Funds from Operations, and Adjusted Funds from Operations
NAREIT developed funds from operations (“FFO”) as a relative non-GAAP supplemental measure of operating performance of an equity REIT to recognize that income-producing real estate historically has not depreciated on the same basis as determined under GAAP. FFO, as defined by NAREIT, is net income (computed in accordance with GAAP), excluding gains or losses from sales of property and impairment losses on property, plus depreciation and amortization of real estate assets, and after adjustments for unconsolidated partnerships and joint ventures. We further present core FFO (“CFFO”) and adjusted FFO (“AFFO”) as additional non-GAAP financial measures of our operational performance, as we believe both CFFO and AFFO improve comparability on a period-over-period basis and are more useful supplemental metrics for investors to use in assessing
37
our operational performance on a more sustainable basis than FFO. We believe that these additional performance metrics provide investors with additional insight to how management measures our ongoing performance, as each of CFFO and AFFO (and their respective per-share amounts) are used by management and our board of directors, as appropriate, in assessing overall performance, as well as in certain decision-making analysis, including, but not limited to, the timing of acquisitions and potential equity raises (and the type of securities to offer in any such equity raises), the determination of any fee credits, and declarations of distributions on our common stock. We believe that net income is the most directly-comparable GAAP measure to each of FFO, CFFO and AFFO.
Specifically, we believe that FFO is helpful to investors in better understanding our operating performance, primarily because its calculation excludes depreciation and amortization expense on real estate assets, as we believe that GAAP historical cost depreciation of real estate assets is generally not correlated with changes in the value of those assets, particularly with farmland real estate, the value of which does not diminish in a predictable manner over time, as historical cost depreciation implies. Further, we believe that CFFO and AFFO are helpful in understanding our operating performance in that it removes certain items that, by their nature, are not comparable on a period-over-period basis and therefore tend to obscure actual operating performance. In addition, we believe that providing CFFO and AFFO as additional performance metrics allows investors to gauge our overall performance in a manner that is more similar to how our performance is measured by management (including their respective per-share amounts), as well as by analysts and the overall investment community.
We calculate CFFO by adjusting FFO for the following items:
• | Acquisition-related expenses. Acquisition-related expenses (i.e., due diligence costs) are incurred for investment purposes and do not correlate with the ongoing operations of our existing portfolio. Further, due to the inconsistency in which these costs are incurred and how they have historically been treated for accounting purposes, we believe the exclusion of these expenses improves comparability of our operating results on a period-to-period basis. |
• | Acquisition-related accounting fees. Certain auditing and accounting fees we incur are directly related to acquisitions and vary depending on the number and complexity of acquisitions completed during a period. Due to the inconsistency in which these costs are incurred, we believe the exclusion of these expenses improves comparability of our results on a period-to-period basis. We modified our definition of CFFO to include an adjustment for these costs beginning with the three months ended March 31, 2015, and applied the same modified definition of CFFO for all prior periods presented to provide consistency and better comparability. |
• | Income tax provision. As a REIT, we generally will not be subject to federal income taxes on amounts distributed to our stockholders, provided we meet certain conditions. As such, we believe it is beneficial for investors to view our results of operations excluding the impact of income taxes. |
• | Other adjustments. We will adjust for certain non-recurring charges and receipts and will explain such adjustments accordingly. |
Further, we calculate AFFO by adjusting CFFO for the following items:
• | Rent adjustments. This adjustment removes the effects of straight-lining rental income, as well as the amortization related to above-market lease values and lease incentives and accretion related to below-market lease values, deferred revenue, and tenant improvements, resulting in rental income reflected on a modified accrual cash basis. In addition to these adjustments, we also modify our calculation in our definition of AFFO to provide greater consistency and comparability due to the period-to-period volatility in which cash rents are received. To coincide with our tenants’ harvest seasons, our leases typically provide for cash rents to be paid at various points throughout the lease year, usually annually or semi-annually. As a result, cash rents received during a particular period may not necessarily be comparable to other periods or represent the cash rents indicative of a given lease year. Therefore, we further adjust AFFO to normalize the cash rent received pertaining to a lease year over that respective lease year on a straight-line basis, resulting in cash rent being recognized ratably over the period in which the cash rent is earned. |
• | Amortization of deferred financing costs. The amortization of costs incurred to obtain financing is excluded from AFFO, as it is a non-cash expense item that is not directly related to the performance of our properties. |
We believe the foregoing adjustments aid our investors' understanding of our ongoing operational performance.
FFO, CFFO, and AFFO do not represent cash flows from operating activities in accordance with GAAP, which, unlike FFO, CFFO, and AFFO, generally reflects all cash effects of transactions and other events in the determination of net income, and should not be considered an alternative to net income as an indication of our performance or to cash flows from operations as a measure of liquidity or ability to make distributions. Comparisons of FFO, CFFO, and AFFO, using the NAREIT definition for FFO and the definitions above for CFFO and AFFO, to similarly-titled measures for other REITs may not necessarily be meaningful due to possible differences in the definitions used by such REITs.
38
Diluted funds from operations (“Diluted FFO”), diluted core funds from operations (“Diluted CFFO”), and diluted adjusted funds from operations (“Diluted AFFO”) per share are FFO, CFFO, and AFFO, respectively, divided by the weighted-average number of total shares (including shares of our common stock and OP Units held by non-controlling limited partners) outstanding on a fully-diluted basis during a period. We believe that diluted earnings (loss) per share is the most directly-comparable GAAP measure to each of Diluted FFO, CFFO, and AFFO per share. Because many REITs provide Diluted FFO, CFFO, and AFFO per share information to the investment community, we believe these are useful supplemental measures when comparing us to other REITs.
We believe that FFO, CFFO, and AFFO and Diluted FFO, CFFO, and AFFO per share are useful to investors because they provide investors with a further context for evaluating our FFO, CFFO, and AFFO results in the same manner that investors use net income and EPS in evaluating net income.
The following table provides a reconciliation of our FFO, CFFO, and AFFO for the years ended December 31, 2017, 2016, 2015, 2014, and 2013 to the most directly-comparable GAAP measure, net income (loss), and a computation of diluted FFO, CFFO, and AFFO per share, using the weighted-average number of total shares (including shares of our common stock and OP Units held by non-controlling limited partners) outstanding during the respective periods (dollars in thousands, except per-share data):
For the Years Ended December 31, | |||||||||||||||||||
2017 | 2016 | 2015 | 2014 | 2013 | |||||||||||||||
Net (loss) income | $ | (34 | ) | $ | 473 | $ | 569 | $ | (125 | ) | $ | (1,225 | ) | ||||||
Plus: Real estate and intangible depreciation and amortization | 7,237 | 5,187 | 3,113 | 1,736 | 723 | ||||||||||||||
Plus (less): Losses (gains) on dispositions of real estate assets, net | 21 | — | (14 | ) | — | — | |||||||||||||
FFO available to common stockholders and OP Unitholders | 7,224 | 5,660 | 3,668 | 1,611 | (502 | ) | |||||||||||||
Plus: Acquisition-related expenses | 127 | 246 | 467 | 520 | 153 | ||||||||||||||
Plus: Acquisition-related accounting fees | 97 | 115 | 90 | 151 | 75 | ||||||||||||||
Plus: Income tax provision | — | — | — | 26 | 1,520 | ||||||||||||||
(Minus) plus: Other (receipts) charges, net(1) | — | — | (409 | ) | (173 | ) | — | ||||||||||||
CFFO available to common stockholders and OP Unitholders | 7,448 | 6,021 | 3,816 | 2,135 | 1,246 | ||||||||||||||
Net rent adjustments(2) | (509 | ) | (439 | ) | (483 | ) | (476 | ) | (278 | ) | |||||||||
Plus: Amortization of deferred financing costs | 524 | 241 | 107 | 54 | 30 | ||||||||||||||
AFFO available to common stockholders and OP Unitholders | $ | 7,463 | $ | 5,823 | $ | 3,440 | $ | 1,713 | $ | 998 | |||||||||
Weighted average common shares outstanding – basic & diluted | 12,055,791 | 10,007,350 | 8,639,397 | 6,852,917 | 6,214,557 | ||||||||||||||
Weighted-average OP Units outstanding(3) | 1,358,790 | 766,351 | — | — | — | ||||||||||||||
Weighted-average total shares outstanding | 13,414,581 | 10,773,701 | 8,639,397 | 6,852,917 | 6,214,557 | ||||||||||||||
Diluted FFO per weighted average total share | $ | 0.54 | $ | 0.53 | $ | 0.42 | $ | 0.24 | $ | (0.08 | ) | ||||||||
Diluted CFFO per weighted average total share | $ | 0.56 | $ | 0.56 | $ | 0.44 | $ | 0.31 | $ | 0.20 | |||||||||
Diluted AFFO per weighted average total share | $ | 0.56 | $ | 0.54 | $ | 0.40 | $ | 0.25 | $ | 0.16 | |||||||||
(1) | 2015 adjustments consist of the removal of (i) a one-time credit we received from our Adviser related to a new property acquisition, (ii) repairs incurred as a result of a fire on one of our properties during 2014 that were expensed during 2015, and (iii) insurance proceeds received during 2015 as a result of the same fire. 2014 adjustments consist of the removal of (i) repairs incurred as a result of the aforementioned fire that were expensed during 2014, and (ii) insurance proceeds received during 2014 as a result of the same fire. |
(2) | Using our previous definition of AFFO, the net adjustment for cash rents for the years ended December 31, 2015, 2014, and 2013 would have been an increase (decrease) of approximately $1.1 million, $(7,000) and $(297,000), respectively. |
(3) | Includes only OP Units held by third parties. As of December 31, 2017 and 2016, there were 1,008,105 and 1,449,258, respectively, OP Units held by non-controlling limited partners, representing 6.8% and 12.6%, respectively, of all OP Units issued and outstanding. There were no OP Units held outside of the Company prior to 2016. |
39
ITEM 7. | MANAGEMENT’S DISCUSSION AND ANALYSIS OF FINANCIAL CONDITION AND RESULTS OF OPERATIONS |
The following analysis of our financial condition and results of operations should be read in conjunction with our financial statements and the notes thereto contained elsewhere in this Form 10-K.
OVERVIEW
General
We are an externally-managed, agricultural REIT that is engaged primarily in the business of owning and leasing farmland. With the exception of one farm in California, which is currently leased (on a temporary basis) to a wholly-owned subsidiary of ours, we are not a grower, nor do we farm the properties we own. We currently own 74 farms comprised of 63,175 acres across 9 states in the U.S. (Arizona, California, Colorado, Florida, Michigan, Nebraska, North Carolina, Oregon, and Washington). We also own several farm-related facilities, such as cooling facilities, packinghouses, processing facilities, and various storage facilities. These farms and facilities are currently leased to 52 different, third-party tenants that are either independent or corporate farming operations, and, as of October 17, 2017, one farm is leased to our TRS.
We were incorporated in 1997, primarily for the purpose of operating strawberry farms through our former subsidiary, Coastal Berry Company, LLC (“Coastal Berry”), an entity that provided growing, packaging, marketing, and distribution of fresh berries and other agricultural products. We operated Coastal Berry as our primary business until 2004, when it was sold to Dole Food Company (“Dole”). Since 2004, our operations have consisted solely (with the exception of one farm currently leased to our TRS) of leasing our farms to third-party tenants.
We conduct substantially all of our investment activities through, and all of our properties are held, directly or indirectly, by, our Operating Partnership. We control the sole general partner of the Operating Partnership and currently own, directly or indirectly, approximately 93.5% of the OP Units. We have the ability and expectation to continue to offer equity ownership in our Operating Partnership by issuing OP Units from time to time, in whole or in part, in exchange for agricultural real property. By structuring our acquisitions in this manner, the sellers of the real estate will generally be able to defer the realization of capital gains until they redeem the OP Units or sell the OP Units for cash. Persons who receive OP Units in our Operating Partnership in exchange for real estate or interests in entities that own real estate will be entitled to cause us to redeem these OP Units for cash or, at our election, shares of our common stock on a one-for-one basis at any time after holding the OP Units for one year.
We intend to acquire additional farmland and farm-related facilities in those states where we currently own farmland, as well as in other states within our regions of focus that is already leased or will be leased to farmers, and we expect that most of our future tenants will continue to be unrelated farming operations that sell their products through national corporate marketers-distributors. We generally lease our properties on a triple-net basis, an arrangement under which, in addition to rent, the tenant is required to pay the related property taxes, insurance costs (including drought insurance if we acquire properties that depend upon rainwater for irrigation), maintenance, and other operating costs. Except in unique circumstances, we do not currently intend to enter into the business of growing, packing, or marketing farmed products; however, if we do so, we expect that it would again be through a TRS. We may also elect to sell farmland at certain times, such as when the land could be developed by others for urban or suburban uses.
Our Adviser manages our real estate portfolio pursuant to an advisory agreement, and our Administrator provides administrative services to us pursuant to an administration agreement. Our Adviser and our Administrator collectively employ all of our personnel and pay directly their salaries, benefits, and general expenses.
Portfolio Diversity
Since our IPO, we have expanded our portfolio from 12 farms leased to 7 different, unrelated tenants to a current portfolio of 74 farms leased to 52 different, unrelated tenants (plus one related-party tenant). While our focus remains in farmland suitable for growing fresh produce annual row crops, we have also diversified our portfolio into farmland suitable for other crop types, including permanent crops (e.g., almonds, blueberries, pistachios, and wine grape vineyards) and certain commodity crops (e.g., corn and beans). The following table summarizes the different sources of revenues for our properties owned and with leases in place as of and for the years ended December 31, 2017 and 2016 (dollars in thousands):
40
As of and For the Year Ended December 31, 2017 | As of and For the Year Ended December 31, 2016 | Annualized Straight-line Rent as of December 31, 2017(1) | ||||||||||||||||||||||||
Revenue Source | Total Farmable Acres | % of Total Farmable Acres | Rental Revenue | % of Total Revenue | Total Farmable Acres | % of Total Farmable Acres | Rental Revenue | % of Total Revenue | Total Rental Revenue | % of Total Revenue | ||||||||||||||||
Annual row crops – fresh produce(2) | 14,694 | 28.9% | $ | 14,500 | 57.7% | 9,768 | 24.5% | $ | 11,252 | 65.0% | $ | 14,293 | 53.2% | |||||||||||||
Annual row crops – commodity crops(3) | 30,160 | 59.2% | 3,615 | 14.4% | 25,874 | 64.8% | 1,716 | 9.9% | 4,368 | 16.2% | ||||||||||||||||
Subtotal – Total annual row crops | 44,854 | 88.1% | 18,115 | 72.1% | 35,642 | 89.3% | 12,968 | 74.9% | 18,661 | 69.4% | ||||||||||||||||
Permanent crops(4) | 6,040 | 11.9% | 5,021 | 20.0% | 4,253 | 10.7% | 2,581 | 14.9% | 6,097 | 22.7% | ||||||||||||||||
Subtotal – Total crops | 50,894 | 100.0% | 23,136 | 92.1% | 39,895 | 100.0% | 15,549 | 89.8% | 24,758 | 92.1% | ||||||||||||||||
Facilities and other(5) | — | —% | 1,975 | 7.9% | — | —% | 1,757 | 10.2% | 2,129 | 7.9% | ||||||||||||||||
Total | 50,894 | 100.0% | $ | 25,111 | 100.0% | 39,895 | 100.0% | $ | 17,306 | 100.0% | $ | 26,887 | 100.0% | |||||||||||||
(1) | Annualized straight-line rent amount is based on the minimum rental payments guaranteed under the lease, as required under GAAP. Excludes contingent rental payments, such as crop share proceeds, and excludes rent owed to us by our TRS. |
(2) | Includes berries and other fruits, such as blackberries, melons, raspberries, and strawberries; and vegetables, such as arugula, broccoli, cabbage, carrots, celery, cilantro, cucumbers, edamame, green beans, kale, lettuce, mint, onions, peas, peppers, potatoes, radicchio, spinach, and tomatoes. |
(3) | Includes alfalfa, barley, corn, edible beans, grass, popcorn, soybeans, and wheat. |
(4) | Includes almonds, apples, avocados, blueberries, cherries, lemons, pistachios, and wine grapes. |
(5) | Consists primarily of rental revenue from: (i) farm-related facilities, such as cooling facilities, packinghouses, distribution centers, residential houses for tenant farmers, and other farm-related buildings; (ii) two oil and gas surface area leases on small parcels of two of our properties; and (iii) unimproved or non-farmable acreage on certain of our farms. |
Our acquisition of 63 farms since our IPO has also allowed us to further diversify our portfolio geographically. The following table summarizes the different geographic locations of our properties owned and with leases in place as of and for the years ended December 31, 2017 and 2016 (dollars in thousands):
As of and For the Year Ended December 31, 2017 | As of and For the Year Ended December 31, 2016 | Annualized Straight- line Rent as of December 31, 2017(1) | ||||||||||||||||||||||||
State | Total Acres | % of Total Acres | Rental Revenue | % of Total Rental Revenue | Total Acres | % of Total Acres | Rental Revenue | % of Total Rental Revenue | Total Rental Revenue | % of Total Rental Revenue | ||||||||||||||||
California | 8,080 | 12.8% | $ | 12,006 | 47.8% | 6,713 | 13.3% | $ | 9,829 | 56.8% | $ | 12,102 | 45.0% | |||||||||||||
Florida | 11,006 | 17.5% | 6,585 | 26.2% | 5,567 | 11.0% | 3,293 | 19.0% | 6,976 | 25.9% | ||||||||||||||||
Colorado | 31,450 | 49.9% | 2,704 | 10.8% | 30,170 | 59.6% | 1,453 | 8.4% | 2,743 | 10.2% | ||||||||||||||||
Arizona | 6,280 | 10.0% | 1,572 | 6.3% | 3,000 | 5.9% | 729 | 4.2% | 2,414 | 9.0% | ||||||||||||||||
Oregon | 2,313 | 3.7% | 1,189 | 4.7% | 2,313 | 4.6% | 1,172 | 6.8% | 1,208 | 4.5% | ||||||||||||||||
Nebraska | 2,559 | 4.0% | 580 | 2.3% | 2,559 | 5.1% | 580 | 3.4% | 580 | 2.2% | ||||||||||||||||
Michigan | 270 | 0.4% | 249 | 1.0% | 270 | 0.5% | 250 | 1.4% | 249 | 0.9% | ||||||||||||||||
Washington | 746 | 1.2% | 152 | 0.6% | — | —% | — | —% | 484 | 1.8% | ||||||||||||||||
North Carolina | 310 | 0.5% | 74 | 0.3% | — | —% | — | —% | 131 | 0.5% | ||||||||||||||||
Total | 63,014 | 100.0% | $ | 25,111 | 100.0% | 50,592 | 100.0% | $ | 17,306 | 100.0% | $ | 26,887 | 100.0% | |||||||||||||
(1) | Annualized straight-line rent amount is based on the minimum rental payments guaranteed under the lease, as required under GAAP. Excludes contingent rental payments, such as crop share proceeds, and excludes rent owed to us by our TRS. |
Leases
General
Most of our agricultural leases are on a triple-net basis and have original terms ranging from 3 to 10 years for farms growing row crops and 5 to 15 years for farms growing permanent crops (in each case, often with options to extend the lease further), and rent is generally payable to us on either an annual or semi-annual basis. Further, most of our leases contain provisions that provide for annual increases in the rental amounts payable by the tenants, often referred to as escalation clauses. The escalation clauses may specify fixed dollar amount or percentage increases each year, or they may be variable, based on standard cost of living or inflation indices. In addition, some leases that are longer-term in nature may require a regular survey of comparable land rents, with the rent owed per the lease being adjusted to reflect then-current market rents. We also have leases that include variable rents based on the success of the harvest each year. In these types of agreements, we will generally require the lease to include the guarantee of a minimum amount of rental income that satisfies our investment return criteria. Currently, our 74 farms are leased under agricultural leases with original terms ranging from 1 to 20 years, with 48 farms leased on a pure, triple-net basis, 23 farms leased on a partial-net basis (with us, as landlord, responsible for all or a portion of the related property taxes), and 2 farms leased on a gross basis (with the landlord responsible for the related property taxes, insurance, and maintenance on the property). One of our farms is currently vacant. Additionally, 13 of our farms are leased under agreements that include a variable rent component. We monitor our tenants’ credit quality on an ongoing basis by, among other things,
41
periodically conducting site visits of the properties to ensure farming operations are taking place and to assess the general maintenance of the properties. During the year ended December 31, 2017, we wrote off approximately $149,000 of aggregate deferred rent balances to bad debt expense related to two early lease terminations. However, prior to the leases' early terminations, each of the tenants were current in their scheduled rent payments. We have not identified any changes to the credit quality of any of our current our tenants, and all tenants continue to pay pursuant to the terms of their respective leases.
Lease Expirations
Farm leases are often short-term in nature, so in any given year, we may have multiple leases up for renewal or extension. The following table summarizes the lease expirations by year for the properties owned and with leases in place as of December 31, 2017 (dollars in thousands):
Year | Number of Expiring Leases | Expiring Leased Acreage | % of Total Acreage | Rental Revenue for the Year Ended December 31, 2017 | % of Total Rental Revenue | |||||||||
2018 | 5 | (1),(4) | 2,879 | 4.6% | $ | 1,391 | 5.5% | |||||||
2019 | 5 | (2),(4) | 157 | 0.2% | 156 | 0.6% | ||||||||
2020 | 12 | 28,497 | 45.2% | 7,465 | 29.7% | |||||||||
2021 | 6 | 8,234 | 13.1% | 1,952 | 7.8% | |||||||||
2022 | 3 | (3) | 269 | 0.4% | 616 | 2.5% | ||||||||
2023 | 6 | 7,046 | 11.2% | 4,844 | 19.3% | |||||||||
Thereafter | 20 | (4) | 15,932 | 25.3% | 8,687 | 34.6% | ||||||||
Totals | 57 | 63,014 | 100.0% | $ | 25,111 | 100.0% | ||||||||
(1) | Includes one oil and gas lease that continues on a year-to-year basis, for which we recorded rental revenue of approximately $32,000 during the year ended December 31, 2017, and one farm currently leased to our TRS through July 31, 2018, under a lease that commenced on October 17, 2017. During the year ended December 31, 2017, prior to the farm being leased to our TRS, we had recorded approximately $573,000 of rental revenue related to this farm. |
(2) | Includes one cellular lease, for which we recorded approximately $2,000 of rental revenue during the year ended December 31, 2017. |
(3) | Includes one oil, gas, and mineral lease, for which we recorded no rental revenue during the year ended December 31, 2017. |
(4) | Subsequent to December 31, 2017, two leases that were originally scheduled to expire in 2024 and 2025 were terminated early and immediately released to new tenants under leases that expire in 2019 and 2018, respectively. See "Recent Developments—Investment, Leasing, and Other Portfolio Activity—Existing Properties—Leasing Activity" below for further discussion on these early terminations and re-leasings. |
Recent Developments
Investment, Leasing, and Other Portfolio Activity
Property Acquisitions
Since January 1, 2017, through the date of this filing, we have acquired 17 farms, which are summarized in the table below (dollars in thousands):
42
Property Name | Property Location | Acquisition Date | Total Acreage | No. of Farms | Primary Crop(s) | Lease Term (1) | Renewal Options | Total Purchase Price | Acquisition Costs (2) | Annualized Straight-line Rent(3) | |||||||||||||||||
Citrus Boulevard | Martin, FL | 1/12/2017 | 3,748 | 1 | Organic Vegetables | 7.0 years | 3 (5 years) | $ | 54,000 | $ | 80 | $ | 2,926 | ||||||||||||||
Spot Road | (4) | Yuma, AZ | 6/1/2017 | 3,280 | 4 | Melons and Alfalfa Hay | 8.6 years | 1 (10 years) & 1 (2 years) | 27,500 | 88 | 1,672 | ||||||||||||||||
Poplar Street | Bladen, NC | 6/2/2017 | 310 | 2 | Organic Blueberries | 9.6 years | 1 (5 years) | 2,169 | 49 | 122 | (5) | ||||||||||||||||
Phelps Avenue | Fresno, CA | 7/17/2017 | 847 | 4 | Pistachios and Almonds | 10.3 years | 1 (5 years) | 13,603 | 43 | 681 | (5) | ||||||||||||||||
Parrot Avenue | (6) | Okeechobee, FL | 8/9/2017 | 1,910 | 1 | Misc. Vegetables | 0.5 years | None | 9,700 | 67 | 488 | ||||||||||||||||
Cat Canyon Road | (7) | Santa Barbara, CA | 8/30/2017 | 361 | 1 | Wine Grapes | 9.8 years | 2 (5 years) | 5,375 | 112 | 320 | ||||||||||||||||
Oasis Road | Walla Walla, WA | 9/8/2017 | 746 | 1 | Apples, Cherries, and Wine Grapes | 6.3 years | None | 9,500 | 45 | 484 | (5) | ||||||||||||||||
JJ Road | Baca, CO | 10/2/2017 | 1,280 | 1 | Grass Hay | 4.3 years | 1 (5 years) | 900 | 26 | 52 | |||||||||||||||||
Jayne Avenue | Fresno, CA | 12/15/2017 | 159 | 1 | Organic Almonds | 19.9 years | 2 (5 years) | 5,925 | 44 | 364 | (5) | ||||||||||||||||
Taft Highway | (8) | Kern, CA | 1/31/2018 | 161 | 1 | Potatoes and Melons | N/A | N/A | 2,945 | 13 | — | ||||||||||||||||
12,802 | 17 | $ | 131,617 | $ | 567 | $ | 7,109 | ||||||||||||||||||||
(1) | Where more than one lease was assumed or executed, represents the weighted-average lease term on the property. |
(2) | Unless noted otherwise, acquisitions were accounted for as asset acquisitions under ASC 360. As such, all acquisition-related costs were capitalized and allocated among the identifiable assets acquired. The figures above represent only costs paid or accrued for as of the date of this filing. |
(3) | Annualized straight-line amount is based on the minimum cash rental payments guaranteed under the lease, as required under GAAP. |
(4) | Includes two farms (1,368 total acres) acquired through a leasehold interest, with the State of Arizona as the lessor. These state leases expire in February 2022 (485 total acres) and February 2025 (883 total acres). In addition, in connection with the acquisition of this property, we assumed four in-place leases with us as the lessor or sublessor. Three of these leases are agricultural leases, with one lease expiring on June 30, 2019, and two leases expiring on September 15, 2026. The fourth lease is a residential lease that expires on September 30, 2019. If either of the state leases is not renewed upon its expiration, the subleases on the respective acreage shall terminate automatically. |
(5) | Leases also provide for a variable rent component based on the gross crop revenues earned on the property. The figures above represent only the minimum cash rents guaranteed under the respective leases. |
(6) | In connection with the acquisition of this property, we executed a 6-year, follow-on lease with a new tenant that begins upon the expiration of the 7-month lease assumed at acquisition. The follow-on lease includes two, 6-year extension options and provides for minimum annualized straight-line rents of approximately $542,000. In addition, in connection with the execution of the follow-on lease, we committed to providing up to $1.0 million of capital for certain irrigation and property improvements. As stipulated in the follow-on lease, we will earn additional rent income on the total cost of the improvements as disbursements are made by us at a rate commensurate with the annual yield on the farmland (as determined by each year's minimum cash rent per the follow-on lease). |
(7) | In connection with the acquisition of this property, we committed up to $4.0 million of capital to fund the development of additional vineyard acreage on the property. As stipulated in the lease agreement, we will earn additional rental income on the total cost of the project as the capital is disbursed by us at rates specified in the lease. |
(8) | Property was purchased with no lease at the time of acquisition. We expect to have a lease executed on this property during the three months ending March 31, 2018. |
Property Dispositions
During the year ended December 31, 2017, we completed the sale of a 219-acre farm in Hillsborough County, Florida (“Colding Loop”), to the existing tenant for $3.9 million, recognizing a net gain on the sale (inclusive of closing costs) of approximately $85,000.
Existing Properties
Leasing Activity
During the year ended December 31, 2017, we executed 10 separate leases on 9 different farms in California and Florida that had leases expiring in either 2017 or 2018. In total, these leases were renewed for additional terms ranging between one and five years and for total annualized rents of approximately $2.2 million, representing a decrease of approximately $167,000 (approximately 7.0%) from that of the prior leases. These renewals were executed without incurring any downtime on the respective farms, and no leasing commissions or tenant improvements were incurred in connection with these renewals.
In addition, on December 31, 2017, we terminated the lease with Dole on one of our farms in Santa Clara, California, and entered into a new lease with a new tenant to occupy the farm. The prior lease was originally scheduled to expire on December 31, 2020, and in connection with its early termination, during the year ended December 31, 2017, we wrote off approximately $99,000 of deferred rent asset balance to bad debt expense, which is included in General and administrative expenses on the accompanying Consolidated Statements of Operations. The new lease is scheduled to expire on December 31, 2020, and provides for annualized straight-line rent of approximately $605,000, representing a 10.9% increase over that of the
43
prior lease (before its termination). No downtime was incurred as a result of the early termination and re-leasing of this farm, nor were any leasing commissions or tenant improvements incurred in connection with the new lease.
Subsequent to December 31, 2017, we terminated the leases on two of our farms in Cochise County, Arizona, early and entered into two new lease agreements with a new tenant. Each of the new leases is for a term of one year and provides for aggregate minimum rents of approximately $480,000, which represents a decrease of approximately $203,000 (approximately 29.7%) from that of the prior leases (before each of their terminations). However, each of the new leases also contains a variable rent component based on the total gross revenues earned on the respective farms, whereas the prior leases were both fixed-rent leases. In addition, both of the new leases are pure, triple-net lease agreements, whereas one of the prior leases was a partial-net lease (with us responsible for the property taxes on the farm). In connection with one of the early lease terminations, during the year ended December 31, 2017, we recorded a full allowance on the respective lease's deferred rent asset balance as of December 31, 2017, which was approximately $50,000. We recorded this allowance to bad debt expense, which is included in General and administrative expenses on the accompanying Consolidated Statements of Operations. In connection with the other early lease termination, as of the termination date, the lease has a deferred rent liability balance of approximately $84,000. In accordance with ASC 360-10, we will recognize this balance as additional rental income during the three months ending March 31, 2018 (on the lease termination date). No downtime was incurred as a result of the early terminations and re-leasing of these farms, nor were any leasing commissions or tenant improvements incurred in connection with the new leases.
Project Completion
In connection with the lease we executed upon our acquisition of an 854-acre farm in California in September 2015, we agreed to fund the development of the property into an almond orchard. The development included the removal of 274 acres of old grape vineyards, the installation of a new irrigation system, including the drilling of four new wells, and the planting of over 800 acres of new almond trees. As of December 31, 2017, the development project had been completed at a total cost of approximately $8.4 million, and, as a result, we expect to receive approximately $5.2 million of additional rent throughout the term of the lease, which expires January 9, 2031.
Capital Improvements
In connection with certain lease agreements executed during the year ended December 31, 2017, we committed to providing up to $7.8 million of aggregate capital to our tenants for improvements on certain of our farms. These improvements are expected to be completed over the next three years and, assuming full deployment of the capital commitment amounts, are expected to result in additional annual rental income of approximately $450,000. We will begin earning rental income on each of these projects as the funds are disbursed by us. See Note 8, “Commitments and Contingencies,” in the notes to our accompanying consolidated financial statements for a more detailed discussion on each of these projects.
TRS Lease Assumption
On October 17, 2017, our TRS entered into an Assignment and Assumption of Agricultural Lease (the “Assigned TRS Lease”) with the previously-existing tenant on a 169-acre farm located in Ventura County, California. The Assigned TRS Lease was then amended to shorten the lease term by two years (the new expiration date is July 31, 2018) and to remove any tenant renewal options. All other terms of the lease remained unchanged, including the rental amounts. In addition, to fund the initial operations on the farm, on October 17, 2017, our TRS issued a $1.7 million unsecured promissory note to the Company that is scheduled to mature on July 31, 2018, and will bear interest at a rate equal to the prime rate plus a spread of 5.0% per annum. Repayment of the promissory note, along with interest accrued on the note, is expected to be funded by crop sales earned on the farm by our TRS.
As our wholly-owned TRS is operating the farm, the amount of rent and interest our TRS pays to us (as the parent-landlord and parent-lender) will not be qualifying income for purposes of certain of our REIT tests; however, we do not expect such amounts to be at a level where we are at risk of not qualifying as a REIT. In addition, any taxable income generated by our TRS (whose operations are consolidated within our financial statements) will be subject to regular corporate income taxes. We are unable to estimate the amount of taxable income, if any, that will be generated by our TRS. No taxable income was generated by our TRS during the year ended December 31, 2017.
Financing Activity
Debt Activity
During the year ended December 31, 2017, we incurred the following new, long-term borrowings (dollars in thousands):
44
Lender(1) | Aggregate Principal Amount | Weighted-average Maturity Date | Weighted-average Stated Interest Rates(2) | Interest Rate Terms | ||||||||
MetLife | $ | 42,750 | July 2027 | 3.84 | % | Fixed through March 2026 (variable thereafter) | ||||||
Farmer Mac | 35,625 | June 2022 | 3.40 | % | Fixed throughout term | |||||||
Farm Credit West | 11,717 | June 2037 | 4.42 | % | (3) | Fixed through August 2025 (variable thereafter) | ||||||
Farm Credit FL | 5,820 | March 2037 | 4.70 | % | (4) | Fixed through February 2024 (variable thereafter) | ||||||
Farm Credit CFL(5) | 5,472 | August 2022 | 4.47 | % | (6) | Fixed throughout term | ||||||
NW Farm Credit | 5,460 | September 2024 | 4.41 | % | (4) | Fixed throughout term | ||||||
CF Farm Credit | 1,301 | July 2022 | 4.41 | % | (4) | Fixed throughout term | ||||||
Rabo AgriFinance | 540 | October 2022 | 4.59 | % | Fixed throughout term | |||||||
$ | 108,685 | |||||||||||
(1) | For further discussion on borrowings from each of these lenders, refer to Note 4, “Borrowings,” in the notes to our accompanying consolidated financial statements. |
(2) | Where applicable, rate is before interest patronage, or refunded interest. |
(3) | In February 2017, we received interest patronage from Farm Credit West representing a 21.3% refund of the interest accrued on all borrowings from Farm Credit West during the year ended December 31, 2016. This interest patronage reduced the interest rates on our borrowings from Farm Credit West during the year ended December 31, 2016, from a weighted-average stated interest rate of 3.59% to a weighted-average effective interest rate of 2.83%. We are unable to estimate the amount of interest patronage to be received, if any, related to interest accrued during 2017 on our Farm Credit West borrowings. |
(4) | Interest patronage is expected to be received related to interest accrued during 2017 on these borrowings; however, we are unable to estimate the amount to be received, if any. |
(5) | During the year ended December 31, 2017, we amended four existing loan agreements with Farm Credit CFL to increase the loan amounts and adjust the principal amortization and interest rate terms as shown in the table above. The amount presented in the table above represents the total additional funds advanced under the four loans. The new terms of each of these four loans are pari passu with one another. |
(6) | In April 2017, we received interest patronage from Farm Credit CFL representing a 15.8% refund of the interest accrued on all borrowings from Farm Credit CFL during the year ended December 31, 2016. This interest patronage reduced the interest rates on our borrowings from Farm Credit CFL during the year ended December 31, 2016, from a weighted-average stated interest rate of 3.47% to a weighted-average effective interest rate of 2.93%. We are unable to estimate the amount of interest patronage to be received, if any, related to interest accrued during 2017 on our Farm Credit CFL borrowings. |
On December 15, 2017, we executed an amendment to our credit facility with Metropolitan Life Insurance Company (“MetLife”), which, in aggregate, previously consisted of $150.0 million of term notes and $50.0 million of revolving equity lines of credit (the “MetLife Facility”). Pursuant to the amendment, the MetLife Facility now consists of an aggregate of $200.0 million of term notes and $75.0 million of revolving equity lines of credit. In addition, the amendment extended the draw period under each of the term notes by an additional year, through December 31, 2019, and adjusted the unused fee on all borrowings from a flat fee of 0.20% on undrawn amounts to a sliding fee (ranging from 0.10% to 0.20%) based on the amount drawn under each individual note.
In addition, on November 30, 2017, in connection with the sale of Colding Loop, we repaid a mortgage note collateralized by the property in the amount of approximately $2.6 million, plus all accrued interest. The mortgage note bore interest at a fixed rate of 2.90% (which was fixed through April 30, 2018) and was originally scheduled to mature on May 1, 2030. There was no prepayment penalty incurred in connection with the early repayment.
Equity Activity
Secondary Offerings
During the year ended December 31, 2017, we completed two overnight public offerings of our common stock. In the aggregate, these offerings resulted in the issuance of 2,975,749 new shares (including 295,749 shares issued as a result of the underwriters exercising their over-allotment options) of our common stock for aggregate gross proceeds of approximately $34.8 million and net proceeds (after deducting underwriting discounts and offering expenses borne by us) of approximately $32.9 million.
At-the-Market Program
On August 7, 2015, we entered into equity distribution agreements (“Sales Agreements”) with Cantor Fitzgerald & Co. and Ladenburg Thalmann & Co., Inc. (each a “Sales Agent”), under which we may issue and sell, from time to time and through the Sales Agents, shares of our common stock having an aggregate offering price of up to $30.0 million (the “ATM Program”). On April 13, 2017, we amended the Sales Agreements to reference the new universal registration statement on Form S-3 (File No. 333-217042) (the “2017 Registration Statement”), filed with the SEC on March 31, 2017, and declared effective on April 12, 2017. All other material terms of the Sales Agreements remained the same.
Since January 1, 2017, through the date of this filing, we sold 640,665 shares of our common stock under the ATM Program at an average sales price of $13.07 per share for gross proceeds of approximately $8.4 million and net proceeds (after deducting
45
offering expenses borne by us) of approximately $8.2 million. To date, we have sold 705,226 shares of our common stock at an average sales price of $12.81 per share under the ATM Program for gross proceeds of approximately $9.0 million and net proceeds (after deducting offering expenses borne by us) of approximately $8.9 million.
OP Unit Redemptions
Since January 1, 2017, through the date of this filing, a total of 478,653 OP Units were tendered for redemption. As a result, we issued 254,575 shares of common stock (in exchange for 254,575 of the tendered OP Units), and we satisfied the redemption of the remaining 224,078 tendered OP Units with an aggregate cash payment of approximately $3.0 million (approximately $13.25 per OP Unit). Currently, there are 970,605 OP Units held by non-controlling limited partners outstanding and eligible to be tendered for redemption.
Series B Preferred Stock Offering
On January 10, 2018, we filed a prospectus supplement (the “Prospectus Supplement”) with the SEC for a continuous public offering of up to 6,000,000 shares (the “Primary Offering”) of our newly-designated Series B Preferred Stock at an offering price of $25.00 per share (the “Offering Price”), for gross proceeds of up to $150.0 million and net proceeds, after deducting dealer-manager fees, selling commissions, and estimated expenses of the offering payable by us, of up to approximately $131.3 million, assuming all shares of the Series B Preferred Stock are sold in the offering. We are also offering up to 500,000 additional shares of the Series B Preferred Stock pursuant to our dividend reinvestment plan (the “DRIP”) to those holders of the Series B Preferred Stock who elect to participate in such plan. The Series B Preferred Stock is being offered on a “reasonable best efforts” basis by Gladstone Securities, an affiliate of ours who will serve as our exclusive dealer-manager in connection with the Primary Offering (see “—Dealer-Manager Agreement” below).
The offering of the Series B Preferred Stock will terminate on the date (the “Termination Date”) that is the earlier of either January 10, 2023 (unless terminated earlier or extended by our Board of Directors), or the date on which all 6,000,000 shares offered in the Primary Offering are sold.
There is currently no public market for shares of the Series B Preferred Stock; however, we intend to apply to list the Series B Preferred Stock on Nasdaq or another national securities exchange within one calendar year after the offering's Termination Date, though there can be no assurance that a listing will be achieved in such timeframe, or at all.
We intend to use the net proceeds from the Series B Offering to repay existing indebtedness, to fund future acquisitions, and for other general corporate purposes. No sales of the Series B Preferred Stock have been made through the date of this filing.
We are still assessing the accounting treatment of shares of the Series B Preferred Stock, though we anticipate that they will be treated as permanent equity (within stockholders' equity) on the Consolidated Balance Sheet, as the shares are redeemable only upon the occurrence of an event within our control (due to our ability to terminate or suspend all shareholder redemption options at any time). For a more detailed discussion on this offering, see Note 11, “Subsequent Events—Equity Activity—Series B Preferred Stock,” in the accompanying notes to our consolidated financial statements.
Our Adviser and Administrator
We are externally managed pursuant to contractual arrangements with our Adviser and our Administrator (both affiliates of ours), which collectively employ all of our personnel and pay their salaries, benefits, and general expenses directly.
The investment advisory agreement with our Adviser that was in effect through March 31, 2017 (the “Prior Advisory Agreement”), and the current administration agreement with our Administrator (the “Administration Agreement”) each became effective February 1, 2013. On April 11, 2017, we entered into the Amended Advisory Agreement with our Adviser that became effective beginning with the three months ended June 30, 2017. A summary of the management investment advisory and administrative services and fees under these agreements are described below, and further discussion can also be found in Note 6, “Related-Party Transactions,” in the accompanying notes to our consolidated financial statements.
Prior Advisory Agreement
Pursuant to the Prior Advisory Agreement that was in effect through March 31, 2017, our Adviser was compensated in the form of a base management fee and, as applicable, an incentive fee. Each of these fees is described below.
Base Management Fee
We paid an annual base management fee equal to 2.0% of our adjusted stockholders’ equity, which was defined as our total stockholders’ equity at the end of each quarter less the recorded value of any preferred stock we may have issued.
Incentive Fee
46
We also paid an additional quarterly incentive fee based on funds from operations (as defined in the Prior Advisory Agreement). For purposes of calculating the incentive fee, our funds from operations, before giving effect to any incentive fee (our “Pre-Incentive Fee FFO”), included any realized capital gains or losses, less any distributions paid on our preferred stock, but did not include any unrealized capital gains or losses. The incentive fee rewarded our Adviser if our Pre-Incentive Fee FFO for a particular calendar quarter exceeded a hurdle rate of 1.75% (7.0% annualized) of our total stockholders’ equity (as shown on the balance sheet) at the end of the quarter. Our Adviser earned 100% of the amount of the Pre-Incentive Fee FFO for the quarter that exceeded the hurdle rate but was less than 2.1875% of our total stockholders' equity at the end of the quarter (8.75% annualized) and 20% of the amount of our Pre-Incentive Fee FFO that exceeded 2.1875% for the quarter.
Amended Advisory Agreement
Pursuant to the Amended Advisory Agreement, our Adviser is compensated in the form of a base management fee and, each as applicable, an incentive fee, a capital gains fee, and a termination fee. Each of these fees is described below.
Base Management Fee
A base management fee will be paid quarterly and will be calculated as 2.0% per annum (0.50% per quarter) of the prior calendar quarter's total adjusted equity, which is defined as total equity plus total mezzanine equity, if any, each as reported on the balance sheet, adjusted to exclude unrealized gains and losses and certain other one-time events and non-cash items (“Total Adjusted Equity”).
Incentive Fee
An incentive fee will be calculated and payable quarterly in arrears if the Pre-Incentive Fee FFO for a particular quarter exceeds a hurdle rate of 1.75% (7.0% annualized) of the prior calendar quarter's Total Adjusted Equity. For purposes of this calculation, Pre-Incentive Fee FFO is defined in the Amended Advisory Agreement as FFO (also as defined in the Amended Advisory Agreement) accrued by the Company during the current calendar quarter (prior to any incentive fee calculation for the current calendar quarter), less any dividends paid on preferred stock securities that are not treated as a liability for GAAP (as defined below) purposes. We pay our Adviser an incentive fee with respect to our Pre-Incentive Fee FFO quarterly, as follows:
• | no Incentive Fee in any calendar quarter in which our Pre-Incentive Fee FFO does not exceed the hurdle rate of 1.75% (7.0% annualized); |
• | 100% of the amount of our Pre-Incentive Fee FFO with respect to that portion of such Pre-Incentive Fee FFO, if any, that exceeds the hurdle rate but is less than 2.1875% in any calendar quarter (8.75% annualized); and |
• | 20% of the amount of our Pre-Incentive fee FFO, if any, that exceeds 2.1875% in any calendar quarter (8.75% annualized). |
Quarterly Incentive Fee Based on Pre-Incentive Fee FFO
Pre-Incentive Fee FFO
(expressed as a percentage of Total Adjusted Equity)
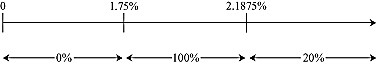
Percentage of Pre-Incentive Fee FFO allocated to Incentive Fee
Capital Gains Fee
A capital gains-based incentive fee will be calculated and payable in arrears at the end of each fiscal year (or upon termination of the Amended Advisory Agreement). The capital gains fee shall equal: (i) 15% of the cumulative aggregate realized capital gains minus the cumulative aggregate realized capital losses, minus (ii) any aggregate capital gains fees paid in prior periods. For purposes of this calculation, realized capital gains and losses will be calculated as (x) the sales price of the property, minus (y) any costs to sell the property and the then-current gross value of the property (which includes the property's original acquisition price plus any subsequent, non-reimbursed capital improvements). At the end of each fiscal year, if this figure is negative, no capital gains fee shall be paid. To date, no capital gains fee has been earned by our Advisor.
Termination Fee
In the event of our termination of the Amended Advisory Agreement for any reason (with 120 days’ prior written notice and the vote of at least two-thirds of our independent directors), a termination fee would be payable to our Adviser equal to three times
47
the sum of the average annual base management fee and incentive fee earned by the Adviser during the 24-month period prior to such termination.
Administration Agreement
Pursuant to the Administration Agreement, we pay for our allocable portion of the Administrator’s expenses incurred while performing services to us, including, but not limited to, rent and the salaries and benefits expenses of our Administrator’s employees, including our chief financial officer, treasurer, chief compliance officer, general counsel, and secretary (who also serves as our Administrator’s president, general counsel, and secretary), and their respective staffs.
As approved by our Board of Directors, effective July 1, 2014, our allocable portion of the Administrator’s expenses is generally derived by multiplying our Administrator’s total expenses by the approximate percentage of time the Administrator’s employees perform services for us in relation to their time spent performing services for all companies serviced by our Administrator under similar contractual agreements.
Emerging Growth Company
We are an “emerging growth company,” as defined in the JOBS Act, and we may take advantage of certain exemptions from various reporting requirements that are applicable to other public companies that are not “emerging growth companies.” In particular, Section 107 of the JOBS Act provides that an emerging growth company may choose to take advantage of the extended transition period provided in Section 7(a)(2)(B) of the Securities Act of 1933, as amended, for complying with new or revised accounting standards, meaning that the company can delay the adoption of certain accounting standards until those standards would otherwise apply to private companies. Additionally, we are eligible to take advantage of certain other exemptions from various reporting requirements that are applicable to public companies that are not emerging growth companies, including, but not limited to, an exemption from the auditor attestation requirements of Section 404 of the Sarbanes-Oxley Act of 2002. As an emerging growth company, we have the ability to defer compliance with new or revised accounting standards to the dates on which adoption of such standards is required for private companies for as long as we maintain our emerging company status. The election to defer such compliance could have a material impact on our financial statements and the comparability of our financial statements to that of similar public companies. We will remain an “emerging growth company” through December 30, 2018, unless the market value of our common stock that is held by non-affiliates exceeds $700.0 million as of any June 30 before that time.
Critical Accounting Policies
The preparation of our financial statements in accordance with GAAP requires management to make judgments that are subjective in nature to make certain estimates and assumptions. Application of these accounting policies involves the exercise of judgment regarding the use of assumptions as to future uncertainties, and, as a result, actual results could materially differ from these estimates. A summary of all of our significant accounting policies are provided in Note 2, “Summary of Significant Accounting Policies,” in the accompanying notes to our consolidated financial statements, located elsewhere in this Form 10-K, and a summary of our critical accounting policies is below. We consider these policies to be critical because they involve estimates and assumptions that require complex, subjective or significant judgments in their application and that materially affect our results of operations. There were no material changes in our critical accounting policies during the year ended December 31, 2017.
Purchase Price Allocation
When we acquire real estate, we allocate the purchase price to: (i) the tangible assets acquired and liabilities assumed, consisting primarily of land, improvements (including irrigation and drainage systems), buildings, horticulture, and long-term debt, and, if applicable, (ii) any identifiable intangible assets and liabilities, which primarily consist of the values of above- and below-market leases, in-place lease values, lease origination costs, and tenant relationships, based in each case on their fair values.
Certain of our acquisitions involve sale-leaseback transactions with newly-originated leases, and other of our acquisitions involve the acquisition of farmland that is already being operated as rental property, in which case we will typically assume the lease in place at the time of acquisition. Prior to us early adopting Accounting Standards Update (“ASU”) 2017-01, “Clarifying the Definition of a Business” (as further described in Note 2, “Summary of Significant Accounting Pronouncements,” under the caption, “—Recently-Issued Accounting Pronouncements,” in the accompanying consolidated financial statements), acquisitions of farmland already being operated as rental property were generally considered to be business combinations under Accounting Standards Codification (“ASC”) 805, “Business Combinations.” However, after our adoption of ASU 2017-01, effective October 1, 2016, we now generally consider both types of acquisitions to be asset acquisitions under ASC 360, “Property Plant and Equipment.” ASC 360 requires us to capitalize the transaction costs incurred in connection with the
48
acquisition, whereas ASC 805 required that all costs related to the acquisition be expensed as incurred, rather than capitalized into the cost of the acquisition.
Whether an acquisition is considered an asset acquisition or a business combination, both ASC 360 and ASC 805 require that the purchase price of real estate be allocated to (i) the tangible assets acquired and liabilities assumed, and, if applicable, (ii) any identifiable intangible assets and liabilities, by valuing the property as if it was vacant, based on management's determination of the relative fair values of such assets and liabilities as of the date of acquisition.
For a more detailed discussion on this accounting policy, see Note 2, “Summary of Significant Accounting Policies—Real Estate and Lease Intangibles,” in the accompanying notes to our consolidated financial statements.
Recently-Issued Accounting Pronouncements
See Note 2, “Summary of Significant Accounting Policies,” in the accompanying notes to our consolidated financial statements for a description of recently-issued accounting pronouncements.
RESULTS OF OPERATIONS
For the purposes of the following discussions on certain operating revenues and expenses:
• | With regard to the comparison between the years ended December 31, 2017 versus 2016: |
◦ | Same-property basis represents properties owned as of December 31, 2015, and were not vacant at any point during either period presented. |
◦ | Properties acquired during the prior-year period are properties acquired during the year ended December 31, 2016. |
◦ | Properties acquired subsequent to prior-year period are properties acquired subsequent to December 31, 2016. |
◦ | Disposed of, vacant, or self-operated farms represent properties that were either (i) disposed of during either period presented, (ii) vacant at any point during either period presented, or (iii) operated by a wholly-owned subsidiary of ours (in which case no revenues would have been recognized on our consolidated statements of operations). We sold one property during the year ended December 31, 2017, and this same property was also vacant for a portion of the year ended December 31, 2016. In addition, one of our farms was leased to our TRS for a portion of the year ended December 31, 2017. |
• | With regard to the comparison between the year ended December 31, 2016 versus 2015: |
◦ | Same-property basis represents properties owned as of December 31, 2014, and were not vacant at any point during either period presented. |
◦ | Properties acquired during the prior-year period are properties acquired during the year ended December 31, 2015. |
◦ | Properties acquired subsequent to prior-year period are properties acquired subsequent to December 31, 2015. |
◦ | Disposed of, vacant, or self-operated farms represent properties that were either (i) disposed of during either period presented, (ii) vacant at any point during either period presented, or (iii) operated by a wholly-owned subsidiary of ours (in which case no revenues would have been recognized on our consolidated statements of operations. We did not dispose of any properties during either of the years ended December 31, 2016 or 2015; however, we had one property that was vacant for a portion of the year ended December 31, 2016, and two properties that were vacant for a portion of the year ended December 31, 2015. In addition, no farms were self-operated during either of the years ended December 31, 2016 or 2015. |
A comparison of our operating results for the years ended December 31, 2017 and 2016 is below (dollars in thousands):
49
For the Years Ended December 31, | ||||||||||||||
2017 | 2016 | $ Change | % Change | |||||||||||
Operating revenues: | ||||||||||||||
Rental revenues | $ | 25,111 | $ | 17,306 | $ | 7,805 | 45.1% | |||||||
Tenant recovery revenue | 11 | 11 | — | —% | ||||||||||
Total operating revenues | 25,122 | 17,317 | 7,805 | 45.1% | ||||||||||
Operating expenses: | ||||||||||||||
Depreciation and amortization | 7,237 | 5,187 | 2,050 | 39.5% | ||||||||||
Property operating expenses | 1,165 | 787 | 378 | 48.0% | ||||||||||
Acquisition-related expenses | 127 | 246 | (119 | ) | (48.4)% | |||||||||
Management and incentive fees, net of fee credits | 2,675 | 1,892 | 783 | 41.4% | ||||||||||
Administration fee | 914 | 771 | 143 | 18.5% | ||||||||||
General and administrative | 1,628 | 1,378 | 250 | 18.1% | ||||||||||
Total operating expenses, net of fee credits | 13,746 | 10,261 | 3,485 | 34.0% | ||||||||||
Operating income | 11,376 | 7,056 | 4,320 | 61.2% | ||||||||||
Other income (expense) | ||||||||||||||
Other income | 206 | 109 | 97 | 89.0% | ||||||||||
Interest expense | (9,762 | ) | (6,015 | ) | (3,747 | ) | 62.3% | |||||||
Distributions attributable to mandatorily-redeemable preferred stock | (1,833 | ) | (677 | ) | (1,156 | ) | 170.8% | |||||||
Loss on disposals of real estate assets, net | (21 | ) | — | (21 | ) | NM | ||||||||
Total other expense | (11,410 | ) | (6,583 | ) | (4,827 | ) | 73.3% | |||||||
Net (loss) income | (34 | ) | 473 | (507 | ) | (107.2)% | ||||||||
Net loss (income) attributable to non-controlling interests | 3 | (25 | ) | 28 | (112.0)% | |||||||||
Net (loss) income attributable to the Company | $ | (31 | ) | $ | 448 | $ | (479 | ) | (106.9)% | |||||
NM = Not Meaningful
Operating Revenues
Same-property Analysis (dollars in thousands)
Rental Revenues: | For the Years Ended December 31, | ||||||||||||
2017 | 2016 | $ Change | % Change | ||||||||||
Same-property basis | $ | 14,178 | $ | 13,858 | $ | 320 | 2.3% | ||||||
Properties acquired during prior-year period | 5,750 | 2,636 | 3,114 | 118.1% | |||||||||
Properties acquired subsequent to prior-year period | 4,541 | — | 4,541 | — | |||||||||
Disposed of, vacant, or self-operated properties | 642 | 812 | (170 | ) | (20.9)% | ||||||||
$ | 25,111 | $ | 17,306 | $ | 7,805 | 45.1% | |||||||
Rental revenues on a same-property basis increased for the year ended December 31, 2017, as compared to the prior year, by 2.3%. This increase was primarily due to earning additional revenue on capital improvements constructed on certain properties, partially offset by the recent renewals of leases on four of our California farms that resulted in a net decrease in aggregate annualized revenues of approximately $199,000. Rental revenues from acquired properties increased for the year ended December 31, 2017, as compared to the prior year, due to the additional revenues recorded from owning the 15 farms we acquired during the year ended December 31, 2016, for the full year in 2017, coupled with additional revenues earned from the 16 new farms we acquired during the year ended December 31, 2017. In addition, during the year ended December 31, 2017, we received a variable rent payment of approximately $304,000 from a farm in California that was acquired during the year ended December 31, 2016, which was recorded as additional rental revenue upon receipt. No variable rent revenues had been recorded prior to the receipt of this payment. Rental revenues from disposed of, vacant, or self-operated properties decreased for the year ended December 31, 2017, due primarily to the loss of revenues on the one farm in California that is currently being farmed by our TRS, as there were no crop sales on the farm during the year ended December 31, 2017, and revenue from rents owed to us from our TRS were eliminated on consolidation. We had one farm that was vacant for a portion of the year
50
ended December 31, 2016; however, this property was sold during the year ended December 31, 2017. As a result, there was not a significant difference in rent earned from this property during each of the periods presented.
Other Operating Revenues
Tenant recovery revenue represents real estate taxes and insurance premiums paid on certain of our properties that, per the leases, are required to be reimbursed by the tenant. Corresponding amounts were also recorded as property operating expenses during the respective periods.
Operating Expenses
Same-property Analysis (dollars in thousands)
Depreciation and amortization: | For the Years Ended December 31, | ||||||||||||
2017 | 2016 | $ Change | % Change | ||||||||||
Same-property basis | $ | 3,617 | $ | 3,534 | $ | 83 | 2.3% | ||||||
Properties acquired during prior-year period | 2,160 | 1,463 | 697 | 47.6% | |||||||||
Properties acquired subsequent to prior-year period | 1,265 | — | 1,265 | — | |||||||||
Disposed of, vacant, or self-operated properties | 195 | 190 | 5 | 2.6% | |||||||||
$ | 7,237 | $ | 5,187 | $ | 2,050 | 39.5% | |||||||
Depreciation and amortization expense on a same-property basis increased for the year ended December 31, 2017, as compared to the prior year, primarily as a result of additional depreciation on site improvements completed on certain properties during 2017, partially offset by the expiration of certain lease intangible amortization periods during 2017. Depreciation and amortization expense on acquired properties increased for the year ended December 31, 2017, as compared to the prior year, due to the additional depreciation and amortization expense recorded from owning the 15 farms we acquired during the year ended December 31, 2016, for the full year in 2017, coupled with the additional depreciation and amortization expense incurred on the 16 new farms we acquired during the year ended December 31, 2017. Depreciation and amortization expense on disposed of, vacant, or self-operated properties for the year ended December 31, 2017, remained relatively flat from that of the prior year, as the additional depreciation expense incurred as a result of making capital improvements to the farm currently operated by our TRS was offset by the sale of a property during the year ended December 31, 2017.
Property operating expenses: | For the Years Ended December 31, | ||||||||||||
2017 | 2016 | $ Change | % Change | ||||||||||
Same-property basis | $ | 752 | $ | 660 | $ | 92 | 13.9% | ||||||
Properties acquired during prior-year period | 39 | 12 | 27 | 225.0% | |||||||||
Properties acquired subsequent to prior-year period | 272 | — | 272 | — | |||||||||
Disposed of, vacant, or self-operated properties | 102 | 115 | (13 | ) | (11.3)% | ||||||||
$ | 1,165 | $ | 787 | $ | 378 | 48.0% | |||||||
Property operating expenses consist primarily of real estate taxes, repairs and maintenance expense, insurance premiums, and other miscellaneous operating expenses paid for certain of our properties. Property operating expenses on a same-property basis increased by approximately $92,000 for the year ended December 31, 2017, as compared to the prior year. This increase was primarily driven by a net increase in aggregate property tax expense (due to one of our pure, triple-net leases converting to a partial-net lease during the three months ended December 31, 2016, partially offset by a decrease in property taxes on certain properties that were entered into land conservation contracts under the California Land Conservation Act (which restricts the land to agricultural use and reduces the property tax assessment), effective January 1, 2017), as well as additional expenses incurred related to obtaining certain permits on one of our California properties. Property operating expenses on acquired properties increased for the year ended December 31, 2017, as compared to the prior year, primarily due to additional property taxes and other operating expenses owed on certain of the new farms we acquired during 2017, as two of the leases we acquired during the year ended December 31, 2017, were gross leases. Property operating expenses on disposed of, vacant, or self-operated properties for the year ended December 31, 2017, decreased as a result of lower property taxes (due to certain properties being entered into a land conservation contract under the California Land Conservation Act) and a property sale during 2017. On our overall portfolio, for the year ended December 31, 2017, we recorded approximately $703,000 of aggregate real estate taxes related to certain of our farms, as compared to approximately $488,000 for the prior year.
Other Operating Expenses
51
Acquisition-related expenses generally consist of legal fees and fees incurred for third-party reports prepared in connection with potential acquisitions and the related due diligence analyses. Acquisition-related expenses decreased for the year ended December 31, 2017, as compared to the prior year, primarily due to the difference in accounting treatment of such expenses incurred in connection with the properties acquired during each of the respective periods or expected to be acquired in the near future (i.e., acquisition costs are capitalized under ASC 360 if the acquisition is considered an asset acquisition, whereas such costs are expensed under ASC 805 if the acquisition is treated as a business combination). With our adoption of ASU 2017-01, as defined in Note 2, “Summary of Significant Accounting Policies—Recently-Issued Accounting Pronouncements,” in the notes to our accompanying consolidated financial statements, we anticipate that most of our acquisitions will be treated as asset acquisitions, which will result in lower acquisition-related expenses, as the majority of these costs will be capitalized and included as part of the fair value allocation of the purchase price. As of December 31, 2017, we have capitalized approximately $41,000 of acquisition-related costs (which costs were incurred during the year ended December 31, 2017) related to farms we expect to acquire during the six months ending June 30, 2018, as these acquisitions are reasonably assured to be completed and are expected to be treated as asset acquisitions. These costs are included in Other assets, net on the accompanying Consolidated Balance Sheet as of December 31, 2017.
The aggregate net fees to our Adviser, including both the management and incentive fees and any credits to those fees, increased for the year ended December 31, 2017, as compared to the prior year. For the year ended December 31, 2017, the gross management fee increased by approximately $499,000, primarily due to additional common equity raised since January 1, 2016. From January 1, 2016, through December 31, 2017, we have raised approximately $39.9 million of net proceeds (net of both direct costs and allocated indirect costs) through follow-on common stock offerings and our ATM Program, increasing the base on which the management fee is calculated, which, until March 31, 2017, was the book value of our common stockholders' equity. Pursuant to the Amended Advisory Agreement, which became effective beginning with the three months ended June 30, 2017, the base on which the management fee is calculated was adjusted to include, among other items, the balance of non-controlling interests in our operating partnership, which further increased the management fee recorded for the year ended December 31, 2017. Our Adviser also earned incentive fees during each of the years ended December 31, 2017 and 2016, due to our Pre-Incentive Fee FFO exceeding the required hurdle rate of the equity base applicable to each period (which was total stockholders' equity through March 31, 2017, under our Prior Advisory Agreement; and, beginning with the three months ended June 30, 2017, was Total Adjusted Equity (which includes non-controlling interests in the Operating Partnership) under our Amended Advisory Agreement). The incentive fees earned by our Adviser (net of credits) for the year ended December 31, 2017, increased by approximately $284,000, compared to the prior year, primarily due to increased rental revenues earned on properties acquired during and subsequent to the year ended December 31, 2016, outpacing the operating expenses (other than depreciation and amortization expense) incurred on such properties. The credit to the incentive fee of $54,000 that was recorded for year ended December 31, 2017, represents an irrevocable waiver granted by our Adviser. See “Our Adviser and Administrator—Amended Advisory Agreement” above for further discussion on changes to the compensation terms stipulated in the Amended Advisory Agreement.
The administration fee paid to our Administrator increased for the year ended December 31, 2017, as compared to the prior year, primarily due to higher overall costs incurred by our Administrator and us using a higher share of our Administrator’s resources in relation to those used by other funds and affiliated companies serviced by our Administrator during the year ended December 31, 2017.
General and administrative expenses increased for the year ended December 31, 2017, as compared to the prior year. This increase was primarily driven by the following factors: (i) increased accounting fees (due to additional expenses related to new acquisitions and higher tax preparation fees caused by having to file additional tax returns for our Operating Partnership); (ii) additional costs associated with the implementation of a new accounting system (which was completed during the three months ended June 30, 2016); (iii) increased marketing and advertising efforts during the current year; (iv) an increase in bad debt expense, as we wrote off approximately $150,000 of deferred rent asset balances during the year ended December 31, 2017, related to two early lease terminations (each of the properties were immediately re-leased with new tenants without incurring any downtime), compared to approximately $85,000 of deferred rent asset balances written off due to an early lease termination during the prior year; and (v) during the year ended December 31, 2017, we wrote off approximately $46,000 of unallocated costs associated with the initial filing of our prior universal registration statement on Form S-3 (File No. 333-194539) (the “2014 Registration Statement”), which was replaced with the 2017 Registration Statement.
Other Income (Expense)
Other income, which consists primarily of interest patronage received from Farm Credit and interest earned on short-term investments, increased for the year ended December 31, 2017, as compared to the prior year, primarily driven by additional interest patronage received from Farm Credit (due to increased borrowings from Farm Credit). During the year ended December 31, 2017, we recorded approximately $183,000 of interest patronage from Farm Credit related to interest accrued during 2016, compared to $94,000 of interest patronage recorded during the prior year. The receipt of this interest patronage
52
resulted in a 17.2% decrease in our effective interest rate on our aggregate borrowings from Farm Credit during the year ended December 31, 2016.
Interest expense increased for the year ended December 31, 2017, as compared to the prior year, primarily due to increased overall borrowings. The weighted-average principal balance of our aggregate borrowings (excluding our Series A Term Preferred Stock) outstanding for the year ended December 31, 2017, was approximately $273.6 million, as compared to approximately $176.7 million for the prior year. Including interest patronage received on certain of our Farm Credit borrowings, the overall effective interest rate charged on our aggregate borrowings (excluding the impact of deferred financing costs) was 3.31% for the year ended December 31, 2017, as compared to 3.21% for the prior year.
During the year ended December 31, 2017, we paid aggregate distributions on our Series A Term Preferred Stock (which distributions are treated similar to interest expense) of approximately $1.8 million, as compared to approximately $677,000 for the year ended December 31, 2016. The offering of the Series A Term Preferred Stock was completed in August 2016.
During the year ended December 31, 2017, we recognized a net loss of approximately $21,000 on the disposal of real estate assets. This net loss was composed of the following items: (i) an aggregate loss of approximately $106,000 due to the removal of certain blueberry bushes owned by us that were removed to allow for the planting of new varieties and the abandonment of one well, and (ii) the sale of Colding Loop, which resulted in a net gain of approximately $85,000.
A comparison of our operating results for the years ended December 31, 2016 and 2015 is below (dollars in thousands):
For the Years Ended December 31, | ||||||||||||||
2016 | 2015 | $ Change | % Change | |||||||||||
Operating revenues: | ||||||||||||||
Rental revenues | $ | 17,306 | $ | 11,888 | $ | 5,418 | 45.6% | |||||||
Tenant recovery revenue | 11 | 13 | (2 | ) | (15.4)% | |||||||||
Total operating revenues | 17,317 | 11,901 | 5,416 | 45.5% | ||||||||||
Operating expenses: | ||||||||||||||
Depreciation and amortization | 5,187 | 3,113 | 2,074 | 66.6% | ||||||||||
Property operating expenses | 787 | 803 | (16 | ) | (2.0)% | |||||||||
Acquisition-related expenses | 246 | 467 | (221 | ) | (47.3)% | |||||||||
Management and incentive fees, net of fee credits | 1,892 | 1,022 | 870 | 85.1% | ||||||||||
Administration fee | 771 | 680 | 91 | 13.4% | ||||||||||
General and administrative | 1,378 | 1,247 | 131 | 10.5% | ||||||||||
Total operating expenses, net of fee credits | 10,261 | 7,332 | 2,929 | 39.9% | ||||||||||
Operating income | 7,056 | 4,569 | 2,487 | 54.4% | ||||||||||
Other income (expense) | ||||||||||||||
Other income | 109 | 49 | 60 | 122.4% | ||||||||||
Interest expense | (6,015 | ) | (4,160 | ) | (1,855 | ) | 44.6% | |||||||
Distributions attributable to mandatorily-redeemable preferred stock | (677 | ) | — | (677 | ) | NM | ||||||||
Property and casualty recovery, net | — | 97 | (97 | ) | (100.0)% | |||||||||
Gain on disposals of real estate assets, net | — | 14 | (14 | ) | (100.0)% | |||||||||
Total other expense | (6,583 | ) | (4,000 | ) | (2,583 | ) | 64.6% | |||||||
Net income | 473 | 569 | (121 | ) | 21.3% | |||||||||
Net income attributable to non-controlling interests | (25 | ) | — | (25 | ) | NM | ||||||||
Net income attributable to the Company | $ | 448 | $ | 569 | $ | (121 | ) | 21.3% | ||||||
NM = Not Meaningful
Operating Revenues
Same-property Analysis (dollars in thousands)
53
Rental Revenues: | For the Years Ended December 31, | |||||||||||||
2016 | 2015 | $ Change | % Change | |||||||||||
Same-property basis | $ | 10,108 | $ | 9,707 | $ | 401 | 4.1% | |||||||
Properties acquired during prior-year period | 4,340 | 1,975 | 2,365 | 119.7% | ||||||||||
Properties acquired subsequent to prior-year period | 2,636 | — | 2,636 | — | ||||||||||
Disposed of, vacant, or self-operated properties | 222 | 206 | 16 | 7.8% | ||||||||||
$ | 17,306 | $ | 11,888 | $ | 5,418 | 45.6% | ||||||||
Rental revenues on a same-property basis increased for the year ended December 31, 2016, as compared to the prior year, by 4.1%. This increase was primarily a result of our ability to renew existing leases at higher rental rates and earning additional revenue on capital improvements constructed on certain properties. Rental revenues from acquired properties increased for the year ended December 31, 2016, as compared to the prior year, due to the additional revenues recorded from owning the 11 farms we acquired during the year ended December 31, 2015, for the full year in 2016, coupled with additional revenues earned from the 15 new farms we acquired during the year ended December 31, 2016. Rental revenues from disposed of, vacant, or self-operated properties increased for the year ended December 31, 2016, as compared to the prior year, due to a decrease in the number of aggregate property-vacant days during the year ended December 31, 2016, as compared to the prior year.
Other Operating Revenues
Tenant recovery revenue represents real estate taxes and insurance premiums paid on certain of our properties that, per the leases, are required to be reimbursed by the tenant. Corresponding amounts were also recorded as property operating expenses during the respective periods.
Operating Expenses
Same-property Analysis (dollars in thousands)
Depreciation and amortization: | For the Years Ended December 31, | |||||||||||||
2016 | 2015 | $ Change | % Change | |||||||||||
Same-property basis | $ | 2,201 | $ | 2,240 | $ | (39 | ) | (1.7)% | ||||||
Properties acquired during prior-year period | 1,377 | 721 | 656 | 91.0% | ||||||||||
Properties acquired subsequent to prior-year period | 1,463 | — | 1,463 | — | ||||||||||
Disposed of, vacant, or self-operated properties | 146 | 152 | (6 | ) | (3.9)% | |||||||||
$ | 5,187 | $ | 3,113 | $ | 2,074 | 66.6% | ||||||||
Depreciation and amortization expense on a same-property basis decreased for the year ended December 31, 2016, as compared to the prior year, primarily as a result of certain lease intangible amortization periods expiring during 2015 and 2016, partially offset by additional depreciation on site improvements completed on certain properties during 2016. Depreciation and amortization expense on acquired properties increased for the year ended December 31, 2016, as compared to the prior year, due to the additional depreciation and amortization expense recorded from owning the 11 farms we acquired during the year ended December 31, 2015, for the full year in 2016, coupled with the additional depreciation and amortization expense incurred on the 15 new farms we acquired during the year ended December 31, 2016. Depreciation and amortization expense on disposed of, vacant, or self-operated properties decreased for the year ended December 31, 2016, as compared to the prior year, due to writing off a larger amount of unamortized leasing intangibles during the year ended December 31, 2015, as compared to the current year, in connection with early lease termination.
Property operating expenses: | For the Years Ended December 31, | |||||||||||||
2016 | 2015 | $ Change | % Change | |||||||||||
Same-property basis | $ | 593 | $ | 731 | $ | (138 | ) | (18.9)% | ||||||
Properties acquired during prior-year period | 165 | 53 | 112 | 211.3% | ||||||||||
Properties acquired subsequent to prior-year period | 11 | — | 11 | — | ||||||||||
Disposed of, vacant, or self-operated properties | 18 | 19 | (1 | ) | (5.3)% | |||||||||
$ | 787 | $ | 803 | $ | (16 | ) | (2.0)% | |||||||
Property operating expenses consist primarily of real estate taxes, repairs and maintenance expense, insurance expense, and other miscellaneous operating expenses paid for certain of our properties. Property operating expenses on a same-property basis decreased by approximately $138,000 for the year ended December 31, 2016, as compared to the prior year, primarily due
54
to a decrease in aggregate property tax expense on those properties, as two partial-net leases converted to pure, triple-net leases during year ended December 31, 2015, and, beginning in 2016, certain other properties were entered into land conservation contracts under the California Land Conservation Act, restricting the land to agricultural use and reducing the property tax assessments on those properties. Property operating expenses on acquired properties increased for the year ended December 31, 2016, as compared to the prior year, primarily due to additional property taxes owed on certain of the farms we acquired during and subsequent to the year ended December 31, 2015. Property operating expenses on disposed of, vacant, or self-operated properties remained relatively flat year-over-year. On our overall portfolio, for the year ended December 31, 2016, we recorded approximately $488,000 of aggregate real estate taxes related to certain of our farms, which included the recognition of certain prior-year supplemental taxes as a result of stepped-up tax assessments of those properties after our acquisitions of them, as compared to approximately $574,000 for the prior year.
Other Operating Expenses
Acquisition-related expenses generally consist of legal fees and fees incurred for third-party reports prepared in connection with potential acquisitions and the related due diligence analyses. Acquisition-related expenses decreased for the year ended December 31, 2016, as compared to the prior year, primarily due to the difference in accounting treatment of such expenses incurred in connection with the properties acquired during each of the respective periods (i.e., acquisition costs are capitalized under ASC 360 if the acquisition is considered an asset acquisition, whereas such costs are expensed under ASC 805 if the acquisition is treated as a business combination). We also incurred additional state document stamp taxes on deed transfers incurred in connection with the acquisition of certain properties during the prior year.
The aggregate net fees to our Adviser, including both the management and incentive fees and any credits to those fees, increased for the year ended December 31, 2016, as compared to the prior year. For the year ended December 31, 2016, the gross management fee increased by approximately $199,000, primarily due to additional common equity raised over the past two years. From March 31, 2015, through December 31, 2016, we raised approximately $21.9 million of net proceeds (net of both direct costs and allocated indirect costs) through follow-on common stock offerings and our ATM Program, increasing the base (the book value of our common stockholders' equity) on which the management fee was calculated. In addition, on a net basis, the net management fee increased for the year ended December 31, 2016, as compared to the prior year, as a result of a finder's fee of approximately $321,000 earned by our Adviser in connection with one of our acquisitions during the year ended December 31, 2015, which the Adviser applied as a credit to the management fee (as an irrevocable waiver granted by our Adviser) for the year ended December 31, 2015. Our Adviser also earned an incentive fee of approximately $350,000 during the year ended December 31, 2016, due to our Pre-Incentive Fee FFO exceeding the required hurdle rate of our total stockholders' equity, as stipulated in the Prior Advisory Agreement. The increase in our Pre-Incentive Fee FFO was primarily due to increased rental revenues earned on properties acquired during and subsequent to the year ended December 31, 2015, outpacing the operating expenses (other than depreciation and amortization expense) incurred on such properties. No incentive fee was earned during the prior year.
The administration fee paid to our Administrator increased for the year ended December 31, 2016, as compared to the prior year, primarily due to higher overall costs incurred by our Administrator and us using a higher share of our Administrator’s resources in relation to those used by other funds and affiliated companies serviced by our Administrator during the year ended December 31, 2016.
General and administrative expenses increased for the year ended December 31, 2016, as compared to the prior year, primarily as a result of additional legal costs incurred related to obtaining certain permits on one of our California properties and completing the settlement of an eminent domain lawsuit on another of our California properties, increased accounting fees related to a higher volume of acquisitions during the current year, additional costs associated with updating the valuations of certain of our farms, and additional advertising and marketing expenses incurred during the current year. In addition, during the years ended December 31, 2016 and 2015, we wrote off approximately $85,000 and $32,000, respectively, of deferred rent asset balances related to leases on two of our properties that were terminated prior to their expirations and subsequently re-leased to new tenants. These increases were partially offset by lower overhead insurance expense.
Other Income (Expense)
Other income, which consists primarily of interest patronage received from Farm Credit, interest earned on short-term investments, and state income tax refunds, increased for the year ended December 31, 2016, as compared to the prior year, primarily driven by additional interest patronage received from Farm Credit (due to increased borrowings from Farm Credit). During the year ended December 31, 2016, we recorded approximately $94,000 of interest patronage from Farm Credit related to interest accrued during 2015, compared to $15,000 of interest patronage recorded during the prior year. The receipt of this interest patronage resulted in a 16.1% decrease in our effective interest rate on our aggregate borrowings from Farm Credit during the year ended December 31, 2016.
55
Interest expense increased for the year ended December 31, 2016, as compared to the prior year, primarily due to increased overall borrowings. The weighted-average principal balance of our aggregate borrowings (excluding our Series A Term Preferred Stock) outstanding for the year ended December 31, 2016, was approximately $176.6 million, as compared to $118.3 million for the prior year. Including interest patronage received on our Farm Credit borrowings, the overall effective interest rate charged on our aggregate borrowings (excluding the impact of deferred financing costs) was 3.22% for the year ended December 31, 2016, as compared to 3.42% for the prior year.
During the year ended December 31, 2016, we paid aggregate distributions on our Series A Term Preferred Stock (which distributions are treated as a component of interest expense) of approximately $677,000. There was no Series A Term Preferred Stock outstanding during 2015.
During the year ended December 31, 2015, we received additional insurance proceeds as a result of a fire on one of our properties in California. This claim was closed during the year ended September 30, 2015. There were no claims during the year ended December 31, 2016.
During the year ended December 31, 2015, we executed an agreement for a perpetual right-of-way easement to allow for the installation of a natural gas pipeline underneath approximately 2.6 nonfarmable acres on one of our properties. In return, we received $17,021 of gross consideration, of which $14,483 was recognized as a capital gain during the year ended December 31, 2015. No property sales or disposals occurred during the year ended December 31, 2016.
LIQUIDITY AND CAPITAL RESOURCES
Overview
Since our IPO in January 2013, we have invested approximately $415.8 million into 63 new farms, and we have expended or accrued an additional $18.3 million for capital improvements on existing properties. Our current short- and long-term sources of funds include cash and cash equivalents, cash flows from operations, borrowings (including the undrawn commitments available under the MetLife Facility and the Farmer Mac Facility), and issuances of additional equity securities. Our current available liquidity is approximately $7.9 million, consisting of $3.3 million in cash and, based on the current level of collateral pledged, $4.6 million of availability under the MetLife Facility, subject to compliance with covenants.
As of December 31, 2017, our total-debt-to-total-capitalization ratio (including our Series A Term Preferred Stock as debt), at book value, was 73.6%, which is up from 72.8% as of December 31, 2016. However, on a fair value basis, our total-debt-to-total-capitalization ratio (including our Series A Term Preferred Stock as debt) as of December 31, 2017, was 61.1%, which is up from 59.3% as of December 31, 2016 (see “Non-GAAP Financial Information—Net Asset Value” below for an explanation of our fair value process).
Future Capital Needs
Our short- and long-term liquidity requirements consist primarily of making distributions to stockholders (including non-controlling OP Unitholders) to maintain our qualification as a REIT, funding our general operating costs, making principal and interest payments on outstanding borrowings, making dividend payments on our Series A Term Preferred Stock (and on our Series B Preferred Stock, if and when shares are sold), and, as capital is available, funding new farmland and farm-related property acquisitions consistent with our investment strategy.
We believe that our current and short-term cash resources will be sufficient to fund our distributions to stockholders (including non-controlling OP Unitholders), service our debt, pay dividends on our Series A Term Preferred Stock (and on our Series B Preferred Stock, if and when shares are sold), and fund our current operating costs in the near term. We expect to meet our long-term liquidity requirements through various sources of capital, including future equity issuances (including, but not limited to, shares of common stock through our ATM Program, OP Units through our Operating Partnership as consideration for future acquisitions, and sales of shares of our Series B Preferred Stock), long-term mortgage indebtedness and bond issuances, and other secured and unsecured borrowings.
We intend to use a significant portion of any current and future available liquidity to purchase additional farms and farm-related properties. We continue to actively seek and evaluate acquisitions of additional farms and farm-related properties that satisfy our investment criteria, and our pipeline of potential acquisitions remains healthy. We currently have two properties under signed purchase and sale agreements for an aggregate proposed purchase price of approximately $21.1 million (a portion of which is expected to be paid in OP Units), which we expect to be consummated during the six months ending June 30, 2018. We currently have access to the capital required to complete these transactions for the proposed purchase price amounts; however, we continue to explore various options for access to additional capital, as evidenced by our recent launch of a continuous offering of the Series B Preferred Stock. We also have many other properties that are in various other stages of our due diligence process, including several properties under signed, non-binding letters of intent. However, all potential
56
acquisitions will be subject to our due diligence investigation of such properties, and there can be no assurance that we will be successful in identifying or acquiring any properties in the future.
Cash Flow Resources
The following table summarizes total cash flows for operating, investing, and financing activities for the years ended December 31, 2017 and 2016:
2017 | 2016 | Change ($) | Change (%) | ||||||||||
Net change in cash from: | |||||||||||||
Operating activities | $ | 6,515 | $ | 8,403 | $ | (1,888 | ) | (22.5)% | |||||
Investing activities | (129,645 | ) | (95,501 | ) | (34,144 | ) | (35.8)% | ||||||
Financing activities | 123,630 | 87,003 | 36,627 | 42.1% | |||||||||
Net Change in Cash and cash equivalents | $ | 500 | $ | (95 | ) | $ | 595 | (626.3)% | |||||
Operating Activities
The majority of cash from operating activities is generated from the rental payments we receive from our tenants, which is first used to fund our property-level operating expenses, with any excess cash being primarily used for principal and interest payments on our borrowings, management fees to our Adviser, administrative fees to our Administrator, and other corporate-
level expenses. The decrease in cash provided by operating activities during the year ended December 31, 2017, as compared to the prior year, was primarily due to the following: (i) the receipt of two years of prepaid rent upon the closing of the three farms we acquired during the three months ended March 31, 2016 (approximately $1.6 million of which prepaid rent related to cash rent earned during the year ended December 31, 2017), and (ii) approximately $1.3 million of costs paid during the three months ended December 31, 2017, in connection with the initial operations on the farm in California that is leased to our TRS, which costs have been deferred and will be expensed throughout the first half of 2018 as the crops are sold. These decreases were partially offset by additional rental payments received from farms we have acquired since December 31, 2016.
Investing Activities
The increase in cash used in investing activities during the year ended December 31, 2017, as compared to the prior year, was primarily due to an increase in cash paid for acquisitions of new farms during the year ended December 31, 2017, which exceeded that of the prior year by approximately $43.2 million. This increase was partially offset by proceeds received from the sale of one property and a decrease of approximately $4.5 million in cash paid for capital improvements made on existing properties during the year ended December 31, 2017, as compared to the prior year.
Financing Activities
The increase in cash provided by financing activities during the year ended December 31, 2017, as compared to the prior year, was primarily due to approximately $39.9 million of aggregate net cash proceeds received from two overnight common stock offerings and additional issuances of common stock under our ATM Program during the year ended December 31, 2017, and increased net borrowings, as our net borrowings for the year ended December 31, 2017, increased by approximately $28.2 million over that of the prior year. These increases were partially offset by the receipt of approximately $27.6 million of net proceeds from the issuance of our Series A Term Preferred Stock during the prior year.
Debt Capital
MetLife Facility
As amended on December 15, 2017, the MetLife Facility consists of a total of $200.0 million of term notes and $75.0 million of revolving equity lines of credit. In aggregate, we currently have approximately $128.9 million outstanding under the term notes that bear interest at a fixed rate of 3.30% per annum (which rate is fixed until January 5, 2027) and $16.0 million outstanding under the lines of credit that currently bear interest at 3.95% (which rate is variable). While approximately $122.5 million of the full commitment amount under the MetLife Facility remains undrawn (including approximately $7.6 million of aggregate amortizing principal payments made on the term notes), based on the current level of collateral pledged, we currently have approximately $4.6 million of availability under the MetLife Facility.
57
Farmer Mac
As amended on June 16, 2016, our agreement with Federal Agricultural Mortgage Corporation (“Farmer Mac”) provides for bond issuances up to an aggregate amount of $125.0 million (the “Farmer Mac Facility”). To date, we have issued aggregate bonds of approximately $85.9 million under the Farmer Mac Facility, and we currently have $84.5 million outstanding that bear interest at a weighted-average interest rate of 3.13% (which rates are fixed throughout the bonds' respective terms) and have a weighted-average maturity date of June 2021. While approximately $39.1 million of the full commitment balance remains undrawn, we currently have no additional availability under the Farmer Mac Facility based on the current level of collateral pledged. However, we expect to pledge certain potential new property acquisitions as collateral under the Farmer Mac Facility to utilize some or all of this remaining commitment balance. If we have not issued bonds such that the aggregate bond issuances total $125.0 million by December 11, 2018, Farmer Mac has the option to be relieved of its obligation to purchase additional bonds under this facility. We are currently in discussions with Farmer Mac to both expand the size of the facility and extend the borrowing period.
Farm Credit
Since September 19, 2014, we have closed on 16 separate loans with five different Farm Credit associations (including Farm Credit CFL, Farm Credit West, CF Farm Credit, Farm Credit FL, and NW Farm Credit, each as defined in Note 4, “Borrowings,” in the notes to our accompanying consolidated financial statements) for an aggregate amount of approximately $68.3 million (the “Farm Credit Notes Payable”). We currently have approximately $61.3 million outstanding under the Farm Credit Notes Payable that bear interest at an expected weighted-average effective interest rate (net of expected interest patronage) of 3.43% (which rates are fixed, on a weighted-average basis, until July, 2023) and have a weighted-average maturity date of June, 2031. While we do not currently have any additional availability under any of our Farm Credit programs based on the properties currently pledged as collateral, we expect to enter into additional borrowing agreements with existing and new Farm Credit associations in connection with certain potential new acquisitions in the future.
Equity Capital
Since January 1, 2017, through the date of this filing, we have completed two separate overnight common stock offerings and have also issued shares of common stock through our ATM Program. In the aggregate, through these transactions, we have issued and sold a total of 3,616,414 shares of our common stock for gross proceeds of approximately $43.2 million and net proceeds, after deducting underwriting discounts and offering expenses borne by us, of approximately $41.1 million.
The 2017 Registration Statement permits us to issue up to an aggregate of $300.0 million in securities (including approximately $29.3 million originally reserved for issuance under our ATM Program and up to $162.5 million reserved for issuance of shares of our Series B Preferred Stock), consisting of common stock, preferred stock, warrants, debt securities, depository shares, subscription rights, and units, including through separate, concurrent offerings of two or more of such securities. To date, we have issued approximately $22.5 million of common stock (including approximately $8.4 million through our ATM Program) and have registered $162.5 million of Series B Preferred Stock under the 2017 Registration Statement.
On January 10, 2018, we launched a continuous public offering of up to (including the Primary Offering and the DRIP) $162.5 million of our newly-designated Series B Preferred Stock, which will be offered on a “reasonable best efforts” basis by Gladstone Securities. However, as of the date of this filing, no shares of our Series B Preferred Stock have been sold, and there can be no guarantee with regard to how many shares will be sold, if any.
In addition, we have the ability to, and expect to in the future, issue additional OP Units to third parties as consideration in future property acquisitions.
58
Contractual Obligations and Off-Balance Sheet Arrangements
Contractual Obligations
The following table presents a summary of our material contractual obligations as of December 31, 2017:
Payments Due During the Fiscal Years Ending December 31, | ||||||||||||||||||||
Contractual Obligations | Total | 2018 | 2019 – 2020 | 2021 – 2022 | 2023+ | |||||||||||||||
Debt obligations(1) | $ | 292,988 | $ | 23,434 | $ | 37,560 | $ | 43,800 | $ | 188,194 | ||||||||||
Interest on debt obligations(2) | 81,503 | 10,480 | 19,456 | 16,907 | 34,660 | |||||||||||||||
Series A Term Preferred Stock(3) | 28,750 | — | — | 28,750 | — | |||||||||||||||
Series A Term Preferred Stock Dividends(3) | 6,885 | 1,836 | 3,672 | 1,377 | — | |||||||||||||||
Operating obligations(4) | 6,149 | 3,969 | 1,843 | 337 | — | |||||||||||||||
Operating lease obligations(5) | 279 | 47 | 94 | 77 | 61 | |||||||||||||||
Total | $ | 416,554 | $ | 39,766 | $ | 62,625 | $ | 91,248 | $ | 222,915 | ||||||||||
(1) | Debt obligations include all borrowings (consisting of mortgage notes and bonds payable and borrowings under our lines of credit) outstanding as of December 31, 2017. Maturity dates of these debt obligations range from July 2018 to November 2041. |
(2) | Interest on debt obligations includes estimated interest on our MetLife Lines of Credit. The balances and interest rates on our MetLife Lines of Credit are variable, thus the amounts of interest calculated for purposes of this table were based upon the balance and interest rates in place as of December 31, 2017. |
(3) | Our Series A Term Preferred Stock has a mandatory redemption date of September 30, 2021, and the related dividend payments are treated similar to interest expense on the accompanying Consolidated Statements of Operations. |
(4) | Operating obligations represent commitments outstanding as of December 31, 2017. See Note 8, “Commitments and Contingencies,” in the notes to our accompanying consolidated financial statements for further discussion on each of these operating obligations. |
(5) | Operating lease obligations represent ground lease payments due on two of our Arizona farms (1,368 total acres), which are leased from the State of Arizona under leases expiring in February 2022 and February 2025. |
Off-Balance Sheet Arrangements
As of December 31, 2017, we did not have any off-balance sheet arrangements.
NET ASSET VALUE
Real estate companies are required to record real estate using the historical cost basis of the real estate, adjusted for accumulated depreciation and amortization, and, as a result, the carrying value of the real estate does not typically change as the fair value of the assets change. Thus, one challenge is determining the fair value of the real estate in order to allow stockholders to see the value of the real estate increase or decrease over time, which we believe is useful to our investors.
Determination of Fair Value
Our Board of Directors reviews and approves the valuations of our properties pursuant to a valuation policy approved by our Board of Directors (the “Valuation Policy”). Such review and approval occurs in three phases: (i) prior to its quarterly meetings, the Board of Directors receives written valuation recommendations and supporting materials that are provided by professionals of the Adviser and Administrator, with oversight and direction from the chief valuation officer, who is also employed by the Administrator (collectively, the “Valuation Team”); (ii) the valuation committee of the Board of Directors (the “Valuation Committee”), which is comprised entirely of independent directors, meets to review the valuation recommendations and supporting materials; and (iii) after the Valuation Committee concludes its meeting, it and the chief valuation officer present the Valuation Committee’s findings to the entire Board of Directors so that the full Board of Directors may review and approve the fair values of our properties in accordance with the Valuation Policy. Further, on a quarterly basis, the Board of Directors reviews the Valuation Policy to determine if changes thereto are advisable and also reviews whether the Valuation Team has applied the Valuation Policy consistently.
Per the Valuation Policy, our valuations are derived based on the following:
• | For properties acquired within 12 months prior to the date of valuation, the purchase price of the property will generally be used as the current fair value unless overriding factors apply. In situations where OP Units are issued as partial or whole consideration in connection with the acquisition of a property, the fair value of the property will generally be the lower of: (i) the agreed-upon purchase price between the seller and the buyer (as shown in the purchase and sale agreement or contribution agreement and using the agreed-upon pricing of the OP Units, if applicable), or (ii) the value as determined by an independent, third-party appraiser. |
59
• | For real estate we acquired more than one year prior to the date of valuation, we determine the fair value either by relying on estimates provided by independent, third-party appraisers or through an internal valuation process. In addition, if significant capital improvements take place on a property, we will typically have those properties reappraised upon completion of the project by an independent, third-party appraiser. In any case, we intend to have each property valued by an independent, third-party appraiser at least once every three years, with interim values generally being determined by our internal valuation process. |
Various methodologies were used, both by the appraisers and in our internal valuations, to determine the fair value of our real estate on a fee simple, “As Is” basis, including the sales comparison, income capitalization (or a discounted cash flow analysis), and cost approaches of valuation. In performing their analyses, the appraisers typically (i) performed site visits to the properties, (ii) discussed each property with our Adviser and reviewed property-level information, including, but not limited to, property operating data, prior appraisals (as available), existing lease agreements, farm acreage, location, access to water and water rights, potential for future development, and other property-level information, and (iii) reviewed information from a variety of sources about regional market conditions applicable to each of our properties, including, but not limited to, recent sale prices of comparable farmland, market rents for similar farmland, estimated marketing and exposure time, market capitalization rates, and the current economic environment, among others. In performing our internal valuations, we will consider the most recent appraisal available and use similar methodologies in determining an updated fair value. We will also obtain updated market data related to the property, such as updated sales and market rent comparisons and market capitalization rates, and perform an updated assessment of the tenants’ credit risk profiles, among others. Sources of this data may come from market inputs from recent acquisitions of our own portfolio of farmland real estate, recent appraisals of properties we own that are similar in nature and in the same region (as applicable) as the property being valued, market conditions, trends we observe in our general due diligence process, and conversations with appraisers, brokers, and farmers.
A breakdown of the methodologies used to value our properties and the aggregate value as of December 31, 2017, determined by each method is shown in the table below (dollars in thousands, except in footnotes):
Valuation Method | Number of Farms | Total Acres | Farm Acres | Net Cost Basis(1) | Current Fair Value | % of Total Fair Value | ||||||||||
Purchase Price | 16 | 12,641 | 11,180 | $ | 130,518 | $ | 128,672 | 24.1% | ||||||||
Internal Valuation | 12 | 12,462 | 9,685 | 80,048 | 128,763 | (2) | 24.2% | |||||||||
Third-party Appraisal(3) | 45 | 37,911 | 30,029 | 241,298 | 275,862 | 51.7% | ||||||||||
Total | 73 | 63,014 | 50,894 | $ | 451,864 | $ | 533,297 | 100.0% | ||||||||
(1) | Consists of the initial acquisition price (including the costs allocated to both tangible and intangible assets acquired and liabilities assumed), plus subsequent improvements and other capitalized costs paid for by us that were associated with the properties, and adjusted for accumulated depreciation and amortization. |
(2) | 98.6% of these valuations, or approximately $126.9 million, are supported by values determined by third-party appraisals performed between August 2015 and June 2016. The difference of approximately $1.8 million represents the net appreciation of those properties since the time of such appraisals, as determined according with our Valuation Policy. |
(3) | Appraisals performed between March 2017 and December 2017. |
Some of the significant assumptions used by appraisers and the Valuation Team in valuing our portfolio as of December 31, 2017, include land values per farmable acre, market rental rates per farmable acre, and capitalization rates, among others. These assumptions were applied on a farm-by-farm basis and were selected based on several factors, including comparable land sales, surveys of both existing and current market rates, discussions with other brokers and farmers, soil quality, size, location, and other factors deemed appropriate. A summary of these significant assumptions is provided in the following table:
Appraisal Assumptions | Internal Valuation Assumptions | |||||||||||
Range (Low - High) | Weighted Average | Range (Low - High) | Weighted Average | |||||||||
Land Value (per farmable acre) | $815 – $103,000 | $ | 38,113 | $4,123 – $105,000 | $ | 50,790 | ||||||
Market Rent (per farmable acre) | $20 – $4,864 | $ | 1,837 | $215 – $3,700 | $ | 1,927 | ||||||
Market Capitalization Rate | 1.14% – 5.49% | 4.29% | 3.12% – 5.87% | 0.04% | ||||||||
Note: | Figures in the above table apply only to the farmland portion of our portfolio and exclude assumptions made relating to farm-related property, such as cooling facilities and box barns, and other structures on our properties, including residential housing and horticulture, as their aggregate value was considered to be insignificant in relation to that of the farmland. |
Our Valuation Team reviews the appraisals, including the significant assumptions and inputs used in determining the appraised values, and considers any developments that may have occurred since the time the appraisals were performed. Developments considered that may have an impact on the fair value of our real estate include, but are not limited to, changes in tenant credit profiles; changes in lease terms (such as expirations and notices of non-renewals or to vacate), and potential asset sales, particularly those at prices significantly different from the appraised values of our properties.
60
Management believes that the purchase prices of the farms acquired during the previous 12 months, the most recent appraisals available for the farms acquired prior to the previous 12 months that were not valued internally, and the farms that were valued internally during the previous 12 months fairly represent the current market values of the properties as of December 31, 2017, and, accordingly, did not make any adjustment to these values.
A quarterly roll-forward of the change in our portfolio value for the three months ended December 31, 2017, from the prior value basis as of September 30, 2017, is provided in the table below (dollars in thousands):
Total portfolio fair value as of September 30, 2017 | $ | 531,664 | ||||||
Plus: Acquisition of two new farms during the three months ended December 31, 2017 | 6,825 | |||||||
Less: Sale of one farm during the three months ended December 31, 2017(1) | (4,500 | ) | ||||||
Plus net value appreciation (depreciation) during the three months ended December 31, 2017: | ||||||||
One farm valued internally | $ | (368 | ) | |||||
Four farms valued via third-party appraisals | (324 | ) | ||||||
Total net depreciation for the three months ended December 31, 2017 | (692 | ) | ||||||
Total portfolio fair value as of December 31, 2017 | $ | 533,297 | ||||||
(1) | Farm was sold for $3.9 million. |
Management also determined fair values of all of its long-term borrowings. Using a discounted cash flow analysis, management determined that the fair value of all long-term encumbrances on our properties as of December 31, 2017, was approximately $284.8 million, as compared to a carrying value (excluding unamortized related debt issuance costs) of approximately $293.0 million. In addition, using the closing stock price as of December 31, 2017, the fair value of the Series A Term Preferred Stock was determined to be approximately $29.7 million, as compared to a carrying value (excluding unamortized related issuance costs) of approximately $28.8 million.
Calculation of Estimated Net Asset Value
To provide our stockholders with an estimate of the fair value of our real estate assets, we intend to estimate the fair value of our farm properties, expressed in terms of net asset value (“NAV”), and provide that to our stockholders on a quarterly basis. NAV is a non-GAAP, supplemental measure of financial position of an equity REIT and is calculated as total equity, adjusted for the increase or decrease in fair value of our real estate assets and long-term borrowings (including any preferred stock required to be treated as debt for GAAP purposes) relative to their respective costs bases. Further, we calculate NAV per common share by dividing NAV by our total common shares outstanding (consisting of our common stock and OP Units held by non-controlling limited partners). A reconciliation of NAV to total equity, which the Company believes is the most directly-comparable GAAP measure, is provided below.
The fair values presented above and their usage in the calculation of net asset value per share presented below have been prepared by, and is the responsibility of, management. PricewaterhouseCoopers LLP has neither examined, compiled nor performed any procedures with respect to the fair values or the calculation of net asset value per common share, which utilizes information that is not disclosed within the financial statements, and, accordingly, does not express an opinion or any other form of assurance with respect thereto.
As of December 31, 2017, we estimate the NAV per share to be $13.96, as detailed below (dollars in thousands, except per-share data):
61
Total equity per balance sheet | $ | 117,951 | ||||||
Fair value adjustment for long-term assets: | ||||||||
Less: net cost basis of tangible and intangible real estate holdings(1) | $ | (451,864 | ) | |||||
Plus: estimated fair value of real estate holdings(2) | 533,297 | |||||||
Net fair value adjustment for real estate holdings | 81,433 | |||||||
Fair value adjustment for long-term liabilities: | ||||||||
Plus: book value of aggregate long-term indebtedness(3) | 321,738 | |||||||
Less: fair value of aggregate long-term indebtedness(3)(4) | (314,511 | ) | ||||||
Net fair value adjustment for long-term indebtedness | 7,227 | |||||||
Estimated NAV | $ | 206,611 | ||||||
Total shares outstanding(5) | 14,799,679 | |||||||
Estimated NAV per common share | $ | 13.96 | ||||||
(1) | Per Net Cost Basis as presented in the table above. |
(2) | Per Current Fair Value as presented in the table above. |
(3) | Includes the principal balances outstanding of all long-term borrowings (consisting of mortgage notes and bonds payable) and the Series A Term Preferred Stock. |
(4) | Long-term mortgage notes and bonds payable were valued using a discounted cash flow model. The Series A Term Preferred Stock was valued based on its closing stock price as of December 31, 2017. |
(5) | Includes 13,791,574 shares of common stock and 1,008,105 OP Units held by non-controlling limited partners (representing 6.8% of all OP Units issued and outstanding as of December 31, 2017). |
A quarterly rollforward in the estimated NAV per share for the three months ended December 31, 2017, is provided below:
Estimated NAV per common share as of September 30, 2017 | $ | 14.15 | ||||||
Less net loss | (0.01 | ) | ||||||
Change due to sale of one farm(1) | (0.04 | ) | ||||||
Plus change in valuations: | ||||||||
Net change in unrealized fair value of farmland portfolio(2) | $ | (0.16 | ) | |||||
Net change in unrealized fair value of long-term indebtedness | 0.16 | |||||||
Net change in valuations | — | |||||||
Less distributions | (0.13 | ) | ||||||
Less dilutive effect of equity issuances(3) | (0.01 | ) | ||||||
Estimated NAV per common share as of December 31, 2017 | $ | 13.96 | ||||||
(1) | During the three months ended December 31, 2017, we sold one farm for $3.9 million. The farm had previously been reported (based on a third-party appraisal performed in April 2017) at a fair value of $4.5 million. At the time of the sale, the farm had a net cost basis of approximately $3.7 million. |
(2) | The net change in unrealized appreciation of farmland portfolio consists of three components: (i) a decrease of $0.05 per share due to the net depreciation in value of five farms that were valued during the three months ended December 31, 2017, (ii) an increase of $0.14 per share due to the aggregate depreciation and amortization expense recorded during the three months ended December 31, 2017, and (iii) a decrease of $0.25 per share due to capital improvements made on certain properties that have not yet been considered in the determination of the respective properties’ estimated fair values. |
(3) | Represents new shares of common stock issued through our ATM Program. During the three months ended December 31, 2017, we issued 109,674 new shares of common stock through the ATM Program at an average sales price of $13.55 per share. |
Comparison of estimated NAV and estimated NAV per common share, using the definitions above, to similarly-titled measures for other REITs, may not necessarily be meaningful due to possible differences in the calculation or application of the definition of NAV used by such REITs. In addition, the trading price of our common shares may differ significantly from our most recent estimated NAV per common share calculation. For example, while we estimated the NAV per share as of December 31, 2017, to be $13.96 per share based on the calculation above, the closing price of our common stock on December 31, 2017, was $13.43, and it has subsequently traded between $11.70 and $13.95 per share through the date of this filing.
While management believes the values presented reflect current market conditions, the ultimate amount realized on any asset will be based on the timing of such dispositions and the then-current market conditions. There can be no assurance that the ultimate realized value upon disposition of an asset will approximate the estimated fair value above.
We intend to report any adjustments to the estimated NAV, as well as to the values of our properties, in this section on a quarterly basis, but in no case less than annually. However, the determination of estimated NAV is subjective and involves a number of assumptions, judgments and estimates, and minor adjustments to these assumptions, judgments or estimates may have a material impact on our overall portfolio valuation. In addition, many of the assumptions used are sensitive to market
62
conditions and can change frequently. Changes in the market environment and other events that may occur during our ownership of these properties may cause the values reported above to vary from the actual fair value that may be obtained in the open market.
ITEM 7A. | QUANTITATIVE AND QUALITATIVE DISCLOSURES ABOUT MARKET RISK |
Market risk includes risks that arise from changes in interest rates, foreign currency exchange rates, commodity prices, equity prices, and other market changes that affect market-sensitive instruments. The primary market risk that we believe we are and will be exposed to is interest rate risk. Certain of our existing leases contain escalations based on market indices, and certain of our existing borrowings are subject to variable interest rates. Further, the interest rates on certain of our fixed-rate borrowings are either fixed for a finite period before converting to variable rate or are subject to periodic adjustments. Although we seek to mitigate this risk by structuring certain provisions into many of our leases, such as escalation clauses or adjusting the rent to prevailing market rents at two- to three-year intervals, these features do not eliminate this risk. To date, we have not entered into any derivative contracts to attempt to manage our exposure to interest rate fluctuations.
To illustrate the potential impact of changes in interest rates on our net loss for the year ended December 31, 2017, we have performed the following analysis, which approximates the annual impact that hypothetical changes in our effective LIBOR may have had on our net loss for the year ended December 31, 2017. For purposes of this analysis, we used the actual balances outstanding on our borrowings subject to variable interest rates during the year (which consisted only of our MetLife Lines of Credit) and assumed that no further actions were taken to adjust our leases than what actually occurred during the year ended December 31, 2017, to alter our existing interest rate sensitivity (dollars in thousands).
Interest Rate Changes(1) | (Decrease) Increase to Interest Expense | Net Decrease (Increase) to Net Loss | ||||||
1% Decrease to LIBOR | $ | (217 | ) | $ | 217 | |||
1% Increase to LIBOR | 244 | (244 | ) | |||||
2% Increase to LIBOR | 489 | (489 | ) | |||||
3% Increase to LIBOR | 733 | (733 | ) | |||||
(1) For the year ended December 31, 2017, our weighted-average effective LIBOR was 1.16%; therefore, a 1%, 2% or 3% decrease could not occur.
As of December 31, 2017, the fair value of our fixed-rate borrowings outstanding (excluding our Series A Term Preferred Stock), which accounted for approximately 96.7% of the aggregate principal balance of all borrowings outstanding as of December 31, 2017, was approximately $284.8 million. However, interest rate fluctuations may affect the fair value of our fixed-rate borrowings. If market interest rates had been one percentage point lower or higher than those rates in place as of December 31, 2017, the fair value of our fixed-rate borrowings would have increased or decreased by approximately $15.5 million or $14.4 million, respectively.
In the future, we may be exposed to additional effects of interest rate changes, primarily as a result of additional borrowings used to maintain liquidity and fund expansion of our farmland investment portfolio and operations. Our interest rate risk management objectives are to limit the impact of interest rate changes on earnings and cash flows and to lower overall borrowing costs. To achieve these objectives, we will borrow primarily at fixed rates or variable rates with the lowest margins available and, in some cases, with the ability to convert variable rates to fixed rates. We may also enter into derivative financial instruments, such as interest rate swaps and caps, to mitigate the interest rate risk on a related financial instrument. We will not enter into derivative or interest rate transactions for speculative purposes.
In addition to changes in interest rates, the fair value of our farmland portfolio is subject to fluctuations based on changes in local and regional economic conditions and changes in the creditworthiness of our tenants. Materially adverse changes in the fair value of our real estate may affect our ability to refinance our debt, if necessary.
63
ITEM 8. FINANCIAL STATEMENTS AND SUPPLEMENTARY DATA
Index to Consolidated Financial Statements
PAGE | |
Schedule III – Real Estate and Accumulated Depreciation as of December 31, 2017 | |
64
Report of Management on Internal Controls over Financial Reporting
To the Stockholders and Board of Directors of Gladstone Land Corporation:
Our management is responsible for establishing and maintaining adequate internal control over financial reporting, as such term is defined in Rule 13a-15(f) and 15d-15(f) under the Securities Exchange Act of 1934. Our internal control over financial reporting is designed to provide reasonable assurance regarding the reliability of financial reporting and the preparation of financial statements for external purposes in accordance with generally accepted accounting principles and include those policies and procedures that pertain to the maintenance of records that in reasonable detail accurately and fairly reflect our transactions and the dispositions of our assets, provide reasonable assurance that our transactions are recorded as necessary to permit preparation of financial statements in accordance with generally accepted accounting principles, and that our receipts and expenditures are being made only in accordance with appropriate authorizations; and provide reasonable assurance regarding prevention or timely detection of unauthorized acquisition, use or disposition of our assets that could have a material effect on our financial statements.
Because of its inherent limitations, internal control over financial reporting may not prevent or detect misstatements. Therefore, even those systems determined to be effective can provide only reasonable assurance with respect to financial statement preparation and presentation.
Under the supervision and with the participation of our management, we assessed the effectiveness of our internal control over financial reporting based on the framework in Internal Control—Integrated Framework (2013) issued by the Committee of Sponsoring Organizations (COSO). Based on our assessment, management concluded that our internal control over financial reporting was effective as of December 31, 2017.
February 20, 2018
65
Report of Independent Registered Public Accounting Firm
To the Stockholders and Board of Directors of Gladstone Land Corporation
Opinion on the Financial Statements
We have audited the accompanying consolidated balance sheets of Gladstone Land C0rporation and its subsidiaries as of December 31, 2017 and 2016, and the related consolidated statements of operations, equity and cash flows for each of the three years in the period ended December 31, 2017, including the related notes and financial statement schedule listed in the accompanying index (collectively referred to as the “consolidated financial statements”). In our opinion, the consolidated financial statements present fairly, in all material respects, the financial position of the Company as of December 31, 2017 and 2016, and the results of their operations and their cash flows for each of the three years in the period ended December 31, 2017 in conformity with accounting principles generally accepted in the United States of America.
Basis for Opinion
These consolidated financial statements are the responsibility of the Company's management. Our responsibility is to express an opinion on the Company’s consolidated financial statements based on our audits. We are a public accounting firm registered with the Public Company Accounting Oversight Board (United States) (“PCAOB”) and are required to be independent with respect to the Company in accordance with the U.S. federal securities laws and the applicable rules and regulations of the Securities and Exchange Commission and the PCAOB.
We conducted our audits of these consolidated financial statements in accordance with the standards of the PCAOB. Those standards require that we plan and perform the audit to obtain reasonable assurance about whether the consolidated financial statements are free of material misstatement, whether due to error or fraud. The Company is not required to have, nor were we engaged to perform, an audit of its internal control over financial reporting. As part of our audits we are required to obtain an understanding of internal control over financial reporting but not for the purpose of expressing an opinion on the effectiveness of the Company's internal control over financial reporting. Accordingly, we express no such opinion.
Our audits included performing procedures to assess the risks of material misstatement of the consolidated financial statements, whether due to error or fraud, and performing procedures that respond to those risks. Such procedures included examining, on a test basis, evidence regarding the amounts and disclosures in the consolidated financial statements. Our audits also included evaluating the accounting principles used and significant estimates made by management, as well as evaluating the overall presentation of the consolidated financial statements. We believe that our audits provide a reasonable basis for our opinion.
/s/ PricewaterhouseCoopers LLP
McLean, Virginia
February 20, 2018
We have served as the Company's auditor since 2005.
66
GLADSTONE LAND CORPORATION AND SUBSIDIARIES
CONSOLIDATED BALANCE SHEETS
(In thousands, except share and per-share data)
December 31, 2017 | December 31, 2016 | |||||||
ASSETS | ||||||||
Investment in real estate, net | $ | 449,486 | $ | 326,311 | ||||
Lease intangibles, net | 5,492 | 2,000 | ||||||
Cash and cash equivalents | 2,938 | 2,438 | ||||||
Crop inventory | 1,528 | — | ||||||
Other assets, net | 2,834 | 3,236 | ||||||
TOTAL ASSETS | $ | 462,278 | $ | 333,985 | ||||
LIABILITIES AND EQUITY | ||||||||
LIABILITIES: | ||||||||
Borrowings under lines of credit | $ | 10,000 | $ | 16,550 | ||||
Mortgage notes and bonds payable, net | 291,002 | 190,797 | ||||||
Series A cumulative term preferred stock, par value $0.001 per share; $25.00 per share liquidation preference; 2,000,000 shares authorized, 1,150,000 shares issued and outstanding as of December 31, 2017 and 2016, net | 27,890 | 27,655 | ||||||
Accounts payable and accrued expenses | 7,398 | 2,801 | ||||||
Due to related parties, net(1) | 940 | 751 | ||||||
Other liabilities, net | 7,097 | 7,654 | ||||||
Total liabilities | 344,327 | 246,208 | ||||||
Commitments and contingencies(2) | ||||||||
EQUITY: | ||||||||
Stockholders' equity: | ||||||||
Common stock, $0.001 par value; 98,000,000 shares authorized, 13,791,574 shares issued and outstanding as of December 31, 2017; 18,000,000 shares authorized, 10,024,875 shares issued and outstanding as of December 31, 2016 | 14 | 10 | ||||||
Additional paid-in capital | 129,705 | 90,082 | ||||||
Distributions in excess of accumulated earnings | (19,802 | ) | (13,402 | ) | ||||
Total stockholders’ equity | 109,917 | 76,690 | ||||||
Non-controlling interests in Operating Partnership | 8,034 | 11,087 | ||||||
Total equity | 117,951 | 87,777 | ||||||
TOTAL LIABILITIES AND EQUITY | $ | 462,278 | $ | 333,985 | ||||
(1) | Refer to Note 6, “Related-Party Transactions,” for additional information. |
(2) | Refer to Note 8, “Commitments and Contingencies,” for additional information. |
The accompanying notes are an integral part of these consolidated financial statements.
67
GLADSTONE LAND CORPORATION
CONSOLIDATED STATEMENTS OF OPERATIONS
(In thousands, except share and per-share data)
For the year ended December 31, | |||||||||||
2017 | 2016 | 2015 | |||||||||
OPERATING REVENUES: | |||||||||||
Rental revenue | $ | 25,111 | $ | 17,306 | $ | 11,888 | |||||
Tenant recovery revenue | 11 | 11 | 13 | ||||||||
Total operating revenues | 25,122 | 17,317 | 11,901 | ||||||||
OPERATING EXPENSES: | |||||||||||
Depreciation and amortization | 7,237 | 5,187 | 3,113 | ||||||||
Property operating expenses | 1,165 | 787 | 803 | ||||||||
Acquisition-related expenses | 127 | 246 | 467 | ||||||||
Management fees(1) | 2,041 | 1,542 | 1,343 | ||||||||
Incentive fees(1) | 688 | 350 | — | ||||||||
Administration fees(1) | 914 | 771 | 680 | ||||||||
General and administrative expenses | 1,628 | 1,378 | 1,247 | ||||||||
Total operating expenses | 13,800 | 10,261 | 7,653 | ||||||||
Credits to fees from Adviser(1) | (54 | ) | — | (321 | ) | ||||||
Total operating expenses, net of credits to fees | 13,746 | 10,261 | 7,332 | ||||||||
OPERATING INCOME | 11,376 | 7,056 | 4,569 | ||||||||
OTHER INCOME (EXPENSE): | |||||||||||
Other income | 206 | 109 | 49 | ||||||||
Interest expense | (9,762 | ) | (6,015 | ) | (4,160 | ) | |||||
Distributions attributable to mandatorily-redeemable preferred stock | (1,833 | ) | (677 | ) | — | ||||||
Property and casualty recovery | — | — | 97 | ||||||||
(Loss) gain on disposals of real estate assets, net | (21 | ) | — | 14 | |||||||
Total other expense | (11,410 | ) | (6,583 | ) | (4,000 | ) | |||||
NET (LOSS) INCOME | $ | (34 | ) | $ | 473 | $ | 569 | ||||
Net loss (income) attributable to non-controlling interests | 3 | (25 | ) | — | |||||||
NET (LOSS) INCOME ATTRIBUTABLE TO THE COMPANY | (31 | ) | 448 | 569 | |||||||
(LOSS) EARNINGS PER COMMON SHARE: | |||||||||||
Basic and diluted | $ | — | $ | 0.04 | $ | 0.07 | |||||
WEIGHTED AVERAGE SHARES OF COMMON STOCK OUTSTANDING | |||||||||||
Basic and diluted | 12,055,791 | 10,007,350 | 8,639,397 | ||||||||
(1) | Refer to Note 6, “Related-Party Transactions,” for additional information. |
The accompanying notes are an integral part of these consolidated financial statements.
68
GLADSTONE LAND CORPORATION
CONSOLIDATED STATEMENTS OF EQUITY
(In thousands, except share data)
Common Stock | Additional Paid-in Capital | Distributions in Excess of Accumulated Earnings | Total Stockholders' Equity | Non- Controlling Interest | Total Equity | ||||||||||||||||||||||
Number of Shares | Par Value | ||||||||||||||||||||||||||
Balance at December 31, 2014 | 7,753,717 | $ | 8 | $ | 65,366 | $ | (5,405 | ) | $ | 59,969 | $ | — | $ | 59,969 | |||||||||||||
Net income | — | — | — | 569 | 569 | — | 569 | ||||||||||||||||||||
Issuance of common stock, net | 2,239,224 | 2 | 21,526 | — | 21,528 | — | 21,528 | ||||||||||||||||||||
Distributions | — | — | — | (4,059 | ) | (4,059 | ) | — | (4,059 | ) | |||||||||||||||||
Balance at December 31, 2015 | 9,992,941 | $ | 10 | $ | 86,892 | $ | (8,895 | ) | $ | 78,007 | $ | — | $ | 78,007 | |||||||||||||
Net income | — | — | — | 448 | 448 | 25 | 473 | ||||||||||||||||||||
Issuance of common stock, net | 31,934 | — | 350 | — | 350 | — | 350 | ||||||||||||||||||||
Distributions | — | — | — | (4,955 | ) | (4,955 | ) | (388 | ) | (5,343 | ) | ||||||||||||||||
Issuance of OP Units as consideration in real estate acquisitions, net | — | — | — | — | — | 14,290 | 14,290 | ||||||||||||||||||||
Adjustment to non-controlling interests resulting from changes in ownership of the Operating Partnership | — | — | 2,840 | — | 2,840 | (2,840 | ) | — | |||||||||||||||||||
Balance at December 31, 2016 | 10,024,875 | $ | 10 | $ | 90,082 | $ | (13,402 | ) | $ | 76,690 | $ | 11,087 | $ | 87,777 | |||||||||||||
Net loss | — | — | — | (31 | ) | (31 | ) | (3 | ) | (34 | ) | ||||||||||||||||
Issuance of common stock, net | 3,519,824 | 4 | 39,852 | — | 39,856 | — | 39,856 | ||||||||||||||||||||
Distributions | — | — | — | (6,369 | ) | (6,369 | ) | (710 | ) | (7,079 | ) | ||||||||||||||||
Redemption of OP Units | 246,875 | — | 1,968 | — | 1,968 | (4,537 | ) | (2,569 | ) | ||||||||||||||||||
Adjustment to non-controlling interests resulting from changes in ownership of the Operating Partnership | — | — | (2,197 | ) | — | (2,197 | ) | 2,197 | — | ||||||||||||||||||
Balance at December 31, 2017 | 13,791,574 | $ | 14 | $ | 129,705 | $ | (19,802 | ) | $ | 109,917 | $ | 8,034 | $ | 117,951 | |||||||||||||
The accompanying notes are an integral part of these consolidated financial statements.
69
GLADSTONE LAND CORPORATION
CONSOLIDATED STATEMENTS OF CASH FLOWS
(In thousands)
For the year ended December 31, | |||||||||||
2017 | 2016 | 2015 | |||||||||
CASH FLOWS FROM OPERATING ACTIVITIES: | |||||||||||
Net (loss) income | $ | (34 | ) | $ | 473 | $ | 569 | ||||
Adjustments to reconcile net (loss) income to net cash provided by operating activities: | |||||||||||
Depreciation and amortization | 7,237 | 5,187 | 3,113 | ||||||||
Amortization of deferred financing costs | 524 | 241 | 107 | ||||||||
Amortization of deferred rent assets and liabilities, net | (278 | ) | (178 | ) | (201 | ) | |||||
Bad debt expense | 150 | 72 | 10 | ||||||||
Loss (gain) on disposals of real estate assets, net | 21 | — | (14 | ) | |||||||
Property and casualty recovery | — | — | (97 | ) | |||||||
Insurance proceeds received utilized for repairs to real estate assets | — | — | 10 | ||||||||
Changes in operating assets and liabilities: | |||||||||||
Crop inventory and Other assets, net | (1,904 | ) | (322 | ) | (124 | ) | |||||
Accounts payable and accrued expenses and Due to related parties, net | 1,923 | 720 | 524 | ||||||||
Other liabilities, net | (1,124 | ) | 2,210 | 843 | |||||||
Net cash provided by operating activities | 6,515 | 8,403 | 4,740 | ||||||||
CASH FLOWS FROM INVESTING ACTIVITIES: | |||||||||||
Acquisition of new real estate | (127,835 | ) | (84,593 | ) | (74,449 | ) | |||||
Capital expenditures on existing real estate | (5,211 | ) | (9,797 | ) | (3,231 | ) | |||||
Proceeds from sale of real estate, net | 3,834 | 156 | — | ||||||||
Decrease in restricted cash | — | — | 133 | ||||||||
Maturity of short-term investment | 682 | — | — | ||||||||
Change in deposits on real estate acquisitions and investments, net | (1,115 | ) | (1,267 | ) | (1,000 | ) | |||||
Insurance proceeds received capitalized as real estate asset additions | — | — | 87 | ||||||||
Net cash used in investing activities | (129,645 | ) | (95,501 | ) | (78,460 | ) | |||||
CASH FLOWS FROM FINANCING ACTIVITIES: | |||||||||||
Proceeds from issuance of equity | 41,907 | 360 | 23,133 | ||||||||
Offering costs | (1,977 | ) | (272 | ) | (1,482 | ) | |||||
Payments for redemption of OP Units | (2,569 | ) | — | — | |||||||
Borrowings from mortgage notes payable | 108,685 | 54,403 | 60,841 | ||||||||
Repayments on mortgage note payable | (7,906 | ) | (4,827 | ) | (626 | ) | |||||
Borrowings from lines of credit | 58,400 | 59,750 | 18,100 | ||||||||
Repayments on lines of credit | (64,950 | ) | (43,300 | ) | (22,000 | ) | |||||
Proceeds from issuance of mandatorily redeemable preferred stock | — | 28,750 | — | ||||||||
Payment of financing fees | (881 | ) | (1,818 | ) | (273 | ) | |||||
Distributions paid on common stock | (6,369 | ) | (4,955 | ) | (4,059 | ) | |||||
Distributions paid to non-controlling interests in Operating Partnership | (710 | ) | (388 | ) | — | ||||||
Payment of contingent consideration | — | (700 | ) | — | |||||||
Net cash provided by financing activities | 123,630 | 87,003 | 73,634 | ||||||||
NET INCREASE (DECREASE) IN CASH AND CASH EQUIVALENTS | 500 | (95 | ) | (86 | ) | ||||||
CASH AND CASH EQUIVALENTS AT BEGINNING OF PERIOD | 2,438 | 2,533 | 2,619 | ||||||||
CASH AND CASH EQUIVALENTS AT END OF PERIOD | $ | 2,938 | $ | 2,438 | $ | 2,533 | |||||
Cash paid during the year for interest(1) | $ | 9,582 | $ | 5,981 | $ | 3,263 | |||||
NON-CASH INVESTING AND FINANCING INFORMATION: | |||||||||||
Issuance of non-controlling interests in operating partnership in conjunction with acquisitions | $ | — | $ | 14,353 | $ | — | |||||
Real estate additions included in Other assets, net | 15 | — | — | ||||||||
Real estate additions included in Accounts payable and accrued expenses and Due to related parties, net | 2,641 | 162 | 1,157 | ||||||||
Loss on disposal of real estate asset included in Accounts payable and accrued expenses and Due to related parties, net | 39 | — | — | ||||||||
Real estate additions included in Other liabilities, net | 849 | 1,392 | 1,572 | ||||||||
Common and preferred stock offering and OP Unit issuance costs included in Accounts payable and accrued expenses and Due to related parties, net | 149 | 9 | 226 | ||||||||
Financing fees included in Accounts payable and accrued expenses and Due to related parties, net | 15 | 8 | 25 | ||||||||
(1) | Includes distributions made on our Series A Term Preferred Stock. |
The accompanying notes are an integral part of these consolidated financial statements.
70
GLADSTONE LAND CORPORATION AND SUBSIDIARIES
NOTES TO CONSOLIDATED FINANCIAL STATEMENTS
All references to the number of farms/properties and acreage are unaudited.
NOTE 1. BUSINESS AND ORGANIZATION
Business
Gladstone Land Corporation is an agricultural real estate investment trust (“REIT”) that was re-incorporated in Maryland on March 24, 2011, having been originally incorporated in California on June 14, 1997. We are primarily in the business of owning and leasing farmland. Subject to certain restrictions and limitations, and pursuant to contractual agreements, our business is managed by Gladstone Management Corporation (the “Adviser”), a Delaware corporation, and administrative services are provided to us by Gladstone Administration, LLC (the “Administrator”), a Delaware limited liability company. Our Adviser and Administrator are both affiliates of ours (see Note 6, “Related-Party Transactions,” for additional discussion regarding our Adviser and Administrator).
Organization
We conduct substantially all of our operations through a subsidiary, Gladstone Land Limited Partnership (the “Operating Partnership”), a Delaware limited partnership. As we currently control the sole general partner of the Operating Partnership and own, directly or indirectly, a majority of the limited partnership interests in the Operating Partnership (“OP Units”), the financial position and results of operations of the Operating Partnership are consolidated within our financial statements. As of December 31, 2017 and 2016, the Company owned 93.2% and 87.4%, respectively, of the outstanding OP Units (see Note 7, “Equity,” for additional discussion regarding OP Units).
Gladstone Land Partners, LLC (“Land Partners”), a Delaware limited liability company and a subsidiary of ours, was organized to engage in any lawful act or activity for which a limited liability company may be organized in Delaware. Land Partners is the general partner of the Operating Partnership and has the power to make and perform all contracts and to engage in all activities necessary in carrying out the purposes of the Company, as well as all other powers available to it as a limited liability company. As we currently own all of the membership interests of Land Partners, the financial position and results of operations of Land Partners are consolidated within our financial statements.
Gladstone Land Advisers, Inc. (“Land Advisers”), a Delaware corporation and a subsidiary of ours, was created to collect any non-qualifying income related to our real estate portfolio and to perform certain small-scale farming business operations. We have elected for Land Advisers to be taxed as a taxable REIT subsidiary (“TRS”). On October 17, 2017, our TRS began farming a 169-acre farm located in Ventura County, California under a short-term lease that will expire on July 31, 2018. Since we currently own 100% of the voting securities of Land Advisers, the financial position and results of operations of Land Advisers are consolidated within our financial statements.
All further references herein to “we,” “us,” “our,” and the “Company” refer, collectively, to Gladstone Land Corporation and its consolidated subsidiaries, except where indicated otherwise.
NOTE 2. SUMMARY OF SIGNIFICANT ACCOUNTING POLICIES
Use of Estimates
The preparation of financial statements in accordance with U.S. generally-accepted accounting principles (“GAAP”) requires management to make estimates and assumptions that affect the reported amounts of assets and liabilities and disclosure of contingent assets and liabilities as of the date of the financial statements and the reported amounts of revenues and expenses during the reporting periods. Actual results could materially differ from those estimates.
Real Estate and Lease Intangibles
Our investments in real estate consist of farmland, improvements made to the farmland (consisting primarily of buildings, irrigation and drain systems, cooling facilities, and packinghouses), and long-term horticulture acquired in connection with certain land purchases (consisting primarily of almond, apple, and pistachio trees; blueberry bushes; and wine vineyards). We record investments in real estate at cost and capitalize improvements and replacements when they extend the useful life or improve the efficiency of the asset. We expense costs of repairs and maintenance as such costs are incurred. We generally compute depreciation using the straight-line method over the shorter of the estimated useful life or 39 years for buildings and
71
improvements, the shorter of the estimated useful life or 25 years for horticulture, 5 to 10 years for equipment and fixtures, and the shorter of the useful life or the remaining lease term for tenant improvements.
Certain of our acquisitions involve sale-leaseback transactions with newly-originated leases, and other of our acquisitions involve the acquisition of farmland that is already being operated as rental property, in which case we will typically assume the lease in place at the time of acquisition. Prior to us early adopting Accounting Standards Update (“ASU”) 2017-01, “Clarifying the Definition of a Business” (as further described below under “—Recently-Issued Accounting Pronouncements”), acquisitions of farmland already being operated as rental property were generally considered to be business combinations under Accounting Standards Codification (“ASC”) 805, “Business Combinations.” However, after our adoption of ASU 2017-01, effective October 1, 2016, we now generally consider both types of acquisitions to be asset acquisitions under ASC 360, “Property Plant and Equipment.”
Whether an acquisition is considered an asset acquisition or a business combination, both ASC 360 and ASC 805 require that the purchase price of real estate be allocated to (i) the tangible assets acquired and liabilities assumed, typically consisting of land, buildings, improvements, horticulture, and long-term debt, and, if applicable, (ii) any identifiable intangible assets and liabilities, which may consist of the values of above- and below-market leases, in-place lease values, lease origination costs, and tenant relationships, based in each case on their fair values. In addition, ASC 360 requires us to capitalize the transaction costs incurred in connection with the acquisition, whereas ASC 805 required that all costs related to the acquisition be expensed as incurred, rather than capitalized into the cost of the acquisition.
Management’s estimates of fair value are made using methods similar to those used by independent appraisers, such as a sales comparison approach, a cost approach, and either an income capitalization approach or discounted cash flow analysis. Factors considered by management in its analysis include an estimate of carrying costs during hypothetical, expected lease-up periods, taking into consideration current market conditions and costs to execute similar leases. We also consider information obtained about each property as a result of our pre-acquisition due diligence, marketing, and leasing activities in estimating the fair value of the tangible and intangible assets acquired and liabilities assumed. In estimating carrying costs, management also includes lost reimbursement of real estate taxes, insurance, and certain other operating expenses, as well as estimates of lost rental income at market rates during the hypothetical, expected lease-up periods, which typically range from 1 to 24 months, depending on specific local market conditions. Management also estimates costs to execute similar leases, including leasing commissions, legal fees, and other related expenses, to the extent that such costs are not already incurred in connection with a new lease origination as part of the transaction. While management believes these estimates to be reasonable based on the information available at the time of acquisition, the purchase price allocation may be adjusted if management obtains more information regarding the valuations of the assets acquired or liabilities assumed.
We allocate the purchase price to the fair value of the tangible assets and liabilities of an acquired property by valuing the property as if it were vacant. The “as-if-vacant” value is allocated to land, buildings, improvements, and horticulture, based on management’s determination of the relative fair values of such assets and liabilities as of the date of acquisition.
We record above- and below-market lease values for acquired properties based on the present value (using a discount rate that reflects the risks associated with the leases acquired) of the difference between (i) the contractual amounts to be paid pursuant to the in-place lease agreements, and (ii) management’s estimate of fair market lease rates for the corresponding in-place leases, measured over a period equal to the remaining, non-cancelable term of the lease. When determining the non-cancelable term of the lease, we evaluate whether fixed-rate or below-market renewal options, if any, should be included. The fair value of capitalized above-market lease values, included as part of Other assets in the accompanying Consolidated Balance Sheets, is amortized as a reduction of rental income on a straight-line basis over the remaining, non-cancelable terms of the respective leases. The fair value of capitalized below-market lease values, included as part of Other liabilities in the accompanying Consolidated Balance Sheets, is amortized as an increase to rental income on a straight-line basis over the remaining, non-cancelable terms of the respective leases, including that of any fixed-price or below-market renewal options.
The value of the remaining intangible assets acquired, which consists of in-place lease values, lease origination costs, and tenant relationship values, are determined based on management’s evaluation of the specific characteristics of each tenant’s lease and our overall relationship with that respective tenant. Characteristics to be considered by management in allocating these values include the nature and extent of our existing business relationships with the tenant, prospects for developing additional business with the tenant, the tenant’s credit quality, and our expectations of lease renewals (including those existing under the terms of the current lease agreement), among other factors.
The value of in-place leases and lease origination costs are amortized to amortization expense on a straight-line basis over the remaining, non-cancelable terms of the respective leases. The value of tenant relationship intangibles, which is the benefit to us resulting from the likelihood of an existing tenant renewing its lease at the existing property or entering into a lease at a different property we own, is amortized to amortization expense over the remaining lease term and any anticipated renewal periods in the respective leases.
72
Should a tenant terminate its lease, the unamortized portion of the above intangible assets or liabilities would be charged to the appropriate income or expense account.
Impairment of Real Estate Assets
We account for the impairment of our tangible and identifiable intangible real estate assets in accordance with ASC 360, which requires us to periodically review the carrying value of each property to determine whether indicators of impairment exist. Such indicators may include, but are not limited to, declines in a property’s operating performance, deteriorating market conditions, vacancy rates, and environmental or legal concerns. If circumstances support the possibility of impairment, we prepare a projection of the total undiscounted future cash flows of the specific property, including proceeds from disposition without interest charges, and compare them to the net book value of the property to determine whether the carrying value of the property is recoverable. In performing the analysis, we consider such factors as the tenants’ payment history and financial condition, the likelihood of lease renewal, agricultural and business conditions in the regions in which our farms are located, and whether there are indications that the fair value of the real estate has decreased. If the carrying amount is more than the aggregate undiscounted future cash flows, we would recognize an impairment loss to the extent the carrying value exceeds the estimated fair value of the property.
We evaluate our entire property portfolio each quarter for any impairment indicators and perform an impairment analysis on those select properties that have an indication of impairment. As of December 31, 2017, we concluded that none of our properties were impaired, and we will continue to monitor our portfolio for any indicators of impairment. There have been no impairments recognized on real estate assets since our inception.
Tenant Improvements
From time to time, our tenants may pay for improvements on certain of our properties with the ownership of the improvements remaining with us, in which case we will record the cost of such improvements as an asset (tenant improvements), along with a corresponding liability (deferred rent liability) on our balance sheet. When we are determined to be the owner of the tenant improvements, such improvements will be depreciated, and the related deferred rent liability will be amortized as an addition to rental income, each over the shorter of the useful life of the respective improvement or the remaining term of the existing lease in place. If the tenant is determined to be the owner of the tenant improvements, any tenant improvements funded by us are treated as a lease incentive and amortized as a reduction of rental income over the remaining term of the existing lease in place. We have not recorded any such lease incentives to date. In determining whether the tenant or the Company is the owner of such improvements, several factors will be considered, including, but not limited to: (i) whether the tenant or landlord retains legal title to the improvements upon expiration of the lease; (ii) whether the lease stipulates how such improvements should be treated; (iii) the uniqueness of the improvements (i.e., whether the improvements were made to meet the specific needs or for the benefit of the tenant leasing the property, or if the improvements generally increased the value or extended the useful life of the asset improved upon); (iv) the expected useful life of the improvements relative to the remaining length of the lease; (v) whether the tenant improvements are expected to have significant residual value at the end of the lease term; and (vi) whether the tenant or the Company constructs or directs construction of the improvements. The determination of who owns the improvements can be subject to significant judgment. When we pay for tenant improvements and are determined to be the owner of such improvements, we will record the cost of the improvement as an asset and will depreciate it over its corresponding useful life.
Cash and Cash Equivalents
We consider cash equivalents to be all short-term, highly-liquid investments that are both readily convertible to cash and have a maturity of three months or less at the time of purchase, except that any such investments purchased with funds held in escrow or similar accounts are classified as restricted cash. Items classified as cash equivalents include money-market deposit accounts. Our cash and cash equivalents at December 31, 2017 and 2016 were held in the custody of one financial institution, and our balance at times may exceed federally-insurable limits. We did not have any restricted cash or restricted cash equivalents at December 31, 2017 or 2016.
Crop Inventory
As of December 31, 2017, costs incurred by our TRS to grow crops consisted primarily of growing costs (including the costs of land preparation, plants, fertilizers and pesticides, and labor costs) and certain overhead costs (including management/oversight costs). These costs have been accumulated and deferred until the related crops are harvested and sold and are recorded in Crop inventory on the accompanying Consolidated Balance Sheet at the lower of cost or market value.
73
Crop inventory consisted primarily of the following (dollars in thousands):
As of December 31, 2017 | ||||
Growing costs | $ | 1,335 | ||
Overhead costs(1) | 193 | |||
Total Crop inventory | $ | 1,528 | ||
(1) | Includes a fee earned by our Adviser from the TRS of approximately $71,000 (see Note 6, “Related-Party Transactions—TRS Fee Arrangements” for further discussion on this fee). |
There had been minimal harvesting activity on the farm operated by our TRS as of December 31, 2017. The accumulated costs will be charged to cost of products sold as the related crops are harvested and sold during 2018. As the crops are harvested and sold, our TRS will also incur additional costs (including labor costs for harvesting, packaging and colling costs, and sales commissions). These costs will also be charged to cost of products sold as the related crops are harvested and sold.
Deferred Financing Costs
Deferred financing costs consist of costs incurred to obtain financing, including legal fees, origination fees, and administrative fees. Costs associated with our long-term borrowings are deferred and amortized over the terms of the respective financings using the straight-line method, which approximates the effective interest method. In the case of our lines of credit, the straight-line method is used due to the revolving nature of the financing instrument. Upon early extinguishment of any borrowings, the unamortized portion of the related deferred financing costs will be immediately charged to expense. In addition, in accordance with ASC 470, “Debt,” when a financing arrangement is amended so that the only material change is an increase in the borrowing capacity, the unamortized deferred financing costs from the prior arrangement is amortized over the term of the new arrangement.
In accordance with ASU 2015-15, unamortized deferred financing costs associated with our lines of credit are reported as an asset and are included in Other assets, net on the accompanying Consolidated Balance Sheets. In accordance with ASU 2015-03, unamortized deferred financing costs related to long-term borrowings are reported as a deduction from the carrying amount of the related debt liability and are included in Mortgage notes and bonds payable, net on the accompanying Consolidated Balance Sheets. In both cases, the amortization of deferred financing costs is included as a component of interest expense on the accompanying Consolidated Statements of Operations. During the years ended December 31, 2017, 2016, and 2015, we recorded total amortization expense related to deferred financing costs of approximately $524,000, $241,000, and $107,000, respectively.
Deferred Offering Costs
We account for offering costs in accordance with SEC Staff Accounting Bulletin (“SAB”) Topic 5.A., which states that incremental offering costs directly attributable to a proposed or actual offering of securities may be deferred and charged against the gross proceeds of such offering. Accordingly, costs incurred related to our ongoing equity offerings are included in Other assets, net on the accompanying Consolidated Balance Sheets and are ratably applied to the cost of equity as the related securities are issued. If an equity offering is subsequently terminated, the remaining, unallocated portion of the related deferred offering costs are charged to expense in the period such offering is aborted and recorded as General and administrative expenses on the accompanying Consolidated Statements of Operations.
Other Assets and Other Liabilities
Other assets, net consist primarily of net deferred rent assets, deferred offering costs, prepaid expenses, deferred financing costs associated with our lines of credit, deposits on potential real estate acquisitions, short-term investments, and other miscellaneous receivables. Other liabilities consist primarily of rents received in advance and deferred rent liabilities.
Non-controlling Interests
Non-controlling interests are interests in the Operating Partnership not owned by us. We evaluate whether non-controlling interests are subject to redemption features outside of our control. As of both December 31, 2017 and 2016, the non-controlling interests in the Operating Partnership are redeemable at the option of the holder for cash or, at our election, shares of our common stock and thus are reported in the equity section of the Consolidated Balance Sheets but separate from stockholders' equity. The amount reported for non-controlling interests on the Consolidated Statements of Operations represent the portion of income from the Operating Partnership not attributable to us. At the end of each reporting period, we determine the amount of equity (at book value) that is allocable to non-controlling interests based upon the respective ownership interests. To reflect
74
the non-controlling interests' equity interest in the Company, an adjustment is made to non-controlling interests, with a corresponding adjustment to paid-in capital, as reflected on the Consolidated Statements of Equity.
Revenue Recognition
Rental revenue includes rents that each tenant pays in accordance with the terms of its respective lease, reported evenly over the non-cancelable term of the lease. Most of our leases contain rental increases at specified intervals; we recognize such revenues on a straight-line basis. Certain other leases provide for additional rental payments that are based on a percentage of the gross crop revenues earned on the farm, which we refer to as variable rent payments. Such contingent revenue is generally recognized when all contingencies have been resolved and when actual results become known or estimable, enabling us to estimate and/or measure our share of such gross revenues. As a result, depending on the circumstances of each lease, certain participating rents may be recognized by us in the year the crop was harvested, while other participating rents may be recognized in the year following the harvest. During the year ended December 31, 2017, we received a variable rent payment of approximately $304,000 from one farm in California, which was recorded as additional rental revenue upon receipt. No variable rent revenues had been recorded prior to the receipt of this payment.
Deferred rent receivable, included in Other assets on the accompanying Consolidated Balance Sheets, includes the cumulative difference between rental revenue as recorded on a straight-line basis and cash rents received from the tenants in accordance with the lease terms. In addition, we determine, in our judgment, to what extent the deferred rent receivable applicable to each specific tenant is collectible. We perform a quarterly review of the net deferred rent receivable balance as it relates to straight-line rents and take into consideration the tenant’s payment history, the financial condition of the tenant, business conditions of the industry in which the tenant operates, and economic and agricultural conditions in the geographic area in which the property is located. In the event that the collectibility of deferred rent with respect to any given tenant is in doubt, we record an allowance for uncollectible accounts or record a direct write-off of the specific rent receivable. During the year ended December 31, 2017, we recorded an allowance of approximately $50,000 against the deferred rent asset balance of a farm for which the lease was terminated on January 1, 2018 (see Note 11, “Subsequent Events,” for further discussion on this lease termination); no such allowances had been recorded prior to 2017. In addition, during the years ended December 31, 2017, 2016, and 2015, we wrote off approximately $99,000, $85,000, and $7,000, respectively, of deferred rent asset balances related to early terminations of certain leases.
Tenant recovery revenue includes payments received from tenants as reimbursements for certain operating expenses, such as property taxes and insurance premiums. These expenses and their subsequent reimbursements are recognized under property operating expenses as incurred and tenant recovery revenue as earned, respectively, and are recorded in the same periods. We do not record any property operating expenses or tenant recovery revenues associated with costs paid directly by our tenants for net-leased properties.
Other Income
We record non-operating and unusual or infrequent income as Other income on our Consolidated Statements of Operations. Other income recorded for the years ended December 31, 2017, 2016, and 2015 was primarily from interest patronage received on certain of our long-term borrowings, interest earned on short-term investments, and income tax refunds from the State of California.
Involuntary Conversions and Property and Casualty Recovery
We account for involuntary conversions, for example, when a nonmonetary asset, such as property or equipment, is involuntarily converted to a monetary asset, such as insurance proceeds, in accordance with ASC 605, “Revenue Recognition – Gains and Losses,” which requires us to recognize a gain or a loss equal to the difference between the carrying amount of the nonmonetary asset and the amount of monetary assets received. Further, in accordance with ASC 450, “Contingencies,” if recovery of the loss is considered to be probable, we will recognize a receivable for the amount expected to be covered by insurance proceeds, not to exceed the related loss recognized, unless such amounts have been realized.
(Loss) Gain on Disposals of Real Estate Assets
We recognize net (losses) or gains on disposals of real estate assets either upon the abandonment of an asset before the end of its useful life or upon the closing of a transaction (be it an outright sale of a property or the sale of a perpetual, right-of-way easement on all or a portion of a property) with the purchaser. When a real estate asset is abandoned prior to the end of its useful life, a loss is recorded in an amount equal to the net book value of the related real estate asset at the time of abandonment. In the case of a sale of a property, a gain (loss) is recorded to the extent that the total consideration received for a property is more (less) than the property's net carrying value (plus any closing costs incurred) at the time of the sale. Gains are recognized using the full accrual method (i.e., when the collectability of the sales price is reasonably assured, we are not
75
obligated to perform additional activities that may be considered significant, the initial investment from the buyer is sufficient, and other profit recognition criteria have been satisfied). Gains on sales of real estate assets may be deferred in whole or in part until the requirements for gain recognition have been met.
Income Taxes
We have operated and intend to continue to operate in a manner that will allow us to qualify as a REIT under the Sections 856-860 of the Internal Revenue Code of 1986, as amended (the “Code”). On September 3, 2014, we filed our 2013 federal income tax return, on which we elected to be taxed as a REIT for federal income tax purposes beginning with our tax year ended December 31, 2013. As a REIT, we generally are not subject to federal income taxes on amounts that we distribute to our stockholders (except income from any foreclosure property), provided that, on an annual basis, we distribute at least 90% of our REIT taxable income (excluding net capital gains) to our stockholders and meet certain other conditions. To the extent that we satisfy the annual distribution requirement but distribute less than 100% of our taxable income (including net capital gains), we will be subject to corporate income tax on our undistributed taxable income. If we fail to qualify as a REIT in any taxable year, we will be subject to federal income tax on our taxable income at regular corporate rates (including any alternative minimum tax) and may not be able to qualify as a REIT for the four immediately-subsequent taxable years. Even as a REIT, we may be subject to certain state and local income and property taxes and to federal income and excise taxes on undistributed taxable income. In general, however, as long as we qualify as a REIT, no provision for federal income taxes will be necessary, except for taxes on undistributed REIT taxable income and taxes on the income generated by a TRS, if any.
Since January 1, 2013, Land Advisers has been treated as a wholly-owned TRS that is subject to federal and state income taxes. Prior to 2017, there had been no activity in Land Advisers; however, on October 17, 2017, it took over the farming operations on one of our farms in California. There was no taxable income from Land Advisers for the year ended December 31, 2017, though should we have taxable income in the future, we would account for any income taxes in accordance with the provisions of ASC 740, “Income Taxes.” Under ASC 740-10-25, we would account for income taxes using the asset and liability method, under which deferred tax assets and liabilities are recognized for the future tax consequences attributable to temporary differences between the financial statement carrying amounts of existing assets and liabilities and their respective income tax bases, as well as for operating loss, capital loss, and tax credit carryforwards, in each case, based on enacted income tax rates expected to be in effect when such amounts are realized or settled. At this time, we are unable to estimate the amount of taxable income, if any, that will be generated by our TRS.
We may recognize a tax benefit from uncertain tax positions when it is more-likely-than-not (defined as a likelihood of more than 50%) that the position will be sustained upon examination, including resolutions of any related appeals or litigation. If a tax position does not meet the more-likely-than-not threshold, the benefit of that tax position is not recognized in the statements of operations.
We perform an annual review for any uncertain tax positions and, if necessary, will record future tax consequences of uncertain tax positions in the financial statements. An uncertain tax position is defined as a position taken or expected to be taken in a tax return that is not based on clear and unambiguous tax law and which is reflected in measuring current or deferred income tax assets and liabilities for interim or annual periods. As of December 31, 2017 and 2016, we had no material provisions for uncertain tax positions. The prior three tax years remain open for an audit by the Internal Revenue Service.
Comprehensive Income
For the years ended December 31, 2017, 2016, and 2015, comprehensive income equaled net income; therefore, a separate statement of comprehensive income is not included in the accompanying consolidated financial statements.
Segment Reporting
We manage our operations on an aggregated, single-segment basis for purposes of assessing performance and making operating decisions and, accordingly, have only one reporting and operating segment.
Reclassifications
Certain line items on the Consolidated Statements of Operations and Consolidated Statements of Cash Flows for the years ended December 31, 2016 and 2015, have been reclassified to conform to the current period’s presentation. On the Consolidated Statements of Operations, certain property-specific costs have been reclassified from general and administrative expenses to property operating expenses. In addition, on the Consolidated Statements of Cash Flows, deposits on future acquisitions, deposits applied against real estate investments, and deposits refunded are presented on a net basis as a single line item within the “Cash Flows From Investing Activities”; and borrowings from and repayments on lines of credit (previously reported on a net basis) have been separated, and each are presented on a gross basis within the “Cash Flows from Financing
76
Activities” section. These reclassifications had no impact on previously-reported net income, equity, or net change in cash and cash equivalents.
Recently-Issued Accounting Pronouncements
In May 2014, the Financial Accounting Standards Board (the “FASB”) issued Accounting Standards Update (“ASU”) 2014-09, “Revenue from Contracts with Customers (Topic 606)” (“ASU 2014-09”), which was amended in each of March, April, May, and December of 2016. ASU 2014-09, as amended, supersedes or replaces nearly all GAAP revenue recognition guidance and establishes a new, control-based revenue recognition model, changes the basis for deciding when revenue is recognized over time or at a point in time and will expand disclosures about revenue. As deferred by the FASB in July 2015, ASU 2014-09, as amended, is effective for annual reporting periods beginning after December 15, 2017, and interim periods within those years. We will adopt this guidance for our annual and interim periods beginning January 1, 2018, and expect to use the modified retrospective method, under which the cumulative effect of initially applying the guidance is recognized at the date of initial application. We do not expect ASU 2014-09 to have a material impact on our results of operations or financial condition, as the primary impact of this update is related to common area maintenance and other material tenant reimbursements, whereas the majority of our revenue is from rental income pursuant to net-lease agreements, with very little being attributed to tenant recoveries. The impact of ASU 2014-09 will not take effect until the new leasing standard (ASU 2016-02, as defined below) becomes effective on January 1, 2019.
In February 2016, the FASB issued ASU 2016-02, “Leases (Topic 842): An Amendment of the FASB Accounting Standards Codification” (“ASU 2016-02”). The new standard requires lessees to apply a dual approach, classifying leases as either finance or operating leases based on the principle of whether or not the lease is effectively a financed purchase by the lessee, which classification determines whether lease expense is recognized based on an effective interest method or on a straight-line basis, respectively, over the term of the lease. A lessee is also required to record a right-of-use asset and a lease liability for all leases with a term of greater than 12 months, regardless of the classification. Leases with a term of 12 months or less will be accounted for similar to existing guidance for operating leases. The new standard requires lessees to record a right-of-use asset and a lease liability for all leases with a term greater than 12 months, regardless of their classification, while lessors are required to account for leases using an approach that is substantially equivalent to existing guidance for sales-type leases, direct financing leases, and operating leases. ASU 2016-02 supersedes the previous leasing standard, Accounting Standards Codification (“ASC”) 840, “Leases,” and is effective on January 1, 2019, with early adoption permitted. We expect our legal expenses (included in General and administrative expenses on our Consolidated Statements of Operations) to increase marginally, as the new standard requires us to expense indirect leasing costs that were previously capitalized; however, we do not expect ASU 2016-02 to materially impact our consolidated financial statements, as we currently only have two operating ground lease arrangements with terms greater than one year for which we are the lessee.
In August 2016, the FASB issued ASU 2016-15, “Statement of Cash Flows (Topic 230): Classification of Certain Cash Receipts and Cash Payments” (“ASU 2016-15”), which provides guidance on certain cash flow classification issues, with the objective of reducing the existing diversity in practice in how certain cash receipts and cash payments are presented and classified on the statement of cash flows. ASU 2016-15 is effective for annual periods beginning after December 15, 2017, including interim periods within those fiscal years, with early adoption permitted and retrospective adoption required. We will adopt this guidance for our annual and interim periods beginning January 1, 2018. We do not expect the adoption of ASU 2016-15 to have a material impact on our consolidated financial statements.
In January 2017, the FASB issued ASU 2017-01, “Business Combinations (Topic 805): Clarifying the Definition of a Business” (“ASU 2017-01”), which clarifies the definition of a business with the objective of adding guidance to assist entities with evaluating whether transactions should be accounted for as acquisitions (or disposals) of assets or businesses. The definition of a business affects many areas of accounting, including acquisitions and disposals. ASU 2017-01 is effective for annual periods beginning after December 15, 2017, including interim periods within those fiscal years, with early adoption permitted. We adopted ASU 2017-01, effective October 1, 2016, and, as a result of our early adoption, all of our farmland acquisitions since our adoption have been treated as asset acquisitions under ASC 360, which has resulted in a lower amount of acquisition-related costs being expensed on our consolidated statements of operations, as the majority of those costs have been capitalized and included as part of the fair value allocation of the respective purchase prices. We anticipate that the majority of our future acquisitions will continue to be treated as asset acquisitions under ASC 360, resulting in similar treatment of acquisition-related costs.
In February 2017, the FASB issued ASU 2017-05, "Other Income—Gains and Losses from the Derecognition of Nonfinancial Assets (Subtopic 610-20): Clarifying the Scope of Asset Derecognition Guidance and Accounting for Partial Sales of Nonfinancial Assets" ("ASU 2017-05"), which provides guidance for recognizing gains and losses from the transfer of nonfinancial assets and in-substance nonfinancial assets in contracts with non-customers (unless other specific guidance applies). ASU 2017-05 requires derecognition once control of a distinct nonfinancial asset or in-substance nonfinancial asset is transferred. Additionally, when a company transfers its controlling interest in a nonfinancial asset but retains a non-controlling
77
ownership interest, any non-controlling interest received is required to be measured at fair value, and the company is required to recognize a full gain or loss on the transaction. As a result of ASU 2017-05, the guidance specific to real estate sales in ASC 360-20 will be eliminated, and partial sales of real estate assets will now be subject to the same derecognition model as all other nonfinancial assets. ASU 2017-05 is effective for annual periods beginning after December 15, 2017, including interim periods within those fiscal years. We expect to utilize the modified retrospective approach in adopting ASU 2017-05, and we do not expect the adoption of this guidance to have a material impact on our consolidated financial statements.
NOTE 3. REAL ESTATE AND INTANGIBLE ASSETS
All of our properties are wholly-owned on a fee-simple basis, except where noted. The following table provides certain summary information about our 73 farms as of December 31, 2017 (dollars in thousands, except for footnotes):
Location | No. of Farms | Total Acres | Farm Acres | Net Cost Basis(1) | Encumbrances(2) | |||||||||
California | 28 | 8,080 | 7,308 | $ | 208,774 | $ | 152,860 | |||||||
Florida | 16 | 11,006 | 8,846 | 114,225 | 73,264 | |||||||||
Colorado | 10 | 31,450 | 24,513 | 42,409 | 25,579 | |||||||||
Arizona(3) | 6 | 6,280 | 5,228 | 41,341 | 23,333 | |||||||||
Oregon | 4 | 2,313 | 2,003 | 19,806 | 12,978 | |||||||||
Nebraska | 2 | 2,559 | 2,101 | 10,626 | 6,602 | |||||||||
Washington | 1 | 746 | 417 | 9,386 | 5,412 | |||||||||
Michigan | 4 | 270 | 183 | 2,936 | 1,659 | |||||||||
North Carolina | 2 | 310 | 295 | 2,361 | 1,301 | |||||||||
73 | 63,014 | 50,894 | $ | 451,864 | $ | 302,988 | ||||||||
(1) | Consists of the initial acquisition price (including the costs allocated to both tangible and intangible assets acquired and liabilities assumed), plus subsequent improvements and other capitalized costs associated with the properties, and adjusted for accumulated depreciation and amortization. Includes Investments in real estate, net (excluding improvements paid for by the tenant) and Lease intangibles, net; plus net above-market lease values and lease incentives included in Other assets, net; and less net below-market lease values and deferred revenue included in Other liabilities, net, each as shown on the accompanying Consolidated Balance Sheet. |
(2) | Excludes approximately $2.0 million of deferred financing costs related to mortgage notes and bonds payable included in Mortgage notes and bonds payable, net on the accompanying Consolidated Balance Sheet. |
(3) | Includes two farms in which we own a leasehold interest via ground leases with the State of Arizona that expire in February 2022 and February 2025, respectively. In total, these two farms consist of 1,368 total acres and 1,221 farm acres and had a net cost basis of approximately $3.2 million as of December 31, 2017 (included in Lease intangibles, net on the accompanying Consolidated Balance Sheet). |
Real Estate
The following table sets forth the components of our investments in tangible real estate assets as of December 31, 2017 and 2016 (dollars in thousands):
December 31, 2017 | December 31, 2016 | |||||||
Real estate: | ||||||||
Land and land improvements | $ | 356,316 | $ | 265,985 | ||||
Irrigation systems | 50,282 | 33,969 | ||||||
Buildings | 18,191 | 14,671 | ||||||
Horticulture | 34,803 | 17,759 | ||||||
Other site improvements | 6,551 | 4,993 | ||||||
Real estate, at cost | 466,143 | 337,377 | ||||||
Accumulated depreciation | (16,657 | ) | (11,066 | ) | ||||
Real estate, net | $ | 449,486 | $ | 326,311 | ||||
Real estate depreciation expense on these tangible assets was approximately $6.2 million, $4.4 million, and $2.3 million for the years ended December 31, 2017, 2016, and 2015, respectively.
Included in the figures above are amounts related to improvements on certain of our properties paid for by our tenants but owned by us, or tenant improvements. As of December 31, 2017 and 2016, we recorded tenant improvements, net of accumulated depreciation, of approximately $2.4 million and $1.8 million, respectively. We recorded both depreciation expense and additional rental revenue related to these tenant improvements of approximately $220,000, $147,000, and $62,000 during the years ended December 31, 2017, 2016, and 2015, respectively.
78
Intangible Assets and Liabilities
The following table summarizes the carrying value of lease intangibles and the accumulated amortization for each intangible asset or liability class as of December 31, 2017 and 2016 (dollars in thousands):
December 31, 2017 | December 31, 2016 | |||||||
Lease intangibles: | ||||||||
Leasehold interests – land | $ | 3,498 | $ | — | ||||
In-place leases | 1,451 | 1,481 | ||||||
Leasing costs | 1,490 | 1,086 | ||||||
Tenant relationships | 439 | 706 | ||||||
Lease intangibles, at cost | 6,878 | 3,273 | ||||||
Accumulated amortization | (1,386 | ) | (1,273 | ) | ||||
Lease intangibles, net | $ | 5,492 | $ | 2,000 | ||||
Total amortization expense related to these lease intangible assets, including amounts charged to amortization expense due to early lease terminations, was approximately $1.1 million, $741,000, and $842,000 for the years ended December 31, 2017, 2016, and 2015, respectively. During the years ended December 31, 2017, 2016, and 2015, we charged approximately $102,000, $9,000, and $20,000, respectively, to amortization expense due to early lease terminations.
The following table summarizes the carrying values of certain lease intangible assets or liabilities included in Other assets and Other liabilities, respectively, on the accompanying Consolidated Balance Sheets and the related accumulated amortization or accretion, respectively, as of December 31, 2017, and 2016 (dollars in thousands).
December 31, 2017 | December 31, 2016 | |||||||||||||||
Intangible Asset or Liability | Deferred Rent Asset (Liability) | Accumulated (Amortization) Accretion | Deferred Rent Asset (Liability) | Accumulated (Amortization) Accretion | ||||||||||||
Above-market lease values and lease incentives(1) | $ | 26 | $ | (5 | ) | $ | 19 | $ | (14 | ) | ||||||
Below-market lease values and deferred revenue(2) | (823 | ) | 125 | (785 | ) | 61 | ||||||||||
$ | (797 | ) | $ | 120 | $ | (766 | ) | $ | 47 | |||||||
(1) | Net above-market lease values and lease incentives are included as part of Other assets, net on the accompanying Consolidated Balance Sheets, and the related amortization is recorded as a reduction of rental income. |
(2) | Net below-market lease values and deferred revenue are included as a part of Other liabilities, net on the accompanying Consolidated Balance Sheets, and the related accretion is recorded as an increase to rental income. |
Total amortization related to above-market lease values and lease incentives was approximately $10,000, $7,000 and $17,000 for the years ended December 31, 2017, 2016, and 2015, respectively. Total accretion related to below-market lease values and other deferred revenue was $63,000, $38,000 and $179,000 for the years ended December 31, 2017, 2016, and 2015, respectively.
The estimated aggregate amortization expense to be recorded related to in-place lease values, leasing costs, and tenant relationships and the estimated net impact on rental income from the amortization of above-market lease values and lease incentives or accretion of above-market lease values and deferred revenue for each of the five succeeding fiscal years and thereafter is as follows (dollars in thousands):
Period | Estimated Amortization Expense | Estimated Net Increase to Rental Income | |||||||
For the fiscal years ending December 31: | 2018 | $ | 1,037 | $ | 60 | ||||
2019 | 978 | 62 | |||||||
2020 | 911 | 61 | |||||||
2021 | 744 | 60 | |||||||
2022 | 516 | 33 | |||||||
Thereafter | 1,306 | 401 | |||||||
$ | 5,492 | $ | 677 | ||||||
Acquisitions
79
Until our adoption of ASU 2017-01, which clarified the definition of a business, certain acquisitions during the prior-year periods presented were accounted for as business combinations in accordance with ASC 805, as there was a prior leasing history on the property. As such, the fair value of all assets acquired and liabilities assumed were determined in accordance with ASC 805, and all acquisition-related costs were expensed as incurred, other than those costs directly related to reviewing or assigning leases that we assumed upon acquisition, which were capitalized as part of leasing costs. Upon our early adoption of ASU 2017-01, effective October 1, 2016, most acquisitions, including those with a prior leasing history, are now generally treated as an asset acquisition under ASC 360. For acquisitions accounted for as asset acquisitions under ASC 360, all acquisition-related costs were capitalized and included as part of the fair value allocation of the identifiable tangible and intangible assets acquired, other than those costs that directly related to originating new leases we executed upon acquisition, which were capitalized as part of leasing costs.
In addition, total consideration for acquisitions may include a combination of cash and equity securities, such as OP Units. When OP Units are issued in connection with acquisitions, we determine the fair value of the OP Units issued based on the number of units issued multiplied by the closing price of the Company’s common stock on the date of acquisition.
2017 Acquisitions
During the year ended December 31, 2017, we acquired 16 new farms, which are summarized in the table below (dollars in thousands, except for footnotes).
Property Name | Property Location | Acquisition Date | Total Acreage | No. of Farms | Primary Crop(s) | Lease Term(1) | Renewal Options | Total Purchase Price | Acquisition Costs(2) | Annualized Straight-line Rent(3) | New Long-term Debt Issued | |||||||||||||||||||
Citrus Boulevard | Martin, FL | 1/12/2017 | 3,748 | 1 | Organic Vegetables | 7.0 years | 3 (5 years) | $ | 54,000 | $ | 80 | $ | 2,926 | $ | 32,400 | |||||||||||||||
Spot Road(4) | Yuma, AZ | 6/1/2017 | 3,280 | 4 | Melons and Alfalfa Hay | 8.6 years | 1 (10 years) & 1 (2 years) | 27,500 | 88 | 1,672 | 15,300 | |||||||||||||||||||
Poplar Street | Bladen, NC | 6/2/2017 | 310 | 2 | Organic Blueberries | 9.6 years | 1 (5 years) | 2,169 | 49 | 122 | (5) | 1,301 | ||||||||||||||||||
Phelps Avenue | Fresno, CA | 7/17/2017 | 847 | 4 | Pistachios and Almonds | 10.3 years | 1 (5 years) | 13,603 | 43 | 681 | (5) | 8,162 | ||||||||||||||||||
Parrot Avenue(6) | Okeechobee, FL | 8/9/2017 | 1,910 | 1 | Misc. Vegetables | 0.5 years | None | 9,700 | 67 | 488 | 5,820 | |||||||||||||||||||
Cat Canyon Road(7) | Santa Barbara, CA | 8/30/2017 | 361 | 1 | Wine Grapes | 9.8 years | 2 (5 years) | 5,375 | 112 | 320 | 3,225 | |||||||||||||||||||
Oasis Road | Walla Walla, WA | 9/8/2017 | 746 | 1 | Apples, Cherries, and Wine Grapes | 6.3 years | None | 9,500 | 45 | 484 | (5) | 5,460 | ||||||||||||||||||
JJ Road | Baca, CO | 10/2/2017 | 1,280 | 1 | Grass Hay | 4.3 years | 1 (5 years) | 900 | 26 | 52 | 540 | |||||||||||||||||||
Jayne Avenue | Fresno, CA | 12/15/2017 | 159 | 1 | Organic Almonds | 19.9 years | 2 (5 years) | 5,925 | 44 | 364 | (5) | 3,555 | ||||||||||||||||||
12,641 | 16 | $ | 128,672 | $ | 554 | $ | 7,109 | $ | 75,763 | |||||||||||||||||||||
(1) | Where more than one lease was assumed or executed, represents the weighted-average lease term on the property. |
(2) | Unless noted otherwise, acquisitions were accounted for as asset acquisitions under ASC 360. |
(3) | Annualized straight-line amount is based on the minimum cash rental payments guaranteed under the lease, as required under GAAP. |
(4) | Includes two farms (1,368 total acres) acquired through a leasehold interest, with the State of Arizona as the lessor. These state leases expire in February 2022 (485 total acres) and February 2025 (883 total acres). In addition, in connection with the acquisition of this property, we assumed four in-place leases with us as the lessor or sublessor. Three of these leases are agricultural leases, with one lease expiring on June 30, 2019, and two leases expiring on September 15, 2026. The fourth lease is a residential lease that expires on September 30, 2019. If either of the state leases is not renewed upon its expiration, the subleases on the respective acreage shall terminate automatically. |
(5) | Leases also provide for a variable rent component based on the gross crop revenues earned on the property. The figures above represent only the minimum cash rents guaranteed under the respective leases. |
(6) | In connection with the acquisition of this property, we executed a 6-year, follow-on lease with a new tenant that begins upon the expiration of the 7-month lease assumed at acquisition. The follow-on lease includes two, 6-year extension options and provides for minimum annualized straight-line rents of approximately $542,000. In addition, in connection with the execution of the follow-on lease, we committed to providing up to $1.0 million of capital for certain irrigation and property improvements. As stipulated in the follow-on lease, we will earn additional rental income on the total cost of the improvements as disbursements are made by us at a rate commensurate with the annual yield on the farmland (as determined by each year's minimum cash rent per the follow-on lease). |
(7) | In connection with the acquisition of this property, we committed up to $4.0 million of capital to fund the development of additional vineyard acreage on the property. As stipulated in the lease agreement, we will earn additional rental income on the total cost of the project as the capital is disbursed by us at rates specified in the lease. |
During the year ended December 31, 2017, in the aggregate, we recognized operating revenues of approximately $4.5 million, and earnings of approximately $1.1 million, related to the above acquisitions.
80
2016 Acquisitions
During the year ended December 31, 2016, we acquired 15 new farms in nine separate transactions, which are summarized in the table below (dollars in thousands, except for footnotes).
Property Name | Property Location | Acquisition Date | Total Acreage | No. of Farms | Primary Crop(s) | Lease Term | Renewal Options | Total Purchase Price | Acquisition Costs | Annualized Straight-line Rent(1) | New Long-term Debt Issued | |||||||||||||||||||
Gunbarrel Road (2) | Saguache, CO | 3/3/2016 | 6,191 | 3 | Organic Potatoes | 5.0 years | 1 (5 years) | $ | 25,736 | $ | 119 | (3) | $ | 1,591 | $ | 15,531 | ||||||||||||||
Calaveras Avenue | Fresno, CA | 4/5/2016 | 453 | 1 | Pistachios | 10.0 years | 1 (5 years) | 15,470 | 38 | (4) | 774 | (5) | 9,282 | |||||||||||||||||
Orange Avenue | St. Lucie, FL | 7/1/2016 | 401 | 1 | Vegetables | 7.0 years | 2 (7 years) | 5,100 | 38 | (4) | 291 | 3,120 | ||||||||||||||||||
Lithia Road | Hillsborough, FL | 8/11/2016 | 72 | 1 | Strawberries | 5.0 years | None | 1,700 | 38 | (3) | 97 | 1,020 | ||||||||||||||||||
Baca County(6) | Baca, CO | 9/1/2016 | 7,384 | 5 | Grass Hay and Alfalfa | 4.0 years | 1 (5 years) | 6,323 | 73 | (4) | 384 | — | ||||||||||||||||||
Diego Ranch(7) | Stanislaus, CA | 9/14/2016 | 1,357 | 1 | Almonds | 3.0 years | 3 (5 years) & 1 (3 years) | 13,996 | 64 | (3) | 621 | — | ||||||||||||||||||
Nevada Ranch | Merced, CA | 9/14/2016 | 1,130 | 1 | Almonds | 3.0 years | 3 (5 years) & 1 (3 years) | 13,232 | 42 | (3) | 574 | — | ||||||||||||||||||
Central Avenue | Fresno, CA | 10/13/2016 | 197 | 1 | Almonds | 10.0 years | 2 (5 years) | 6,500 | 29 | (4) | 325 | 3,900 | ||||||||||||||||||
Horse Creek(8) | Baca, CO | 12/28/2016 | 16,595 | 1 | Grass Hay and Alfalfa | 4.0 years | 1 (5 years) | 11,665 | 55 | (4) | 717 | — | ||||||||||||||||||
33,780 | 15 | $ | 99,722 | $ | 496 | $ | 5,374 | $ | 32,853 | |||||||||||||||||||||
(1) | Annualized straight-line amount is based on the minimum cash rental payments guaranteed under the lease, as required under GAAP. |
(2) | As partial consideration for the acquisition of this property, we issued 745,879 OP Units, constituting an aggregate fair value of approximately $6.5 million as of the acquisition date. We incurred $25,500 of legal costs in connection with the issuance of these OP Units. |
(3) | Acquisition accounted for as a business combination under ASC 805. In aggregate, $9,520 of these costs were direct leasing costs incurred in connection with these acquisitions. |
(4) | Acquisition accounted for as an asset acquisition under ASC 360. |
(5) | Lease also provides for a variable rent component based on the gross crop revenues earned on the property. The figure above represents only the minimum cash rents guaranteed under the lease. |
(6) | As partial consideration for the acquisition of this property, we issued 125,677 OP Units, constituting an aggregate fair value of approximately $1.5 million as of the acquisition date. We incurred approximately $8,235 of legal costs in connection with the issuance of these OP Units. |
(7) | As partial consideration for the acquisition of this property, we issued 343,750 OP Units, constituting an aggregate fair value of approximately $3.9 million as of the acquisition date. We incurred approximately $21,710 of legal costs in connection with the issuance of these OP Units. |
(8) | As partial consideration for the acquisition of this property, we issued 233,952 OP Units, constituting as aggregate fair value of approximately $2.6 million as of the acquisition date. We incurred $7,675 of legal costs in connection with the issuance of these OP Units. |
During the year ended December 31, 2016, in the aggregate, we recognized operating revenues of approximately $2.6 million, and earnings of approximately $196,000, related to the above acquisitions (which earnings figure includes approximately $206,000 of non-recurring acquisition-related costs).
Purchase Price Allocations
The allocation of the aggregate purchase price for the farms acquired during each of the years ended December 31, 2017 and 2016 is as follows (dollars in thousands):
Acquisition Period | Land and Land Improvements | Buildings | Irrigation Systems | Other Improvements | Horticulture | Leasehold Interest – Land | In-place Leases | Leasing Costs | Net Below-Market Leases | Total Purchase Price | |||||||||||||||||||||||||||||
2017 Acquisitions | $ | 92,516 | $ | 2,805 | $ | 11,844 | $ | 835 | $ | 16,213 | $ | 3,488 | 486 | $ | 508 | $ | (23 | ) | $ | 128,672 | |||||||||||||||||||
2016 Acquisitions | 73,351 | 3,690 | 5,199 | 2,248 | 14,868 | — | 501 | 447 | (582 | ) | 99,722 | ||||||||||||||||||||||||||||
Acquired Intangibles and Liabilities
The following table shows the weighted-average amortization period, in years, for the intangible assets acquired and liabilities assumed in connection with new real estate acquired during the years ended December 31, 2017 and 2016:
81
Weighted-Average Amortization Period (in Years) | ||||
Intangible Assets and Liabilities | 2017 | 2016 | ||
Leasehold interest – land | 6.9 | 0 | ||
In-place leases | 6.3 | 8.7 | ||
Leasing costs | 8.8 | 11.6 | ||
Above-market lease values and lease incentives | 5.4 | 0 | ||
Below-market lease values and deferred revenue | 4.7 | 20.9 | ||
All intangible assets and liabilities | 7.0 | 14.2 | ||
Pro-Forma Financials
During each of the years ended December 31, 2016 and 2015, we acquired six farms in transactions that qualified as business combinations. The following table reflects pro-forma consolidated financial information as if each of these farms was acquired on January 1 of the respective prior fiscal year. In addition, pro-forma earnings have been adjusted to assume that acquisition-related costs related to these farms were incurred at the beginning of the previous fiscal year. No farms were acquired during the year ended December 31, 2017, that were treated as business combinations.
For the years ended | ||||||||
December 31, 2016 | December 31, 2015 | |||||||
(Dollars in thousands, except per-share amounts) | (Unaudited) | (Unaudited) | ||||||
Operating Data: | ||||||||
Total operating revenue | $ | 18,206 | $ | 13,552 | ||||
Net income (loss) attributable to the company | 901 | (419 | ) | |||||
Share and Per-share Data: | ||||||||
Earnings (loss) per share of common stock – basic and diluted | $ | 0.09 | $ | (0.05 | ) | |||
Weighted-average common shares outstanding – basic and diluted | 10,007,350 | 8,639,397 | ||||||
The pro-forma consolidated results are prepared for informational purposes only. They are not necessarily indicative of what our consolidated financial condition or results of operations actually would have been assuming the acquisitions had occurred at the beginning of the respective previous periods, nor do they purport to represent our consolidated financial position or results of operations for future periods.
Property Dispositions
On November 30, 2017, we completed the sale of a 219-acre farm in Hillsborough County, Florida (“Colding Loop”), to the existing tenant for $3.9 million, recognizing a net gain on the sale (inclusive of closing costs) of approximately $85,000.
In addition, during the year ended December 31, 2017, we recorded an aggregate loss of approximately $106,000 due to: (i) the removal of certain blueberry bushes owned by us that were removed to allow for the planting of new varieties of blueberry bushes, and (ii) the abandonment on one well.
Significant Existing Real Estate Activity
Leasing Activity
During the year ended December 31, 2017, we executed ten separate leases on nine different farms in California and Florida that had leases expiring in either 2017 or 2018. In total, these leases were renewed for additional terms ranging between one and five years and for total annualized rents of approximately $2.2 million, representing a decrease of approximately $167,000 (approximately 7.0%) from that of the prior leases. These renewals were executed without incurring any downtime on the respective farms, and no leasing commissions or tenant improvements were incurred in connection with these renewals.
In addition, on December 31, 2017, we terminated the lease with the tenant occupying a farm in Santa Cruz County, California, and entered into a new lease with a new tenant to occupy the farm, beginning January 1, 2018. The prior lease was originally scheduled to expire on December 31, 2020, and in connection with its early termination, during the year ended December 31, 2017, we wrote off approximately $99,000 of deferred rent asset balance to bad debt expense, which is included in General and administrative expenses on the accompanying Consolidated Statements of Operations. The new lease is scheduled to expire on December 31, 2020, and provides for annualized straight-line rent of approximately $605,000, representing a 10.9% increase
82
over that of the prior lease (before its termination). No downtime was incurred as a result of the early termination and re-leasing of this farm, nor were any leasing commissions or tenant improvements incurred in connection with the new lease.
Project Completion
In connection with the lease we executed upon our acquisition of an 854-acre farm in California in September 2015, we agreed to fund the development of the property into an almond orchard. The development included the removal of 274 acres of old grape vineyards, the installation of a new irrigation system, including the drilling of four new wells, and the planting of over 800 acres of new almond trees. As of December 31, 2017, the development project had been completed at a total cost of approximately $8.4 million, and, as a result, we expect to receive approximately $5.2 million of additional rent throughout the term of the lease, which expires January 9, 2031.
TRS Lease Assumption
On October 17, 2017, our TRS entered into an Assignment and Assumption of Agricultural Lease (the “Assigned TRS Lease”) with the previously-existing tenant on a 169-acre farm located in Ventura County, California. The Assigned TRS Lease was then amended to shorten the lease term by two years (the new expiration date is July 31, 2018) and to remove any tenant renewal options. All other terms of the lease remained unchanged, including the rental amounts. In addition, to fund the initial operations on the farm, on October 17, 2017, our TRS issued a $1.7 million unsecured promissory note to the Company that is scheduled to mature on July 31, 2018, and will bear interest at a rate equal to the prime rate plus a spread of 5.0% per annum. Repayment of the promissory note, along with interest accrued on the note, is expected to be funded by crop sales earned on the farm by our TRS.
As our wholly-owned TRS is operating the farm, the amount of rent and interest our TRS pays to us (as the parent-landlord and parent-lender) will not be qualifying income for purposes of certain of our REIT tests; however, we do not expect such amounts to be at a level where we would be at risk of not qualifying as a REIT.
Involuntary Conversions and Property and Casualty Recovery
In April 2014, two separate fires occurred on two of our properties, partially damaging a structure on each property. During the year ended December 31, 2015, we recovered approximately $97,000 of insurance proceeds, and, in accordance with ASC 450, “Contingencies,” such recovery is included in Property and casualty recovery on the accompanying Consolidated Statements of Operations. Repairs have been completed on each of these properties, and each of the insurance claims have been closed. No further recoveries are expected for either of these fires.
Future Rental Payments
Future operating rental payments owed from tenants under all non-cancelable leases (excluding tenant reimbursement of certain expenses) for each of the five succeeding fiscal years and thereafter as of December 31, 2017, are as follows (dollars in thousands):
Period | Tenant Rental Payments | |||||
For the fiscal years ending December 31: | 2018 | $ | 25,974 | |||
2019 | 25,334 | |||||
2020 | 22,755 | |||||
2021 | 16,630 | |||||
2022 | 16,089 | |||||
Thereafter | 56,572 | |||||
$ | 163,354 | |||||
Portfolio Diversification and Concentrations
Diversification
The following unaudited table summarizes the geographic locations, by state, of our properties with leases in place as of December 31, 2017 and 2016 (dollars in thousands):
83
As of and For the Year Ended December 31, 2017 | As of and For the Year Ended December 31, 2016 | |||||||||||||||||||||||
State | No. of Farms | Total Acres | % of Total Acres | Rental Revenue | % of Total Rental Revenue | No. of Farms | Total Acres | % of Total Acres | Rental Revenue | % of Total Rental Revenue | ||||||||||||||
California | 28 | 8,080 | 12.8% | $ | 12,006 | 47.8% | 22 | 6,713 | 13.3% | $ | 9,829 | 56.8% | ||||||||||||
Florida | 16 | 11,006 | 17.5% | 6,585 | 26.2% | 15 | 5,567 | 11.0% | 3,293 | 19.0% | ||||||||||||||
Colorado | 10 | 31,450 | 49.9% | 2,704 | 10.8% | 9 | 30,170 | 59.6% | 1,453 | 8.4% | ||||||||||||||
Arizona | 6 | 6,280 | 10.0% | 1,572 | 6.3% | 2 | 3,000 | 5.9% | 729 | 4.2% | ||||||||||||||
Oregon | 4 | 2,313 | 3.7% | 1,189 | 4.7% | 4 | 2,313 | 4.6% | 1,172 | 6.8% | ||||||||||||||
Nebraska | 2 | 2,559 | 4.0% | 580 | 2.3% | 2 | 2,559 | 5.1% | 580 | 3.4% | ||||||||||||||
Michigan | 4 | 270 | 0.4% | 249 | 1.0% | 4 | 270 | 0.5% | 250 | 1.4% | ||||||||||||||
Washington | 1 | 746 | 1.2% | 152 | 0.6% | — | — | —% | — | —% | ||||||||||||||
North Carolina | 2 | 310 | 0.5% | 74 | 0.3% | — | — | —% | — | —% | ||||||||||||||
73 | 63,014 | 100.0% | $ | 25,111 | 100.0% | 58 | 50,592 | 100.0% | $ | 17,306 | 100.0% | |||||||||||||
Concentrations
Credit Risk
As of December 31, 2017, our farms were leased to 52 different, third-party tenants (plus one related-party tenant), with certain tenants leasing more than one farm. One unrelated tenant (“Tenant A”) leases five of our farms, and aggregate rental revenue attributable to Tenant A accounted for approximately 4.3 million, or 17.3% of the rental revenue recorded during the year ended December 31, 2017. In addition, throughout 2017, Dole Food Company (“Dole”) leased two of our farms, and aggregate rental revenue attributable to Dole accounted for approximately $3.0 million, or 11.8% of the rental revenue recorded during the year ended December 31, 2017. Both of the leases with Dole were originally scheduled to expire in 2020; however, one of the leases was terminated on December 31, 2017, and re-leased to a new, third-party tenant, with the new lease commencing on January 1, 2018. Therefore, we do not expect rental revenues attributable to leases with Dole to make up more than 10.0% of our total rental revenues during 2018. However, if Tenant A fails to make rental payments, elects to terminate its leases prior to their expirations, or does not renew its leases, and we cannot re-lease the farms on satisfactory terms, there could be a material adverse effect on our financial performance and ability to continue operations. No other individual tenant represented greater than 10.0% of the total rental revenue recorded during the year ended December 31, 2017.
Geographic Risk
As of December 31, 2017, 28 of the 73 farms we owned were located in California, 16 farms were located in Florida, and 10 farms were located in Colorado. Further, our California, Florida, and Colorado farms accounted for approximately $12.0 million (47.8%), $6.6 million (26.2%), and $2.7 million (10.8%), respectively, of the rental revenue recorded during the year ended December 31, 2017. Our 28 California farms are spread across four of the many different growing regions within the state. Though we seek to continue to further diversify geographically, as may be desirable or feasible, should an unexpected natural disaster occur where our properties are located, there could be a material adverse effect on our financial performance and ability to continue operations. None of our farms in California or Florida were materially impacted by the recent wildfires or hurricanes in those respective areas. No other single state accounted for more than 10.0% of the total rental revenue recorded during the year ended December 31, 2017.
NOTE 4. BORROWINGS
Our borrowings as of December 31, 2017 and 2016 are summarized below (dollars in thousands):
84
Carrying Value as of | As of December 31, 2017 | |||||||||||
December 31, 2017 | December 31, 2016 | Stated Interest Rates(1) (Range; Wtd Avg) | Maturity Dates (Range; Wtd Avg) | |||||||||
Mortgage notes and bonds payable: | ||||||||||||
Fixed-rate mortgage notes payable | $ | 208,469 | $ | 142,861 | 3.16%–4.70%; 3.62% | 6/1/2020–11/1/2041; May 2029 | ||||||
Fixed-rate bonds payable | 84,519 | 49,348 | 2.38%–4.05%; 3.13% | 7/30/2018–8/30/2024; June 2021 | ||||||||
Total mortgage notes and bonds payable | 292,988 | 192,209 | ||||||||||
Deferred financing costs – mortgage notes and bonds payable | (1,986 | ) | (1,412 | ) | N/A | N/A | ||||||
Mortgage notes and bonds payable, net | $ | 291,002 | $ | 190,797 | ||||||||
Variable-rate revolving lines of credit | $ | 10,000 | $ | 16,550 | 3.60% | 4/5/2024 | ||||||
Total borrowings, net | $ | 301,002 | $ | 207,347 | ||||||||
(1) | Where applicable, stated interest rates are before interest patronage (as described below). |
The weighted-average interest rate charged on the above borrowings, excluding the impact of deferred financing costs and before any interest patronage, or refunded interest, was 3.38% for the year ended December 31, 2017, as compared to 3.27% for the year ended December 31, 2016, and 3.44% for the year ended December 31, 2015. In addition, 2016 interest patronage from our Farm Credit CFL Notes Payable (as defined below), which we received and recorded during the six months ended June 30, 2017, resulted in a 17.2% reduction (approximately 61 basis points) to the stated interest rate on such borrowings. We are unable to estimate the amount of patronage to be received, if any, related to interest accrued during 2017 on our Farm Credit Notes Payable.
Metlife Borrowings
MetLife Facility
On May 9, 2014, we closed on a credit facility (the “MetLife Facility”) with Metropolitan Life Insurance Company (“MetLife”) that originally consisted of a $100.0 million long-term note payable (the “2014 MetLife Term Note”) and a $25.0 million revolving equity line of credit (the “2014 MetLife Line of Credit”). On October 5, 2016, we executed an amendment with MetLife to increase the overall size of the MetLife Facility from $125.0 million to $200.0 million (the “2016 Amendment”). Pursuant to the 2016 Amendment, the MetLife Facility consisted of the 2014 MetLife Term Note, the 2014 MetLife Line of Credit, a $50.0 million long-term note payable (the “2016 MetLife Term Note,” and together with the 2014 MetLife Term Note, the “MetLife Term Notes”), the terms of which are pari passu with those of the 2014 MetLife Term Note, and a $25.0 million revolving equity line of credit (the “2016 MetLife Line of Credit,” and together with the 2014 MetLife Line of Credit, the “MetLife Lines of Credit”), the terms of which are pari passu to those of the 2014 MetLife Line of Credit. On December 15, 2017, we executed an additional amendment with MetLife to further increase the size of the MetLife Facility from $200.0 million to $275.0 million (the “2017 Amendment”). Pursuant to the 2017 Amendment, the 2016 MetLife Term Note was increased from $50.0 million to $100.0 million, and the 2016 MetLife Line of Credit was increased from $25.0 million to $50.0 million. In addition, the 2017 Amendment extended the draw period under each of the MetLife Term Notes by an additional year, through December 31, 2019, and adjusted the unused fee on all borrowings under the MetLife Facility from a flat fee of 0.20% on undrawn amounts to a sliding fee (ranging from 0.10% to 0.20%) based on the balance drawn under each individual note. As a result of the 2016 Amendment and the 2017 Amendment, the MetLife Facility now consists of an aggregate of $200.0 million of term notes and $75.0 million of revolving equity lines of credit.
The following table summarizes the terms of the MetLife Facility as of December 31, 2017 (dollars in thousands, except for footnotes):
Issuance | Aggregate Commitment | Maturity Dates | Principal Outstanding | Interest Rate Terms | Undrawn Commitment | ||||||||||||
MetLife Term Notes | $ | 200,000 | (1) | 1/5/2029 | $ | 131,210 | 3.30%, fixed through 1/4/2027 | (2) | $ | 63,530 | (3),(4) | ||||||
MetLife Lines of Credit | 75,000 | 4/5/2024 | 10,000 | 3-month LIBOR + 2.25% | (5) | 65,000 | (3) | ||||||||||
Total principal outstanding | $ | 141,210 | |||||||||||||||
(1) | If the aggregate commitment under this facility is not fully utilized by December 31, 2019, MetLife has the option to be relieved of its obligations to disburse the additional funds under the MetLife Term Notes. |
85
(2) | Represents the blended interest rate as of December 31, 2017. Interest rates for subsequent disbursements will be based on then-prevailing market rates. The interest rate on all then-outstanding disbursements will be subject to adjustment on January 5, 2027. Through December 31, 2019, the MetLife Term Notes are also subject to an unused fee ranging from 0.10% to 0.20% on undrawn amounts (based on the balance drawn under the notes). |
(3) | Based on the properties that were pledged as collateral under the MetLife Facility, as of December 31, 2017, the maximum additional amount we could draw under the facility was approximately $8.0 million. |
(4) | Net of amortizing principle payments of approximately $5.3 million. |
(5) | The interest rate on the MetLife Lines of Credit is subject to a minimum annualized rate of 2.50%, plus an unused fee ranging from 0.10% to 0.20% on undrawn amounts (based on the balance drawn under the lines of credit). The interest rate spread will be subject to adjustment on October 5, 2019. As of December 31, 2017, the interest rate on the MetLife Lines of Credit was 3.60%. |
Under the MetLife Facility, we are generally allowed to borrow up to 60% of the aggregate of the lower of cost or the appraised value of the pool of agricultural real estate pledged as collateral. Our continuing ability to borrow under the MetLife Facility is subject to our ongoing compliance with various affirmative and negative covenants (as further described below), including with respect to liens, indebtedness, mergers, and asset sales.
In connection with obtaining the MetLife Facility, as amended, and the subsequent pledging of properties under the facility, through December 31, 2017, we have incurred total loan origination fees of approximately $658,000 (including approximately $213,000 and $225,000 for the 2017 Amendment and the 2016 Amendment, respectively) and additional financing costs (consisting of legal fees and administrative fees) of approximately $713,000. In addition, approximately $299,000 of unamortized deferred financing costs associated with a prior credit facility we had with MetLife were further deferred and are being amortized over the term of the MetLife Facility.
As of December 31, 2017, the MetLife Facility was collateralized by 33 farms with an aggregate book value of approximately $187.4 million.
Individual MetLife Notes
In May 2017, we also entered into two new loan agreements with MetLife (collectively, the “Individual MetLife Notes”), the terms of which are summarized in the aggregate in the table below (dollars in thousands):
Date of Issuance | Amount | Maturity Date | Principal Amortization | Interest Rate Terms | ||||
5/31/2017 | $15,300 | (1) | 2/14/2022 & 2/14/2025 | 28.6 years | 3.55% & 3.85%, fixed throughout their respective terms | |||
(1) | Proceeds from these notes were used for the acquisition of a new property. |
The Individual MetLife Notes have a loan-to-value ratio of 60% of the underlying agricultural real estate. Our agreement with MetLife for the Individual MetLife Notes contains various affirmative and negative covenants (as further described below), including with respect to liens, indebtedness, mergers, and asset sales.
In connection with the Individual MetLife Notes, we incurred total loan origination fees of approximately $38,000 and additional financing costs (including legal fees and administrative fees) of approximately $38,000.
As of December 31, 2017, the Individual MetLife Notes were collateralized by four farms with an aggregate book value of approximately $28.2 million.
Both of our agreements with MetLife (including the MetLife Facility and the Individual MetLife Notes) require that we satisfy financial covenants on a consolidated basis at the end of each calendar quarter, including staying below a maximum debt-to-asset-value ratio and maintaining a minimum net worth value and rental-revenue-to-debt ratio. Amounts owed to MetLife under each of the agreements are guaranteed by us and each subsidiary of ours that owns a property pledged as collateral pursuant to the respective loan documents. As of December 31, 2017, we were in compliance with all covenants under each of the agreements with MetLife.
Farm Credit Notes Payable
From time to time since September 2014, we, through certain subsidiaries of our Operating Partnership, have entered into various loan agreements with certain Farm Credit associations, including Farm Credit of Central Florida, FLCA (“Farm Credit CFL”), Farm Credit West, FLCA (“Farm Credit West”), Cape Fear Farm Credit, ACA (“CF Farm Credit”), Farm Credit of Florida, ACA (“Farm Credit FL”), and Northwest Farm Credit Services, FLCA (“NW Farm Credit,” and, collectively, with the other Farm Credit associations, “Farm Credit”). During the year ended December 31, 2017, we entered into the following loan agreements with Farm Credit (dollars in thousands):
86
Issuer | Date of Issuance | Amount(1) | Maturity Date | Principal Amortization | Stated Interest Rate Terms(2) | |||||||
CF Farm Credit | 6/14/2017 | $ | 1,301 | 7/1/2022 | 40.2 years | 4.41%, fixed throughout its term | ||||||
Farm Credit CFL(3) | 7/13/2017 | 5,472 | 8/1/2022 | 28.4 years | 4.47%, fixed throughout term | |||||||
Farm Credit West | 7/17/2017 | 8,162 | 5/1/2037 | 20.0 years | 4.31%, fixed through 7/31/2024, variable thereafter | |||||||
Farm Credit FL | 8/9/2017 | 5,820 | 3/1/2037 | 19.5 years | 4.70%, fixed through 2/29/2024, variable thereafter | |||||||
NW Farm Credit | 9/8/2017 | 5,460 | 9/1/2024 | 39.6 years | 4.41%, fixed throughout its term | |||||||
Farm Credit West | 12/20/2017 | 3,555 | 11/1/2037 | 20.0 years | 4.67%, fixed through 12/31/2027, variable thereafter | |||||||
(1) | Proceeds from these notes were used to fund new acquisitions, to repay existing indebtedness, and for other general corporate purposes. |
(2) | Stated rate is before interest patronage, as discussed below. |
(3) | In July 2017, we amended four existing loan agreements with Farm Credit CFL to increase the loan amounts and adjust the principal amortization and interest rate terms as shown in the table above. The amount presented in the table above represents the total additional funds advanced under the four loans. The new terms of each of these four loans are pari passu with one another. |
In addition, on November 30, 2017, in connection with the sale of Colding Loop, we repaid a Farm Credit CFL mortgage note collateralized by the property in the amount of approximately $2.6 million, plus all accrued interest. The mortgage note bore interest at a fixed rate of 2.90% (which was fixed through April 30, 2018) and was originally scheduled to mature on May 1, 2030. There was no prepayment penalty incurred in connection with the early repayment.
The following table summarizes, in the aggregate, the pertinent terms of the loans outstanding from Farm Credit (collectively, the “Farm Credit Notes Payable”) as of December 31, 2017 (dollars in thousands, except for footnotes):
Issuer | # of Loans Outstanding | Dates of Issuance | Maturity Dates | Principal Outstanding | Stated Interest Rate(1) | ||||||||
Farm Credit CFL | 7 | 9/19/2014 – 7/13/2017 | 6/1/2020 – 10/1/2040 | $ | 24,664 | 4.29% | (2) | ||||||
Farm Credit West | 4 | 4/4/2016 – 12/20/2017 | 5/1/2037 – 11/1/2041 | 24,222 | 4.02% | (3) | |||||||
CF Farm Credit | 1 | 6/14/2017 | 7/1/2022 | 1,301 | 4.41% | (4) | |||||||
Farm Credit FL | 1 | 8/9/2017 | 3/1/2037 | 5,820 | 4.70% | (4) | |||||||
NW Farm Credit | 1 | 9/8/2017 | 9/1/2024 | 5,412 | 4.41% | (4) | |||||||
Total | 14 | $ | 61,419 | ||||||||||
(1) | Represents the weighted-average, blended rate (before interest patronage, as discussed below) on the respective borrowings as of December 31, 2017. |
(2) | In April 2017, we received interest patronage of approximately $124,000 related to interest accrued on loans from Farm Credit CFL during the year ended December 31, 2016, which resulted in a 15.8% reduction (approximately 55 basis points) to the stated interest rates on such borrowings. In March 2016, we received interest patronage related to loans from Farm Credit CFL of approximately $94,000. |
(3) | In February 2017, we received interest patronage of approximately $59,000 related to interest accrued on loans from Farm Credit West during the year ended December 31, 2016, which resulted in a 21.3% reduction (approximately 76 basis points) to the stated interest rates on such borrowings. We did not receive any patronage related to loans from Farm Credit West during the prior year. |
(4) | To date, no interest patronage has been received or recorded associated with these loans, as they were not outstanding prior to 2017. |
Interest patronage, or refunded interest, on our borrowings from the various Farm Credit associations is recorded upon receipt and is included in Other income on our Consolidated Statements of Operations. Receipt of interest patronage typically occurs in the first half of the calendar year following the year in which the respective interest payments are made.
Loans from Farm Credit will generally have a loan-to-value ratio of 60% of the underlying agricultural real estate. Our agreements with Farm Credit contain various affirmative and negative covenants, including with respect to liens, indebtedness, mergers, and asset sales. The Farm Credit Notes Payable also require us to satisfy certain financial covenants at the end of each calendar year, including maintaining a minimum current ratio and net worth value and staying below a maximum leverage ratio. In addition, certain amounts owed under the Farm Credit Notes Payable, limited to 12 months of principal and interest due under certain of the loans, are guaranteed by us pursuant to the loan documents. As of December 31, 2017, we were in compliance with all covenants applicable to the Farm Credit Notes Payable.
In connection with the Farm Credit Notes Payable, through December 31, 2017, we have incurred total loan origination fees of approximately $276,000 and additional financing costs (consisting of legal fees and administrative fees) of approximately $306,000.
As of December 31, 2017, the Farm Credit Notes Payable were collateralized by 22 farms with an aggregate book value of approximately $95.6 million.
Farmer Mac Facility
On December 5, 2014, we, through certain subsidiaries of our Operating Partnership, entered into a bond purchase agreement (the “Bond Purchase Agreement”) with Federal Agricultural Mortgage Corporation (“Farmer Mac”) and Farmer Mac Mortgage
87
Securities Corporation (the “Bond Purchaser”), for a secured note purchase facility that initially provided for bond issuances up to an aggregate principal amount of $75.0 million (the “Farmer Mac Facility”). On June 16, 2016, we entered into an amendment to increase the maximum borrowing capacity under the Farmer Mac Facility from $75.0 million to $125.0 million and extend the term of the Bond Purchase Agreement by two years, to December 11, 2018.
Pursuant to the Bond Purchase Agreement, we may, from time to time, issue one or more bonds to the Bond Purchaser that will be secured by a security interest in one or more loans originated by us (pursuant to the Pledge and Security Agreement described below), which, in turn, will be collateralized by first liens on agricultural real estate owned by subsidiaries of ours. The interest rate for each bond issuance will be based on prevailing market rates at the time of such issuance, and prepayment of each bond issuance will not be permitted unless otherwise agreed upon by all parties to the Bond Purchase Agreement. The bonds issued will generally have a maximum aggregate, effective loan-to-value ratio of 60% of the underlying agricultural real estate, after giving effect to the overcollateralization obligations described below.
During the year ended December 31, 2017, we issued five bonds for gross proceeds of approximately $35.6 million, the terms of which are summarized in the aggregate in the table below (dollars in thousands):
Dates of Issuance | Gross Proceeds | Maturity Dates | Principal Amortization | Interest Rate Terms | ||||||
1/12/2017-8/30/2017 | $ | 35,625 | (1) | 1/10/2020 – 8/30/2024 | None | 2.80% – 4.05%, fixed throughout their respective terms | ||||
(1) | Proceeds from these bonds were used for the acquisition of new properties. |
The following table summarizes, in the aggregate, the terms of the 14 bonds outstanding under the Farmer Mac Facility as of December 31, 2017 (dollars in thousands):
Dates of Issuance | Initial Commitment | Maturity Dates | Principal Outstanding | Stated Interest Rate(1) | Undrawn Commitment | ||||||||||||
12/11/2014–8/30/2017 | $ | 125,000 | (2) | 7/30/2018–8/30/2024 | $ | 84,519 | 3.13% | $ | 39,118 | (3) | |||||||
(1) | Represents the weighted-average interest rate as of December 31, 2017. |
(2) | If facility is not fully utilized by December 11, 2018, Farmer Mac has the option to be relieved of its obligations to purchase additional bonds under the facility. |
(3) | As of December 31, 2017, there was no additional availability to draw under this facility, as no additional properties had been pledged as collateral. |
Our ability to borrow under the Farmer Mac Facility is subject to our ongoing compliance with a number of customary affirmative and negative covenants, as well as financial covenants, including staying below a maximum leverage ratio and maintaining a minimum fixed charge coverage ratio and a tangible net worth. As of December 31, 2017, we were in compliance with all covenants under the Farmer Mac Facility.
In connection with the Bond Purchase Agreement, on December 5, 2014, we also entered into a pledge and security agreement (the “Pledge and Security Agreement”) in favor of the Bond Purchaser and Farmer Mac, which provides for us to pledge, as collateral for bonds issued pursuant to the Farmer Mac Facility, all of our respective right, title, and interest in mortgage loans made by us, which, among other things, must have at all times a value of not less than 110% of the aggregate principal amount of the outstanding bonds held by the Bond Purchaser.
The Bond Purchase Agreement and the Pledge Agreement include customary events of default, the occurrence of any of which, after any applicable cure period, would permit the Bond Purchaser and Farmer Mac to, among other things, accelerate payment of all amounts outstanding under the Farmer Mac Facility and to exercise its remedies with respect to the pledged collateral, including foreclosure and sale of the agricultural real estate underlying the pledged mortgage loans.
In connection with the Farmer Mac Facility, through December 31, 2017, we have incurred aggregate financing costs, which include legal fees and administrative fees, of approximately $506,000.
As of December 31, 2017, the Farmer Mac Facility was collateralized by 13 farms with an aggregate book value of approximately $139.8 million.
Rabo Note Payable
On October 13, 2017, in connection with the acquisition of JJ Road, we closed on a term loan from Rabo AgriFinance, LLC (“Rabo”), for $540,000 (the “Rabo Note Payable”). The loan is scheduled to mature on October 1, 2022, and will bear interest at a fixed rate of 4.59% per annum throughout its term.
Debt Service – Aggregate Maturities
Scheduled principal payments of our aggregate mortgage notes and bonds payable as of December 31, 2017, for the succeeding years are as follows (dollars in thousands):
88
For the Years Ended December 31, | Scheduled Principal Payments | |||
2018 | $ | 23,434 | ||
2019 | 11,065 | |||
2020 | 26,495 | |||
2021 | 7,259 | |||
2022 | 36,541 | |||
Thereafter | 188,194 | |||
$ | 292,988 | |||
Fair Value
ASC 820 provides a definition of fair value that focuses on the exchange (exit) price of an asset or liability in the principal, or most advantageous, market and prioritizes the use of market-based inputs to the valuation. ASC 820-10, “Fair Value Measurements and Disclosures,” establishes a three-level hierarchy for fair value measurements based upon the transparency of inputs to the valuation of an asset or liability as of the measurement date. The three levels are defined as follows:
• | Level 1 — inputs that are based upon quoted prices (unadjusted) for identical assets or liabilities in active markets; |
• | Level 2 — inputs are based upon quoted prices for similar assets or liabilities in active or inactive markets or model-based valuation techniques, for which all significant inputs are observable in the market or can be corroborated by observable market data for substantially the full term of the assets or liabilities; and |
• | Level 3 — inputs are generally unobservable and significant to the fair value measurement. These unobservable inputs are generally supported by little or no market activity and are based upon management's estimates of assumptions that market participants would use in pricing the asset or liability. |
As of December 31, 2017, the aggregate fair value of our long-term, fixed-rate mortgage notes and bonds payable was approximately $284.8 million, as compared to an aggregate carrying value (excluding unamortized related debt issuance costs) of approximately $293.0 million. The fair value of our long-term, fixed-rate mortgage notes and bonds payable is valued using Level 3 inputs under the hierarchy established by ASC 820-10 and is calculated based on a discounted cash flow analysis, using discount rates based on management’s estimates of market interest rates on long-term debt with comparable terms. Further, due to the revolving nature of the MetLife Lines of Credit and the lack of changes in market credit spreads, their aggregate fair value as of December 31, 2017, is deemed to approximate their aggregate carrying value of $10.0 million.
NOTE 5. MANDATORILY-REDEEMABLE PREFERRED STOCK
On August 17, 2016, we completed a public offering of 1,000,000 shares of 6.375% Series A Cumulative Series A Term Preferred Stock, par value $0.001 per share (the “Series A Term Preferred Stock”), at a public offering price of $25.00 per share. Simultaneous with the closing of the offering and on the same terms and conditions, the underwriters exercised in full their option to purchase an additional 150,000 shares of the Series A Term Preferred Stock to cover over-allotments. As a result of this offering, we issued a total of 1,150,000 shares of the Series A Term Preferred Stock for gross proceeds of approximately $28.8 million and net proceeds, after deducting underwriting discounts and offering expenses borne by us, of approximately $27.6 million. These proceeds were used to repay existing indebtedness, to fund new property acquisitions and for other general corporate purposes. The Series A Term Preferred Stock is traded under the ticker symbol, “LANDP,” on the Nasdaq Global Market. The Series A Term Preferred Stock is not convertible into our common stock or any other securities.
Generally, we may not redeem shares of the Series A Term Preferred Stock prior to September 30, 2018, except in limited circumstances to preserve our qualification as a REIT. On or after September 30, 2018, we may redeem the shares at a redemption price of $25.00 per share, plus any accumulated and unpaid dividends up to, but excluding, the date of redemption. The shares of the Series A Term Preferred Stock have a mandatory redemption date of September 30, 2021. We incurred approximately $1.2 million in total offering costs related to this issuance, which have been recorded net of the Series A Term Preferred Stock as presented on the Consolidated Balance Sheet, and we will amortize these costs over the redemption period, which ends on September 30, 2021.
The Series A Term Preferred Stock is recorded as a liability on our Consolidated Balance Sheet in accordance with ASC 480, “Distinguishing Liabilities from Equity,” which states that mandatorily-redeemable financial instruments should be classified as liabilities. In addition, the related dividend payments are treated similar to interest expense in the Consolidated Statement of Operations.
As of December 31, 2017, the fair value of our Series A Term Preferred Stock was approximately $29.7 million, as compared to the carrying value, exclusive of offering costs, of $28.8 million. The fair value of our Series A Term Preferred Stock is valued
89
using Level 1 inputs under the hierarchy established by ASC 820-10, “Fair Value Measurements and Disclosures,” and is calculated based on the closing stock price as of December 31, 2017, of $25.86.
The dividends to preferred stockholders declared by our Board of Directors and paid by us during the years ended December 31, 2017 and 2016, are reflected in the table below:
Fiscal Year | Declaration Date | Record Date | Payment Date | Dividend per Preferred Share | |||||||
2017 | January 10, 2017 | January 20, 2017 | January 31, 2017 | $ | 0.132812500 | ||||||
January 10, 2017 | February 16, 2017 | February 28, 2017 | 0.132812500 | ||||||||
January 10, 2017 | March 22, 2017 | March 31, 2017 | 0.132812500 | ||||||||
April 11, 2017 | April 21, 2017 | April 28, 2017 | 0.132812500 | ||||||||
April 11, 2017 | May 19, 2017 | May 31, 2017 | 0.132812500 | ||||||||
April 11, 2017 | June 21, 2017 | June 30, 2017 | 0.132812500 | ||||||||
July 11, 2017 | July 21, 2017 | July 31, 2017 | 0.132812500 | ||||||||
July 11, 2017 | August 21, 2017 | August 31, 2017 | 0.132812500 | ||||||||
July 11, 2017 | September 20, 2017 | September 29, 2017 | 0.132812500 | ||||||||
October 10, 2017 | October 20, 2017 | October 31, 2017 | 0.132812500 | ||||||||
October 10, 2017 | November 20, 2017 | November 30, 2017 | 0.132812500 | ||||||||
October 10, 2017 | December 19, 2017 | December 29, 2017 | 0.132812500 | ||||||||
Year ended December 31, 2017 | $ | 1.593750000 | |||||||||
2016 | September 12, 2016 | September 21, 2016 | September 30, 2016 | $ | 0.190364583 | (1) | |||||
October 11, 2016 | October 21, 2016 | October 31, 2016 | 0.132812500 | ||||||||
October 11, 2016 | November 17, 2016 | November 30, 2016 | 0.132812500 | ||||||||
October 11, 2016 | December 20, 2016 | December 30, 2016 | 0.132812500 | ||||||||
Year ended December 31, 2016 | $ | 0.588802083 | |||||||||
(1) | Represents the cumulative dividend from (but excluding) the date of original issuance through the month ended September 30, 2016. |
For federal income tax characterization purposes, dividends paid to preferred stockholders may be characterized as ordinary income, capital gains, return of capital, or a combination thereof. The characterization of dividends paid on our Series A Term Preferred Stock since its issuance is reflected in the following table:
For the Years Ended December 31, | Ordinary Income | Return of Capital | Long-term Capital Gain | ||||||
2017 | 82.32594 | % | — | % | 17.67406 | % | |||
2016 | 100.00000 | % | — | % | — | % | |||
NOTE 6. RELATED-PARTY TRANSACTIONS
Our Adviser and Administrator
We are externally managed pursuant to contractual arrangements with our Adviser and our Administrator, which collectively employ all of our personnel and pay their salaries, benefits, and general expenses directly. Both our Adviser and Administrator are affiliates of ours, as their parent company is owned and controlled by David Gladstone, our chairman, chief executive officer, and president. In addition, two of our executive officers, Mr. Gladstone and Terry Brubaker (our vice chairman and chief operating officer), serve as directors and executive officers of each of our Adviser and Administrator, and Michael LiCalsi, our general counsel and secretary, serves as our Administrator’s president, general counsel, and secretary.
The investment advisory agreement with our Adviser that was in effect through March 31, 2017 (the “Prior Advisory Agreement”), and the current administration agreement with our Administrator (the “Administration Agreement”) each became effective February 1, 2013. On April 11, 2017, we entered into a Second Amended and Restated Investment Advisory Agreement (the “Amended Advisory Agreement”) with our Adviser that became effective beginning with the three months
90
ended June 30, 2017. Our entrance into the Amended Advisory Agreement was approved unanimously by our board of directors, including, specifically, our independent directors.
A summary of the compensation terms for each of the Prior Advisory Agreement, Amended Advisory Agreement, Administration Agreement, Financing Arrangement Agreement, and TRS Fee Arrangements is below.
Prior Advisory Agreement
Pursuant to the Prior Advisory Agreement that was in effect through March 31, 2017, our Adviser was compensated in the form of a base management fee and, as applicable, an incentive fee. Each of these fees is described below.
Base Management Fee
We paid an annual base management fee equal to 2.0% of our adjusted stockholders’ equity, which was defined as our total stockholders’ equity at the end of each quarter less the recorded value of any preferred stock we may have issued.
Incentive Fee
We also paid an additional quarterly incentive fee based on funds from operations (as defined in the Prior Advisory Agreement). For purposes of calculating the incentive fee, our funds from operations, before giving effect to any incentive fee (our “Pre-Incentive Fee FFO”), included any realized capital gains or losses, less any distributions paid on our preferred stock, but did not include any unrealized capital gains or losses. The incentive fee rewarded our Adviser if our Pre-Incentive Fee FFO for a particular calendar quarter exceeded a hurdle rate of 1.75% (7.0% annualized) of our total stockholders’ equity (as shown on the balance sheet) at the end of the quarter. Our Adviser received 100% of the amount of the Pre-Incentive Fee FFO for the quarter that exceeded the hurdle rate but was less than 2.1875% of our total stockholders’ equity at the end of the quarter (8.75% annualized) and 20% of the amount of our Pre-Incentive Fee FFO that exceeded 2.1875% for the quarter.
Amended Advisory Agreement
Pursuant to the Amended Advisory Agreement, effective beginning with the three months ended June 30, 2017, our Adviser has been compensated in the form of a base management fee and, each as applicable, an incentive fee, a capital gains fee, and a termination fee. Each of these fees is described below.
Base Management Fee
A base management fee is paid quarterly and will be calculated as 2.0% per annum (0.50% per quarter) of the prior calendar quarter's total adjusted equity, which is defined as total equity plus total mezzanine equity, if any, each as reported on our balance sheet, adjusted to exclude unrealized gains and losses and certain other one-time events and non-cash items (“Total Adjusted Equity”).
Incentive Fee
An incentive fee is calculated and payable quarterly in arrears if the Pre-Incentive Fee FFO for a particular quarter exceeds a hurdle rate of 1.75% (7.0% annualized) of the prior calendar quarter's Total Adjusted Equity. For purposes of this calculation, Pre-Incentive Fee FFO is defined in the Amended Advisory Agreement as FFO (also as defined in the Amended Advisory Agreement) accrued by the Company during the current calendar quarter (prior to any incentive fee calculation for the current calendar quarter), less any dividends paid on preferred stock securities that are not treated as a liability for GAAP purposes. Our Adviser will receive: (i) no Incentive Fee in any calendar quarter in which the Pre-Incentive Fee FFO does not exceed the hurdle rate; (ii) 100% of the Pre-Incentive Fee FFO with respect to that portion of such Pre-Incentive Fee FFO, if any, that exceeds the hurdle rate but is less than 2.1875% in any calendar quarter (8.75% annualized); and (iii) 20% of the amount of the Pre-Incentive Fee FFO, if any, that exceeds 2.1875% in any calendar quarter (8.75% annualized).
Capital Gains Fee
A capital gains-based incentive fee will be calculated and payable in arrears at the end of each fiscal year (or upon termination of the Amended Advisory Agreement). The capital gains fee shall equal: (i) 15% of the cumulative aggregate realized capital gains minus the cumulative aggregate realized capital losses, minus (ii) any aggregate capital gains fees paid in prior periods. For purposes of this calculation, realized capital gains and losses will be calculated as (x) the sales price of the property, minus (y) any costs to sell the property and the then-current gross value of the property (which includes the property's original acquisition price plus any subsequent, non-reimbursed capital improvements). At the end of each fiscal year, if this figure is negative, no capital gains fee shall be paid. To date, no capital gains fee has been earned by our Advisor.
Termination Fee
91
In the event of our termination of the Amended Advisory Agreement for any reason (with 120 days’ prior written notice and the vote of at least two-thirds of our independent directors), a termination fee would be payable to the Adviser equal to three times the sum of the average annual base management fee and incentive fee earned by the Adviser during the 24-month period prior to such termination.
Administration Agreement
Pursuant to the Administration Agreement, we pay for our allocable portion of the Administrator’s expenses incurred while performing services to us, including, but not limited to, rent and the salaries and benefits expenses of our Administrator’s employees, including our chief financial officer, treasurer, chief compliance officer, general counsel, and secretary (who also serves as our Administrator’s president, general counsel, and secretary), and their respective staffs.
As approved by our Board of Directors, effective July 1, 2014, our allocable portion of the Administrator’s expenses is generally derived by multiplying our Administrator’s total expenses by the approximate percentage of time the Administrator’s employees perform services for us in relation to their time spent performing services for all companies serviced by our Administrator under similar contractual agreements.
Gladstone Securities
On April 11, 2017, we entered into an agreement with Gladstone Securities, LLC, (“Gladstone Securities”), effective beginning with the three months ended June 30, 2017, for it to act as our non-exclusive agent to assist us with arranging financing for our properties (the “Financing Arrangement Agreement”). Gladstone Securities is a privately-held broker-dealer and a member of the Financial Industry Regulatory Authority and the Securities Investor Protection Corporation. Gladstone Securities is an affiliate of ours, as its parent company is owned and controlled by Mr. Gladstone, who also serves on the board of managers of Gladstone Securities.
Financing Arrangement Agreement
In connection with the Financing Arrangement Agreement, Gladstone Securities may, from time to time, solicit the interest of various agricultural or commercial real estate lenders and/or recommend to us third-party lenders offering credit products or packages that are responsive to our needs. We will pay Gladstone Securities a financing fee in connection with the services it provides to us for securing financing on our properties. Depending on the size of the financing obtained, the maximum amount of the financing fee, which will be payable upon closing of the respective financing, will range from 0.5% to 1.0% of the amount of financing obtained. The amount of the financing fee may be reduced or eliminated as determined by us and Gladstone Securities after taking into consideration various factors, including, but not limited to, the involvement of any third-party brokers and general market conditions. During the year ended December 31, 2017, the total amount of financing fees paid to Gladstone Securities represented approximately 0.1% of the total financings secured since the Financing Arrangement Agreement has been in place.
Dealer-Manager Agreement
Subsequent to December 31, 2017, we entered into an agreement with Gladstone Securities to act as our exclusive dealer-manager in connection with the offering of our Series B Preferred Stock (each as defined below). See Note 11, “Subsequent Events—Equity Activity—Series B Preferred Stock—Dealer-Manager Agreement” for further discussion on this agreement.
TRS Lease Assumption
During the three months ended December 31, 2017, the existing lease on one of our farms was assigned by the tenant to our TRS (see Note 3, “Real Estate and Lease Intangibles—TRS Lease Assumption,” for further discussion on this transaction). In connection with this transaction, on October 23, 2017, in exchange for services provided by our Adviser to the TRS, our Adviser and the TRS entered into an Expense Sharing Agreement (the “TRS Expense Sharing Agreement”). In addition, during the three months ended December 31, 2017, to account for the time our Administrator's staff spends on TRS-related activities, we adopted a policy whereas a portion of the fee paid by the Company to our Administrator pursuant to the Administration Agreement would be allocated to our TRS (the “TRS Administration Fee Allocation, and together with the TRS Expense Sharing Agreement, the “TRS Fee Arrangements”).
TRS Fee Arrangements
TRS Expense Sharing Agreement
Pursuant to the TRS Expense Sharing Agreement, our Adviser is responsible for maintaining the day-to-day operations on the farm leased to the TRS. In exchange for such services, the TRS compensates our Adviser through reimbursement of certain
92
expenses incurred by our Advisor, including the TRS's pro-rata share of our Advisor's payroll and related benefits (based on the percentage of each employee's time devoted to TRS matters in relation to the time such employees devoted to all affiliated funds, collectively, advised by our Advisor) and general overhead expenses (based on the total general overhead expenses incurred by our Adviser multiplied by the ratio of hours worked by our Advisor's employees on TRS matters to the total hours worked by our Advisor's employees).
During the year ended December 31, 2017, our Adviser incurred approximately $71,000 of costs related to services provided to the TRS. Such costs, while payable by our TRS, were deferred and are included in Crop inventory on the accompanying Consolidated Balance Sheet as of December 31, 2017.
TRS Administration Fee Allocation
Under to the TRS Administration Fee Allocation, a portion of the fee owed by us to our Administrator under the Administration Agreement is allocated to the TRS based on the percentage of each employee's time devoted to TRS matters in relation to the total time such employees devoted to the Company.
During the year ended December 31, 2017, approximately $22,000 of the administration fee that would have otherwise been owed by us to our Adviser was allocated to the TRS. This administration fee is payable by the TRS and is included in Administration Fee on the accompanying Consolidated Statement of Operations for the year ended December 31, 2017.
Related Party Fees
The following table summarizes related party fees paid or accrued for and reflected in our accompanying Consolidated Statements of Operations (dollars in thousands):
For the Years Ended December 31, | |||||||||||||
2017 | 2016 | 2015 | |||||||||||
Management fee(1)(2) | $ | 2,041 | (3) | $ | 1,542 | $ | 1,343 | ||||||
Incentive fee(1)(2) | 688 | 350 | — | ||||||||||
Credits from voluntary, irrevocable waiver by Adviser’s board of directors(2) | (54 | ) | (4) | — | (321 | ) | (5) | ||||||
Net fees to our Adviser | $ | 2,675 | $ | 1,892 | $ | 1,022 | |||||||
Administration fee(1)(2) | $ | 914 | (6) | $ | 771 | $ | 680 | ||||||
Financing Fees to Gladstone Securities(7) | $ | 36 | $ | — | $ | — | |||||||
(1) | Pursuant to the agreements with our Adviser and Administrator as discussed above. |
(2) | Reflected as a line item on our accompanying Consolidated Statements of Operations. |
(3) | Excludes the reimbursement by the TRS of certain costs incurred by our Adviser (approximately $71,000, pursuant to the TRS Expense Sharing Agreement as discussed above), which amount was deferred and included in Crop inventory on the accompanying Consolidated Balance Sheet. |
(4) | The credit received from our Adviser for the year ended December 31, 2017, was granted as a voluntary, irrevocable waiver to be applied against the incentive fee payable to our Advisor. |
(5) | The credit received from our Adviser for the year ended December 31, 2015, was attributable to a finder’s fee earned by our Adviser in connection with a farm we acquired during the year, which fee was granted to us as a one-time, voluntary and irrevocable waiver to be applied against the fees payable to our Adviser. |
(6) | Includes the portion of administration fee that was allocated to the TRS (approximately $22,000), as further described above under “TRS Administration Fee Allocation.” |
(7) Included in Mortgage notes and bonds payable, net on the Consolidated Balance Sheet and amortized into Interest expense on the Consolidated Statement of Operations.
Related-Party Fees Due
Amounts due to related parties on our accompanying Consolidated Balance Sheets as of December 31, 2017 and 2016 were as follows (dollars in thousands):
93
December 31, 2017 | December 31, 2016 | |||||||
Management fee due to Adviser(1) | $ | 666 | $ | 384 | ||||
Incentive fee due to Adviser | — | 169 | ||||||
Other due to Adviser(2) | 16 | 2 | ||||||
Total due to Adviser | 682 | 555 | ||||||
Administration fee due to Administrator(3) | 258 | 202 | ||||||
Other due from Administrator(2) | — | (6 | ) | |||||
Total due to Administrator | 258 | 196 | ||||||
Total due to related parties(4) | $ | 940 | $ | 751 | ||||
(1) | Includes approximately $71,000 owed by the TRS to our Advisor, pursuant to the TRS Expense Sharing Agreement, as discussed above. |
(2) | Other fees due to or from related parties primarily relate to miscellaneous general and administrative expenses paid by our Adviser or Administrator on our behalf or by us on our Advisor's or Administrator's behalf. |
(3) | Includes approximately $22,000 owed by the TRS to our Administrator, in accordance with the TRS Administration Fee Allocation, as discussed above. |
(4) | Reflected as a line item on our accompanying Consolidated Balance Sheet. |
NOTE 7. EQUITY
Amendment to Articles of Incorporation
On July 12, 2017, we filed an Articles of Amendment with the State Department of Assessments and Taxation for Maryland to increase the number of shares of capital stock that we have authority to issue from 20,000,000 shares to 100,000,000 shares, with the additional 80,000,000 shares of stock being initially classified as common stock, $0.001 par value per share. See Note 11, “Subsequent Events” for a further amendment to our articles of incorporation.
Stockholders' Equity
As of December 31, 2017, there were 98,000,000 shares of common stock, par value $0.001 per share, authorized, with 13,791,574 shares issued and outstanding. As of December 31, 2016, there were 18,000,000 shares of common stock, par value $0.001 per share, authorized, with 10,024,875 shares issued and outstanding.
Non-Controlling Interests in Operating Partnership
We consolidate our Operating Partnership, which is a majority-owned partnership. As of December 31, 2017 and 2016, we owned approximately 93.2% and 87.4%, respectively, of the outstanding OP Units.
On or after 12 months after becoming a holder of OP Units, each limited partner, other than the Company, has the right, subject to the terms and conditions set forth in the partnership agreement of the Operating Partnership, to require the Operating Partnership to redeem all or a portion of such units in exchange for cash or, at the Company’s option, shares of our common stock on a one-for-one basis. The cash redemption per OP Unit would be based on the market price of our common stock at the time of redemption. A limited partner will not be entitled to exercise redemption rights if the delivery of common stock to the redeeming limited partner would breach restrictions on the ownership of common stock imposed under our charter and other limitations thereof.
On September 20, 2017, 221,875 OP Units were tendered for redemption, and on September 29, 2017, we issued 50,000 shares of common stock in exchange for 50,000 of the OP Units, and we satisfied the redemption of the remaining 171,875 OP Units with a cash payment of approximately $2.3 million (approximately $13.21 per OP Unit). On October 6, 2017, 121,875 OP Units were tendered for redemption, and on October 13, 2017, we issued 121,875 shares of common stock in exchange for 121,875 OP Units. On November 28, 2017, 75,000 OP Units were tendered for redemption, and on December 1, 2017, we issued 75,000 shares of common stock in exchange for 75,000 OP Units. On December 27, 2017, 22,403 OP Units were tendered for redemption, and on December 28, 2017, we satisfied the redemption of these OP Units with a cash payment of approximately $299,000 (approximately $13.35 per OP Unit).
Regardless of the rights described above, the Operating Partnership will not have an obligation to issue cash to a unitholder upon a redemption request if the Company elects to redeem the OP Units for shares of its common stock. When a non-Company unitholder redeems OP Units and the Company elects to satisfy that redemption through the issuance of common stock, non-controlling interest in the Operating Partnership is reduced, and stockholders’ equity is increased.
The Operating Partnership is required to make distributions on each OP Unit in the same amount as those paid on each share of the Company’s common stock, with the distributions on the OP Units held by the Company being utilized to make distributions to the Company’s common stockholders.
94
As of December 31, 2017 and 2016, there were 1,008,105 and 1,449,258 OP Units held by non-controlling limited partners outstanding, respectively, of which 1,008,105 and zero OP Units, respectively, were eligible to be tendered for redemption. Subsequent to December 31, 2017, 7,700 additional OP Units were tendered for redemption; see Note 11, “Subsequent Events,” for further discussion on the redemption of these OP Units.
Distributions
The distributions to common stockholders declared by our Board of Directors and paid by us during the years ended December 31, 2017, 2016, and 2015 are reflected in the table below.
95
Fiscal Year | Declaration Date | Record Date | Payment Date | Distributions per Common Share | |||||||
2017 | January 10, 2017 | January 20, 2017 | January 31, 2017 | $ | 0.04300 | ||||||
January 10, 2017 | February 16, 2017 | February 28, 2017 | 0.04300 | ||||||||
January 10, 2017 | March 22, 2017 | March 31, 2017 | 0.04300 | ||||||||
April 11, 2017 | April 21, 2017 | April 28, 2017 | 0.04350 | ||||||||
April 11, 2017 | May 19, 2017 | May 31, 2017 | 0.04350 | ||||||||
April 11, 2017 | June 21, 2017 | June 30, 2017 | 0.04350 | ||||||||
July 11, 2017 | July 21, 2017 | July 31, 2017 | 0.04400 | ||||||||
July 11, 2017 | August 21, 2017 | August 31, 2017 | 0.04400 | ||||||||
July 11, 2017 | September 20, 2017 | September 29, 2017 | 0.04400 | ||||||||
October 10, 2017 | October 20, 2017 | October 31, 2017 | 0.04410 | ||||||||
October 10, 2017 | November 20, 2017 | November 30, 2017 | 0.04410 | ||||||||
October 10, 2017 | December 29, 2017 | December 29, 2017 | 0.04410 | ||||||||
Year ended December 31, 2017 | $ | 0.52380 | |||||||||
2016 | January 12, 2016 | January 22, 2016 | February 2, 2016 | $ | 0.04000 | ||||||
January 12, 2016 | February 18, 2016 | February 29, 2016 | 0.04000 | ||||||||
January 12, 2016 | March 21, 2016 | March 31, 2016 | 0.04000 | ||||||||
April 12, 2016 | April 22, 2016 | May 2, 2016 | 0.04125 | ||||||||
April 12, 2016 | May 19, 2016 | May 31, 2016 | 0.04125 | ||||||||
April 12, 2016 | June 17, 2016 | June 30, 2016 | 0.04125 | ||||||||
July 12, 2016 | July 22, 2016 | August 2, 2016 | 0.04125 | ||||||||
July 12, 2016 | August 22, 2016 | August 31, 2016 | 0.04125 | ||||||||
July 12, 2016 | September 21, 2016 | September 30, 2016 | 0.04125 | ||||||||
October 11, 2016 | October 21, 2016 | October 31, 2016 | 0.04250 | ||||||||
October 11, 2016 | November 17, 2016 | November 30, 2016 | 0.04250 | ||||||||
October 11, 2016 | December 20, 2016 | December 30, 2016 | 0.04250 | ||||||||
Year ended December 31, 2016 | $ | 0.49500 | |||||||||
2015 | January 13, 2015 | January 23, 2015 | February 3, 2015 | $ | 0.03500 | ||||||
January 13, 2015 | February 18, 2015 | February 27, 2015 | 0.03500 | ||||||||
January 13, 2015 | March 20, 2015 | March 31, 2015 | 0.03500 | ||||||||
April 14, 2015 | April 24, 2015 | May 4, 2015 | 0.04000 | ||||||||
April 14, 2015 | May 19, 2015 | May 28, 2015 | 0.04000 | ||||||||
April 14, 2015 | June 19, 2015 | June 30, 2015 | 0.04000 | ||||||||
July 14, 2015 | July 24, 2015 | August 4, 2015 | 0.04000 | ||||||||
July 14, 2015 | August 20, 2015 | August 31, 2015 | 0.04000 | ||||||||
July 14, 2015 | September 21, 2015 | September 30, 2015 | 0.04000 | ||||||||
October 13, 2015 | October 26, 2015 | October 29, 2015 | 0.04000 | ||||||||
October 13, 2015 | November 17, 2015 | November 24, 2015 | 0.04000 | ||||||||
October 13, 2015 | December 18, 2015 | December 31, 2015 | 0.04000 | ||||||||
Year ended December 31, 2015 | $ | 0.46500 | |||||||||
During the years ended December 31, 2017, 2016 and 2015, we paid aggregate distributions to common stockholders of approximately $6.4 million, $5.0 million and $4.1 million, respectively.
For federal income tax characterization purposes, distributions paid to common stockholders may be characterized as ordinary income, capital gains, return of capital, or a combination thereof. The characterization of distributions on our common stock during each of the last three years is reflected in the following table:
96
For the Years Ended December 31, | Ordinary Income | Return of Capital | Long-term Capital Gain | ||||||
2017 | 26.84290 | % | 67.39436 | % | 5.76274 | % | |||
2016 | 30.65818 | % | 69.34182 | % | — | % | |||
2015 | 62.29540 | % | 37.34781 | % | 0.35679 | % | |||
Registration Statement
We filed a universal registration statement on Form S-3 (File No. 333-194539) with the SEC on March 13, 2014 (the “2014 Registration Statement”), which the SEC declared effective on April 2, 2014. The 2014 Registration Statement, which was scheduled to expire on April 1, 2017, permitted us to issue up to an aggregate of $300.0 million in securities, consisting of common stock, senior common stock, preferred stock, subscription rights, debt securities, and depository shares, including through separate, concurrent offerings of two or more of such securities. We issued a total of 4,013,763 shares of common stock and 1,150,000 shares of preferred stock for aggregate gross proceeds of approximately $73.1 million under the 2014 Registration Statement.
On March 30, 2017, we filed a universal registration statement on Form S-3 (File No. 333-217042) with the SEC (the “2017 Registration Statement”) to replace the expiring 2014 Registration Statement. The 2017 Registration Statement, which was declared effective by the SEC on April 12, 2017, permits us to issue up to an aggregate of $300.0 million in securities, consisting of common stock, preferred stock, warrants, debt securities, depository shares, subscription rights, and units, including through separate, concurrent offerings of two or more of such securities. As of December 31, 2017, we have issued a total of 1,694,075 shares of common stock (excluding 246,875 shares of common stock issued in exchange for certain OP Units that were tendered for redemption) for gross proceeds of approximately $21.2 million under the 2017 Registration Statement.
In conjunction with the replacement of the 2014 Registration Statement, during the year ended December 31, 2017, we wrote off approximately $46,000 of unallocated costs associated with the initial filing of the 2014 Registration Statement. These costs were written off to professional fees and stockholder-related expenses, both of which are included in General and administrative expenses on our accompanying Consolidated Statement of Operations.
2017 Equity Issuances
Secondary Offerings
In March 2017, we completed a public offering of 1,825,749 shares (including 145,749 shares issued as a result of the underwriters exercising their over-allotment option) of our common stock at a public offering price of $11.35 per share. This issuance resulted in gross proceeds of approximately $20.7 million and net proceeds, after deducting underwriting discounts and offering expenses borne by us, of approximately $19.6 million.
In September 2017, we completed a public offering of 1,150,000 shares (including 150,000 shares issued as a result of the underwriters simultaneously exercising their over-allotment option) of our common stock at a public offering price of $12.25 per share. This issuance resulted in gross proceeds of approximately $14.1 million and net proceeds, after deducting underwriting discounts and offering expenses borne by us, of approximately $13.4 million.
All offering proceeds were used to repay existing indebtedness (which, in turn, was used to fund farmland acquisitions) and for other general corporate purposes.
At-the-Market Program
On August 7, 2015, we entered into equity distribution agreements (commonly referred to as “at-the-market agreements” or our “Sales Agreements”) with Cantor Fitzgerald & Co. and Ladenburg Thalmann & Co., Inc. (each a “Sales Agent”), under which we may issue and sell, from time to time and through the Sales Agents, shares of our common stock having an aggregate offering price of up to $30.0 million (the “ATM Program”). During the year ended December 31, 2017, we issued and sold 544,075 shares of our common stock at an average sales price of $13.04 per share under the ATM Program for gross proceeds of approximately $7.1 million and net proceeds of approximately $7.0 million. Through December 31, 2017, we have issued and sold a total of 608,636 shares of our common stock at an average sales price of $12.75 per share for gross proceeds of approximately $7.8 million and net proceeds of approximately $7.6 million. See Note 11, “Subsequent Events,” for shares of common stock issued and sold under the ATM Program subsequent to December 31, 2017.
On April 13, 2017, we amended each of the Sales Agreements to reference the new 2017 Registration Statement. All other material terms of the Sales Agreements remained unchanged.
97
Series B Preferred Stock
Subsequent to December 31, 2017, we launched a continuous public offering of up to a total of 6,500,000 shares of the Series B Preferred Stock (as defined below) for total gross proceeds (assuming all shares of the Series B Preferred Stock are sold in the offering) of up to $162.5 million. See Note 11, “Subsequent Events—Equity Activity—Series B Preferred Stock” for further discussion on this offering.
NOTE 8. COMMITMENTS AND CONTINGENCIES
Operating Obligations
In connection with a lease amendment we executed on one of our Oregon farms in May 2017, we committed to providing up to $1.8 million of capital for anticipated improvements on the farm, including irrigation upgrades and the planting of new blueberry bushes, which improvements are expected to be completed by December 31, 2020. As stipulated in the lease amendment, we will begin earning additional rent on the cost of the improvements as the funds are disbursed by us at an initial annual rate of 6.5%, which rate is subject to annual escalations and market resets. As a result of this project, and assuming full deployment of the capital commitment amount, we expect to receive approximately $718,000 of additional rent throughout the term of the lease, which expires September 30, 2024. As of December 31, 2017, we have expended or accrued approximately $789,000 related to this project. In addition, as part of the project, certain blueberry bushes owned by us were removed to allow for the planting of new varieties of blueberry bushes. As a result, during the year ended December 31, 2017, we recorded a loss of approximately $84,000 associated with the removal of these bushes, which amount represents the net cost basis of such bushes plus all removal costs. This loss is included in (Loss) gain on disposal of real estate assets, net on our Consolidated Statement of Operations for the year ended December 31, 2017.
In connection with the lease we executed upon our acquisition of our two North Carolina farms in June 2017, we committed to providing up to $300,000 of capital over the first two years to support additional plantings and infrastructure on the farm, which improvements are expected to be completed by June 30, 2019. As stipulated in the lease, we will earn additional rent on the total cost of the improvements as disbursements are made by us at a rate commensurate with the annual yield on the farmland (as determined by each year's minimum cash rent per the lease). As a result of this project, and assuming full deployment of the capital commitment amount, we expect to receive approximately $157,000 of additional rent throughout the term of the lease, which expires December 31, 2026. As of December 31, 2017, we have incurred approximately $166,000 related to this project.
In connection with a lease amendment we executed on one of our Florida properties in June 2017, we committed to providing up to $700,000 of capital to expand and upgrade the existing cooler on the property, which improvements are expected to be completed during the three months ended March 31, 2018. As stipulated in the lease amendment, we will begin earning additional rent on the cost of the improvements as the funds are disbursed by us at an initial annual rate of 8.5%, which rate is subject to annual escalations. As a result of this project, and assuming full deployment of the capital commitment amount, we expect to receive approximately $280,000 of additional rent throughout the term of the lease, which expires June 30, 2022. As of December 31, 2017, we have incurred approximately $643,000 related to this project.
In connection with the follow-on lease we executed upon our acquisition of a 1,910-acre farm in Florida in August 2017 (which has a commencement date of February 24, 2018), we committed to providing up to $1.0 million of capital in the first year of the lease to support additional plantings and infrastructure on the farm, which improvements are expected to be completed during the three months ending March 31, 2019. As stipulated in the follow-on lease, we will earn additional rent on the total cost of the improvements as disbursements are made by us at a rate commensurate with the annual yield on the farmland (as determined by each year's minimum cash rent per the lease). As a result of this project, and assuming full deployment of the capital commitment amount, we expect to receive approximately $305,000 of additional rent throughout the term of the lease, which expires February 23, 2024. As of December 31, 2017, we have incurred approximately $442,000 related to this project.
In connection with the lease we executed upon our acquisition of a 361-acre farm in California in August 2017, we committed to providing up to $4 million of capital over the first two years to fund the development of additional vineyard acreage on the farm, which development is expected to be completed by August 30, 2019. As stipulated in the lease, we will earn additional rent on the total cost of the improvements as the funds are disbursed by us at an initial annual rate of 6.0%, which is subject to annual escalations. As a result of this project, and assuming full deployment of the capital commitment amount, we expect to receive approximately $2.3 million of additional rent throughout the term of the lease, which expires May 31, 2027. As of December 31, 2017, we have incurred approximately $660,000 related to this project.
98
Ground Lease Obligations
In connection with two farms acquired on June 1, 2017, through a leasehold interest, we assumed two ground leases under which we are the lessee (with the State of Arizona as the lessor). During the year ended December 31, 2017, we recorded approximately $31,000 of lease expense (included as part of Property operating expenses on the accompanying Consolidated Statement of Operations) as a result of these ground leases. Future minimum lease payments due under the terms of these leases as of December 31, 2017, are as follows (dollars in thousands):
For the Years Ended December 31, | Estimated Minimum Lease Payments Due(1) | |||
2018 | $ | 47 | ||
2019 | 47 | |||
2020 | 47 | |||
2021 | 47 | |||
2022 | 30 | |||
Thereafter | 61 | |||
$ | 279 | |||
(1) | Annual lease payments are set at the beginning of each year to then-current market rates (as determined by the State of Arizona). The amounts shown above represent estimated amounts based on the lease rates currently in place . |
Litigation
In the ordinary course of business, we may be involved in legal proceedings from time to time. We are not currently subject to any material known or threatened litigation.
NOTE 9. (LOSS) EARNINGS PER SHARE OF COMMON STOCK
The following table sets forth the computation of basic and diluted (loss) earnings per common share for the years ended December 31, 2017, 2016, and 2015, computed using the weighted-average number of shares outstanding during the respective periods. The non-controlling limited partners' outstanding OP Units (which may be redeemed for shares of common stock) have been excluded from the diluted earnings per share calculation, as there would be no effect on the amounts since the non-controlling limited partners' share of income would also be added back to net income. Net income figures are presented net of non-controlling interests in the earnings per share calculation.
2017 | 2016 | 2015 | ||||||||||
(Dollars in thousands, except per-share amounts) | ||||||||||||
Net (loss) income attributable to the Company | $ | (31 | ) | $ | 448 | $ | 569 | |||||
Weighted average shares of common stock outstanding – basic and diluted | 12,055,791 | 10,007,350 | 8,639,397 | |||||||||
(Loss) earnings per common share – basic and diluted | $ | — | $ | 0.04 | $ | 0.07 | ||||||
The weighted-average number of OP Units held by non-controlling limited partners was 1,358,790 and 766,351 for the years ended December 31, 2017 and 2016, respectively. There were no OP Units held by anyone other than the Company during 2015.
NOTE 10. QUARTERLY FINANCIAL INFORMATION (unaudited)
The following table reflects the quarterly results of operations for the years ended December 31, 2017 and 2016 (dollars in thousands, except per share data):
99
Fiscal Year 2017: | Quarter Ended | |||||||||||||||
March 31, 2017 | June 30, 2017 | September 30, 2017 | December 31, 2017 | |||||||||||||
Operating revenues | $ | 5,750 | $ | 5,996 | $ | 6,564 | $ | 6,812 | ||||||||
Operating expenses | (3,146 | ) | (3,090 | ) | (3,645 | ) | (3,865 | ) | ||||||||
Other expenses | (2,431 | ) | (2,651 | ) | (3,166 | ) | (3,162 | ) | ||||||||
Net income (loss) | 173 | 255 | (247 | ) | (215 | ) | ||||||||||
Net (income) loss attributable to non-controlling interests | (21 | ) | (28 | ) | 26 | 26 | ||||||||||
Net income (loss) attributable to the Company | $ | 152 | $ | 227 | $ | (221 | ) | $ | (189 | ) | ||||||
Earnings (loss) per common share – basic and diluted | $ | 0.01 | $ | 0.02 | $ | (0.02 | ) | $ | (0.01 | ) | ||||||
Weighted average shares of common stock outstanding – basic and diluted | 10,395,736 | 11,850,624 | 12,271,925 | 13,666,560 | ||||||||||||
Fiscal Year 2016: | Quarter Ended | |||||||||||||||
March 31, 2016 | June 30, 2016 | September 30, 2016 | December 31, 2016 | |||||||||||||
Operating revenues | $ | 3,683 | $ | 4,244 | $ | 4,469 | $ | 4,921 | ||||||||
Operating expenses | (2,283 | ) | (2,650 | ) | (2,663 | ) | (2,665 | ) | ||||||||
Other expenses | (1,160 | ) | (1,478 | ) | (1,771 | ) | (2,174 | ) | ||||||||
Net income | 240 | 116 | 35 | 82 | ||||||||||||
Net income attributable to non-controlling interests | (6 | ) | (8 | ) | (3 | ) | (8 | ) | ||||||||
Net income attributable to the Company | $ | 234 | $ | 108 | $ | 32 | $ | 74 | ||||||||
Earnings per common share – basic and diluted | $ | 0.02 | $ | 0.01 | $ | — | $ | 0.01 | ||||||||
Weighted average shares of common stock outstanding – basic and diluted | 9,992,941 | 9,992,941 | 10,018,331 | 10,024,875 | ||||||||||||
NOTE 11. SUBSEQUENT EVENTS
Portfolio Activity
Acquisition Activity
On January 31, 2018, we acquired a 161-acre farm in Kern County, California, for approximately $2.9 million. We will account for this acquisition as an asset acquisition in accordance with ASC 360. We acquired this property without a lease; however, we expect to execute a lease on this property during the three months ending March 31, 2018.
Leasing Activity
Subsequent to December 31, 2017, we terminated the leases on two of our farms in Cochise County, Arizona, early and entered into two new lease agreements with a new tenant. Each of the new leases is for a term of one year and provides for aggregate minimum rents of approximately $480,000, which represents a decrease of approximately $203,000 (approximately 29.7%) from that of the prior leases (before each of their terminations). However, each of the new leases also contains a variable rent component based on the total gross revenues earned on the respective farms, whereas the prior leases were both fixed-rent leases. In addition, both of the new leases are pure, triple-net lease agreements, whereas one of the prior leases was a partial-net lease (with us responsible for the property taxes on the farm). In connection with one of the early lease terminations, during the year ended December 31, 2017, we recorded a full allowance on the respective lease's deferred rent asset balance as of December 31, 2017, which was approximately $50,000. We recorded this allowance to bad debt expense, which is included in General and administrative expenses on the accompanying Consolidated Statements of Operations. In connection with the other early lease termination, as of the termination date, the lease has a deferred rent liability balance of approximately $84,000. In accordance with ASC 360-10, we will recognize this balance as additional rental income during the three months ending March 31, 2018 (on the lease termination date). No downtime was incurred as a result of the early terminations and re-leasing of these farms, nor were any leasing commissions or tenant improvements incurred in connection with the new leases.
100
Equity Activity
Series B Preferred Stock
Offering
On January 10, 2018, we filed a prospectus supplement (the “Prospectus Supplement”) with the SEC for a continuous public offering (the “Series B Offering”) of up to 6,000,000 shares (the “Primary Offering”) of our newly-designated 6.00% Series B Cumulative Redeemable Preferred Stock (the “Series B Preferred Stock”) at an offering price of $25.00 per share (the “Offering Price”), for gross proceeds of up to $150.0 million and net proceeds, after deducting dealer-manager fees, selling commissions, and estimated expenses of the offering payable by us, of up to approximately $131.3 million, assuming all shares of the Series B Preferred Stock are sold in the offering. We are also offering up to 500,000 additional shares of the Series B Preferred Stock pursuant to our dividend reinvestment plan (the “DRIP”) to those holders of the Series B Preferred Stock who elect to participate in such plan. The Series B Preferred Stock is being offered on a “reasonable best efforts” basis by Gladstone Securities, an affiliate of ours who will serve as our exclusive dealer-manager in connection with the Primary Offering (see “—Dealer-Manager Agreement” below).
We expect that the Series B Offering will terminate on the date (the “Termination Date”) that is the earlier of either January 10, 2023 (unless terminated earlier or extended by our Board of Directors), or the date on which all 6,000,000 shares offered in the Primary Offering are sold.
There is currently no public market for shares of the Series B Preferred Stock; however, we intend to apply to list the Series B Preferred Stock on Nasdaq or another national securities exchange within one calendar year after the Termination Date, though there can be no assurance that a listing will be achieved in such timeframe, or at all.
We intend to use the net proceeds from this offering to repay existing indebtedness, to fund future acquisitions, and for other general corporate purposes. No sales of the Series B Preferred Stock have been made through the date of this filing. Further, as of December 31, 2017, we had incurred approximately $165,000 of costs related to this offering, which have been recorded as deferred offering costs and are included in Other assets on the accompanying Consolidated Balance Sheet as of December 31, 2017.
Company and Shareholder Redemption Options
We may not redeem the Series B Preferred Stock prior to the later of (i) the first anniversary of the Termination Date (as defined in the Articles Supplementary) or (ii) January 10, 2022 (except in limited circumstances relating to our continuing qualification as a REIT). On and after the later of (x) the first anniversary of the Termination Date or (y) January 10, 2022, we may, at our option, redeem the Series B Preferred Stock, in whole or in part, at any time or from time to time, by making payment of $25.00 per share, plus any accumulated and unpaid dividends up to but excluding the date of redemption.
Commencing on December 31, 2018 (or, if after December 31, 2018, we suspend the optional redemption right of the holders of Series B Preferred Stock, on the date we reinstate such right), and terminating on the earlier to occur of (i) the date upon which the Board, by resolution, suspends or terminates the optional redemption right of the holders of Series B Preferred Stock, (ii) December 31, 2022, or (iii) the date on which shares of Series B Preferred Stock are listed on a national securities exchange, holders of Series B Preferred Stock may, at their option, require the Company to redeem, on the last business day of each calendar year, any or all of their shares of Series B Preferred Stock at a redemption price per share of Series B Preferred Stock equal to $23.50 in cash, subject, on a share basis, to a 5.0% limitation of all shares sold by us between January 1 through November 30 of such calendar year. In addition, we have the authority to suspend or terminate all shareholder redemption options at any time, in our sole discretion.
Amendment to Articles of Incorporation
On January 10, 2018, we filed with the Maryland Department of Assessments and Taxation Articles Supplementary to reclassify and designate 6,500,000 shares of our authorized and unissued shares of capital stock as shares of Series B Preferred Stock. The reclassification decreased the number of shares classified as common stock from 98,000,000 shares immediately prior to the reclassification to 91,500,000 shares immediately after the reclassification.
Dealer-Manager Agreement
On January 10, 2018, we entered into a dealer-manager agreement (the “Dealer-Manager Agreement”), with Gladstone Securities, whereby Gladstone Securities will serve as our exclusive dealer-manager in connection with the Series B Offering. The Series B Preferred Stock is registered with the SEC pursuant to the 2017 Registration Statement (as it may be amended and/or supplemented) under the Securities Act of 1933, as amended, and will be offered and sold pursuant to the Prospectus Supplement and the 2017 Registration Statement.
101
Under the Dealer-Manager Agreement, Gladstone Securities will provide certain sales, promotional, and marketing services to us in connection with the offering of the Series B Preferred Stock, and we will pay the Gladstone Securities (i) selling commissions of up to 7.0% of the gross proceeds from sales of Series B Preferred Stock in the Primary Offering (the “Selling Commissions”), and (ii) a dealer-manager fee of 3.0% of the gross proceeds from sales of Series B Preferred Stock in the Primary Offering (the “Dealer-Manager Fee”). No Selling Commissions or Dealer-Manager Fee shall be paid with respect to shares of the Series B Preferred Stock sold pursuant to the DRIP. Gladstone Securities may, in its sole discretion, reallow a portion of the Dealer-Manager Fee to participating broker-dealers in support of the Primary Offering. The terms of the Dealer-Manager Agreement were approved by our board of directors, including all of its independent directors.
ATM Program
Subsequent to December 31, 2017, through the date of this filing, we sold 96,590 shares of our common stock at an average sales price of $13.19 per share under the ATM Program for gross and net proceeds (after deducting offering expenses borne by us) of approximately $1.3 million.
Redemption of OP Units
On January 16, 2018, 37,500 OP Units were tendered for redemption, and on January 17, 2018, we issued 7,700 shares of common stock in exchange for 7,700 of the OP Units, and we satisfied the redemption of the remaining 29,800 OP Units with a cash payment of approximately $400,000 (approximately $13.42 per OP Unit).
Distributions
On January 9, 2018, our Board of Directors declared the following monthly cash distributions to common stockholders:
Record Date | Payment Date | Distribution per Common Share | Dividends per Series A Term Preferred Share | |||||||
January 22, 2018 | January 31, 2018 | $ | 0.04425 | $ | 0.1328125 | |||||
February 16, 2018 | February 28, 2018 | 0.04425 | 0.1328125 | |||||||
March 20, 2018 | March 30, 2018 | 0.04425 | 0.1328125 | |||||||
Total: | $ | 0.13275 | $ | 0.3984375 | ||||||
The same amounts paid to common stockholders will be paid as distributions on each OP Unit held by non-controlling limited partners of the Operating Partnership as of the above record dates.
102
GLADSTONE LAND CORPORATION
SCHEDULE III—REAL ESTATE AND ACCUMULATED DEPRECIATION
December 31, 2017
(In Thousands)
Initial Cost | Subsequent Capitalized Additions | Total Cost | ||||||||||||||||||||||||||||||||||||||||||||||||
Location and Description of Property | Date Acquired | Encumbrances | Land and Land Improvements | Buildings & Improvements | Horticulture | Land Improvements | Buildings & Improvements | Horticulture | Land and Land Improvements | Buildings & Improvements | Horticulture | Total(1) | Accumulated Depreciation(2) | |||||||||||||||||||||||||||||||||||||
Santa Cruz County, California: | ||||||||||||||||||||||||||||||||||||||||||||||||||
Land & Improvements | 6/16/1997 | 7,875 | 4,350 | — | — | — | 579 | — | 4,350 | 579 | — | 4,929 | (222 | ) | ||||||||||||||||||||||||||||||||||||
Ventura County, California: | ||||||||||||||||||||||||||||||||||||||||||||||||||
Land, Buildings & Improvements | 9/15/1998 | 30,689 | 9,895 | 5,256 | — | — | 293 | — | 9,895 | 5,549 | — | 15,444 | (3,631 | ) | ||||||||||||||||||||||||||||||||||||
Santa Cruz County, California: | ||||||||||||||||||||||||||||||||||||||||||||||||||
Land & Improvements | 1/3/2011 | 6,867 | 8,328 | — | — | 469 | 527 | — | 8,797 | 527 | — | 9,324 | (83 | ) | ||||||||||||||||||||||||||||||||||||
Hillsborough County, Florida: | ||||||||||||||||||||||||||||||||||||||||||||||||||
Land, Buildings & Improvements | 9/12/2012 | 2,868 | 2,199 | 1,657 | — | 14 | 1,129 | — | 2,213 | 2,786 | — | 4,999 | (692 | ) | ||||||||||||||||||||||||||||||||||||
Marion County, Oregon: | ||||||||||||||||||||||||||||||||||||||||||||||||||
Land, Buildings & Improvements | 5/31/2013 | 1,942 | 2,494 | 703 | — | 1 | 507 | — | 2,495 | 1,210 | — | 3,705 | (279 | ) | ||||||||||||||||||||||||||||||||||||
Monterey County, California: | ||||||||||||||||||||||||||||||||||||||||||||||||||
Land, Buildings & Improvements | 10/21/2013 | 4,922 | 7,187 | 164 | — | — | 2,311 | — | 7,187 | 2,475 | — | 9,662 | (252 | ) | ||||||||||||||||||||||||||||||||||||
Ventura County, California: | ||||||||||||||||||||||||||||||||||||||||||||||||||
Land & Improvements | 12/27/2013 | 9,264 | 12,937 | 1,118 | — | 4 | 134 | — | 12,941 | 1,252 | — | 14,193 | (307 | ) | ||||||||||||||||||||||||||||||||||||
Cochise County, Arizona: | ||||||||||||||||||||||||||||||||||||||||||||||||||
Land, Buildings & Improvements | 12/27/2013 | 4,823 | 6,168 | 572 | — | 8 | 1,531 | — | 6,176 | 2,103 | — | 8,279 | (732 | ) | ||||||||||||||||||||||||||||||||||||
Santa Cruz County, California: | ||||||||||||||||||||||||||||||||||||||||||||||||||
Land, Building & Improvements | 6/13/2014 | 4,010 | 5,576 | 207 | — | — | — | — | 5,576 | 207 | — | 5,783 | (184 | ) | ||||||||||||||||||||||||||||||||||||
Ventura County, California: | ||||||||||||||||||||||||||||||||||||||||||||||||||
Land, Buildings & Improvements | 7/23/2014 | 4,013 | 6,219 | 505 | — | — | 84 | — | 6,219 | 589 | — | 6,808 | (115 | ) | ||||||||||||||||||||||||||||||||||||
Kern County, California: | ||||||||||||||||||||||||||||||||||||||||||||||||||
Land & Improvements | 7/25/2014 | 4,478 | 5,841 | 67 | — | — | 993 | — | 5,841 | 1,060 | — | 6,901 | (168 | ) | ||||||||||||||||||||||||||||||||||||
Manatee County, Florida: | ||||||||||||||||||||||||||||||||||||||||||||||||||
Land, Buildings & Improvements | 9/29/2014 | 10,025 | 8,466 | 5,426 | — | — | 667 | — | 8,466 | 6,093 | — | 14,559 | (1,673 | ) | ||||||||||||||||||||||||||||||||||||
Ventura County, California: | ||||||||||||||||||||||||||||||||||||||||||||||||||
Land, Buildings & Improvements | 10/29/2014 | 15,634 | 23,673 | 350 | — | — | 1,374 | — | 23,673 | 1,724 | — | 25,397 | (113 | ) | ||||||||||||||||||||||||||||||||||||
Ventura County, California: | ||||||||||||||||||||||||||||||||||||||||||||||||||
Land & Improvements | 11/4/2014 | 3,675 | 5,860 | 92 | — | — | 2 | — | 5,860 | 94 | — | 5,954 | (30 | ) | ||||||||||||||||||||||||||||||||||||
Monterey County, California: | ||||||||||||||||||||||||||||||||||||||||||||||||||
Land, Buildings & Improvements | 1/5/2015 | 10,178 | 15,852 | 582 | — | (156 | ) | 1,110 | — | 15,696 | 1,692 | — | 17,388 | (324 | ) | |||||||||||||||||||||||||||||||||||
Manatee County, Florida: | ||||||||||||||||||||||||||||||||||||||||||||||||||
Land, Buildings & Improvements | 3/10/2015 | 4,177 | 2,403 | 1,871 | — | — | — | — | 2,403 | 1,871 | — | 4,274 | (475 | ) | ||||||||||||||||||||||||||||||||||||
Hendry County, Florida | ||||||||||||||||||||||||||||||||||||||||||||||||||
Land, Buildings & Improvements | 6/25/2015 | 9,360 | 14,411 | 789 | — | — | — | — | 14,411 | 789 | — | 15,200 | (309 | ) | ||||||||||||||||||||||||||||||||||||
Holt County, Nebraska | ||||||||||||||||||||||||||||||||||||||||||||||||||
Land, Buildings & Improvements | 8/20/2015 | 3,301 | 4,690 | 787 | — | — | — | — | 4,690 | 787 | — | 5,477 | (155 | ) | ||||||||||||||||||||||||||||||||||||
Rock County, Nebraska | ||||||||||||||||||||||||||||||||||||||||||||||||||
Land, Buildings & Improvements | 8/20/2015 | 3,301 | 4,862 | 613 | — | — | — | — | 4,862 | 613 | — | 5,475 | (189 | ) | ||||||||||||||||||||||||||||||||||||
Kern County, California: | ||||||||||||||||||||||||||||||||||||||||||||||||||
103
Land & Improvements | 9/3/2015 | 12,841 | 18,893 | 497 | — | 688 | 5,935 | 1,400 | 19,581 | 6,432 | 1,400 | 27,413 | (631 | ) | ||||||||||||||||||||||||||||||||||||
Hendry County, Florida: | ||||||||||||||||||||||||||||||||||||||||||||||||||
Land, Buildings & Improvements | 11/2/2015 | 2,076 | 3,244 | 739 | — | 2 | — | — | 3,246 | 739 | — | 3,985 | (245 | ) | ||||||||||||||||||||||||||||||||||||
Cochise County, Arizona: | ||||||||||||||||||||||||||||||||||||||||||||||||||
Land, Buildings & Improvements | 12/23/2015 | 3,210 | 4,234 | 1,502 | — | 5 | 152 | — | 4,239 | 1,654 | — | 5,893 | (270 | ) | ||||||||||||||||||||||||||||||||||||
Saguache County, Colorado: | ||||||||||||||||||||||||||||||||||||||||||||||||||
Land, Buildings & Improvements | 3/3/2016 | 14,849 | 16,756 | 8,348 | — | — | — | — | 16,756 | 8,348 | — | 25,104 | (2,052 | ) | ||||||||||||||||||||||||||||||||||||
Fresno County, California: | ||||||||||||||||||||||||||||||||||||||||||||||||||
Land, Improvements & Horticulture | 4/5/2016 | 8,914 | 3,623 | 1,228 | 11,455 | — | 13 | — | 3,623 | 1,241 | 11,455 | 16,319 | (811 | ) | ||||||||||||||||||||||||||||||||||||
Saint Lucie County, Florida: | ||||||||||||||||||||||||||||||||||||||||||||||||||
Land, Buildings & Improvements | 7/1/2016 | 2,995 | 4,165 | 971 | — | — | — | — | 4,165 | 971 | — | 5,136 | (146 | ) | ||||||||||||||||||||||||||||||||||||
Baca County, Colorado: | ||||||||||||||||||||||||||||||||||||||||||||||||||
Land & Buildings | 9/1/2016 | 3,474 | 6,167 | 214 | — | — | — | — | 6,167 | 214 | — | 6,381 | (19 | ) | ||||||||||||||||||||||||||||||||||||
Stanislaus County, California: | ||||||||||||||||||||||||||||||||||||||||||||||||||
Land & Improvements | 9/14/2016 | 8,280 | 14,114 | 45 | — | — | 464 | — | 14,114 | 509 | — | 14,623 | (7 | ) | ||||||||||||||||||||||||||||||||||||
Merced County, California: | ||||||||||||||||||||||||||||||||||||||||||||||||||
Land & Improvements | 9/14/2016 | 7,643 | 12,845 | 504 | — | — | 161 | — | 12,845 | 665 | — | 13,510 | (25 | ) | ||||||||||||||||||||||||||||||||||||
Fresno County, California: | ||||||||||||||||||||||||||||||||||||||||||||||||||
Land, Improvements & Horticulture | 10/13/2016 | 3,806 | 2,937 | 139 | 3,451 | — | — | — | 2,937 | 139 | 3,451 | 6,527 | (221 | ) | ||||||||||||||||||||||||||||||||||||
Baca County, Colorado: | ||||||||||||||||||||||||||||||||||||||||||||||||||
Land & Improvements | 12/28/2016 | 6,717 | 11,430 | 278 | — | — | — | — | 11,430 | 278 | — | 11,708 | (56 | ) | ||||||||||||||||||||||||||||||||||||
Martin County, Florida: | ||||||||||||||||||||||||||||||||||||||||||||||||||
Land & Improvements | 1/12/2017 | 32,400 | 52,444 | 1,627 | — | — | — | — | 52,444 | 1,627 | — | 54,071 | (63 | ) | ||||||||||||||||||||||||||||||||||||
Yuma County, Arizona: | ||||||||||||||||||||||||||||||||||||||||||||||||||
Land & Improvements | 6/1/2017 | 15,300 | 12,390 | 12,191 | — | — | — | — | 12,390 | 12,191 | — | 24,581 | (281 | ) | ||||||||||||||||||||||||||||||||||||
Bladen County, North Carolina: | ||||||||||||||||||||||||||||||||||||||||||||||||||
Land, Improvements & Horticulture | 7/17/2017 | 7,947 | 5,048 | 777 | 7,818 | 2 | — | — | 5,050 | 777 | 7,818 | 13,645 | (198 | ) | ||||||||||||||||||||||||||||||||||||
Okeechobee County, Florida: | ||||||||||||||||||||||||||||||||||||||||||||||||||
Land & Improvements | 8/9/2017 | 5,820 | 9,111 | 953 | — | 8 | — | — | 9,119 | 953 | — | 10,072 | (17 | ) | ||||||||||||||||||||||||||||||||||||
Santa Barbara County, California: | ||||||||||||||||||||||||||||||||||||||||||||||||||
Land, Improvements & Horticulture | 8/9/2017 | 3,225 | 4,559 | 577 | 397 | — | 660 | — | 4,559 | 1,237 | 397 | 6,193 | (39 | ) | ||||||||||||||||||||||||||||||||||||
Walla Walla County, Washington: | ||||||||||||||||||||||||||||||||||||||||||||||||||
Land, Improvements & Horticulture | 9/8/2017 | 5,412 | 5,286 | 401 | 3,739 | — | — | — | 5,286 | 401 | 3,739 | 9,426 | (153 | ) | ||||||||||||||||||||||||||||||||||||
Baca County, Colorado: | ||||||||||||||||||||||||||||||||||||||||||||||||||
Land, Improvements & Horticulture | 12/15/2017 | 3,555 | 2,016 | 324 | 3,626 | — | — | — | 2,016 | 324 | 3,626 | 5,966 | (15 | ) | ||||||||||||||||||||||||||||||||||||
Miscellaneous Investments | ||||||||||||||||||||||||||||||||||||||||||||||||||
Land, Buildings, Improvements & Horticulture | N/A | 13,122 | 14,589 | 3,356 | 2,361 | 9 | 968 | 556 | 14,598 | 4,324 | 2,917 | 21,839 | (1,475 | ) | ||||||||||||||||||||||||||||||||||||
$ | 302,988 | $ | 355,262 | $ | 55,430 | $ | 32,847 | $ | 1,054 | $ | 19,594 | $ | 1,956 | $ | 356,316 | $ | 75,024 | $ | 34,803 | $ | 466,143 | $ | (16,657 | ) | ||||||||||||||||||||||||||
(1) | The aggregate cost for land, buildings, improvements and horticulture for federal income tax purposes is approximately $457.9 million. |
(2) | The Company computes depreciation using the straight-line method over the shorter of the estimated useful life or 39 years for buildings and improvements, the the shorter of the estimated useful life or 25 years for horticulture, 5 to 7 years for equipment and fixtures and the shorter of the useful life or the remaining lease term for tenant improvements. |
104
The following table reconciles the change in the balance of real estate during the years ended December 31, 2017, 2016, and 2015, respectively (dollars in thousands):
2017 | 2016 | 2015 | ||||||||||
Balance, beginning of period | $ | 337,377 | $ | 228,418 | $ | 148,371 | ||||||
Additions: | ||||||||||||
Acquisitions during the period | 129,226 | 100,356 | 75,078 | |||||||||
Improvements | 3,945 | 8,773 | 5,037 | |||||||||
Deductions: | ||||||||||||
Dispositions during period | (4,405 | ) | (170 | ) | (68 | ) | ||||||
Purchase price adjustments | — | — | — | |||||||||
Balance, end of period | $ | 466,143 | $ | 337,377 | $ | 228,418 | ||||||
The following table reconciles the change in the balance of accumulated depreciation during the years ended December 31, 2017, 2016, and 2015, respectively (dollars in thousands):
2017 | 2016 | 2015 | ||||||||||
Balance, beginning of period | $ | 11,066 | $ | 6,634 | $ | 4,431 | ||||||
Additions during period | 6,180 | 4,446 | 2,203 | |||||||||
Dispositions during period | (589 | ) | (14 | ) | — | |||||||
Balance, end of period | $ | 16,657 | $ | 11,066 | $ | 6,634 | ||||||
105
ITEM 9. | CHANGES IN AND DISAGREEMENTS WITH ACCOUNTANTS ON ACCOUNTING AND FINANCIAL DISCLOSURE |
None.
ITEM 9A. | CONTROLS AND PROCEDURES |
Evaluation of Disclosure Controls and Procedures
As of December 31, 2017, our management, including our chief executive officer and chief financial officer, evaluated the effectiveness of the design and operation of our disclosure controls and procedures. Based on that evaluation, management, including the chief executive officer and chief financial officer, concluded that our disclosure controls and procedures were effective as of December 31, 2017, in providing a reasonable level of assurance that information we are required to disclose in reports that we file or submit under the Exchange Act is recorded, processed, summarized and reported within the time periods specified in applicable SEC rules and forms, including providing a reasonable level of assurance that information required to be disclosed by us in such reports is accumulated and communicated to our management, including our chief executive officer and our chief financial officer, as appropriate to allow timely decisions regarding required disclosure. However, in evaluating the disclosure controls and procedures, management recognized that any controls and procedures, no matter how well designed and operated can provide only reasonable assurance of necessarily achieving the desired control objectives, and management was required to apply its judgment in evaluating the cost-benefit relationship of possible controls and procedures.
Management’s Annual Report on Internal Control over Financial Reporting
Refer to “Management’s Report on Internal Controls over Financial Reporting,” located in Item 8 of this Form 10-K.
Changes in Internal Control over Financial Reporting
There were no changes in our internal control over financial reporting that occurred during the year ended December 31, 2017, that have materially affected, or are reasonably likely to materially affect, our internal control over financial reporting.
ITEM 9B. | OTHER INFORMATION |
None.
106
PART III
We will file a definitive Proxy Statement for our 2018 Annual Meeting of Stockholders (the “2018 Proxy Statement”) with the SEC, pursuant to Regulation 14A, not later than 120 days after December 31, 2017. Accordingly, certain information required by Part III has been omitted under General Instruction G(3) to Form 10-K. Only those sections of the 2018 Proxy Statement that specifically address the items set forth herein are incorporated by reference.
ITEM 10. | DIRECTORS, EXECUTIVE OFFICERS AND CORPORATE GOVERNANCE |
The information required by Item 10 is hereby incorporated by reference from our 2018 Proxy Statement under the captions “Election of Directors to Class of 2021,” “Information Regarding the Board of Directors and Corporate Governance,” “Report of the Compensation Committee of the Board of Directors” and “Section 16(a) Beneficial Ownership Reporting Compliance” and the sub-caption “Code of Business Conduct and Ethics.”
ITEM 11. | EXECUTIVE COMPENSATION |
The information required by Item 11 is hereby incorporated by reference from our 2018 Proxy Statement under the captions “Executive Compensation,” “Director Compensation” and “Report of the Compensation Committee of the Board of Directors” and the sub-caption “Compensation Committee Interlocks and Insider Participation.”
ITEM 12. | SECURITY OWNERSHIP OF CERTAIN BENEFICIAL OWNERS AND MANAGEMENT AND RELATED STOCKHOLDER MATTERS |
The information required by Item 12 is hereby incorporated by reference from our 2018 Proxy Statement under the caption “Security Ownership of Certain Beneficial Owners and Management.”
ITEM 13. | CERTAIN RELATIONSHIPS AND RELATED TRANSACTIONS AND DIRECTOR INDEPENDENCE |
The information required by Item 13 is hereby incorporated by reference from our 2018 Proxy Statement under the captions “Transactions with Related Persons” and “Information Regarding the Board of Directors and Corporate Governance.”
ITEM 14. | PRINCIPAL ACCOUNTANT FEES AND SERVICES |
The information required by Item 14 is hereby incorporated by reference from our 2018 Proxy Statement under the sub-captions “Independent Registered Public Accounting Firm Fees” and “Pre-Approval Policy and Procedures” under the caption “Ratification of Selection of Independent Registered Public Accounting Firm.”
107
PART IV
ITEM 15. | EXHIBITS AND FINANCIAL STATEMENT SCHEDULES |
a. DOCUMENTS FILED AS PART OF THIS REPORT
1. The following financial statements are filed herewith:
Report of Independent Registered Public Accounting Firm
Consolidated Balance Sheets as of December 31, 2017 and 2016
Consolidated Statements of Operations for the years ended December 31, 2017, 2016, and 2015
Consolidated Statements of Equity for the years ended December 31, 2017, 2016, and 2015
Consolidated Statements of Cash Flows for the years ended December 31, 2017, 2016, and 2015
Notes to Financial Statements
2. Financial statement schedules
Schedule III – Real Estate and Accumulated Depreciation is filed herewith.
All other schedules are omitted because they are not applicable, or because the required information is included in the financial statements or notes thereto.
3. Exhibits
The following exhibits are filed as part of this report or hereby incorporated by reference to exhibits previously filed with the Securities and Exchange Commission:
Exhibit Number | Exhibit Description | |
3.1 | ||
3.2 | ||
3.3 | ||
3.4 | ||
3.5 | ||
4.1 | ||
4.2 | ||
4.3 | ||
4.4 | ||
10.1 | ||
10.2 | ||
108
10.3 | ||
10.4 | ||
10.5 | ||
10.6 | ||
10.7 | ||
10.8 | ||
10.9 | ||
10.10 | ||
10.11 | ||
10.12 | ||
10.13 | ||
10.14 | ||
10.15 | ||
10.16 | ||
10.17 | ||
10.18 | ||
10.19 | ||
109
10.20 | ||
10.21 | ||
10.22 | ||
10.23 | ||
10.24 | ||
10.25 | ||
10.26 | ||
10.27 | ||
10.28 | ||
10.29 | ||
10.30 | ||
10.31 | ||
10.32 | ||
10.33 | ||
10.34 | ||
10.35 | ||
11 | ||
12 | ||
110
21 | ||
23 | ||
31.1 | ||
31.2 | ||
32.1 | ||
32.2 | ||
101.INS*** | XBRL Instance Document | |
101.SCH*** | XBRL Taxonomy Extension Schema Document | |
101.CAL*** | XBRL Taxonomy Extension Calculation Linkbase Document | |
101.LAB*** | XBRL Taxonomy Extension Label Linkbase Document | |
101.PRE*** | XBRL Taxonomy Extension Presentation Linkbase Document | |
101.DEF*** | XBRL Definition Linkbase | |
*** | Attached as Exhibit 101 to this Annual Report on Form 10-K are the following materials, formatted in eXtensible Business Reporting Language (XBRL): (i) the Consolidated Balance Sheets as of December 31, 2017, and December 31, 2016, (ii) the Consolidated Statements of Operations for the years ended December 31, 2017, 2016 and 2015, (iii) the Consolidated Statements of Equity for the years ended December 31, 2017, 2016 and 2015, (iv) the Consolidated Statements of Cash Flows for the years ended December 31, 2017, 2016 and 2015 and (v) the Notes to the Consolidated Financial Statements. |
ITEM 16. | FORM 10-K SUMMARY |
Not applicable.
SIGNATURES
Pursuant to the requirements of Section 13 or 15(d) of the Securities Exchange Act of 1934, the registrant has duly caused this report to be signed on its behalf by the undersigned, thereunto duly authorized.
Gladstone Land Corporation | |||
Date: February 20, 2018 | By: | /s/ Lewis Parrish | |
Lewis Parrish | |||
Chief Financial Officer | |||
Date: February 20, 2018 | By: | /s/ David Gladstone | |
David Gladstone | |||
Chief Executive Officer and | |||
Chairman of the Board of Directors | |||
111
Pursuant to the requirements of the Securities Exchange Act of 1934, this report has been signed below by the following persons on behalf of the registrant and in the capacities and on the dates indicated.
Date: February 20, 2018 | By: | /s/ David Gladstone | |
David Gladstone | |||
Chief Executive Officer and Chairman of the Board of Directors (principal executive officer) | |||
Date: February 20, 2018 | By: | /s/ Terry Lee Brubaker | |
Terry Lee Brubaker Vice Chairman, Chief Operating Officer and Director | |||
Date: February 20, 2018 | By: | /s/ Lewis Parrish | |
Lewis Parrish | |||
Chief Financial Officer (principal financial and accounting officer) | |||
Date: February 20, 2018 | By: | /s/ Paul Adelgren | |
Paul Adelgren | |||
Director | |||
Date: February 20, 2018 | By: | /s/ Michela A. English | |
Michela A. English | |||
Director | |||
Date: February 20, 2018 | By: | /s/ Caren D. Merrick | |
Caren D. Merrick | |||
Director | |||
Date: February 20, 2018 | By: | /s/ John Outland | |
John Outland | |||
Director | |||
Date: February 20, 2018 | By: | /s/ Anthony W. Parker | |
Anthony W. Parker | |||
Director | |||
Date: February 20, 2018 | By: | /s/ Walter H. Wilkinson, Jr. | |
Walter H. Wilkinson, Jr. | |||
Director | |||
112