10-K00012979962021FYfalse0001494877--12-312021FY2021-12-313825000030200000280289726284415013382500003020000028028972628441501380462675931771http://fasb.org/us-gaap/2021-01-31#AccountsPayableAndAccruedLiabilitiesCurrentAndNoncurrent0.05875P2YP2YP2YP2YP4Y0001297996dlr:UnsecuredTermLoanMember2020-12-310001297996dlr:IncentiveUnitsMember2021-12-310001297996dlr:CommonUnitsMember2021-12-310001297996dlr:IncentiveUnitsMember2020-12-310001297996dlr:CommonUnitsMember2020-12-310001297996dlr:IncentiveUnitsMember2019-12-310001297996dlr:CommonUnitsMember2019-12-310001297996dlr:IncentiveUnitsMember2018-12-310001297996dlr:CommonUnitsMember2018-12-310001297996us-gaap:SeriesCPreferredStockMemberus-gaap:PreferredStockMember2021-01-012021-12-310001297996dlr:DigitalRealtyTrustLPMemberus-gaap:SeriesCPreferredStockMember2021-01-012021-12-310001297996us-gaap:SeriesCPreferredStockMember2021-01-012021-12-310001297996dlr:DigitalRealtyTrustLPMemberdlr:CommonUnitsMemberus-gaap:GeneralPartnerMemberus-gaap:SeriesGPreferredStockMember2020-01-012020-12-310001297996dlr:DigitalRealtyTrustLPMemberdlr:CommonUnitsMemberus-gaap:GeneralPartnerMemberdlr:SeriesIPreferredStockMember2020-01-012020-12-310001297996us-gaap:SeriesGPreferredStockMemberus-gaap:RetainedEarningsMember2020-01-012020-12-310001297996us-gaap:SeriesGPreferredStockMemberus-gaap:PreferredStockMember2020-01-012020-12-310001297996dlr:SeriesIPreferredStockMemberus-gaap:RetainedEarningsMember2020-01-012020-12-310001297996dlr:SeriesIPreferredStockMemberus-gaap:PreferredStockMember2020-01-012020-12-310001297996dlr:DigitalRealtyTrustLPMemberus-gaap:SeriesGPreferredStockMember2020-01-012020-12-310001297996dlr:DigitalRealtyTrustLPMemberdlr:SeriesIPreferredStockMember2020-01-012020-12-310001297996us-gaap:SeriesGPreferredStockMember2020-01-012020-12-310001297996dlr:SeriesIPreferredStockMember2020-01-012020-12-310001297996dlr:DigitalRealtyTrustLPMemberdlr:CommonUnitsMemberus-gaap:GeneralPartnerMemberus-gaap:SeriesHPreferredStockMember2019-01-012019-12-310001297996us-gaap:SeriesHPreferredStockMemberus-gaap:RetainedEarningsMember2019-01-012019-12-310001297996us-gaap:SeriesHPreferredStockMemberus-gaap:PreferredStockMember2019-01-012019-12-310001297996dlr:DigitalRealtyTrustLPMemberus-gaap:SeriesHPreferredStockMember2019-01-012019-12-310001297996us-gaap:SeriesHPreferredStockMember2019-01-012019-12-310001297996dlr:DigitalRealtyTrustLPMemberdlr:PreferredUnitsMemberus-gaap:GeneralPartnerMemberus-gaap:SeriesCPreferredStockMember2021-01-012021-12-310001297996dlr:DigitalRealtyTrustLPMemberdlr:PreferredUnitsMemberus-gaap:GeneralPartnerMemberus-gaap:SeriesGPreferredStockMember2020-01-012020-12-310001297996dlr:DigitalRealtyTrustLPMemberdlr:PreferredUnitsMemberus-gaap:GeneralPartnerMemberdlr:SeriesIPreferredStockMember2020-01-012020-12-310001297996dlr:DigitalRealtyTrustLPMemberdlr:PreferredUnitsMemberus-gaap:GeneralPartnerMemberus-gaap:SeriesHPreferredStockMember2019-01-012019-12-310001297996dlr:SeriesLPreferredStockMemberus-gaap:PreferredStockMember2019-01-012019-12-310001297996dlr:SeriesKPreferredStockMemberus-gaap:PreferredStockMember2019-01-012019-12-310001297996dlr:DigitalRealtyTrustLPMemberdlr:SeriesLPreferredStockMember2019-01-012019-12-310001297996dlr:DigitalRealtyTrustLPMemberdlr:SeriesKPreferredStockMember2019-01-012019-12-310001297996dlr:SeriesLPreferredStockMember2019-01-012019-12-310001297996dlr:SeriesKPreferredStockMember2019-01-012019-12-310001297996us-gaap:OverAllotmentOptionMember2021-10-132021-10-130001297996dlr:DigitalRealtyTrustLPMemberdlr:PreferredUnitsMemberus-gaap:GeneralPartnerMemberdlr:SeriesLPreferredStockMember2019-01-012019-12-310001297996dlr:DigitalRealtyTrustLPMemberdlr:PreferredUnitsMemberus-gaap:GeneralPartnerMemberdlr:SeriesKPreferredStockMember2019-01-012019-12-310001297996us-gaap:CommonStockMember2019-01-012019-12-310001297996us-gaap:RetainedEarningsMember2021-12-310001297996us-gaap:PreferredStockMember2021-12-310001297996us-gaap:NoncontrollingInterestMember2021-12-310001297996us-gaap:AdditionalPaidInCapitalMember2021-12-310001297996dlr:RedeemableNoncontrollingInterestsOperatingPartnershipMember2021-12-310001297996us-gaap:RetainedEarningsMember2020-12-310001297996us-gaap:PreferredStockMember2020-12-310001297996us-gaap:NoncontrollingInterestMember2020-12-310001297996us-gaap:AdditionalPaidInCapitalMember2020-12-310001297996dlr:RedeemableNoncontrollingInterestsOperatingPartnershipMember2020-12-310001297996srt:CumulativeEffectPeriodOfAdoptionAdjustmentMemberus-gaap:RetainedEarningsMember2019-12-310001297996us-gaap:RetainedEarningsMember2019-12-310001297996us-gaap:PreferredStockMember2019-12-310001297996us-gaap:NoncontrollingInterestMember2019-12-310001297996us-gaap:AdditionalPaidInCapitalMember2019-12-310001297996srt:CumulativeEffectPeriodOfAdoptionAdjustmentMember2019-12-310001297996dlr:RedeemableNoncontrollingInterestsOperatingPartnershipMember2019-12-310001297996us-gaap:RetainedEarningsMember2018-12-310001297996us-gaap:PreferredStockMember2018-12-310001297996us-gaap:NoncontrollingInterestMember2018-12-310001297996us-gaap:AdditionalPaidInCapitalMember2018-12-310001297996us-gaap:AccumulatedOtherComprehensiveIncomeMember2018-12-310001297996dlr:RedeemableNoncontrollingInterestsOperatingPartnershipMember2018-12-310001297996us-gaap:CommonStockMember2021-12-310001297996us-gaap:CommonStockMember2020-12-310001297996us-gaap:CommonStockMember2019-12-310001297996us-gaap:CommonStockMember2018-12-310001297996us-gaap:OverAllotmentOptionMember2021-10-130001297996us-gaap:OverAllotmentOptionMember2021-09-130001297996dlr:TwoThousandFourteenIncentiveAwardPlanMember2021-12-310001297996dlr:MarketPerformanceBasedAwardsMember2021-02-252021-02-250001297996dlr:MarketPerformanceBasedAwardsMember2021-01-012021-01-010001297996dlr:MarketPerformanceBasedAwardsMember2020-02-202020-02-200001297996dlr:MarketPerformanceBasedAwardsMember2020-02-192020-02-190001297996dlr:MarketPerformanceBasedAwardsMember2019-02-212019-02-210001297996dlr:MarketPerformanceBasedAwardsMember2019-01-012019-01-010001297996dlr:A2019PerformanceGrantMemberus-gaap:RestrictedStockUnitsRSUMemberus-gaap:SubsequentEventMember2022-01-012022-01-310001297996dlr:A2019PerformanceGrantMemberdlr:ClassDUnitsMemberus-gaap:SubsequentEventMember2022-01-012022-01-310001297996dlr:A2019PerformanceGrantMemberdlr:DistributionEquivalentUnitMember2021-01-012021-12-310001297996dlr:A2018PerformanceGrantMemberus-gaap:RestrictedStockUnitsRSUMember2021-01-012021-01-310001297996dlr:A2018PerformanceGrantMemberdlr:ClassDUnitsMember2021-01-012021-01-310001297996dlr:A2018PerformanceGrantMemberdlr:DistributionEquivalentUnitMember2020-01-012020-12-310001297996dlr:A2017PerformanceGrantMemberus-gaap:RestrictedStockUnitsRSUMember2020-01-012020-01-310001297996dlr:A2017PerformanceGrantMemberdlr:ClassDUnitsMember2020-01-012020-01-310001297996dlr:A2017PerformanceGrantMemberdlr:DistributionEquivalentUnitMember2019-01-012019-12-310001297996us-gaap:RestrictedStockMember2020-12-310001297996us-gaap:RestrictedStockMemberdlr:InterxionHoldingN.v.Member2021-01-012021-12-310001297996dlr:ClassDAndRsuUnitsMember2021-01-012021-12-310001297996us-gaap:RestrictedStockMember2020-01-012020-12-310001297996dlr:ClassDAndRsuUnitsMember2020-01-012020-12-310001297996us-gaap:RestrictedStockMember2019-01-012019-12-310001297996dlr:ClassDAndRsuUnitsMember2019-01-012019-12-310001297996us-gaap:RestrictedStockMember2021-12-310001297996dlr:LongTermIncentiveUnitsMember2019-12-310001297996dlr:A2019PerformanceGrantMemberdlr:MarketPerformanceBasedAwardsMemberdlr:ShareBasedCompensationAwardTrancheSixMember2023-02-272023-02-270001297996dlr:A2019PerformanceGrantMemberdlr:MarketPerformanceBasedAwardsMemberdlr:ShareBasedCompensationAwardTrancheFiveMember2022-02-272022-02-270001297996dlr:A2018PerformanceGrantMemberdlr:MarketPerformanceBasedAwardsMemberdlr:ShareBasedCompensationAwardTrancheSixMember2022-02-272022-02-270001297996dlr:A2018PerformanceGrantMemberdlr:MarketPerformanceBasedAwardsMemberdlr:ShareBasedCompensationAwardTrancheFiveMember2021-02-272021-02-270001297996dlr:A2017PerformanceGrantMemberdlr:MarketPerformanceBasedAwardsMemberdlr:ShareBasedCompensationAwardTrancheSixMember2021-02-272021-02-270001297996dlr:A2017PerformanceGrantMemberdlr:MarketPerformanceBasedAwardsMemberdlr:ShareBasedCompensationAwardTrancheFiveMember2020-02-272020-02-270001297996srt:MinimumMemberdlr:ServiceBasedRestrictedStockUnitsMember2021-01-012021-12-310001297996srt:MinimumMemberdlr:LongTermIncentiveUnitsMember2021-01-012021-12-310001297996srt:MaximumMemberdlr:ServiceBasedRestrictedStockUnitsMember2021-01-012021-12-310001297996srt:MaximumMemberdlr:LongTermIncentiveUnitsMember2021-01-012021-12-310001297996us-gaap:RestrictedStockMember2021-01-012021-12-310001297996srt:MinimumMember2021-01-012021-12-310001297996srt:MaximumMember2021-01-012021-12-310001297996dlr:DigitalCoreReitMember2021-01-012021-12-310001297996dlr:DigitalRealtyTrustLPMemberdlr:RentalAndOtherServicesMember2021-01-012021-12-310001297996dlr:DigitalRealtyTrustLPMemberdlr:FeeIncomeAndOtherMember2021-01-012021-12-310001297996us-gaap:NonUsMember2021-01-012021-12-310001297996dlr:RentalAndOtherServicesMember2021-01-012021-12-310001297996dlr:FeeIncomeAndOtherMember2021-01-012021-12-310001297996country:US2021-01-012021-12-310001297996dlr:DigitalRealtyTrustLPMemberdlr:RentalAndOtherServicesMember2020-01-012020-12-310001297996dlr:DigitalRealtyTrustLPMemberdlr:FeeIncomeAndOtherMember2020-01-012020-12-310001297996us-gaap:NonUsMember2020-01-012020-12-310001297996dlr:RentalAndOtherServicesMember2020-01-012020-12-310001297996dlr:FeeIncomeAndOtherMember2020-01-012020-12-310001297996country:US2020-01-012020-12-310001297996dlr:DigitalRealtyTrustLPMemberdlr:RentalAndOtherServicesMember2019-01-012019-12-310001297996dlr:DigitalRealtyTrustLPMemberdlr:FeeIncomeAndOtherMember2019-01-012019-12-310001297996us-gaap:NonUsMember2019-01-012019-12-310001297996dlr:RentalAndOtherServicesMember2019-01-012019-12-310001297996dlr:FeeIncomeAndOtherMember2019-01-012019-12-310001297996country:US2019-01-012019-12-310001297996us-gaap:EquityMethodInvestmentNonconsolidatedInvesteeOrGroupOfInvesteesMember2021-12-310001297996us-gaap:EquityMethodInvestmentNonconsolidatedInvesteeOrGroupOfInvesteesMember2020-12-310001297996us-gaap:EquityMethodInvestmentNonconsolidatedInvesteeOrGroupOfInvesteesMember2019-12-310001297996dlr:OtherInvestmentMemberus-gaap:UnconsolidatedPropertiesMember2021-12-310001297996us-gaap:UnconsolidatedPropertiesMember2021-12-310001297996dlr:OtherInvestmentMemberus-gaap:UnconsolidatedPropertiesMember2020-12-310001297996dlr:MitsubishiCorporationJointVentureMemberus-gaap:UnconsolidatedPropertiesMember2020-12-310001297996dlr:MapletreeJointVentureMemberus-gaap:UnconsolidatedPropertiesMember2020-12-310001297996dlr:LumenMemberus-gaap:UnconsolidatedPropertiesMember2020-12-310001297996dlr:AscentyMemberus-gaap:UnconsolidatedPropertiesMember2020-12-310001297996us-gaap:UnconsolidatedPropertiesMember2020-12-310001297996country:US2021-12-310001297996country:US2020-12-310001297996srt:MinimumMemberus-gaap:MachineryAndEquipmentMember2021-01-012021-12-310001297996srt:MinimumMemberus-gaap:FurnitureAndFixturesMember2021-01-012021-12-310001297996srt:MinimumMemberus-gaap:BuildingAndBuildingImprovementsMember2021-01-012021-12-310001297996srt:MaximumMemberus-gaap:MachineryAndEquipmentMember2021-01-012021-12-310001297996srt:MaximumMemberus-gaap:FurnitureAndFixturesMember2021-01-012021-12-310001297996srt:MaximumMemberus-gaap:BuildingAndBuildingImprovementsMember2021-01-012021-12-3100012979962021-07-012021-09-300001297996us-gaap:SeriesCPreferredStockMember2020-01-012020-12-310001297996dlr:SeriesLPreferredStockMember2020-01-012020-12-310001297996dlr:SeriesKPreferredStockMember2020-01-012020-12-310001297996dlr:SeriesJPreferredStockMember2020-01-012020-12-310001297996dlr:OnePointThreeSevenFivePercentNotesDueTwentyThirtyTwoMemberdlr:UnsecuredSeniorNotesMemberus-gaap:SubsequentEventMember2022-01-182022-01-180001297996us-gaap:OverAllotmentOptionMember2021-09-132021-09-130001297996dlr:DigitalIntrepidHoldingB.vMemberdlr:SwissFrancNotesMemberdlr:UnsecuredSeniorNotesMember2021-07-152021-07-150001297996dlr:DigitalIntrepidHoldingB.vMemberdlr:ZeroPointSixTwoFivePercentNotesDueToTwoThousandThirtyOneMemberdlr:UnsecuredSeniorNotesMember2021-01-122021-01-120001297996us-gaap:SeriesCPreferredStockMember2020-12-310001297996dlr:SeriesLPreferredStockMember2020-12-310001297996dlr:SeriesKPreferredStockMember2020-12-310001297996dlr:SeriesJPreferredStockMember2020-12-310001297996dlr:DigitalRealtyTrustLPMemberdlr:SeriesHPreferredUnitsMember2019-04-010001297996dlr:SeriesHPreferredUnitsMember2019-04-010001297996dlr:SeriesCPreferredUnitsMember2021-05-172021-05-170001297996dlr:SeriesLPreferredStockMember2021-12-310001297996dlr:SeriesKPreferredStockMember2021-12-310001297996dlr:SeriesJPreferredStockMember2021-12-310001297996dlr:DigitalRealtyTrustLPMemberdlr:SeriesGPreferredUnitsMember2020-10-150001297996dlr:SeriesGPreferredUnitsMember2020-10-150001297996dlr:DigitalRealtyTrustLPMemberdlr:SeriesIPreferredUnitsMember2020-09-080001297996dlr:SeriesIPreferredUnitsMember2020-09-080001297996dlr:DigitalRealtyTrustLPMemberdlr:SeriesIPreferredUnitsMember2021-01-012021-12-310001297996dlr:DigitalRealtyTrustLPMemberdlr:SeriesHPreferredUnitsMember2021-01-012021-12-310001297996dlr:DigitalRealtyTrustLPMemberdlr:SeriesGPreferredUnitsMember2021-01-012021-12-310001297996dlr:SeriesIPreferredUnitsMember2021-01-012021-12-310001297996dlr:SeriesHPreferredUnitsMember2021-01-012021-12-310001297996dlr:SeriesGPreferredUnitsMember2021-01-012021-12-310001297996dlr:SeriesLPreferredStockMember2019-10-102019-10-100001297996dlr:SeriesKPreferredStockMember2019-03-132019-03-130001297996us-gaap:SeriesCPreferredStockMember2017-09-142017-09-140001297996dlr:SeriesJPreferredStockMember2017-08-072017-08-070001297996dlr:DigitalRealtyTrustLPMemberus-gaap:AccumulatedTranslationAdjustmentMember2021-12-310001297996dlr:DigitalRealtyTrustLPMemberus-gaap:AccumulatedOtherComprehensiveIncomeMember2021-12-310001297996dlr:DigitalRealtyTrustLPMemberus-gaap:AccumulatedOtherComprehensiveIncomeMember2021-12-310001297996dlr:DigitalRealtyTrustLPMemberus-gaap:AccumulatedGainLossNetCashFlowHedgeParentMember2021-12-310001297996dlr:DigitalRealtyTrustLPMemberdlr:RedeemableLimitedPartnerCommonUnitsMember2021-12-310001297996dlr:DigitalRealtyTrustLPMemberdlr:NoncontrollingInterestsInConsolidatedJointVenturesMember2021-12-310001297996dlr:DigitalRealtyTrustLPMemberdlr:AccumulatedForeignCurrencyNetInvestmentAdjustmentAttributableToParentMember2021-12-310001297996us-gaap:AccumulatedTranslationAdjustmentMember2021-12-310001297996us-gaap:AccumulatedOtherComprehensiveIncomeMember2021-12-310001297996us-gaap:AccumulatedGainLossNetCashFlowHedgeParentMember2021-12-310001297996dlr:AccumulatedForeignCurrencyNetInvestmentAdjustmentAttributableToParentMember2021-12-310001297996dlr:DigitalRealtyTrustLPMemberus-gaap:AccumulatedTranslationAdjustmentMember2020-12-310001297996dlr:DigitalRealtyTrustLPMemberus-gaap:AccumulatedOtherComprehensiveIncomeMember2020-12-310001297996dlr:DigitalRealtyTrustLPMemberus-gaap:AccumulatedOtherComprehensiveIncomeMember2020-12-310001297996dlr:DigitalRealtyTrustLPMemberus-gaap:AccumulatedGainLossNetCashFlowHedgeParentMember2020-12-310001297996dlr:DigitalRealtyTrustLPMemberdlr:RedeemableLimitedPartnerCommonUnitsMember2020-12-310001297996dlr:DigitalRealtyTrustLPMemberdlr:NoncontrollingInterestsInConsolidatedJointVenturesMember2020-12-310001297996dlr:DigitalRealtyTrustLPMemberdlr:AccumulatedForeignCurrencyNetInvestmentAdjustmentAttributableToParentMember2020-12-310001297996us-gaap:AccumulatedTranslationAdjustmentMember2020-12-310001297996us-gaap:AccumulatedOtherComprehensiveIncomeMember2020-12-310001297996us-gaap:AccumulatedGainLossNetCashFlowHedgeParentMember2020-12-310001297996dlr:AccumulatedForeignCurrencyNetInvestmentAdjustmentAttributableToParentMember2020-12-310001297996dlr:DigitalRealtyTrustLPMembersrt:CumulativeEffectPeriodOfAdoptionAdjustmentMemberdlr:CommonUnitsMemberus-gaap:GeneralPartnerMember2019-12-310001297996dlr:DigitalRealtyTrustLPMemberus-gaap:AccumulatedTranslationAdjustmentMember2019-12-310001297996dlr:DigitalRealtyTrustLPMemberus-gaap:AccumulatedOtherComprehensiveIncomeMember2019-12-310001297996dlr:DigitalRealtyTrustLPMemberus-gaap:AccumulatedOtherComprehensiveIncomeMember2019-12-310001297996dlr:DigitalRealtyTrustLPMemberus-gaap:AccumulatedGainLossNetCashFlowHedgeParentMember2019-12-310001297996dlr:DigitalRealtyTrustLPMembersrt:CumulativeEffectPeriodOfAdoptionAdjustmentMember2019-12-310001297996dlr:DigitalRealtyTrustLPMemberdlr:RedeemableLimitedPartnerCommonUnitsMember2019-12-310001297996dlr:DigitalRealtyTrustLPMemberdlr:NoncontrollingInterestsInConsolidatedJointVenturesMember2019-12-310001297996dlr:DigitalRealtyTrustLPMemberdlr:AccumulatedForeignCurrencyNetInvestmentAdjustmentAttributableToParentMember2019-12-310001297996us-gaap:AccumulatedTranslationAdjustmentMember2019-12-310001297996us-gaap:AccumulatedOtherComprehensiveIncomeMember2019-12-310001297996us-gaap:AccumulatedGainLossNetCashFlowHedgeParentMember2019-12-310001297996dlr:AccumulatedForeignCurrencyNetInvestmentAdjustmentAttributableToParentMember2019-12-310001297996dlr:DigitalRealtyTrustLPMemberus-gaap:AccumulatedOtherComprehensiveIncomeMember2018-12-310001297996dlr:DigitalRealtyTrustLPMemberdlr:RedeemableLimitedPartnerCommonUnitsMember2018-12-310001297996dlr:DigitalRealtyTrustLPMemberdlr:NoncontrollingInterestsInConsolidatedJointVenturesMember2018-12-310001297996dlr:DigitalRealtyTrustLPMemberdlr:PreferredUnitsMemberus-gaap:GeneralPartnerMember2021-12-310001297996dlr:DigitalRealtyTrustLPMemberdlr:CommonUnitsMemberus-gaap:LimitedPartnerMember2021-12-310001297996dlr:DigitalRealtyTrustLPMemberdlr:CommonUnitsMemberus-gaap:GeneralPartnerMember2021-12-310001297996dlr:DigitalRealtyTrustLPMemberdlr:PreferredUnitsMemberus-gaap:GeneralPartnerMember2020-12-310001297996dlr:DigitalRealtyTrustLPMemberdlr:CommonUnitsMemberus-gaap:LimitedPartnerMember2020-12-310001297996dlr:DigitalRealtyTrustLPMemberdlr:CommonUnitsMemberus-gaap:GeneralPartnerMember2020-12-310001297996dlr:DigitalRealtyTrustLPMemberdlr:PreferredUnitsMemberus-gaap:GeneralPartnerMember2019-12-310001297996dlr:DigitalRealtyTrustLPMemberdlr:CommonUnitsMemberus-gaap:LimitedPartnerMember2019-12-310001297996dlr:DigitalRealtyTrustLPMemberdlr:CommonUnitsMemberus-gaap:GeneralPartnerMember2019-12-310001297996dlr:DigitalRealtyTrustLPMemberdlr:PreferredUnitsMemberus-gaap:GeneralPartnerMember2018-12-310001297996dlr:DigitalRealtyTrustLPMemberdlr:CommonUnitsMemberus-gaap:LimitedPartnerMember2018-12-310001297996dlr:DigitalRealtyTrustLPMemberdlr:CommonUnitsMemberus-gaap:GeneralPartnerMember2018-12-310001297996us-gaap:CommonStockMember2020-01-012020-12-310001297996dlr:DigitalRealtyTrustLPMemberus-gaap:AccumulatedOtherComprehensiveIncomeMember2021-01-012021-12-310001297996dlr:DigitalRealtyTrustLPMemberus-gaap:AccumulatedOtherComprehensiveIncomeMember2020-01-012020-12-310001297996dlr:DigitalRealtyTrustLPMemberus-gaap:AccumulatedOtherComprehensiveIncomeMember2019-01-012019-12-310001297996us-gaap:AccumulatedOtherComprehensiveIncomeMember2019-01-012019-12-310001297996dlr:DigitalRealtyTrustLPMemberus-gaap:InterestRateSwapMemberus-gaap:AccumulatedOtherComprehensiveIncomeMember2021-01-012021-12-310001297996us-gaap:InterestRateSwapMemberus-gaap:NoncontrollingInterestMember2021-01-012021-12-310001297996us-gaap:InterestRateSwapMemberus-gaap:AccumulatedOtherComprehensiveIncomeMember2021-01-012021-12-310001297996dlr:DigitalRealtyTrustLPMemberus-gaap:InterestRateSwapMember2021-01-012021-12-310001297996us-gaap:InterestRateSwapMember2021-01-012021-12-310001297996dlr:DigitalRealtyTrustLPMemberus-gaap:InterestRateSwapMemberus-gaap:AccumulatedOtherComprehensiveIncomeMember2020-01-012020-12-310001297996us-gaap:InterestRateSwapMemberus-gaap:NoncontrollingInterestMember2020-01-012020-12-310001297996us-gaap:InterestRateSwapMemberus-gaap:AccumulatedOtherComprehensiveIncomeMember2020-01-012020-12-310001297996dlr:DigitalRealtyTrustLPMemberus-gaap:InterestRateSwapMember2020-01-012020-12-310001297996us-gaap:InterestRateSwapMember2020-01-012020-12-310001297996dlr:DigitalRealtyTrustLPMemberus-gaap:InterestRateSwapMemberus-gaap:AccumulatedOtherComprehensiveIncomeMember2019-01-012019-12-310001297996us-gaap:InterestRateSwapMemberus-gaap:NoncontrollingInterestMember2019-01-012019-12-310001297996us-gaap:InterestRateSwapMemberus-gaap:AccumulatedOtherComprehensiveIncomeMember2019-01-012019-12-310001297996dlr:DigitalRealtyTrustLPMemberus-gaap:InterestRateSwapMember2019-01-012019-12-310001297996us-gaap:InterestRateSwapMember2019-01-012019-12-310001297996dlr:DigitalRealtyTrustLPMemberus-gaap:AccumulatedTranslationAdjustmentMember2021-01-012021-12-310001297996dlr:DigitalRealtyTrustLPMemberus-gaap:AccumulatedOtherComprehensiveIncomeMember2021-01-012021-12-310001297996dlr:DigitalRealtyTrustLPMemberus-gaap:AccumulatedGainLossNetCashFlowHedgeParentMember2021-01-012021-12-310001297996us-gaap:AccumulatedTranslationAdjustmentMember2021-01-012021-12-310001297996us-gaap:AccumulatedOtherComprehensiveIncomeMember2021-01-012021-12-310001297996us-gaap:AccumulatedGainLossNetCashFlowHedgeParentMember2021-01-012021-12-310001297996dlr:DigitalRealtyTrustLPMemberus-gaap:AccumulatedTranslationAdjustmentMember2020-01-012020-12-310001297996dlr:DigitalRealtyTrustLPMemberus-gaap:AccumulatedOtherComprehensiveIncomeMember2020-01-012020-12-310001297996dlr:DigitalRealtyTrustLPMemberus-gaap:AccumulatedGainLossNetCashFlowHedgeParentMember2020-01-012020-12-310001297996dlr:DigitalRealtyTrustLPMemberdlr:AccumulatedForeignCurrencyNetInvestmentAdjustmentAttributableToParentMember2020-01-012020-12-310001297996us-gaap:AccumulatedTranslationAdjustmentMember2020-01-012020-12-310001297996us-gaap:AccumulatedOtherComprehensiveIncomeMember2020-01-012020-12-310001297996us-gaap:AccumulatedGainLossNetCashFlowHedgeParentMember2020-01-012020-12-310001297996dlr:AccumulatedForeignCurrencyNetInvestmentAdjustmentAttributableToParentMember2020-01-012020-12-310001297996dlr:OperatingPropertiesMember2021-12-310001297996us-gaap:FairValueInputsLevel2Memberus-gaap:EstimateOfFairValueFairValueDisclosureMemberdlr:UnsecuredSeniorNotesMember2021-12-310001297996us-gaap:FairValueInputsLevel2Memberus-gaap:CarryingReportedAmountFairValueDisclosureMemberdlr:UnsecuredSeniorNotesMember2021-12-310001297996us-gaap:FairValueInputsLevel2Memberus-gaap:EstimateOfFairValueFairValueDisclosureMemberdlr:UnsecuredSeniorNotesMember2020-12-310001297996us-gaap:FairValueInputsLevel2Memberus-gaap:CarryingReportedAmountFairValueDisclosureMemberdlr:UnsecuredSeniorNotesMember2020-12-310001297996dlr:DigitalRealtyTrustLPMemberdlr:PreferredUnitsMemberus-gaap:GeneralPartnerMember2021-01-012021-12-310001297996dlr:DigitalRealtyTrustLPMemberdlr:NoncontrollingInterestsInConsolidatedJointVenturesMember2021-01-012021-12-310001297996dlr:DigitalRealtyTrustLPMemberdlr:NoncontrollingInterestsInConsolidatedJointVenturesMember2020-01-012020-12-310001297996dlr:DigitalRealtyTrustLPMemberdlr:PreferredUnitsMemberus-gaap:GeneralPartnerMember2019-01-012019-12-310001297996dlr:DigitalRealtyTrustLPMemberdlr:RedeemableLimitedPartnerCommonUnitsMember2019-01-012019-12-310001297996dlr:DigitalRealtyTrustLPMemberdlr:NoncontrollingInterestsInConsolidatedJointVenturesMember2019-01-012019-12-310001297996dlr:SubsidiaryOfOperatingPartnershipSubsidiaryMemberdlr:AscentyMember2021-12-310001297996dlr:SubsidiaryOfOperatingPartnershipSubsidiaryMemberdlr:AscentyMember2020-12-310001297996us-gaap:EstimateOfFairValueFairValueDisclosureMember2021-12-310001297996us-gaap:CarryingReportedAmountFairValueDisclosureMember2021-12-310001297996us-gaap:EstimateOfFairValueFairValueDisclosureMember2020-12-310001297996us-gaap:CarryingReportedAmountFairValueDisclosureMember2020-12-310001297996us-gaap:FairValueInputsLevel2Memberus-gaap:EstimateOfFairValueFairValueDisclosureMemberus-gaap:SecuredDebtMember2021-12-310001297996us-gaap:FairValueInputsLevel2Memberus-gaap:CarryingReportedAmountFairValueDisclosureMemberus-gaap:SecuredDebtMember2021-12-310001297996us-gaap:FairValueInputsLevel2Memberus-gaap:EstimateOfFairValueFairValueDisclosureMemberus-gaap:SecuredDebtMember2020-12-310001297996us-gaap:FairValueInputsLevel2Memberus-gaap:CarryingReportedAmountFairValueDisclosureMemberus-gaap:SecuredDebtMember2020-12-310001297996us-gaap:FairValueInputsLevel2Memberus-gaap:EstimateOfFairValueFairValueDisclosureMemberdlr:GlobalRevolvingCreditFacilityMember2021-12-310001297996us-gaap:FairValueInputsLevel2Memberus-gaap:CarryingReportedAmountFairValueDisclosureMemberdlr:GlobalRevolvingCreditFacilityMember2021-12-310001297996us-gaap:FairValueInputsLevel2Memberus-gaap:EstimateOfFairValueFairValueDisclosureMemberdlr:UnsecuredTermLoanMember2020-12-310001297996us-gaap:FairValueInputsLevel2Memberus-gaap:EstimateOfFairValueFairValueDisclosureMemberdlr:GlobalRevolvingCreditFacilityMember2020-12-310001297996us-gaap:FairValueInputsLevel2Memberus-gaap:CarryingReportedAmountFairValueDisclosureMemberdlr:UnsecuredTermLoanMember2020-12-310001297996us-gaap:FairValueInputsLevel2Memberus-gaap:CarryingReportedAmountFairValueDisclosureMemberdlr:GlobalRevolvingCreditFacilityMember2020-12-310001297996dlr:DigitalRealtyTrustLPMemberdlr:YenRevolvingCreditFacilityMember2021-12-310001297996dlr:YenRevolvingCreditFacilityMember2021-12-310001297996dlr:GlobalRevolvingCreditFacilityMember2021-12-310001297996dlr:GlobalRevolvingCreditFacilityMember2020-12-310001297996dlr:RentalAndOtherServicesMemberdlr:BelowMarketLeasesNetOfAboveMarketLeasesMember2021-01-012021-12-310001297996dlr:RentalAndOtherServicesMemberdlr:BelowMarketLeasesNetOfAboveMarketLeasesMember2020-01-012020-12-310001297996dlr:RentalAndOtherServicesMemberdlr:BelowMarketLeasesNetOfAboveMarketLeasesMember2019-01-012019-12-310001297996dlr:DigitalRealtyTrustLPMemberus-gaap:DomesticCountryMember2021-01-012021-12-310001297996us-gaap:DomesticCountryMember2021-01-012021-12-310001297996us-gaap:DomesticCountryMember2020-01-012020-12-310001297996us-gaap:DomesticCountryMember2019-01-012019-12-310001297996us-gaap:EquityMethodInvestmentNonconsolidatedInvesteeOrGroupOfInvesteesMember2021-01-012021-12-310001297996us-gaap:EquityMethodInvestmentNonconsolidatedInvesteeOrGroupOfInvesteesMember2020-01-012020-12-310001297996us-gaap:EquityMethodInvestmentNonconsolidatedInvesteeOrGroupOfInvesteesMember2019-01-012019-12-310001297996us-gaap:EquityMethodInvestmentNonconsolidatedInvesteeOrGroupOfInvesteesMemberus-gaap:CorporateJointVentureMember2021-01-012021-12-310001297996dlr:OtherInvestmentMemberus-gaap:EquityMethodInvestmentNonconsolidatedInvesteeOrGroupOfInvesteesMember2021-01-012021-12-310001297996dlr:MitsubishiCorporationJointVentureMemberus-gaap:EquityMethodInvestmentNonconsolidatedInvesteeOrGroupOfInvesteesMember2021-01-012021-12-310001297996dlr:MapletreeJointVentureMemberus-gaap:EquityMethodInvestmentNonconsolidatedInvesteeOrGroupOfInvesteesMember2021-01-012021-12-310001297996dlr:LumenMemberus-gaap:EquityMethodInvestmentNonconsolidatedInvesteeOrGroupOfInvesteesMember2021-01-012021-12-310001297996dlr:AscentyMemberus-gaap:EquityMethodInvestmentNonconsolidatedInvesteeOrGroupOfInvesteesMember2021-01-012021-12-310001297996us-gaap:EquityMethodInvestmentNonconsolidatedInvesteeOrGroupOfInvesteesMemberus-gaap:CorporateJointVentureMember2020-01-012020-12-310001297996dlr:OtherInvestmentMemberus-gaap:EquityMethodInvestmentNonconsolidatedInvesteeOrGroupOfInvesteesMember2020-01-012020-12-310001297996dlr:MitsubishiCorporationJointVentureMemberus-gaap:EquityMethodInvestmentNonconsolidatedInvesteeOrGroupOfInvesteesMember2020-01-012020-12-310001297996dlr:MapletreeJointVentureMemberus-gaap:EquityMethodInvestmentNonconsolidatedInvesteeOrGroupOfInvesteesMember2020-01-012020-12-310001297996dlr:LumenMemberus-gaap:EquityMethodInvestmentNonconsolidatedInvesteeOrGroupOfInvesteesMember2020-01-012020-12-310001297996dlr:AscentyMemberus-gaap:EquityMethodInvestmentNonconsolidatedInvesteeOrGroupOfInvesteesMember2020-01-012020-12-310001297996us-gaap:EquityMethodInvestmentNonconsolidatedInvesteeOrGroupOfInvesteesMemberus-gaap:CorporateJointVentureMember2019-01-012019-12-310001297996dlr:OtherInvestmentMemberus-gaap:EquityMethodInvestmentNonconsolidatedInvesteeOrGroupOfInvesteesMember2019-01-012019-12-310001297996dlr:MitsubishiCorporationJointVentureMemberus-gaap:EquityMethodInvestmentNonconsolidatedInvesteeOrGroupOfInvesteesMember2019-01-012019-12-310001297996dlr:MapletreeJointVentureMemberus-gaap:EquityMethodInvestmentNonconsolidatedInvesteeOrGroupOfInvesteesMember2019-01-012019-12-310001297996dlr:LumenMemberus-gaap:EquityMethodInvestmentNonconsolidatedInvesteeOrGroupOfInvesteesMember2019-01-012019-12-310001297996dlr:AscentyMemberus-gaap:EquityMethodInvestmentNonconsolidatedInvesteeOrGroupOfInvesteesMember2019-01-012019-12-310001297996dlr:FourPointSevenFiveZeroPercentNotesDueTwoThousandTwentyThreeMemberus-gaap:SubsequentEventMember2022-01-012022-03-310001297996dlr:PowerGridRightsMember2021-12-310001297996dlr:OtherIntangibleAssetsExcludingAmountsNotBeingAmortizedMember2021-12-310001297996us-gaap:OtherIntangibleAssetsMember2021-12-310001297996us-gaap:LeasesAcquiredInPlaceMember2021-12-310001297996us-gaap:CustomerRelationshipsMember2021-12-310001297996us-gaap:AboveMarketLeasesMember2021-12-310001297996us-gaap:OtherIntangibleAssetsMember2020-12-310001297996us-gaap:LeasesAcquiredInPlaceMember2020-12-310001297996us-gaap:CustomerRelationshipsMember2020-12-310001297996us-gaap:AboveMarketLeasesMember2020-12-310001297996dlr:DigitalRealtyTrustLPMemberdlr:TwoPointSevenFiveZeroPercentNotesDueTwentyTwentyThreeMemberdlr:UnsecuredSeniorNotesMember2021-01-012021-12-310001297996dlr:DigitalRealtyTrustLPMemberdlr:UnsecuredSeniorNotesMember2020-01-012020-12-310001297996dlr:DigitalRealtyTrustLPMemberdlr:UnsecuredSeniorNotesMember2019-01-012019-12-310001297996dlr:SreitMemberus-gaap:UnconsolidatedPropertiesMember2021-12-310001297996dlr:MitsubishiCorporationJointVentureMemberus-gaap:UnconsolidatedPropertiesMember2021-12-310001297996dlr:MapletreeJointVentureMemberus-gaap:UnconsolidatedPropertiesMember2021-12-310001297996dlr:LumenMemberus-gaap:UnconsolidatedPropertiesMember2021-12-310001297996dlr:AscentyMemberus-gaap:UnconsolidatedPropertiesMember2021-12-310001297996dlr:DigitalCoreReitMemberus-gaap:UnconsolidatedPropertiesMember2021-12-060001297996dlr:ServiceBasedRestrictedStockUnitsMember2021-12-310001297996dlr:MarketPerformanceBasedAwardsMember2021-12-310001297996dlr:InterxionAwardMember2021-12-310001297996dlr:ServiceBasedRestrictedStockUnitsMember2020-12-310001297996dlr:MarketPerformanceBasedAwardsMember2020-12-310001297996dlr:LongTermIncentiveUnitsMember2020-12-310001297996dlr:InterxionAwardMember2020-12-310001297996dlr:DigitalRealtyTrustLPMemberdlr:November172021InstallmentMemberdlr:SeriesLPreferredUnitsMember2021-01-012021-12-310001297996dlr:DigitalRealtyTrustLPMemberdlr:November172021InstallmentMemberdlr:SeriesKPreferredUnitsMember2021-01-012021-12-310001297996dlr:DigitalRealtyTrustLPMemberdlr:November172021InstallmentMemberdlr:SeriesJPreferredUnitsMember2021-01-012021-12-310001297996dlr:DigitalRealtyTrustLPMemberdlr:May102021InstallmentMemberdlr:SeriesLPreferredUnitsMember2021-01-012021-12-310001297996dlr:DigitalRealtyTrustLPMemberdlr:May102021InstallmentMemberdlr:SeriesKPreferredUnitsMember2021-01-012021-12-310001297996dlr:DigitalRealtyTrustLPMemberdlr:May102021InstallmentMemberdlr:SeriesJPreferredUnitsMember2021-01-012021-12-310001297996dlr:DigitalRealtyTrustLPMemberdlr:February252021InstallmentMemberdlr:SeriesLPreferredUnitsMember2021-01-012021-12-310001297996dlr:DigitalRealtyTrustLPMemberdlr:February252021InstallmentMemberdlr:SeriesKPreferredUnitsMember2021-01-012021-12-310001297996dlr:DigitalRealtyTrustLPMemberdlr:February252021InstallmentMemberdlr:SeriesJPreferredUnitsMember2021-01-012021-12-310001297996dlr:DigitalRealtyTrustLPMemberdlr:February252021InstallmentMemberdlr:SeriesCPreferredUnitsMember2021-01-012021-12-310001297996dlr:DigitalRealtyTrustLPMemberdlr:August102021InstallmentMemberdlr:SeriesLPreferredUnitsMember2021-01-012021-12-310001297996dlr:DigitalRealtyTrustLPMemberdlr:August102021InstallmentMemberdlr:SeriesKPreferredUnitsMember2021-01-012021-12-310001297996dlr:DigitalRealtyTrustLPMemberdlr:August102021InstallmentMemberdlr:SeriesJPreferredUnitsMember2021-01-012021-12-310001297996dlr:November172021InstallmentMemberdlr:SeriesLPreferredUnitsMember2021-01-012021-12-310001297996dlr:November172021InstallmentMemberdlr:SeriesKPreferredUnitsMember2021-01-012021-12-310001297996dlr:November172021InstallmentMemberdlr:SeriesJPreferredUnitsMember2021-01-012021-12-310001297996dlr:November172021InstallmentMemberdlr:SeriesCPreferredUnitsMember2021-01-012021-12-310001297996dlr:May102021InstallmentMemberdlr:SeriesLPreferredUnitsMember2021-01-012021-12-310001297996dlr:May102021InstallmentMemberdlr:SeriesKPreferredUnitsMember2021-01-012021-12-310001297996dlr:May102021InstallmentMemberdlr:SeriesJPreferredUnitsMember2021-01-012021-12-310001297996dlr:May102021InstallmentMemberdlr:SeriesCPreferredUnitsMember2021-01-012021-12-310001297996dlr:February252021InstallmentMemberdlr:SeriesLPreferredUnitsMember2021-01-012021-12-310001297996dlr:February252021InstallmentMemberdlr:SeriesKPreferredUnitsMember2021-01-012021-12-310001297996dlr:February252021InstallmentMemberdlr:SeriesJPreferredUnitsMember2021-01-012021-12-310001297996dlr:February252021InstallmentMemberdlr:SeriesCPreferredUnitsMember2021-01-012021-12-310001297996dlr:DigitalRealtyTrustLPMemberdlr:SeriesLPreferredUnitsMember2021-01-012021-12-310001297996dlr:DigitalRealtyTrustLPMemberdlr:SeriesKPreferredUnitsMember2021-01-012021-12-310001297996dlr:DigitalRealtyTrustLPMemberdlr:SeriesJPreferredUnitsMember2021-01-012021-12-310001297996dlr:DigitalRealtyTrustLPMemberdlr:SeriesCPreferredUnitsMember2021-01-012021-12-310001297996dlr:August102021InstallmentMemberdlr:SeriesLPreferredUnitsMember2021-01-012021-12-310001297996dlr:August102021InstallmentMemberdlr:SeriesKPreferredUnitsMember2021-01-012021-12-310001297996dlr:August102021InstallmentMemberdlr:SeriesJPreferredUnitsMember2021-01-012021-12-310001297996dlr:August102021InstallmentMemberdlr:SeriesCPreferredUnitsMember2021-01-012021-12-310001297996dlr:SeriesKPreferredUnitsMember2021-01-012021-12-310001297996dlr:SeriesJPreferredUnitsMember2021-01-012021-12-310001297996dlr:SeriesCPreferredUnitsMember2021-01-012021-12-310001297996dlr:DigitalRealtyTrustLPMemberdlr:November102020InstallmentMemberdlr:SeriesLPreferredUnitsMember2020-01-012020-12-310001297996dlr:DigitalRealtyTrustLPMemberdlr:November102020InstallmentMemberdlr:SeriesKPreferredUnitsMember2020-01-012020-12-310001297996dlr:DigitalRealtyTrustLPMemberdlr:November102020InstallmentMemberdlr:SeriesJPreferredUnitsMember2020-01-012020-12-310001297996dlr:DigitalRealtyTrustLPMemberdlr:November102020InstallmentMemberdlr:SeriesCPreferredUnitsMember2020-01-012020-12-310001297996dlr:DigitalRealtyTrustLPMemberdlr:May2020InstallmentMemberdlr:SeriesLPreferredUnitsMember2020-01-012020-12-310001297996dlr:DigitalRealtyTrustLPMemberdlr:May2020InstallmentMemberdlr:SeriesKPreferredUnitsMember2020-01-012020-12-310001297996dlr:DigitalRealtyTrustLPMemberdlr:May2020InstallmentMemberdlr:SeriesJPreferredUnitsMember2020-01-012020-12-310001297996dlr:DigitalRealtyTrustLPMemberdlr:May2020InstallmentMemberdlr:SeriesIPreferredUnitsMember2020-01-012020-12-310001297996dlr:DigitalRealtyTrustLPMemberdlr:May2020InstallmentMemberdlr:SeriesGPreferredUnitsMember2020-01-012020-12-310001297996dlr:DigitalRealtyTrustLPMemberdlr:May2020InstallmentMemberdlr:SeriesCPreferredUnitsMember2020-01-012020-12-310001297996dlr:DigitalRealtyTrustLPMemberdlr:February2020InstallmentMemberdlr:SeriesLPreferredUnitsMember2020-01-012020-12-310001297996dlr:DigitalRealtyTrustLPMemberdlr:February2020InstallmentMemberdlr:SeriesKPreferredUnitsMember2020-01-012020-12-310001297996dlr:DigitalRealtyTrustLPMemberdlr:February2020InstallmentMemberdlr:SeriesJPreferredUnitsMember2020-01-012020-12-310001297996dlr:DigitalRealtyTrustLPMemberdlr:February2020InstallmentMemberdlr:SeriesIPreferredUnitsMember2020-01-012020-12-310001297996dlr:DigitalRealtyTrustLPMemberdlr:February2020InstallmentMemberdlr:SeriesGPreferredUnitsMember2020-01-012020-12-310001297996dlr:DigitalRealtyTrustLPMemberdlr:February2020InstallmentMemberdlr:SeriesCPreferredUnitsMember2020-01-012020-12-310001297996dlr:DigitalRealtyTrustLPMemberdlr:August2020InstallmentMemberdlr:SeriesLPreferredUnitsMember2020-01-012020-12-310001297996dlr:DigitalRealtyTrustLPMemberdlr:August2020InstallmentMemberdlr:SeriesKPreferredUnitsMember2020-01-012020-12-310001297996dlr:DigitalRealtyTrustLPMemberdlr:August2020InstallmentMemberdlr:SeriesJPreferredUnitsMember2020-01-012020-12-310001297996dlr:DigitalRealtyTrustLPMemberdlr:August2020InstallmentMemberdlr:SeriesGPreferredUnitsMember2020-01-012020-12-310001297996dlr:DigitalRealtyTrustLPMemberdlr:August2020InstallmentMemberdlr:SeriesCPreferredUnitsMember2020-01-012020-12-310001297996dlr:November102020InstallmentMemberdlr:SeriesLPreferredUnitsMember2020-01-012020-12-310001297996dlr:November102020InstallmentMemberdlr:SeriesKPreferredUnitsMember2020-01-012020-12-310001297996dlr:November102020InstallmentMemberdlr:SeriesJPreferredUnitsMember2020-01-012020-12-310001297996dlr:November102020InstallmentMemberdlr:SeriesCPreferredUnitsMember2020-01-012020-12-310001297996dlr:May2020InstallmentMemberdlr:SeriesLPreferredUnitsMember2020-01-012020-12-310001297996dlr:May2020InstallmentMemberdlr:SeriesKPreferredUnitsMember2020-01-012020-12-310001297996dlr:May2020InstallmentMemberdlr:SeriesJPreferredUnitsMember2020-01-012020-12-310001297996dlr:May2020InstallmentMemberdlr:SeriesIPreferredUnitsMember2020-01-012020-12-310001297996dlr:May2020InstallmentMemberdlr:SeriesGPreferredUnitsMember2020-01-012020-12-310001297996dlr:May2020InstallmentMemberdlr:SeriesCPreferredUnitsMember2020-01-012020-12-310001297996dlr:February2020InstallmentMemberdlr:SeriesLPreferredUnitsMember2020-01-012020-12-310001297996dlr:February2020InstallmentMemberdlr:SeriesKPreferredUnitsMember2020-01-012020-12-310001297996dlr:February2020InstallmentMemberdlr:SeriesJPreferredUnitsMember2020-01-012020-12-310001297996dlr:February2020InstallmentMemberdlr:SeriesIPreferredUnitsMember2020-01-012020-12-310001297996dlr:February2020InstallmentMemberdlr:SeriesGPreferredUnitsMember2020-01-012020-12-310001297996dlr:February2020InstallmentMemberdlr:SeriesCPreferredUnitsMember2020-01-012020-12-310001297996dlr:DigitalRealtyTrustLPMemberdlr:SeriesLPreferredUnitsMember2020-01-012020-12-310001297996dlr:DigitalRealtyTrustLPMemberdlr:SeriesKPreferredUnitsMember2020-01-012020-12-310001297996dlr:DigitalRealtyTrustLPMemberdlr:SeriesJPreferredUnitsMember2020-01-012020-12-310001297996dlr:DigitalRealtyTrustLPMemberdlr:SeriesIPreferredUnitsMember2020-01-012020-12-310001297996dlr:DigitalRealtyTrustLPMemberdlr:SeriesGPreferredUnitsMember2020-01-012020-12-310001297996dlr:DigitalRealtyTrustLPMemberdlr:SeriesCPreferredUnitsMember2020-01-012020-12-310001297996dlr:August2020InstallmentMemberdlr:SeriesLPreferredUnitsMember2020-01-012020-12-310001297996dlr:August2020InstallmentMemberdlr:SeriesKPreferredUnitsMember2020-01-012020-12-310001297996dlr:August2020InstallmentMemberdlr:SeriesJPreferredUnitsMember2020-01-012020-12-310001297996dlr:August2020InstallmentMemberdlr:SeriesGPreferredUnitsMember2020-01-012020-12-310001297996dlr:August2020InstallmentMemberdlr:SeriesCPreferredUnitsMember2020-01-012020-12-310001297996dlr:SeriesLPreferredUnitsMember2020-01-012020-12-310001297996dlr:SeriesKPreferredUnitsMember2020-01-012020-12-310001297996dlr:SeriesJPreferredUnitsMember2020-01-012020-12-310001297996dlr:SeriesIPreferredUnitsMember2020-01-012020-12-310001297996dlr:SeriesGPreferredUnitsMember2020-01-012020-12-310001297996dlr:SeriesCPreferredUnitsMember2020-01-012020-12-310001297996dlr:DigitalRealtyTrustLPMemberdlr:November192019InstallmentMemberdlr:SeriesLPreferredUnitsMember2019-01-012019-12-310001297996dlr:DigitalRealtyTrustLPMemberdlr:November192019InstallmentMemberdlr:SeriesKPreferredUnitsMember2019-01-012019-12-310001297996dlr:DigitalRealtyTrustLPMemberdlr:November192019InstallmentMemberdlr:SeriesJPreferredUnitsMember2019-01-012019-12-310001297996dlr:DigitalRealtyTrustLPMemberdlr:November192019InstallmentMemberdlr:SeriesIPreferredUnitsMember2019-01-012019-12-310001297996dlr:DigitalRealtyTrustLPMemberdlr:November192019InstallmentMemberdlr:SeriesGPreferredUnitsMember2019-01-012019-12-310001297996dlr:DigitalRealtyTrustLPMemberdlr:November192019InstallmentMemberdlr:SeriesCPreferredUnitsMember2019-01-012019-12-310001297996dlr:DigitalRealtyTrustLPMemberdlr:May132019InstallmentMemberdlr:SeriesKPreferredUnitsMember2019-01-012019-12-310001297996dlr:DigitalRealtyTrustLPMemberdlr:May132019InstallmentMemberdlr:SeriesJPreferredUnitsMember2019-01-012019-12-310001297996dlr:DigitalRealtyTrustLPMemberdlr:May132019InstallmentMemberdlr:SeriesIPreferredUnitsMember2019-01-012019-12-310001297996dlr:DigitalRealtyTrustLPMemberdlr:May132019InstallmentMemberdlr:SeriesGPreferredUnitsMember2019-01-012019-12-310001297996dlr:DigitalRealtyTrustLPMemberdlr:May132019InstallmentMemberdlr:SeriesCPreferredUnitsMember2019-01-012019-12-310001297996dlr:DigitalRealtyTrustLPMemberdlr:February212019InstallmentMemberdlr:SeriesJPreferredUnitsMember2019-01-012019-12-310001297996dlr:DigitalRealtyTrustLPMemberdlr:February212019InstallmentMemberdlr:SeriesIPreferredUnitsMember2019-01-012019-12-310001297996dlr:DigitalRealtyTrustLPMemberdlr:February212019InstallmentMemberdlr:SeriesHPreferredUnitsMember2019-01-012019-12-310001297996dlr:DigitalRealtyTrustLPMemberdlr:February212019InstallmentMemberdlr:SeriesGPreferredUnitsMember2019-01-012019-12-310001297996dlr:DigitalRealtyTrustLPMemberdlr:February212019InstallmentMemberdlr:SeriesCPreferredUnitsMember2019-01-012019-12-310001297996dlr:DigitalRealtyTrustLPMemberdlr:August132019InstallmentMemberdlr:SeriesKPreferredUnitsMember2019-01-012019-12-310001297996dlr:DigitalRealtyTrustLPMemberdlr:August132019InstallmentMemberdlr:SeriesJPreferredUnitsMember2019-01-012019-12-310001297996dlr:DigitalRealtyTrustLPMemberdlr:August132019InstallmentMemberdlr:SeriesIPreferredUnitsMember2019-01-012019-12-310001297996dlr:DigitalRealtyTrustLPMemberdlr:August132019InstallmentMemberdlr:SeriesGPreferredUnitsMember2019-01-012019-12-310001297996dlr:DigitalRealtyTrustLPMemberdlr:August132019InstallmentMemberdlr:SeriesCPreferredUnitsMember2019-01-012019-12-310001297996dlr:November192019InstallmentMemberdlr:SeriesLPreferredUnitsMember2019-01-012019-12-310001297996dlr:November192019InstallmentMemberdlr:SeriesKPreferredUnitsMember2019-01-012019-12-310001297996dlr:November192019InstallmentMemberdlr:SeriesJPreferredUnitsMember2019-01-012019-12-310001297996dlr:November192019InstallmentMemberdlr:SeriesIPreferredUnitsMember2019-01-012019-12-310001297996dlr:November192019InstallmentMemberdlr:SeriesGPreferredUnitsMember2019-01-012019-12-310001297996dlr:November192019InstallmentMemberdlr:SeriesCPreferredUnitsMember2019-01-012019-12-310001297996dlr:May132019InstallmentMemberdlr:SeriesKPreferredUnitsMember2019-01-012019-12-310001297996dlr:May132019InstallmentMemberdlr:SeriesJPreferredUnitsMember2019-01-012019-12-310001297996dlr:May132019InstallmentMemberdlr:SeriesIPreferredUnitsMember2019-01-012019-12-310001297996dlr:May132019InstallmentMemberdlr:SeriesGPreferredUnitsMember2019-01-012019-12-310001297996dlr:May132019InstallmentMemberdlr:SeriesCPreferredUnitsMember2019-01-012019-12-310001297996dlr:February212019InstallmentMemberdlr:SeriesJPreferredUnitsMember2019-01-012019-12-310001297996dlr:February212019InstallmentMemberdlr:SeriesIPreferredUnitsMember2019-01-012019-12-310001297996dlr:February212019InstallmentMemberdlr:SeriesHPreferredUnitsMember2019-01-012019-12-310001297996dlr:February212019InstallmentMemberdlr:SeriesGPreferredUnitsMember2019-01-012019-12-310001297996dlr:February212019InstallmentMemberdlr:SeriesCPreferredUnitsMember2019-01-012019-12-310001297996dlr:DigitalRealtyTrustLPMemberdlr:SeriesLPreferredUnitsMember2019-01-012019-12-310001297996dlr:DigitalRealtyTrustLPMemberdlr:SeriesKPreferredUnitsMember2019-01-012019-12-310001297996dlr:DigitalRealtyTrustLPMemberdlr:SeriesJPreferredUnitsMember2019-01-012019-12-310001297996dlr:DigitalRealtyTrustLPMemberdlr:SeriesIPreferredUnitsMember2019-01-012019-12-310001297996dlr:DigitalRealtyTrustLPMemberdlr:SeriesHPreferredUnitsMember2019-01-012019-12-310001297996dlr:DigitalRealtyTrustLPMemberdlr:SeriesGPreferredUnitsMember2019-01-012019-12-310001297996dlr:DigitalRealtyTrustLPMemberdlr:SeriesCPreferredUnitsMember2019-01-012019-12-310001297996dlr:August132019InstallmentMemberdlr:SeriesKPreferredUnitsMember2019-01-012019-12-310001297996dlr:August132019InstallmentMemberdlr:SeriesJPreferredUnitsMember2019-01-012019-12-310001297996dlr:August132019InstallmentMemberdlr:SeriesIPreferredUnitsMember2019-01-012019-12-310001297996dlr:August132019InstallmentMemberdlr:SeriesGPreferredUnitsMember2019-01-012019-12-310001297996dlr:August132019InstallmentMemberdlr:SeriesCPreferredUnitsMember2019-01-012019-12-310001297996dlr:SeriesLPreferredUnitsMember2019-01-012019-12-310001297996dlr:SeriesKPreferredUnitsMember2019-01-012019-12-310001297996dlr:SeriesJPreferredUnitsMember2019-01-012019-12-310001297996dlr:SeriesIPreferredUnitsMember2019-01-012019-12-310001297996dlr:SeriesHPreferredUnitsMember2019-01-012019-12-310001297996dlr:SeriesGPreferredUnitsMember2019-01-012019-12-310001297996dlr:SeriesCPreferredUnitsMember2019-01-012019-12-310001297996dlr:DigitalRealtyTrustLPMemberdlr:November172021InstallmentMemberdlr:CommonUnitsMember2021-01-012021-12-310001297996dlr:DigitalRealtyTrustLPMemberdlr:May102021InstallmentMemberdlr:CommonUnitsMember2021-01-012021-12-310001297996dlr:DigitalRealtyTrustLPMemberdlr:February252021InstallmentMemberdlr:CommonUnitsMember2021-01-012021-12-310001297996dlr:DigitalRealtyTrustLPMemberdlr:August102021InstallmentMemberdlr:CommonUnitsMember2021-01-012021-12-310001297996dlr:November172021InstallmentMemberdlr:CommonUnitsMember2021-01-012021-12-310001297996dlr:May102021InstallmentMemberdlr:CommonUnitsMember2021-01-012021-12-310001297996dlr:February252021InstallmentMemberdlr:CommonUnitsMember2021-01-012021-12-310001297996dlr:August102021InstallmentMemberdlr:CommonUnitsMember2021-01-012021-12-310001297996dlr:DigitalRealtyTrustLPMemberdlr:November102020InstallmentMemberdlr:CommonUnitsMember2020-01-012020-12-310001297996dlr:DigitalRealtyTrustLPMemberdlr:May2020InstallmentMemberdlr:CommonUnitsMember2020-01-012020-12-310001297996dlr:DigitalRealtyTrustLPMemberdlr:February2020InstallmentMemberdlr:CommonUnitsMember2020-01-012020-12-310001297996dlr:DigitalRealtyTrustLPMemberdlr:August2020InstallmentMemberdlr:CommonUnitsMember2020-01-012020-12-310001297996dlr:November102020InstallmentMemberdlr:CommonUnitsMember2020-01-012020-12-310001297996dlr:May2020InstallmentMemberdlr:CommonUnitsMember2020-01-012020-12-310001297996dlr:February2020InstallmentMemberdlr:CommonUnitsMember2020-01-012020-12-310001297996dlr:August2020InstallmentMemberdlr:CommonUnitsMember2020-01-012020-12-310001297996dlr:CommonUnitsMember2020-01-012020-12-310001297996dlr:DigitalRealtyTrustLPMemberdlr:November192019InstallmentMemberdlr:CommonUnitsMember2019-01-012019-12-310001297996dlr:DigitalRealtyTrustLPMemberdlr:May132019InstallmentMemberdlr:CommonUnitsMember2019-01-012019-12-310001297996dlr:DigitalRealtyTrustLPMemberdlr:February212019InstallmentMemberdlr:CommonUnitsMember2019-01-012019-12-310001297996dlr:DigitalRealtyTrustLPMemberdlr:August132019InstallmentMemberdlr:CommonUnitsMember2019-01-012019-12-310001297996dlr:November192019InstallmentMemberdlr:CommonUnitsMember2019-01-012019-12-310001297996dlr:May132019InstallmentMemberdlr:CommonUnitsMember2019-01-012019-12-310001297996dlr:February212019InstallmentMemberdlr:CommonUnitsMember2019-01-012019-12-310001297996dlr:August132019InstallmentMemberdlr:CommonUnitsMember2019-01-012019-12-310001297996us-gaap:RetainedEarningsMember2021-01-012021-12-310001297996dlr:RedeemableNoncontrollingInterestsOperatingPartnershipMember2021-01-012021-12-310001297996us-gaap:RetainedEarningsMember2020-01-012020-12-310001297996dlr:RedeemableNoncontrollingInterestsOperatingPartnershipMember2020-01-012020-12-310001297996us-gaap:RetainedEarningsMember2019-01-012019-12-310001297996dlr:RedeemableNoncontrollingInterestsOperatingPartnershipMember2019-01-012019-12-310001297996us-gaap:DisposalGroupDisposedOfBySaleNotDiscontinuedOperationsMemberdlr:DisposalOfPortfolioCentersInNorthAmericaMemberdlr:IncomeLossFromEquityMethodInvestmentMember2021-07-012021-09-300001297996us-gaap:DisposalGroupHeldforsaleNotDiscontinuedOperationsMemberdlr:DisposalOfPortfolioCentersInEuropeMember2021-03-162021-03-160001297996us-gaap:DisposalGroupHeldforsaleNotDiscontinuedOperationsMemberdlr:OtherPortfolioMember2021-01-012021-12-310001297996dlr:SreitMember2021-01-012021-12-310001297996dlr:DataCentersMemberus-gaap:DisposalGroupHeldforsaleNotDiscontinuedOperationsMemberdlr:DisposalOfPortfolioCentersInEuropeMember2021-01-012021-03-310001297996us-gaap:DisposalGroupHeldforsaleNotDiscontinuedOperationsMemberdlr:Liverpoolweg10Member2020-07-172020-07-170001297996us-gaap:DisposalGroupHeldforsaleNotDiscontinuedOperationsMemberdlr:MapletreePortfolioMember2020-01-142020-01-140001297996dlr:DataCentersMemberus-gaap:DisposalGroupHeldforsaleNotDiscontinuedOperationsMemberdlr:MapletreePortfolioMember2020-01-012020-01-310001297996dlr:DataCentersMemberus-gaap:DisposalGroupHeldforsaleNotDiscontinuedOperationsMemberdlr:MapletreePortfolioMember2019-11-012019-11-300001297996us-gaap:DisposalGroupHeldforsaleNotDiscontinuedOperationsMemberdlr:MapletreePortfolioMember2019-11-012019-11-010001297996us-gaap:DisposalGroupHeldforsaleNotDiscontinuedOperationsMemberdlr:OtherPortfolioMember2021-12-310001297996us-gaap:DisposalGroupDisposedOfBySaleNotDiscontinuedOperationsMemberdlr:DisposalOfPortfolioCentersInNorthAmericaMember2021-09-300001297996dlr:DataCentersMemberus-gaap:DisposalGroupHeldforsaleNotDiscontinuedOperationsMemberdlr:DisposalOfPortfolioCentersInEuropeMember2021-03-310001297996us-gaap:DisposalGroupHeldforsaleNotDiscontinuedOperationsMemberdlr:DisposalOfPortfolioCentersInEuropeMember2021-03-160001297996us-gaap:DisposalGroupHeldforsaleNotDiscontinuedOperationsMemberdlr:Naritaweg52Member2020-12-300001297996us-gaap:DisposalGroupHeldforsaleNotDiscontinuedOperationsMemberdlr:Liverpoolweg10Member2020-07-170001297996dlr:DataCentersMemberus-gaap:DisposalGroupHeldforsaleNotDiscontinuedOperationsMemberdlr:MapletreePortfolioMember2020-01-310001297996us-gaap:DisposalGroupHeldforsaleNotDiscontinuedOperationsMemberdlr:MapletreePortfolioMember2020-01-140001297996us-gaap:DisposalGroupHeldforsaleNotDiscontinuedOperationsMemberdlr:MapletreePortfolioMember2019-11-010001297996us-gaap:InterestRateSwapMember2021-12-130001297996dlr:InterestRateSwapStrikeRate1.435Member2020-12-310001297996dlr:InterestRateSwapStrikeRate0.779Member2020-12-310001297996us-gaap:InterestRateSwapMember2020-09-240001297996us-gaap:InterestRateSwapMember2020-09-242020-09-240001297996currency:CADdlr:UnsecuredTermLoanMember2021-12-310001297996currency:CADdlr:UnsecuredTermLoanMember2020-12-310001297996dlr:InterestRateSwapStrikeRate1.435Member2021-12-310001297996dlr:InterestRateSwapStrikeRate0.779Member2021-12-310001297996us-gaap:FairValueInputsLevel2Member2021-12-310001297996dlr:InterestRateSwapStrikeRate1.435Memberus-gaap:FairValueInputsLevel2Member2020-12-310001297996dlr:InterestRateSwapStrikeRate0.779Memberus-gaap:FairValueInputsLevel2Member2020-12-310001297996us-gaap:FairValueInputsLevel2Member2020-12-310001297996dlr:InterxionAwardMember2021-01-012021-12-310001297996dlr:InterxionAwardMember2020-01-012020-12-310001297996dlr:DigitalRealtyTrustLPMemberdlr:FourPointSevenFiveZeroNotesDueTwentyTwentyFiveMemberdlr:UnsecuredSeniorNotesMemberus-gaap:SubsequentEventMember2022-02-030001297996dlr:DigitalRealtyTrustLPMembersrt:MinimumMemberdlr:SecuredAndOtherDebtMember2021-12-310001297996dlr:DigitalRealtyTrustLPMembersrt:MaximumMemberdlr:SecuredAndOtherDebtMember2021-12-310001297996dlr:DigitalRealtyTrustLPMemberdlr:TwoPointSevenFiveZeroPercentNotesDueTwentyTwentyThreeMemberdlr:UnsecuredSeniorNotesMember2021-02-280001297996dlr:DigitalRealtyTrustLPMemberdlr:FourPointSevenFiveZeroPercentNotesDueTwoThousandTwentyThreeMemberdlr:UnsecuredSeniorNotesMember2020-10-310001297996dlr:DigitalRealtyTrustLPMemberdlr:ThreePointSixTwoFivePercentNotesDueTwentyTwentyTwoMemberdlr:UnsecuredSeniorNotesMember2020-08-310001297996dlr:DigitalRealtyTrustLPMemberdlr:A3.950NotesDue2022Memberdlr:UnsecuredSeniorNotesMember2020-08-310001297996dlr:DigitalRealtyTrustLPMemberdlr:ThreePointFourZeroZeroTwentyTwentyAndTwentyTwentyOneNotesMemberdlr:UnsecuredSeniorNotesMember2019-06-300001297996dlr:DigitalRealtyTrustLPMemberdlr:FivePointTwoFiveZeroPercentNotesDueTwentyTwentyOneMemberdlr:UnsecuredSeniorNotesMember2019-06-300001297996dlr:DigitalRealtyTrustLPMemberdlr:FivePointEightSevenFivePercentNotesDueTwentyTwentyMemberdlr:UnsecuredSeniorNotesMember2019-02-280001297996dlr:DigitalRealtyTrustLPMemberdlr:FivePointEightSevenFivePercentNotesDueTwentyTwentyMemberdlr:UnsecuredSeniorNotesMember2019-01-310001297996dlr:OnePointThreeSevenFivePercentNotesDueTwentyThirtyTwoMemberdlr:UnsecuredSeniorNotesMemberus-gaap:SubsequentEventMember2022-01-180001297996dlr:DigitalRealtyTrustLPMemberdlr:TwoPointSevenFiveZeroPercentNotesDueTwentyTwentyThreeMemberdlr:UnsecuredSeniorNotesMember2021-12-310001297996dlr:DigitalIntrepidHoldingB.vMemberdlr:ZeroPointTwoZeroPercentNotesDueTwentyTwentySixMemberdlr:UnsecuredSeniorNotesMember2021-07-150001297996dlr:DigitalIntrepidHoldingB.vMemberdlr:ZeroPointFiveFivePercentNotesDueTwentyTwentyNineMemberdlr:UnsecuredSeniorNotesMember2021-07-150001297996dlr:DigitalIntrepidHoldingB.vMemberdlr:ZeroPointSixTwoFivePercentNotesDueToTwoThousandThirtyOneMemberdlr:UnsecuredSeniorNotesMember2021-01-120001297996dlr:DigitalRealtyTrustLPMembercurrency:USDdlr:UnsecuredSeniorNotesMemberdlr:FloatingRateMember2021-12-310001297996dlr:DigitalRealtyTrustLPMembercurrency:EURdlr:GlobalRevolvingCreditFacilityMemberdlr:FloatingRateMember2021-12-310001297996dlr:DigitalRealtyTrustLPMemberdlr:ZeroPointTwoZeroZeroPercentDueTwoThousandTwentySixMemberdlr:UnsecuredSeniorNotesMember2021-12-310001297996dlr:DigitalRealtyTrustLPMemberdlr:ZeroPointSixTwoFivePercentNotesDueTwentyTwentyFiveMemberdlr:UnsecuredSeniorNotesMember2021-12-310001297996dlr:DigitalRealtyTrustLPMemberdlr:ZeroPointSixTwoFivePercentNotesDueToTwoThousandThirtyOneMemberdlr:UnsecuredSeniorNotesMember2021-12-310001297996dlr:DigitalRealtyTrustLPMemberdlr:ZeroPointOneTwoFivePercentNotesDueTwentyTwentyTwoMemberdlr:UnsecuredSeniorNotesMember2021-12-310001297996dlr:DigitalRealtyTrustLPMemberdlr:ZeroPointFiveFiveZeroPercentDueTwoThousandTwentyNineMemberdlr:UnsecuredSeniorNotesMember2021-12-310001297996dlr:DigitalRealtyTrustLPMemberdlr:TwoPointSixTwoFivePercentNotesDueTwentyTwentyFourMemberdlr:UnsecuredSeniorNotesMember2021-12-310001297996dlr:DigitalRealtyTrustLPMemberdlr:TwoPointSevenFiveZeroPercentNotesDueTwentyTwentyFourMemberdlr:UnsecuredSeniorNotesMember2021-12-310001297996dlr:DigitalRealtyTrustLPMemberdlr:TwoPointFiveZeroZeroPercentNotesDueTwentyTwentySixMemberdlr:UnsecuredSeniorNotesMember2021-12-310001297996dlr:DigitalRealtyTrustLPMemberdlr:ThreePointThreeZeroZeroPercentNotesDueTwentyTwentyNineMemberdlr:UnsecuredSeniorNotesMember2021-12-310001297996dlr:DigitalRealtyTrustLPMemberdlr:ThreePointSixZeroZeroPercentNotesDueTwentyTwentyNineMemberdlr:UnsecuredSeniorNotesMember2021-12-310001297996dlr:DigitalRealtyTrustLPMemberdlr:ThreePointSevenZeroZeroPercentNotesDueTwentyTwentySevenMemberdlr:UnsecuredSeniorNotesMember2021-12-310001297996dlr:DigitalRealtyTrustLPMemberdlr:ThreePointSevenFiveZeroPercentNotesDueTwentyThirtyMemberdlr:UnsecuredSeniorNotesMember2021-12-310001297996dlr:DigitalRealtyTrustLPMemberdlr:OnePointZeroZeroZeroPercentNotesDueTwoThousandThirtyTwoMemberdlr:UnsecuredSeniorNotesMember2021-12-310001297996dlr:DigitalRealtyTrustLPMemberdlr:OnePointTwoFiveZeroPercentNotesDueTwoThousandThirtyOneMemberdlr:UnsecuredSeniorNotesMember2021-12-310001297996dlr:DigitalRealtyTrustLPMemberdlr:OnePointTwoFivePercentNotesDueTwentyTwentyEightMemberdlr:UnsecuredSeniorNotesMember2021-12-310001297996dlr:DigitalRealtyTrustLPMemberdlr:OnePointFiveZeroZeroPercentNotesDueTwoThousandThirtyMemberdlr:UnsecuredSeniorNotesMember2021-12-310001297996dlr:DigitalRealtyTrustLPMemberdlr:FourPointTwoFiveZeroPercentNotesDueTwoThousandTwentyFiveMemberdlr:UnsecuredSeniorNotesMember2021-12-310001297996dlr:DigitalRealtyTrustLPMemberdlr:FourPointSevenFiveZeroPercentNotesDueTwoThousandTwentyFiveMemberdlr:UnsecuredSeniorNotesMember2021-12-310001297996dlr:DigitalRealtyTrustLPMemberdlr:FourPointFourFiveZeroPercentNotesDueTwentyTwentyEightMemberdlr:UnsecuredSeniorNotesMember2021-12-310001297996dlr:DigitalRealtyTrustLPMemberdlr:FloatingRateNotesDueTwentyTwentyTwoMemberdlr:UnsecuredSeniorNotesMember2021-12-310001297996dlr:DigitalRealtyTrustLPMemberdlr:UnsecuredSeniorNotesMember2021-12-310001297996dlr:DigitalRealtyTrustLPMemberdlr:UnsecuredDebtInGreeceMember2021-12-310001297996dlr:DigitalRealtyTrustLPMemberdlr:SecuredAndOtherDebtMember2021-12-310001297996dlr:DigitalRealtyTrustLPMemberdlr:OtherCurrencyMember2021-12-310001297996dlr:DigitalRealtyTrustLPMemberdlr:MortgageLoanForWestinBuildingMember2021-12-310001297996dlr:DigitalRealtyTrustLPMembercurrency:USD2021-12-310001297996dlr:DigitalRealtyTrustLPMembercurrency:GBP2021-12-310001297996dlr:DigitalRealtyTrustLPMembercurrency:EUR2021-12-310001297996dlr:DigitalRealtyTrustLPMembercurrency:USDdlr:UnsecuredSeniorNotesMemberdlr:FloatingRateMember2020-12-310001297996dlr:DigitalRealtyTrustLPMembercurrency:EURdlr:GlobalRevolvingCreditFacilityMemberdlr:FloatingRateMember2020-12-310001297996dlr:DigitalRealtyTrustLPMemberdlr:ZeroPointSixTwoFivePercentNotesDueTwentyTwentyFiveMemberdlr:UnsecuredSeniorNotesMember2020-12-310001297996dlr:DigitalRealtyTrustLPMemberdlr:ZeroPointOneTwoFivePercentNotesDueTwentyTwentyTwoMemberdlr:UnsecuredSeniorNotesMember2020-12-310001297996dlr:DigitalRealtyTrustLPMemberdlr:TwoPointSixTwoFivePercentNotesDueTwentyTwentyFourMemberdlr:UnsecuredSeniorNotesMember2020-12-310001297996dlr:DigitalRealtyTrustLPMemberdlr:TwoPointSevenFiveZeroPercentNotesDueTwentyTwentyThreeMemberdlr:UnsecuredSeniorNotesMember2020-12-310001297996dlr:DigitalRealtyTrustLPMemberdlr:TwoPointSevenFiveZeroPercentNotesDueTwentyTwentyFourMemberdlr:UnsecuredSeniorNotesMember2020-12-310001297996dlr:DigitalRealtyTrustLPMemberdlr:TwoPointFiveZeroZeroPercentNotesDueTwentyTwentySixMemberdlr:UnsecuredSeniorNotesMember2020-12-310001297996dlr:DigitalRealtyTrustLPMemberdlr:ThreePointThreeZeroZeroPercentNotesDueTwentyTwentyNineMemberdlr:UnsecuredSeniorNotesMember2020-12-310001297996dlr:DigitalRealtyTrustLPMemberdlr:ThreePointSixZeroZeroPercentNotesDueTwentyTwentyNineMemberdlr:UnsecuredSeniorNotesMember2020-12-310001297996dlr:DigitalRealtyTrustLPMemberdlr:ThreePointSevenZeroZeroPercentNotesDueTwentyTwentySevenMemberdlr:UnsecuredSeniorNotesMember2020-12-310001297996dlr:DigitalRealtyTrustLPMemberdlr:ThreePointSevenFiveZeroPercentNotesDueTwentyThirtyMemberdlr:UnsecuredSeniorNotesMember2020-12-310001297996dlr:DigitalRealtyTrustLPMemberdlr:OnePointZeroZeroZeroPercentNotesDueTwoThousandThirtyTwoMemberdlr:UnsecuredSeniorNotesMember2020-12-310001297996dlr:DigitalRealtyTrustLPMemberdlr:OnePointTwoFiveZeroPercentNotesDueTwoThousandThirtyOneMemberdlr:UnsecuredSeniorNotesMember2020-12-310001297996dlr:DigitalRealtyTrustLPMemberdlr:OnePointTwoFivePercentNotesDueTwentyTwentyEightMemberdlr:UnsecuredSeniorNotesMember2020-12-310001297996dlr:DigitalRealtyTrustLPMemberdlr:OnePointFiveZeroZeroPercentNotesDueTwoThousandThirtyMemberdlr:UnsecuredSeniorNotesMember2020-12-310001297996dlr:DigitalRealtyTrustLPMemberdlr:FourPointTwoFiveZeroPercentNotesDueTwoThousandTwentyFiveMemberdlr:UnsecuredSeniorNotesMember2020-12-310001297996dlr:DigitalRealtyTrustLPMemberdlr:FourPointSevenFiveZeroPercentNotesDueTwoThousandTwentyFiveMemberdlr:UnsecuredSeniorNotesMember2020-12-310001297996dlr:DigitalRealtyTrustLPMemberdlr:FourPointFourFiveZeroPercentNotesDueTwentyTwentyEightMemberdlr:UnsecuredSeniorNotesMember2020-12-310001297996dlr:DigitalRealtyTrustLPMemberdlr:FloatingRateNotesDueTwentyTwentyTwoMemberdlr:UnsecuredSeniorNotesMember2020-12-310001297996dlr:DigitalRealtyTrustLPMemberdlr:UnsecuredTermLoanMember2020-12-310001297996dlr:DigitalRealtyTrustLPMemberdlr:UnsecuredSeniorNotesMember2020-12-310001297996dlr:DigitalRealtyTrustLPMemberdlr:SecuredAndOtherDebtMember2020-12-310001297996dlr:DigitalRealtyTrustLPMemberdlr:OtherCurrencyMember2020-12-310001297996dlr:DigitalRealtyTrustLPMemberdlr:GlobalRevolvingCreditFacilityMember2020-12-310001297996dlr:DigitalRealtyTrustLPMembercurrency:USD2020-12-310001297996dlr:DigitalRealtyTrustLPMembercurrency:GBP2020-12-310001297996dlr:DigitalRealtyTrustLPMembercurrency:EUR2020-12-310001297996dlr:SeriesLPreferredStockMember2019-10-100001297996dlr:SeriesKPreferredStockMember2019-03-130001297996us-gaap:SeriesCPreferredStockMember2017-09-140001297996dlr:SeriesJPreferredStockMember2017-08-070001297996us-gaap:NonUsMemberus-gaap:SalesRevenueNetMemberus-gaap:GeographicConcentrationRiskMember2021-01-012021-12-310001297996us-gaap:NonUsMemberus-gaap:SalesRevenueNetMemberus-gaap:GeographicConcentrationRiskMember2020-01-012020-12-310001297996us-gaap:NonUsMemberus-gaap:SalesRevenueNetMemberus-gaap:GeographicConcentrationRiskMember2019-01-012019-12-310001297996dlr:DigitalRealtyTrustLPMember2019-12-310001297996dlr:DigitalRealtyTrustLPMember2018-12-3100012979962018-12-310001297996dlr:InterxionMember2020-03-120001297996dlr:InterxionMember2020-03-122020-03-120001297996dlr:InterxionMember2020-03-092020-03-090001297996dlr:BelowMarketLeasesMember2020-12-310001297996us-gaap:NonUsMember2021-12-310001297996us-gaap:NonUsMember2020-12-310001297996us-gaap:EquityMethodInvestmentNonconsolidatedInvesteeOrGroupOfInvesteesMemberus-gaap:CorporateJointVentureMember2021-12-310001297996dlr:OtherInvestmentMemberus-gaap:EquityMethodInvestmentNonconsolidatedInvesteeOrGroupOfInvesteesMember2021-12-310001297996dlr:MitsubishiCorporationJointVentureMemberus-gaap:EquityMethodInvestmentNonconsolidatedInvesteeOrGroupOfInvesteesMember2021-12-310001297996dlr:MapletreeJointVentureMemberus-gaap:EquityMethodInvestmentNonconsolidatedInvesteeOrGroupOfInvesteesMember2021-12-310001297996dlr:LumenMemberus-gaap:EquityMethodInvestmentNonconsolidatedInvesteeOrGroupOfInvesteesMember2021-12-310001297996dlr:AscentyMemberus-gaap:EquityMethodInvestmentNonconsolidatedInvesteeOrGroupOfInvesteesMember2021-12-310001297996us-gaap:EquityMethodInvestmentNonconsolidatedInvesteeOrGroupOfInvesteesMemberus-gaap:CorporateJointVentureMember2020-12-310001297996dlr:OtherInvestmentMemberus-gaap:EquityMethodInvestmentNonconsolidatedInvesteeOrGroupOfInvesteesMember2020-12-310001297996dlr:MitsubishiCorporationJointVentureMemberus-gaap:EquityMethodInvestmentNonconsolidatedInvesteeOrGroupOfInvesteesMember2020-12-310001297996dlr:MapletreeJointVentureMemberus-gaap:EquityMethodInvestmentNonconsolidatedInvesteeOrGroupOfInvesteesMember2020-12-310001297996dlr:LumenMemberus-gaap:EquityMethodInvestmentNonconsolidatedInvesteeOrGroupOfInvesteesMember2020-12-310001297996dlr:AscentyMemberus-gaap:EquityMethodInvestmentNonconsolidatedInvesteeOrGroupOfInvesteesMember2020-12-310001297996us-gaap:EquityMethodInvestmentNonconsolidatedInvesteeOrGroupOfInvesteesMemberus-gaap:CorporateJointVentureMember2019-12-310001297996dlr:OtherInvestmentMemberus-gaap:EquityMethodInvestmentNonconsolidatedInvesteeOrGroupOfInvesteesMember2019-12-310001297996dlr:MitsubishiCorporationJointVentureMemberus-gaap:EquityMethodInvestmentNonconsolidatedInvesteeOrGroupOfInvesteesMember2019-12-310001297996dlr:MapletreeJointVentureMemberus-gaap:EquityMethodInvestmentNonconsolidatedInvesteeOrGroupOfInvesteesMember2019-12-310001297996dlr:LumenMemberus-gaap:EquityMethodInvestmentNonconsolidatedInvesteeOrGroupOfInvesteesMember2019-12-310001297996dlr:AscentyMemberus-gaap:EquityMethodInvestmentNonconsolidatedInvesteeOrGroupOfInvesteesMember2019-12-310001297996us-gaap:SeriesCPreferredStockMember2021-01-012021-12-310001297996us-gaap:ForwardContractsMember2021-01-012021-12-310001297996dlr:SeriesLPreferredStockMember2021-01-012021-12-310001297996dlr:SeriesKPreferredStockMember2021-01-012021-12-310001297996dlr:SeriesJPreferredStockMember2021-01-012021-12-310001297996dlr:OperatingPartnershipUnitsNotOwnedByCompanyMember2021-01-012021-12-310001297996us-gaap:SeriesGPreferredStockMember2020-01-012020-12-310001297996us-gaap:SeriesCPreferredStockMember2020-01-012020-12-310001297996dlr:SeriesLPreferredStockMember2020-01-012020-12-310001297996dlr:SeriesKPreferredStockMember2020-01-012020-12-310001297996dlr:SeriesJPreferredStockMember2020-01-012020-12-310001297996dlr:SeriesIPreferredStockMember2020-01-012020-12-310001297996dlr:OperatingPartnershipUnitsNotOwnedByCompanyMember2020-01-012020-12-310001297996us-gaap:SeriesHPreferredStockMember2019-01-012019-12-310001297996us-gaap:SeriesGPreferredStockMember2019-01-012019-12-310001297996us-gaap:SeriesCPreferredStockMember2019-01-012019-12-310001297996dlr:SeriesLPreferredStockMember2019-01-012019-12-310001297996dlr:SeriesKPreferredStockMember2019-01-012019-12-310001297996dlr:SeriesJPreferredStockMember2019-01-012019-12-310001297996dlr:SeriesIPreferredStockMember2019-01-012019-12-310001297996dlr:OperatingPartnershipUnitsNotOwnedByCompanyMember2019-01-012019-12-310001297996dlr:CustomerRelationshipValueAcquiredInPlaceLeaseValueAndOtherIntangiblesMember2021-01-012021-12-310001297996dlr:CustomerRelationshipValueAcquiredInPlaceLeaseValueAndOtherIntangiblesMember2020-01-012020-12-310001297996dlr:CustomerRelationshipValueAcquiredInPlaceLeaseValueAndOtherIntangiblesMember2019-01-012019-12-310001297996us-gaap:CommonStockMember2021-01-012021-12-310001297996us-gaap:LeasesAcquiredInPlaceMember2021-01-012021-12-310001297996us-gaap:CustomerRelationshipsMember2021-01-012021-12-310001297996us-gaap:AboveMarketLeasesMember2021-01-012021-12-310001297996dlr:DigitalRealtyTrustLPMemberdlr:CommonUnitsMemberus-gaap:GeneralPartnerMemberus-gaap:SeriesCPreferredStockMember2021-01-012021-12-310001297996us-gaap:SeriesCPreferredStockMemberus-gaap:RetainedEarningsMember2021-01-012021-12-310001297996dlr:IncentiveUnitsMember2021-01-012021-12-310001297996dlr:IncentiveUnitsMember2020-01-012020-12-310001297996dlr:IncentiveUnitsMember2019-01-012019-12-310001297996dlr:MarketPerformanceBasedAwardsMemberus-gaap:ShareBasedCompensationAwardTrancheTwoMember2021-01-012021-12-310001297996dlr:MarketPerformanceBasedAwardsMemberus-gaap:ShareBasedCompensationAwardTrancheThreeMember2021-01-012021-12-310001297996dlr:MarketPerformanceBasedAwardsMemberus-gaap:ShareBasedCompensationAwardTrancheOneMember2021-01-012021-12-310001297996dlr:MarketPerformanceBasedAwardsMemberdlr:ShareBasedCompensationAwardTrancheFourMember2021-01-012021-12-310001297996dlr:MarketPerformanceBasedAwardsMemberus-gaap:ShareBasedCompensationAwardTrancheTwoMember2020-01-012020-12-310001297996dlr:MarketPerformanceBasedAwardsMemberus-gaap:ShareBasedCompensationAwardTrancheThreeMember2020-01-012020-12-310001297996dlr:MarketPerformanceBasedAwardsMemberus-gaap:ShareBasedCompensationAwardTrancheOneMember2020-01-012020-12-310001297996dlr:MarketPerformanceBasedAwardsMemberdlr:ShareBasedCompensationAwardTrancheFourMember2020-01-012020-12-310001297996dlr:MarketPerformanceBasedAwardsMemberus-gaap:ShareBasedCompensationAwardTrancheTwoMember2019-01-012019-12-310001297996dlr:MarketPerformanceBasedAwardsMemberus-gaap:ShareBasedCompensationAwardTrancheThreeMember2019-01-012019-12-310001297996dlr:MarketPerformanceBasedAwardsMemberus-gaap:ShareBasedCompensationAwardTrancheOneMember2019-01-012019-12-310001297996dlr:MarketPerformanceBasedAwardsMemberdlr:ShareBasedCompensationAwardTrancheFourMember2019-01-012019-12-310001297996dlr:LongTermIncentiveUnitsMember2021-12-310001297996dlr:EquityDistributionAmendment2020Member2021-01-012021-12-310001297996dlr:EquityDistributionAmendment2020Member2020-01-012020-12-310001297996dlr:CommonUnitsMember2021-01-012021-12-310001297996dlr:CommonUnitsMember2020-01-012020-12-310001297996dlr:CommonUnitsMember2019-01-012019-12-310001297996us-gaap:EMEAMember2021-12-310001297996stpr:NY2021-12-310001297996srt:NorthAmericaMember2021-12-310001297996srt:AsiaPacificMember2021-12-310001297996dlr:ZurichMember2021-12-310001297996dlr:ViennaMember2021-12-310001297996dlr:TorontoMember2021-12-310001297996dlr:SydneyMember2021-12-310001297996dlr:StockholmMember2021-12-310001297996dlr:SiliconValleyMember2021-12-310001297996dlr:SeattleMember2021-12-310001297996dlr:SanFranciscoMember2021-12-310001297996dlr:PortlandMember2021-12-310001297996dlr:PhoenixMember2021-12-310001297996dlr:ParisMember2021-12-310001297996dlr:OtherNorthAmericaMember2021-12-310001297996dlr:OtherInAsiaPacificMember2021-12-310001297996dlr:OtherEuropeMember2021-12-310001297996dlr:OtherAfricaMember2021-12-310001297996dlr:NorthernVirginiaMember2021-12-310001297996dlr:MinneapolisStPaulMember2021-12-310001297996dlr:MiamiMember2021-12-310001297996dlr:MelbourneMember2021-12-310001297996dlr:MarseilleMember2021-12-310001297996dlr:MadridMember2021-12-310001297996dlr:LosAngelesMember2021-12-310001297996dlr:LondonMember2021-12-310001297996dlr:HoustonMember2021-12-310001297996dlr:FrankfurtMember2021-12-310001297996dlr:DusseldorfMember2021-12-310001297996dlr:DublinMember2021-12-310001297996dlr:DallasMember2021-12-310001297996dlr:CopenhagenMember2021-12-310001297996dlr:ChicagoMember2021-12-310001297996dlr:CharlotteMember2021-12-310001297996dlr:BrusselsMember2021-12-310001297996dlr:BostonMember2021-12-310001297996dlr:AustinMember2021-12-310001297996dlr:AtlantaMember2021-12-310001297996dlr:AmsterdamMember2021-12-310001297996country:SG2021-12-310001297996country:HK2021-12-310001297996us-gaap:EMEAMember2021-01-012021-12-310001297996stpr:NY2021-01-012021-12-310001297996srt:NorthAmericaMember2021-01-012021-12-310001297996srt:AsiaPacificMember2021-01-012021-12-310001297996dlr:ZurichMember2021-01-012021-12-310001297996dlr:ViennaMember2021-01-012021-12-310001297996dlr:TorontoMember2021-01-012021-12-310001297996dlr:SydneyMember2021-01-012021-12-310001297996dlr:StockholmMember2021-01-012021-12-310001297996dlr:SiliconValleyMember2021-01-012021-12-310001297996dlr:SeattleMember2021-01-012021-12-310001297996dlr:SanFranciscoMember2021-01-012021-12-310001297996dlr:PortlandMember2021-01-012021-12-310001297996dlr:PhoenixMember2021-01-012021-12-310001297996dlr:ParisMember2021-01-012021-12-310001297996dlr:OtherNorthAmericaMember2021-01-012021-12-310001297996dlr:OtherInAsiaPacificMember2021-01-012021-12-310001297996dlr:OtherEuropeMember2021-01-012021-12-310001297996dlr:OtherAfricaMember2021-01-012021-12-310001297996dlr:NorthernVirginiaMember2021-01-012021-12-310001297996dlr:MinneapolisStPaulMember2021-01-012021-12-310001297996dlr:MiamiMember2021-01-012021-12-310001297996dlr:MelbourneMember2021-01-012021-12-310001297996dlr:MarseilleMember2021-01-012021-12-310001297996dlr:MadridMember2021-01-012021-12-310001297996dlr:LosAngelesMember2021-01-012021-12-310001297996dlr:LondonMember2021-01-012021-12-310001297996dlr:HoustonMember2021-01-012021-12-310001297996dlr:FrankfurtMember2021-01-012021-12-310001297996dlr:DusseldorfMember2021-01-012021-12-310001297996dlr:DublinMember2021-01-012021-12-310001297996dlr:DallasMember2021-01-012021-12-310001297996dlr:CopenhagenMember2021-01-012021-12-310001297996dlr:ChicagoMember2021-01-012021-12-310001297996dlr:CharlotteMember2021-01-012021-12-310001297996dlr:BrusselsMember2021-01-012021-12-310001297996dlr:BostonMember2021-01-012021-12-310001297996dlr:AustinMember2021-01-012021-12-310001297996dlr:AtlantaMember2021-01-012021-12-310001297996dlr:AmsterdamMember2021-01-012021-12-310001297996country:SG2021-01-012021-12-310001297996country:HK2021-01-012021-12-310001297996dlr:DisposalOfPortfolioCentersInEuropeMember2021-01-012021-03-310001297996dlr:DataCentersMemberdlr:MapletreePortfolioMember2020-01-012020-01-310001297996us-gaap:AccountingStandardsUpdate201409Member2021-01-012021-12-310001297996us-gaap:AccountingStandardsUpdate201409Member2020-01-012020-12-310001297996us-gaap:AccountingStandardsUpdate201409Member2019-01-012019-12-310001297996dlr:NoncontrollingInterestsInOperatingPartnershipMember2021-12-310001297996dlr:NoncontrollingInterestsInOperatingPartnershipMember2020-12-310001297996dlr:PgimRealEstateMemberdlr:InvestmentInPartnershipMember2021-09-300001297996dlr:InvestmentInPartnershipMember2021-09-300001297996dlr:CommonUnitsHeldByThirdPartiesMember2021-12-310001297996dlr:CommonUnitsHeldByThirdPartiesMember2020-12-310001297996dlr:IncentiveUnitsHeldByEmployeesAndDirectorsMember2021-12-310001297996dlr:IncentiveUnitsHeldByEmployeesAndDirectorsMember2020-12-310001297996dlr:SreitMember2021-12-062021-12-060001297996dlr:SreitMember2021-12-310001297996dlr:SreitMember2021-12-060001297996dlr:SreitMemberdlr:DigitalCoreReitMember2021-12-060001297996dlr:DataCentersMembercountry:NLdlr:DisposalOfPortfolioCentersInEuropeMember2021-03-160001297996dlr:DataCentersMembercountry:GBdlr:DisposalOfPortfolioCentersInEuropeMember2021-03-160001297996dlr:DataCentersMembercountry:FRdlr:DisposalOfPortfolioCentersInEuropeMember2021-03-160001297996dlr:DataCentersMembercountry:CHdlr:DisposalOfPortfolioCentersInEuropeMember2021-03-160001297996dlr:DataCentersMemberdlr:DisposalOfPortfolioCentersInEuropeMember2021-03-160001297996dlr:DataCentersMemberdlr:DisposalOfPortfolioCentersInNorthAmericaMemberdlr:MapletreePortfolioMember2020-01-310001297996dlr:DataCentersMemberdlr:MapletreePortfolioMember2019-11-300001297996dlr:DigitalCoreReitMember2021-12-062021-12-060001297996us-gaap:DisposalGroupDisposedOfBySaleNotDiscontinuedOperationsMemberdlr:DisposalOfPortfolioCentersInNorthAmericaMember2021-07-012021-09-300001297996dlr:MapletreePortfolioMember2020-01-012020-01-310001297996dlr:DigitalRealtyTrustLPMemberus-gaap:SecuredDebtMember2021-12-310001297996dlr:DigitalRealtyTrustLPMemberdlr:UnsecuredTermLoanMember2021-12-310001297996dlr:DigitalRealtyTrustLPMemberdlr:GlobalRevolvingCreditFacilityMember2021-12-310001297996dlr:DigitalRealtyTrustLPMemberdlr:GlobalRevolvingCreditFacilityMember2021-01-012021-12-310001297996dlr:DigitalRealtyTrustLPMemberdlr:CommonUnitsMemberus-gaap:LimitedPartnerMember2021-01-012021-12-310001297996dlr:DigitalRealtyTrustLPMemberdlr:CommonUnitsMemberus-gaap:LimitedPartnerMember2020-01-012020-12-310001297996dlr:DigitalRealtyTrustLPMemberdlr:CommonUnitsMemberus-gaap:LimitedPartnerMember2019-01-012019-12-310001297996dlr:DigitalRealtyTrustLPMemberdlr:CommonUnitsMemberus-gaap:GeneralPartnerMember2019-01-012019-12-310001297996dlr:DigitalCoreReitMemberus-gaap:UnconsolidatedPropertiesMember2021-12-310001297996dlr:SeriesCPreferredUnitsMember2021-05-170001297996srt:MaximumMemberdlr:EquityDistributionAmendment2020Member2021-12-310001297996dlr:SreitMemberdlr:DigitalCoreReitMember2021-12-062021-12-060001297996dlr:DigitalCoreReitMember2021-12-062021-12-060001297996dlr:ServiceBasedRestrictedStockUnitsMember2021-01-012021-12-310001297996dlr:MarketPerformanceBasedAwardsMember2021-01-012021-12-310001297996dlr:LongTermIncentiveUnitsMember2021-01-012021-12-310001297996dlr:ServiceBasedRestrictedStockUnitsMember2020-01-012020-12-310001297996dlr:MarketPerformanceBasedAwardsMember2020-01-012020-12-310001297996dlr:LongTermIncentiveUnitsMember2020-01-012020-12-310001297996dlr:ServiceBasedRestrictedStockUnitsMember2019-01-012019-12-310001297996dlr:MarketPerformanceBasedAwardsMember2019-01-012019-12-310001297996dlr:LongTermIncentiveUnitsMember2019-01-012019-12-310001297996dlr:FourPointSevenFiveZeroPercentNotesDueTwoThousandTwentyThreeMemberus-gaap:SubsequentEventMember2022-02-030001297996dlr:FourPointSevenFiveZeroPercentNotesDueTwoThousandTwentyThreeMemberus-gaap:SubsequentEventMember2022-02-032022-02-030001297996dlr:DigitalRealtyTrustLPMembersrt:MinimumMemberdlr:UnsecuredSeniorNotesMember2021-01-012021-12-310001297996dlr:DigitalRealtyTrustLPMemberdlr:YenRevolvingCreditFacilityMember2021-01-012021-12-310001297996dlr:GlobalRevolvingCreditFacilityMember2021-01-012021-12-310001297996dlr:DigitalRealtyTrustLPMembersrt:MaximumMemberdlr:UnsecuredSeniorNotesMember2021-01-012021-12-310001297996dlr:DigitalRealtyTrustLPMember2021-12-310001297996dlr:DigitalRealtyTrustLPMember2020-12-310001297996dlr:DigitalRealtyTrustLPMemberdlr:CommonUnitsMember2021-01-012021-12-310001297996dlr:SeriesLPreferredUnitsMember2021-01-012021-12-310001297996dlr:CommonUnitsMember2021-01-012021-12-310001297996dlr:DigitalRealtyTrustLPMemberdlr:CommonUnitsMember2020-01-012020-12-310001297996dlr:DigitalRealtyTrustLPMemberdlr:CommonUnitsMember2019-01-012019-12-310001297996dlr:CommonUnitsMember2019-01-012019-12-310001297996dlr:InterxionMember2020-03-090001297996dlr:BelowMarketLeasesMember2021-12-3100012979962020-01-012020-12-310001297996dlr:DigitalRealtyTrustLPMember2019-01-012019-12-3100012979962019-01-012019-12-310001297996dlr:DigitalRealtyTrustLPMemberdlr:CommonUnitsMemberus-gaap:GeneralPartnerMember2021-01-012021-12-310001297996dlr:DigitalRealtyTrustLPMemberdlr:RedeemableLimitedPartnerCommonUnitsMember2021-01-012021-12-310001297996dlr:DigitalRealtyTrustLPMemberdlr:CommonUnitsMemberus-gaap:GeneralPartnerMember2020-01-012020-12-310001297996dlr:DigitalRealtyTrustLPMemberdlr:RedeemableLimitedPartnerCommonUnitsMember2020-01-012020-12-310001297996dlr:DigitalRealtyTrustLPMember2020-01-012020-12-310001297996us-gaap:NoncontrollingInterestMember2021-01-012021-12-310001297996us-gaap:AdditionalPaidInCapitalMember2021-01-012021-12-310001297996us-gaap:NoncontrollingInterestMember2020-01-012020-12-310001297996us-gaap:AdditionalPaidInCapitalMember2020-01-012020-12-310001297996us-gaap:NoncontrollingInterestMember2019-01-012019-12-310001297996us-gaap:AdditionalPaidInCapitalMember2019-01-012019-12-310001297996dlr:BelowMarketLeasesMember2021-01-012021-12-3100012979962019-12-3100012979962021-12-3100012979962020-12-310001297996us-gaap:CommonStockMember2021-01-012021-12-310001297996dlr:SeriesLPreferredStockMember2021-01-012021-12-310001297996dlr:SeriesKPreferredStockMember2021-01-012021-12-310001297996dlr:SeriesJPreferredStockMember2021-01-012021-12-3100012979962021-06-3000012979962022-02-220001297996dlr:DigitalRealtyTrustLPMember2021-01-012021-12-3100012979962021-01-012021-12-31iso4217:GBPiso4217:USDiso4217:CADiso4217:JPYdlr:segmentxbrli:sharesiso4217:USDxbrli:pureiso4217:USDxbrli:sharesdlr:itemdlr:derivativedlr:propertyiso4217:EURiso4217:CHF

Table of Contents

Index to Financial Statements

55555555555555555555555555555555555555555555555555555555555555555555555555555555555555555555555555555555555555555555555555555555555555555555555555555555555555555555555555555555555555555555555555555555555555555555555555555555555555555555555555555555555555555555555555555555555555555555555555555555555555555555555555555555555555555555555555555555555555555555555555555555555555555555555555555555555555555555555555555555555555555555555555555555555555555555555555555555555555555555555555555555555555555555555555555555555555555555555555555555555555555555555555555555555555555555555555555555555555555555555555555555555555555555555555555555555555555555555555555555555555555555555555555555555555555555555555555555555555555555555555555555555555555555555555555555555555555555555555555555555555555555555555555555555555555555555555555555555555555555555555555555555555555555555555555555555555555555555555555555555555555555555555555555555555555555555555555555555555555555555555555555555555555555555555555555555555555555555555555555555555555555555555555555555555555555555555555555555555555555555555555555555555555555555555555555555555555555555555555555555555555555555555555555555555555555555555555555555555555555555555555555555555555555555555555555555555555555555555555555555555555555555555555555555555555555555555555555555555555555555555555555555555555555555555555555555555555555555555555555555555555555555555555555555555555555555555555555555555555555555555555555555555555555555555555555555555555555555555555555555555555555555555555555555555555555555555555555555555555555555555555555555555555555555555555555555555555555555555555555555555555555555555555555555555555555555555555555555555555555555555555555555555555555555555555555555555555555555555555555555555555555555555555555555555555555555555555555555555555555555555555555555555555555555555555555555555555555555555555555555555555555555555555555555555555555555555555555555555555555555555555555555555555555555555555555555555555555555555555555555555555555555555555555555555555555555555555555555555555555555555555555555555555555555555555555555555555555555555555555555555555555555555555555555555555555555555555555555555555555555555555555555555555555555555555555555555555555555555555555555555555555555555555555555555555555555555555555555555555555555555555555555555555555555555555555555555555555555555555555555555555555555555555555555555555555555555555555555555555555555555555555555555555555555555555555555555555555555555555555555555555555555555555555555555555555555555555555555555555555555555555555555555555555555555555555555555555555555555555555555555555555555555555555555555555555555555555555555555555555555555555555555555555555555555555555555555555555555555555555555555555555555555555555555555555555555555555555555555555555555555555555555555555555555555555555555555555555555555555555555555555555555555555555555555555555555555555555555555555555555555555555555555555555555555555555555555

UNITED STATES

SECURITIES AND EXCHANGE COMMISSION

WASHINGTON, D.C. 20549

FORM 10-K

Annual Report Pursuant to Section 13 or 15(d) of the Securities Exchange Act of 1934

For the fiscal year ended December 31, 2021

Transition Report Pursuant to Section 13 or 15(d) of the Securities Exchange Act of 1934

For the Transition Period From                     to                     .

Commission file number


001-32336 (Digital Realty Trust, Inc.)

000-54023 (Digital Realty Trust, L.P.)

DIGITAL REALTY TRUST, INC.

DIGITAL REALTY TRUST, L.P.

(Exact name of registrant as specified in its charter)

Maryland (Digital Realty Trust, Inc.)

Maryland (Digital Realty Trust, L.P.)

26-0081711

20-2402955

(State or other jurisdiction of incorporation or organization)

(IRS employer identification number)

5707 Southwest Parkway, Building 1, Suite 275

Austin, Texas

78735

(Address of principal executive offices)

(Zip Code)

(737) 281-0101

(Registrant’s telephone number, including area code)

Securities registered pursuant to Section 12(b) of the Act:


Title of each class

Trading Symbols(s)


Name of each exchange on which registered

Digital Realty Trust, Inc.

Common Stock, $0.01 par value per share

DLR

New York Stock Exchange

Series J Cumulative Redeemable Preferred
Stock
, $0.01 par value per share

DLR Pr J

New York Stock Exchange

Series K Cumulative Redeemable Preferred
Stock
, $0.01 par value per share

DLR Pr K

New York Stock Exchange

Series L Cumulative Redeemable Preferred
Stock
, $0.01 par value per share

DLR Pr L

New York Stock Exchange

Digital Realty Trust, L.P.

None

None

None

Securities registered pursuant to Section 12(g) of the Act:

Digital Realty Trust, Inc.

None

Digital Realty Trust, L.P.

Common Units of Partnership Interest

Indicate by check mark if the registrant is a well-known seasoned issuer, as defined in Rule 405 of the Securities Act.

Digital Realty Trust, Inc.

Yes     No  

Digital Realty Trust, L.P.

Yes     No  

Indicate by check mark if the registrant is not required to file reports pursuant to Section 13 or Section 15(d) of the Act.

Digital Realty Trust, Inc.

Yes     No   

Digital Realty Trust, L.P.

Yes     No   

Indicate by check mark whether the registrant (1) has filed all reports required to be filed by Section 13 or 15(d) of the Securities Exchange Act of 1934 during the preceding 12 months (or for such shorter period that the registrant was required to file such reports), and (2) has been subject to such filing requirements for the past 90 days.

Digital Realty Trust, Inc.

Yes     No  

Digital Realty Trust, L.P.

Yes     No  

Indicate by check mark whether the registrant has submitted electronically every Interactive Data File required to be submitted pursuant to Rule 405 of Regulation S-T (§232.405 of this chapter) during the preceding 12 months (or for such shorter period that the registrant was required to submit such files).

Table of Contents

Index to Financial Statements

Digital Realty Trust, Inc.

Yes     No  

Digital Realty Trust, L.P.

Yes     No  

Indicate by check mark whether the registrant is a large accelerated filer, an accelerated filer, a non-accelerated filer, a smaller reporting company, or emerging growth company. See the definitions of “large accelerated filer,” “accelerated filer,” “smaller reporting company,” and “emerging growth company” in Rule 12b-2 of the Exchange Act.

Digital Realty Trust, Inc.:

Large accelerated filer

Accelerated filer

Non-accelerated filer

Smaller reporting company

Emerging growth company

Digital Realty Trust, L.P.:

Large accelerated filer

Accelerated filer

Non-accelerated filer

Smaller reporting company

Emerging growth company

If an emerging growth company, indicate by check mark if the registrant has elected not to use the extended transition period for complying with any new or revised financial accounting standards provided pursuant to Section 13(a) of the Exchange Act.

Digital Realty Trust, Inc.

Digital Realty Trust, L.P.

Indicate by check mark whether the registrant has filed a report on and attestation to its management’s assessment of the effectiveness of its internal control over financial reporting under Section 404(b) of the Sarbanes-Oxley Act (15 U.S.C. 7262(b)) by the registered public accounting firm that prepared or issued its audit report.

Digital Realty Trust, Inc.

Digital Realty Trust, L.P.

Indicate by check mark whether the registrant is a shell company (as defined in Rule 12b-2 of the Act).

Digital Realty Trust, Inc.

Yes     No   

Digital Realty Trust, L.P.

Yes     No   

The aggregate market value of the common equity held by non-affiliates of Digital Realty Trust, Inc. as of June 30, 2021 totaled approximately $42 billion based on the closing price for Digital Realty Trust, Inc.’s common stock on that day as reported by the New York Stock Exchange. Such value excludes common stock held by executive officers, directors and 10% or greater stockholders as of June 30, 2021. The identification of 10% or greater stockholders as of June 30, 2021 is based on Schedule 13G and amended Schedule 13G reports publicly filed before June 30, 2021. This calculation does not reflect a determination that such parties are affiliates for any other purposes.

There is no public trading market for the common units of Digital Realty Trust, L.P. As a result, the aggregate market value of the common units held by non-affiliates of Digital Realty Trust, L.P. cannot be determined.

Indicate the number of shares outstanding of each of the registrant’s classes of common stock, as of the latest practicable date.

Digital Realty Trust, Inc.:

Class


Outstanding at February 22, 2022

Common Stock, $.01 par value per share

284,469,103

DOCUMENTS INCORPORATED BY REFERENCE

Part III incorporates by reference portions of Digital Realty Trust, Inc.’s Proxy Statement for its 2022 Annual Meeting of Stockholders which the registrants anticipate will be filed no later than 120 days after the end of their fiscal year pursuant to Regulation 14A.

Table of Contents

Index to Financial Statements

EXPLANATORY NOTE

This report combines the annual reports on Form 10-K for the year ended December 31, 2021 of Digital Realty Trust, Inc., a Maryland corporation, and Digital Realty Trust, L.P., a Maryland limited partnership, of which Digital Realty Trust, Inc. is the sole general partner. Unless otherwise indicated or unless the context requires otherwise, all references in this report to “we,” “us,” “our,” “our Company”, or “the Company” refer to Digital Realty Trust, Inc. together with its consolidated subsidiaries, including Digital Realty Trust, L.P. Unless otherwise, all references to the “Parent” refer to Digital Realty Trust, Inc., and all references to “our Operating Partnership,” “the Operating Partnership” or “the OP” refer to Digital Realty Trust, L.P. together with its consolidated subsidiaries.

The Parent is a real estate investment trust, or REIT, and the sole general partner of the OP. In statements regarding qualification as a REIT, such terms refer solely to Digital Realty Trust, Inc. As of December 31, 2021, the Parent owned an approximate 98.0% common general partnership interest in Digital Realty Trust, L.P. The remaining approximate 2.0% of the common limited partnership interests of Digital Realty Trust, L.P. are owned by non-affiliated third parties and certain directors and officers of the Parent. As of December 31, 2021, the Parent owned all of the preferred limited partnership interests of Digital Realty Trust, L.P. As the sole general partner of Digital Realty Trust, L.P., the Parent has the full, exclusive and complete responsibility for the OP’s day-to-day management and control.

We believe combining the annual reports on Form 10-K of the Parent and the OP into this single report results in the following benefits:

enhancing investors’ understanding of the Parent and the OP by enabling investors to view the business as a whole in the same manner as management views and operates the business;
eliminating duplicative disclosure and providing a more streamlined and readable presentation since a substantial portion of the disclosure applies to both the Parent and the OP; and
creating time and cost efficiencies through the preparation of one combined report instead of two separate reports.

It is important to understand the few differences between the Parent and the OP in the context of how we operate the Company. The Parent does not conduct business itself, other than acting as the sole general partner of the OP and issuing public equity from time to time and guaranteeing certain unsecured debt of the OP and certain of its subsidiaries and affiliates. The OP holds substantially all the assets of the business, directly or indirectly. The OP conducts the operations of the business and is structured as a partnership with no publicly traded equity. Except for net proceeds from equity issuances by the Parent, which are generally contributed to the OP in exchange for partnership units, the OP generates capital required by the business through the OP’s operations, incurrence of indebtedness and issuance of partnership units to third parties.

The presentation of noncontrolling interests, stockholders’ equity and partners’ capital are the main areas of difference between the consolidated financial statements of the Parent and those of the OP. The differences in the presentations between stockholders’ equity and partners’ capital result from the differences in the equity and capital issuances in the Parent and in the OP.

To highlight the differences between the Parent and the OP, separate sections in this report, as applicable, individually discuss the Parent and the OP, including separate financial statements and separate Exhibit 31 and 32 certifications. In the sections that combine disclosure of the Parent and the OP, this report refers to actions or holdings as being actions or holdings of the Company.

As general partner with control of the OP, the Parent consolidates the OP for financial reporting purposes, and it does not have significant assets other than its investment in the OP. Therefore, the assets and liabilities of the Parent and the OP are the same on their respective consolidated financial statements. The separate discussions of the Parent and the OP in this report should be read in conjunction with each other to understand the results of the Company on a consolidated basis and how management operates the Company.

Table of Contents

Index to Financial Statements

In this report, “properties” and “buildings” refer to all or any of the buildings in our portfolio, including data centers and non-data centers, and “data centers” refers only to the properties or buildings in our portfolio that contain data center space.

Table of Contents

Index to Financial Statements

DIGITAL REALTY TRUST, INC. AND DIGITAL REALTY TRUST, L.P.

FORM 10-K

FOR THE YEAR ENDED DECEMBER 31, 2021

TABLE OF CONTENTS


PAGE NO.

PART I.

1

ITEM 1.

Business

1

ITEM 1A.

Risk Factors

17

ITEM 1B.

Unresolved Staff Comments

47

ITEM 2.

Properties

47

ITEM 3.

Legal Proceedings

51

ITEM 4.

Mine Safety Disclosures

51

PART II.

52

ITEM 5.

Market for Registrant’s Common Equity, Related Stockholder Matters and Issuer Purchases of Equity Securities

52

ITEM 6.

Selected Financial Data

55

ITEM 7.

Management’s Discussion and Analysis of Financial Condition and Results of Operations

56

ITEM 7A.

Quantitative and Qualitative Disclosures About Market Risk

75

ITEM 8.

Financial Statements and Supplementary Data

79

ITEM 9.

Changes in and Disagreements with Accountants on Accounting and Financial Disclosure

149

ITEM 9A.

Controls and Procedures

149

ITEM 9B.

Other Information

150

PART III.

151

ITEM 10.

Directors, Executive Officers and Corporate Governance

151

ITEM 11.

Executive Compensation

151

ITEM 12.

Security Ownership of Certain Beneficial Owners and Management and Related Stockholder Matters

151

ITEM 13.

Certain Relationships and Related Transactions and Director Independence

151

ITEM 14.

Principal Accounting Fees and Services

151

PART IV.

152

ITEM 15.

Exhibits and Financial Statement Schedules

152

ITEM 16.

Form 10-K Summary

161

SIGNATURES

162

Table of Contents

Index to Financial Statements

PART I

ITEM 1.     BUSINESS

The Company

Digital Realty Trust, Inc. (the “Parent”), through its controlling interest in Digital Realty Trust, L.P. (the “Operating Partnership” or the “OP”) and the subsidiaries of the Operating Partnership, (collectively, “we”, “our”, “us” or the “Company”) is a leading global provider of data center, colocation and interconnection solutions for customers across a variety of industry verticals. The Parent operates as a REIT for federal income tax purposes. The OP is the entity through which the Parent conducts its business of owning, acquiring, developing and operating data centers. The Parent was incorporated in the state of Maryland on March 9, 2004. The OP was organized as a limited partnership in the state of Maryland on July 21, 2004.

As of December 31, 2021, our portfolio consisted of 287 data centers (including 50 data centers held as investments in unconsolidated entities), of which 127 are located in the United States, 107 are located in Europe, 27 are located in Latin America, 13 are located in Asia, six are located in Australia, four are located in Africa and three are located in Canada.

Our principal executive offices are located at 5707 Southwest Parkway, Building 1, Suite 275, Austin, Texas 78735. Our telephone number is (737) 281-0101. Our website is www.digitalrealty.com. The information found on, or otherwise accessible through, our website is not incorporated by reference into, nor does it form a part of, this Annual Report on Form 10-K.

Recent Acquisitions

On October 29, 2019, Digital Realty Trust, Inc., Digital Intrepid Holding B.V., an indirect subsidiary of Digital Realty Trust, Inc. (the “Buyer”), and Interxion Holding N.V., which we refer to as Interxion, entered into a purchase agreement, or the Purchase Agreement, pursuant to which, subject to the terms and conditions of the Purchase Agreement, the Buyer commenced an exchange offer to purchase all of the outstanding ordinary shares of Interxion in exchange for shares of common stock of Digital Realty Trust, Inc. We refer to the transactions contemplated by the Purchase Agreement as the Interxion Combination. We obtained control of Interxion on March 9, 2020 and completed the Interxion Combination on March 12, 2020 for total equity consideration of approximately $7.0 billion, including cash assumed. The Interxion Combination expanded the combined company’s presence across Europe and Africa.

On November 1, 2019, we closed the joint venture with Mapletree Investments and Mapletree Industrial Trust, which we refer to collectively as Mapletree, on three existing Turn-Key Flex® data centers located in Ashburn, Virginia. The Company retained a 20% ownership interest in the joint venture, and Mapletree acquired the remaining 80% stake for approximately $0.8 billion. We will continue to operate and manage these facilities. The second tranche of the Mapletree transaction, the sale of 10 fully-leased Powered Base Building® properties for $557 million, closed in January 2020.

On December 20, 2018, the Operating Partnership and Stellar Participações S.A. (formerly Stellar Participões Ltda.), a Brazilian subsidiary of the Operating Partnership, completed the acquisition of Ascenty, a leading data center provider in Brazil, for cash and equity consideration of approximately $2.0 billion, including cash assumed. We refer to this transaction as the Ascenty Acquisition. In March 2019, we formed a joint venture with Brookfield Infrastructure, an affiliate of Brookfield Asset Management, one of the largest owners and operators of infrastructure assets globally. Brookfield invested approximately $702 million in exchange for approximately 49% of the total equity interests in the joint venture which owns and operates Ascenty. A subsidiary of the Operating Partnership retained the remaining equity interest in the Ascenty joint venture. As of March 27, 2019, we deconsolidated Ascenty and recorded our retained interest as an investment in unconsolidated entities due to shared control with Brookfield.

1

Table of Contents

Index to Financial Statements

Industry Background

The digital economy continues to grow and change how enterprises across all industries create and deliver value. Companies increasingly need to operate ubiquitously, on-demand and with real-time intelligence serving customers, partners and employees across multiple channels, business functions and points of business presence. Computational processing power requirements continue to advance, data traffic is growing, and the volume of data that enterprises generate, transmit, process, analyze, monitor and manage is expanding dramatically. The Internet of Things, 5G, autonomous vehicles and artificial intelligence, among other technological advancements, are driving this digital transformation.

We believe that enterprise data growth is accelerating due to the growing digital economy and emerging technological advances. As enterprises analyze and process this accelerating data mass, they create more data. As this mass of data continues to grow, it needs to be analyzed and processed: a task which we believe is becoming increasingly challenging to replicate and relocate. This phenomenon is called Data Gravity. We believe that enterprise decisionmakers will need to increasingly consider the impact of how Data Gravity impacts their enterprise IT architectures and, accordingly, we have developed the Data Gravity Index™: a global forecast that measures the intensity and gravitational force of enterprise data growth.

As the largest global provider of cloud- and carrier-neutral data center, colocation and interconnection solutions, we believe the data center industry is poised for sustainable growth. The demand for data center infrastructure is being driven by this digital transformation which is contributing to the explosive growth of data, rapid growth of cloud adoption and greater demand for IT outsourcing. The power requirements and financial costs to support this growth in data, traffic and storage are substantial and growing accordingly. We believe data centers will continue to play a critical role in the digital economy and enabling business transformation strategies.

We believe cloud solutions and hybrid cloud solutions will remain significant drivers of demand for data center infrastructure. The hybrid cloud, which combines public and private cloud solutions, has gained traction because it enables corporate enterprises to achieve efficiencies and contain costs, as well as scale and secure their most sensitive information. In addition, the leading cloud service providers are generally mature, well-capitalized technology companies, and cloud platforms are among the fastest-growing business segments. Data center providers that can solve global coverage, capacity and connectivity needs, and coordinate and aggregate diverse customer and application demand, are poised to benefit from these cloud-specific industry drivers.

These diverse and secular industry dynamics are driving greater demand for data center capacity not only from global cloud service providers, but also from businesses across other industries, including IT service firms, social media, content providers and the financial services sector. As companies focus on their core competencies and rely on outsourcing to meet their IT infrastructure needs, they are prioritizing colocation for their data center solutions for various reasons, including to reduce latency in data transfer and increase global presence and connectivity. New technologies need a fast, reliable and flexible foundation to operate, and the importance of offering a full spectrum of power, space and connectivity solutions continues to grow.

Our Business

We provide a global data center platform that supports our customers’ digital infrastructure and enables our customers to interconnect with their customers and partners. We solve global coverage, capacity and connectivity needs for companies of all sizes, including the world’s leading enterprises and services providers, through PlatformDIGITAL®, a global data center platform for scaling digital business which enables customers to deploy their critical infrastructure with a global data center provider.

PlatformDIGITAL® combines our global presence with our Pervasive Data Center Architecture (PDx™) solution methodology for scaling digital business and efficiently managing data gravity challenges. Our global data center footprint gives customers access to the connected data communities that matter to them with 287 facilities in nearly 50 metros across 25 countries on six continents.

2

Table of Contents

Index to Financial Statements

Fundamentally, we bring together foundational real estate and innovative technology expertise around the world to deliver a comprehensive, dedicated product suite to meet customers’ data and connectivity needs. We represent an important part of the digital economy that we believe will benefit from powerful, long-term growth drivers.

We believe that the growth trends in the data center market, technology, the cloud, internet traffic and internet-based services, combined with cost advantages in outsourcing data center requirements, provide attractive growth opportunities for us as a data center solutions provider. Leveraging deep expertise in technology and real estate, we have an expansive global footprint, impressive scale and a full-spectrum fit-for-purpose product offering in key metropolitan areas around the world. These advantages simplify the contracting process for multinational enterprises, eliminating their need to negotiate with multiple local data center solutions providers. In addition, in areas where high data center construction and operating costs and long time-to-market prohibit many of our customers from building their own data centers, our global footprint and scale allow us to meet our customers' needs quickly and efficiently.

Our Data Center Portfolio

Our portfolio of high-quality data centers provides secure, highly connected and continuously available environments for the exchange, processing and storage of critical data. Data centers are used for digital communication, disaster recovery purposes, transaction processing and housing mission-critical corporate IT applications. Our internet gateway data centers are highly connected, network-dense facilities that serve as hubs for internet and data communications within and between major metropolitan areas. We believe internet gateways are extremely valuable, and a high-quality, highly interconnected global portfolio such as ours could not be easily replicated today on a cost-competitive basis.

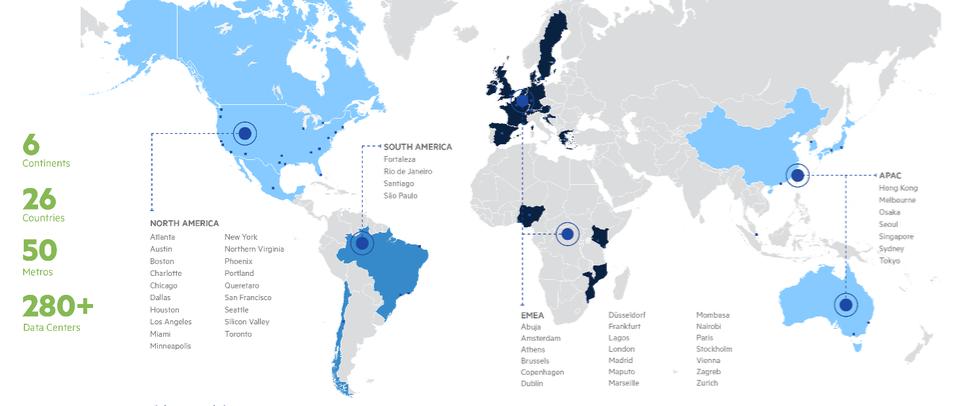
We are diversified across major metropolitan areas characterized by a high concentration of connected end-users and technology companies. At December 31, 2021, we owned or had investments in properties, on a wholly-owned basis or through unconsolidated entities, in the following geographies:

Graphic

Our portfolio contains a total of approximately 45.5 million square feet, including approximately 7.2 million square feet of space under active development and approximately 2.7 million square feet of space held for future development. The 50 data centers held as investments in unconsolidated entities have an aggregate of approximately 35.6 million rentable square feet. The 27 parcels of developable land we own comprise approximately 849 acres. A significant component of our current and future growth is expected to be generated through the development of our existing space held for development and acquisition of new properties. As of December 31, 2021, our portfolio, including the 50 data centers held as investments in unconsolidated entities and excluding space under active development and space held for future development, was approximately 83.6% leased. From time to time we may look to sell individual assets or portfolios of assets that we do not consider to be core to our business and growth strategy.

3

Table of Contents

Index to Financial Statements

Through strategic investments, we have expanded our footprint into Latin America, enhanced our data center offerings in strategic and complementary U.S. metropolitan areas, established our colocation and interconnection platform in the U.S. and expanded our colocation and interconnection platform in Europe and Africa, with each transaction enhancing our presence in top-tier locations throughout North America, Europe, Latin America and Africa.

The locations of and improvements to our data centers, the network density, interconnection infrastructure and connectivity-centric customers in certain of our facilities, and our comprehensive product offerings are critical to our customers’ businesses, which we believe results in high occupancy levels, longer average lease terms and customer relationships, as well as lower turnover. In addition, many of our data centers contain significant improvements that have been installed at our customers’ expense. The tenant improvements in our data centers are generally readily adaptable for use by similar customers.

Our data centers are physically secure, network-rich and equipped to meet the power and cooling requirements of smaller footprints up to the most demanding IT applications. Many of our data centers are located on major aggregation points formed by the physical presence of multiple major telecommunications service providers, which reduces our customers’ costs and operational risks and enhances the attractiveness of our properties. In addition, our strategically located global data center campuses offer our customers the ability to expand their global footprint as their businesses grow, while our connectivity offerings on our campuses enhance the capabilities and attractiveness of these facilities. Further, the network density, interconnection infrastructure and connectivity-centric customers in certain of our data centers has led to the organic formation of densely connected data communities that are difficult for competitors to replicate and deliver added value to our customers.

Our Diversified Product Offerings

We provide a flexible, global data center platform that allows our customers to tailor infrastructure deployments and controls matched to their business needs. Our data centers and comprehensive suite of product offerings are scalable to meet our customers’ needs, from a single rack or cabinet up to multi-megawatt deployments, along with connectivity, connected data communities and solutions to support their hybrid cloud architecture requirements. Over the past few years, we have expanded our product mix to appeal to a broader spectrum of data center customers, especially those seeking to support a greater portion of their data center requirements through a single provider. Our Critical Facilities Management® services and team of technical engineers and data center operations experts provide 24/7 support for these mission-critical facilities.

PlatformDIGITAL® Solution Model. The PlatformDIGITAL® solution model is based on our Pervasive Data Center Architecture (PDx™) strategy, which brings users, networks, clouds, controls and systems to the data, removing barriers, creating centers of data exchange to accommodate distributed workflows and scaling digital business.

Network Hub


Consolidates and localizes traffic into ingress/egress points to optimize network performance and cost

Control Hub


Hosts adjacent security and IT controls to improve security posture and Hybrid-IT operations

Data Hub


Localizes data aggregation, staging, analytics, streaming and data management to optimize data exchange

SX Fabric

Adds SDN overlay to service chain multi-cloud and B2B application ecosystems

Connects hubs across metros and regions to enable secure and performant distributed workflows

4

Table of Contents

Index to Financial Statements

Capacity

Product


Description

Colocation

(0 to 1 MW)


Small (one cabinet) to medium (75 cabinets) deployments

Provides agility to quickly deploy in days

Contract length generally 2-5 years

Consistent designs, operational environment, power expenses

Scale & Hyperscale

Powered Base Building®

Turn-Key Flex®

(> 1 MW)


Scale from medium to very large deployments

Solution can be executed in weeks

Contract length generally 5-10+ years

Customized data center environment for specific deployment needs

5

Table of Contents

Index to Financial Statements

The PlatformDIGITAL® solution model is available in our colocation and Turn-Key Flex® data centers, which are move-in ready, physically secure facilities with the power and cooling capabilities to support customers requiring a single rack or cabinet up to multi-megawatt deployments. We believe our colocation and Turn-Key Flex® facilities are effective solutions for customers who may lack the bandwidth, capital budget, expertise, or desire to provide their own extensive data center infrastructure, management, and security. We believe our offerings are also well-suited for those customers who seek to efficiently exchange data with others in our connected data communities, lowering their costs and creating value for their business. For customers who possess the ability to build and operate their own facility, our Powered Base Building® solution provides the physical location, requisite power, and network access necessary to support a state-of-the-art data center.

Additionally, our data center campuses offer our customers the opportunity to expand in or near their existing deployments within our data center campuses.

Connectivity

Product


Description

Cross Connect


A physical connection between two customer defined end points in a Digital Realty facility enabling customers to directly exchange data traffic

Campus Connect


Local, dedicated connectivity solution within Digital Realty campus environments located in hyperconnected metros around the world enabling multiple facilities on a single campus to exchange data traffic and therefore operate as a virtual single data center

Metro Connect


Dedicated connection between multiple Digital Realty facilities located in the same metro area enabling fast connectivity for data traffic between them

Interxion Cloud Connect

Provides secure and high-performance VLAN interconnections to multiple cloud service providers from one physical connection

Internet Exchange


A common peering platform allowing participants to exchange network traffic with multiple ISPs, CDNs and other parties over a single port interface

Service Exchange


SDN Global interconnection solution enabling customers to establish direct, private connections to multiple Cloud Service Providers, Network Providers and other participants of the platform from a single interface

IP Bandwidth


Dedicated Internet Access using blend of ISPs. Provides customer with highly resilient customer dedicated connections including Fixed and Burstable Service options

Pathway


Point-of-entry access for carriers, terminating into the POP or Meet Me Room within a given facility

Through investments and strategic partnerships, we have significantly expanded our capabilities as a leading provider of interconnection and cloud-enablement services globally. We believe interconnection is an attractive line of business that would be difficult to build organically and enhances the overall value proposition of our data center product offerings. Furthermore, through product offerings such as our Service Exchange and Interxion Cloud Connect and partnerships with cloud service providers, we can support our customers’ hybrid cloud architecture requirements.

Our Global Customers

Our portfolio has attracted a high-quality, diversified mix of customers. We have more than 4,000 customers, and no single customer represented more than approximately 10.0% of the aggregate annualized recurring revenue of our

6

Table of Contents

Index to Financial Statements

portfolio as of December 31, 2021. We provide each customer access to a choice of highly customized solutions based on their scale, colocation, and interconnection needs.

Global Customer Base across a Wide Variety of Industry Sectors. We use our in-depth knowledge of requirements for and trends impacting cloud and information technology service providers, content providers, network and communications providers, and other data center users, including enterprise customers, to market our data centers to meet these customers’ specific technology needs. Our customers are increasingly launching multi-regional deployments and growing with us globally. Our largest customer, accounted for approximately 10.0% of our aggregate annualized recurring revenue as of December 31, 2021. No other single customer accounted for more than approximately 4.1% of the aggregate annualized recurring revenue of our portfolio. Our customers represent a variety of industry verticals, ranging from cloud and information technology services, communications and social networking to financial services, manufacturing, energy, gaming, life sciences and consumer products.

Cloud and IT Services

Digital Content Providers and
Financial Companies

Network and Mobile Services

Equinix

Facebook, Inc.

AT&T

Fortune 50 Software Company

Fortune 25 Investment Grade-Rated Company

Comcast Corporation

IBM

JPMorgan Chase & Co.

Lumen Technologies, Inc.

Oracle America, Inc.

LinkedIn

Verizon

Proven Experience Attracting and Retaining Customers. Our specialized data center salesforce, which is aligned to meet our customers’ needs for global, enterprise and network solutions, provides a robust pipeline of new customers, while existing customers continue to grow and expand their utilization of our technology-enabled services to support a greater portion of their IT needs.

Our Design and Construction Program

Our extensive development activity, operating scale and process-based approach to data center design and construction result in significant cost savings and added value for our customers. We have leveraged our purchasing power by securing global purchasing agreements and developing relationships with major equipment manufacturers, reducing costs and shortening delivery timeframes on key components, including major mechanical and electrical equipment. See "We and our customers may experience supply chain or procurement disruptions, or increased supply chain costs, which may lead to delays." in Item 1A. Risk Factors for further discussion. Utilizing our innovative modular data center design, we deliver what we believe to be a technically superior data center environment at significant cost savings. In addition, by utilizing our modular design architecture to develop new distributed redundant solutions in our existing Powered Base Building® facilities, on average we can deliver a fully commissioned standard design facility in under 30 weeks. Finally, our access to capital and investment-grade ratings allow us to provide data center solutions for customers who do not want to invest their own capital.

Our Investment Approach

We have developed detailed, standardized procedures for evaluating acquisitions and investments, including income-producing properties as well as vacant buildings and land suitable for development, to ensure that they meet our strategic, financial, technical and other criteria. These procedures, together with our in-depth knowledge of the technology, data center and real estate industries, allow us to identify strategically located properties and evaluate investment opportunities efficiently and, as appropriate, commit and close quickly. Our investment-grade ratings, along with our broad network of contacts within the data center industry, enable us to effectively capitalize on acquisition and investment opportunities.

7

Table of Contents

Index to Financial Statements

Our Management Team and Organization

Our senior management team has many years of experience in the technology and/or real estate industries, including experience as investors in and advisors to technology companies. We believe that our senior management team’s extensive knowledge of both the technology and the real estate industries provides us with a key competitive advantage. Further, a significant portion of compensation for our senior management team and directors is in the form of common equity interests in our Company. We also maintain minimum stock ownership requirements for our senior management team and directors, further aligning their interests with those of external stockholders, as well as an employee stock purchase plan, which encourages our employees to increase their ownership in the Company.

Our Business and Growth Strategies

Our primary business objectives are to maximize: (i) sustainable long-term growth in earnings and funds from operations per share and unit, (ii) cash flow and returns to our stockholders and our Operating Partnership’s unitholders through the payment of dividends and distributions and (iii) return on invested capital. We expect to accomplish these objectives by achieving superior risk-adjusted returns, prudently allocating capital, diversifying our product offerings, accelerating our global reach and scale, and driving revenue growth and operating efficiencies.

Superior Risk-Adjusted Returns. We believe that achieving appropriate risk-adjusted returns on our business, including on our development pipeline and leasing transactions, will deliver superior stockholder returns. We may continue to build out our development pipeline when justified by anticipated returns. We have established robust internal guidelines for reviewing and approving leasing transactions, which we believe will drive risk-adjusted returns. We also believe that providing an even stronger value proposition to our customers, including new and more comprehensive product offerings, as well as continuing to improve operational efficiencies, will further drive improved returns for our business.

Prudently Allocate Capital. We believe that the strategic deployment of capital at sufficiently positive spreads above our cost of capital enables us to increase cash flow and create long-term stockholder value.

Strategic and Complementary Investments. We have developed significant expertise at underwriting, financing and executing data center investment opportunities. We employ a collaborative approach to deal analysis, risk management and asset allocation, focusing on key elements, such as market fundamentals, accessibility to fiber and power, and the local regulatory environment. In addition, the specialized nature of data centers makes these investment opportunities more difficult for traditional real estate investors to underwrite, resulting in reduced competition for investments relative to other property types. We believe this dynamic creates an opportunity for us to generate attractive risk-adjusted returns on our capital.

Preserve the Flexibility of Our Balance Sheet. We are committed to maintaining a conservative capital structure. We target a debt-to-adjusted EBITDA ratio at or less than 5.5x, fixed charge coverage of greater than three times, and floating rate debt at less than 20% of total outstanding debt. In addition, we strive to maintain a well-laddered debt maturity schedule, and we seek to maximize the menu of our available sources of capital, while minimizing the related cost. Since Digital Realty Trust, Inc.’s initial public offering in 2004, we have raised approximately $53.1 billion of capital through common (excluding forward contracts), preferred and convertible preferred equity offerings, exchangeable debt offerings, non-exchangeable bond offerings, our global revolving credit facilities, our term loan facility, a senior notes shelf facility, secured mortgage financings and re-financings, joint venture partnerships and the sale of non-core assets. We endeavor to maintain financial flexibility while using our liquidity and access to capital to support operations, our acquisition, investment, leasing and development programs and global campus expansion, which are important sources of our growth.

8

Table of Contents

Index to Financial Statements

Leverage Technology to Develop Comprehensive and Diverse Products. We believe we have one of the most comprehensive suites of global data center solutions available to customers from a single provider.

Global Service Infrastructure Platform. With our recent acquisitions, which extend our footprint further across Latin America, Europe and Africa, enhanced our portfolio of scale and hyper-scale data centers in the U.S. and furthers our position as a leading provider of colocation, interconnection and cloud-enablement services globally, we are able to offer one of the industry’s broadest range of data center solutions to meet our customers’ needs, from a single rack or cabinet to multi-megawatt deployments. We believe our products like Service Exchange and our partnerships with managed services and cloud service providers further enhance the attractiveness of our data centers.

Provide Foundational Services to Enable Customers and Partners. We believe that the platform, through which we offer the foundational services of space, power and connectivity, will enable our customers and partners to serve their customers and grow their businesses. We believe our Internet gateway data centers, individual data centers and data center campuses are attractive to a wide variety of customers and partners of all sizes. Furthermore, we believe our colocation and interconnection offerings, as well as the densely connected communities of interest that have developed within our facilities, and the availability and scalability of our comprehensive suite of products are valuable and critical to our customers and partners.

Accelerate Global Reach and Scale. We have strategically pursued international expansion since our IPO in 2004 and now operate across six continents. We believe that our global multi-product data center portfolio is a foundational element of our strategy and our scale and global platform represent key competitive advantages difficult to replicate. Customers and competitors are recognizing the value of interconnected scale, which aligns with our connected campus strategy that enables customers to “land and expand” with us. We expect to continue to source and execute strategic and complementary transactions to strengthen our data center portfolio, expand our global footprint and product mix, and enhance our scale.

Drive Revenue Growth and Operating Efficiencies. We aggressively manage our properties to maximize cash flow and control costs by leveraging our scale to drive operating efficiencies.

Leverage Strong Industry Relationships. Our global market leadership position and strong industry relationships provide us with a unique vantage point to detect and capitalize on secular trends as they emerge globally. We focus our industry relationship efforts towards market sensing, market shaping and helping to set open standards that benefit companies of all types to derive value from digital infrastructure and multi-tenant datacenters. Industry collaboration includes engagements with industry associations, IT industry analysts, venture capitalists, technology incubators, technology service providers, telecommunications providers, systems integrators and large multi-national companies across segments including manufacturing, transportation & logistics, financial services, healthcare, pharmaceutical and digital media. These relationships help us forge new product capabilities, inform investment decisions, develop new routes to market and create differentiated value for customers and drive long-term growth and yield for shareholders.

Maximize Cash Flow. We often acquire operating properties with substantial in-place cash flow and some vacancy, which enables us to create upside through lease-up. We control our costs by negotiating expense pass-through provisions in customer agreements for operating expenses, including power costs and certain capital expenditure. We have also focused on centralizing functions and optimizing operations as well as improving processes and technologies. We believe that expanding our global data center campuses will also contribute to operating efficiencies because we expect to achieve economies of scale on our campus environments.

9

Table of Contents

Index to Financial Statements

Sustainability. We believe that addressing sustainability by driving environmental efficiency through the implementation of cost-effective design features and the use of carbon-free and renewable energy serves as a key differentiator enabling us to deliver products that help attract and retain customers, generate cash flow, and manage operational risks. In 2021, for the fifth consecutive year, we received the Nareit “Leader in the Light” award for data centers, recognizing our sustainability and energy-efficiency achievements. In 2021, we allocated €1.83 billion in net proceeds from our green bonds and issued two additional green bonds (€1.0 billion and CHF545 million) to allocate to green buildings, energy efficiency improvements, and renewable energy.

The Real Estate Sustainability Accounting Standard guidance, issued by the Sustainability Accounting Standards Board (“SASB”), outlines proposed disclosure topics and accounting metrics for the real estate industry. We provide data on energy and water management metrics that we believe best correlate with our business and industry as indicated in the following sections. Energy and water data receive third party assurance as part of our annual environmental, social, and governance (“ESG”) report development process.

Energy Management

a) 2020 Energy Data(1)

a

Energy Consumption Data Coverage as % of Floor Area

Total Energy Consumed by Portfolio Area with Data Coverage (MWh)(2)

Grid electricity consumption as a % of Energy Consumption

Renewable Energy as a % of Energy Consumption(3)

Like-for-Like Change in Energy Consumption for Portfolio Area with Data Coverage(4)

87%

8,443,670

97%

38%

1%

(1)The most recent full year for which energy data is available is 2020. The scope of data coverage includes managed and non-managed assets. In 2020, 99% of the Company’s portfolio consisted of data center space along with limited accessory uses, predominantly office space. These secondary space types are not broken out by subsector.
(2)The scope of energy includes energy purchased from sources external to the Company and its customers; energy produced by the Company and its customers (i.e., self-generated); and energy from all other sources, including direct fuel usage, purchased electricity, and purchased chilled water.
(3)Provided as a percent of energy consumption for managed assets. Excludes renewable energy delivered as part of the standard utility fuel mix. Includes above-baseline utility renewables (e.g., green tariffs), Renewable Energy Credit (“REC”) and Guaranty-of-Origin (“GO”) purchases, customer-sourced renewable energy and RECs generated by the Company.
(4)Scope of data is aligned with the 2020 GRESB Real Estate Assessment Reference Guide (“Like-for-like Comparison”).

b) Sustainable Data Center Ratings

We seek to certify major new construction and redevelopment projects under US Green Building Council LEED Silver rating or comparable certification. Our data center space receiving third-party sustainable ratings in 2021 totaled approximately 1.0 million square feet. We received the following sustainable data center ratings for all, or a portion of, the following sites:

Data Center

Metropolitan Area

Rating System

Level Achieved

22125 Broderick Dr

Ashburn

LEED (1)

Silver

6675 NE 62nd St

Hillsboro

LEED

Silver

11 Hanbury St (LON3)

London

BREEAM (2)

Excellent

11 Hanbury St (LON3)

London

BREEAM 

Excellent

(1)LEEDTM: Leadership in Energy and Environmental Design
(2)BREEAM: Building Research Establishment Environmental Assessment Method

For existing buildings, we seek to benchmark 100% of properties in ENERGY STAR Portfolio Manager and pursue EPA ENERGY STAR certification for eligible U.S. properties. In 2021, we achieved ENERGY STAR for Data Centers recognition for 34 data centers, representing 44% of our U.S. stabilized and managed data center portfolio by square

10

Table of Contents

Index to Financial Statements

feet. In total, 35% of our total global stabilized and managed portfolio by square feet had an energy rating as of December 31, 2021.(1)

(1)Excludes non-stabilized assets, Powered Base Building space, space under active development, space held for development, non-managed assets, and space held in unconsolidated entities.

c) Energy management considerations

Energy and resource management considerations are integrated into our business decisions and strategy. For our operating portfolio, annual capital expense investment planning identifies and evaluates resource efficiency project opportunities alongside non-resource-impacting capital investments. For acquisitions and new development activity, resiliency risks, resource availability, and renewable energy access are considered. Our design and construction process is intended to incorporate sustainable features that support resource efficiency during construction as well as during the operational lifecycle of the sites.

We seek to proactively identify and support opportunities to efficiently utilize resources, such as energy and water, throughout our operating portfolio. We have a target to reduce global colocation power usage effectiveness (PUE) 10% by 2022 from a 2017 baseline and we surpassed this goal in 2020 by achieving an 11% reduction. We also had a target to reduce PUE for our Interxion portfolio 5% by 2020 from a 2017 baseline and we surpassed this goal by achieving a 6% reduction in 2020. These goals reflect targets established prior to the Digital Realty and Interxion combination. 24 of our data centers in EMEA participate in the European Union’s Code of Conduct for Energy Efficiency in Data Centers, a voluntary initiative which addresses airflow management, cooling system efficiency and capital plant replacement.

Globally, we conduct external technical building assessments as well as utilize ENERGY STAR Portfolio Manager scores to prioritize efficiency opportunities. Energy efficiency measures implemented typically involve HVAC and lighting-related improvements and building commissioning. In 2020, energy efficiency measures implemented totaled over 21,800 MWh in projected energy savings.

We set a global carbon reduction target that has been validated by the Science-Based Target Initiative (SBTi) to reduce our Scope 1 and 2 emissions 68% per square foot and Scope 3 emissions from purchased goods and services and fuel- and energy-related activities 24% per square foot by 2030, from a 2018 baseline. Additionally, we are a signatory to the EU Climate Neutral Data Centre Pact, a Self-Regulatory Initiative committing to climate neutrality by 2030 and setting additional goals around energy efficiency, carbon-free energy sourcing, water conservation and waste heat recycling. We continue to match 100% of our European portfolio and US colocation business unit with renewable energy. Our US renewable energy purchase agreements produced 1.01 million MWh of renewable energy credits in 2020.

We implement ISO 14001 (Environmental Management) and ISO 50001 (Energy Management) to measure, manage and improve the energy and environmental performance of our data centers. In 2020, 46% of our global portfolio had ISO 14001 certifications and 28% of our global portfolio was covered under ISO 50001. Additionally, 100% of our Singapore portfolio was certified under the SS564 Green Data Centres standard for Energy and Environmental Management Systems.

Water Management

a) 2020 Water Data (1)

Water Withdrawal Data Coverage as % of Floor Area

% of Floor Area with 40% or Greater Baseline Water Stress (2)

Total Water Withdrawn by Portfolio Area with Data Coverage (cubic meters, in thousands) (3)

% of Water Withdrawn with 40% or Greater Baseline Water Stress (2)

Like-for-Like Change in Water Withdrawals (4)

80%

32%

5,385

50%

-6%

11

Table of Contents

Index to Financial Statements

(1)The most recent full year for which water data is available is 2020. The scope of data coverage involves managed and non-managed assets. The scope of water withdrawals is aligned with the 2020 GRESB Real Estate Assessment Reference Guide. In 2020, 99% of the Company’s portfolio consisted of data center space along with limited accessory uses, predominantly office. These secondary space types are not broken out by subsector.
(2)Based on properties classified as High or Extremely High Baseline Water Stress determined by the World Resources Institute’s (WRI) Water Risk Atlas tool, Aqueduct. Includes properties that have complete water withdrawal data coverage.
(3)The scope of water consumed includes potable water and non-potable water purchased from third-party suppliers and water reused.
(4)Scope of data is aligned with the 2020 GRESB Real Estate Assessment Reference Guide (“Like-for-like Comparison”).

b) Water Management Risks and Mitigation Strategies

Some of our assets are in regions of high or extremely high baseline water stress and may face future risk of water scarcity, higher water costs, and regulatory constraints on water consumption. We consider water availability, cost, and alternate supply solutions to potable water such as municipally supplied non-potable reclaimed water, which accounted for 43% of our total water usage in 2020. We also consider cooling system designs to maximize ‘free cooling’ and reduce or eliminate reliance on access to water for cooling. Our Global Water Strategy addresses the strategic role that water plays in our operations, identifies regions where water quality and scarcity pose the greatest interruption risk to our business, and creates a pipeline of projects and opportunities to advance our position with respect to water conservation, resiliency, and redundancy in our operations.

Management of Tenant Sustainability Impacts

a) 2020 Tenant Sustainability

% of New Leases with Cost Recovery Clause for Efficiency Improvements (1)

Leased Floor Area of New Leases with Cost Recovery Clause (Square Feet)

% of Total Leased Floor Area with Cost Recovery Clauses (2)

% of Leased Floor Area that is Separately Metered for Electricity Consumption (3)

25%

6,394

41%

84%

(1)Data provided for new data center scale leases signed and excludes colocation and Powered Base Building agreements.
(2)Total leased floor area excludes non-managed unconsolidated entities, vacant space, space held for development, space under active development, Powered Base Building, colocation, and non-technical space.
(3)Excludes unconsolidated entities, vacant space, space held for development, space under active development, and non-technical space. Water use is predominantly driven by shared cooling infrastructure, common areas, and exterior landscape irrigation and is not separately metered.

b) Approach to measuring, incentivizing and improving sustainability impacts of tenants

We seek to incorporate “green lease” language into agreements with new customers where energy is separately metered, and we endeavor to incorporate green lease language into renewals. We launched our green lease program for applicable contract types to better align interests between landlord and tenants to incentivize energy and resource efficiency investments, share energy and water usage data, streamline renewable energy procurement and support sustainable building certifications.

Climate Change Adaptation

a) Properties located in 100-Year Flood Zones

Eight U.S. data centers totaling about 2.08 million square feet are exposed to 100-year flood zones designated by the U.S. Federal Emergency Management Agency (“FEMA”) as special flood hazard areas (“SFHA”). No other non-U.S. sites are in 100-year flood zones or similar high hazard locations.

12

Table of Contents

Index to Financial Statements

b) Climate Change Risks and Mitigation Strategies

We evaluate potential risks and opportunities as a result of climate change and have implemented strategies to mitigate risks and capitalize on opportunities. Climate change risks that we have identified include acute and chronic physical risks, as well as transition risks such as market, policy, reputational, and technology risks. Management of climate-related risks and opportunities is a company-wide priority, delivered through an interdisciplinary effort with contributions from our global operations team, risk management, environmental occupational health and safety, compliance, information security, physical security and other functions, with oversight by our Executive Leadership Team and governed by our Board of Directors. We manage potential risks first via our siting and design standards, then by implementing recommendations to proactively mitigate losses related to short-term acute weather events as well as long-term climate-related events. Climate resilience measures include maintaining appropriate levels of insurance for each asset, performing climate risk scenario analyses for a sample selection of our global portfolio, and implementing operational risk reduction measures at the site level. We continue to align our ESG Report with the recommendations of the Financial Stability Board’s Task Force on Climate-related Financial Disclosures (“TCFD”) to disclose specific climate-related financial risks and opportunities, mitigation strategies, and associated metrics and targets.

Competition

We compete with numerous data center providers globally, many of whom own or operate properties similar to ours in some of the same metropolitan areas where our data centers are located, including Equinix, Inc. and NTT; Switch, Inc. and various private operators in the U.S.; as well as Global Switch Holdings Limited and various regional operators in Europe, Asia, Latin America and Australia. See "We face significant competition, which may adversely affect the occupancy and rental rates of our data centers." in Item 1A. Risk Factors.

Regulation

General

Our properties are subject to various laws, ordinances and regulations, including regulations relating to common areas. We believe each of our properties as of December 31, 2021 has the necessary permits and approvals to operate.

Americans with Disabilities Act

Our properties must comply with Title III of the Americans with Disabilities Act of 1990, or the ADA, to the extent that such properties are “public accommodations” as defined by the ADA. We believe our properties are in substantial compliance with the ADA and that we will not be required to make substantial capital expenditures to address the requirements of the ADA. However, non-compliance with the ADA could result in imposition of fines or an award of damages to private litigants. The obligation to make accommodations in accordance with the ADA, as well as other applicable laws and regulations is an ongoing one, and we will continue to assess our properties and make alterations as appropriate in this respect. See “We may incur significant costs complying with applicable laws and governmental regulations, including the Americans with Disabilities Act.” in Item 1A. Risk Factors.

Environmental Matters

We are exposed to various environmental risks that may result in unanticipated losses and could affect our operating results and financial condition. Either the previous owners or we have conducted environmental reviews on a majority of the properties we have acquired, including land. While some of these assessments have led to further investigation and sampling, none of the environmental assessments have revealed an environmental liability that we believe would have a material adverse effect on our business, financial condition or results of operations. See "We could incur significant costs related to environmental matters, including from government regulation, private litigation, and existing conditions at some of our properties." in Item 1A. Risk Factors for further discussion.

13

Table of Contents

Index to Financial Statements

Climate change legislation. In June 2009, the U.S. House of Representatives approved comprehensive clean energy and climate change legislation intended to cut greenhouse gas, or GHG, emissions, via a cap-and-trade program. The U.S. Senate did not subsequently pass similar legislation.

In the absence of comprehensive federal climate change legislation, regulatory agencies, including the U.S. Environmental Protection Agency, or EPA, and states have taken the lead in regulating GHG emissions in the U.S. Under the Obama administration, from 2009 through 2016, the EPA moved aggressively to regulate GHG emissions from automobiles and large stationary sources, including electricity producers, using its authority under the Clean Air Act. From 2017 through 2020, the Trump administration moved to eliminate or modify certain of the EPA’s GHG emissions regulations and refocus the EPA’s mission away from such regulation. However, the Biden administration has described climate change regulation as a top priority, announcing in April 2021 a target of reducing net U.S. GHG emissions by 50-52 percent from 2005 levels by 2030.

The EPA made an endangerment finding in 2009 that allows it to create regulations imposing emissions reporting, permitting, control technology installation, and monitoring requirements applicable to certain emitters of GHGs, including facilities that provide electricity to our data centers, although the materiality of the impacts will not be fully known until all regulations are finalized and legal challenges are resolved. Under the Obama administration, the EPA finalized rules imposing permitting and control technology requirements upon certain newly-constructed or modified facilities which emit GHGs under the Clean Air Act New Source Review Prevention of Significant Deterioration, or NSR PSD, and Title V permitting programs. As a result, newly-issued NSR PSD and Title V permits for new or modified electricity generating units (EGUs) and other facilities may need to address GHG emissions, including by requiring the installation of “Best Available Control Technology.” The EPA also implemented in December 2015 the “Clean Power Plan” regulating carbon dioxide (CO2) emissions from coal-fired and natural gas EGUs. However, in June 2019 the EPA repealed the Clean Power Plan and issued the “Affordable Clean Energy Rule” to replace the Clean Power Plan. The Affordable Clean Energy Rule requires heat rate efficiency improvements at certain EGUs, but does not place numeric limits on EGU emissions. In January 2021, the U.S. Court of Appeals for the District of Columbia Circuit vacated both the Affordable Clean Energy Rule and the Clean Power Plan repeal rule, and the U.S. Supreme Court agreed to hear an appeal of this ruling. In fall 2021, the EPA announced plans to propose in summer 2022 a new rule regulating GHG emissions from existing power plants. Separately, the EPA’s GHG “reporting rule” requires that certain emitters, including electricity generators, monitor and report GHG emissions.

As a result of the former Trump administration policies, states have been driving regulation to reduce GHG emissions in the United States. At the state level, California implemented a GHG cap-and-trade program that began imposing compliance obligations on industrial sectors, including electricity generators and importers, in January 2013. In September 2016, California adopted legislation calling for a further reduction in GHG emissions to 40% below 1990 levels by 2030, and in July 2017, California extended its cap-and-trade program through 2030. In September 2018, California adopted legislation that will require all of the state’s electricity to come from carbon-free sources by 2045. As other examples of state action, in May 2021, Washington passed a law capping GHG emissions from electricity generators and other entities, and in December 2021 Oregon adopted a GHG cap-and-trade program. Additionally, a number of states have adopted Renewable Portfolio Standards to increase the use of renewable energy, and a number of eastern states participate in the Regional Greenhouse Gas Initiative (RGGI), a market-based program aimed at reducing GHG emissions from power plants.

Outside the United States, the European Union, or EU (as well as the United Kingdom), have been operating since 2005 under a cap-and-trade program, which directly affects the largest emitters of GHGs, including electricity producers from whom we purchase power, and the EU has taken a number of other climate change-related initiatives, including a directive targeted at improving energy efficiency (which introduces energy efficiency auditing requirements). In December 2019, EU leaders endorsed the objective of achieving by 2050 a climate-neutral EU, with net-zero GHG emissions, and in July 2021 the European Commission adopted the European Climate Law to write this goal into the law. The European Climate Law includes a 2030 GHG reduction target of at least 55% below 1990 levels. In July 2021 the European Commission also adopted a Carbon Border Adjustment Mechanism to institute a carbon import tax, which covers electricity imports. National legislation may also be implemented independently by members of the EU. It is not

14

Table of Contents

Index to Financial Statements

yet clear how Brexit will impact the United Kingdom’s approach to climate change regulation; the United Kingdom adopted a target of net-zero GHG emissions by 2050.

The Paris Agreement, which was adopted by the United States and 194 other countries and looks to prevent global average temperatures from increasing by more than 2 degrees Celsius above preindustrial levels, went into force in November 2016. President Trump announced in June 2017 that he would initiate the process to withdraw the United States from the Paris Agreement; however, upon his inauguration in January 2021, President Biden signed an order rejoining the Paris Agreement.

The Canadian Greenhouse Gas Pollution Pricing Act established a carbon-pricing regime that went into effect in January 2019 for provinces and territories in Canada where there is no provincial system in place already, or where the provincial system does not meet the federal benchmark. The act was challenged in court and upheld by the Supreme Court of Canada in March 2021. Climate change regulations are also in various stages of implementation in other nations as well, including nations where we operate, such as Japan, Singapore, and Australia.

Insurance

We carry commercial general liability, property, and business interruption insurance, including rental income loss coverage on all of the properties in our portfolio under a blanket program. We select policy specifications and insured limits which we believe to be appropriate given the relative risk of loss, the cost of coverage, and industry practice. We believe the properties in our portfolio are adequately insured. We do not carry insurance for generally uninsured exposures such as loss from war or nuclear reaction. In addition, we carry earthquake insurance on our properties in an amount and with deductibles we believe are commercially reasonable. We intend to partially fund the earthquake insurance deductibles through a captive insurance company we established. Certain of the properties in our portfolio are located in areas known to be seismically active. See “Potential losses may not be covered by insurance.” in Item 1A. Risk Factors.

Human Capital Resource Management

As of December 31, 2021, we had 3,030 full-time employees. The geographic distribution of our global employee base as of December 31, 2021 is summarized in the following table.

Region


Number of Employees

North America


1,393

Europe


1,481

Asia Pacific


156

Total


3,030

Compensation, Benefits and Employee Wellbeing

To attract and retain the best-qualified talent and to help our employees maintain healthy and balanced lives, and meet their financial and retirement goals, we offer competitive benefits, including market-competitive compensation, healthcare, flexible vacation, parental leave, 401(k) company match, an employee stock purchase plan, fitness reimbursement program, commuter benefits, tuition reimbursement, employee skills development and leadership development. Employee surveys are conducted regularly to solicit feedback and to help prioritize and improve employee engagement.

We also encourage our employees to give back to the community by matching their contributions to eligible charitable organizations through our Matching Gifts Program. Additionally, our Donate 8 Program grants paid time off each year to employees for the purpose of volunteering for eligible organizations. We also sponsor and support the Women’s Leadership Forum, the Black Employee Resource Group, Digital Pride, the Hispanic Employee Resource Group, and the Veterans Employee Group, which promote a diverse and inclusive network to grow and deliver the next wave of digital innovation.

15

Table of Contents

Index to Financial Statements

We prioritize providing programs and benefits that promote healthy and productive lifestyles. We offer a company-wide wellness program, Wellness@Digital, that serves to invest in the health, fitness, financial wellness and overall quality of life for our employees. We implement wellness challenges that promote physical activity and an active lifestyle, with additional price incentivizes for winners of the challenges.

During 2021, we sought to play an active role in supporting the communities we operate in across North America, EMEA and APAC. This included companywide giving focused on our four areas of philanthropic focus (disaster relief, STEM, sustainability and diversity, equity and inclusion).

Diversity, Equity and Inclusion

It is our Company’s policy to recruit talent based on skill, knowledge, attitude and experience, without discrimination on the basis of gender, sexual orientation, age, family status, ethnic origin, nationality, disability or religious belief. In 2020, we formally launched our DEI Employee Leadership Council to assess the current state of our diversity, equity and inclusion (“DEI”) initiatives beyond the Women’s Leadership Forum and Veteran’s employee resource groups. The Council identifies future opportunities for progress, formulates a cohesive strategy, and ultimately leads our global DEI effort. The DEI Council is led by employees spanning various management levels and global regions with program support from our executive management team. Since 2020, the Company has launched three new employee resource groups (ERGs)—Digital Pride (LGBTQI+), the Black ERG, and the Hispanic ERG. Today, more than 500 employees globally are members of Digital Realty’s ERGs.

Digital Realty’s DEI focus and work is set with the “tone from the top” from Chief Executive Officer A. William Stein. He has signed the CEO Action Pledge for Diversity & Inclusion, the largest CEO-driven business commitment to advance diversity and inclusion in the workplace. Mr. Stein is Co-Chair of Nareit’s Dividends through Diversity, Equity & Inclusion CEO Council, seeking to advance diversity and inclusion throughout our industry. In 2021, we published our EEO-1 report, providing transparency on the racial and gender composition of our U.S. workforce. We disclose our DEI strategy and initiatives annually in our ESG Report.

COVID-19 Health and Safety

As a result of the COVID-19 pandemic, we have maintained a number of health and safety measures to enable our operations teams to continue to work from our data centers and construction sites. We require social distancing in accordance with the World Health Organization and Centers for Disease Control and Prevention and local health agency guidelines, have made modifications to our facilities, including posting signage detailing health and safety protocols, engage in regular sanitation, and require all visitors and employees to wear facial coverings. We have also modified staffing levels to avoid potential cross contamination among teams, and have instituted customer, employee and visitor screening. Together with our operations teams, we have implemented innovative approaches to maintain our high standards of customer service, including virtual data center tours to ensure that activities typically accomplished on-site or in-person continued throughout periods of reduced travel. Our non-essential and corporate personnel adopted a work-from-home approach beginning in March 2020, which has continued without significant impacts to productivity. In January 2022, we began to reopen various offices allowing corporate employees to create hybrid work schedules. Refer to the discussion in Item 7. Management’s Discussion and Analysis for further information related to the impact of the pandemic on our business.

Available Information

All reports we file with the SEC are available free of charge via EDGAR through the SEC website at www.sec.gov. We will also provide copies of our Forms 8-K, Forms 10-K, Forms 10-Q, Proxy Statements and amendments to those documents at no charge to investors upon request and make electronic copies of such reports available through our website at www.digitalrealty.com as soon as reasonably practicable after filing such material with the SEC. The information found on, or otherwise accessible through, our website is not incorporated by reference into, nor does it form a part of, this report or any other document that we file with the SEC.

16

Table of Contents

Index to Financial Statements

Offices

Our headquarters are located in Austin, Texas. We have regional U.S. offices in Boston, Chicago, Dallas, Los Angeles, New York, Northern Virginia, Phoenix and San Francisco and regional international offices in Amsterdam, Dublin, London, Singapore, Sydney, Tokyo and Hong Kong.

Reports to Security Holders

Digital Realty Trust, Inc. is required to send an annual report to its securityholders and to our Operating Partnership’s unitholders.

ITEM 1A.      RISK FACTORS

For purposes of this section, the term “stockholders” means the holders of shares of Digital Realty Trust, Inc.’s common stock and preferred stock. Set forth below are the risks that we believe are material to Digital Realty Trust, Inc.’s stockholders and Digital Realty Trust, L.P.’s unitholders. You should carefully consider the following factors in evaluating our Company, our properties and our business. The occurrence of any of the following risks might cause Digital Realty Trust, Inc.’s stockholders and Digital Realty Trust, L.P.’s unitholders to lose all or a part of their investment. Some statements in this report, including statements in the following risk factors, constitute forward-looking statements. Please refer to the section entitled “Forward-Looking Statements” starting on page 45.

Overview

Our business, operations and financial results are subject to various risks and uncertainties, including those described below, that could adversely affect our business, financial condition, results of operations, cash flows, and the trading price of our common stock and preferred stock. The following material factors, among others, could cause our actual results to differ materially from historical results and those expressed in forward-looking statements made by us or on our behalf in filings with the SEC, press releases, communications with investors and oral statements. The risks that we describe in our public filings are not the only risks that we face. Additional risks and uncertainties not presently known to us, or that we currently consider immaterial, also may materially adversely affect our business, financial condition, and results of operations.

Risk Factors Summary

The following is a summary of the principal risks that could adversely affect our business, operations and financial results.

Risk Related to Our Business and Operations

Our business and operations, and our customers, suppliers and business partners may be adversely affected by epidemics, pandemics or other outbreaks.
Our business depends upon the demand for data centers.
We face significant competition, which may adversely affect the occupancy and rental rates of our data centers.
Any failure of our physical or information technology or operational technology infrastructure or services could lead to significant costs and disruptions.
We may be vulnerable to breaches, or unauthorized access to, or disruption of our physical and information technology and operational technology infrastructure and systems.
We depend on significant customers, and many of our data centers are single-tenant properties or are currently occupied by single tenants.
Failure to attract, grow and retain a diverse and balanced customer base, including key magnet customers, could harm our business and operating results.
Our contracts with our customers could subject us to significant liability.
Certain of our customer agreements may include restrictions on the sale of our properties to certain third parties, which could have a material adverse effect on us.

17

Table of Contents

Index to Financial Statements

Our data centers may not be suitable for re-leasing without significant expenditures or renovations.
We may be unable to lease vacant or development space, renew leases, or re-lease space as leases expire.
Even if we have additional space available for lease at any one of our data centers, our ability to lease this space to existing or new customers could be constrained by our ability to provide sufficient electrical power.
Our portfolio depends upon local economic conditions and is geographically concentrated in certain locations.
We and our customers may experience supply chain or procurement disruptions, or increased supply chain costs, which may lead to delays.
We lease or sublease certain of our data center space from third parties and the ability to retain these leases or subleases could be a significant risk to our ongoing operations.
We may not be able to adapt to changing technologies and customer requirements, and our data center infrastructure may become obsolete.
We depend upon third-party suppliers for power, and we are vulnerable to service failures and to price increases by such suppliers and to volatility in the supply and price of power in the open market.
We depend on third parties to provide network connectivity to the customers in our data centers and any delays or disruptions in connectivity may materially adversely affect our operating results and cash flow.
Our international activities, including acquisition, ownership and operation of data centers located outside of the United States, subject us to risks different than those we face in the United States and we may not be able to effectively manage our international business.
The United Kingdom’s withdrawal from the European Union may have a negative effect on global economic conditions, financial markets and our business.
Our recent acquisitions may not achieve the intended benefits or may disrupt our plans and operations.
We may be subject to unknown or contingent liabilities related to our recent acquisitions, for which we may have no or limited recourse against the sellers.
We may be unable to identify, including sourcing off-market deal flow, and complete acquisitions on favorable terms or at all.
Joint venture (JV) investments could be adversely affected by our lack of sole decision-making authority, our reliance on our JV partners’ financial condition and disputes between us and our JV partners.
Brazilian political and economic conditions could adversely affect our investment in the Ascenty joint venture.
Any delays or unexpected costs in the development of our existing space and developable land and new properties acquired for development may delay and harm our growth prospects, future operating results and financial condition.
Discontinuation, reform or replacement of the London Interbank Offered Rate (LIBOR) and other benchmark rates, or uncertainty related to the potential for any of the foregoing, may adversely affect our business.
We have substantial debt and face risks associated with the use of debt to fund our business activities, including refinancing and interest rate risks.
Our growth depends on external sources of capital which are outside of our control.
Declining real estate valuations, impairment charges and illiquidity of real estate investments could adversely affect our earnings and financial condition.
Our success depends on key personnel whose continued service is not guaranteed.
We may have difficulty managing our growth.
Potential losses may not be covered by insurance.
We could incur significant costs related to environmental matters, including from government regulation, private litigation, and existing conditions at some of our properties.
Our properties may contain or develop harmful mold or suffer from other air quality issues, which could lead to liability for adverse health effects and costs to remedy the problem.
We may incur significant costs complying with applicable laws and governmental regulations, including the Americans with Disabilities Act.
Our business could be adversely impacted if there are deficiencies in our disclosure controls and procedures or internal control over financial reporting.

Risks Related to the Organizational Structure

18

Table of Contents

Index to Financial Statements

Digital Realty Trust, Inc.’s duty to its stockholders may conflict with the interests of Digital Realty Trust, L.P.’s unitholders.
Digital Realty Trust, Inc.’s charter, Digital Realty Trust, L.P.’s partnership agreement and Maryland law contain provisions that may delay, defer or prevent a change of control transaction.
Digital Realty Trust, Inc.’s rights and the rights of its stockholders to take action against its directors and officers are limited.

Risks Related to Taxes and Digital Realty Trust, Inc.’s Status as a REIT

Failure to qualify as a REIT would have significant adverse consequences to Digital Realty Trust, Inc. and its stockholders and to Digital Realty Trust, L.P. and its unitholders.
In certain circumstances, Digital Realty Trust, Inc. may be subject to federal and state taxes as a REIT, which would reduce its cash available for distribution to its stockholders.
To maintain Digital Realty Trust, Inc.’s REIT status, we may be forced to borrow funds during unfavorable market conditions.
Dividends payable by REITs do not qualify for the reduced tax rates available for some dividends.
The tax imposed on REITs engaging in “prohibited transactions” may limit our ability to engage in transactions which would be treated as sales for federal income tax purposes.
Complying with REIT requirements may cause us to forgo otherwise attractive opportunities or liquidate otherwise attractive investments.
The power of Digital Realty Trust, Inc.’s Board of Directors to revoke Digital Realty Trust, Inc.’s REIT election without stockholder approval may cause adverse consequences to Digital Realty Trust, Inc.’s stockholders and Digital Realty Trust, L.P.’s unitholders.
If Digital Realty Trust L.P. were to fail to qualify as a partnership for federal income tax purposes, Digital Realty Trust, Inc. would fail to qualify as a REIT and suffer other adverse consequences.
Changes in U.S. or foreign tax laws and regulations, including changes to tax rates, legislation and other actions may adversely affect our results of operations, our stockholders, Digital Realty Trust, L.P.’s unitholders and us.
Tax liabilities and attributes inherited in connection with acquisitions may adversely impact our business.

Risks Related to Our Business and Operations

Our business and operations, and our customers, suppliers and business partners may be adversely affected by epidemics, pandemics or other outbreaks.

Epidemics, pandemics or other outbreaks of an illness, disease or virus that affect countries or regions in which we or our customers, suppliers or business partners operate, and actions taken to contain or prevent their further spread, may have a material and adverse impact on general commercial activity and on our financial condition, results of operations, liquidity and creditworthiness. Epidemics, pandemics or other outbreaks of an illness, disease or virus could result in significant governmental measures being implemented to control the spread of such illness, disease or virus, including quarantines, travel restrictions, manufacturing restrictions, declarations of states of emergency, business shutdowns, prioritization and allocation of resources, and restrictions on the movement of our employees and those of our customers, suppliers and business partners on which we rely, which could adversely affect our ability and their respective abilities to adequately manage our respective businesses. Risks related to epidemics, pandemics or other outbreaks of an illness, disease or virus could also lead to the complete or partial closure of one or more of our offices or properties or our customers’, suppliers’ or business partners’ businesses, or otherwise result in significant disruptions to our business and operations or theirs. Such events could materially and adversely impact our operations and the rental revenue we generate from our agreements with our customers or could result in defaults by our customers.

As with COVID-19, we may institute policies requiring employees to work remotely in certain cases and such policies may remain in place for an indeterminate amount of time or may be made mandatory by relevant government authorities. There can be no assurance that remote working arrangements will be as effective as an office environment. Moreover, pandemics or outbreaks of an illness, disease or virus could disrupt our supply chain and development activities, which could impact our ability to meet delivery timelines, including delivery timelines to our customers, and lead to delays, potential penalties that we may be required to pay and potential terminations of agreements by our customers. If any such delay or disruption were to occur, it could have a material adverse effect on our liquidity and financial condition. In

19

Table of Contents

Index to Financial Statements

addition, risks related to epidemics, pandemics or other outbreaks of an illness, disease or virus may adversely affect the economies in impacted countries, including in locations where we operate, and the global financial markets, including the global debt and equity capital markets, may experience significant volatility, potentially leading to an economic downturn that could adversely affect our and our customers’, suppliers’ and business partners’ respective businesses, financial condition, liquidity, results of operations and prospects. We have in the past and expect in the future to rely on the availability of debt and equity capital to grow our business; however, there can be no assurance that such capital will be available to us going forward on acceptable terms or at all. The ultimate extent of the impact of any epidemic, pandemic or other outbreak of an illness, disease or virus on our business, financial condition, liquidity, results of operations and prospects will depend on future developments, which are highly uncertain and cannot be predicted, including new information that may emerge concerning the severity of such epidemics, pandemics or other outbreaks of an illness, disease or virus and actions taken to contain or prevent their further spread, among others. These and other potential impacts of epidemics, pandemics or other outbreaks of an illness, disease or virus could therefore materially and adversely affect our business, financial condition, liquidity, results of operations and prospects.

In particular, the global spread of COVID-19 and the various attempts to contain it have created significant volatility, uncertainty and economic disruption. The global impact of the outbreak has been rapidly evolving and federal and local governments, including in locations where we operate, have responded by instituting quarantines, restrictions on travel, restrictions on the types of business that may continue to operate, and restrictions on various construction projects. In response to government mandates, health care advisories and otherwise responding to employee and vendor concerns, we have altered certain aspects of our operations. Our workforce, excluding our critical data center employees, is working from home, which may impact their productivity. We have also experienced delays in construction activity in a few of our markets due to government restrictions in specific locations and as a result of availability of labor and these delays are impacting some of our anticipated deliveries to our customers. We may continue to experience delays in construction activity, even after these restrictions are eased or lifted, due to increased safety protocols implemented in response to the COVID-19 pandemic.

In addition, we cannot predict the impact that COVID-19 will have on our customers, suppliers and other business partners; however, any material effect on these parties could adversely impact us. While we did not have any material adjustments to amounts as of and during the year ended December 31, 2021, circumstances related to the COVID-19 pandemic could potentially result in recording impairments, lease modifications and credit losses in future periods.

While we did not experience significant disruptions from the COVID-19 pandemic during the year ended December 31, 2021 nor as of the date of this report, we cannot predict what impact the COVID-19 pandemic may have on our future financial condition, results of operations and cash flows due to numerous uncertainties. The full extent to which the COVID-19 pandemic and the various responses to it impacts our business, operations and financial results will depend on numerous evolving factors that we may not be able to accurately predict, including: the duration and scope of the pandemic; governmental, business and individuals’ actions that have been and continue to be taken in response to the pandemic; the availability of and cost to access the capital markets; the effect on our customers and customer demand for and ability to pay for our services; the impact on our development projects; and disruptions or restrictions on our employees’ ability to work and travel. Furthermore, we cannot predict whether additional restrictions will be implemented or how long they will be in effect. Although some governments have begun to ease or lift these restrictions, the impacts from the severe disruptions caused by the effective shutdown of large segments of the global economy remain unknown.

Our business depends upon the demand for data centers.

We are in the business of owning, acquiring, developing and operating data centers. A reduction in the demand for data center space, power or connectivity would have a greater adverse effect on our business and financial condition than if we owned a portfolio with a less specialized use. Our substantial development activities make us particularly susceptible to general economic slowdowns as well as adverse developments in the data center, Internet and data communications and broader technology industries. Any such slowdown or adverse development could lead to reduced corporate IT spending or reduced demand for data center space. Reduced demand could also result from business relocations, including to metropolitan areas that we do not currently serve. Changes in industry practice or in technology could also reduce demand for the physical data center space we provide. In addition, our customers may choose to develop new data centers or expand their own existing data centers or consolidate into data centers that we do not own or operate, which could reduce demand for our newly developed data centers or result in the loss of one or more key customers. If

20

Table of Contents

Index to Financial Statements

any of our key customers were to do so, it could result in a loss of business to us or put pressure on our pricing. Mergers or consolidations of technology companies could reduce further the number of our customers and potential customers and make us more dependent on a more limited number of customers. If our customers merge with or are acquired by other entities that are not our customers, they may discontinue or reduce the use of our data centers in the future. Our financial condition, results of operations, cash flow, cash available for distribution and ability to satisfy our debt service obligations could be materially adversely affected as a result of any or all of these factors.

We face significant competition, which may adversely affect the occupancy and rental rates of our data centers.

We compete with numerous data center providers globally, many of whom own or operate properties similar to ours in some of the same metropolitan areas where our data centers are located, including Equinix, Inc. and NTT; Switch, Inc. and various private operators in the U.S.; as well as Global Switch Holdings Limited and various regional operators in Europe, Asia, Latin America and Australia. In addition, we may in the future face competition from new entrants into the data center market, including new entrants who may acquire our current competitors. Some of our competitors and potential competitors have significant advantages over us, including greater name recognition, longer operating histories, pre-existing relationships with current or potential customers, significantly greater financial, marketing and other resources and more ready access to capital which allow them to respond more quickly to new or changing opportunities.

If our competitors offer space that our customers or potential customers perceive to be superior to ours based on factors such as available power, security, location, or connectivity, or if they offer rental rates below current market rates, or below the rental rates we are offering, we may lose customers or potential customers or be required to incur costs to improve our data centers or reduce our rental rates. In addition, recently many of our competitors have developed and continue to develop additional data center space. If the supply of data center space continues to increase as a result of these activities or otherwise, rental rates may be reduced or we may face delays in leasing or be unable to lease our vacant space, including space that we develop. Further, if customers or potential customers desire services that we do not offer, we may not be able to lease our space to those customers. Our financial condition, results of operations, cash flow, cash available for distribution and ability to satisfy our debt service obligations could be materially adversely affected as a result of any or all of these factors.

Any failure of our physical or information technology or operational technology infrastructure or services could lead to significant costs and disruptions.

Our business depends on providing customers with highly reliable services, including with respect to power supply, physical security and maintenance of environmental conditions. We may fail to provide such service as a result of numerous factors, including mechanical failure, power outage, human error, physical or electronic security breaches, war, terrorism, fire, earthquake, pandemics, hurricane, flood and other natural disasters, sabotage and vandalism. Our systems may be susceptible to damage, interference, or interruption from modifications or upgrades, power loss, telecommunications failures, computer viruses, ransomware attacks, computer denial of service attacks, phishing schemes, or other attempts to harm or access our systems.

Problems at one or more of our data centers, whether or not within our control, could result in service interruptions or equipment damage. Substantially all of our customer agreements include terms requiring us to meet certain service level commitments to our customers. Any failure to meet these or other commitments or any equipment damage in our data centers, including as a result of mechanical failure, power outage, human error or other reasons, could subject us to liability under the terms of our customer agreements, including service level credits against customer rent payments, monetary damages, or, in certain cases of repeated failures, the right by the customer to terminate the agreement. Service interruptions, equipment failures or security breaches may also expose us to additional legal liability and monetary damages and damage our brand and reputation, and could cause our customers to terminate or not renew their agreements. In addition, we may be unable to attract new customers if we have a reputation for service disruptions, equipment failures or physical or electronic security breaches in our data centers. Any such failures could materially adversely affect our business, financial condition and results of operations.

We may be vulnerable to breaches, or unauthorized access to, or disruption of our physical and information technology and operational technology infrastructure and systems.

Security breaches, or disruption, of our or our customers’ physical or information technology or operational technology infrastructure, networks and related management systems and controls could result in, among other things, unauthorized

21

Table of Contents

Index to Financial Statements

access to our facilities, a breach of our and our customers’ networks and information technology infrastructure, the misappropriation of our or our customers’ or their customers’ proprietary or confidential information, interruptions or malfunctions in our or our customers’ operations, delays or interruptions to our ability to meet customer needs, breach of our legal, regulatory or contractual obligations, inability to access or rely upon critical business records or other disruptions in our operations. We may be required to expend significant financial resources to protect against or to remediate such security breaches. We may not be able to implement security measures in a timely manner or, if and when implemented, these measures could be circumvented. Any breaches that may occur could expose us to increased risk of lawsuits, material monetary damages, potential violations of applicable privacy and other laws, penalties and fines, loss of existing or potential customers, harm to our reputation and increases in our security and insurance costs, which could have a material adverse effect on our business, financial condition and results of operations.

Although our customers’ computing equipment resides in our buildings, we generally do not have access to, nor do we have knowledge of, what applications and data are being housed and processed on their equipment. In certain instances, we provide digital infrastructure and platforms as a service to our customers, which increases the risk of loss of data, and we may expand these aspects of our business. In the event of a breach resulting in loss of data, such as personally identifiable information or other such data protected by data privacy or other laws, we may be liable for damages, fines and penalties for such losses under applicable regulatory frameworks despite not handling the data. Further, the regulatory framework around data custody, data privacy and breaches varies by jurisdiction and is an evolving area of law. For example, the EU General Data Protection Regulation (GDPR), and any subsequent amended versions of it, and similar regulations that apply to our business globally may have significant impact on our compliance frameworks and operations. If we fail to comply with these various regulations, we may have to pay fines or damages. We may not be able to limit our liability or damages in the event of such a loss.

We have made, and continue to make, investments to update and modernize our information technology systems and expect such investments to continue in order to meet our business needs, including for ongoing improvements for our customer experience. Additionally, as part of our global platform strategy, we have acquired and invested in, and continue to acquire and invest in, businesses and operations globally, including in new regions with complex and evolving regulatory frameworks and different risk profiles. Transitioning to new or upgraded systems, and integrating acquired networks and data, can create difficulties, including potential disruptions to current processes and cybersecurity complexities. In addition, our information technology systems may require further modification as we grow and as our business needs change, which could prolong difficulties we experience with such transitions and integrations. Such significant investments in our systems may take longer to deploy and cost more than originally planned. In addition, we may not realize the full benefits we hoped to achieve, and we may need to expend significant attention, time and resources to correct problems or find alternative sources for performing various functions. Difficulties in implementing new or upgraded information or operational technology systems or significant system failures or delays or the failure to successfully modify our systems and respond to changes in our business needs could adversely affect our business and results of operations.

We depend on significant customers, and many of our data centers are single-tenant properties or are currently occupied by single tenants.

As of December 31, 2021, the 20 largest customers in our portfolio represented approximately 49.2% of the total annualized recurring revenue generated by our properties. Our top three customers represented approximately 17.5% of the total annualized recurring revenue generated by our properties as of December 31, 2021. In addition, 45 of our 287 data centers are occupied by single customers, including data centers occupied solely by our top three customers. Many factors, including global economic conditions, may cause our customers to experience a downturn in their businesses or otherwise experience a lack of liquidity, which may weaken their financial condition and impact our estimates as to the probability of collectability of payments, and ultimately result in their failure to make timely rental and other payments or their default under their agreements with us. Further, the development of new technologies, the adoption of new industry standards or other factors could render many of our customers’ current products and services obsolete or unmarketable and contribute to a downturn in their businesses, thereby increasing the likelihood that they default under their leases, become insolvent or file for bankruptcy. If any customer defaults or fails to make timely rent or other payments, we may experience delays in enforcing our rights as landlord and may incur substantial costs in protecting our investment, which could adversely affect our financial condition and results of operations.

22

Table of Contents

Index to Financial Statements

If any customer becomes a debtor in a case under the U.S. Bankruptcy Code, we cannot evict the customer solely because of the bankruptcy. In addition, the bankruptcy court might authorize the customer to reject and terminate its contracts with us. Our claim against the customer for unpaid, future rent and other payments would be subject to a statutory cap that might be substantially less than the remaining amounts actually owed under their agreements with us. In either case, our claim for unpaid rent and other amounts would likely not be paid in full. Our revenue and cash available for distribution could be materially adversely affected if any of our significant customers were to become bankrupt or insolvent, suffer a downturn in their businesses, fail to renew their contracts or renew on terms less favorable to us than their current terms. As of February 25, 2022, we had no material customers in bankruptcy.

Failure to attract, grow and retain a diverse and balanced customer base, including key magnet customers, could harm our business and operating results.

Our ability to attract, grow and retain a diverse and balanced customer base, consisting of enterprises, cloud service providers, network service providers, and digital economy customers, some of which we consider to be key magnets drawing in other customers, may affect our ability to maximize our revenues. Dense and desirable customer concentrations within a facility enable us to better generate significant interconnection revenues, which in turn increases our overall revenues. Our ability to attract customers to our data centers will depend on a variety of factors, including our product offerings, the presence of carriers, the overall mix of customers, the presence of key customers attracting business through ecosystems, the data center’s operating reliability and security and our ability to effectively market our product offerings. Our inability to develop, provide or effectively execute any of these factors may hinder the development, growth and retention of a diverse and balanced customer base and adversely affect our business, financial condition and results of operations.

Our contracts with our customers could subject us to significant liability.

In the ordinary course of business, we enter into agreements with our customers pursuant to which we provide data center space, power, environmental controls, physical security and connectivity products to our customers. These contracts typically contain indemnification and liability provisions, in addition to service level commitments, which could potentially impose a significant cost on us in the event of losses arising out of certain breaches of such agreements, services to be provided by us or our subcontractors or from third-party claims. Customers increasingly are looking to pass through their regulatory obligations and other liabilities to their outsourced data center providers and we may not be able to limit our liability or damages in an event of loss suffered by such customers whether as a result of our breach of an agreement or otherwise. Further, liabilities and standards for damages and enforcement actions, including the regulatory framework applicable to different types of losses, vary by jurisdiction, and we may be subject to greater liability for certain losses in certain jurisdictions. Additionally, in connection with our acquisitions, we have assumed existing agreements with customers that may subject us to greater liability for such an event of loss. If such an event of loss occurred, we could be liable for material monetary damages and could incur significant legal fees in defending against such an action, which could adversely affect our financial condition and results of operations.

Certain of our customer agreements may include restrictions on the sale of our properties to certain third parties, which could have a material adverse effect on us.

Certain of our customer agreements may prohibit us from selling certain properties to a third party unless specified conditions are met. The existence of such restrictions could hinder our ability to sell one or more of these properties, which could materially adversely affect our business, financial condition and results of operations.

Our data centers may not be suitable for re-leasing without significant expenditures or renovations.

Because many of our data centers contain tenant improvements installed at our customers’ expense, they may be better suited for a specific data center user or technology industry customer and could require significant modification in order for us to re-lease vacant space to another data center user or technology industry customer. The tenant improvements may also become outdated or obsolete as the result of technological change, the passage of time or other factors. In addition, our development space will generally require substantial improvement to be suitable for data center use. For the same reason, our properties also may not be suitable for leasing to traditional office customers without significant expenditures or renovations.

As a result, we may be required to invest significant amounts or offer significant discounts to customers in order to lease or re-lease that space, either of which could adversely affect our financial and operating results.

23

Table of Contents

Index to Financial Statements

We may be unable to lease vacant or development space, renew leases, or re-lease space as leases expire.

At December 31, 2021, we owned approximately 7.2 million square feet of space under active development and approximately 2.7 million square feet of space held for future development. We intend to continue to add new space to our development inventory and to continue to develop additional space from this inventory. A portion of the space that we develop has been, and may continue to be, developed on a speculative basis, meaning that we do not have a signed customer agreement for the space when we begin the development process. We also develop space specifically for customers pursuant to agreements signed prior to beginning the development process. In those cases, if we fail to meet our development obligations under those agreements, these customers may be able to terminate the agreements and we would be required to find a new customer for this space. In addition, in certain circumstances we lease data center facilities prior to their completion. If we fail to complete the facilities in a timely manner, the customer may be entitled to terminate its agreement, seek damages or penalties against us or pursue other remedies and we may be required to find a new customer for the space. We cannot assure you that once we have developed space or land we will be able to successfully lease it at all, or at rates we consider favorable or expected at the time we commenced development. Further, once development of a data center facility is complete, we incur certain operating expenses even if there are no customers occupying any space. If we are not able to complete development in a timely manner or successfully lease the space that we develop, if development costs are higher than we currently estimate, or if rental rates are lower than expected when we began the project or are otherwise undesirable, our financial condition, results of operations, cash flow, cash available for distribution and ability to satisfy our debt service obligations could be materially adversely affected.

In addition, as of December 31, 2021, customer agreements representing 23.8% of the square footage of the properties in our portfolio, excluding month-to-month leases and space held for development, were scheduled to expire through 2023, and an additional 17.2% of the net rentable square footage, excluding space held for development, was available to be leased. Some of this space may require substantial capital investment to meet the power and cooling requirements of our customers, or may no longer be suitable for their needs. In addition, we cannot assure you that customer agreements will be renewed or that our properties will be re-leased at all, or at net effective rental rates equal to or above the current average net effective rental rates. If the rental rates for our properties decrease, our existing customers do not renew their agreements, we do not lease or re-lease our available space, including newly developed space and space for which customer agreements are scheduled to expire, or it takes longer for us to lease or re-lease this space or for rents to commence on this space, our financial condition, results of operations, cash flow, cash available for distribution and ability to satisfy our debt service obligations could be materially adversely affected.

Additionally, a customer’s decision to lease space and power in one of our data centers and to purchase additional products typically involves a significant commitment of resources and due diligence on the part of our customers regarding the adequacy of our facilities. As a result, the leasing of data center space can have a long sales cycle, and we may expend significant time and resources in pursuing a particular transaction that may not result in revenue. Economic conditions, including market downturns, may further impact this long sales cycle by making it difficult for customers to plan future business activities, which could cause customers to slow spending or delay decision-making. Our inability to adequately manage the risks associated with the sales cycle may adversely affect our business, financial condition and results of operations.

Even if we have additional space available for lease at any one of our data centers, our ability to lease this space to existing or new customers could be constrained by our ability to provide sufficient electrical power.

As current and future customers increase their power footprint in our data centers over time, the corresponding reduction in available power could limit our ability to increase occupancy rates or network density within our existing data centers. Furthermore, at certain of our data centers, our aggregate maximum contractual obligation to provide power and cooling to our customers may exceed the physical capacity at such data centers if customers were to quickly increase their demand for power and cooling. If we are not able to increase the available power and/or cooling or move the customer to another location within our data centers with sufficient power and cooling to meet such demand, we could lose the customer as well as be exposed to liability under our customer agreements. In addition, our power and cooling systems are difficult and expensive to upgrade. Accordingly, we may not be able to efficiently upgrade or change these systems to meet new demands without incurring significant costs that we may not be able to pass on to our customers. Any such

24

Table of Contents

Index to Financial Statements

material loss of customers, liability or additional costs could adversely affect our business, financial condition and results of operations.

Our portfolio depends upon local economic conditions and is geographically concentrated in certain locations.

Our portfolio is located in 50 metropolitan areas. As of December 31, 2021, our portfolio, including the 50 data centers held as investments in unconsolidated entities, was geographically concentrated in the following metropolitan areas:


Percentage of


December 31, 2021


Metropolitan Area

Total annualized rent (1)


Northern Virginia


19.5

%

Chicago


9.0

%

London


6.6

%

New York


6.2

%

Silicon Valley


6.1

%

Frankfurt


5.7

%

Dallas

5.5

%

Amsterdam


4.2

%

Sao Paulo


4.1

%

Singapore


4.0

%

Paris


2.2

%

Phoenix


2.0

%

San Francisco


1.9

%

Osaka


1.6

%

Atlanta

1.5

%

Other


19.9

%

Total


100.0

%

(1)Annualized rent is monthly contractual rent (defined as cash base rent before abatements) under existing leases as of December 31, 2021 multiplied by 12. Includes consolidated portfolio and unconsolidated entities at the entities’ 100% ownership level. The aggregate amount of abatements for the year ended December 31, 2021 was approximately $108.7 million.

Some of these areas have experienced downturns in recent years. We depend upon the local economic conditions in these areas, including local real estate conditions, and our operations, revenue and cash available for distribution could be materially adversely affected by a downturn in local economic conditions in these areas. Our operations may also be affected if too many competing properties are built in any of these areas or supply otherwise increases or exceeds demand. We cannot assure you that these locations will grow or will remain favorable to data center investments or operations. In addition, we are currently developing data centers in certain of these metropolitan areas. Any negative changes in real estate, technology or economic conditions in these metropolitan areas in particular could negatively impact our performance.

We lease or sublease certain of our data center space from third parties and the ability to retain these leases or subleases could be a significant risk to our ongoing operations.

We do not own all the buildings in our portfolio. These leased buildings accounted for approximately 15% of our total revenue for the year ended December 31, 2021. In addition, we may acquire additional leased data center space or businesses that lease facilities instead of owning them. Our business could be harmed if we are unable to renew the leases for these data centers on favorable terms or at all. Additionally, in several of our smaller facilities we sublease our space, and our rights under these subleases are dependent on our sublandlord retaining its rights under the prime lease. When the initial terms of our existing leases expire, we generally have the right to extend the terms of our leases for one or more renewal periods, subject to, in the case of several of our subleases, our sublandlord renewing its term under the prime lease. If renewal rates are less favorable than those we currently have, we may be required to increase revenues

25

Table of Contents

Index to Financial Statements

within existing data centers to offset such increase in lease payments. Failure to increase revenues to sufficiently offset these projected higher costs could adversely impact our operating income. Upon the end of our renewal options, we would have to renegotiate our lease terms with the applicable landlords.

Additionally, if we are unable to renew the lease at any of our data centers, we could lose customers due to the disruptions in their operations caused by the relocation. We could also lose those customers that choose our data centers based on their locations. The costs of relocating data center infrastructure equipment, such as generators, power distribution units and cooling units, to different data centers could be prohibitive and, as such, we could lose the value of this equipment. For these reasons, any lease that cannot be renewed could adversely affect our business, financial condition and results of operations.

We and our customers may experience supply chain or procurement disruptions, or increased supply chain costs, which may lead to delays.

The development of our data centers requires the timely delivery of required equipment and materials. We rely on third parties to provide the equipment and materials needed for our construction and development needs. Our global supply chain and development activities could be impacted by disruptions, such as political events, international trade disputes, war, terrorism, natural disasters, public health issues, industrial accidents, pandemics and other business interruptions, which could impact our ability to meet delivery timelines, including delivery timelines to our customers, and lead to delays, reputational damage, potential penalties that we may be required to pay and potential terminations of agreements by our customers. If any such delay or disruption were to occur, it could have an adverse effect on our liquidity and financial condition. Changes in the costs of procuring materials and equipment used in our construction and development programs, including vendor costs, or changes in our relationships with vendors, could have an adverse effect on our results of operations. Similarly, our customers may experience supply chain or procurement disruptions, constraints and increased costs, which may impact their ability to deploy in our facilities, which could have a material adverse impact on our business and financial condition. During the COVID-19 pandemic, we have actively monitored our vendors and suppliers and remain in frequent communication with customers, contractors and suppliers. We have proactively managed our supply chain, and we believe the equipment needed will be delivered to complete our 2022 development activities. Although to date, we have been able to manage through disruptions in our supply chain and procurement process due to the COVID-19 pandemic, continuing disruptions could have a material adverse impact on our business and financial condition. However, the full extent and impact of the ongoing COVID-19 pandemic on our future supply chain and procurement process cannot be reasonably estimated at this time and it could have a material adverse impact on our business and financial condition.

We may not be able to adapt to changing technologies and customer requirements, and our data center infrastructure may become obsolete.

The technology industry generally and specific industries in which certain of our customers operate are characterized by rapidly changing technology, customer requirements and industry standards. New systems to deliver power to or eliminate heat in data centers or the development of new server technology that does not require the levels of critical load and heat removal that our facilities are designed to provide and could be run less expensively on a different platform could make our data center infrastructure obsolete. Our power and cooling systems are difficult and expensive to upgrade, and we may not be able to efficiently upgrade or change these systems to meet new demands without incurring significant costs that we may not be able to pass on to our customers which could adversely impact our business, financial condition and results of operations. In addition, the infrastructure that connects our data centers to the Internet and other external networks may become insufficient, including with respect to latency, reliability and connectivity. We may not be able to adapt to changing technologies or meet customer demands for new processes or technologies in a timely and cost-effective manner, if at all, which would adversely impact our ability to sustain and grow our business.

Further, our inability to adapt to changing customer requirements may make our data centers obsolete or unmarketable to such customers. Some of our customers operate at significant scale across numerous data center facilities and have designed cloud and computing networks with redundancies and fail-over capabilities across these facilities, which enhances the resiliency of their networks and applications. As a result, these customers may realize cost benefits by locating their data center operations in facilities with less electrical or mechanical infrastructure redundancy than is found in our existing data center facilities. Additionally, some of our customers have begun to operate their data centers

26

Table of Contents

Index to Financial Statements

using a wider range of humidity levels and at temperatures that are higher than servers customarily have operated at in the past, all of which may result in energy cost savings for these customers. We may not be able to operate our existing data centers under these environmental conditions, particularly in multi-tenant facilities with other customers who are not willing to operate under these conditions, and our data centers could be at a competitive disadvantage to facilities that satisfy such requirements. Because we may not be able to modify the redundancy levels or environmental systems of our existing data centers cost effectively, these or other changes in customer requirements could have a material adverse effect on our business, results of operations and financial condition.

Additionally, due to regulations that apply to our customers as well as industry standards, such as ISO and SOC certifications which customers may deem desirable, they may seek specific requirements from their data centers that we are unable to provide. If new or different regulations or standards are adopted or such extra requirements are demanded by our customers, we could lose some customers or be unable to attract new customers in certain industries, which could materially and adversely affect our operations.

We depend upon third-party suppliers for power, and we are vulnerable to service failures and price increases by such suppliers and to volatility in the supply and price of power in the open market.

We rely on third parties to provide power to our data centers, and we cannot ensure that these third parties will deliver such power in adequate quantities or on a consistent basis. If the amount of power available to us is inadequate to support our customer requirements, we may be unable to satisfy our obligations to our customers or grow our business. In addition, our data centers may be susceptible to power shortages and planned or unplanned power outages caused by these shortages. Power outages may last beyond our backup and alternative power arrangements, which would harm our customers and our business. Any loss of services or equipment damage could adversely affect both our ability to generate revenues and our operating results, harm our reputation and potentially lead to customer disputes or litigation.

In addition, we may be subject to risks and unanticipated costs associated with obtaining power from various utility companies. Utilities that serve our data centers may be dependent on, and sensitive to price increases for, a particular type of fuel, such as coal, oil or natural gas. In addition, the price of these fuels and the electricity generated from them could increase as a result of: regulations intended to regulate carbon emissions and other pollutants, ratepayer surcharges related to recovering the cost of natural disasters, grid modernization charges, as well as other charges borne by ratepayers. Increases in the cost of power at any of our data centers could put those locations at a competitive disadvantage relative to data centers that are supplied power at a lower price.

We have also entered into power purchase agreements with contract terms ranging from 10-15 years. These agreements require us to purchase renewable energy and/or renewable energy credits from producers at fixed prices over the terms of the contracts, subject to certain adjustments. In the event that the market price for energy decreases, we may be required to pay more under the power purchase agreements than we would otherwise if we were to purchase renewable energy credits on the open market, which could adversely affect our results of operations. Additionally, interruptions in the operations of one or more of the suppliers under these agreements, as a result of unpredictable weather, natural phenomena or otherwise, could negatively impact the quantity of renewable energy credits delivered to us.

We depend on third parties to provide network connectivity to the customers in our data centers and any delays or disruptions in connectivity may materially adversely affect our operating results and cash flow.

We are not a telecommunications carrier. Although our customers generally are responsible for providing their own network connectivity, we still depend upon the presence of telecommunications carriers’ fiber networks serving our data centers in order to attract and retain customers. We believe that the availability of carrier capacity will directly affect our ability to achieve our projected results. Any carrier may elect not to offer its services within our data centers. Any carrier that has decided to provide network connectivity to our data centers may not continue to do so for any period of time. Further, some carriers are experiencing business difficulties or have announced consolidations. As a result, some carriers may be forced to downsize or terminate connectivity within our data centers, which could have an adverse effect on the business of our customers and, in turn, our own operating results.

Our data centers may require construction and operation of a sophisticated redundant fiber network. The construction required to connect multiple carrier facilities to our data centers is complex and involves factors outside of our control, including regulatory requirements and the availability of construction resources. We have obtained the right to use network resources owned by other companies, including rights to use dark fiber, in order to attract telecommunications

27

Table of Contents

Index to Financial Statements

carriers and customers to our portfolio. If the establishment of highly diverse network connectivity to our data centers does not occur, is materially delayed or is discontinued, or is subject to failure, our operating results and cash flow may be materially adversely affected. Additionally, any hardware or fiber failures on this network may result in significant loss of connectivity to our data centers. This could negatively affect our ability to attract new customers or retain existing customers, which could have an adverse effect on our business, financial condition and results of operations.

Our international activities, including acquisition, ownership and operation of data centers located outside of the United States, subject us to risks different than those we face in the United States and we may not be able to effectively manage our international business.

Our portfolio included 160 data centers, including 35 held in unconsolidated entities, located outside of the United States as of December 31, 2021. We have acquired and developed, and may continue to acquire and develop, and operate data centers outside the United States.

The ownership and operation of data centers located outside of the United States subject us to risks from fluctuations in exchange rates between foreign currencies and the U.S. dollar. Changes in the relation of these currencies to the U.S. dollar will affect our revenues and operating margins, may materially adversely impact our financial condition, results of operations, cash flow, cash available for distribution and ability to satisfy our debt obligations. We may attempt to mitigate some or all of the risk of currency fluctuation by financing our properties in the local currency denominations, although we cannot assure you that we will be able to do so or that this will be effective. We may also engage in direct hedging activities to mitigate the risks of exchange rate fluctuations in a manner consistent with our qualifications as a REIT, although we cannot assure you that we will be able to do so or that this will be effective.

Our foreign operations involve additional risks not generally associated with or different from operations in the United States, including:

our limited knowledge of and relationships with sellers, customers, contractors, suppliers or other parties in these metropolitan areas;
complexity and costs associated with managing international development and operations;
difficulty in hiring qualified management, sales and construction personnel and service providers in a timely fashion;
the adoption and expansion of trade restrictions or the occurrence of trade wars;
differing employment practices and labor issues, including related to works councils, employee committees, labor unions and collective rights of action;
multiple, conflicting and changing legal, regulatory, entitlement and permitting, and tax and treaty environments;
exposure to increased taxation, confiscation or expropriation;
currency transfer restrictions and limitations on our ability to distribute cash earned in foreign jurisdictions to the United States;
difficulty in enforcing agreements in non-U.S. jurisdictions, including those entered into in connection with our acquisitions or in the event of a default by one or more of our customers, suppliers or contractors;
local business and cultural factors;
political and economic instability, including sovereign credit risk, in certain geographic regions; and
risks related to bribery and corruption.

We also face risks with investing in unfamiliar metropolitan areas. We have acquired and may continue to acquire properties in international metropolitan areas that are new to us. When we acquire properties located in these metropolitan areas, we may face risks associated with a lack of market knowledge or understanding of the local economy and culture, forging new business relationships in the area and unfamiliarity with local government and permitting procedures. In addition, due diligence, transaction and structuring costs may be higher than those we may face in the United States. We work to mitigate such risks through extensive diligence and research and associations with experienced local partners; however, we cannot assure you that all such risks will be eliminated.

28

Table of Contents

Index to Financial Statements

Our inability to overcome these risks could adversely affect our international activities, including our foreign operations and could harm our business and results of operations.

The United Kingdom’s withdrawal from the European Union may have a negative effect on global economic conditions, financial markets and our business.

We are a global company with worldwide operations, including material business operations in Europe. Following a national referendum and enactment of legislation by the government of the United Kingdom, the United Kingdom formally withdrew from the European Union, and, on May 1, 2021, the European Union and United Kingdom entered into a new trade and cooperation agreement to govern certain aspects of their relationship following the United Kingdom’s withdrawal from the European Union. The agreement addresses trade, economic arrangements, law enforcement, judicial cooperation and a governance framework including procedures for dispute resolution, among other things. Because the agreement merely sets forth a framework in many respects and will require complex additional bilateral negotiations between the United Kingdom and the European Union as both parties continue to work on the rules for implementation, significant political and economic uncertainty remains about how the precise terms of the relationship between the parties will differ from the terms before withdrawal.

These developments, or the perception that any related developments could occur, have had and may continue to have a material adverse effect on global economic conditions and financial markets, and could significantly reduce global market liquidity and restrict the ability of key market participants to operate in certain financial markets. Asset valuations, currency exchange rates and credit ratings have been and may continue to be subject to increased market volatility. Lack of clarity about future United Kingdom laws and regulations as the United Kingdom determines which European Union laws to replace or replicate, including financial laws and regulations, tax and free trade agreements, tax and customs laws, intellectual property rights, environmental, health and safety laws and regulations, immigration laws, employment laws and transport laws could increase costs, disrupt supply chains, and depress economic activity and restrict our access to capital. Any of these factors could have a material adverse effect on our business, financial condition and results of operations and reduce the price of our securities.

Our recent acquisitions may not achieve the intended benefits or may disrupt our plans and operations.

Acquisitions present many risks, and we may not realize the financial or strategic goals that were contemplated at the time of the transaction. Our ability to realize the anticipated benefits of the Interxion Combination in March 2020 and other acquisitions depends, to a large extent, on our ability to integrate each of them with our business. The combination of two independent businesses can be a complex, costly and time-consuming process, which requires significant time and focus from our management team and may divert attention from the day-to-day operations of our business. There can be no assurance that we will be able to successfully integrate acquired properties and businesses with our business or otherwise realize the expected benefits of these acquisitions. In addition, even if our operations are integrated successfully with the operations of our acquisitions, we may not realize the full benefits of the acquisitions, including the synergies, operating efficiencies, or sales or growth opportunities that are expected. These benefits may not be achieved within the anticipated time frame or at all. All of these factors could decrease or delay any potential accretive effect of the acquisitions and negatively impact the price of our common stock.

In addition, the overall integration of the businesses may result in material unanticipated problems, expenses, liabilities, competitive responses and loss of customer relationships, among other potential adverse consequences. Actual integration costs may exceed those estimated and there may be further unanticipated costs and the assumption of known and unknown liabilities. While we have assumed that we will incur certain integration expenses, there are factors beyond our control that could affect the total amount or the timing of such expenses. Many of the expenses that will be incurred, by their nature, are difficult to estimate accurately. If we cannot integrate and operate acquired properties or businesses to meet our financial expectations, our financial condition, results of operations, cash flow, cash available for distribution and ability to satisfy our debt service obligations could be materially adversely affected.

The risks of combining businesses include, among others:

we may have underestimated the costs to make any necessary improvements to the acquired properties;
the acquired properties may be subject to reassessment, which may result in higher than expected property tax payments;

29

Table of Contents

Index to Financial Statements

we may be unable to integrate new acquisitions quickly and efficiently, particularly acquisitions of operating businesses or portfolios of properties, into our existing operations;
we may face difficulties in integrating employees and in retaining key personnel;
we may face challenges in keeping existing customers, including key customers, which could adversely impact our revenue;
we may be unable to effectively manage our expanded operations; and
market conditions may result in higher than expected vacancy rates and lower than expected rental rates on acquired properties.

Any one of these risks could result in increased costs, decreases in the amount of expected revenue and diversion of our management’s time and energy, which could have a material adverse effect on our business, financial condition, results of operations and cash flows.

Several of our data centers, including the data centers which we have acquired in the past five years, have been under our management for a limited time. The data centers may have characteristics or deficiencies unknown to us that could affect their valuation or revenue potential. We cannot assure you that the operating performance of these data centers will not decline under our management.

We may be subject to unknown or contingent liabilities related to our recent acquisitions, for which we may have no or limited recourse against the sellers.

Our recent and future acquisitions may be subject to unknown or contingent liabilities for which we may have no or limited recourse against the sellers. Unknown or contingent liabilities might include liabilities for clean-up or remediation of environmental conditions, claims of customers, vendors or other persons dealing with the acquired entities or the former owners of acquired properties or businesses, tax liabilities, claims for indemnification by general partners, directors, officers and others indemnified by the former owners of acquired properties or businesses, and other liabilities whether incurred in the ordinary course of business or otherwise. In addition, the total amount of costs and expenses that we may incur with respect to liabilities associated with our acquisitions may exceed our expectations, which may adversely affect our business, financial condition and results of operations.

Further, we have entered, and may in the future enter, into transactions with limited representations and warranties or with representations and warranties that do not survive the closing of such transactions, in which event we would have no or limited recourse against the sellers of such properties or businesses. While we usually require the sellers to indemnify us with respect to breaches of representations and warranties that survive, such indemnification is often limited and subject to various materiality thresholds, a significant deductible or an aggregate cap on losses. We may obtain insurance policies providing for coverage for breaches of certain representations and warranties in certain transactions, subject to certain exclusions and a deductible, however, there can be no assurance that we would be able to recover any amounts with respect to losses due to breaches of any such representations and warranties. As a result, there is no guarantee that we will recover any amounts with respect to losses due to breaches by the sellers of their representations and warranties. Finally, indemnification agreements between us and the sellers typically provide that the sellers will retain certain specified liabilities relating to the properties or businesses acquired by us. While the sellers are generally contractually obligated to pay all losses and other expenses relating to such retained liabilities, there can be no guarantee that such arrangements will not require us to incur losses or other expenses as well.

We may be unable to identify, including sourcing off-market deal flow, and complete acquisitions on favorable terms or at all.

A component of our growth strategy is to continue to acquire additional data centers, and we continually evaluate the market of available properties and businesses and may acquire additional properties or businesses when opportunities exist. To date, a substantial portion of our acquisitions were completed before they were widely marketed by real estate brokers, or “off-market.” Properties that are acquired off-market are typically more attractive to us as a purchaser because of the absence of competitive bidding, which could potentially lead to higher prices. We obtain access to off-market deal flow from numerous sources. If we cannot obtain off-market deal flow in the future, our ability to identify and acquire additional properties at attractive prices could be adversely affected.

Our ability to acquire properties or businesses on favorable terms may be subject to the following significant risks:

30

Table of Contents

Index to Financial Statements

we may be unable to acquire a desired property or business because of competition from other real estate investors with significant capital, including both publicly traded REITs and institutional investment funds;
even if we are able to acquire a desired property or business, competition from other potential acquirers may significantly increase the purchase price or result in other less favorable terms;
even if we enter into agreements for the acquisition of real estate or businesses, these agreements are subject to customary conditions to closing; and
we may be unable to finance acquisitions on favorable terms or at all.

If we cannot complete property or business acquisitions on favorable terms or at all, our financial condition, results of operations, cash flow, cash available for distribution and ability to satisfy our debt service obligations could be materially adversely affected.

Joint venture (JV) investments could be adversely affected by our lack of sole decision-making authority, our reliance on our JV partners’ financial condition and disputes between us and our JV partners.

We currently, and may in the future, co-invest with third parties through partnerships, joint ventures or other entities, acquiring non-controlling interests in or sharing responsibility for managing the affairs of a property or portfolio of properties, partnership, joint venture or other entity. In these events, we are not in a position to exercise sole decision-making authority regarding the properties, partnership, joint venture or other entity. Investments in partnerships, joint ventures, or other entities may, under certain circumstances, involve risks not present when a third party is not involved, including the possibility that partners might become bankrupt or fail to fund their share of required capital contributions. Partners may have economic, tax or other business interests or goals which are inconsistent with our business interests or goals, and may be in a position to take actions contrary to our policies or objectives. Our joint venture partners may take actions that are not within our control, which would require us to dispose of the joint venture asset or transfer it to a taxable REIT subsidiary in order for Digital Realty Trust, Inc. to maintain its status as a REIT. Such investments may also lead to impasses, for example, as to whether to sell a property, because neither we nor our partner would have full control over the partnership or joint venture. Disputes between us and our partners may result in litigation or arbitration that would increase our expenses and prevent our management from focusing their time and effort on our day-to-day business. Consequently, actions by or disputes with our partners may subject properties owned by the partnership or joint venture to additional risk. In addition, we may in certain circumstances be liable for the actions of our third-party partners. Each of these factors may result in returns on these investments being less than we expect or in losses and our financial and operating results may be adversely affected. In addition, we cannot assure you that we will be able to close joint ventures, on the anticipated schedule or at all. Failure to complete any such joint venture could have a negative impact on our business and the trading price of our common stock.

Brazilian political and economic conditions could adversely affect our investment in the Ascenty joint venture.

Ascenty’s portfolio of data centers is concentrated in Brazil. The Brazilian government frequently intervenes in the Brazilian economy and occasionally makes significant changes in policy and regulations. The Brazilian government’s actions designed to control inflation, stimulate growth and other policies and regulations have often involved, among other measures, increases in interest rates, changes in tax policies, price controls, currency devaluations, capital controls and limits on imported goods and services. We cannot control or predict changes in policy or regulations that the Brazilian government might adopt in the future. Our investment in the Ascenty joint venture may be adversely affected by the economic and political conditions in Brazil as well as changes in policy or regulations at the federal, state or municipal levels involving or affecting factors such as economic or social factors or political instability.

Any delays or unexpected costs in the development of our existing space and developable land and new properties acquired for development may delay and harm our growth prospects, future operating results and financial condition.

At  December 31, 2021, we had approximately 7.2 million square feet of space under active development and approximately 2.7 million square feet of space held for future development. We have built and may continue to build out a large portion of this space on a speculative basis at significant cost. Our successful development of these projects is subject to many risks, including those associated with:

delays in construction, or changes to the plans or specifications;

31

Table of Contents

Index to Financial Statements

budget overruns, increased prices for raw materials or building supplies, or lack of availability and/or increased costs for specialized data center components, including long lead time items such as generators;
construction site accidents and other casualties;
financing availability, including our ability to obtain construction financing and permanent financing, or increases in interest rates or credit spreads;
labor availability, costs, disputes and work stoppages with contractors, subcontractors or others that are constructing the project;
failure of contractors to perform on a timely basis or at all, or other misconduct on the part of contractors;
access to sufficient power and related costs of providing such power to our customers;
environmental issues;
supply chain constraints;
fire, flooding, earthquakes and other natural disasters;
pandemics;
geological, construction, excavation and equipment problems; and
delays or denials of entitlements or permits, including zoning and related permits, or other delays resulting from requirements of public agencies and utility companies.

In addition, while we intend to develop data centers primarily in metropolitan areas we are familiar with, we may in the future develop data centers in new geographic regions where we expect the development to result in favorable risk-adjusted returns on our investment. We may not possess the same level of familiarity with the development of data centers in other metropolitan areas, which could adversely affect our ability to develop such data centers successfully or at all or to achieve expected performance.

Development activities, regardless of whether they are ultimately successful, also typically require a substantial portion of our management’s time and attention. This may distract our management from focusing on other operational activities of our business. If we are unable to complete development projects successfully, our business may be adversely affected.

We have substantial debt and face risks associated with the use of debt to fund our business activities, including refinancing and interest rate risks.

Our total consolidated indebtedness at  December 31, 2021 was approximately $13.4 billion, and we may incur significant additional debt to finance future acquisition, investment and development activities. As of December 31, 2021, we have a $3.0 billion global revolving credit facility. We have the ability from time to time to increase the size of the global revolving credit facility by up to $1.5 billion, subject to receipt of lender commitments and other conditions precedent. At December 31, 2021, approximately $2.5 billion was available under this facility, net of outstanding letters of credit. As of February 22, 2022, we had approximately $2.2 billion available under the global revolving credit facility, net of outstanding letters of credit.

Our substantial indebtedness currently requires us to dedicate a significant portion of our cash flow from operations to debt service payments, which reduces the availability of our cash flow to fund working capital, capital expenditures, expansion efforts, distributions and other general corporate purposes. Additionally, it could: make it more difficult for us to satisfy our obligations with respect to our indebtedness; limit our ability in the future to undertake refinancing of our debt or obtain financing for expenditures, acquisitions, development or other general corporate purposes on terms and conditions acceptable to us, if at all; or affect adversely our ability to compete effectively or operate successfully under adverse economic conditions.

In addition, we may violate restrictive covenants or fail to maintain financial ratios specified in our loan documents, which would entitle the lenders to accelerate our debt obligations, and our secured lenders or mortgagees may foreclose on our properties or our interests in the entities that own the properties that secure their loans and receive an assignment of rents and leases. Our default under any one of our loans could result in a cross-default on other indebtedness. A foreclosure on one or more of our properties could adversely affect our access to capital, financial condition, results of operations, cash flow and cash available for distribution. Further, foreclosures could create taxable income without accompanying cash proceeds, a circumstance which could hinder Digital Realty Trust, Inc.’s ability to meet the REIT distribution requirements imposed by the Internal Revenue Code of 1986, as amended, or the Code.

32

Table of Contents

Index to Financial Statements

Additional risks related to our indebtedness include the following:

We may be unable to refinance our indebtedness at maturity or the refinancing terms may be less favorable than the terms of our original indebtedness. It is likely that we will need to refinance at least a portion of our outstanding debt as it matures. If we are unable to refinance or extend principal payments due at maturity or pay them with proceeds of other capital transactions, then our cash flow may not be sufficient in all years to repay all such maturing debt and to pay distributions. Further, if prevailing interest rates or other factors at the time of refinancing, such as the reluctance of lenders to make commercial real estate loans, result in higher interest rates upon refinancing, then the interest expense relating to that refinanced indebtedness would increase.

Fluctuations in interest rates could materially affect our financial results and may increase the risk our counterparty defaults on our interest rate hedges. Because a significant portion of our debt, including debt incurred under our global revolving credit facilities, bears interest at variable rates, increases in interest rates could materially increase our interest expense. If the United States Federal Reserve increases short-term interest rates, this would have a significant upward impact on shorter-term interest rates, including the interest rates that apply to our variable rate debt. Potential future increases in interest rates and credit spreads may increase our interest expense and therefore negatively affect our financial condition and results of operations, and reduce our access to capital markets. We have entered into interest rate swap agreements to fix a significant portion of our floating rate debt. Increased interest rates may increase the risk that the counterparties to our swap agreements will default on their obligations, which could further increase our exposure to interest rate fluctuations. Conversely, if interest rates are lower than our swapped fixed rates, we will be required to pay more for our debt than we would have had we not entered into the swap agreements.

Adverse changes in our Company’s credit ratings could negatively affect our financing activity. The credit ratings of our senior unsecured long-term debt and Digital Realty Trust, Inc.’s preferred stock are based on our Company’s operating performance, liquidity and leverage ratios, overall financial position and other factors employed by the credit rating agencies in their rating analyses of our Company. Our Company’s credit ratings can affect the amount of capital we can access, as well as the terms and pricing of any debt we may incur. We cannot assure you that we will be able to maintain our current credit ratings, and in the event our current credit ratings are downgraded, we would likely incur higher borrowing costs and may encounter difficulty in obtaining additional financing. Also, a downgrade in our credit ratings may trigger additional payments or other negative consequences under our current and future credit facilities and debt instruments. For example, if the credit ratings of our senior unsecured long-term debt are downgraded to below investment grade levels, we may not be able to obtain or maintain extensions on certain of our existing debt. Adverse changes in our credit ratings could negatively impact our refinancing and other capital market activities, our ability to manage our debt maturities, our future growth, our financial condition, the market price of Digital Realty Trust, Inc.’s stock, and our development and acquisition activity.

Our global revolving credit facilities and senior notes restrict our ability to engage in some business activities. Our global revolving credit facilities contain negative covenants and other financial and operating covenants that, among other things, restrict our ability to: incur additional indebtedness; make certain investments; merge with another company; and create, incur or assume liens; and require us to maintain financial coverage ratios, including with respect to unencumbered assets.

In addition, the global revolving credit facilities restrict Digital Realty Trust, Inc. from making distributions to its stockholders, or redeeming or otherwise repurchasing shares of its capital stock, after the occurrence and during the continuance of an event of default, except in limited circumstances including as necessary to enable Digital Realty Trust, Inc. to maintain its qualification as a REIT and to avoid the payment of income or excise tax.

In addition, our unsecured senior notes are governed by indentures, which contain various restrictive covenants, including limitations on our ability to incur indebtedness and requirements to maintain a pool of unencumbered assets. These restrictions, and the restrictions in our global revolving credit facilities, could cause us to default on our senior notes or global revolving credit facilities, as applicable, or negatively affect our operations or our ability to pay dividends to Digital Realty Trust, Inc.’s stockholders or distributions to Digital Realty Trust, L.P.’s unitholders, which could have a material adverse effect on the market value of Digital Realty Trust, Inc.’s common stock and preferred stock.

33

Table of Contents

Index to Financial Statements

Failure to hedge effectively against interest rate changes may adversely affect results of operations. We seek to manage our exposure to interest rate volatility by using interest rate hedging arrangements, such as interest rate cap, forward or swap lock agreements. These agreements involve risks, such as the risk that counterparties may fail to honor their obligations under these arrangements, that these arrangements may not be effective in reducing our exposure to interest rate changes and that a court could rule that such an agreement is not legally enforceable. Our policy is to use these derivatives only to hedge interest rate risks related to our borrowings, not for speculative or trading purposes, and to enter into contracts only with major financial institutions based on their credit ratings and other factors. However, we may choose to change this policy in the future. Approximately 94% of our total indebtedness as of December 31, 2021 was subject to fixed interest rates or variable rates subject to interest rate swaps. We do not currently hedge our global revolving credit facilities and as our borrowings under our global revolving credit facilities increase, so will our percentage of indebtedness not subject to fixed rates and our exposure to interest rates increase. Hedging may reduce the overall returns on our investments. Failure to hedge effectively against interest rate changes may materially adversely affect our results of operations.

Our growth depends on external sources of capital which are outside of our control.

In order for Digital Realty Trust, Inc. to maintain its qualification as a REIT, it is required under the Code to annually distribute at least 90% of its REIT taxable income determined without regard to the dividends paid deduction and excluding any net capital gain. In addition, Digital Realty Trust, Inc. will be subject to federal and state corporate income taxes to the extent that it distributes less than 100% of its REIT taxable income, including any net capital gains. Digital Realty Trust, L.P. is required to make distributions to Digital Realty Trust, Inc. that will enable the latter to satisfy this distribution requirement and avoid income and excise tax liability. Because of these distribution requirements, we may not be able to fund future capital needs, including any necessary acquisition or development financing, from operating cash flow. Consequently, we may rely on third-party sources to fund our capital needs.

Our access to third-party sources of capital depends on a number of factors, including general market conditions, the market’s perception of our business prospects and growth potential, our current and expected future earnings, funds from operations, our cash flow and cash distributions, and the market price per share of Digital Realty Trust, Inc.’s common stock. We cannot assure you that we will be able to obtain equity or debt financing at all or on terms favorable or acceptable to us. Any additional debt we incur will increase our leverage. Further, equity markets have experienced high volatility recently and we cannot assure you that we will be able to raise capital through the sale of equity securities at all or on favorable terms. Sales of equity on unfavorable terms could result in substantial dilution to Digital Realty Trust, Inc.’s common stockholders and Digital Realty Trust, L.P.’s unitholders. In addition, we may be forced to dispose of one or more of our properties, possibly on disadvantageous terms.

If we cannot obtain capital from third-party sources, we may not be able to acquire or develop data centers when strategic opportunities exist, satisfy our debt service obligations, pay cash dividends to Digital Realty Trust, Inc.’s stockholders or make distributions to Digital Realty Trust, L.P.’s unitholders.

Declining real estate valuations, impairment charges and illiquidity of real estate investments could adversely affect our earnings and financial condition.

We review each of our properties for indicators that its carrying amount may not be recoverable. Examples of such indicators may include a significant decrease in the market price, a significant adverse change in how the property is being used or expected to be used based on the underwriting at the time of acquisition, an accumulation of costs significantly in excess of the amount originally expected for the acquisition or development, a change in our intended holding period due to our intention to sell an asset, or a history of operating or cash flow losses. When such impairment indicators exist, we review an estimate of the future undiscounted net cash flows (excluding interest charges) expected to result from the real estate investment’s or group of properties that operate together as a group use and eventual disposition and compare it to the carrying value of the property or asset group. We consider factors such as future operating income, trends and prospects, as well as the effects of leasing demand, competition and other factors. If our future undiscounted net cash flow evaluation indicates that we are unable to recover the carrying value of a real estate investment, an impairment loss is recorded to the extent that the carrying value exceeds the estimated fair value of the property or asset group. These losses have a direct impact on our net income because recording an impairment loss results in an immediate negative adjustment to net income. The evaluation of anticipated cash flows is highly subjective and is based in part on assumptions regarding future occupancy, rental rates and capital requirements that could differ

34

Table of Contents

Index to Financial Statements

materially from actual results in future periods. A worsening real estate market may cause us to reevaluate the assumptions used in our impairment analysis. These impairment charges could be significant and could adversely affect our financial condition, results of operations and cash available for distribution.

Because real estate investments are relatively illiquid and because there may be even fewer buyers for our specialized real estate, our ability to promptly sell properties in our portfolio in response to adverse changes in their performance may be limited, which may harm our financial condition. Further, Digital Realty Trust, Inc. is subject to provisions in the Code that limit a REIT’s ability to dispose of properties, which limitations are not applicable to other types of real estate companies. See “Risks Related to Our Organizational Structure—Digital Realty Trust, Inc.’s duty to its stockholders may conflict with the interests of Digital Realty Trust, L.P.’s unitholders—Tax consequences upon sale or refinancing.” While Digital Realty Trust, Inc. has exclusive authority under Digital Realty Trust, L.P.’s limited partnership agreement to determine whether, when, and on what terms to sell a property, such decisions may require the approval of Digital Realty Trust, Inc.’s Board of Directors. These limitations may affect our ability to sell properties.

This lack of liquidity and the Code restrictions may limit our ability to adjust our portfolio promptly in response to changes in economic or other conditions and, as a result, could adversely affect our financial condition, results of operations, cash flow, cash available for distribution and ability to access capital necessary to meet our debt payments and other obligations.

Our success depends on key personnel whose continued service is not guaranteed.

We depend on the efforts of key personnel of our Company, particularly A. William Stein, our Chief Executive Officer, Andrew P. Power, our President & Chief Financial Officer, Gregory S. Wright, our Chief Investment Officer, Chris Sharp, our Chief Technology Officer, Erich J. Sanchack, our Chief Operating Officer, and Cindy Fiedelman, our Chief Human Resources Officer. They are important to our success for many reasons, including that each has a national or regional reputation in our industry and the investment community that attracts investors and business and investment opportunities and assists us in negotiations with investors, lenders, existing and potential customers and industry personnel. If we lost their services, our business and investment opportunities and our relationships with lenders and other capital markets participants, existing and prospective customers and industry personnel could suffer. Many of our Company’s other senior employees also have strong technology, finance and real estate industry reputations. As a result, we have greater access to potential acquisitions, financing, leasing and other opportunities, and are better able to negotiate with customers. As the number of our competitors increases, it becomes more likely that a competitor would attempt to hire certain of these individuals away from our Company. The loss of any of these key personnel would result in the loss of these and other benefits and could materially and adversely affect our results of operations.

We also depend on the talents and efforts of highly skilled technical individuals. Our success depends on our continuing ability to identify, hire, develop, motivate, and retain highly skilled technical personnel for all areas of our organization. Competition in our industry for qualified technical employees is intense, and the availability of qualified technical personnel is not guaranteed.

We may have difficulty managing our growth.

We have significantly and rapidly expanded the size of our Company. Our growth may significantly strain our management, operational and financial resources and systems. In addition, as a reporting company, we are subject to the reporting requirements of the Securities Exchange Act of 1934 and the Sarbanes-Oxley Act of 2002, or the Sarbanes-Oxley Act. The requirements of these rules and regulations subject us to certain accounting, legal and financial compliance costs and may strain our management and financial, legal and operational resources and systems. An inability to manage our growth effectively or the increased strain on our management of our resources and systems could result in deficiencies in our disclosure controls and procedures or our internal control over financial reporting and could negatively impact financial condition, results of operations and our cash available for distribution.

Potential losses may not be covered by insurance.

We currently carry commercial general liability, property, business interruption, including loss of rental income, and other insurance policies to cover insurable risks to our Company. We select policy specifications, insured limits and deductibles which we believe to be appropriate and adequate given the relative risk of loss, the cost of the coverage and standard industry practices. Our insurance policies contain industry standard exclusions and we do not carry insurance for generally uninsurable perils, such as loss from war or nuclear reaction. A significant portion of our properties are

35

Table of Contents

Index to Financial Statements

located in seismically active zones such as California, which represents approximately 9% of our portfolio’s annualized rent as of  December 31, 2021. One catastrophic event, for example, in California, could significantly impact multiple properties, the aggregate deductible amounts could be significant and the limits we purchase could prove to be insufficient, which could materially and adversely impact our business, financial condition and results of operations. Furthermore, a catastrophic regional event could also severely impact some of our insurers rendering them insolvent or unable to fully pay on claims despite their current financial strength. We may discontinue purchasing insurance against earthquake, flood or windstorm or other perils on some or all of our properties in the future if the cost of premiums for any of these policies exceeds, in our judgment, the value of the coverage relative to the risk of loss.

In addition, many of our buildings contain extensive and highly valuable technology-related improvements. Under the terms of our agreements with customers, customers are obligated to maintain adequate insurance coverage applicable to such improvements and under most circumstances use their insurance proceeds to restore such improvements after a casualty event. In the event of a casualty or other loss involving one of our buildings with extensive installed tenant improvements, our customers may have the right to terminate their leases if we do not rebuild the base building within prescribed times. In such cases, the proceeds from customers’ insurance will not be available to us to restore the improvements, and our insurance coverage may be insufficient to replicate the technology-related improvements made by such customers. Furthermore, the terms of our mortgage indebtedness at certain of our properties may require us to pay insurance proceeds over to our lenders under certain circumstances, rather than use the proceeds to repair the property. If we or one or more of our customers experience a loss which is uninsured or which exceeds policy limits, we could lose the capital invested in the damaged properties as well as the anticipated future cash flows from those properties. In addition, if the damaged properties are subject to recourse indebtedness, we would continue to be liable for the indebtedness, even if these properties were irreparably damaged.

We could incur significant costs related to environmental matters, including from government regulation, private litigation, and existing conditions at some of our properties.

Under various laws relating to the protection of the environment in the United States, as well as in many jurisdictions in Europe, Asia and South America, a current or previous owner or operator of real estate may be liable for contamination resulting from the presence or discharge of hazardous or toxic substances at a property, and may be required to investigate and clean up such contamination at or emanating from a property. Such laws often impose liability without regard to whether the owner or operator knew of, or was responsible for, the presence of the contaminants, and the liability may be joint and several. In the United States, the Comprehensive Environmental Response, Compensation, and Liability Act of 1980, or CERCLA, established a regulatory and remedial program intended to provide for the investigation and clean-up of facilities where, or from which, a release of any hazardous substance into the environment has occurred or is threatened. CERCLA’s primary mechanism for remedying such problems is to impose strict joint and several liability for clean-up of facilities on current owners and operators of the site, former owners and operators of the site at the time of the disposal of the hazardous substances, any person who arranges for the transportation, disposal or treatment of the hazardous substances, and the transporters who select the disposal and treatment facilities, regardless of the care exercised by such persons. CERCLA also imposes liability for the cost of evaluating and remedying any damage to natural resources. The costs of CERCLA investigation and clean-up can be very substantial. CERCLA also authorizes the imposition of a lien in favor of the United States on all real property subject to, or affected by, a remedial action for all costs for which a party is liable. Subject to certain procedural restrictions, CERCLA gives a responsible party the right to bring a contribution action against other responsible parties for their allocable shares of investigative and remedial costs. Our ability to obtain reimbursement from others for their allocable shares of such costs would be limited by our ability to find other responsible parties and prove the extent of their responsibility, their financial resources, and other procedural requirements. Various state laws, as well as laws in Europe, Asia and South America, also impose in certain cases strict joint and several liability for investigation, clean-up and other damages associated with hazardous substance releases.

Previous owners used some of our properties for industrial and manufacturing purposes, and those properties may contain some level of environmental contamination. Independent environmental consultants have conducted Phase I or similar environmental site assessments on a majority of the properties in our portfolio. Site assessments are intended to discover and evaluate information regarding the environmental condition of the surveyed property and surrounding properties. These assessments do not generally include soil samplings, subsurface investigations or an asbestos survey and the assessments may fail to reveal all environmental conditions, liabilities or compliance concerns. In addition,

36

Table of Contents

Index to Financial Statements

material environmental conditions, liabilities or compliance concerns may have arisen after these reviews were completed or may arise in the future. We could be held jointly and severally liable under CERCLA and various state, local and national laws for the investigation and remediation of environmental contamination on our properties caused by previous owners or operators. Further, fuel storage tanks are present at most of our properties, and if releases were to occur, we may be liable for the costs of cleaning any resulting contamination. The presence of contamination or the failure to remediate contamination at our properties may expose us to third-party liability or materially adversely affect our ability to sell, lease or develop the real estate or to borrow using the real estate as collateral.

In addition, some of our customers, particularly those in the biotechnology and life sciences industry and those in the technology manufacturing industry, routinely handle hazardous substances and wastes as part of their operations at our properties. Environmental laws and regulations subject our customers, and potentially us, to liability resulting from these activities or from previous industrial or retail uses of those properties. We could be held jointly and severally liable under CERCLA and various state, local and national laws for the investigation and remediation of hazardous substances released by our customers on our properties. Environmental liabilities could also affect a customer’s ability to make rental payments to us. We cannot assure you that costs of investigation and remediation of environmental matters will not affect our ability to pay dividends to Digital Realty Trust, Inc.’s stockholders and distributions to Digital Realty Trust, L.P.’s unitholders or that such costs or other remedial measures will not have a material adverse effect on our business, assets or results of operations.

Some of our properties may contain asbestos-containing building materials and lead-based paint. Environmental laws require that asbestos-containing building materials and lead-based paint be properly managed and maintained, and may impose fines and penalties on building owners or operators for failure to comply with these requirements. These laws may also allow third parties to seek recovery from owners or operators for personal injury associated with exposure to asbestos-containing building materials and lead-based paint.

Our properties and their uses often require permits and entitlements from various government agencies, including permits and entitlements related to zoning and land use. Certain permits from state or local environmental regulatory agencies, including regulators of air quality, are usually required to install and operate diesel-powered generators, which provide emergency back-up power at most of our facilities. These permits often set emissions limits for certain air pollutants, including oxides of nitrogen. In addition, various federal, state, and local environmental, health and safety requirements, such as fire requirements and treated and storm water discharge requirements, apply to some of our properties. Our ability to comply with, as well as changes to, applicable regulations, such as air quality regulations, or the permit requirements for equipment at our facilities, could hinder or prevent our construction or operation of data center facilities.

Governmental authorities have in the past sought to restrict data center development based on environmental considerations. For example, governmental authorities in locations where we operate have imposed moratoria on data center development, citing concerns about energy usage and requiring new data centers to meet energy efficiency requirements. Some government agencies have also sought to restrict the use of diesel generators for back-up power. We may face higher costs from any laws requiring enhanced energy efficiency measures, changes to cooling systems, caps on energy usage, land use restrictions, limitations on back-up power sources, or other environmental requirements. Moratoria on data center construction could hinder our ability to construct new data centers.

Also, drought conditions in certain markets have resulted in water usage restrictions and proposals to further restrict water usage. Our data center facilities could face restrictions on water usage, water efficiency mandates, or higher water prices. Climate change could also limit water availability. In addition, sea level rise and more frequent and severe weather events caused or contributed to by climate change pose physical risks to our facilities. Additional risks related to our business and operations as a result of climate change include both physical and transition risks such as:

Higher energy costs (e.g., due to more extreme weather events, extreme temperatures or increased demand for limited resources);
Increased environmental regulations impacting the cost to develop, or the ability to develop in certain areas;
Higher costs of materials due to environmental impacts from extraction and processing of raw materials and production of finished goods;
Higher costs of supply chain services, with potential supply chain disruptions related to climate change; and

37

Table of Contents

Index to Financial Statements

Lost revenue or higher expenses related to climate change events (e.g., higher insurance costs, uninsured losses, diminished customer retention in areas subject to extreme weather or resource availability constraints).

The environmental laws and regulations to which our properties are subject may change in the future, and new laws and regulations may be created. Future laws, ordinances or regulations may impose additional material environmental liability. Such laws include those directly regulating our climate change impacts and those which regulate the climate change impacts of companies with which we do business, such as utilities providing our facilities with electricity. See “Item 1. Business—Regulations—Environmental Matters—Climate change legislation.” We do not know if or how the requirements will change, but changes may require that we make significant unanticipated expenditures, and such expenditures may materially adversely impact our financial condition, cash flow, results of operations, cash available for distributions, Digital Realty Trust, Inc.’s common stock’s per share trading price, our competitive position and ability to satisfy our debt service obligations.

Our properties may contain or develop harmful mold or suffer from other air quality issues, which could lead to liability for adverse health effects and costs to remedy the problem.

When excessive moisture accumulates in buildings or on building materials, mold may grow, particularly if the moisture problem remains undiscovered or is not addressed over a period of time. Some molds may produce airborne toxins or irritants. Indoor air quality issues can also stem from inadequate ventilation, chemical contamination from indoor or outdoor sources and other biological contaminants such as pollen, viruses and bacteria. Indoor exposure to airborne toxins or irritants above certain levels can be alleged to cause a variety of adverse health effects and symptoms, including allergic or other reactions. As a result, the presence of significant mold or other airborne contaminants, such as Legionella, at any of our properties could require us to undertake a costly remediation program to contain or remove the mold or other airborne contaminants from the affected property or increase indoor ventilation. In addition, the presence of significant mold or other airborne contaminants could expose us to liability from our customers, their employees, our employees and others if property damage or health concerns arise.

We may incur significant costs complying with applicable laws and governmental regulations, including the Americans with Disabilities Act.

Our business is subject to regulation under a wide variety of U.S. federal, state and local laws, regulations and policies, including those imposed by the SEC, the Sarbanes-Oxley Act of 2002, the Dodd-Frank Wall Street Reform and Consumer Protection Act and the NYSE, as well as applicable local, state, and national labor laws. Although we have policies and procedures designed to comply with applicable laws and regulations, failure to comply with the various laws and regulations may result in civil and criminal liability, fines and penalties and increased costs of compliance.

Under the Americans with Disabilities Act of 1990, or the ADA, all public accommodations must meet federal requirements related to access and use by disabled persons. We have not conducted an audit or investigation of all of our properties to determine our compliance with the ADA or similar laws of other jurisdictions in which we operate. If one or more of the properties in our portfolio does not comply with the ADA or such other laws, then we would be required to incur additional costs to bring the property into compliance. Additional federal, state and local laws also may require modifications to our properties, or restrict our ability to renovate our properties. We cannot predict the ultimate cost of compliance with the ADA or other laws. If we incur substantial costs to comply with the ADA and any other similar legislation or are subject to awards of damages to private litigants, our financial condition, results of operations, cash flow, cash available for distribution and ability to satisfy our debt service obligations could be materially adversely affected.

The properties in our portfolio are subject to various federal, state and local regulations, such as state and local fire and life safety regulations. If we fail to comply with these various regulations, we may have to pay fines or damage awards to private litigants. In addition, we do not know whether existing regulations will change or whether future regulations will require us to make significant unanticipated expenditures that will materially adversely impact our financial condition, results of operations, cash flow, cash available for distribution and ability to satisfy our debt service obligations.

Our business could be adversely impacted if there are deficiencies in our disclosure controls and procedures or internal control over financial reporting.

38

Table of Contents

Index to Financial Statements

The design and effectiveness of our disclosure controls and procedures and internal control over financial reporting may not prevent all errors, misstatements or misrepresentations. While management will continue to review the effectiveness of our disclosure controls and procedures and internal control over financial reporting, there can be no guarantee that our internal control over financial reporting will be effective in accomplishing all control objectives all of the time. Furthermore, our disclosure controls and procedures and internal control over financial reporting with respect to entities that we do not control or manage may be substantially more limited than those we maintain with respect to the subsidiaries that we have controlled or managed over the course of time. Deficiencies, including any material weakness, in our internal control over financial reporting which may occur in the future could result in misstatements of our results of operations, restatements of our financial statements, a decline in Digital Realty Trust, Inc.’s stock price, or otherwise materially adversely affect our business, reputation, results of operations, financial condition or liquidity.

Risks Related to Our Organizational Structure

Digital Realty Trust, Inc.’s duty to its stockholders may conflict with the interests of Digital Realty Trust, L.P.’s unitholders.

Conflicts of interest may exist or could arise in the future as a result of the relationships between Digital Realty Trust, Inc. and its stockholders, on the one hand, and Digital Realty Trust, L.P. and its partners, on the other. Digital Realty Trust, Inc.’s directors and officers have duties to Digital Realty Trust, Inc. and its stockholders under Maryland law in connection with their management of our Company. At the same time, Digital Realty Trust, Inc., as general partner, has fiduciary duties under Maryland law to Digital Realty Trust, L.P. and to the limited partners in connection with the management of our Operating Partnership. Digital Realty Trust, Inc.’s duties as general partner to Digital Realty Trust, L.P. and its partners may come into conflict with the duties of Digital Realty Trust, Inc.’s directors and officers to Digital Realty Trust, Inc. and its stockholders. Under Maryland law, a general partner of a Maryland limited partnership owes its limited partners the duties of loyalty and care, which must be discharged consistently with the obligation of good faith and fair dealing, unless the partnership agreement provides otherwise. The partnership agreement of Digital Realty Trust, L.P. provides that for so long as Digital Realty Trust, Inc. owns a controlling interest in Digital Realty Trust, L.P., any conflict that cannot be resolved in a manner not adverse to either Digital Realty Trust, Inc.’s stockholders or the limited partners will be resolved in favor of Digital Realty Trust, Inc.’s stockholders.

The provisions of Maryland law that allow the fiduciary duties of a general partner to be modified by a partnership agreement have not been tested in a court of law, and we have not obtained an opinion of counsel covering the provisions set forth in the partnership agreement that purport to waive or restrict Digital Realty Trust, Inc.’s fiduciary duties.

Digital Realty Trust, Inc.’s stockholders and Digital Realty Trust, L.P.’s unitholders are also subject to the following additional conflict of interest:

Tax consequences upon sale or refinancing. Sales of properties and repayment of certain indebtedness will affect holders of common units in Digital Realty Trust, L.P. and Digital Realty Trust, Inc.’s stockholders differently. Consequently, these holders of common units in Digital Realty Trust, L.P. may have different objectives regarding the appropriate pricing and timing of any such sale or repayment of debt. While Digital Realty Trust, Inc. has exclusive authority under the partnership agreement of Digital Realty Trust, L.P. to determine when to refinance or repay debt or whether, when, and on what terms to sell a property, such decisions may require the approval of Digital Realty Trust, Inc.’s Board of Directors. Certain of Digital Realty Trust, Inc.’s directors and executive officers could exercise their influence in a manner inconsistent with the interests of some, or a majority, of Digital Realty Trust, L.P.’s unitholders, including in a manner which could prevent completion of a sale of a property or the repayment of indebtedness.

Digital Realty Trust, Inc.’s charter, Digital Realty Trust, L.P.’s partnership agreement and Maryland law contain provisions that may delay, defer or prevent a change of control transaction.

These provisions include the following:

Digital Realty Trust, Inc.’s charter, including the articles supplementary governing its preferred stock, contains 9.8% ownership limits. Digital Realty Trust, Inc.’s charter, subject to certain exceptions, authorizes Digital Realty Trust, Inc.’s Board of Directors to take such actions as are necessary and desirable to preserve Digital Realty Trust, Inc.’s qualification as a REIT and to limit any person to actual or constructive ownership of no more than 9.8% (by value or by

39

Table of Contents

Index to Financial Statements

number of shares, whichever is more restrictive) of the outstanding shares of Digital Realty Trust, Inc.’s common stock, 9.8% (by value or by number of shares, whichever is more restrictive) of the outstanding shares of any series of Digital Realty Trust, Inc.’s preferred stock and 9.8% of the value of Digital Realty Trust, Inc.’s outstanding capital stock. Digital Realty Trust, Inc.’s Board of Directors, in its sole discretion, may exempt (prospectively or retroactively) a proposed transferee from the ownership limit. However, Digital Realty Trust, Inc.’s Board of Directors may not grant an exemption from the ownership limit to any proposed transferee whose direct or indirect ownership of more than 9.8% of the outstanding shares of Digital Realty Trust, Inc.’s common stock, more than 9.8% of the outstanding shares of any series of Digital Realty Trust, Inc.’s preferred stock or more than 9.8% of the value of Digital Realty Trust, Inc.’s outstanding capital stock could jeopardize Digital Realty Trust, Inc.’s status as a REIT. These restrictions on transferability and ownership will not apply if Digital Realty Trust, Inc.’s Board of Directors determines that it is no longer in Digital Realty Trust, Inc.’s best interests to attempt to qualify, or to continue to qualify, as a REIT or that compliance is no longer required for REIT qualification. The ownership limit may delay, defer or prevent a transaction or a change of control that might be in the best interest of Digital Realty Trust, Inc.’s stockholders and Digital Realty Trust, L.P.’s unitholders.

Digital Realty Trust, L.P.’s partnership agreement contains provisions that may delay, defer or prevent a change of control transaction. Digital Realty Trust, L.P.’s partnership agreement provides that Digital Realty Trust, Inc. may not engage in any merger, consolidation or other combination with or into another person, any sale of all or substantially all of its assets or any reclassification, recapitalization or change of its outstanding equity interests unless the transaction is approved by the holders of common units and long-term incentive units representing at least 35% of the aggregate percentage interests of all holders of common units and long-term incentive units and either:

all limited partners will receive, or have the right to elect to receive, for each common unit an amount of cash, securities or other property equal to the product of the number of shares of Digital Realty Trust, Inc. common stock into which a common unit is then exchangeable and the greatest amount of cash, securities or other property paid in consideration of each share of Digital Realty Trust, Inc. common stock in connection with the transaction (provided that, if, in connection with the transaction, a purchase, tender or exchange offer is made to and accepted by the holders of more than 50% of the shares of Digital Realty Trust, Inc. common stock, each holder of common units will receive, or have the right to elect to receive, the greatest amount of cash, securities or other property which such holder would have received if it exercised its right to redemption and received shares of Digital Realty Trust, Inc. common stock in exchange for its common units immediately prior to the expiration of such purchase, tender or exchange offer and thereupon accepted such purchase, tender or exchange offer and the transaction was then consummated); or
the following conditions are met:
osubstantially all of the assets directly or indirectly owned by the surviving entity in the transaction are held directly or indirectly by Digital Realty Trust, L.P. or another limited partnership or limited liability company which is the survivor of a merger, consolidation or combination of assets with Digital Realty Trust, L.P., which we refer to as the surviving partnership;
othe holders of common units and long-term incentive units own a percentage interest of the surviving partnership based on the relative fair market value of Digital Realty Trust, L.P.’s net assets and the other net assets of the surviving partnership immediately prior to the consummation of such transaction;
othe rights, preferences and privileges of the holders of interests in the surviving partnership are at least as favorable as those in effect immediately prior to the consummation of such transaction and as those applicable to any other limited partners or non-managing members of the surviving partnership; and
othe rights of the limited partners or non-managing members of the surviving partnership include at least one of the following: (i) the right to redeem their interests in the surviving partnership for the consideration available to such persons pursuant to Digital Realty Trust, L.P.’s partnership agreement; or (ii) the right to redeem their interests for cash on terms equivalent to those in effect with respect to their common units immediately prior to the consummation of such transaction (or,

40

Table of Contents

Index to Financial Statements

if the ultimate controlling person of the surviving partnership has publicly traded common equity securities, for such common equity securities, with an exchange ratio based on the determination of relative fair market value of such securities and the shares of Digital Realty Trust, Inc. common stock).

These provisions may discourage others from trying to acquire control of Digital Realty Trust, Inc. and may delay, defer or prevent a change of control transaction that might be beneficial to Digital Realty Trust, Inc.’s stockholders and Digital Realty Trust, L.P.’s unitholders.

The change of control conversion features of Digital Realty Trust, Inc.’s preferred stock may make it more difficult for a party to take over our Company or discourage a party from taking over our Company. Upon the occurrence of specified change of control transactions, holders of our series J preferred stock, series K preferred stock and series L preferred stock will have the right (unless, prior to the change of control conversion date, we have provided or provide notice of our election to redeem such preferred stock) to convert some or all of their series J preferred stock, series K preferred stock or series L preferred stock, as applicable, into shares of our common stock (or equivalent value of alternative consideration), subject to caps set forth in the articles supplementary governing the applicable series of preferred stock. The change of control conversion features of the series J preferred stock, series K preferred stock and series L preferred stock may have the effect of discouraging a third party from making an acquisition proposal for our Company or of delaying, deferring or preventing certain change of control transactions of our Company under circumstances that otherwise could provide the holders of our common stock, series J preferred stock, series K preferred stock and series L preferred stock with the opportunity to realize a premium over the then-current market price or that stockholders may otherwise believe is in their best interests.

Digital Realty Trust, Inc. could increase or decrease the number of authorized shares of stock and issue stock without stockholder approval. Digital Realty Trust, Inc.’s charter authorizes Digital Realty Trust, Inc.’s Board of Directors, without stockholder approval, to amend the charter from time to time to increase or decrease the aggregate number of authorized shares of stock or the number of authorized shares of stock of any class or series, to issue authorized but unissued shares of Digital Realty Trust, Inc.’s common stock or preferred stock and, subject to the voting rights of holders of preferred stock, to classify or reclassify any unissued shares of Digital Realty Trust, Inc.’s common stock or preferred stock into other classes of series of stock and to set the preferences, rights and other terms of such classified or reclassified shares. Although Digital Realty Trust, Inc.’s Board of Directors has no such intention at the present time, it could establish an additional class or series of preferred stock that could, depending on the terms of such class or series, delay, defer or prevent a transaction or a change of control that might be in the best interest of Digital Realty Trust, Inc.’s stockholders and Digital Realty Trust, L.P.’s unitholders.

Certain provisions of Maryland law could inhibit changes in control. Certain provisions of the Maryland General Corporation Law, or MGCL, may have the effect of impeding a third party from making a proposal to acquire Digital Realty Trust, Inc. or of impeding a change of control under circumstances that otherwise could be in the best interests of Digital Realty Trust, Inc.’s stockholders and Digital Realty Trust, L.P.’s unitholders, including:

“business combination” provisions that, subject to limitations, prohibit certain business combinations between Digital Realty Trust, Inc. and an “interested stockholder” (defined generally as any person who beneficially owns, directly or indirectly, 10% or more of the voting power of Digital Realty Trust, Inc.’s outstanding shares of voting stock or an affiliate or associate of Digital Realty Trust, Inc. who, at any time within the two-year period prior to the date in question, was the beneficial owner, directly or indirectly, of 10% or more of the voting power of Digital Realty Trust, Inc.’s then outstanding shares of stock) or an affiliate thereof for five years after the most recent date on which the stockholder becomes an interested stockholder, and thereafter impose special appraisal rights and supermajority voting requirements on these combinations; and
“control share” provisions that provide that “control shares” of Digital Realty Trust, Inc. (defined as shares which, when aggregated with other shares controlled by the stockholder (except solely by virtue of a revocable proxy), entitle the stockholder to exercise one of three increasing ranges of voting power in electing directors) acquired in a “control share acquisition” (defined as the direct or indirect acquisition of ownership or control of issued and outstanding “control shares”) have no voting rights except to the extent approved by Digital Realty Trust, Inc.’s stockholders by the affirmative vote of at least two-thirds of all the votes entitled to be cast on the matter, excluding all interested shares.

41

Table of Contents

Index to Financial Statements

Digital Realty Trust, Inc. has opted out of these provisions of the MGCL, in the case of the business combination provisions of the MGCL by resolution of its Board of Directors, and in the case of the control share provisions of the MGCL pursuant to a provision in its bylaws. However, Digital Realty Trust, Inc.’s Board of Directors may by resolution elect to opt in to the business combination provisions of the MGCL and Digital Realty Trust, Inc. may, by amendment to its bylaws, opt in to the control share provisions of the MGCL in the future.

The provisions of Digital Realty Trust, Inc.’s charter governing removal of directors and the advance notice provisions of Digital Realty Trust, Inc.’s bylaws could delay, defer or prevent a change of control or other transaction that might be in the best interests of Digital Realty Trust, Inc.’s stockholders and Digital Realty Trust, L.P.’s unitholders. Likewise, if Digital Realty Trust, Inc.’s board of directors were to opt in to the business combination provisions of the MGCL or the provisions of Title 3, Subtitle 8 of the MGCL not currently applicable to Digital Realty Trust, Inc., or if the provision in Digital Realty Trust, Inc.’s bylaws opting out of the control share acquisition provisions of the MGCL were rescinded, these provisions of the MGCL could have similar anti-takeover effects.

The conversion rights of Digital Realty Trust, Inc.’s preferred stock may be detrimental to holders of Digital Realty Trust, Inc.’s common stock.

Digital Realty Trust, Inc. currently has 8,000,000 shares of 5.250% series J cumulative redeemable preferred stock outstanding, 8,400,000 shares of 5.850% series K cumulative redeemable preferred stock outstanding and 13,800,000 shares of 5.200% series L cumulative redeemable preferred stock outstanding which may be converted into Digital Realty Trust, Inc. common stock upon the occurrence of limited specified change in control transactions. The conversion of the series J preferred stock, series K preferred stock or series L preferred stock for Digital Realty Trust, Inc. common stock would dilute stockholder ownership in Digital Realty Trust, Inc. and unitholder ownership in Digital Realty Trust, L.P., and could adversely affect the market price of Digital Realty Trust, Inc. common stock and could impair our ability to raise capital through the sale of additional equity securities.

Digital Realty Trust, Inc.’s rights and the rights of its stockholders to take action against its directors and officers are limited.

Maryland law provides that Digital Realty Trust, Inc.’s directors have no liability in their capacities as directors if they perform their duties in good faith, in a manner they reasonably believe to be in the Company’s best interests and with the care that an ordinarily prudent person in a like position would use under similar circumstances. As permitted by the MGCL, Digital Realty Trust, Inc.’s charter limits the liability of Digital Realty Trust, Inc.’s directors and officers to the Company and its stockholders for money damages, except for liability resulting from:

actual receipt of an improper benefit or profit in money, property or services; or
a final judgment based upon a finding of active and deliberate dishonesty by the director or officer that was material to the cause of action adjudicated.

In addition, Digital Realty Trust, Inc.’s charter authorizes Digital Realty Trust, Inc. to obligate itself, and Digital Realty Trust, Inc.’s bylaws require it, to indemnify Digital Realty Trust, Inc.’s directors and officers for actions taken by them in those capacities and, without requiring a preliminary determination of the ultimate entitlement to indemnification, to pay or reimburse their reasonable expenses in advance of final disposition of a proceeding to the maximum extent permitted by Maryland law. Further, Digital Realty Trust, Inc. has entered into indemnification agreements with its directors and officers. As a result, Digital Realty Trust, Inc. and its stockholders may have more limited rights against its directors and officers than might otherwise exist under common law. Accordingly, in the event that actions taken in good faith by any of Digital Realty Trust, Inc.’s directors or officers impede the performance of the Company, the Company’s stockholders’ ability to recover damages from that director or officer will be limited.

Risks Related to Taxes and Digital Realty Trust, Inc.’s Status as a REIT

Failure to qualify as a REIT would have significant adverse consequences to Digital Realty Trust, Inc. and its stockholders and to Digital Realty Trust, L.P. and its unitholders.

Digital Realty Trust, Inc. has operated and intends to continue operating in a manner that it believes will allow it to qualify as a REIT for federal income tax purposes under the Code. Digital Realty Trust, Inc. has not requested and does not plan to request a ruling from the Internal Revenue Service, or the IRS, that it qualifies as a REIT. Qualification as a REIT involves the application of highly technical and complex Code provisions for which there are only limited judicial

42

Table of Contents

Index to Financial Statements

and administrative interpretations. The complexity of these provisions and of the applicable Treasury regulations promulgated under the Code, or Treasury Regulations, is greater in the case of a REIT that, like Digital Realty Trust, Inc., holds its assets through a partnership. The determination of various factual matters and circumstances not entirely within Digital Realty Trust, Inc.’s control may affect its ability to qualify as a REIT. In order to qualify as a REIT, Digital Realty Trust, Inc. must satisfy a number of requirements, including requirements regarding the ownership of its stock, requirements regarding the composition of its assets and requirements regarding the source of its income. Also, Digital Realty Trust, Inc. must make distributions to stockholders aggregating annually at least 90% of its REIT taxable income, excluding any net capital gains.

If Digital Realty Trust, Inc. loses its REIT status, it will face serious tax consequences that would substantially reduce its cash available for distribution, including cash available to pay dividends to its stockholders, for each of the years involved because:

Digital Realty Trust, Inc. would not be allowed a deduction for dividends paid to stockholders in computing its taxable income and would be subject to federal and state corporate income taxes on its taxable income;
Digital Realty Trust, Inc. also could be subject to the federal alternative minimum tax for taxable years prior to 2018 and possibly increased state and local taxes; and
unless Digital Realty Trust, Inc. is entitled to relief under applicable statutory provisions, it could not elect to be taxed as a REIT for four taxable years following the year during which it was disqualified.

In addition, if Digital Realty Trust, Inc. fails to qualify as a REIT, it will not be required to make distributions to common stockholders, and accordingly, distributions Digital Realty Trust, L.P. makes to its unitholders could be similarly reduced. As a result of all these factors, Digital Realty Trust, Inc.’s failure to qualify as a REIT could impair our ability to expand our business and raise capital, and could materially adversely affect the value of Digital Realty Trust, Inc.’s stock and Digital Realty Trust, L.P.’s units.

In certain circumstances, Digital Realty Trust, Inc. may be subject to federal and state taxes as a REIT, which would reduce its cash available for distribution to its stockholders.

Even if Digital Realty Trust, Inc. qualifies as a REIT for federal income tax purposes, it may be subject to some federal, state and local taxes on its income or property and, in certain cases, a 100% penalty tax, in the event it sells property as a dealer. In addition, our domestic corporate subsidiary, Digital Services, Inc., which is a taxable REIT subsidiary of Digital Realty Trust, Inc., could be subject to federal, state and local taxes, and our foreign properties and companies are subject to tax in the jurisdictions in which they operate and are located. A domestic taxable REIT subsidiary is subject to U.S. federal income tax as a regular C corporation. In addition, a 100% excise tax will be imposed on certain transactions between a taxable REIT subsidiary and its parent REIT that are not conducted on an arm’s length basis. Any federal, state or foreign taxes Digital Realty Trust, Inc. pays will reduce its cash available for distribution to stockholders.

To maintain Digital Realty Trust, Inc.’s REIT status, we may be forced to borrow funds during unfavorable market conditions.

To qualify as a REIT for federal income tax purposes, Digital Realty Trust, Inc. generally must distribute to its stockholders at least 90% of its REIT taxable income each year, excluding capital gains, and Digital Realty Trust, Inc. will be subject to federal and state corporate income taxes to the extent that it distributes less than 100% of its REIT taxable income each year. In addition, Digital Realty Trust, Inc. will be subject to a 4% nondeductible excise tax on the amount, if any, by which distributions paid by Digital Realty Trust, Inc. in any calendar year are less than the sum of 85% of its ordinary income, 95% of its capital gain net income and 100% of its undistributed income from prior years. While historically Digital Realty Trust, Inc. has satisfied these distribution requirements by making cash distributions to its stockholders, a REIT is permitted to satisfy these requirements by making distributions of cash or other property. We may need to borrow funds for Digital Realty Trust, Inc. to meet the REIT distribution requirements even if the then prevailing market conditions are not favorable for these borrowings. These borrowing needs could result from differences in timing between the actual receipt of cash and inclusion of income for federal income tax purposes, or the effect of non-deductible capital expenditures, the creation of reserves or required debt or amortization payments.

Dividends payable by REITs do not qualify for the reduced tax rates available for some dividends.

43

Table of Contents

Index to Financial Statements

The maximum tax rate applicable to “qualified dividend income” payable to U.S. stockholders that are individuals, trusts and estates is 20%. Dividends payable by REITs, however, generally are not eligible for these reduced rates. U.S. stockholders that are individuals, trusts and estates generally may deduct up to 20% of the ordinary dividends (i.e., dividends not designated as capital gain dividends or qualified dividend income) received from a REIT for taxable years beginning before January 1, 2026. Although this deduction reduces the effective tax rate applicable to certain dividends paid by REITs (generally to 29.6% assuming the shareholder is subject to the 37% maximum rate), such tax rate is still higher than the tax rate applicable to corporate dividends that constitute qualified dividend income. Accordingly, investors who are individuals, trusts and estates may perceive investments in REITs to be relatively less attractive than investments in the stocks of non-REIT corporations that pay dividends treated as qualified dividend income, which could materially and adversely affect the value of the shares of REITs, including the per share trading price of Digital Realty Trust, Inc.’s capital stock.

The tax imposed on REITs engaging in “prohibited transactions” may limit our ability to engage in transactions which would be treated as sales for federal income tax purposes.

A REIT’s net income from prohibited transactions is subject to a 100% penalty tax. In general, prohibited transactions are sales or other dispositions of property, other than foreclosure property, held primarily for sale to customers in the ordinary course of business. Although we do not intend to hold any properties that would be characterized as held for sale to customers in the ordinary course of our business, unless a sale or disposition qualifies under certain statutory safe harbors, such characterization is a factual determination and no guarantee can be given that the IRS would agree with our characterization of our properties or that we will always be able to make use of the available safe harbors.

Complying with REIT requirements may cause us to forgo otherwise attractive opportunities or liquidate otherwise attractive investments.

To qualify as a REIT for federal income tax purposes, Digital Realty Trust, Inc. must continually satisfy tests concerning, among other things, its sources of income, the nature and diversification of its assets (including its proportionate share of Digital Realty Trust, L.P.’s assets), the amounts it distributes to its stockholders and the ownership of its capital stock. If Digital Realty Trust, Inc. were to fail to comply with one or more of the asset tests at the end of any calendar quarter, it would need to correct the failure within 30 days after the end of the calendar quarter or qualify for certain statutory relief provisions to avoid losing its REIT qualification and suffering adverse tax consequences. In order to meet these tests, we may be required to forgo investments we might otherwise make or to liquidate otherwise attractive investments. Thus, compliance with the REIT requirements may hinder our performance and reduce amounts available for distribution to Digital Realty Trust, Inc.’s stockholders and Digital Realty Trust, L.P.’s unitholders.

The power of Digital Realty Trust, Inc.’s Board of Directors to revoke Digital Realty Trust, Inc.’s REIT election without stockholder approval may cause adverse consequences to Digital Realty Trust, Inc.’s stockholders and Digital Realty Trust, L.P.’s unitholders.

Digital Realty Trust, Inc.’s charter provides that its board of directors may revoke or otherwise terminate its REIT election, without the approval of its stockholders, if the board determines that it is no longer in Digital Realty Trust, Inc.’s best interests to continue to qualify as a REIT. If Digital Realty Trust, Inc. ceases to qualify as a REIT, it would become subject to U.S. federal and state corporate income taxes on its taxable income and it would no longer be required to distribute most of its taxable income to its stockholders and, accordingly, distributions Digital Realty Trust, L.P. makes to its unitholders could be similarly reduced.

If Digital Realty Trust L.P. were to fail to qualify as a partnership for federal income tax purposes, Digital Realty Trust, Inc. would fail to qualify as a REIT and suffer other adverse consequences.

We believe that Digital Realty Trust, L.P. has been organized and operated in a manner that will allow it to be treated as a partnership, and not an association or publicly traded partnership taxable as a corporation, for federal income tax purposes. As a partnership, Digital Realty Trust, L.P. is not subject to federal income tax on its income. Instead, each of its partners, including Digital Realty Trust, Inc., is allocated, and may be required to pay tax with respect to, that partner’s share of Digital Realty Trust, L.P.’s income. No assurance can be provided, however, that the IRS will not challenge Digital Realty Trust, L.P.’s status as a partnership for federal income tax purposes or that a court would not sustain such a challenge. If the IRS were successful in treating Digital Realty Trust, L.P. as an association or publicly

44

Table of Contents

Index to Financial Statements

traded partnership taxable as a corporation for federal income tax purposes, Digital Realty Trust, Inc. would fail to meet the gross income tests and certain of the asset tests applicable to REITs and, accordingly, would cease to qualify as a REIT. Such REIT qualification failure could impair our ability to expand our business and raise capital, and would materially adversely affect the value of Digital Realty Trust, Inc.’s stock and Digital Realty Trust, L.P.’s units. Also, the failure of Digital Realty Trust, L.P. to qualify as a partnership would cause it to become subject to federal corporate income tax, which would reduce significantly the amount of its cash available for debt service and for distribution to its partners, including Digital Realty Trust, Inc.

Changes in U.S. or foreign tax laws and regulations, including changes to tax rates, legislation and other actions may adversely affect our results of operations, our stockholders, Digital Realty Trust, L.P.’s unitholders and us.

We are headquartered in the United States with subsidiaries and operations globally and are subject to income taxes in these jurisdictions. Significant judgment is required in determining our provision for income taxes. Although we believe that we have adequately assessed and accounted for our potential tax liabilities, and that our tax estimates are reasonable, there can be no assurance that additional taxes will not be due upon audit of our tax returns or as a result of changes to applicable tax laws. The governments of many of the countries in which we operate may enact changes to the tax laws of such countries, including changes to the corporate recognition and taxation of worldwide income. The nature and timing of any changes to each jurisdiction’s tax laws and the impact on our future tax liabilities cannot be predicted with any accuracy but could materially and adversely impact our results of operations and cash flows.

Additionally, each of our properties is subject to real property and personal property taxes. These taxes may increase as tax rates change and as the properties are assessed or reassessed by taxing authorities. Any increase in property taxes on our properties could have a material adverse effect on our revenues and results of operations.

Further, the rules dealing with federal income taxation are constantly under review by persons involved in the legislative process and by the IRS and the U.S. Department of the Treasury. Changes to the tax laws, with or without retroactive application, could materially and adversely affect Digital Realty Trust, Inc.’s stockholders, Digital Realty Trust, L.P.’s unitholders and us. We cannot predict how changes in the tax laws might affect our investors and us. New legislation, Treasury Regulations, administrative interpretations or court decisions could significantly and negatively affect Digital Realty Trust, Inc.’s ability to qualify as a REIT, the federal income tax consequences of such qualification, or the federal income tax consequences of an investment in us. Moreover, the law relating to the tax treatment of other entities, or an investment in other entities, could change, making an investment in such other entities more attractive relative to an investment in a REIT.

Tax liabilities and attributes inherited in connection with acquisitions may adversely impact our business.

From time to time we may acquire other corporations or entities and, in connection with such acquisitions, we may succeed to the historic tax attributes and liabilities of such entities. For example, if we acquire a C corporation and subsequently dispose of its assets within five years of the acquisition, we could be required to pay tax on any built-in gain attributable to such assets determined as of the date on which we acquired the assets. In addition, in order to qualify as a REIT, at the end of any taxable year, we must not have any earnings and profits accumulated in a non-REIT year. As a result, if we acquire a C corporation, we must distribute the corporation’s earnings and profits accumulated prior to the acquisition before the end of the taxable year in which we acquire the corporation. We also could be required to pay the acquired entity’s unpaid taxes even though such liabilities arose prior to the time we acquired the entity.

Forward-Looking Statements

We make statements in this report that are forward-looking statements within the meaning of the federal securities laws. In particular, statements pertaining to our capital resources, portfolio performance, our ability to lease vacant space and space under development, leverage policy and acquisition and capital expenditure plans, as well as our discussion of “Factors Which May Influence Future Results of Operations,” contain forward-looking statements. Likewise, all of our statements regarding anticipated market conditions, demographics and results of operations are forward-looking statements. You can identify forward-looking statements by the use of forward-looking terminology such as “believes,” “expects,” “may,” “will,” “should,” “seeks,” “approximately,” “intends,” “plans,” “pro forma,” “estimates” or “anticipates” or the negative of these words and phrases or similar words or phrases which are predictions of or indicate

45

Table of Contents

Index to Financial Statements

future events or trends and which do not relate solely to historical matters. You can also identify forward-looking statements by discussions of strategy, plans or intentions.

Forward-looking statements involve numerous risks and uncertainties and you should not rely on them as predictions of future events. Forward-looking statements depend on assumptions, data or methods which may be incorrect or imprecise and we may not be able to realize them. We do not guarantee that the transactions and events described will happen as described or that they will happen at all. The following factors, among others, could cause actual results and future events to differ materially from those set forth or contemplated in the forward-looking statements:

reduced demand for data centers or decreases in information technology spending;
increased competition or available supply of data center space;
decreased rental rates, increased operating costs or increased vacancy rates;
the suitability of our data centers and data center infrastructure, delays or disruptions in connectivity or availability of power, or failures or breaches of our physical or information technology or operational technology infrastructure or services;
breaches of our obligations or restrictions under our contracts with our customers;
our inability to successfully develop and lease new properties and development space, and delays or unexpected costs in development of properties;
the impact of current global and local economic, credit and market conditions;
global supply chain or procurement disruptions, or increased supply chain costs;
our inability to retain data center space that we lease or sublease from third parties;
information security and data privacy breaches;
difficulties managing an international business and acquiring or operating properties in foreign jurisdictions and unfamiliar metropolitan areas;
our failure to realize the intended benefits from, or disruptions to our plans and operations or unknown or contingent liabilities related to, our recent acquisitions;
our failure to successfully integrate and operate acquired or developed properties or businesses;
difficulties in identifying properties to acquire and completing acquisitions;
risks related to joint venture investments, including as a result of our lack of control of such investments;
risks associated with using debt to fund our business activities, including re-financing and interest rate risks, our failure to repay debt when due, adverse changes in our credit ratings or our breach of covenants or other terms contained in our loan facilities and agreements;
our failure to obtain necessary debt and equity financing, and our dependence on external sources of capital;
financial market fluctuations and changes in foreign currency exchange rates;
adverse economic or real estate developments in our industry or the industry sectors that we sell to, including risks relating to decreasing real estate valuations and impairment charges and goodwill and other intangible asset impairment charges;
our inability to manage our growth effectively;
losses in excess of our insurance coverage;
our inability to attract and retain talent;
impact on our operations and on the operations of our customers, suppliers and business partners during a pandemic, such as COVID-19;
environmental liabilities, risks related to natural disasters and our inability to achieve our sustainability goals;
our inability to comply with rules and regulations applicable to our Company;
Digital Realty Trust, Inc.’s failure to maintain its status as a REIT for federal income tax purposes;
Digital Realty Trust, L.P.’s failure to qualify as a partnership for federal income tax purposes;
restrictions on our ability to engage in certain business activities;
changes in local, state, federal and international laws and regulations, including related to taxation, real estate and zoning laws, and increases in real property tax rates; and
the impact of any financial, accounting, legal or regulatory issues or litigation that may affect us.

46

Table of Contents

Index to Financial Statements

The risks included here are not exhaustive, and additional factors could adversely affect our business and financial performance, including factors and risks included in other sections of this report, including under Part I, Item 1A, Risk Factors. Moreover, we operate in a very competitive and rapidly changing environment. New risk factors emerge from time to time and it is not possible for management to identify all such risk factors, nor can we assess the impact of all such risk factors on the business or the extent to which any factor, or combination of factors, may cause actual results to differ materially from those contained in any forward-looking statements. While forward-looking statements reflect our good faith beliefs, they are not guaranties of future performance. We disclaim any obligation to publicly update or revise any forward-looking statement to reflect changes in underlying assumptions or factors, new information, data or methods, future events or other changes.

ITEM 1B.         UNRESOLVED STAFF COMMENTS

None.

ITEM 2.           PROPERTIES

General

In addition to the information in this Item 2, certain information regarding our portfolio is contained in Schedule III (Financial Statement Schedule) under Part IV, Item 15(a) (2) and which is included in Part II, Item 8.

Our Portfolio

The following table presents an overview of our portfolio of properties, including the 50 data centers held as investments in unconsolidated entities and developable land, based on information as of December 31, 2021 (dollar amounts in thousands). All data centers are held in fee simple except as otherwise indicated. Please refer to Note 11 in the Notes to the Consolidated Financial Statements included in Part II, Item 8 of this Annual Report on Form 10-K for a description of all applicable encumbrances as of December 31, 2021.

47

Table of Contents

Index to Financial Statements


Space Under


Data Center

Net Rentable

Active

Space Held for

Occupancy


Metropolitan Area

Buildings

Square Feet (1)

Development (2)

Development (3)

Percentage (4)


North America

Northern Virginia


22


5,404,662


780,016


128,694

91.1

%

Chicago


10


3,428,169


148,101

89.1

%

New York


13


2,103,114


147,753


106,407

82.4

%

Dallas


21


3,550,639


136,445


8,204

79.8

%

Silicon Valley


15


1,591,835


130,752

97.4

%

Phoenix


2


795,697


72.1

%

San Francisco


4


843,339


66.1

%

Atlanta


4


525,414


41,661


313,581

95.1

%

Seattle


1


398,735


85.3

%

Los Angeles

2


580,764


37,713


83.3

%

Portland

2


399,095


756,483


98.4

%

Toronto

2


300,307


427,050


85.6

%

Boston


3


437,119


50,649

49.9

%

Houston


6


392,816


13,969

70.4

%

Miami

2


226,314


89.9

%

Minneapolis


1


328,765


100.0

%

Austin


1


85,688


52.5

%

Charlotte


3


95,499


89.5

%

North America Total


114


21,487,970


2,327,121


900,357

85.4

%

Europe


London

16


1,433,240


64,274


95,832

68.0

%

Frankfurt

27


1,893,266


1,327,522


80.1

%

Amsterdam

13


1,220,639


46,240


95,262

70.2

%

Paris

10


598,536


314,876


82.7

%

Marseille

4


389,484


165,435


74.0

%

Vienna

2


351,418


79.5

%

Dublin

8


440,917


112,135


77.3

%

Zurich

3


284,671


258,240


82.5

%

Madrid

4


218,282


225,140


76.1

%

Brussels

4


171,470


186,464


62.6

%

Stockholm

6


205,304


48,492


63.7

%

Copenhagen

3


162,182


163,696


78.7

%

Dusseldorf

3


105,523


107,600


59.7

%

Athens

3


55,170


92,536


74.4

%

Zagreb

1


19,105


12,801


55.3

%

Europe Total

107


7,549,209


3,125,451


191,094

74.6

%

Asia Pacific


Singapore

3


882,847


84.3

%

Sydney

4


226,697


222,838


86.4

%

Melbourne

2


146,570


62.8

%

Hong Kong

1


99,129


185,622


%

Seoul

1


162,260


%

Osaka

1

235,532

%

Asia Pacific Total

12


1,355,243


806,252


76.2

%

Africa

Nairobi

1


15,710


61.9

%

Mombasa

2


10,115


37,025


53.2

%

Maputo

1


3,940


%

Africa Total

4


25,825


40,965


58.5

%

Non-Data Center Properties


263,668


100.0

%

Managed Unconsolidated Entities


Northern Virginia

8


1,482,337


93.8

%

Silicon Valley

4


414,267


100.0

%

Hong Kong

1


186,300


87.3

%

Toronto

1


104,308


100.0

%

Los Angeles


2


196,517


100.0

%


16


2,383,729


95.2

%

Non-Managed Unconsolidated Entities


Sao Paulo

20


1,022,251


183,498


1,033,967

96.9

%

Osaka

3


277,031


248,590


94.5

%

Tokyo

3


980,916


318,415


70.3

%

Fortaleza

1


94,205


100.0

%

Rio De Janeiro

2


72,442


26,781


100.0

%

Seattle

1


51,000


100.0

%

Santiago

2


67,340


45,209


180,835

68.7

%

Queretaro

2


108,178


376,202

%

34


2,565,185


930,670


1,591,004

86.0

%

Total


287


35,630,828


7,230,460


2,682,456

83.6

%

(1)Net rentable square feet at a building represents the current square feet at that building under lease as specified in the lease agreements plus management’s estimate of space available for lease. We estimate the total net rentable square feet available for lease based on a number of factors in addition to contractually leased square feet, including

48

Table of Contents

Index to Financial Statements

available power, required support space and common area. Net rentable square feet includes tenants’ proportional share of common areas but excludes space held for development.
(2)Space under active development includes current base building and data center projects in progress.
(3)Space held for development includes space held for future data center development, and excludes space under active development.
(4)Excludes space held for development and space under active development. We estimate the total square feet available for lease based on a number of factors in addition to contractually leased square feet, including available power, required support space and common area.

We lease space from third parties under noncancellable leases for: our corporate headquarters, several regional office locations, certain data centers, and certain equipment. In addition, we are subject to ground leases at certain data centers primarily in Europe and Singapore.

Customer Diversification

The following table sets forth information regarding the 20 largest customers in our portfolio based on annualized recurring revenue as of December 31, 2021 (dollar amounts in thousands).


Weighted

Average 

Remaining 

Number

Annualized

% of Annualized

Lease 

of 

Recurring

Recurring

Term in 

Tenant

Locations

Revenue (1)

Revenue

Years

1


Fortune 50 Software Company


56


$

340,515


10.0

%  

8.9

2


IBM


36


138,065


4.1

%  

2.3

3


Oracle America, Inc.


29


114,935


3.4

%  

3.2

4


Global Cloud Provider

51


110,186


3.2

%  

3.3

5


Facebook, Inc.


38


106,583


3.1

%  

4.0

6


Fortune 25 Investment Grade-Rated Company


25


94,292


2.8

%  

4.5

7


Equinix


21


87,739


2.6

%  

8.0

8


LinkedIn Corporation


8


78,298


2.3

%  

2.9

9


Social Content Platform


11


72,253


2.1

%  

5.5

10


Fortune 500 SaaS Provider


15


66,522


2.0

%  

4.3

11


Cyxtera Technologies, Inc.


15


62,080


1.8

%  

10.2

12


Rackspace


20


61,921


1.8

%  

10.7

13


Fortune 25 Tech Company


44


59,258


1.7

%  

3.1

14


Lumen Technologies, Inc.


129


54,197


1.6

%  

4.7

15


Comcast Corporation


32


42,132


1.2

%  

4.3

16


JPMorgan Chase & Co.


17


40,898


1.2

%  

2.5

17


Verizon


99


40,582


1.2

%  

3.1

18


AT&T


75


37,000


1.1

%  

2.9

19


Social Media Platform


7


34,680


1.0

%  

8.9

20


Zayo


124


33,290


1.0

%  

2.0


Total / Weighted Average


$

1,675,426


49.2

%  

6.1

Note:   Represents consolidated portfolio in addition to our managed portfolio of unconsolidated entities based on our ownership percentage. Our direct customers may be the entities named in the table above or their subsidiaries or affiliates.

(1)Annualized recurring revenue represents the monthly contractual base rent (defined as cash base rent before abatements), and interconnection revenue under existing leases as of December 31, 2021 multiplied by 12.

49

Table of Contents

Index to Financial Statements

Lease Distribution

The following table sets forth information relating to the distribution of leases in the properties in our portfolio, based on size (in megawatts), excluding approximately 7.2 million square feet of space under active development and approximately 2.7 million square feet of space held for development at December 31, 2021, under lease as of December 31, 2021 (dollar amounts in thousands).


Percentage


Total Net

of Net 

Percentage


Rentable 

Rentable 

of 


Square 

Square

Annualized

Annualized 


Size

Feet(1)

Feet(1)

Rent(2)

Rent


Available


5,402,030


17.2

%


0 - 1 MW


4,783,464


15.2

%

$

1,038,685


34.3

%

> 1 MW


12,795,157


40.8

%


1,732,620


57.1

%

Other (3)


8,477,013


26.8

%


264,448


8.6

%

Total


31,457,664


100.0

%

$

3,035,753


100.0

%

Note:   Represents consolidated portfolio in addition to our managed portfolio of unconsolidated entities based on our ownership percentage.

(1)We estimate the total net rentable square feet available for lease based on a number of factors in addition to contractually leased square feet, including available power, required support space and common area.
(2)Annualized rent represents the monthly contractual base rent (defined as cash base rent before abatements) under existing leases as of December 31, 2021 multiplied by 12.
(3)Other includes unimproved building shell capacity as well as storage and office space within fully improved data center facilities.

50

Table of Contents

Index to Financial Statements

Lease Expirations

The following table sets forth a summary schedule of the lease expirations for leases in place as of December 31, 2021 plus available space for ten calendar years at the properties in our portfolio. The table excludes space that is currently under active development or held for active development. Unless otherwise stated in the footnotes to the table below, the information set forth in the table assumes that tenants exercise no renewal options and all early termination rights (dollar amounts in thousands).

Annualized

Percentage

Annualized

Rent Per

Square

of Net

Percentage

Rent Per

Occupied

Footage of

Rentable

of

Occupied

Square

Annualized

Expiring

Square

Annualized

Annualized

Square

Foot at

Rent at

Year

Leases (1)

Feet (1)

Rent (2)

Rent (2)

Foot

Expiration

Expiration

Available


5,402,030


17.2

%  


Month to Month (3)


289,908


0.9

%  

$

59,640


2.0

%  

$

206

$

206

$

59,790

2022


3,829,739


12.2

%  


806,656


26.6

%  


211


211


807,409

2023


3,646,102


11.6

%  


436,432


14.4

%  


120


122


446,393

2024


2,508,237


8.0

%  


328,223


10.8

%  


131


136


340,148

2025


2,968,276


9.4

%  


320,496


10.5

%  


108


114


339,329

2026


2,649,679


8.4

%  


280,903


9.2

%  


106


115


304,869

2027


1,619,483


5.1

%  


191,929


6.3

%  


119


127


205,520

2028


780,358


2.5

%  


71,685


2.4

%  


92


105


82,262

2029


1,413,025


4.5

%  


104,843


3.4

%  


74


89


126,247

2030


1,255,507


4.0

%  


92,704


3.1

%  


74


86


107,772

2031


1,042,453


3.3

%  


121,364


4.0

%  


116


134


139,803

Thereafter


4,052,868


12.9

%  


220,878


7.3

%  


54


64


259,784

Portfolio Total / Weighted Average


31,457,664


100.0

%  

$

3,035,753


100.0

%  

$

117

$

124

$

3,219,325

Note:   Represents consolidated portfolio in addition to our managed portfolio of unconsolidated entities based on our ownership percentage.

(1)For some of our properties, we calculate square footage based on factors in addition to contractually leased square feet, including available power, required support space and common area. We estimate the total net rentable square feet available for lease based on a number of factors in addition to contractually leased square feet, including available power, required support space and common area.
(2)Annualized rent represents the monthly contractual base rent (defined as cash base rent before abatements) under existing leases as of December 31, 2021 multiplied by 12.
(3)Includes leases, licenses and similar agreements that upon expiration have been automatically renewed on a month-to-month basis.

ITEM 3.         LEGAL PROCEEDINGS

In the ordinary course of our business, we may become subject to various legal proceedings. As of December 31, 2021, we were not a party to any legal proceedings which we believe would have a material adverse effect on our operations or financial position.

ITEM 4.        MINE SAFETY DISCLOSURES

Not applicable.

51

Table of Contents

Index to Financial Statements

PART II

ITEM 5.      MARKET FOR REGISTRANT’S COMMON EQUITY, RELATED STOCKHOLDER MATTERS AND ISSUER PURCHASES OF EQUITY SECURITIES

Digital Realty Trust, Inc.

Digital Realty Trust, Inc.’s common stock has been listed, and is traded, on the New York Stock Exchange, or the NYSE, under the symbol “DLR” since October 29, 2004.

Subject to the distribution requirements applicable to REITs under the Code, Digital Realty Trust, Inc. intends, to the extent practicable, to invest substantially all of the proceeds from sales and refinancings of its assets in real estate-related assets and other assets. Digital Realty Trust, Inc. may, however, under certain circumstances, make a dividend of capital or of assets. Such dividends, if any, will be made at the discretion of Digital Realty Trust, Inc.’s Board of Directors.

As of February 22, 2022, there were approximately 59 holders of record of Digital Realty Trust, Inc.’s common stock. This figure does not reflect the beneficial ownership of shares held in nominee name.

Digital Realty Trust, L.P.

There is no established trading market for Digital Realty Trust, L.P.’s common units of limited partnership. As of February 22, 2022, there were 73 holders of record of common units, including Digital Realty Trust, L.P.’s general partner, Digital Realty Trust, Inc.

Digital Realty Trust, L.P. currently intends to continue to make regular quarterly distributions to holders of its common units. Any future distributions will be declared at the discretion of the Board of Directors of Digital Realty Trust, L.P.’s general partner, Digital Realty Trust, Inc., and will depend on our actual cash flow, financial condition, capital requirements, the annual distribution requirements under the REIT provisions of the Code, and such other factors as the Board of Directors may deem relevant.

52

Table of Contents

Index to Financial Statements

STOCK PERFORMANCE GRAPH

The following graph compares the yearly change in the cumulative total stockholder return on Digital Realty Trust, Inc.’s common stock during the period from December 31, 2016 through December 31, 2021, with the cumulative total returns on the MSCI US REIT Index (RMS) and the S&P 500 Market Index. The comparison assumes that $100 was invested on December 31, 2016 in Digital Realty Trust, Inc.’s common stock and in each of these indices and assumes reinvestment of dividends, if any.

COMPARISON OF CUMULATIVE TOTAL RETURNS

AMONG DIGITAL REALTY TRUST, INC., S&P 500 INDEX AND RMS INDEX

Assumes $100 invested on December 31, 2016 and

dividends reinvested

To fiscal year ending December 31, 2021

Graphic

53

Table of Contents

Index to Financial Statements

Pricing Date


DLR($)


S&P 500($)


RMS($)

December 31, 2016


100.0


100.0


100.0

December 31, 2017


119.8


121.8


105.1

December 31, 2018


116.1


116.5


100.3

December 31, 2019


135.3


153.2


126.2

December 31, 2020


163.0


181.3


116.6

December 31, 2021


213.0


233.4


166.8

This graph and the accompanying text are not “soliciting material,” are not deemed filed with the SEC and are not to be incorporated by reference in any filing by us under the Securities Act of 1933, as amended, or the Securities Exchange Act of 1934, as amended, whether made before or after the date hereof and irrespective of any general incorporation language in any such filing.
The stock price performance shown on the graph is not necessarily indicative of future price performance.
The hypothetical investment in Digital Realty Trust, Inc.’s common stock presented in the stock performance graph above is based on the closing price of the common stock on December 31, 2016.

SALES OF UNREGISTERED EQUITY SECURITIES

Digital Realty Trust, Inc.

None.

Digital Realty Trust, L.P.

During the year ended December 31, 2021, our Operating Partnership issued partnership units in private placements in reliance on the exemption from registration provided by Section 4(a)(2) of the Securities Act, in the amounts and for the consideration set forth below:

During the year ended December 31, 2021, Digital Realty Trust, Inc. issued an aggregate of 265,576 shares of its common stock in connection with restricted stock awards for no cash consideration. For each share of common stock issued by Digital Realty Trust, Inc. in connection with such awards, our Operating Partnership issued a restricted common unit to Digital Realty Trust, Inc. During the year ended December 31, 2021, our Operating Partnership issued an aggregate of 265,576 common units to Digital Realty Trust, Inc., as required by our Operating Partnership’s partnership agreement. During the year ended December 31, 2021, an aggregate of 63,724 shares of its common stock were forfeited to Digital Realty Trust, Inc. in connection with restricted stock awards for a net issuance of 201,852 shares of common stock.

All other issuances of unregistered equity securities of our Operating Partnership during the year ended December 31, 2021 have been disclosed previously in filings with the SEC. For all issuances of units to Digital Realty Trust, Inc., our Operating Partnership relied on Digital Realty Trust, Inc.’s status as a publicly traded NYSE-listed company with over $36 billion in total consolidated assets and as our Operating Partnership’s majority owner and general partner as the basis for the exemption under Section 4(a)(2) of the Securities Act.

REPURCHASES OF EQUITY SECURITIES

Digital Realty Trust, Inc.

None.

54

Table of Contents

Index to Financial Statements

Digital Realty Trust, L.P.

None.

ITEM 6.       [Reserved]

55

Table of Contents

Index to Financial Statements

ITEM 7.      MANAGEMENT’S DISCUSSION AND ANALYSIS OF FINANCIAL CONDITION AND RESULTS OF OPERATIONS

The following discussion should be read in conjunction with the Consolidated Financial Statements and notes thereto included in Item 8 of this report and the matters described under Item 1A. Risk Factors. We make statements in this section that are forward-looking statements within the meaning of the federal securities laws. For a complete discussion of forward-looking statements, see the section in this report entitled “Forward-Looking Statements.”

A discussion regarding our financial condition and results of operations for 2021 as compared to 2020 is presented herein. Information on 2019 is presented in graphs and other tables only to show year-over-year trends in our results of operations and operating metrics. Our financial condition for 2019 and results of operations for 2019 – and also 2019 as compared to 2020 – can be found under Item 7. Management’s Discussion and Analysis of Financial Condition and Results of Operations, of our Annual Report on form 10-K for the fiscal year ended 2020, filed with the SEC on March 1, 2021.

Business Overview and Strategy

Digital Realty Trust, Inc., through its controlling interest in Digital Realty Trust, L.P. and its subsidiaries, delivers comprehensive space, power, and interconnection solutions that enable its customers and partners to connect with each other and service their own customers on a global technology and real estate platform. We are a leading global provider of data center, colocation and interconnection solutions for customers across a variety of industry verticals. Digital Realty Trust, Inc. operates as a REIT for federal income tax purposes, and our Operating Partnership is the entity through which we conduct our business and own our assets.

Our primary business objectives are to maximize:

(i)sustainable long-term growth in earnings and funds from operations per share and unit;
(ii)cash flow and returns to our stockholders and our Operating Partnership’s unitholders through the payment of distributions; and
(iii)return on invested capital.

We expect to accomplish our objectives by achieving superior risk-adjusted returns, prudently allocating capital, diversifying our product offerings, accelerating our global reach and scale, and driving revenue growth and operating efficiencies. A significant component of our current and future internal growth is anticipated through the development of our existing space held for development, acquisition of land for future development, and acquisition of new properties.

We target high-quality, strategically located properties containing the physical and connectivity infrastructure that supports the applications and operations of data center and technology industry customers and properties that may be developed for such use. Most of our data center properties contain fully redundant electrical supply systems, multiple power feeds, above-standard cooling systems, raised floor areas, extensive in-building communications cabling and high-level security systems. We focus exclusively on owning, acquiring, developing and operating data centers because we believe that the growth in data center demand and the technology-related real estate industry generally will continue to outpace the overall economy.

We have developed detailed, standardized procedures for evaluating new real estate investments to ensure that they meet our financial, technical and other criteria. We expect to continue to acquire additional assets as part of our growth strategy. We intend to aggressively manage and lease our assets to increase their cash flow. We may continue to build out our development portfolio when justified by anticipated demand and returns.

We may acquire properties subject to existing mortgage financing and other indebtedness or we may incur new indebtedness in connection with acquiring or refinancing these properties. Debt service on such indebtedness will have a priority over any cash dividends with respect to Digital Realty Trust, Inc.’s common stock and preferred stock. We are committed to maintaining a conservative capital structure. We target a debt-to-Adjusted EBITDA ratio at or less than

56

Table of Contents

Index to Financial Statements

5.5x, fixed charge coverage of greater than three times, and floating rate debt at less than 20% of total outstanding debt. In addition, we strive to maintain a well-laddered debt maturity schedule, and we seek to maximize the menu of our available sources of capital, while minimizing the cost.

Summary of 2021 Significant Activities

We completed the following significant activities in 2021 as described in the Notes to the Consolidated Financial Statements:

In January, we issued and sold €1.0 billion aggregate principal amount of 0.625% Guaranteed Notes due 2031 (the “2031 Notes”). The 2031 Notes are senior unsecured obligations of Digital Intrepid Holding B.V. (a wholly-owned subsidiary of the OP) and are fully and unconditionally guaranteed by the Parent and the OP. Net proceeds from the offering were approximately €988.3 million (approximately $1,206.4 million based on the exchange rate on the issuance date of January 12, 2021) after deducting managers’ discounts and estimated offering expenses.
In February, we redeemed €350 million of 2.750% notes due in 2023. As part of this redemption, we recorded a $17.5 million loss on extinguishment of debt.
In March, we sold a portfolio of 11 data centers in Europe to Ascendas Reit, a CapitaLand sponsored REIT, for total consideration of approximately $680.0 million. The total gain recorded as a result of this sale was approximately $332.0 million.
In May, we redeemed all of the Parent’s outstanding Series C cumulative redeemable perpetual preferred stock for $25.21 per share, or a redemption price of $25.00 per share, plus accrued and unpaid dividends up to but not including the redemption date (the “Series C Preferred Share Redemption”). The transaction resulted in a gain on redemption of $18.0 million. This amount is reflected as gain on redemption of preferred stock which increased net income available to common stockholders.
In July, we issued and sold CHF 275 million aggregate principal amount of 0.20% guaranteed notes due 2026 and CHF 270 million aggregate principal amount of 0.55% guaranteed notes due 2029 (collectively referred to as, “the Swiss Franc Notes”). Net proceeds from the offering were approximately CHF 542.3 million (approximately $591 million based on the exchange rate on the issuance date of July 15, 2021). The net proceeds are intended to finance or refinance, in whole or in part, recently completed or future green building, energy and resource efficiency and renewable energy projects.
In August, an existing unconsolidated joint venture between the Company and PGIM Real Estate (the “PGIM Joint Venture”) completed the sale of a portfolio consisting of 10 data centers in North America for $581 million – which resulted in a gain on sale of assets for the joint venture. Our portion of the gain was $64 million and included as a component of Equity in Unconsolidated Entities in our consolidated income statements. In connection with completion of the sale, we also received a $19 million promote fee related to the partnership exceeding certain investor return thresholds over the life of the partnership. The amount received is included in fee income and other in our consolidated income statements.
In September, we completed an underwritten public offering of 6,250,000 shares of the Parent’s common stock, all of which were offered in connection with forward sale agreements we entered into with certain financial institutions acting as forward purchasers. The forward purchasers borrowed and sold an aggregate of 6,250,000 shares of common stock in the public offering. We did not receive any proceeds from the sale of our common stock by the forward purchaser. We expect to receive net proceeds of approximately $1.0 billion (net of fees and estimated expenses) upon full physical settlement of the forward sale agreements (for which the timing is fully determined at our option and is expected to be no later than March 13, 2023).

57

Table of Contents

Index to Financial Statements

In November, we refinanced our global revolving credit facility and Yen revolving credit facility (collectively referred to as the “global revolving credit facilities”). The global revolving credit facilities provide for borrowings of up to $3.3 billion (including approximately $0.3 billion available to be drawn on the Yen revolving credit facility). The global revolving credit facility provides for borrowings in a variety of currencies and can be increased by an additional $1.5 billion, subject to receipt of lender commitments and other conditions precedent. Both facilities mature on January 24, 2026, with two six-month extension options available. These facilities also feature a sustainability-linked pricing component, with pricing subject to adjustment based on annual performance targets, further demonstrating the Company's continued leadership and commitment to sustainable business practices.
In December, we:
ocompleted the listing of Digital Core REIT as a standalone Singapore real estate investment trust publicly traded on the Singapore Exchange. Digital Core REIT and its subsidiaries are hereafter referred to as the “SREIT”. In connection with the listing, we contributed a portfolio of 10 operating data center properties valued at $1.4 billion to the SREIT in exchange for $919 million cash and an initial retained investment of approximately 39.4% in Digital Core REIT as well as a 10% direct interest in the underlying operating properties of the SREIT. As part of this transaction, we recognized a gain on sale of assets of approximately $1.0 billion; and
oentered into a definitive agreement to acquire approximately 55% of the total equity interests in Teraco, Africa’s leading carrier-neutral colocation provider. The remaining 45% will be held by a consortium of existing investors. The transaction values Teraco at approximately $3.5 billion. Close of the transaction is dependent upon customary closing conditions.

Revenue Base

The majority of our revenue consists of rental income generated by the data centers in our portfolio. Our ability to generate and grow revenue depends on several factors, including our ability to maintain or improve occupancy rates. A summary of our data center portfolio and related square feet occupied (excluding space under development or held for development) is shown below. Unconsolidated portfolios shown below consist of assets owned by unconsolidated entities in which we have invested. We often provide management services for these entities under management agreements and receive management fees. These are shown as Managed Unconsolidated Portfolio. Entities for which we do not provide such services are shown as Non-Managed Unconsolidated Portfolio.

As of December 31, 2021

As of December 31, 2020

Region

Data Center Buildings

Net Rentable Square Feet (1)

Space Under Active Development (2)

Space Held for Development (3)

Occupancy

Data Center Buildings

Net Rentable Square Feet (1)

Space Under Active Development (2)

Space Held for Development (3)

Occupancy

North America

114

21,751,638

2,327,121

900,357

85.4

%

125

22,767,431

2,021,891

960,161

87.0

%

Europe

107

7,549,209

3,125,451

191,094

74.6

%

107

7,654,259

1,516,192

256,398

78.7

%

Asia Pacific

12

1,355,243

806,252

76.2

%

13

913,905

1,330,123

284,751

89.0

%

Africa

4

25,825

40,965

58.5

%

3

25,300

37,025

48.3

%

Consolidated Portfolio

237

30,681,914

6,299,789

1,091,451

82.5

%

248

31,360,895

4,905,231

1,501,310

85.2

%

Managed Unconsolidated Portfolio

16

2,383,729

95.2

%

16

2,191,236

96.4

%

Non-Managed Unconsolidated Portfolio

34

2,565,185

930,670

1,591,004

86.0

%

27

2,324,185

486,738

789,500

92.1

%

Total Portfolio

287

35,630,828

7,230,460

2,682,456

83.6

%

291

35,876,316

5,391,969

2,290,810

86.3

%

(1)Net rentable square feet represents the current square feet under lease as specified in the applicable lease agreement plus management’s estimate of space available for lease based on engineering drawings. The amount includes customers’ proportional share of common areas but excludes space held for the intent of or under active development.

58

Table of Contents

Index to Financial Statements

(2)Space under active development includes current base building and data center projects in progress, and excludes space held for development. For additional information on the current and future investment for space under active development, see “—Liquidity and Capital Resources of the Operating Partnership—Construction”.
(3)Space held for development includes space held for future data center development, and excludes space under active development. For additional information on the current investment for space held for development, see “—Liquidity and Capital Resources of the Operating Partnership—Construction”.

Leasing Activities

Due to the capital-intensive and long-term nature of the operations we support, our lease terms with customers are generally longer than standard commercial leases. As of December 31, 2021, our average remaining lease term was approximately five years.

Our ability to re-lease expiring space at rental rates equal to or in excess of current rental rates will impact our results of operations. The subsequent table summarizes our leasing activity in the year ended December 31, 2021:


TI’s/Lease


Weighted

Commissions 

Average Lease 

Rentable

Expiring 

New

Rental Rate

Per Square 

Terms 

Square Feet (1)

Rates (2)

Rates (2)

Changes

Foot

(years)

Leasing Activity (3)(4)


Renewals Signed


0 1 MW


1,776,184

$

267.61

$

272.39


1.8

%  

$

0.70


1.7

> 1 MW


1,509,389

$

156.71

$

146.39


(6.6)

%  

$

1.30


4.3

Other (6)


1,536,720

$

21.20

$

23.79


12.3

%  

$

1.12


3.9

New Leases Signed (5)


0 1 MW


549,391


$

269.94


$

15.38


3.6

> 1 MW


2,180,268


$

134.79


$

1.68


8.1

Other (6)


351,853


$

27.44


$

0.27


13.0

Leasing Activity Summary


0 1 MW


2,325,575


$

271.81


> 1 MW


3,689,657


$

139.54


Other (6)


1,888,573


$

24.47


(1)For some of our properties, we calculate square footage based on factors in addition to contractually leased square feet, including power, required support space and common area.
(2)Rental rates represent average annual estimated base cash rent per rentable square foot – calculated for each contract based on total cash base rent divided by the total number of years in the contract (including any tenant concessions). All rates were calculated in the local currency of each contract and then converted to USD based on average exchange rates for the year presented.
(3)Excludes short-term leases.
(4)Commencement dates for the leases signed range from 2021 to 2022.
(5)Includes leases signed for new and re-leased space.
(6)Other includes Powered Base Building shell capacity as well as storage and office space within fully improved data center facilities.

We continue to see strong demand in most of our key metropolitan areas for data center space and, subject to the supply of available data center space in these metropolitan areas, we expect average aggregate rental rates on re-leased or renewed data center leases for 2022 expirations to generally be consistent with the rates currently being paid for the same space on a GAAP basis and on a cash basis. Our past performance may not be indicative of future results, and we cannot assure you that leases will be renewed or that our data centers will be re-leased at all or at rental rates equal to or above the current average rental rates. Further, re-leased/renewed rental rates in a particular metropolitan area may not be consistent with rental rates across our portfolio as a whole and may fluctuate from one period to another due to a number of factors, including local economic conditions, local supply and demand for data center space, competition

59

Table of Contents

Index to Financial Statements

from other data center developers or operators, the condition of the property and whether the property, or space within the property, has been developed.

Geographic concentration

We depend on the market for data centers in specific geographic regions and significant changes in these regional or metropolitan areas can impact our future results. The following table shows the geographic concentration of annualized rent from our portfolio, including data centers held as investments in unconsolidated entities.


Percentage of


December 31, 2021


Metropolitan Area

total annualized rent (1)


Northern Virginia


19.5

%

Chicago


9.0

%

London


6.6

%

New York


6.2

%

Silicon Valley


6.1

%

Frankfurt


5.7

%

Dallas

5.5

%

Amsterdam


4.2

%

Sao Paulo


4.1

%

Singapore


4.0

%

Paris


2.2

%

Phoenix


2.0

%

San Francisco


1.9

%

Osaka


1.6

%

Atlanta

1.5

%

Other


19.9

%

Total


100.0

%

(1)Annualized rent is monthly contractual rent (defined as cash base rent before abatements) under existing leases as of the end of the period presented, multiplied by 12. Includes consolidated portfolio and unconsolidated entities at the entities’ 100% ownership level. The aggregate amount of abatements for the year ended December 31, 2021 was approximately $108.7 million.

Operating expenses

Operating expenses primarily consist of utilities, property and ad valorem taxes, property management fees, insurance and site maintenance costs, and rental expenses on our ground and building leases. Our buildings require significant power to support data center operations and the cost of electric power and other utilities is a significant component of operating expenses.

Many of our leases contain provisions under which tenants reimburse us for all or a portion of property operating expenses and real estate taxes incurred by us. However, in some cases we are not entitled to reimbursement of property operating expenses, other than utility expense, and real estate taxes under our leases for Turn-Key Flex® facilities. We expect to incur additional operating expenses as we continue to expand.

Costs pertaining to our asset management function, legal, accounting, corporate governance, reporting and compliance are categorized as general and administrative costs within operating expenses.

Other key components of operating expenses include: depreciation of our fixed assets, amortization of intangible assets, and transaction and integration costs.

Other Income / (Expenses)

60

Table of Contents

Index to Financial Statements

Equity in earnings of unconsolidated entities, interest expense, and income tax expense make up the majority of other income/(expense). Equity in earnings of unconsolidated entities represents our share of the income/(loss) of entities in which we invest, but do not consolidate under U.S. GAAP. The largest of these investments is currently our investment in Digital Core REIT, which is publicly traded on the Singapore Exchange (“SGX”) and which owns a portfolio of 10 properties operating in the United States and Canada. Our second-largest equity-method investment is in Ascenty which is located primarily in Brazil. Refer to additional discussion of the SREIT and Ascenty in the footnotes to the financial statements.

Results of Operations

As a result of the consistent and significant growth in our business since the first property acquisition in 2002, we evaluate period-to-period results for revenue and property level operating expenses on a stabilized vs. non-stabilized portfolio basis.

Stabilized: The stabilized portfolio includes properties owned as of the beginning of all periods presented with less than 5% of total rentable square feet under development.

Non-stabilized: The non-stabilized portfolio includes: 1) properties that were undergoing, or were expected to undergo, development activities during any of the periods presented, 2) any properties contributed to joint ventures, sold, or held for sale during the periods presented, and 3) any properties that were acquired or delivered at any point during the periods presented.

Comparison of the Year Ended December 31, 2021 to the Year Ended December 31, 2020

Revenues

Total operating revenues as shown on our consolidated income statements was as follows (in thousands):

Year Ended December 31, 

$ Change

% Change

2021


2020


2021 vs 2020


2021 vs 2020

Rental and other services

$

4,395,039

$

3,886,546

$

508,493

13.1

%  

Fee income and other


32,843


17,063


15,780

92.5

%  

Total operating revenues

$

4,427,882

$

3,903,609

$

524,273

13.4

%  

A break-out of rental and other services revenue between stabilized properties and non-stabilized properties is shown in the subsequent table (in thousands). Fee income and other is not broken out between stabilized and non-stabilized categories because it is typically generated by the Company as a whole and not by individual properties.

Year Ended December 31, 

2021


2020


$ Change


% Change


Stabilized

$

2,307,668

$

2,298,695

$

8,973

0.4

%  

Non-Stabilized

2,087,371

1,587,851

499,520

31.5

%  

Rental and other services


4,395,039


3,886,546


508,493

13.1

%  

Fee income and other

32,843

17,063

15,780

92.5

%  

Total operating revenues

$

4,427,882

$

3,903,609

$

524,273

13.4

%  

61

Table of Contents

Index to Financial Statements

Total operating revenues increased by approximately $524.3 million for the year ended December 31, 2021 compared to the same period in 2020 driven primarily by growth in non-stabilized rental and other services revenue. Non-stabilized rental and other services revenue increased $499.5 million for the year ended December 31, 2021, compared to the same period in 2020 primarily due to the completion of global development pipeline and related lease up operating activities and expansion into new markets in EMEA, offset by the impact of properties sold in 2020 and 2021 and due to the Interxion Combination, which contributed $303.8 million to the increase. Stabilized rental and other services revenue increased $9.0 million for the year ended December 31, 2021 compared to the same period in 2020 due to increased tenant reimbursements associated with higher utility costs in Texas due to winter storm Uri less new leasing and renewals, net of expirations.

Operating Expenses — Property Level

Property level operating expenses as shown in our consolidated income statements were as follows (in thousands):

Year Ended December 31, 

$ Change

% Change


2021


2020


2021 vs 2020


2021 vs 2020

Rental property operating and maintenance

$

1,570,506

$

1,331,493

$

239,013

18.0

%  

Property taxes and insurance


207,814


182,623


25,191

13.8

%  

Total Property Level Expenses

$

1,778,320

$

1,514,116

$

264,204

17.4

%  

A break-out of property level expenses between stabilized properties and non-stabilized properties (all other properties) is shown below (in thousands).

Year Ended December 31, 

2021


2020


$ Change


% Change


Stabilized

$

811,952

$

747,873

$

64,079

8.6

%  

Non-Stabilized

758,554

583,620

174,934

30.0

%  

Rental property operating and maintenance


1,570,506


1,331,493


239,013

18.0

%  

Stabilized

130,023

122,290

7,733

6.3

%  

Non-Stabilized

77,791

60,333

17,458

28.9

%  

Property taxes and insurance


207,814

182,623

25,191

13.8

%  

Total Property Level Expenses

$

1,778,320

$

1,514,116

$

264,204

17.4

%  

62

Table of Contents

Index to Financial Statements

Property level operating expenses include costs to operate and maintain the locations as well as taxes and insurance. Stabilized property operating and maintenance expenses increased by approximately $64.1 million for the year ended December 31, 2021 compared to the same period in 2020 primarily related to higher utility consumption at certain properties in the stabilized portfolio. Non-stabilized property operating and maintenance expenses increased $174.9 million for the year ended December 31, 2021 compared to the same period in 2020 primarily due to (i) the Interxion Combination, which contributed $127.5 million to the increase, (ii) the completion of global development pipeline and related lease up operating activities and expansion into new markets in EMEA offset by (iii) the impact of properties sold in 2020 and 2021.

The cost of electric power comprises a significant component of our operating expenses. Any additional taxation or regulation of energy use, including as a result of (i) new legislation that Congress may pass, (ii) the regulations that the EPA has proposed or finalized, (iii) regulations under legislation that states have passed or may pass, or (iv) any further legislation or regulations in the EU or other regions where we operate could significantly increase our costs, and we may not be able to effectively pass all of these costs on to our customers. These matters could adversely impact our business, results of operations, or financial condition.

Stabilized property taxes and insurance increased by approximately $7.7 million for the year ended December 31, 2021 compared to the same period in 2020 primarily related to property tax reassessments for certain properties located in Chicago in the stabilized portfolio. Non-stabilized property taxes and insurance increased by approximately $17.5 million for the year ended December 31, 2021 compared to the same period in 2020 primarily related to property tax reassessments for certain properties located in Chicago and Dallas in the non-stabilized portfolio.

Other Operating Expenses

Other operating expenses include costs which are either non-cash in nature (such as depreciation and amortization) or which do not directly pertain to operation of data center properties. A comparison of other operating expenses for the respective periods is shown below (in thousands). The increases in depreciation and amortization and general and administrative expenses for the 2021 period as compared to 2020 were primarily driven by the Interxion Combination, which closed in March 2020.

Year Ended December 31, 

$ Change

% Change


2021


2020


2021 vs 2020


2021 vs 2020

Depreciation and amortization

$

1,486,632

$

1,366,379

$

120,253

8.8

%  

General and administrative

400,654

351,369

49,285

14.0

%  

Transaction, integration and other expense


47,426


106,662

(59,236)

(55.5)

%  

Impairment of investments in real estate

18,291

6,482

11,809

182.2

%  

Other


2,550


1,075

1,475

137.2

%  

Total Other Operating Expenses

1,955,553

1,831,967

123,586

6.7

%  

Property level operating expenses

1,778,320

1,514,116

264,204

17.4

%  

Total Operating Expenses

$

3,733,873

$

3,346,083

$

387,790

11.6

%  

Equity in Earnings (Loss) of Unconsolidated Entities

Equity in earnings (loss) of unconsolidated entities increased approximately $119.9 million for the year ended December 31, 2021, compared to 2020, primarily due to: (i) a $64 million gain we recorded as a component of our share of earnings in the PGIM joint venture which was associated with the joint venture’s sale of a portfolio of 10 data centers in August 2021, and (ii) a $59.3 million increase primarily related to a reduction of the foreign-exchange loss recorded by our Ascenty joint venture associated with re-measurement of its debt denominated in U. S. Dollars to Brazilian Real.

63

Table of Contents

Index to Financial Statements

Gain on Disposition of Properties

Gain on disposition of properties, increased $1,063.9 million for the year ended December 31, 2021 compared to the same period in 2020, due primarily to the approximately $1 billion gain we recorded on disposition of 10 operating properties to the SREIT on December 6, 2021. Refer to additional information in the “Notes to the Consolidated Financial Statements.”

The gain on disposition of properties recorded for the year ended December 31, 2020 consisted of (i) a gain of $10.4 million on sale of Liverpoolweg 10 in Amsterdam for gross proceeds of approximately $21.5 million, and (ii) a gain of $306.5 million on sale of 10 Powered Base Building® properties (which comprised 12 data centers) in North America to Mapletree at a purchase consideration of approximately $557.0 million.

Loss from Early Extinguishment of Debt

Loss from early extinguishment of debt decreased approximately $84.5 million for the year ended December 31, 2021 compared to the same period in 2020, primarily due to the redemption of the 3.950% 2022 Notes and 3.625% 2022 Notes in August 2020, offset by the redemption of the 2.750% 2023 Notes in February 2021.

Income Tax Expense

Income tax expense increased by $34.8 million for the year ended December 31, 2021 compared to the same period in 2020, primarily due to an increase in the corporate tax rate in the United Kingdom from 19% to 25% during the quarter ended June 30, 2021.

Interest Expense

Interest expense decreased by approximately $39.2 million for the year ended December 31, 2021 compared to the same period in 2020. The decrease was primarily due to a decrease in interest expense related to our term loan facility, which was paid off in full in January 2021. In addition, interest expense on our unsecured senior notes decreased as a result of lower rate debt.

Liquidity and Capital Resources

The sections “Analysis of Liquidity and Capital Resources — Parent” and “Analysis of Liquidity and Capital Resources — Operating Partnership” should be read in conjunction with one another to understand our liquidity and capital resources on a consolidated basis. The term “Parent” refers to Digital Realty Trust, Inc. on an unconsolidated basis, excluding our Operating Partnership. The term “Operating Partnership” or “OP” refers to Digital Realty Trust, L.P. on a consolidated basis.

Analysis of Liquidity and Capital Resources — Parent

Our Parent does not conduct business itself, other than acting as the sole general partner of the Operating Partnership, issuing public equity from time to time, incurring certain expenses in operating as a public company (which are fully reimbursed by the Operating Partnership) and guaranteeing certain unsecured debt of the Operating Partnership and certain of its subsidiaries and affiliates. If our Operating Partnership or such subsidiaries fail to fulfill their debt requirements, which trigger Parent guarantee obligations, then our Parent will be required to fulfill its cash payment commitments under such guarantees. Our Parent’s only material asset is its investment in our Operating Partnership.

Our Parent’s principal funding requirement is the payment of dividends on its common and preferred stock. Our Parent’s principal source of funding is the distributions it receives from our Operating Partnership.

As the sole general partner of our Operating Partnership, our Parent has the full, exclusive and complete responsibility for our Operating Partnership’s day-to-day management and control. Our Parent causes our Operating Partnership to

64

Table of Contents

Index to Financial Statements

distribute such portion of its available cash as our Parent may in its discretion determine, in the manner provided in our Operating Partnership’s partnership agreement.

As circumstances warrant, our Parent may issue equity from time to time on an opportunistic basis, dependent upon market conditions and available pricing. Any proceeds from such equity issuances would generally be contributed to our Operating Partnership in exchange for additional equity interests in our Operating Partnership. Our Operating Partnership may use the proceeds to acquire additional properties, to fund development opportunities and for general working capital purposes, including potentially for the repurchase, redemption or retirement of outstanding debt or equity securities.

Our Parent and our Operating Partnership are parties to an at-the-market (ATM) equity offering sales agreement dated January 4, 2019, as amended in 2020 (the “Sales Agreement”). In accordance with the Sales Agreement, following the date of the 2020 amendment, Digital Realty Trust, Inc. may offer and sell shares of its common stock having an aggregate offering price of up to $1.0 billion. Prior to the 2020 amendment, Digital Realty Trust, Inc. had offered and sold shares of its common stock having an aggregate gross sales price of approximately $652.2 million. The sales of common stock made under the Sales Agreement will be made in “at the market” offerings as defined in Rule 415 of the Securities Act. For the year ended December 31, 2021, Digital Realty Trust, Inc. issued approximately 1.1 million common shares under the Sales Agreement at an average price of $161.92 per share. As of December 31, 2021, approximately $577.6 million remains available for future sales under the program. Our Parent has used and intends to use the net proceeds from the program to temporarily repay borrowings under our Operating Partnership’s global revolving credit facilities, to acquire additional properties or businesses, to fund development opportunities and for working capital and other general corporate purposes, including potentially for the repayment of other debt or the repurchase, redemption or retirement of outstanding debt securities. For additional information on the Sales Agreement, see our Annual Report on Form 10-K for the year ended December 31, 2020.

On September 13, 2021, Digital Realty Trust, Inc. completed an underwritten public offering of 6,250,000 shares of its common stock, all of which were offered in connection with forward sale agreements it entered into with certain financial institutions acting as forward purchasers. The forward purchasers borrowed and sold an aggregate of 6,250,000 shares of Digital Realty Trust, Inc.’s common stock in the public offering. Digital Realty Trust, Inc. did not receive any proceeds from the sale of our common stock by the forward purchasers in the public offering. The Company expects to receive net proceeds of approximately $1.0 billion (net of fees and estimated expenses) upon full physical settlement of the forward sale agreements, which is anticipated to be no later than March 13, 2023. Upon physical settlement of the forward sale agreements, the Operating Partnership is expected to issue partnership units to Digital Realty Trust, Inc. in exchange for contribution of the net proceeds.

We believe our Operating Partnership’s sources of working capital, specifically its cash flow from operations, and funds available under its global revolving credit facility are adequate for it to make its distribution payments to our Parent and, in turn, for our Parent to make its dividend payments to its stockholders. However, we cannot assure you that our Operating Partnership’s sources of capital will continue to be available at all or in amounts sufficient to meet its needs, including making distribution payments to our Parent. The lack of availability of capital could adversely affect our Operating Partnership’s ability to pay its distributions to our Parent, which would in turn, adversely affect our Parent’s ability to pay cash dividends to its stockholders.

Future Uses of Cash — Parent

Our Parent Company may from time to time seek to retire, redeem or repurchase its equity or the debt securities of our Operating Partnership or its subsidiaries through cash purchases and/or exchanges for equity securities in open market purchases, privately negotiated transactions or otherwise. Such repurchases, redemptions or exchanges, if any, will depend on prevailing market conditions, our liquidity requirements, contractual restrictions or other factors. The amounts involved may be material.

65

Table of Contents

Index to Financial Statements

Dividends and Distributions — Parent

Our Parent is required to distribute 90% of its taxable income (excluding capital gains) on an annual basis to continue to qualify as a REIT for federal income tax purposes. Our Parent intends to make, but is not contractually bound to make, regular quarterly distributions to its common stockholders from cash flow from our Operating Partnership’s operating activities. While historically our Parent has satisfied this distribution requirement by making cash distributions to its stockholders, it may choose to satisfy this requirement by making distributions of cash or other property. All such distributions are at the discretion of our Parent’s Board of Directors. Our Parent considers market factors and our Operating Partnership’s performance in addition to REIT requirements in determining distribution levels. Our Parent has distributed at least 100% of its taxable income annually since inception to minimize corporate level federal and state income taxes. Amounts accumulated for distribution to stockholders are invested primarily in interest-bearing accounts and short-term interest-bearing securities, which are consistent with our intention to maintain our Parent’s status as a REIT.

As a result of this distribution requirement, our Operating Partnership cannot rely on retained earnings to fund its ongoing operations to the same extent that other companies whose parent companies are not REITs can. Our Parent may need to continue to raise capital in the debt and equity markets to fund our Operating Partnership’s working capital needs, as well as potential developments at new or existing properties, acquisitions or investments in existing or newly created joint ventures. In addition, our Parent may be required to use borrowings under the Operating Partnership’s global revolving credit facility (which is guaranteed by our Parent), if necessary, to meet REIT distribution requirements and maintain our Parent’s REIT status.

Distributions out of our Parent’s current or accumulated earnings and profits are generally classified as ordinary income whereas distributions in excess of our Parent’s current and accumulated earnings and profits, to the extent of a stockholder’s U.S. federal income tax basis in our Parent’s stock, are generally classified as a return of capital. Distributions in excess of a stockholder’s U.S. federal income tax basis in our Parent’s stock are generally characterized as capital gain. Cash provided by operating activities has been generally sufficient to fund distributions on an annual basis. However, we may also need to utilize borrowings under the global revolving credit facility to fund distributions.

The expected tax treatment of distributions on our Parent’s common stock and preferred stock paid in 2021 is as follows: approximately 9% ordinary income and 91% capital gain distribution. The tax treatment of distributions on our Parent’s common stock and preferred stock paid in 2020 was as follows: approximately 72% ordinary income and 28% capital gain distribution. The tax treatment of distributions on our Parent’s common stock paid in 2019 was as follows: approximately 83% ordinary income and 17% return of capital.

For additional information regarding dividends declared and paid by our Parent on its common and preferred stock for the years ended December 31, 2021, 2020 and 2019, see Item 8, Note 14 in the Notes to the Consolidated Financial Statements contained herein.

Analysis of Liquidity and Capital Resources — Operating Partnership

As of December 31, 2021, we had $142.7 million of cash and cash equivalents, excluding $8.8 million of restricted cash. Restricted cash primarily consists of contractual capital expenditures plus other deposits. Our liquidity requirements primarily consist of:

operating expenses,
development costs and other capital expenditures associated with our properties,
distributions to our Parent to enable it to make dividend payments,
distributions to unitholders of common limited partnership interests in Digital Realty Trust, L.P.,
debt service, and,
potentially, acquisitions.

66

Table of Contents

Index to Financial Statements

On November 18, 2021, we refinanced our global revolving credit facility and Yen revolving credit facility. The global revolving credit facilities provide for borrowings of up to $3.3 billion (including approximately $0.3 billion available to be drawn on the Yen revolving credit facility). The global revolving credit facility provides for borrowings in a variety of currencies and can be increased by an additional $1.5 billion, subject to receipt of lender commitments and other conditions precedent. Both facilities mature on January 24, 2026, with two six-month extension options available. The 2021 global revolving credit facility provides for borrowings in a variety of currencies, and includes the ability to add additional currencies in the future. We have used and intend to use available borrowings under the global revolving credit facility to acquire additional properties, fund development opportunities and for general working capital and other corporate purposes, including potentially for the repurchase, redemption or retirement of outstanding debt or equity securities. For additional information regarding our global revolving credit facility, see Item 8, Note 8 in the Notes to the Consolidated Financial Statements.

Future Uses of Cash

Our properties require periodic investments of capital for customer-related capital expenditures and for general capital improvements. Depending upon customer demand, we expect to incur significant improvement costs to build out and develop additional capacity. At December 31, 2021, we had open commitments, related to construction contracts of approximately $1.3 billion, including amounts reimbursable of approximately $37.8 million.

We currently expect to incur approximately $2.3 billion to $2.5 billion of capital expenditures for our development programs during the year ending December 31, 2022. This amount could go up or down, potentially materially, based on numerous factors, including changes in demand, leasing results and availability of debt or equity capital.

We are party to a definitive agreement under which we committed to acquire approximately 55% of the total equity interest in Teraco, Africa’s leading carrier-neutral colocation provider. The transaction values Teraco at approximately $3.5 billion. Close of the transaction is dependent upon customary closing conditions.

Development Projects

The costs we incur to develop our properties is a key component of our liquidity requirements. The following table summarizes our cumulative investments in current development projects as well as expected future investments in these projects as of the periods presented, excluding costs incurred or to be incurred by unconsolidated entities.

Development Lifecycle

As of December 31, 2021

As of December 31, 2020

Net Rentable 

Current 

Future 

Net Rentable 

Current 

Future 

Square Feet

Investment

Investment

 Square Feet 

Investment 

Investment

(dollars in thousands)


  (1)


(2)


(3)


Total Cost


(1)


 (4)


(3)


Total Cost

Land held for future development (5)


N/A


$

133,683


$


$

133,683


N/A


$

226,862


$


$

226,862

Construction in Progress and Space Held for Development


Land - Current Development (5)

N/A

$

974,464

$

$

974,464

N/A

$

785,182

$

$

785,182

Space Held for Development (6)


1,091,451


210,903


210,903


1,501,310

236,545


236,545

Base Building Construction


3,319,999


545,529

460,595


1,006,124


2,331,472


458,357

485,613


943,970

Data Center Construction


2,979,791


1,409,403


1,825,369


3,234,772


2,573,759


1,232,762


1,596,821


2,829,583

Equipment Pool & Other Inventory


N/A


7,881


7,881


N/A


9,761


9,761

Campus, Tenant Improvements & Other


N/A


65,209


99,118


164,327


N/A


45,718


42,848


88,566

Total Construction in Progress and Land Held for Future Development


7,391,241

$

3,347,072

$

2,385,082

$

5,732,154


6,406,541

$

2,995,187

$

2,125,282

$

5,120,469

(1)We estimate the total net rentable square feet available for lease based on a number of factors in addition to contractually leased square feet, including available power, required support space and common areas. Excludes square footage of properties held in unconsolidated entities. Square footage is based on current estimates and project plans, and may change upon completion of the project due to remeasurement.
(2)Represents balances incurred through December 31, 2021.

67

Table of Contents

Index to Financial Statements

(3)Represents estimated cost to complete specific scope of work pursuant to contract, budget or approved capital plan.
(4)Represents balances incurred through December 31, 2020.
(5)Represents approximately 849 acres as of December 31, 2021 and approximately 927 acres as of December 31, 2020.
(6)Excludes space held for development through unconsolidated entities.

Land inventory and space held for development reflect cumulative cost spent pending future development. Base building construction consists of ongoing improvements to building infrastructure in preparation for future data center fit-out. Data center construction includes 6.8 million square feet of Turn Key Flex® and Powered Base Building® product. Generally, we expect to deliver the space within 12 months; however, lease commencement dates may significantly impact final delivery schedules. Equipment pool and other inventory represent the value of long-lead equipment and materials required for timely deployment and delivery of data center construction fit-out. Campus, tenant improvements and other costs include the value of development work which benefits space recently converted to our operating portfolio and is composed primarily of shared infrastructure projects and first-generation tenant improvements.

Capital Expenditures (Cash Basis)

The table below summarizes our capital expenditure activity for the year ended December 31, 2021 and 2020 (in thousands):

Year Ended December 31, 


2021


2020

Development projects

$

2,176,203

$

1,751,502

Enhancement and improvements


2,812


1,024

Recurring capital expenditures


217,103


210,727

Total capital expenditures (excluding indirect costs)

$

2,396,118

$

1,963,253

For the year ended December 31, 2021, total capital expenditures increased $432.9 million to approximately $2,396.1 million from $1,963.3 million for the same period in 2020. Capital expenditures on our development projects plus our enhancement and improvements projects for the year ended December 31, 2021 were approximately $2,179.0 million, which reflects an increase of approximately 24% from the same period in 2020. This increase was primarily due to development activity at properties acquired in the Interxion Combination. Our development capital expenditures are generally funded by our available cash and equity and debt capital.

Indirect costs, including capitalized interest, capitalized in the years ended December 31, 2021 and 2020 were $124.7 million and $101.0 million, respectively. Capitalized interest comprised approximately $53.5 million and $47.3 million of the total indirect costs capitalized for the years ended December 31, 2021 and 2020, respectively. Capitalized interest in the year ended December 31, 2021 increased, compared to the same period in 2020, due to an increase in qualifying activities. Excluding capitalized interest, indirect costs in the year ended December 31, 2021 increased compared to the same period in 2020 due primarily to capitalized amounts relating to compensation expense of employees directly engaged in construction activities. 

Consistent with our growth strategy, we actively pursue potential acquisition opportunities, with due diligence and negotiations often at different stages at different times. The dollar value of acquisitions for the year ending December 31, 2022 will depend upon numerous factors, including customer demand, leasing results, availability of debt or equity capital and acquisition opportunities. Further, the growing acceptance by private institutional investors of the data center asset class has generally pushed capitalization rates lower, as such private investors may often have lower return expectations than us. As a result, we anticipate near-term single asset acquisitions activity to comprise a smaller percentage of our growth while this market dynamic persists.

We may from time to time seek to retire or repurchase our outstanding debt or the equity of our Parent through cash purchases and/or exchanges for equity securities of our Parent in open market purchases, privately negotiated

68

Table of Contents

Index to Financial Statements

transactions or otherwise. Such repurchases or exchanges, if any, will depend upon prevailing market conditions, our liquidity requirements, contractual restrictions or other factors. The amounts involved may be material.

Sources of Cash

We expect to meet our short-term and long-term liquidity requirements, including payment of scheduled debt maturities and funding of acquisitions and non-recurring capital improvements, with net cash from operations, future long-term secured and unsecured indebtedness and the issuance of equity and debt securities and the proceeds of equity issuances by our Parent. We also may fund future short-term and long-term liquidity requirements, including acquisitions and non-recurring capital improvements, using our global revolving credit facilities pending permanent financing. As of February 22, 2022, we had approximately $2.4 billion of borrowings available under our global revolving credit facilities.

Our global revolving credit facility provides for borrowings up to $3.0 billion. We have the ability from time to time to increase the size of the global revolving credit facility by up to $1.5 billion, subject to the receipt of lender commitments and other conditions precedent. The global revolving credit facility matures on January 24, 2026, with two six-month extension options available. We have used and intend to use available borrowings under the global revolving credit facility to fund our liquidity requirements from time to time. For additional information regarding our global revolving credit facility, see Note 11. “Debt of the Operating Partnership” to our condensed consolidated financial statements contained herein.

In connection with the issuance of the Swiss Franc Notes in July 2021, we intend to allocate an amount equal to the net proceeds from the offering of the Swiss Franc Notes to finance or refinance, in whole or in part, recently completed or future green building, energy and resource efficiency and renewable energy projects, including the development and redevelopment of such projects (collectively, “Eligible Green Projects”). Pending the allocation of an amount equal to the net proceeds of the Swiss Franc Notes to Eligible Green Projects, all or a portion of an amount equal to the net proceeds from the Swiss Franc Notes were used to temporarily repay borrowings outstanding under the Operating Partnership’s global credit facility and for other general corporate purposes. For additional information regarding our Swiss Franc Notes, see Note 11. “Debt of the Operating Partnership” to our condensed consolidated financial statements contained herein.

Distributions

All distributions on our units are at the discretion of our Parent’s Board of Directors. For additional information regarding distributions paid on our common and preferred units for the years ended December 31, 2021, 2020 and 2019, see Item 8, Note. 14 in the Notes to the Consolidated Financial Statements.

69

Table of Contents

Index to Financial Statements

Outstanding Consolidated Indebtedness

The below tables summarize our outstanding debt, and also our contractual debt maturities and principal payments as of December 31, 2021 (in thousands):

Outstanding Debt

Debt Summary:


Fixed rate

$

12,797.8

Variable rate debt subject to interest rate swaps


Total fixed rate debt (including interest rate swaps)


12,797.8

Variable rate—unhedged


764.4

Total

$

13,562.2

Percent of Total Debt:


Fixed rate (including swapped debt)


94.4

%

Variable rate


5.6

%

Total


100.0

%

Effective Interest Rate as of December 31, 2021


Fixed rate (including hedged variable rate debt)


2.33

%

Variable rate


0.47

%

Effective interest rate


2.22

%

Contractual Debt Maturities and Principal Payments


Global Revolving 


Unsecured

Secured and


Total 

Credit Facilities (1)

Senior Notes

Other Debt

Debt

2022

$

$

682,200

$

336

$

682,536

2023


3,081


3,081

2024


1,020,500


1,020,500

2025


1,730,330


1,730,330

2026


415,116


1,523,694


3,870


1,942,680

Thereafter


8,043,318


139,794


8,183,112

Subtotal

$

415,116

$

13,000,042

$

147,082

$

13,562,240

Unamortized discount


(33,612)


(33,612)

Unamortized premium


(16,944)


(63,060)


(414)


(80,418)

Total

$

398,172

$

12,903,370

$

146,668

$

13,448,210

(1)Subject to two six-month extension options exercisable by us. The bank group is obligated to grant the extension options provided we give proper notice, we make certain representations and warranties and no default exists under the global revolving credit facilities, as applicable.

Our ratio of debt to total enterprise value was approximately 21% (based on the closing price of Digital Realty Trust, Inc.’s common stock on December 31, 2021 of $176.87. For this purpose, our total enterprise value is defined as the sum of the market value of Digital Realty Trust, Inc.’s outstanding common stock (which may decrease, thereby increasing our debt to total enterprise value ratio), plus the liquidation value of Digital Realty Trust, Inc.’s preferred stock, plus the aggregate value of our Operating Partnership’s units not held by Digital Realty Trust, Inc. (with the per unit value equal to the market value of one share of Digital Realty Trust, Inc.’s common stock and excluding long-term incentive units, Class C units and Class D units), plus the book value of our total consolidated indebtedness.

70

Table of Contents

Index to Financial Statements

The variable rate debt shown above bears interest based on various one-month LIBOR, EURIBOR, SOR, BBR, HIBOR, JPY LIBOR and CDOR rates, depending on the respective agreement governing the debt, including our global revolving credit facilities and unsecured term loans. As of December 31, 2021 our debt had a weighted average term to initial maturity of approximately 6.0 years (or approximately 6.1 years assuming exercise of extension options).

Off-Balance Sheet Arrangements

As of December 31, 2021, our pro-rata share of secured debt of unconsolidated entities was approximately $675.7 million.

Cash Flows

The following summary discussion of our cash flows is based on the consolidated statements of cash flows and is not meant to be an all-inclusive discussion of the changes in our cash flows for the periods presented below.

Comparison of Year Ended December 31, 2021 to Year Ended December 31, 2020

The following table shows cash flows and ending cash, cash equivalents and restricted cash balances for the respective periods (in thousands).

Year Ended December 31, 

2021


2020


2019

Net cash provided by operating activities

$

1,702,228

$

1,706,541

$

1,513,817

Net cash used in investing activities


(1,061,721)


(2,599,347)


(274,992)

Net cash (used in) provided by financing activities


(590,630)


935,689


(1,272,021)

Net (decrease) increase in cash, cash equivalents and restricted cash

$

49,877

$

42,883

$

(33,196)

The changes in the activities that comprise net cash used in investing activities for the year ended December 31, 2021 as compared to the year ended December 31, 2020 consisted of the following amounts (in thousands).

Change

2021 vs 2020

Increase in cash used for improvements to investments in real estate

$

(456,706)

Decrease in cash paid for acquisitions in cash paid for business combinations and assets acquisition, net of cash and restricted cash acquired

716,552

Increase in net cash provided by proceeds from sale of real estate

1,126,457

Increase in cash provided by proceeds from the unconsolidated entities transactions

146,988

Other changes


4,335

Decrease in net cash used in investing activities

$

1,537,626

The 2021 decrease in net cash used in investing activities was primarily due to an increase in cash provided by proceeds from (i) contribution of properties to the SREIT, (ii) sale of investments related to the sale of 11 data centers in Europe in March 2021 partially offset by the sale of 10 Powered Base Building® properties, which comprise 12 data centers, in North America to Mapletree in January 2020, (iii) an increase in cash used for improvements to investments in real estate and a decrease in cash paid for acquisitions related to the acquisition of an additional 49% ownership interest in the Westin Building Exchange in February 2020, and (iv) partially offset by an increase in cash used for improvements to investments in real estate.

Change

2021 vs 2020

Increase in cash used in/provided by short-term borrowings

$

(251,665)

71

Table of Contents

Index to Financial Statements

(Decrease) in cash provided by net proceeds from issuance of common and preferred stock, including equity plans, net

(1,707,861)

(Decrease) in cash provided by proceeds from secured / unsecured debt

(1,748,731)

Decrease in cash used for repayment on secured / unsecured debt

1,937,956

Decrease in cash used for redemption of preferred stock


298,750

Increase in cash used for dividend and distribution payments


(139,880)

Other changes

85,112

(Decrease) in net cash provided by financing activities

$

(1,526,319)

The decrease in net cash provided by finance activities as compared to the same period in 2020 was primarily due to (i) a decrease of net proceeds from issuance of common stock, due to the full physical settlement of our forward equity agreements in September 2020, (ii) higher activity in the ATM equity offering program in 2020 compared to 2021, (iii) an increase in dividend and distribution payments for the year ended December 31, 2021 due to an increase in the number of shares outstanding subsequent to the Interxion Combination and (iv) offset by an increase in cash proceeds from short-term borrowings.

Noncontrolling Interests in Operating Partnership

Noncontrolling interests relate to the common units in our Operating Partnership that are not owned by Digital Realty Trust, Inc., which, as of December 31, 2021, amounted to 2.0% of our Operating Partnership common units. Historically, our Operating Partnership has issued common units to third party sellers in connection with our acquisition of real estate interests from such third parties.

Limited partners have the right to require our Operating Partnership to redeem part or all of their common units for cash based upon the fair market value of an equivalent number of shares of Digital Realty Trust, Inc. common stock at the time of the redemption. Alternatively, we may elect to acquire those common units in exchange for shares of Digital Realty Trust, Inc. common stock on a one-for-one basis, subject to adjustment in the event of stock splits, stock dividends, issuance of stock rights, specified extraordinary distributions and similar events. As of December 31, 2021, approximately 0.2 million common units of the Operating Partnership that were issued to certain former unitholders of DuPont Fabros Technology, L.P. in connection with the Company’s acquisition of DuPont Fabros Technology, Inc. were outstanding, which are subject to certain restrictions and, accordingly, are not presented as permanent capital in the consolidated balance sheet.

Inflation

Many of our leases provide for separate real estate tax and operating expense escalations. In addition, many of the leases provide for fixed base rent increases. We believe that inflationary increases may be at least partially offset by the contractual rent increases and expense escalations described above.

72

Table of Contents

Index to Financial Statements

Critical Accounting Policies

A critical accounting policy is one that involves management’s use of judgement regarding expected outcomes of uncertain events in order to make estimates and assumptions that are material to an entity’s financial condition and results of operations. Though we base our estimates and assumptions regarding these matters on historical and current conditions as well as future expectations, these estimates and assumptions are subjective in nature. Changes to the estimates and assumptions we make regarding these matters could affect our financial position and specific items in our results of operations used by stockholders, potential investors, industry analysts and lenders in the evaluation of our performance. Of the significant accounting policies described in Note 2 to the Consolidated Financial Statements, the subsequent items have been identified by us as meeting the criteria to be considered critical accounting policies. Refer to Note 2 for more information on these critical accounting policies.

Fair Value Measurements. Fair value is intended to reflect the price that would be received for the sale of an asset or paid for the transfer of a liability in an orderly transaction between market participants at the measurement date (the exit price). We use fair value measurements to enable us to determine the fair value of a variety of items. Fair value measurements are most significant to our financial statements in the following areas: 1) evaluation of recoverability of real estate and intangible assets (which involves comparison of fair value of the assets to net book value to quantify any potential impairments), 2) accounting for assets held for sale (which involves recording assets qualifying for held for sale treatment at the lower of book value or fair value less costs to sell), and 3) determination of fair value of assets and liabilities acquired in connection with business combinations or asset acquisitions as well as certain equity interests in unconsolidated entities.

We estimate fair value using available market information and valuation methods we believe to be appropriate for these purposes. Given the significant amount of judgement and subjectivity involved in the determination of fair value, estimated fair value is not necessarily indicative of amounts that would be realized on disposition. Refer to Note 2. “Summary of Significant Accounting Policies” the Consolidated Financial Statements for additional information.

Recoverability of Real Estate Assets. We assess the carrying value of our properties whenever events or circumstances indicate carrying amounts of these assets may not be fully recoverable (“triggering events"). Triggering events typically relate to a change in the expected holding period of a property, an adverse change in expected future cash flows of the property, or a trend of past cash flow losses that is expected to continue in the future. If our assessment of triggering events indicates the carrying value of a property or asset group might not be recoverable, we estimate the future undiscounted net cash flows expected to be generated by the assets and compare that amount to the book value of the assets. If our future undiscounted net cash flow evaluation indicates we are unable to recover the carrying value of a property or asset group, we record an impairment loss to the extent the carrying value of the property or asset group exceeds fair value. Refer to Note 2. “Summary of Significant Accounting Policies” of the Consolidated Financial Statements for additional information.

Consolidation. We consolidate all entities that are wholly owned as well as all partially-owned entities that we control. In addition, we consolidate any variable interest entities (“VIEs”) for which we are the primary beneficiary. We evaluate whether or not an entity is a VIE (and we are the primary beneficiary) through consideration of substantive terms in the arrangement to identify which enterprise has the power to direct the activities of the entity that most significantly impact the entity’s economic performance and the obligation to absorb losses/receive benefits from the entity.

73

Table of Contents

Index to Financial Statements

For entities that do not meet the definition of VIEs, we first consider if we are the general partner or a limited partner (or the equivalent in investments not structured as partnerships). We consolidate entities in which we are the general partner and the limited partners do not have rights that would preclude control. For entities in which we are the general partner, but the limited partners hold substantive participating or kick-out rights that prohibit our ability to control the entity, we apply the equity method of accounting since, as the general partner, we have the ability to exercise significant influence over the operating and financial policies of the entities. For entities in which we are a limited partner, or that are not structured similar to a partnership, we consider factors such as ownership interest, voting control, authority to make decisions and contractual and substantive participating rights of the partners. When factors indicate we have a controlling financial interest in an entity, we consolidate the entity. Refer to Note 8. “Investments in Unconsolidated Entities” of the Consolidated Financial Statements for additional information.

Revenue Recognition. We generate the majority of our revenue by leasing our properties to customers under operating lease agreements, which are accounted for under Accounting Standards Codification 842, Leases (“ASC 842”). We recognize the total minimum lease payments provided for under the leases on a straight-line basis over the lease term if we determine it is probable that substantially all of the lease payments will be collected over the lease term.

We estimate the probability of collection of lease payments based on customer creditworthiness, outstanding accounts receivable balances, and historical bad debts – as well as current economic trends. If collection of substantially all lease payments over the lease term is not probable, rental revenue is recognized when payment is received, and we record a full valuation allowance on the balance of any rent receivable, less the balance of any security deposits or letters of credit. If collection is subsequently determined to be probable, we: 1) resume recognizing rental revenue on a straight-line basis, 2) record incremental revenue such that the cumulative amount recognized is equal to the amount that would have been recorded on a straight-line basis since inception of the lease, and 3) reverse the allowance for bad debt recorded on outstanding receivables. Refer to Note 5. “Receivables” of the Consolidated Financial Statements for additional information.

New Accounting Pronouncements

See Note 2. “Summary of Significant Accounting Policies” of the Consolidated Financial Statements.

Funds From Operations

We calculate funds from operations, or FFO, in accordance with the standards established by the National Association of Real Estate Investment Trusts (Nareit) in the Nareit Funds From Operations White Paper - 2018 Restatement. FFO represents net income (loss) (computed in accordance with GAAP), excluding gains (or losses) from sales of property, a gain from a pre-existing relationship, impairment charges and real estate related depreciation and amortization (excluding amortization of deferred financing costs) and after adjustments for unconsolidated partnerships and joint ventures. Management uses FFO as a supplemental performance measure because, in excluding real estate related depreciation and amortization and gains and losses from property dispositions and after adjustments for unconsolidated partnerships and joint ventures, it provides a performance measure that, when compared year over year, captures trends in occupancy rates, rental rates and operating costs. We also believe that, as a widely recognized measure of the performance of REITs, FFO will be used by investors as a basis to compare our operating performance with that of other REITs. However, because FFO excludes depreciation and amortization and captures neither the changes in the value of our properties that result from use or market conditions, nor the level of capital expenditures and capitalized leasing commissions necessary to maintain the operating performance of our properties, all of which have real economic effect and could materially impact our financial condition and results from operations, the utility of FFO as a measure of our performance is limited. Other REITs may not calculate FFO in accordance with the Nareit definition and, accordingly, our FFO may not be comparable to other REITs’ FFO. FFO should be considered only as a supplement to net income computed in accordance with GAAP as a measure of our performance.

74

Table of Contents

Index to Financial Statements

Reconciliation of Net Income Available to Common Stockholders to Funds From Operations (FFO)

(in thousands, except per share and unit data)

(unaudited)

Year Ended December 31, 

2021


2020


2019

Net Income Available to Common Stockholders

$

1,681,498

$

263,342

$

493,011

Adjustments:


Non-controlling interests in operating partnership


39,100


9,500


21,100

Real estate related depreciation & amortization (1)


1,463,512


1,341,836


1,149,240

Unconsolidated JV real estate related depreciation & amortization

85,800

77,730

52,716

Gain on real estate transactions

(1,445,230)

(316,895)

(267,651)

Impairment of investments in real estate


18,291


6,482


5,351

FFO available to common stockholders and unitholders (2)

$

1,842,971

$

1,381,995

$

1,453,767

Basic FFO per share and unit

$

6.37

$

5.16

$

6.69

Diluted FFO per share and unit (2)

$

6.36

$

5.11

$

6.66

Weighted average common stock and units outstanding


Basic


289,165


268,073


217,285

Diluted (2)


289,912


270,497


218,440

(1) Real estate related depreciation and amortization was computed as follows:

Depreciation and amortization per income statement

$

1,486,632


$

1,366,379


$

1,163,774

Non-real estate depreciation

(23,120)

(24,543)

(14,534)

$

1,463,512

$

1,341,836

$

1,149,240

(2)For all periods presented, we have excluded the effect of the series C, series J, series K and series L preferred stock, as applicable, that may be converted into common stock upon the occurrence of specified change in control transactions as described in the articles supplementary governing the series C, series J, series K and series L preferred stock, as applicable, as they would be anti-dilutive.


Year Ended December 31, 


2021


2020


2019

Weighted average common stock and units outstanding


289,165


268,073


217,285

Add: Effect of dilutive securities


747


2,424


1,155

Weighted average common stock and units outstanding—diluted


289,912


270,497


218,440

ITEM 7A.       QUANTITATIVE AND QUALITATIVE DISCLOSURES ABOUT MARKET RISK

Our future income, cash flows and fair values relevant to financial instruments depend upon prevalent market interest rates. Market risk refers to the risk of loss from adverse changes in market prices and interest rates. We do not use derivatives for trading or speculative purposes and only enter into contracts with major financial institutions based on their credit ratings and other factors.

75

Table of Contents

Index to Financial Statements

Analysis of Debt between Fixed and Variable Rate

We use interest rate swap agreements and fixed rate debt to reduce our exposure to interest rate movements. As of December 31, 2021, our consolidated debt was as follows (in millions):


Estimated Fair

Carrying Value


Value

Fixed rate debt

$

12,797.8

$

13,383.5

Variable rate debt subject to interest rate swaps


Total fixed rate debt (including interest rate swaps)


12,797.8


13,383.5

Variable rate debt


764.4


764.4

Total outstanding debt

$

13,562.2

$

14,147.9

76

Table of Contents

Index to Financial Statements

Interest rate derivatives and their fair values as of December 31, 2021 and December 31, 2020 were as follows (in thousands):

Fair Value at Significant Other

Notional Amount

Observable Inputs (Level 2)

As of

As of

As of

As of

December 31, 

December 31, 

Type of

Strike

Effective

Expiration

December 31, 

December 31, 

2021


2020


Derivative


Rate


 Date


Date


2021


2020

Currently-paying contracts

$

$

104,000

(1)

Swap


1.435

Jan 15, 2016

Jan 15, 2023

$

$

(2,773)


77,352

(2)

Swap


0.779

Jan 15, 2016

Jan 15, 2021


(9)

$

$

181,352


$

$

(2,782)

(1)Represents debt which bears interest based on one-month U.S. LIBOR.
(2)Represents debt which bears interest based on one-month CDOR. Translation to U.S. dollars is based on exchange rates of $0.79 to 1.00 CAD as of December 31, 2020.

Sensitivity to Changes in Interest Rates

The following table shows the effects if assumed changes in interest rates occurred, based on fair values and interest expense as of December 31, 2021:


Change

Assumed event

($ millions)

Increase in fair value of interest rate swaps following an assumed 10% increase in interest rates

$

0.0

Decrease in fair value of interest rate swaps following an assumed 10% decrease in interest rates


(0.0)

Increase in annual interest expense on our debt that is variable rate and not subject to swapped interest following a 10% increase in interest rates


0.2

Decrease in annual interest expense on our debt that is variable rate and not subject to swapped interest following a 10% decrease in interest rates


(0.2)

Increase in fair value of fixed rate debt following a 10% decrease in interest rates


17.6

Decrease in fair value of fixed rate debt following a 10% increase in interest rates


(24.5)

Interest risk amounts were determined by considering the impact of hypothetical interest rates on our financial instruments. These analyses do not consider the effect of any change in overall economic activity that could occur in that environment. Further, in the event of a change of that magnitude, we may take actions to further mitigate our exposure to the change. However, due to the uncertainty of the specific actions that would be taken and their possible effects, these analyses assume no changes in our financial structure.

Foreign Currency Exchange Risk

We are subject to risk from the effects of exchange rate movements of a variety of foreign currencies, which may affect future costs and cash flows. Our primary currency exposures are to the Euro, Japanese yen, British pound sterling and Singapore dollar. As a result of the Ascenty entity and deconsolidation of Ascenty, our exposure to foreign exchange risk related to the Brazilian real is limited to the impact that currency has on our share of the Ascenty entity’s operations and financial position. We attempt to mitigate a portion of the risk of currency fluctuations by financing our investments in local currency denominations in order to reduce our exposure to any foreign currency transaction gains or losses resulting from transactions entered into in currencies other than the functional currencies of the associated entities. In addition, we may also hedge well-defined transactional exposures with foreign currency forwards or options, although there can be no assurances that these will be effective. As a result, changes in the relation of any such foreign currency to U.S. dollar may affect our revenues, operating margins and distributions and may also affect the book value of our assets and the amount of stockholders’ equity.

77

Table of Contents

Index to Financial Statements

78

Table of Contents

Index to Financial Statements

ITEM 8.        FINANCIAL STATEMENTS AND SUPPLEMENTARY DATA

INDEX TO THE CONSOLIDATED FINANCIAL STATEMENTS


Page No.

Management’s Reports on Internal Control over Financial Reporting

80

Reports of Independent Registered Public Accounting Firm (Auditor Firm ID: 185)

81

Consolidated Financial Statements of Digital Realty Trust, Inc.

Consolidated Balance Sheets as of December 31, 2021 and 2020

86

Consolidated Income Statements for each of the years in the three-year period ended December 31, 2021

87

Consolidated Statements of Comprehensive Income for each of the years in the three-year period ended December 31, 2021

88

Consolidated Statements of Equity for each of the years in the three-year period ended December 31, 2021

91

Consolidated Statements of Cash Flows for each of the years in the three-year period ended December 31, 2021

92

Consolidated Financial Statements of Digital Realty Trust, L.P.

Consolidated Balance Sheets as of December 31, 2021 and 2020

93

Consolidated Income Statements for each of the years in the three-year period ended December 31, 2021

94

Consolidated Statements of Comprehensive Income for each of the years in the three-year period ended December 31, 2021

95

Consolidated Statements of Capital for each of the years in the three-year period ended December 31, 2021

96

Consolidated Statements of Cash Flows for each of the years in the three-year period ended December 31, 2021

99

Consolidated Financial Statements of Digital Realty Trust, Inc. and Digital Realty Trust, L.P.

Notes to Consolidated Financial Statements

100

Supplemental Schedule—Schedule III—Properties and Accumulated Depreciation

146

Notes to Schedule III—Properties and Accumulated Depreciation

148

79

Table of Contents

Index to Financial Statements

Management’s Report on Internal Control over Financial Reporting

The management of Digital Realty Trust, Inc. (the Company) is responsible for establishing and maintaining adequate internal control over financial reporting, as such term is defined in Exchange Act Rules 13a-15(f) and 15(d)-15(f). Our internal control system was designed to provide reasonable assurance to the Company’s management and board of directors regarding the preparation and fair presentation of published financial statements.

All internal control systems, no matter how well designed, have inherent limitations. Therefore, even those systems determined to be effective can provide only reasonable assurance with respect to financial statement preparation and presentation.

Under the supervision and with the participation of management, including our Chief Executive Officer and Chief Financial Officer, we assessed the effectiveness of the Company’s internal control over financial reporting as of December 31, 2021. In making this assessment, we used the criteria set forth by the Committee of Sponsoring Organizations of the Treadway Commission in Internal Control—Integrated Framework (2013). We acquired Interxion and subsidiaries during the year ended December 31, 2021. Based on our assessment, management concluded that as of December 31, 2021, the Company’s internal control over financial reporting was effective based on those criteria.

Our independent registered public accounting firm has issued an audit report on the Company’s internal control over financial reporting. This report appears on page 83.

Management’s Report on Internal Control over Financial Reporting

The management of Digital Realty Trust, L.P. (the Operating Partnership) is responsible for establishing and maintaining adequate internal control over financial reporting, as such term is defined in Exchange Act Rules 13a-15(f) and 15(d)-15(f). Our internal control system was designed to provide reasonable assurance to the Operating Partnership’s management regarding the preparation and fair presentation of published financial statements.

All internal control systems, no matter how well designed, have inherent limitations. Therefore, even those systems determined to be effective can provide only reasonable assurance with respect to financial statement preparation and presentation.

Under the supervision and with the participation of management, including the Chief Executive Officer and Chief Financial Officer of our general partner, we assessed the effectiveness of the Operating Partnership’s internal control over financial reporting as of December 31, 2021. In making this assessment, we used the criteria set forth by the Committee of Sponsoring Organizations of the Treadway Commission in Internal Control—Integrated Framework (2013). We acquired Interxion and subsidiaries during the year ended December 31, 2021. Based on our assessment, management concluded that as of December 31, 2021, the Operating Partnership’s internal control over financial reporting was effective based on those criteria.

80

Table of Contents

Index to Financial Statements

Report of Independent Registered Public Accounting Firm

To the Stockholders and Board of Directors
Digital Realty Trust, Inc.:

Opinion on the Consolidated Financial Statements

We have audited the accompanying consolidated balance sheets of Digital Realty Trust, Inc. and subsidiaries (the Company) as of December 31, 2021 and 2020, the related consolidated income statements, and statements of comprehensive income, equity, and cash flows for each of the years in the three-year period ended December 31, 2021, and the related notes and financial statement schedule III, properties and accumulated depreciation (collectively, the consolidated financial statements). In our opinion, the consolidated financial statements present fairly, in all material respects, the financial position of the Company as of December 31, 2021 and 2020, and the results of its operations and its cash flows for each of the years in the three-year period ended December 31, 2021, in conformity with U.S. generally accepted accounting principles.

We also have audited, in accordance with the standards of the Public Company Accounting Oversight Board (United States) (PCAOB), the Company’s internal control over financial reporting as of December 31, 2021, based on criteria established in Internal Control – Integrated Framework (2013) issued by the Committee of Sponsoring Organizations of the Treadway Commission, and our report dated February 25, 2022 expressed an unqualified opinion on the effectiveness of the Company’s internal control over financial reporting.

Basis for Opinion

These consolidated financial statements are the responsibility of the Company’s management. Our responsibility is to express an opinion on these consolidated financial statements based on our audits. We are a public accounting firm registered with the PCAOB and are required to be independent with respect to the Company in accordance with the U.S. federal securities laws and the applicable rules and regulations of the Securities and Exchange Commission and the PCAOB.

We conducted our audits in accordance with the standards of the PCAOB. Those standards require that we plan and perform the audit to obtain reasonable assurance about whether the consolidated financial statements are free of material misstatement, whether due to error or fraud. Our audits included performing procedures to assess the risks of material misstatement of the consolidated financial statements, whether due to error or fraud, and performing procedures that respond to those risks. Such procedures included examining, on a test basis, evidence regarding the amounts and disclosures in the consolidated financial statements. Our audits also included evaluating the accounting principles used and significant estimates made by management, as well as evaluating the overall presentation of the consolidated financial statements. We believe that our audits provide a reasonable basis for our opinion.

Critical Audit Matter

The critical audit matter communicated below is a matter arising from the current period audit of the consolidated financial statements that was communicated or required to be communicated to the audit committee and that: (1) relates to accounts or disclosures that are material to the consolidated financial statements and (2) involved our especially challenging, subjective, or complex judgments. The communication of a critical audit matter does not alter in any way our opinion on the consolidated financial statements, taken as a whole, and we are not, by communicating the critical audit matter below, providing a separate opinion on the critical audit matter or on the accounts or disclosures to which it relates.

81

Table of Contents

Index to Financial Statements

Evaluation of lease revenue

As discussed in Note 2 to the consolidated financial statements, the Company records rental revenue on a straight-line basis if the Company determines on a lease-by-lease basis it is probable substantially all lease payments over the term of the lease will be collected. Whenever the results of that assessment indicate that it is not probable that the Company will be able to collect substantially all lease payments over the remaining term of the lease, the Company records a reduction to rental revenue equal to the then-current combined balance of the deferred rent and amounts contractually due but unpaid for the lease (rent receivable), and ceases recognizing rental revenue on a straight-line basis and commences recognizing rental revenue on a cash collected basis. Rental and other services revenue was $4.4 billion for the year ended December 31, 2021 and deferred rent and rent receivable, net was $547.4 million and $370.5 million, respectively, as of December 31, 2021.

We identified the evaluation of the probability of collection of lease payments as a critical audit matter. Evaluating the Company’s probability assessment of collection of substantially all the lease payments for its leases required significant auditor judgment because of the subjective nature of the evidence obtained. Specifically, evaluating the creditworthiness of the customer and any guarantors required significant auditor judgment.

The following are the primary procedures we performed to address this critical audit matter. We evaluated the design and tested the operating effectiveness of certain internal controls over the Company’s probability assessment of lease payment collection process, including controls related to the assessment of the creditworthiness of the customer and any guarantors. For a selection of the Company’s leases, we evaluated the Company’s determination of the collectibility of substantially all of the lease payments by: (i) comparing the legal name of customer and any guarantor to the underlying lease agreements and third-party credit rating report, (ii) evaluating the creditworthiness of the customer by assessing their credit rating, (iii) reading publicly available information, including the customer’s financial statements, analyst reports, recent public filings, and news articles, and (iv) inquiring of Company employees to obtain evidence regarding creditworthiness of the customers.

.


/s/    KPMG LLP

We have served as the Company’s auditor since 2004.

San Francisco, California

February 25, 2022

82

Table of Contents

Index to Financial Statements

Report of Independent Registered Public Accounting Firm

To the Stockholders and Board of Directors

Digital Realty Trust, Inc.:

Opinion on Internal Control Over Financial Reporting

We have audited Digital Realty Trust, Inc. and subsidiaries' (the Company) internal control over financial reporting as of December 31, 2021, based on criteria established in Internal Control – Integrated Framework (2013) issued by the Committee of Sponsoring Organizations of the Treadway Commission. In our opinion, the Company maintained, in all material respects, effective internal control over financial reporting as of December 31, 2021, based on criteria established in Internal Control – Integrated Framework (2013) issued by the Committee of Sponsoring Organizations of the Treadway Commission.

We also have audited, in accordance with the standards of the Public Company Accounting Oversight Board (United States) (PCAOB), the consolidated balance sheets of the Company as of December 31, 2021 and 2020, the related consolidated income statements and consolidated statements of comprehensive income, equity, and cash flows for each of the years in the three-year period ended December 31, 2021, and the related notes and financial statement schedule III, properties and accumulated depreciation (collectively, the consolidated financial statements), and our report dated February 25, 2022 expressed an unqualified opinion on those consolidated financial statements.

Basis for Opinion

The Company’s management is responsible for maintaining effective internal control over financial reporting and for its assessment of the effectiveness of internal control over financial reporting, included in the accompanying Management's Report on Internal Control over Financial Reporting. Our responsibility is to express an opinion on the Company’s internal control over financial reporting based on our audit. We are a public accounting firm registered with the PCAOB and are required to be independent with respect to the Company in accordance with the U.S. federal securities laws and the applicable rules and regulations of the Securities and Exchange Commission and the PCAOB.

We conducted our audit in accordance with the standards of the PCAOB. Those standards require that we plan and perform the audit to obtain reasonable assurance about whether effective internal control over financial reporting was maintained in all material respects. Our audit of internal control over financial reporting included obtaining an understanding of internal control over financial reporting, assessing the risk that a material weakness exists, and testing and evaluating the design and operating effectiveness of internal control based on the assessed risk. Our audit also included performing such other procedures as we considered necessary in the circumstances. We believe that our audit provides a reasonable basis for our opinion.

Definition and Limitations of Internal Control Over Financial Reporting

A company’s internal control over financial reporting is a process designed to provide reasonable assurance regarding the reliability of financial reporting and the preparation of financial statements for external purposes in accordance with generally accepted accounting principles. A company’s internal control over financial reporting includes those policies and procedures that (1) pertain to the maintenance of records that, in reasonable detail, accurately and fairly reflect the transactions and dispositions of the assets of the company; (2) provide reasonable assurance that transactions are recorded as necessary to permit preparation of financial statements in accordance with generally accepted accounting principles, and that receipts and expenditures of the company are being made only in accordance with authorizations of management and directors of the company; and (3) provide reasonable assurance regarding prevention or timely detection of unauthorized acquisition, use, or disposition of the company’s assets that could have a material effect on the financial statements.

Because of its inherent limitations, internal control over financial reporting may not prevent or detect misstatements. Also, projections of any evaluation of effectiveness to future periods are subject to the risk that controls may become inadequate because of changes in conditions, or that the degree of compliance with the policies or procedures may deteriorate.


/s/    KPMG LLP

San Francisco, California

February 25, 2022

83

Table of Contents

Index to Financial Statements

Report of Independent Registered Public Accounting Firm

To the Stockholders and Board of Directors of the General Partner and Partners
Digital Realty Trust, L.P.:

Opinion on the Consolidated Financial Statements

We have audited the accompanying consolidated balance sheets of Digital Realty Trust, L.P. and subsidiaries (the Operating Partnership) as of December 31, 2021 and 2020, the related consolidated income statements, and consolidated statements of comprehensive income, capital, and cash flows for each of the years in the three-year period ended December 31, 2021, and the related notes and financial statement schedule III, properties and accumulated depreciation (collectively, the consolidated financial statements). In our opinion, the consolidated financial statements present fairly, in all material respects, the financial position of the Operating Partnership as of December 31, 2021 and 2020, and the results of its operations and its cash flows for each of the years in the three-year period ended December 31, 2021, in conformity with U.S. generally accepted accounting principles.

Basis for Opinion

These consolidated financial statements are the responsibility of the Operating Partnership’s management. Our responsibility is to express an opinion on these consolidated financial statements based on our audits. We are a public accounting firm registered with the Public Company Accounting Oversight Board (United States) (PCAOB) and are required to be independent with respect to the Operating Partnership in accordance with the U.S. federal securities laws and the applicable rules and regulations of the Securities and Exchange Commission and the PCAOB.

We conducted our audits in accordance with the standards of the PCAOB. Those standards require that we plan and perform the audit to obtain reasonable assurance about whether the consolidated financial statements are free of material misstatement, whether due to error or fraud. The Operating Partnership is not required to have, nor were we engaged to perform, an audit of its internal control over financial reporting. As part of our audits, we are required to obtain an understanding of internal control over financial reporting but not for the purpose of expressing an opinion on the effectiveness of the Operating Partnership’s internal control over financial reporting. Accordingly, we express no such opinion.

Our audits included performing procedures to assess the risks of material misstatement of the consolidated financial statements, whether due to error or fraud, and performing procedures that respond to those risks. Such procedures included examining, on a test basis, evidence regarding the amounts and disclosures in the consolidated financial statements. Our audits also included evaluating the accounting principles used and significant estimates made by management, as well as evaluating the overall presentation of the consolidated financial statements. We believe that our audits provide a reasonable basis for our opinion.

Critical Audit Matter

The critical audit matter communicated below is a matter arising from the current period audit of the consolidated financial statements that was communicated or required to be communicated to the audit committee and that: (1) relates to accounts or disclosures that are material to the consolidated financial statements and (2) involved our especially challenging, subjective, or complex judgments. The communication of a critical audit matter does not alter in any way our opinion on the consolidated financial statements, taken as a whole, and we are not, by communicating the critical audit matter below, providing a separate opinion on the critical audit matter or on the accounts or disclosures to which it relates.

84

Table of Contents

Index to Financial Statements

Evaluation of lease revenue  

As discussed in Note 2 to the consolidated financial statements, the Operating Partnership records rental revenue on a straight-line basis if the Operating Partnership determines on a lease-by-lease basis it is probable substantially all lease payments over the term of the lease will be collected. Whenever the results of that assessment indicate that it is not probable that the Operating Partnership will be able to collect substantially all lease payments over the remaining term of the lease, the Operating Partnership records a reduction to rental revenue equal to the then-current combined balance of the deferred rent and amounts contractually due but unpaid for the lease (rent receivable), and ceases recognizing rental revenue on a straight-line basis and commences recognizing rental revenue on a cash collected basis. Rental and other services revenue was $4.4 billion for the year ended December 31, 2021 and deferred rent and rent receivable, net was $547.4 million and $370.5 million, respectively, as of December 31, 2021. 

We identified the evaluation of the probability of collection of lease payments as a critical audit matter. Evaluating the Operating Partnership’s probability assessment of collection of substantially all the lease payments for its leases required significant auditor judgment because of the subjective nature of the evidence obtained. Specifically, evaluating the creditworthiness of the customer and any guarantors required significant auditor judgment.


The following are the primary procedures we performed to address this critical audit matter. We evaluated the design and tested the operating effectiveness of certain internal controls over the Operating Partnership’s probability assessment of lease payment collection process, including controls related to the assessment of the creditworthiness of the customer and any guarantors. For a selection of the Operating Partnership’s leases, we evaluated the Operating Partnership’s determination of the collectibility of substantially all of the lease payments by: (i) comparing the legal name of customer and any guarantor to the underlying lease agreements and third-party credit rating report, (ii) evaluating the creditworthiness of the customer by assessing their credit rating, (iii) reading publicly available information, including the customer’s financial statements, analyst reports, recent public filings, and news articles, and (iv) inquiring of Operating Partnership employees to obtain evidence regarding creditworthiness of the customers.


/s/    KPMG LLP

We have served as the Operating Partnership’s auditor since 2004.

San Francisco, California

February 25, 2022

85

Table of Contents

Index to Financial Statements

DIGITAL REALTY TRUST, INC. AND SUBSIDIARIES

CONSOLIDATED BALANCE SHEETS

(in thousands, except share and per share data)


December 31, 


December 31, 

2021

2020

ASSETS

Investments in real estate:

Investments in properties, net

$

20,762,241

$

20,582,954

Investments in unconsolidated entities


1,807,689


1,148,158

Net investments in real estate


22,569,930


21,731,112

Operating lease right-of-use assets, net

1,405,441

1,386,959

Cash and cash equivalents


142,698


108,501

Accounts and other receivables, net


671,721


603,111

Deferred rent, net


547,385


528,180

Goodwill


7,937,440


8,330,996

Customer relationship value, deferred leasing costs and intangibles, net


2,735,486

3,122,904

Other assets


359,459


264,528

Total assets

$

36,369,560

$

36,076,291

LIABILITIES AND EQUITY

Global revolving credit facilities, net

$

398,172

$

531,905

Unsecured term loans, net


536,580

Unsecured senior notes, net of discount


12,903,370


11,997,010

Secured and other debt, including premiums


146,668


239,222

Operating lease liabilities

1,512,187

1,468,712

Accounts payable and other accrued liabilities


1,543,623


1,420,162

Deferred tax liabilities, net

666,451

698,308

Accrued dividends and distributions


338,729


324,386

Security deposits and prepaid rents


336,578


371,659

Total liabilities


17,845,778


17,587,944

Redeemable noncontrolling interests


46,995


42,011

Commitments and contingencies

Equity:

Stockholders’ Equity:

Preferred Stock: $0.01 par value per share, 110,000,000 shares authorized; $755,000 and $956,250 liquidation preference ($25.00 per share), 30,200,000 and 38,250,000 shares issued and outstanding as of December 31, 2021 and December 31, 2020, respectively


731,690


950,940

Common Stock: $0.01 par value per share, 392,000,000 shares authorized; 284,415,013 and 280,289,726 shares issued and outstanding as of December 31, 2021 and December 31, 2020, respectively


2,824


2,788

Additional paid-in capital


21,075,863


20,626,897

Accumulated dividends in excess of earnings


(3,631,929)


(3,997,938)

Accumulated other comprehensive (loss) income, net


(173,880)


135,010

Total stockholders’ equity


18,004,568


17,717,697

Noncontrolling interests


472,219


728,639

Total equity


18,476,787


18,446,336

Total liabilities and equity

$

36,369,560

$

36,076,291

See accompanying notes to the consolidated financial statements.

86

Table of Contents

Index to Financial Statements

DIGITAL REALTY TRUST, INC. AND SUBSIDIARIES

CONSOLIDATED INCOME STATEMENTS

(in thousands, except share and per share data)

Year Ended December 31, 

2021


2020


2019

Operating Revenues:

Rental and other services

$

4,395,039

$

3,886,546

$

3,196,356

Fee income and other


32,843


17,063


12,885

Total operating revenues


4,427,882


3,903,609


3,209,241

Operating Expenses:

Rental property operating and maintenance


1,570,506


1,331,493


1,020,578

Property taxes and insurance


207,814


182,623


172,183

Depreciation and amortization


1,486,632


1,366,379


1,163,774

General and administrative


400,654


351,369


211,097

Transactions and integration


47,426


106,662


27,925

Impairment of investments in real estate


18,291


6,482


5,351

Other


2,550


1,075


14,118

Total operating expenses


3,733,873


3,346,083


2,615,026

Operating income


694,009


557,526


594,215

Other Income (Expenses):

Equity in earnings (loss) of unconsolidated entities


62,283


(57,629)


8,067

Gain on disposition of properties, net

1,380,795

316,894


267,651

Gain on deconsolidation, net


67,497

Other (expenses) income, net


(4,358)


20,222


66,000

Interest expense


(293,846)


(333,021)


(353,057)

Loss from early extinguishment of debt


(18,672)


(103,215)


(39,157)

Income tax expense


(72,799)


(38,047)


(11,995)

Net income


1,747,412


362,730


599,221

Net income attributable to noncontrolling interests


(38,153)


(6,332)


(19,460)

Net income attributable to Digital Realty Trust, Inc.


1,709,259


356,398


579,761

Preferred stock dividends, including undeclared dividends


(45,761)


(76,536)


(74,990)

Gain (loss) on redemption of preferred stock


18,000


(16,520)


(11,760)

Net income available to common stockholders

$

1,681,498

$

263,342

$

493,011

Net income per share available to common stockholders:

Basic

$

5.95

$

1.01

$

2.37

Diluted

$

5.94

$

1.00

$

2.35

Weighted average common shares outstanding:

Basic


282,474,927


260,098,978


208,325,823

Diluted


283,221,968


262,522,508


209,462,247

See accompanying notes to the consolidated financial statements.

87

Table of Contents

Index to Financial Statements

DIGITAL REALTY TRUST, INC. AND SUBSIDIARIES

CONSOLIDATED STATEMENTS OF COMPREHENSIVE INCOME

(in thousands)

Year Ended December 31, 

2021


2020


2019

Net income

$

1,747,412

$

362,730

$

599,221

Other comprehensive income (loss):

Foreign currency translation adjustments


(318,828)


230,340


23,975

Reclassification of foreign currency translation adjustment due to deconsolidation of Ascenty

21,687

Increase (decrease) in fair value of interest rate swaps


1,279


(12,425)


(9,232)

Reclassification to interest expense from interest rate swaps


1,304


8,294


(7,446)

Other comprehensive income (loss)

(316,245)

226,209

28,984

Comprehensive income


1,431,167


588,939


628,205

Comprehensive income attributable to noncontrolling interests


(30,796)


(9,610)


(20,719)

Comprehensive income attributable to Digital Realty Trust, Inc.

$

1,400,371

$

579,329

$

607,486

See accompanying notes to the consolidated financial statements.

88

Table of Contents

Index to Financial Statements

DIGITAL REALTY TRUST, INC. AND SUBSIDIARIES

CONSOLIDATED STATEMENTS OF EQUITY (continued)

(in thousands, except share data)


Accumulated


Accumulated

Other

Redeemable 

Number of

Additional

Dividends in

Comprehensive

Total


Noncontrolling

Preferred

Common

Common

Paid-in

Excess of

Loss,

Noncontrolling

Total

 Interests

Stock

Shares

Stock

Capital

Earnings

Net

Interests

Equity

Balance as of December 31, 2018

$

15,832

$

1,249,560


206,425,656

$

2,051

$

11,355,751

$

(2,633,071)

$

(115,647)

$

999,566

$

10,858,210

Conversion of common units to common stock


2,154,460


22


190,492


(190,514)


Issuance of unvested restricted stock, net of forfeitures


256,868


Common stock offering costs


(2,530)


(2,530)

Shares issued under employee stock purchase plan

63,774

5,462

5,462

Issuance of series K preferred stock, net of offering costs


203,264


203,264

Issuance of series L preferred stock, net of offering costs

334,886

334,886

Redemption of series H preferred stock

(353,290)

(11,760)

(365,050)

Amortization of unearned compensation on share-based awards

38,662

38,662

Reclassification of vested share-based awards


(8,458)


8,458


Adjustment to redeemable noncontrolling interests


25,937


(2,059)


(23,878)


(25,937)

Dividends declared on preferred stock


(74,990)


(74,990)

Dividends and distributions on common stock and common and incentive units


(676)


(900,201)


(38,278)


(938,479)

Contributions from noncontrolling interests in consolidated entities


63,173


63,173

Deconsolidation of consolidated entity


(110,086)


(110,086)

Cumulative effect adjustment from adoption of new accounting standard


(6,318)


(6,318)

Net income


372


579,761


19,088


598,849

Other comprehensive income—foreign currency translation adjustments


43,702


1,960


45,662

Other comprehensive loss—fair value of interest rate swaps


(8,839)


(393)


(9,232)

Other comprehensive loss—reclassification of accumulated other comprehensive income to interest expense


(7,138)


(308)


(7,446)

Balance as of December 31, 2019

$

41,465

$

1,434,420


208,900,758

$

2,073

$

11,577,320

$

(3,046,579)

$

(87,922)

$

728,788

$

10,608,100

See accompanying notes to the consolidated financial statements.

89

Table of Contents

Index to Financial Statements

DIGITAL REALTY TRUST, INC. AND SUBSIDIARIES

CONSOLIDATED STATEMENTS OF EQUITY (continued)

(in thousands, except share data)


Accumulated


Accumulated

Other

Redeemable 

Number of

Additional

Dividends in

Comprehensive

Total


Noncontrolling

Preferred

Common

Common

Paid-in

Excess of

Income (Loss),

Noncontrolling

Total

 Interests

Stock

Shares

Stock

Capital

Earnings

Net

Interests

Equity

Balance as of December 31, 2019

$

41,465

$

1,434,420


208,900,758

$

2,073

$

11,577,320

$

(3,046,579)

$

(87,922)

$

728,788

$

10,608,100

Conversion of common units to common stock


1,070,014

10

92,543

(92,553)

Common stock and share-based awards issued in connection with business combinations


54,487,997

545

7,012,675

7,013,220

Issuance of common stock, net of costs


15,920,893

160

1,888,366

1,888,526

Shares issued under employee stock purchase plan


58,136

6,503

6,503

Shares repurchased and retired to satisfy tax withholding upon vesting


(8,570)

(8,570)

Amortization of share-based compensation


78,757

78,757

Vesting of restricted stock, net


(148,072)

Reclassification of vested share-based awards


(17,611)

17,611

Redemption of series G preferred stock


(241,468)


(8,532)

(250,000)

Redemption of series I preferred stock


(242,012)


(7,988)

(250,000)

Adjustment to redeemable noncontrolling interests


3,086


(3,086)

(3,086)

Dividends declared on preferred stock


(76,536)

(76,536)

Dividends and distributions on common stock and common and incentive units


(700)


(1,214,701)

(37,147)

(1,251,848)

Contributions from noncontrolling interests


2,089


97,914

97,914

Net income (loss)


(4,417)


356,398

10,749

367,147

Other comprehensive income—foreign currency translation adjustments


488


226,849

3,491

230,340

Other comprehensive loss—fair value of interest rate swaps

(11,980)

(445)

(12,425)

Other comprehensive income—reclassification of accumulated other comprehensive income to interest expense


8,063

231

8,294

Balance as of December 31, 2020

$

42,011

$

950,940


280,289,726

$

2,788

$

20,626,897

$

(3,997,938)

$

135,010

$

728,639

$

18,446,336

See accompanying notes to the consolidated financial statements.

90

Table of Contents

Index to Financial Statements

DIGITAL REALTY TRUST, INC. AND SUBSIDIARIES

CONSOLIDATED STATEMENTS OF EQUITY (continued)

(in thousands, except share data)


Accumulated


Accumulated

Other

Redeemable 

Number of

Additional

Dividends in

Comprehensive

Total

Noncontrolling

Preferred

Common

Common

Paid-in

Excess of

Income (Loss),

Noncontrolling

Total

 Interests

Stock

Shares

Stock

Capital

Earnings

Net

Interests

Equity

Balance as of December 31, 2020

$

42,011

$

950,940


280,289,726

$

2,788

$

20,626,897

$

(3,997,938)

$

135,010

$

728,639

$

18,446,336

Conversion of common units to common stock


2,502,331


25


206,695


(206,720)


Issuance of common units in connection with acquisition

125,395

1

18,269

18,270

Issuance of common stock, net of costs


1,060,943


11


172,085


172,096

Shares issued under employee stock purchase plan


82,129


9,895


9,895

Redemption of series C preferred stock


(219,250)


18,000


(201,250)

Shares repurchased and retired to satisfy tax withholding upon vesting


(1)


(16,733)


(16,734)

Amortization of unearned compensation on share-based awards


88,414


88,414

Vesting of restricted stock, net

385,783

Reclassification of vested share-based awards


(23,829)


23,829


Adjustment to redeemable noncontrolling interests


5,830


(5,830)


(5,830)

Dividends declared on preferred stock


(45,761)


(45,761)

Dividends and distributions on common stock and common and incentive units


(724)


(1,315,489)


(31,567)


(1,347,056)

Contributions from (distributions to) noncontrolling interests


(1,052)


125,186


125,186

Deconsolidation of consolidated entities

(197,016)

(197,016)

Net income


930


1,709,259


37,223


1,746,482

Other comprehensive loss—foreign currency translation adjustments


(311,413)


(7,415)


(318,828)

Other comprehensive income—fair value of interest rate swaps


1,250


29


1,279

Other comprehensive income—reclassification of accumulated other comprehensive income to interest expense


1,273


31


1,304

Balance as of December 31, 2021

$

46,995

$

731,690


284,446,307

$

2,824

$

21,075,863

$

(3,631,929)

$

(173,880)

$

472,219

$

18,476,787

See accompanying notes to the consolidated financial statements.

91

Table of Contents

Index to Financial Statements

DIGITAL REALTY TRUST, INC. AND SUBSIDIARIES

CONSOLIDATED STATEMENTS OF CASH FLOWS

(in thousands)

Year Ended December 31, 


2021


2020


2019

Cash flows from operating activities:


Net income

$

1,747,412

$

362,730

$

599,221

Adjustments to reconcile net income to net cash provided by operating activities:

Gain on disposition of properties, net


(1,380,795)


(316,894)


(335,148)

Equity in (earnings) loss of unconsolidated entities


(62,283)


57,629


(8,067)

Distributions from unconsolidated entities


66,232


39,878


44,293

Depreciation and amortization

1,486,632

1,366,379

1,163,774

Amortization of share-based compensation


84,083


74,577


34,905

Loss from early extinguishment of debt


18,672


103,215


39,157

Amortization of acquired above-market leases and acquired below-market leases, net


6,074


12,686


17,097

Amortization of deferred financing costs and debt discount / premium

18,694

19,202

15,622

Other items, net

27,341

(4,443)

(26,535)

Changes in assets and liabilities:

Increase in accounts receivable and other assets

(425,983)

(103,327)

(103,162)

Increase in accounts payable and other liabilities

116,149

94,909

72,660

Net cash provided by operating activities


1,702,228

1,706,541


1,513,817

Cash flows from investing activities:

Improvements to investments in real estate


(2,520,772)


(2,064,066)


(1,436,902)

Cash paid for business combinations and assets acquisition, net of cash and restricted cash acquired

(192,015)

(908,567)

(75,704)

Proceeds from (investment in) unconsolidated entities, net

2,665

(144,323)

1,296,699

Proceeds from sale of real estate

1,691,072

564,615

Other investing activities, net

(42,671)

(47,006)

(59,085)

Net cash used in investing activities


(1,061,721)


(2,599,347)


(274,992)

Cash flows from financing activities:

Net (payments on) proceeds from credit facilities

$

(89,554)

$

162,111

$

(1,412,388)

Borrowings on secured / unsecured debt

1,824,389

3,573,120

2,869,240

Repayments on secured / unsecured debt

(990,968)

(2,928,924)

(1,915,301)

Premium paid for early extinguishment of debt

(16,482)

(96,124)

(35,067)

Capital contributions from noncontrolling interests, net


124,134


102,285


63,173

Proceeds from issuance of common stock, net

172,096

1,879,957

535,620

Redemption of preferred stock


(201,250)


(500,000)


(365,050)

Payments of dividends and distributions

(1,379,198)

(1,239,318)

(996,766)

Other financing activities, net

(33,797)

(17,418)

(15,482)

Net cash (used in) provided by financing activities


(590,630)


935,689


(1,272,021)

Net increase (decrease) in cash, cash equivalents and restricted cash


49,877


42,883


(33,196)

Effect of exchange rate changes on cash, cash equivalents and restricted cash


(22,044)


(16,484)


(4,773)

Cash, cash equivalents and restricted cash at beginning of period


123,652


97,253


135,222

Cash, cash equivalents and restricted cash at end of period

$

151,485

$

123,652

$

97,253

See accompanying notes to the consolidated financial statements.

92

Table of Contents

Index to Financial Statements

DIGITAL REALTY TRUST, L.P. AND SUBSIDIARIES

CONSOLIDATED BALANCE SHEETS

(in thousands, except unit and per unit data)


December 31, 


December 31, 

2021

2020

ASSETS


Investments in real estate:


Investments in properties, net

$

20,762,241

$

20,582,954

Investments in unconsolidated entities


1,807,689


1,148,158

Net investments in real estate


22,569,930


21,731,112

Operating lease right-of-use assets, net

1,405,441

1,386,959

Cash and cash equivalents


142,698


108,501

Accounts and other receivables, net


671,721


603,111

Deferred rent, net


547,385


528,180

Goodwill


7,937,440


8,330,996

Customer relationship value, deferred leasing costs and intangibles, net


2,735,486


3,122,904

Other assets


359,459


264,528

Total assets

$

36,369,560

$

36,076,291

LIABILITIES AND CAPITAL


Global revolving credit facilities, net

$

398,172

$

531,905

Unsecured term loans, net


536,580

Unsecured senior notes, net


12,903,370


11,997,010

Secured and other debt, including premiums

146,668

239,222

Operating lease liabilities

1,512,187

1,468,712

Accounts payable and other accrued liabilities


1,543,623


1,420,162

Deferred tax liabilities, net

666,451

698,308

Accrued dividends and distributions


338,729


324,386

Security deposits and prepaid rents


336,578


371,659

Total liabilities


17,845,778


17,587,944

Redeemable noncontrolling interests

46,995

42,011

Commitments and contingencies


Capital:


Partners’ capital:


General Partner:


Preferred units, $755,000 and $956,250 liquidation preference ($25.00 per unit), 30,200,000 and 38,250,000 units issued and outstanding as of December 31, 2021 and December 31, 2020, respectively


731,690


950,940

Common units, 284,415,013 and 280,289,726 units issued and outstanding as of December 31, 2021 and December 31, 2020, respectively


17,446,758


16,631,747

Limited Partners, 5,931,771 and 8,046,267 units issued and outstanding as of December 31, 2021 and December 31, 2020, respectively


432,902


609,190

Accumulated other comprehensive (loss) income


(181,445)


134,800

Total partners’ capital


18,429,905


18,326,677

Noncontrolling interests in consolidated entities


46,882


119,659

Total capital


18,476,787


18,446,336

Total liabilities and capital

$

36,369,560

$

36,076,291

See accompanying notes to the consolidated financial statements.

93

Table of Contents

Index to Financial Statements

DIGITAL REALTY TRUST, L.P. AND SUBSIDIARIES

CONSOLIDATED INCOME STATEMENTS

(in thousands, except unit and per unit data)

Year Ended December 31, 

2021


2020


2019

Operating Revenues:


Rental and other services

$

4,395,039

$

3,886,546

$

3,196,356

Fee income and other


32,843


17,063


12,885

Total operating revenues


4,427,882


3,903,609


3,209,241

Operating Expenses:


Rental property operating and maintenance


1,570,506


1,331,493


1,020,578

Property taxes and insurance


207,814


182,623


172,183

Depreciation and amortization


1,486,632


1,366,379


1,163,774

General and administrative


400,654


351,369


211,097

Transactions and integration


47,426


106,662


27,925

Impairment of investments in real estate


18,291


6,482


5,351

Other


2,550


1,075


14,118

Total operating expenses


3,733,873


3,346,083


2,615,026

Operating income

694,009

557,526

594,215

Other Income (Expenses):

Equity in earnings (loss) of unconsolidated entities


62,283


(57,629)


8,067

Gain on disposition of properties, net

1,380,795


316,894


267,651

Gain on deconsolidation, net


67,497

Other (expense) income, net


(4,358)


20,222


66,000

Interest expense


(293,846)


(333,021)


(353,057)

Loss from early extinguishment of debt

(18,672)


(103,215)


(39,157)

Income tax expense


(72,799)


(38,047)


(11,995)

Net income

1,747,412

362,730

599,221

Net loss attributable to noncontrolling interests


947


3,168


1,640

Net income attributable to Digital Realty Trust, L.P.

1,748,359

365,898

600,861

Preferred units distributions, including undeclared distributions


(45,761)


(76,536)


(74,990)

Gain (loss) on redemption of preferred units


18,000


(16,520)


(11,760)

Net income available to common unitholders

$

1,720,598

$

272,842

$

514,111

Net income per unit available to common unitholders:


Basic

$

5.95

$

1.02

$

2.37

Diluted

$

5.94

$

1.01

$

2.35

Weighted average common units outstanding:


Basic


289,165,448


268,072,983


217,284,755

Diluted


289,912,489


270,496,513


218,421,179

See accompanying notes to the consolidated financial statements.

94

Table of Contents

Index to Financial Statements

DIGITAL REALTY TRUST, L.P. AND SUBSIDIARIES

CONSOLIDATED STATEMENTS OF COMPREHENSIVE INCOME

(in thousands)

Year Ended December 31, 

2021


2020


2019

Net income

$

1,747,412

$

362,730

$

599,221

Other comprehensive income (loss):


Foreign currency translation adjustments


(318,828)


230,340


23,975

Reclassification of foreign currency translation adjustment due to deconsolidation of Ascenty

21,687

Increase (decrease) in fair value of interest rate swaps


1,279


(12,425)


(9,232)

Reclassification to interest expense from interest rate swaps


1,304


8,294


(7,446)

Other comprehensive income (loss)

(316,245)

226,209

28,984

Comprehensive income attributable to Digital Realty Trust, L.P.

$

1,431,167

$

588,939

$

628,205

Comprehensive loss attributable to noncontrolling interests


947


3,168


1,640

Comprehensive income attributable to Digital Realty Trust, L.P.

$

1,432,114

$

592,107

$

629,845

See accompanying notes to the consolidated financial statements.

95

Table of Contents

Index to Financial Statements

DIGITAL REALTY TRUST, L.P. AND SUBSIDIARIES

CONSOLIDATED STATEMENTS OF CAPITAL (continued)

(in thousands, except unit data)

Accumulated

Redeemable

General Partner

Limited Partners

Other

Noncontrolling

Preferred Units

Common Units

Common Units

Comprehensive

Noncontrolling


Interests


Units


Amount


Units


Amount


Units


Amount


Loss


Interests


Total Capital

Balance as of December 31, 2018

$

15,832


50,650,000

$

1,249,560


206,425,656

$

8,724,731


10,580,884

$

911,256

$

(120,393)

$

93,056

$

10,858,210

Conversion of limited partner common units to general partner common units


2,154,460


190,514


(2,154,460)


(190,514)


Issuance of unvested restricted common units, net of forfeitures


256,868


Common unit offering costs


(2,530)


(2,530)

Issuance of common units, net of forfeitures


416,731


Units issued in connection with employee stock purchase plan


63,774


5,462


5,462

Issuance of series K preferred units, net of offering costs


8,400,000


203,264


203,264

Issuance of series L preferred units, net of offering costs


13,800,000


334,886


334,886

Redemption of series H preferred units


(14,600,000)


(353,290)


(11,760)


(365,050)

Amortization of unearned compensation on share-based awards


38,662


38,662

Reclassification of vested share-based awards


(8,458)


8,458


Adjustment to redeemable noncontrolling interests


25,937


(2,059)


(23,878)


(25,937)

Distributions


(676)


(74,990)


(900,201)


(38,278)


(1,013,469)

Contributions from noncontrolling interests in consolidated entities


63,173


63,173

Deconsolidation of consolidated entity


(110,086)


(110,086)

Cumulative effect adjustment from adoption of new accounting standard


(6,318)


(6,318)

Net income


372


74,990


504,771


20,728


(1,640)


598,849

Other comprehensive income - foreign currency translation adjustments


45,662


45,662

Other comprehensive loss - fair value of interest rate swaps


(9,232)


(9,232)

Other comprehensive loss – reclassification of accumulated other comprehensive income to interest expense


(7,446)


(7,446)

Balance as of December 31, 2019

$

41,465


58,250,000

$

1,434,420


208,900,758

$

8,532,814


8,843,155

$

711,650

$

(91,409)

$

20,625

$

10,608,100

See accompanying notes to the consolidated financial statements.

96

Table of Contents

Index to Financial Statements

DIGITAL REALTY TRUST, L.P. AND SUBSIDIARIES

CONSOLIDATED STATEMENTS OF CAPITAL (continued)

(in thousands, except unit data)

Accumulated


Redeemable

General Partner

Limited Partners

Other

Noncontrolling

Preferred Units

Common Units

Common Units

Comprehensive

Noncontrolling


Interests


Units


Amount


Units


Amount


Units


Amount


Income (Loss)


Interests


Total Capital

Balance as of December 31, 2019

$

41,465


58,250,000

$

1,434,420


208,900,758

$

8,532,814


8,843,155

$

711,650

$

(91,409)

$

20,625

$

10,608,100

Conversion of limited partner common units to general partner common units


1,070,014


92,553


(1,070,014)


(92,553)


Common units and share-based awards issued in connection with business combinations


54,487,997


7,013,220


7,013,220

Issuance of common units, net of offering costs


15,920,893


1,888,526


1,888,526

Issuance of common units, net of forfeitures


273,126


Units issued in connection with employee stock purchase plan


58,136


6,503


6,503

Units repurchased and retired to satisfy tax withholding upon vesting


(7,320)


(7,320)

Amortization of share-based compensation


77,507


77,507

Vesting of restricted common units, net


(148,072)


Reclassification of vested share-based awards


(17,611)


17,611


Redemption of series G preferred units


(10,000,000)


(241,468)


(8,532)


(250,000)

Redemption of series I preferred units


(10,000,000)


(242,012)


(7,988)


(250,000)

Adjustment to redeemable partnership units


3,086


(3,086)


(3,086)

Distributions


(700)


(1,214,701)


(37,147)


(1,251,848)

Contributions from noncontrolling interests in consolidated entities


2,089


97,914


97,914

Net income (loss)


(4,417)


279,862


9,629


1,120


290,611

Other comprehensive income—foreign currency translation adjustments


488


230,340


230,340

Other comprehensive loss—fair value of interest rate swaps


(12,425)


(12,425)

Other comprehensive income—reclassification of accumulated other comprehensive loss to interest expense

8,294

8,294

Balance as of December 31, 2020

$

42,011


38,250,000

$

950,940


280,289,726

$

16,631,747


8,046,267

$

609,190

$

134,800

$

119,659

$

18,446,336

See accompanying notes to the consolidated financial statements.

97

Table of Contents

Index to Financial Statements

DIGITAL REALTY TRUST, L.P. AND SUBSIDIARIES

CONSOLIDATED STATEMENTS OF CAPITAL (continued)

(in thousands, except unit data)

Accumulated

Redeemable

General Partner

Limited Partners

Other

Noncontrolling

Preferred Units

Common Units

Common Units

Comprehensive

Noncontrolling


Interests


Units


Amount


Units


Amount


Units


Amount


Income (Loss)


Interests


Total Capital

Balance as of December 31, 2020

$

42,011


38,250,000

$

950,940


280,289,726

$

16,631,747


8,046,267

$

609,190

$

134,800

$

119,659

$

18,446,336

Conversion of limited partner common
   units to general partner common units


2,502,331


206,720


(2,502,331)


(206,720)


Issuance of common units in connection with acquisition


125,395


18,270


18,270

Issuance of common stock, net offering costs


1,060,943


172,096


172,096

Issuance of common units, net of forfeitures


387,835


Units issued in connection with employee stock purchase plan


82,129


9,895


9,895

Shares repurchased and retired to satisfy tax withholding upon vesting


(16,734)


(16,734)

Amortization of unearned compensation
   regarding share-based awards


88,414


88,414

Vesting of restricted common units, net


354,489


Reclassification of vested share-based awards


(23,829)


23,829


Redemption of series C preferred units


(8,050,000)


(219,250)


18,000


(201,250)

Adjustment to redeemable partnership units


5,830


(5,830)


(5,830)

Distributions


(724)


(45,761)


(1,315,989)


(31,067)


(1,392,817)

Contribution from noncontrolling interests in consolidated entities


(1,052)


125,186


125,186

Deconsolidation of consolidated entities


(197,016)


(197,016)

Net income


930


45,761


1,663,998


37,670


(947)


1,746,482

Other comprehensive loss—foreign currency translation adjustments


(318,828)

(318,828)

Other comprehensive income—fair value of interest rate swaps


1,279


1,279

Other comprehensive income—reclassification of accumulated other comprehensive loss to interest expense


1,304


1,304

Balance as of December 31, 2021

$

46,995


30,200,000

$

731,690


284,415,013

$

17,446,758


5,931,771

$

432,902

$

(181,445)

$

46,882

$

18,476,787

See accompanying notes to the consolidated financial statements.

98

Table of Contents

Index to Financial Statements

DIGITAL REALTY TRUST, L.P. AND SUBSIDIARIES

CONSOLIDATED STATEMENTS OF CASH FLOWS

(in thousands)

Year Ended December 31, 

2021


2020


2019

Cash flows from operating activities:


Net income

$

1,747,412

$

362,730

$

599,221

Adjustments to reconcile net income to net cash provided by operating activities:

Gain on disposition of properties, net


(1,380,795)


(316,894)


(335,148)

Equity in (earnings) loss of unconsolidated entities


(62,283)


57,629

(8,067)

Distributions from unconsolidated entities


66,232


39,878


44,293

Depreciation and amortization

1,486,632

1,366,379


1,163,774

Amortization of share-based compensation


84,083


74,577


34,905

Loss from early extinguishment of debt


18,672


103,215


39,157

Amortization of acquired above-market leases and acquired below-market leases, net


6,074


12,686


17,097

Amortization of deferred financing costs and debt discount / premium

18,694

19,202


15,622

Other items, net

27,341

(4,443)


(26,535)

Changes in assets and liabilities:


Increase in accounts receivable and other assets

(425,983)

(103,327)


(103,162)

Increase in accounts payable and other liabilities


116,149


94,909


72,660

Net cash provided by operating activities

1,702,228

1,706,541


1,513,817

Cash flows from investing activities:


Improvements to investments in real estate


(2,520,772)


(2,064,066)

(1,436,902)

Cash paid for business combinations and assets acquisition, net of cash and restricted cash acquired

(192,015)

(908,567)

(75,704)

Proceeds from (investment in) unconsolidated entities, net


2,665


(144,323)


1,296,699

Proceeds from sale of real estate

1,691,072

564,615

Other investing activities, net

(42,671)

(47,006)


(59,085)

Net cash used in investing activities

$

(1,061,721)

$

(2,599,347)

(274,992)

Cash flows from financing activities:

Net (payments on) proceeds from credit facilities

(89,554)

162,111

(1,412,388)

Borrowings on secured / unsecured debt

1,824,389

3,573,120

2,869,240

Repayments on secured / unsecured debt


(990,968)


(2,928,924)

(1,915,301)

Premium paid for early extinguishment of debt

(16,482)

(96,124)

(35,067)

Capital contributions from noncontrolling interests, net


124,134

102,285

63,173

General partner contributions

172,096

1,879,957

535,620

General partner distributions

(201,250)

(500,000)

(365,050)

Payments of dividends and distributions


(1,379,198)


(1,239,318)

(996,766)

Other financing activities, net


(33,797)


(17,418)

(15,482)

Net cash (used in) provided by financing activities


(590,630)


935,689

(1,272,021)

Net increase (decrease) in cash, cash equivalents and restricted cash


49,877


42,883

(33,196)

Effect of exchange rate changes on cash, cash equivalents and restricted cash

(22,044)

(16,484)

(4,773)

Cash, cash equivalents and restricted cash at beginning of period

123,652

97,253

135,222

Cash, cash equivalents and restricted cash at end of period

$

151,485

$

123,652

$

97,253

See accompanying notes to the consolidated financial statements.

99

Table of Contents

Index to Financial Statements

DIGITAL REALTY TRUST, INC. AND SUBSIDIARIES

DIGITAL REALTY TRUST, L.P. AND SUBSIDIARIES

NOTES TO CONSOLIDATED FINANCIAL STATEMENTS-

December 31, 2021 and 2020

1. Organization and Description of Business

Digital Realty Trust, Inc. (the Parent), through its controlling interest in Digital Realty Trust, L.P. (the Operating Partnership or the OP) and the subsidiaries of the OP (collectively, we, our, us or the Company), is a leading global provider of data center (including colocation and interconnection) solutions for customers across a variety of industry verticals ranging from cloud and information technology services, social networking and communications to financial services, manufacturing, energy, healthcare, and consumer products. The OP, a Maryland limited partnership, is the entity through which the Parent, a Maryland corporation, conducts its business of owning, acquiring, developing and operating data centers. The Parent operates as a REIT for federal income tax purposes.

The Parent’s only material asset is its ownership of partnership interests of the OP. As a result, the Parent generally does not conduct business itself, other than acting as the sole general partner of the OP, issuing public securities from time to time and guaranteeing certain unsecured debt of the OP and certain of its subsidiaries and affiliates. The Parent has not issued any debt but guarantees the unsecured debt of the OP and certain of its subsidiaries and affiliates.

The OP holds substantially all the assets of the Company. The OP conducts the operations of the business and has no publicly traded equity. Except for net proceeds from public equity issuances by the Parent, which are generally contributed to the OP in exchange for partnership units, in general, the OP generates the capital required by the Company’s business primarily through the OP’s operations, by the OP’s or its affiliates’ direct or indirect incurrence of indebtedness or through the issuance of partnership units.

2. Summary of Significant Accounting Policies

Basis of Presentation. The accompanying consolidated financial statements are prepared in accordance with United States generally accepted accounting principles (“U.S. GAAP”) and are presented in our reporting currency, the U.S. dollar. All of the accounts of the Parent, the OP, and the subsidiaries of the OP are included in the accompanying consolidated financial statements. Intercompany transactions with consolidated entities have been eliminated.

Consolidation. We consolidate all entities that are wholly owned as well as all partially-owned entities that we control. In addition, we consolidate any variable interest entities (“VIEs”) for which we are the primary beneficiary. We evaluate whether or not an entity is a VIE (and we are the primary beneficiary) through consideration of substantive terms in the arrangement to identify which enterprise has the power to direct the activities of the entity that most significantly impact the entity’s economic performance and the obligation to absorb losses/receive benefits from the entity.

For entities that do not meet the definition of VIEs, we first consider if we are the general partner or a limited partner (or the equivalent in investments not structured as partnerships). We consolidate entities in which we are the general partner and the limited partners do not have rights that would preclude control. For entities in which we are the general partner, but the limited partners hold substantive participating or kick-out rights that prohibit our ability to control the entity, we apply the equity method of accounting since, as the general partner, we have the ability to exercise significant influence over the operating and financial policies of the entities. For entities in which we are a limited partner, or that are not structured similar to a partnership, we consider factors such as ownership interest, voting control, authority to make decisions and contractual and substantive participating rights of the partners. When factors indicate we have a controlling financial interest in an entity, we consolidate the entity.

100

Table of Contents

Index to Financial Statements

DIGITAL REALTY TRUST, INC. AND SUBSIDIARIES

DIGITAL REALTY TRUST, L.P. AND SUBSIDIARIES

NOTES TO CONSOLIDATED FINANCIAL STATEMENTS- (Continued)

December 31, 2021 and 2020

Management Estimates and Assumptions. U.S. GAAP requires that we make estimates and assumptions that affect reported amounts of revenue and expenses during the reporting period, reported amounts for assets and liabilities as of the date of the financial statements, and disclosures of contingent assets and liabilities as of the date of the financial statements. Although we believe the estimates and assumptions we made are reasonable and appropriate, as discussed in the applicable sections throughout the consolidated financial statements, different assumptions and estimates could materially impact our reported results. Actual results and outcomes may differ from our assumptions.

Foreign Operations and Foreign Currencies. The functional currency of each of our consolidated subsidiaries and unconsolidated entities operating in other countries is the principal currency in which each entity’s assets, liabilities, income and expenses are denominated, which may be different from the local currency of incorporation or the currency with which the entities conduct their operations. The primary functional currencies impacting our business include the Euro, Japanese yen, British pound sterling, Singapore dollar, and Brazilian real.

For our consolidated subsidiaries whose functional currency is not the U.S. dollar, we translate financial statements into U.S. dollars at the time we consolidate these subsidiaries’ financial statements. Generally, assets and liabilities are translated at the exchange rate in effect at the balance sheet date. Certain balance sheet items, such as equity and capital-related accounts are reflected at historical exchange rates. Income statement accounts are generally translated at the average exchange rates for the reporting periods.

We and certain of our consolidated subsidiaries have intercompany and third-party debt that is not denominated in the functional currency of the entities. When debt is denominated in a currency other than the functional currency of an entity, a gain or loss can result. The associated adjustment is reflected in other (expenses) income, net, in the consolidated income statements, unless it is intercompany debt that is deemed to be long-term in nature or third-party debt that has been designated as a nonderivative net investment hedge – in which case the associated adjustments are reflected as a cumulative translation adjustments as a component of other comprehensive income. In the statement of cash flows, cash flows denominated in foreign currencies are translated using the exchange rates in effect at the time of the respective cash flows or at average exchange rates for the period, depending on the nature of the cash flow items.

Acquisition Accounting. We evaluate whether or not substantially all of the value of acquired assets is concentrated in a single identifiable asset or group of identifiable assets to determine whether a transaction is accounted for as an asset acquisition or a business combination. For asset acquisitions: (1) transaction costs are included in the total costs of the acquisition and are allocated on a pro-rata basis to the carrying value of the assets and liabilities acquired, (2) real estate assets acquired are measured based on their cost or total consideration exchanged with any excess consideration or bargain purchase amount allocated to real estate properties and their associated intangibles such as above and below-market leases, in-place leases, acquired ground leases, and customer relationship value and (3) all other assets and liabilities assumed, including any debt, are recorded at fair value. For business combinations: (1) transaction costs are expensed as incurred, (2) all acquired tangible and identifiable intangible assets are recognized at fair value, (3) the amount of any purchase consideration that exceeds the fair value of the tangible and identifiable intangible assets acquired is recognized as goodwill, and (4) to the extent the purchase consideration is less than the fair value of the tangible and identifiable intangible assets acquired, a gain on bargain purchase is recognized.

When we obtain control of an unconsolidated entity that we previously held as an equity method investment and the acquisition qualifies as a business combination, we remeasure our previously held interest in the unconsolidated entity at its acquisition-date fair value, derecognize the book value associated with that interest, and recognize any resulting gain or loss in earnings.

101

Table of Contents

Index to Financial Statements

DIGITAL REALTY TRUST, INC. AND SUBSIDIARIES

DIGITAL REALTY TRUST, L.P. AND SUBSIDIARIES

NOTES TO CONSOLIDATED FINANCIAL STATEMENTS- (Continued)

December 31, 2021 and 2020

We allocate purchase price primarily using Level 2 and Level 3 inputs (further defined in Fair Value Measurements) as follows:

Real Estate. The fair value of acquired land is determined based on relevant market data, such as comparable land sales. The fair value of acquired improvements is determined based on replacement cost as adjusted for any physical and/or market obsolescence. Operating properties are valued as if they are vacant (“as-if-vacant”) by applying an income approach methodology using either a discounted cash flow analysis or by applying a capitalization rate to the estimated Net Operating Income (“NOI”) of a property. As-if-vacant values consider estimated carrying costs during expected lease-up periods and costs to execute similar leases (based on current market conditions). Carrying costs during expected lease up periods include real estate taxes, insurance and other operating expenses as well as estimates of lost rental revenue during the expected lease-up periods. Costs to execute similar leases include lease commissions, tenant improvements, legal and other related costs.

Lease Intangibles. The portion of the purchase price related to acquired in-place leases is recorded as intangible assets and liabilities as follows:

Above and below market leases: We use a discounted cash flow approach to determine the estimated present value of any difference between contractual rents for acquired in-place leases as compared to current market rents. If rents on acquired in-place leases are higher than current market rents, we record an intangible asset for the favorable rents. If rents on acquired in-place leases are lower than current market rents, we record a liability for the unfavorable rents. Favorable rent assets are amortized as a reduction to rental income over the remaining non-cancelable term of the lease. Unfavorable rent liabilities are amortized as an increase to rental income over the initial lease term plus any below-market fixed rate renewal periods.
In-place lease value: Since the as-if-vacant model is used to determine the value of acquired operating properties, the value of such properties does not include the value associated with having existing tenants who are leasing space in the purchased properties. Having in-place tenants allows buyers to avoid costs associated with leasing the property as well as any rent losses and unreimbursed operating expenses during the lease-up period. An asset for such benefits is recorded separately as in-place lease value. In-place lease value is determined based on estimated carrying costs during hypothetical expected lease-up periods as well as costs to execute similar leases. We determine expected carrying costs and costs to execute similar leases in the same manner as described in the previous discussion of the valuation of operating properties using the as-if-vacant model. The value of in-place leases is amortized to expense over the remaining initial terms of the respective leases.
Customer relationship value: In some transactions, customers acquired are expected to generate recurring revenues beyond existing in-place lease terms. We utilize the multi-period excess earnings method to determine value customer relationship value, if any. Key factors reflected in this approach include: (1) projected revenue growth from existing customers, (2) historical customer lease renewals and attrition rates, (3) rental renewal probabilities and related market terms, (4) estimated operating costs, and (5) discount rate. Customer relationship value is amortized to expense ratably over the anticipated life of substantially all of the acquired customer relationships that are expected to generate excess earnings.

Debt. We recognize the fair value of any acquired debt based on contractual future cash flows discounted using borrowing spreads and market interest rates that would be available to us for issuance of debt with similar terms and remaining maturities. If acquired debt is publicly-traded, we utilize available market data to determine fair value of the

102

Table of Contents

Index to Financial Statements

DIGITAL REALTY TRUST, INC. AND SUBSIDIARIES

DIGITAL REALTY TRUST, L.P. AND SUBSIDIARIES

NOTES TO CONSOLIDATED FINANCIAL STATEMENTS- (Continued)

December 31, 2021 and 2020

debt. Any discount or premium on the principal is included in the carrying value of the debt and amortized to interest expense over the remaining term of the debt using the effective interest method.

Noncontrolling interests. The fair value of the ownership percentage of acquired entities held by third parties is determined based on the fair value of the consolidated net assets acquired – adjusted for any put or call options or other such features associated of the noncontrolling interests.

Other acquired assets and liabilities. The fair value of other acquired assets and liabilities is determined using the best information available. For working capital items that are short-term in nature, fair value is generally presumed to equal the seller’s carrying value, unless facts and circumstances suggest otherwise.

Fair Value Measurements. Fair value is intended to reflect the price that would be received for the sale of an asset or paid for the transfer of a liability in an orderly transaction between market participants at the measurement date (the exit price). We estimate fair value using available market information and valuation methods we believe to be appropriate for these purposes. Given the significant amount of judgement and subjectivity involved in the determination of fair value, estimated fair value is not necessarily indicative of amounts that would be realized on disposition. There are three levels in the fair value hierarchy under US GAAP, which are:

Level 1 – Quoted prices (unadjusted) in active markets for identical assets or liabilities that an entity can access at the measurement date.
Level 2 – Inputs that are directly or indirectly observable for the associated asset or liability, but which do not qualify as Level 1 inputs.
Level 3 – Unobservable inputs for the asset or liability.

In instances where inputs from multiple different levels of the fair value hierarchy are used to determine fair value, the lowest level input that is significant is used to determine the fair-value measurement in its entirety. Our assessment of the significance of a particular input to a fair-value measurement requires judgment and considers factors specific to the asset or liability. We utilize fair value measurements on a recurring basis to determine the fair value of: marketable equity securities, share-based compensation awards, derivative instruments, and outstanding debt. Such measurements are also regularly utilized in assessing whether or not impairments may exist on intangible assets (including goodwill). In addition, we utilize fair value measurements on a non-recurring basis to determine the fair value associated with assets held for sale, acquisitions of assets, and acquisitions of businesses.

103

Table of Contents

Index to Financial Statements

DIGITAL REALTY TRUST, INC. AND SUBSIDIARIES

DIGITAL REALTY TRUST, L.P. AND SUBSIDIARIES

NOTES TO CONSOLIDATED FINANCIAL STATEMENTS- (Continued)

December 31, 2021 and 2020

Investments in Unconsolidated Entities. Investments in unconsolidated entities as reflected on the consolidated balance sheets includes all investments accounted for using the equity method. We use the equity method to account for these investments, because we have the ability to exercise significant influence over their operating and financial policies, but do not control them. Equity method investments are initially recognized at our cost. Transaction costs related to the formation of equity method investments are also capitalized. We subsequently adjust these balances to reflect: (1) our proportionate share of net earnings/losses of the entities and accumulated other comprehensive income or loss, (2) distributions received, (3) contributions made, (4) sales and redemptions of our investments, and (5) certain other adjustments, as appropriate. When circumstances indicate there may have been a reduction in the value of an equity method investment, we evaluate whether or not the loss in value is other than temporary. If we determine that a loss in value is other than temporary, we recognize an impairment charge to reflect the equity investment at fair value.

With regard to the cash flow classifications of distributions from unconsolidated entities, we have elected the nature of the distribution approach as the information is available to us to determine the nature of the underlying activity that generated the distributions. In accordance with this approach, cash flows generated from the operations of an unconsolidated entity are classified as a return on investment (cash inflow from operating activities) and cash flows that are generated from property sales, debt refinancing or sales and redemptions of our investments are classified as a return of investment (cash inflow from investing activities).

The Company has a negligible value of investments accounted for under the cost-method. These investments are included in Other Assets on the consolidated balance sheets.

Cash, Cash Equivalents and Restricted Cash. We consider all cash on hand, demand deposits with financial institutions, and short-term highly-liquid investments with original maturities of 90 days or less to be cash and cash equivalents. Our cash and cash equivalents are financial instruments exposed to concentrations of credit risk. We invest our cash with high-credit quality institutions. We may invest our cash balances in money market accounts that are not insured. We do not believe we are exposed to any significant credit risk associated with our cash and cash equivalents, and have not realized any losses associated with cash investments or accounts.

Restricted Cash. Cash that is held for a specific purpose and thus not available to us for immediate or general business use is categorized separately from cash and cash equivalents and is included in other assets on the consolidated balance sheet. Restricted cash primarily consists of contractual capital expenditures and other deposits.

Assets Held for Sale. We classify an asset as held for sale when the following criteria are met: 1). management that has the proper authority has approved and committed to a plan to sell, 2). the asset is available for immediate sale, 3). an active program to locate a buyer has commenced, 4). the sale of the asset is probable, and 5). transfer of the asset is expected to occur within one year. Assets classified as held for sale are recorded at the lower of carrying value or fair value less costs to sell and are no longer depreciated.

Investments in Real Estate. Investments in real estate are stated at cost, less accumulated depreciation and amortization. Land is not depreciated. Depreciation and amortization is recorded on a straight-line basis over the estimated useful lives of the respective assts. Depreciable lives of assets are stated below.

104

Table of Contents

Index to Financial Statements

DIGITAL REALTY TRUST, INC. AND SUBSIDIARIES

DIGITAL REALTY TRUST, L.P. AND SUBSIDIARIES

NOTES TO CONSOLIDATED FINANCIAL STATEMENTS- (Continued)

December 31, 2021 and 2020

Investments in Real Estate. Investments in real estate are stated at cost, less accumulated depreciation and amortization. Land is not depreciated. Depreciation and amortization is recorded on a straight-line basis over the estimated useful lives of the respective assets. Depreciable lives of assets are stated below.

Acquired ground leases


Terms of the related lease

Buildings and improvements

5-39 years

Machinery and equipment

7-15 years

Furniture and fixtures

3-5 years

Leasehold improvements

Shorter of the estimated useful lives or the terms of the related leases

Tenant improvements

Shorter of the estimated useful lives or the terms of the related leases

Improvements and replacements are capitalized when they extend the useful life, increase capacity, or improve the efficiency of the asset. Repairs and maintenance are charged to expense as incurred.

Capitalization of Costs.

Development Costs - During the land development and construction periods of qualifying projects, we capitalize direct and indirect project costs that are clearly associated with the development of properties. Capitalized project costs include all costs associated with the development of a property. Such costs include the cost of: land and buildings, improvements and fixed equipment, design and engineering, other construction costs, interest, property taxes, insurance, legal fees, personnel working on the project, and corporate supervision. Capitalization of costs ceases when development projects are substantially complete and ready for their intended use. We generally consider development projects to be substantially complete and ready for intended use upon receipt of a certificate of occupancy.

Leasing commissions - Leasing commissions and other direct and indirect costs associated with the acquisition of tenants are capitalized and amortized on a straight-line basis over the terms of the related leases. During the years ended December 31, 2021, 2020 and 2019, we capitalized deferred leasing costs of approximately $42.8 million, $40.8 million and $30.8 million, respectively. Deferred leasing costs are included in customer relationship value, deferred leasing costs and intangibles on the consolidated balance sheet and amounted to approximately $249.3 million and $272.3 million, net of accumulated amortization of $453.0 million and $401.4 million, as of December 31, 2021 and 2020, respectively. Amortization expense on leasing costs was approximately $83.4 million, $76.0 million, and $75.3 million for the years

ended December 31, 2021, 2020 and 2019, respectively.

Recoverability of Real Estate Assets. We assess the carrying value of our properties whenever events or circumstances indicate carrying amounts of these assets may not be fully recoverable (“triggering events"). Triggering events typically relate to a change in the expected holding period of a property, an adverse change in expected future cash flows of the property, or a trend of past cash flow losses that is expected to continue in the future. If our assessment of triggering events indicates the carrying value of a property or asset group might not be recoverable, we estimate the future undiscounted net cash flows expected to be generated by the assets and compare that amount to the book value of the assets. If our future undiscounted net cash flow evaluation indicates we are unable to recover the carrying value of a property or asset group, we record an impairment loss to the extent the carrying value of the property or asset group exceeds fair value.

We generally estimate fair value of rental properties using a discounted cash flow analysis that includes projections of future revenues, expenses, and capital improvements that a market participant would use. In certain cases, we may supplement this analysis by obtaining outside broker opinions of value. When determining undiscounted future cash flows, we consider factors such as future operating income trends and prospects as well as the effects of leasing demand, competition and other factors.

Goodwill and Other Acquired Intangible Assets. Goodwill represents the excess of the purchase price over the fair value of net tangible and intangible assets acquired in a business combination. Goodwill is not amortized. Goodwill is

105

Table of Contents

Index to Financial Statements

DIGITAL REALTY TRUST, INC. AND SUBSIDIARIES

DIGITAL REALTY TRUST, L.P. AND SUBSIDIARIES

NOTES TO CONSOLIDATED FINANCIAL STATEMENTS- (Continued)

December 31, 2021 and 2020

evaluated for impairment at the reporting unit level. The Company has one reportable segment and one reporting unit. We evaluate goodwill for impairment whenever events or changes in circumstances occur that would more likely than not reduce the fair value of the reporting unit below its carrying value. In addition to monitoring for impactful events and circumstances, we perform an annual one-step quantitative test in which we compare the reporting unit’s carrying value to its fair value. We determine the fair value of the reporting unit based on quoted market prices of the Company’s publicly-traded shares. To the extent the fair value of the reporting unit is less than its carrying value, we would record an impairment charge equal to the amount by which the carrying value of the reporting unit exceeds its fair value. We have not recognized any goodwill impairments since our inception. Since a significant aspect of our goodwill is denominated in foreign currencies, changes to our goodwill balance can occur over time due to changes in foreign currency exchange rates.

Other acquired intangible assets consist primarily of customer relationship value and in-place lease value. All of our other acquired intangible assets have finite useful lives. If impairment indicators arise with respect to these finite-lived intangible assets, we evaluate for impairment by comparing the carrying amount of the assets to the estimated future undiscounted net cash flows expected to be generated by the assets. If estimated future undiscounted cash flows exceed the carrying value of the assets, we record an impairment charge equal to the amount by which the carrying value exceeds the estimated fair value of the assets. We have no indefinite-lived intangible assets other than goodwill.

Share-Based Compensation. The Company provides a variety of share-based compensation awards to employees and directors, including awards that contain: time-based vesting criteria and a combination of time-based and market-performance based criteria. The Company measures all share-based compensation awards at grant date fair value. The fair value of awards that include only a time-based service condition (“time-based awards”) is the closing price of the Company’s publicly-traded shares at the grant date – and is expensed over the requisite service period. The fair value of awards that include a combination of market performance based criteria and time-based vesting is measured using a Monte Carlo simulation method. The fair value of these awards is expensed over the requisite service period – and is not adjusted based on actual achievement of the market performance condition.

Derivative Instruments. As part of the Company’s risk management program, a variety of financial instruments, such as interest rate swaps and foreign exchange contracts, may be used to mitigate interest rate and foreign currency exposures. The Company utilizes derivative instruments to manage risks, and not for trading or speculative purposes. All derivatives are recorded at fair value. The majority of inputs used to value our derivatives fall within Level 2 of the fair value hierarchy. However, credit valuation adjustments utilize Level 3 inputs (such as estimates of current credit spreads). Based on the insignificance of credit valuation adjustments to the overall valuation of our derivatives, we have determined that valuation of our outstanding derivatives is properly categorized in Level 2 of the fair value hierarchy.

Changes in the fair value of derivatives are recognized periodically either in earnings or in other comprehensive income (loss), depending on whether the derivative financial instrument is undesignated or qualifies for hedge accounting, and if so, whether it represents a fair value, cash flow, or net investment hedge. Gains and losses on derivatives designated as cash flow hedges, to the extent they are included in the assessment of effectiveness, are recorded in other comprehensive income (loss) and subsequently reclassified to earnings to offset the impact of the hedged items when they occur. In the event it becomes probable the forecasted transaction to which a cash flow hedge relates will not occur, the derivative would be terminated and the amount in other comprehensive income (loss) would be recognized in earnings.

Gains and losses representing components excluded from the assessment of effectiveness for cash flow and fair value hedges are recognized in earnings on a straight-line basis in the same caption as the hedged item over the term of the hedge. Gains and losses representing components excluded from the assessment of effectiveness for net investment hedges are recognized in earnings on a straight-line basis over the term of the hedge.

106

Table of Contents

Index to Financial Statements

DIGITAL REALTY TRUST, INC. AND SUBSIDIARIES

DIGITAL REALTY TRUST, L.P. AND SUBSIDIARIES

NOTES TO CONSOLIDATED FINANCIAL STATEMENTS- (Continued)

December 31, 2021 and 2020

Interest rate swaps – The Company uses interest rate swaps to add stability to interest expense and to manage our exposure to interest rate movements related to certain floating rate debt obligations. Interest rate swaps designated as cash flow hedges involve the receipt of variable-rate amounts from a counterparty in exchange for making fixed-rate payments over the life of the agreements without exchange of the underlying notional amount. We record all interest rate swaps on the balance sheet at fair value. The fair value of interest rate swaps is determined using the market standard methodology of netting discounted future fixed cash receipts (or payments) and discounted expected variable cash payments (or receipts). Variable cash payments (or receipts) are based on expected future interest rates derived from observable market interest rate curves. We incorporate credit valuation adjustments to appropriately reflect nonperformance risk for the Company and for the respective counterparties. The counterparties of interest rate swaps are generally larger financial institutions engaged in providing a variety of financial services.

Interest rate derivatives are presented on a gross basis on the consolidated balance sheets – with interest rate swap assets presented in other assets, and interest rate swap liabilities presented in accounts payable and other accrued liabilities. As of December 31, 2021, there was no impact from netting arrangements, because the Company had no derivatives in liability positions. Net interest paid or received on interest rate swaps is recognized as interest expense. Gains and losses resulting from the early termination of interest rate swap agreements are deferred and amortized as adjustments to interest expense over the remaining period of the debt originally covered by the terminated swap.

Foreign currency contracts – The Company may, from time to time, enter into forward contracts pursuant to which we agree to sell an amount of one currency in exchange for an agreed-upon amount of another currency. These agreements are typically entered into to manage exposures related to transactions that are settled in currencies other than the functional currency of the legal entity that is party to the transactions. To the extent the Company does not designate such instruments as hedges, changes in the fair value of these instruments are reflected in earnings. The Company had no outstanding derivative foreign currency contracts as of December 31, 2021.

Hedge of Net Investment in Foreign Operations – The Company has no outstanding derivatives that function as hedges of net investments in foreign operations. However, notes denominated in the Swiss franc with a total outstanding principle balance of 545 million Swiss francs (“CHF”) issued by Digital Intrepid Holding B.V. (“DIH”, a wholly-owned subsidiary of the OP with Euro functional currency) are designated as non-derivative hedges of DIH’s net investment in certain of its subsidiaries that have CHF as the functional currency. Changes in the fair value of these hedges, to the extent they are included in the assessment of effectiveness, are reported in other comprehensive income (loss) and will be deferred until disposal of the underlying assets (which is currently not expected to occur). Any amounts excluded from the assessment of effectiveness are reflected as foreign-currency transaction gains/losses which are included as Other (expense) income, net in the consolidated income statements.

See Note 17. “Derivative Instruments” for further discussion on the Company’s outstanding derivative instruments.

Income Taxes. Digital Realty Trust, Inc. has elected to be treated as a real estate investment trust (a “REIT”) for federal income tax purposes. As a REIT, Digital Realty Trust, Inc. generally is not required to pay U.S. federal corporate income tax to the extent taxable income is currently distributed to its stockholders. If Digital Realty Trust, Inc. were to fail to qualify as a REIT in any taxable year, it would be subject to U.S. federal and state income taxes (including any applicable alternative minimum tax for taxable years prior to 2018) on its taxable income.

The Company is subject to foreign, state and local income taxes in the jurisdictions in which it conducts business. The Company’s taxable REIT subsidiaries are subject to federal, state, local and foreign income taxes to the extent there is

107

Table of Contents

Index to Financial Statements

DIGITAL REALTY TRUST, INC. AND SUBSIDIARIES

DIGITAL REALTY TRUST, L.P. AND SUBSIDIARIES

NOTES TO CONSOLIDATED FINANCIAL STATEMENTS- (Continued)

December 31, 2021 and 2020

taxable income. Accordingly, the Company recognizes current and deferred income taxes for the Company and its taxable REIT subsidiaries, including for U.S. federal, state, local and foreign jurisdictions, as applicable.

We assess our significant tax positions in accordance with U.S. GAAP for all open tax years and determine whether we have any material unrecognized liabilities from uncertain tax benefits. If a tax position is not considered “more-likely-than-not” to be sustained solely on its technical merits, no benefits of the tax position are to be recognized (for financial statement purposes). As of December 31, 2021 and 2020, we have no assets or liabilities for uncertain tax positions. We classify interest and penalties from significant uncertain tax positions as interest expense and operating expense, respectively, in our consolidated income statements. For the years ended December 31, 2021, 2020 and 2019, we had no such interest or penalties. The tax year 2017 and thereafter remain open to examination by the major taxing jurisdictions with which the Company files tax returns.

See Note 13. “Income Taxes” for further discussion on income taxes.

Transactional-based Taxes. We account for transactional-based taxes, such as value added tax, or VAT, for our international properties on a net basis.

Noncontrolling Interests and Redeemable Noncontrolling Interests. Noncontrolling interests represent the share of consolidated entities owned by third parties. We recognize each noncontrolling holder’s share of the fair value of the respective entity’s net assets as noncontrolling interest on our consolidated balance sheets at the date of formation or acquisition. Noncontrolling interest balances are adjusted for the noncontrolling holder’s share of additional contributions, distributions, and net earnings or losses.

Partnership units which are contingently redeemable for cash are classified as redeemable noncontrolling interests and presented in the mezzanine section of the Company’s consolidated balance sheets between total liabilities and stockholder’s equity. Redeemable noncontrolling interests include amounts related to partnership units issued by consolidated subsidiaries of the Company in which redemption for equity is outside the control of the Company.

The amounts of consolidated net income attributable to noncontrolling interests and redeemable noncontrolling interests are presented on the Company’s consolidated income statements as income (or loss) attributable to noncontrolling interests.

Revenue Recognition.

Rental and other services revenue – We generate the majority of our revenue by leasing our properties to customers under operating lease agreements, which are accounted for under Accounting Standards Codification 842, Leases (“ASC 842”). We recognize the total minimum lease payments provided for under the leases on a straight-line basis over the lease term if we determine it is probable that substantially all of the lease payments will be collected over the lease term. We commence recognition of revenue from rentals at the date the property is ready for its intended use by the tenant and the tenant takes possession, or controls the physical use of the leased asset. The excess of rents recognized as revenue over amounts contractually due pursuant to the underlying leases is included in deferred rent. Rental payments received in excess of revenue recognized are classified as accounts payable and other accrued liabilities. Unpaid rents that are contractually due are included in accounts and other receivables.

We estimate the probability of collection of lease payments based on customer creditworthiness, outstanding accounts receivable balances, and historical bad debts – as well as current economic trends. If collection of substantially all lease payments over the lease term is not probable, rental revenue is recognized when payment is received, and we record a

108

Table of Contents

Index to Financial Statements

DIGITAL REALTY TRUST, INC. AND SUBSIDIARIES

DIGITAL REALTY TRUST, L.P. AND SUBSIDIARIES

NOTES TO CONSOLIDATED FINANCIAL STATEMENTS- (Continued)

December 31, 2021 and 2020

full valuation allowance on the balance of any rent receivable, less the balance of any security deposits or letters of credit. If collection is subsequently determined to be probable, we: 1). resume recognizing rental revenue on a straight-line basis, 2). record incremental revenue such that the cumulative amount recognized is equal to the amount that would have been recorded on a straight-line basis since inception of the lease, and 3). reverse the allowance for bad debt recorded on outstanding receivables.

Generally, under the terms of our leases, the majority of our rental expenses, including common area maintenance, real estate taxes and insurance, are recovered from our customers. We record amounts reimbursable by customers (“tenant recoveries”) as revenue in the period the applicable expenses are incurred – which is generally on a ratable basis through the term of the lease. Tenant recoveries are recognized as revenue, because we are the primary obligor with respect to purchasing and selecting goods and services from third-party vendors and bear the associated credit risk.

We account for and present rental revenue and tenant recoveries as a single component under rental and other services as the timing of recognition is the same, the pattern with which we transfer the right of use of the property and related services to the lessee are both on a straight-line basis and our leases qualify as operating leases.

Interconnection services include port and cross-connect services generally provided on a month-to-month, one-year or multi-year term. We bill for these services on a monthly basis and recognizes the revenue over the period the service is provided. Revenue for cross-connect installations is generally recognized in the period the cross-connect is installed. Interconnection services that are not specific to a particular leased space are accounted for under Topic 606 and have terms that are generally one year or less.

Fee income and other – Fee income arises primarily from contractual management agreements with entities in which we have a noncontrolling interest. Management fees are recognized as earned under the respective agreements. The Company also provides property and construction management services. Depending on the nature of the agreements, revenue for these services is recognized either on a ratable monthly basis as the service is provided, or when certain performance milestones are met. Service revenues are typically recognized on an equal monthly basis based on the minimum fee to be earned. The monthly amounts could be adjusted depending on whether certain performance milestones are met.

We utilize the practical expedient in ASC 842 that allows us to account for lease and non-lease components associated with each lease as a single lease component recorded within rental and other services, instead of accounting for such items separately under Accounting Standards Codification 606, Revenue (“ASC 606”). We recognize revenue for items that do not qualify for revenue recognition under ASC 842 under ASC 606. Revenue recognized as a result of applying ASC 606 was approximately 6% of total operating revenue for the years ended December 31, 2021, 2020 and 2019.

Transaction and Integration Expense. Transaction expenses include closing costs, broker commissions and other

professional fees, including legal and accounting fees related to business combinations or acquisitions that were not

consummated. Integration costs include transition costs associated with organizational restructuring (such as severance

and retention payments and recruiting expenses), third-party consulting expenses directly related to the integration of

acquired companies (in areas such as cost savings and synergy realization, technology and systems work), and internal

costs such as training, travel and labor, reflecting time spent by Company personnel on integration activities and

projects. Recurring costs are recorded in general and administrative expense.

Gains on Disposition of Properties. We recognize gains on the disposition of real estate when the recognition criteria

have been met, generally at the time the risks and rewards and title have transferred, and we no longer have substantial

continuing involvement with the real estate sold. We recognize losses from the disposition of real estate when known.

109

Table of Contents

Index to Financial Statements

DIGITAL REALTY TRUST, INC. AND SUBSIDIARIES

DIGITAL REALTY TRUST, L.P. AND SUBSIDIARIES

NOTES TO CONSOLIDATED FINANCIAL STATEMENTS- (Continued)

December 31, 2021 and 2020

New Accounting Pronouncements.

Income Taxes. In December 2019, the Financial Accounting Standards Board (“FASB”) issued updated guidance that is intended to simplify the accounting for income taxes by removing several exceptions contained in existing guidance and amending other guidance to simplify several other income tax accounting matters. The Company adopted the updated guidance for the quarter ended March 31, 2021. The adoption of this guidance had no impact on the Company’s results of operations, financial position or liquidity.

Reference Rate Reform. The Financial Conduct Authority and other independent groups announced in July 2017, that beginning in 2021, they would stop requiring banks to submit rates for the calculation of the London Inter-bank Offered Rate (“LIBOR”). As a result, in the U.S. the Federal Reserve Board and the Federal Reserve Bank of New York identified the Secured Overnight Financing Rate (“SOFR”) as its preferred alternative rate for USD LIBOR in debt and derivative financial instruments. Other global regulators have also undertaken reference rate reform initiatives to identify a preferred alternative rate for other interbank offered rates (“IBORs”). Both LIBOR and IBOR are herein referred to as “IBOR-indexed rate”. In November 2020, the Federal Reserve Board along with various independent groups announced the potential for certain USD LIBOR tenors to continue to be published until June 2023. This change would allow most legacy USD LIBOR contracts to mature before disruptions occur in the USD LIBOR market, without the need to transition these contracts to SOFR.

In March 2020, the FASB issued an Accounting Standard Update (“ASU”) that provided practical expedients to address existing guidance on contract modifications and hedge accounting due to the expected market transition from an IBOR-indexed rate to alternative reference rates, such as SOFR for LIBOR (“reference rate reform”).

The first practical expedient within the ASU allows companies to elect to not apply certain modification accounting requirements to debt, derivative, and lease contracts affected by reference rate reform if certain criteria are met. The second practical expedient allows companies to change the reference rate and other critical terms related to the reference rate reform in derivative hedge documentation without having to designate the hedging relationship – allowing companies to continue applying hedge accounting to existing cash flow and net investment hedges.

The ASU was effective on a prospective basis beginning January 1, 2020 and may be elected over time as reference rate reform activities occur. We have not modified any contracts to date, but will continue to evaluate debt, derivative, and lease contracts that are modified in the future to ensure they are eligible for modification relief and apply the available practical expedients as needed.

Business Combinations. In October 2021, the FASB issued ASU 2021-08, "Business Combinations (Topic 805): Accounting for Contract Assets and Contract Liabilities from Contracts with Customers," which requires contract assets and contract liabilities acquired in a business combination to be recognized and measured by the acquirer on the acquisition date in accordance with ASC 606, "Revenue from Contracts with Customers," as if the acquirer had originated the contracts. ASU 2021-08 is applicable on a prospective basis and is effective for fiscal years and interim reporting periods within those years beginning after December 15, 2022 (or in January 1, 2023 for the Company). Early adoption is permitted. The Company is currently evaluating the effect, if any, the adoption of this guidance will have on the Company’s results of operations, financial position and liquidity.

We determined that all other recently issued accounting pronouncements that have yet to be adopted by the Company will not have a material impact on our consolidated financial statements or do not apply to our operations.

110

Table of Contents

Index to Financial Statements

DIGITAL REALTY TRUST, INC. AND SUBSIDIARIES

DIGITAL REALTY TRUST, L.P. AND SUBSIDIARIES

NOTES TO CONSOLIDATED FINANCIAL STATEMENTS- (Continued)

December 31, 2021 and 2020

3. Business Combinations

The acquisition of Interxion in 2020 is the only material business combination that was completed by the Company in any of the periods presented in the consolidated financial statements.

Interxion Combination in 2020

We acquired Interxion on March 9, 2020, completing the transaction on March 12, 2020 for total equity consideration of approximately $7.0 billion, including approximately $108.5 million of assumed cash and cash equivalents. The following table summarizes the acquired assets and liabilities recorded at their fair values as of the acquisition date (in thousands):


Final

Amounts

Land

$

190,970

Building and improvements

3,166,988

Construction in progress and space held for development

397,825

Operating lease right-of-use assets

553,987

Goodwill


4,338,711

Customer relationship value and other intangibles


1,052,811

Debt assumed

(1,662,276)

Finance lease obligations

(47,797)

Operating lease liabilities


(553,987)

Deferred tax liability, net

(535,990)

Working capital liabilities, net

(24,738)

Total purchase consideration

6,876,504

Assumed cash and cash equivalents


108,548

Total equity consideration

$

6,985,052

Goodwill recorded as part of this transaction is not expected to be deductible for local tax purposes. This transaction enabled the Company to strengthen its ability to provide solutions on a global basis using a diversified product offering of data center solutions for small and large footprint deployments as well as interconnection services. We believe this strategic benefit of the acquisition supports the balance of goodwill recorded.

Unaudited pro forma financial information based on our historical consolidated income statements adjusted to give effect to the Interxion Combination as if it occurred on January 1, 2019, is shown below. Pro forma adjustments primarily relate to merger expenses, depreciation expense on acquired buildings and improvements, amortization of acquired intangibles, and estimated interest expense related to financing transactions, the proceeds of which were used to fund the repayment of Interxion debt in connection with the Interxion Combination. Pro forma net income available to common stockholders/unitholders was adjusted to exclude $65.7 million of merger-related costs incurred by the Company during the year ended December 31, 2020 and to include these charges for the year ended December 31, 2019.

111

Table of Contents

Index to Financial Statements

DIGITAL REALTY TRUST, INC. AND SUBSIDIARIES

DIGITAL REALTY TRUST, L.P. AND SUBSIDIARIES

NOTES TO CONSOLIDATED FINANCIAL STATEMENTS- (Continued)

December 31, 2021 and 2020

Pro forma (unaudited, in thousands)

Year Ended December 31, 

Digital Realty Trust, Inc.


2020


2019

Total revenue

$

4,051,608

$

3,758,054

Net (loss) income available to common stockholders

$

323,889

$

267,600

Digital Realty Trust, L.P.


Total revenue

$

4,051,608

$

3,758,054

Net income available to common unitholders

$

333,389

$

288,700

Revenues of approximately $691.4 million and net income of approximately $59.4 million associated with the Interxion Combination are included in the consolidated income statement for the year ended December 31, 2020.

4. Leases

Lessor Accounting

We generate the majority of our revenue by leasing our operating properties to customers under operating lease agreements. The manner in which we recognize these transactions in our financial statements is described in the Revenue Recognition section of Footnote 1 to these consolidated financial statements.

A summary of minimum lease payments due from our customers under operating leases of land, prestabilized development properties, and operating properties with lease periods of greater than one year at December 31, 2021 (in thousands) is shown below. These amounts do not reflect future rental revenues from renewal or replacement of existing leases unless we are reasonably certain we will exercise the option or the lessee has the sole ability to exercise the option. Reimbursements of operating expenses and variable rent increases are excluded from the table below.


Operating leases

2022

$

2,483,938

2023


1,859,306

2024


1,529,889

2025


1,218,396

2026


933,773

Thereafter


3,044,931

Total

$

11,070,233

112

Table of Contents

Index to Financial Statements

DIGITAL REALTY TRUST, INC. AND SUBSIDIARIES

DIGITAL REALTY TRUST, L.P. AND SUBSIDIARIES

NOTES TO CONSOLIDATED FINANCIAL STATEMENTS- (Continued)

December 31, 2021 and 2020

Lessee Accounting

We lease space and equipment at certain of our data centers from third parties under noncancelable lease agreements. Leases for our data centers expire on various dates through 2069. Certain of our data centers, primarily in Europe and Singapore, are subject to ground leases. As of December 31, 2021, the termination dates of these ground leases ranged from 2049 to 2108. In addition, our corporate headquarters along with several regional office locations are subject to leases with termination dates ranging from 2022 to 2028. The leases generally require us to make fixed rental payments that increase at defined intervals during the term of the lease plus pay our share of common area, real estate and utility expenses as incurred. The leases do not contain residual value guarantees and do not impose material restrictions or covenants on us. Further, the leases have been classified and accounted for as either operating or finance leases. Rent expense related to operating leases included in rental property operating and maintenance expense in the consolidated income statements amounted to approximately $143.8 million, $118.8 million and $83.8 million for the years ended December 31, 2021, 2020 and 2019, respectively.

As of December 31, 2021, the weighted average remaining lease term for our operating leases and finance leases was 13 years and 23 years, respectively. We do not include renewal options in the lease term for calculating the lease liability unless we are reasonably certain we will exercise the option or the lessor has the sole ability to exercise the option. The weighted average incremental borrowing rate was 2.7% for operating leases and 3.0% for finance leases at December 31, 2021. We assigned a collateralized interest rate to each lease based on the term of the lease and the currency in which the lease is denominated.

Maturities of lease liabilities as of December 31, 2021 were as follows (in thousands):


Operating


Finance

lease liabilities

lease liabilities

2022

$

158,331

$

12,608

2023


163,586


31,424

2024


165,467


11,648

2025


166,015


11,699

2026


161,199


11,750

Thereafter


963,874


225,541

Total undiscounted future cash flows


1,778,472


304,670

Less: Imputed interest


(266,285)


(86,080)

Present value of undiscounted future cash flows

$

1,512,187

$

218,590

5. Receivables

Refer to Note 2 “Summary of Significant Accounting Policies—Revenue Recognition” for discussion of our accounting policies related to accounts receivable, deferred rent and related allowances.

Accounts and Other Receivables, Net

Accounts and other receivables, net is primarily comprised of contractual rents and other lease-related obligations currently due from customers. These amounts are shown in the subsequent table as Accounts receivable – trade. Other receivables shown separately from Accounts receivable – trade, consist primarily of amounts that have not yet been billed to customers, such as for utility reimbursements and installation fees.

113

Table of Contents

Index to Financial Statements

DIGITAL REALTY TRUST, INC. AND SUBSIDIARIES

DIGITAL REALTY TRUST, L.P. AND SUBSIDIARIES

NOTES TO CONSOLIDATED FINANCIAL STATEMENTS- (Continued)

December 31, 2021 and 2020

As of December 31,

(Amounts in thousands):

2021

2020

Accounts receivable – trade, net

$

399,029

$

355,727

Allowance for doubtful accounts

(28,574)

(18,825)

Accounts receivable, net

370,455

336,902

Accounts receivable – customer recoveries

131,538

93,224

Value-added tax receivables

104,036

88,633

Accounts receivable – installation fees

43,626

64,068

Other receivables

22,066

20,284

Accounts and other receivables, net

$

671,721

$

603,111

Deferred Rent 

Deferred rent represents rental income that has been recognized as revenue under ASC 842, but which is not yet due from customers under their existing rental agreements. The Company recognizes an allowance against deferred rent receivables to the extent it becomes no longer probable that a customer or group of customers will be able to make substantially all of their required cash rental payments over the entirety of their respective lease terms.

Balance as of

Balance as of

(Amounts in thousands):

December 31, 2021

December 31, 2020

Deferred rent receivables

$

556,251

$

538,040

Allowance for deferred rent receivables

(8,866)

(9,860)

Deferred rent receivables, net

$

547,385

$

528,180


114

Table of Contents

Index to Financial Statements

DIGITAL REALTY TRUST, INC. AND SUBSIDIARIES

DIGITAL REALTY TRUST, L.P. AND SUBSIDIARIES

NOTES TO CONSOLIDATED FINANCIAL STATEMENTS- (Continued)

December 31, 2021 and 2020

6. Investments in Properties

A summary of our investments in properties is below (in thousands):

Property Type

As of December 31, 2021

As of December 31, 2020

Land

$

1,019,723

$

1,106,392

Acquired ground lease

6,721

10,308

Buildings and improvements

21,914,091

21,335,396

Tenant improvements

684,915

690,892

23,625,450

23,142,988

Accumulated depreciation and amortization

(6,210,281)

(5,555,221)

Investments in operating properties, net

17,415,169

17,587,767

Construction in progress and space held for development

3,213,389

2,768,325

Land held for future development

133,683

226,862

Investments in properties, net

$

20,762,241

$

20,582,954

7. Acquisitions and Dispositions of Properties

Acquisitions of Properties

For the years ended December 31, 2021, 2020 and 2019, acquisitions of properties that did not qualify as business combinations were immaterial to our financial statements – both individually and in the aggregate.

Disposition of Properties to Digital Core REIT

On December 6, 2021, we completed the listing of Digital Core REIT as a standalone real estate investment trust publicly traded on the Singapore Exchange (“SGX”) under the ticker symbol: DCRU. Hereafter, Digital Core REIT and its associated subsidiaries are collectively referred to as the Singapore REIT (“SREIT”). In connection with the listing, the Company contributed a portfolio of 10 operating data center properties to the SREIT. The fair value of these properties was determined to be approximately $1.4 billion based on two separate third party appraisal reports . In exchange for the contribution of these properties, the Company received: 1). $919 million cash and 2). a 39.4% equity interest in the publicly-traded Digital Core REIT entity, while retaining a 10% direct interest in the operating properties that were contributed by the Company to the SREIT. In addition, the Company received approximately $13 million of acquisition fees paid to the Company by Digital Core REIT in the form of additional units in Digital Core REIT.

The Company determined the fair market value of its 10% retained investment in the properties contributed to the SREIT based on its retained ownership percentage applied to the appraised value of the properties. This approach was deemed appropriate because the Company determined that a discount for lack of marketability and/or lack of control associated with its 10% direct interest in the properties was not warranted.

As a result of this transaction, the Company recognized a gain on sale of assets of approximately $1.0 billion – which is summarized below (in millions).

Cash received

$

919.1

Fair market value of retained investment in SREIT

521.4

Acquisition fees paid in Digital Core REIT units

13.0

115

Table of Contents

Index to Financial Statements

DIGITAL REALTY TRUST, INC. AND SUBSIDIARIES

DIGITAL REALTY TRUST, L.P. AND SUBSIDIARIES

NOTES TO CONSOLIDATED FINANCIAL STATEMENTS- (Continued)

December 31, 2021 and 2020

Tax on acquisition fees

(3.0)

Net book value of assets contributed

(439.3)

Gain on disposition of properties

$

1,011.2

The Company provides property management and other services to the SREIT in exchange for contractual fees that are payable to the Company in cash or in additional units of the SREIT. The Company’s retained investment in the SREIT is accounted for as an equity method investment, based on the conclusion that the Company has significant influence over (but does not control) the SREIT.

The assets and liabilities sold to the SREIT were not representative of a significant component of our portfolio, nor did the sale represent a significant shift in our strategy.

Disposition of Other Properties

The Company sold the following other real estate properties during the years ended December 31, 2021, 2020 and 2019:

Gross Proceeds / Fair Value

Gain on Sale / contribution

Location / Portfolio

Metro Area

Date Sold

(in millions)

(in millions)

European Portfolio

Various

Mar 16, 2021

$

680.0

$

332.0

Other

Various

2021

109.6

37.7

Naritaweg 52


Amsterdam


Dec 30, 2020

6.1


Liverpoolweg 10


Amsterdam


Jul 17, 2020

21.5

10.4

Mapletree portfolio

Various

Jan 14, 2020

$

557.0

$

306.5

Mapletree portfolio

Northern Virginia

Nov 1, 2019

$

996.6

$

266.0

European Portfolio - On March 16, 2021, we sold a portfolio of 11 data centers in Europe (four in the United Kingdom, three in the Netherlands, three in France and one in Switzerland) to Ascendas Reit, a CapitaLand sponsored REIT, for total consideration of approximately $680.0 million (subject to customary final adjustments for working capital and other items). The total gain recorded during the three months ended March 31, 2021 as a result of this sale was approximately $332.0 million. We are providing transitional property management services for one year from the closing date at a customary market rate. The assets and liabilities sold were not representative of a significant component of our portfolio, nor did the sale represent a significant shift in our strategy.

Mapletree portfolio - In January 2020, we closed on the sale of 10 Powered Base Building® properties, which comprise 12 data centers, in North America to Mapletree Investments Pte Ltd (“Mapletree Investments”) and Mapletree Industrial Trust (“MIT” and together with Mapletree Investments, “Mapletree”), at a purchase consideration of approximately $557.0 million, which resulted in a gain of approximately $306.5 million. The 12 data centers were not representative of a significant component of our portfolio, nor did the sale represent a significant shift in our strategy. We provided transitional property management services for one year from the closing date at a customary market rate. Prior to sale of the 10 Powered Base Building properties in January 2020, we contributed three data centers to the joint venture with Mapletree in November 2019 – total gain on contribution of these assets was $266.0 million.

116

Table of Contents

Index to Financial Statements

DIGITAL REALTY TRUST, INC. AND SUBSIDIARIES

DIGITAL REALTY TRUST, L.P. AND SUBSIDIARIES

NOTES TO CONSOLIDATED FINANCIAL STATEMENTS- (Continued)

December 31, 2021 and 2020

8. Investments in Unconsolidated Entities

As of December 31, 2021 and 2020, our investments in unconsolidated entities accounted for under the equity method presented in our consolidated balance sheets consist of the following (in thousands):

Year

Metropolitan

Balance as of


Balance as of

Entity

Entity Formed


Area of Properties


% Ownership


December 31, 2021

December 31, 2020

Digital Core REIT

2021

U.S. / Canada

35

%

$

343,317

$

Direct interest in SREIT properties

2021

U.S. / Canada

10

%

144,050

Ascenty

2019


Brazil / Chile / Mexico


51

%


553,031

567,192

Mapletree

2019

Northern Virginia

20

%  

172,465

184,890

Mitsubishi

Various


Osaka / Tokyo


50

%  


401,509


278,947

Lumen

2012


Hong Kong


50

%  


68,854


86,600

Other

Various


U.S. / India / Nigeria


Various


124,463


30,529

Total


$

1,807,689

$

1,148,158

SREIT – The Company’s ownership interest in the SREIT consists of units of the SREIT parent, Digital Core REIT (which is publicly-traded on the SGX under the ticker symbol: DCRU), as well as a direct interest in the operating properties. As of December 31, 2021, the Company held a 35% interest in the SREIT and separately owns a 10% direct retained interest in the underlying operating properties. The Company’s 35% interest in Digital Core REIT as of December 31, 2021 consists of 390 million units publicly-traded on the SGX under the ticker symbol DCRU. Based on the closing price per unit of $1.16, the fair value of the units the Company owns in DCRU was $453 million as of December 31, 2021. This value does not include the value of the Company’s 10% direct interest in the operating properties of the SREIT, because the associated ownership interests are not publicly-traded.

The Company accounts for its combined ownership interest in the SREIT as an equity method investment based on the significant influence it is able to exert on the SREIT (and not at fair value). A greenshoe option was included as a provision in the SREIT IPO underwriting agreement that granted underwriters the right to buy an additional amount of units from the Company at the same price as the initial offering price and sell those units to other parties. The greenshoe option was exercised on December 31, 2021 – reducing the Company’s share in Digital Core REIT down from the initial 39% interest (including the acquisition fee that was received in units) upon sale of the 10 operating properties on December 6, 2021 to 35% at December 31, 2021. No incremental gain or loss was recorded by the Company for the sale of units under the greenshoe option, because the units were sold at the initial offering price which was equal to the Company’s book basis in the units.

Pursuant to contractual agreements with the SREIT, the Company will earn fees for asset and property management services as well as fees for aiding the SREIT in future acquisition, disposition and development activities. Certain of these fees are payable to the Company in the form of additional units in the SREIT or in cash.

117

Table of Contents

Index to Financial Statements

DIGITAL REALTY TRUST, INC. AND SUBSIDIARIES

DIGITAL REALTY TRUST, L.P. AND SUBSIDIARIES

NOTES TO CONSOLIDATED FINANCIAL STATEMENTS- (Continued)

December 31, 2021 and 2020

Ascenty – The Company’s ownership percentage in Ascenty includes an approximate 2% interest held by one of the Company’s non-controlling interest holders. This 2% interest had a carrying value of approximately $20.9 million and $21.9 million as of December 31, 2021 and December 31, 2020, respectively. Ascenty is a variable interest entity (“VIE”) and the Company’s maximum exposure to loss related to this VIE is limited to our equity investment in the entity.

PREI ® – In the third quarter of 2021, the existing unconsolidated partnership between the Company and PGIM Real Estate (the “PGIM Joint Venture”), completed the sale of a portfolio of 10 data centers in North America for $581 million. PGIM Real Estate owned an 80% interest and the Company owned a 20% interest in the partnership. We recognized a gain of approximately $64 million from the sale of the data centers. This gain is reflected in equity in earnings (loss) of unconsolidated entities in our condensed consolidated income statements. In addition, we received a promote in the amount of $19 million related to the partnership exceeding certain investor return thresholds over the life of the partnership, which is included in fee income and other in our consolidated income statements.

Summarized Financial Information of Investments in Unconsolidated Entities

SREIT

The SREIT is a separate publicly-traded entity on the Singapore Stock Exchange (“SGX”) with its own set of standalone financial statements that are made available to the public by the SREIT’s management team as part of its compliance with the rules of the SGX. The SREIT’s standalone results for the period subsequent to when the SREIT was listed on December 6, 2021 will not be made public by the SREIT until the first quarter of 2022. Consequently, we have utilized summarized financial information of the SREIT as of December 6, 2021 (which is the information that is publicly-available at this time). Actual balances at December 31, 2021 are not expected to materially differ from amounts shown herein.

SREIT Summarized Financial Information

(in millions)

Real estate properties appraised value

$

1,440.5

Debt

(350.0)

Net assets

$

1,090.5

All Other Investments in Unconsolidated Entities

The subsequent tables provide summarized financial information for all of our investments in unconsolidated entities accounted for using the equity method except for the investment in the SREIT which is discussed previously. Amounts are shown in thousands.

118

Table of Contents

Index to Financial Statements

DIGITAL REALTY TRUST, INC. AND SUBSIDIARIES

DIGITAL REALTY TRUST, L.P. AND SUBSIDIARIES

NOTES TO CONSOLIDATED FINANCIAL STATEMENTS- (Continued)

December 31, 2021 and 2020


Net


Net

Total

Total 

Operating

Income

December 31, 2021

Assets

Liabilities

Equity

Revenues

Income

(Loss)

Unconsolidated entities

Ascenty

$

2,079,401

$

1,046,079

$

1,033,322

$

204,696

$

128,827

$

(41,461)

Mitsubishi

1,376,763

537,581

839,182

168,203

88,462

31,125

Lumen

148,576

10,868

137,708

25,541

15,506

2,718

Mapletree


925,190


24,865


900,325


111,010


65,701


(9,825)

Other


440,694


190,996


249,698


59,881


36,427


233,298

Total Unconsolidated entities

$

4,970,624

$

1,810,389

$

3,160,235

$

569,331

$

334,923


$

215,855

Our investment in and share of equity in earnings of unconsolidated entities

$

1,807,689


$

62,283


Net 


Net 

Total 

Total 

Operating

Income 

December 31, 2020

Assets

Liabilities

Equity

Revenues

 Income

(Loss)

Unconsolidated entities

Ascenty

$

1,862,402

$

833,801

$

1,028,601

$

165,680

$

105,040

$

(191,161)

Mitsubishi


968,957

358,749

610,208

154,114

83,113

43,746

Lumen

181,464

8,264

173,200

25,006

14,765

5,581

Mapletree

985,900

38,140

947,760

106,966

66,062

(11,473)

Other


604,215

421,349

182,866

83,475

57,674

18,210

Total Unconsolidated entities

$

4,602,938

$

1,660,303

$

2,942,635

$

535,241

$

326,654


$

(135,097)

Our investment in and share of equity in loss of unconsolidated entities

$

1,148,158


$

(57,629)

119

Table of Contents

Index to Financial Statements

DIGITAL REALTY TRUST, INC. AND SUBSIDIARIES

DIGITAL REALTY TRUST, L.P. AND SUBSIDIARIES

NOTES TO CONSOLIDATED FINANCIAL STATEMENTS- (Continued)

December 31, 2021 and 2020


Net 


Net 

Total 

Total 

Equity / 

Operating

Income 

December 31, 2019

Assets

Liabilities

(Deficit)

Revenues

 Income

(Loss)

Unconsolidated entities

Ascenty

$

2,178,663

$

764,603

$

1,414,060

$

112,052

$

71,802

$

(54,606)

Mitsubishi

753,743

303,130

450,613

84,344

45,044

18,751

Lumen

187,241

9,947

177,294

24,680

15,429

6,712

Mapletree

1,042,661

23,796

1,018,865

17,852

11,078

(1,872)

Other

715,442

579,470

135,972

140,672

93,104

39,372

Total Unconsolidated entities

$

4,877,750

$

1,680,946

$

3,196,804

$

379,600

$

236,457


$

8,357

Our investment in and share of equity in earnings of unconsolidated entities

$

1,287,109


$

8,067

The amounts reflected in the previous tables on this topic are based on the historical financial information of the respective individual entities and have not been adjusted to show only the portion that is owned by the Company. The debt of our unconsolidated entities generally is non-recourse to us, except for customary exceptions pertaining to such matters as intentional misuse of funds, environmental conditions, and material misrepresentations.

9. Goodwill

Goodwill represents the excess of the purchase price over the fair value of net tangible and intangible assets acquired in a business combination. Changes in the value of goodwill at December 31, 2021 as compared to December 31, 2020 were immaterial and driven primarily by changes in exchange rates associated with goodwill balances denominated in foreign currencies.

120

Table of Contents

Index to Financial Statements

DIGITAL REALTY TRUST, INC. AND SUBSIDIARIES

DIGITAL REALTY TRUST, L.P. AND SUBSIDIARIES

NOTES TO CONSOLIDATED FINANCIAL STATEMENTS- (Continued)

December 31, 2021 and 2020

10. Acquired Intangible Assets and Liabilities

The following summarizes our acquired intangible assets and intangible liabilities as of December 31, 2021 and 2020.

(Amounts in thousands)

Balance as of

December 31, 2021

December 31, 2020

Gross Carrying Amount

Accumulated Amortization

Net Carrying Amount

Gross Carrying Amount

Accumulated Amortization

Net Carrying Amount

Customer relationship value

$

2,838,842

$

(721,983)

$

2,116,859

$

2,993,093

$

(570,886)

$

2,422,207

Acquired in-place lease value

1,278,012

(995,883)

282,129

1,382,563

(1,004,421)

378,142

Other

101,869

(14,688)

87,181

57,370

(7,107)

50,263

Acquired above-market leases

268,724

(247,135)

21,589

280,216

(236,923)

43,293

Acquired below-market leases

(351,052)

247,877

(103,175)

(401,539)

270,648

(130,891)

Amortization of customer relationship value, acquired in-place lease value and other intangibles (a component of depreciation and amortization expense) was approximately $262.9 million, $266.2 million and $271.4 million for the years ended December 31, 2021, 2020 and 2019, respectively. Amortization of acquired below-market leases, net of acquired above-market leases, resulted in a decrease in rental and other services revenue of $(3.6) million, $(10.5) million and $(17.1) million for the years ended December 31, 2021, 2020 and 2019, respectively. Estimated annual amortization for each of the five succeeding years and thereafter, commencing January 1, 2022 is as follows:

(Amounts in thousands)


Customer relationship value

Acquired in-place lease value

Other (1)

Acquired above-market leases

Acquired below-market leases

2022

$

168,560

$

53,840

$

8,073

$

11,209

$

(14,190)

2023


167,891


43,769


1,458


4,759


(12,657)

2024


167,312


37,945


2,584


(11,364)

2025


166,809


34,846


1,452


(10,370)

2026


166,374


30,713


684


(8,728)

Thereafter


1,279,913


81,016


901


(45,866)

Total

$

2,116,859

$

282,129

$

9,531

$

21,589

$

(103,175)

Remaining Contractual Life (in years)

13.6

5.0

1.6

7.2

(1)Excludes power grid rights in the amount of approximately $77.7 million that are currently not being amortized. Amortization of these assets will begin once the data centers associated with the power grid rights are placed into service.

121

Table of Contents

Index to Financial Statements

DIGITAL REALTY TRUST, INC. AND SUBSIDIARIES

DIGITAL REALTY TRUST, L.P. AND SUBSIDIARIES

NOTES TO CONSOLIDATED FINANCIAL STATEMENTS- (Continued)

December 31, 2021 and 2020

11. Debt of the Operating Partnership

All debt is currently held by the OP or its consolidated subsidiaries, and the Parent is the guarantor or co-guarantor of such debt. A summary of outstanding indebtedness is as follows (in thousands):


December 31, 2021


December 31, 2020

Weighted-

Weighted-

average

Amount

average

Amount

interest rate

Outstanding

interest rate

Outstanding

Global revolving credit facilities

0.96

%

$

415,116

0.91

%

$

540,184

Unsecured term loans

%  


1.20

%  


537,470

Unsecured senior notes

2.26

%  

13,000,042

2.49

%  

12,096,029

Secured and other debt

3.47

%  


147,082

2.92

%  


239,330

Total

2.23

%  

$

13,562,240


2.38

%  

$

13,413,013

The weighted-average interest rates shown represent interest rates at the end of the periods for the debt outstanding and include the impact of designated interest rate swaps, which effectively fix the interest rates on certain variable rate debt.

We primarily borrow in the functional currencies of the countries where we invest. Included in the outstanding balances were borrowings denominated in the following currencies (in thousands, U.S. dollars):

December 31, 2021

December 31, 2020

Amount

Amount

Denomination of Draw


Outstanding


% of Total


Outstanding


% of Total


U.S. dollar ($)

$

3,141,951


23.2

%

$

3,629,000


27.1

%

British pound sterling (£)


2,117,758


15.6

%

2,166,695

16.2

%

Euro ()

7,532,057

55.5

%

6,912,142

51.5

%

Other

770,474

5.7

%

705,176

5.2

%

Total

$

13,562,240


$

13,413,013


The table below summarizes our debt maturities and principal payments as of December 31, 2021 (in thousands):

Global Revolving

Unsecured


Credit Facilities(1)


Senior Notes


Secured and Other Debt


Total Debt

2022

$

$

682,200

$

336

$

682,536

2023

3,081

3,081

2024

1,020,500

1,020,500

2025


1,730,330


1,730,330

2026


415,116


1,523,694


3,870


1,942,680

Thereafter


8,043,318


139,794


8,183,112

Subtotal

$

415,116

$

13,000,042

$

147,082

$

13,562,240

Unamortized net discounts


(33,612)


(33,612)

Unamortized deferred financing costs

(16,944)

(63,060)

(414)

(80,418)

Total

$

398,172

$

12,903,370

$

146,668

$

13,448,210

122

Table of Contents

Index to Financial Statements

DIGITAL REALTY TRUST, INC. AND SUBSIDIARIES

DIGITAL REALTY TRUST, L.P. AND SUBSIDIARIES

NOTES TO CONSOLIDATED FINANCIAL STATEMENTS- (Continued)

December 31, 2021 and 2020

(1)Includes amounts outstanding for the Global Revolving Credit Facility and the Yen Revolving Credit Facility (together, we refer to as the “Global Revolving Credit Facilities”) – but are discussed separately in these footnotes given slightly different fees/terms.

Global Revolving Credit Facility

We have a global revolving senior credit facility (“global revolving credit facility”) under which we may draw up to $3.0 billion on a revolving basis (subject to currency fluctuations). The global revolving credit facility can be drawn in Australian dollars, British pounds sterling, Canadian dollars, Euros, Hong Kong dollars, Japanese yen, Singapore dollars, Indonesian rupiah, Swiss francs, Korean won and U.S. dollars (with the ability to add other currencies in the future).

We have the ability to increase the size of the global revolving credit facility by up to $1.5 billion, subject to the receipt of lender commitments and other conditions precedent. Other key terms of the global revolving credit facility are as follows:

Maturity date: January 24, 2026, with two six-month extension options available. The bank group is obligated to grant the extension options provided we give proper notice, we make certain representations and warranties and no default exists under the global revolving credit facilities.
Interest rate: the applicable index plus a margin which is based on the credit ratings of our long-term debt and is currently 85 basis points.
Annual facility fee: based on the total commitment amount of the facility and the credit ratings of our long-term debt is currently 20 basis points and is payable quarterly.
Sustainability-linked pricing component: pricing can increase by up to 5 basis points or decrease by up to 5 basis points depending on whether or not the OP or its subsidiaries meet certain sustainability performance targets.

Yen Revolving Credit Facility

In addition to the global revolving credit facility, we have a revolving credit facility that provides for borrowings in Japanese Yen of up to ¥33.3 billion (approximately $291.3 million based on the exchange rate on November 18, 2021), hereafter referred to as the “Yen revolving credit facility”). We have the ability from time to time to increase the size of the Yen revolving credit facility to up to ¥93.3 billion, subject to receipt of lender commitments and other conditions precedent. Other key terms of the Yen revolving credit facility are as follows:

Maturity date: January 24, 2026, with two six-month extension options available. The bank group is obligated to grant the extension options provided we give proper notice, we make certain representations and warranties and no default exists under the global revolving credit facilities.
Interest rate: the applicable index plus a margin which is based on the credit ratings of our long-term debt and is currently 50 basis points.
Quarterly unused commitment fee: currently is 10 basis points, calculated using the average daily unused revolving credit commitment and is based on the credit ratings of our long-term debt

123

Table of Contents

Index to Financial Statements

DIGITAL REALTY TRUST, INC. AND SUBSIDIARIES

DIGITAL REALTY TRUST, L.P. AND SUBSIDIARIES

NOTES TO CONSOLIDATED FINANCIAL STATEMENTS- (Continued)

December 31, 2021 and 2020

Sustainability-linked pricing component: pricing can increase by up to 5 basis points or decrease by up to 5 basis points depending on whether or not the OP or its subsidiaries meet certain sustainability performance targets.

Restrictive Covenants in Global Revolving Credit Facility and Yen Revolving Credit Facility

The global revolving credit facility and the Yen revolving credit facility both contain various restrictive covenants, including limitations on our ability to incur additional indebtedness, make certain investments, or merge with another company. In addition, we are required to maintain financial coverage ratios, including with ratios respect to unencumbered assets. After the occurrence of and during the continuance of any event of default, these credit facilities restrict the Parent’s ability to make distributions to stockholders or redeem or otherwise repurchase shares of its capital stock, except in limited circumstances (such as those necessary to enable Digital Realty Trust, Inc. to maintain its qualification as a REIT and to minimize the payment of income or excise tax). As of December 31, 2021, we were in compliance with all of such covenants for both of these revolving credit facilities.

Unsecured Senior Notes

The following table provides details of outstanding unsecured senior notes (balances in thousands):

Aggregate Principal at Issuance

Balance as of

Borrowing Currency

USD

Maturity Date

December 31, 2021

December 31, 2020

Floating rate notes due 2022

300,000

$

349,800

Sep 23, 2022

$

341,100

$

366,480

0.125% notes due 2022

300,000

332,760

Oct 15, 2022

341,100

366,480

2.750% notes due 2023

$

350,000

350,000

Feb 1, 2023

-

350,000

2.625% notes due 2024

600,000

677,040

Apr 15, 2024

682,200

732,960

2.750% notes due 2024

£

250,000

324,925

Jul 19, 2024

338,300

341,750

4.250% notes due 2025

£

400,000

634,480

Jan 17, 2025

541,280

546,800

0.625% notes due 2025

650,000

720,980

Jul 15, 2025

739,050

794,040

4.750% notes due 2025

$

450,000

450,000

Oct 1, 2025

450,000

450,000

2.500% notes due 2026

1,075,000

1,224,640

Jan 16, 2026

1,222,275

1,313,219

0.200% notes due 2026

CHF

275,000

298,404

Dec 15, 2026

301,419

-

3.700% notes due 2027

$

1,000,000

1,000,000

Aug 15, 2027

1,000,000

1,000,000

1.125% notes due 2028

500,000

548,550

Apr 09, 2028

568,500

610,800

4.450% notes due 2028

$

650,000

650,000

Jul 15, 2028

650,000

650,000

0.550% notes due 2029

CHF

270,000

292,478

Apr 16, 2029

295,938

-

3.300% notes due 2029

£

350,000

454,895

Jul 19, 2029

473,620

478,450

3.600% notes due 2029

$

900,000

900,000

Jul 01, 2029

900,000

900,000

1.500% notes due 2030

750,000

831,900

Mar 15, 2030

852,750

916,200

3.750% notes due 2030

£

550,000

719,825

Oct 17, 2030

744,260

751,850

1.250% notes due 2031

500,000

560,950

Feb 1, 2031

568,500

610,800

0.625% notes due 2031

1,000,000

1,220,700

Jul 15, 2031

1,137,000

-

1.000% notes due 2032

750,000

874,500

Jan 15, 2032

852,750

916,200

$

13,000,042

$

12,096,029

Unamortized discounts, net of premiums

(33,612)

(34,988)

Deferred financing costs, net

(63,060)

(64,031)

Total unsecured senior notes, net of discount and deferred financing costs

$

12,903,370

$

11,997,010

On January 12, 2021, Digital Intrepid Holding B.V., an indirect wholly owned holding and finance subsidiary of the OP, issued and sold €1.0 billion aggregate principal amount of 0.625% Guaranteed Notes due 2031 (the “2031 Notes”). The 2031 Notes are senior unsecured obligations of Digital Intrepid Holding B.V. and are fully and unconditionally guaranteed by the Parent and the OP. Net proceeds from the offering were approximately €988.3 million (approximately $1,206.4 million based on the exchange rate on January 12, 2021) after deducting managers’ discounts and estimated offering expenses.

124

Table of Contents

Index to Financial Statements

DIGITAL REALTY TRUST, INC. AND SUBSIDIARIES

DIGITAL REALTY TRUST, L.P. AND SUBSIDIARIES

NOTES TO CONSOLIDATED FINANCIAL STATEMENTS- (Continued)

December 31, 2021 and 2020

On July 15, 2021, Digital Intrepid Holding B.V., an indirect wholly owned holding and finance subsidiary of the OP issued and sold CHF 275 million aggregate principal amount of 0.20% Guaranteed Notes due 2026 (the “2026 Notes”) and CHF 270 million aggregate principal amount of 0.55% Guaranteed Notes due 2029 (the “2029 Notes” and together with the 2026 Notes, the “Swiss Franc Notes”). The Swiss Franc Notes are senior unsecured obligations of Digital Intrepid Holding B.V. and are fully and unconditionally guaranteed by the Parent and the OP. Net proceeds from the offering of the Swiss Franc Notes were approximately CHF 542.3 million (approximately $590.9 million based on the exchange rate on July 15, 2021) after deducting the managers’ commissions and certain offering expenses.

See Note 22. “Subsequent Events” for additional information on the issuance of 1.375% Guaranteed Notes due 2032 on January 18, 2022 and the redemption of the 4.750% Notes due 2025, which occurred on February 3, 2022.

Restrictive Covenants in Unsecured Senior Notes

The indentures governing our senior notes contain certain covenants, including (1) a leverage ratio not to exceed 60%, (2) a secured debt leverage ratio not to exceed 40% and (3) an interest coverage ratio of greater than 1.50. The covenants also require us to maintain total unencumbered assets of not less than 150% of the aggregate principal amount of unsecured debt. At December 31, 2021, we were in compliance with each of these financial covenants.

Early Extinguishment of Unsecured Senior Notes

We recognized the following losses on early extinguishment of unsecured notes:

During the year ended December 31, 2021: $18.7 million primarily due to redemption of the 2.750% Notes due 2023 in February 2021.
During the year ended December 31, 2020: $103.2 million primarily due to redemption of:
o3.950% Notes due 2022 and 3.625% Notes due 2022 in August 2020; and

o4.750% Notes due 2023 in October 2020
During the year ended December 31, 2019: $39.2 million, primarily due to costs associated with early tender offer and subsequent redemption of:
o5.875% Notes due 2020 in January and February 2019; and
o3.400% Notes due 2020 and 5.250% Notes due 2021 during June 2019

Secured and other debt – This amount consists of a variety of loans at fixed rates ranging from 1.11% to 11.65%. The largest component of the balance is a $135 million mortgage loan for the Company’s Westin building in Seattle – which bears interest at 3.29%. The loan bearing interest at 11.65% is an unsecured loan with a balance of less than $4 million.

125

Table of Contents

Index to Financial Statements

DIGITAL REALTY TRUST, INC. AND SUBSIDIARIES

DIGITAL REALTY TRUST, L.P. AND SUBSIDIARIES

NOTES TO CONSOLIDATED FINANCIAL STATEMENTS- (Continued)

December 31, 2021 and 2020

12. Earnings per Common Share or Unit

The following is a summary of basic and diluted income per share/unit (in thousands, except share/unit and per share/unit amounts):

Digital Realty Trust, Inc. Earnings per Common Share

Year Ended December 31, 


2021


2020


2019

Net income available to common stockholders

$

1,681,498

$

263,342

$

493,011

Weighted average shares outstanding—basic


282,474,927


260,098,978


208,325,823

Potentially dilutive common shares:


Unvested incentive units


253,344


120,775


165,185

Unvested restricted stock

191,541

177,244

Forward equity offering


1,596,476


813,073

Market performance-based awards


302,156


529,035


158,166

Weighted average shares outstanding—diluted


283,221,968


262,522,508


209,462,247

Income per share:


Basic

$

5.95

$

1.01

$

2.37

Diluted

$

5.94

$

1.00

$

2.35

Digital Realty Trust, L.P. Earnings per Unit

Year Ended December 31, 


2021


2020


2019

Net income available to common unitholders

$

1,720,598

$

272,842

$

514,111

Weighted average units outstanding—basic


289,165,448


268,072,983


217,284,755

Potentially dilutive common units:


Unvested incentive units


253,344


120,775


165,185

Unvested restricted units

191,541

177,244

Forward equity offering


1,596,476


813,073

Market performance-based awards


302,156


529,035


158,166

Weighted average units outstanding—diluted


289,912,489


270,496,513


218,421,179

Income per unit:


Basic

$

5.95

$

1.02

$

2.37

Diluted

$

5.94

$

1.01

$

2.35

126

Table of Contents

Index to Financial Statements

DIGITAL REALTY TRUST, INC. AND SUBSIDIARIES

DIGITAL REALTY TRUST, L.P. AND SUBSIDIARIES

NOTES TO CONSOLIDATED FINANCIAL STATEMENTS- (Continued)

December 31, 2021 and 2020

The below table shows the securities that would be antidilutive or not dilutive to the calculation of earnings per share and unit. Common units of the Operating Partnership not owned by Digital Realty Trust, Inc. were excluded only from the calculation of earnings per share as they are not applicable to the calculation of earnings per unit. All other securities shown below were excluded from the calculation of both earnings per share and earnings per unit.

Year Ended December 31, 


2021


2020


2019

Shares of common stock subject to forward sale agreements

6,250,000

Weighted average of Operating Partnership common units not owned by Digital Realty Trust, Inc.


6,690,521


7,974,005


8,958,932

Potentially dilutive Series C Cumulative Redeemable Perpetual Preferred Stock


541,249


1,489,983


1,695,765

Potentially dilutive Series G Cumulative Redeemable Preferred Stock


1,452,809


2,102,655

Potentially dilutive Series H Cumulative Redeemable Preferred Stock


789,846

Potentially dilutive Series I Cumulative Redeemable Preferred Stock


1,269,035


2,105,116

Potentially dilutive Series J Cumulative Redeemable Preferred Stock


1,318,309


1,475,721


1,679,534

Potentially dilutive Series K Cumulative Redeemable Preferred Stock

1,386,274

1,551,801

1,334,691

Potentially dilutive Series L Cumulative Redeemable Preferred Stock

2,273,803

2,543,639

670,823

Total


18,460,156


17,756,993


19,337,362

13. Income Taxes

Digital Realty Trust, Inc. has elected to be treated and believes that it has been organized and has operated in a manner that has enabled it to qualify as a REIT for federal income tax purposes. As a REIT, Digital Realty Trust, Inc. is generally not subject to corporate level federal income taxes on taxable income distributed currently to its stockholders. Since inception, Digital Realty Trust, Inc. has distributed at least 100% of its taxable income annually. As such, no provision for federal income taxes has been included in the Company’s accompanying consolidated financial statements for the years ended December 31, 2021, 2020 and 2019.

The Operating Partnership is a partnership and is not required to pay federal income tax. Instead, taxable income is allocated to its partners, who include such amounts on their federal income tax returns. As such, no provision for federal income taxes has been included in the Operating Partnership’s accompanying consolidated financial statements.

We have elected taxable REIT subsidiary (“TRS”) status for some of our consolidated subsidiaries. In general, a TRS may provide services that would otherwise be considered impermissible for REITs to provide and may hold assets that REITs cannot hold directly. Income taxes for TRS entities were accrued, as necessary, for the years ended December 31, 2021, 2020 and 2019.

For our TRS entities and foreign subsidiaries that are subject to U.S. federal, state, local and foreign income taxes, deferred tax assets and liabilities are established for temporary differences between the financial reporting basis and the tax basis of assets and liabilities at the enacted tax rates expected to be in effect when the temporary differences reverse. A valuation allowance for deferred tax assets is provided if we believe it is more likely than not that the deferred tax asset may not be realized, based on available evidence at the time the determination is made. An increase or decrease in the valuation allowance that results from the change in circumstances that causes a change in our judgment about the realizability of the related deferred tax asset is included in the income statement. Deferred tax assets (net of valuation allowance) and liabilities for our TRS entities and foreign subsidiaries were accrued, as necessary, for the years ended December 31, 2021, 2020 and 2019. As of December 31, 2021 and 2020, we had deferred tax liabilities net of deferred

127

Table of Contents

Index to Financial Statements

DIGITAL REALTY TRUST, INC. AND SUBSIDIARIES

DIGITAL REALTY TRUST, L.P. AND SUBSIDIARIES

NOTES TO CONSOLIDATED FINANCIAL STATEMENTS- (Continued)

December 31, 2021 and 2020

tax assets of approximately $658.8 million and $737.3 million, respectively, primarily related to our foreign properties, classified in accounts payable and other accrued expenses in the consolidated balance sheet. The majority of our net deferred tax liability relates to differences between foreign tax basis and book basis of the assets acquired in the Interxion Combination in March 2020, the European Portfolio Acquisition in July 2016 and the Sentrum portfolio acquisition in 2012. The valuation allowance against the deferred tax assets at December 31, 2021 and 2020 relate primarily to net operating loss carryforwards that we do not expect to utilize attributable to certain foreign jurisdictions.

Deferred income tax assets and liabilities as of December 31, 2021 and 2020 were as follows (in thousands):


2021


2020

Gross deferred income tax assets:


Net operating loss carryforwards

$

155,152

$

164,294

Basis difference - real estate property


9,078


20,297

Basis difference - intangibles


2,357


2,369

Straight-line rent

8,097

1,121

Other - temporary differences


175,766


60,840

Total gross deferred income tax assets


350,450


248,921

Valuation allowance


(130,893)


(108,060)

Total deferred income tax assets, net of valuation allowance


219,557


140,861

Gross deferred income tax liabilities:


Basis difference - real estate property


798,640


610,499

Basis difference - equity investments

3,543

4,000

Basis difference - intangibles


63,222


246,950

Straight-line rent


10,942


6,884

Other - temporary differences


1,976


9,805

Total gross deferred income tax liabilities


878,323


878,138

Net deferred income tax liabilities

$

658,766

$

737,277

14. Equity and Capital

Equity Distribution Agreement

Digital Realty Trust, Inc. and Digital Realty Trust, L.P., are parties to an at-the-market (ATM) equity offering sales agreement dated January 4, 2019, as amended in 2020 (the “Sales Agreement”). Pursuant to the Sales Agreement, Digital Realty Trust, Inc. can issue and sell common stock having an aggregate offering price of up to $1.0 billion through various named agents from time to time. For the year ended December 31, 2021, Digital Realty Trust, Inc. issued approximately 1.1 million common shares under the Sales Agreement at an average price of $161.92 per share. For the year ended December 31, 2020, Digital Realty Trust, Inc. issued approximately 6.1 million common shares under the Sales Agreement at an average price of $146.89 per share. As of December 31, 2021, approximately $577.6 million remains available for future sales under the program.

Forward Equity Sale

On September 13, 2021, the Parent completed an underwritten public offering of 6,250,000 shares of its common stock, all of which were offered in connection with forward sale agreements it entered into with certain financial institutions

128

Table of Contents

Index to Financial Statements

DIGITAL REALTY TRUST, INC. AND SUBSIDIARIES

DIGITAL REALTY TRUST, L.P. AND SUBSIDIARIES

NOTES TO CONSOLIDATED FINANCIAL STATEMENTS- (Continued)

December 31, 2021 and 2020

acting as forward purchasers. The forward purchasers borrowed and sold an aggregate of 6,250,000 shares of the Parent’s common stock in the public offering. The Parent did not receive any proceeds from the sale of common stock by the forward purchasers in the public offering. The Parent may receive gross proceeds of approximately $1.0 billion (based on the net offering price of $155.69 per share) upon full physical settlement of the forward sale agreements, which is to be no later than March 13, 2023.

Upon physical settlement of the forward sale agreements, the OP is expected to issue general partner common partnership units to the Parent in exchange for contribution of the net proceeds. The forward purchasers had also granted to the underwriters an option, exercisable until October 13, 2021, to purchase up to 937,500 additional shares at a price of $155.69, which represents the initial price to the public less the underwriting discount. The underwriters opted not to exercise their option within the specified time period.

We account for our forward equity sales agreements in accordance with the accounting guidance governing financial instruments and derivatives. As of December 31, 2021, none of our forward equity sales agreements were deemed to be liabilities as they did not embody obligations to repurchase our shares, nor did they embody obligations to issue a variable number of shares for which the monetary value was predominantly fixed, varied with something other than the fair value of our shares, or varied inversely in relation to our shares. We also evaluated whether the agreements met the derivatives and hedging guidance scope exception to be accounted for as equity instruments and concluded that the agreements could be classified as equity contracts based on the following assessment: (i) none of the agreements’ exercise contingencies were based on observable markets or indices besides those related to the market for our own stock price and operations; and (ii) none of the settlement provisions precluded the agreements from being indexed to our own stock.

129

Table of Contents

Index to Financial Statements

DIGITAL REALTY TRUST, INC. AND SUBSIDIARIES

DIGITAL REALTY TRUST, L.P. AND SUBSIDIARIES

NOTES TO CONSOLIDATED FINANCIAL STATEMENTS- (Continued)

December 31, 2021 and 2020

Redeemable Preferred Stock

The Company has issued and outstanding the following series of cumulative redeemable preferred stock, which are governed by the articles supplementary for the applicable series of preferred stock as of December 31, 2021 and 2020.

Total


Liquidation

Annual

Shares Outstanding as of

Balance (in thousands, net of

Date(s)

Initial Date to

Value (in

Dividend

December 31, 

issuance costs) as of December 31, 

Preferred Stock (1)


Issued


Redeem (2)


Share Cap (3)


thousands) (4)


Rate (5)


2021


2020


2021


2020

6.625% Series C Cumulative Redeemable Perpetual Preferred Stock

Sep 14, 2017

May 17, 2021


0.6389035

$

$

1.65625


8,050,000

$

$

219,250

5.250% Series J Cumulative Redeemable Preferred Stock

Aug 7, 2017

Aug 7, 2022


0.4252100


200,000


1.31250


8,000,000


8,000,000


193,540


193,540

5.850% Series K Cumulative Redeemable Preferred Stock

Mar 13, 2019

Mar 13, 2024

0.4361100

210,000

1.46250

8,400,000

8,400,000

203,264

203,264

5.200% Series L Cumulative Redeemable Preferred Stock

Oct 10, 2019

Oct 10, 2024

0.3851800

345,000

1.30000

13,800,000

13,800,000

334,886

334,886

$

755,000


30,200,000


38,250,000

$

731,690

$

950,940

(1)All series of preferred stock do not have a stated maturity date and are not subject to any sinking fund or mandatory redemption provisions. Upon liquidation, dissolution or winding up, each series of preferred stock will rank senior to Digital Realty Trust, Inc. common stock and on parity with the other series of preferred stock. Holders of each series of preferred stock generally have no voting rights except for limited voting rights if Digital Realty Trust, Inc. fails to pay dividends for six or more quarterly periods (whether or not consecutive) and in certain other circumstances.
(2)Except in limited circumstances, reflects earliest date that Digital Realty Trust, Inc. may exercise its option to redeem the preferred stock, at a redemption price of $25.00 per share, plus accrued and unpaid dividends up to but excluding the date of redemption.
(3)Upon the occurrence of specified changes of control, as a result of which neither Digital Realty Trust, Inc.’s common stock nor the common securities of the acquiring or surviving entity (or American Depositary Receipts representing such securities) is listed on the New York Stock Exchange, the NYSE MKT, LLC or the NASDAQ Stock Market or listed or quoted on a successor exchange or quotation system, each holder of preferred stock will have the right (unless, prior to the change of control conversion date specified in the applicable Articles Supplementary governing the preferred stock, Digital Realty Trust, Inc. has provided or provides notice of its election to redeem the preferred stock) to convert some or all of the preferred stock held by it into a number of shares of Digital Realty Trust, Inc.’s common stock per share of preferred stock to be converted equal to the lesser of (i) the quotient obtained by dividing (a) the sum of the $25.00 liquidation preference plus the amount of any accrued and unpaid dividends to, but not including, the change of control conversion date (unless the change of control conversion date is after a record date for a preferred stock dividend payment and prior to the corresponding dividend payment date, in which case no additional amount for such accrued and unpaid dividend will be included in this sum) by (b) the common stock price specified in the applicable Articles Supplementary governing the preferred stock; and (ii) the Share Cap, subject to certain adjustments; subject, in each case, to provisions for the receipt of alternative consideration as described in the applicable Articles Supplementary governing the preferred stock. Except in connection with specified change of control transactions, the preferred stock is not convertible into or exchangeable for any other property or securities of Digital Realty Trust, Inc.
(4)Liquidation preference is $25.00 per share.
(5)Dividends on preferred shares are cumulative and payable quarterly in arrears.

130

Table of Contents

Index to Financial Statements

DIGITAL REALTY TRUST, INC. AND SUBSIDIARIES

DIGITAL REALTY TRUST, L.P. AND SUBSIDIARIES

NOTES TO CONSOLIDATED FINANCIAL STATEMENTS- (Continued)

December 31, 2021 and 2020

Noncontrolling Interests in Operating Partnership

Noncontrolling interests in the Operating Partnership relate to the proportion of entities consolidated by the Company that are owned by third parties. The following table shows the ownership interest in the Operating Partnership as of December 31, 2021 and 2020:

December 31, 2021

December 31, 2020


Number of

Percentage of

Number of

Percentage of


units


total


units


total


Digital Realty Trust, Inc.

284,415,013

98.0

%  

280,289,726

97.2

%

Noncontrolling interests consist of:


Common units held by third parties


4,389,384


1.5

%  

6,212,369


2.2

%

Incentive units held by employees and directors (see Note 16. “Incentive Plan”)


1,542,387


0.5

%  

1,833,898


0.6

%


290,346,784


100.0

%  

288,335,993


100.0

%

Limited partners have the right to require the Operating Partnership to redeem all or a portion of their common units for cash based on the fair market value of an equivalent number of shares of Digital Realty Trust, Inc. common stock at the time of redemption. Alternatively, Digital Realty Trust, Inc. may elect to acquire those common units in exchange for shares of its common stock on a one-for-one basis, subject to adjustment in the event of stock splits, stock dividends, issuance of stock rights, specified extraordinary distributions and similar events. The common units and incentive units of the Operating Partnership are classified within equity, except for certain common units issued to certain former DuPont Fabros Technology, L.P. unitholders in the Company’s acquisition of DuPont Fabros Technology, Inc., which are subject to certain restrictions and, accordingly, are not presented as permanent equity in the consolidated balance sheet.

The redemption value of the noncontrolling Operating Partnership common units and the vested incentive units was approximately $1,074.7 million and $1,078.9 million based on the closing market price of Digital Realty Trust, Inc. common stock on December 31, 2021 and December 31, 2020, respectively.

131

Table of Contents

Index to Financial Statements

DIGITAL REALTY TRUST, INC. AND SUBSIDIARIES

DIGITAL REALTY TRUST, L.P. AND SUBSIDIARIES

NOTES TO CONSOLIDATED FINANCIAL STATEMENTS- (Continued)

December 31, 2021 and 2020

The following table shows activity for the noncontrolling interests in the Operating Partnership for the years ended December 31, 2021, 2020 and 2019:


Common Units


Incentive Units


Total

As of December 31, 2018

8,636,146


1,944,738


10,580,884

Redemption of common units for shares of Digital Realty Trust, Inc. common stock (1)

(1,815,945)

(1,815,945)

Conversion of incentive units held by employees and directors for shares of Digital Realty Trust, Inc. common stock (1)

(338,515)

(338,515)

Incentive units issued upon achievement of market performance condition

319,279

319,279

Grant of incentive units to employees and directors

120,368

120,368

Cancellation / forfeitures of incentive units held by employees and directors

(22,916)

(22,916)

As of December 31, 2019


6,820,201


2,022,954


8,843,155

Redemption of common units for shares of Digital Realty Trust, Inc. common stock (1)

(607,832)

(607,832)

Conversion of incentive units held by employees and directors for shares of Digital Realty Trust, Inc. common stock (1)

(461,912)

(461,912)

Incentive units issued upon achievement of market performance condition

147,570

147,570

Grant of incentive units to employees and directors

128,049

128,049

Cancellation / forfeitures of incentive units held by employees and directors

(2,763)

(2,763)

As of December 31, 2020


6,212,369


1,833,898


8,046,267

Redemption of common units for shares of Digital Realty Trust, Inc. common stock (1)


(1,822,985)


(1,822,985)

Conversion of incentive units held by employees and directors for shares of Digital Realty Trust, Inc. common stock (1)


(679,346)


(679,346)

Incentive units issued upon achievement of market performance condition


238,618


238,618

Grant of incentive units to employees and directors


151,093


151,093

Cancellation / forfeitures of incentive units held by employees and directors


(1,876)


(1,876)

As of December 31, 2021


4,389,384


1,542,387


5,931,771

(1)These redemptions and conversions were recorded as a reduction to noncontrolling interests in the Operating Partnership and an increase to common stock and additional paid in capital based on the book value per unit in the accompanying consolidated balance sheet of Digital Realty Trust, Inc.

132

Table of Contents

Index to Financial Statements

DIGITAL REALTY TRUST, INC. AND SUBSIDIARIES

DIGITAL REALTY TRUST, L.P. AND SUBSIDIARIES

NOTES TO CONSOLIDATED FINANCIAL STATEMENTS- (Continued)

December 31, 2021 and 2020

Dividends and Distributions

Digital Realty Trust, Inc. Dividends

We have declared and paid the following dividends on our common and preferred stock for the years ended December 31, 2021, 2020 and 2019 (in thousands, except per share data):

Series C

Series G

Series H

Series I

Series J

Series K

Series L


Preferred

Preferred

Preferred

Preferred

Preferred

Preferred

Preferred

Common

Date dividend declared


Dividend payment date


Stock


Stock (1)


Stock


Stock


Stock


Stock


Stock

Stock

February 21, 2019

March 29, 2019

$

3,333

$

3,672

$

6,730

$

3,969

$

2,625

$

$

$

224,802

(3)

May 13, 2019

June 28, 2019

3,333

3,672

(1)

3,969

2,625

3,686

(2)

224,895

(3)

August 13, 2019

September 30, 2019

3,333

3,672

3,969

2,625

3,071

225,188

(3)

November 19, 2019

December 31, 2019 for Preferred Stock; January 15, 2020 for Common Stock

3,333

3,672

3,969

2,625

3,071

4,036

(4)

225,488

(3)


$

13,332


$

14,688

$

6,730

$

15,876

$

10,500

$

9,828

$

4,036

$

900,373


February 26, 2020

March 31, 2020

$

3,333

$

3,672

$

$

3,969

$

2,625

$

3,071

$

4,485

$

295,630

(7)

May 12, 2020

June 30, 2020

3,333

3,672

3,969

2,625

3,071

4,485

301,005

(7)

August 11, 2020

September 30, 2020

3,333

3,672

(6)

2,625

3,071

4,485

303,006

(7)

November 10, 2020

December 31, 2020 for Preferred Stock; January 15, 2021 for Common Stock

3,333

(5)

2,625

3,071

4,485

314,280

(7)

$

13,332


$

11,016

$

$

7,938

$

10,500

$

12,284

$

17,940

$

1,213,921

February 25, 2021

March 31, 2021

$

3,333

$

$

$

$

2,625

$

3,071

$

4,485

$

326,965

(9)

May 10, 2021

June 30, 2021

(8)

2,625

3,071

4,485

328,279

(9)

August 10, 2021

September 30, 2021

2,625

3,071

4,485

329,720

(9)

November 17, 2021

December 31, 2021 for Preferred Stock; January 14, 2022 for Common Stock

2,625

3,071

4,485

329,772

(9)

$

3,333

$

$

$

$

10,500

$

12,284

$

17,940

$

1,314,736

Annual rate of dividend per share


$

1.65625


$

1.46875

$

1.84375

$

1.58750

$

1.31250

$

1.46250

$

1.30000

$

4.64000


(1)Redeemed on April 1, 2019 for $25.00 per share, or a redemption price of $25.00 per share, plus accrued and unpaid dividends up to but not including the redemption date. In connection with the redemption, the previously incurred offering costs of approximately $11.8 million were recorded as a reduction to net income available to common stockholders.
(2)Represents a pro rata dividend from and including the original issue date to and including June 30, 2019.
(3)$4.320 annual rate of dividend per share.
(4)Represents a pro rata dividend from and including the original issue date to and including December 31, 2019.
(5)Redeemed on October 15, 2020 for $25.057118 per share, or a redemption price of $25.00 per share, plus accrued and unpaid dividends up to but not including the redemption date. In connection with the redemption, the previously incurred offering costs of approximately $8.2 million were recorded as a reduction to net income available to common stockholders.
(6)Redeemed on September 8, 2020 for $25.29545 per share, or a redemption price of $25.00 per share, plus accrued and unpaid dividends up to but not including the redemption date. In connection with the redemption, the previously incurred offering costs of approximately $8.0 million were recorded as a reduction to net income available to common stockholders.
(7)$4.480 annual rate of dividend per share.
(8)Redeemed on May 17, 2021 for $ 25.211632 per share, or a redemption price of $25.00 per share, plus accrued and unpaid dividends up to but not including the redemption date. The transaction resulted in a gain on redemption of $18.0 million, measured as the difference between the cash consideration paid upon redemption, which was $201.3 million and the carrying value of the preferred stock at the time of the redemption, which was $219.3 million. This

133

Table of Contents

Index to Financial Statements

DIGITAL REALTY TRUST, INC. AND SUBSIDIARIES

DIGITAL REALTY TRUST, L.P. AND SUBSIDIARIES

NOTES TO CONSOLIDATED FINANCIAL STATEMENTS- (Continued)

December 31, 2021 and 2020

amount is reflected as gain on redemption of preferred stock which increased net income available to common stockholders.
(9)$4.640 annual rate of dividend per share.

Digital Realty Trust, L.P. Distributions

All distributions on the Operating Partnership’s units are at the discretion of Digital Realty Trust, Inc.’s Board of Directors. The table below shows the distributions declared and paid by the Operating Partnership on its common and preferred units for the years ended December 31, 2021, 2020 and 2019 (in thousands, except for per unit data):

Series C

Series G

Series H

Series I

Series J

Series K

Series L

Preferred

Preferred

Preferred

Preferred

Preferred

Preferred

Preferred

Common

Date distribution declared


Distribution payment date


Units


Units (1)


Units


Units


Units


Units

Units

Units

February 21, 2019

March 29, 2019

$

3,333

$

3,672

$

6,730

$

3,969

$

2,625

$

$

$

235,256

(3)

May 13, 2019

June 28, 2019


3,333


3,672


(1)


3,969


2,625


3,686

(2)


235,142

(3)

August 13, 2019

September 30, 2019


3,333


3,672


3,969


2,625


3,071


235,164

(3)

November 19, 2019

December 31, 2019 for Preferred Units; January 15, 2020 for Common Units


3,333


3,672


3,969


2,625


3,071


4,036

(4)


235,154

(3)

$

13,332

$

14,688

$

6,730

$

15,876

$

10,500

$

9,828

$

4,036

$

940,716

February 26, 2020

March 31, 2020

$

3,333

$

3,672

$

$

3,969

$

2,625

$

3,071

$

4,485

$

305,267

(7)

May 12, 2020

June 30, 2020


3,333


3,672


3,969


2,625


3,071


4,485


310,421

(7)

August 11, 2020

September 30, 2020


3,333


3,672


(6)


2,625


3,071


4,485


312,262

(7)

November 10, 2020

December 31, 2020 for Preferred Units; January 15, 2021 for Common Units

3,333

(5)

2,625

3,071

4,485

323,453

(7)

$

13,332

$

11,016

$

$

7,938

$

10,500

$

12,284

$

17,940

$

1,251,403

February 25, 2021

March 31, 2021

$

3,333

$

$

$

$

2,625

$

3,071

$

4,485

$

336,041

(9)

May 10, 2021

June 30, 2021


(8)


2,625


3,071


4,485


336,543

(9)

August 10, 2021

September 30, 2021


2,625


3,071


4,485


337,447

(9)

November 17, 2021

December 31, 2021 for Preferred Units; January 14, 2022 for Common Units

2,625

3,071

4,485

337,476

(9)

$

3,333

$

$

$

$

10,500

$

12,284

$

17,940

$

1,347,507

Annual rate of distribution per unit

$

1.65625

$

1.46875

$

1.84375

$

1.58750

$

1.31250

$

1.46250

$

1.30000

$

4.64000

(1)Redeemed on April 1, 2019 for $25.00 per unit, or a redemption price of $25.00 per unit, plus accrued and unpaid distributions up to but not including the redemption date. In connection with the redemption, the previously incurred offering costs of approximately $11.8 million were recorded as a reduction to net income available to common unitholders.
(2)Represents a pro rata distribution from and including the original issue date to and including June 30, 2019.
(3)$4.320 annual rate of distribution per unit.
(4)Represents a pro rata distribution from and including the original issue date to and including December 31, 2019.
(5)Redeemed on October 15, 2020 for $25.057118 per unit, or a redemption price of $25.00 per unit, plus accrued and unpaid distributions up to but not including the redemption date. In connection with the redemption, the previously incurred offering costs of approximately $8.2 million were recorded as a reduction to net income available to common unitholders.
(6)Redeemed on September 8, 2020 for $25.29545 per unit, or a redemption price of $25.00 per unit, plus accrued and unpaid distributions up to but not including the redemption date. In connection with the redemption, the previously incurred offering costs of approximately $8.0 million were recorded as a reduction to net income available to common unitholders.

134

Table of Contents

Index to Financial Statements

DIGITAL REALTY TRUST, INC. AND SUBSIDIARIES

DIGITAL REALTY TRUST, L.P. AND SUBSIDIARIES

NOTES TO CONSOLIDATED FINANCIAL STATEMENTS- (Continued)

December 31, 2021 and 2020

(7)$4.480 annual rate of distribution per unit.
(8)Redeemed on May 17, 2021 for $ 25.211632 per unit, or a redemption price of $25.00 per unit, plus accrued and unpaid distributions up to but not including the redemption date. The transaction resulted in a gain on redemption of $18.0 million, measured as the difference between the cash consideration paid upon redemption, which was $201.3 million and the carrying value of the preferred stock at the time of the redemption, which was $219.3 million. This amount is reflected as gain on redemption of preferred stock which increased net income available to common unitholders.
(9)$4.640 annual rate of distribution per unit.

Distributions out of Digital Realty Trust, Inc.’s current or accumulated earnings and profits are generally classified as dividends whereas distributions in excess of its current and accumulated earnings and profits, to the extent of a stockholder’s U.S. federal income tax basis in Digital Realty Trust, Inc.’s stock, are generally classified as a return of capital. Distributions in excess of a stockholder’s U.S. federal income tax basis in Digital Realty Trust, Inc.’s stock are generally characterized as capital gain. Cash provided by operating activities has generally been sufficient to fund all distributions, however, in the future we may also need to utilize borrowings under the global revolving credit facility to fund all or a portion of distributions.

15. Accumulated Other Comprehensive Income (Loss), Net

The accumulated balances for each item within accumulated other comprehensive income (loss) are shown below (in thousands) for Digital Realty Trust, Inc. and separately for Digital Realty Trust, L.P:

Digital Realty Trust, Inc.

Foreign currency

Cash flow

Foreign currency net

Accumulated other

translation

hedge

investment hedge

comprehensive


adjustments


adjustments


adjustments


income (loss), net

Balance as of December 31, 2019

$

(114,947)

$

1,287

$

25,738

$

(87,922)

Net current period change


213,707

(11,980)

13,142

214,869

Reclassification to interest expense from interest rate swaps


8,063

8,063

Balance as of December 31, 2020

$

98,760

$

(2,630)

$

38,880

$

135,010

Net current period change


(311,413)


1,250


(310,163)

Reclassification to interest expense from interest rate swaps


1,273


1,273

Balance as of December 31, 2021

$

(212,653)

$

(107)

$

38,880

$

(173,880)

135

Table of Contents

Index to Financial Statements

DIGITAL REALTY TRUST, INC. AND SUBSIDIARIES

DIGITAL REALTY TRUST, L.P. AND SUBSIDIARIES

NOTES TO CONSOLIDATED FINANCIAL STATEMENTS- (Continued)

December 31, 2021 and 2020

Digital Realty Trust, L.P.

Foreign currency

Foreign currency net

Accumulated other

translation

Cash flow hedge

investment hedge

comprehensive


adjustments


adjustments


adjustments


income (loss)

Balance as of December 31, 2019

$

(117,869)

$

308

$

26,152

$

(91,409)

Net current period change


216,815


(12,425)


13,525


217,915

Reclassification to interest expense from interest rate swaps


8,294


8,294

Balance as of December 31, 2020

$

98,946

$

(3,823)

$

39,677

$

134,800

Net current period change


(318,828)


1,279


(317,549)

Reclassification to interest expense from interest rate swaps


1,304


1,304

Balance as of December 31, 2021

$

(219,882)

$

(1,240)

$

39,677

$

(181,445)

16. Incentive Plans

2014 Incentive Award Plan

The Company provides incentive awards in the form of common stock or awards convertible into common stock pursuant to the Digital Realty Trust, Inc., Digital Services, Inc. and Digital Realty Trust, L.P. 2014 Incentive Award Plan, as amended (the “Incentive Plan”). The Incentive Plan allows for the issuance of a variety of awards. The major categories of awards that can be issued under the Incentive Plan include:

Long-Term Incentive Units (“LTIP Units”): LTIP Units, in the form of profits interest units of the Operating Partnership, may be issued to eligible participants for the performance of services to or for the benefit of the Operating Partnership. LTIP Units (other than Class D units), whether vested or not, receive the same quarterly per-unit distributions as Operating Partnership common units. Initially, LTIP Units do not have full parity with common units with respect to liquidating distributions. However, if such parity is reached, vested LTIP Units may be converted into an equal number of common units of the Operating Partnership at any time. The awards generally vest over periods between two and four years.

Service-Based Restricted Stock Units: Service-based Restricted Stock Units, which vest over periods between two and four years, convert to shares of Digital Realty Trust, Inc.’s common stock upon vesting.

136

Table of Contents

Index to Financial Statements

DIGITAL REALTY TRUST, INC. AND SUBSIDIARIES

DIGITAL REALTY TRUST, L.P. AND SUBSIDIARIES

NOTES TO CONSOLIDATED FINANCIAL STATEMENTS- (Continued)

December 31, 2021 and 2020

Market Performance-Based Awards (“the Performance Awards”): Market performance-based Class D units of the Operating Partnership and market performance-based Restricted Stock Units covering shares of Digital Realty Trust, Inc.’s common stock are eligible to be issued to officers and employees of the Company. The Performance Awards include market performance-based and time-based vesting criteria. The market performance-based criteria is the basis for determining the total number of units that qualify to be awarded (subject to time-based vesting). The market performance criterion compares the Company’s total shareholder return (“TSR”) relative to the MSCI US REIT Index (“RMS”) over a three-year period in order to determine the percentage of the total eligible pool of units that qualifies to be awarded. The awards then have a time-based vesting element that allows for 50% of the qualifying awards to vest in that same 3rd year and 50% of the qualifying awards in the subsequent year.

Vesting with respect to the market condition is measured based on the difference between Digital Realty Trust, Inc.’s TSR percentage and the TSR percentage of the RMS as is shown in the subsequent table.

Market


2019

2020 and 2021


Performance

RMS Relative

RMS Relative


Vesting

Level


Market Performance

Market Performance


Percentage

Below Threshold Level


≤ -300 basis points

≤ -500 basis points


0

%

Threshold Level


-300 basis points

-500 basis points


25

%

Target Level


100 basis points

0 basis points


50

%

High Level


500 basis points

500 basis points


100

%

137

Table of Contents

Index to Financial Statements

DIGITAL REALTY TRUST, INC. AND SUBSIDIARIES

DIGITAL REALTY TRUST, L.P. AND SUBSIDIARIES

NOTES TO CONSOLIDATED FINANCIAL STATEMENTS- (Continued)

December 31, 2021 and 2020

If the RMS Relative Market Performance falls between the levels specified in the prior table, the percentage of the award that will vest with respect to the market condition will be determined using straight-line linear interpolation between such levels.

Following the completion of the applicable Market Performance Period, the Compensation Committee made the following determinations regarding the vesting of these awards.

2019 Awards

In January 2022, the RMS Relative Market Performance fell between the target and high level for the 2019 awards and accordingly, 239,436 Class D units and 70,721 Restricted Stock Units qualified for time-based vesting.
The Class D units included 18,966 distribution equivalent units that immediately vested on December 31, 2021.
On February 27, 2022, 50% of the 2019 awards will vest and the remaining 50% will vest on February 27, 2023, subject to continued employment through the applicable vesting date.

2018 Awards

In January 2021, the high level of the performance metric was determined to have been achieved and, accordingly, 240,377 Class D units and 63,498 Restricted Stock Units qualified for time-based vesting.
The Class D units included 20,725 distribution equivalent units that immediately vested on December 31, 2020.
On February 27, 2021, 50% of the 2018 awards vested and the remaining 50% will vest on February 27, 2022, subject to continued employment through the applicable vesting date.

2017 Awards

In January 2020, the RMS Relative Market Performance fell between the target and high level for the 2017 awards and, accordingly, 137,816 Class D units and 29,141 Restricted Stock Units qualified for time-based vesting.
The Class D units included 10,971 distribution equivalent units that immediately vested on December 31, 2019.
On February 27, 2020, 50% of the 2017 awards vested and the remaining 50% vested on February 27, 2021.

138

Table of Contents

Index to Financial Statements

DIGITAL REALTY TRUST, INC. AND SUBSIDIARIES

DIGITAL REALTY TRUST, L.P. AND SUBSIDIARIES

NOTES TO CONSOLIDATED FINANCIAL STATEMENTS- (Continued)

December 31, 2021 and 2020

Fair Value of Market Performance-Based Awards

The fair values of the Performance Awards granted were measured using a Monte Carlo simulation to estimate the probability of the market vesting condition being satisfied. The Monte Carlo simulation is a probabilistic technique based on the underlying theory of the Black-Scholes formula, which was run for 100,000 trials to determine the fair value of the awards. For each trial, the payoff to an award is calculated at the settlement date and is then discounted to the grant date at a risk-free interest rate. The total expected value of the awards on the grant date was determined by multiplying the average value per award over all trials by the number of awards granted. Assumptions used in the valuations are summarized as follows:


Expected Stock Price


Risk-Free Interest

Award Date


Volatility


Rate

January 1, 2019

23

%  

2.44

%

February 21, 2019

23

%  

2.48

%

February 19, 2020

22

%  

1.39

%

February 20, 2020

22

%  

1.35

%

January 1, 2021

27

%  

0.17

%

February 25, 2021

26

%  

0.31

%

The expected stock price volatility assumption is calculated based on our historical volatility, which is calculated over a period of time commensurate with the expected term of the awards being valued. The expected dividend yield assumption used in the Monte Carlo simulation represents the percent of return to a stock that is available to the holder of an award. Because the holders of the awards receive dividend equivalents, an expected dividend yield assumption of 0.00% was used in the valuation. These valuations were performed in a risk-neutral framework, and no assumption was made with respect to an equity risk premium.

The grant date fair value of the Class D unit and RSU awards was approximately $25.0 million, $17.2 million and $22.3 million for the years ended years ended December 31, 2021, 2020 and 2019, respectively. We will recognize compensation expense on a straight-line basis over the expected service period of approximately four years.

The aggregate intrinsic value of the Class D unit and RSU awards that vested in 2021, 2020 and 2019 was $28.6 million, $24.3 million and $32.7 million, respectively.

Other Items: In addition to the LTIP Units, service-based Restricted Stock Units and Performance Awards described above, one-time grants of time and/or performance-based Class D units and Restricted Stock Units were issued in connection with the Interxion Combination. These awards vest over a period of two and three years based on continued service and/or the attainment of performance metrics related to successful integration of the Interxion business.

As of December 31, 2021, approximately 5.6 million shares of common stock, including awards that can be converted to or exchanged for shares of common stock, remained available for future issuance under the Incentive Plan.

Each LTIP unit and each Class D unit issued under the Incentive Plan counts as one share of common stock for purposes of calculating the limit on shares that may be issued under the Incentive Plan and the individual award limits set forth therein.

139

Table of Contents

Index to Financial Statements

DIGITAL REALTY TRUST, INC. AND SUBSIDIARIES

DIGITAL REALTY TRUST, L.P. AND SUBSIDIARIES

NOTES TO CONSOLIDATED FINANCIAL STATEMENTS- (Continued)

December 31, 2021 and 2020

Below is a summary of compensation expense and unearned compensation (in millions):

Expected


period to

Deferred Compensation


Unearned Compensation


recognize

Expensed

Capitalized

As of

As of


unearned


Year Ended December 31, 

Year Ended December 31, 

December 31, 

December 31, 


compensation

Type of incentive award


2021


2020


2019


2021


2020


2019


2021


2020


(in years)

Long-term incentive units

$

15.4

$

12.8

$

8.7

$

0.2

$

0.2

$

0.2

$

19.8

$

15.1


2.5

Performance-based awards


23.9


24.8


13.0


0.7


0.6


0.8


39.2


34.4


1.1

Service-based restricted stock units


23.2


15.1


11.5


3.3


3.2


2.8


44.5


41.5


2.4

Interxion awards

17.7

19.7

8.5

27.2

1.8

The following table sets forth the weighted-average fair value of for each type of incentive award at the date of grant for the years ended December 31, 2021, 2020 and 2019:


Weighted Average Fair Value at Date of Grant

Type of incentive award


2021


2020


2019

Long-term incentive units

$

132.66

$

134.55

$

116.22

Performance-based awards

137.69

159.34

114.97

Restricted stock

129.52

138.82

115.25

Interxion awards

120.67

Activity for LTIP Units and service-based Restricted Stock Units for the year ended December 31, 2021 is shown below.


Weighted-Average

Weighted-Average

Aggregate


Grant Date Fair

Remaining Contractual

Intrinsic Value

Unvested Long-term Incentive Units

Units


Value

Life (Years)

(in thousands)

Unvested, beginning of period


235,535

$

122.22

Granted


151,093


139.08

Vested


(134,284)


121.63

Cancelled or expired


(1,876)


128.38

Unvested, end of period


250,468

$

132.66

1.97

$

44,300

(1)The intrinsic value is calculated based on the market value of our common stock as of December 31, 2021.

The grant date fair values, which equal the market price of Digital Realty Trust, Inc. common stock on the applicable grant date(s), are being expensed on a straight-line basis for service awards between two and four years, the current vesting periods of the long-term incentive units.

The aggregate intrinsic value of long-term incentive units that vested in 2021, 2020 and 2019 was $17.5 million, $11.6 million and $5.7 million, respectively. As of December 31, 2021, we had approximately 0.9 million long-term incentive units that were outstanding and exercisable with an aggregate intrinsic value of approximately $159.4 million (based on the market price of our common stock as of December 31, 2021).

140

Table of Contents

Index to Financial Statements

DIGITAL REALTY TRUST, INC. AND SUBSIDIARIES

DIGITAL REALTY TRUST, L.P. AND SUBSIDIARIES

NOTES TO CONSOLIDATED FINANCIAL STATEMENTS- (Continued)

December 31, 2021 and 2020

Weighted-Average

Weighted-Average

Aggregate


Grant Date Fair

Remaining Contractual

Intrinsic Value (1)

Unvested Restricted Stock


Shares


Value

Life (Years)

(in thousands)

Unvested, beginning of period


783,219

$

123.04

Granted


265,576


137.30

Vested


(475,702)


123.17

Cancelled or expired


(63,724)


129.62

Unvested, end of period


509,369

$

129.52

2.20

$

90,092

(1)The intrinsic value is calculated based on the market value of our common stock as of December 31, 2021.

The grant date fair values, which equal the market price of Digital Realty Trust, Inc. common stock on the grant date, are expensed on a straight-line basis for service awards over the vesting period of the restricted stock, which is generally four years.

The aggregate intrinsic value of restricted stock that vested in 2021, 2020 and 2019 was $59.0 million, $53.4 million and $14.0 million, respectively.

Interxion Equity Plans

On March 9, 2020, in connection with the Interxion Combination, certain outstanding awards granted under various Interxion equity plans were assumed by Digital Realty Trust, Inc. and converted into adjusted equity-based awards of Digital Realty Trust, Inc. common stock in accordance with the terms of the Purchase Agreement for the Interxion Combination. All such awards will continue to be governed by the terms of the applicable Interxion equity plan and underlying award agreement evidencing the award. Approximately 0.6 million shares of Digital Realty Trust, Inc. common stock are registered and issuable pursuant to such awards. The impact of these plans is included in the tables above.

Defined Contribution Plans

We have a 401(k) plan whereby our U.S. employees may contribute a portion of their compensation to their respective retirement accounts, in an amount not to exceed the maximum allowed under the Code. The 401(k) plan complies with Internal Revenue Service requirements as a 401(k) safe harbor plan whereby matching contributions made by us are 100% vested. The aggregate cost of our contributions to the 401(k) plan was approximately $5.9 million, $5.5 million, and $5.2 million for the years ended December 31, 2021, 2020 and 2019, respectively. In addition, Interxion has a defined contribution pension plan for most of its employees. Contributions are made in accordance with the terms of such defined contribution pension plan and are expensed as incurred.

141

Table of Contents

Index to Financial Statements

DIGITAL REALTY TRUST, INC. AND SUBSIDIARIES

DIGITAL REALTY TRUST, L.P. AND SUBSIDIARIES

NOTES TO CONSOLIDATED FINANCIAL STATEMENTS- (Continued)

December 31, 2021 and 2020

17. Derivative Instruments

We had no outstanding interest rate derivatives that were designated as cash flow hedges of interest rate risk as of December 31, 2021. The table below shows outstanding amounts as of December 31, 2020 (in thousands):

Notional Amount

Fair Value at Significant Other

As of

As of

December 31, 

Type of

Strike

Effective

Expiration

December 31, 

2020


Derivative


Rate


Date


Date


2020 (3)

$

104,000

(1)

Swap


1.435

Jan 15, 2016

Jan 15, 2023

$

(2,773)


77,352

(2)

Swap


0.779

Jan 15, 2016

Jan 15, 2021


(9)

$

181,352

$

(2,782)

(1)Represents debt which bears interest based on one-month U.S. LIBOR.
(2)Represents debt which bears interest based on one-month CDOR. Translation to U.S. dollars is based on exchange rates of $0.79 to 1.00 CAD as of  December 31, 2021 and $0.79 to 1.00 CAD as of December 31, 2020.
(3)Balance recorded in other assets in the consolidated balance sheets if positive and recorded in accounts payable and other accrued liabilities in the consolidated balance sheets if negative.

On December 13, 2021, in connection with the paydown of our secured note due March 2023, we terminated interest rate swap agreements with notional amounts in the aggregate of $104.0 million and, as a result of the termination, the accumulated fair value of the interest rate swap will be ratably reclassified from accumulated other comprehensive income to interest expense on the accompanying consolidated income statement over the original term of the interest rate swap. On September 24, 2020, in connection with the paydown of our Term Loan maturing in 2023, we terminated interest rate swap agreements with notional amounts in the aggregate of $300.0 million, as a result of the termination, the accumulated fair value of the interest rate swap was reclassified from accumulated other comprehensive income to interest expense on the accompanying consolidated income statement, which resulted in a realized loss of approximately $6.4 million for the year ended December 31, 2020.

Amounts reported in accumulated other comprehensive loss related to interest rate swaps are reclassified to interest expense as interest payments are made on our debt. As of December 31, 2021, we had no interest rate swap agreements outstanding.

Credit-risk related contingent features – Upon entering into derivatives, we would have agreements with each of our derivative counterparties that contain a provision where we could be declared in default on our derivative obligations if repayment of the underlying indebtedness is accelerated by the lender due to our default on the indebtedness. As of December 31, 2021, we did not have any derivatives outstanding.

142

Table of Contents

Index to Financial Statements

DIGITAL REALTY TRUST, INC. AND SUBSIDIARIES

DIGITAL REALTY TRUST, L.P. AND SUBSIDIARIES

NOTES TO CONSOLIDATED FINANCIAL STATEMENTS- (Continued)

December 31, 2021 and 2020

18. Fair Value of Financial Instruments

We disclose fair value information for all financial instruments, whether or not recognized in the consolidated balance sheets, for which it is practicable to estimate fair value. Considerable judgment is necessary to interpret market data in order to estimate the fair value of financial instruments. The use of different market assumptions or estimation methods may have a material effect on the estimated fair value amounts.

The carrying amounts for cash and cash equivalents, restricted cash, accounts and other receivables, accounts payable and other accrued liabilities, accrued dividends and distributions, security deposits and prepaid rents approximate fair value because of the short-term nature of these instruments. The carrying value of our global revolving credit facilities and unsecured term loans approximates estimated fair value, because these liabilities have variable interest rates and our credit ratings have remained stable. Differences between the carrying value and fair value of our unsecured senior notes and secured and other debt are caused by differences in interest rates or borrowing spreads that were available to us on December 31, 2021 and 2020 as compared to those in effect when the debt was issued or assumed. As described in Note 16. "Derivative Instruments", outstanding derivative contracts are recorded at fair value.

We calculate the fair value of our secured and other debt, unsecured term loans and unsecured senior notes based on currently available market rates assuming the loans are outstanding through maturity and considering the collateral and other loan terms. In determining the current market rate for fixed rate debt, a market spread is added to the quoted yields on federal government treasury securities with similar maturity dates to our debt.

The aggregate estimated fair value and carrying value of our global revolving credit facilities, unsecured term loans, unsecured senior notes and secured debt as of the respective periods is shown below (in thousands):

Categorization

As of December 31, 2021

As of December 31, 2020

under the fair value

Estimated Fair

Estimated Fair


hierarchy


Value


Carrying Value


Value


Carrying Value

Global revolving credit facilities


Level 2

$

415,116

$

415,116

$

540,184

$

540,184

Unsecured term loans


Level 2


537,470


537,470

Unsecured senior notes (1)


Level 2


13,580,262


13,000,042


13,359,960


12,096,029

Secured and other debt (1)


Level 2


152,511


147,082


242,051


239,326

$

14,147,889

$

13,562,240

$

14,679,665

$

13,413,009

(1)Valuations for our unsecured senior notes and secured debt are determined based on the expected future payments discounted at risk-adjusted rates and quoted market prices.

143

Table of Contents

Index to Financial Statements

DIGITAL REALTY TRUST, INC. AND SUBSIDIARIES

DIGITAL REALTY TRUST, L.P. AND SUBSIDIARIES

NOTES TO CONSOLIDATED FINANCIAL STATEMENTS- (Continued)

December 31, 2021 and 2020

19. Commitments and Contingencies

Construction Commitments Our properties require periodic investments of capital for tenant-related capital

expenditures and for general capital improvements and from time to time in the normal course of our business, we

enter into various construction contracts with third parties that may obligate us to make payments. At

December 31, 2021, we had open commitments, including amounts reimbursable of approximately $37.8

million, related to construction contracts of approximately $1.3 billion.

Legal Proceedings Although the Company is involved in legal proceedings arising in the ordinary course of business, as of December 31, 2021, the Company is not currently a party to any legal proceedings nor, to its knowledge, is any legal proceeding threatened against it that it believes would have a material adverse effect on its financial position, results of operations or liquidity.

20. Supplemental Cash Flow Information

Cash, cash equivalents, and restricted cash balances as of December 31, 2021, 2020, and 2019:

Balance as of

(Amounts in thousands)


December 31, 2021


December 31, 2020

December 31, 2019

Cash and cash equivalents

$

142,698

$

108,501

$

89,817

Restricted cash (included in other assets)


8,787


15,151


7,436

Total

$

151,485

$

123,652

$

97,253

We paid $274.7 million, $301.9 million and $312.8 million for interest, net of amounts capitalized, for the year ended December 31, 2021, 2020 and 2019, respectively. During the years ended December 31, 2021, 2020 and 2019, we capitalized interest of approximately $53.5 million, $47.3 million and $40.2 million, respectively. During the years ended December 31, 2021, 2020 and 2019, we capitalized amounts relating to compensation and other overhead expense of employees direct and incremental to construction activities of approximately $71.2 million, $53.7 million and $46.5 million, respectively.

We paid $29.9 million, $20.1 million and $14.6 million for income taxes, net of refunds, for the year ended December 31, 2021, 2020 and 2019, respectively.

Accrued construction related costs totaled $423.9 million, $358.7 million and $197.7 million as of December 31, 2021, 2020 and 2019, respectively.

21. Segment and Geographic Information

A majority of the Company’s largest customers are global entities that transact with the Company across multiple geographies worldwide. In order to better address the needs of these global customers, the Company manages critical decisions around development, operations, and leasing globally based on customer demand considerations. In this regard, the Company manages customer relationships on a global basis in order to achieve consistent sales and delivery experience of our products for our customers throughout the global portfolio. In order to best accommodate the needs of global customers (and customers that might one day become global), the Company manages its operations as a single global business – with one operating segment and therefore one reporting segment.

144

Table of Contents

Index to Financial Statements

DIGITAL REALTY TRUST, INC. AND SUBSIDIARIES

DIGITAL REALTY TRUST, L.P. AND SUBSIDIARIES

NOTES TO CONSOLIDATED FINANCIAL STATEMENTS- (Continued)

December 31, 2021 and 2020

Operating Revenues

Investments in Real Estate

Year Ended December 31,

As of December 31,

(Amounts in billions)

2021

2020

2019

2021

2020

Inside the United States

$

2.8

$

2.6

$

2.6

$

11.2

$

11.3

Outside the United States

1.7

1.3

0.6

9.6

9.3

Revenue Outside of US %

37.5

%

33.3

%

19.5

%

Net Assets in Foreign Operations

$

3.9

$

5.7

22. Subsequent Events

On January 18, 2022, Digital Intrepid Holding B.V., an indirect wholly owned holding and finance subsidiary of the Operating Partnership through which the Interxion business is held, issued and sold €750.0 million aggregate principal amount of 1.375% Guaranteed Notes due 2032 (the “2032 Notes”). The 2032 Notes are senior unsecured obligations of Digital Intrepid Holding B.V. and are fully and unconditionally guaranteed by Digital Realty Trust, Inc. and the Operating Partnership. Net proceeds from the offering were approximately €737.5 million (approximately $835.3 million based on the exchange rate on January 18, 2022) after deducting managers’ discounts and estimated offering expenses.

On February 3, 2022 (the “Redemption Date”), the Operating Partnership redeemed the $450.0 million aggregate principal amount outstanding of its 4.750% Notes due 2025 (the “4.750% Notes”). The redemption price for the 4.750% Notes was equal to the sum of (a) $1,110.36 per $1,000 principal amount of the 4.750% Notes, or 111.036% of the aggregate principal amount of the 4.750% Notes, plus (b) accrued and unpaid interest to, but excluding, the Redemption Date equal to $16.097222 per $1,000 principal amount of the 4.750% Notes. The redemption will result in an early extinguishment charge of approximately $51.1 million during the three months ended March 31, 2022.

145

Table of Contents

Index to Financial Statements

DIGITAL REALTY TRUST, INC.

DIGITAL REALTY TRUST, L.P.

SCHEDULE III

PROPERTIES AND ACCUMULATED DEPRECIATION

December 31, 2021

(In thousands)


Costs capitalized 

Initial costs

subsequent to acquisition

Total costs

Accumulated

Date of

Acquired

Acquired

depreciation

acquisition

Data Center

ground

Buildings and

Carrying

ground

Buildings and

and

or


Buildings


Encumbrances


Land


lease


improvements


Improvements


costs


Land


lease


improvements


Total


amortization


construction

North American Markets

Northern Virginia

22

167,482

1,505,807

2,425,628

169,594

3,929,324

4,098,917

(1,054,422)

2005 - 2019

Chicago

10

95,444

1,320,334

978,734

105,830

2,288,682

2,394,512

(713,781)

2005 - 2017

Dallas

21

66,489

338,284

1,029,363

58,900

1,375,236

1,434,136

(593,222)

2002 - 2015

Silicon Valley

15

129,702

842,693

460,102

128,467

1,304,030

1,432,497

(472,565)

2002 - 2018

New York

13

17,301

474,561

869,968

17,042

1,344,788

1,361,830

(642,992)

2002 - 2015

Phoenix

2

11,859

399,122

364,640

11,859

763,762

775,621

(358,072)

2006 - 2015

San Francisco

4

41,165

358,066

294,954

41,478

652,707

694,185

(248,208)

2004 - 2015

Seattle

1

135,000

43,110

329,283

11,518

43,110

340,801

383,911

(23,736)

2020

Toronto

2

26,600

116,863

234,412

21,059

356,816

377,875

(26,836)

2013 - 2017

Boston

3

17,826

253,711

97,041

16,600

351,977

368,578

(153,349)

2006 - 2011

Portland

2

1,689

3,131

360,909

6,058

359,671

365,729

(51,916)

2011 - 2015

Atlanta

4

6,537

264,948

72,563

6,552

337,495

344,048

(97,069)

2011 - 2017

Los Angeles

2

29,531

105,910

119,398

28,139

226,700

254,839

(122,663)

2004 - 2015

Houston

6

6,965

23,492

149,517

6,594

173,380

179,974

(101,507)

2006

Austin

1

1,177

4,877

71,557

1,177

76,433

77,611

(22,769)

2005

Miami

2

2,964

29,793

37,061

2,964

66,854

69,818

(31,421)

2002 - 2015

Minneapolis

1

10,190

20,054

3,191

10,190

23,245

33,435

(6,840)

2013

Charlotte

3

4,117

13,068

14,090

4,118

27,157

31,275

(16,140)

2005 - 2015

North America - Other

106,447

106,447

106,447

(30,821)

Total North America

114

135,000

680,148

6,403,997

7,701,094

679,732

14,105,506

14,785,239

(4,768,329)

EMEA Markets

London

16

101,397

7,355

1,423,194

494,928

55,252

6,627

1,964,995

2,026,874

(574,017)

2007 - 2020

Amsterdam

13

40,709

968,935

167,171

37,470

1,139,345

1,176,815

(142,010)

2005 - 2020

Frankfurt

27

31,260

876,342

758,004

84,739

1,580,867

1,665,606

(137,960)

2015 - 2020

Dublin

8

11,722

1,444

89,597

245,952

7,797

94

340,823

348,715

(107,260)

2006 - 2020

Paris

10

45,722

355,386

273,431

51,178

623,362

674,540

(34,628)

2012 - 2020

Marseille

4

1,121

220,737

184,558

1,113

405,303

406,417

(29,615)

2020

Vienna

2

14,159

364,949

(8,304)

13,497

357,306

370,803

(34,337)

2020

Zurich

3

20,605

48,325

164,248

21,638

211,540

233,178

(13,047)

2020

Stockholm

6

93,861

46,861

140,721

140,721

(13,305)

2020

Madrid

4

8,456

134,817

(1,281)

7,493

134,499

141,992

(12,277)

2020

Copenhagen

3

11,665

107,529

(45,398)

1,506

72,290

73,796

(8,567)

2020

Brussels

4

3,874

118,034

2,148

3,693

120,363

124,056

(10,410)

2020

146

Table of Contents

Index to Financial Statements

DIGITAL REALTY TRUST, INC.

DIGITAL REALTY TRUST, L.P.

SCHEDULE III

PROPERTIES AND ACCUMULATED DEPRECIATION- (Continued)

December 31, 2021

(In thousands)

Dusseldorf

3

30,093

19,186

49,279

49,279

(4,088)

2020

Europe - Other

4

3,144

43,046

213,663

35,912

223,941

263,317

(18,079)

2020

Africa - Other

4

14,884

3,464

11,421

11,421

(791)

2020

Total EMEA

111

293,834

8,799

4,874,844

2,530,051

324,752

6,721

7,376,055

7,707,528

(1,140,393)

APAC Markets

Singapore

3

137,545

670,836

808,381

808,381

(218,953)

2010 - 2015

Sydney

4

18,285

3,868

117,478

12,056

127,575

139,631

(34,263)

2011 - 2012

Melbourne

2

4,467

107,597

3,183

108,881

112,064

(44,093)

2011

Hong Kong

1

56,822

56,822

56,822

(1)

2021

Asia Pacific - Other

2

15,785

15,785

15,785

(4,250)

Total APAC

12

22,752

141,413

968,518

15,239

1,117,445

1,132,683

(301,559)

Total Portfolio


237


135,000


996,734


8,799


11,420,254


11,199,663


1,019,723


6,721


22,599,006


23,625,450


(6,210,281)


147

Table of Contents

Index to Financial Statements

DIGITAL REALTY TRUST, INC.

DIGITAL REALTY TRUST, L.P.

SCHEDULE III

PROPERTIES AND ACCUMULATED DEPRECIATION

December 31, 2021

(In thousands)

(1) Tax Cost

The aggregate gross cost of the Company’s properties for federal income tax purposes approximated $35.2 billion (unaudited) as of December 31, 2021.

(2) Historical Cost and Accumulated Depreciation and Amortization

The following table reconciles the historical cost of the Company’s properties for financial reporting purposes for each of the years in the three-year period ended December 31, 2021.

Year Ended December 31, 


2021


2020


2019

Balance, beginning of year

$

23,142,988

$

16,886,592

$

17,055,016

Additions during period (acquisitions and improvements)


1,570,162


6,514,218


833,836

Deductions during period (dispositions, impairments and assets held for sale)


(1,087,700)


(257,822)


(1,002,260)

Balance, end of year

$

23,625,450

$

23,142,988

$

16,886,592

The following table reconciles accumulated depreciation and amortization of the Company’s properties for financial reporting purposes for each of the years in the three-year period ended December 31, 2021.

Year Ended December 31, 


2021


2020


2019

Balance, beginning of year

$

5,555,221

$

4,536,169

$

3,935,267

Additions during period (depreciation and amortization expense)


1,042,011


1,029,863


805,916

Deductions during period (dispositions and assets held for sale)


(386,951)


(10,811)


(205,014)

Balance, end of year

$

6,210,281

$

5,555,221

$

4,536,169

Schedules other than those listed above are omitted because they are not applicable or the information required is included in the consolidated financial statements or the notes thereto.

148

Table of Contents

Index to Financial Statements

ITEM 9.            CHANGES IN AND DISAGREEMENTS WITH ACCOUNTANTS ON ACCOUNTING AND FINANCIAL DISCLOSURE

None.

ITEM 9A.         CONTROLS AND PROCEDURES

Our Management’s Reports on Internal Control over Financial Reporting for Digital Realty Trust, Inc. and Digital Realty Trust, L.P. are included in Part II, Item 8, Financial Statements and Supplementary Data on page 80.

Evaluation of Disclosure Controls and Procedures (Digital Realty Trust, Inc.)

The Company maintains disclosure controls and procedures that are designed to ensure that information required to be disclosed in its reports filed under the Securities Exchange Act of 1934, as amended, is recorded, processed, summarized and reported within the time periods specified in the U.S. Securities and Exchange Commission’s rules and forms, and that such information is accumulated and communicated to its management, including its chief executive officer and chief financial officer, as appropriate, to allow timely decisions regarding required disclosure. In designing and evaluating the disclosure controls and procedures, the Company’s management recognizes that any controls and procedures, no matter how well designed and operated, can provide only reasonable assurance of achieving the desired control objectives, and its management is required to apply its judgment in evaluating the cost-benefit relationship of possible controls and procedures. Also, the Company has investments in certain unconsolidated entities, which are accounted for using the equity method of accounting. As the Company does not control or manage these entities, its disclosure controls and procedures with respect to such entities may be substantially more limited than those it maintains with respect to its consolidated subsidiaries.

As required by Rule 13a-15(b) or Rule 15d-15(b) of the Securities Exchange Act of 1934, as amended, management of the Company carried out an evaluation, under the supervision and with participation of its chief executive officer and chief financial officer, of the effectiveness of the design and operation of its disclosure controls and procedures that were in effect as of December 31, 2021. Based on the foregoing, the Company’s management concluded that its disclosure controls and procedures were effective at the reasonable assurance level.

Changes in Internal Control over Financial Reporting

There has not been any change in our internal control over financial reporting during the three months ended December 31, 2021, that has materially affected, or is reasonably likely to materially affect, our internal control over financial reporting.

Evaluation of Disclosure Controls and Procedures (Digital Realty Trust, L.P.)

The Operating Partnership maintains disclosure controls and procedures that are designed to ensure that information required to be disclosed in its reports filed under the Securities Exchange Act of 1934, as amended, is recorded, processed, summarized and reported within the time periods specified in the U.S. Securities and Exchange Commission’s rules and forms, and that such information is accumulated and communicated to its management, including the chief executive officer and chief financial officer of its general partner, as appropriate, to allow timely decisions regarding required disclosure. In designing and evaluating the disclosure controls and procedures, the Operating Partnership’s management recognizes that any controls and procedures, no matter how well designed and operated, can provide only reasonable assurance of achieving the desired control objectives, and its management is required to apply its judgment in evaluating the cost-benefit relationship of possible controls and procedures. Also, the Operating Partnership has investments in certain unconsolidated entities, which are accounted for using the equity method of accounting. As the Operating Partnership does not control or manage these entities, its disclosure controls and procedures with respect to such entities may be substantially more limited than those it maintains with respect to its consolidated subsidiaries.

149

Table of Contents

Index to Financial Statements

As required by Rule 13a-15(b) or Rule 15d-15(b) of the Securities Exchange Act of 1934, as amended, management of the Operating Partnership carried out an evaluation, under the supervision and with participation of the chief executive officer and chief financial officer of its general partner, of the effectiveness of the design and operation of its disclosure controls and procedures that were in effect as of December 31, 2021. Based on the foregoing, the Operating Partnership’s management concluded that its disclosure controls and procedures were effective at the reasonable assurance level.

Changes in Internal Control over Financial Reporting

There has not been any change in our internal control over financial reporting during the three months ended December 31, 2021, that has materially affected, or is reasonably likely to materially affect, our internal control over financial reporting.

ITEM 9B.          OTHER INFORMATION

None.

150

Table of Contents

Index to Financial Statements

PART III

ITEM 10.            DIRECTORS, EXECUTIVE OFFICERS AND CORPORATE GOVERNANCE

The information concerning our directors, executive officers and corporate governance required by Item 10 will be included in the Proxy Statement to be filed relating to our 2022 Annual Meeting of Stockholders and is incorporated herein by reference.

We have filed, as exhibits to this Annual Report on Form 10-K for the year ended December 31, 2021, the certifications of our Chief Executive Officer and Chief Financial Officer required under Section 302 of the Sarbanes Oxley Act to be filed with the Securities and Exchange Commission regarding the quality of our public disclosure. We have furnished to the Securities and Exchange Commission as exhibits to this Annual Report on Form 10-K for the year ended December 31, 2021, the certifications of our Chief Executive Officer and Chief Financial Officer required under Section 906 of the Sarbanes Oxley Act. In addition, as required by Section 303A.12 of the NYSE Listed Company Manual, our Chief Executive Officer made his annual certification to the NYSE stating that he was not aware of any violation by the Company of the corporate governance listing standards of the NYSE.

ITEM 11.            EXECUTIVE COMPENSATION

The information concerning our executive compensation required by Item 11 will be included in the Proxy Statement to be filed relating to our 2022 Annual Meeting of Stockholders and is incorporated herein by reference.

ITEM 12.            SECURITY OWNERSHIP OF CERTAIN BENEFICIAL OWNERS AND MANAGEMENT AND RELATED STOCKHOLDER MATTERS

The information concerning the security ownership of certain beneficial owners and management and related stockholder matters (including equity compensation plan information) required by Item 12 will be included in the Proxy Statement to be filed relating to our 2022 Annual Meeting of Stockholders and is incorporated herein by reference.

ITEM 13.            CERTAIN RELATIONSHIPS AND RELATED TRANSACTIONS AND DIRECTOR INDEPENDENCE

The information concerning certain relationships, related transactions and director independence required by Item 13 will be included in the Proxy Statement to be filed relating to our 2022 Annual Meeting of Stockholders and is incorporated herein by reference.

ITEM 14.            PRINCIPAL ACCOUNTING FEES AND SERVICES

The information concerning our principal accounting fees and services required by Item 14 will be included in the Proxy Statement to be filed relating to our 2022 Annual Meeting of Stockholders and is incorporated herein by reference.

151

Table of Contents

Index to Financial Statements

PART IV

ITEM 15.EXHIBITS.

Exhibit
Number


Description

2.1

Amendment No. 1 to Purchase Agreement dated as of January 23, 2020, by and among Digital Realty Trust, Inc., Digital Intrepid Holding B.V. and Interxion Holding N.V. (incorporated by reference to Exhibit 2.1 to the Current Report on Form 8-K of Digital Realty Trust, Inc. (File No. 001-32336) filed on January 27, 2020).

3.1

Articles of Amendment and Restatement of Digital Realty Trust, Inc., as amended (incorporated by reference to Exhibit 3.1 to the Combined Quarterly Report on Form 10-Q of Digital Realty Trust, Inc. and Digital Realty Trust, L.P. (File Nos. 001-32336 and 000-54023) filed on May 11, 2020).

3.2

Eighth Amended and Restated Bylaws of Digital Realty Trust, Inc. (incorporated by reference to Exhibit 3.2 to the Combined Annual Report on Form 10-K of Digital Realty Trust, Inc. and Digital Realty Trust, L.P. (File Nos. 001-32336 and 000-54023) filed on February 25, 2019).

3.3

Certificate of Limited Partnership of Digital Realty Trust, L.P. (incorporated by reference to Exhibit 3.1 to Digital Realty Trust, L.P.’s General Form for Registration of Securities on Form 10 filed on June 25, 2010 (File No. 000-54023)).

3.4

Nineteenth Amended and Restated Agreement of Limited Partnership of Digital Realty Trust, L.P. (incorporated by reference to Exhibit 3.1 to the Combined Current Report on Form 8-K of Digital Realty Trust, Inc. and Digital Realty Trust, L.P. (File Nos. 001-32336 and 000-54023) filed on October 10, 2019).

4.1

Specimen Certificate for Common Stock for Digital Realty Trust, Inc. (incorporated by reference to Exhibit 4.1 to Digital Realty Trust, Inc.’s Registration Statement on Form S-11 (Registration No. 333-117865) (File No. 001-32336) filed on October 26, 2004).

4.2

Registration Rights Agreement, dated as of October 27, 2004, by and among Digital Realty Trust, Inc., Digital Realty Trust, L.P. and the Unit Holders, as defined therein (incorporated by reference to Exhibit 10.2 to Digital Realty Trust, Inc.’s Quarterly Report on Form 10-Q (File No. 001-32336) filed on December 13, 2004).

4.3

Indenture, dated as of March 8, 2011, among Digital Realty Trust, L.P., as issuer, Digital Realty Trust, Inc., as guarantor, and Deutsche Bank Trust Company Americas, as trustee (incorporated by reference to Exhibit 4.1 to the Combined Current Report on Form 8-K of Digital Realty Trust, Inc. and Digital Realty Trust, L.P. (File Nos. 001-32336 and 000-54023) filed on March 8, 2011).

4.4

Indenture, dated as of January 18, 2013, among Digital Stout Holding, LLC, Digital Realty Trust, Inc., Digital Realty Trust, L.P., Deutsche Trustee Company Limited, as trustee, Deutsche Bank AG, London Branch, as paying agent and a transfer agent, and Deutsche Bank Luxembourg S.A., as registrar and a transfer agent, including the form of the 4.250% Guaranteed Notes due 2025 (incorporated by reference to Exhibit 4.1 to the Combined Current Report on Form 8-K of Digital Realty Trust, Inc. and Digital Realty Trust, L.P. (File Nos. 001-32336 and 000-54023) filed on January 25, 2013).

4.5

Indenture, dated as of June 23, 2015, among Digital Realty Trust, L.P., as issuer, Digital Realty Trust, Inc., as guarantor, and Wells Fargo Bank, National Association, as trustee (incorporated by reference to Exhibit 4.1 to the Combined Current Report on Form 8-K of Digital Realty Trust, Inc. and Digital Realty Trust, L.P. (File Nos. 001-32336 and 000-54023) filed on June 23, 2015).

152

Table of Contents

Index to Financial Statements

4.6

Indenture, dated as of October 1, 2015, among Digital Delta Holdings, LLC as issuer, Digital Realty Trust, Inc. and Digital Realty Trust, L.P., as guarantors, and Wells Fargo Bank, National Association, as trustee, including the form of the Notes and the guarantees (incorporated by reference to Exhibit 4.1 to the Combined Current Report on Form 8-K of Digital Realty Trust, Inc. and Digital Realty Trust, L.P. (File Nos. 001-32336 and 000-54023) filed on October 2, 2015).

4.7

Registration Rights Agreement, dated October 1, 2015, among Digital Delta Holdings, LLC, Digital Realty Trust, Inc., Digital Realty Trust, L.P. and Citigroup Global Markets Inc., Merrill Lynch, Pierce, Fenner & Smith Incorporated and Morgan Stanley & Co. LLC, as representatives of the several initial purchasers named therein (incorporated by reference to Exhibit 4.2 to the Combined Current Report on Form 8-K of Digital Realty Trust, Inc. and Digital Realty Trust, L.P. (File Nos. 001-32336 and 000-54023) filed on October 2, 2015).

4.8

Indenture, dated as of April 15, 2016, among Digital Euro Finco, LLC, Digital Realty Trust, Inc., Digital Realty Trust, L.P., Deutsche Trustee Company Limited, as trustee, Deutsche Bank AG, London Branch, as paying agent and a transfer agent, and Deutsche Bank Luxembourg S.A., as registrar and a transfer agent, including the form of the 2.625% Guaranteed Notes due 2024 (incorporated by reference to Exhibit 4.1 to the Combined Current Report on Form 8-K of Digital Realty Trust, Inc. and Digital Realty Trust, L.P. (File Nos. 001-32336 and 000-54023) filed on April 19, 2016).

4.9

Supplemental Indenture No. 2, dated as of August 7, 2017, among Digital Realty Trust, L.P., as issuer, Digital Realty Trust, Inc., as guarantor, and Wells Fargo Bank, National Association, as trustee, including the form of 2.750% Notes due 2023, the form of 3.700% Notes due 2027 and the guarantees (incorporated by reference to Exhibit 4.2 to the Combined Current Report on Form 8-K of Digital Realty Trust, Inc. and Digital Realty Trust, L.P. (File Nos. 001-32336 and 000-54023) filed on August 9, 2017).

4.10

Indenture, dated as of July 21, 2017, among Digital Stout Holding, LLC, Digital Realty Trust, Inc., Digital Realty Trust, L.P., Deutsche Trustee Company Limited, as trustee, Deutsche Bank AG, London Branch, as paying agent and a transfer agent, and Deutsche Bank Luxembourg S.A., as registrar and a transfer agent, including the form of the 2.750% Guaranteed Notes due 2024 (incorporated by reference to Exhibit 4.1 to the Combined Current Report on Form 8-K of Digital Realty Trust, Inc. and Digital Realty Trust, L.P. (File Nos. 001-32336 and 000-54023) filed on July 21, 2017).

4.11

Indenture, dated as of July 21, 2017, among Digital Stout Holding, LLC, Digital Realty Trust, Inc., Digital Realty Trust, L.P., Deutsche Trustee Company Limited, as trustee, Deutsche Bank AG, London Branch, as paying agent and a transfer agent, and Deutsche Bank Luxembourg S.A., as registrar and a transfer agent, including the form of the 3.300% Guaranteed Notes due 2029 (incorporated by reference to Exhibit 4.2 to the Combined Current Report on Form 8-K of Digital Realty Trust, Inc. and Digital Realty Trust, L.P. (File Nos. 001-32336 and 000-54023) filed on July 21, 2017).

4.12

Specimen Certificate for Digital Realty Trust, Inc.’s 5.250% Series J Cumulative Redeemable Preferred Stock (incorporated by reference to Exhibit 4.1 to the Registration Statement on Form 8-A of Digital Realty Trust, Inc. (File No. 001-32336) filed on August 4, 2017).

4.13

Supplemental Indenture No. 3, dated as of June  21, 2018, among Digital Realty Trust, L.P., as issuer, Digital Realty Trust, Inc., as guarantor, and Wells Fargo Bank, National Association, as trustee, including the form of 4.450% Notes due 2028 and the guarantees (incorporated by reference to Exhibit 4.2 to the Combined Current Report on Form 8-K of Digital Realty Trust, L.P. (File Nos. 001-32336 and 000-54023) filed on June 21, 2018).

153

Table of Contents

Index to Financial Statements

4.14

Indenture, dated as of October  17, 2018, among Digital Stout Holding, LLC, Digital Realty Trust, Inc., Digital Realty Trust, L.P., Deutsche Trustee Company Limited, as trustee, Deutsche Bank AG, London Branch, as paying agent and a transfer agent, and Deutsche Bank Luxembourg S.A., as registrar and a transfer agent, including the form of the 3.750% Guaranteed Notes due 2030 (incorporated by reference to Exhibit 4.1 to the Combined Current Report on Form 8-K of Digital Realty Trust, Inc. and Digital Realty Trust, L.P. (File Nos. 001-32336 and 000-54023) filed on October 18, 2018).

4.15

Indenture, dated as of January 16, 2019, among Digital Euro Finco, LLC, as issuer, Digital Realty Trust, L.P. and Digital Realty Trust, Inc., as guarantors, Deutsche Trustee Company Limited, as the trustee, Deutsche Bank AG, London Branch, as paying agent and a transfer agent, and Deutsche Bank Luxembourg S.A., as registrar and a transfer agent (incorporated by reference to Exhibit 4.1 to the Combined Current Report on Form 8-K of Digital Realty Trust, Inc. and Digital Realty Trust, L.P. (File Nos. 001-32336 and 000-54023) filed on January 16, 2019).

4.16

Form of Specimen Certificate for Digital Realty Trust, Inc.’s 5.850% Series K Cumulative Redeemable Preferred Stock (incorporated by reference to Exhibit 4.1 to the Registration Statement on Form 8-A of Digital Realty Trust, Inc. (File No. 001-32336) filed on March 12, 2019).

4.17

Supplemental Indenture No. 4, dated as of June 14, 2019, among Digital Realty Trust, L.P., as issuer, Digital Realty Trust, Inc., as guarantor, and Wells Fargo Bank, National Association, as trustee, including the form of 3.600% Notes due 2029 and the guarantee (incorporated by reference to Exhibit 4.2 to the Combined Current Report on Form 8-K of Digital Realty Trust, Inc. and Digital Realty Trust, L.P. (File Nos. 001-32336 and 000-54023) filed on June 14, 2019).

4.18

Indenture, dated as of October 9, 2019, among Digital Euro Finco, LLC, Digital Realty Trust, Inc., Digital Realty Trust, L.P., Deutsche Trustee Company Limited, as trustee, Deutsche Bank AG, London Branch, as paying agent and a transfer agent, and Deutsche Bank Luxembourg S.A., as registrar and a transfer agent, including the form of the 1.125% Guaranteed Notes due 2028 (incorporated by reference to Exhibit 4.1 to the Combined Current Report on Form 8-K of Digital Realty Trust, Inc. and Digital Realty Trust, L.P. (File Nos. 001-32336 and 000-54023) filed on October 9, 2019).

4.19

Specimen Certificate for Digital Realty Trust, Inc.’s 5.200% Series L Cumulative Redeemable Preferred Stock (incorporated by reference to Exhibit 4.1 to the Registration Statement on Form 8-A of Digital Realty Trust, Inc. (File No. 001-32336) filed on October 9, 2019).

4.20

Description of Securities.

4.21

Indenture, dated as of January 17, 2020, among Digital Dutch Finco B.V., Digital Realty Trust, Inc., Digital Realty Trust, L.P., Deutsche Trustee Company Limited, as trustee, Deutsche Bank AG, London Branch, as paying agent and a transfer agent, and Deutsche Bank Luxembourg S.A., as registrar and a transfer agent, including the form of the 0.125% Guaranteed Notes due 2022 (incorporated by reference to Exhibit 4.1 to the Combined Current Report on Form 8-K of Digital Realty Trust, Inc. and Digital Realty Trust, L.P. (File Nos. 001-32336 and 000-54023) filed on January 17, 2020).

4.22

Indenture, dated as of January 17, 2020, among Digital Dutch Finco B.V., Digital Realty Trust, Inc., Digital Realty Trust, L.P., Deutsche Trustee Company Limited, as trustee, Deutsche Bank AG, London Branch, as paying agent and a transfer agent, and Deutsche Bank Luxembourg S.A., as registrar and a transfer agent, including the form of the 0.625% Guaranteed Notes due 2025 (incorporated by reference to Exhibit 4.2 to the Combined Current Report on Form 8-K of Digital Realty Trust, Inc. and Digital Realty Trust, L.P. (File Nos. 001-32336 and 000-54023) filed on January 17, 2020).

154

Table of Contents

Index to Financial Statements

4.23

Indenture, dated as of January 17, 2020, among Digital Dutch Finco B.V., Digital Realty Trust, Inc., Digital Realty Trust, L.P., Deutsche Trustee Company Limited, as trustee, Deutsche Bank AG, London Branch, as paying agent and a transfer agent, and Deutsche Bank Luxembourg S.A., as registrar and a transfer agent, including the form of the 1.500% Guaranteed Notes due 2030 (incorporated by reference to Exhibit 4.3 to the Combined Current Report on Form 8-K of Digital Realty Trust, Inc. and Digital Realty Trust, L.P. (File Nos. 001-32336 and 000-54023) filed on January 17, 2020).

4.24

Indenture, dated as of June 26, 2020, among Digital Dutch Finco B.V., Digital Realty Trust, Inc., Digital Realty Trust, L.P., Deutsche Trustee Company Limited, as trustee, Deutsche Bank AG, London Branch, as paying agent and a transfer agent, and Deutsche Bank Luxembourg S.A., as registrar and a transfer agent, including the form of the 1.250% Guaranteed Notes due 2031 (incorporated by reference to Exhibit 4.1 to the Combined Current Report on Form 8-K of Digital Realty Trust, Inc. and Digital Realty Trust, L.P. (File Nos. 001-32336 and 000-54023) filed on June 26, 2020).

4.25

Indenture, dated as of September 23, 2020, among Digital Dutch Finco B.V., Digital Realty Trust, Inc., Digital Realty Trust, L.P., Deutsche Trustee Company Limited, as trustee, Deutsche Bank AG, London Branch, as paying agent and a transfer agent, and Deutsche Bank Luxembourg S.A., as registrar and a transfer agent, including the form of the 1.000% Guaranteed Notes due 2032 (incorporated by reference to Exhibit 4.1 to the Combined Current Report on Form 8-K of Digital Realty Trust, Inc. and Digital Realty Trust, L.P. (File Nos. 001-32336 and 000-54023) filed on September 23, 2020).

4.26

Indenture, dated as of September 23, 2020, among Digital Dutch Finco B.V., Digital Realty Trust, Inc., Digital Realty Trust, L.P., Deutsche Trustee Company Limited, as trustee, Deutsche Bank AG, London Branch, as calculation agent, paying agent and a transfer agent, and Deutsche Bank Luxembourg S.A., as registrar and a transfer agent, including the form of the Floating Rate Guaranteed Notes due 2022 (incorporated by reference to Exhibit 4.2 to the Combined Current Report on Form 8-K of Digital Realty Trust, Inc. and Digital Realty Trust, L.P. (File Nos. 001-32336 and 000-54023) filed on September 23, 2020).

4.27

Indenture, dated as of January 12, 2021, among Digital Intrepid Holding B.V., Digital Realty Trust, Inc., Digital Realty Trust, L.P., Deutsche Trustee Company Limited, as trustee, Deutsche Bank AG, London Branch, as paying agent and a transfer agent, and Deutsche Bank Luxembourg S.A., as registrar and a transfer agent, including the form of the 0.625% Guaranteed Notes due 2031. (incorporated by reference to Exhibit 4.1 to the Combined Current Report on Form 8-K of Digital Realty Trust, Inc. and Digital Realty Trust, L.P. (File Nos. 001-32336 and 000-54023) filed on January 12, 2021).

4.28

Terms and Conditions of the Notes, dated as of July 13, 2021 (incorporated by reference to Exhibit 4.1 to the Combined Current Report on Form 8-K of Digital Realty Trust, Inc. and Digital Realty Trust, L.P. (File Nos. 001-32336 and 000-54023) filed on July 15, 2021).

4.29

Form of the 2026 Notes (incorporated by reference to Exhibit 4.2 to the Combined Current Report on Form 8-K of Digital Realty Trust, Inc. and Digital Realty Trust, L.P. (File Nos. 001-32336 and 000-54023) filed on July 15, 2021).

4.30

Form of the 2029 Notes (incorporated by reference to Exhibit 4.3 to the Combined Current Report on Form 8-K of Digital Realty Trust, Inc. and Digital Realty Trust, L.P. (File Nos. 001-32336 and 000-54023) filed on July 15, 2021).

155

Table of Contents

Index to Financial Statements

4.31

Indenture, dated as of January 18, 2022, among Digital Intrepid Holding B.V., Digital Realty Trust, Inc., Digital Realty Trust, L.P., Deutsche Trustee Company Limited, as trustee, Deutsche Bank AG, London Branch, as paying agent and a transfer agent, and Deutsche Bank Luxembourg S.A., as registrar and a transfer agent, including the form of the 1.375% Guaranteed Notes due 2032 (incorporated by reference to Exhibit 4.1 to the Combined Current Report on Form 8-K of Digital Realty Trust, Inc. and Digital Realty Trust, L.P. (File Nos. 001-32336 and 000-54023) filed on January 18, 2022).

10.1†

Form of Indemnification Agreement by and between Digital Realty Trust, Inc. and its directors and officers (incorporated by reference to Exhibit 10.4 to Digital Realty Trust, Inc.’s Registration Statement on Form S-11 (Registration No. 333-117865) filed on October 13, 2004).

10.2

Contribution Agreement, dated as of July 31, 2004, by and among Digital Realty Trust, L.P., San Francisco Wave eXchange, LLC, Santa Clara Wave eXchange, LLC and eXchange colocation, LLC (incorporated by reference to Exhibit 10.12 to Digital Realty Trust, Inc.’s Registration Statement on Form S-11 (Registration No. 333-117865) filed on September 17, 2004).

10.3†

Form of Profits Interest Units Agreement (incorporated by reference to Exhibit 10.44 to Digital Realty Trust, Inc.’s Quarterly Report on Form 10-Q (File No. 001-32336) filed on December 13, 2004).

10.4†

Form of Class C Profits Interest Units Agreement (incorporated by reference to Exhibit 10.1 to Digital Realty Trust, Inc.’s Quarterly Report on Form 10-Q (File No. 001-32336) filed on August 9, 2007).

10.5†

First Amended and Restated Digital Realty Trust, Inc., Digital Services, Inc. and Digital Realty Trust, L.P. 2004 Incentive Award Plan (incorporated by reference to Appendix A to Digital Realty Trust, Inc.’s definitive proxy statement on Schedule 14A (File No. 001-32336) filed on March 30, 2007).

10.6†

Form of 2008 Performance-Based Profits Interest Units Agreement (incorporated by reference to Exhibit 10.3 to Digital Realty Trust, Inc.’s Quarterly Report on Form 10-Q (File No. 001-32336) filed on May 9, 2008).

10.7†

First Amendment to First Amended and Restated Digital Realty Trust, Inc., Digital Services, Inc. and Digital Realty Trust, L.P. 2004 Incentive Award Plan (incorporated by reference to Exhibit 10.4 to Digital Realty Trust, Inc.’s Quarterly Report on Form 10-Q (File No. 001-32336) filed on May 9, 2008).

10.8†

Second Amendment to First Amended and Restated Digital Realty Trust, Inc., Digital Services, Inc. and Digital Realty Trust, L.P. 2004 Incentive Award Plan (incorporated by reference to Exhibit 10.4 to Digital Realty Trust, Inc.’s Quarterly Report on Form 10-Q (File No. 001-32336) filed on August 6, 2009).

10.9†

Third Amendment to First Amended and Restated Digital Realty Trust, Inc., Digital Services, Inc. and Digital Realty Trust, L.P. 2004 Incentive Award Plan (incorporated by reference to Exhibit 10.1 to Digital Realty Trust, Inc.’s Quarterly Report on Form 10-Q (File No. 001-32336) filed on November 9, 2009).

10.10†

Fourth Amendment to First Amended and Restated Digital Realty Trust, Inc., Digital Services, Inc. and Digital Realty Trust, L.P. 2004 Incentive Award Plan (incorporated by reference to Exhibit 10.1 to the Combined Quarterly Report on Form 10-Q of Digital Realty Trust, Inc. and Digital Realty Trust, L.P. (File Nos. 001-32336 and 000-54023) filed on August 7, 2012).

10.11†

Fifth Amendment to First Amended and Restated Digital Realty Trust, Inc., Digital Services, Inc. and Digital Realty Trust, L.P. 2004 Incentive Award Plan. (incorporated by reference to exhibit 10.46 to the Combined Annual Report on Form 10-K of Digital Realty Trust, Inc. and Digital Realty Trust, L.P. (File Nos. 001-32336 and 000-54023) filed on March 2, 2015).

156

Table of Contents

Index to Financial Statements

10.12†

Director Compensation Program (incorporated by reference to Exhibit 10.14 to the Combined Annual Report on Form 10-K of Digital Realty Trust, Inc. and Digital Realty Trust, L.P. (File Nos. 001-32336 and 000-54023) filed on March 1, 2021).

10.13†

Profits Interest Unit Agreement – Directors (incorporated by reference to Exhibit 10.21 to the Combined Annual Report on Form 10-K of Digital Realty Trust, Inc. and Digital Realty Trust, L.P. (File Nos. 001-32336 and 000-54023) filed on February 25, 2019).

10.14†

Digital Realty Deferred Compensation Plan (incorporated by reference to Exhibit 10.33 to the Combined Annual Report on Form 10-K of Digital Realty Trust, Inc. and Digital Realty Trust, L.P. (File Nos. 001-32336 and 000-54023) filed on February 28, 2014).

10.15†

First Amendment to Digital Realty Deferred Compensation Plan (incorporated by reference to Exhibit 10.45 to the Combined Annual Report on Form 10-K of Digital Realty Trust, Inc. and Digital Realty Trust, L.P. (File Nos. 001-32336 and 000-54023) filed on March 2, 2015).

10.16†

Second Amendment to Digital Realty Deferred Compensation Plan (incorporated by reference to Exhibit 10.3 to the Combined Quarterly Report on Form 10-Q of Digital Realty Trust, Inc. and Digital Realty Trust, L.P. (File Nos. 001-32336 and 000-54023) filed on November 6, 2015).

10.17†

Form of Class D Profits Interest Unit Agreement (incorporated by reference to Exhibit 10.34 to the Combined Annual Report on Form 10-K of Digital Realty Trust, Inc. and Digital Realty Trust, L.P. (File Nos. 001-32336 and 000-54023) filed on February 28, 2014).

10.18†

Form of Performance-Based Restricted Stock Unit Agreement (incorporated by reference to Exhibit 10.35 to the Combined Annual Report on Form 10-K of Digital Realty Trust, Inc. and Digital Realty Trust, L.P. (File Nos. 001-32336 and 000-54023) filed on February 28, 2014).

10.19†

Form of Time-Based Restricted Stock Unit Agreement (incorporated by reference to Exhibit 10.36 to the Combined Annual Report on Form 10-K of Digital Realty Trust, Inc. and Digital Realty Trust, L.P. (File Nos. 001-32336 and 000-54023) filed on February 28, 2014).

10.20†

Form of Time-Based Profits Interest Unit Agreement (incorporated by reference to Exhibit 10.23 to the Combined Annual Report on Form 10-K of Digital Realty Trust, Inc. and Digital Realty Trust, L.P. (File Nos. 001-32336 and 000-54023) filed on March 1, 2017).

10.21†

Form of Executive Time-Based Profits Interest Unit Agreement (incorporated by reference to Exhibit 10.27 to the Combined Annual Report on Form 10-K of Digital Realty Trust, Inc. and Digital Realty Trust, L.P. (File Nos. 001-32336 and 000-54023) filed on March 1, 2018).

10.22†

Form of Class D Profits Interest Unit Agreement (incorporated by reference to Exhibit 10.30 to the Combined Annual Report on Form 10-K of Digital Realty Trust, Inc. and Digital Realty Trust, L.P. (File Nos. 001-32336 and 000-54023) filed on February 25, 2019).

10.23†

Executive Time-Based Profits Interest Unit Agreement (incorporated by reference to Exhibit 10.31 to the Combined Annual Report on Form 10-K of Digital Realty Trust, Inc. and Digital Realty Trust, L.P. (File Nos. 001-32336 and 000-54023) filed on February 25, 2019).

10.24†

Management Election Program (incorporated by reference to Exhibit 10.32 to the Combined Annual Report on Form 10-K of Digital Realty Trust, Inc. and Digital Realty Trust, L.P. (File Nos. 001-32336 and 000-54023) filed on February 25, 2019).

157

Table of Contents

Index to Financial Statements

10.25†

Digital Realty Trust, Inc., Digital Services, Inc. and Digital Realty Trust, L.P. 2014 Incentive Award Plan (incorporated by reference to Exhibit 10.1 to the Combined Current Report on Form 10-Q of Digital Realty Trust, Inc. and Digital Realty Trust, L.P. (File Nos. 001-32336 and 000-54023) filed on August 7, 2014).

10.26†

First Amendment to Digital Realty Trust, Inc., Digital Services, Inc. and Digital Realty Trust, L.P. 2014 Incentive Award Plan. (incorporated by reference to Exhibit 10.1 to the Combined Quarterly Report on Form 10-Q of Digital Realty Trust, Inc. and Digital Realty Trust, L.P. (File Nos. 001-32336 and 000-54023) filed on November 7, 2014).

10.27†

Second Amendment to Digital Realty Trust, Inc., Digital Services, Inc. and Digital Realty Trust, L.P. 2014 Incentive Award Plan (incorporated by reference to Exhibit 10.44 to the Combined Annual Report on Form 10-K of Digital Realty Trust, Inc. and Digital Realty Trust, L.P. (File Nos. 001-32336 and 000-54023) filed on March 2, 2015).

10.28†

Third Amendment to Digital Realty Trust, Inc., Digital Services, Inc. and Digital Realty Trust, L.P. 2014 Incentive Award Plan (incorporated by reference to Exhibit 10.1 to the Combined Annual Report on Form 10-Q of Digital Realty Trust, Inc. and Digital Realty Trust, L.P. filed on November 9, 2016).

10.29†

Fourth Amendment to the Digital Realty Trust, Inc., Digital Services, Inc. and Digital Realty Trust, L.P. 2014 Incentive Award Plan (incorporated by reference to Exhibit 10.1 to the Combined Current Report on Form 8-K of Digital Realty Trust, Inc. and Digital Realty Trust, L.P. (File Nos. 001-32336 and 000-54023) filed on September 14, 2017).

10.30†

Fifth Amendment to the Digital Realty Trust, Inc., Digital Services, Inc. and Digital Realty Trust, L.P. 2014 Incentive Award Plan (incorporated by reference to Exhibit 10.38 to the Combined Annual Report on Form 10-K of Digital Realty Trust, Inc. and Digital Realty Trust, L.P. (File Nos. 001-32336 and 000-54023) filed on February 25, 2019).

10.31†

Sixth Amendment to the Digital Realty Trust, Inc., Digital Services, Inc. and Digital Realty Trust, L.P. 2014 Incentive Award Plan (incorporated by reference to Exhibit 10.33 to the Combined Annual Report on Form 10-K of Digital Realty Trust, Inc. and Digital Realty Trust, L.P. (File Nos. 001-32336 and 000-54023) filed on March 1, 2021).

10.32†

Employment Agreement among Digital Realty Trust, Inc., DLR LLC and A. William Stein (incorporated by reference to Exhibit 10.1 to the Combined Current Report on Form 8-K of Digital Realty Trust, Inc. and Digital Realty Trust, L.P. (File Nos. 001-32336 and 000-54023) filed on July 9, 2018).

10.33†

Amended and Restated Employment Agreement, dated as of June 18, 2019, by and among Digital Realty Trust, Inc., DLR, LLC and Andrew P. Power (incorporated by reference to Exhibit 10.1 to the Combined Current Report on Form 8-K of Digital Realty Trust, Inc. and Digital Realty Trust, L.P. (File Nos. 001-32336 and 000-54023) filed on June 24, 2019)

10.34†

Digital Realty Trust, Inc. 2015 Employee Stock Purchase Plan (incorporated by reference to Exhibit 10.6 to the Combined Quarterly Report on Form 10-Q of Digital Realty Trust, Inc. and Digital Realty Trust, L.P. (File Nos. 001-32336 and 000-54023) filed on August 6, 2015).

10.35†

First Amendment to Digital Realty Trust, Inc. 2015 Employee Stock Purchase Plan (incorporated by reference to Exhibit 4.7 to the Registration Statement on Form S-8 of Digital Realty Trust, Inc. (File Nos. 001-32336 and 000-54023) filed on October 7, 2015).

10.36†

Form of Director Confidentiality Agreement (incorporated by reference to Exhibit 10.39 to the Combined Annual Report on Form 10-K of Digital Realty Trust, Inc. and Digital Realty Trust, L.P. (File Nos. 001-32336 and 000-54023) filed on March 1, 2017).

158

Table of Contents

Index to Financial Statements

10.37*

Second Amended and Restated Global Senior Credit Agreement, dated as of November 18, 2021, among Digital Realty Trust, L.P. and the other initial borrowers named therein and additional borrowers party thereto, as borrowers, Digital Realty Trust, Inc., as parent guarantor, the additional guarantors party thereto, as additional guarantors, the banks, financial institutions and other institutional lenders listed therein, as the initial lenders, each issuing bank and swing line bank as listed therein, Citibank, N.A., as administrative agent, BofA Securities, Inc. and Citibank, as co-sustainability structuring agents, Bank of America, N.A. and JPMorgan Chase Bank, N.A., as syndication agents, and BofA Securities, Inc., Citibank, N.A., and JPMorgan Chase Bank, N.A., as joint lead arrangers and joint bookrunners, and the other agents and lenders named therein.

10.38*

Amended and Restated Credit Agreement, dated as of November 18, 2021, among Digital Realty Trust, L.P. and the other initial borrowers named therein and additional borrowers party thereto, as borrowers, Digital Realty Trust, Inc. and Digital Euro Finco LLC and Digital Realty Trust, L.P. as guarantors, the subsidiary borrowers and additional guarantors named therein, the initial lenders and issuing banks named therein, Sumitomo Mitsui Banking Corporation, as administrative agent, Sumitomo Mitsui Banking Corporation as sustainability structuring agent, SMBC, MUFG Bank Ltd. and Mizuho Bank, Ltd., as joint lead arrangers and joint bookrunners, and the other agents and lenders named therein.

10.39†

Form of Executive Severance Agreement (incorporated by reference to Exhibit 10.56 to the Combined Annual Report on Form 10-K of Digital Realty Trust, Inc. and Digital Realty Trust, L.P. (File Nos. 001-32336 and 000-54023) filed on March 2, 2020).

10.40†

Employment Agreement, dated November 19, 2018, by and among Digital Realty Trust, Inc., DLR, LLC and Gregory S. Wright (incorporated by reference to Exhibit 10.1 to the Combined Quarterly Report on Form 10-Q of Digital Realty Trust, Inc. and Digital Realty Trust, L.P. (File Nos. 001-32336 and 000-54023) filed on May 11, 2020).

10.41†

Form of Class D Profits Interest Unit Agreement (Transaction Award) (incorporated by reference to Exhibit 10.3 to the Combined Quarterly Report on Form 10-Q of Digital Realty Trust, Inc. and Digital Realty Trust, L.P. (File Nos. 001-32336 and 000-54023) filed on May 11, 2020).

10.42†

Form of Performance-Based Restricted Stock Unit Agreement (Transaction Award) (incorporated by reference to Exhibit 10.4 to the Combined Quarterly Report on Form 10-Q of Digital Realty Trust, Inc. and Digital Realty Trust, L.P. (File Nos. 001-32336 and 000-54023) filed on May 11, 2020).

10.43†

Form of Executive Severance Class D Profits Interest Unit Agreement (Transaction Award) (incorporated by reference to Exhibit 10.5 to the Combined Quarterly Report on Form 10-Q of Digital Realty Trust, Inc. and Digital Realty Trust, L.P. (File Nos. 001-32336 and 000-54023) filed on May 11, 2020).

10.44†

Form of Time-Based Profits Interest Unit Agreement (Transaction Award) (incorporated by reference to Exhibit 10.6 to the Combined Quarterly Report on Form 10-Q of Digital Realty Trust, Inc. and Digital Realty Trust, L.P. (File Nos. 001-32336 and 000-54023) filed on May 11, 2020).

10.45†

Form of Time-Based Restricted Stock Unit Agreement (Transaction Award) (incorporated by reference to Exhibit 10.7 to the Combined Quarterly Report on Form 10-Q of Digital Realty Trust, Inc. and Digital Realty Trust, L.P. (File Nos. 001-32336 and 000-54023) filed on May 11, 2020).

10.46†

Form of Executive Severance Time-Based Profits Interest Unit Agreement (Transaction Award) (incorporated by reference to Exhibit 10.8 to the Combined Quarterly Report on Form 10-Q of Digital Realty Trust, Inc. and Digital Realty Trust, L.P. (File Nos. 001-32336 and 000-54023) filed on May 11, 2020).

10.47†

Form of Executive Severance Time-Based Profits Interest Unit Agreement (incorporated by reference to Exhibit 10.9 to the Combined Quarterly Report on Form 10-Q of Digital Realty Trust, Inc. and Digital Realty Trust, L.P. (File Nos. 001-32336 and 000-54023) filed on May 11, 2020).

159

Table of Contents

Index to Financial Statements

10.48†

Form of Executive Severance Class D Profits Interest Unit Agreement (incorporated by reference to Exhibit 10.10 to the Combined Quarterly Report on Form 10-Q of Digital Realty Trust, Inc. and Digital Realty Trust, L.P. (File Nos. 001-32336 and 000-54023) filed on May 11, 2020).

10.49†

InterXion Holding N.V. 2017 Executive Director Long Term Incentive Plan (incorporated by reference to Exhibit 4.5 to the Registration Statement on Form S-8 of Digital Realty Trust, Inc. (File No. 333-237038) filed on March 9, 2020).

10.50†

InterXion Holding N.V. 2013 Amended International Equity Based Incentive Plan (incorporated by reference to Exhibit 4.4 to the Registration Statement on Form S-8 of Digital Realty Trust, Inc. (File No. 333-237038) filed on March 9, 2020).

10.51†

Form of Indemnification Agreement by and between Digital Realty Trust, Inc. and its directors and officers (incorporated by reference to Exhibit 10.59 to the Combined Annual Report on Form 10-K of Digital Realty Trust, Inc. and Digital Realty Trust, L.P. (File Nos. 001-32336 and 000-54023) filed on March 1, 2021).

10.52†

Form of Omnibus Letter Agreement to 2020 Equity Award Agreements.

10.53†

Form of Amended and Restated Form of Executive Severance Agreement - United States.

10.54†

Form of Amended and Restated Form of Executive Severance Agreement - Canada.

21.1

List of Subsidiaries of Digital Realty Trust, Inc.

21.2

List of Subsidiaries of Digital Realty Trust, L.P.

23.1

Consent of Independent Registered Public Accounting Firm.

31.1

Rule 13a-14(a)/15d-14(a) Certifications of Chief Executive Officer for Digital Realty Trust, Inc.

31.2

Rule 13a-14(a)/15d-14(a) Certifications of Chief Financial Officer for Digital Realty Trust, Inc.

31.3

Rule 13a-14(a)/15d-14(a) Certifications of Chief Executive Officer for Digital Realty Trust, L.P.

31.4

Rule 13a-14(a)/15d-14(a) Certifications of Chief Financial Officer for Digital Realty Trust, L.P.

32.1

18 U.S.C. § 1350 Certifications of Chief Executive Officer for Digital Realty Trust, Inc.

32.2

18 U.S.C. § 1350 Certifications of Chief Financial Officer for Digital Realty Trust, Inc.

32.3

18 U.S.C. § 1350 Certifications of Chief Executive Officer for Digital Realty Trust, L.P.

32.4

18 U.S.C. § 1350 Certifications of Chief Financial Officer for Digital Realty Trust, L.P.

101

The following financial statements from Digital Realty Trust, Inc.’s and Digital Realty Trust, L.P.’s Form 10 K for the year ended December 31, 2021, formatted in Inline XBRL interactive data files: (i) Consolidated Balance Sheets as of December 31, 2021 and December 31, 2020; (ii) Consolidated Income Statements for each of the years in the three-year period ended December 31, 2021; (iii) Consolidated Statements of Equity and Comprehensive Income/Statements of Capital and Comprehensive Income for each of the years in the three-year period ended December 31, 2021; (iv) Consolidated Statements of Cash Flows for each of the years in the three-year period ended December 31, 2021; and (v) Notes to Consolidated Financial Statements.

104

Cover Page Interactive Data File (formatted as Inline XBRL and contained in Exhibit 101).

160

Table of Contents

Index to Financial Statements

Management contract or compensatory plan or arrangement.

*

Portions of this exhibit have been omitted because such portions (i) are not material and (ii) would be competitively harmful if publicly disclosed.

ITEM 16.            FORM 10-K SUMMARY

None.

161

Table of Contents

Index to Financial Statements

SIGNATURES

Pursuant to the requirements of Section 13 or 15(d) of the Securities Exchange Act of 1934, the registrant has duly caused this report to be signed on its behalf by the undersigned, thereunto duly authorized.

DIGITAL REALTY TRUST, INC.

By:

/s/ A. WILLIAM STEIN

A. William Stein
Chief Executive Officer

Date:

February 25, 2022

POWER OF ATTORNEY

KNOW ALL PERSONS BY THESE PRESENTS, that each person whose signature appears below constitutes and appoints A. William Stein, Andrew P. Power and Jeannie Lee, and each of them, with full power to act without the other, such person’s true and lawful attorneys-in-fact and agents, with full power of substitution and resubstitution, for him or her and in his or her name, place and stead, in any and all capacities, to sign this Form 10-K and any and all amendments thereto, and to file the same, with exhibits and schedules thereto, and other documents in connection therewith, with the Securities and Exchange Commission, granting unto said attorneys-in-fact and agents, and each of them, full power and authority to do and perform each and every act and thing necessary or desirable to be done in and about the premises, as fully to all intents and purposes as he or she might or could do in person, hereby ratifying and confirming all that said attorneys-in-fact and agents, or any of them, or their or his or her substitute or substitutes, may lawfully do or cause to be done by virtue hereof.

Pursuant to the requirements of the Securities Exchange Act of 1934, this report has been signed below by the following persons on behalf of the registrant and in the capacities and on the dates indicated.

NNIS

Signature


Title


Date

/s/ LAURENCE A. CHAPMAN

Chairman of the Board

February 25, 2022

Laurence A. Chapman

/s/ A. WILLIAM STEIN

Chief Executive Officer and Director (Principal Executive Officer)

February 25, 2022

A. William Stein

/s/ ANDREW P. POWER

President & Chief Financial Officer (Principal Financial Officer)

February 25, 2022

Andrew P. Power

/s/ CAMILLA A. HARRIS

Chief Accounting Officer (Principal Accounting Officer)

February 25, 2022

Camilla A. Harris

/s/ ALEXIS BLACK BJORLIN

Director

February 25, 2022

Alexis Black Bjorlin

/s/ VeraLinn Jamieson

Director

February 25, 2022

VeraLinn Jamieson

/s/ KEVIN J. KENNEDY

Director

February 25, 2022

Kevin J. Kennedy

162

Table of Contents

Index to Financial Statements

NNIS

Signature


Title


Date

/s/ WILLIAM G. LAPERCH

Director

February 25, 2022

William G. LaPerch

/s/ JEAN F.H.P. MANDEVILLE

Director

February 25, 2022

Jean F.H.P. Mandeville

/s/ AFSHIN MOHEBBI

Director

February 25, 2022

Afshin Mohebbi

/s/ MARK R. PATTERSON

Director

February 25, 2022

Mark R. Patterson

/s/ MARY HOGAN PREUSSE

Director

February 25, 2022

Mary Hogan Preusse

/s/ DENNIS E. SINGLETON

Director

February 25, 2022

Dennis E. Singleton

163

Table of Contents

Index to Financial Statements

SIGNATURES

Pursuant to the requirements of Section 13 or 15(d) of the Securities Exchange Act of 1934, the registrant has duly caused this report to be signed on its behalf by the undersigned, thereunto duly authorized.

DIGITAL REALTY TRUST, L.P.

By:

Digital Realty Trust, Inc.,

Its

General Partner

By:

/s/ A. WILLIAM STEIN

A. William Stein
Chief Executive Officer

Date:

February 25, 2022

POWER OF ATTORNEY

KNOW ALL PERSONS BY THESE PRESENTS, that each person whose signature appears below constitutes and appoints A. William Stein, Andrew P. Power and Jeannie Lee, and each of them, with full power to act without the other, such person’s true and lawful attorneys-in-fact and agents, with full power of substitution and resubstitution, for him or her and in his or her name, place and stead, in any and all capacities, to sign this Form 10-K and any and all amendments thereto, and to file the same, with exhibits and schedules thereto, and other documents in connection therewith, with the Securities and Exchange Commission, granting unto said attorneys-in-fact and agents, and each of them, full power and authority to do and perform each and every act and thing necessary or desirable to be done in and about the premises, as fully to all intents and purposes as he or she might or could do in person, hereby ratifying and confirming all that said attorneys-in-fact and agents, or any of them, or their or his or her substitute or substitutes, may lawfully do or cause to be done by virtue hereof.

Pursuant to the requirements of the Securities Exchange Act of 1934, this report has been signed below by the following persons on behalf of the registrant and in the capacities and on the dates indicated.

Signature


Title


Date

/s/ LAURENCE A. CHAPMAN

Chairman of the Board

February 25, 2022

Laurence A. Chapman

/s/ A. WILLIAM STEIN

Chief Executive Officer and Director (Principal Executive Officer)

February 25, 2022

A. William Stein

/s/ ANDREW P. POWER

President & Chief Financial Officer (Principal Financial Officer)

February 25, 2022

Andrew P. Power

/s/ CAMILLA A. HARRIS

Chief Accounting Officer (Principal Accounting Officer)

February 25, 2022

Camilla A. Harris

/s/ ALEXIS BLACK BJORLIN

Director

February 25, 2022

Alexis Black Bjorlin

/s/ VeraLinn Jamieson

Director

February 25, 2022

VeraLinn Jamieson

164

Table of Contents

Index to Financial Statements

Signature


Title


Date

/s/ KEVIN J. KENNEDY

Director

February 25, 2022

Kevin J. Kennedy

/s/ WILLIAM G. LAPERCH

Director

February 25, 2022

William G. LaPerch

/s/ JEAN F.H.P. MANDEVILLE

Director

February 25, 2022

Jean F.H.P. Mandeville

/s/ AFSHIN MOHEBBI

Director

February 25, 2022

Afshin Mohebbi

/s/ MARK R. PATTERSON

Director

February 25, 2022

Mark R. Patterson

/s/ MARY HOGAN PREUSSE

Director

February 25, 2022

Mary Hogan Preusse

/s/ DENNIS E. SINGLETON

Director

February 25, 2022

Dennis E. Singleton

165