UNITED STATES
SECURITIES AND EXCHANGE COMMISSION
Washington, D.C. 20549
FORM N-CSR
CERTIFIED SHAREHOLDER REPORT OF REGISTERED MANAGEMENT
INVESTMENT COMPANIES
Investment Company Act file number 811-22443
Partners Group Private Equity (Institutional TEI), LLC
(Exact name of registrant as specified in charter)
c/o Partners Group (USA) Inc.
1114 Avenue of the Americas, 37th Floor
New York, NY 10036
(Address of principal executive offices) (Zip code)
Robert Collins
1114 Avenue of the Americas, 37th Floor
New York, NY 10036
(Name and address of agent for service)
Registrant's telephone number, including area code: (212) 908-2600
Date of fiscal year end: March 31
Date of reporting period: September 30, 2014
Form N-CSR is to be used by management investment companies to file reports with the Commission not later than 10 days after the transmission to stockholders of any report that is required to be transmitted to stockholders under Rule 30e-1 under the Investment Company Act of 1940 (17 CFR 270.30e-1). The Commission may use the information provided on Form N-CSR in its regulatory, disclosure review, inspection, and policymaking roles.
A registrant is required to disclose the information specified by Form N-CSR, and the Commission will make this information public. A registrant is not required to respond to the collection of information contained in Form N-CSR unless the Form displays a currently valid Office of Management and Budget (“OMB”) control number. Please direct comments concerning the accuracy of the information collection burden estimate and any suggestions for reducing the burden to Secretary, Securities and Exchange Commission, 450 Fifth Street, NW, Washington, DC 20549-0609. The OMB has reviewed this collection of information under the clearance requirements of 44 U.S.C. § 3507.
ITEM 1. REPORTS TO STOCKHOLDERS.
The Report to Shareholders is attached herewith.
PARTNERS GROUP PRIVATE EQUITY (INSTITUTIONAL TEI), LLC
(a Delaware Limited Liability Company)
Semi-Annual Report
For the Six Months Ended September 30, 2014
(Unaudited)
(Including the Consolidated Financial Statements of
Partners Group Private Equity (Master Fund), LLC)

Partners Group Private Equity (Institutional TEI), LLC
(a Delaware Limited Liability Company)
Table of Contents
For the Six Months Ended September 30, 2014 (Unaudited)
|
Consolidated Statement of Assets, Liabilities and Members' Equity
|
1
|
|
Consolidated Statement of Operations
|
2
|
|
Consolidated Statements of Changes in Members' Equity
|
3
|
|
Consolidated Statement of Cash Flows
|
4
|
|
Consolidated Financial Highlights
|
5
|
|
Notes to Consolidated Financial Statements
|
6-9
|
|
Other Information
|
10
|
|
Consolidated Financial Statements of Partners Group Private Equity (Master Fund), LLC
|
Appendix I
|
Partners Group Private Equity (Institutional TEI), LLC
(a Delaware Limited Liability Company)
Consolidated Statement of Assets, Liabilities and Members’ Equity – September 30, 2014 (Unaudited)
|
Assets
|
||||
|
Investment in Partners Group Private Equity (Master Fund), LLC, at fair value (cost $50,799,351)
|
$ | 59,294,452 | ||
|
Interest receivable
|
3 | |||
|
Prepaid assets
|
17,074 | |||
|
Total Assets
|
$ | 59,311,529 | ||
|
Liabilities
|
||||
|
Professional fees payable
|
$ | 24,500 | ||
|
Accounting and administration fees payable
|
9,635 | |||
|
Custodian fees payable
|
800 | |||
|
Other expenses payable
|
1,367 | |||
|
Total Liabilities
|
$ | 36,302 | ||
|
Members' Equity
|
$ | 59,275,227 | ||
|
Members' Equity consists of:
|
||||
|
Members' Equity Paid-in
|
$ | 51,924,501 | ||
|
Accumulated net investment income
|
657,124 | |||
|
Accumulated net realized gain on investments, forward foreign currency contracts and foreign currency translation
|
3,568,038 | |||
|
Accumulated net unrealized appreciation on investments, forward foreign currency contracts and foreign currency translation
|
3,974,905 | |||
|
Accumulated Adviser's Incentive Allocation
|
(849,341 | ) | ||
|
Total Members' Equity
|
$ | 59,275,227 | ||
|
Number of Outstanding Units
|
4,387,833 | |||
|
Net Asset Value per Unit
|
$ | 13.51 | ||
The accompanying notes are an integral part of these Consolidated Financial Statements.
1
Partners Group Private Equity (Institutional TEI), LLC
(a Delaware Limited Liability Company)
Consolidated Statement of Operations – For the Six Months Ended September 30, 2014 (Unaudited)
|
Fund Investment Income
|
$ | 33 | ||
|
Fund Operating Expenses
|
||||
|
Accounting and administration fees
|
27,936 | |||
|
Professional fees
|
7,000 | |||
|
Registration fees
|
3,652 | |||
|
Custodian fees
|
2,400 | |||
|
Withholding tax
|
13,245 | |||
|
Other expenses
|
11,300 | |||
|
Total Operating Expenses
|
65,533 | |||
|
Investment Income Allocated from Partners Group Private Equity (Master Fund), LLC
|
||||
|
Investment Income
|
671,801 | |||
|
Expenses
|
(406,593 | ) | ||
|
Total Investment Income Allocated from Partners Group Private Equity (Master Fund), LLC
|
265,208 | |||
|
Net Investment Income
|
199,708 | |||
|
Net Realized Gain and Change in Unrealized Appreciation on Investments, Forward
Foreign Currency Contracts and Foreign Currency Allocated from Partners Group Private
Equity (Master Fund), LLC
|
||||
|
Net realized gain from investments and forward foreign currency contracts
|
112,109 | |||
|
Net realized gain distributions from primary and secondary investments
|
1,511,247 | |||
|
Net change in accumulated unrealized appreciation on investments, forward foreign currency
contracts and foreign currency translation
|
1,802,346 | |||
|
Net Realized Gain and Change in Unrealized Appreciation on Investments, Forward
Foreign Currency Contracts and Foreign Currency Allocated from Partners Group Private
Equity (Master Fund), LLC
|
3,425,702 | |||
|
Adviser's Incentive Allocation Allocated from Partners Group Private Equity (Master
Fund), LLC
|
(369,056 | ) | ||
|
Net Increase in Members' Equity from Operations
|
$ | 3,256,354 |
The accompanying notes are an integral part of these Consolidated Financial Statements.
2
Partners Group Private Equity (Institutional TEI), LLC
(a Delaware Limited Liability Company)
Consolidated Statements of Changes in Members’ Equity – For the Periods Ended March 31, 2014 and September 30, 2014 (Unaudited)
|
Members’
Equity
|
||||
|
Members' Equity at March 31, 2013
|
$ | 12,025,933 | ||
|
Capital contributions
|
20,100,000 | |||
|
Capital tenders
|
(53,144 | ) | ||
|
Net investment income
|
389,782 | |||
|
Net realized gain from investments and forward foreign currency contracts
|
459,986 | |||
|
Net realized gain on foreign currency translation
|
147 | |||
|
Net realized gain distributions from primary and secondary investments
|
1,245,303 | |||
|
Net change in accumulated unrealized appreciation on investments, forward foreign currency
contracts and foreign currency translation
|
1,581,995 | |||
|
Adviser's Incentive Allocation
|
(383,774 | ) | ||
|
Members' Equity at March 31, 2014
|
$ | 35,366,228 | ||
|
Capital contributions
|
21,863,641 | |||
|
Capital tenders
|
(1,210,996 | ) | ||
|
Net investment income
|
199,708 | |||
|
Net realized gain from investments and forward foreign currency contracts
|
112,109 | |||
|
Net realized gain distributions from primary and secondary investments
|
1,511,247 | |||
|
Net change in accumulated unrealized appreciation on investments, forward foreign currency
contracts and foreign currency translation
|
1,802,346 | |||
|
Adviser's Incentive Allocation
|
(369,056 | ) | ||
|
Members' Equity at September 30, 2014
|
$ | 59,275,227 | ||
|
Units outstanding at March 31, 2013
|
1,073,144 | |||
|
Units sold
|
1,709,647 | |||
|
Units repurchased
|
(4,600 | ) | ||
|
Units outstanding at March 31, 2014
|
2,778,191 | |||
|
Units sold
|
1,702,142 | |||
|
Units repurchased
|
(92,500 | ) | ||
|
Units outstanding at September 30, 2014
|
4,387,833 | |||
The accompanying notes are an integral part of these Consolidated Financial Statements.
3
Partners Group Private Equity (Institutional TEI), LLC
(a Delaware Limited Liability Company)
Consolidated Statement of Cash Flows – For the Six Months Ended September 30, 2014 (Unaudited)
|
CASH FLOWS FROM OPERATING ACTIVITIES
|
||||
|
Net Increase in Members' Equity from Operations
|
$ | 3,256,354 | ||
|
Adjustments to reconcile Net Increase in Members' Equity from Operations to net cash used in
operating activities:
|
||||
|
Purchases of interests in Partners Group Private Equity (Master Fund), LLC
|
(20,652,816 | ) | ||
|
Net investment income allocated from Partners Group Private Equity (Master Fund), LLC
|
(265,208 | ) | ||
|
Net realized gain from investments and forward foreign currency contracts allocated from
Partners Group Private Equity (Master Fund), LLC
|
(112,109 | ) | ||
|
Net realized gain distributions from primary and secondary investments allocated from Partners
Group Private Equity (Master Fund), LLC
|
(1,511,247 | ) | ||
|
Net change in accumulated unrealized appreciation on investments, forward foreign currency
contracts and foreign currency translation allocated from Partners Group Private Equity
(Master Fund), LLC
|
(1,716,547 | ) | ||
|
Adviser's Incentive Allocation allocated from Partners Group Private Equity (Master Fund), LLC
|
369,056 | |||
|
Decrease in interest receivable
|
29 | |||
|
Increase in prepaid assets
|
(17,074 | ) | ||
|
Increase in professional fees payable
|
7,000 | |||
|
Decrease in accounting and administration fees payable
|
(7,339 | ) | ||
|
Decrease in custodian fees payable
|
(400 | ) | ||
|
Decrease in withholding taxes payable
|
(110 | ) | ||
|
Decrease in other expenses payable
|
(2,234 | ) | ||
|
Net Cash Used in Operating Activities
|
(20,652,645 | ) | ||
|
CASH FLOWS FROM FINANCING ACTIVITIES
|
||||
|
Members' capital contributions
|
21,863,641 | |||
|
Members' capital tenders
|
(1,210,996 | ) | ||
|
Net Cash Provided by Financing Activities
|
20,652,645 | |||
|
Net change in cash and cash equivalents
|
— | |||
|
Cash and cash equivalents at beginning of year
|
— | |||
|
Cash and cash equivalents at End of Year
|
$ | — | ||
The accompanying notes are an integral part of these Consolidated Financial Statements.
4
Partners Group Private Equity (Institutional TEI), LLC
(a Delaware Limited Liability Company)
Consolidated Financial Highlights
|
Six Months
Ended September 30, 2014
(Unaudited) |
Year Ended
March 31,
2014
|
Year Ended
March 31,
2013
|
Period from Commencement of Operations -
December 1, 2011 through March 31, 2012
|
|||||||||||||
|
Per Unit Operating Performance (1)
|
||||||||||||||||
|
NET ASSET VALUE, BEGINNING OF PERIOD
|
$ | 12.73 | $ | 11.21 | $ | 10.26 | (2) | $ | 10.00 | (2)(3) | ||||||
|
INCOME FROM INVESTMENT OPERATIONS:
|
||||||||||||||||
|
Net investment income (loss)
|
(0.01 | ) | 0.10 | 0.05 | (2) | 0.01 | (2) | |||||||||
|
Net realized and unrealized gain on investments
|
0.79 | 1.42 | 0.90 | (2) | 0.25 | (2) | ||||||||||
|
Net Increase in Members' Equity from Operations
|
0.78 | 1.52 | 0.95 | (2) | 0.26 | (2) | ||||||||||
|
NET ASSET VALUE, END OF PERIOD
|
$ | 13.51 | $ | 12.73 | $ | 11.21 | $ | 10.26 | (2) | |||||||
|
TOTAL RETURN (4)
|
6.13 | %(5) | 13.56 | % | 9.26 | % | 2.60 | %(5) | ||||||||
|
RATIOS AND SUPPLEMENTAL DATA:
|
||||||||||||||||
|
Net Assets, end of period in thousands (000's)
|
59,275 | 35,366 | 12,026 | 5,130 | ||||||||||||
|
Net investment income to average net assets, excluding Incentive Allocation
|
0.78 | %(6) | 1.58 | % | 0.83 | % | 0.35 | %(6) | ||||||||
|
Ratio of gross expenses to average net assets, excluding Incentive Allocation (7)
|
1.85 | %(6) | 2.10 | % | 2.89 | % | 3.92 | %(6)(8) | ||||||||
|
Ratio of expense recoupment (waiver) to average net assets
|
0.00 | %(6) | 0.27 | % | (0.47 | )% | (1.97 | )% | ||||||||
|
Ratio of net expenses to average net assets, excluding Incentive Allocation (9)
|
1.85 | %(6) | 2.37 | %(10) | 2.42 | %(10) | 1.95 | %(6)(8) | ||||||||
|
Ratio of Incentive Allocation to average net assets
|
0.73 | %(5) | 1.56 | % | 1.09 | % | 0.94 | %(6) | ||||||||
|
Portfolio Turnover
|
11.56 | %(5) | 26.77 | % | 15.47 | % | 8.39 | % | ||||||||
|
(1)
|
Selected data for a unit of membership interest outstanding throughout the period.
|
|
(2)
|
Adjusted for 100 for 1 change in units, effective October 1, 2012.
|
|
(3)
|
The net asset value for the beginning period December 1, 2011 (Commencement of Operations) through March 31, 2012 represents the initial contribution per unit of $10.
|
|
(4)
|
Total return based on per unit net asset value reflects the changes in net asset value based on the effects of the performance of the Fund during the period and assumes distribution, if any, were reinvested.
|
|
(5)
|
Not annualized.
|
|
(6)
|
Annualized.
|
|
(7)
|
Represents the ratio of expenses to average net assets absent fee waivers and/or expense reimbursement by/to the Adviser.
|
|
(8)
|
The organizational expenses are not annualized for the ratio calculation.
|
|
(9)
|
Effective September 26, 2011, the Fund’s expense ratio is voluntarily capped at 2.30%. See note 2.e. for a more thorough Expense Limitation Agreement discussion.
|
|
(10)
|
The Fund’s operating expenses include interest expense allocated from Partners Group Private Equity (Master Fund), LLC, and withholding tax, which are excluded from the Expense Limitation calculation. If interest expense and withholding tax were excluded from operating expenses, the net expense ratio would be 2.30%.
|
The accompanying notes are an integral part of these Consolidated Financial Statements.
5
Partners Group Private Equity (Institutional TEI), LLC
(a Delaware Limited Liability Company)
Notes to Consolidated Financial Statements – September 30, 2014 (Unaudited)
1. Organization
Partners Group Private Equity (Institutional TEI), LLC (the “Fund”) invests substantially all of its assets in Partners Group Private Equity (Offshore II), LDC (the “Offshore Fund”). The Offshore Fund is a Cayman Islands limited duration company with the same investment objective as the Fund. The Offshore Fund serves solely as an intermediary entity through which the Fund invests in Partners Group Private Equity (Master Fund), LLC (the “Master Fund”). The Offshore Fund enables tax-exempt Members (as defined below) to invest without receiving certain income in a form that would otherwise be taxable to such tax-exempt Members regardless of their tax-exempt status. The Fund owns 100% of the participating beneficial interest of the Offshore Fund. Where these Notes to Consolidated Financial Statements discuss the Fund’s investment in the Master Fund, it means its investment in the Master Fund through the Offshore Fund.
The Fund was organized as a limited liability company under the laws of the State of Delaware on May 25, 2010 and commenced operations on December 1, 2011. The Fund is registered under the Investment Company Act of 1940, as amended (the “1940 Act”), as a closed-end, non-diversified management investment company. The objective of the Fund is to seek attractive long-term capital appreciation by investing in a diversified portfolio of private equity investments. To achieve its objective, the Fund invests substantially all of its assets in limited liability company interests (“Interests”) in the Master Fund, a limited liability company organized under the laws of the State of Delaware, which is also registered under the 1940 Act. In addition to the Fund, three other closed-end, non-diversified investment companies also invest substantially all of their respective assets in Interests in the Master Fund (the Fund and each such other investment company, individually a “Feeder Fund” and collectively, the “Feeder Funds”). Collectively, the Feeder Funds own all of Interests in the Master Fund.
The Master Fund is managed by Partners Group (USA) Inc. (the “Adviser”), an investment adviser registered under the Investment Advisers Act of 1940, as amended. A board of managers (the “Board”) has overall responsibility for the management and supervision of the business operations of the Fund. The Board also acts as the board of managers of the Master Fund (the “Master Fund Board”) and of each of the other Feeder Funds. As permitted by applicable law, the Board may delegate any of its rights, powers and authority to, among others, the officers of the Fund, any committee of the Board, or the Adviser. Units of limited liability company interests in the Fund (“Units”) are offered only to investors that represent that they are an “accredited investor” within the meaning of Rule 501 under the Securities Act of 1933, as amended, and a “qualified client” within the meaning of Rule 205-3 under the Investment Advisers Act of 1940, as amended. Holders of Units (“Members”) of the Fund do not own any direct interest in the Master Fund.
The Fund’s consolidated financial statements should be read in conjunction with the Master Fund’s consolidated financial statements, which are included as Appendix I.
At September 30, 2014, the Fund owned 5.54% of the Interests in the Master Fund.
2. Significant Accounting Policies
The following is a summary of significant accounting and reporting policies used in preparing the consolidated financial statements.
a. Basis of Accounting
The Fund’s accounting and reporting policies conform with U.S. generally accepted accounting principles (“U.S. GAAP”).
b. Valuation of Investments
The Fund values its investment in the Master Fund at the net asset value of the Interests in the Master Fund owned by the Fund. The net asset value of the Interests in the Master Fund is determined by the Master Fund. Investments held by the Master Fund include direct equity and debt investments in operating companies (“Direct Investments”) and primary and secondary investments in private equity funds (“Private Equity Fund Investments”; Direct Investments and Private Equity Fund Investments, collectively, “Private Equity Investments”). The Master Fund values interests in Private Equity Investments at fair value in accordance with procedures (the “Valuation Procedures”), which have been approved by the Board and the Master Fund Board. The fair values of Private Equity Investments determined on behalf of the Master Fund by the Adviser in accordance with the Valuation Procedures are estimates. In the case of a Private Equity Fund Investment, the fair value is net of management and performance incentive fees or allocations that may be payable pursuant to the constituent documents of such investment fund.
6
Partners Group Private Equity (Institutional TEI), LLC
(a Delaware Limited Liability Company)
Notes to Consolidated Financial Statements – September 30, 2014 (Unaudited) (continued)
2. Significant Accounting Policies (continued)
c. Allocations from the Master Fund
In accordance with U.S. GAAP, the Fund, as the holder of Interests in the Master Fund, records in its consolidated financial statements its allocated portion of income, expense, realized gains and losses and unrealized appreciation and depreciation in the Master Fund.
d. Fund Level Income and Expenses
Income, including interest income on any cash or cash equivalents held by the Fund, and expenses are recognized and recorded on an accrual basis. Expenses that are specifically attributed to the Fund are accrued and charged to the Fund. Although the Fund bears its proportionate share of the management fees paid by the Master Fund, the Fund pays no direct management fee to the Adviser.
e. Expense Limitation Agreement
Effective September 26, 2011, the Adviser entered into an expense limitation agreement (the “Expense Limitation Agreement”) with the Fund, whereby the Adviser has agreed to waive fees that it would otherwise be paid, and/or to assume expenses of the Fund (a “Waiver”), if required to ensure the Total Annual Expenses (excluding taxes, interest, brokerage commissions, certain transaction-related expenses, extraordinary expenses, the Incentive Allocation (as defined below) and any acquired fund fees and expenses) do not exceed 2.30% on an annualized basis (the “Expense Limit”). For a period not to exceed three years from the date on which a Waiver is made, the Adviser may recoup amounts waived or assumed, provided it is able to effect such recoupment and remain in compliance with the Expense Limit. The Expense Limitation Agreement may be terminated by the Adviser or the Fund upon thirty days’ written notice to the other party. As of September 30, 2014, there were no amounts waived or assumed that are subject for recoupment by Adviser.
f. Tax Basis Reporting
Because the Master Fund invests primarily in investments that are treated as partnerships for U.S. federal income tax purposes, the tax character of the Fund’s allocated earnings depends on the tax filings of the Private Equity Investments. Accordingly, the tax bases of these allocated earnings and the related balances are not available as of the reporting date.
g. Income Taxes
For U.S. federal income tax purposes, the Fund is treated as a partnership, and each Member in the Fund is treated as the owner of its allocated share of the net assets, income, expenses, and the realized and unrealized gains (losses) of the Fund. Accordingly, no U.S. federal, state or local income taxes are paid by the Fund on the income or gains of the Fund since the Members are individually liable for the taxes on their allocated share of such income or gains of the Fund.
The Adviser determines whether a tax position of the Fund is more likely than not to be sustained upon examination, including resolution of any related appeals or litigation processes, based on the technical merits of the position. For tax positions meeting the more likely than not threshold, the tax amount recognized in the consolidated financial statements is reduced by the largest benefit that has a greater than fifty percent likelihood of being realized upon ultimate settlement with the relevant taxing authority.
The Fund files tax returns as prescribed by the tax laws of the jurisdictions in which it operates. In the normal course of business, the Fund is subject to examination by U.S. federal, state, local and foreign jurisdictions, where applicable. As of September 30, 2014, the tax years from the year 2011 forward remain subject to examination by the major tax jurisdictions under the statute of limitations.
h. Cash and Cash Equivalents
Pending investment in the Master Fund, the Fund holds cash and cash equivalents including amounts held in interest bearing deposit accounts. At times, those amounts may exceed federally insured limits. The Fund has not experienced any losses in such accounts and does not believe that it is exposed to any significant credit risk on such accounts.
7
Partners Group Private Equity (Institutional TEI), LLC
(a Delaware Limited Liability Company)
Notes to Consolidated Financial Statements – September 30, 2014 (Unaudited) (continued)
2. Significant Accounting Policies (continued)
i. Use of Estimates
The preparation of financial statements in conformity with U.S. GAAP requires that management makes estimates and assumptions that affect the reported amounts of assets and liabilities and disclosure of contingent assets and liabilities at the date of the consolidated financial statements, and the reported amounts of increases and decreases in Members’ capital from operations during the reporting period. Actual results can differ from those estimates.
j. Consolidated Financial Statements
The asset, liability, and equity accounts of the Fund are consolidated with the Offshore Fund as presented in the Consolidated Statement of Assets, Liabilities and Members’ Equity. All significant intercompany accounts and transactions have been eliminated in consolidation.
3. Fair Value Measurements
The Fund records its investment in the Master Fund at the net asset value of the Interests in the Master Fund owned by the Fund. The Master Fund’s disclosure with respect to investments held by the Master Fund under the three-tier hierarchy is discussed in the Notes to the Master Fund’s consolidated financial statements.
4. Allocation to Members’ Capital Accounts
Net profits or net losses of the Fund for each Allocation Period (as defined below) are allocated among and credited to or debited against the Members’ capital accounts in proportion to the number of Units owned by Members. Each Allocation Period begins on the day after the last day of the preceding Allocation Period and ends at the close of business on the first to occur thereafter of: (1) the last day of a calendar month, (2) the last day of a taxable year, (3) the day preceding a day on which Units are purchased, (4) a day on which Units are repurchased by the Fund pursuant to tenders of Units by Members, or (5) a day on which any amount is credited to or debited from the capital account of any Member other than an amount to be credited to or debited from the capital accounts of all Members in accordance with their respective investment percentages.
The Fund maintains a separate capital account in its records for each Member. As of any date, the capital account balance of a Member is equal to the net asset value per Unit as of such date, multiplied by the number of Units held by such Member. Any amounts charged or debited against a Member’s capital account under the Fund’s ability to allocate special items and to accrue reserves (other than among all Members in accordance with the number of Units held by each Member) are treated as a partial repurchase of such Member’s Units for no additional consideration as of the date on which the Board determines such charge or debit is required to be made. Additionally, such Member’s Units are reduced thereby as appropriately determined by the Fund. Any amounts credited to a Member’s capital account under the Fund’s ability to allocate special items and to accrue reserves (other than among all Members in accordance with the number of Units held by each such Member) are treated as an issuance of additional Units to such Member for no additional consideration as of the date on which the Board determines such credit is required to be made. Additionally, such Member’s Units are increased thereby as appropriately determined by the Fund. As of September 30, 2014, there have been no special items or accrued receivables allocated to Members’ capital accounts.
5. Subscriptions and Repurchase of Units
Units are generally offered for purchase as of the first day of each calendar month, but may be offered more or less frequently as determined by the Board in its sole discretion.
The Board may, from time to time and in its sole discretion, cause the Fund to repurchase Units from Members pursuant to written tenders by Members at such times and on such terms and conditions as established by the Board. In determining whether the Fund should offer to repurchase Units, the Board considers whether the Master Fund is making a contemporaneous repurchase offer for Interests in the Master Fund, as well as a variety of other operational, business and economic factors. The Adviser anticipates recommending to the Master Fund Board that, under normal circumstances, the Master Fund conduct repurchase offers of no more than 5% of the Master Fund’s net assets quarterly on or about each January 1st, April 1st, July 1st and October 1st. It is anticipated that the Fund will generally conduct repurchase offers contemporaneously with repurchase offers conducted by the Master Fund. A 2.00% early repurchase fee will be charged by the Fund with respect to any repurchase of Units from a Member at any time prior to the day immediately preceding the first anniversary of the Member’s purchase of such Units.
8
Partners Group Private Equity (Institutional TEI), LLC
(a Delaware Limited Liability Company)
Notes to Consolidated Financial Statements – September 30, 2014 (Unaudited) (continued)
6. Related Party Transactions and Other
An incentive allocation (“Incentive Allocation”) is calculated at the Master Fund and allocated to the Fund based on the Fund’s ownership of Interests in the Master Fund. The Incentive Allocation is equal to 10% of the excess, if any, of (i) the allocable share of the net profits of the Master Fund for the relevant period of each member of the Master Fund, including the Fund, over (ii) the then balance, if any, of that member’s Loss Recovery Account (as defined below). The Incentive Allocation is debited from such member’s capital account and credited to a capital account of the Adviser (or, to the extent permitted by applicable law, of an affiliate of the Adviser) in the Master Fund (the “Incentive Allocation Account”). The Incentive Allocation Account is maintained solely for the purpose of allocating the Incentive Allocation, and thus, the Incentive Allocation Account does not participate in the net profits and losses of the Master Fund.
The Master Fund maintains a memorandum account for each member of the Master Fund, including the Fund (each, a “Loss Recovery Account”). Each member’s Loss Recovery Account has an initial balance of zero and is (i) increased upon the close of each Allocation Period of the Master Fund by the amount of the relevant member’s allocable share of the net losses of the Master Fund for the Allocation Period, and (ii) decreased (but not below zero) upon the close of such Allocation Period by the amount of such member’s allocable share of the net profits of the Master Fund for the Allocation Period. The Incentive Allocation is calculated, charged to each member of the Master Fund and credited to the Incentive Allocation Account as of the end of each Allocation Period. The Allocation Period for a member whose Interest in the Master Fund is repurchased or is transferred in part is treated as ending only for the portion of the Interest so repurchased or transferred. In addition, only the net profits of the Master Fund, if any, and the balance of the Loss Recovery Account attributable to the portion of the Interest being repurchased or transferred (based on the member’s capital account amount being so repurchased or transferred) is taken into account in determining the Incentive Allocation for the Allocation Period then ending. The member’s Loss Recovery Account is not adjusted for such member’s allocable share of the net losses of the Master Fund, if any, for the Allocation Period then ending that are attributable to the portion of the Interest so repurchased or transferred. For the six month period ended September 30, 2014, an Incentive Allocation of $369,056 was credited to the Incentive Allocation Account from the Fund’s capital account in the Master Fund.
UMB Fund Services, Inc. (the “Administrator”) serves as administrator and accounting agent to the Fund and provides certain accounting, record keeping and investor related services. For these services the Administrator receives a fixed monthly fee, based upon average net assets, and a monthly fee based on the number of Member accounts as well as reasonable out of pocket expenses. For the six month period ended September 30, 2014, the Fund paid $27,936 in administration and accounting fees.
7. Risk Factors
An investment in the Fund involves significant risks that should be carefully considered prior to investment and should only be considered by persons financially able to maintain their investment and who can afford a loss of a substantial part or all of such investment. The Master Fund invests substantially all of its available capital in Private Equity Investments. These investments are generally restricted securities that are subject to substantial holding periods and are not traded in public markets. As a result, the Master Fund may not be able to resell some of its holdings for extended periods, which may be several years. No guarantee or representation is made that the Fund’s investment objective will be met.
A further discussion of the risks associated with the Fund’s investment in the Master Fund is provided in Note 11 of the Notes to the Master Fund’s consolidated financial statements, the Fund’s Confidential Private Placement Memorandum and the Fund’s Statement of Additional Information.
8. Indemnification
In the normal course of business, the Fund enters into contracts that may provide general indemnification. The Fund’s maximum exposure under these agreements is dependent on future claims that may be made against the Fund under such agreements, and therefore, cannot be established; however, based on management’s experience, the risk of loss from such claims is considered remote.
9. Subsequent Events
Management has evaluated the impact of all subsequent events on the Fund and has determined that there were no subsequent events that require disclosure in the consolidated financial statements.
9
Partners Group Private Equity (Institutional TEI), LLC
(a Delaware Limited Liability Company)
Other Information (Unaudited)
Proxy Voting
The Fund is required to file Form N-PX, with its complete proxy voting record for the twelve months ended June 30, no later than August 31. The Fund’s Form N-PX filing is available: (i) without charge, upon request, by calling the Fund at 1-877-748-7209 or (ii) by visiting the SEC’s website at www.sec.gov.
Availability of Quarterly Portfolio Schedules
The Fund files its complete schedule of portfolio holdings with the SEC for the first and third quarters of each fiscal year on Form N-Q. The Fund’s Form N-Q is available, without charge and upon request, on the SEC’s website at www.sec.gov or may be reviewed and copied at the SEC’s Public Reference Room in Washington, DC. Information on the Public Reference Room may be obtained by calling 1-800-SEC-0330.
10
PARTNERS GROUP PRIVATE EQUITY (MASTER FUND), LLC
(a Delaware Limited Liability Company)
Semi-Annual Report
For the Six Months Ended September 30, 2014
(Unaudited)
Partners Group Private Equity (Master Fund), LLC
(a Delaware Limited Liability Company)
Table of Contents
For the Six Months Ended September 30, 2014 (Unaudited)
|
Consolidated Schedule of Investments
|
1-5
|
|
Consolidated Statement of Assets, Liabilities and Members' Equity
|
6
|
|
Consolidated Statement of Operations
|
7
|
|
Consolidated Statements of Changes in Members' Equity
|
8
|
|
Consolidated Statement of Cash Flows
|
9
|
|
Consolidated Financial Highlights
|
10
|
|
Notes to Consolidated Financial Statements
|
11-19
|
|
Other Information
|
20
|
Partners Group Private Equity (Master Fund), LLC
(a Delaware Limited Liability Company)
Consolidated Schedule of Investments – September 30, 2014 (Unaudited)
INVESTMENT PORTFOLIO AS A PERCENTAGE OF TOTAL MEMBERS’ EQUITY
Percentages as a percentage of total investments are as follows:
|
Private Equity Investments (86.37%)
Direct Investments * (46.50%)
Direct Equity (28.61%)
|
Investment Type
|
Geographic
Region b
|
Fair
Value **
|
|||
|
ACP Viking Co-Investment, LLC a, c
|
Member interest
|
North America
|
$ | 2,963,842 | ||
|
Action Holding BV a, c
|
Common equity
|
Western Europe
|
385,826 | |||
|
Apollo Overseas Co-Investors (MHE), L.P. a, c
|
Limited partnership interest
|
North America
|
6,583,702 | |||
|
Astorg Co-Invest Kerneos, FCPI a, c
|
Common equity
|
Western Europe
|
9,933,206 | |||
|
ATX Networks Holdings, LLC a, c
|
Member interest
|
North America
|
95,707 | |||
|
Aurora Products Group, LLC a
|
Member interest
|
North America
|
357,760 | |||
|
CapitalSpring Finance Company a, c
|
Warrants
|
North America
|
590,699 | |||
|
Carlyle Retail Turkey Partners, L.P. a, c
|
Limited partnership interest
|
South America
|
6,883,970 | |||
|
CCM Pharma Debtco Limited a
|
Common equity
|
Western Europe
|
2,019,631 | |||
|
CD&R Univar Co-Investor, L.P. a, c
|
Limited partnership interest
|
North America
|
3,147,318 | |||
|
Centauro Co-Investment Fund, L.P. a, c
|
Limited partnership interest
|
South America
|
7,929,461 | |||
|
CT Holdings (International) Limited a
|
Common equity
|
Asia - Pacific
|
2,276,465 | |||
|
DLJSAP BookCO, LLC a, c
|
Member interest
|
South America
|
717,078 | |||
|
EQT Marvin Co-Investment, L.P. a, c
|
Limited partnership interest
|
Western Europe
|
1,947,642 | |||
|
Eurodrip Co-Investment Fund I, L.P. a, c
|
Limited partnership interest
|
Western Europe
|
11,783,476 | |||
|
Faster S.p.A. a, c
|
Common equity
|
Western Europe
|
17,425,495 | |||
|
Fermo Limited a, c
|
Common equity
|
Asia - Pacific
|
5,940,346 | |||
|
Fermo Limited a, c
|
Preferred equity
|
Asia - Pacific
|
2,821,553 | |||
|
Gemini Global Holdings Investors, LLC a, c
|
Member interest
|
North America
|
5,400,000 | |||
|
Genoa Holding Company, Inc. a, c
|
Common equity
|
North America
|
8,926,098 | |||
|
Globetrotter Investment & Co S.C.A. a, c
|
Common equity
|
Western Europe
|
2,193,779 | |||
|
Globetrotter Investment & Co S.C.A. a
|
Preferred equity
|
Western Europe
|
8,781,296 | |||
|
GTS II Cayman Corporation a, c
|
Common equity
|
South America
|
3,283,669 | |||
|
Hogan S.ar.l a, c
|
Common equity
|
Western Europe
|
1 | |||
|
Hogan S.ar.l a, c
|
Preferred equity
|
Western Europe
|
1,115,457 | |||
|
Kahuna Holdco Pty Limited a
|
Common equity
|
Asia - Pacific
|
967,719 | |||
|
KKBS Group Holdings, LLC a, c
|
Member interest
|
North America
|
205,735 | |||
|
KKBS Holdings, LLC a, c
|
Member interest
|
North America
|
107,489 | |||
|
KKR Matterhorn Co-Invest, L.P. a, c
|
Limited partnership interest
|
Western Europe
|
15,986,973 | |||
|
KLFS Holdings, L.P. a, c
|
Limited partnership interest
|
North America
|
2,822,000 | |||
|
Learning Care Group (US), Inc. a, c
|
Warrants
|
North America
|
8,179 | |||
|
Mauritius (Luxembourg) Investments S.ar.l. a, c
|
Common equity
|
Western Europe
|
2,059,253 | |||
|
MPH Acquisition Holdco, L.P. a, c
|
Limited partnership interest
|
North America
|
29,217,996 | |||
|
MPH Acquisition Holding, LLC a
|
Member interest
|
North America
|
1 | |||
|
NDES Holdings, LLC a, c
|
Member interest
|
North America
|
2,869,639 | |||
|
NTS Holding Corporation, Inc. a, c
|
Common equity
|
North America
|
3,307,011 | |||
|
Peer I S.A. a, c
|
Common equity
|
Western Europe
|
17,308,515 | |||
|
Peer I S.A. a
|
Preferred equity
|
Western Europe
|
2,531,663 | |||
|
QoL meds Holding Company, LLC a, c
|
Member interest
|
North America
|
11,592,335 | |||
|
R&R Co-Invest FCPR a, c
|
Common equity
|
Western Europe
|
16,409,888 | |||
|
Sabre Industries, Inc. a, c
|
Common equity
|
North America
|
939,384 | |||
|
S-Evergreen Holding Corp. a, c
|
Common equity
|
North America
|
428,930 | |||
|
Silver Lake Sumeru Marlin Co-Invest Fund, L.P. a, c
|
Limited partnership interest
|
North America
|
2,702,726 | |||
|
Snack Parent Corporation a, c
|
Preferred equity
|
North America
|
96,099 | |||
The accompanying notes are an integral part of these Consolidated Financial Statements.
1
Partners Group Private Equity (Master Fund), LLC
(a Delaware Limited Liability Company)
Consolidated Schedule of Investments – September 30, 2014 (Unaudited) (continued)
|
Private Equity Investments (continued)
Direct Investments * (continued)
Direct Equity (continued)
|
Investment Type
|
Geographic
Region b
|
Fair
Value **
|
|||
|
SPH GRD Acquisition Partners, LLC a, c
|
Member interest
|
North America
|
$ | 12,599,213 | ||
|
Spring Topco, Ltd. a, c
|
Common equity
|
North America
|
467,538 | |||
|
Strategic Partners, Inc. a
|
Common equity
|
North America
|
5,750,813 | |||
|
Surgery Center Holdings, Inc. a
|
Warrants
|
North America
|
95,799 | |||
|
Svensk Utbildning Intressenter Holding AB a, c
|
Common equity
|
Western Europe
|
346,803 | |||
|
Swissport II Co-Invest FCPR a, c
|
Common equity
|
Western Europe
|
6,530,396 | |||
|
THL Equity Fund VI Investors (BKFS), L.P. a, c
|
Limited partnership interest
|
North America
|
13,406,250 | |||
|
Valhalla Co-Invest, L.P. a
|
Limited partnership interest
|
Western Europe
|
2,556,412 | |||
|
Velocity Holdings L.P. a, c
|
Limited partnership interest
|
North America
|
1,592,600 | |||
|
Velocity Technologies Solutions, Inc. a, c
|
Common equity
|
North America
|
9,327,400 | |||
|
Virtuoso Lux I SarL a, c
|
Common equity
|
Western Europe
|
6,342,590 | |||
|
Virtuoso Lux I SarL a, c
|
Shareholder loan
|
Western Europe
|
15,630,655 | |||
|
WP Mustang Co-Invest-C, L.P. a, c
|
Limited partnership interest
|
North America
|
8,654,489 | |||
| 306,365,970 | ||||||
|
Direct Debt (17.89%)
|
Interest
|
Maturity
|
Investment Type
|
Geographic
Region b
|
Fair
Value **
|
|||
|
Ability Network Inc. a
|
Libor (1.00% floor) +
8.25%
|
5/16/2022
|
Second Lien
|
North America
|
$ | 11,500,000 | ||
|
Ability Network Inc. a
|
Libor (1.00% floor) +
5.00%
|
5/16/2021
|
Senior
|
North America
|
7,711,299 | |||
|
Attendo Care AB a
|
Euribor (1.25% floor) +
7.00% + 3.25% PIK
|
6/30/2019
|
Mezzanine
|
Western Europe
|
8,278,550 | |||
|
Attendo Care AB a
|
Euribor (1.25% floor) +
10.25% PIK
|
6/30/2019
|
Senior
|
Western Europe
|
2,989,959 | |||
|
ATX Networks Corp. a
|
12.00% + 2.00% PIK
|
5/12/2016
|
Mezzanine
|
North America
|
1,002,960 | |||
|
Beauty Holding Two AG a
|
Euribor + 5.50% + 6.00%
PIK
|
12/12/2020
|
Mezzanine
|
Western Europe
|
8,685,511 | |||
|
Biomnis a
|
7.00% + 7.00% PIK
|
9/3/2019
|
Senior
|
Western Europe
|
2,829,075 | |||
|
Biomnis a
|
6.55% PIK
|
9/3/2019
|
Senior
|
Western Europe
|
2,511,714 | |||
|
CapitalSpring Finance Company a
|
2.00% + 11.25% PIK
|
10/2/2019
|
Mezzanine
|
North America
|
7,453,760 | |||
|
CCM Pharma Debtco Limited a
|
Libor (1.50% floor) +
6.50% + 4.00% PIK
|
12/31/2020
|
Mezzanine
|
Western Europe
|
10,779,209 | |||
|
CDRH Parent, Inc. a
|
Libor (1.00% floor) +
8.00%
|
7/1/2022
|
Second Lien
|
North America
|
9,837,500 | |||
|
Evergreen ACQC01, L.P. a
|
10.25% |
7/11/2022
|
Mezzanine
|
North America
|
6,487,078 | |||
|
Global Tel*Link Corporation a
|
Libor (1.25% floor) +
7.75%
|
11/23/2020
|
Second Lien
|
North America
|
10,216,570 | |||
|
Global Tel*Link Corporation a
|
Libor (1.25% floor) +
3.75%
|
12/14/2017
|
Senior
|
North America
|
4,035,372 | |||
|
KACC Acquisition, LLC a
|
12.00% + 1.00% PIK
|
6/29/2018
|
Mezzanine
|
North America
|
4,349,726 | |||
|
Kahuna Bidco Pty Limited a
|
BBSY + 5.00% + 3.50%
PIK
|
12/31/2016
|
Mezzanine
|
Asia - Pacific
|
5,034,879 | |||
|
Learning Care Group (US) No. 2, Inc. a
|
Libor (1.00% floor) +
4.50%
|
5/5/2021
|
Senior
|
North America
|
6,216,518 | |||
|
Panda Temple Power Intermediate Holdings I, LLC a
|
Libor (0.50% floor) +
13.00% PIK
|
7/27/2020
|
Mezzanine
|
North America
|
7,107,633 | |||
|
Photonis Technologies S.A.S a
|
Libor (1.00% floor) +
7.50%
|
9/18/2019
|
Second Lien
|
Western Europe
|
8,986,591 | |||
|
Sabre Industries, Inc. a
|
10.00% |
2/22/2019
|
Mezzanine
|
North America
|
4,027,570 | |||
|
Securitas Direct Holding AB a
|
Euribor + 3.75% + 6.75%
PIK
|
9/2/2019
|
Mezzanine
|
Western Europe
|
7,229,326 | |||
|
Ship Luxco 3 S.a.r.l. a
|
Libor (1.25% floor) +
3.50%
|
11/30/2019
|
Senior
|
Western Europe
|
20,010,000 | |||
|
Springer Science+Business Media Deutschland GmbH a
|
Libor (1.00% floor) +
3.75%
|
8/14/2020
|
Senior
|
Western Europe
|
9,862,537 | |||
|
Sun Products Corporation (The) a
|
Libor (1.25% floor) +
4.25%
|
3/23/2020
|
Senior
|
North America
|
12,552,172 | |||
|
Surgery Center Holdings, Inc. a
|
Libor (1.25% floor) +
4.75%
|
4/11/2019
|
Senior
|
North America
|
4,862,125 | |||
|
TrustHouse Services Group a
|
Libor (1.25% floor) +
4.50%
|
4/15/2019
|
Senior
|
North America
|
7,060,446 | |||
| 191,618,080 | ||||||||
|
Total Direct Investments (46.50%)
|
$ | 497,984,050 | ||||||
The accompanying notes are an integral part of these Consolidated Financial Statements.
2
Partners Group Private Equity (Master Fund), LLC
(a Delaware Limited Liability Company)
Consolidated Schedule of Investments – September 30, 2014 (Unaudited) (continued)
|
Private Equity Investments (continued)
Secondary Investments* (32.94%)
|
Geographic
Region b
|
Fair
Value
|
|||
|
3i Europartners Vb, L.P. a
|
Western Europe
|
$ | 1,311,209 | ||
|
Abingworth Bioventures V Co-Investment Growth Equity Fund, L.P. a, c
|
Western Europe
|
731,751 | |||
|
Abingworth Bioventures V, L.P. a
|
Western Europe
|
688,721 | |||
|
Advent International GPE VI, L.P. a
|
Western Europe
|
4,775,408 | |||
|
Apax Europe VI - A, L.P. a
|
Western Europe
|
579,023 | |||
|
Apax Europe VII - B, L.P. a, c
|
Western Europe
|
689,305 | |||
|
Apollo Investment Fund IV, L.P. a, c
|
North America
|
6,612 | |||
|
Apollo Investment Fund VI, L.P. a
|
North America
|
1,325,684 | |||
|
Apollo Investment Fund VII, L.P. a
|
North America
|
1,041,170 | |||
|
Apollo Overseas Partners (Delaware) VII, L.P. a
|
North America
|
431,151 | |||
|
Ares Corporate Opportunities Fund III, L.P. a
|
North America
|
314,246 | |||
|
Bain Capital Fund X, L.P. a
|
North America
|
32,858,496 | |||
|
Bain Capital X Co-Investment Fund, L.P. a
|
North America
|
1,333,471 | |||
|
Baring Asia Private Equity Fund IV, L.P. a
|
Asia - Pacific
|
580,003 | |||
|
BC European Capital IX, L.P. a, c
|
Western Europe
|
3,229,685 | |||
|
Blackstone Capital Partners V/F, L.P. a
|
North America
|
4,025,379 | |||
|
Blackstone Capital Partners V-S, L.P. a
|
North America
|
549,098 | |||
|
Candover 2001 Fund UK No. 2, L.P. a
|
Western Europe
|
48,005 | |||
|
Candover 2005 Fund, L.P. a, c
|
Western Europe
|
1,220,039 | |||
|
Carlyle Europe Partners II, L.P. a
|
Western Europe
|
595,955 | |||
|
Carlyle Europe Partners III, L.P. a
|
Western Europe
|
16,055,365 | |||
|
Carlyle Japan International Partners II, L.P. a
|
Asia - Pacific
|
5,372,024 | |||
|
Carlyle Partners IV, L.P. a
|
North America
|
1,666,005 | |||
|
Carlyle Partners V, L.P. a
|
North America
|
1,158,242 | |||
|
Carlyle Partners V/B, L.P. a
|
North America
|
5,391,641 | |||
|
CCP IX LP No. 2 a, c
|
Western Europe
|
4,691,774 | |||
|
Citigroup Venture Capital International Growth Offshore I, L.P. a
|
Asia - Pacific
|
54,326 | |||
|
Citigroup Venture Capital International Growth Offshore II, L.P. a
|
Asia - Pacific
|
552,321 | |||
|
Citigroup Venture International Growth Partnership II, L.P. a
|
Asia - Pacific
|
1,662,155 | |||
|
Clayton, Dubilier & Rice Fund VII, L.P. a
|
North America
|
7,381,650 | |||
|
Clayton, Dubilier & Rice Fund VIII, L.P. a
|
North America
|
19,034,749 | |||
|
CVC Capital Partners Asia Pacific III, L.P. a
|
Asia - Pacific
|
3,970,318 | |||
|
CVC European Equity Partners Tandem Fund (A), L.P. a
|
Western Europe
|
440,905 | |||
|
CVC European Equity Partners V, L.P. a
|
Western Europe
|
4,593,735 | |||
|
daVinci Japan Real Estate Partners IV, L.P. a, c
|
Asia - Pacific
|
33,736 | |||
|
Duke Street VI US No. 1 Limited Partnership a
|
Western Europe
|
259,887 | |||
|
Fourth Cinven Fund, L.P. a
|
Western Europe
|
573,663 | |||
|
Frazier Healthcare VI, L.P. a
|
North America
|
1,130,487 | |||
|
FS Equity Partners V, L.P. a, c
|
North America
|
6,152,160 | |||
|
Green Equity Investors Side V, L.P. a
|
North America
|
2,087,941 | |||
|
Gryphon Partners 3.5, L.P. a
|
North America
|
1,331,944 | |||
|
Harvest Partners V, L.P. a
|
North America
|
438,785 | |||
|
Hellman & Friedman Capital Partners VI, L.P. a
|
North America
|
2,764,467 | |||
|
Hellman & Friedman Capital Partners VII, L.P. a
|
North America
|
1,847,568 | |||
|
H.I.G. Bayside Debt & LBO Fund II, L.P. a
|
North America
|
935,975 | |||
|
Highstar Capital III Prism Fund, L.P. a
|
North America
|
1,814,143 | |||
|
Investcorp Private Equity 2007 Fund, L.P. a
|
North America
|
5,649,012 | |||
|
Investcorp Technology Partners III (Cayman), L.P. a, c
|
North America
|
2,636,502 | |||
|
Irving Place Capital Investors II, L.P. a
|
North America
|
27,174 | |||
|
Irving Place Capital Partners III, L.P. a
|
North America
|
1,013,218 | |||
|
KKR European Fund III, L.P. a
|
Western Europe
|
6,225,344 | |||
|
Lightyear Fund II, L.P. a, c
|
North America
|
5,751,140 | |||
|
Madison Dearborn Capital Partners V-A and V-B, L.P. a
|
North America
|
8,002,718 | |||
|
Madison Dearborn Capital Partners VI-C, L.P. a
|
North America
|
1,168,265 | |||
|
MidOcean Partners III, L.P. a
|
North America
|
2,825,606 | |||
|
Montagu III, L.P. a
|
Western Europe
|
10,586 | |||
The accompanying notes are an integral part of these Consolidated Financial Statements.
3
Partners Group Private Equity (Master Fund), LLC
(a Delaware Limited Liability Company)
Consolidated Schedule of Investments – September 30, 2014 (Unaudited) (continued)
|
Private Equity Investments (continued)
Secondary Investments* (continued)
|
Geographic
Region b
|
Fair
Value
|
|||
|
Oak Investment Partners XII, L.P. a
|
North America
|
$ | 1,870,319 | ||
|
PAI Europe V a, c
|
Western Europe
|
2,722,892 | |||
|
Palladium Equity Partners III, L.P. a
|
North America
|
617,702 | |||
|
Pamlico Capital GP I, LLC a, c
|
North America
|
1 | |||
|
Pamlico Capital GP II, LLC a, c
|
North America
|
110,798 | |||
|
Pamlico Capital II, L.P. a, c
|
North America
|
4,418,291 | |||
|
Pamlico Capital Secondary Fund, L.P. a, c
|
North America
|
1 | |||
|
Permira Europe I, L.P. 1B a, c
|
North America
|
50,428 | |||
|
Permira Europe II, L.P. a, c
|
Western Europe
|
178,888 | |||
|
Permira Europe III, L.P. a
|
Western Europe
|
1,712,805 | |||
|
Permira IV Continuing, L.P. 1 a
|
Western Europe
|
18,235,197 | |||
|
Providence Equity Partners IV, L.P. a
|
North America
|
103,246 | |||
|
Providence Equity Partners V, L.P. a
|
North America
|
533,687 | |||
|
Providence Equity Partners VI, L.P. a
|
North America
|
15,548,413 | |||
|
Providence Equity Partners VII-A, L.P. a
|
North America
|
460,522 | |||
|
Riverside Europe Fund IV, L.P. a, c
|
Western Europe
|
2,796,302 | |||
|
Silver Lake Partners II, L.P. a
|
North America
|
713,115 | |||
|
Silver Lake Partners III, L.P. a
|
North America
|
13,853,505 | |||
|
Silver Lake Sumeru Fund, L.P. a
|
North America
|
313,540 | |||
|
Sun Capital Partners V, L.P. a
|
North America
|
24,725,828 | |||
|
TCV VI, L.P. a, c
|
North America
|
972,172 | |||
|
TCV VII (A), L.P. a, c
|
North America
|
11,518,401 | |||
|
Terra Firma Capital Partners III, L.P. a, c
|
Western Europe
|
13,134,493 | |||
|
Thomas H. Lee Parallel (DT) Fund VI, L.P. a
|
North America
|
2,517,167 | |||
|
Thomas H. Lee Parallel Fund VI, L.P. a
|
North America
|
2,251,381 | |||
|
TPG Partners V, L.P. a
|
North America
|
8,432,694 | |||
|
TPG Partners VI, L.P. a
|
North America
|
21,988,137 | |||
|
Tudor Ventures III, L.P. a, c
|
North America
|
4,658,913 | |||
|
Warburg Pincus Private Equity IX, L.P. a
|
North America
|
461,361 | |||
|
Warburg Pincus Private Equity X, L.P. a
|
North America
|
16,786,211 | |||
|
Total Secondary Investments (32.94%)
|
$ | 352,726,352 | |||
|
Primary Investments* (6.93%)
|
Geographic
Region b
|
Fair
Value
|
|||
|
Advent International GPE VII-B, L.P. a, c
|
North America
|
$ | 8,557,839 | ||
|
Altra Private Equity Fund II, L.P. a, c
|
South America
|
1,158,655 | |||
|
Apollo Investment Fund VIII, L.P. a, c
|
North America
|
817,253 | |||
|
Ares Corporate Opportunities Fund IV, L.P. a, c
|
North America
|
4,109,534 | |||
|
Avista Capital Partners II, L.P. a
|
North America
|
1,323,382 | |||
|
Avista Capital Partners III, L.P. a
|
North America
|
6,665,183 | |||
|
Baring Asia Private Equity Fund V, L.P. a
|
Asia - Pacific
|
2,989,843 | |||
|
CapVest Equity Partners III B, L.P. a, c
|
Western Europe
|
708,659 | |||
|
Carlyle Europe Partners, IV. a, c
|
Western Europe
|
362,742 | |||
|
Clayton, Dubilier & Rice Fund IX, L.P. a
|
North America
|
3,167,630 | |||
|
Crescent Mezzanine Partners VIB, L.P. a
|
North America
|
2,245,976 | |||
|
CVC Capital Partners VI (A) L.P. a, c
|
Western Europe
|
589,713 | |||
|
EQT VI (No.1) Limited Partnership a, c
|
Western Europe
|
3,463,727 | |||
|
Genstar Capital Partners VI, L.P. a
|
North America
|
2,959,837 | |||
|
Hony Capital Partners V, L.P. a
|
Asia - Pacific
|
5,191,672 | |||
|
KKR North America Fund XI, L.P. a, c
|
North America
|
5,692,264 | |||
|
Kohlberg TE Investors VII, L.P. a
|
North America
|
2,345,488 | |||
|
New Enterprise Associates 14, L.P. a, c
|
North America
|
3,162,825 | |||
|
Pátria - Brazilian Private Equity Fund IV, L.P. a, c
|
South America
|
1,970,705 | |||
|
PennantPark Credit Opportunities Fund, L.P. a
|
North America
|
11,732,681 | |||
The accompanying notes are an integral part of these Consolidated Financial Statements.
4
Partners Group Private Equity (Master Fund), LLC
(a Delaware Limited Liability Company)
Consolidated Schedule of Investments – September 30, 2014 (Unaudited) (continued)
|
Private Equity Investments (continued)
Primary Investments* (continued)
|
Geographic
Region b
|
Fair
Value
|
|||
|
Silver Lake Partners IV, L.P. a, c
|
North America
|
$ | 2,007,079 | ||
|
Windjammer Senior Equity Fund IV, L.P. a
|
North America
|
2,980,379 | |||
|
Total Primary Investments (6.93%)
|
$ | 74,203,066 | |||
|
Total Private Equity Investments (Cost $778,399,675) (86.37%)
|
$ | 924,913,468 | |||
|
Short-Term Investments (9.34%)
U.S. Government Treasury Obligations (9.34%)
|
Principal
|
Fair
Value
|
||||||
|
U.S. Treasury Bill, 0.008%, 10/02/2014 d
|
30,000,000 | $ | 29,999,993 | |||||
|
U.S. Treasury Bill, 0.010%, 11/06/2014 d
|
30,000,000 | 29,999,700 | ||||||
|
U.S. Treasury Bill, 0.023%, 12/04/2014 d
|
20,000,000 | 19,999,380 | ||||||
|
U.S. Treasury Bill, 0.025%, 12/26/2014 d
|
20,000,000 | 19,999,280 | ||||||
|
Total U.S. Government Treasury Obligations (9.34%)
|
$ | 99,998,353 | ||||||
|
Total Short-Term Investments (Cost $99,997,699) (9.34%)
|
$ | 99,998,353 | ||||||
|
Total Investments (Cost $878,397,374) (95.71%)
|
1,024,911,821 | |||||||
|
Other Assets in Excess of Liabilities (4.29%)
|
45,978,653 | |||||||
|
Members' Equity (100.00%)
|
$ | 1,070,890,474 | ||||||
|
*
|
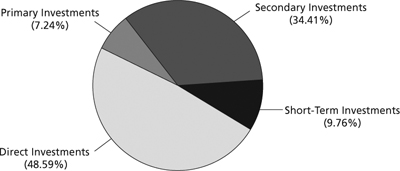
Direct private equity investments are private investments directly into the equity or debt of selected operating companies, often together with the management of the company. Primary investments are investments in newly established private equity partnerships where underlying portfolio companies are not known as of the time of investment. Secondary investments involve acquiring single or portfolios of assets on the secondary market.
|
|
**
|
The Fair Value of any Direct Investment may not necessarily reflect the current or expected future performance of such Direct Investment or the Fair Value of the Master Fund’s interest in such Direct Investment. Furthermore, the Fair Value of any Direct Investment has not been calculated, reviewed, verified or in any way approved by such Direct Investment or its general partner, manager or sponsor (including any of its affiliates). Please see Note 2.b for further detail regarding the valuation policy of the Master Fund.
|
|
a
|
Private equity investments are generally issued in private placement transactions and as such are generally restricted as to resale. Total cost and fair value of restricted portfolio funds as of September 30, 2014 was $778,399,675 and $924,913,468, respectively.
|
|
b
|
Geographic region is based on where a Direct Investment is headquartered and may be different from where such Investment invests or operates. In the case of Primary and Secondary Investments, geographic region generally refers to where the majority of the underlying assets are invested.
|
|
c
|
Non-income producing.
|
|
d
|
Each issue shows the rate of the discount at the time of purchase.
|
The accompanying notes are an integral part of these Consolidated Financial Statements.
5
Partners Group Private Equity (Master Fund), LLC
(a Delaware Limited Liability Company)
Consolidated Statement of Assets, Liabilities and Members’ Equity – September 30, 2014 (Unaudited)
|
Assets
|
||||
|
Private Equity Investments, at fair value (cost $778,399,675)
|
$ | 924,913,468 | ||
|
Short-term investments, at fair value (cost $99,997,699)
|
99,998,353 | |||
|
Cash and cash equivalents
|
93,255,265 | |||
|
Cash denominated in foreign currencies (cost $3,225,945)
|
2,551,944 | |||
|
Forward foreign currency contracts receivable
|
4,175,945 | |||
|
Investments in Private Equity Investments paid in advance
|
7,629,859 | |||
|
Interest receivable
|
1,613,656 | |||
|
Investment sales receivable
|
2,499,440 | |||
|
Prepaid assets
|
30,377 | |||
|
Total Assets
|
$ | 1,136,668,307 | ||
|
Liabilities
|
||||
|
Investment purchases payable
|
$ | 44,153,453 | ||
|
Repurchase amounts payable for tender offers
|
19,461,675 | |||
|
Management fee payable
|
1,137,562 | |||
|
Professional fees payable
|
410,733 | |||
|
Interest expense payable
|
482,210 | |||
|
Accounting and administration fees payable
|
89,485 | |||
|
Board of Managers' fees payable
|
22,500 | |||
|
Custodian fees payable
|
16,161 | |||
|
Other payable
|
4,054 | |||
|
Total Liabilities
|
$ | 65,777,833 | ||
|
Members' Equity
|
$ | 1,070,890,474 | ||
|
Members' Equity consists of:
|
||||
|
Members' Equity Paid-in
|
$ | 778,175,278 | ||
|
Accumulated net investment income
|
33,878,871 | |||
|
Accumulated net realized gain on investments, forward foreign currency contracts and foreign currency translation
|
108,819,934 | |||
|
Accumulated net unrealized appreciation on investments, forward foreign currency contracts and foreign currency translation
|
150,016,391 | |||
|
Total Members' Equity
|
$ | 1,070,890,474 | ||
The accompanying notes are an integral part of these Consolidated Financial Statements.
6
Partners Group Private Equity (Master Fund), LLC
(a Delaware Limited Liability Company)
Consolidated Statement of Operations – For the Six Months Ended September 30, 2014 (Unaudited)
|
Investment Income
|
||||
|
Dividends (net of $73,314 withholding tax)
|
$ | 3,304,163 | ||
|
Interest
|
9,335,754 | |||
|
Transaction fee income
|
52,184 | |||
|
Other income
|
287,541 | |||
|
Total Investment Income
|
12,979,642 | |||
|
Operating Expenses
|
||||
|
Management fee
|
6,477,581 | |||
|
Professional fees
|
477,123 | |||
|
Accounting and administration fees
|
266,188 | |||
|
Interest expense
|
189,684 | |||
|
Insurance expense
|
81,339 | |||
|
Custodian fees
|
55,644 | |||
|
Board of Managers' fees
|
45,000 | |||
|
Other expenses
|
265,810 | |||
|
Net Expenses
|
7,858,369 | |||
|
Net Investment Income
|
5,121,273 | |||
|
Net Realized Gain and Change in Unrealized Appreciation (Depreciation)
on Investments, Forward Foreign Currency Contracts and Foreign Currency
|
||||
|
Net realized gain from investments
|
3,114,516 | |||
|
Net realized gain on forward foreign currency contracts
|
227,152 | |||
|
Net realized gain distributions from primary and secondary investments
|
30,288,871 | |||
|
Net change in accumulated unrealized appreciation (depreciation) on:
|
||||
|
Investments
|
26,748,863 | |||
|
Foreign currency translation
|
(381,816 | ) | ||
|
Forward foreign currency contracts
|
5,314,416 | |||
|
Net Realized Gain and Change in Unrealized Appreciation (Depreciation) on
Investments, Forward Foreign Currency Contracts and Foreign Currency
|
65,312,002 | |||
|
Net Increase in Members’ Equity From Operations
|
$ | 70,433,275 | ||
The accompanying notes are an integral part of these Consolidated Financial Statements.
7
Partners Group Private Equity (Master Fund), LLC
(a Delaware Limited Liability Company)
Consolidated Statements of Changes in Members’ Equity – For the Periods Ended March 31, 2013 and September 30, 2014 (Unaudited)
|
Adviser’s
Equity
|
Members’
Equity
|
Total Members’ Equity
|
||||||||||
|
Members' Equity at March 31, 2013
|
$ | 1,269,039 | $ | 656,244,563 | $ | 657,513,602 | ||||||
|
Capital contributions
|
— | 245,760,013 | 245,760,013 | |||||||||
|
Capital tenders
|
(10,976,482 | ) | (64,098,298 | ) | (75,074,780 | ) | ||||||
|
Net investment income
|
— | 18,206,982 | 18,206,982 | |||||||||
|
Net realized gain from investments
|
— | 15,081,912 | 15,081,912 | |||||||||
|
Net realized loss on forward foreign currency contracts
|
— | (401,175 | ) | (401,175 | ) | |||||||
|
Net realized gain on foreign currency translation
|
— | 4,075 | 4,075 | |||||||||
|
Net realized gain distributions from primary and
secondary investments
|
— | 38,410,123 | 38,410,123 | |||||||||
|
Net change in accumulated unrealized appreciation on investments, forward foreign currency contracts and foreign currency translation
|
— | 52,949,438 | 52,949,438 | |||||||||
|
Adviser's Incentive Allocation from April 1, 2013
to March 31, 2014
|
12,420,143 | (12,420,143 | ) | — | ||||||||
|
Members' Equity at March 31, 2014
|
$ | 2,712,700 | $ | 949,737,490 | $ | 952,450,190 | ||||||
|
Capital contributions
|
— | 119,984,792 | 119,984,792 | |||||||||
|
Capital tenders
|
(5,948,010 | ) | (66,029,773 | ) | (71,977,783 | ) | ||||||
|
Net investment income
|
— | 5,121,273 | 5,121,273 | |||||||||
|
Net realized gain from investments
|
— | 3,114,516 | 3,114,516 | |||||||||
|
Net realized gain on forward foreign currency contracts
|
— | 227,152 | 227,152 | |||||||||
|
Net realized gain distributions from primary and secondary
investments
|
— | 30,288,871 | 30,288,871 | |||||||||
|
Net change in accumulated unrealized appreciation on investments, forward foreign currency contracts and foreign currency translation
|
— | 31,681,463 | 31,681,463 | |||||||||
|
Adviser's Incentive Allocation from April 1, 2014 to September 30, 2014
|
7,042,124 | (7,042,124 | ) | — | ||||||||
|
Members' Equity at September 30, 2014
|
$ | 3,806,814 | $ | 1,067,083,660 | $ | 1,070,890,474 | ||||||
The accompanying notes are an integral part of these Consolidated Financial Statements.
8
Partners Group Private Equity (Master Fund), LLC
(a Delaware Limited Liability Company)
Consolidated Statement of Cash Flows – For the Six Months Ended September 30, 2014 (Unaudited)
|
CASH FLOWS FROM OPERATING ACTIVITIES
|
||||
|
Net Increase in Members' Equity from Operations
|
$ | 70,433,275 | ||
|
Adjustments to reconcile Net Increase in Members' Equity from Operations to net cash provided by
operating activities:
|
||||
|
Net change in accumulated unrealized appreciation on investments, forward foreign currency
contracts and foreign currency translation
|
(31,681,463 | ) | ||
|
Net realized gain from investments, forward foreign currency contracts and foreign currency
translation
|
(33,630,539 | ) | ||
|
Purchases of Private Equity Investments
|
(130,649,542 | ) | ||
|
Distributions received from Private Equity Investments
|
100,890,102 | |||
|
Net (purchases) sales of common stocks
|
213,166 | |||
|
Net (purchases) sales of short-term investments
|
19,997,150 | |||
|
Net realized gain on forward foreign currency contracts
|
227,152 | |||
|
Net realized gain distributions from primary and secondary investments
|
30,288,871 | |||
|
Increase in investments in Private Equity Investments paid in advance
|
(7,629,859 | ) | ||
|
Decrease in interest receivable
|
412,457 | |||
|
Increase in investment sales receivable
|
(2,476,690 | ) | ||
|
Decrease in prepaid assets
|
14,209 | |||
|
Decrease in other receivable
|
114,000 | |||
|
Decrease in investment purchases payable
|
(3,993,501 | ) | ||
|
Decrease in management fee payable
|
(890,017 | ) | ||
|
Decrease in professional fees payable
|
(47,213 | ) | ||
|
Increase in interest expense payable
|
189,684 | |||
|
Decrease in accounting and administration fees payable
|
(78,724 | ) | ||
|
Decrease in Board of Managers' fees payable
|
(22,500 | ) | ||
|
Decrease in custodian fees payable
|
(7,602 | ) | ||
|
Decrease in other payable
|
(325,748 | ) | ||
|
Net Cash Provided by Operating Activities
|
11,346,668 | |||
|
CASH FLOWS FROM FINANCING ACTIVITIES
|
||||
|
Proceeds from Members' capital contributions
|
119,984,792 | |||
|
Distributions for Members' capital tenders
|
(73,456,987 | ) | ||
|
Net Cash Provided by Financing Activities
|
46,527,805 | |||
|
Net change in cash and cash equivalents
|
57,874,473 | |||
|
Effect of exchange rate changes on cash
|
(381,816 | ) | ||
|
Cash and cash equivalents at beginning of year
|
38,314,552 | |||
|
Cash and cash equivalents at End of Year
|
$ | 95,807,209 | ||
The accompanying notes are an integral part of these Consolidated Financial Statements.
9
Partners Group Private Equity (Master Fund), LLC
(a Delaware Limited Liability Company)
Consolidated Financial Highlights
|
Six Months Ended September 30,
2014 (Unaudited)
|
Year Ended March 31, 2014
|
Year Ended March 31, 2013
|
Year Ended March 31, 2012
|
Year Ended March 31, 2011
|
Period from Commencement of Operations -
July 1, 2009 through
March 31, 2010
|
|||||||||||||||||||
|
Total Return Before Incentive Allocation(1)
|
7.02 | %(3) | 15.94 | % | 11.20 | % | 9.11 | % | 11.08 | % | 4.30 | %(3) | ||||||||||||
|
Total Return After Incentive Allocation(1)
|
6.46 | %(3) | 14.55 | % | 10.21 | % | 8.33 | % | 9.95 | % | 3.80 | %(3) | ||||||||||||
|
RATIOS AND SUPPLEMENTAL DATA:
|
||||||||||||||||||||||||
|
Net Assets, end of period in thousands (000's)
|
$ | 1,070,890 | $ | 952,450 | $ | 657,514 | $ | 384,488 | $ | 166,326 | $ | 28,214 | ||||||||||||
|
Net investment income (loss) to average net assets before Incentive Allocation
|
1.00 | %(4) | 2.20 | % | 1.48 | % | 1.17 | % | (0.06 | )% | (3.02 | )%(4) | ||||||||||||
|
Ratio of gross expenses to average net assets, excluding Incentive Allocation (2)
|
1.54 | %(4) | 1.68 | % | 1.65 | % | 1.63 | % | 2.20 | % | 4.96 | %(5) | ||||||||||||
|
Incentive Allocation to average net assets
|
0.69 | %(3) | 1.50 | % | 1.07 | % | 0.86 | % | 1.86 | % | 0.99 | %(3) | ||||||||||||
|
Ratio of gross expenses and Incentive Allocation to average net assets (2)
|
2.23 | %(4)(5) | 3.18 | % | 2.72 | % | 2.49 | % | 4.06 | % | 5.95 | %(4)(5) | ||||||||||||
|
Expense waivers to average net assets
|
0.00 | %(4) | 0.00 | % | 0.00 | % | 0.00 | % | (0.02 | )% | (1.16 | )%(4) | ||||||||||||
|
Ratio of net expenses and Incentive Allocation to average net assets
|
2.23 | %(4)(5) | 3.18 | % | 2.72 | % | 2.49 | % | 4.04 | % | 4.79 | %(4) | ||||||||||||
|
Ratio of net expenses to average net assets, excluding Incentive Allocation
|
1.54 | %(4)(5) | 1.68 | % | 1.65 | % | 1.63 | % | 2.18 | % | 3.79 | %(4)(5) | ||||||||||||
|
Portfolio Turnover
|
11.56 | %(3) | 26.77 | % | 15.47 | % | 8.39 | % | 5.71 | % | 13.05 | %(3)(5) | ||||||||||||
|
(1)
|
Total investment return reflects the changes in net asset value based on the effects of the performance of the Master Fund during the period and adjusted for cash flows related to capital contributions or withdrawals during the period.
|
|
(2)
|
Represents the ratio of expenses to average net assets absent fee waivers and/or expense reimbursement by/to the Adviser.
|
|
(3)
|
Not annualized.
|
|
(4)
|
Annualized.
|
|
(5)
|
The Incentive Allocation and/or organizational expenses are not annualized.
|
The accompanying notes are an integral part of these Consolidated Financial Statements.
10
Partners Group Private Equity (Master Fund), LLC
(a Delaware Limited Liability Company)
Notes to Consolidated Financial Statements – September 30, 2014 (Unaudited)
1. Organization
Partners Group Private Equity (Master Fund), LLC (the “Master Fund”) was organized as a limited liability company under the laws of the State of Delaware on August 4, 2008 and commenced operations on July 1, 2009. The Master Fund is registered under the Investment Company Act of 1940, as amended (the “1940 Act”), as a closed-end, non-diversified management investment company. The Master Fund is managed by Partners Group (USA) Inc. (the “Adviser”), an investment adviser registered under the Investment Advisers Act of 1940, as amended. A board of managers (the “Board”) has overall responsibility for the management and supervision of the business operations of the Master Fund. As permitted by applicable law, the Board may delegate any of its rights, powers and authority to, among others, the officers of the Master Fund, any committee of the Board, or the Adviser. The objective of the Master Fund is to seek attractive long-term capital appreciation by investing in a diversified portfolio of private equity investments. The Master Fund may make investments through its wholly-owned subsidiary, Partners Group Private Equity (Subholding), LLC (the “Subsidiary”). The Board has oversight responsibility for the Master Fund’s investment in the Subsidiary and the Master Fund’s role as sole member of the Subsidiary.
The Master Fund is a master investment portfolio in a master-feeder structure. Partners Group Private Equity, LLC, Partners Group Private Equity (Institutional), LLC, Partners Group Private Equity (TEI), LLC, and Partners Group Private Equity (Institutional TEI), LLC, (collectively “the Feeder Funds”) invest substantially all of their assets, directly or indirectly, in the limited liability company interests (“Interests”) of the Master Fund and become members, directly or indirectly, of the Master Fund (“Members”).
2. Significant Accounting Policies
The following is a summary of significant accounting and reporting policies used in preparing the consolidated financial statements.
a. Basis of Accounting
The Master Fund’s accounting and reporting policies conform with U.S. generally accepted accounting principles (“U.S. GAAP”).
b. Valuation of Investments
Investments held by the Master Fund include direct equity and debt investments in operating companies (“Direct Investments”) and primary and secondary investments in private equity funds (“Private Equity Fund Investments”; Direct Investments and Private Equity Fund Investments, collectively, “Private Equity Investments”).
The Master Fund estimates the fair value of its Private Equity Investments in conformity with U.S. GAAP. The Master Fund’s valuation procedures (the “Valuation Procedures”), which have been approved by the Board, require evaluation of all relevant factors available at the time the Master Fund values its investments. The inputs or methodologies used for valuing the Master Fund’s Private Equity Investments are not necessarily an indication of the risk associated with investing in those investments.
Direct Investments
In assessing the fair value of non-traded Direct Investments, the Master Fund uses a variety of methods such as the time of last financing, earnings and multiple analysis, discounted cash flow and third party valuation, and makes assumptions that are based on market conditions existing at the end of each reporting period. Quoted market prices or dealer quotes for certain similar instruments are used for long-term debt investments where appropriate. Other techniques, such as option pricing models and estimated discounted value of future cash flows, are used to determine fair value for the remaining financial instruments.
Private Equity Fund Investments
The fair values of Private Equity Fund Investments determined by the Adviser in accordance with the Valuation Procedures are estimates. These estimates are net of management and performance incentive fees or allocations payable pursuant to the respective organizational documents of the Private Equity Fund Investments. Ordinarily, the fair value of a Private Equity Fund Investment is based on the net asset value of that Private Equity Fund Investment reported by its investment manager. If the Adviser determines that the most recent net asset value reported by the investment manager of a Private Equity Fund Investment does not represent fair value or if the manager of a Private Equity Fund Investment fails to report a net asset value to the Master Fund, a fair value determination is made by the Adviser in accordance with the Valuation Procedures. In making that determination, the Adviser will consider whether it is appropriate, in light of all relevant circumstances, to value such Private Equity Fund Investment at the net asset value last reported by its
11
Partners Group Private Equity (Master Fund), LLC
(a Delaware Limited Liability Company)
Notes to Consolidated Financial Statements – September 30, 2014 (Unaudited) (continued)
2. Significant Accounting Policies (continued)
b. Valuation of Investments (continued)
investment manager, or whether to adjust such value to reflect a premium or discount to such net asset value. Because of the inherent uncertainty in valuation, the estimated values may differ from the values that would have been used had a ready market for the securities existed, and the differences could be material.
Daily Traded Investments
The Master Fund values investments traded (1) on one or more of the U.S. national securities exchanges or the OTC Bulletin Board, at their last sales price, or (2) on NASDAQ at the NASDAQ Official Closing Price, at the close of trading on the exchanges or markets where such securities are traded for the business day as of the relevant determination date. If no sale or official closing price of particular securities are reported on a particular day, the securities will be valued at the closing bid price for securities held long, or the closing ask price for securities held short, or if a closing bid or ask price, as applicable, is not available, at either the exchange or system-defined closing price on the exchange or system in which such securities are principally traded. Securities traded on a foreign securities exchange generally are valued at their closing prices on the exchange where such securities are primarily traded and translated into U.S. dollars at the current exchange rate provided by a recognized pricing service.
Investments for which no prices are obtained under the foregoing procedures, including those for which a pricing service supplies no exchange quotation or a quotation that is believed by the Adviser not to reflect the market value, will be valued at the bid price, in the case of securities held long, or the ask price, in the case of securities held short, supplied by one or more dealers making a market in those securities or one or more brokers. High quality investment grade debt securities (e.g., treasuries, commercial paper, etc.) with a remaining maturity of 60 days or less are valued by the Adviser at amortized cost.
c. Cash and Cash Equivalents
Pending investment in Private Equity Investments and in order to maintain liquidity, the Master Fund holds cash, including amounts held in foreign currency and short-term interest bearing deposit accounts. At times, those amounts may exceed federally insured limits. The Master Fund has not experienced any losses in such accounts and does not believe that it is exposed to any significant credit risk on such accounts.
d. Foreign Currency Translation
The books and records of the Master Fund are maintained in U.S. Dollars. Generally, assets and liabilities denominated in non-U.S. currencies are translated into U.S. Dollar equivalents using valuation date exchange rates, while purchases, realized gains and losses, income and expenses are translated at the transaction date exchange rates. As of September 30, 2014 the Master Fund has 45 investments denominated in Euros, five investments denominated in British Pounds, two investments denominated in Australian Dollars, two investments denominated in Norwegian Kronor, two investments denominated in Swiss Francs, one investment denominated in Brazilian Real, one investment denominated in Hong Kong Dollars, one investment denominated in Japanese Yen and one investment denominated in Swedish Kronor. The Master Fund does not isolate the portion of the results of operations due to fluctuations in foreign exchange rates from changes in fair values of the investments during the period.
e. Forward Foreign Currency Exchange Contracts
The Master Fund may enter forward foreign currency exchange contracts as a way of managing foreign exchange rate risk. The Master Fund may enter into these contracts for the purchase or sale of a specific foreign currency at a fixed price on a future date as a hedge or cross hedge against either specific transactions or portfolio positions. The objective of the Master Fund’s foreign currency hedging transactions is to reduce the risk that the U.S. Dollar value of the Master Fund’s foreign currency denominated investments will decline in value due to changes in foreign currency exchange rates. All forward foreign currency exchange contracts are “marked-to-market” daily at the applicable translation rates resulting in unrealized gains or losses. Realized gains or losses are recorded at the time the forward foreign currency exchange contract is offset by entering into a closing transaction or by the delivery or receipt of the currency. Risk may arise upon entering into these contracts from the potential inability of counterparties to meet the terms of their contracts and from unanticipated movements in the value of a foreign currency relative to the U.S. Dollar.
12
Partners Group Private Equity (Master Fund), LLC
(a Delaware Limited Liability Company)
Notes to Consolidated Financial Statements – September 30, 2014 (Unaudited) (continued)
2. Significant Accounting Policies (continued)
e. Forward Foreign Currency Exchange Contracts (continued)
During the six month period ended September 30, 2014, the Master Fund entered into three short forward foreign currency exchange contracts. As disclosed in the Consolidated Statement of Operations, the Master Fund had $227,152 in net realized gains, and a $5,314,416 change in net unrealized appreciation on forward foreign currency exchange contracts.
At September 30, 2014, the Master Fund had two outstanding short forward foreign currency exchange contracts:
|
Contract Amount
|
Unrealized | |||||
|
Settlement Date
|
Currency
|
Buy
|
Sell
|
Value
|
Appreciation (Depreciation)
|
Counterparty
|
|
October 23, 2014
|
Euro (€)
|
$60,707,025
|
€45,000,000
|
$56,854,806
|
$3,852,219
|
Barclays Capital
|
|
December 18, 2014
|
Euro (€)
|
$38,237,409
|
€30,000,000
|
$37,913,683
|
$323,726
|
Barclays Capital
|
f. Investment Income
The Master Fund records distributions of cash or in-kind securities from Private Equity Investments at fair value based on the information from distribution notices when distributions are received. Thus, the Master Fund would recognize within the Consolidated Statement of Operations its share of realized gains or (losses) and the Master Fund’s share of net investment income or (loss) based upon information received regarding distributions from Private Equity Investments. Unrealized appreciation/depreciation on investments within the Consolidated Statement of Operations includes the Master Fund’s share of unrealized gains and losses, realized undistributed gains/losses, and the Master Fund’s share of undistributed net investment income or (loss) from Private Equity Investments for the relevant period.
g. Master Fund Expenses
The Master Fund bears all expenses incurred in the business of the Master Fund on an accrual basis, including, but not limited to, the following: all costs and expenses related to portfolio transactions and positions for the Master Fund’s account; legal fees; accounting, auditing, and tax preparation fees; custodial fees; fees for data and software providers; costs of insurance; registration expenses; board fees; and expenses of meetings of the Board.
h. Costs Relating to Purchases of Secondary Investments
Costs relating to purchases of secondary investments consist of imputed expenses relating to the amortization of deferred payments on investments purchased in secondary transactions. Such expenses are recognized on a monthly basis until the due date of a deferred payment. At due date the net present value of such payment equals the notional amount due to the respective counterparty.
i. Income Taxes
For U.S. federal income tax purposes, the Master Fund is treated as a partnership, and each Member of the Master Fund is treated as the owner of its allocated share of the net assets, income, expenses, and the realized and unrealized gains (losses) of the Master Fund. Accordingly, no U.S. federal, state or local income taxes are paid by the Master Fund on the income or gains of the Master Fund since the Members are individually liable for the taxes on their allocated share of such income or gains of the Master Fund.
The Adviser determines whether a tax position is more likely than not to be sustained upon examination, including resolution of any related appeals or litigation processes, based on the technical merits of the position. For tax positions meeting the more likely than not threshold, the tax amount recognized in the consolidated financial statements is reduced by the largest benefit that has a greater than fifty percent likelihood of being realized upon ultimate settlement with the relevant taxing authority.
13
Partners Group Private Equity (Master Fund), LLC
(a Delaware Limited Liability Company)
Notes to Consolidated Financial Statements – September 30, 2014 (Unaudited) (continued)
2. Significant Accounting Policies (continued)
i. Income Taxes (continued)
The Master Fund files tax returns as prescribed by the tax laws of the jurisdictions in which it operates. In the normal course of business, the Master Fund is subject to examination by U.S. federal, state, local and foreign jurisdictions, where applicable. As of September 30, 2014, the tax years from the year 2010 forward remain subject to examination by the major tax jurisdictions under the statute of limitations.
j. Use of Estimates
The preparation of financial statements in conformity with U.S. GAAP requires the Master Fund to make estimates and assumptions that affect the reported amounts of assets and liabilities and disclosure of contingent assets and liabilities at the date of the financial statements and the reported amounts of increases and decreases in capital from operations during the reporting period. Actual results can differ from those estimates.
k. Consolidated Financial Statements
The Consolidated Schedule of Investments, Statement of Assets and Liabilities, Statement of Operations, Statement of Changes in Members’ Equity, Statement of Cash Flows and Financial Highlights of the Master Fund include the accounts of the Subsidiary. All significant intercompany accounts and transactions have been eliminated in consolidation.
l. Disclosures about Offsetting Assets and Liabilities
The Master Fund is subject to Financial Accounting Standards Board’s (“FASB”) Disclosures about Offsetting Assets and Liabilities which requires an entity to disclose information about offsetting and related arrangements to enable users of its financial statements to understand the effect of those arrangements on its financial position. The guidance requires retrospective application for all comparative periods presented.
For financial reporting purposes, the Master Fund does not offset derivative assets and liabilities that are subject to Master Netting Agreements (“MNA”) or similar arrangements in the Consolidated Statement of Assets and Liabilities. The Master Fund has adopted the new disclosure requirements on offsetting in the following table:
The following table presents the Master Fund’s derivative assets by type, net of amounts available for offset under a MNA and net of the related collateral received by the Master Fund as of September 30, 2014:
|
Counterparty
|
Gross
Amounts of
Recognized
Assets
|
Gross Amounts Offset
in the Consolidated
Statement of Assets
and Liabilities
|
Net Amounts of
Assets Presented
in the Consolidated
Statement of Assets
and Liabilities
|
Collateral
Pledged
|
Net Amount 1
|
|
Barclays Capital
|
$4,175,945
|
$—
|
$—
|
$—
|
$4,175,945
|
|
1
|
Net amount represents the net amount receivable from the counterparty in the event of default.
|
14
Partners Group Private Equity (Master Fund), LLC
(a Delaware Limited Liability Company)
Notes to Consolidated Financial Statements – September 30, 2014 (Unaudited) (continued)
3. Fair Value Measurements
In conformity with U.S. GAAP, investments are classified in their entirety based on the lowest level of input that is significant to the fair value measurement. Estimated values may differ from the values that would have been used if a ready market existed or if the investments were liquidated at the valuation date. A three-tier hierarchy is used to distinguish between (1) inputs that reflect the assumptions market participants would use in pricing an asset or liability developed based on market data obtained from sources independent of the reporting entity (observable inputs) and (2) inputs that reflect the reporting entity’s own assumptions about the assumptions market participants would use in pricing an asset or liability developed based on the best information available in the circumstances (unobservable inputs) and to establish classification of fair value measurements for disclosure purposes. Various inputs are used in determining the value of the Master Fund’s investments. The inputs are summarized in the three broad levels listed below:
Valuation of Investments
|
•
|
Level 1 – Quoted prices are available in active markets for identical investments as of the measurement date. The type of investments included in Level 1 include marketable securities that are primarily traded on a securities exchange or over-the-counter. The fair value is determined to be the last sale price on the determination date, or, if no sales occurred on any such day, the mean between the closing bid and ask prices on such day. The Master Fund does not apply a blockage discount to the quoted price for these investments, even in situations where the Master Fund holds a large position and a sale could reasonably impact the quoted price.
|
|
•
|
Level 2 – Pricing inputs are other than quoted prices in active markets (i.e. Level 1 pricing) and fair value is determined through the use of models or other valuation methodologies through direct or indirect corroboration with observable market data. Investments which are generally included in this category include corporate notes, convertible notes, warrants and restricted equity securities. The fair value of legally restricted equity securities may be discounted depending on the likely impact of the restrictions on liquidity and the Adviser’s estimates.
|
|
•
|
Level 3 – Pricing inputs are unobservable for the investment and include situations where there is little, if any, market activity for the investment. The inputs into the determination of fair value require significant management judgment and/or estimation. Investments that are included in this category generally include equity investments that are privately owned, as well as convertible notes and warrants that are not actively traded. The fair value for investments using Level 3 pricing inputs are based on the Adviser’s estimates that consider a combination of various performance measurements including the timing of the transaction, the market in which the company operates, comparable market transactions, company performance and projections and various performance multiples as applied to earnings before interest, taxes, depreciation and amortization or a similar measure of earnings for the latest reporting period and forward earnings, as well as discounted cash flow analysis. The following table presents the Master Fund’s investments at September 30, 2014 measured at fair value. Due to the inherent uncertainty of valuations, estimated values may materially differ from the values that would have been used had a ready market for the securities existed.
|
|
Investments
|
Level 1
|
Level 2
|
Level 3
|
Total
|
||||||||||||
|
Direct Investments:
|
||||||||||||||||
|
Direct Equity Investments
|
$ | — | $ | — | $ | 306,365,970 | $ | 306,365,970 | ||||||||
|
Direct Debt Investments
|
— | — | 191,618,080 | 191,618,080 | ||||||||||||
|
Total Direct Investments*
|
$ | — | $ | — | $ | 497,984,050 | $ | 497,984,050 | ||||||||
|
Secondary Investments*
|
— | — | 352,726,352 | 352,726,352 | ||||||||||||
|
Primary Investments*
|
— | — | 74,203,066 | 74,203,066 | ||||||||||||
|
Short-Term Investments
|
99,998,353 | — | — | 99,998,353 | ||||||||||||
|
Total
|
$ | 99,998,353 | $ | — | $ | 924,913,468 | $ | 1,024,911,821 | ||||||||
15
Partners Group Private Equity (Master Fund), LLC
(a Delaware Limited Liability Company)
Notes to Consolidated Financial Statements – September 30, 2014 (Unaudited) (continued)
3. Fair Value Measurements (continued)
The following is a reconciliation of those investments in which significant unobservable inputs (Level 3) were used in determining value:
|
|
Balance as
of April 1,
2014
|
Realized
gain
|
Net change in unrealized appreciation/ (depreciation)
|
Gross purchases
|
Gross
sales
|
Net transfers
in or out
of Level 3
|
Balance
as of September 30, 2014
|
|||||||||||||||||||||
|
Direct Investments:
|
||||||||||||||||||||||||||||
|
Direct Equity Investments
|
$ | 242,078,103 | $ | 1,748,291 | $ | 40,404,018 | $ | 36,109,825 | $ | (13,974,267 | ) | $ | — | $ | 306,365,970 | |||||||||||||
|
Direct Debt Investments
|
210,660,647 | 1,209,468 | (5,234,927 | ) | 41,979,129 | (56,996,237 | ) | — | 191,618,080 | |||||||||||||||||||
|
Total Direct Investments*
|
$ | 452,738,750 | $ | 2,957,759 | $ | 35,169,091 | $ | 78,088,954 | $ | (70,970,504 | ) | $ | — | $ | 497,984,050 | |||||||||||||
|
Secondary Investments*
|
360,274,889 | 205,628 | (11,492,913 | ) | 31,389,421 | (27,650,673 | ) | — | 352,726,352 | |||||||||||||||||||
|
Primary Investments*
|
52,073,161 | — | 3,227,663 | 21,171,167 | (2,268,925 | ) | — | 74,203,066 | ||||||||||||||||||||
|
Total
|
$ | 865,086,800 | $ | 3,163,387 | $ | 26,903,841 | $ | 130,649,542 | $ | (100,890,102 | ) | $ | — | $ | 924,913,468 | |||||||||||||
The amount of the net change in unrealized appreciation for the six month period ended September 30, 2014 relating to investments in Level 3 assets still held at September 30, 2014 is $28,398,295, which is included as a component of net change in accumulated unrealized appreciation on investments on the Consolidated Statement of Operations.
|
*
|
Direct private equity investments are private investments directly into the equity or debt of selected operating companies, often together with the management of the company. Secondary investments involve acquiring single or portfolios of assets on the secondary market. Primary investments are investments in newly established private equity partnerships where underlying portfolio companies are not known as of the time of investment.
|
The Master Fund’s Valuation Procedures have been approved by the Board. The Valuation Procedures are implemented by the Adviser and the Master Fund’s third party administrator, both of which report to the Board. For third-party information, the Master Fund’s administrator monitors and reviews the methodologies of the various pricing services employed by the Master Fund. The Adviser employs valuation techniques for Private Equity Investments held by the Master Fund, which include discounted cash flow methods and market comparables. The Adviser has established a committee (the “Valuation Committee”) to oversee the valuation of the Master Fund’s investments pursuant to the Valuation Procedures. The Adviser and one or more of its affiliates may act as investment advisers to clients other than the Master Fund that hold Private Equity Investments held by the Master Fund. In such cases, the Valuation Committee may value such Private Equity Investments in consultation with its affiliates. Valuation determinations by the Adviser and its affiliates for a Private Equity Investment held by other clients may result in different values than those ascribed to the same Private Equity Investment held by the Master Fund. This situation can arise in particular when reconciling fair valuation differences between U.S. GAAP and accounting standards applicable to such other clients.
16
Partners Group Private Equity (Master Fund), LLC
(a Delaware Limited Liability Company)
Notes to Consolidated Financial Statements – September 30, 2014 (Unaudited) (continued)
3. Fair Value Measurements (continued)
The following is a summary of quantitative information about significant unobservable valuation inputs approved by the Adviser’s Valuation Committee for Level 3 Fair Value Measurements for investments held as of September 30, 2014:
|
Type of Security
|
Fair Value at 9/30/2014
|
Valuation Technique(s)
|
Unobservable Input
|
Range
(weighted average)
|
|||
|
Direct Investments:
|
|
|
|
|
|||
|
Direct Equity Investments
|
$ | 296,391,084 |
Market comparable companies
|
Enterprise Value to EBITDA multiple
|
4.20 x - 15.10 x(10.04 x) | ||
|
|
3,289,539 |
Discounted cash flow
|
Discount factor
|
14.40% - 20.00%(15.20%) | |||
|
|
1,115,457 |
Market comparable companies
|
Price to Book ratio
|
1.00 x - 1.00 x(1.00 x) | |||
|
|
2,702,726 |
Market comparable companies
|
Enterprise Value to Sales multiple
|
2.56 x - 2.56 x(2.56 x) | |||
|
|
2,276,465 |
Price to Earnings multiple
|
Price to Earnings multiple
|
1.42 x - 1.42 x(1.42 x) | |||
|
|
590,699 |
Exit price
|
Recent transaction price
|
n/a - n/a (n/a)
|
|||
|
Direct Debt Investments
|
$ | 4,862,125 |
Market comparable companies
|
Enterprise Value to EBITDA multiple
|
8.50 x - 8.50 x(8.50 x) | ||
|
|
71,313,190 |
Discounted cash flow
|
Discount factor
|
7.09% - 14.98%(11.89%) | |||
|
|
107,989,005 |
Quoted Debt
|
Quoted Debt
|
n/a - n/a (n/a)
|
|||
|
|
7,453,760 |
Exit price
|
Recent transaction price
|
n/a - n/a (n/a)
|
|||
Level 3 Direct Equity Investments valued by using an unobservable input factor are directly affected by a change in that factor. For Level 3 Direct Debt Investments, the Master Fund arrives at a fair value through the use of an earnings and multiples analysis and a discounted cash flows analysis which consider credit risk and interest rate risk of the particular investment. Significant increases or decreases in these inputs in isolation would result in a significantly lower or higher fair value measurement.
4. Allocation of Members’ Capital
Net profits or net losses of the Master Fund for each Allocation Period (as defined below) are allocated among and credited to or debited against the capital accounts of the Members. “Allocation Period” means a period that begins on the day after the last day of the preceding Allocation Period and ends at the close of business on the first to occur thereafter of: (1) the last day of a calendar month, (2) the last day of a taxable year; (3) the day preceding a day on which newly issued Interests are purchased by Members, (4) a day on which Interests are repurchased by the Master Fund pursuant to tenders of Interests by Members, or (5) a day on which any amount is credited to or debited from the capital account of any Member other than an amount to be credited to or debited from the capital accounts of all Members in accordance with their respective investment percentages.
5. Subscription and Repurchase of Members’ Interests
Interests are generally offered for purchase by Members as of the first day of each calendar month, except that Interests may be offered more or less frequently as determined by the Board in its sole discretion.
The Board may, from time to time and in its sole discretion, cause the Master Fund to repurchase Interests from Members pursuant to written tenders by Members at such times and on such terms and conditions as established by the Board. In determining whether the Master Fund should offer to repurchase Interests, the Board considers the recommendation of the Adviser, as well as a variety of other operational, business and economic factors. The Adviser anticipates recommending to the Board that, under normal circumstances, the Master Fund conduct repurchase offers of no more than 5% of the Master Fund’s net assets quarterly on or about each January 1st, April 1st, July 1st and October 1st. At the present time, the Master Fund does not intend to distribute to the Members any of the Master Fund’s income, but instead expects to reinvest substantially all income and gains allocable to the Members.
17
Partners Group Private Equity (Master Fund), LLC
(a Delaware Limited Liability Company)
Notes to Consolidated Financial Statements – September 30, 2014 (Unaudited) (continued)
6. Management Fees, Incentive Allocation, and Fees and Expenses of Managers
The Adviser is responsible for providing day-to-day investment management services to the Master Fund, subject to the ultimate supervision of and subject to any policies established by the Board, pursuant to the terms of an investment management agreement with the Master Fund (the “Investment Management Agreement”). Under the Investment Management Agreement, the Adviser is responsible for developing, implementing and supervising the Master Fund’s investment program. In consideration for such services, the Master Fund pays the Adviser a monthly management fee equal to 1/12th of 1.25% (1.25% on an annualized basis) of the greater of (i) the Master Fund’s net asset value and (ii) the Master Fund’s net asset value less cash and cash equivalents plus the total of all commitments made by the Master Fund that have not yet been drawn for investment. In no event will the Investment Management Fee exceed 1.50% as a percentage of the Master Fund’s net asset value.
In addition, at the end of each calendar quarter (and at certain other times), an amount (the “Incentive Allocation”) equal to 10% of the excess, if any, of (i) the allocable share of the net profits of the Master Fund for the relevant period of each Member over (ii) the then balance, if any, of that Member’s Loss Recovery Account (as defined below) is debited from such Member’s capital account and credited to a capital account of the Adviser (or, to the extent permitted by applicable law, of an affiliate of the Adviser) in the Master Fund (the “Incentive Allocation Account”). The Incentive Allocation Account is maintained solely for the purpose of being allocated the Incentive Allocation and thus, the Incentive Allocation Account does not participate in the net profits or losses of the Master Fund.
The Master Fund maintains a memorandum account for each Member (each, a “Loss Recovery Account”). Each Member’s Loss Recovery Account has an initial balance of zero and is (i) increased upon the close of each Allocation Period by the amount of the relevant Member’s allocable share of the net losses of the Master Fund for the Allocation Period, and (ii) decreased (but not below zero) upon the close of such Allocation Period by the amount of such Member’s allocable share of the net profits of the Master Fund for the Allocation Period. The Incentive Allocation is calculated, charged to each Member and credited to the Incentive Allocation Account as of the end of each Allocation Period. The Allocation Period for a Member whose Interest is repurchased or is transferred in part is treated as ending only for the portion of Interests so repurchased or transferred. In addition, only the net profits of the Master Fund, if any, and the balance of the Loss Recovery Account attributable to the portion of the Interest being repurchased or transferred (based on the Member’s capital account amount being so repurchased or transferred) is taken into account in determining the Incentive Allocation for the Allocation Period then ending. The Member’s Loss Recovery Account is not adjusted for such Member’s allocable share of the net losses of the Master Fund, if any, for the Allocation Period then ending that are attributable to the portion of the Interest so repurchased or transferred. For the six month period ended September 30, 2014 an aggregate Incentive Allocation of $7,042,124 was credited to the Incentive Allocation Account.
Each member of the Board who is not an “interested person” of the Master Fund, as defined by the 1940 Act (the “Independent Managers”), receives a fee of $35,000 per year. In addition, the Master Fund pays an additional fee of $10,000 per year to the Chairman of the Board and to the Chairman of the audit committee. All Board members are reimbursed by the Master Fund for all reasonable out-of-pocket expenses incurred by them in performing their duties.
7. Accounting and Administration Agreement
UMB Fund Services, Inc. (the “Administrator”) serves as administrator and accounting agent to the Master Fund and provides certain accounting, record keeping and investor related services. For these services the Administrator receives a fixed monthly fee, based upon average net assets, fees on portfolio transactions, as well as reasonable out of pocket expenses. For the six month period ended September 30, 2014, the Master Fund paid $266,188 in administration and accounting fees.
8. Investment Transactions
Total purchases of Private Equity Investments for the six month period ended September 30, 2014 amounted to $130,649,542. Total distribution proceeds from sale, redemption, or other disposition of Private Equity Investments for the six month period ended September 30, 2014 amounted to $100,890,102. The cost of investments in Private Equity Investments for U.S. federal income tax purposes is adjusted for items of taxable income allocated to the Master Fund from such Private Equity Investments. The Master Fund relies upon actual and estimated tax information provided by the managers of the Private Equity Investments as to the amounts of taxable income allocated to the Master Fund as of September 30, 2014.
18
Partners Group Private Equity (Master Fund), LLC
(a Delaware Limited Liability Company)
Notes to Consolidated Financial Statements – September 30, 2014 (Unaudited) (continued)
9. Indemnification
In the normal course of business, the Master Fund may enter into contracts that provide general indemnification. The Master Fund’s maximum exposure under these agreements is dependent on future claims that may be made against the Master Fund under such agreements, and therefore cannot be established; however, based on management’s experience, the risk of loss from such claims is considered remote.
10. Commitments
As of September 30, 2014, the Master Fund had contributed 79% or $1,097,842,372 of the total of $1,384,956,231 of its capital commitments to its Private Equity Investments. With respect to its (i) Direct Investments it had contributed $661,345,347 of $661,498,209 in total commitments, (ii) secondary Private Equity Investments it had contributed $365,262,809 of $546,149,274 in total commitments, and (iii) primary Private Equity Investments it had contributed $71,234,216 of $177,308,748 in total commitments, in each case, as of September 30, 2014.
11. Risk Factors
An investment in the Master Fund involves significant risks, including industry risk, liquidity risk, interest rate risk and economic conditions risk, that should be carefully considered prior to investing and should only be considered by persons financially able to maintain their investment and who can afford a loss of a substantial part or all of such investment. The Master Fund invests substantially all of its available capital in Private Equity Investments. These investments are generally restricted securities that are subject to substantial holding periods and are not traded in public markets, so that the Master Fund may not be able to resell some of its holdings for extended periods, which may be several years. The Master Fund may have a concentration of investments in a particular industry or sector. Investment performance of the sector may have a significant impact on the performance of the Master Fund. The Master Fund’s investments are also subject to the risk associated with investing in private equity securities. The investments in private equity securities are illiquid, can be subject to various restrictions on resale, and there can be no assurance that the Master Fund will be able to realize the value of such investments in a timely manner. Private Equity Fund Investments are generally closed-end private equity partnerships with no right to withdraw prior to the termination of the partnership. The frequency of withdrawals is dictated by the governing documents of the Private Equity Fund Investments.
Interests in the Master Fund provide limited liquidity because Members will not be able to redeem Interests on a daily basis because the Master Fund is a closed-end fund. Therefore investment in the Master Fund is suitable only for investors who can bear the risks associated with the limited liquidity of Interests and should be viewed as a long-term investment. No guarantee or representation is made that the investment objective will be met.
12. Subsequent Events
Management has evaluated the impact of all subsequent events on the Master Fund and has determined that there were no subsequent events that require disclosure in the consolidated financial statements.
19
Partners Group Private Equity (Master Fund), LLC
(a Delaware Limited Liability Company)
Other Information (Unaudited)
Proxy Voting
The Master Fund is required to file Form N-PX, with its complete proxy voting record for the twelve months ended June 30, no later than August 31. The Master Fund’s Form N-PX filing is available: (i) without charge, upon request, by calling 1-877-748-7209 or (ii) by visiting the SEC’s website at www.sec.gov.
Availability of Quarterly Portfolio Schedules
The Master Fund files its complete schedule of portfolio holdings with the SEC for the first and third quarters of each fiscal year on Form N-Q. The Master Fund’s Form N-Q is available, without charge and upon request, on the SEC’s website at www.sec.gov or may be reviewed and copied at the SEC’s Public Reference Room in Washington, DC. Information on the Public Reference Room may be obtained by calling 1-800-SEC-0330.
20
ITEM 2. CODE OF ETHICS.
Not applicable to semi-annual reports.
ITEM 3. AUDIT COMMITTEE FINANCIAL EXPERT.
Not applicable to semi-annual reports.
ITEM 4. PRINCIPAL ACCOUNTANT FEES AND SERVICES.
Not applicable to semi-annual reports.
ITEM 5. AUDIT COMMITTEE OF LISTED REGISTRANTS.
Not applicable.
ITEM 6. SCHEDULE OF INVESTMENTS.
Schedule of Investments in securities of unaffiliated issuers as of the close of the reporting period is included as part of the report to shareholders filed under Item 1 of this form.
ITEM 7. DISCLOSURE OF PROXY VOTING POLICIES AND PROCEDURES FOR CLOSED-END MANAGEMENT INVESTMENT COMPANIES.
Not applicable to semi-annual reports.
ITEM 8. PORTFOLIO MANAGERS OF CLOSED-END MANAGEMENT INVESTMENT COMPANIES.
Not applicable to semi-annual reports.
ITEM 9. PURCHASES OF EQUITY SECURITIES BY CLOSED-END MANAGEMENT INVESTMENT COMPANY AND AFFILIATED PURCHASERS.
Not applicable.
ITEM 10. SUBMISSION OF MATTERS TO A VOTE OF SECURITY HOLDERS.
There have been no material changes to the procedures by which the shareholders may recommend nominees to the registrant's board of managers, where those changes were implemented after the registrant last provided disclosure in response to the requirements of Item 407(c)(2)(iv) of Regulation S-K (17CFR 229.407), or this Item.
ITEM 11. CONTROLS AND PROCEDURES.
(a) The registrant's principal executive and principal financial officers, or persons performing similar functions, have concluded that the registrant's disclosure controls and procedures (as defined in Rule 30a-3(c) under the Investment Company Act of 1940, as amended (the "1940 Act") (17 CFR 270.30a-3(c))) are effective, as of a date within 90 days of the filing date of the report that includes the disclosure required by this paragraph, based on their evaluation of these controls and procedures required by Rule 30a-3(b) under the 1940 Act (17 CFR 270.30a-3(b)) and Rules 13a-15(b) or 15d-15(b) under the Securities Exchange Act of 1934, as amended (17 CFR 240.13a-15(b) or 240.15d-15(b)).
(b) There were no changes in the registrant's internal control over financial reporting (as defined in Rule 30a-3(d) under the 1940 Act (17 CFR 270.30a-3(d)) that occurred during the registrant's second fiscal quarter of the period covered by this report that has materially affected, or is reasonably likely to materially affect, the registrant's internal control over financial reporting.
ITEM 12. EXHIBITS.
(a)(1) Not applicable to semi-annual reports.
(a)(2) Certifications pursuant to Rule 30a-2(a) under the 1940 Act and Section 302 of the Sarbanes-Oxley Act of 2002 are attached hereto.
(a)(3) Not applicable.
(b) Not applicable.
SIGNATURES
Pursuant to the requirements of the Securities Exchange Act of 1934 and the Investment Company Act of 1940, the registrant has duly caused this report to be signed on its behalf by the undersigned, thereunto duly authorized.
|
(registrant)
|
Partners Group Private Equity (Institutional TEI), LLC
|
|
|
By (Signature and Title)*
|
/s/ Robert Collins | |
|
Robert Collins, President &
|
||
|
Chief Executive Officer
|
||
|
(Principal Executive Officer)
|
||
|
Date
|
December 4, 2014
|
Pursuant to the requirements of the Securities Exchange Act of 1934 and the Investment Company Act of 1940, this report has been signed below by the following persons on behalf of the registrant and in the capacities and on the dates indicated.
|
By (Signature and Title)*
|
/s/ Robert Collins | |
|
Robert Collins, President &
|
||
|
Chief Executive Officer
|
||
|
(Principal Executive Officer)
|
||
|
Date
|
December 4, 2014
|
|
By (Signature and Title)*
|
/s/ Justin Rindos | |
|
Justin Rindos, Chief Financial Officer
|
||
|
(Principal Financial Officer)
|
||
|
Date
|
December 4, 2014
|
* Print the name and title of each signing officer under his or her signature.