Exhibit
|
| | |
| | |
| P.O. Box 29243 - Phoenix, Arizona 85038-9243 |
| 2200 S. 75th Avenue - Phoenix, Arizona 85043 |
| (602) 269-9700 |
| |
Dear Fellow Stockholders of Swift Transportation Company (NYSE: SWFT),
A summary of our key results for the three months and years ended December 31st is shown below:
|
| | | | | | | | | | | | | | | | | | | | | | | |
| Three Months Ended December 31, | | Year Ended December 31, |
| 2016 | | 2015 | | 2014 | | 2016 | | 2015 | | 2014 |
| Unaudited |
| (Dollars in millions, except per share data) |
Operating Revenue | $ | 1,038.6 |
| | $ | 1,089.8 |
| | $ | 1,139.5 |
| | $ | 4,031.5 |
| | $ | 4,229.3 |
| | $ | 4,298.7 |
|
Revenue xFSR (1)(2) | $ | 950.8 |
| | $ | 996.2 |
| | $ | 960.2 |
| | $ | 3,722.9 |
| | $ | 3,782.0 |
| | $ | 3,535.4 |
|
| | | | | | | | | | | |
Operating Ratio | 92.7 | % | | 88.8 | % | | 88.4 | % | | 94.0 | % | | 91.2 | % | | 91.4 | % |
Adjusted Operating Ratio (2) | 91.6 | % | | 87.4 | % | | 85.8 | % | | 92.9 | % | | 89.8 | % | | 89.0 | % |
| | | | | | | | | | | |
Diluted EPS | $ | 0.38 |
| | $ | 0.51 |
| | $ | 0.41 |
| | $ | 1.10 |
| | $ | 1.38 |
| | $ | 1.12 |
|
Adjusted EPS (2) | $ | 0.40 |
| | $ | 0.53 |
| | $ | 0.55 |
| | $ | 1.22 |
| | $ | 1.49 |
| | $ | 1.38 |
|
| | | | | | | | | | | |
(1) Revenue xFSR is operating revenue, excluding fuel surcharge revenue |
(2) See GAAP to Non-GAAP reconciliation in the schedules following this letter |
Key Highlights for the Fourth Quarter 2016:
(discussed in more detail below, including GAAP to non-GAAP reconciliations)
Consolidated
| |
• | Diluted EPS was $0.38 and Adjusted EPS was $0.40 |
| |
• | We repurchased $2.1 million of our Class A common stock in the fourth quarter |
| |
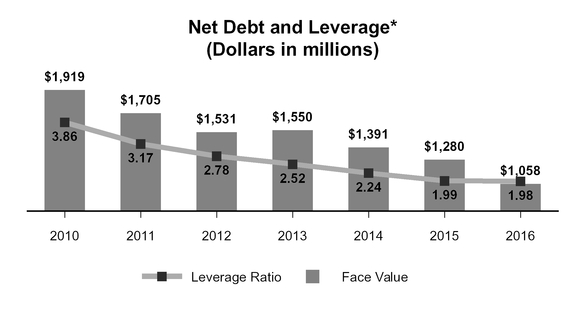
• | Net Debt and Net Leverage Ratio were $1,057.7 million and 1.98, respectively, as of December 31, 2016 |
| |
• | Consolidated Average Operational Truck Count declined by 210 trucks from the third quarter of 2016, and 746 trucks year over year in the fourth quarter, in a continued effort to drive improvements in asset utilization |
| |
• | Favorable discrete tax items resulted in an effective tax rate of 27.8% |
Truckload
| |
• | Truckload Revenue xFSR for the fourth quarter of 2016 was $472.7 million, compared to $503.3 million in the fourth quarter of 2015 |
| |
• | Excess carrier capacity and pricing pressure continue to challenge the marketplace |
| |
• | Total loaded miles driven within the period decreased 3.8% year over year, although utilization increased slightly primarily due to a 3.9% reduction in Average Operational Truck Count |
| |
• | Deadhead percentage improved 30 basis points year over year |
| |
• | Operating Ratio and Adjusted Operating Ratio for the fourth quarter of 2016 were 90.9% and 90.0%, respectively |
Dedicated
| |
• | Dedicated Revenue xFSR grew 6.7% year over year to $241.0 million |
| |
• | Weekly Revenue xFSR per Tractor improved 6.5% year over year, and has increased sequentially for the past five quarters |
| |
• | Average Operational Truck Count increased 86 trucks sequentially, due to growth with our existing dedicated customers and seasonal surge |
| |
• | Operating Ratio and Adjusted Operating Ratio for the fourth quarter of 2016 were 90.0% and 89.3%, respectively |
Swift Refrigerated
| |
• | Swift Refrigerated Revenue xFSR for the fourth quarter of 2016 was $73.8 million, compared to $82.7 million in the fourth quarter of 2015 |
| |
• | Weekly Revenue xFSR per Tractor increased 3.8% year over year, due to a 6.5% increase in asset utilization |
| |
• | Deadhead percentage improved 60 basis points year over year, and 10 basis points sequentially |
| |
• | Operating Ratio and Adjusted Operating Ratio for the fourth quarter of 2016 were 96.5% and 96.0%, respectively |
Intermodal
| |
• | Intermodal Revenue xFSR for the fourth quarter of 2016 was $85.1 million, compared to $90.0 million in the fourth quarter of 2015 |
| |
• | Load Counts were inconsistent and pressured throughout the quarter |
| |
• | Maintaining a proper cost infrastructure, while also improving operational efficiencies remains our primary focus |
| |
• | Operating Ratio and Adjusted Operating Ratio for the fourth quarter of 2016 were 98.8% and 98.7%, respectively |
The fourth quarter capped a very challenging 2016, as rising fuel prices and a weak used truck market compounded the negative impact of the pricing and freight volume headwinds prevalent within the market. Our results for the fourth quarter were further impacted by higher than expected insurance and claims expense related to development on certain prior and current year claims. Our organization continued to work diligently throughout the quarter to mitigate the financial impact of these factors, by remaining disciplined to our countermeasures to increase the utilization of our assets, ensuring available trucks are paired with high quality freight, and further implementing numerous cost control initiatives. Although this quarter's financial results are not as strong as we would like to see, we are confident that this dedication, along with these countermeasures, has helped offset a portion of the market headwinds mentioned above.
Given our goal of generating incremental improvement to the loaded utilization of our assets, in conjunction with a tougher than anticipated freight market, we elected to further reduce our Consolidated Average Operational Truck Count during the fourth quarter of 2016. In the fourth quarter of 2016, we reduced our tractor count 746 trucks year over year, and 210 trucks when compared to the third quarter of 2016. Our Truckload and Swift Refrigerated segments continued to experience the majority of this reduction, which helped drive year over year improvements in our loaded miles per tractor per week in each segment. As anticipated, Revenue xFSR per loaded mile was pressured year over year; however, it increased sequentially from the third to fourth quarter in both the Truckload and Swift Refrigerated segments driven by an improving contract environment, combined with less dependency on the spot market. Within the Swift Refrigerated segment, fourth quarter loaded miles per tractor per week increased 6.5% year over year, which also supported a 3.8% increase in Weekly Revenue xFSR per Tractor within the segment. Year over year Deadhead Percentage improvements were also produced within both segments, as Truckload and Swift Refrigerated recognized a 30 basis point and 60 basis point reduction, respectively.
As we mentioned on our mid-fourth quarter conference call, our Dedicated segment continues to find opportunities to grow, as our fourth quarter Average Operational Truck Count increased 86 trucks sequentially compared to the third quarter. This growth represents additional units assigned to both our existing dedicated customer base and seasonal surge business. Our Dedicated sales pipeline remains healthy, and we are optimistic further growth and operational improvements will be achieved in 2017. As it relates to our Intermodal segment, the fourth quarter continued to be challenged by aggressive pricing in the market. As a result, our fourth quarter's Revenue xFSR per load decreased year over year by 1.3%. Despite this decrease, we believe our leaner cost infrastructure and improved operational efficiencies have allowed us to remain competitive and will foster improved financial results if the market firms.
We are also pleased to report our continued success with strengthening our balance sheet and returning cash to shareholders. During the fourth quarter of 2016, we repurchased $2.1 million of our outstanding Class A common stock, funded through cash flows from operations. Additionally, our Net Debt and Net Leverage Ratio remained healthy at $1,057.7 million and 1.98, respectively. Further, as a result of our $100.0 million prepayment in October 2016 and our $22.5 million prepayment in January 2017, we have now prepaid all remaining scheduled payments on our Term Loan A through its maturity in July 2020.
Fourth Quarter Results by Segment
Truckload Segment
Our Truckload segment consists of one-way movements over irregular routes throughout the United States, Mexico, and Canada. This service uses both company and owner-operator tractors with dry van, flatbed, and other specialized trailing equipment.
|
| | | | | | | | | | | |
| Three Months Ended December 31, |
| 2016 | | 2015 | | 2014 |
| Unaudited |
Operating Revenue (1) | $ | 521.2 |
| | $ | 557.2 |
| | $ | 601.5 |
|
Revenue xFSR (1)(2)(3) | $ | 472.7 |
| | $ | 503.3 |
| | $ | 498.5 |
|
| | | | | |
Operating Ratio | 90.9 | % | | 86.5 | % | | 85.8 | % |
Adjusted Operating Ratio (3) | 90.0 | % | | 85.1 | % | | 82.9 | % |
| | | | | |
Weekly Revenue xFSR per Tractor | $ | 3,577 |
| | $ | 3,659 |
| | $ | 3,671 |
|
Total Loaded Miles (4) | 249,901 |
| | 259,762 |
| | 262,114 |
|
| | | | | |
Average Operational Truck Count | 10,055 |
| | 10,465 |
| | 10,333 |
|
Deadhead Percentage | 12.4 | % | | 12.7 | % | | 12.3 | % |
| | | | | |
(1) In millions |
(2) Revenue xFSR is operating revenue, excluding fuel surcharge revenue |
(3) See GAAP to Non-GAAP reconciliation in the schedules following this letter |
(4) Total Loaded Miles presented in thousands |
Our Truckload Revenue xFSR for the fourth quarter of 2016 was $472.7 million, compared to $503.3 million in the fourth quarter of 2015. This change resulted from a 3.8% reduction in loaded miles driven within the period, and a 2.3% year over year decrease in Revenue xFSR per loaded mile. Weekly Revenue xFSR per Tractor decreased 2.2% to $3,577 driven by the aforementioned 2.3% decrease in Revenue xFSR per loaded mile, partially offset by a slight increase in loaded miles per tractor per week.
For the fourth quarter of 2016, the Operating Ratio in our Truckload segment was 90.9% compared to 86.5% for the fourth quarter of 2015, while the Adjusted Operating Ratio was 90.0% and 85.1%, respectively, for the same periods. The change in Operating Ratio metrics was primarily driven by a challenging truckload pricing market and excess carrier capacity, combined with a year over year increase in insurance and claims expense, higher depreciation and amortization expense as a percentage of Revenue xFSR, lower gains on sale of equipment, and fuel prices, which increased throughout the quarter. These headwinds were partially offset by reductions in equipment maintenance and other operating expenses.
In an effort to minimize the impact of these difficult market conditions, we continue to allocate our efforts and resources to the implementation of several cost control and efficiency-improving countermeasures. We believe these efforts along with the scheduled Electronic Logging Device ("ELD") compliance deadline will enable us to be well-positioned if the truckload market strengthens.
Dedicated Segment
Through our Dedicated segment, we devote equipment and offer tailored solutions under long-term contracts with customers. This dedicated business utilizes refrigerated, dry van, flatbed, and other specialized trailing equipment.
|
| | | | | | | | | | | |
| Three Months Ended December 31, |
| 2016 | | 2015 | | 2014 |
| Unaudited |
Operating Revenue (1) | $ | 257.3 |
| | $ | 241.2 |
| | $ | 237.3 |
|
Revenue xFSR (1)(2)(3) | $ | 241.0 |
| | $ | 226.0 |
| | $ | 202.5 |
|
| | | | | |
Operating Ratio | 90.0 | % | | 88.5 | % | | 91.8 | % |
Adjusted Operating Ratio (3) | 89.3 | % | | 87.7 | % | | 90.4 | % |
| | | | | |
Weekly Revenue xFSR per Tractor | $ | 3,641 |
| | $ | 3,418 |
| | $ | 3,210 |
|
Average Operational Truck Count | 5,037 |
| | 5,030 |
| | 4,802 |
|
| | | | | |
(1) In millions |
(2) Revenue xFSR is operating revenue, excluding fuel surcharge revenue |
(3) See GAAP to Non-GAAP reconciliation in the schedules following this letter |
Dedicated Revenue xFSR grew 6.7% to $241.0 million in the fourth quarter of 2016 compared to the fourth quarter of 2015. This growth was driven by a 6.5% increase in Weekly Revenue xFSR per Tractor and a slight year over year increase in our Average Operational Truck Count. We are pleased with our Dedicated leadership team and their sustained performance in delivering improvements in fleet efficiency, pricing, and underperforming accounts which has helped produce a sequential increase in Weekly Revenue xFSR per Tractor over the past five quarters.
For the fourth quarter of 2016, the Operating Ratio in our Dedicated segment was 90.0% compared to 88.5% for the fourth quarter of 2015, while the Adjusted Operating Ratio was 89.3% and 87.7%, respectively, for the same periods. The change in Operating Ratio metrics was primarily driven by increases in insurance and claims expense, fuel prices and depreciation and amortization expense and lower gains on sale of equipment. These headwinds were partially offset by the increase in Weekly Revenue xFSR per Tractor mentioned above, and improved workers’ compensation claim frequency and expense. Despite the current quarter margin results, we are pleased with the momentum this segment has generated throughout 2016, and remain confident in our leadership’s ability to drive further improvements.
Swift Refrigerated Segment
Our Swift Refrigerated segment represents shipments for customers that require temperature-controlled trailers. These shipments include one-way movements over irregular routes and dedicated truck operations.
|
| | | | | | | | | | | |
| Three Months Ended December 31, |
| 2016 | | 2015 | | 2014 |
| Unaudited |
Operating Revenue (1) | $ | 84.5 |
| | $ | 94.0 |
| | $ | 103.9 |
|
Revenue xFSR (1)(2)(3) | $ | 73.8 |
| | $ | 82.7 |
| | $ | 84.2 |
|
| | | | | |
Operating Ratio | 96.5 | % | | 96.2 | % | | 95.5 | % |
Adjusted Operating Ratio (3) | 96.0 | % | | 95.7 | % | | 94.4 | % |
| | | | | |
Weekly Revenue xFSR per Tractor | $ | 3,578 |
| | $ | 3,448 |
| | $ | 3,558 |
|
Average Operational Truck Count | 1,570 |
| | 1,824 |
| | 1,800 |
|
Deadhead Percentage | 13.9 | % | | 14.5 | % | | 15.6 | % |
| | | | | |
(1) In millions |
(2) Revenue xFSR is operating revenue, excluding fuel surcharge revenue |
(3) See GAAP to Non-GAAP reconciliation in the schedules following this letter |
Our Swift Refrigerated Revenue xFSR for the fourth quarter of 2016 was $73.8 million, versus $82.7 million in the fourth quarter of 2015. This change was primarily driven by a 8.4% reduction in loaded miles driven within the period, and a 2.3% decrease in Revenue xFSR per loaded mile. The lackluster refrigerated freight market, prevalent throughout 2016, persisted for the majority of the fourth quarter. Although we did experience windows of occasional tightening within certain markets over the course of the quarter, it was infrequent. In an attempt to take full advantage of this periodic tightening, we proactively engineered our network to properly match trucks with the highest quality freight available. These efforts enabled us to surpass our previously disclosed pricing expectations, while also improving our year over year Deadhead Percentage by 60 basis points.
In addition to the efforts mentioned above, our sales and operations teams also made progress with their continued focus to improve additional operational metrics while further implementing several cost control initiatives. As result of these efforts, the Swift Refrigerated segment's Weekly Revenue xFSR per Tractor increased 3.8% year over year to $3,578, primarily due to a 6.5% year over year increase in the number of loaded miles per tractor per week. Year over year improvements in insurance and claims and workers' compensation expense were also realized within the quarter, as we experienced a reduction in the average cost per accident and improvement in workers' compensation incident frequency.
For the fourth quarter of 2016, the Operating Ratio in our Swift Refrigerated segment was 96.5% compared to 96.2% for the fourth quarter of 2015, while the Adjusted Operating Ratio was 96.0% and 95.7%, respectively, for the same periods. The increase in the Operating Ratio metrics was primarily driven by the reduction in Revenue xFSR per loaded mile, partially offset by the increase in asset utilization and the decrease in insurance and claims and workers' compensation expense mentioned above.
Intermodal Segment
Our Intermodal segment includes revenue generated by freight moving over the rail in our containers and other trailing equipment, combined with revenue for drayage to transport loads between the railheads and customer locations.
|
| | | | | | | | | | | |
| Three Months Ended December 31, |
| 2016 | | 2015 | | 2014 |
| Unaudited |
Operating Revenue (1) | $ | 95.3 |
| | $ | 100.7 |
| | $ | 109.4 |
|
Revenue xFSR (1)(2)(3) | $ | 85.1 |
| | $ | 90.0 |
| | $ | 89.7 |
|
| | | | | |
Operating Ratio | 98.8 | % | | 97.0 | % | | 92.9 | % |
Adjusted Operating Ratio (3) | 98.7 | % | | 96.6 | % | | 91.3 | % |
| | | | | |
Load Counts | 44,043 |
| | 45,949 |
| | 46,182 |
|
Average Container Counts | 9,131 |
| | 9,150 |
| | 9,150 |
|
| | | | | |
(1) In millions |
(2) Revenue xFSR is operating revenue, excluding fuel surcharge revenue |
(3) See GAAP to Non-GAAP reconciliation in the schedules following this letter |
Intermodal Revenue xFSR was $85.1 million in the fourth quarter of 2016 compared to $90.0 million in the fourth quarter of 2015. This change was primarily driven by a 4.1% reduction in Load Counts, and a 1.3% decrease in Revenue xFSR per load. As we mentioned during our mid-fourth quarter conference call, these trends were largely anticipated due to the discontinuation of our Trailer-on-Flat-Car (TOFC) service offering and an extremely competitive pricing environment, which persisted throughout the quarter.
For the fourth quarter of 2016, the Operating Ratio in our Intermodal segment was 98.8% compared to 97.0% for the fourth quarter of 2015, while the Adjusted Operating Ratio was 98.7% compared to 96.6% for the same periods. The increase in the Operating Ratio metrics was primarily driven by the Revenue xFSR per load and load count reductions mentioned above and increased insurance and claims expense, partially offset by an improved fixed and variable cost infrastructure.
Other Non-Reportable Segments
Our other non-reportable segments include our logistics and brokerage services, as well as support services that our subsidiaries provide to customers and owner-operators, including repair and maintenance shop services, equipment leasing, and insurance. Intangible asset amortization related to the 2007 going-private transaction, certain legal settlements and reserves, and certain other corporate expenses are also included in the non-reportable segments.
In the fourth quarter of 2016, combined operating revenues from the aforementioned services, before eliminations, decreased $20.1 million compared to the same period of 2015, primarily due to reductions in logistics freight volumes and services provided to owner-operators. The operating income/loss of the other non-reportable segments in the fourth quarter of 2016 decreased $13.8 million year over year, to an operating loss of $1.8 million. This decrease was primarily driven by the reductions in logistics freight volumes and the margins associated with services provided to owner-operators as discussed in prior quarters.
Fourth Quarter Consolidated Operating and Other Expenses
The table below highlights some of our cost categories for the fourth quarter of 2016, compared to the fourth quarter of 2015 and the third quarter of 2016, showing each as a percent of Revenue xFSR. Fuel surcharge revenue can be volatile and is primarily dependent upon the cost of fuel and not specifically related to our non-fuel operational expenses. Therefore, we believe that Revenue xFSR is a better measure for analyzing our expenses and operating metrics.
|
| | | | | | | | | | | | | | | | | | | | |
| | | | YOY | | | | | | QOQ |
Q4'16 | | Q4'15 | | Variance (1) | (Dollars in millions) | Q4'16 | | Q3'16 | | Variance (1) |
Unaudited | | Unaudited |
$ | 1,038.6 |
| | $ | 1,089.8 |
| | -4.7 | % | Operating Revenue | $ | 1,038.6 |
| | $ | 1,013.2 |
| | 2.5 | % |
$ | (87.8 | ) | | $ | (93.6 | ) | | -6.2 | % | Less: Fuel Surcharge Revenue | $ | (87.8 | ) | | $ | (83.5 | ) | | 5.2 | % |
$ | 950.8 |
| | $ | 996.2 |
| | -4.6 | % | Revenue xFSR | $ | 950.8 |
| | $ | 929.7 |
| | 2.3 | % |
| | | | | | | | | | |
$ | 279.8 |
| | $ | 290.2 |
| | 3.6 | % | Salaries, Wages, & Benefits | $ | 279.8 |
| | $ | 293.1 |
| | 4.5 | % |
29.4 | % | | 29.1 | % | | -30 bps |
| % of Revenue xFSR | 29.4 | % | | 31.5 | % | | 210 | bps |
| | | | | | | | | | |
$ | 98.8 |
| | $ | 99.7 |
| | 0.9 | % | Operating Supplies & Expenses | $ | 98.8 |
| | $ | 113.8 |
| | 13.2 | % |
10.4 | % | | 10.0 | % | | -40 bps |
| % of Revenue xFSR | 10.4 | % | | 12.2 | % | | 180 | bps |
| | | | | | | | | | |
$ | 51.8 |
| | $ | 40.2 |
| | -29.1 | % | Insurance & Claims | $ | 51.8 |
| | $ | 47.4 |
| | -9.4 | % |
5.5 | % | | 4.0 | % | | -150 bps |
| % of Revenue xFSR | 5.5 | % | | 5.1 | % | | -40 bps |
|
| | | | | | | | | | |
$ | 7.7 |
| | $ | 8.5 |
| | 8.6 | % | Communications & Utilities | $ | 7.7 |
| | $ | 7.1 |
| | -8.6 | % |
0.8 | % | | 0.9 | % | | 10 | bps | % of Revenue xFSR | 0.8 | % | | 0.8 | % | | — |
|
| | | | | | | | | | |
$ | 19.0 |
| | $ | 19.5 |
| | 2.8 | % | Operating Taxes & Licenses | $ | 19.0 |
| | $ | 18.7 |
| | -1.5 | % |
2.0 | % | | 2.0 | % | | — |
| % of Revenue xFSR | 2.0 | % | | 2.0 | % | | — |
|
(1) Positive numbers represent favorable variances. Negative numbers represent unfavorable variances. Variances are calculated based on the precision of the consolidated income statement, presented in thousands, included in the schedules following this letter. |
Salaries, wages, and benefits decreased $10.4 million to $279.8 million during the fourth quarter of 2016, compared to the fourth quarter of 2015, primarily due to a decrease in total miles driven by company drivers within the period and a reduction in workers' compensation expense, partially offset by a year over year increase in driver pay rates. Sequentially, salaries, wages, and benefits decreased $13.3 million primarily due to the one-time retirement charge associated with Swift's Founder and Chief Executive Officer Jerry Moyes, which was recorded in the third quarter, a decrease in total miles driven by company drivers within the period and a reduction in workers' compensation expense, partially offset by an increase in driver pay rates.
Fourth quarter operating supplies and expenses decreased $0.9 million year over year. This decrease was primarily due to decreases in equipment maintenance expense and driver hiring-related expenses, partially offset by increased legal and consulting fees. Sequentially, operating supplies and expenses decreased $15.0 million during the fourth quarter of 2016 compared to the third quarter of 2016 primarily due to a reduction in legal fees and reserves.
Insurance and claims expense increased $11.7 million, representing 5.5% of Revenue xFSR in the fourth quarter of 2016, compared to 4.0% of Revenue of xFSR in the fourth quarter of 2015, and 5.1% of Revenue xFSR in the third quarter of 2016. Total crashes per million miles decreased 4.9% for the full year of 2016 compared to 2015, but the average cost per claim as reserved was higher than anticipated due to development on prior year claims and occurrences from earlier this year.
Fuel Expense |
| | | | | | | | | | | | | | |
Q4'16 | | Q4'15 | (Dollars in millions) | Q4'16 | | Q3'16 |
Unaudited | | Unaudited |
$ | 92.5 |
| | $ | 90.2 |
| Fuel Expense | $ | 92.5 |
| | $ | 90.5 |
|
8.9 | % | | 8.3 | % | % of Operating Revenue | 8.9 | % | | 8.9 | % |
Fuel expense for the fourth quarter of 2016 was $92.5 million, an increase of $2.3 million from the fourth quarter of 2015. The increase was a result of higher fuel prices, partially offset by a decrease in the number of miles driven by company drivers and improved fuel efficiency.
Sequentially, fuel expense increased $2.0 million during the fourth quarter of 2016 compared to the third quarter of 2016 primarily due to higher fuel prices, partially offset by a decrease in the number of miles driven by company drivers.
Purchased Transportation
Purchased transportation includes payments to owner-operators, railroads and other third parties we use for intermodal drayage and other brokered business.
|
| | | | | | | | | | | | | | |
Q4'16 | | Q4'15 | (Dollars in millions) | Q4'16 | | Q3'16 |
Unaudited | | Unaudited |
$ | 285.8 |
| | $ | 297.0 |
| Purchased Transportation | $ | 285.8 |
| | $ | 280.0 |
|
27.5 | % | | 27.3 | % | % of Operating Revenue | 27.5 | % | | 27.6 | % |
Purchased transportation decreased $11.3 million year over year, primarily due to the decreases in logistics and intermodal volumes and fewer miles driven by owner-operators, partially offset by an increase in the contracted rate paid to owner-operators.
Sequentially, purchased transportation increased $5.7 million during the fourth quarter of 2016 compared to the third quarter of 2016, primarily due to increased miles driven by owner-operators, an increase in fuel reimbursements to owner-operators and other third parties as a result of higher fuel prices, and an increase in intermodal volumes.
Rental Expense and Depreciation & Amortization of Property and Equipment
Due to fluctuations in the number of tractors leased versus owned, we combine our rental expense with depreciation and amortization of property and equipment for analytical purposes.
|
| | | | | | | | | | | | | | |
Q4'16 | | Q4'15 | (Dollars in millions) | Q4'16 | | Q3'16 |
Unaudited | | Unaudited |
$ | 55.9 |
| | $ | 59.6 |
| Rental Expense | $ | 55.9 |
| | $ | 57.0 |
|
5.9 | % | | 6.0 | % | % of Revenue xFSR | 5.9 | % | | 6.1 | % |
| | | | | | |
$ | 68.3 |
| | $ | 67.5 |
| Depreciation & Amortization of Property and Equipment | $ | 68.3 |
| | $ | 67.2 |
|
7.2 | % | | 6.8 | % | % of Revenue xFSR | 7.2 | % | | 7.2 | % |
| | | | | | |
$ | 124.2 |
| | $ | 127.1 |
| Combined Rental Expense and Depreciation | $ | 124.2 |
| | $ | 124.2 |
|
13.1 | % | | 12.8 | % | % of Revenue xFSR | 13.1 | % | | 13.4 | % |
Combined rental and depreciation expense in the fourth quarter of 2016 decreased $3.0 million to $124.2 million while increasing 30 basis points as a percentage of Revenue xFSR from the fourth quarter of 2015. As discussed in the third quarter, we lowered the residual values on a certain number of tractors in August 2016 causing an on-going increase to depreciation expense. This increase was partially offset by a reduction in the total number of tractors and trailers in the fleet. Sequentially, combined rental and depreciation expense remained unchanged while improving 30 basis points as a percentage of Revenue xFSR from the third quarter of 2016.
Gain or Loss on Disposal of Property and Equipment
The gain on disposal of property and equipment in the fourth quarter of 2016 was $1.4 million, compared to $8.5 million in the fourth quarter of 2015, and $5.6 million in the third quarter of 2016. For the first quarter of 2017, we expect gain on disposal of property and equipment to be in the $1-$2 million range.
Income Tax Expense
GAAP income tax expense for the fourth quarter and full year 2016 was $19.4 million and $65.7 million, respectively. This resulted in an effective tax rate of 27.8% and 30.6% for the fourth quarter and full year, respectively. The lower effective rate in the fourth quarter was primarily due to federal domestic production deductions realized as a discrete item in the quarter. The full year 2016 effective tax rate of 30.6% reflects reduced taxes primarily due to federal domestic production deductions, certain income tax credits received by our foreign and domestic subsidiaries and a reduction in our uncertain tax position reserve. We expect the 2017 full year GAAP effective tax rate to be in the range of 36.0%-37.0%.
Interest Expense
Interest expense, which includes debt related interest expense, the amortization of deferred financing costs, and (through the third quarter 2015) original issue discount, but excludes derivative interest expense, decreased by $1.7 million in the fourth quarter of 2016 to $7.1 million, compared with $8.7 million for the fourth quarter of 2015. The decrease was due to our lower debt balances.
Debt Balances and Stock Repurchases
|
| | | | | | | | | | | |
| September 30, 2016 | | Q4 2016 Changes | | December 31, 2016 |
| Unaudited |
| (In millions) |
Unrestricted Cash | $ | 71.3 |
| | $ | 18.1 |
| | $ | 89.4 |
|
| | | | | |
A/R Securitization ($400 million) (1) | 300.0 |
| | (20.0 | ) | | 280.0 |
|
Revolver ($600 million) | 50.0 |
| | 80.0 |
| | 130.0 |
|
Term Loan A (1) | 594.3 |
| | (100.0 | ) | | 494.3 |
|
Capital Leases & Other Debt | 250.1 |
| | (7.3 | ) | | 242.8 |
|
Total Debt | $ | 1,194.4 |
| | $ | (47.3 | ) | | $ | 1,147.1 |
|
| | | | | |
Net Debt | $ | 1,123.1 |
| | $ | (65.4 | ) | | $ | 1,057.7 |
|
(1) Amounts presented represent face value |
Our leverage ratio as of December 31, 2016 increased slightly to 1.98 compared to 1.94 as of September 30, 2016. This increase was primarily the result of the timing of lease financing versus cash capital expenditures in 2016. As mentioned in previous quarters, we expected our Net Debt balance to increase in the second half of the year as a result of our net cash capital expenditures increasing in the last six months of the year. Our leverage ratio at December 31, 2016 is essentially flat with the prior year, as we used $117.1 million of free cash flow to repurchase our outstanding Class A common stock in 2016, including $2.1 million in the fourth quarter.
Further, during the fourth quarter of 2016, we prepaid $100.0 million of our Term Loan A, funded approximately half from cash flows and half from an advance under our revolving line of credit. Following an additional $22.5 million prepayment in January 2017, all remaining scheduled payments on our Term Loan A have now been prepaid through its maturity in July 2020.
*Data prior to 2013 has not been recast for acquisitions
Cash Flow and Capital Expenditures
We continue to generate positive cash flows from operations. During the year ended December 31, 2016, we generated $466.3 million of cash flows from operating activities. Cash used in investing activities was $122.6 million, compared to $241.8 million for 2015, with the decrease primarily driven by a year over year reduction in capital expenditures of $103.2 million. Cash used in financing activities for the year ended December 31, 2016 was $361.9 million, including $246.8 million in repayment of long-term debt and capital leases, as well as the repurchase of $117.1 million of the Company's outstanding Class A common stock during the period, compared to $325.2 million of cash used in financing activities for the same period in 2015. Our 2016 net cash capital expenditures of $126.0 million were within our expected range of $125-$135 million.
As we mentioned on our mid-fourth quarter conference call, a normal year of maintenance net cash capital expenditures is in the range of $250-$300 million. We intend to be as flexible as possible with capital expenditures in 2017 to appropriately respond to pending business opportunities and the overall market environment.
2016 Summary
2016 proved to be a very challenging year as excess industry capacity, excess customer inventories, a weakening used truck market, and sluggish demand pressured volumes and pricing throughout the year. In response to these market headwinds, our organization developed and implemented several key initiatives, which proved to be effective in offsetting a portion of these negative factors. We are proud of our team's dedication and perseverance, and although the collective annual results are not as strong as we had originally hoped, we are confident we have positioned ourselves to be able to take advantage of the capacity / demand contraction that we believe will manifest itself as we move throughout 2017. Some of the key highlights for the full year 2016 compared to the full year 2015 include:
| |
• | GAAP Diluted EPS of $1.10 and Adjusted EPS of $1.22 |
| |
• | Reduced Net Debt to $1,057.7 million and Leverage Ratio to 1.98 |
| |
• | Completed the repurchase of $117.1 million of the Company's outstanding Class A common stock |
| |
• | Jerry Moyes, Swift's Founder and Chief Executive Officer, announced his retirement effective December 31, 2016 |
| |
• | Richard Stocking, Swift's President and Chief Operating Officer, was appointed Chief Executive Officer by Swift's Board of Directors as Mr. Moyes' successor |
| |
• | Consolidated Average Operational Truck Count reduced 367 units or 2.0%, improving utilization levels |
| |
• | Dedicated Revenue xFSR growth of 8.4% driven by a 7.7% increase in Weekly Revenue xFSR per Tractor |
| |
• | 6.8% improvement in the Swift Refrigerated segment's loaded miles per tractor per week |
| |
• | Improved Intermodal cost infrastructure, centered around utilization, increased dray efficiencies, and overhead reductions; helping mitigate a difficult operating environment |
| |
• | Improved safety trends and fuel efficiency resulting from the investment in new equipment |
| |
• | Reduced our effective tax rate to 30.6% due to federal domestic production deductions, certain income tax credits received by our foreign and domestic subsidiaries and a reduction in our uncertain tax position reserve |
2017 Expectations
As we outlined on our December 9th mid-fourth quarter conference call, we feel 2017 has the potential to be a very exciting year for large, well-capitalized, strategically positioned, compliant carriers. As the deadline for ELD implementation draws closer, we expect the market to have meaningful capacity contraction which we believe will have a positive impact on truckload pricing. Furthermore, we believe our operational improvements and cost-control initiatives implemented throughout 2016 will further strengthen our position within the market. We currently expect our first quarter 2017 GAAP Diluted EPS to be in the range of $0.11-$0.16 and Adjusted EPS to be in the range of $0.13-$0.18. For the second quarter 2017, we expect our GAAP Diluted EPS to be in the range of $0.23-$0.28 and Adjusted EPS to be in the range of $0.25-$0.30. We have identified the following as potential Risks / Opportunities in 2017:
Risks
| |
• | Economic recession and/or softening of freight volumes |
| |
• | Pricing pressure / irrational competitor behavior |
| |
• | Negative safety trends (frequency and severity) and/or claims development |
| |
• | Further weakening of the used truck market |
| |
• | Significant increases in fuel prices |
| |
• | Qualified driver availability |
| |
• | See other risk factors listed below |
Opportunities
| |
• | Further operational and cost control improvements |
| |
• | Cross-selling suite of services to new and existing customers |
| |
• | Positive safety trends (frequency and severity) and/or claims development |
| |
• | Potential favorable changes in corporate tax rate legislation |
| |
• | The impact of new ELD enforcement on capacity and pricing |
| |
• | Customer core carrier consolidation |
Once again, we would like to thank all of our hard-working employees and the professional owner-operators who have contracted with us, as well as our loyal customers and stockholders, for their continued support of Swift as we strive towards Delivering a Better LifeSM to our drivers, customers, and stockholders.
Sincerely,
Conference Call Q&A Session
Swift Transportation's management team will host a Q&A session at 10:30 a.m. Eastern Standard Time on Friday, January 27, 2017 to answer questions about the Company’s fourth quarter financial results. Please email your questions to Investor_Relations@swifttrans.com prior to 7:00 p.m. Eastern Standard Time on Thursday, January 26, 2017.
Participants may access the call using the following dial-in numbers:
U.S./Canada: (877) 897-8479
International/Local: (706) 501-7951
Conference ID: 49094961
The live webcast, letter to stockholders, transcript of the Q&A, and the replay of the earnings Q&A session can be accessed via our investor relations website at investor.swifttrans.com.
IR Contact:
Jason Bates
Vice President of Finance &
Investor Relations Officer
(623) 907-7335
Forward Looking Statements
This letter contains statements that may constitute forward-looking statements, which are based on information currently available, usually identified by words such as "anticipates," "believes," "estimates," "plans,'' "projects," "expects," "hopes," "intends," "will," "could," "should," "may," or similar expressions which speak only as of the date the statement was made. Such forward-looking statements are made pursuant to the safe harbor provisions of the Private Securities Litigation Reform Act of 1995. Such statements include, but are not limited to, statements concerning:
| |
• | trends and expectations relating to our operations, growth in the Dedicated segment, expenses, other revenue, pricing and demand, utilization, profitability, Adjusted EPS, and related metrics; |
| |
• | risks and opportunities in 2017; |
| |
• | the expected benefits of our cost cutting and similar strategic actions; |
| |
• | the impact on the transportation industry and the Company of the new ELD regulations; |
| |
• | estimate gains on the disposal of property and equipment; |
| |
• | our expected first and second quarter 2017 EPS and Adjusted EPS; |
| |
• | our expected 2017 effective tax rate; |
| |
• | the timing and level of fleet size changes and equipment and container count; and |
| |
• | estimated net capital expenditures for 2017. |
Such forward-looking statements are inherently uncertain, and are based upon the current beliefs, assumptions and expectations of Company management and current market conditions, which are subject to significant risks and uncertainties as set forth in the Risk Factors section of our Annual Report on Form 10-K for the year ended December 31, 2015. As to the Company’s business and financial performance, the following factors, among others, could cause actual results to differ materially from those in forward-looking statements:
| |
• | economic conditions, including future recessionary economic cycles and downturns in customers’ business cycles, particularly in market segments and industries in which we have a significant concentration of customers; |
| |
• | increasing competition from trucking, rail, intermodal, and brokerage competitors; |
| |
• | our ability to execute or integrate any future acquisitions successfully; |
| |
• | increases in driver compensation to the extent not offset by increases in freight rates and difficulties in driver recruitment and retention; |
| |
• | additional risks arising from our contractual agreements with owner-operators that do not exist with our Company drivers; |
| |
• | our ability to retain or replace key personnel; |
| |
• | our dependence on third parties for intermodal and brokerage business; |
| |
• | potential failure in computer or communications systems; |
| |
• | seasonal factors such as harsh weather conditions that increase operating costs; |
| |
• | the regulatory environment in which we operate and changes in existing regulations, or violations by us of existing or future regulations; |
| |
• | the possible re-classification of our owner-operators as employees; |
| |
• | changes in rules or legislation by the National Labor Relations Board or Congress and/or union organizing efforts; |
| |
• | our Compliance Safety Accountability safety rating; |
| |
• | government regulations with respect to our captive insurance companies; |
| |
• | uncertainties and risks associated with our operations in Mexico; |
| |
• | a significant reduction in, or termination of, our trucking services by a key customer; |
| |
• | our significant ongoing capital requirements; |
| |
• | volatility in the price or availability of fuel as well as our ability to recover fuel prices through our fuel surcharge program; |
| |
• | fluctuations in new equipment prices or replacement costs, and the potential failure of manufactures to meet their sale and trade back obligations; |
| |
• | the impact that our substantial leverage may have on the way we operate our business and our ability to service our debt, including compliance with our debt covenants, and the impact such indebtedness may have on the way we operate our business; |
| |
• | restrictions contained in our debt agreements; |
| |
• | adverse impacts of insuring risk through our captive insurance companies, including our need to provide restricted cash and similar collateral for anticipated losses; |
| |
• | potential volatility or decrease in the amount of earnings as a result of our claims exposure through our captive insurance companies; |
| |
• | the potential impact of the significant number of shares of our common stock that is eligible for future sale; |
| |
• | our intention to not pay dividends; |
| |
• | conflicts of interest or potential litigation that may arise from other businesses owned by Jerry Moyes, including pledges of Swift stock and guarantees related to other businesses by Jerry Moyes; |
| |
• | the significant amount of our stock and related control over the Company by Jerry Moyes; and |
| |
• | related-party transactions between the Company and Jerry Moyes. |
You should understand that many important factors, in addition to those listed above and in our filings with the SEC, could impact us financially. As a result of these and other factors, actual results may differ from those set forth in the forward-looking statements and the prices of the Company's securities may fluctuate dramatically. The Company makes no commitment, and disclaims any duty, to update or revise any forward-looking statements to reflect future events, new information or changes in these expectations.
Use of Non-GAAP Measures
In addition to our GAAP results, this Letter to Stockholders also includes certain non-GAAP financial measures, as defined by the SEC. The terms "Adjusted EPS," "Adjusted Operating Ratio," and "Adjusted EBITDA," as we define them, are not presented in accordance with GAAP. These financial measures supplement our GAAP results in evaluating certain aspects of our business. We believe that using these measures improves comparability in analyzing our performance because they remove the impact of items from our operating results that, in our opinion, do not reflect our core operating performance. Management and the board of directors focus on Adjusted EPS, Adjusted Operating Ratio, and Adjusted EBITDA as key measures of our performance, all of which are reconciled to the most comparable GAAP financial measures and further discussed below. We believe our presentation of these non-GAAP financial measures is useful because it provides investors and securities analysts the same information that we use internally for purposes of assessing our core operating performance and compliance with debt covenants.
Adjusted EPS, Adjusted Operating Ratio, and Adjusted EBITDA are not substitutes for their comparable GAAP financial measures, such as net income, cash flows from operating activities, operating margin, or other measures prescribed by GAAP. There are limitations to using non-GAAP financial measures. Although we believe that they improve comparability in analyzing our period to period performance, they could limit comparability to other companies in our industry if those companies define these measures differently. Because of these limitations, our non-GAAP financial measures should not be considered measures of income generated by our business or discretionary cash available to us to invest in the growth of our business. Management compensates for these limitations by primarily relying on GAAP results and using non-GAAP financial measures on a supplemental basis.
CONSOLIDATED INCOME STATEMENTS (UNAUDITED)
THREE MONTHS AND YEARS ENDED DECEMBER 31, 2016, 2015, AND 2014
|
| | | | | | | | | | | | | | | | | | | | | | | |
| Three Months Ended December 31, | | Year Ended December 31, |
| 2016 | | 2015 | | 2014 | | 2016 | | 2015 | | 2014 |
| (In thousands, except per share data) |
Operating revenue: | | | | | | | | | | | |
Revenue, excluding fuel surcharge revenue | $ | 950,809 |
| | $ | 996,239 |
| | $ | 960,226 |
| | $ | 3,722,863 |
| | $ | 3,781,976 |
| | $ | 3,535,391 |
|
Fuel surcharge revenue | 87,805 |
| | 93,562 |
| | 179,274 |
| | 308,654 |
| | 447,346 |
| | 763,333 |
|
Operating revenue | 1,038,614 |
| | 1,089,801 |
| | 1,139,500 |
| | 4,031,517 |
| | 4,229,322 |
| | 4,298,724 |
|
Operating expenses: | | | | | | | | | | | |
Salaries, wages, and employee benefits | 279,779 |
| | 290,199 |
| | 263,219 |
| | 1,148,610 |
| | 1,111,946 |
| | 970,683 |
|
Operating supplies and expenses | 98,783 |
| | 99,665 |
| | 88,712 |
| | 389,968 |
| | 387,735 |
| | 342,073 |
|
Fuel | 92,459 |
| | 90,184 |
| | 133,057 |
| | 345,281 |
| | 416,782 |
| | 591,855 |
|
Purchased transportation | 285,757 |
| | 297,049 |
| | 333,738 |
| | 1,116,709 |
| | 1,180,403 |
| | 1,321,268 |
|
Rental expense | 55,932 |
| | 59,592 |
| | 61,781 |
| | 226,258 |
| | 240,501 |
| | 229,290 |
|
Insurance and claims | 51,845 |
| | 40,155 |
| | 45,804 |
| | 192,733 |
| | 179,545 |
| | 159,246 |
|
Depreciation and amortization of property and equipment | 68,250 |
| | 67,541 |
| | 55,787 |
| | 267,134 |
| | 251,735 |
| | 221,122 |
|
Amortization of intangibles | 4,203 |
| | 4,203 |
| | 4,203 |
| | 16,814 |
| | 16,814 |
| | 16,814 |
|
Impairments | 807 |
| | — |
| | — |
| | 807 |
| | — |
| | 2,308 |
|
Gain on disposal of property and equipment | (1,376 | ) | | (8,466 | ) | | (4,583 | ) | | (18,285 | ) | | (32,453 | ) | | (27,682 | ) |
Communication and utilities | 7,746 |
| | 8,472 |
| | 7,664 |
| | 28,723 |
| | 31,606 |
| | 29,871 |
|
Operating taxes and licenses | 18,958 |
| | 19,500 |
| | 17,651 |
| | 74,753 |
| | 74,604 |
| | 71,806 |
|
Total operating expenses | 963,143 |
| | 968,094 |
| | 1,007,033 |
| | 3,789,505 |
| | 3,859,218 |
| | 3,928,654 |
|
Operating income | 75,471 |
| | 121,707 |
| | 132,467 |
| | 242,012 |
| | 370,104 |
| | 370,070 |
|
Other expenses (income): | | | | | | | | | | | |
Interest expense | 7,053 |
| | 8,723 |
| | 15,014 |
| | 30,598 |
| | 38,350 |
| | 80,064 |
|
Derivative interest expense | — |
| | — |
| | 1,468 |
| | — |
| | 3,972 |
| | 6,495 |
|
Interest income | (623 | ) | | (701 | ) | | (674 | ) | | (2,634 | ) | | (2,526 | ) | | (2,909 | ) |
Loss on debt extinguishment | — |
| | — |
| | 27,152 |
| | — |
| | 9,567 |
| | 39,909 |
|
Non-cash impairments of non-operating assets | — |
| | — |
| | — |
| | — |
| | 1,480 |
| | — |
|
(Gain) loss on sale of real property | — |
| | (5 | ) | | — |
| | — |
| | 133 |
| | — |
|
Legal settlements and reserves | — |
| | — |
| | — |
| | 3,000 |
| | 6,000 |
| | — |
|
Other income, net | (828 | ) | | (1,179 | ) | | (1,699 | ) | | (3,921 | ) | | (3,658 | ) | | (4,115 | ) |
Total other expenses (income), net | 5,602 |
| | 6,838 |
| | 41,261 |
| | 27,043 |
| | 53,318 |
| | 119,444 |
|
Income before income taxes | 69,869 |
| | 114,869 |
| | 91,206 |
| | 214,969 |
| | 316,786 |
| | 250,626 |
|
Income tax expense | 19,427 |
| | 42,367 |
| | 32,715 |
| | 65,702 |
| | 119,209 |
| | 89,474 |
|
Net income | $ | 50,442 |
| | $ | 72,502 |
| | $ | 58,491 |
| | $ | 149,267 |
| | $ | 197,577 |
| | $ | 161,152 |
|
Basic earnings per share | $ | 0.38 |
| | $ | 0.52 |
| | $ | 0.41 |
| | $ | 1.11 |
| | $ | 1.39 |
| | $ | 1.14 |
|
Diluted earnings per share | $ | 0.38 |
| | $ | 0.51 |
| | $ | 0.41 |
| | $ | 1.10 |
| | $ | 1.38 |
| | $ | 1.12 |
|
Shares used in per share calculations: | | | | | | | | | | | |
Basic | 132,702 |
| | 140,532 |
| | 141,869 |
| | 134,139 |
| | 142,018 |
| | 141,431 |
|
Diluted | 133,940 |
| | 141,631 |
| | 143,695 |
| | 135,494 |
| | 143,668 |
| | 143,475 |
|
NON GAAP RECONCILIATION:
ADJUSTED EPS (UNAUDITED) (1)
THREE MONTHS AND YEARS ENDED DECEMBER 31, 2016, 2015, AND 2014
Note: Since the numbers reflected in the table below are calculated on a per share basis, they may not foot due to rounding.
|
| | | | | | | | | | | | | | | | | | | | | | | |
| Three Months Ended December 31, | | Year Ended December 31, |
| 2016 | | 2015 | | 2014 | | 2016 | | 2015 | | 2014 |
Diluted earnings per share | $ | 0.38 |
| | $ | 0.51 |
| | $ | 0.41 |
| | $ | 1.10 |
| | $ | 1.38 |
| | $ | 1.12 |
|
Adjusted for: | | | | | | | | | | | |
Income tax expense | 0.15 |
| | 0.30 |
| | 0.23 |
| | 0.48 |
| | 0.83 |
| | 0.62 |
|
Income before income taxes | 0.52 |
| | 0.81 |
| | 0.63 |
| | 1.59 |
| | 2.20 |
| | 1.75 |
|
Non-cash impairments (2) | 0.01 |
| | — |
| | — |
| | 0.01 |
| | — |
| | 0.02 |
|
Non-cash impairments of non-operating assets (3) | — |
| | — |
| | — |
| | — |
| | 0.01 |
| | — |
|
Loss on debt extinguishment (4) | — |
| | — |
| | 0.19 |
| | — |
| | 0.07 |
| | 0.28 |
|
Amortization of certain
intangibles (5) | 0.03 |
| | 0.03 |
| | 0.03 |
| | 0.12 |
| | 0.11 |
| | 0.11 |
|
Moyes retirement package (6) | — |
| | — |
| | — |
| | 0.05 |
| | — |
| | — |
|
Adjusted income before income taxes | 0.56 |
| | 0.84 |
| | 0.85 |
| | 1.76 |
| | 2.39 |
| | 2.15 |
|
Provision for income tax expense at effective rate | (0.15 | ) | | (0.31 | ) | | (0.30 | ) | | (0.54 | ) | | (0.90 | ) | | (0.77 | ) |
Adjusted EPS (1) | $ | 0.40 |
| | $ | 0.53 |
| | $ | 0.55 |
| | $ | 1.22 |
| | $ | 1.49 |
| | $ | 1.38 |
|
(1) Our definition of the non-GAAP measure, Adjusted EPS, starts with (a) income (loss) before income taxes, the most comparable GAAP measure. We add the following items back to (a) to arrive at (b) adjusted income (loss) before income taxes:
| |
(i) | amortization of the intangibles from our 2007 going-private transaction, |
| |
(ii) | non-cash impairments, |
| |
(iii) | other special non-cash items, |
| |
(iv) | excludable transaction costs, |
| |
(v) | mark-to-market adjustments on our interest rate swaps, recognized in the income statement, |
| |
(vi) | amortization of previous losses recorded in accumulated other comprehensive income (loss) ("AOCI") related to the interest rate swaps we terminated upon our IPO and refinancing transactions in December 2010, and |
| |
(vii) | severance expense, including cash and equity award impact, related to the departure of certain executive leadership. |
We subtract income taxes, at the GAAP effective tax rate, from (b) to arrive at (c) adjusted earnings. Adjusted EPS is equal to (c) divided by weighted average diluted shares outstanding.
We believe that excluding the impact of derivatives provides for more transparency and comparability since these transactions have historically been volatile. Additionally, we believe that comparability of our performance is improved by excluding impairments that are unrelated to our core operations, as well as intangibles from the 2007 going-private transactions and other special items that are non-comparable in nature.
(2) During the three months ended December 31, 2016, certain operations software related to the Company's logistics business was determined to be fully impaired based on a significant decrease in the expected useful life of the software. This resulted in a pre-tax impairment loss of $0.5 million. Also during the three months ended December 31, 2016, management reassessed the fair value of certain IEL tractors, which had a total book value of $2.2 million, determining that there was a pre-tax impairment loss of $0.3 million. The impairment losses were recorded in "Impairments" within operating income in the consolidated income statement.
During the three months ended September 30, 2014, certain operations software was replaced and determined to be fully impaired. This resulted in a pre-tax impairment loss of $2.3 million, recorded in "Non-cash impairments of non-operating assets" in the consolidated income statement.
| |
(3) | During the three months ended, March 31, 2015, the Company recorded an impairment loss related to an uncollectible note receivable. In September 2013, the Company agreed to advance up to $2.3 million, pursuant to an unsecured promissory note, to an independent fleet contractor that transported freight on Swift's behalf. In March 2015, management became aware that the independent contractor violated various covenants outlined in the unsecured promissory note, which created an event of default that made the principal and accrued interest immediately due and payable. As a result of this event of default, as well as an overall decline in the independent contractor's financial condition, management re-evaluated the fair value of the unsecured promissory note. At March 31, 2015, management determined that the remaining balance due from the independent contractor to the Company was not collectible, which resulted in a $1.5 million pre-tax impairment that was recorded in "Non-cash impairments of non-operating assets" in the Company's consolidated income statement. |
(4) In July 2015, the Company entered into a Fourth Amended and Restated Credit Agreement ("2015 Agreement"), which included a $680.0 million first lien Term Loan A tranche and a $600.0 million revolving credit line. The 2015 Agreement replaced the then-existing $450.0 million revolving credit line, as well as the first lien Term Loan A and Term Loan B tranches of the Third Amended and Restated Credit Agreement ("2014 Agreement"), which had outstanding principal balances at closing of $485.0 million and $395.0 million, respectively. The replacement of the 2014 Agreement
NON GAAP RECONCILIATION:
ADJUSTED EPS (UNAUDITED) (1) — CONTINUED
THREE MONTHS AND YEARS ENDED DECEMBER 31, 2016, 2015, AND 2014
resulted in a loss on debt extinguishment of $9.6 million, reflecting the write-off of the unamortized original issue discount and deferred financing fees related to the 2014 Agreement and the previous revolving credit line.
In November 2014, the Company redeemed, in full, the remaining $428.1 million face value of its Senior Secured Second Priority Notes due 2018 ("Senior Notes"). The Company paid 105% of face value, plus accrued and unpaid interest, to call the Senior Notes. The November 2014 redemption followed a series of refinancing transactions that occurred in the first nine months of 2014, in which the Company used cash on hand to repurchase $71.9 million in principal of the Senior Notes. Including the November 2014 redemption, the Company repurchased $500.0 million in principal of the Senior Notes during 2014, averaging 105.58% of the face value. In connection with these transactions, the Company incurred a loss on debt extinguishment of $27.2 million and $34.7 million during the three months and year ended December 31, 2014, respectively. The loss on debt extinguishment reflects the cost of the premium paid, as well as the write-off of original issue discount and deferred financing costs. These transactions significantly reduced Swift’s average cost of debt.
In June 2014, the Company entered into the 2014 Agreement, which included a $500.0 million delayed-draw first lien Term Loan A tranche, a $400.0 million first lien Term Loan B tranche, and a $450.0 million revolving credit line. The 2014 Agreement replaced the then-existing $400.0 million revolving credit line, as well as the first lien Term Loan B-1 and B-2 tranches of the Second Amended and Restated Credit Agreement ("2013 Agreement"), which had outstanding principal balances at closing of $229.0 million and $370.9 million, respectively. The replacement of the 2013 Agreement resulted in a loss on debt extinguishment of $5.2 million, reflecting the write-off of the unamortized original issue discount and deferred financing fees related to the 2013 Agreement and the previous revolving credit line.
(5) Amortization of certain intangibles reflects the non-cash amortization expense relating to certain intangible assets identified in the 2007 going-private transaction through which Swift Corporation acquired Swift Transportation Co.
| |
(6) | In conjunction with the Company's September 8, 2016 announcement that Jerry Moyes would retire from his position as Chief Executive Officer effective December 31, 2016, the Company entered into an agreement with Mr. Moyes to memorialize the terms of his retirement. The Company has contracted with Mr. Moyes to serve as a non-employee consultant from January 1, 2017 through December 31, 2019, during which time the Company will pay Mr. Moyes a monthly consulting fee of $0.2 million in cash. Additionally, the Company modified the vesting terms and forfeiture conditions of Mr. Moyes' previously-granted equity awards. As a result of the terms of the agreement, the Company incurred a one-time expense in September 2016 totaling $7.1 million, consisting of $6.8 million in accrued consulting fees and $0.3 million for the impact of the equity award modifications. The amounts are included in "Salaries, wages, and employee benefits" within the non-reportable segments' income statement. |
NON-GAAP RECONCILIATION:
ADJUSTED OPERATING RATIO (UNAUDITED) (1)
THREE MONTHS AND YEARS ENDED DECEMBER 31, 2016, 2015, AND 2014
|
| | | | | | | | | | | | | | | | | | | | | | | |
| Three Months Ended December 31, | | Year Ended December 31, |
| 2016 | | 2015 | | 2014 | | 2016 | | 2015 | | 2014 |
| (Dollars in thousands) |
Operating revenue | $ | 1,038,614 |
| | $ | 1,089,801 |
| | $ | 1,139,500 |
| | $ | 4,031,517 |
| | $ | 4,229,322 |
| | $ | 4,298,724 |
|
Less: Fuel surcharge revenue | (87,805 | ) | | (93,562 | ) | | (179,274 | ) | | (308,654 | ) | | (447,346 | ) | | (763,333 | ) |
Revenue, excluding fuel surcharge revenue | $ | 950,809 |
| | $ | 996,239 |
| | $ | 960,226 |
| | $ | 3,722,863 |
| | $ | 3,781,976 |
| | $ | 3,535,391 |
|
| | | | | | | | | | | |
Operating expense | $ | 963,143 |
| | $ | 968,094 |
| | $ | 1,007,033 |
| | $ | 3,789,505 |
| | $ | 3,859,218 |
| | $ | 3,928,654 |
|
Adjusted for: | | | | | | | | | | | |
Fuel surcharge revenue | (87,805 | ) | | (93,562 | ) | | (179,274 | ) | | (308,654 | ) | | (447,346 | ) | | (763,333 | ) |
Amortization of certain
intangibles (2) | (3,912 | ) | | (3,912 | ) | | (3,912 | ) | | (15,648 | ) | | (15,648 | ) | | (15,648 | ) |
Non-cash impairments (3) | (807 | ) | | — |
| | — |
| | (807 | ) | | — |
| | (2,308 | ) |
Moyes retirement package (4) | — |
| | — |
| | — |
| | (7,079 | ) | | — |
| | — |
|
Adjusted operating expense | $ | 870,619 |
| | $ | 870,620 |
| | $ | 823,847 |
| | $ | 3,457,317 |
| | $ | 3,396,224 |
| | $ | 3,147,365 |
|
Operating Ratio | 92.7 | % | | 88.8 | % | | 88.4 | % | | 94.0 | % | | 91.2 | % | | 91.4 | % |
Adjusted Operating Ratio | 91.6 | % | | 87.4 | % | | 85.8 | % | | 92.9 | % | | 89.8 | % | | 89.0 | % |
(1) Our definition of the non-GAAP measure, Adjusted Operating Ratio, starts with (a) operating expense and (b) operating revenue, which are GAAP financial measures. We subtract the following items from (a) to arrive at (c) adjusted operating expense:
| |
(i) | fuel surcharge revenue, |
| |
(ii) | amortization of the intangibles from our 2007 going-private transaction, |
| |
(iii) | non-cash operating impairment charges, |
| |
(iv) | other special non-cash items, |
| |
(v) | excludable transaction costs, and |
| |
(vi) | severance expense, including cash and equity award impact, related to the departure of certain executive leadership. |
We then subtract fuel surcharge revenue from (b) to arrive at (d) Revenue xFSR. Adjusted Operating Ratio is equal to (c) adjusted operating expense as a percentage of (d) Revenue xFSR.
We net fuel surcharge revenue against fuel expense in the calculation of our Adjusted Operating Ratio, thereby excluding fuel surcharge revenue from operating revenue in the denominator. Because fuel surcharge revenue is so volatile, we believe excluding it provides for more transparency and comparability. Additionally, we believe that comparability of our performance is improved by excluding impairments, non-comparable intangibles from our 2007 going-private transaction and other special items.
(2) Includes the items discussed in note (5) to the Non-GAAP Reconciliation: Adjusted EPS.
(3) Includes the items discussed in note (2) to the Non-GAAP Reconciliation: Adjusted EPS.
(4) Includes the items discussed in note (6) to the Non-GAAP Reconciliation: Adjusted EPS.
NON-GAAP RECONCILIATION:
ADJUSTED EARNINGS BEFORE INTEREST, TAXES, DEPRECIATION, AND AMORTIZATION (UNAUDITED) (1)
THREE MONTHS AND YEARS ENDED DECEMBER 31, 2016, 2015, AND 2014
|
| | | | | | | | | | | | | | | | | | | | | | | |
| Three Months Ended December 31, | | Year Ended December 31, |
| 2016 | | 2015 | | 2014 | | 2016 | | 2015 | | 2014 |
| (In thousands) |
Net income | $ | 50,442 |
| | $ | 72,502 |
| | $ | 58,491 |
| | $ | 149,267 |
| | $ | 197,577 |
| | $ | 161,152 |
|
Adjusted for: | | | | | | | | | | | |
Depreciation and amortization of property and equipment | 68,250 |
| | 67,541 |
| | 55,787 |
| | 267,134 |
| | 251,735 |
| | 221,122 |
|
Amortization of intangibles | 4,203 |
| | 4,203 |
| | 4,203 |
| | 16,814 |
| | 16,814 |
| | 16,814 |
|
Interest expense | 7,053 |
| | 8,723 |
| | 15,014 |
| | 30,598 |
| | 38,350 |
| | 80,064 |
|
Derivative interest expense | — |
| | — |
| | 1,468 |
| | — |
| | 3,972 |
| | 6,495 |
|
Interest income | (623 | ) | | (701 | ) | | (674 | ) | | (2,634 | ) | | (2,526 | ) | | (2,909 | ) |
Income tax expense | 19,427 |
| | 42,367 |
| | 32,715 |
| | 65,702 |
| | 119,209 |
| | 89,474 |
|
Earnings before interest, taxes, depreciation and amortization (EBITDA) | 148,752 |
| | 194,635 |
| | 167,004 |
| | 526,881 |
| | 625,131 |
| | 572,212 |
|
Non-cash impairments (2) | 807 |
| | — |
| | — |
| | 807 |
| | — |
| | 2,308 |
|
Non-cash equity compensation (3) | 1,326 |
| | 1,907 |
| | 1,504 |
| | 6,017 |
| | 6,525 |
| | 5,396 |
|
Loss on debt extinguishment (4) | — |
| | — |
| | 27,152 |
| | — |
| | 9,567 |
| | 39,909 |
|
Non-cash impairments of non-operating assets (5) | — |
| | — |
| | — |
| | — |
| | 1,480 |
| | — |
|
Adjusted earnings before interest, taxes, depreciation and amortization (Adjusted EBITDA) | $ | 150,885 |
| | $ | 196,542 |
| | $ | 195,660 |
| | $ | 533,705 |
| | $ | 642,703 |
| | $ | 619,825 |
|
(1) Our definition of the non-GAAP measure, Adjusted EBITDA, starts with (a) net income (loss), the most comparable GAAP measure. We add the following items back to (a) to arrive at Adjusted EBITDA:
| |
(i) | depreciation and amortization, |
| |
(ii) | interest and derivative interest expense, including fees and charges associated with indebtedness, net of interest income, |
| |
(iv) | non-cash equity compensation expense, |
| |
(vi) | other special non-cash items, and |
| |
(vii) | excludable transaction costs. |
We believe that Adjusted EBITDA is a relevant measure for estimating the cash generated by our operations that would be available to cover capital expenditures, taxes, interest and other investments and it enhances an investor's understanding of our financial performance. We use Adjusted EBITDA for business planning purposes and in measuring our performance relative to that of our competitors. Our method of computing Adjusted EBITDA is consistent with that used in our debt covenants, specifically our leverage ratio, and is also routinely reviewed by management for that purpose.
(2) Includes the items discussed in note (2) to the Non-GAAP Reconciliation: Adjusted EPS.
(3) Represents recurring non-cash equity compensation expense, on a pre-tax basis. In accordance with the terms of our senior credit agreement, this expense is added back in the calculation of Adjusted EBITDA for covenant compliance purposes.
(4) Includes the items discussed in note (4) to the Non-GAAP Reconciliation: Adjusted EPS.
(5) Includes the items discussed in note (3) to the Non-GAAP Reconciliation: Adjusted EPS.
FINANCIAL INFORMATION BY SEGMENT (UNAUDITED)
THREE MONTHS AND YEARS ENDED DECEMBER 31, 2016, 2015, AND 2014
|
| | | | | | | | | | | | | | | | | | | | | | | |
| Three Months Ended December 31, | | Year Ended December 31, |
| 2016 | | 2015 | | 2014 | | 2016 | | 2015 | | 2014 |
| (Dollars in thousands) |
Operating revenue: | | | | | | | | | | | |
Truckload | $ | 521,242 |
| | $ | 557,242 |
| | $ | 601,541 |
| | $ | 2,048,049 |
| | $ | 2,204,114 |
| | $ | 2,301,010 |
|
Dedicated | 257,323 |
| | 241,152 |
| | 237,302 |
| | 971,246 |
| | 927,657 |
| | 892,078 |
|
Swift Refrigerated | 84,506 |
| | 93,950 |
| | 103,858 |
| | 341,280 |
| | 380,251 |
| | 417,980 |
|
Intermodal | 95,283 |
| | 100,745 |
| | 109,391 |
| | 360,157 |
| | 390,572 |
| | 401,577 |
|
Subtotal | 958,354 |
| | 993,089 |
| | 1,052,092 |
| | 3,720,732 |
| | 3,902,594 |
| | 4,012,645 |
|
Non-reportable segments (1) | 98,046 |
| | 118,114 |
| | 103,690 |
| | 386,349 |
| | 407,781 |
| | 342,969 |
|
Intersegment eliminations | (17,786 | ) | | (21,402 | ) | | (16,282 | ) | | (75,564 | ) | | (81,053 | ) | | (56,890 | ) |
Consolidated operating revenue | $ | 1,038,614 |
| | $ | 1,089,801 |
| | $ | 1,139,500 |
| | $ | 4,031,517 |
| | $ | 4,229,322 |
| | $ | 4,298,724 |
|
| | | | | | | | | | | |
Operating income (loss): | | | | | | | | | | | |
Truckload | $ | 47,349 |
| | $ | 75,197 |
| | $ | 85,383 |
| | $ | 181,781 |
| | $ | 257,007 |
| | $ | 258,072 |
|
Dedicated | 25,841 |
| | 27,850 |
| | 19,460 |
| | 108,481 |
| | 82,735 |
| | 75,794 |
|
Swift Refrigerated | 2,934 |
| | 3,542 |
| | 4,715 |
| | (12,844 | ) | | 17,080 |
| | 14,035 |
|
Intermodal | 1,100 |
| | 3,047 |
| | 7,785 |
| | (547 | ) | | 4,128 |
| | 8,298 |
|
Subtotal | 77,224 |
| | 109,636 |
| | 117,343 |
| | 276,871 |
| | 360,950 |
| | 356,199 |
|
Non-reportable segments (1) | (1,753 | ) | | 12,071 |
| | 15,124 |
| | (34,859 | ) | | 9,154 |
| | 13,871 |
|
Consolidated operating income | $ | 75,471 |
| | $ | 121,707 |
| | $ | 132,467 |
| | $ | 242,012 |
| | $ | 370,104 |
| | $ | 370,070 |
|
| | | | | | | | | | | |
Operating ratio: (2) | | | | | | | | | | | |
Truckload | 90.9 | % | | 86.5 | % | | 85.8 | % | | 91.1 | % | | 88.3 | % | | 88.8 | % |
Dedicated | 90.0 | % | | 88.5 | % | | 91.8 | % | | 88.8 | % | | 91.1 | % | | 91.5 | % |
Swift Refrigerated | 96.5 | % | | 96.2 | % | | 95.5 | % | | 103.8 | % | | 95.5 | % | | 96.6 | % |
Intermodal | 98.8 | % | | 97.0 | % | | 92.9 | % | | 100.2 | % | | 98.9 | % | | 97.9 | % |
| | | | | | | | | | | |
Adjusted Operating Ratio: (2) | | | | | | | | | | | |
Truckload | 90.0 | % | | 85.1 | % | | 82.9 | % | | 90.3 | % | | 86.8 | % | | 86.1 | % |
Dedicated | 89.3 | % | | 87.7 | % | | 90.4 | % | | 88.2 | % | | 90.2 | % | | 89.8 | % |
Swift Refrigerated | 96.0 | % | | 95.7 | % | | 94.4 | % | | 104.2 | % | | 94.8 | % | | 95.8 | % |
Intermodal | 98.7 | % | | 96.6 | % | | 91.3 | % | | 100.2 | % | | 98.8 | % | | 97.4 | % |
| |
(1) | The non-reportable segments include the Company's logistics and freight brokerage services, as well as support services that its subsidiaries provide to customers and owner-operators, including repair and maintenance shop services, equipment leasing, and insurance. Intangible amortization related to the 2007 Transactions, certain legal settlements and reserves, and certain other corporate expenses are also included in the non-reportable segments. |
(2) For detailed calculation, refer to the Non-GAAP Reconciliation: Adjusted Operating Ratio by Reportable Segment, and for definition, refer to Non-GAAP Reconciliation: Adjusted Operating Ratio.
OPERATING STATISTICS BY REPORTABLE SEGMENT (UNAUDITED)
THREE MONTHS AND YEARS ENDED DECEMBER 31, 2016, 2015, AND 2014
|
| | | | | | | | | | | | | | | | | | | | | | | |
| Three Months Ended December 31, | | Year Ended |
| 2016 | | 2015 | | 2014 | | 2016 | | 2015 | | 2014 |
Truckload: | | | | | | | | | | | |
Weekly Revenue xFSR per tractor | $ | 3,577 |
| | $ | 3,659 |
| | $ | 3,671 |
| | $ | 3,442 |
| | $ | 3,546 |
| | $ | 3,450 |
|
Total loaded miles (1) | 249,901 |
| | 259,762 |
| | 262,114 |
| | 1,010,193 |
| | 1,037,636 |
| | 1,030,443 |
|
Average operational truck count: | | | | | | | | | | | |
Company | 7,180 |
| | 7,567 |
| | 7,114 |
| | 7,477 |
| | 7,508 |
| | 6,975 |
|
Owner-operator | 2,875 |
| | 2,898 |
| | 3,219 |
| | 2,920 |
| | 3,021 |
| | 3,361 |
|
Total | 10,055 |
| | 10,465 |
| | 10,333 |
| | 10,397 |
| | 10,529 |
| | 10,336 |
|
Deadhead miles percentage | 12.4 | % | | 12.7 | % | | 12.3 | % | | 12.1 | % | | 12.1 | % | | 11.9 | % |
| | | | | | | | | | | |
Dedicated: | | | | | | | | | | | |
Weekly Revenue xFSR per tractor | $ | 3,641 |
| | $ | 3,418 |
| | $ | 3,210 |
| | $ | 3,583 |
| | $ | 3,326 |
| | $ | 3,182 |
|
Average operational truck count: | | | | | | | | | | | |
Company | 4,142 |
| | 4,136 |
| | 3,838 |
| | 4,060 |
| | 4,006 |
| | 3,609 |
|
Owner-operator | 895 |
| | 894 |
| | 964 |
| | 850 |
| | 884 |
| | 852 |
|
Total | 5,037 |
| | 5,030 |
| | 4,802 |
| | 4,910 |
| | 4,890 |
| | 4,461 |
|
| | | | | | | | | | | |
Swift Refrigerated: | | | | | | | | | | | |
Weekly Revenue xFSR per tractor | $ | 3,578 |
| | $ | 3,448 |
| | $ | 3,558 |
| | $ | 3,532 |
| | $ | 3,434 |
| | $ | 3,461 |
|
Total loaded miles (1) | 39,549 |
| | 43,159 |
| | 40,838 |
| | 163,838 |
| | 170,684 |
| | 166,637 |
|
Average operational truck count: | | | | | | | | | | | |
Company | 993 |
| | 1,230 |
| | 1,221 |
| | 1,049 |
| | 1,242 |
| | 1,102 |
|
Owner-operator | 577 |
| | 594 |
| | 579 |
| | 593 |
| | 590 |
| | 755 |
|
Total | 1,570 |
| | 1,824 |
| | 1,800 |
| | 1,642 |
| | 1,832 |
| | 1,857 |
|
Deadhead miles percentage | 13.9 | % | | 14.5 | % | | 15.6 | % | | 13.9 | % | | 14.2 | % | | 15.2 | % |
| | | | | | | | | | | |
Intermodal: | | | | | | | | | | | |
Average operational truck count: | | | | | | | | | | | |
Company | 425 |
| | 518 |
| | 456 |
| | 437 |
| | 517 |
| | 426 |
|
Owner-operator | 85 |
| | 114 |
| | 86 |
| | 89 |
| | 102 |
| | 77 |
|
Total | 510 |
| | 632 |
| | 542 |
| | 526 |
| | 619 |
| | 503 |
|
Load Count | 44,043 |
| | 45,949 |
| | 46,182 |
| | 172,209 |
| | 181,513 |
| | 172,464 |
|
Average Container Count | 9,131 |
| | 9,150 |
| | 9,150 |
| | 9,142 |
| | 9,150 |
| | 8,841 |
|
(1) Total loaded miles presented in thousands.
NON-GAAP RECONCILIATION:
ADJUSTED OPERATING RATIO BY REPORTABLE SEGMENT (UNAUDITED)
THREE MONTHS AND YEARS ENDED DECEMBER 31, 2016, 2015, AND 2014
|
| | | | | | | | | | | | | | | | | | | | | | | |
| Three Months Ended December 31, | | Year Ended December 31, |
| 2016 | | 2015 | | 2014 | | 2016 | | 2015 | | 2014 |
| (Dollars in thousands) |
Truckload: | | | | | | | | | | | |
Operating revenue | $ | 521,242 |
| | $ | 557,242 |
| | $ | 601,541 |
| | $ | 2,048,049 |
| | $ | 2,204,114 |
| | $ | 2,301,010 |
|
Less: Fuel surcharge revenue | (48,575 | ) | | (53,945 | ) | | (103,044 | ) | | (176,676 | ) | | (257,150 | ) | | (442,023 | ) |
Revenue xFSR | $ | 472,667 |
| | $ | 503,297 |
| | $ | 498,497 |
| | $ | 1,871,373 |
| | $ | 1,946,964 |
| | $ | 1,858,987 |
|
| | | | | | | | | | | |
Operating expense | $ | 473,893 |
| | $ | 482,045 |
| | $ | 516,158 |
| | $ | 1,866,268 |
| | $ | 1,947,107 |
| | $ | 2,042,938 |
|
Adjusted for: Fuel surcharge revenue | (48,575 | ) | | (53,945 | ) | | (103,044 | ) | | (176,676 | ) | | (257,150 | ) | | (442,023 | ) |
Adjusted operating expense | $ | 425,318 |
| | $ | 428,100 |
| | $ | 413,114 |
| | $ | 1,689,592 |
| | $ | 1,689,957 |
| | $ | 1,600,915 |
|
Operating Ratio | 90.9 | % | | 86.5 | % | | 85.8 | % | | 91.1 | % | | 88.3 | % | | 88.8 | % |
Adjusted Operating Ratio | 90.0 | % | | 85.1 | % | | 82.9 | % | | 90.3 | % | | 86.8 | % | | 86.1 | % |
| | | | | | | | | | | |
Dedicated: | | | | | | | | | | | |
Operating revenue | $ | 257,323 |
| | $ | 241,152 |
| | $ | 237,302 |
| | $ | 971,246 |
| | $ | 927,657 |
| | $ | 892,078 |
|
Less: Fuel surcharge revenue | (16,287 | ) | | (15,191 | ) | | (34,764 | ) | | (51,308 | ) | | (79,360 | ) | | (151,399 | ) |
Revenue xFSR | $ | 241,036 |
| | $ | 225,961 |
| | $ | 202,538 |
| | $ | 919,938 |
| | $ | 848,297 |
| | $ | 740,679 |
|
| | | | | | | | | | | |
Operating expense | $ | 231,482 |
| | $ | 213,302 |
| | $ | 217,842 |
| | $ | 862,765 |
| | $ | 844,922 |
| | $ | 816,284 |
|
Adjusted for: Fuel surcharge revenue | (16,287 | ) | | (15,191 | ) | | (34,764 | ) | | (51,308 | ) | | (79,360 | ) | | (151,399 | ) |
Adjusted operating expense | $ | 215,195 |
| | $ | 198,111 |
| | $ | 183,078 |
| | $ | 811,457 |
| | $ | 765,562 |
| | $ | 664,885 |
|
Operating Ratio | 90.0 | % | | 88.5 | % | | 91.8 | % | | 88.8 | % | | 91.1 | % | | 91.5 | % |
Adjusted Operating Ratio | 89.3 | % | | 87.7 | % | | 90.4 | % | | 88.2 | % | | 90.2 | % | | 89.8 | % |
| | | | | | | | | | | |
Swift Refrigerated: | | | | | | | | | | | |
Operating revenue | $ | 84,506 |
| | $ | 93,950 |
| | $ | 103,858 |
| | $ | 341,280 |
| | $ | 380,251 |
| | $ | 417,980 |
|
Less: Fuel surcharge revenue | (10,659 | ) | | (11,278 | ) | | (19,670 | ) | | (38,032 | ) | | (52,211 | ) | | (83,660 | ) |
Revenue xFSR | $ | 73,847 |
| | $ | 82,672 |
| | $ | 84,188 |
| | $ | 303,248 |
| | $ | 328,040 |
| | $ | 334,320 |
|
| | | | | | | | | | | |
Operating expense | $ | 81,572 |
| | $ | 90,408 |
| | $ | 99,143 |
| | $ | 354,124 |
| | $ | 363,171 |
| | $ | 403,945 |
|
Adjusted for: Fuel surcharge revenue | (10,659 | ) | | (11,278 | ) | | (19,670 | ) | | (38,032 | ) | | (52,211 | ) | | (83,660 | ) |
Adjusted operating expense | $ | 70,913 |
| | $ | 79,130 |
| | $ | 79,473 |
| | $ | 316,092 |
| | $ | 310,960 |
| | $ | 320,285 |
|
Operating Ratio | 96.5 | % | | 96.2 | % | | 95.5 | % | | 103.8 | % | | 95.5 | % | | 96.6 | % |
Adjusted Operating Ratio | 96.0 | % | | 95.7 | % | | 94.4 | % | | 104.2 | % | | 94.8 | % | | 95.8 | % |
| | | | | | | | | | | |
Intermodal: | | | | | | | | | | | |
Operating revenue | $ | 95,283 |
| | $ | 100,745 |
| | $ | 109,391 |
| | $ | 360,157 |
| | $ | 390,572 |
| | $ | 401,577 |
|
Less: Fuel surcharge revenue | (10,166 | ) | | (10,784 | ) | | (19,646 | ) | | (34,457 | ) | | (50,441 | ) | | (77,947 | ) |
Revenue xFSR | $ | 85,117 |
| | $ | 89,961 |
| | $ | 89,745 |
| | $ | 325,700 |
| | $ | 340,131 |
| | $ | 323,630 |
|
| | | | | | | | | | | |
Operating expense | $ | 94,183 |
| | $ | 97,698 |
| | $ | 101,606 |
| | $ | 360,704 |
| | $ | 386,444 |
| | $ | 393,279 |
|
Adjusted for: | | | | | | | | | | | |
Fuel surcharge revenue | (10,166 | ) | | (10,784 | ) | | (19,646 | ) | | (34,457 | ) | | (50,441 | ) | | (77,947 | ) |
Non-cash impairments | (37 | ) | | — |
| | — |
| | (37 | ) | | — |
| | — |
|
Adjusted operating expense | $ | 83,980 |
| | $ | 86,914 |
| | $ | 81,960 |
| | $ | 326,210 |
| | $ | 336,003 |
| | $ | 315,332 |
|
Operating Ratio | 98.8 | % | | 97.0 | % | | 92.9 | % | | 100.2 | % | | 98.9 | % | | 97.9 | % |
Adjusted Operating Ratio | 98.7 | % | | 96.6 | % | | 91.3 | % | | 100.2 | % | | 98.8 | % | | 97.4 | % |
CONSOLIDATED EQUIPMENT (UNAUDITED)
AS OF DECEMBER 31, 2016, 2015, AND 2014
AND
AVERAGE OPERATIONAL TRUCK COUNT (UNAUDITED)
THREE MONTHS AND YEARS ENDED DECEMBER 31, 2016, 2015, AND 2014
|
| | | | | | | | |
| December 31, |
| 2016 | | 2015 | | 2014 |
Tractors | | | | | |
Company: | | | | | |
Owned | 6,735 |
| | 7,442 |
| | 6,083 |
|
Leased – capital leases | 1,968 |
| | 2,170 |
| | 1,700 |
|
Leased – operating leases | 5,234 |
| | 5,599 |
| | 6,099 |
|
Total company tractors | 13,937 |
| | 15,211 |
| | 13,882 |
|
Owner-operator: | | | | | |
Financed through the Company | 3,272 |
| | 3,767 |
| | 4,204 |
|
Other | 1,157 |
| | 886 |
| | 750 |
|
Total owner-operator tractors | 4,429 |
| | 4,653 |
| | 4,954 |
|
Total tractors | 18,366 |
| | 19,864 |
| | 18,836 |
|
Trailers | 64,066 |
| | 65,233 |
| | 61,652 |
|
Containers | 9,131 |
| | 9,150 |
| | 9,150 |
|
|
| | | | | | | | | | | | | | | | | |
| Three Months Ended December 31, | | Year Ended December 31, |
| 2016 | | 2015 | | 2014 | | 2016 | | 2015 | | 2014 |
Average operational truck count (1) : | | | | | | | | | | | |
Company | 12,838 |
| | 13,514 |
| | 12,678 |
| | 13,096 |
| | 13,316 |
| | 12,146 |
|
Owner-operator | 4,432 |
| | 4,502 |
| | 4,848 |
| | 4,452 |
| | 4,599 |
| | 5,044 |
|
Total | 17,270 |
| | 18,016 |
| | 17,526 |
| | 17,548 |
| | 17,915 |
| | 17,190 |
|
| |
(1) | Includes trucks within our non-reportable segments. |
CONDENSED CONSOLIDATED BALANCE SHEETS (UNAUDITED)
AS OF DECEMBER 31, 2016 AND 2015
|
| | | | | | | |
| December 31, |
| 2016 | | 2015 |
ASSETS | (In thousands) |
Current assets: | | | |
Cash and cash equivalents | $ | 89,391 |
| | $ | 107,590 |
|
Cash and cash equivalents — restricted | 57,046 |
| | 55,241 |
|
Restricted investments, held to maturity, amortized cost | 22,717 |
| | 23,215 |
|
Accounts receivable, net | 408,593 |
| | 422,421 |
|
Income tax refund receivable | 206 |
| | 11,664 |
|
Inventories and supplies | 16,630 |
| | 18,426 |
|
Assets held for sale | 6,969 |
| | 9,084 |
|
Prepaid taxes, licenses, insurance, and other | 47,038 |
| | 48,149 |
|
Current portion of notes receivable | 6,961 |
| | 9,817 |
|
Total current assets | 655,551 |
| | 705,607 |
|
Property and equipment, at cost: | | | |
Revenue and service equipment | 2,266,137 |
| | 2,278,618 |
|
Land | 132,084 |
| | 131,693 |
|
Facilities and improvements | 281,390 |
| | 269,769 |
|
Furniture and office equipment | 113,880 |
| | 99,519 |
|
Total property and equipment | 2,793,491 |
| | 2,779,599 |
|
Less: accumulated depreciation and amortization | (1,244,890 | ) | | (1,128,499 | ) |
Net property and equipment | 1,548,601 |
| | 1,651,100 |
|
Other assets (2) | 21,953 |
| | 26,585 |
|
Intangible assets, net | 266,305 |
| | 283,119 |
|
Goodwill | 253,256 |
| | 253,256 |
|
Total assets | $ | 2,745,666 |
| | $ | 2,919,667 |
|
LIABILITIES AND STOCKHOLDERS’ EQUITY | | | |
Current liabilities: | | | |
Accounts payable | $ | 115,063 |
| | $ | 121,827 |
|
Accrued liabilities | 132,712 |
| | 97,313 |
|
Current portion of claims accruals | 80,866 |
| | 84,429 |
|
Current portion of long-term debt (1)(2) | 8,459 |
| | 35,514 |
|
Current portion of capital lease obligations | 72,473 |
| | 59,794 |
|
Total current liabilities | 409,573 |
| | 398,877 |
|
Revolving line of credit | 130,000 |
| | 200,000 |
|
Long-term debt, less current portion (1)(2) | 493,346 |
| | 643,663 |
|
Capital lease obligations, less current portion | 161,463 |
| | 222,001 |
|
Claims accruals, less current portion | 165,726 |
| | 149,281 |
|
Deferred income taxes | 427,722 |
| | 463,832 |
|
Accounts receivable securitization (2) | 279,285 |
| | 223,927 |
|
Other liabilities | 6,296 |
| | 959 |
|
Total liabilities | 2,073,411 |
| | 2,302,540 |
|
Stockholders’ equity: | | | |
Preferred stock | — |
| | — |
|
Class A common stock | 833 |
| | 878 |
|
Class B common stock | 497 |
| | 510 |
|
Additional paid-in capital (3) | 701,065 |
| | 754,589 |
|
Accumulated deficit (3) | (30,242 | ) | | (139,033 | ) |
Accumulated other comprehensive income | — |
| | 81 |
|
Noncontrolling interest | 102 |
| | 102 |
|
Total stockholders’ equity | 672,255 |
| | 617,127 |
|
Total liabilities and stockholders’ equity | $ | 2,745,666 |
| | $ | 2,919,667 |
|
CONDENSED CONSOLIDATED BALANCE SHEETS (UNAUDITED) — CONTINUED
AS OF DECEMBER 31, 2016 AND 2015
Notes to Condensed Consolidated Balance Sheets:
| |
(1) | As of December 31, 2016, the Company's long-term debt had a carrying value of $501.8 million, comprised of: |
| |
• | $492.9 million: Term Loan A, due July 2020, net of $1.3 million deferred loan costs |
As of December 31, 2015, the Company's long-term debt had a carrying value of $679.2 million, comprised of:
| |
• | $668.1 million: Term Loan A, due July 2020, net of $1.7 million deferred loan costs |
•$11.1 million: Other
| |
(2) | In 2016, the Company adopted Accounting Standards Update 2015-03, Simplifying the Presentation of Debt Issuance Costs, which was issued by the Financial Accounting Standards Board in April 2015. Accordingly, debt issuance costs associated with the Company’s Term Loan A and accounts receivable securitization are now presented within liabilities as direct deductions from the face amount of the related debt, rather than within other assets as deferred charges. The Company retrospectively adjusted the December 31, 2015 consolidated balance sheet to align with the current period presentation by reclassifying $1.6 million, $0.1 million and $1.1 million of debt issuance costs out of "Other assets" and into "Long-term debt, less current portion," "Current portion of long-term debt" and "Accounts receivable securitization," respectively. |
| |
(3) | The line items "Additional paid-in capital" and "Accumulated deficit" include allocation of purchase price related to the Company's repurchase and cancellation of its Class A common stock, as follows: |
| |
• | During the year ended December 31, 2016, the Company repurchased and canceled 7.4 million shares of its Class A common stock for $117.1 million. The excess of the repurchase price over par value was allocated $76.6 million to "Additional paid-in capital" and $40.5 million to "Accumulated deficit." |
| |
• | During the three months ended December 31, 2015, the Company repurchased and canceled 4.2 million shares of its Class A common stock for $70.0 million. The excess of the repurchase price over par value was allocated $43.4 million to "Additional paid-in capital" and $26.6 million to "Accumulated deficit." |
CONSOLIDATED STATEMENTS OF CASH FLOWS (UNAUDITED)
YEARS ENDED DECEMBER 31, 2016 AND 2015
|
| | | | | | | |
| Year Ended December 31, |
| 2016 | | 2015 |
| (In thousands) |
Cash flows from operating activities: | | | |
Net income | $ | 149,267 |
| | $ | 197,577 |
|
Adjustments to reconcile net income to net cash provided by operating activities: | | | |
Depreciation and amortization of property, equipment, and intangibles | 283,948 |
| | 268,549 |
|
Amortization of debt issuance costs, original issue discount, and other | 1,333 |
| | 5,937 |
|
Gain on disposal of property and equipment, less write-off of totaled tractors | (15,854 | ) | | (30,195 | ) |
Impairments | 807 |
| | 1,480 |
|
Deferred income taxes | (36,079 | ) | | 26,476 |
|
Provision for (reduction of) losses on accounts receivable | (1,147 | ) | | 8,004 |
|
Non-cash loss on debt extinguishment and write-offs of deferred financing costs and original issue discount | — |
| | 9,567 |
|
Stock-based compensation expense | 6,017 |
| | 6,525 |
|
Excess tax benefit from stock-based compensation | (2,575 | ) | | (2,147 | ) |
Income effect of mark-to-market adjustment of interest rate swaps | — |
| | 87 |
|
Increase in cash resulting from changes in: | | | |
Accounts receivable | 14,975 |
| | 48,574 |
|
Inventories and supplies | 1,796 |
| | 566 |
|
Prepaid expenses and other current assets | 20,999 |
| | 17,741 |
|
Other assets | 1,171 |
| | 7,785 |
|
Accounts payable, and accrued and other liabilities | 41,654 |
| | 2,972 |
|
Net cash provided by operating activities | 466,312 |
| | 569,498 |
|
Cash flows from investing activities: | | | |
Increase in cash and cash equivalents — restricted | (1,805 | ) | | (9,620 | ) |
Proceeds from maturities of investments | 30,269 |
| | 33,015 |
|
Purchases of investments | (30,061 | ) | | (31,930 | ) |
Proceeds from sale of property and equipment | 113,410 |
| | 116,330 |
|
Capital expenditures | (239,446 | ) | | (342,615 | ) |
Payments received on notes receivable | 10,114 |
| | 4,252 |
|
Expenditures on assets held for sale | (31,027 | ) | | (25,937 | ) |
Payments received on assets held for sale | 25,939 |
| | 14,410 |
|
Payments received on equipment sale receivables | — |
| | 288 |
|
Net cash used in investing activities | (122,607 | ) | | (241,807 | ) |
Cash flows from financing activities: | | | |
Repayment of long-term debt and capital leases | (246,829 | ) | | (979,816 | ) |
Proceeds from long-term debt | — |
| | 684,504 |
|
Net (repayments) borrowings on revolving line of credit | (70,000 | ) | | 143,000 |
|
Borrowings under accounts receivable securitization | 105,000 |
| | 75,000 |
|
Repayment of accounts receivable securitization | (50,000 | ) | | (184,000 | ) |
Payment of deferred loan costs | — |
| | (4,235 | ) |
Proceeds from common stock issued | 14,469 |
| | 8,167 |
|
Repurchases of Class A common stock (1) | (117,119 | ) | | (70,000 | ) |
Excess tax benefit from stock-based compensation | 2,575 |
| | 2,147 |
|
Net cash used in financing activities | (361,904 | ) | | (325,233 | ) |
Net (decrease) increase in cash and cash equivalents | (18,199 | ) | | 2,458 |
|
Cash and cash equivalents at beginning of period | 107,590 |
| | 105,132 |
|
Cash and cash equivalents at end of period | $ | 89,391 |
| | $ | 107,590 |
|
Notes to Consolidated Statements of Cash Flows:
| |
(1) | Refer to Note (3) to the Condensed Consolidated Balance Sheets. |
CONSOLIDATED STATEMENTS OF CASH FLOWS (UNAUDITED) — CONTINUED
YEARS ENDED DECEMBER 31, 2016 AND 2015
|
| | | | | | | |
| Year Ended December 31, |
| 2016 | | 2015 |
| (In thousands) |
Supplemental disclosures of cash flow information: | | | |
Cash paid during the period for: | | | |
Interest | $ | 29,150 |
| | $ | 45,390 |
|
Income taxes | 79,250 |
| | 78,522 |
|
Non-cash investing activities: | | | |
Equipment purchase accrual | $ | 11,103 |
| | $ | 447 |
|
Notes receivable from sale of assets | 4,158 |
| | 7,670 |
|
Non-cash financing activities: | | | |
Capital lease additions | $ | 12,811 |
| | $ | 145,338 |
|
Accrued deferred loan costs | — |
| | 105 |
|
Insurance premium notes payable | 8,430 |
| | 7,658 |
|