Exhibit99 6.30.2015
|
| | |
| | |
| P.O. Box 29243 - Phoenix, Arizona 85038-9243 |
| 2200 S. 75th Avenue - Phoenix, Arizona 85043 |
| (602) 269-9700 |
| |
July 27, 2015
Dear Fellow Stockholders of Swift Transportation Company (NYSE: SWFT),
A summary of our key results for the three and six months ended June 30th is shown below:
|
| | | | | | | | | | | | | | | | | | | | | | | |
| Three Months Ended June 30, | | Six Months Ended June 30, |
| 2015 | | 2014 | | 2013 | | 2015 | | 2014 | | 2013 |
| Unaudited |
| ($ in millions, except per share data) |
Operating Revenue | $ | 1,059.4 |
| | $ | 1,075.9 |
| | $ | 1,029.1 |
| | $ | 2,074.5 |
| | $ | 2,084.3 |
| | $ | 2,010.7 |
|
Revenue xFSR(1) | $ | 935.9 |
| | $ | 876.3 |
| | $ | 830.1 |
| | $ | 1,830.8 |
| | $ | 1,693.3 |
| | $ | 1,614.7 |
|
| | | | | | | | | | | |
Operating Ratio | 90.7 | % | | 91.3 | % | | 90.3 | % | | 91.6 | % | | 93.3 | % | | 91.5 | % |
Adjusted Operating Ratio(2) | 89.1 | % | | 88.8 | % | | 87.5 | % | | 90.1 | % | | 91.3 | % | | 89.0 | % |
| | | | | | | | | | | |
EBITDA(2) | $ | 158.1 |
| | $ | 146.7 |
| | $ | 162.7 |
| | $ | 293.3 |
| | $ | 251.2 |
| | $ | 293.1 |
|
Adjusted EBITDA(2) | $ | 159.5 |
| | $ | 155.0 |
| | $ | 163.6 |
| | $ | 297.7 |
| | $ | 263.5 |
| | $ | 299.6 |
|
| | | | | | | | | | | |
Diluted EPS | $ | 0.35 |
| | $ | 0.28 |
| | $ | 0.35 |
| | $ | 0.62 |
| | $ | 0.37 |
| | $ | 0.57 |
|
Adjusted EPS(2) | $ | 0.37 |
| | $ | 0.33 |
| | $ | 0.35 |
| | $ | 0.65 |
| | $ | 0.44 |
| | $ | 0.59 |
|
| | | | | | | | | | | |
1Revenue xFSR is operating revenue, excluding fuel surcharge revenue |
2 See GAAP to Non-GAAP reconciliation in the schedules following this letter |
Key Highlights for the Second Quarter 2015 as compared to the Second Quarter 2014:
(discussed in more detail below, including GAAP to non-GAAP reconciliations)
Consolidated
| |
• | Adjusted EPS increased 12.1% to $0.37 and was negatively impacted by $0.03 after-tax for a legal settlement relating to a non-operational contractual dispute |
| |
• | Consolidated Revenue xFSR increased 6.8% |
| |
• | Consolidated Average Operational Truck Count increased 816 trucks, or 4.8%, year over year in the second quarter, 308 of which were added in 2015 |
| |
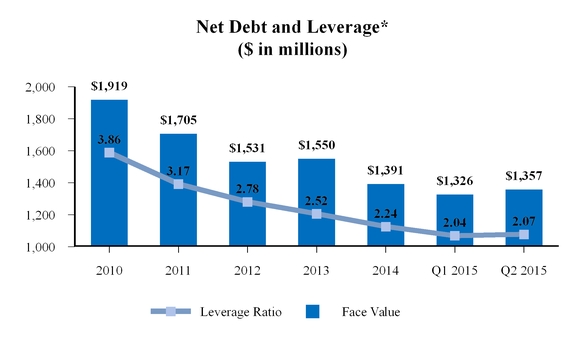
• | Net Debt and Net Leverage Ratio increased slightly as anticipated to $1,356.8 million and 2.07, respectively, as of June 30, 2015, due to increased capital expenditures |
| |
• | New amended and restated credit agreement was completed effective July 27, 2015, which is expected to result in an estimated $7 million reduction in annual interest expense going forward (based on current borrowing levels) |
Truckload
| |
• | As anticipated, the Adjusted Operating Ratio in our Truckload segment increased 120 basis points to 86.0%, primarily driven by the compounding impact of both sets of targeted wage increases for drivers and pay increases for owner-operators. The two pay increases were implemented on August 1, 2014 and May 1, 2015. |
| |
• | Truckload pricing increases continued to gain momentum, resulting in a 4.9% increase in Revenue xFSR per loaded mile |
| |
• | Driver retention and overall satisfaction with Swift continue to trend favorably, as evidenced by a 15% improvement in our operations turnover metric |
Dedicated
| |
• | Dedicated Revenue xFSR grew 15.1% driven by the addition of multiple new customer contracts over the last 12 months |
| |
• | Weekly Revenue xFSR per Tractor improved 4.8% year over year |
| |
• | Adjusted Operating Ratio improved 360 bps sequentially to 89.1% |
Central Refrigerated Services ("CRS")
| |
• | CRS Adjusted Operating Ratio improved 300 basis points year over year to 92.7%, in spite of the two large driver and owner-operator wage and pay increases previously mentioned |
| |
• | Adjusted Operating Ratio and Operating Income reached strongest levels since acquisition in August 2013 |
| |
• | Process initiated to change name to Swift Refrigerated |
Intermodal
| |
• | Intermodal Revenue xFSR grew 5.0% on Container on Flat Car growth of 14.6%, partially offset by a continued reduction in Trailer on Flat Car loads |
| |
• | Adjusted Operating Ratio improved 250 basis points to 98.1% due to improved container utilization, dray efficiencies, and safety trends |
We are encouraged with the operational performance generated by our team in the second quarter of 2015, and look forward to building on this momentum in coming quarters. We delivered year over year growth in Operating Income in our Dedicated, CRS, and Intermodal segments. Our CRS segment reported record post-acquisition Adjusted Operating Ratio and Operating Income levels. Our Dedicated segment produced a sub-ninety Adjusted Operating Ratio driven by improved pricing, asset utilization, and reduced deadhead percentage. Our Intermodal segment continues to show progress, fueled by improved container turns and improved dray efficiency. As expected, Truckload's profitability was temporarily impacted by the two previously disclosed targeted wage increases for drivers and corresponding pay increases for owner-operators, which went into effect on August 1, 2014 and May 1, 2015, respectively. These increases were designed to yield improvements in driver retention and recruiting, and while the driver market continues to be challenging, we are already seeing the positive impact of the investment we have made in our drivers and owner-operators. We anticipate Truckload's profitability to rebound in the coming quarters, as driver retention, recruiting, and pricing trends continue their favorable progress. Our Consolidated Average Operational Truck Count increased 816 trucks year over year, bringing our year to date Average Operational Truck growth to 308. We remain focused on our 2015 target of enterprise-wide fleet growth of 700-1,100 tractors from the beginning to the end of 2015.
The accumulation of these various positive trends and hard work by all of our Swift team members, enabled us to overcome a recently settled legal claim of $6.0 million pre-tax, relating to a non-operational contractual dispute, while still producing a year over year increase in Consolidated Adjusted EPS of 12.1% in the second quarter, and 47.7% year over year Adjusted EPS improvement in the first half of the year. We remain comfortable in affirming our previously provided Adjusted EPS range for 2015 of $1.64 - $1.74.
Second Quarter Results by Reportable Segment
Truckload Segment
Our Truckload segment consists of one-way movements over irregular routes throughout the United States, Mexico and Canada. This service uses both company and owner-operator tractors with dry van, flatbed and other specialized trailing equipment.
|
| | | | | | | | | | | |
| Three Months Ended June 30, |
| 2015 | | 2014 | | 2013 |
| Unaudited |
Operating Revenue (1) | $ | 555.7 |
| | $ | 575.5 |
| | $ | 588.7 |
|
Revenue xFSR(1)(2)(3) | $ | 485.4 |
| | $ | 459.1 |
| | $ | 468.6 |
|
| | | | | |
Operating Ratio | 87.8 | % | | 87.9 | % | | 89.0 | % |
Adjusted Operating Ratio(3) | 86.0 | % | | 84.8 | % | | 86.2 | % |
| | | | | |
Weekly Revenue xFSR per Tractor | $ | 3,571 |
| | $ | 3,453 |
| | $ | 3,270 |
|
Total Loaded Miles(4) | 261,609 |
| | 259,583 |
| | 274,830 |
|
| | | | | |
Average Operational Truck Count | 10,456 |
| | 10,228 |
| | 11,021 |
|
Deadhead Percentage | 11.8 | % | | 11.7 | % | | 11.4 | % |
| | | | | |
1 In millions |
2 Revenue xFSR is operating revenue, excluding fuel surcharge revenue |
3 See GAAP to Non-GAAP reconciliation in the schedules following this letter |
4 Total Loaded Miles presented in thousands |
Our Truckload Revenue xFSR for the second quarter of 2015 increased $26.4 million, or 5.7%, over the same quarter in 2014. This revenue growth was the result of a 4.9% year over year increase in Revenue xFSR per loaded mile and a 0.8% increase in total loaded miles driven within the period. Weekly Revenue xFSR per Tractor increased 3.4% year over year to $3,571 driven by the robust 4.9% increase in Revenue xFSR per loaded mile mentioned above, partially offset by a 1.5% decrease in loaded miles per tractor per week. Loaded miles per tractor per week in the second quarter of 2014 reflected unseasonably strong pent up demand caused by severe weather in first quarter 2014. Our second quarter utilization was also pressured by the disruption associated with trading and in-servicing 65% more tractors year over year. This was the result of our accelerated fleet turnover plan and the manufacturer delays, as reported in our first quarter letter to stockholders. Our Average Operational Truck Count increased 228 trucks in the second quarter of 2015 when compared to the second quarter of 2014.
Our Adjusted Operating Ratio increased 120 basis points to 86.0% compared to 84.8% from the prior year. As we announced last quarter, we implemented a second material, targeted wage increase for drivers and pay increase for owner-operators on May 1, 2015. We consider our driving service professionals as our most important assets and remain fully committed to making these types of investments to improve driver retention and recruiting. As such, this most recent increase represents the second material increase implemented within the past 12 months. As expected, these initiatives had a short-term negative impact on the Truckload operating ratio in the second quarter, given the immediate nature of driver increases versus the more gradual nature of customer rate increases. The increase in
Adjusted Operating Ratio was primarily driven by the wage and pay increases, partially offset by an increase in pricing and a reduction in fuel expense reflecting a combination of declining diesel prices and better fuel efficiency.
Dedicated Segment
Through our Dedicated segment, we devote equipment and offer tailored solutions under long-term contracts with customers. This dedicated business utilizes refrigerated, dry van, flatbed and other specialized trailing equipment.
|
| | | | | | | | | | | |
| Three Months Ended June 30, |
| 2015 | | 2014 | | 2013 |
| Unaudited |
Operating Revenue (1) | $ | 234.2 |
| | $ | 223.1 |
| | $ | 182.7 |
|
Revenue xFSR(1)(2)(3) | $ | 211.0 |
| | $ | 183.3 |
| | $ | 148.7 |
|
| | | | | |
Operating Ratio | 90.2 | % | | 90.5 | % | | 86.7 | % |
Adjusted Operating Ratio(3) | 89.1 | % | | 88.5 | % | | 83.7 | % |
| | | | | |
Weekly Revenue xFSR per Tractor | $ | 3,343 |
| | $ | 3,191 |
| | $ | 3,396 |
|
Average Operational Truck Count | 4,854 |
| | 4,420 |
| | 3,367 |
|
| | | | | |
1 In millions |
2 Revenue xFSR is operating revenue, excluding fuel surcharge revenue |
3 See GAAP to Non-GAAP reconciliation in the schedules following this letter |
Dedicated Revenue xFSR grew 15.1% to $211.0 million in the second quarter of 2015 compared to the second quarter of 2014. This growth was driven by the various new contracts awarded over the last twelve months, which also drove the 9.8% increase in our Average Operational Truck Count year over year. Weekly Revenue xFSR per Tractor increased 4.8% to $3,343 due to improved operational fundamentals, including pricing, utilization and deadhead.
For the second quarter of 2015 the Adjusted Operating Ratio in our Dedicated segment increased 60 basis points year over year primarily driven by the anticipated increase in insurance and claims expense, as discussed the last two quarters, in addition to the previously discussed driver wage and owner-operator pay increases in August 2014 and May 2015. These headwinds were largely offset by the improved operational fundamentals mentioned above.
We are pleased with the many operational improvements within the segment, and are encouraged by the 360 basis point sequential improvement in our Adjusted Operating Ratio compared to the first quarter of 2015. Our recently implemented safety initiatives continue to gain momentum, as both accident and worker's compensation frequencies have decreased year over year, although given the nature of actuarial models and insurance allocations, we have not yet experienced favorable reductions in our insurance and claims expenses in the Dedicated segment this year. We remain focused on these safety initiatives, pricing and other operational initiatives to help drive continued operating ratio improvement in the coming quarters.
CRS Segment
Our CRS segment represents shipments for customers that require temperature-controlled trailers. These shipments include one-way movements over irregular routes and dedicated truck operations.
|
| | | | | | | | | | | |
| Three Months Ended June 30, |
| 2015 | | 2014 | | 2013 |
| Unaudited |
Operating Revenue (1) | $ | 97.7 |
| | $ | 106.9 |
| | $ | 111.2 |
|
Revenue xFSR(1)(2)(3) | $ | 83.3 |
| | $ | 86.0 |
| | $ | 87.1 |
|
| | | | | |
Operating Ratio | 93.7 | % | | 96.6 | % | | 94.9 | % |
Adjusted Operating Ratio(3) | 92.7 | % | | 95.7 | % | | 93.5 | % |
| | | | | |
Weekly Revenue xFSR per Tractor | $ | 3,418 |
| | $ | 3,543 |
| | $ | 3,367 |
|
Average Operational Truck Count | 1,874 |
| | 1,867 |
| | 1,990 |
|
Deadhead Percentage | 13.9 | % | | 15.1 | % | | 12.4 | % |
| | | | | |
1 In millions |
2 Revenue xFSR is operating revenue, excluding fuel surcharge revenue |
3 See GAAP to Non-GAAP reconciliation in the schedules following this letter |
Revenue xFSR for the second quarter of 2015 decreased 3.1% to $83.3 million compared to $86.0 million for the same quarter in 2014, primarily driven by a 3.7% reduction in Revenue xFSR per loaded mile, partially offset by a 0.6% increase in total loaded miles driven within the period. As previously disclosed, we discontinued servicing a large CRS specialty dedicated account on January 31, 2015. This dedicated account, which had a much lower average length of haul, higher deadhead, and a much higher Revenue xFSR per loaded mile, was not profitable, and artificially skewed some of our operating metrics.
We are pleased with the continued profitability improvements produced within the CRS segment. The Adjusted Operating Ratio improved 300 basis points to 92.7% in the second quarter of 2015 from 95.7% in the second quarter of 2014. This is the best quarterly result since our acquisition of Central Refrigerated Transportation in August 2013. This improvement was driven by the elimination of the unprofitable specialty dedicated account, lower fuel prices, and other operational improvements, partially offset by increased driver wage and owner-operator pay and increased insurance and claims expense.
We are proud of the progress our CRS team is making and its ability to deliver on our goal of year over year profitability improvements each quarter in 2015. The leadership team is aligned and as a final step in the integration, we are in the process of changing the name of this business to Swift Refrigerated.
Intermodal Segment
Our Intermodal segment includes revenue generated by freight moving over the rail in our containers and other trailing equipment, combined with revenue for drayage to transport loads between the railheads and customer locations.
Intermodal Revenue xFSR grew by 5.0% in the second quarter of 2015 compared to the second quarter of 2014, driven by a 7.2% increase in Load Counts. Container on Flat Car (COFC) loads increased 14.6%, while Trailer on Flat Car (TOFC) loads decreased 65.4% primarily due to the elimination of the refrigerated TOFC business as discussed in 2014. Revenue xFSR per load decreased 2.0% in the second quarter of 2015 from the same period of 2014, primarily due to the mix shift to COFC from TOFC.
|
| | | | | | | | | | | |
| Three Months Ended June 30, |
| 2015 | | 2014 | | 2013 |
| Unaudited |
Operating Revenue (1) | $ | 98.5 |
| | $ | 100.9 |
| | $ | 91.0 |
|
Revenue xFSR(1)(2)(3) | $ | 84.8 |
| | $ | 80.8 |
| | $ | 72.2 |
|
| | | | | |
Operating Ratio | 98.4 | % | | 100.5 | % | | 99.1 | % |
Adjusted Operating Ratio(3) | 98.1 | % | | 100.6 | % | | 98.9 | % |
| | | | | |
Load Counts | 46,517 | | 43,404 | | 39,124 |
Average Container Counts | 9,150 | | 8,717 | | 8,717 |
| | | | | |
1 In millions |
2 Revenue xFSR is operating revenue, excluding fuel surcharge revenue |
3 See GAAP to Non-GAAP reconciliation in the schedules following this letter |
Intermodal Adjusted Operating Ratio improved 250 basis points to 98.1% in the second quarter of 2015 compared to 100.6% during the same period last year. This improvement was driven by an 9.1% increase in container turns, improvements in dray efficiencies and improved safety trends.
Other Non-Reportable Segments
Our other non-reportable segments include our logistics and brokerage services, and our subsidiaries offering support services to customers and owner-operators, including shop maintenance, equipment leasing and insurance. Also captured here is the intangible asset amortization related to the 2007 going-private transaction.
In the second quarter of 2015, combined revenues from the aforementioned services, before eliminations, increased $10.4 million compared to the same period of 2014 primarily due to 39.5% growth in our logistics business.
Second Quarter Consolidated Operating Expenses
The table below highlights some of our cost categories for the second quarter of 2015, compared to the second quarter of 2014 and the first quarter of 2015, showing each as a percent of Revenue xFSR. Fuel surcharge revenue can be volatile and is primarily dependent upon the cost of fuel and not specifically related to our non-fuel operational expenses. Therefore, we believe that Revenue xFSR is a better measure for analyzing our expenses and operating metrics.
Salaries, wages and benefits increased $38.2 million to $276.3 million during the second quarter of 2015, compared to $238.1 million for the second quarter of 2014 due primarily to increases in total miles driven by company drivers within the period and the two targeted driver pay rate increases in August 2014 and May 2015. Sequentially, salaries, wages and benefits increased $14.6 million during the second quarter of 2015 compared to the first quarter of 2015, but remained relatively consistent as a percentage of Revenue xFSR. The sequential increase is driven by growth in the number of miles driven by company drivers and the driver pay rate increases mentioned above.
Second quarter 2015 operating supplies and expenses increased $7.0 million year over year, but remained relatively consistent as a percentage of Revenue xFSR. The year over year increase was primarily driven by an increase in
equipment maintenance expense, specifically trailer maintenance and tire expense. Sequentially, operating supplies and expenses as a percentage of Revenue xFSR improved 80 basis points from the first quarter of 2015.
|
| | | | | | | | | | | | | | | | | | | | |
| | | | YOY | | | | | | QOQ |
Q2'15 | | Q2'14 | | Variance1 | ($ in millions) | Q2'15 | | Q1'15 | | Variance1 |
Unaudited | | Unaudited |
$ | 1,059.4 |
| | $ | 1,075.9 |
| | -1.5 | % | Operating Revenue | $ | 1,059.4 |
| | $ | 1,015.1 |
| | 4.4 | % |
$ | (123.5 | ) | | $ | (199.6 | ) | | -38.1 | % | Less: Fuel Surcharge Revenue | $ | (123.5 | ) | | $ | (120.3 | ) | | 2.7 | % |
$ | 935.9 |
| | $ | 876.3 |
| | 6.8 | % | Revenue xFSR | $ | 935.9 |
| | $ | 894.8 |
| | 4.6 | % |
| | | | | | | | | | |
$ | 276.3 |
| | $ | 238.1 |
| | -16.0 | % | Salaries, Wages & Benefits | $ | 276.3 |
| | $ | 261.7 |
| | -5.6 | % |
29.5 | % | | 27.2 | % | | -230 bps |
| % of Revenue xFSR | 29.5 | % | | 29.2 | % | | -30 bps |
|
| | | | | | | | | | |
$ | 91.1 |
| | $ | 84.1 |
| | -8.3 | % | Operating Supplies & Expenses | $ | 91.1 |
| | $ | 94.2 |
| | 3.3 | % |
9.7 | % | | 9.6 | % | | -10 bps |
| % of Revenue xFSR | 9.7 | % | | 10.5 | % | | 80 bps |
|
| | | | | | | | | | |
$ | 42.2 |
| | $ | 33.3 |
| | -26.7 | % | Insurance & Claims | $ | 42.2 |
| | $ | 44.3 |
| | 4.7 | % |
4.5 | % | | 3.8 | % | | -70 bps |
| % of Revenue xFSR | 4.5 | % | | 5.0 | % | | 50 bps |
|
| | | | | | | | | | |
$ | 7.4 |
| | $ | 7.7 |
| | 3.9 | % | Communications & Utilities | $ | 7.4 |
| | $ | 7.5 |
| | 1.3 | % |
0.8 | % | | 0.9 | % | | 10 bps |
| % of Revenue xFSR | 0.8 | % | | 0.8 | % | | 0 bps |
|
| | | | | | | | | | |
$ | 18.3 |
| | $ | 17.9 |
| | -2.2 | % | Operating Taxes & Licenses | $ | 18.3 |
| | $ | 17.6 |
| | -4.0 | % |
2.0 | % | | 2.0 | % | | 0 bps |
| % of Revenue xFSR | 2.0 | % | | 2.0 | % | | 0 bps |
|
| | | | | | | | | | |
1 Positive numbers represent favorable variances, negative numbers represent unfavorable variances |
As a percentage of Revenue xFSR, insurance and claims expense increased to 4.5% in the second quarter of 2015 compared to 3.8% in the second quarter of 2014, but improved 50 basis points sequentially compared to the first quarter of 2015. The enhanced safety features of our new equipment, improved driver retention, and other safety initiatives are helping to reduce our current accident frequency and severity trends, but given adverse development on certain prior year claims and the trend-dependent nature of actuarially derived claims accruals, it will take some time for noticeable benefits to be realized.
Fuel Expense
|
| | | | | | | | | | | | | | |
Q2'15 | | Q2'14 | ($ in millions) | Q2'15 | | Q1'15 |
Unaudited | | Unaudited |
$ | 116.7 |
| | $ | 153.7 |
| Fuel Expense | $ | 116.7 |
| | $ | 106.9 |
|
11.0 | % | | 14.3 | % | % of Operating Revenue | 11.0 | % | | 10.5 | % |
Fuel expense for the second quarter of 2015 was $116.7 million, representing a decrease of $37.0 million or 24.1% from the second quarter of 2014. The decrease was a result of lower fuel prices and improved fuel efficiency, partially offset by an increase in the number of miles driven by company drivers. Sequentially, fuel expense increased $9.8 million in the second quarter of 2015 compared to the first quarter of 2015. This sequential increase is primarily
due to an increase in the number of miles driven by company drivers, partially offset by improved fuel efficiency and lower fuel prices.
Purchased Transportation
Purchased transportation includes payments to owner-operators, railroads and other third parties we use for intermodal drayage and other brokered business.
|
| | | | | | | | | | | | | | |
Q2'15 | | Q2'14 | ($ in millions) | Q2'15 | | Q1'15 |
Unaudited | | Unaudited |
$ | 294.7 |
| | $ | 340.2 |
| Purchased Transportation | $ | 294.7 |
| | $ | 288.8 |
|
27.8 | % | | 31.6 | % | % of Operating Revenue | 27.8 | % | | 28.5 | % |
Purchased transportation decreased $45.6 million year over year, primarily due to a reduction in fuel reimbursed to owner-operators and other third parties as a result of declining fuel prices and fewer miles driven by owner-operators. These reductions were partially offset by the targeted owner-operator contracted pay rate increases implemented in August 2014 and May 2015, and growth in our logistics business.
Sequentially, purchased transportation increased $5.9 million primarily due to growth in our intermodal business and the May 2015 owner-operator contracted pay rate increase mentioned above.
Rental Expense and Depreciation & Amortization of Property and Equipment
Due to fluctuations in the number of tractors leased versus owned, we combine our rental expense with depreciation and amortization of property and equipment for analytical purposes.
|
| | | | | | | | | | | | | | |
Q2'15 | | Q2'14 | ($ in millions) | Q2'15 | | Q1'15 |
Unaudited | | Unaudited |
$ | 59.8 |
| | $ | 56.1 |
| Rental Expense | $ | 59.8 |
| | $ | 62.0 |
|
6.4 | % | | 6.4 | % | % of Revenue xFSR | 6.4 | % | | 6.9 | % |
| | | | | | |
$ | 60.4 |
| | $ | 54.8 |
| Depreciation & Amortization of Property and Equipment | $ | 60.4 |
| | $ | 56.9 |
|
6.5 | % | | 6.3 | % | % of Revenue xFSR | 6.5 | % | | 6.4 | % |
| | | | | | |
$ | 120.2 |
| | $ | 110.9 |
| Combined Rental Expense and Depreciation | $ | 120.2 |
| | $ | 118.9 |
|
12.8 | % | | 12.7 | % | % of Revenue xFSR | 12.8 | % | | 13.3 | % |
As noted in the table above, combined rental and depreciation expense in the second quarter of 2015 increased $9.3 million to $120.2 million from the second quarter of 2014. This increase is primarily due to an increase in the number of tractors and trailers in the fleet, higher equipment replacement costs, and an increase in the amount of leased equipment. Sequentially, combined rental and depreciation expense increased $1.3 million from the first quarter of 2015.
Gain on Disposal of Property and Equipment
Gain on disposal of property and equipment in the second quarter of 2015 was $10.2 million, due to a larger volume of disposals in the quarter relative to prior periods, compared to $8.3 million in the second quarter of 2014 and $3.9
million in the first quarter of 2015. We discussed our strategic decision to shorten the tractor trade cycles in order to accelerate our acquisition of beneficial new technology in our first quarter letter to stockholders.
Income Taxes
The income tax provision in accordance with GAAP for the second quarter of 2015 was $31.9 million, resulting in an effective tax rate of 38.5%, which is in line with our expectations. In the second quarter of 2014, our income tax provision was $25.2 million, also resulting in an effective tax rate of 38.5%.
Other Expenses
Interest expense, which includes debt related interest expense, the amortization of deferred financing costs and original issue discount, but excludes derivative interest expense on our interest rate swaps, decreased by $11.3 million in the second quarter of 2015 to $10.1 million, compared with $21.5 million for the second quarter of 2014. The decrease was largely due to our call of our remaining 10.0% Senior Secured 2nd Lien Notes in November 2014, lower debt balances, and our June 2014 amended and restated credit facility that contains more favorable interest rates and terms.
Also included in Other Expenses in the second quarter of 2015 was a $6 million pre-tax charge related to a legal claim relating to a non-operational contractual dispute that was settled during the second quarter and paid in early July 2015.
Debt Balances
|
| | | | | | | | | | | | | |
| | March 31, 2015 | | | Q2 2015 | | June 30, 2015 |
($ in millions) | | | | | Changes | | |
| | Unaudited |
Unrestricted Cash | | $ | 68.7 |
| | | $ | (15.0 | ) | | $ | 53.7 |
|
| | | | | | | |
A/R Securitization ($375 mm) | | $ | 294.0 |
| | | $ | (30.0 | ) | | $ | 264.0 |
|
Revolver ($450mm) | | $ | — |
| | | $ | — |
| | $ | — |
|
Term Loan A | | $ | 494.4 |
| | | $ | (6.4 | ) | | $ | 488.0 |
|
Term Loan B (a) | | $ | 396.0 |
| | | $ | (1.0 | ) | | $ | 395.0 |
|
Capital Leases & Other Debt | | $ | 209.8 |
| | | $ | 53.7 |
| | $ | 263.5 |
|
Total Debt | | $ | 1,394.2 |
| | | $ | 16.3 |
| | $ | 1,410.5 |
|
| | | | | | | |
Net Debt | | $ | 1,325.5 |
| | | $ | 31.3 |
| | $ | 1,356.8 |
|
| | | | | | | |
(a) Amounts presented represent face value |
As shown in the chart below, our leverage ratio as of June 30, 2015 increased slightly to 2.07 compared to 2.04 as of March 31, 2015. As we noted in our first quarter release, this increase was expected and was primarily the result of increased capital expenditures in the second quarter, although the increase was largely offset by year over year Adjusted EBITDA growth. The increase in capital expenditures led to an increase in capital lease liabilities and a reduction in cash, which combined to produce a $31.3 million increase in Net Debt for the second quarter of 2015 compared to March 31, 2015.
* Data prior to Q3 2013 does not include Central Refrigerated
In addition, on July 27, we closed on an amended and restated credit facility in which we replaced our previous $450 million revolving credit facility, and outstanding amounts under the Term Loan A of $488 million and Term Loan B of $395 million, with a new facility that includes a $600 million revolving credit facility and a $680 million Term Loan A. The previous Term Loan B was paid off by using the incremental $192 million of proceeds on the new Term Loan A, a $200 million draw on the revolver, and $3 million of cash on hand. At closing, the pricing of the revolver and Term Loan A are 1.75% over LIBOR, unchanged from the prior facility, and represent a reduction of approximately 180 basis points as compared to the pricing of the Term Loan B for an annualized savings of approximately $7 million. The new revolver and Term Loan A mature in July 2020 and are subject to the same financial covenants and substantially the same terms as those contained in the prior facility.
Cash Flow and Capital Expenditures
We continue to generate positive cash flows from operations. During the six months ending June 30, 2015, we generated $248.2 million of cash from operations compared with $183.5 million during the same period of 2014. Cash used in investing activities was $136.2 million, of which capital expenditures were $166.7 million, partially offset by proceeds from the sale of property and equipment of $46.7 million. For the full year 2015, we are currently expecting our net cash capital expenditures to be in the range of $350 - $375 million. Cash used in financing activities for the six months ending June 30, 2015 was $163.5 million, compared to $123.3 million for the same period in 2014, primarily driven by our voluntary repayments of debt.
Summary
We are pleased with the results our organization has been able to achieve this quarter, and are excited about the continued momentum we are seeing in each of our segments. Although the driver market remains competitive, we are optimistic that the investments we have made over the past several years in our infrastructure, tools and personnel
will enable Swift to be uniquely positioned to attract, train, and retain drivers - in spite of difficult market conditions. We base this optimism on both internal and external feedback we continue to receive.
Recent customer interactions reaffirm to us that capacity availability remains a significant concern in their eyes. As a result, they have shifted freight away from the spot market and towards contract and dedicated service providers. Shippers tell us they are seeking "quality" carriers, with a breadth of service offerings, who can consistently provide safe and reliable drivers, equipment and technology to service their expanding transportation needs. Our customers have indicated to us that they feel we are mutually aligned for continued beneficial growth. We are proud of our customer base, and the strategic partnerships we have developed with them over the past 50 years.
Our team remains focused upon delivering on our previously outlined commitments while also "Delivering a Better LifeSM" to our drivers, customers, and stockholders. We would like to thank all of our hard-working employees and our owner-operators, as well as our loyal customers and stockholders, for their continued support of Swift.
Conference Call Q&A Session
Swift Transportation's management team will host a Q&A session at 11:00 a.m. Eastern Time on Tuesday, July 28th to answer questions about the Company’s second quarter financial results. Please email your questions to Investor_Relations@swifttrans.com prior to 7:00 p.m. Eastern Time on Monday, July 27th.
Participants may access the call using the following dial-in numbers:
U.S./Canada: (877) 897-8479
International/Local: (706) 501-7951
Conference ID: 83626856
The live webcast, letter to stockholders, transcript of the Q&A, and the replay of the earnings Q&A session can be accessed via our investor relations website at investor.swifttrans.com.
IR Contact:
Jason Bates
Vice President of Finance &
Investor Relations Officer
623.907.7335
Forward Looking Statements
This letter contains statements that may constitute forward-looking statements, which are based on information currently available, usually identified by words such as "anticipates," "believes," "estimates", "plans,'' "projects," "expects," "hopes," "intends," "will," "could," "should," "may," or similar expressions which speak only as of the date the statement was made. Such forward-looking statements are made pursuant to the safe harbor provisions of the Private Securities Litigation Reform Act of 1995. Such statements include, but are not limited to, statements concerning:
| |
• | trends and expectations relating to our operations, Revenue xFSR, expenses, other revenue, pricing, profitability and related metrics; |
| |
• | the anticipated benefits of our driver satisfaction and retention initiatives; |
| |
• | projected Adjusted EPS for full year 2015; |
| |
• | the timing and level of fleet size and equipment and container count; |
| |
• | expected trends in insurance claims expense resulting from our safety initiatives; and |
| |
• | estimated capital expenditures for the remainder of 2015. |
Such forward-looking statements are inherently uncertain, and are based upon the current beliefs, assumptions and expectations of Company management and current market conditions, which are subject to significant risks and uncertainties as set forth in the Risk Factors section of our Annual Report on Form 10-K for the year ended December 31, 2014. As to the Company’s business and financial performance, the following factors, among others, could cause actual results to differ materially from those in forward-looking statements:
| |
• | economic conditions, including future recessionary economic cycles and downturns in customers’ business cycles, particularly in market segments and industries in which we have a significant concentration of customers; |
| |
• | increasing competition from trucking, rail, intermodal, and brokerage competitors; |
| |
• | our ability to execute or integrate any future acquisitions successfully; |
| |
• | increases in driver compensation to the extent not offset by increases in freight rates and difficulties in driver recruitment and retention; |
| |
• | our ability to attract and maintain relationships with owner-operators; |
| |
• | our ability to retain or replace key personnel; |
| |
• | our dependence on third parties for intermodal and brokerage business; |
| |
• | potential failure in computer or communications systems; |
| |
• | seasonal factors such as harsh weather conditions that increase operating costs; |
| |
• | the regulatory environment in which we operate, including existing regulations and changes in existing regulations, or violations by us of existing or future regulations; |
| |
• | the possible re-classification of our owner-operators as employees; |
| |
• | changes in rules or legislation by the National Labor Relations Board or Congress and/or union organizing efforts; |
| |
• | our Compliance Safety Accountability safety rating; |
| |
• | government regulations with respect to our captive insurance companies; |
| |
• | uncertainties and risks associated with our operations in Mexico; |
| |
• | a significant reduction in, or termination of, our trucking services by a key customer; |
| |
• | our significant ongoing capital requirements; |
| |
• | the amount and velocity of changes in fuel prices and our ability to recover fuel prices through our fuel surcharge program; |
| |
• | volatility in the price or availability of fuel; |
| |
• | increases in new equipment prices or replacement costs; |
| |
• | our level of indebtedness and our ability to service our outstanding indebtedness, including compliance with our indebtedness covenants, and the impact such indebtedness may have on the way we operate our business; |
| |
• | restrictions contained in our debt agreements; |
| |
• | adverse impacts of insuring risk through our captive insurance companies, including our need to provide restricted cash and similar collateral for anticipated losses; |
| |
• | potential volatility or decrease in the amount of earnings as a result of our claims exposure through our captive insurance companies; |
| |
• | the potential impact of the significant number of shares of our common stock that is outstanding; |
| |
• | our intention to not pay dividends; |
| |
• | conflicts of interest or potential litigation that may arise from other businesses owned by Jerry Moyes, including pledges of Swift stock and guarantees related to other businesses by Jerry Moyes; |
| |
• | the significant amount of our stock and related control over the Company by Jerry Moyes; |
| |
• | related-party transactions between the Company and Jerry Moyes; and |
| |
• | that our acquisition of Central may be challenged by our stockholders. |
You should understand that many important factors, in addition to those listed above and in our filings with the SEC, could impact us financially. As a result of these and other factors, actual results may differ from those set forth in the forward-looking statements and the prices of the Company's securities may fluctuate dramatically. The Company makes no commitment, and disclaims any duty, to update or revise any forward-looking statements to reflect future events, new information or changes in these expectations.
Use of Non-GAAP Measures
In addition to our GAAP results, this Letter to Stockholders also includes certain non-GAAP financial measures, as defined by the SEC. The terms "Adjusted EBITDA," "Adjusted Operating Ratio," and "Adjusted EPS," as we define them, are not presented in accordance with GAAP. These financial measures supplement our GAAP results in evaluating certain aspects of our business. We believe that using these measures improves comparability in analyzing our performance because they remove the impact of items from our operating results that, in our opinion, do not reflect our core operating performance. Management and the board of directors focus on Adjusted EBITDA, Adjusted Operating Ratio and Adjusted EPS as key measures of our performance, all of which are reconciled to the most comparable GAAP financial measures and further discussed below. We believe our presentation of these non-GAAP financial measures is useful because it provides investors and securities analysts the same information that we use internally for purposes of assessing our core operating performance and compliance with debt covenants.
Adjusted EBITDA, Adjusted Operating Ratio and Adjusted EPS are not substitutes for their comparable GAAP financial measures, such as net income, cash flows from operating activities, operating margin, or other measures prescribed by GAAP. There are limitations to using non-GAAP financial measures. Although we believe that they improve comparability in analyzing our period to period performance, they could limit comparability to other companies in our industry if those companies define these measures differently. Because of these limitations, our non-GAAP financial measures should not be considered measures of income generated by our business or discretionary cash available to us to invest in the growth of our business. Management compensates for these limitations by primarily relying on GAAP results and using non-GAAP financial measures on a supplemental basis.
CONSOLIDATED INCOME STATEMENTS (UNAUDITED)
THREE AND SIX MONTHS ENDED JUNE 30, 2015 AND 2014
|
| | | | | | | | | | | | | | | |
| Three Months Ended June 30, | | Six Months Ended June 30, |
| 2015 | | 2014 | | 2015 | | 2014 |
| (in thousands, except per share data) |
Operating revenue: | | | | | | | |
Revenue, excluding fuel surcharge revenue | $ | 935,899 |
| | $ | 876,337 |
| | $ | 1,830,763 |
| | $ | 1,693,336 |
|
Fuel surcharge revenue | 123,505 |
| | 199,561 |
| | 243,785 |
| | 391,008 |
|
Operating revenue | 1,059,404 |
| | 1,075,898 |
| | 2,074,548 |
| | 2,084,344 |
|
Operating expenses: | | | | | | | |
Salaries, wages and employee benefits | 276,326 |
| | 238,093 |
| | 537,980 |
| | 467,459 |
|
Operating supplies and expenses | 91,147 |
| | 84,077 |
| | 185,351 |
| | 164,902 |
|
Fuel | 116,668 |
| | 153,677 |
| | 223,575 |
| | 309,699 |
|
Purchased transportation | 294,677 |
| | 340,249 |
| | 583,488 |
| | 659,418 |
|
Rental expense | 59,846 |
| | 56,135 |
| | 121,821 |
| | 107,854 |
|
Insurance and claims | 42,206 |
| | 33,321 |
| | 86,513 |
| | 75,769 |
|
Depreciation and amortization of property and equipment | 60,415 |
| | 54,791 |
| | 117,342 |
| | 110,966 |
|
Amortization of intangibles | 4,203 |
| | 4,203 |
| | 8,407 |
| | 8,407 |
|
Gain on disposal of property and equipment | (10,230 | ) | | (8,312 | ) | | (14,162 | ) | | (11,471 | ) |
Communication and utilities | 7,399 |
| | 7,716 |
| | 14,898 |
| | 14,886 |
|
Operating taxes and licenses | 18,271 |
| | 17,926 |
| | 35,859 |
| | 36,263 |
|
Total operating expenses | 960,928 |
| | 981,876 |
| | 1,901,072 |
| | 1,944,152 |
|
Operating income | 98,476 |
| | 94,022 |
| | 173,476 |
| | 140,192 |
|
Other expenses (income): | | | | | | | |
Interest expense | 10,109 |
| | 21,453 |
| | 20,497 |
| | 44,678 |
|
Derivative interest expense | 1,111 |
| | 1,618 |
| | 3,904 |
| | 3,271 |
|
Interest income | (591 | ) | | (692 | ) | | (1,178 | ) | | (1,458 | ) |
Loss on debt extinguishment | — |
| | 6,990 |
| | — |
| | 9,903 |
|
Non-cash impairments of non-operating assets | — |
| | — |
| | 1,480 |
| | — |
|
Legal settlement | 6,000 |
| | — |
| | 6,000 |
| | — |
|
Other | (984 | ) | | (710 | ) | | (1,589 | ) | | (1,574 | ) |
Total other expenses (income), net | 15,645 |
| | 28,659 |
| | 29,114 |
| | 54,820 |
|
Income before income taxes | 82,831 |
| | 65,363 |
| | 144,362 |
| | 85,372 |
|
Income tax expense | 31,877 |
| | 25,165 |
| | 55,568 |
| | 32,869 |
|
Net income | $ | 50,954 |
| | $ | 40,198 |
| | $ | 88,794 |
| | $ | 52,503 |
|
Basic earnings per share | $ | 0.36 |
| | $ | 0.28 |
| | $ | 0.62 |
| | $ | 0.37 |
|
Diluted earnings per share | $ | 0.35 |
| | $ | 0.28 |
| | $ | 0.62 |
| | $ | 0.37 |
|
Shares used in per share calculations: | | | | | | | |
Basic | 142,540 |
| | 141,308 |
| | 142,371 |
| | 141,143 |
|
Diluted | 144,212 |
| | 143,393 |
| | 144,182 |
| | 143,265 |
|
NON-GAAP RECONCILIATION:
ADJUSTED EPS (UNAUDITED) (1)
THREE AND SIX MONTHS ENDED JUNE 30, 2015, 2014 AND 2013
|
| | | | | | | | | | | | | | | | | | | | | | | |
| Three Months Ended June 30, | | Six Months Ended June 30, |
| 2015 | | 2014 | | 2013 | | 2015 | | 2014 | | 2013 |
Diluted earnings per share | $ | 0.35 |
| | $ | 0.28 |
| | $ | 0.35 |
| | $ | 0.62 |
| | $ | 0.37 |
| | $ | 0.57 |
|
Adjusted for: | | | | | | | | | | | |
Income tax expense | 0.22 |
| | 0.18 |
| | 0.19 |
| | 0.39 |
| | 0.23 |
| | 0.29 |
|
Income before income taxes | 0.57 |
| | 0.46 |
| | 0.54 |
| | 1.00 |
| | 0.60 |
| | 0.86 |
|
Non-cash impairments of non-operating assets (2) | — |
| | — |
| | — |
| | 0.01 |
| | — |
| | — |
|
Loss on debt extinguishment (3) | — |
| | 0.05 |
| | — |
| | — |
| | 0.07 |
| | 0.04 |
|
Amortization of certain intangibles (4) | 0.03 |
| | 0.03 |
| | 0.03 |
| | 0.05 |
| | 0.05 |
| | 0.06 |
|
Adjusted income before income taxes | 0.60 |
| | 0.53 |
| | 0.57 |
| | 1.06 |
| | 0.72 |
| | 0.95 |
|
Provision for income tax expense at effective rate | 0.23 |
| | 0.20 |
| | 0.22 |
| | 0.41 |
| | 0.28 |
| | 0.37 |
|
Adjusted EPS | $ | 0.37 |
| | $ | 0.33 |
| | $ | 0.35 |
| | $ | 0.65 |
| | $ | 0.44 |
| | $ | 0.59 |
|
(1) Our definition of the non-GAAP measure, Adjusted EPS, starts with (a) income (loss) before income taxes, the most comparable GAAP measure. We add
the following items back to (a) to arrive at (b) adjusted income (loss) before income taxes:
| |
(i) | amortization of the intangibles from our 2007 going-private transaction, |
| |
(ii) | non-cash impairments, |
(iii) other special non-cash items,
| |
(iv) | excludable transaction costs, |
| |
(v) | mark-to-market adjustments on our interest rate swaps, recognized in the income statement, and |
| |
(vi) | amortization of previous losses recorded in accumulated other comprehensive income (loss) (“AOCI”) related to the interest rate swaps we terminated upon our IPO and refinancing transactions in December 2010. |
We subtract income taxes, at the GAAP effective tax rate (except for 2013, when we used the GAAP expected effective tax rate), from (b) to arrive at (c) adjusted earnings. Adjusted EPS is equal to (c) divided by weighted average diluted shares outstanding. Since the numbers reflected in the above table are calculated on a per share basis, they may not foot due to rounding.
We believe that excluding the impact of derivatives provides for more transparency and comparability since these transactions have historically been volatile. Additionally, we believe that comparability of our performance is improved by excluding impairments that are unrelated to our core operations, as well as intangibles from the 2007 going-private transactions and other special items that are non-comparable in nature.
| |
(2) | In September 2013, the Company agreed to advance up to $2.3 million, pursuant to an unsecured promissory note, to an independent fleet contractor that transported freight on Swift's behalf. In March 2015, management became aware that the independent contractor violated various covenants outlined in the unsecured promissory note, which created an event of default that made the principal and accrued interest immediately due and payable. As a result of this event of default, as well as an overall decline in the independent contractor's financial condition, management re-evaluated the fair value of the unsecured promissory note. As of March 31, 2015, management determined that the remaining balance due from the independent contractor to the Company was not collectible, which resulted in a $1.5 million pre-tax adjustment that was recorded in "Non-cash impairments of non-operating assets" in the Company's consolidated income statements. |
| |
(3) | During the six months ended June 30, 2014, the Company used cash on hand to repurchase $39.2 million in principal of its Senior Secured Second Priority Notes, priced at 110.50%, in the form of open market transactions. Including principal, premium and accrued interest, the Company paid $44.7 million. The repurchase of the Senior Secured Second Priority Notes resulted in a loss on debt extinguishment of $4.7 million, representing the write-off of the unamortized original issue discount. |
In June 2014, the Company entered into a Third Amended and Restated Credit Agreement ("2014 Agreement"), which included a $500.0 million delayed-draw first lien Term Loan A tranche, a $400.0 million first lien Term Loan B tranche, and a $450.0 million revolving credit line. The 2014 Agreement replaced the then-existing $400.0 million revolving credit line, as well as the first lien Term Loan B-1 and B-2 tranches of the Second Amended and Restated Credit Agreement ("2013 Agreement"), which had outstanding principal balances at closing of $229.0 million and $370.9 million, respectively. The replacement of the 2013 Agreement resulted in a loss on debt extinguishment of $5.2 million, reflecting the write-off of the unamortized original issue discount and deferred financing fees related to the 2013 Agreement and the previous revolving credit line.
In March 2013, the Company entered into the 2013 Agreement, which included a first lien Term Loan B-1 tranche and a first lien Term Loan B-2 tranche with face values of $250.0 million and $410.0 million, respectively. The 2013 Agreement replaced the then-existing term loan B-1 and B-2 tranches of the Amended and Restated Credit Agreement ("2012 Agreement"), which had outstanding principal balances at closing of $152.0 million and $508.0 million, respectively. The replacement of the 2012 Agreement resulted in a loss on debt extinguishment of $5.0 million, reflecting the write-off of the unamortized original issue discount and deferred financing fees associated with the original term loan.
| |
(4) | For each three and six month period presented, amortization of certain intangibles reflects the non-cash amortization expense of $3.9 million and $7.8 million, respectively, relating to certain intangible assets identified in the 2007 going-private transaction through which Swift Corporation acquired Swift Transportation Co. |
NON-GAAP RECONCILIATION:
ADJUSTED OPERATING INCOME AND OPERATING RATIO (UNAUDITED) (1)
THREE AND SIX MONTHS ENDED JUNE 30, 2015, 2014 AND 2013
|
| | | | | | | | | | | | | | | | | | | | | | | |
| Three Months Ended June 30, | | Six Months Ended June 30, |
| 2015 | | 2014 | | 2013 | | 2015 | | 2014 | | 2013 |
| (dollar amounts in thousands) |
Operating revenue | $ | 1,059,404 |
| | $ | 1,075,898 |
| | $ | 1,029,071 |
| | $ | 2,074,548 |
| | $ | 2,084,344 |
| | $ | 2,010,679 |
|
Less: Fuel surcharge revenue | 123,505 |
| | 199,561 |
| | 198,924 |
| | 243,785 |
| | 391,008 |
| | 395,981 |
|
Revenue xFSR | 935,899 |
| | 876,337 |
| | 830,147 |
| | 1,830,763 |
| | 1,693,336 |
| | 1,614,698 |
|
Operating expense | 960,928 |
| | 981,876 |
| | 928,805 |
| | 1,901,072 |
| | 1,944,152 |
| | 1,840,695 |
|
Adjusted for: | | | | | | | | | | | |
Fuel surcharge revenue | (123,505 | ) | | (199,561 | ) | | (198,924 | ) | | (243,785 | ) | | (391,008 | ) | | (395,981 | ) |
Amortization of certain intangibles (2) | (3,912 | ) | | (3,912 | ) | | (3,912 | ) | | (7,824 | ) | | (7,824 | ) | | (7,824 | ) |
Adjusted operating expense | 833,511 |
| | 778,403 |
| | 725,969 |
| | 1,649,463 |
| | 1,545,320 |
| | 1,436,890 |
|
Adjusted operating income | $ | 102,388 |
| | $ | 97,934 |
| | $ | 104,178 |
| | $ | 181,300 |
| | $ | 148,016 |
| | $ | 177,808 |
|
Operating Ratio | 90.7 | % | | 91.3 | % | | 90.3 | % | | 91.6 | % | | 93.3 | % | | 91.5 | % |
Adjusted Operating Ratio | 89.1 | % | | 88.8 | % | | 87.5 | % | | 90.1 | % | | 91.3 | % | | 89.0 | % |
| |
(1) | Our definition of the non-GAAP measure, Adjusted Operating Ratio, starts with (a) operating expense and (b) operating revenue, which are GAAP financial measures. We subtract the following items from (a) to arrive at (c) adjusted operating expense: |
| |
(i) | fuel surcharge revenue, |
| |
(ii) | amortization of the intangibles from our 2007 going-private transaction, |
| |
(iii) | non-cash operating impairment charges, |
| |
(iv) | other special non-cash items, and |
| |
(v) | excludable transaction costs. |
We then subtract fuel surcharge revenue from (b) to arrive at (d) Revenue xFSR. Adjusted Operating Ratio is equal to (c) adjusted operating expense as a percentage of (d) Revenue xFSR.
We net fuel surcharge revenue against fuel expense in the calculation of our Adjusted Operating Ratio, thereby excluding fuel surcharge revenue from operating revenue in the denominator. Because fuel surcharge revenue is so volatile, we believe excluding it provides for more transparency and comparability. Additionally, we believe that comparability of our performance is improved by excluding impairments, non-comparable intangibles from the 2007 Transactions and other special items.
| |
(2) | Includes the items discussed in note (4) to the Non-GAAP Reconciliation: Adjusted EPS. |
NON-GAAP RECONCILIATION:
ADJUSTED EARNINGS BEFORE INTEREST, TAXES, DEPRECIATION
AND AMORTIZATION (UNAUDITED) (1)
THREE AND SIX MONTHS ENDED JUNE 30, 2015, 2014 AND 2013
|
| | | | | | | | | | | | | | | | | | | | | | | |
| Three Months Ended June 30, | | Six Months Ended June 30, |
| 2015 | | 2014 | | 2013 | | 2015 | | 2014 | | 2013 |
| (in thousands) |
Net income | $ | 50,954 |
| | $ | 40,198 |
| | $ | 49,879 |
| | $ | 88,794 |
| | $ | 52,503 |
| | $ | 80,171 |
|
Adjusted for: | | | | | | | | | | | |
Depreciation and amortization of property and equipment | 60,415 |
| | 54,791 |
| | 56,880 |
| | 117,342 |
| | 110,966 |
| | 111,750 |
|
Amortization of intangibles | 4,203 |
| | 4,203 |
| | 4,203 |
| | 8,407 |
| | 8,407 |
| | 8,407 |
|
Interest expense | 10,109 |
| | 21,453 |
| | 24,762 |
| | 20,497 |
| | 44,678 |
| | 51,124 |
|
Derivative interest expense | 1,111 |
| | 1,618 |
| | 532 |
| | 3,904 |
| | 3,271 |
| | 1,094 |
|
Interest income | (591 | ) | | (692 | ) | | (546 | ) | | (1,178 | ) | | (1,458 | ) | | (1,137 | ) |
Income tax expense | 31,877 |
| | 25,165 |
| | 26,963 |
| | 55,568 |
| | 32,869 |
| | 41,650 |
|
Earnings before interest, taxes, depreciation and amortization (EBITDA) | $ | 158,078 |
| | $ | 146,736 |
| | $ | 162,673 |
| | $ | 293,334 |
| | $ | 251,236 |
| | $ | 293,059 |
|
Non-cash equity compensation (2) | 1,400 |
| | 1,292 |
| | 893 |
| | 2,883 |
| | 2,353 |
| | 1,498 |
|
Loss on debt extinguishment (3) | — |
| | 6,990 |
| | — |
| | — |
| | 9,903 |
| | 5,044 |
|
Non-cash impairments of non-operating assets (4) | — |
| | — |
| | — |
| | 1,480 |
| | — |
| | — |
|
Adjusted earnings before interest, taxes, depreciation and amortization (Adjusted EBITDA) | $ | 159,478 |
| | $ | 155,018 |
| | $ | 163,566 |
| | $ | 297,697 |
| | $ | 263,492 |
| | $ | 299,601 |
|
| |
(1) | Our definition of the non-GAAP measure, Adjusted EBITDA, starts with (a) net income (loss), the most comparable GAAP measure. We add the following items back to (a) to arrive at Adjusted EBITDA |
| |
(i) | depreciation and amortization, |
| |
(ii) | interest and derivative interest expense, including fees and charges associated with indebtedness, net of interest income, |
| |
(iv) | non-cash equity compensation expense, |
| |
(vi) | other special non-cash items, and |
| |
(vii) | excludable transaction costs. |
We believe that Adjusted EBITDA is a relevant measure for estimating the cash generated by our operations that would be available to cover capital expenditures, taxes, interest and other investments and that it enhances an investor’s understanding of our financial performance. We use Adjusted EBITDA for business planning purposes and in measuring our performance relative to that of our competitors. Our method of computing Adjusted EBITDA is consistent with that used in our debt covenants, specifically our leverage ratio, and is also routinely reviewed by management for that purpose.
| |
(2) | Represents recurring non-cash equity compensation expense, on a pre-tax basis. In accordance with the terms of our senior credit agreement, this expense is added back in the calculation of Adjusted EBITDA for covenant compliance purposes. |
| |
(3) | Includes the items discussed in note (3) to the Non-GAAP Reconciliation: Adjusted EPS. |
| |
(4) | Includes the item discussed in note (2) to the Non-GAAP Reconciliation: Adjusted EPS. |
FINANCIAL INFORMATION BY SEGMENT (UNAUDITED)
THREE AND SIX MONTHS ENDED JUNE 30, 2015, 2014 AND 2013
|
| | | | | | | | | | | | | | | | | | | | | | |
| Three Months Ended June 30, | | Six Months Ended June 30, |
| 2015 | | 2014 | | 2013 | | 2015 | | 2014 | | 2013 |
| (dollar amounts in thousands) |
Operating Revenue: | | | | | | | | | | | |
Truckload | $ | 555,715 |
| | $ | 575,481 |
| | $ | 588,724 |
| | 1,094,056 |
| | $ | 1,128,538 |
| | $ | 1,148,319 |
|
Dedicated | 234,213 |
| | 223,098 |
| | 182,651 |
| | 451,988 |
| | 416,751 |
| | 361,877 |
|
Central Refrigerated | 97,688 |
| | 106,911 |
| | 111,238 |
| | 193,256 |
| | 213,674 |
| | 217,640 |
|
Intermodal | 98,507 |
| | 100,911 |
| | 90,994 |
| | 188,861 |
| | 192,224 |
| | 174,258 |
|
Subtotal | 986,123 |
| | 1,006,401 |
| | 973,607 |
| | 1,928,161 |
| | 1,951,187 |
| | 1,902,094 |
|
Non-reportable segment (1) | 93,869 |
| | 83,491 |
| | 71,915 |
| | 185,491 |
| | 159,157 |
| | 143,972 |
|
Intersegment eliminations | (20,588 | ) | | (13,994 | ) | | (16,451 | ) | | (39,104 | ) | | (26,000 | ) | | (35,387 | ) |
Consolidated operating revenue | $ | 1,059,404 |
| | $ | 1,075,898 |
| | $ | 1,029,071 |
| | 2,074,548 |
| | $ | 2,084,344 |
| | $ | 2,010,679 |
|
| | | | | | | | | | | |
Operating Income (Loss): | | | | | | | | | | | |
Truckload | $ | 67,944 |
| | $ | 69,596 |
| | $ | 64,614 |
| | 124,798 |
| | $ | 101,503 |
| | $ | 107,017 |
|
Dedicated | 22,967 |
| | 21,112 |
| | 24,263 |
| | 37,312 |
| | 32,642 |
| | 43,217 |
|
Central Refrigerated | 6,117 |
| | 3,662 |
| | 5,660 |
| | 10,916 |
| | 6,082 |
| | 10,381 |
|
Intermodal | 1,601 |
| | (495 | ) | | 788 |
| | 358 |
| | (1,421 | ) | | (816 | ) |
Subtotal | 98,629 |
| | 93,875 |
| | 95,325 |
| | 173,384 |
| | 138,806 |
| | 159,799 |
|
Non-reportable segment (1) | (153 | ) | | 147 |
| | 4,941 |
| | 92 |
| | 1,386 |
| | 10,185 |
|
Consolidated operating income | $ | 98,476 |
| | $ | 94,022 |
| | $ | 100,266 |
| | 173,476 |
| | $ | 140,192 |
| | $ | 169,984 |
|
| | | | | | | | | | | |
Operating Ratio: | | | | | | | | | | | |
Truckload | 87.8 | % | | 87.9 | % | | 89.0 | % | | 88.6 | % | | 91.0 | % | | 90.7 | % |
Dedicated | 90.2 | % | | 90.5 | % | | 86.7 | % | | 91.7 | % | | 92.2 | % | | 88.1 | % |
Central Refrigerated | 93.7 | % | | 96.6 | % | | 94.9 | % | | 94.4 | % | | 97.2 | % | | 95.2 | % |
Intermodal | 98.4 | % | | 100.5 | % | | 99.1 | % | | 99.8 | % | | 100.7 | % | | 100.5 | % |
| | | | | | | | | | | |
Adjusted Operating Ratio (2): | | | | | | | | | | | |
Truckload | 86.0 | % | | 84.8 | % | | 86.2 | % | | 86.9 | % | | 88.7 | % | | 88.2 | % |
Dedicated | 89.1 | % | | 88.5 | % | | 83.7 | % | | 90.8 | % | | 90.4 | % | | 85.3 | % |
Central Refrigerated | 92.7 | % | | 95.7 | % | | 93.5 | % | | 93.4 | % | | 96.4 | % | | 93.8 | % |
Intermodal | 98.1 | % | | 100.6 | % | | 98.9 | % | | 99.8 | % | | 100.9 | % | | 100.6 | % |
| |
(1) | The other non-reportable segment includes the Company's logistics and freight brokerage services, as well as support services provided by its subsidiaries to customers and owner-operators, including repair and maintenance shop services, equipment leasing, and insurance. Intangible asset amortization related to the 2007 going-private transactions is also included in this other non-reportable segment. |
| |
(2) | For more details, refer to the Non-GAAP Reconciliation: Adjusted Operating Income and Operating Ratio by Segment. |
OPERATING STATISTICS BY SEGMENT (UNAUDITED)
THREE AND SIX MONTHS ENDED JUNE 30, 2015, 2014 AND 2013
|
| | | | | | | | | | | | | | | | | | | | | | |
| Three Months Ended June 30, | | Six Months Ended June 30, |
| 2015 | | 2014 | | 2013 | | 2015 | | 2014 | | 2013 |
Truckload: | | | | | | | | | | | |
Weekly revenue xFSR per tractor | $ | 3,571 |
| | $ | 3,453 |
| | $ | 3,270 |
| | 3,516 |
| | $ | 3,335 |
| | $ | 3,227 |
|
Total loaded miles (1) | 261,609 |
| | 259,583 |
| | 274,830 |
| | 516,535 |
| | 514,009 |
| | 536,680 |
|
Deadhead miles percentage | 11.8 | % | | 11.7 | % | | 11.4 | % | | 11.8 | % | | 11.7 | % | | 11.3 | % |
Average operational truck count: | | | | | | | | | | | |
Company | 7,465 |
| | 6,822 |
| | 7,733 |
| | 7,400 |
| | 6,987 |
| | 7,613 |
|
Owner-Operator | 2,991 |
| | 3,406 |
| | 3,288 |
| | 3,096 |
| | 3,445 |
| | 3,290 |
|
Total | 10,456 |
| | 10,228 |
| | 11,021 |
| | 10,496 |
| | 10,432 |
| | 10,903 |
|
| | | | | | | | | | | |
Dedicated: | | | | | | | | | | | |
Weekly revenue xFSR per tractor | $ | 3,343 |
| | $ | 3,191 |
| | $ | 3,396 |
| | 3,275 |
| | $ | 3,184 |
| | $ | 3,391 |
|
Average operational truck count: | | | | | | | | | | | |
Company | 3,983 |
| | 3,650 |
| | 2,735 |
| | 3,933 |
| | 3,405 |
| | 2,709 |
|
Owner-Operator | 871 |
| | 770 |
| | 632 |
| | 875 |
| | 731 |
| | 638 |
|
Total | 4,854 |
| | 4,420 |
| | 3,367 |
| | 4,808 |
| | 4,136 |
| | 3,347 |
|
| | | | | | | | | | | |
Central Refrigerated: | | | | | | | | | | | |
Weekly revenue xFSR per tractor | $ | 3,418 |
| | $ | 3,543 |
| | $ | 3,367 |
| | 3,412 |
| | $ | 3,383 |
| | $ | 3,349 |
|
Total loaded miles (1) | 43,215 |
| | 42,937 |
| | 49,239 |
| | 85,095 |
| | 85,694 |
| | 96,339 |
|
Deadhead miles percentage | 13.9 | % | | 15.1 | % | | 12.4 | % | | 14.0 | % | | 14.6 | % | | 12.2 | % |
Average operational truck count: | | | | | | | | | | | |
Company | 1,283 |
| | 1,057 |
| | 1,043 |
| | 1,273 |
| | 1,057 |
| | 1,020 |
|
Owner-Operator | 591 |
| | 810 |
| | 947 |
| | 590 |
| | 882 |
| | 927 |
|
Total | 1,874 |
| | 1,867 |
| | 1,990 |
| | 1,863 |
| | 1,939 |
| | 1,947 |
|
| | | | | | | | | | | |
Intermodal: | | | | | | | | | | | |
Average operational truck count: | | | | | | | | | | | |
Company | 521 |
| | 409 |
| | 301 |
| | 501 |
| | 394 |
| | 298 |
|
Owner-Operator | 95 |
| | 68 |
| | 29 |
| | 91 |
| | 71 |
| | 24 |
|
Total | 616 |
| | 477 |
| | 330 |
| | 592 |
| | 465 |
| | 322 |
|
Load Count | 46,517 |
| | 43,404 |
| | 39,124 |
| | 88,457 |
| | 82,007 |
| | 74,763 |
|
Average Container Count | 9,150 |
| | 8,717 |
| | 8,717 |
| | 9,150 |
| | 8,717 |
| | 8,717 |
|
| |
(1) | Total loaded miles presented in thousands. |
CONSOLIDATED TOTAL EQUIPMENT (UNAUDITED)
AS OF JUNE 30 2015, DECEMBER 31, 2014 AND JUNE 30, 2014
|
| | | | | | | | |
| As of |
| June 30,
2015 | | December 31, 2014 | | June 30,
2014 |
Tractors | | | | | |
Company: | | | | | |
Owned | 6,753 |
| | 6,083 |
| | 5,618 |
|
Leased – capital leases | 2,077 |
| | 1,700 |
| | 2,059 |
|
Leased – operating leases | 6,897 |
| | 6,099 |
| | 5,880 |
|
Total company tractors | 15,727 |
| | 13,882 |
| | 13,557 |
|
Owner-operator: | | | | | |
Financed through the Company | 3,843 |
| | 4,204 |
| | 4,473 |
|
Other | 1,097 |
| | 750 |
| | 567 |
|
Total owner-operator tractors | 4,940 |
| | 4,954 |
| | 5,040 |
|
Total tractors | 20,667 |
| | 18,836 |
| | 18,597 |
|
Trailers | 63,142 |
| | 61,652 |
| | 57,462 |
|
Containers | 9,150 |
| | 9,150 |
| | 8,717 |
|
NON-GAAP RECONCILIATION:
ADJUSTED OPERATING INCOME AND OPERATING RATIO
BY SEGMENT (UNAUDITED)
THREE AND SIX MONTHS ENDED JUNE 30, 2015, 2014 AND 2013
|
| | | | | | | | | | | | | | | | | | | | | | | |
| Three Months Ended June 30, | | Six Months Ended June 30, |
| 2015 | | 2014 | | 2013 | | 2015 | | 2014 | | 2013 |
| (in thousands) |
Truckload: | | | | | | | | | | | |
Operating revenue | $ | 555,715 |
| | $ | 575,481 |
| | $ | 588,724 |
| | $ | 1,094,056 |
| | $ | 1,128,538 |
| | $ | 1,148,319 |
|
Less: Fuel surcharge revenue | 70,281 |
| | 116,414 |
| | 120,144 |
| | 139,842 |
| | 228,062 |
| | 238,483 |
|
Revenue xFSR | 485,434 |
| | 459,067 |
| | 468,580 |
| | 954,214 |
| | 900,476 |
| | 909,836 |
|
| | | | | | | | | | | |
Operating expense | 487,771 |
| | 505,885 |
| | 524,110 |
| | 969,258 |
| | 1,027,035 |
| | 1,041,302 |
|
Adjusted for: Fuel surcharge revenue | (70,281 | ) | | (116,414 | ) | | (120,144 | ) | | (139,842 | ) | | (228,062 | ) | | (238,483 | ) |
Adjusted operating expense | 417,490 |
| | 389,471 |
| | 403,966 |
| | 829,416 |
| | 798,973 |
| | 802,819 |
|
Adjusted operating income | $ | 67,944 |
| | $ | 69,596 |
| | $ | 64,614 |
| | $ | 124,798 |
| | $ | 101,503 |
| | $ | 107,017 |
|
Adjusted Operating Ratio | 86.0 | % | | 84.8 | % | | 86.2 | % | | 86.9 | % | | 88.7 | % | | 88.2 | % |
Operating Ratio | 87.8 | % | | 87.9 | % | | 89.0 | % | | 88.6 | % | | 91.0 | % | | 90.7 | % |
| | | | | | | | | | | |
Dedicated: | | | | | | | | | | | |
Operating revenue | $ | 234,213 |
| | $ | 223,098 |
| | $ | 182,651 |
| | $ | 451,988 |
| | $ | 416,751 |
| | $ | 361,877 |
|
Less: Fuel surcharge revenue | 23,256 |
| | 39,775 |
| | 33,998 |
| | 44,898 |
| | 76,309 |
| | 68,431 |
|
Revenue xFSR | 210,957 |
| | 183,323 |
| | 148,653 |
| | 407,090 |
| | 340,442 |
| | 293,446 |
|
| | | | | | | | | | | |
Operating expense | 211,246 |
| | 201,986 |
| | 158,388 |
| | 414,676 |
| | 384,109 |
| | 318,660 |
|
Adjusted for: Fuel surcharge revenue | (23,256 | ) | | (39,775 | ) | | (33,998 | ) | | (44,898 | ) | | (76,309 | ) | | (68,431 | ) |
Adjusted operating expense | 187,990 |
| | 162,211 |
| | 124,390 |
| | 369,778 |
| | 307,800 |
| | 250,229 |
|
Adjusted operating income | $ | 22,967 |
| | $ | 21,112 |
| | $ | 24,263 |
| | $ | 37,312 |
| | $ | 32,642 |
| | $ | 43,217 |
|
Adjusted Operating Ratio | 89.1 | % | | 88.5 | % | | 83.7 | % | | 90.8 | % | | 90.4 | % | | 85.3 | % |
Operating Ratio | 90.2 | % | | 90.5 | % | | 86.7 | % | | 91.7 | % | | 92.2 | % | | 88.1 | % |
| | | | | | | | | | | |
Central Refrigerated: | | | | | | | | | | | |
Operating revenue | $ | 97,688 |
| | $ | 106,911 |
| | $ | 111,238 |
| | $ | 193,256 |
| | $ | 213,674 |
| | $ | 217,640 |
|
Less: Fuel surcharge revenue | 14,410 |
| | 20,941 |
| | 24,162 |
| | 28,878 |
| | 44,118 |
| | 49,012 |
|
Revenue xFSR | 83,278 |
| | 85,970 |
| | 87,076 |
| | 164,378 |
| | 169,556 |
| | 168,628 |
|
| | | | | | | | | | | |
Operating expense | 91,571 |
| | 103,249 |
| | 105,578 |
| | 182,340 |
| | 207,592 |
| | 207,259 |
|
Adjusted for: Fuel surcharge revenue | (14,410 | ) | | (20,941 | ) | | (24,162 | ) | | (28,878 | ) | | (44,118 | ) | | (49,012 | ) |
Adjusted operating expense | 77,161 |
| | 82,308 |
| | 81,416 |
| | 153,462 |
| | 163,474 |
| | 158,247 |
|
Adjusted operating income | $ | 6,117 |
| | $ | 3,662 |
| | $ | 5,660 |
| | $ | 10,916 |
| | $ | 6,082 |
| | $ | 10,381 |
|
Adjusted Operating Ratio | 92.7 | % | | 95.7 | % | | 93.5 | % | | 93.4 | % | | 96.4 | % | | 93.8 | % |
Operating Ratio | 93.7 | % | | 96.6 | % | | 94.9 | % | | 94.4 | % | | 97.2 | % | | 95.2 | % |
| | | | | | | | | | | |
Intermodal: | | | | | | | | | | | |
Operating revenue | $ | 98,507 |
| | $ | 100,911 |
| | $ | 90,994 |
| | $ | 188,861 |
| | $ | 192,224 |
| | $ | 174,258 |
|
Less: Fuel surcharge revenue | 13,664 |
| | 20,104 |
| | 18,814 |
| | 26,754 |
| | 38,468 |
| | 36,825 |
|
Revenue xFSR | 84,843 |
| | 80,807 |
| | 72,180 |
| | 162,107 |
| | 153,756 |
| | 137,433 |
|
| | | | | | | | | | | |
Operating expense | 96,906 |
| | 101,406 |
| | 90,206 |
| | 188,503 |
| | 193,645 |
| | 175,074 |
|
Adjusted for: Fuel surcharge revenue | (13,664 | ) | | (20,104 | ) | | (18,814 | ) | | (26,754 | ) | | (38,468 | ) | | (36,825 | ) |
Adjusted operating expense | 83,242 |
| | 81,302 |
| | 71,392 |
| | 161,749 |
| | 155,177 |
| | 138,249 |
|
Adjusted operating income (loss) | $ | 1,601 |
| | $ | (495 | ) | | $ | 788 |
| | $ | 358 |
| | $ | (1,421 | ) | | $ | (816 | ) |
Adjusted Operating Ratio | 98.1 | % | | 100.6 | % | | 98.9 | % | | 99.8 | % | | 100.9 | % | | 100.6 | % |
Operating Ratio | 98.4 | % | | 100.5 | % | | 99.1 | % | | 99.8 | % | | 100.7 | % | | 100.5 | % |
CONDENSED CONSOLIDATED BALANCE SHEETS (UNAUDITED)
AS OF JUNE 30, 2015 AND DECEMBER 31, 2014
|
| | | | | | | |
| June 30, 2015 | | December 31, 2014 |
| (in thousands) |
ASSETS | | | |
Current assets: | | | |
Cash and cash equivalents | $ | 53,651 |
| | $ | 105,132 |
|
Restricted cash | 64,309 |
| | 45,621 |
|
Restricted investments, held to maturity, amortized cost | 18,284 |
| | 24,510 |
|
Accounts receivable, net | 451,799 |
| | 478,999 |
|
Equipment sales receivable | — |
| | 288 |
|
Income tax refund receivable | 4,399 |
| | 18,455 |
|
Inventories and supplies | 18,633 |
| | 18,992 |
|
Assets held for sale | 8,049 |
| | 2,907 |
|
Prepaid taxes, licenses, insurance and other | 47,137 |
| | 51,441 |
|
Deferred income taxes | 39,348 |
| | 44,861 |
|
Current portion of notes receivable | 9,093 |
| | 9,202 |
|
Total current assets | 714,702 |
| | 800,408 |
|
Property and equipment, at cost: | | | |
Revenue and service equipment | 2,194,255 |
| | 2,061,835 |
|
Land | 127,865 |
| | 122,835 |
|
Facilities and improvements | 263,645 |
| | 268,025 |
|
Furniture and office equipment | 78,809 |
| | 67,740 |
|
Total property and equipment | 2,664,574 |
| | 2,520,435 |
|
Less: accumulated depreciation and amortization | 1,049,974 |
| | 978,305 |
|
Net property and equipment | 1,614,600 |
| | 1,542,130 |
|
Other assets | 34,928 |
| | 41,855 |
|
Intangible assets, net | 291,526 |
| | 299,933 |
|
Goodwill | 253,256 |
| | 253,256 |
|
Total assets | $ | 2,909,012 |
| | $ | 2,937,582 |
|
LIABILITIES AND STOCKHOLDERS’ EQUITY | | | |
Current liabilities: | | | |
Accounts payable | $ | 123,438 |
| | $ | 160,186 |
|
Accrued liabilities | 114,171 |
| | 100,329 |
|
Current portion of claims accruals | 74,465 |
| | 81,251 |
|
Current portion of long-term debt (1) | 30,860 |
| | 31,445 |
|
Current portion of capital lease obligations | 52,499 |
| | 42,902 |
|
Fair value of interest rate swaps | 2,213 |
| | 6,109 |
|
Total current liabilities | 397,646 |
| | 422,222 |
|
Revolving line of credit | — |
| | 57,000 |
|
Long-term debt, less current portion (1) | 858,879 |
| | 871,615 |
|
Capital lease obligations, less current portion | 203,447 |
| | 158,104 |
|
Claims accruals, less current portion | 148,559 |
| | 143,693 |
|
Deferred income taxes | 464,206 |
| | 480,640 |
|
Securitization of accounts receivable | 264,000 |
| | 334,000 |
|
Other liabilities | 181 |
| | 14 |
|
Total liabilities | 2,336,918 |
| | 2,467,288 |
|
Stockholders' equity: | | | |
Preferred stock | — |
| | — |
|
Class A common stock | 917 |
| | 911 |
|
Class B common stock | 510 |
| | 510 |
|
Additional paid-in capital | 791,776 |
| | 781,124 |
|
Accumulated deficit | (221,223 | ) | | (310,017 | ) |
Accumulated other comprehensive income (loss) | 12 |
| | (2,336 | ) |
Noncontrolling interest | 102 |
| | 102 |
|
Total stockholders' equity | 572,094 |
| | 470,294 |
|
Total liabilities and stockholders' equity | $ | 2,909,012 |
| | $ | 2,937,582 |
|
Note to Condensed Consolidated Balance Sheets:
| |
(1) | As of June 30, 2015, the Company's total long-term debt had a carrying value of $889.7 million, comprised of: |
•$488.0 million: Term Loan A, due June 2019
•$394.2 million: Term Loan B, due 2021, net of $0.8 million OID
•$7.5 million: Other
As of December 31, 2014, the Company's total long-term debt had a carrying value of $903.1 million, comprised of:
•$500.0 million: Term Loan A, due June 2019
•$396.1 million: Term Loan B, due 2021, net of $0.9 million OID
•$7.0 million: Other
CONSOLIDATED STATEMENTS OF CASH FLOWS (UNAUDITED)
SIX MONTHS ENDED JUNE 30, 2015 AND 2014
|
| | | | | | | |
| Six Months Ended June 30, |
| 2015 | | 2014 |
| (in thousands) |
Cash flows from operating activities: | |
Net income | $ | 88,794 |
| | $ | 52,503 |
|
Adjustments to reconcile net income to net cash provided by operating activities: | | | |
Depreciation and amortization of property, equipment and intangibles | 125,749 |
| | 119,373 |
|
Amortization of debt issuance costs, original issue discount, and losses on terminated swaps | 5,228 |
| | 5,077 |
|
Gain on disposal of property and equipment less write-off of totaled tractors | (13,507 | ) | | (10,522 | ) |
Impairments | 1,480 |
| | — |
|
Deferred income taxes | (12,636 | ) | | (25,538 | ) |
Provision for losses on accounts receivable | 3,612 |
| | 1,604 |
|
Non-cash loss on debt extinguishment and write-offs of deferred financing costs and original issue discount | — |
| | 9,903 |
|
Non-cash equity compensation | 2,883 |
| | 2,353 |
|
Excess tax benefits from stock-based compensation (1) | (2,460 | ) | | (1,835 | ) |
Income effect of mark-to-market adjustment of interest rate swaps | (325 | ) | | (43 | ) |
Increase (decrease) in cash resulting from changes in: | | | |
Accounts receivable | 23,588 |
| | (43,526 | ) |
Inventories and supplies | 359 |
| | (2,334 | ) |
Prepaid expenses and other current assets | 18,360 |
| | 28,128 |
|
Other assets | 4,551 |
| | 6,556 |
|
Accounts payable, accrued and other liabilities (1) | 2,527 |
| | 41,784 |
|
Net cash provided by operating activities | 248,203 |
| | 183,483 |
|
Cash flows from investing activities: | | | |
Increase in restricted cash | (18,688 | ) | | (1,982 | ) |
Proceeds from maturities of investments (2) | 20,975 |
| | 19,642 |
|
Purchases of investments (2) | (14,825 | ) | | (19,755 | ) |
Proceeds from sale of property and equipment | 46,663 |
| | 77,088 |
|
Capital expenditures | (166,697 | ) | | (135,068 | ) |
Payments received on notes receivable | 3,536 |
| | 2,226 |
|
Expenditures on assets held for sale | (11,461 | ) | | (1,991 | ) |
Payments received on assets held for sale | 4,299 |
| | 13,603 |
|
Payments received on equipment sale receivables | 12 |
| | 385 |
|
Net cash used in investing activities | (136,186 | ) | | (45,852 | ) |
Cash flows from financing activities: | | | |
Repayment of long-term debt and capital leases | (48,777 | ) | | (707,386 | ) |
Proceeds from long-term debt | 4,504 |
| | 450,000 |
|
Net (repayments) borrowings on revolving line of credit | (57,000 | ) | | 82,000 |
|
Borrowings under accounts receivable securitization | 25,000 |
| | 95,000 |
|
Repayment of accounts receivable securitization | (95,000 | ) | | (40,000 | ) |
Payment of deferred loan costs | — |
| | (10,541 | ) |
Proceeds from common stock issued | 5,315 |
| | 5,811 |
|
Excess tax benefits from stock-based compensation | 2,460 |
| | 1,835 |
|
Net cash used in financing activities | (163,498 | ) | | (123,281 | ) |
Net (decrease) increase in cash and cash equivalents | (51,481 | ) | | 14,350 |
|
Cash and cash equivalents at beginning of period | 105,132 |
| | 59,178 |
|
Cash and cash equivalents at end of period | $ | 53,651 |
| | $ | 73,528 |
|
CONSOLIDATED STATEMENTS OF CASH FLOWS (UNAUDITED) — CONTINUED
|
| | | | | | | |
| Six Months Ended June 30, |
| 2015 | | 2014 |
| (in thousands) |
Supplemental disclosures of cash flow information: | | | |
Cash paid during the period for: | | | |
Interest | $ | 25,575 |
| | $ | 49,331 |
|
Income taxes | 50,807 |
| | 22,041 |
|
Non-cash investing activities: | | | |
Equipment purchase accrual | $ | 8,991 |
| | $ | 19,916 |
|
Notes receivable from sale of assets | 3,548 |
| | 4,015 |
|
Equipment sales receivables | — |
| | 453 |
|
Non-cash financing activities: | | | |
Capital lease additions | $ | 85,821 |
| | $ | 38,043 |
|
Accrued deferred loan costs | — |
| | 1,433 |
|
Notes to Consolidated Statements of Cash Flows:
| |
(1) | Beginning in 2015, we separately present excess tax benefits from stock-based compensation within "Net cash provided by operating activities." The prior period presentation has been retrospectively adjusted to reclassify the amount out of "Accounts payable, accrued and other liabilities" and into the new line item "Excess tax benefits from stock-based compensation." The change in presentation has no net impact on “Net cash provided by operating activities.” |
| |
(2) | Also beginning in 2015, the Company presents gross amounts of its investment in securities activities as "Proceeds from maturities of investments" and "Purchases of investments" in the consolidated statements of cash flows. The prior period presentation has been retrospectively adjusted to accommodate this gross presentation. The change in presentation has no net impact on "Net cash used in investing activities." |