Exhibit 99 | ||

January 27, 2014
Dear Fellow Stockholders of Swift Transportation Company (NYSE: SWFT),
A summary of our key results for the three and twelve months ended December 31,st for each of the last three years is shown below. As previously discussed in our third quarter 2013 letter, consistent with the common control accounting method for acquisitions between entities under common control, all historical financial results have been recast to include the results of Central Refrigerated ("Central").
Three Months Ended December 31, | Year Ended December 31, | ||||||||||||||||||||||
2013 | 2012 | 2011 | 2013 | 2012 | 2011 | ||||||||||||||||||
(recast) | (recast) | (recast) | (recast) | ||||||||||||||||||||
Unaudited | |||||||||||||||||||||||
($ in millions, except per share data) | |||||||||||||||||||||||
Operating Revenue | $ | 1,075.4 | $ | 1,047.6 | $ | 978.9 | $ | 4,118.2 | $ | 3,976.1 | 3,779.0 | ||||||||||||
Revenue xFSR(1)(2) | $ | 878.6 | $ | 838.3 | $ | 788.3 | $ | 3,326.7 | $ | 3,181.6 | 3,028.8 | ||||||||||||
Operating Ratio | 90.5 | % | 88.9 | % | 89.4 | % | 91.3 | % | 91.2 | % | 91.5 | % | |||||||||||
Adjusted Operating Ratio(2) | 87.9 | % | 85.4 | % | 86.3 | % | 88.8 | % | 88.3 | % | 88.8 | % | |||||||||||
EBITDA | $ | 163.1 | $ | 169.3 | $ | 164.4 | $ | 600.1 | $ | 562.5 | $ | 560.6 | |||||||||||
Adjusted EBITDA(2) | $ | 164.8 | $ | 178.2 | $ | 165.7 | $ | 615.2 | $ | 598.9 | $ | 567.6 | |||||||||||
Diluted EPS | $ | 0.32 | $ | 0.39 | $ | 0.31 | $ | 1.09 | $ | 1.00 | $ | 0.74 | |||||||||||
Adjusted EPS(2) | $ | 0.36 | $ | 0.41 | $ | 0.32 | $ | 1.23 | $ | 1.11 | $ | 0.84 | |||||||||||
(1) Revenue xFSR is operating revenue, excluding fuel surcharge revenue | |||||||||||||||||||||||
(2) See GAAP to Non-GAAP reconciliation in the schedules following this letter | |||||||||||||||||||||||
Quarterly Highlights: (discussed in more detail below, including GAAP to Non-GAAP reconciliations)
• | Fourth quarter 2013 Adjusted EPS decreased to $0.36 versus $0.41 in the fourth quarter of 2012, primarily due to a $0.06 increase in insurance and claims expense |
• | Consolidated Revenue xFSR grew 4.8% in the quarter led by growth in Central Refrigerated of 17.0%, Dedicated of 3.4% and Intermodal of 2.8% |
• | Intermodal Adjusted Operating Ratio improved to 93.5%, notwithstanding negative developments in insurance and claims expense associated with the settlement of a claim from 2008 |
 | 1 | |
• | Several new customer awards in the fourth quarter led to a 6.9% increase in the Dedicated segment Average Operational Truck Count from the third quarter |
• | An owner-operator fleet with approximately 300 trucks and additional customer revenue joined the Truckload segment of Swift in mid-November providing future capacity |
• | Net debt reduction of $75.9 million in the fourth quarter, showing continued commitment to reduce debt |
Full Year Highlights: (discussed in more detail below, including GAAP to Non-GAAP reconciliations)
• | Achieved record revenue and operating income for the full year 2013 (both including and excluding Central) |
• | Full year 2013 Adjusted EPS, including Central in both periods, increased 10.8% to $1.23 in 2013 from $1.11 in 2012. For reference, the Adjusted EPS reported for 2012 before the common control accounting treatment was $1.00. Our target Adjusted EPS growth for 2013 was 15% over the $1.00 reported for 2012. For 2013, including only the accretion for the Central acquisition from August 6, 2013 through December 31, 2013, our growth in Adjusted EPS was 17% for 2013, thus exceeding our target for the second straight year. |
• | Consolidated Revenue xFSR grew 4.6%, led by Central growth of 13.1% and Intermodal growth of 5.5% |
• | Our leverage ratio improved to 2.52 as of December 31, 2013 compared to the pre-acquisition ratio of 2.78 at December 31, 2012, demonstrating continued progress toward our goal of 1.50 by December 2017 |
Fourth Quarter Results by Reportable Segment
Truckload Segment
Our Truckload segment consists of one-way movements over irregular routes throughout the United States, Mexico and Canada. This service uses both company and owner-operator tractors with dry van, flatbed and other specialized trailing equipment.
Three Months Ended December 31, | |||||||||||
2013 | 2012 | 2011 | |||||||||
Operating Revenue (1) | $ | 585.2 | $ | 591.1 | $ | 573.2 | |||||
Revenue xFSR(1)(2) | $ | 469.7 | $ | 465.7 | $ | 453.8 | |||||
Operating Ratio | 89.6 | % | 86.9 | % | 88.1 | % | |||||
Adjusted Operating Ratio(3) | 87.0 | % | 83.3 | % | 85.0 | % | |||||
Weekly Revenue xFSR per Tractor | $ | 3,366 | $ | 3,292 | $ | 2,999 | |||||
Average Operational Truck Count | 10,618 | 10,765 | 11,514 | ||||||||
Deadhead Percentage | 12.4 | % | 11.3 | % | 11.1 | % | |||||
1 In millions | |||||||||||
2 Revenue xFSR is operating revenue, excluding fuel surcharge revenue | |||||||||||
3 See GAAP to Non-GAAP reconciliation in the schedules following this letter | |||||||||||
Revenue xFSR for the fourth quarter of 2013 increased slightly to $469.7 million, compared with $465.7 million for the same quarter in 2012, despite a 1.4% reduction in our Average Operational Truck Count. In the last four months of 2013, we migrated approximately 250 trucks from our Truckload segment to our Dedicated segment to support the start up of several new customer accounts. During the fourth quarter of 2013, we entered into a definitive
| 2 | |
agreement with a transportation company located in the midwest to become a fleet operator for Swift. This added approximately 300 trucks to our Truckload segment in mid-November, but due to timing, the increase was not enough to keep the Average Operational Truck Count from declining year over year. The reduction in truck count was offset by an improvement in Weekly Revenue xFSR per Tractor of 2.2% driven by a 2.6% increase in Revenue xFSR per loaded mile, partially offset by a slight decrease in loaded miles per truck per week of 0.4%. The decline in loaded miles per week was primarily caused by the lingering impacts of the Department of Transportation regulatory changes that further limit the driving hours available ("Hours of Service") in July, inclement weather in December, and the transition of the fleet referred to above. The increase in Revenue xFSR per loaded mile was driven in part by an increase in repositioning fees that also caused an increase in the deadhead percentage, which was a further headwind on our loaded miles per truck per week.
The Adjusted Operating Ratio in our Truckload segment was 87.0% in the fourth quarter of 2013 compared to 83.3% during the same quarter of 2012. The year over year increase was driven primarily by an increase in insurance expense, higher equipment costs, higher operating supplies and expenses, and higher deadhead due to increased project business and the repositioning in the fourth quarter mentioned above. These increases were partially offset by increased Revenue xFSR per loaded mile, improved fuel economy, and higher gains on sale of equipment.
Dedicated Segment
Through our Dedicated segment, we devote equipment and offer tailored solutions under long-term contracts with customers. This dedicated business utilizes refrigerated, dry van, flatbed and other specialized trailing equipment.
Three Months Ended December 31, | |||||||||||
2013 | 2012 | 2011 | |||||||||
Operating Revenue (1) | $ | 192.5 | $ | 188.2 | $ | 174.6 | |||||
Revenue xFSR(1)(2) | $ | 157.3 | $ | 152.2 | $ | 143.0 | |||||
Operating Ratio | 89.7 | % | 87.3 | % | 87.8 | % | |||||
Adjusted Operating Ratio(3) | 87.4 | % | 84.3 | % | 85.1 | % | |||||
Weekly Revenue xFSR per Tractor | $ | 3,256 | $ | 3,366 | $ | 3,256 | |||||
Average Operational Truck Count | 3,675 | 3,439 | 3,343 | ||||||||
1 In millions | |||||||||||
2 Revenue xFSR is operating revenue, excluding fuel surcharge revenue | |||||||||||
3 See GAAP to Non-GAAP reconciliation in the schedules following this letter | |||||||||||
Dedicated Revenue xFSR grew 3.4% in the fourth quarter of 2013, compared to the fourth quarter of 2012. During 2013, we were awarded several new dedicated contracts utilizing approximately 250 trucks that started operations in the last four months of the year. Although these start-ups had a negative impact on our Adjusted Operating Ratio and our Weekly Revenue xFSR per Tractor in the quarter, we are excited about the opportunity these and other upcoming bids may bring us in 2014.
For the fourth quarter of 2013, our Dedicated segment Adjusted Operating Ratio increased to 87.4% in the fourth quarter of 2013 compared to 84.3% in the fourth quarter of the prior year. This increase was primarily due to the start-up costs mentioned above in addition to higher equipment costs, workers compensation expense, and insurance and claims expense.
| 3 | |
Central Refrigerated Segment ("CRS")
Our CRS segment consists primarily of shipments for customers that require temperature-controlled trailers and represents the core operations of Central. These shipments include one-way movements over irregular routes, dedicated truck operations, as well as a small number of Intermodal Trailer on Flat Car ("TOFC") and third party logistics loads.
Three Months Ended December 31, | |||||||||||
2013 | 2012 | 2011 | |||||||||
Operating Revenue (1) | $ | 140.9 | $ | 125.4 | $ | 118.6 | |||||
Revenue xFSR(1)(2) | $ | 115.7 | $ | 98.9 | $ | 93.4 | |||||
Operating Ratio | 95.8 | % | 92.9 | % | 94.2 | % | |||||
Adjusted Operating Ratio(3) | 94.9 | % | 91.0 | % | 92.6 | % | |||||
Weekly Revenue xFSR per Tractor | $ | 3,588 | $ | 3,337 | $ | 3,373 | |||||
Average Operational Truck Count | 2,047 | 1,881 | 1,771 | ||||||||
Deadhead Percentage | 13.6 | % | 13.0 | % | 12.0 | % | |||||
1 In millions | |||||||||||
2 Revenue xFSR is operating revenue, excluding fuel surcharge revenue | |||||||||||
3 See GAAP to Non-GAAP reconciliation in the schedules following this letter | |||||||||||
Revenue xFSR for the fourth quarter of 2013 increased 17.0% to $115.7 million, compared to $98.9 million for the same quarter in 2012. This increase in Revenue xFSR was driven by growth in volume and pricing with our existing customers and the addition of several new customers including a significant new dedicated customer added during the second quarter of 2013. This new dedicated business has a much lower average length of haul, higher deadhead and a much higher Revenue xFSR per loaded mile than the core refrigerated business.
Weekly Revenue xFSR per Tractor grew 7.5% to $3,588 in the fourth quarter 2013, compared to $3,337 in the fourth quarter of 2012. This improvement was due to increased dedicated business as well as utilization improvements in our CRS over the road business.
The Adjusted Operating Ratio in our CRS segment for the fourth quarter 2013 increased 390 basis points over the fourth quarter of 2012. The year over year increase was driven primarily by higher insurance costs and start-up challenges with the large dedicated contract that began in the second quarter of 2013.
Intermodal Segment
Our Intermodal segment includes revenue generated by freight moving over the rail in our containers and other trailing equipment, combined with revenue for drayage to transport loads between the railheads and customer locations.
During the fourth quarter of 2013, Revenue xFSR in our Intermodal segment grew 2.8% over the fourth quarter of 2012. This increase in Revenue xFSR was driven primarily by a 4.9% increase in Container on Flat Car ("COFC") loads partially offset by a 25.5% reduction in TOFC loads.
| 4 | |
Three Months Ended December 31, | |||||||||||
2013 | 2012 | 2011 | |||||||||
Operating Revenue (1) | $ | 98.6 | $ | 97.7 | $ | 72.8 | |||||
Revenue xFSR(1)(2) | $ | 79.0 | $ | 76.8 | $ | 58.0 | |||||
Operating Ratio | 94.8 | % | 100.5 | % | 96.0 | % | |||||
Adjusted Operating Ratio(3) | 93.5 | % | 100.6 | % | 95.0 | % | |||||
Load Counts | 41,782 | 40,862 | 31,452 | ||||||||
Average Container Counts | 8,717 | 8,628 | 5,955 | ||||||||
1 In millions | |||||||||||
2 Revenue xFSR is operating revenue, excluding fuel surcharge revenue | |||||||||||
3 See GAAP to Non-GAAP reconciliation in the schedules following this letter | |||||||||||
Our average container count grew slightly to 8,717 in the fourth quarter of 2013 when compared to the same period in 2012, due to the addition of containers throughout the fourth quarter of 2012. However, our December 31, 2013 year end container count of 8,717 remained essentially unchanged from year end 2012 as we focused on increasing the utilization of our existing fleet in 2013.
For the fourth quarter, the Intermodal Adjusted Operating Ratio improved 710 basis points to 93.5% in 2013 from 100.6% in 2012. As we previously stated, during 2012, our Intermodal segment incurred an increase in its insurance and claims expense primarily related to one claim associated with a drayage accident. This accident increased the the Intermodal Adjusted Operating Ratio by approximately 570 basis points in the fourth quarter of 2012. Additionally, in the fourth quarter of 2013, we settled a 2008 loss year claim, which resulted in an increase of insurance and claims expense in Intermodal of approximately $2 million, or a 240 basis point impact in the Adjusted Operating Ratio. Excluding the impact of the drayage accident in the fourth quarter of 2012 and the settlement of the 2008 claim in the fourth quarter of 2013, our Intermodal Adjusted Operating Ratio improved approximately 380 basis points. This improvement is due primarily to improved utilization of our container and chassis fleets as well as our internal drayage fleet.
Other Revenue
Other Revenue includes revenue generated by our logistics and brokerage services, as well as revenue generated by our subsidiaries offering support services to customers and owner-operators, including shop maintenance, equipment leasing and insurance. In the fourth quarter of 2013, combined revenue from these services increased 10.5% compared to the same quarter in 2012, driven primarily by an increase in logistics revenue and an increase in the services provided to owner operators.
Fourth Quarter Consolidated Operating Expenses
The table below highlights some of our cost categories for the fourth quarter of 2013, compared to the fourth quarter of 2012 and the third quarter of 2013, showing each as a percent of Revenue xFSR. Fuel surcharge revenue can be volatile and is primarily dependent upon the cost of fuel and not specifically related to our non-fuel operational expenses. Therefore, we believe that Revenue xFSR is a better measure for analyzing our expenses and operating metrics.
| 5 | |
YOY | QOQ | |||||||||||||||||||
Q4'13 | Q4'12 | Variance1 | ($ in millions) | Q4'13 | Q3'13 | Variance1 | ||||||||||||||
(recast) | ||||||||||||||||||||
$ | 1,075.4 | $ | 1,047.6 | 2.7 | % | Total Revenue | $ | 1,075.4 | $ | 1,032.1 | 4.2 | % | ||||||||
$ | (196.8 | ) | $ | (209.3 | ) | -6.0 | % | Less: Fuel Surcharge Revenue | $ | (196.8 | ) | $ | (198.7 | ) | -1.0 | % | ||||
878.6 | 838.3 | 4.8 | % | Revenue xFSR | $ | 878.6 | $ | 833.4 | 5.4 | % | ||||||||||
$ | 233.5 | 224.6 | -4.0 | % | Salaries, Wages & Benefits | $ | 233.5 | $ | 220.2 | -6.0 | % | |||||||||
26.6 | % | 26.8 | % | 20 bps | % of Revenue xFSR | 26.6 | % | 26.4 | % | -20 bps | ||||||||||
$ | 82.8 | 74.7 | -10.8 | % | Operating Supplies & Expenses | $ | 82.8 | $ | 85.2 | 2.8 | % | |||||||||
9.4 | % | 8.9 | % | -50 bps | % of Revenue xFSR | 9.4 | % | 10.2 | % | 80 bps | ||||||||||
$ | 41.9 | $ | 28.7 | -46.2 | % | Insurance & Claims | $ | 41.9 | $ | 35.1 | -19.4 | % | ||||||||
4.8 | % | 3.4 | % | -140 bps | % of Revenue xFSR | 4.8 | % | 4.2 | % | -60 bps | ||||||||||
$ | 6.4 | $ | 6.5 | 1.0 | % | Communications & Utilities | $ | 6.4 | $ | 6.7 | 4.5 | % | ||||||||
0.7 | % | 0.8 | % | 10 bps | % of Revenue xFSR | 0.7 | % | 0.8 | % | 10 bps | ||||||||||
$ | 19.1 | $ | 18.2 | -4.8 | % | Operating Taxes & Licenses | $ | 19.1 | $ | 18.6 | -2.7 | % | ||||||||
2.2 | % | 2.2 | % | — | % of Revenue xFSR | 2.2 | % | 2.2 | % | — | ||||||||||
1 Positive numbers represent favorable variances, negative numbers represent unfavorable variances | ||||||||||||||||||||
Salaries, wages and benefits increased $8.9 million to $233.5 million during the fourth quarter of 2013, compared to $224.6 million for the fourth quarter of 2012, but remained relatively consistent as a percentage of Revenue xFSR. The year over year increase is primarily due to an increase in workers compensation expense and an increase in the number of non-driving employees.
Sequentially, salaries, wages and benefits increased by $13.3 million to $233.5 million during the fourth quarter of 2013 compared to $220.2 million in the third quarter of 2013 due primarily to an increase in the full year bonus accrual and an increase in workers compensation expense.
Operating supplies and expenses increased $8.1 million to $82.8 million during the fourth quarter of 2013, compared to $74.7 million for the fourth quarter of 2012, due primarily to increased legal and professional fees related to the Central acquisition, the acquisition of an owner-operator fleet and an aborted equity offering; increased unloading and other miscellaneous expenses due to a significant new flatbed and logistics customer; increased chassis expense due to additional intermodal volume; increased tolls expense; and increased hiring costs.
Sequentially, operating supplies and expenses decreased $2.4 million from $85.2 million in the third quarter to $82.8 million in the fourth quarter. This decrease is due primarily to lower maintenance expenses, partially offset by the increase in expenses noted above.
Insurance and claims expense increased to $41.9 million for the fourth quarter of 2013, compared to $28.7 million in the fourth quarter of 2012. As a percent of Revenue xFSR, insurance and claims expense increased to 4.8% in the
| 6 | |
fourth quarter of 2013 from 3.4% in the prior year. During the fourth quarter of 2013, we experienced unfavorable claims development specifically related to our current year claims, and to a lesser extent on prior year claims
resulting in a negative impact in the quarter. Whereas, in the fourth quarter of 2012, we experienced favorable claims development on claims associated with insurance coverage sold by our captive insurance company. For the full year 2013, insurance and claims expense as a percent of Revenue xFSR was 4.3%. For the full year 2014, we expect our insurance and claims expense to be approximately 4% of Revenue xFSR.
Fuel Expense
Q4'13 | Q4'12 | ($ in millions, except D.O.E. Diesel Fuel Index) | Q4'13 | Q3'13 | ||||||||||
(recast) | ||||||||||||||
$ | 150.4 | $ | 168.1 | Fuel Expense | $ | 150.4 | $ | 160.6 | ||||||
14.0 | % | 16.0 | % | % of Total Revenue | 14.0 | % | 15.6 | % | ||||||
$ | 196.8 | $ | 209.3 | Fuel Surcharge Revenue (FSR) | $ | 196.8 | $ | 198.7 | ||||||
$ | (87.1 | ) | $ | (87.9 | ) | Less: FSR Reimbursed to Third Parties | $ | (87.1 | ) | $ | (85.5 | ) | ||
$ | 109.7 | $ | 121.4 | Company FSR | $ | 109.7 | $ | 113.2 | ||||||
$ | 150.4 | $ | 168.1 | Fuel Expense | $ | 150.4 | $ | 160.6 | ||||||
$ | (109.7 | ) | $ | (121.4 | ) | Less: Company FSR | $ | (109.7 | ) | $ | (113.2 | ) | ||
$ | 40.7 | $ | 46.7 | Net Fuel Expense | $ | 40.7 | $ | 47.4 | ||||||
4.6 | % | 5.6 | % | % of Revenue xFSR | 4.6 | % | 5.7 | % | ||||||
$ | 3.869 | $ | 4.020 | Average D.O.E. Diesel Fuel Index | $ | 3.869 | $ | 3.918 | ||||||
-3.8 | % | 3.9 | % | Year over Year % Change | -3.8 | % | -0.2 | % | ||||||
Fuel expense for the fourth quarter of 2013 was $150.4 million, representing a decrease of $17.7 million from the fourth quarter of 2012. We collect fuel surcharge revenue from our customers to help mitigate increases in fuel prices. The surcharges are primarily based on the Department of Energy (D.O.E.) Diesel Fuel Index, which is set on Monday each week based on retail prices at various truck stops around the country. We utilize a portion of our fuel surcharge revenue to reimburse owner-operators and other third parties, such as the railroads, who also must pay for fuel. To evaluate the effectiveness of our fuel surcharges, we deduct the portion of the revenue we pay to third parties and then subtract the remaining company-related fuel surcharge revenue from our fuel expense. This calculation of Net Fuel Expense is shown above.
During the fourth quarter of 2013 Net Fuel Expense was $40.7 million compared to $46.7 million in the fourth quarter of 2012 and $47.4 million in the third quarter of 2013. Both the year over year and sequential improvement are primarily due to improved fuel economy which has helped to offset some of the higher equipment costs. This combined with a shift in business mix that increased our revenue generated by owner-operators, intermodal and logistics, for which we do not incur fuel expense, drove the decrease in Net Fuel Expense as a percentage of Revenue xFSR.
Purchased Transportation
Purchased transportation includes payments to owner-operators, railroads and other third parties we use for intermodal drayage and other brokered business.
| 7 | |
Q4'13 | Q4'12 | ($ in millions) | Q4'13 | Q3'13 | ||||||||||||
(recast) | ||||||||||||||||
$ | 337.1 | $ | 313.6 | Purchased Transportation | $ | 337.1 | $ | 318.3 | ||||||||
31.3 | % | 29.9 | % | % of Total Revenue | 31.3 | % | 30.8 | % | ||||||||
$ | (87.1 | ) | $ | (87.9 | ) | Less: FSR Reimbursed to Third Parties | $ | (87.1 | ) | $ | (85.5 | ) | ||||
$ | 250.0 | $ | 225.7 | Net Purchased Transportation | $ | 250.0 | $ | 232.8 | ||||||||
28.5 | % | 26.9 | % | % of Revenue xFSR | 28.5 | % | 27.9 | % | ||||||||
As noted in the table above, during the fourth quarter of 2013, excluding fuel reimbursements, Net Purchased Transportation increased $24.3 million year over year due primarily to an increased number of miles driven by owner-operators, increased logistics business and higher intermodal volume. As a percent of Revenue xFSR, Net Purchased Transportation increased in the fourth quarter from 26.9% in 2012 to 28.5% in the fourth quarter of 2013.
Sequentially, Net Purchased Transportation increased $17.2 million due to an increased percentage of miles driven by owner-operators, higher seasonal freight volumes in the fourth quarter 2013 compared to the third quarter 2013 and increased logistics volume. These same factors also caused Net Purchased Transportation as a percent of Revenue xFSR, to increase 60 basis points in the fourth quarter of 2013 from 27.9% in the third quarter of 2013.
Rental Expense and Depreciation & Amortization of Property and Equipment
Due to fluctuations in the amount of tractors leased versus owned, we combine our rental expense with depreciation and amortization of property and equipment for analytical purposes as shown in the table below.
Combined rental and depreciation expense in the fourth quarter of 2013 increased $11.2 million to $106.4 million from the fourth quarter of 2012. This increase is due to the rising costs of new equipment, and growth in the number of tractors, trailers and intermodal containers.
Q4'13 | Q4'12 | ($ in millions) | Q4'13 | Q3'13 | ||||||||||
(recast) | ||||||||||||||
$ | 50.4 | $ | 40.7 | Rental Expense | $ | 50.4 | $ | 46.3 | ||||||
5.7 | % | 4.9 | % | % of Revenue xFSR | 5.7 | % | 5.6 | % | ||||||
$ | 56.0 | $ | 54.5 | Depreciation & Amortization of Property and Equipment | $ | 56.0 | $ | 58.3 | ||||||
6.4 | % | 6.5 | % | % of Revenue xFSR | 6.4 | % | 7.0 | % | ||||||
$ | 106.4 | $ | 95.2 | Combined Rental Expense and Depreciation | $ | 106.4 | $ | 104.5 | ||||||
12.1 | % | 11.4 | % | % of Revenue xFSR | 12.1 | % | 12.5 | % | ||||||
Gain on Disposal of Property and Equipment
Gain on disposal of property and equipment increased $4.6 million in the fourth quarter of 2013 as compared to the fourth quarter of 2012 due primarily to an increase in the number of trucks sold on the open market rather than
| 8 | |
returned to the original manufacturer per trade agreements as well as an increase in the amount of trailer equipment disposed of during the quarter.
Income Taxes
Income tax in accordance with GAAP for the fourth quarter and full year 2013 was $33.2 million (resulting in an effective tax rate of 42.3%) and a provision of $101.0 million (resulting in an effective tax rate of 39.4%), respectively. The higher effective rate in the fourth quarter was primarily due to increased deferred taxes resulting from recently enacted tax rate increases in Mexico. The full year effective tax rate reflects increased taxes due to the new tax rate in Mexico, Central’s conversion to a C-Corporation from an S-Corporation, fixed asset basis differences and state tax rate changes, Central acquisition related costs as well as the benefit realized from Central’s designation as an S-Corporation prior to the acquisition. We expect the 2014 full year effective tax rate, in accordance with GAAP, to be approximately 38.5%.
Interest Expense
Interest expense, comprised of debt interest expense, the amortization of deferred financing costs and original issue discount and excluding derivative interest expense on our interest rate swaps, decreased by $4.7 million in the fourth quarter of 2013 to $23.8 million, compared with $28.5 million for the fourth quarter of 2012. The decrease was largely due to lower interest rates from refinancing our senior credit facility in March of 2013, as well as the continued reduction of our debt balances, which has been an area of focus since our initial public offering in December 2010.
Full Year 2013 Results by Reportable Segments
A summary of our full year 2013 revenue trends and key metrics for our individual segments are as follows:
Truckload Segment
Year Ended December 31, | |||||||||||
2013 | 2012 | 2011 | |||||||||
Operating Revenue (1) | $ | 2,313.0 | $ | 2,282.3 | $ | 2,336.1 | |||||
Revenue xFSR(1)(2) | $ | 1,839.9 | $ | 1,798.7 | $ | 1,844.2 | |||||
Operating Ratio | 90.2 | % | 89.2 | % | 90.5 | % | |||||
Adjusted Operating Ratio(3) | 87.7 | % | 86.3 | % | 87.9 | % | |||||
Weekly Revenue xFSR per Tractor | $ | 3,257 | $ | 3,165 | $ | 2,968 | |||||
Average Operational Truck Count | 10,833 | 10,869 | 11,915 | ||||||||
Deadhead Percentage | 11.6 | % | 11.1 | % | 11.0 | % | |||||
1 In millions | |||||||||||
2 Revenue xFSR is operating revenue, excluding fuel surcharge revenue | |||||||||||
3 See GAAP to Non-GAAP reconciliation in the schedules following this letter | |||||||||||
Our Truckload Revenue xFSR increased 2.3% during 2013, while our Average Operational Truck Count decreased slightly to 10,833. Our Revenue xFSR improvement was driven by a 2.9% improvement in Weekly Revenue xFSR per Tractor that consisted of a 0.8% improvement in loaded miles per truck per week and a 2.1% increase in Revenue xFSR per loaded mile.
| 9 | |
For the full year 2013, the deadhead percentage in our Truckload segment increased 50 basis points as operational improvements were offset by a softer freight environment in the third quarter of 2013 when compared with 2012, and increased project business in the fourth quarter of 2013 versus 2012. Although this seasonal project business carries a higher deadhead percent, it is also designed to carry a higher revenue per loaded mile to compensate.
In our Truckload segment, the Adjusted Operating Ratio increased 140 basis points to 87.7% in 2013, compared with 86.3% in 2012. The increase in the Adjusted Operating Ratio was driven primarily by increased insurance costs, higher equipment costs, higher deadhead costs, and a $5.2 million favorable settlement with the Port of Los Angeles in the first quarter of 2012. These increases were partially offset by improved Revenue xFSR per loaded mile, increased loaded miles per truck per week, and improved fuel economy.
For the full year 2014, we expect an improving freight environment compared to what we experienced in 2013. Although we expect the new Hours of Service rules to be a headwind to our loaded miles per truck per week through the first half of the year, we are still expecting year over year improvements. We anticipate the improvements will be tempered in the first half before accelerating in the second half of 2014. We expect Revenue xFSR per loaded mile to increase between 2.0% and 3.0%, depending on the macro economic environment, and we expect our tractor count to increase over the course of the year by approximately 150-200 trucks.
Dedicated Segment
Dedicated Revenue xFSR increased 1.9% during 2013, largely due to the addition of several accounts in the late third quarter and into the fourth quarter of 2013. This new account growth is also reflected in our Average Operational Truck Count which grew to 3,451 for the full year 2013.
Year Ended December 31, | |||||||||||
2013 | 2012 | 2011 | |||||||||
Operating Revenue (1) | $ | 738.9 | $ | 724.4 | $ | 625.3 | |||||
Revenue xFSR(1)(2) | $ | 600.9 | $ | 589.9 | $ | 513.4 | |||||
Operating Ratio | 88.7 | % | 89.8 | % | 88.8 | % | |||||
Adjusted Operating Ratio(3) | 86.1 | % | 87.5 | % | 86.4 | % | |||||
Weekly Revenue xFSR per Tractor | $ | 3,339 | $ | 3,357 | $ | 3,305 | |||||
Average Operational Truck Count | 3,451 | 3,361 | 2,979 | ||||||||
1 In millions | |||||||||||
2 Revenue xFSR is operating revenue, excluding fuel surcharge revenue | |||||||||||
3 See GAAP to Non-GAAP reconciliation in the schedules following this letter | |||||||||||
The Adjusted Operating Ratio in our Dedicated segment improved to 86.1% for the full year 2013 from 87.5% in 2012. This improvement was primarily due to a decision to terminate a few underperforming contracts in the latter half of 2012, growth with improved customer contracts in 2013, and improved fuel efficiency. These improvements were partially offset by increased insurance costs and higher equipment costs.
Central Refrigerated Segment ("CRS")
Revenue xFSR increased 13.1% to $430.1 million in 2013, compared to $380.3 million in 2012. This increase in Revenue xFSR was driven by growth in volume and pricing with our existing customers and the addition of several
| 10 | |
new customers, including a significant new dedicated customer added during the second quarter of 2013. This dedicated business has a much lower average length of haul, higher deadhead and a much higher Revenue xFSR per loaded mile. This business combined with the other revenue growth drove our Weekly Revenue xFSR per Tractor to improve 2.9% over the prior year.
Year Ended December 31, | |||||||||||
2013 | 2012 | 2011 | |||||||||
Operating Revenue (1) | $ | 534.0 | $ | 484.7 | $ | 447.2 | |||||
Revenue xFSR(1)(2) | $ | 430.1 | $ | 380.3 | $ | 351.1 | |||||
Operating Ratio | 95.2 | % | 93.9 | % | 96.4 | % | |||||
Adjusted Operating Ratio(3) | 93.8 | % | 92.2 | % | 95.4 | % | |||||
Weekly Revenue xFSR per Tractor | $ | 3,427 | $ | 3,331 | $ | 3,249 | |||||
Average Operational Truck Count | 2,006 | 1,839 | 1,760 | ||||||||
Deadhead Percentage | 13.1 | % | 12.6 | % | 12.1 | % | |||||
1 In millions | |||||||||||
2 Revenue xFSR is operating revenue, excluding fuel surcharge revenue | |||||||||||
3 See GAAP to Non-GAAP reconciliation in the schedules following this letter | |||||||||||
The 2013 Adjusted Operating Ratio in our CRS segment increased 160 basis points over the prior year. The year over year increase was driven primarily by new dedicated start up costs and higher insurance expense.
For 2014 we expect our CRS segment to be a focal point. We will be targeting truck count growth of approximately 200 units over the course of the year. Additionally, we plan to integrate our systems on February 1, 2014. We believe this integration will be the catalyst for many of the expected acquisition-related synergies we identified. At that point, we will also re-evaluate our segment reporting structure to ensure the most transparent and consistent reporting format with how management operates the company.
Intermodal Segment
Our intermodal business grew Revenue xFSR 5.5% to $277.7 million in 2013 from $263.2 million in 2012 driven by a 0.9% increase in Revenue xFSR per load, and a 11.6% increase in COFC load volume partially offset by a 43.6% reduction in TOFC volume.
Our focus for 2013 was to increase the utilization of our existing container fleet before adding additional capacity. As such, we did not add any containers to our fleet in 2013, however our full year average container count grew by 1,508 as containers were added throughout 2012. During the fourth quarter of 2013, we were able to generate higher container turns on a year over year basis. We believe we have further opportunity to improve the utilization of this fleet in 2014 and hope to grow our volume by 10-20% without adding containers. We will monitor our volume growth in 2014 and will add containers in the latter half of the year if necessary.
| 11 | |
Year Ended December 31, | |||||||||||
2013 | 2012 | 2011 | |||||||||
Operating Revenue (1) | $ | 350.1 | $ | 333.9 | $ | 237.9 | |||||
Revenue xFSR(1)(2) | $ | 277.7 | $ | 263.2 | $ | 187.7 | |||||
Operating Ratio | 98.3 | % | 102.1 | % | 98.7 | % | |||||
Adjusted Operating Ratio(3) | 97.8 | % | 102.6 | % | 98.3 | % | |||||
Load Counts | 151,781 | 145,144 | 106,419 | ||||||||
Average Container Counts | 8,717 | 7,209 | 5,527 | ||||||||
1 In millions | |||||||||||
2 Revenue xFSR is operating revenue, excluding fuel surcharge revenue | |||||||||||
3 See GAAP to Non-GAAP reconciliation in the schedules following this letter | |||||||||||
The Intermodal Adjusted Operating Ratio for the full year improved 480 basis points to 97.8% in 2013 from 102.6% in 2012. As we previously stated, during 2012, our Intermodal segment incurred an increase in its insurance and claims expense primarily related to one claim associated with a drayage accident. This accident increased the Intermodal Adjusted Operating Ratio by approximately 380 basis points in 2012. Additionally, as noted above, in the fourth quarter of 2013, we settled a 2008 loss year claim , which resulted in an increase of insurance and claims expense in the Intermodal segment of approximately $2 million, or a 70 basis point increase in Adjusted Operating Ratio on a full year basis. Excluding the impact of the drayage accident in 2012 and the settlement of the 2008 claim in the fourth quarter of 2013, our Intermodal Adjusted Operating Ratio improved in 2013 approximately 160 basis points. This improvement is due primarily to our focus on improving the utilization of our containers, reducing our chassis costs, improving our rail economics, as well as improving the efficiency of our drayage operations.
Other Revenue
Revenue from other services includes revenue generated by brokerage services, and revenue generated by our subsidiaries offering support services to customers and owner-operators, including shop maintenance, equipment leasing, and insurance. For the full year 2013, revenue from these services increased 6.3% compared to the full year 2012, driven primarily by increased services to owner-operators.
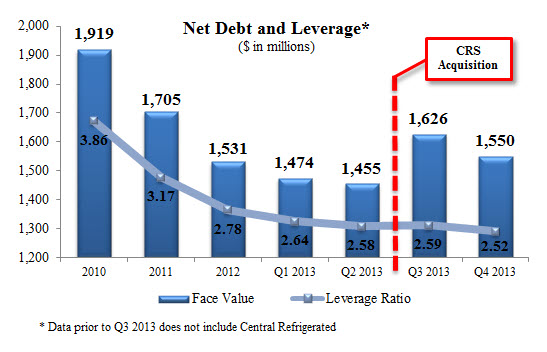
Debt Balances
As noted in the chart below, our net debt as of December 31, 2013 was $1,549.8 million, compared to $1,530.7 million at the end of 2012. The $19.1 million increase in our net debt for the full year is comprised of a reduction in net debt for the year of $206.7 million, offset by an increase of $225.8 associated with the Central acquisition. During the fourth quarter, we reduced our net debt by $75.9 million. As a result of our prior voluntary prepayments, our next required principal payment on our Term Loan B-1 is March 31, 2015, and we have no additional required principal payments on our Term Loan B-2 until its maturity in December of 2017.
| 12 | |
December 31, 2012 | Central Acquisition | Other Full Year | December 31, 2013 | |||||||||||||
($ in millions) | Actuals | Changes | Changes | Actuals | ||||||||||||
Unrestricted Cash | $ | 53.6 | $ | (4.7 | ) | $ | 10.3 | $ | 59.2 | |||||||
A/R Securitization | $ | 204.0 | $ | 100.0 | $ | (40.0 | ) | $ | 264.0 | |||||||
Revolver ($400mm) | $ | — | $ | 85.0 | $ | (68.0 | ) | $ | 17.0 | |||||||
Term Loan B-1(a) | $ | 157.5 | $ | 71.5 | $ | 229.0 | ||||||||||
Term Loan B-2(a) | $ | 577.0 | $ | (167.0 | ) | $ | 410.0 | |||||||||
Senior Secured 2nd Lien Notes (a) | $ | 500.0 | $ | — | $ | 500.0 | ||||||||||
Capital Leases & Other Debt | $ | 145.8 | $ | 36.1 | $ | 7.1 | $ | 189.0 | ||||||||
Total Debt | $ | 1,584.3 | $ | 221.1 | $ | (196.4 | ) | $ | 1,609.0 | |||||||
Net Debt | $ | 1,530.7 | $ | 225.8 | $ | (206.7 | ) | $ | 1,549.8 | |||||||
(a) Amounts presented represent face value and exclude unamortized discount | ||||||||||||||||
As a result of the debt repayments in the fourth quarter, we were able to reduce our leverage ratio to 2.52 as of December 31, 2013. As we have stated previously, our goal is to continue to reduce our leverage ratio through EBITDA growth and debt repayments.
Cash Flow and Capital Expenditures
We continue to generate positive cash flows from operations. For the full year 2013, we generated $452.9 million of cash from operations compared with $447.1 million during the same period of 2012. Cash used in financing activities for the year ended December 31, 2013 was $156.2 million, driven primarily by the voluntary repayments of our debt.
Our Net Cash Capital Expenditures for 2013 were $199.1 million compared with $171.4 million during the previous year. For the full year of 2014, we expect our net cash capital expenditures to be in the range of $220 to $250 million.
| 13 | |
Liquidity Summary
Our liquidity position at December 31, 2013 remains strong with total available liquidity of $447.1 million, including $59.2 million of unrestricted cash and $76.6 million of restricted cash and investments in our captive insurance companies that are reserved for the future payment of outstanding claims.
Summary
In summary, we have been very pleased with our team's ability to deliver on our goals and objectives. Some of the key highlights for 2013 include: exceeding our long-term goals for growth in Adjusted EPS for the second consecutive year; remaining on-track to achieve our long-term goal of reducing our leverage ratio to 1.5 times by 2017 despite the $225 million Central acquisition; continuing to improve our return on net assets; investing for growth in rapidly expanding Intermodal, logistics and refrigerated lines of business; partnering with customers to create win/win solutions that are driving growth in our dedicated business; improving our Truckload utilization year over year despite the challenges posed by the Hours of Service regulations; laying the foundation for improvement in our Intermodal Adjusted Operating Ratio by focusing on the cost objectives outlined at our Investor Day this past May; investing in clean technology with an order of 200 CNG trucks; and diligently working through the integration of Central including preparation for the systems integration in February, which we believe will be the catalyst for synergies throughout 2014.
Despite these many accomplishments, we did experience some disappointments in 2013 including a less than ideal macro economic environment, a negative impact on our utilization in the second half of the year associated with Hour of Service regulatory changes, and discouraging safety and claims trends. Some of these items were outside of our control. Others were not and we are taking action. We have realigned our operations to provide focus and additional communication with our drivers. We want to help them be successful, productive and promote safe behaviors.
Our organizational focus for 2014 is a three-pronged approach to "Delivering a better lifeSM". First, we want to deliver a better life to our employees and especially our drivers. We have various strategic teams centered around improving our interactions and service to our drivers at each of the key touch points we have with them throughout the day. Second, we aim to deliver a better life for our customers by providing Best in Class service and partnering to create solutions for all of their transportation needs. Finally, we aim to deliver a better life for you, our stockholders, by executing upon our stated goals and driving value in our stock. If you owned our stock throughout 2013, you experienced the very value we are striving to deliver, realizing a 142% return for the year. We appreciate your continued support, and the trust you extend to us, which we hope to continue to earn year after year.

| 14 | |
Guidance
• | Gain on sale of equipment expected to be approximately $8 million for the full year 2014, and approximately $2.0 million in the first quarter |
• | Estimated truck growth by segment for 2014: Dedicated ~350-400, Truckload ~150-200, Central ~200 |
• | Truckload Revenue xFSR per loaded mile anticipated to increase by ~2.0 - 3.0% |
• | Intermodal Revenue xFSR growth expected to be ~ 15% |
• | Insurance and claims expense as a percent of Revenue xFSR in 2014 expected to be ~4.0% |
• | Cash taxes for 2014 expected to be similar to GAAP taxes as federal NOLs have been fully utilized |
• | Net cash capital expenditures expected to be in the range of $220 million to $250 million for full year 2014, depending on growth |
• | Debt reduction expected to be at the high end of our previously disclosed annual range of $50-100 million |
• | 15% Adjusted EPS growth target for 2014 will be based on full year recast Adjusted EPS of $1.23, with a smaller expected YOY growth rate in the first half of the year, and a larger YOY growth rate in the second half of the year, equating to approximately 15% for the full year |
| 15 | |
Conference Call Q&A Session
Swift Transportation management will host a Q&A session at 10:00 a.m. Eastern Standard Time on Tuesday, January 28th to answer questions about the Company’s fourth quarter financial results. Please email your questions to Investor_Relations@swifttrans.com prior to 7:00 p.m. Eastern Standard Time on Monday, January 27th.
Participants may access the call using the following dial-in numbers:
U.S./Canada: (877) 897-8479
International/Local: (706) 501-7951
Conference ID: 33277930
The live webcast, letter to stockholders, transcript of the Q&A, and the replay of the earnings Q&A session can be accessed via our investor relations website at investor.swifttrans.com.
IR Contact:
Jason Bates
Vice President of Finance &
Investor Relations Officer
623.907.7335
Forward Looking Statements & Use of Non-GAAP Measures
This letter contains statements that may constitute forward-looking statements, which are based on information currently available, usually identified by words such as "anticipates," "believes," "estimates", "plans,” "projects," "expects," “hopes,” “intends,” “will,” “could,” “should,” “may,” or similar expressions which speak only as of the date the statement was made. Such forward-looking statements are made pursuant to the safe harbor provisions of the Private Securities Litigation Reform Act of 1995. Such statements include, but are not limited to, statements concerning: trends and expectations relating to our operations and growth in certain business segments, the freight environment, freight volumes, leverage, utilization, revenue, cash flow, Revenue xFSR per loaded mile, Intermodal Revenue xFSR growth, bid opportunities, expenses, taxes, profitability and related metrics; expected reduction in Net Debt and leverage ratio in 2014; projected EPS growth; the timing and level of fleet size and equipment and container count; changes in Truckload and Dedicated tractor count; expected insurance claims expense as a percentage of Revenue xFSR; our expected effective tax rate; estimated capital expenditures for 2014; our expectations of intermodal growth in revenue, utilization, and improved Adjusted Operating Ratio; the benefits of, and our ability to overcome challenges relating to, recently awarded dedicated contracts; that we can grow intermodal volumes without increasing our container count; impact of the Hours of Service regulation; clean technology; expected gain on sale of equipment in 2014; and our intentions to use excess cash flows to repay debt. Such forward-looking statements are inherently uncertain, and are based upon the current beliefs, assumptions and expectations of Company management and current market conditions, which are subject to significant risks and uncertainties as set forth in the Risk Factor Section of our Annual Report Form 10-K for the year ended December 31, 2012. As to the Company’s business and financial performance, the following factors, among others, could cause actual results to differ materially from those in forward-looking statements: any future recessionary economic cycles and downturns in customers' business cycles, particularly in market segments and industries in which we have a significant concentration of customers; increasing competition from trucking, rail, intermodal, and brokerage competitors; a significant reduction in, or termination of, our trucking services by a key customer; a significant reduction in, or termination of, our trucking services by a key customer; the amount and velocity of changes in fuel prices and our ability to recover fuel prices through our fuel surcharge program; volatility in the price or availability of fuel; increases in new equipment prices or replacement costs; the regulatory environment in which we operate, including existing regulations and changes in existing regulations, or violations by us of existing or future regulations; our Compliance Safety Accountability safety rating; increases in driver compensation to the extent not offset by increases in freight rates and difficulties in driver recruitment and retention; changes in rules or legislation by the National Labor Relations Board or Congress and/or union organizing efforts; potential volatility or decrease in the amount of earnings as a result of our claims exposure through our wholly-owned captive insurance companies; risks relating to our captive insurance companies; uncertainties associated with our operations in Mexico; our ability to attract and
| 16 | |
maintain relationships with owner-operators; the possible re-classification of our owner-operators as employees; our ability to retain or replace key personnel; conflicts of interest or potential litigation that may arise from other businesses owned by Jerry Moyes, including margin pledges or other collateralization of Swift stock and guarantees related to other businesses owned by Jerry Moyes; our dependence on third parties for intermodal and brokerage business; our ability to sustain cost savings realized as part of recent cost reduction initiatives; potential failure in computer or communications systems; our ability to execute or integrate any future acquisitions successfully; seasonal factors such as harsh weather conditions that increase operating costs; goodwill impairment; the potential impact of the significant number of shares of our common stock that is outstanding; our intention to not pay dividends; demand; our significant ongoing capital requirements; our level of indebtedness and our ability to service our outstanding indebtedness, including compliance with our debt covenants, and the impact such indebtedness may have on the way we operate our business; the significant amount of our stock and related control over the Company by Jerry Moyes; and restrictions contained in our debt agreements. You should understand that many important factors, in addition to those listed above and in our filings with the SEC, could impact us financially. As a result of these and other factors, actual results may differ from those set forth in the forward-looking statements and the prices of the Company's securities may fluctuate dramatically. The Company makes no commitment, and disclaims any duty, to update or revise any forward-looking statements to reflect future events, new information or changes in these expectations. In addition to our GAAP results, this Letter to Stockholders also includes certain non-GAAP financial measures as defined by the SEC. The calculation of each measure, including reconciliation to the most closely related GAAP measure and the reasons management believes each non-GAAP measure is useful, are included in the attached schedules.
| 17 | |
CONSOLIDATED STATEMENTS OF OPERATIONS (UNAUDITED) (a)
THREE MONTHS AND YEARS ENDED DECEMBER 31, 2013, 2012 AND 2011
Three Months Ended December 31, | Year Ended December 31, | ||||||||||||||||||||||
2013 | 2012 | 2011 | 2013 | 2012 | 2011 | ||||||||||||||||||
(recast) | (recast) | (recast) | (recast) | ||||||||||||||||||||
(Unaudited) (Amounts in thousands, except per share data) | |||||||||||||||||||||||
Operating revenue | $ | 1,075,389 | $ | 1,047,560 | $ | 978,889 | $ | 4,118,195 | $ | 3,976,085 | $ | 3,778,963 | |||||||||||
Operating expenses: | |||||||||||||||||||||||
Salaries, wages and employee benefits | 233,497 | 224,556 | 213,473 | 903,990 | 879,856 | 861,423 | |||||||||||||||||
Operating supplies and expenses | 82,756 | 74,695 | 71,313 | 319,023 | 290,472 | 281,872 | |||||||||||||||||
Fuel | 150,437 | 168,118 | 169,056 | 640,000 | 668,707 | 698,530 | |||||||||||||||||
Purchased transportation | 337,052 | 313,619 | 282,290 | 1,255,646 | 1,195,033 | 1,055,416 | |||||||||||||||||
Rental expense | 50,447 | 40,661 | 30,763 | 180,328 | 149,433 | 122,279 | |||||||||||||||||
Insurance and claims | 41,934 | 28,663 | 26,988 | 142,179 | 121,655 | 110,639 | |||||||||||||||||
Depreciation and amortization of property and equipment | 56,004 | 54,485 | 55,519 | 226,008 | 218,839 | 218,098 | |||||||||||||||||
Amortization of intangibles | 4,203 | 4,204 | 4,405 | 16,814 | 16,925 | 18,258 | |||||||||||||||||
Impairments | — | 2,322 | — | — | 3,387 | — | |||||||||||||||||
Gain on disposal of property and equipment | (9,054 | ) | (4,464 | ) | (2,797 | ) | (22,664 | ) | (18,351 | ) | (8,902 | ) | |||||||||||
Communication and utilities | 6,448 | 6,466 | 6,731 | 25,593 | 26,464 | 27,757 | |||||||||||||||||
Operating taxes and licenses | 19,110 | 18,231 | 17,191 | 74,319 | 71,849 | 71,557 | |||||||||||||||||
Total operating expenses | 972,834 | 931,556 | 874,932 | 3,761,236 | 3,624,269 | 3,456,927 | |||||||||||||||||
Operating income | 102,555 | 116,004 | 103,957 | 356,959 | 351,816 | 322,036 | |||||||||||||||||
Other (income) expenses: | |||||||||||||||||||||||
Interest expense | 23,815 | 28,519 | 36,383 | 99,534 | 122,049 | 149,981 | |||||||||||||||||
Derivative interest expense | 1,293 | — | 2,990 | 3,852 | 5,101 | 15,057 | |||||||||||||||||
Interest income | (733 | ) | (608 | ) | (428 | ) | (2,474 | ) | (2,156 | ) | (1,997 | ) | |||||||||||
Merger and acquisition expense | 582 | — | — | 4,913 | — | — | |||||||||||||||||
Loss on debt extinguishment | — | — | — | 5,540 | 22,219 | — | |||||||||||||||||
Impairments of non-operating assets | — | 5,979 | — | — | 5,979 | — | |||||||||||||||||
Gain on sale of real property | — | — | — | (6,876 | ) | — | — | ||||||||||||||||
Other | (876 | ) | (611 | ) | (522 | ) | (3,934 | ) | (3,077 | ) | (2,244 | ) | |||||||||||
Total other (income) expenses, net | 24,081 | 33,279 | 38,423 | 100,555 | 150,115 | 160,797 | |||||||||||||||||
Income before income taxes | 78,474 | 82,725 | 65,534 | 256,404 | 201,701 | 161,239 | |||||||||||||||||
Income tax expense | 33,176 | 28,041 | 22,895 | 100,982 | 61,614 | 58,492 | |||||||||||||||||
Net income | $ | 45,298 | $ | 54,684 | $ | 42,639 | $ | 155,422 | $ | 140,087 | $ | 102,747 | |||||||||||
Basic earnings per share | $ | 0.32 | $ | 0.39 | $ | 0.31 | $ | 1.11 | $ | 1.00 | $ | 0.74 | |||||||||||
Diluted earnings per share | $ | 0.32 | $ | 0.39 | $ | 0.31 | $ | 1.09 | $ | 1.00 | $ | 0.74 | |||||||||||
Shares used in per share calculations | |||||||||||||||||||||||
Basic | 140,698 | 139,551 | 139,499 | 140,179 | 139,532 | 139,155 | |||||||||||||||||
Diluted | 142,748 | 139,618 | 139,528 | 142,221 | 139,619 | 139,663 | |||||||||||||||||
(a) On August 6, 2013, Swift Transportation Company ("Swift") acquired all the outstanding capital stock of Central Refrigerated Transportation ("Central") in a cash transaction valued at $225 million (the "Acquisition"). Jerry Moyes, the Chief Executive Officer and controlling stockholder of Swift, was the majority shareholder of Central. Given Mr. Moyes' majority ownership in both Swift and Central, the Acquisition is accounted for as a combination of entities under common control which is similar to the pooling of interest method. Under common control accounting, the historical results of Central have been combined with Swift's. The above consolidated statement of operations for the three months and years ended December 31, 2013, 2012 and 2011 reflects the combination of the entities as if the Acquisition was effective January 1, 2011.
| 18 | |
ADJUSTED EPS RECONCILIATION (UNAUDITED) (a)(b)
THREE MONTHS AND YEARS ENDED DECEMBER 31, 2013, 2012 AND 2011
Three Months Ended December 31, | Year Ended December 31, | ||||||||||||||||||||||
2013 | 2012 | 2011 | 2013 | 2012 | 2011 | ||||||||||||||||||
(recast) | (recast) | (recast) | (recast) | ||||||||||||||||||||
Diluted earnings per share | $ | 0.32 | $ | 0.39 | $ | 0.31 | $ | 1.09 | $ | 1.00 | $ | 0.74 | |||||||||||
Adjusted for: | |||||||||||||||||||||||
Income tax expense | 0.23 | 0.20 | 0.16 | 0.71 | 0.44 | 0.42 | |||||||||||||||||
Income before income taxes | 0.55 | 0.59 | 0.47 | 1.80 | 1.44 | 1.15 | |||||||||||||||||
Non-cash impairments (c) | — | 0.02 | — | — | 0.02 | — | |||||||||||||||||
Non-cash impairments of non-operating assets (d) | — | 0.04 | — | — | 0.04 | — | |||||||||||||||||
Loss on debt extinguishment (e) | — | — | — | 0.04 | 0.16 | — | |||||||||||||||||
Amortization of certain intangibles (f) | 0.03 | 0.03 | 0.03 | 0.11 | 0.11 | 0.12 | |||||||||||||||||
Amortization of unrealized losses on interest rate swaps (g) | — | — | 0.02 | — | 0.04 | 0.11 | |||||||||||||||||
Acceleration of non-cash equity compensation (h) | — | — | — | 0.01 | — | — | |||||||||||||||||
Excludable transaction costs (i) | — | — | — | 0.03 | — | — | |||||||||||||||||
Mark-to-market adjustment of interest rate swaps (j) | — | — | — | 0.01 | — | — | |||||||||||||||||
Adjusted income before income taxes | 0.58 | 0.68 | 0.52 | 2.00 | 1.82 | 1.38 | |||||||||||||||||
Provision for income tax expense at effective rate | 0.22 | 0.27 | 0.20 | 0.77 | 0.71 | 0.54 | |||||||||||||||||
Adjusted EPS | $ | 0.36 | $ | 0.41 | $ | 0.32 | $ | 1.23 | $ | 1.11 | $ | 0.84 | |||||||||||
(a) | We define Adjusted EPS as (1) income (loss) before income taxes plus (i) amortization of the intangibles from our 2007 going-private transaction, (ii) non-cash impairments, (iii) other special non-cash items, (iv) excludable transaction costs, (v) the mark-to-market adjustment on our interest rate swaps that is recognized in the statement of operations in a given period, and (vi) the amortization of previous losses recorded in accumulated other comprehensive income (loss) (“OCI”) related to the interest rate swaps we terminated upon our IPO and refinancing transactions in December 2010; (2) reduced by income taxes; (3) divided by weighted average diluted shares outstanding. For all periods through 2012, we used a normalized tax rate of 39% in our Adjusted EPS calculation due to the amortization of deferred tax assets related to our pre-IPO interest rate swap amortization and other items that we knew would cause fluctuations in our GAAP effective tax rate. Beginning in 2013, these items should no longer result in large variations. Therefore, we began using our expected GAAP effective tax rate of 38.5% for our Adjusted EPS calculation. We believe the presentation of financial results excluding the impact of the items noted above provides a consistent basis for comparing our results from period to period and to those of our peers due to the non-comparable nature of the intangibles from our going-private transaction, the historical volatility of the interest rate derivative agreements and the non-operating nature of the impairment charges, transaction costs and other adjustment items. Adjusted EPS is not presented in accordance with GAAP and should be considered in addition to, not as a substitute for, or superior to, measures of financial performance in accordance with GAAP. The numbers reflected in the above table are calculated on a per share basis and may not foot due to rounding. |
(b) | As a result of the Acquisition described in footnote (a) within the schedule Consolidated Statements of Operations (Unaudited) for the three months and years ended December 31, 2013, 2012 and 2011, the above Adjusted EPS Reconciliation reflects the combination of the entities as if the Acquisition was effective on January 1, 2011. |
(c) | In the fourth quarter of 2012, a deposit related to the purchase of certain fuel technology equipment and a related asset were written off as the supplier ceased operations, resulting in a pre-tax impairment of $2.3 million. In the first quarter of 2012, real property with a carrying amount of $1.7 million was written down to its fair value of $0.6 million, resulting in a pre-tax impairment charge of $1.1 million. |
(d) | Swift Power Services, LLC ("SPS"), an entity in which we own a minority interest and hold a secured promissory note from, failed to make its first scheduled principal payment and quarterly interest payment to us on December 31, 2012 due to a decline in its financial performance resulting from a legal dispute with the former owners and its primary customer. This caused us to evaluate the secured promissory note due from SPS for impairment, which resulted in a $6.0 million pre-tax adjustment that was recorded in Impairments of non-operational assets in the fourth quarter of 2012. |
(e) | In association with the Acquisition of Central noted in footnote (b) above, on August 6, 2013, certain debt outstanding under Central was paid-in full and extinguished, resulting in a loss on debt extinguishment of $0.5 million, representing the write-off of the remaining unamortized deferred financing fees. Additionally, on March 7, 2013, the Company entered into a Second Amended and Restated Credit Agreement (“2013 Agreement”). The 2013 Agreement replaced the then-existing first lien term loan B-1 and B-2 tranches under the Amended and Restated Credit Agreement (“2012 Agreement”) entered into on March 6, 2012 with outstanding principal balances of $152.0 million and $508.0 million, respectively, with new first lien term loan B-1 and B-2 tranches with face values of $250.0 million and $410.0 million, respectively. The replacement of the 2012 Agreement resulted in a loss on debt extinguishment of $5.0 million in the first quarter of 2013, representing the write-off of the unamortized original issue discount and deferred financing fees associated with the 2012 Agreement. On May 21, 2012, the Company completed the call of its remaining $15.2 million face value 12.50% fixed rate notes due May 15, 2017, at a price of 106.25% resulting in a loss on debt extinguishment of $1.3 million, representing the call premium and write-off of the remaining unamortized deferred financing fees. The Company entered into the 2012 Agreement on March 6, 2012, which replaced the then-existing, remaining $874 million face value first lien term loan, maturing in December 2016, resulting in a loss on debt extinguishment of $20.9 million in the first quarter of 2012 representing the write-off of the unamortized original issue discount and deferred |
| 19 | |
financing fees associated with the original term loan.
(f) | Amortization of certain intangibles reflects the non-cash amortization expense of $3.9 million, $3.9 million and $4.1 million for the three months ended December 31, 2013, 2012 and 2011, respectively, and $15.6 million, $15.8 million and $17.1 million for the years ended December 31, 2013, 2012 and 2011, respectively, relating to certain intangible assets identified in the 2007 going-private transaction through which Swift Corporation acquired Swift Transportation Co. |
(g) | Amortization of unrealized losses on interest rate swaps reflects the non-cash amortization expense of $3.0 million for the three months ended December 31, 2011, and $5.1 million and $15.1 million for the years ended December 31, 2012 and 2011, respectively, included in derivative interest expense in the consolidated statements of operations and is comprised of previous losses recorded in accumulated OCI related to the interest rate swaps we terminated upon our IPO and concurrent refinancing transactions in December 2010. Such losses were incurred in prior periods when hedge accounting applied to the swaps and are being expensed in relation to the hedged interest payments through the original maturity of the swaps in August 2012. |
(h) | In the third quarter of 2013, Central incurred a $0.9 million one-time non-cash equity compensation charge for certain stock options that accelerated upon the closing of the Acquisition noted above in footnote (b). |
(i) | As a result of the Acquisition of Central noted above in footnote (b), both Swift and Central incurred certain transactional related expenses, including financial advisory, severance and other professional fees, related to the Acquisition totaling approximately $4.9 million for the year ended December 31, 2013. |
(j) | Mark-to-market adjustment of interest rate swaps reflects the portion of the change in fair value of these financial instruments that was recorded in earnings in each period indicated and excludes the portion recorded in accumulated OCI under cash flow hedge accounting. |
| 20 | |
ADJUSTED OPERATING INCOME AND OPERATING RATIO RECONCILIATION (UNAUDITED) (a)(b)
THREE MONTHS AND YEARS ENDED DECEMBER 31, 2013, 2012 AND 2011
Three Months Ended December 31, | Year Ended December 31, | ||||||||||||||||||||||
2013 | 2012 | 2011 | 2013 | 2012 | 2011 | ||||||||||||||||||
(recast) | (recast) | (recast) | (recast) | ||||||||||||||||||||
(Dollars in thousands) | |||||||||||||||||||||||
Operating revenue | $ | 1,075,389 | $ | 1,047,560 | $ | 978,889 | $ | 4,118,195 | $ | 3,976,085 | $ | 3,778,963 | |||||||||||
Less: Fuel surcharge revenue | 196,754 | 209,249 | 190,627 | 791,481 | 794,514 | 750,203 | |||||||||||||||||
Revenue xFSR | 878,635 | 838,311 | 788,262 | 3,326,714 | 3,181,571 | 3,028,760 | |||||||||||||||||
Operating expense | 972,834 | 931,556 | 874,932 | 3,761,236 | 3,624,269 | 3,456,927 | |||||||||||||||||
Adjusted for: | |||||||||||||||||||||||
Fuel surcharge revenue | (196,754 | ) | (209,249 | ) | (190,627 | ) | (791,481 | ) | (794,514 | ) | (750,203 | ) | |||||||||||
Amortization of certain intangibles (c) | (3,912 | ) | (3,912 | ) | (4,113 | ) | (15,648 | ) | (15,758 | ) | (17,092 | ) | |||||||||||
Non-cash impairments (d) | — | (2,322 | ) | — | — | (3,387 | ) | — | |||||||||||||||
Acceleration of non-cash equity compensation (e) | — | — | — | (887 | ) | — | — | ||||||||||||||||
Adjusted operating expense | 772,168 | 716,073 | 680,192 | 2,953,220 | 2,810,610 | 2,689,632 | |||||||||||||||||
Adjusted operating income | $ | 106,467 | $ | 122,238 | $ | 108,070 | $ | 373,494 | $ | 370,961 | $ | 339,128 | |||||||||||
Adjusted Operating Ratio | 87.9 | % | 85.4 | % | 86.3 | % | 88.8 | % | 88.3 | % | 88.8 | % | |||||||||||
Operating Ratio | 90.5 | % | 88.9 | % | 89.4 | % | 91.3 | % | 91.2 | % | 91.5 | % | |||||||||||
(a) | We define Adjusted Operating Ratio as (a) total operating expenses, less (i) fuel surcharges, (ii) amortization of the intangibles from our 2007 going-private transaction, (iii) non-cash impairment charges, (iv) other special non-cash items, and (v) excludable transaction costs, as a percentage of (b) total revenue excluding fuel surcharge revenue (revenue xFSR). We believe fuel surcharge is sometimes volatile and eliminating the impact of this source of revenue (by netting fuel surcharge revenue against fuel expense) affords a more consistent basis for comparing our results of operations. We also believe excluding impairments, non-comparable nature of the intangibles from our going-private transaction and other special items enhances the comparability of our performance from period to period. Adjusted Operating Ratio is not a recognized measure under GAAP. Adjusted Operating Ratio should be considered in addition to, not as a substitute for, or superior to, measures of financial performance in accordance with GAAP. |
(b) | As a result of the Acquisition described in footnote (a) within the schedule Consolidated Statements of Operations (Unaudited) for the three months and years ended December 31, 2013, 2012 and 2011, the above Adjusted Operating Income and Operating Ratio reconciliation for the three months and years ended December 31, 2013, 2012 and 2011 reflects the combination of the entities as if the Acquisition was effective January 1, 2011. |
(c) | Amortization of certain intangibles reflects the non-cash amortization expense relating to certain intangible assets identified in the 2007 going-private transaction through which Swift Corporation acquired Swift Transportation Co. |
(d) | In the fourth quarter of 2012, a deposit related to the purchase of certain fuel technology equipment and a related asset were written off as the supplier ceased operations, resulting in a pre-tax impairment of $2.3 million. In the first quarter of 2012, real property with a carrying amount of $1.7 million was written down to its fair value of $0.6 million, resulting in a pre-tax impairment charge of $1.1 million. |
(e) | In the third quarter of 2013, Central incurred a $0.9 million one-time non-cash-equity compensation charge for certain stock options that accelerated upon the closing of the Acquisition noted above in footnote (b). |
| 21 | |
ADJUSTED EARNINGS BEFORE INTEREST, TAXES, DEPRECIATION
AND AMORTIZATION (UNAUDITED) (a)(b)
THREE MONTHS AND YEARS ENDED DECEMBER 31, 2013, 2012 AND 2011
Three Months Ended December 31, | Year Ended December 31, | |||||||||||||||||||||||
2013 | 2012 | 2011 | 2013 | 2012 | 2011 | |||||||||||||||||||
(recast) | (recast) | (recast) | (recast) | |||||||||||||||||||||
(Amounts in thousands) | ||||||||||||||||||||||||
Net income | $ | 45,298 | $ | 54,684 | $ | 42,639 | $ | 155,422 | $ | 140,087 | $ | 102,747 | ||||||||||||
Adjusted for: | ||||||||||||||||||||||||
Depreciation and amortization of property and equipment | 56,004 | 54,485 | 55,519 | 226,008 | 218,839 | 218,098 | ||||||||||||||||||
Amortization of intangibles | 4,203 | 4,204 | 4,405 | 16,814 | 16,925 | 18,258 | ||||||||||||||||||
Interest expense | 23,815 | 28,519 | 36,383 | 99,534 | 122,049 | 149,981 | ||||||||||||||||||
Derivative interest expense | 1,293 | — | 2,990 | 3,852 | 5,101 | 15,057 | ||||||||||||||||||
Interest income | (733 | ) | (608 | ) | (428 | ) | (2,474 | ) | (2,156 | ) | (1,997 | ) | ||||||||||||
Income tax expense | 33,176 | 28,041 | 22,895 | 100,982 | 61,614 | 58,492 | ||||||||||||||||||
Earnings before interest, taxes, depreciation and amortization (EBITDA) | 163,056 | 169,325 | 164,403 | 600,138 | 562,459 | 560,636 | ||||||||||||||||||
Non-cash equity compensation (c) | 1,180 | 575 | 1,326 | 4,645 | 4,890 | 7,001 | ||||||||||||||||||
Loss on debt extinguishment (d) | — | — | — | 5,540 | 22,219 | — | ||||||||||||||||||
Non-cash impairments (e) | — | 2,322 | — | — | 3,387 | — | ||||||||||||||||||
Excludable transaction costs (f) | 582 | — | — | 4,913 | — | — | ||||||||||||||||||
Non-cash impairments of non-operating assets (g) | — | 5,979 | — | — | — | 5,979 | — | |||||||||||||||||
Adjusted earnings before interest, taxes, depreciation and amortization (Adjusted EBITDA) | $ | 164,818 | $ | 178,201 | $ | 165,729 | $ | 615,236 | $ | 598,934 | $ | 567,637 | ||||||||||||
(a) | We define Adjusted EBITDA as net income (loss) plus (i) depreciation and amortization, (ii) interest and derivative interest expense, including other fees and charges associated with indebtedness, net of interest income, (iii) income taxes, (iv) non-cash equity compensation expense, (v) non-cash impairments, (vi) other special non-cash items, and (vii) excludable transaction costs. We believe that Adjusted EBITDA is a relevant measure for estimating the cash generated by our operations that would be available to cover capital expenditures, taxes, interest and other investments and that it enhances an investor’s understanding of our financial performance. We use Adjusted EBITDA for business planning purposes and in measuring our performance relative to that of our competitors. Our method of computing Adjusted EBITDA is consistent with that used in our senior secured credit agreement for covenant compliance purposes and may differ from similarly titled measures of other companies. Adjusted EBITDA is not a recognized measure under GAAP. Adjusted EBITDA should be considered in addition to, not as a substitute for or superior to, net income, cash flow from operations, operating income or any other performance measures derived in accordance with GAAP as measures of operating performance or operating cash flows as a measure of liquidity. |
(b) | As a result of the Acquisition described in footnote (a) within the schedule Consolidated Statement of Operations (Unaudited) for the three months and years ended December 31, 2013, 2012 and 2011, the above Adjusted Earnings Before Interest, Taxes, Depreciation and Amortization reconciliation for the three months and year ended December 31, 2013, 2012 and 2011 reflects the combination of the entities as if the Acquisition was effective January 1, 2011. |
(c) | Represents recurring non-cash equity compensation expense following our IPO, on a pre-tax basis. In addition to the recurring non-cash equity compensation expense, in the third quarter of 2013, Central incurred a $0.9 million one-time non-cash equity compensation charge for certain options that accelerated upon the closing of the Acquisition noted above in footnote (b). In accordance with the terms of our senior credit agreement, this expense is added back in the calculation of Adjusted EBITDA for covenant compliance purposes. |
| 22 | |
(d) | In association with the Acquisition of Central noted in footnote (b) above, on August 6, 2013, certain debt outstanding under Central was paid-in full and extinguished, resulting in a loss on debt extinguishment of $0.5 million, representing the write-off of the remaining unamortized deferred financing fees. Additionally, on March 7, 2013, the Company entered into a Second Amended and Restated Credit Agreement (“2013 Agreement”). The 2013 Agreement replaced the then-existing first lien term loan B-1 and B-2 tranches under the Amended and Restated Credit Agreement (“2012 Agreement”) entered into on March 6, 2012 with outstanding principal balances of $152.0 million and $508.0 million, respectively, with new first lien term loan B-1 and B-2 tranches with face values of $250.0 million and $410.0 million, respectively. The replacement of the 2012 Agreement resulted in a loss on debt extinguishment of $5.0 million in the first quarter of 2013, representing the write-off of the unamortized original issue discount and deferred financing fees associated with the 2012 Agreement. On May 21, 2012, the Company completed the call of its remaining $15.2 million face value 12.50% fixed rate notes due May 15, 2017, at a price of 106.25% of face value pursuant to the terms of the indenture governing the notes, resulting in a loss on debt extinguishment of $1.3 million, representing the call premium and write-off of the remaining unamortized deferred financing fees. The Company entered into the 2012 Agreement on March 6, 2012, which replaced the then-existing, remaining $874 million face value first lien term loan, maturing in December 2016, resulting in a loss on debt extinguishment of $20.9 million in the first quarter of 2012 representing the write-off of the unamortized original issue discount and deferred financing fees associated with the original term loan. |
(e) | In the fourth quarter of 2012, a deposit related to the purchase of certain fuel technology equipment and a related asset were written off as the supplier ceased operations, resulting in a pre-tax impairment of $2.3 million. In the first quarter of 2012, real property with a carrying amount of $1.7 million was written down to its fair value of $0.6 million, resulting in a pre-tax impairment charge of $1.1 million. |
(f) | As a result of the Acquisition of Central noted above in footnote (b), both Swift and Central incurred transaction related expenses, including financial advisory, severance and other professional fees, related to the Acquisition. |
(g) | Swift Power Services, LLC ("SPS"), an entity in which we own a minority interest and hold a secured promissory note from, failed to make its first scheduled principal payment and quarterly interest payment to us on December 31, 2012 due to a decline in its financial performance resulting from a legal dispute with the former owners and its primary customer. This caused us to evaluate the secured promissory note due from SPS for impairment, which resulted in a $6.0 million pre-tax adjustment that was recorded in Impairments of non-operational assets in the fourth quarter of 2012. |
| 23 | |
FINANCIAL INFORMATION BY SEGMENT (UNAUDITED) (a)
THREE MONTHS AND YEARS ENDED DECEMBER 31, 2013, 2012 AND 2011
Three Months Ended December 31, | Year Ended December 31, | ||||||||||||||||||||||
2013 | 2012 | 2011 | 2013 | 2012 | 2011 | ||||||||||||||||||
(recast) | (recast) | (recast) | (recast) | ||||||||||||||||||||
(Dollars in thousands) | |||||||||||||||||||||||
Operating revenue: | |||||||||||||||||||||||
Truckload | $ | 585,222 | $ | 591,100 | $ | 573,198 | $ | 2,313,035 | $ | 2,282,342 | $ | 2,336,056 | |||||||||||
Dedicated | 192,502 | 188,150 | 174,636 | 738,929 | 724,405 | 625,268 | |||||||||||||||||
Central Refrigerated | 140,899 | 125,444 | 118,614 | 533,993 | 484,657 | 447,173 | |||||||||||||||||
Intermodal | 98,634 | 97,710 | 72,830 | 350,093 | 333,938 | 237,875 | |||||||||||||||||
Subtotal | 1,017,257 | 1,002,404 | 939,278 | 3,936,050 | 3,825,342 | 3,646,372 | |||||||||||||||||
Nonreportable segments (b) | 64,964 | 58,791 | 53,602 | 224,425 | 211,112 | 192,987 | |||||||||||||||||
Intersegment eliminations | (6,832 | ) | (13,635 | ) | (13,991 | ) | (42,280 | ) | (60,369 | ) | (60,396 | ) | |||||||||||
Consolidated operating revenue | $ | 1,075,389 | $ | 1,047,560 | $ | 978,889 | $ | 4,118,195 | $ | 3,976,085 | $ | 3,778,963 | |||||||||||
Operating income (loss): | |||||||||||||||||||||||
Truckload | $ | 60,893 | $ | 77,639 | $ | 68,295 | $ | 225,963 | $ | 246,005 | $ | 222,954 | |||||||||||
Dedicated | 19,795 | 23,922 | 21,292 | 83,520 | 74,026 | 69,753 | |||||||||||||||||
Central Refrigerated | 5,940 | 8,894 | 6,937 | 25,821 | 29,770 | 16,023 | |||||||||||||||||
Intermodal | 5,096 | (445 | ) | (c) | 2,877 | 6,030 | (6,854 | ) | (c) | 3,146 | |||||||||||||
Subtotal | 91,724 | 110,010 | 99,401 | 341,334 | 342,947 | 311,876 | |||||||||||||||||
Nonreportable segments (b) | 10,831 | 5,994 | 4,556 | 15,625 | 8,869 | 10,160 | |||||||||||||||||
Consolidated operating income | $ | 102,555 | $ | 116,004 | $ | 103,957 | $ | 356,959 | $ | 351,816 | $ | 322,036 | |||||||||||
Operating Ratio: | |||||||||||||||||||||||
Truckload | 89.6 | % | 86.9 | % | 88.1 | % | 90.2 | % | 89.2 | % | 90.5 | % | |||||||||||
Dedicated | 89.7 | % | 87.3 | % | 87.8 | % | 88.7 | % | 89.8 | % | 88.8 | % | |||||||||||
Central Refrigerated | 95.8 | % | 92.9 | % | 94.2 | % | 95.2 | % | 93.9 | % | 96.4 | % | |||||||||||
Intermodal | 94.8 | % | 100.5 | % | (c) | 96.0 | % | 98.3 | % | 102.1 | % | (c) | 98.7 | % | |||||||||
Adjusted Operating Ratio (d): | |||||||||||||||||||||||
Truckload | 87.0 | % | 83.3 | % | 85.0 | % | 87.7 | % | 86.3 | % | 87.9 | % | |||||||||||
Dedicated | 87.4 | % | 84.3 | % | 85.1 | % | 86.1 | % | 87.5 | % | 86.4 | % | |||||||||||
Central Refrigerated | 94.9 | % | 91.0 | % | 92.6 | % | 93.8 | % | 92.2 | % | 95.4 | % | |||||||||||
Intermodal | 93.5 | % | 100.6 | % | (c) | 95.0 | % | 97.8 | % | 102.6 | % | (c) | 98.3 | % | |||||||||
(a) | As a result of the Acquisition of Central described in footnote (a) within the schedule Consolidated Statement of Operations (Unaudited) for the three months and years ended December 31, 2013, 2012 and 2011, the above Financial Information by Segment schedule for the three months and year ended December 31, 2013, 2012 and 2011 reflects the combination of the entities as if the Acquisition was effective January 1, 2011. |
(b) | Our nonreportable segments are comprised of our freight brokerage and logistics management services, Interstate Equipment Leasing (“IEL”), insurance and shop activities. |
(c) | During 2012, our Intermodal reportable segment incurred an increase in its insurance and claims expense primarily related to one claim associated with a drayage accident, which increased the Intermodal Operating Ratio by approximately 450 basis points and 300 basis points for the three months and year ended December 31, 2012, respectively, and increased the Intermodal Adjusted Operating Ratio by approximately 570 basis points and 380 basis points for the three months and year ended December 31, 2012 respectively. |
(d) | See our reconciliation of Adjusted Operating Ratio by Segment at the schedule titled “Adjusted Operating Income and Operating Ratio Reconciliation by Segment”. |
| 24 | |
OPERATING STATISTICS (UNAUDITED)
THREE MONTHS AND YEARS ENDED DECEMBER 31, 2013, 2012 AND 2011
Three Months Ended December 31, | Year Ended December 31, | ||||||||||||||||||||||
2013 | 2012 | 2011 | 2013 | 2012 | 2011 | ||||||||||||||||||
(recast) | (recast) | (recast) | (recast) | ||||||||||||||||||||
Operating Statistics by Segment: | |||||||||||||||||||||||
Truckload: | |||||||||||||||||||||||
Weekly revenue xFSR per tractor | $ | 3,366 | $ | 3,292 | $ | 2,999 | $ | 3,257 | $ | 3,165 | $ | 2,968 | |||||||||||
Total loaded miles (a) | 262,854 | 267,557 | 269,212 | 1,067,141 | 1,065,339 | 1,125,270 | |||||||||||||||||
Deadhead miles percentage | 12.4 | % | 11.3 | % | 11.1 | % | 11.6 | % | 11.1 | % | 11.0 | % | |||||||||||
Average tractors available for dispatch: | |||||||||||||||||||||||
Company | 7,220 | 7,425 | 8,024 | 7,500 | 7,508 | 8,385 | |||||||||||||||||
Owner-Operator | 3,398 | 3,340 | 3,490 | 3,333 | 3,361 | 3,530 | |||||||||||||||||
Total | 10,618 | 10,765 | 11,514 | 10,833 | 10,869 | 11,915 | |||||||||||||||||
Dedicated: | |||||||||||||||||||||||
Weekly revenue xFSR per tractor | $ | 3,256 | $ | 3,366 | $ | 3,256 | $ | 3,339 | $ | 3,357 | $ | 3,305 | |||||||||||
Average tractors available for dispatch: | |||||||||||||||||||||||
Company | 2,975 | 2,768 | 2,635 | 2,791 | 2,698 | 2,409 | |||||||||||||||||
Owner-Operator | 700 | 671 | 708 | 660 | 663 | 570 | |||||||||||||||||
Total | 3,675 | 3,439 | 3,343 | 3,451 | 3,361 | 2,979 | |||||||||||||||||
Central Refrigerated: | |||||||||||||||||||||||
Weekly revenue xFSR per tractor | $ | 3,588 | $ | 3,337 | $ | 3,373 | $ | 3,427 | $ | 3,331 | $ | 3,249 | |||||||||||
Total loaded miles (a) | 49,485 | 46,839 | 46,002 | 194,597 | 186,703 | 179,420 | |||||||||||||||||
Deadhead miles percentage | 13.6 | % | 13.0 | % | 12.0 | % | 13.1 | % | 12.6 | % | 12.1 | % | |||||||||||
Average tractors available for dispatch: | |||||||||||||||||||||||
Company | 1,059 | 992 | 948 | 1,055 | 974 | 959 | |||||||||||||||||
Owner-Operator | 988 | 889 | 823 | 951 | 865 | 801 | |||||||||||||||||
Total | 2,047 | 1,881 | 1,771 | 2,006 | 1,839 | 1,760 | |||||||||||||||||
Intermodal: | |||||||||||||||||||||||
Average tractors available for dispatch: | |||||||||||||||||||||||
Company | 317 | 268 | 269 | 284 | 275 | 240 | |||||||||||||||||
Owner-Operator | 69 | 7 | — | 41 | 2 | — | |||||||||||||||||
Total | 386 | 275 | 269 | 325 | 277 | 240 | |||||||||||||||||
Load Count | 41,782 | 40,862 | 31,452 | 151,781 | 145,144 | 106,419 | |||||||||||||||||
Average Container Count | 8,717 | 8,628 | 5,955 | 8,717 | 7,209 | 5,527 | |||||||||||||||||
(a) Total loaded miles presented in thousands. | |||||||||||||||||||||||
| 25 | |
As of December 31, | ||||||||
2013 | 2012 | 2011 | ||||||
Consolidated Total Equipment: | (recast) | (recast) | ||||||
Tractors: | ||||||||
Company | ||||||||
Owned | 6,081 | 5,504 | 6,830 | |||||
Leased – capital leases | 1,851 | 2,658 | 2,755 | |||||
Leased – operating leases | 4,834 | 4,139 | 3,259 | |||||
Total company tractors | 12,766 | 12,301 | 12,844 | |||||
Owner-operator | ||||||||
Financed by leasing subsidiary | 4,473 | 3,885 | 3,801 | |||||
Other | 722 | 960 | 1,054 | |||||
Total owner-operator tractors | 5,195 | 4,845 | 4,855 | |||||
Total tractors | 17,961 | 17,146 | 17,699 | |||||
Trailers | 57,310 | 55,947 | 53,557 | |||||
Containers | 8,717 | 8,717 | 6,210 | |||||
| 26 | |
ADJUSTED OPERATING INCOME AND OPERATING RATIO
RECONCILIATION BY SEGMENT (UNAUDITED) (a)
THREE MONTHS AND YEARS ENDED DECEMBER 31, 2013, 2012 AND 2011
Three Months Ended December 31, | Year Ended December 31, | ||||||||||||||||||||||
2013 | 2012 | 2011 | 2013 | 2012 | 2011 | ||||||||||||||||||
(recast) | (recast) | (recast) | (recast) | ||||||||||||||||||||
(Dollars in thousands) | |||||||||||||||||||||||
Truckload: | |||||||||||||||||||||||
Operating revenue | $ | 585,222 | $ | 591,100 | $ | 573,198 | $ | 2,313,035 | $ | 2,282,342 | $ | 2,336,056 | |||||||||||
Less: Fuel surcharge revenue | 115,568 | 125,354 | 119,384 | 473,139 | 483,623 | 491,823 | |||||||||||||||||
Revenue xFSR | 469,654 | 465,746 | 453,814 | 1,839,896 | 1,798,719 | 1,844,233 | |||||||||||||||||
Operating expense | 524,329 | 513,461 | 504,903 | 2,087,072 | 2,036,337 | 2,113,102 | |||||||||||||||||
Adjusted for: | |||||||||||||||||||||||
Fuel surcharge revenue | (115,568 | ) | (125,354 | ) | (119,384 | ) | (473,139 | ) | (483,623 | ) | (491,823 | ) | |||||||||||
Adjusted operating expense | 408,761 | 388,107 | 385,519 | 1,613,933 | 1,552,714 | 1,621,279 | |||||||||||||||||
Adjusted operating income | $ | 60,893 | $ | 77,639 | $ | 68,295 | $ | 225,963 | $ | 246,005 | $ | 222,954 | |||||||||||
Adjusted Operating Ratio | 87.0 | % | 83.3 | % | 85.0 | % | 87.7 | % | 86.3 | % | 87.9 | % | |||||||||||
Operating Ratio | 89.6 | % | 86.9 | % | 88.1 | % | 90.2 | % | 89.2 | % | 90.5 | % | |||||||||||
Dedicated: | |||||||||||||||||||||||
Operating revenue | $ | 192,502 | $ | 188,150 | $ | 174,636 | $ | 738,929 | $ | 724,405 | $ | 625,268 | |||||||||||
Less: Fuel surcharge revenue | 35,208 | 35,999 | 31,593 | 138,063 | 134,498 | 111,892 | |||||||||||||||||
Revenue xFSR | 157,294 | 152,151 | 143,043 | 600,866 | 589,907 | 513,376 | |||||||||||||||||
Operating expense | 172,707 | 164,228 | 153,344 | 655,409 | 650,379 | 555,515 | |||||||||||||||||
Adjusted for: | |||||||||||||||||||||||
Fuel surcharge revenue | (35,208 | ) | (35,999 | ) | (31,593 | ) | (138,063 | ) | (134,498 | ) | (111,892 | ) | |||||||||||
Adjusted operating expense | 137,499 | 128,229 | 121,751 | 517,346 | 515,881 | 443,623 | |||||||||||||||||
Adjusted operating income | $ | 19,795 | $ | 23,922 | $ | 21,292 | $ | 83,520 | $ | 74,026 | $ | 69,753 | |||||||||||
Adjusted Operating Ratio | 87.4 | % | 84.3 | % | 85.1 | % | 86.1 | % | 87.5 | % | 86.4 | % | |||||||||||
Operating Ratio | 89.7 | % | 87.3 | % | 87.8 | % | 88.7 | % | 89.8 | % | 88.8 | % | |||||||||||
Central Refrigerated: | |||||||||||||||||||||||
Operating revenue | 140,899 | 125,444 | 118,614 | 533,993 | 484,657 | 447,173 | |||||||||||||||||
Less: Fuel surcharge revenue | 25,188 | 26,526 | 25,178 | 103,858 | 104,322 | 96,084 | |||||||||||||||||
Revenue xFSR | 115,711 | 98,918 | 93,436 | 430,135 | 380,335 | 351,089 | |||||||||||||||||
Operating expense | 134,959 | 116,550 | 111,677 | 508,172 | 454,887 | 431,150 | |||||||||||||||||
Adjusted for: | |||||||||||||||||||||||
Fuel surcharge revenue | (25,188 | ) | (26,526 | ) | (25,178 | ) | (103,858 | ) | (104,322 | ) | (96,084 | ) | |||||||||||
Acceleration of non-cash equity compensation (b) | — | — | — | (887 | ) | — | — | ||||||||||||||||
Adjusted operating expense | 109,771 | 90,024 | 86,499 | 403,427 | 350,565 | 335,066 | |||||||||||||||||
Adjusted operating income | 5,940 | 8,894 | 6,937 | 26,708 | 29,770 | 16,023 | |||||||||||||||||
Adjusted Operating Ratio | 94.9 | % | 91.0 | % | 92.6 | % | 93.8 | % | 92.2 | % | 95.4 | % | |||||||||||
Operating Ratio | 95.8 | % | 92.9 | % | 94.2 | % | 95.2 | % | 93.9 | % | 96.4 | % | |||||||||||
Intermodal: | |||||||||||||||||||||||
Operating revenue | $ | 98,634 | $ | 97,710 | $ | 72,830 | $ | 350,093 | $ | 333,938 | $ | 237,875 | |||||||||||
Less: Fuel surcharge revenue | 19,648 | 20,902 | 14,822 | 72,436 | 70,786 | 50,219 | |||||||||||||||||
Revenue xFSR | 78,986 | 76,808 | 58,008 | 277,657 | 263,152 | 187,656 | |||||||||||||||||
Operating expense | 93,538 | 98,155 | 69,953 | 344,063 | 340,792 | 234,729 | |||||||||||||||||
Adjusted for: | |||||||||||||||||||||||
Fuel surcharge revenue | (19,648 | ) | (20,902 | ) | (14,822 | ) | (72,436 | ) | (70,786 | ) | (50,219 | ) | |||||||||||
Adjusted operating expense | 73,890 | 77,253 | 55,131 | 271,627 | 270,006 | 184,510 | |||||||||||||||||
Adjusted operating income (loss) | $ | 5,096 | $ | (445 | ) | $ | 2,877 | $ | 6,030 | $ | (6,854 | ) | $ | 3,146 | |||||||||
Adjusted Operating Ratio | 93.5 | % | 100.6 | % | 95.0 | % | 97.8 | % | 102.6 | % | 98.3 | % | |||||||||||
Operating Ratio | 94.8 | % | 100.5 | % | 96.0 | % | 98.3 | % | 102.1 | % | 98.7 | % | |||||||||||
| 27 | |
(a) | As a result of the Acquisition of Central described in footnote (a) within the schedule Consolidated Statement of Operations (Unaudited) for the three months and years ended December 31, 2013, 2012 and 2011, the above Adjusted Operating Income schedule for the three months and year ended December 31, 2013, 2012 and 2011 reflect the combination of the entities as if the Acquisition was effective January 1, 2011. |
(b) In the third quarter of 2013, Central incurred a $0.9 million one-time non-cash-equity compensation charge for certain stock options that accelerated upon the closing of the Acquisition.
| 28 | |
CONSOLIDATED BALANCE SHEET (UNAUDITED) (a)
AS OF DECEMBER 31, 2013 AND 2012
(In thousands, except share data)
December 31, 2013 | December 31, 2012 | ||||||
(Unaudited) | (recast) | ||||||
ASSETS | |||||||
Current assets: | |||||||
Cash and cash equivalents | $ | 59,178 | $ | 53,596 | |||
Restricted cash | 50,833 | 51,678 | |||||
Restricted investments, held to maturity, amortized cost | 25,814 | 22,275 | |||||
Accounts receivable, net | 418,436 | 392,770 | |||||
Equipment sales receivable | 368 | 563 | |||||
Income tax refund receivable | 23,704 | 10,046 | |||||
Inventories and supplies | 18,430 | 17,524 | |||||
Assets held for sale | 19,268 | 31,544 | |||||
Prepaid taxes, licenses, insurance and other | 63,958 | 58,903 | |||||
Deferred income taxes | 46,833 | 98,235 | |||||
Current portion of notes receivable | 7,210 | 4,957 | |||||
Total current assets | 734,032 | 742,091 | |||||
Property and equipment, at cost: | |||||||
Revenue and service equipment | 1,942,423 | 1,863,634 | |||||
Land | 117,929 | 120,442 | |||||
Facilities and improvements | 248,724 | 250,816 | |||||
Furniture and office equipment | 61,396 | 51,340 | |||||
Total property and equipment | 2,370,472 | 2,286,232 | |||||
Less: accumulated depreciation and amortization | 922,665 | 888,696 | |||||
Net property and equipment | 1,447,807 | 1,397,536 | |||||
Other assets | 57,166 | 65,537 | |||||
Intangible assets, net | 316,747 | 333,561 | |||||
Goodwill | 253,256 | 253,256 | |||||
Total assets | $ | 2,809,008 | $ | 2,791,981 | |||
LIABILITIES AND STOCKHOLDERS’ EQUITY | |||||||
Current liabilities: | |||||||
Accounts payable | $ | 118,014 | $ | 113,374 | |||
Accrued liabilities | 110,745 | 107,772 | |||||
Current portion of claims accruals | 75,469 | 86,587 | |||||
Current portion of long-term debt and obligations under capital leases (b) | 75,056 | 73,497 | |||||
Fair value of guarantees | 366 | 366 | |||||
Current portion of fair value of interest rate swaps | 4,718 | 1,853 | |||||
Total current liabilities | 384,368 | 383,449 | |||||
Revolving line of credit | 17,000 | 2,531 | |||||
Long-term debt and obligations under capital leases (b) | 1,246,764 | 1,357,101 | |||||
Claims accruals, less current portion | 118,582 | 98,919 | |||||
Fair value of interest rate swaps, less current portion | 7,050 | 11,497 | |||||
Deferred income taxes | 484,200 | 441,381 | |||||
Securitization of accounts receivable | 264,000 | 204,000 | |||||
Other liabilities | 3,457 | 2,899 | |||||
Total liabilities | 2,525,421 | 2,501,777 | |||||
Stockholders' equity: | |||||||
Class A common stock | 883 | 871 | |||||
Class B common stock | 525 | 525 | |||||
Additional paid-in capital | 759,408 | 920,827 | |||||
Accumulated deficit | (471,169 | ) | (601,777 | ) | |||
Central Refrigerated stockholders' loans receivable, pre-acquisition | — | (22,142 | ) | ||||
Accumulated other comprehensive loss | (6,162 | ) | (8,202 | ) | |||
Noncontrolling interests | 102 | 102 | |||||
Total stockholders' equity | 283,587 | 290,204 | |||||
Total liabilities and stockholders' equity | $ | 2,809,008 | $ | 2,791,981 | |||
| 29 | |
Notes to Selected Consolidated Balance Sheet Data:
(a) | As a result of the Acquisition described in footnote (a) within the schedule Consolidated Statements of Operations (Unaudited) for the three months and years ended December 31, 2013, 2012 and 2011, the above Consolidated Balance Sheet as of December 31, 2013 and December 31, 2012 reflects the combination of the entities as if the Acquisition was effective January 1, 2012. |
(b) | On March 7, 2013, the Company entered into a Second Amended and Restated Credit Agreement (the “2013 Agreement”) replacing our previous Amended and Restated Credit Agreement dated March 6, 2012 (the “2012 Agreement”). The 2013 Agreement replaced the previous first lien term loan B-1 and B-2 tranches with outstanding principal balances of $152.0 million and $508.0 million, respectively, with new first lien term B-1 and B-2 tranches with face values of $250.0 million and $410.0 million, respectively. In addition, the 2013 Agreement reduced the interest rate applicable to the first lien term loan B-1 tranche to the LIBOR rate plus 2.75% with no LIBOR floor, down from LIBOR plus 3.75% with no LIBOR floor, and reduced the interest rate applicable to the first lien term loan B-2 tranche to the LIBOR rate plus 3.00% with a 1.00% LIBOR floor, down from LIBOR plus 3.75% with a 1.25% LIBOR floor. The replacement of the 2012 Agreement resulted in a loss on debt extinguishment of $5.0 million in the first quarter of 2013, representing the write-off of the unamortized original issue discount and deferred financing fees associated with the then-existing first lien term loan B-1 and B-2 tranches. |
Total debt and capital lease obligations as of December 31, 2013 includes $229.0 million net carrying value of first lien term loan B-1 tranche, $410.0 million net carrying value of the first lien term loan B-2 tranche, $493.8 million net carrying value of senior second priority secured notes, and $189.1 million of other secured indebtedness and capital lease obligations. Total debt and capital lease obligations as of December 31, 2012 includes $157.1 million net carrying value of the first lien term loan B-1 tranche, $575.6 million net carrying value of the first lien term loan B-2 tranche, $492.6 million net carrying value of senior second priority secured notes, and $205.3 million of other secured indebtedness and capital lease obligations.
| 30 | |
CONSOLIDATED STATEMENTS OF CASH FLOWS (UNAUDITED) (a)
YEARS ENDED DECEMBER 31, 2013 AND 2012
(In thousands)
Year Ended December 31, | |||||||
2013 | 2012 | ||||||
Cash flows from operating activities: | (recast) | ||||||
Net income | $ | 155,422 | $ | 140,087 | |||
Adjustments to reconcile net income to net cash provided by operating activities: | |||||||
Depreciation and amortization of property, equipment and intangibles | 242,822 | 235,764 | |||||
Amortization of debt issuance costs, original issue discount, and losses on terminated swaps | 7,247 | 10,645 | |||||
Gain on disposal of property and equipment less write-off of totaled tractors | (21,574 | ) | (16,674 | ) | |||
Gain on sale of real property | (6,876 | ) | — | ||||
Impairments | — | 9,366 | |||||
Equity losses of investee | 537 | 1,007 | |||||
Deferred income taxes | 102,290 | 45,753 | |||||
Provision for allowance for losses on accounts receivable | 1,370 | 977 | |||||
Loss on debt extinguishment | 5,540 | 22,219 | |||||
Non-cash equity compensation | 4,645 | 4,890 | |||||
Income effect of mark-to-market adjustment of interest rate swaps | 805 | — | |||||
Interest on Central stockholders' loan receivable, pre-acquisition | (53 | ) | (53 | ) | |||
Increase (decrease) in cash resulting from changes in: | |||||||
Accounts receivable | (37,249 | ) | (17,534 | ) | |||
Inventories and supplies | (912 | ) | 1,484 | ||||
Prepaid expenses and other current assets | (12,013 | ) | (1,643 | ) | |||
Other assets | 6,296 | 3,879 | |||||
Accounts payable, accrued and other liabilities | 4,571 | 6,951 | |||||
Net cash provided by operating activities | 452,868 | 447,118 | |||||
Cash flows from investing activities: | |||||||
Decrease in restricted cash | 845 | 20,046 | |||||
Change in restricted investments | (3,539 | ) | (22,275 | ) | |||
Funding of note receivable | — | (7,500 | ) | ||||
Proceeds from sale of property and equipment | 119,158 | 142,684 | |||||
Capital expenditures | (318,271 | ) | (314,142 | ) | |||
Payments received on notes receivable | 24,504 | 5,948 | |||||
Expenditures on assets held for sale | (18,415 | ) | (12,040 | ) | |||
Payments received on assets held for sale | 53,486 | 12,778 | |||||
Payments received on equipment sale receivables | 1,450 | 5,642 | |||||
Acquisition of Central, net of debt repayment | (150,302 | ) | — | ||||
Other investing activities | — | (270 | ) | ||||
Net cash used in investing activities | (291,084 | ) | (169,129 | ) | |||
Cash flows from financing activities: | |||||||
Repayment of long-term debt and capital leases | (236,388 | ) | (311,935 | ) | |||
Proceeds from long-term debt | 26,267 | 11,304 | |||||
Payment of deferred loan costs | (2,183 | ) | (9,023 | ) | |||
Net borrowings on revolving line of credit | 14,469 | (6,506 | ) | ||||
Borrowings under accounts receivable securitization | 184,000 | 255,000 | |||||
Repayment of accounts receivable securitization | (124,000 | ) | (231,000 | ) | |||
Issuance of Central stockholders' loan receivable, pre-acquisition | (30,000 | ) | — | ||||
Distribution to Central stockholders, pre-acquisition | (2,499 | ) | (13,605 | ) | |||
Proceeds from exercise of stock options and the issuance of employee stock purchase plan shares | 13,945 | 401 | |||||
Income tax benefit from exercise of stock options | 187 | (370 | ) | ||||
Other financing activities | — | (743 | ) | ||||
Net cash used in financing activities | (156,202 | ) | (306,477 | ) | |||
Net increase (decrease) in cash and cash equivalents | 5,582 | (28,488 | ) | ||||
Cash and cash equivalents at beginning of period | 53,596 | 82,084 | |||||
Cash and cash equivalents at end of period | $ | 59,178 | $ | 53,596 | |||
| 31 | |
Supplemental disclosure of cash flow information: | |||||||
Cash paid during the period for: | |||||||
Interest | $ | 103,238 | $ | 121,940 | |||
Income taxes | $ | 20,625 | $ | 22,410 | |||
Supplemental schedule of: | |||||||
Non-cash investing activities: | |||||||
Equipment sales receivables | $ | 1,252 | $ | 705 | |||
Equipment purchase accrual | $ | 7,710 | $ | 14,361 | |||
Notes receivable from sale of assets | $ | 8,089 | $ | 7,784 | |||
Non-cash financing activities: | |||||||
Capital lease additions | $ | 85,094 | $ | 38,453 | |||
Note payable from purchase of revenue equipment | — | $ | 3,775 | ||||
Insurance premium and software notes payable | $ | 9,189 | $ | 7,694 | |||
Non-cash distribution to Central Refrigerated stockholders in satisfaction of stockholders' loans receivable, pre-acquisition | $ | 22,315 | $ | — | |||
Non-cash exercise of Central Refrigerated stock options in exchange for stockholders' loans receivable, pre-acquisition | $ | 3,415 | $ | — | |||
Cancellation of Central Refrigerated stockholders' loans receivable at closing of acquisition | $ | 33,295 | $ | — | |||
(a) As a result of the Acquisition described in footnote (a) within the schedule Consolidated Statements of Operations (Unaudited) for the three months and years ended December 31, 2013, 2012 and 2011, the above Consolidated Statements of Cash Flows for the year ended December 31, 2013 and 2012 reflects the combination of the entities as if the Acquisition was effective January 1, 2012.
| 32 | |