Table of Contents
As filed with the Securities and Exchange Commission on May 28, 2013
UNITED STATES
SECURITIES AND EXCHANGE COMMISSION
Washington, D.C. 20549
Form 10
GENERAL FORM FOR REGISTRATION OF SECURITIES
PURSUANT TO SECTION 12(b) OR 12(g) OF THE
SECURITIES EXCHANGE ACT OF 1934
Excel Trust, L.P.
(Exact Name of Registrant as Specified in Its Charter)
| Delaware | 271495445 | |
| (State or Other Jurisdiction of Incorporation or Organization) |
(I.R.S. Employer Identification Number) |
17140 Bernardo Center Drive, Suite 300
San Diego, California 92128
(858) 613-1800
(Address, Including Zip Code, and Telephone Number, Including Area Code, of Registrant’s Principal Executive Offices)
Securities to be registered pursuant to Section 12(b) of the Act:
| Title of each class to be so registered |
Name of each exchange on which each class is to be registered | |
| N/A | N/A |
Securities to be registered pursuant to Section 12(g) of the Act:
Common Units of Partnership Interest
(Title of Class)
Indicate by check mark whether the registrant is a large accelerated filer, an accelerated filer, a non-accelerated filer, or a smaller-reporting company. See the definitions of “large accelerated filer,” “accelerated filer” and “smaller reporting company” in Rule 12b-2 of the Exchange Act.
| Large accelerated filer | ¨ | Accelerated filer | ¨ | |||
| Non-accelerated filer | x (Do not check if a smaller reporting company) | Smaller reporting company | ¨ | |||
Table of Contents
i
Table of Contents
General
Excel Trust, L.P., a Delaware limited partnership of which Excel Trust, Inc. is the parent company and general partner, is the entity through which Excel Trust, Inc. conducts its business and holds substantially all of its assets. Unless otherwise indicated or unless the context requires otherwise, all references in this registration statement to “we,” “us,” “our” or “the operating partnership” refer to Excel Trust, L.P. together with its consolidated subsidiaries. We refer to Excel Trust, Inc. as our “general partner.” We refer to our general partner together with its consolidated subsidiaries (including us) as “our company.”
Our general partner operates as a real estate investment trust, or REIT, for federal income tax purposes. We are a vertically integrated, self-administered, self-managed real estate firm with the principal objective of acquiring, financing, developing, leasing, owning and managing community and power centers, grocery anchored neighborhood centers and freestanding retail properties. Our strategy is to acquire high quality, well-located, dominant retail properties that generate attractive risk-adjusted returns. We target competitively protected properties in communities that have stable demographics and have historically exhibited favorable trends, such as strong population and income growth. We consider competitively protected properties to be located in the most prominent shopping districts in their respective markets, ideally situated at major “Main and Main” intersections. We seek investment opportunities throughout the United States, but focus on the Northeast, Northwest and Sunbelt regions. We generally lease our properties to national and regional supermarket chains, big-box retailers and select national retailers that frequently offer necessity and value oriented items and generate regular consumer traffic. Our tenants often carry goods that are less impacted by fluctuations in the broader U.S. economy and consumers’ disposable income, which we believe generates more predictable property-level cash flows.
As of March 31, 2013, we owned an operating portfolio consisting of 31 consolidated retail operating properties totaling approximately 5.3 million square feet of gross leasable area (including a consolidated joint venture owned 50% by us), which were approximately 93.2% leased and had a weighted average remaining lease term of approximately seven years, based on gross leasable area (one retail property also contains 339 apartment units on the upper levels of the shopping center, which were 92.9% leased as of March 31, 2013). We also owned two commercial office properties, Excel Center, a portion of which is utilized as our corporate headquarters, and the Promenade Corporate Center. These properties total 338,339 square feet of gross leasable area and were approximately 82.3% leased as of March 31, 2013. In addition, we held ownership interests in two unconsolidated retail properties totaling 225,070 square feet of gross leasable area, which were approximately 65.5% leased as of March 31, 2013. Our non-operating property consists of Phase II of our Chimney Rock property, which is held for future development. Phase I of our Chimney Rock property is classified as an operating property.
1
Table of Contents
The following diagram illustrates our company’s structure as of March 31, 2013:
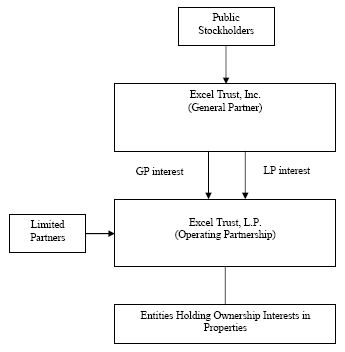
We were organized in the state of Delaware on December 16, 2009. Our general partner was incorporated in Maryland on December 15, 2009. As of May 20, 2013, we had 49 employees. Our primary offices are located in San Diego, California and Salt Lake City, Utah. Our headquarters is located at 17140 Bernardo Center Drive, Suite 300, San Diego, California 92128. Our telephone number at that location is (858) 613-1800. Our internet address is www.ExcelTrust.com.
Recent Developments
On January 24, 2013, we completed the acquisition of Tracy Pavilion, a retail shopping center with approximately 162,000 square feet of gross leasable area located in Tracy, California for a contractual purchase price, excluding closing costs, of approximately $30.7 million. Tenants of Tracy Pavilion include Marshalls, Ross Dress for Less, Staples, PetSmart, Ulta, WinCo Foods (non-owned) and Costco (non-owned).
Business Objective and Growth Strategies
Our objective is to maximize total returns to our unitholders through the pursuit of the following business and growth strategies:
Pursue value oriented investment strategy targeting core retail properties. Our strategy is to acquire high quality, well-located, dominant retail properties that generate attractive risk-adjusted returns. We acquire retail properties based on identified market and property characteristics, including:
| • | Property type. We focus our investment strategy on community and power centers, grocery anchored neighborhood centers and freestanding retail properties. We target a leasing mix where anchor tenants consist of 50 to 70% of our portfolio’s gross leasable area. |
| • | Neighborhood centers. A neighborhood center is designed to provide convenience shopping for the day-to-day needs of consumers in the immediate neighborhood. Neighborhood centers are often anchored by a supermarket or drugstore. |
2
Table of Contents
| • | Community centers. A community center typically offers a wider range of apparel and other soft goods relative to a neighborhood center and in addition to supermarkets and drugstores, can include discount department stores as anchor tenants. |
| • | Power centers. A power center is dominated by several large anchors, including discount department stores, warehouse clubs or other large box retailers that offer tremendous selection in a particular merchandise category at low prices. |
| • | Freestanding retail properties. A freestanding retail property constitutes any retail building that is typically occupied by a single tenant. |
| • | Anchor tenant type. We target properties with anchor tenants that offer necessity and value oriented items that are less impacted by fluctuations in consumers’ disposable income. We believe nationally and regionally recognized anchor tenants that offer necessity and value oriented items provide more predictable property-level cash flows as they are typically higher credit quality tenants that generate stable revenues. |
| • | Lease terms. In the near term, we intend to acquire properties that feature one or more of the following characteristics in their tenants’ lease structure: properties with long-term leases for anchor tenants; properties under triple-net leases, which are leases where the tenant agrees to pay rent as well as all taxes, insurance and maintenance expenses that arise from the use of the property thereby minimizing our expenses; and properties with leases that incorporate percentage rent and/or rental escalations that act as an inflation hedge while maximizing operating cash flows. As a longer-term strategy, we will look to acquire properties with shorter-term lease structures for in-line tenants, which are tenants that rent smaller spaces around the anchor tenants within a property, that have below-market rents that can be renewed at higher market rates. |
| • | Geographic markets and demographics. We seek investment opportunities throughout the United States but we focus on the Northeast, Northwest and Sunbelt regions, which are characterized by attractive demographic and property fundamental trends. We target competitively protected properties in communities that have stable demographics and have historically exhibited favorable trends, such as strong population and income growth. |
Capitalize on network of relationships to pursue off-market transactions. We have pursued and will continue to pursue off-market transactions in our target markets through the long-term relationships we have developed over the past three decades. We believe the current dislocation in the real estate capital markets will allow us to supplement this strategy in the near term by targeting opportunities resulting from both troubled owners and distressed real estate. We target overleveraged property owners facing liquidity constraints or solvency issues. We also intend to target properties that, although well-located, are challenged by tenant bankruptcies. We believe these sellers will provide us the opportunity to obtain high quality, well-located, dominant retail properties at attractive valuations.
Maximize value through proactive asset management. We believe our market expertise, targeted leasing strategies and proactive approach to asset management enable us to maximize the operating performance of our portfolio. We will continue to implement an active asset management program to increase the long-term value of each of our properties. This may include expanding existing tenants, re-entitling site plans to allow for additional outparcels, which are small tracts of land used for freestanding development not attached to the main buildings, and repositioning tenant mixes to maximize traffic, tenant sales and percentage rents. As we grow our portfolio, we will seek to maintain a diverse pool of assets with respect to both geographic distribution and tenant mix, helping to minimize our portfolio risk. We continually monitor our markets for opportunities to selectively dispose of properties where returns appear to have been maximized and redeploy proceeds into new acquisitions that have greater return prospects.
Leverage our experienced property management platform. Our management team has an extensive track record of managing, operating and leasing retail properties. We believe tenants value our commitment to maintaining the high standards of our properties through our handling of many property management functions in-house. Furthermore, we consider ourselves to be in the best position to oversee the day-to-day operations of our properties, which in turn helps us service our tenants. We feel this generates higher renewal and occupancy rates, minimizes rent interruptions, reduces renewal costs and helps us achieve stronger operating results. Along with this, a major component of our leasing strategy is to cultivate long-term relationships through consistent tenant dialogue in conjunction with a proactive approach to meeting the space requirements of our tenants.
Grow our platform through a comprehensive financing strategy. Our capital structure provides us with significant financial capacity and flexibility to fund future growth. Because our general partner is a well-capitalized public company, we believe we will have access to multiple sources of financing that are currently unavailable to many of our private market peers or overleveraged public competitors, which provides us with a competitive advantage. Over time, these financing alternatives may include follow-on offerings of our general partner’s common stock or preferred stock or our issuance of unsecured debt or borrowings from our credit facilities.
3
Table of Contents
Regulation
General
Our properties are subject to various laws, ordinances and regulations, including regulations relating to common areas. We believe that we have the necessary permits and approvals to operate each of our properties.
Americans with Disabilities Act
Our properties must comply with Title III of the Americans with Disabilities Act, or ADA, to the extent that such properties are “public accommodations” as defined by the ADA. The ADA may require removal of structural barriers to access by persons with disabilities in certain public areas of our properties where such removal is readily achievable. We believe that our properties were built in substantial conformance with the building codes of their respective cities, including in substantial compliance with the applicable ADA requirements at the time of construction. Although we believe that our properties substantially comply with present requirements of the ADA, we have not conducted an audit of all such properties to determine compliance. The tenants are generally responsible for any additional amounts required to conform their construction projects to the ADA. Non-compliance could result in imposition of fines by the U.S. government or an award of damages and/or attorneys’ fees to private litigants, or both. The obligation to make readily achievable accommodations is an ongoing one, and we will continue to assess our properties and to make alterations as appropriate in this respect.
Environmental Matters
Under various federal, state and local environmental laws and regulations, a current or previous owner, operator or tenant of real estate may be required to investigate and remove hazardous or toxic substances or petroleum product releases or threats of releases at such property, and may be held liable for property damage and for investigation, clean-up and monitoring costs incurred in connection with the actual or threatened contamination. Such laws typically impose clean-up responsibility and liability without regard to fault, or whether the owner, or tenant knew of or caused the presence of the contamination. The liability under such laws may be joint and several for the full amount of the investigation, clean-up and monitoring costs incurred or to be incurred or actions to be undertaken, although a party held jointly and severally liable may obtain contributions from the other identified, solvent, responsible parties of their fair share toward these costs. These costs may be substantial, and can exceed the value of the property. Some of the properties in our portfolio contain, may have contained or are adjacent to or near other properties that have contained or currently contain underground storage tanks for the storage of petroleum products or other hazardous or toxic substances. These operations may have released, or have the potential to release, such substances into the environment. The presence of contamination, or the failure to properly remediate contamination, on a property may adversely affect the ability of the owner, operator or tenant to sell or rent that property or to borrow using such property as collateral, and may adversely impact our investment in that property.
Federal regulations require building owners and those exercising control over a building’s management to identify and warn, via signs and labels, of potential hazards posed by workplace exposure to installed asbestos-containing materials, or ACMs, and potential ACMs in their building. The regulations also set forth employee training, record-keeping and due diligence requirements pertaining to ACMs and potential ACMs. Significant fines can be assessed for violating these regulations. Building owners and those exercising control over a building’s management may be subject to an increased risk of personal injury lawsuits by workers and others exposed to ACMs and potential ACMs as a result of these regulations. The regulations may affect the value of a building containing ACMs and potential ACMs in which we have invested. Federal, state and local laws and regulations also govern the removal, encapsulation, disturbance, handling and/or disposal of ACMs and potential ACMs when such materials are in poor condition or in the event of construction, remodeling, renovation or demolition of a building. Such laws may impose liability for improper handling or a release to the environment of ACMs and potential ACMs and may provide for fines to, and for third parties to seek recovery from, owners or operators of real properties for personal injury or improper work exposure associated with ACMs and potential ACMs. See “Risk Factors—Risks Related to the Real Estate Industry—Our properties may contain asbestos or develop harmful mold, which could lead to liability for adverse health effects and costs of remediating the problem, which could adversely affect the value of the affected property and our ability to pay distributions to our unitholders.”
When excessive moisture accumulates in buildings or on building materials, mold growth may occur, particularly if the moisture problem remains undiscovered or is not addressed over a period of time. Some molds may produce airborne toxins or irritants. Concern about indoor exposure to mold has been increasing because exposure to mold may cause a variety of adverse health effects and symptoms, including allergic or other reactions. The presence of significant mold at any of our properties could require us to undertake a costly remediation program to contain or remove the mold from the affected property. In addition, the presence of significant mold could expose us to liability to our tenants, their or our company’s employees, and others if property damage or health concerns arise.
4
Table of Contents
Federal, state and local laws and regulations also require removing or upgrading certain underground storage tanks and regulate the discharge of storm water, wastewater and any water pollutants; the emission of air pollutants; the generation, management and disposal of hazardous or toxic chemicals, substances or wastes; and workplace health and safety. Some of our properties have tenants which may use hazardous or toxic substances in the routine course of their businesses. Although we believe that the tenants’ activities involving such materials comply in all material respects with applicable laws and regulations, the risk of contamination or injury from these materials cannot be completely eliminated. In the event of such contamination or injury, we could be held liable for any damages that result, and any such liability could exceed our resources and our environmental remediation insurance coverage. See “Risk Factors — Risks Related to the Real Estate Industry — We could incur significant costs related to government regulation and private litigation over environmental matters involving the presence, discharge or threat of discharge of hazardous or toxic substances, which could adversely affect our operations, the value of our properties, and our ability to make distributions to our unitholders.”
In addition, our leases generally provide that (1) the tenant is responsible for all environmental liabilities relating to the tenant’s operations, (2) we are indemnified for such liabilities and (3) the tenant must comply with all environmental laws and regulations. Such a contractual arrangement, however, does not eliminate our statutory liability or preclude claims against us by governmental authorities or persons who are not parties to such an arrangement. Noncompliance with environmental or health and safety requirements may also result in the need to cease or alter operations at a property, which could affect the financial health of a tenant and its ability to make lease payments. In addition, if there is a violation of such a requirement in connection with a tenant’s operations, it is possible that we, as the owner of the property, could be held accountable by governmental authorities for such violation and could be required to correct the violation and pay related fines.
Prior to closing any property acquisition, we obtain environmental assessments in a manner we believe prudent in order to attempt to identify potential environment concerns at such properties. These assessments are carried out in accordance with an appropriate level of due diligence and generally include a physical site inspection, a review of relevant federal, state and local environmental and health agency database records, one or more interviews with appropriate site-related personnel, review of the property’s chain of title and review of historic aerial photographs and other information on past uses of the property. We may also conduct limited subsurface investigations and test for substances of concern where the results of the first phase of the environmental assessments or other information indicate possible contamination or where our consultants recommend such procedures.
While we may purchase our properties on an “as is” basis, all of our purchase contracts contain an environmental contingency clause, which permits us to reject a property because of any environmental hazard at such property. We receive Phase I environmental reports on all prospective properties.
We believe that our properties comply in all material respects with all federal and state regulations regarding hazardous or toxic substances and other environmental matters. However, there can be no assurance that we will not be subject to any liabilities or costs relating to hazardous or toxic substances or other environmental matters. Any substantial unexpected costs or liabilities that we may incur could significantly harm our financial condition and results of operations.
Insurance
We carry comprehensive general liability, fire, earthquake and extended coverage and loss of rental insurance covering all of our properties under a blanket portfolio policy. We believe the policy specifications and insured limits are adequate given the relative risk of loss, cost of the coverage and standard industry practice. We intend to carry similar insurance with respect to future acquisitions as appropriate.
Competition
We believe that competition for the acquisition, operation and development of retail shopping centers is highly fragmented. We compete with numerous owners, operators and developers for acquisitions and development of retail shopping centers, including institutional investors, other REITs and other owner-operators of community and neighborhood shopping centers, some of which own or may in the future own properties similar to ours in the same markets in which our properties are located. We also face significant competition in leasing available space to prospective tenants at our operating and development properties. Recent economic conditions have caused a greater than normal amount of space to be available for lease generally and in the markets in which our properties are located. The actual competition for tenants varies depending upon the characteristics of each local market (including current economic conditions) in which we own and manage property. We believe that the principal competitive factors in attracting tenants in our market areas are location, demographics, price, the presence of anchor stores and the appearance of properties.
Our competitors may have substantially greater financial resources than we do and may be able to accept more risk than we can prudently manage. In the future, competition from these entities may reduce the number of suitable investment opportunities offered to us or increase the bargaining power of property owners seeking to sell. Further, as a result of their greater resources, such entities may have more flexibility than we do in their ability to offer rental concessions to attract tenants. If our competitors offer space at rental rates below current market rates, or below the rental rates we currently charge our tenants, we may lose potential tenants and we may be pressured to reduce our rental rates below those we currently charge in order to retain tenants when our tenants’ leases expire.
5
Table of Contents
Foreign Operations
We do not engage in any foreign operations or derive any revenue from foreign sources.
Segment Financial Information
Financial information by segment is presented in Note 19 to the financial statements in Item 13 of this registration statement.
Reports to Security Holders
Excel Trust, Inc. is required to send an annual report to its securityholders and to our unitholders.
How to Obtain Our SEC Filings
All reports we will file with the Securities and Exchange Commission, or the SEC, will be available free of charge via EDGAR through the SEC’s website at http://www.sec.gov. In addition, the public may read and copy materials we file with the SEC at the SEC’s public reference room located at 100 F Street, N.E., Washington, D.C. 20549. Information about the operation of the public reference room may be obtained by calling the SEC at 1-800-SEC-0300. Copies of all or a portion of the registration statement can be obtained from the public reference room of the SEC upon payment of prescribed fees. We make available through our company’s website at www.ExcelTrust.com our general partner’s annual report on Form 10-K, quarterly reports on Form 10-Q, current reports on Form 8-K and amendments to such reports filed or furnished pursuant to Sections 13(a) or 15(d) of the Securities Exchange Act of 1934, as amended, or the Exchange Act, as soon as reasonably practicable after we electronically file such material with, or furnish it to, the SEC. The information found on, or otherwise accessible through, our company’s website is not incorporated by reference into, nor does it form a part of, this registration statement, or any other documents that we file with the SEC.
Set forth below are the risks that we believe are material to our unitholders. You should carefully consider the risks described below in evaluating the operating partnership, our properties and our business. If any of the events described in the risk factors below occur, our business, financial condition, operating results and prospects could be materially adversely affected, which in turn could adversely affect our unitholders and cause them to lose all or a part of their investment. Some statements in this registration statement, including statements in the following risk factors, constitute forward-looking statements. Please refer to the section entitled “Forward-Looking Statements.”
Risks Related to Our Properties, Our Business and Our Growth Strategy
Challenging economic conditions facing us and our tenants may have a material adverse effect on our financial condition and results of operations.
We and our tenants are susceptible to adverse economic developments in the United States. The United States has been in a challenging economic environment in recent years that may continue into the future. General economic factors that are beyond our control, including, but not limited to, decreases in consumer confidence, reductions in consumer credit availability, increasing consumer debt levels, rising energy costs, tax rates, increasing business layoffs, downsizing and industry slowdowns, and/or rising inflation, could have a negative impact on the business of our tenants. In turn, this could have a material adverse effect on our business because current or prospective tenants may, among other things (1) have difficulty paying us rent as they struggle to sell goods and services to consumers, (2) be unwilling to enter into or renew leases with us on favorable terms or at all, (3) seek to terminate their existing leases with us or seek downward rental adjustment to such leases or (4) be forced to curtail operations or declare bankruptcy. If the national economy continues to experience uncertainty, or general economic conditions were to worsen, the value of our properties, as well as the income we receive from our properties, could be adversely affected. This may have a material adverse effect on our financial condition and results of operations.
The decrease in demand for retail space may have a material adverse effect on our financial condition and results of operations.
Our portfolio of properties consists primarily of retail properties and because we seek to acquire similar properties, a decrease in the demand for retail space may have a greater adverse effect on our business and financial condition than if we owned a more diversified real estate portfolio. The market for retail space has been, and could continue to be, adversely affected by weakness in the national, regional and local economies, the adverse financial condition of some large retailing companies, the ongoing consolidation in the retail sector, the excess amount of retail space in a number of markets and increasing consumer purchases through catalogues or the Internet. Although we will take current economic conditions into account in acquiring properties in the future, our long-term success depends in part on improving economic conditions and the eventual return of a stable and dependable financing market for retail real estate. To the extent that these conditions continue, they are likely to negatively affect market rents for retail space and could materially and adversely affect our financial condition, results of operations, cash flow, the value of our company’s securities, our ability to satisfy our debt service obligations and our ability to pay distributions to our unitholders.
6
Table of Contents
Our expansion strategy may not yield the returns expected, may result in disruptions to our business, may strain our management resources and may adversely affect our operations.
On January 24, 2013, we completed the acquisition of Tracy Pavilion, a retail shopping center with approximately 162,000 square feet of gross leasable area located in Tracy, California, and we continue to actively negotiate additional potential property acquisitions from our pipeline. As we continue to acquire properties, such growth may require substantial attention from our company’s existing management team, which may divert management’s attention from our current properties and impair our relationships with our current tenants and employees. Implementing our growth plan also will require that we expand our company’s management and staff with qualified and experienced personnel and that we implement administrative, accounting and operational systems sufficient to integrate new properties into our portfolio. We also must manage future property acquisitions without incurring unanticipated costs or disrupting the operations at our existing properties. Managing new properties requires a focus on leasing and retaining tenants. If we fail to successfully integrate future acquisitions into our portfolio, or if newly acquired properties fail to perform as we expect, our results of operations, financial condition and ability to pay distributions could suffer.
We may be unable to identify, acquire, develop or operate properties successfully, which could harm our financial condition and ability to pay distributions.
We continue to evaluate the market for available properties and may acquire additional properties when attractive opportunities exist. We may also develop or substantially renovate other properties. Acquisition, development and renovation activities are subject to significant risks, including:
| • | we may be unable to obtain financing on favorable terms, or at all, |
| • | changing market conditions, including competition from others, may diminish our opportunities for acquiring a desired property on favorable terms, or at all. Even if we enter into agreements for the acquisition of properties, these agreements are likely to be subject to customary conditions to closing, including completion of due diligence investigations to our satisfaction, |
| • | we may spend more time or money than we budget to improve or renovate acquired properties or to develop properties, |
| • | we may abandon development activities after expending significant resources, |
| • | we may be unable to quickly and efficiently integrate new properties, particularly if we acquire portfolios of properties, into our existing operations, |
| • | we may fail to obtain the financial results expected from the properties we acquire or develop, making them unprofitable or less profitable than we had expected, |
| • | market and economic conditions may result in higher than expected vacancy rates and lower than expected rental rates, |
| • | when we develop properties, we may encounter delays or refusals in obtaining all necessary zoning, land use, building, occupancy and other required governmental permits and authorizations, |
| • | we may experience difficulty in obtaining any required consents of third parties such as tenants and mortgage lenders, |
| • | acquired and developed properties may have defects we do not discover through our inspection processes, including latent defects that may not reveal themselves until many years after we put a property in service, and |
| • | we may acquire land, properties or entities owning properties which are subject to liabilities and for which, in the case of unknown liabilities, we may have limited or no recourse. |
7
Table of Contents
The realization of any of the above risks could significantly and adversely affect our financial condition, results of operations, cash flow, the value of our company’s securities, ability to satisfy our debt service obligations and ability to pay distributions.
We may fail to obtain the financial results expected from the properties we acquire or develop, making them unprofitable or less profitable than we had expected.
We expect to acquire and/or develop a number of properties in the near future. In deciding whether to acquire or develop a particular property, we make certain assumptions regarding the expected future performance of that property. If a number of these properties do not perform as expected, such properties may be unprofitable or less profitable than we expected and our financial performance may be adversely affected.
We may not be successful in identifying acquisitions or development projects that meet our investment criteria, which may impede our growth.
Part of our business strategy is expansion through acquisitions and development projects, which requires us to identify acquisition and development candidates that satisfy our investment criteria and are compatible with our growth strategy. We may not be successful in identifying real estate properties or other assets that meet our acquisition or development criteria or in completing acquisitions or developments on satisfactory terms. Failure to identify or complete acquisitions or developments may slow our growth, which may materially adversely affect our operations.
We may suffer economic harm as a result of allocating resources to unprofitable efforts to enter new markets.
Our properties are located in 15 states, and as we grow our business we may expand our operations into markets where we do not currently operate. We may fail to accurately gauge conditions in a new market prior to entering it, and therefore may not achieve our anticipated results in the new market. If this occurs, our cash flow from operations may be adversely affected.
Failure by any major tenant to make rental payments to us, because of a deterioration of its financial condition or otherwise, could seriously harm our performance.
As of March 31, 2013, our three largest retail tenants in terms of annualized base rent were Publix Super Markets, Inc., Lowe’s and Edwards Theatres, the scheduled annualized base rents for which represented 3.7%, 3.0% and 3.0%, respectively, of our total retail annualized base rent. As of March 31, 2013, our three largest office tenants in terms of annualized base rent were Kaiser Permanente, Fitch, Inc. and Buchalter Nemer, the scheduled annualized base rents for which represented 23.6%, 9.0% and 7.4%, respectively, of our total office annualized base rent. Our performance depends on our ability to collect rent from these and other tenants. At any time, our tenants may experience a downturn in their business that may significantly weaken their financial condition, whether as a result of general economic conditions or otherwise. As a result, our tenants may fail to make rental payments when due under a number of leases, delay a number of lease commencements, decline to extend or renew a number of leases upon expiration, close a number of stores or declare bankruptcy. Any of these actions could result in the termination of the tenant’s leases and the loss of rental income attributable to the terminated leases. In addition, lease terminations by a major tenant or non-owned anchor or a failure by that major tenant or non-owned anchor to occupy the premises could result in lease terminations or reductions in rent by other tenants in the same shopping centers under the terms of some leases. In that event, we may be unable to re-lease the vacated space at attractive rents or at all. Furthermore, because many of our leases are triple-net, the failure of a tenant to make payments could result not only in lost rental income, but also in an increase in our operating expenses. The occurrence of any of the situations described above, particularly if it involves a substantial tenant or non-owned anchor with leases in multiple locations, could seriously harm our performance.
The bankruptcy of a tenant may adversely affect the income produced by and the value of our properties.
The bankruptcy or insolvency of a tenant may adversely affect the income produced by our properties. We cannot assure you that any tenant that files for bankruptcy protection will continue to pay rent. If any tenant becomes a debtor in a case under the Bankruptcy Code, we cannot evict the tenant solely because of the bankruptcy. The bankruptcy court also might authorize the tenant to reject and terminate its lease with us, which would generally result in any unpaid, pre-bankruptcy rent being treated as an unsecured claim. An unsecured claim may be paid only to the extent that funds are available and only in the same percentage as is paid to all other holders of unsecured claims. In addition, our claim against the tenant for unpaid, future rent would be subject to a statutory cap equal to the greater of (1) one year of rent or (2) 15% of the remaining rent on the lease (not to exceed three years of rent). This cap might be substantially less than the remaining rent actually owed under the lease. Additionally, a bankruptcy court may require us to turn over to the estate all or a portion of any deposits, amounts in escrow, or prepaid rents. Our claim for unpaid, pre-bankruptcy rent, our lease termination damages and claims relating to damages for which we hold deposits or other amounts that we were forced to repay would likely not be paid in full.
8
Table of Contents
Properties that we acquire may be subject to unknown liabilities that affect the value and profitability of these properties.
We are actively pursuing additional property acquisitions. Any properties that we acquire may be subject to existing liabilities that are unknown at the time we acquire such properties, which could affect such properties’ valuation or revenue potential. Unknown liabilities might include liabilities for cleanup or remediation of undisclosed environmental conditions; claims of tenants, vendors or other persons dealing with the entities prior to our acquisition of such properties (that had not been asserted or threatened prior to our acquisition); tax liabilities and accrued but unpaid liabilities incurred in the ordinary course of business. The existence of such liabilities could significantly adversely affect the value of the property subject to such liability and our ability to pay distributions to our unitholders.
We do not have exclusive control over our joint venture investments, which makes these investments risky.
We have invested in some properties as a joint venture partner, instead of owning the properties directly. In these investments, we do not have exclusive control over the development, financing, leasing, management and other aspects of these investments. As a result, our partners might have interests or goals that are inconsistent with ours, take action contrary to our interests or otherwise impede our objectives. These investments involve risks and uncertainties. Our partners may fail to provide capital or fulfill their obligations, which may result in certain liabilities to us for guarantees and other commitments or conflicts arising between us and our partners. It could be difficult for us to manage or otherwise adequately monitor such joint ventures, including managing and resolving any conflicts with our partners. Our partners also might become insolvent or bankrupt, which may result in significant losses to us.
Although our joint venture arrangements may allow us to share risks with our joint venture partners, these arrangements may also decrease our ability to manage risk. Joint ventures implicate additional risks, such as:
| • | potentially inferior financial capacity, diverging business goals and strategies and the need for our partners’ continued cooperation, |
| • | our inability to take actions with respect to joint venture activities that we believe are favorable if our joint venture partners do not agree, |
| • | our inability to control the legal entity that has title to the real estate associated with the joint venture, |
| • | our lenders may not be easily able to sell our joint venture assets and investments or may view them less favorably as collateral, which could negatively affect our liquidity and capital resources, |
| • | our joint venture partners can take actions that we may not be able to anticipate or prevent, which could result in negative impacts on our debt and equity, and |
| • | our joint venture partners’ business decisions or other actions or omissions may result in harm to our reputation or adversely affect the value of our investments. |
Our joint venture investments generally own real estate properties for which the economic performance and value are subject to all the risks associated with owning and operating real estate described in the risk factors above.
Inflation may adversely affect our financial condition and results of operations.
Many of our leases require the tenant to pay its share of operating expenses, including common area maintenance, real estate taxes and insurance. However, increased inflation may have a more pronounced negative impact on our mortgage and debt interest and general and administrative expenses because these costs could increase at a rate higher than our rents. Also, inflation may adversely affect tenant leases with stated rent increases or limits on such tenant’s obligation to pay its share of operating expenses, which could be lower than the increase in inflation at any given time. For example, certain of our triple-net and bond leases for freestanding retail properties do not include rent escalation clauses and therefore tenants under such leases pay a flat rental rate throughout the life of their lease. Inflation could also have an adverse effect on consumer spending, which may impact our tenants’ sales and, in turn, our average rents.
Our property taxes could increase due to property tax rate changes or reassessment, which may adversely impact our cash flows.
Even if our general partner continues to qualify as a REIT for United States federal income tax purposes, we will be required to pay certain taxes, including state and local taxes on our properties. The real property taxes on our properties may increase as property tax rates change or as our properties are assessed or reassessed by taxing authorities. Therefore, the amount of property taxes we pay in the future may increase substantially. If the property taxes we pay increase, our cash flow would be impacted, and our ability to pay expected distributions to our unitholders may be adversely affected.
9
Table of Contents
Our success depends on key personnel with extensive experience dealing with the commercial real estate industry, and the loss of these key personnel could threaten our ability to operate our business successfully.
Our future success depends, to a significant extent, on the continued services of our company’s management team. In particular, we depend on the efforts of Gary Sabin, our company’s Chairman and Chief Executive Officer, Spencer Plumb, our company’s President and Chief Operating Officer, James Nakagawa, our company’s Chief Financial Officer, Mark Burton, our company’s Chief Investment Officer and Senior Vice President of Acquisitions, and Eric Ottesen, our company’s Senior Vice President and General Counsel. Among the reasons that Messrs. Sabin, Plumb, Nakagawa, Burton and Ottesen are important to our success is that each has a national or regional reputation in the commercial real estate industry based on their extensive experience in running public and private companies, including REITs, devoted to real estate investment, management and development. Each member of our company’s management team has developed informal relationships through past business dealings with numerous members of the commercial real estate community, including current and prospective tenants, lenders, real estate brokers, developers and managers. We expect that their reputations will attract business and investment opportunities before the active marketing of properties and will assist us in negotiations with lenders, existing and potential tenants, and industry personnel. If we lost their services, our relationships with such lenders, existing and prospective tenants, and industry personnel could suffer. Our company has entered into employment agreements with each of our company’s executive officers, but we cannot guarantee that they will not terminate their employment prior to the end of the term.
Risks Related to the Real Estate Industry
Significant competition may decrease or prevent increases in our properties’ occupancy and rental rates and may reduce our investment opportunities.
We compete with numerous owners, operators and developers for acquisitions and development of retail shopping centers, including institutional investors, other REITs and other owner-operators of community and neighborhood shopping centers, some of which own or may in the future own properties similar to ours in the same submarkets in which our properties are located. We also face significant competition in leasing available space to prospective tenants at our operating properties. Due to continued uncertainty in the national economy and the pace of the current economic recovery, the amount of space available for lease generally and in the markets in which our properties are located remains greater than historic levels, with increased tenant delinquencies and defaults under leases, generally lower demand for rentable space and potential oversupply of rentable space. In addition, the state of the economy has impacted demand for retail products and services, which in turn has led to retail business failures or downsizings and reduced demand for retail space. The actual competition for tenants varies depending upon the characteristics of each local market (including current economic conditions) in which we own and manage property. We believe that the principal competitive factors in attracting tenants in our market areas are location, demographics, price, the presence of anchor stores and appearance of properties. Increased competition for tenants may require us to make unbudgeted capital improvements, while decreased occupancy could lower our revenues and cause us to incur expenses on vacant spaces, both of which may reduce cash available to pay distributions to our unitholders. Our competitors may have substantially greater financial resources than we do and may be able to accept more risk than we can prudently manage. In the future, competition from these entities may reduce the number of suitable investment opportunities offered to us or increase the bargaining power of property owners seeking to sell. Further, as a result of their greater resources, those entities may have more flexibility than we do in their ability to offer rental concessions to attract tenants. If our competitors offer space at rental rates below current market rates, or below the rental rates we currently charge our tenants, we may lose potential tenants and we may be pressured to reduce our rental rates below those we currently charge in order to retain tenants when our tenants’ leases expire. As a result, our financial condition, results of operations, cash flow, the value of our company’s securities, ability to satisfy our debt service obligations and ability to pay distributions to our unitholders may be adversely affected. As of March 31, 2013, leases were scheduled to expire in 2013, 2014 and 2015 on a total of approximately 4.4%, 7.6% and 12.4%, respectively, of the gross leasable area of our retail operating properties.
Uninsured and underinsured losses could adversely affect our operating results and our ability to pay distributions.
Many of our properties are located in states that are particularly susceptible to natural disasters (such as earthquakes, wildfires, hurricanes and other events), including our properties in California and the southeastern United States. We carry comprehensive general liability, fire, earthquake and extended coverage and loss of rental insurance covering all of our properties under a blanket portfolio policy. We believe the policy specifications and insured limits are adequate given the relative risk of loss, cost of the coverage and standard industry practice. We intend to carry similar insurance with respect to future acquisitions, as appropriate. In the future, we may be unable to renew or duplicate our current insurance coverage in adequate amounts or at reasonable prices. Insurance companies may no longer offer coverage against certain types of losses, such as losses due to terrorist acts, environmental liabilities, or other catastrophic events, or, if offered, the expense of obtaining these types of insurance may not be justified.
10
Table of Contents
If we experience a loss that is uninsured or that exceeds policy limits, we could lose the capital invested in the damaged properties as well as the anticipated future cash flows from those properties. We may choose not to use insurance proceeds to replace a property after it has been damaged or destroyed, if inflation, changes in building codes and ordinances, environmental considerations and other factors make it impractical or undesirable. In addition, if the damaged properties are subject to recourse indebtedness, we would continue to be liable for the indebtedness, even if these properties were irreparably damaged. If any of our properties were to experience a catastrophic loss, it could seriously disrupt our operations, delay revenue and result in large expenses to repair or rebuild the property. Events such as these could adversely affect our results of operations, our ability to meet our obligations and our ability to pay distributions to our unitholders.
While we evaluate the credit ratings of each of our insurance companies at the time we enter into or renew our policies, the financial condition of one or more of these insurance companies could significantly deteriorate to the point that they may be unable to pay future insurance claims. The inability of any of these insurance companies to pay future claims under our policies may adversely affect our financial condition and results of operations.
Our properties depend on anchor stores or major tenants to attract shoppers and could be adversely affected by the loss of, or a store closure by, one or more of these tenants.
Regional shopping centers are typically anchored by large, nationally recognized tenants. The value of our retail properties with anchor tenants, as well as the value of retail properties we may seek to acquire, could be adversely affected if these tenants fail to comply with their contractual obligations, seek concessions in order to continue operations or cease their operations. Consolidations among large retail establishments typically result in the closure of existing stores or duplicate or geographically overlapping store locations. We will not be able to control the disposition of those large retail establishments following a consolidation, nor will we control the vacant space that is not re-leased to closed stores. Some of our tenants are entitled to modify the terms of their existing leases in the event of such closures. The modification could be unfavorable to us as the lessor and could decrease rents or expense recovery charges. Additionally, major tenant closures may result in decreased customer traffic which could lead to decreased sales at other stores. If the sales of stores operating in our properties were to decline significantly due to closing of anchors, economic conditions or other reasons, tenants may be unable to pay their minimum rents or expense recovery charges. In the event of default by a tenant or anchor store, we may experience delays and costs in enforcing our rights as landlord to recover amounts due to us under the terms of our agreements with those parties.
Illiquidity of real estate investments may make it difficult for us to sell properties in response to market conditions and could harm our financial condition and ability to make distributions.
Equity real estate investments are relatively illiquid and therefore will tend to limit our ability to vary our portfolio promptly in response to changing economic or other conditions. To the extent the properties are not subject to triple-net leases, some significant expenditures such as real estate taxes and maintenance costs are generally not reduced when circumstances cause a reduction in income from the investment. Should these events occur, our income and funds available for distribution could be adversely affected. Properties subject to triple-net leases may, in certain circumstances, be more illiquid than other properties as they may have been developed to suit the needs of a particular tenant. In addition, as a REIT, our general partner may be subject to a 100% tax on net income derived from the sale of property considered to be held primarily for sale to customers in the ordinary course of its business. Our general partner may seek to avoid this tax by complying with certain safe harbor rules that generally limit the number of properties it may sell in a given year, the aggregate expenditures made on such properties prior to their disposition, and how long it retains such properties before disposing of them. However, we can provide no assurance that our general partner will always be able to comply with these safe harbors. If compliance is possible, the safe harbor rules may restrict our ability to sell assets in the future and achieve liquidity that may be necessary to fund distributions. In addition, some of our tenants have rights of first refusal or rights of first offer to purchase the properties, or portions thereof, in which they lease space in the event that we seek to dispose of such properties, or portions thereof. Other tenants have rights of first offer to lease any space in the property that is contiguous with their currently leased space. The presence of these rights of first refusal and rights of first offer could make it more difficult for us to sell these properties, or portions thereof, in response to market conditions.
We may be unable to renew leases, lease vacant space or re-lease space as leases expire, which could adversely affect our business and our ability to pay distributions to our unitholders.
If we cannot renew leases, we may be unable to re-lease our properties at rates equal to or above the current rate. Even if we can renew leases, tenants may be able to negotiate lower rates as a result of market conditions. Our properties currently are located in 15 states. The economic condition of each of our markets may be dependent on one or more industries. An economic downturn in one of these industry sectors or in the markets in which our properties are located may result in an increase in tenant bankruptcies, which may harm our performance in the affected market. Economic and market conditions also may affect the ability of our tenants to make lease payments. Market conditions may also hinder our ability to lease vacant space in newly developed properties. In addition, we may enter into or acquire leases for properties with spaces that are uniquely suited to the needs of a particular tenant. Such properties may require renovations, tenant improvements or other concessions in order to lease them to other tenants if the initial leases terminate. Any of these factors could adversely impact our financial condition, results of operations, cash flow, the value of our company’s securities, our ability to satisfy our debt service obligations and our ability to pay distributions.
11
Table of Contents
We may be unable to secure funds for future tenant or other capital improvements, which could limit our ability to attract or replace tenants and adversely impact our ability to make cash distributions to our unitholders.
When tenants do not renew their leases or otherwise vacate their space, it is common that, in order to attract replacement tenants, we will be required to expend funds for tenant improvements and other concessions related to the vacated space. Such tenant improvements may require us to incur substantial capital expenditures. We may not be able to fund capital expenditures solely from cash provided from our operating activities because our general partner must distribute at least 90% of its REIT taxable income excluding net capital gains each year to maintain its status as a REIT for United States federal income tax purposes. As a result, our ability to fund tenant and other capital improvements through our partners’ capital may be limited. If we have insufficient capital reserves, we will have to obtain financing from other sources. We may also have future financing needs for other capital improvements to refurbish or renovate our properties. If we are unable to secure financing on terms we feel are acceptable or at all, we may be unable to make tenant and other capital improvements or we may be required to defer such improvements. If this happens, it may cause one or more of our properties to suffer from a greater risk of obsolescence or a decline in value, as a result of fewer potential tenants being attracted to the property or existing tenants not renewing their leases. If we do not have access to sufficient funding in the future, we may not be able to make necessary capital improvements to our properties, pay other expenses or pay distributions to our unitholders.
We could incur significant costs related to government regulation and private litigation over environmental matters involving the presence, discharge or threat of discharge of hazardous or toxic substances, which could adversely affect our operations, the value of our properties, and our ability to make distributions to our unitholders.
Our properties may be subject to environmental liabilities. Under various federal, state and local laws, a current or previous owner, operator or tenant of real estate can face liability for environmental contamination created by the presence, discharge or threat of discharge of hazardous or toxic substances. Liabilities can include the cost to investigate, clean up and monitor the actual or threatened contamination and damages caused by the contamination (or threatened contamination).
The liability under such laws may be strict, joint and several, meaning that we may be liable regardless of whether we knew of, or were responsible for, the presence of the contaminants, and the government entity or private party may seek recovery of the entire amount from us even if there are other responsible parties. Liabilities associated with environmental conditions may be significant and can sometimes exceed the value of the affected property. The presence of hazardous substances on a property may adversely affect our ability to sell or rent that property or to borrow using that property as collateral.
Environmental laws also:
| • | may require the removal or upgrade of underground storage tanks, |
| • | regulate the discharge of storm water, wastewater and other pollutants, |
| • | regulate air pollutant emissions, |
| • | regulate hazardous materials’ generation, management and disposal, and |
| • | regulate workplace health and safety. |
We are unaware of any of our existing tenants or any of the tenants in the properties we intend to acquire violating applicable laws and regulations, but we and our tenants cannot completely eliminate the risk of contamination or injury from these materials. If our properties become contaminated, or if a party is injured, we could be held liable for any damages that result. Such liability could exceed our resources and any environmental remediation insurance coverage we have, which could adversely affect our operations, the value of our properties, and our ability to pay distributions.
Existing conditions at some of our properties may expose us to liability related to environmental matters.
Independent environmental consultants have conducted Phase I or similar environmental site assessments on all of the properties in our portfolio. Each of the site assessments has been completed as part of the due diligence in the acquisition process. Site assessments are intended to discover and evaluate information regarding the environmental condition of the surveyed property and surrounding properties. These assessments do not generally include subsurface investigations or mold or asbestos surveys. None of the recent site assessments revealed any past or present environmental liability that we believe would have a material adverse effect on our business, assets or results of operations. However, the assessments may have failed to reveal all environmental conditions, liabilities or compliance concerns. Material environmental conditions, liabilities or compliance concerns may have arisen after the review was completed or may arise in the future; and future laws, ordinances or regulations may impose material additional environmental liability.
12
Table of Contents
We cannot assure you that costs of future environmental compliance will not affect our ability to pay distributions or that such costs or other remedial measures will not have a material adverse effect on our business, assets or results of operations.
Our properties may contain asbestos or develop harmful mold, which could lead to liability for adverse health effects and costs of remediating the problem, which could adversely affect the value of the affected property and our ability to pay distributions to our unitholders.
We are required by federal regulations with respect to our properties to identify and warn, via signs and labels, of potential hazards posed by workplace exposure to installed ACMs, and potential ACMs. We may be subject to an increased risk of personal injury lawsuits by workers and others exposed to ACMs and potential ACMs at our properties as a result of these regulations. The regulations may affect the value of any of our properties containing ACMs and potential ACMs. Federal, state and local laws and regulations also govern the removal, encapsulation, disturbance, handling and/or disposal of ACMs and potential ACMs when such materials are in poor condition or in the event of construction, remodeling, renovation or demolition of a property.
When excessive moisture accumulates in buildings or on building materials, mold growth may occur, particularly if the moisture problem remains undiscovered or is not addressed over a period of time. Some molds may produce airborne toxins or irritants. Concern about indoor exposure to mold has been increasing because exposure to mold may cause a variety of adverse health effects and symptoms, including allergic or other reactions.
The presence of ACMs or significant mold at any of our properties could require us to undertake a costly remediation program to contain or remove the ACMs or mold from the affected property. In addition, the presence of ACMs or significant mold could expose us to liability to our tenants, their or our company’s employees, and others if property damage or health concerns arise.
Compliance with the Americans with Disabilities Act and similar laws may require us to make significant unanticipated expenditures.
Our properties are required to comply with the ADA. The ADA requires that all public accommodations must meet federal requirements related to access and use by disabled persons. We believe that our properties were built in substantial conformance with the building codes of their respective cities, including in substantial compliance with the applicable ADA requirements at the time of construction. If one or more properties is not in compliance with the ADA, then we would be required to bring the non-compliant properties into compliance. Compliance with the ADA could require removing access barriers. Non-compliance could result in imposition of fines by the U.S. government or an award of damages and/or attorneys’ fees to private litigants, or both. Additional federal, state and local laws also may require us to modify properties or could restrict our ability to renovate properties. Complying with the ADA or other legislation at non-compliant properties could be very expensive. If we incur substantial costs to comply with such laws, our financial condition, results of operations, cash flow, the value of our company’s securities, our ability to satisfy our debt service obligations and our ability to pay distributions to our unitholders could be adversely affected.
We may incur significant unexpected costs to comply with fire, safety and other regulations, which could adversely impact our financial condition, results of operations, and ability to pay distributions to our unitholders.
Our properties are subject to various federal, state and local regulatory requirements, such as state and local fire and safety requirements, building codes and land use regulations. If we fail to comply with these requirements, we could be subject to governmental fines or private damage awards. We believe that our properties are currently in material compliance with all applicable regulatory requirements. However, we do not know whether existing requirements will change or whether future requirements, including any requirements that may emerge from pending or future climate change legislation, will require us to make significant unanticipated expenditures that will adversely impact our financial condition, results of operations, cash flow, the value of our company’s securities, our ability to satisfy our debt service obligations and our ability to pay distributions.
Increased competition and affordability of residential homes could limit our ability to retain our residents, lease apartment units or maintain or increase rents at our multi-family apartment units.
Our multi-family apartment units at our West Broad Village property compete with numerous housing alternatives in attracting residents, including other multi-family apartment properties and single-family rental homes, as well as owner occupied single—and multi-family homes. Competitive housing markets and an increase in the affordability of owner occupied single—and multi-family homes due to, among other things, declining housing prices, oversupply of housing, low mortgage interest rates, and tax incentives and government programs to promote home ownership, could adversely affect our ability to retain residents, lease apartment units and maintain or increase rents, which in turn could adversely affect our financial performance.
13
Table of Contents
Litigation may result in unfavorable outcomes.
Like many real estate operators, we may be involved in lawsuits involving premises liability claims and alleged violations of landlord-tenant laws, which may give rise to class action litigation or governmental investigations. Any material litigation not covered by insurance, such as a class action, could result in us incurring substantial costs, harm our financial condition, results of operations, cash flow and ability to pay distributions.
Risks Related to Our Organizational Structure
Our general partner’s duty to its stockholders may conflict with the interests of our unitholders.
Conflicts of interest exist or could arise in the future as a result of the relationships between us or any of our partners, on the one hand, and our general partner and its stockholders or affiliates, on the other. Our general partner’s directors and officers have duties to our general partner and its stockholders under Maryland law in connection with their management of our general partner. At the same time, our general partner has duties to us and to our limited partners in connection with its management of us. Our general partner’s duties, as general partner, to us and our limited partners may come into conflict with the duties of its directors and officers to our general partner and its stockholders. Our general partner is under no obligation to give priority to the separate interests of our limited partners or our general partner’s stockholders in deciding whether to cause us to take or decline to take any actions. Our limited partners expressly acknowledge that, as our general partner, Excel Trust, Inc. is acting for the benefit of its stockholders and for the benefit of us and our limited partners collectively.
Our general partner may choose not to enforce, or to enforce less vigorously, our company’s rights under contribution and other agreements because of conflicts of interest with certain of our company’s directors and officers. Messrs. Sabin, Plumb, Nakagawa, Burton, Ottesen and Romney and other individuals and entities not affiliated with us or our company’s management had ownership interests in the properties contributed to us in our formation transactions. Under the agreements relating to the contribution of those interests, our company is entitled to indemnification and damages in the event of breaches of representations or warranties made by the members of our company’s management and other contributors. In addition, certain members of senior management have entered into employment agreements with our company pursuant to which they have agreed to devote substantially all of their business time to our company’s affairs. None of these contribution and employment agreements were negotiated on an arm’s length basis. Our general partner may choose not to enforce, or to enforce less vigorously, our company’s rights under these contribution and employment agreements because of our general partner’s desire to maintain our ongoing relationships with the individuals involved.
Members of our company’s executive management team have outside business interests that could require time and attention. Members of our company’s executive management team own interests in properties that have not been contributed to us. In some cases, one or more of these individuals or their affiliates will have management and fiduciary obligations that may conflict with that person’s responsibilities as an officer of our company and may adversely affect our operations. For example, Mr. Sabin and certain of our senior management team own and manage various properties that have not been contributed to us.
Certain of our company’s directors and officers may face adverse tax consequences that could prevent the repayment of indebtedness. The repayment of indebtedness relating to our Excel Centre property will have different effects on our unitholders than on our general partner’s stockholders. The parties that contributed this property to us would incur adverse tax consequences upon the repayment of related debt that differ from the tax consequences to our general partner and its stockholders. Consequently, our unitholders, including Messrs. Sabin, Nakagawa, Burton and Ottesen, may have different objectives regarding the appropriate timing of any such repayment of debt. Certain of our company’s directors and officers could exercise their influence in a manner inconsistent with the interests of some, or a majority, of our general partner’s stockholders, including in a manner which could delay or prevent the repayment of indebtedness.
Our partnership agreement, our general partner’s charter and bylaws and Maryland law contain provisions that may delay, defer or prevent a change of control of our general partner that may be beneficial to our unitholders and stockholders of our general partner.
Our limited partners have limited approval rights, which may prevent our general partner from completing a change of control transaction. Our general partner may not withdraw as our general partner or transfer its general partnership interest in us without the consent of limited partners holding more than 50% of the operating partnership units held by all limited partners (excluding any limited partners owned or controlled by our general partner). In addition, except in certain circumstances, our general partner may not engage in a merger, consolidation, or other combination or the sale of all or substantially all of its assets or such similar transaction, without the consent of the partners holding more than 50% of all outstanding common operating partnership units, including the units held by our general partner, as more fully set forth in our partnership agreement. The right of our limited partners to vote on these transactions could limit our ability to complete a change of control transaction that might otherwise be in the best interest of our unitholders and stockholders of our general partner.
14
Table of Contents
Our general partner’s charter contains ownership limits that may delay, defer or prevent a change of control transaction. Our general partner’s charter, with certain exceptions, authorizes its board of directors to take such actions as are necessary and desirable to preserve our general partner’s qualification as a REIT. In addition, our general partner’s charter contains certain restrictions on ownership and transfer of its capital stock which prohibit any person, unless exempted by its board of directors, from, among other things, acquiring or holding, directly or indirectly, (1) in excess of 9.8% in value of the aggregate of our general partner’s outstanding shares of capital stock, (2) common stock in excess of 9.8% (in value or in number of shares, whichever is more restrictive) of our general partner’s outstanding shares of common stock, (3) 7.00% Series A Cumulative Convertible Perpetual Preferred Stock, or Series A preferred stock, in excess of 9.8% (in value or in number of shares, whichever is more restrictive) of our general partner’s outstanding shares of Series A preferred stock or (4) 8.125% Series B Cumulative Redeemable Preferred Stock, or Series B preferred stock, in excess of 9.8% (in value or in number of shares, whichever is more restrictive) of our general partner’s outstanding shares of Series B preferred stock. Among other restrictions, the board of directors may not grant such an exemption to any proposed transferee whose ownership of in excess of the applicable ownership limit would result in our general partner failing to qualify as a REIT. These restrictions on transferability and ownership will not apply if our general partner’s board of directors determines that it is no longer in our general partner’s best interests to attempt to qualify as a REIT. The ownership limits may delay or impede a transaction or a change of control that might involve a premium price for our general partner’s common stock or otherwise be in the best interests of our unitholders and stockholders of our general partner.
Our general partner could authorize and issue stock without unitholder or stockholder approval that may delay, defer or prevent a change of control transaction. Our general partner’s charter authorizes it to issue additional authorized but unissued shares of common stock or preferred stock. In addition, our general partner’s board of directors may classify or reclassify any unissued shares of common stock or preferred stock and may set the preferences, rights and other terms of the classified or reclassified shares. The board of directors may also, without unitholder or stockholder approval, amend our general partner’s charter to increase the authorized number of shares of common stock or preferred stock that our general partner may issue. The board of directors could establish a series of common stock or preferred stock that could, depending on the terms of such series, delay, defer or prevent a transaction or a change of control that might involve a premium price for our general partner’s common stock or otherwise be in the best interests of our unitholders and stockholders of our general partner.
Certain provisions of Maryland law could delay, defer or prevent a change of control transaction. Certain provisions of the Maryland General Corporation Law, or MGCL, may have the effect of inhibiting a third party from making a proposal to acquire our company or of impeding a change of control. In some cases, such an acquisition or change of control could provide you with the opportunity to realize a premium for your operating partnership units over the then-prevailing market price of our general partner’s common stock. These MGCL provisions include:
| • | “business combination” provisions that, subject to limitations, prohibit certain business combinations between our company and an “interested stockholder” for certain periods. An “interested stockholder” is generally any person who beneficially owns 10% or more of the voting power of our general partner’s shares or an affiliate or associate of ours who, at any time within the two-year period prior to the date in question, was the beneficial owner of 10% or more of the voting power of our general partner’s then outstanding voting stock. A person is not an interested stockholder under the statute if our general partner’s board of directors approved in advance the transaction by which he otherwise would have become an interested stockholder. Business combinations with an interested stockholder are prohibited for five years after the most recent date on which the stockholder becomes an interested stockholder. After that period, the MGCL imposes two super-majority voting requirements on such combinations, and |
| • | “control share” provisions that provide that “control shares” of our general partner acquired in a “control share acquisition” have no voting rights unless holders of two-thirds of our general partner’s voting stock (excluding interested shares) consent. “Control shares” are shares that, when aggregated with other shares controlled by the stockholder, entitle the stockholder to exercise one of three increasing ranges of voting power in electing directors. A “control share acquisition” is the direct or indirect acquisition of ownership or control of “control shares” from a party other than the issuer. |
In the case of the business combination provisions of the MGCL, our general partner opted out by resolution of its board of directors. In the case of the control share provisions of the MGCL, our general partner opted out pursuant to a provision in its bylaws. However, our general partner’s board of directors may by resolution elect to opt in to the business combination provisions of the MGCL. Further, our general partner may opt in to the control share provisions of the MGCL in the future by amending its bylaws, which its board of directors can do without unitholder or stockholder approval.
Maryland law, and our general partner’s charter and bylaws also contain other provisions that may delay, defer or prevent a transaction or a change of control that might involve a premium price for our general partner’s common stock or otherwise be in the best interests of our unitholders and stockholders of our general partner.
15
Table of Contents
The ability of our general partner’s board of directors to revoke its REIT status without unitholder or stockholder approval may cause adverse consequences to our unitholders.
Our general partner’s charter provides that its board of directors may revoke or otherwise terminate our general partner’s REIT election, without the approval of our unitholders or our general partner’s stockholders, if the board of directors determines that it is no longer in our company’s best interest for our general partner to continue to qualify as a REIT. If our general partner ceases to be a REIT, it would become subject to United States federal income tax on its taxable income and would no longer be required to distribute most of its taxable income to our unitholders and stockholders of our general partner, which may have adverse consequences on our total return to our unitholders and stockholders of our general partner.
Our general partner’s board of directors may amend our company’s investing and financing guidelines without unitholder or stockholder approval, and, accordingly, you would have limited control over changes in our company’s policies that could increase the risk we default under our debt obligations or that could harm our business, results of operations and price of our company’s securities.
Although we are not required to maintain any particular leverage ratio, we intend, when appropriate, to employ prudent amounts of leverage and to use debt as a means of providing additional funds for the acquisition of our target assets and the diversification of our portfolio. Our general partner’s board of directors has adopted long-term guidelines targeting our company’s indebtedness at less than 40% of our gross undepreciated asset value, although we may, from time to time, exceed this amount. However, our company’s organizational documents do not limit the amount or percentage of debt that our company may incur, nor do they limit the types of properties our company may acquire or develop. The amount of leverage we will deploy for particular investments in our target assets will depend upon the assessment of a variety of factors by our company’s management team, which may include the anticipated liquidity and price volatility of the target assets in our investment portfolio, the potential for losses, the availability and cost of financing the assets, our opinion of the creditworthiness of our financing counterparties, the health of the U.S. economy and commercial mortgage markets, our outlook for the level, slope and volatility of interest rates, the credit quality of our target assets and the collateral underlying our target assets. Our general partner’s board of directors may alter or eliminate our company’s current guidelines on borrowing or investing at any time without unitholder or stockholder approval. Changes in our company’s strategy or in our investment or leverage guidelines could expose us to greater credit risk and interest rate risk and could also result in a more leveraged balance sheet. These factors could result in an increase in our debt service and could adversely affect our cash flow and our ability to make expected distributions to our unitholders. Higher leverage also increases the risk we would default on our debt.
Risks Related to Our Capital Structure
Debt obligations expose us to increased risk of property losses and default under our debt obligations, which could have adverse consequences on our business operations and our ability to pay distributions.
As of March 31, 2013, we had outstanding mortgage indebtedness of approximately $332.7 million, and we may incur significant additional debt to finance future acquisition and development activities. We also had $88.0 million of debt and commitments outstanding under our unsecured revolving credit facility, which includes a $12.1 million letter of credit issued under the facility. The capacity of the credit facility may be increased by up to an additional $200.0 million to a total borrowing capacity of $450.0 million, subject to receipt of lender commitments and other conditions precedent.
Although our company’s organizational documents do not require us to maintain any particular leverage ratio, we intend, when appropriate, to employ prudent amounts of leverage and to use debt as a means of providing additional funds for the acquisition of our target assets and the diversification of our portfolio. Our company’s board of directors has adopted long-term guidelines targeting our company’s indebtedness at less than 40% of our gross undepreciated asset value, although we may, from time to time, exceed this amount. Our company’s organizational documents do not limit the amount or percentage of debt that we may incur, nor do they limit the types of properties we may acquire or develop. The amount of leverage we will deploy for particular investments in our target assets will depend upon the assessment by our company’s management team of a variety of factors, which may include the anticipated liquidity and price volatility of the target assets in our investment portfolio, the potential for losses, the availability and cost of financing the assets, our opinion of the creditworthiness of our financing counterparties, the health of the U.S. economy and commercial mortgage markets, our outlook for the level, slope and volatility of interest rates, the credit quality of our target assets and the collateral underlying our target assets. Our company’s board of directors may alter or eliminate our company’s current guidelines on borrowing or investing at any time without stockholder or unitholder approval. Changes in our company’s strategy or investment or leverage guidelines could expose us to greater credit risk and interest rate risk and could also result in a more leveraged balance sheet. These factors could result in an increase in our debt service and could adversely affect our cash flow and our ability to make expected distributions. Higher leverage also increases the risk we would default on our debt.
16
Table of Contents
We have used and will continue to use debt to finance property acquisitions. Our use of debt may have adverse consequences, including the following:
| • | Required payments of principal and interest may be greater than our cash flow from operations. |
| • | We may be forced to dispose of one or more of our properties, possibly on disadvantageous terms, to make payments on our debt. |
| • | If we default on our debt obligations, the lenders or mortgagees may foreclose on our properties that secure those loans. Further, if we default under a mortgage loan, we will automatically be in default on any other loan that has cross-default provisions, and we may lose the properties securing all of these loans. |
| • | A foreclosure on one of our properties will be treated as a sale of the property for a purchase price equal to the outstanding balance of the secured debt. If the outstanding balance of the secured debt exceeds our tax basis in the property, we would recognize taxable income on foreclosure without realizing any accompanying cash proceeds to pay the tax (or to make distributions based on REIT taxable income). |
| • | We may not be able to refinance or extend our existing debt. If we cannot repay, refinance or extend our debt at maturity, in addition to our failure to repay our debt, we may be unable to pay distributions to our unitholders at expected levels or at all. |
| • | Even if we are able to refinance or extend our existing debt, the terms of any refinancing or extension may not be as favorable as the terms of our existing debt. If the refinancing involves a higher interest rate, it could adversely affect our cash flow and ability to pay distributions to our unitholders. |
If any one of the above were to occur, our financial condition, results of operations, cash flow, cash available for distribution to you, the value of our company’s securities and our ability to satisfy our debt service obligations could be materially adversely affected.
Our unsecured revolving credit facility contains restrictive covenants relating to our operations, which could limit our ability to respond to changing market conditions and our ability to pay distributions.
Our unsecured revolving credit facility imposes restrictions on us that affect our distribution and operating policies and our ability to incur additional debt. For example, we are subject to a maximum leverage ratio (defined as total liabilities to total asset value) of 0.60 to 1.00, which could have the effect of reducing our ability to incur additional debt and consequently reduce our ability to pay distributions. The unsecured revolving credit facility also contains limitations on our ability to pay distributions. Specifically, our cash dividends may not exceed the greater of (1) 95% of our FFO (as defined in the credit agreement), and (2) the amount required for our general partner to qualify and maintain its REIT status. If an event of default exists, we may only make distributions sufficient to qualify and maintain our general partner’s REIT status. In addition, the unsecured revolving credit facility contains customary restrictive covenants requiring us to maintain a minimum fixed charge coverage ratio, a maximum secured indebtedness ratio, a maximum unencumbered leverage ratio, a minimum unencumbered interest coverage ratio and a minimum tangible net worth. These or other limitations may adversely affect our flexibility and our ability to achieve our operating plans and could result in us being limited in the amount of distributions we would be permitted to pay to our unitholders.
Disruptions in the financial markets and the downturn of the broader U.S. economy could affect our ability to obtain debt financing on reasonable terms or at all and have other adverse effects on us.
In recent years, the U.S. credit markets have experienced significant dislocations and liquidity disruptions. These circumstances continue to impact liquidity in the debt markets, making financing terms for some borrowers less attractive, and in certain cases have resulted in the unavailability of certain types of debt financing. Uncertainty in the credit markets may negatively impact our ability to access additional debt financing or to refinance existing debt maturities on reasonable terms (or at all), which may negatively affect our ability to conduct operations, make acquisitions and fund current and future development and redevelopment projects. In addition, if the financial position of the lenders under our credit facilities worsen, they could default on their obligations to make available to us the funds under those facilities. If we are unable to obtain financing in the credit markets, we may seek alternative sources of potentially less attractive financing, and have to adjust our business plan accordingly. In addition, these factors could make it more difficult for us to sell properties or adversely affect the price we receive for properties that we do sell, as prospective buyers may experience increased costs of debt financing or difficulties in obtaining debt financing. Adverse events in the credit markets could also have an adverse effect on other financial markets in the United States and globally, including the stock markets, which could make it more difficult or costly for our general partner to raise capital through the issuance of common stock, preferred stock or other equity securities.
17
Table of Contents
We may engage in hedging transactions, which can limit our gains and increase exposure to losses.
Subject to the requirements for maintaining our general partner’s qualification as a REIT, we may enter into hedging transactions to protect us from the effects of interest rate fluctuations on floating rate debt. Our hedging transactions may include entering into interest rate swap agreements or interest rate cap or floor agreements, or other interest rate exchange contracts. Hedging activities may not have the desired beneficial impact on our results of operations or financial condition. No hedging activity can completely insulate us from the risks associated with changes in interest rates. Moreover, interest rate hedging could fail to protect us or adversely affect us because, among other things:
| • | available interest rate hedging may not correspond directly with the interest rate risk for which we seek protection, |
| • | the duration of the hedge may not match the duration of the related liability, |
| • | the party owing money in the hedging transaction may default on its obligation to pay, |
| • | the credit quality of the party owing money on the hedge may be downgraded to such an extent that it impairs our ability to sell or assign our side of the hedging transaction, and |
| • | the value of derivatives used for hedging may be adjusted from time to time in accordance with accounting rules to reflect changes in fair value, such downward adjustments, or “mark-to-market losses,” which would reduce the value of our company’s equity. |
Hedging involves risk and typically involves costs, including transaction costs, that may reduce our overall returns on our investments. These costs increase as the period covered by the hedging increases and during periods of rising and volatile interest rates. These costs will also limit the amount of cash available for distribution to our unitholders. We generally intend to hedge as much of the interest rate risk as our company’s management determines is in our best interests given the cost of such hedging transactions. The REIT qualification rules may limit our ability to enter into hedging transactions by requiring us to limit our income from non-qualifying hedges. If we are unable to hedge effectively because of the REIT rules, we will face greater interest rate exposure than may be commercially prudent.
Increases in interest rates could increase the amount of our debt payments and adversely affect our ability to pay distributions to our unitholders.
Interest we pay could reduce cash available for distributions. As of March 31, 2013, we had $163.9 million of variable rate mortgage debt outstanding and $100.1 million of debt and commitments outstanding under our unsecured revolving credit facility, which includes a $12.1 million letter of credit issued under the facility. Our unsecured revolving credit facility bears interest at the rate of LIBOR plus a margin of 165 basis points to 225 basis points, depending on our leverage ratio. We may incur variable rate debt in the future, including mortgage debt and amounts under our unsecured revolving credit facility. Any increase in interest rates would increase our interest costs with respect to our variable rate debt. These increased interest costs would reduce our cash flows and our ability to make distributions to our unitholders. In addition, if we need to repay existing debt during a period of rising interest rates, we could be required to liquidate one or more of our investments in properties at times that may not permit realization of the maximum return on such investments.
If we fail to obtain external sources of capital, which is outside of our control, we may be unable to pay distributions to our unitholders or fund growth, and our general partner may be unable to maintain its REIT status.
In order for our general partner to maintain its status as a REIT and to avoid incurring a nondeductible excise tax, our general partner is required, among other things, to distribute annually at least 90% of its REIT taxable income, excluding any net capital gain. In addition, our general partner will be subject to income tax at regular corporate rates to the extent that it distributes less than 100% of its REIT taxable income, including any net capital gains. Because of these distribution requirements, we may not be able to fund future capital needs, including any necessary acquisition financing, from operating cash flow. Consequently, we rely on third-party sources to fund our capital needs. We may not be able to obtain financings on favorable terms or at all. Our access to third-party sources of capital depends, in part, on:
| • | general market conditions, |
| • | the market’s perception of our growth potential, |
| • | with respect to acquisition financing, the market’s perception of the value of the properties to be acquired, |
| • | our current debt levels, |
| • | our current and expected future earnings, |
| • | our cash flow and cash distributions, and |
| • | the market price per share of our general partner’s common stock. |
18
Table of Contents
It will adversely affect our business and limit our growth if we are unable to obtain capital from third-party sources. Without sufficient capital, we may not be able to acquire or develop properties when strategic opportunities exist, satisfy our debt service obligations or make the cash distributions to our general partner necessary for it to maintain its qualification as a REIT.
Risks Related to Our General Partner’s Status as a REIT
Our general partner’s failure to continue to qualify as a REIT under the Internal Revenue Code of 1986, as amended, would result in significant adverse tax consequences to us and would adversely affect our business.
We believe our general partner has operated and intends to continue operating in a manner that will allow it to continue to qualify as a REIT for United States federal income tax purposes under the Internal Revenue Code of 1986, as amended, or the Code, commencing with our general partner’s taxable year ended December 31, 2010. Qualification as a REIT involves the application of highly technical and complex Code provisions, for which there are only limited judicial and administrative interpretations. The fact that we hold substantially all of our general partner’s assets further complicates the application of the REIT requirements. Even a seemingly minor technical or inadvertent mistake could jeopardize our general partner’s REIT status. Our general partner’s REIT status depends upon various factual matters and circumstances that may not be entirely within our control. For example, in order to continue to qualify as a REIT, at least 95% of our general partner’s gross income in any year must be derived from qualifying sources, such as rents from real property, and our general partner must satisfy a number of requirements regarding the composition of its assets. Also, our general partner must make distributions to its stockholders aggregating annually at least 90% of its REIT taxable income, excluding net capital gains. In addition, new legislation, regulations, administrative interpretations or court decisions, each of which could have retroactive effect, may make it more difficult or impossible for our general partner to continue to qualify as a REIT, or could reduce the desirability of an investment in a REIT relative to other investments. Our general partner has not requested and does not plan to request a ruling from the Internal Revenue Service, or IRS, that it qualifies as a REIT, and the statements herein are not binding on the IRS or any court. Accordingly, we cannot be certain that our general partner will be successful in qualifying as a REIT.
If our general partner fails to continue to qualify as a REIT in any taxable year, our company will face serious adverse tax consequences that would substantially reduce the funds available to distribute to you. If our general partner fails to continue to qualify as a REIT:
| • | it would not be allowed to deduct distributions to stockholders in computing its taxable income and would be subject to United States federal income tax at regular corporate rates, |
| • | it could also be subject to the United States federal alternative minimum tax and possibly increased state and local taxes, and |
| • | unless it is entitled to relief under applicable statutory provisions, our general partner could not elect to be taxed as a REIT for four taxable years following the year in which it was disqualified. |
In addition, if our general partner fails to continue to qualify as a REIT, it will not be required to make distributions to stockholders, and accordingly, distributions that we make to our unitholders could be similarly reduced. As a result of all these factors, our general partner’s failure to continue to qualify as a REIT could impair our ability to expand our business and raise capital and would adversely affect the value of our company’s securities.
To maintain our general partner’s REIT status, our company may be forced to borrow funds during unfavorable market conditions to pay distributions to our general partner’s stockholders.
To maintain our general partner’s REIT status, our general partner must distribute to its stockholders at least 90% of its REIT taxable income each year, excluding any net capital gain, and our general partner will be subject to regular corporate income taxes to the extent that it distributes less than 100% of its REIT taxable income each year. In addition, our general partner will be subject to a 4% nondeductible excise tax on the amount, if any, by which distributions paid by it in any calendar year are less than the sum of 85% of its ordinary income, 95% of its capital gain net income and 100% of its undistributed income from prior years. To maintain our general partner’s REIT status and avoid the payment of income and excise taxes our company may need to borrow funds for our general partner to meet the REIT distribution requirements. These borrowing needs could result from:
| • | differences in timing between the actual receipt of cash and inclusion of income for United States federal income tax purposes, |
| • | the effect of non-deductible capital expenditures, |
19
Table of Contents
| • | the creation of reserves, or |
| • | required debt or amortization payments. |
Our company may need to borrow funds at times when the then-prevailing market conditions are not favorable for borrowing. These borrowings could increase our costs or reduce our equity and adversely affect the value of our company’s securities.
Dividends payable by REITs do not qualify for the reduced tax rates available for some dividends.
Income from “qualified dividends” payable to U.S. stockholders that are individuals, trusts and estates are generally subject to tax at preferential rates. Dividends payable by REITs, however, are not eligible for the preferential tax rates applicable to qualified dividend income. Although these rules do not adversely affect the taxation of REITs or dividends payable by REITs, to the extent that the preferential rates continue to apply to regular corporate qualified dividends, investors who are individuals, trusts and estates may perceive investments in REITs to be relatively less attractive than investments in the stock of non-REIT corporations that pay dividends, which could adversely affect the value of the shares of REITs, including the value of our general partner’s capital stock.
Complying with REIT requirements may limit our company’s ability to hedge effectively and may cause our company to incur tax liabilities.
The REIT provisions of the Code limit our general partner’s ability to hedge its liabilities. Any income from a hedging transaction our general partner enters into to manage risk of interest rate changes, price changes or currency fluctuations with respect to borrowings made or to be made to acquire or carry real estate assets does not constitute “gross income” for purposes of the 75% or 95% gross income tests applicable to REITs . In addition, such hedging transactions must be properly identified as provided in the Treasury regulations. If our general partner enters into other types of hedging transactions, the income from those transactions is likely to be treated as non-qualifying income for purposes of the gross income tests applicable to REITs. As a result of these rules, our company may need to limit its use of advantageous hedging techniques or implement those hedges through a taxable REIT subsidiary, or TRS. This could increase the cost of our company’s hedging activities because our TRS would be subject to tax on gains or expose our company to greater risks associated with changes in interest rates than our company would otherwise want to bear.
The tax imposed on REITs engaging in “prohibited transactions” may limit our company’s ability to engage in transactions which would be treated as sales for United States federal income tax purposes.
A REIT’s net income from prohibited transactions is subject to a 100% penalty tax. In general, prohibited transactions are sales or other dispositions of property, other than foreclosure property held in inventory primarily for sale to customers in the ordinary course of business. Although we do not intend to hold any properties that would be characterized as inventory held for sale to customers in the ordinary course of our business, unless the sale or disposition of a property qualifies under certain statutory safe harbors, such characterization is a factual determination and no guarantee can be given that the IRS would agree with our characterization of our properties or that we will always be able to make use of the available safe harbors.
To maintain our general partner’s REIT status, we may be forced to forego otherwise attractive opportunities.
To maintain our general partner’s REIT status, our general partner must satisfy tests concerning, among other things, the sources of its income, the nature and diversification of its assets, the amounts it distributes to its stockholders and the ownership of its stock. Our general partner may be required to make distributions to stockholders at times when it would be more advantageous to reinvest cash in our business or when it does not have funds readily available for distribution. Thus, compliance with the REIT requirements may hinder our ability to operate solely on the basis of maximizing profits.
In particular, our general partner must ensure that at the end of each calendar quarter, at least 75% of the value of its assets consists of cash, cash items, government securities and qualified real estate assets. The remainder of its investment in securities (other than government securities, securities of any TRS or qualified REIT subsidiary of our company and securities that are qualified real estate assets) generally may not include more than 10% of the outstanding voting securities of any one issuer or more than 10% of the total value of the outstanding securities of any one issuer. In addition, in general, no more than 5% of the value of our general partner’s assets (other than government securities, securities of any TRS or qualified REIT subsidiary of our company and securities that are qualified real estate assets) may consist of the securities of any one issuer. If our general partner fails to comply with these requirements at the end of any calendar quarter, our general partner must remedy the failure within 30 days or qualify for certain limited statutory relief provisions to avoid losing status as a REIT. As a result, we may be required to liquidate otherwise attractive investments. These actions could have the effect of reducing our income and amounts available for distribution to our unitholders.
20
Table of Contents
Our general partner may be subject to adverse legislative or regulatory tax changes that could increase our tax liability and reduce our operating flexibility.
At any time, the United States federal income tax laws governing REITs may be amended or the administrative and judicial interpretations of those laws may be changed. We cannot predict when or if any new United States federal income tax law, regulation, or administrative and judicial interpretation, or any amendment to any existing United States federal income tax law, regulation or administrative or judicial interpretation, will be adopted, promulgated or become effective, and any such law, regulation, or interpretation may be effective retroactively. We and our unitholders could be adversely affected by any such change in, or any new, United States federal income tax law, regulation or administrative and judicial interpretation.
Risks Related to Our Mortgage Loan and Note Receivables
We may not be able to recover our investment in our mortgage loan or note receivables which may result in a significant loss to us.
From time to time, we may invest in mortgage loan or note receivables. At March 31, 2013, we had one investment in a $750,000 note receivable. Our investments in note receivables normally are not insured or otherwise guaranteed by any institution or agency. In the event of default by a borrower, it may be necessary for us to foreclose our mortgage or engage in costly negotiations. Delays in liquidating defaulted loans and repossessing and selling the underlying properties or other assets of the borrower could reduce our investment returns. Furthermore, in the event of default, the actual value of the property or other assets securing the loan may decrease. A decline in real estate values will adversely affect the value of our loans and the value of the mortgages securing our loans.
Our mortgage receivables may be or become subordinated to mechanics’ or materialmen’s liens or property tax liens. In these instances, we may need to protect a particular investment by making payments to maintain the current status of a prior lien or discharge it entirely. In these cases, the total amount we recover may be less than our total investment, resulting in a loss and our mortgage receivables may be materially and adversely affected.
Forward-Looking Statements
This registration statement contains “forward-looking statements” within the meaning of the federal securities laws. In particular, statements pertaining to our capital resources, portfolio performance and results of operations contain forward-looking statements. Likewise, our statements regarding anticipated growth in our funds from operations, or FFO, and anticipated market conditions, demographics and results of operations are forward-looking statements. Forward-looking statements involve numerous risks and uncertainties, and you should not rely on them as predictions of future events. Forward-looking statements depend on assumptions, data or methods which may be incorrect or imprecise, and we may not be able to realize them. We do not guarantee that the transactions and events described will happen as described (or that they will happen at all). You can identify forward-looking statements by the use of forward-looking terminology such as “believes,” “expects,” “may,” “will,” “should,” “seeks,” “approximately,” “intends,” “plans,” “estimates” or “anticipates” or the negative of these words and phrases or similar words or phrases. You can also identify forward-looking statements by discussions of strategy, plans or intentions. The following factors, among others, could cause actual results and future events to differ materially from those set forth or contemplated in the forward-looking statements:
| • | adverse economic or real estate developments in the retail industry or the markets in which we operate, |
| • | changes in local, regional and national economic conditions, |
| • | our inability to compete effectively, |
| • | our inability to collect rent from tenants, |
| • | defaults on or non-renewal of leases by tenants, |
| • | increased interest rates and operating costs, |
| • | decreased rental rates or increased vacancy rates, |
| • | our failure to obtain necessary outside financing on favorable terms or at all, |
| • | changes in the availability of additional acquisition opportunities, |
| • | our inability to successfully complete real estate acquisitions, |
21
Table of Contents
| • | our failure to successfully operate acquired properties and operations, |
| • | our general partner’s failure to qualify or maintain its status as a REIT, |
| • | government approvals, actions and initiatives, including the need for compliance with environmental requirements, |
| • | financial market fluctuations, |
| • | changes in real estate and zoning laws and increases in real property tax rates, |
| • | the effects of natural disasters, and |
| • | lack of or insufficient amounts of insurance. |
22
Table of Contents
Item 2. Financial Information.
Selected Consolidated Financial Data
The following sets forth selected consolidated financial and operating information for Excel Trust, L.P. and our Predecessor. Our Predecessor is not a legal entity, but rather a combination of real estate entities and operations invested in four properties that were contributed to us in connection with our general partner’s initial public offering. We have not presented historical information for Excel Trust, L.P. prior to April 28, 2010, the date on which our general partner consummated its initial public offering, because during the period from our formation until the initial public offering, we did not have any material corporate activity and because we believe that a discussion of the results of Excel Trust, L.P. during that period would not be meaningful.
The following data should be read in conjunction with our consolidated and combined financial statements and notes thereto and “Management’s Discussion and Analysis of Financial Condition and Results of Operations” included below in this registration statement.
| The Operating Partnership | The Predecessor | |||||||||||||||||||||||||||||||
| (Dollars in thousands) | Three Months Ended March 31, 2013 |
Three Months Ended March 31, 2012 |
Year Ended December 31, 2012 |
Year Ended December 31, 2011 |
Period from April 28, 2010 to December 31, 2010 |
Period from January 1, 2010 to April 27, 2010 |
Year Ended December 31, 2009 |
Year Ended December 31, 2008 |
||||||||||||||||||||||||
| Operating Data |
||||||||||||||||||||||||||||||||
| Total revenues |
$ | 27,529 | $ | 19,780 | $ | 87,144 | $ | 55,227 | $ | 14,311 | $ | 1,568 | $ | 4,990 | $ | 3,832 | ||||||||||||||||
| Expenses: |
||||||||||||||||||||||||||||||||
| Property operating expenses |
6,502 | 4,407 | 20,608 | 13,847 | 3,346 | 379 | 1,229 | 1,148 | ||||||||||||||||||||||||
| Changes in fair value of contingent consideration |
— | — | (281 | ) | (434 | ) | — | — | — | — | ||||||||||||||||||||||
| Administrative and miscellaneous |
3,834 | 3,502 | 13,778 | 12,773 | 7,095 | 8 | 45 | 43 | ||||||||||||||||||||||||
| Depreciation and amortization |
12,390 | 8,279 | 36,021 | 23,290 | 6,277 | 542 | 2,045 | 1,403 | ||||||||||||||||||||||||
|
|
|
|
|
|
|
|
|
|
|
|
|
|
|
|
|
|||||||||||||||||
| Total expenses |
22,726 | 16,188 | 70,126 | 49,476 | 16,718 | 929 | 3,319 | 2,594 | ||||||||||||||||||||||||
| Net operating income (loss) |
4,803 | 3,592 | 17,018 | 5,751 | (2,407 | ) | 639 | 1,671 | 1,238 | |||||||||||||||||||||||
| Interest expense |
(4,798 | ) | (3,674 | ) | (16,556 | ) | (13,181 | ) | (3,692 | ) | (483 | ) | (1,359 | ) | (1,593 | ) | ||||||||||||||||
| Interest income |
50 | 53 | 173 | 297 | 166 | — | 6 | 29 | ||||||||||||||||||||||||
| Income (loss) from equity in unconsolidated entities |
39 | — | (320 | ) | — | — | — | — | — | |||||||||||||||||||||||
| Gain on acquisition of real estate and sale of land parcel |
— | — | — | 1,479 | 978 | — | — | — | ||||||||||||||||||||||||
| Changes in fair value of financial instruments and gain on common operating partnership unit redemption |
230 | 462 | 1,530 | 1,154 | — | — | — | — | ||||||||||||||||||||||||
|
|
|
|
|
|
|
|
|
|
|
|
|
|
|
|
|
|||||||||||||||||
| Income (loss) from continuing operations |
324 | 433 | 1,845 | (4,500 | ) | (4,955 | ) | 156 | 318 | (326 | ) | |||||||||||||||||||||
| Income from discontinued operations before gain on sale of real estate assets |
— | — | — | 1,023 | 1,082 | — | — | — | ||||||||||||||||||||||||
| Gain on sale of real estate assets |
— | — | — | 3,976 | — | — | — | — | ||||||||||||||||||||||||
|
|
|
|
|
|
|
|
|
|
|
|
|
|
|
|
|
|||||||||||||||||
| Income from discontinued operations |
— | — | — | 4,999 | 1,082 | — | — | — | ||||||||||||||||||||||||
|
|
|
|
|
|
|
|
|
|
|
|
|
|
|
|
|
|||||||||||||||||
| Net income (loss) |
324 | 433 | 1,845 | 499 | (3,873 | ) | 156 | 318 | (326 | ) | ||||||||||||||||||||||
| Net loss (income) attributable to non-controlling interests |
(87 | ) | (66 | ) | (279 | ) | (104 | ) | — | (290 | ) | (75 | ) | (56 | ) | |||||||||||||||||
|
|
|
|
|
|
|
|
|
|
|
|
|
|
|
|
|
|||||||||||||||||
23
Table of Contents
| The Operating Partnership | The Predecessor | |||||||||||||||||||||||||||||||
| (Dollars in thousands) | Three Months Ended March 31, 2013 |
Three Months Ended March 31, 2012 |
Year Ended December 31, 2012 |
Year Ended December 31, 2011 |
Period from April 28, 2010 to December 31, 2010 |
Period from January 1, 2010 to April 27, 2010 |
Year Ended December 31, 2009 |
Year Ended December 31, 2008 |
||||||||||||||||||||||||
| Net income (loss) attributable to Excel Trust, L.P. and controlling interests of the Predecessor |
237 | 367 | 1,566 | 395 | (3,873 | ) | (134 | ) | 243 | (382 | ) | |||||||||||||||||||||
| Preferred unit dividends |
(2,744 | ) | (2,121 | ) | (10,353 | ) | (3,228 | ) | — | — | — | — | ||||||||||||||||||||
|
|
|
|
|
|
|
|
|
|
|
|
|
|
|
|
|
|||||||||||||||||
| Net (loss) income attributable to the unitholders and the Predecessor |
$ | (2,507 | ) | $ | (1,754 | ) | $ | (8,787 | ) | $ | (2,833 | ) | $ | (3,873 | ) | $ | (134 | ) | $ | 243 | $ | (382 | ) | |||||||||
|
|
|
|
|
|
|
|
|
|
|
|
|
|
|
|
|
|||||||||||||||||
| Loss from continuing operations per share attributable to the unitholders — basic and diluted |
$ | (0.06 | ) | $ | (0.06 | ) | $ | (0.26 | ) | $ | (0.36 | ) | $ | (0.31 | ) | |||||||||||||||||
|
|
|
|
|
|
|
|
|
|
|
|||||||||||||||||||||||
| Net loss per unit attributable to the unitholders — basic and diluted |
$ | (0.06 | ) | $ | (0.06 | ) | $ | (0.26 | ) | $ | (0.15 | ) | $ | (0.24 | ) | |||||||||||||||||
|
|
|
|
|
|
|
|
|
|
|
|||||||||||||||||||||||
| Weighted-average units outstanding — basic and diluted |
46,594 | 33,154 | 35,912 | 23,726 | 16,151 | |||||||||||||||||||||||||||
|
|
|
|
|
|
|
|
|
|
|
|||||||||||||||||||||||
| Distributions declared per common operating partnership unit |
$ | 0.17 | $ | 0.1625 | $ | 0.65 | $ | 0.605 | $ | 0.20 | ||||||||||||||||||||||
|
|
|
|
|
|
|
|
|
|
|
|||||||||||||||||||||||
| Other Data |
||||||||||||||||||||||||||||||||
| Funds from operations |
$ | 10,294 | $ | 6,463 | $ | 27,306 | $ | 15,218 | $ | 1,876 | $ | 698 | $ | 2,363 | $ | 1,077 | ||||||||||||||||
|
|
|
|
|
|
|
|
|
|
|
|
|
|
|
|
|
|||||||||||||||||
| Cash flow provided by operations |
$ | 10,609 | $ | 9,178 | $ | 39,892 | $ | 20,986 | $ | 3,920 | $ | 301 | $ | 5,615 | $ | 1,078 | ||||||||||||||||
|
|
|
|
|
|
|
|
|
|
|
|
|
|
|
|
|
|||||||||||||||||
| Cash flow used in investing activities |
$ | (36,618 | ) | $ | (64,092 | ) | $ | (280,132 | ) | $ | (123,295 | ) | $ | (327,284 | ) | $ | (238 | ) | $ | (5,248 | ) | $ | (678 | ) | ||||||||
|
|
|
|
|
|
|
|
|
|
|
|
|
|
|
|
|
|||||||||||||||||
| Cash flow provided (used) in financing activities |
$ | 27,071 | $ | 58,847 | $ | 240,544 | $ | 101,076 | $ | 329,889 | $ | (724 | ) | $ | (244 | ) | $ | (568 | ) | |||||||||||||
|
|
|
|
|
|
|
|
|
|
|
|
|
|
|
|
|
|||||||||||||||||
| Operating Partnership | The Predecessor | |||||||||||||||||||||||
| As of December 31, | ||||||||||||||||||||||||
| (Dollars in thousands) | March 31, 2013 | 2012 | 2011 | 2010 | 2009 | 2008 | ||||||||||||||||||
| Balance Sheet Data |
||||||||||||||||||||||||
| Properties, net |
$ | 971,023 | $ | 944,363 | $ | 583,959 | $ | 365,112 | $ | 41,869 | $ | 37,642 | ||||||||||||
| Cash and cash equivalents |
3,711 | 5,596 | 5,292 | 6,525 | 661 | 538 | ||||||||||||||||||
| Total assets |
1,102,841 | 1,079,254 | 687,671 | 441,088 | 45,456 | 42,131 | ||||||||||||||||||
| Mortgage and notes payable |
420,732 | 408,935 | 265,961 | 222,427 | 30,190 | 31,182 | ||||||||||||||||||
| Total liabilities |
478,604 | 470,482 | 306,685 | 244,478 | 35,934 | 33,445 | ||||||||||||||||||
| Total partners’ capital |
622,406 | 606,899 | 378,947 | 195,185 | 8,622 | 7,930 | ||||||||||||||||||
| Non-controlling interests |
1,859 | 1,873 | 2,039 | 1,425 | 900 | 756 | ||||||||||||||||||
| Total liabilities and equity |
1,102,841 | 1,079,254 | 687,671 | 441,088 | 45,456 | 42,131 | ||||||||||||||||||
| Other Data |
||||||||||||||||||||||||
| Operating properties |
||||||||||||||||||||||||
| Number(1) |
35 | 34 | 21 | 21 | 3 | 3 | ||||||||||||||||||
| Total owned gross leasable area |
5,855,964 | 5,691,312 | 3,809,383 | 2,593,908 | 203,448 | 203,448 | ||||||||||||||||||
| Other properties (land)(2) |
1 | 1 | 2 | 3 | 1 | 1 | ||||||||||||||||||
| (1) | Total number of operating properties includes a 50% consolidated joint venture and two unconsolidated joint ventures. |
| (2) | Other properties (land) represents Phase II of our Chimney Rock property, Phase I of which is classified as an operating property. |
24
Table of Contents
The following table presents a reconciliation of FFO(3) for the periods presented (in thousands):
| The Company | The Predecessor | |||||||||||||||||||||||||||||||
| Three Months Ended March 31, 2013 |
Three Months Ended March 31, 2013 |
Year Ended December 31, 2012 |
Year Ended December 31, 2011 |
Period from April 28, 2010 to December 31, 2010 |
Period from January 1, 2010 to April 27, 2010 |
Year Ended December 31, 2009 |
Year Ended December 31, 2008 |
|||||||||||||||||||||||||
| Net (loss) income attributable to the unitholders and the Predecessor |
$ | (2,507 | ) | $ | (1,754 | ) | $ | (8,787 | ) | $ | (2,833 | ) | $ | (3,873 | ) | $ | 156 | $ | 318 | $ | (326 | ) | ||||||||||
| Depreciation and amortization |
12,390 | 8,279 | 36,021 | 23,705 | 6,727 | 542 | 2,045 | 1,403 | ||||||||||||||||||||||||
| Depreciation and amortization related to joint ventures(4) |
411 | (62 | ) | 72 | (199 | ) | — | — | — | — | ||||||||||||||||||||||
| Gain on acquisition of real estate and sale of land parcel |
— | — | — | (1,479 | ) | (978 | ) | — | — | — | ||||||||||||||||||||||
| Gain on sale of real estate assets |
— | — | — | (3,976 | ) | — | — | — | — | |||||||||||||||||||||||
|
|
|
|
|
|
|
|
|
|
|
|
|
|
|
|
|
|||||||||||||||||
| Funds from operations |
$ | 10,294 | $ | 6,463 | $ | 27,306 | $ | 15,218 | $ | 1,876 | $ | 698 | $ | 2,363 | $ | 1,077 | ||||||||||||||||
|
|
|
|
|
|
|
|
|
|
|
|
|
|
|
|
|
|||||||||||||||||
| (3) | We present funds from operations, or FFO, because we consider FFO an important supplemental measure of our operating performance and believe it is frequently used by securities analysts, investors and other interested parties in the evaluation of REITs, many of which present FFO when reporting their results. See “Management’s Discussion and Analysis of Financial Condition and Results of Operations” for a further discussion of FFO. |
| (4) | Includes a reduction for 50% of the depreciation and amortization expense associated with the proportionate share of our consolidated Dothan property not owned by us and an increase for our proportionate share of depreciation and amortization expense at our unconsolidated La Costa Town Center and The Fountains at Bay Hill properties. |
25
Table of Contents
Management’s Discussion and Analysis of Financial Condition and Results of Operations
The following discussion should be read in conjunction with the financial statements and notes thereto appearing elsewhere in this registration statement. We make statements in this section that are forward-looking statements within the meaning of the federal securities laws. For a complete discussion of forward-looking statements, see the section above entitled “Forward-Looking Statements.” Certain risk factors may cause our actual results, performance or achievements to differ materially from those expressed or implied by the following discussion. For a discussion of such risk factors, see the section above entitled “Risk Factors.”
Overview
As used herein, the terms “we,” “us,” “our” or “the operating partnership” refer to Excel Trust, L.P., a Delaware limited partnership, and any of our consolidated subsidiaries. Our parent company and general partner is Excel Trust, Inc., a Maryland corporation, which is referred to herein as “the general partner.” We refer herein to our general partner together with its consolidated subsidiaries (including us) as “our company.” Our general partner conducts its business and owns its assets through us and operates as a vertically integrated, self-administered, self-managed real estate firm with the principal objective of acquiring, financing, developing, leasing, owning and managing community and power centers, grocery anchored neighborhood centers and freestanding retail properties. Our strategy is to acquire high quality, well-located, dominant retail properties that generate attractive risk-adjusted returns. We target competitively protected properties in communities that have stable demographics and have historically exhibited favorable trends, such as strong population and income growth. We generally lease our properties to national and regional supermarket chains, big-box retailers and select national retailers that frequently offer necessity and value oriented items and generate regular consumer traffic. Our tenants often carry goods that are less impacted by fluctuations in the broader U.S. economy and consumers’ disposable income, which we believe generates more predictable property-level cash flows.
We were organized in the state of Delaware on December 16, 2009. Our general partner was incorporated in Maryland on December 15, 2009 and commenced operations on April 28, 2010, after completing its initial public offering.
The following table reflects our total portfolio at March 31, 2013 (a property is reclassified from development to the operating portfolio at the earlier of 85% occupancy or one year from completion and delivery of the space):
| Gross Leasable Area (GLA) |
% Occupied | % Leased | Number of Properties |
|||||||||||||
| Operating Portfolio: |
||||||||||||||||
| Retail properties |
5,292,555 | 92.1 | % | 93.2 | % | 31 | ||||||||||
| Multi-family properties(1) |
339 units | 89.7 | % | 92.9 | % | n/a | ||||||||||
| Office properties |
338,339 | 80.6 | % | 82.3 | % | 2 | ||||||||||
|
|
|
|
|
|
|
|
|
|||||||||
| Total/weighted-average operating portfolio |
5,630,894 | 91.4 | % | 92.5 | % | 33 | ||||||||||
| Development property(2) |
149,517 | n/a | n/a | n/a | ||||||||||||
| Unconsolidated properties(3) |
225,070 | 65.5 | % | 65.5 | % | 2 | ||||||||||
|
|
|
|
|
|
|
|
|
|||||||||
| Total/weighted-average portfolio |
6,005,481 | 88.2 | % | 89.2 | % | 35 | ||||||||||
|
|
|
|
|
|
|
|
|
|||||||||
| (1) | Includes the 339 apartment units on the upper levels of our West Broad Village retail shopping center (the number of apartment units and leased percentage are not included in the total/weighted-average). |
| (2) | Our non-operating property consists of Phase II of our Chimney Rock property, which is held for future development. Phase I of our Chimney Rock property is classified as an operating property. |
| (3) | Includes our La Costa Town Center and The Fountains at Bay Hill properties in which we hold 20% and 50% ownership interests, respectively. |
We receive income primarily from rents and reimbursement payments received from tenants under existing leases at each of our properties. Potential impacts to our income include unanticipated tenant vacancies, vacancy of space that takes longer to re-lease and, for non triple-net leases, operating costs that cannot be recovered from our tenants through contractual reimbursement formulas in our leases. Our operating results therefore depend materially on the ability of our tenants to make required payments and overall real estate market conditions.
26
Table of Contents
Factors Which May Influence Future Operations
Rental Revenue and Tenant Recoveries. The amount of rental revenue and tenant recoveries generated by our portfolio depends principally on our ability to maintain the occupancy rates of currently leased space and to lease currently available space and space available from lease terminations. As of March 31, 2013, our consolidated retail properties were approximately 93.2% leased, our multi-family property was approximately 92.9% leased and our office properties were approximately 82.3% leased. The amount of rental revenue generated by us also depends on our ability to maintain or increase rental rates at our properties. Positive or negative trends in our geographic areas or the retail market could adversely affect our rental revenue and tenant recoveries in future periods. In addition, growth in rental income will partially depend on our ability to acquire additional retail properties that meet our investment criteria.
Lease Expirations. Our ability to re-lease space subject to expiring leases will impact our results of operations and is affected by economic and competitive conditions in our markets as well as the desirability of our individual properties. The leases scheduled to expire in the nine months ending December 31, 2013 and the twelve months ending December 31, 2014 represent 4.4% and 7.6%, respectively, of our total retail gross leasable area and 5.0% and 9.7%, respectively, of our annualized base rental revenue.
Market Conditions. We seek investment opportunities throughout the United States; however, we focus on the Northeast, Northwest and Sunbelt regions. Positive or negative changes in conditions in these markets will impact our overall performance. Future economic downturns or regional downturns affecting our target markets or downturns in the retail industry that impair our ability to renew or re-lease space as well as the ability of our tenants to fulfill their lease commitments, as such in the case of tenant bankruptcies, could adversely affect our ability to maintain or increase rental rates at our properties. Despite continued uncertainty in the national economy and the pace of the current economic recovery, we believe that our target markets are characterized by attractive demographics and property fundamental trends.
Operating Expenses. Our operating expenses generally consist of maintenance and repair expenses, real estate taxes, management fees and other operating expenses. For select properties, our operating expenses are controlled, in part, by negotiating expense pass-through provisions in tenant leases for most operating expenses. Most of the leases of our properties require tenants to pay all of their direct operating expenses as well as their pro rata share of substantially all of their indirect operating expenses, including common area maintenance, real estate taxes and insurance. Tenants in the office building pay for their direct operating expenses as well as their pro rata share of indirect operating expenses, including real estate taxes and insurance to the extent those expenses increase above the initial year of their respective lease. Increases or decreases in such operating expenses will impact our overall performance.
General and Administrative Expenses. We incur general and administrative expenses, including legal, accounting and other expenses related to corporate governance, public reporting, and supporting our general partner’s compliance with various provisions of the Sarbanes-Oxley Act of 2002. We anticipate that our company’s staffing levels will increase as we acquire additional assets and, as a result, our general and administrative expenses will increase.
Critical Accounting Policies
Our discussion and analysis of our financial condition and results of operations are based upon our consolidated and combined financial statements, which have been prepared in accordance with generally accepted accounting principles, or GAAP. Our significant accounting policies are described in the notes to our consolidated and combined financial statements. The preparation of these financial statements in conformity with GAAP requires us to make estimates, judgments and assumptions that affect the reported amounts of assets, liabilities, revenues and expenses. We base these estimates, judgments and assumptions on historical experience and on various other factors that we believe to be reasonable under the circumstances. Actual results may differ from these estimates under different assumptions or conditions, as described below. We believe our critical accounting policies are as follows:
Investments in Real Estate
Investments in real estate are carried at depreciated cost. Depreciation and amortization are recorded on a straight-line basis over the estimated useful lives of the assets as follows:
| Buildings and improvements |
15 to 40 years | |
| Tenant improvements |
Shorter of the useful lives or the terms of the related leases | |
| Acquired in-place leases |
Non-cancelable term of the related lease | |
27
Table of Contents
Our estimates of useful lives have a direct impact on our net income. If expected useful lives of our investments in real estate were shortened, we would depreciate the assets over a shorter time period, resulting in an increase to depreciation expense and a corresponding decrease to net income on an annual basis.
Management must make significant assumptions in determining the value of assets and liabilities acquired. The use of different assumptions in the recording of the purchase cost of the acquired properties would affect the timing of recognition of the related revenue and expenses. The fair value of tangible assets of an acquired property (which includes land, buildings, and improvements) is determined by valuing the property as if it were vacant, and the “as-if-vacant” value is then recorded to land, buildings and improvements based on management’s determination of the relative fair value of these assets. Factors considered by us in performing these analyses include an estimate of the carrying costs during the expected lease-up periods, current market conditions and costs to execute similar leases. In estimating carrying costs, we include real estate taxes, insurance and other operating expenses, and estimates of lost rental revenue during the expected lease-up periods based on current market demand. The fair value of land is derived from comparable sales of land within the same submarket and/or region. The fair value of buildings and improvements, tenant improvements, site improvements, and leasing costs are based upon current market replacement costs and other relevant market rate information. Additionally, the purchase price of the applicable property is recorded to the above—or below-market value of in-place leases, the value of in-place leases and above- or below-market value of debt assumed.
The value recorded to the above- or below-market component of the acquired in-place leases is determined based upon the present value (using a discount rate which reflects the risks associated with the acquired leases) of the difference between: (1) the contractual amounts to be paid pursuant to the lease over its remaining term, and (2) our estimate of the amounts that would be paid using fair market rates over the remaining term of the lease. The value recorded to below-market leases also includes the first renewal option if (1) the renewal option is a fixed price and (2) the fixed price is projected to be more than 15% below estimated fair market rates at the time of exercise. The amounts recorded to above—market leases are included in lease intangible assets, net in our accompanying combined balance sheets and amortized to rental income over the remaining non-cancelable lease term of the acquired leases with each property. The amounts recorded to below-market lease values are included in lease intangible liabilities, net in our accompanying combined balance sheets and amortized to rental income over the remaining non-cancelable lease term plus any below-market fixed price renewal options of the acquired leases with each property.
The total amount of other intangible assets acquired is further recorded to in-place lease costs and the value of tenant relationships based on our evaluation of the specific characteristics of each tenant’s lease and our overall relationship with that respective tenant. Characteristics considered in recording these values include the nature and extent of the credit quality and expectations of lease renewals, among other factors. The amounts recorded to in-place lease costs are included in lease intangible assets, net in the accompanying consolidated and combined balance sheets and will be amortized over the average remaining non-cancelable lease term of the acquired leases with each property. The amounts recorded to the value of tenant relationships are included in lease intangible assets, net in our accompanying consolidated balance sheets and are amortized over the average remaining non-cancelable lease term of the acquired leases plus a market lease term.
The value recorded to above- or below-market debt is determined based upon the present value of the difference between the cash flow stream of the assumed mortgage and the cash flow stream of a market rate mortgage. The amounts recorded to above—or below-market debt are included in mortgage loan payables, net on our accompanying combined balance sheets and are amortized to interest expense over the remaining term of the assumed mortgage.
Costs incurred in connection with the development or construction of properties and improvements are capitalized. Capitalized costs include pre-construction costs essential to the development of the property, development costs, construction costs, interest costs, real estate taxes and other direct costs incurred during the period of development. We capitalize costs on land and buildings under development until construction is substantially complete and the property is held available for occupancy. The determination of when a development project is substantially complete and when capitalization must cease involves a degree of judgment. We consider a construction project as substantially complete and held available for occupancy upon the completion of landlord-owned tenant improvements or when the lessee takes possession of the unimproved space for construction of its own improvements, but no later than one year from cessation of major construction activity. We cease capitalization on the portion substantially completed and occupied or held available for occupancy, and capitalize only those costs associated with any remaining portion under construction.
Maintenance and repairs costs are charged to expense as incurred and significant replacements and betterments are capitalized and depreciated over their estimated useful lives. Maintenance and repairs costs include all costs that do not extend the useful life of an asset or increase its operating efficiency. Significant replacements and betterments represent costs that extend an asset’s useful life or increase its operating efficiency.
28
Table of Contents
We review long-lived assets and certain identifiable intangible assets for impairment whenever events or circumstances indicate that the carrying amount of an asset may not be recoverable. We assess whether there has been impairment in the value of a long-lived asset by considering expected future operating income, trends and prospects, as well as the effects of demand, competition and other economic factors. Such factors include the tenants’ ability to perform their duties and pay rent under the terms of the leases. The determination of recoverability is made based upon the estimated undiscounted future net cash flows, excluding interest expense, expected to result from the long-lived asset’s use and eventual disposition. The amount of impairment loss, if any, is determined by comparing the fair value, as determined by a discounted cash flows analysis, with the carrying value of the related assets. These cash flows consider factors such as expected future operating income, trends and prospects, as well as the effects of leasing demand, competition and other factors. Although our strategy is to hold our properties over a long-term period, if the strategy changes or market conditions dictate that the sale of properties at an earlier date would be preferable, an impairment loss may be recognized to reduce the property to the lower of the carrying amount or fair value less cost to sell. Long-lived assets classified as held for sale are measured at the lower of the carrying amount or fair value less cost to sell.
Revenue Recognition
We commence revenue recognition on our leases based on a number of factors. In most cases, revenue recognition under a lease begins when the lessee takes possession of or controls the physical use of the leased asset. Generally, this occurs on the lease commencement date. In determining what constitutes the leased asset, we evaluate whether we or the lessee is the owner, for accounting purposes, of the tenant improvements. If we are the owner, for accounting purposes, of the tenant improvements, then the leased asset is the finished space and revenue recognition begins when the lessee takes possession of the finished space, typically when the improvements are substantially complete. If we conclude that we are not the owner, for accounting purposes, of the tenant improvements (the lessee is the owner), then the leased asset is the unimproved space and any tenant improvement allowances funded under the lease are treated as lease incentives, which reduce revenue recognized on a straight-line basis over the remaining non-cancelable term of the respective lease. In these circumstances, we begin revenue recognition when the lessee takes possession of the unimproved space for the lessee to construct improvements. The determination of who is the owner, for accounting purposes, of the tenant improvements determines the nature of the leased asset and when revenue recognition under a lease begins. We consider a number of different factors to evaluate whether we or the lessee is the owner of the tenant improvements for accounting purposes. These factors include:
| • | whether the lease stipulates how and on what a tenant improvement allowance may be spent, |
| • | whether the tenant or landlord retains legal title to the improvements, |
| • | the uniqueness of the improvements, |
| • | the expected economic life of the tenant improvements relative to the length of the lease, |
| • | the responsible party for construction cost overruns, and |
| • | who constructs or directs the construction of the improvements. |
The determination of who owns the tenant improvements, for accounting purposes, is subject to significant judgment. In making that determination we consider all of the above factors. However, no one factor is determinative in reaching a conclusion.
All leases are classified as operating leases and minimum rents are recognized on a straight-line basis over the term of the related lease. The excess of rents recognized over amounts contractually due pursuant to the underlying leases is included in deferred rent receivable on the accompanying combined balance sheets and contractually due but unpaid rents are included in accounts receivable. If a lease were to be terminated or if termination were determined to be likely (e.g., in the case of a tenant bankruptcy) prior to its contractual expiration, amortization of the related unamortized above—or below-market lease intangible would be accelerated and such amounts in addition to any deferred rent receivable would be written off.
Substantially all of our retail rental operations expenses, consisting of real estate taxes, insurance and common area maintenance costs are recoverable from tenants under the terms of our lease agreements. Amounts recovered are dependent on several factors, including occupancy and lease terms. Revenues are recognized in the period the expenses are incurred. The reimbursements are recognized in revenues as tenant recoveries, and the expenses are recorded in rental operations expenses, as we are generally the primary obligor with respect to purchasing goods and services from third-party suppliers, have discretion in selecting the supplier and bear the credit risk.
Lease termination fees are recognized when the related leases are canceled, the amounts to be received are fixed and determinable and collectability is assured, and we have no continuing obligation to provide space to former tenants. Percentage rent is income arising from retail tenant leases that is contingent upon tenant sales exceeding defined thresholds. These rents are recognized only after the contingency has been removed (i.e., when tenant sales thresholds have been achieved).
29
Table of Contents
We maintain an allowance for doubtful accounts for estimated losses resulting from the inability of tenants to make required rent and tenant recovery payments or defaults. We may also maintain an allowance for accrued straight-line rents and amounts due from lease terminations based on our assessment of the collectability of the balance.
Newly Issued Accounting Pronouncements
See Note 2 to the accompanying consolidated and combined financial statements contained elsewhere herein for disclosure and discussion of new accounting standards.
30
Table of Contents
Results of Operations
Comparison of the Three Months Ended March 31, 2013 to the Three Months Ended March 31, 2012
The following table sets forth historical financial information for same properties (all properties that we consolidated, owned and operated for the entirety of both periods being compared, except for properties that were entirely or primarily under redevelopment or development during either or both of the periods being compared), new properties (properties that were not owned during the entirety of the periods being compared), redevelopment/development properties (properties that were entirely or primarily under redevelopment or development during either or both of the periods being compared) and corporate entities (legal entities performing general and administrative functions) (dollars in thousands):
| Same Properties | New Properties | Redevelopment/ Development Properties |
Corporate | Total | ||||||||||||||||||||||||||||||||||||
| As of March 31, | ||||||||||||||||||||||||||||||||||||||||
| 2013 | 2012 | 2013 | 2012 | 2013 | 2012 | 2013 | 2012 | 2013 | 2012 | |||||||||||||||||||||||||||||||
| Rentable GLA |
3,912,719 | 3,912,719 | 1,599,625 | 437,613 | 118,550 | 118,550 | — | — | 5,630,894 | 4,468,882 | ||||||||||||||||||||||||||||||
| Percent leased |
94.6 | % | 94.7 | % | 87.2 | % | 88.3 | % | 95.8 | % | 75.8 | % | — | — | 92.5 | % | 93.6 | % | ||||||||||||||||||||||
| Number of properties |
21 | 21 | 11 | 2 | 1 | 1 | — | — | 33 | 24 | ||||||||||||||||||||||||||||||
| Percent of total portfolio |
63.7 | % | 87.5 | % | 33.3 | % | 8.3 | % | 3.0 | % | 4.2 | % | — | — | 100.0 | % | 100.0 | % | ||||||||||||||||||||||
| Same Properties | New Properties | Redevelopment/ Development Properties |
Corporate | Total | ||||||||||||||||||||||||||||||||||||
| Three months ended March 31, | ||||||||||||||||||||||||||||||||||||||||
| 2013 | 2012 | 2013 | 2012 | 2013 | 2012 | 2013 | 2012 | 2013 | 2012 | |||||||||||||||||||||||||||||||
| Rental revenue |
$ | 14,185 | $ | 14,516 | $ | 7,930 | $ | 1,448 | $ | 424 | $ | 247 | $ | (58 | ) | $ | (58 | ) | $ | 22,481 | $ | 16,153 | ||||||||||||||||||
| Tenant recoveries |
3,606 | 3,121 | 1,082 | 113 | 62 | 26 | (18 | ) | 7 | 4,732 | 3,267 | |||||||||||||||||||||||||||||
| Other income |
11 | 20 | 149 | 50 | — | — | 156 | 290 | 316 | 360 | ||||||||||||||||||||||||||||||
|
|
|
|
|
|
|
|
|
|
|
|
|
|
|
|
|
|
|
|
|
|||||||||||||||||||||
| Total revenues |
17,802 | 17,657 | 9,161 | 1,611 | 486 | 273 | 80 | 239 | 27,529 | 19,780 | ||||||||||||||||||||||||||||||
| Rental operations(1) |
4,214 | 4,226 | 2,524 | 484 | 118 | 37 | (354 | ) | (340 | ) | 6,502 | 4,407 | ||||||||||||||||||||||||||||
|
|
|
|
|
|
|
|
|
|
|
|
|
|
|
|
|
|
|
|
|
|||||||||||||||||||||
| Property operating income |
$ | 13,588 | $ | 13,431 | $ | 6,637 | $ | 1,127 | $ | 368 | $ | 236 | $ | 434 | $ | 579 | $ | 21,027 | $ | 15,373 | ||||||||||||||||||||
|
|
|
|
|
|
|
|
|
|
|
|
|
|
|
|
|
|
|
|
|
|||||||||||||||||||||
| (1) | Amount includes the following expenses that are directly attributable to a property: maintenance and repairs, real estate taxes, management fees and other operating expenses. |
31
Table of Contents
The following table provides a reconciliation of property operating income (as defined in the table above) to net income for the three months ended March 31, 2013 and 2012 (dollars in thousands):
| Three Months Ended | ||||||||||||||||
| March 31, 2013 |
March 31, 2012 |
Change | Percent Change |
|||||||||||||
| Property operating income |
$ | 21,027 | $ | 15,373 | $ | 5,654 | 36.8 | % | ||||||||
| Unallocated (income) expense: |
||||||||||||||||
| General and administrative |
3,834 | 3,502 | 332 | 9.5 | % | |||||||||||
| Depreciation and amortization |
12,390 | 8,279 | 4,111 | 49.7 | % | |||||||||||
|
|
|
|
|
|
|
|
|
|||||||||
| Net operating income |
4,803 | 3,592 | 1,211 | 33.7 | % | |||||||||||
| Interest expense, net |
(4,748 | ) | (3,621 | ) | (1,127 | ) | 31.1 | % | ||||||||
| Income from equity in unconsolidated entities |
39 | — | 39 | n/a | ||||||||||||
| Changes in fair value of financial instruments and gain on common operating partnership unit redemption |
230 | 462 | (232 | ) | 50.2 | % | ||||||||||
|
|
|
|
|
|
|
|
|
|||||||||
| Net income |
$ | 324 | $ | 433 | $ | (109 | ) | $ | 25.2 | % | ||||||
|
|
|
|
|
|
|
|
|
|||||||||
Property operating income: Property operating income increased by $5.6 million, or 36.8%, to $21.0 million for the three months ended March 31, 2013 compared to $15.4 million for the three months ended March 31, 2012. The increase was primarily related to the acquisition of eleven operating properties in 2012 and 2013 and the commencement of additional leases at our development property in 2012 and 2013.
General and administrative: General and administrative expenses were $3.8 million for the three months ended March 31, 2013 compared to $3.5 million for the three months ended March 31, 2012. The increase was primarily related to higher compensation and benefits costs associated with increases in the number of our company’s employees and an increase in the amount of professional fees paid, partially offset by a decrease in acquisition costs and a decrease in share-based compensation expense as a result of the graded vesting method of recognizing compensation expense related to our general partner’s 2012 performance-based stock awards, which results in declining amounts of compensation expense in 2013 as compared to 2012. Included in general and administrative expenses was share-based compensation expense for the three months ended March 31, 2013 and 2012 of $562,000 and $785,000, respectively.
Depreciation and amortization: Depreciation and amortization expense increased $4.1 million, or 49.7%, to $12.4 million for the three months ended March 31, 2013 compared to $8.3 million for the three months ended March 31, 2012. The increase was primarily related to our acquisition of eleven operating properties in 2012 and 2013 and the commencement of depreciation at our development property in 2012.
Interest expense, net: Interest expense, net increased $1.1 million, or 31.1%, to $4.7 million for the three months ended March 31, 2013 compared to $3.6 million for the three months ended March 31, 2012. The increase was primarily due to the assumption of approximately $78.3 million of mortgage debt in connection with our property acquisitions in 2012, partially offset by a decrease in the interest rate and fees associated with our unsecured revolving credit facility as a result of amendments in July 2012.
Income from equity in unconsolidated entities: In September 2012, we contributed our La Costa Town Center property to a newly-formed entity in which we hold a 20% ownership interest. We account for our ownership interest in a manner similar to the equity method of accounting. In October 2012, we purchased a 50% tenant-in-common interest in The Fountains at Bay Hill property, which we account for under the equity method of accounting. Both of these ownership interests are reflected in the accompanying condensed consolidated balance sheets as an investment in unconsolidated entities (see Note 14 to the condensed consolidated financial statements contained elsewhere herein for further discussion). The income of $39,000 recognized for the three months ended March 31, 2013 is comprised of our proportionate share of the income from operations of these properties.
Changes in fair value of financial instruments and gain on common operating partnership unit redemption: A gain on changes in fair value of financial instruments and gain on common operating partnership unit redemption of approximately $230,000 was recognized in the three months ended March 31, 2013 as a result of (1) the redemption of 19,904 common operating partnership units and (2) the expiration of the guaranteed redemption period for common operating partnership units issued in connection with our acquisition of the Edwards Theatres property in March 2011, which resulted in the recognition of a gain of approximately $246,000 representing the unutilized portion of the remaining redemption provision (see Note 18 to the consolidated and combined financial statements contained elsewhere herein for further discussion). A gain on changes in fair value of financial instruments of approximately $462,000 was recognized in the three months ended March 31, 2012 as a result of (1) the redemption of 121,852 common operating partnership units and (2) a decrease in the estimated fair value of the redemption provision.
32
Table of Contents
Comparison of the Year Ended December 31, 2012 to the Year Ended December 31, 2011
The following table sets forth historical financial information for same properties (all properties that we consolidated, owned and operated for the entirety of both periods being compared, except for properties that were entirely or primarily under redevelopment or development during either or both of the periods being compared), new properties (properties that were not owned during the entirety of the periods being compared), redevelopment/development properties (properties that were entirely or primarily under redevelopment or development during either or both of the periods being compared) and corporate entities (legal entities performing general and administrative functions) (dollars in thousands):
| Same Properties | New Properties | Redevelopment/ Development Properties |
Corporate | Total | ||||||||||||||||||||||||||||||||||||
| As of December 31, | ||||||||||||||||||||||||||||||||||||||||
| 2012 | 2011 | 2012 | 2011 | 2012 | 2011 | 2012 | 2011 | 2012 | 2011 | |||||||||||||||||||||||||||||||
| Rentable GLA |
2,701,113 | 2,701,113 | 2,646,577 | 1,209,305 | 118,509 | 118,509 | — | — | 5,466,199 | 4,028,927 | ||||||||||||||||||||||||||||||
| Percent leased |
93.5 | % | 93.9 | % | 91.9 | % | 96.8 | % | 94.1 | % | 75.9 | % | — | — | 92.8 | % | 94.2 | % | ||||||||||||||||||||||
| Number of properties |
16 | 16 | 15 | 5 | 1 | 1 | — | — | 32 | 22 | ||||||||||||||||||||||||||||||
| Percent of total portfolio |
50.0 | % | 72.7 | % | 46.9 | % | 22.7 | % | 3.1 | % | 4.5 | % | — | — | 100.0 | % | 100.0 | % | ||||||||||||||||||||||
| Same Properties | New Properties | Redevelopment/ Development Properties |
Corporate | Total | ||||||||||||||||||||||||||||||||||||
| Year ended December 31, | ||||||||||||||||||||||||||||||||||||||||
| 2012 | 2011 | 2012 | 2011 | 2012 | 2011 | 2012 | 2011 | 2012 | 2011 | |||||||||||||||||||||||||||||||
| Rental revenue |
$ | 35,552 | $ | 34,163 | $ | 35,065 | $ | 10,318 | $ | 1,135 | $ | 14 | $ | (230 | ) | $ | (230 | ) | $ | 71,522 | $ | 44,265 | ||||||||||||||||||
| Tenant recoveries |
7,021 | 7,580 | 6,955 | 2,727 | 214 | — | — | (7 | ) | 14,190 | 10,300 | |||||||||||||||||||||||||||||
| Other income |
92 | 195 | 255 | 36 | 1 | — | 1,084 | 431 | 1,432 | 662 | ||||||||||||||||||||||||||||||
|
|
|
|
|
|
|
|
|
|
|
|
|
|
|
|
|
|
|
|
|
|||||||||||||||||||||
| Total revenues |
42,665 | 41,938 | 42,275 | 13,081 | 1,350 | 14 | 854 | 194 | 87,144 | 55,227 | ||||||||||||||||||||||||||||||
| Rental operations(1) |
10,275 | 10,901 | 11,177 | 3,311 | 256 | — | (1,100 | ) | (365 | ) | 20,608 | 13,847 | ||||||||||||||||||||||||||||
|
|
|
|
|
|
|
|
|
|
|
|
|
|
|
|
|
|
|
|
|
|||||||||||||||||||||
| Property operating income |
32,390 | 31,037 | 31,098 | 9,770 | 1,094 | 14 | 1,954 | 559 | 66,536 | 41,380 | ||||||||||||||||||||||||||||||
|
|
|
|
|
|
|
|
|
|
|
|
|
|
|
|
|
|
|
|
|
|||||||||||||||||||||
| (1) | Amount includes the following expenses that are directly attributable to a property: maintenance and repairs, real estate taxes, management fees and other operating expenses. |
33
Table of Contents
The following table provides a reconciliation of property operating income (as defined in the table above) to net income for the years ended December 31, 2012 and 2011 (dollars in thousands):
| Year Ended | ||||||||||||||||
| December 31, 2012 |
December 31, 2011 |
Change | Percent Change |
|||||||||||||
| Property operating income |
$ | 66,536 | $ | 41,380 | $ | 25,156 | 60.8 | % | ||||||||
| Unallocated income (expense): |
||||||||||||||||
| Changes in fair value of contingent consideration |
(281 | ) | (434 | ) | 153 | 35.3 | % | |||||||||
| General and administrative |
13,778 | 12,773 | 1,005 | 7.9 | % | |||||||||||
| Depreciation and amortization |
36,021 | 23,290 | 12,731 | 54.7 | % | |||||||||||
|
|
|
|
|
|
|
|
|
|||||||||
| Net operating income |
17,018 | 5,751 | 11,267 | 195.9 | % | |||||||||||
| Interest expense, net |
(16,383 | ) | (12,884 | ) | 3,499 | 27.2 | % | |||||||||
| Loss from equity in unconsolidated entities |
(320 | ) | — | 320 | n/a | |||||||||||
| Gain on acquisition of real estate and sale of land parcel |
— | 1,479 | 1,479 | n/a | ||||||||||||
| Changes in fair value of financial instruments and gain on common operating partnership unit redemption |
1,530 | 1,154 | 376 | 32.6 | % | |||||||||||
|
|
|
|
|
|
|
|
|
|||||||||
| Income (loss) from continuing operations |
1,845 | (4,500 | ) | 6,345 | 141.0 | % | ||||||||||
| Income from discontinued operations |
— | 4,999 | 4,999 | n/a | ||||||||||||
|
|
|
|
|
|
|
|
|
|||||||||
| Net income |
$ | 1,845 | $ | 499 | $ | 1,346 | $ | 269.7 | % | |||||||
|
|
|
|
|
|
|
|
|
|||||||||
Property operating income: Property operating income increased by $25.1 million, or 60.8%, to $66.5 million for the year ended December 31, 2012 compared to $41.4 million for the year ended December 31, 2011. The increase was primarily related to our acquisition of 15 operating properties in 2011 and 2012, the commencement of leases at properties partially under development or redevelopment that were placed into service in 2011 and 2012 and the commencement of a portion of the leases at our development property in 2012.
Changes in fair value of contingent consideration: A gain of approximately $281,000 on changes in fair value of contingent consideration (included in changes in fair value of contingent consideration in the accompanying consolidated and combined statements of income) was recognized in the year ended December 31, 2012, compared to a gain of approximately $434,000 recognized in the year ended December 31, 2011, as a result of an increase in the estimated fair value of funds to be received from escrow in connection with master lease agreements related to our acquisition of the Promenade Corporate Center in January 2012.
General and administrative: General and administrative expenses were $13.8 million for the year ended December 31, 2012 compared to $12.8 million for the year ended December 31, 2011. The increase was primarily due to higher acquisition costs related to completed and pending acquisitions, an increase in other professional and audit fees and an overall increase in compensation costs (including benefits and payroll taxes) related to an increase in our company’s total employees. This was partially offset by the decrease in share-based compensation expense as a result of the graded vesting method of recognizing compensation expense related to our general partner’s 2011 performance-based stock awards, which resulted in a declining amount of compensation expense in 2012 as compared to 2011.
Depreciation and amortization: Depreciation and amortization expense increased $12.7 million, or 54.7%, to $36.0 million for the year ended December 31, 2012 compared to $23.3 million for the year ended December 31, 2011. The increase was primarily related to our acquisition of 15 operating properties in 2011 and 2012 and the commencement of depreciation at our development property in 2012.
Interest expense, net: Interest expense increased $3.5 million, or 27.2%, to $16.4 million for the year ended December 31, 2012 compared to $12.9 million for the year ended December 31, 2011. The increase was primarily due to the assumption of approximately $192.3 million of mortgage debt in connection with our property acquisitions in 2011 and 2012, partially offset by a decrease in the interest rate and fees associated with our unsecured revolving credit facility as a result of amendments in 2011 and 2012, and a decrease in the average borrowings outstanding on our unsecured revolving credit facility for the year ended December 31, 2012 as compared to the year ended December 31, 2011.
34
Table of Contents
Loss from equity in unconsolidated entities: In September 2012, we contributed our La Costa Town Center property to a newly-formed entity in which we hold a 20% ownership interest. We account for our ownership interest in a manner similar to the equity method of accounting. In October 2012, we purchased a 50% tenant-in-common interest in The Fountains at Bay Hill property, which we account for under the equity method of accounting. Both of these ownership interests are reflected in the accompanying consolidated and combined balance sheets as an investment in unconsolidated entities (see Note 14 of the consolidated and combined financial statements contained elsewhere herein for further discussion). The loss of $320,000 recognized for the year ended December 31, 2012 is primarily comprised of our proportionate share of non-recurring costs associated with the acquisition of the La Costa Town Center property by the joint venture and our acquisition of an ownership interest in The Fountains at Bay Hill property and the amortization of loan costs associated with incurred indebtedness in excess of our proportionate share of the operating income of the properties.
Changes in fair value of financial instruments and gain on common operating partnership unit redemption: A gain on changes in fair value of financial instruments and gain on redemption of common operating partnership units of approximately $1.5 million was recognized in the year ended December 31, 2012 as a result of (1) a decrease in the estimated fair value of the redemption provision of common operating partnership units arising from a property acquired in 2011 and (2) the redemption of 571,570 common operating partnership units. A gain on changes in fair value of financial instruments of approximately $1.2 million was recognized in the year ended December 31, 2011 as a result of a decrease in the estimated fair value of the redemption provision (see Notes 3 and 18 of the consolidated and combined financial statements contained elsewhere herein for further discussion).
35
Table of Contents
Comparison of the Year Ended December 31, 2011 to the Year Ended December 31, 2010
The following table sets forth historical financial information for same properties (all properties that we consolidated, owned and operated for the entirety of both periods being compared, except for properties that were entirely or primarily under redevelopment or development during either or both of the periods being compared), new properties (properties that were not owned during the entirety of the periods being compared), redevelopment/development properties (properties that were entirely or primarily under redevelopment or development during either or both of the periods being compared) and corporate entities (legal entities performing general and administrative functions) (dollars in thousands). The year ended December 31, 2010 includes financial information for our company for the period from April 28, 2010 to December 31, 2010 and for the Predecessor for the period from January 1, 2010 to April 27, 2010.
| Same Properties | New Properties(1) | Redevelopment/ Development Properties |
Corporate | Total | ||||||||||||||||||||||||||||||||||||
| As of December 31, | ||||||||||||||||||||||||||||||||||||||||
| 2011 | 2010 | 2011 | 2010 | 2011 | 2010 | 2011 | 2010 | 2011 | 2010 | |||||||||||||||||||||||||||||||
| Rentable GLA |
203,448 | 203,448 | 3,557,207 | 2,494,201 | 306,788 | 306,788 | — | — | 4,067,443 | 3,004,437 | ||||||||||||||||||||||||||||||
| Percent leased |
97.7 | % | 96.4 | % | 94.2 | % | 85.9 | % | 80.5 | % | 45.7 | % | — | — | 93.3 | % | 82.5 | % | ||||||||||||||||||||||
| Number of properties |
3 | 3 | 17 | 12 | 2 | 2 | — | — | 22 | 17 | ||||||||||||||||||||||||||||||
| Percent of total portfolio |
13.6 | % | 17.6 | % | 77.3 | % | 70.6 | % | 3.8 | % | 11.8 | % | — | — | 100.0 | % | 100.0 | % | ||||||||||||||||||||||
| Same Properties | New Properties | Redevelopment/ Development Properties |
Corporate | Total | ||||||||||||||||||||||||||||||||||||
| Year ended December 31, | ||||||||||||||||||||||||||||||||||||||||
| 2011 | 2010 | 2011 | 2010 | 2011 | 2010 | 2011 | 2010 | 2011 | 2010 | |||||||||||||||||||||||||||||||
| Rental revenue |
$ | 4,398 | $ | 4,734 | $ | 40,082 | $ | 8,906 | $ | 15 | $ | — | $ | (230 | ) | $ | (151 | ) | $ | 44,265 | $ | 13,489 | ||||||||||||||||||
| Tenant recoveries |
316 | 302 | 9,991 | 1,945 | — | — | (7 | ) | — | 10,300 | 2,247 | |||||||||||||||||||||||||||||
| Other income |
8 | — | 223 | 1 | — | — | 431 | 142 | 662 | 143 | ||||||||||||||||||||||||||||||
|
|
|
|
|
|
|
|
|
|
|
|
|
|
|
|
|
|
|
|
|
|||||||||||||||||||||
| Total revenues |
4,722 | 5,036 | 50,296 | 10,852 | 15 | — | 194 | (9 | ) | 55,227 | 15,879 | |||||||||||||||||||||||||||||
| Rental operations(2) |
1,079 | 1,122 | 13,133 | 2,734 | — | — | (365 | ) | (131 | ) | 13,847 | 3,725 | ||||||||||||||||||||||||||||
|
|
|
|
|
|
|
|
|
|
|
|
|
|
|
|
|
|
|
|
|
|||||||||||||||||||||
| Property operating income |
3,643 | 3,914 | 37,163 | 8,118 | 15 | — | 559 | 122 | 41,380 | 12,154 | ||||||||||||||||||||||||||||||
|
|
|
|
|
|
|
|
|
|
|
|
|
|
|
|
|
|
|
|
|
|||||||||||||||||||||
| (1) | Excludes six retail operating properties, which were acquired in 2010, but subsequently sold in June 2011. |
| (2) | Amount includes the following expenses that are directly attributable to a property: maintenance and repairs, real estate taxes, management fees and other operating expenses. |
36
Table of Contents
The following table provides a reconciliation of property operating income (as defined in the table above) to net income for the years ended December 31, 2011 and 2010 (dollars in thousands):
| Year Ended | ||||||||||||||||
| December 31, 2011 |
December 31, 2010 |
Change | Percent Change |
|||||||||||||
| Property operating income |
$ | 41,380 | $ | 12,154 | $ | 29,226 | 240.5 | % | ||||||||
| Unallocated income (expense): |
||||||||||||||||
| Changes in fair value of contingent consideration |
(434 | ) | — | 434 | n/a | |||||||||||
| General and administrative |
12,773 | 7,103 | 5,670 | 79.8 | % | |||||||||||
| Depreciation and amortization |
23,290 | 6,819 | 16,471 | 241.5 | % | |||||||||||
|
|
|
|
|
|
|
|
|
|||||||||
| Net operating income (loss) |
5,751 | (1,768 | ) | 7,519 | 425.3 | % | ||||||||||
| Interest expense, net |
(12,884 | ) | (4,009 | ) | 8,875 | 221.4 | % | |||||||||
| Gain on acquisition of real estate and sale of land parcel |
1,479 | 978 | 501 | 51.2 | % | |||||||||||
| Changes in fair value of financial instruments and gain on common operating partnership unit redemption |
1,154 | — | 1,154 | n/a | ||||||||||||
|
|
|
|
|
|
|
|
|
|||||||||
| Loss from continuing operations |
(4,500 | ) | (4,799 | ) | 299 | 6.2 | % | |||||||||
| Income from discontinued operations |
4,999 | 1,082 | 3,917 | 362.0 | % | |||||||||||
|
|
|
|
|
|
|
|
|
|||||||||
| Net income (loss) |
$ | 499 | $ | (3,717 | ) | $ | 4,216 | 113.4 | % | |||||||
|
|
|
|
|
|
|
|
|
|||||||||
Property operating income: Property operating income increased by $29.2 million, or 240.5%, to $41.4 million for the year ended December 31, 2011 compared to $12.2 million for the year ended December 31, 2010. The increase was primarily related to our acquisition of 18 properties in 2011 and 2010 (excluding six properties that we sold in June 2011).
Changes in fair value of contingent consideration: A gain of approximately $434,000 on changes in fair value of contingent consideration (included in changes in fair value of contingent consideration in the accompanying consolidated and combined statements of income) was recognized in the year ended December 31, 2011 as a result of a decrease in the estimated fair value of additional consideration due to sellers of properties acquired in 2010 from updated leasing assumptions related to prospective leasing.
General and administrative: General and administrative expenses were $12.8 million for the year ended December 31, 2011 compared to $7.1 million for the year ended December 31, 2010. The increase was primarily the result of approximately $3.2 million of additional non-cash compensation expense recognized in 2011 pursuant to the implementation of a long-term incentive plan in March 2011. In connection with the plan, members of our company’s senior management and other selected employees were provided restricted stock grants of shares of our general partner’s common stock, a portion of which may vest only upon meeting minimum stockholder return thresholds. Non-cash compensation expense related to the stock awards granted in 2011 pursuant to this plan will decline in subsequent years as the expense associated with these awards is recognized using the graded vesting method, in which the majority of the expense is recognized in earlier periods. General and administrative expenses for the year ended December 31, 2010 relate to our operations since the completion of our general partner’s initial public offering, and include salaries and other costs incurred for our general partner to operate as a public company. General and administrative expenses for the years ended December 31, 2011 and 2010 also include approximately $753,000 and $1.6 million, respectively, in costs related to our property acquisitions. Furthermore, we incurred approximately $1.0 million related to the audits, legal and other various costs in preparation for the initial public offering of our general partner, which were recognized at the initial public offering date. Prior to the initial public offering, there were no general and administrative expenses included in the Predecessor’s results of operations other than those that were directly related to the properties contributed to us by the Predecessor.
Depreciation and amortization: Depreciation and amortization expense increased $16.5 million, or 241.5%, to $23.3 million for the year ended December 31, 2011 compared to $6.8 million for the year ended December 31, 2010. The increase was primarily related to our acquisition of 18 properties (excluding six properties that we sold in June 2011) since the completion of the initial public offering.
Interest expense, net: Interest expense increased $8.9 million, or 221.4%, to $12.9 million for the year ended December 31, 2011 compared to $4.0 million for the year ended December 31, 2010. The increase was primarily due to the assumption of approximately $114.0 million and $108.7 million, respectively, of mortgage debt in connection with our property acquisitions in 2011 and 2010, partially offset by a decrease in the interest rate and fees associated with our unsecured revolving credit facility as a result of an amendment in 2011, and a decrease in the average borrowings outstanding on our unsecured revolving credit facility for the year ended December 31, 2011 as compared to the year ended December 31, 2010.
37
Table of Contents
Gain on acquisition of real estate and sale of land parcel: A gain on acquisition of real estate and sale of land parcel of approximately $1.5 million was recognized during the year ended December 31, 2011 related to (1) a property acquired in 2011, representing the difference between the fair value at the date of closing and the price paid of $937,000 (see Note 3 of the consolidated and combined financial statements contained elsewhere herein) and (2) a gain on disposition of a land parcel at one of our properties, resulting in a gain of approximately $542,000.
Changes in fair value of financial instruments and gain on common operating partnership unit redemption: A gain on changes in fair value of financial instruments and gain on redemption of common operating partnership units of approximately $1.2 million was recognized in the year ended December 31, 2011 as a result of a decrease in the estimated fair value of the redemption provision of common operating partnership units arising from a property acquired in 2011 (see Notes 3 and 18 of the consolidated and combined financial statements contained elsewhere herein for further discussion).
38
Table of Contents
Results of Operations — Segments
We evaluate the performance of our segments based upon property operating income. “Property Operating Income” is defined as operating revenues (rental revenue and tenant recoveries) less property operating expenses (maintenance and repairs, real estate taxes, management fees, and other operating expenses).
You should read the following discussion in conjunction with the segment information disclosed in Note 19 to our consolidated and combined financial statements contained elsewhere herein in accordance with ASC 280, Segment Reporting.
Comparison of the Three Months Ended March 31, 2013 to the Three Months Ended March 31, 2012
The following table sets forth results of operations presented by segments for the three months ended March 31, 2013 and 2012 (dollars in thousands). Our results of operations for the three months ended March 31, 2013 and 2012 may not be indicative of our future results of operations:
| Three Months Ended | ||||||||||||||||
| March 31, 2013 |
March 31, 2012 |
Change | Percent Change |
|||||||||||||
| Revenues: |
||||||||||||||||
| Retail properties |
$ | 24,159 | $ | 17,948 | $ | 6,211 | 34.6 | % | ||||||||
| Office properties |
2,050 | 1,832 | 218 | 11.9 | % | |||||||||||
| Multi-family properties |
1,320 | — | 1,320 | n/a | ||||||||||||
|
|
|
|
|
|
|
|
|
|||||||||
| Total revenues |
$ | 27,529 | $ | 19,780 | $ | 7,749 | 39.2 | % | ||||||||
| Property operating expenses: |
||||||||||||||||
| Retail properties |
$ | 5,353 | $ | 3,809 | $ | 1,544 | 40.5 | % | ||||||||
| Office properties |
845 | 598 | 247 | 41.3 | % | |||||||||||
| Multi-family properties |
304 | — | 304 | n/a | ||||||||||||
|
|
|
|
|
|
|
|
|
|||||||||
| Total property operating expenses |
$ | 6,502 | $ | 4,407 | $ | 2,095 | 47.5 | % | ||||||||
Revenue-retail properties: Retail property revenue increased by $6.2 million, or 34.6%, to $24.1 million for the three months ended March 31, 2013 compared to $17.9 million for the three months ended March 31, 2012. The increase was primarily related to our acquisition of eleven operating properties in 2012 and 2013 and commencement of additional leases at our development property in 2012 and 2013.
Revenue-office properties: Office property revenue increased by $218,000, or 11.9%, to $2.0 million for the three months ended March 31, 2013 compared to $1.8 million for the three months ended March 31, 2012. The increase was related to the acquisition of the Promenade Corporate Center in January 2012.
Revenue-multi-family properties: Multi-family property revenue was $1.3 million for the three months ended March 31, 2013 as a result of our acquisition of the West Broad Village property in October 2012, which includes 339 apartments on the upper levels of the shopping center.
Property operating expenses-retail properties: Property operating expenses related to our retail properties increased by $1.5 million, or 40.5%, to $5.3 million for the three months ended March 31, 2013 compared to $3.8 million for the three months ended March 31, 2012. The increase was primarily related to the acquisition of eleven operating properties in 2012 and 2013.
Property operating expenses-office properties: Property operating expenses related to our office properties increased by $247,000, or 41.3%, to $845,000 for the three months ended March 31, 2013 compared to $598,000 for the three months ended March 31, 2012. The increase was primarily related to the acquisition of the Promenade Corporate Center in January 2012.
39
Table of Contents
Property operating expenses-multi-family properties: Multi-family operating expenses were $304,000 for the three months ended March 31, 2013 as a result of our acquisition of the West Broad Village property in October 2012, which includes 339 apartments on the upper levels of the shopping center.
Comparison of the Year Ended December 31, 2012 to the Year Ended December 31, 2011
The following table sets forth results of operations presented by segments for the years ended December 31, 2012 and 2011 (dollars in thousands). Our results of operations for the years ended December 31, 2012 and 2011 may not be indicative of our future results of operations:
| Year Ended | ||||||||||||||||
| December 31, 2012 |
December 31, 2011 |
Change | Percent Change |
|||||||||||||
| Revenues: |
||||||||||||||||
| Retail properties |
$ | 77,548 | $ | 52,047 | $ | 25,501 | 49.0 | % | ||||||||
| Office properties |
8,522 | 3,180 | 5,342 | 168.0 | % | |||||||||||
| Multi-family properties |
1,074 | — | 1,074 | n/a | ||||||||||||
|
|
|
|
|
|
|
|
|
|||||||||
| Total revenues |
$ | 87,144 | $ | 55,227 | $ | 31,917 | 57.8 | % | ||||||||
| Property operating expenses: |
||||||||||||||||
| Retail properties |
$ | 17,122 | $ | 13,135 | $ | 3,987 | 30.4 | % | ||||||||
| Office properties |
3,253 | 712 | 2,541 | 356.9 | % | |||||||||||
| Multi-family properties |
233 | — | 233 | n/a | ||||||||||||
|
|
|
|
|
|
|
|
|
|||||||||
| Total property operating expenses |
$ | 20,608 | $ | 13,847 | $ | 6,761 | 48.8 | % | ||||||||
Revenue-retail properties: Retail property revenue increased by $25.5 million, or 49.0%, to $77.5 million for the year ended December 31, 2012 compared to $52.0 million for the year ended December 31, 2011. The increase was primarily related to our acquisition of 15 retail operating properties in 2012 and 2011, the commencement of leases at a property partially under redevelopment that was placed into service in 2011 and the commencement of a portion of the leases at our development property in 2012.
Revenue-office properties: Office property revenue increased by $5.3 million, or 168.0%, to $8.5 million for the year ended December 31, 2012 compared to $3.2 million for the year ended December 31, 2011. The increase was primarily related to our acquisition of the Promenade Corporate Center in January 2012.
Revenue-multi-family properties: Multi-family property revenue was $1.1 million for the year ended December 31, 2012 as a result of our purchase of the West Broad Village property in October 2012, which includes 339 apartment units on the upper levels of the shopping center.
Property operating expenses-retail properties: Property operating expenses related to our retail properties increased by $4.0 million, or 30.4%, to $17.1 million for the year ended December 31, 2012 compared to $13.1 million for the year ended December 31, 2011. The increase was primarily related to our acquisition of 15 retail operating properties in 2012 and 2011.
Property operating expenses-office properties: Property operating expenses related to our office properties increased by $2.5 million, or 356.9%, to $3.3 million for the year ended December 31, 2012 compared to $712,000 for the year ended December 31, 2011. The increase was primarily related to our acquisition of the Promenade Corporate Center in January 2012.
Property operating expenses-multi-family properties: Property operating expenses related to our multi-family properties was $233,000 for the year ended December 31, 2012 as a result of our purchase of the West Broad Village property in October 2012, which includes 339 apartment units on the upper levels of the shopping center.
40
Table of Contents
Comparison of the Year Ended December 31, 2011 to the Year Ended December 31, 2010
The following table sets forth results of operations presented by segments for the years ended December 31, 2011 and 2010 (dollars in thousands). Our results of operations for the years ended December 31, 2011 and 2010 may not be indicative of our future results of operations:
| Year Ended | ||||||||||||||||
| December 31, 2011 |
December 31, 2010 |
Change | Percent Change |
|||||||||||||
| Revenues: |
||||||||||||||||
| Retail properties |
$ | 52,047 | $ | 12,509 | $ | 39,538 | 316.1 | % | ||||||||
| Office properties |
3,180 | 3,370 | (190 | ) | 5.6 | % | ||||||||||
|
|
|
|
|
|
|
|
|
|||||||||
| Total revenues |
$ | 55,227 | $ | 15,879 | $ | 39,348 | 247.8 | % | ||||||||
| Property operating expenses: |
||||||||||||||||
| Retail properties |
$ | 13,135 | $ | 3,076 | $ | 10,059 | 327.0 | % | ||||||||
| Office properties |
712 | 649 | 63 | 9.7 | % | |||||||||||
|
|
|
|
|
|
|
|
|
|||||||||
| Total property operating expenses |
$ | 13,847 | $ | 3,725 | $ | 10,122 | 271.7 | % | ||||||||
Revenue-retail properties: Retail property revenue increased by $39.5 million, or 316.1%, to $52.0 million for the year ended December 31, 2011 compared to $12.5 million for the year ended December 31, 2010. The increase was primarily related to the acquisition of 18 retail properties in 2011 and 2010 (excluding six properties that we sold in June 2011).
Revenue-office properties: Office property revenue decreased by $190,000, or 5.6%, to $3.2 million for the year ended December 31, 2011 compared to $3.4 million for the year ended December 31, 2010. The decrease was primarily due to the expiration of two leases in late 2010 and early 2011, which were not renewed.
Property operating expenses-retail properties: Property operating expenses related to our retail properties increased by $10.0 million, or 327.0%, to $13.1 million for the year ended December 31, 2011 compared to $3.1 million for the year ended December 31, 2010. The increase was primarily related to the 15 retail operating properties we acquired since our general partner’s initial public offering that are not under triple-net leases (excluding the six properties sold in June 2011). Three of the properties we acquired are under triple-net leases whereby the tenants pay all of the operating expenses (excluding six properties that we sold in June 2011).
Property operating expenses-office properties: Property operating expenses related to our office properties did not change significantly ($712,000 and $649,000 for the years ended December 31, 2011 and 2010, respectively) as there were no significant changes in operations.
Cash Flows
The following summary discussion of our cash flows is based on the consolidated statements of cash flows in “Financial Statements and Supplementary Data” and is not meant to be an all inclusive discussion of the changes in our cash flows for the periods presented below (in thousands):
Comparison of the Three Months Ended March 31, 2013 to the Three Months Ended March 31, 2012
Cash and cash equivalents were $3.7 million and $9.2 million at March 31, 2013 and 2012, respectively.
Net cash provided by operating activities was $10.6 million for the three months ended March 31, 2013 compared to $9.2 million for the three months ended March 31, 2012, an increase of $1.4 million. The increase was primarily due to changes in operating assets and liabilities.
Net cash used in investing activities was $36.6 million for the three months ended March 31, 2013 compared to $64.1 million for the three months ended March 31, 2012, a decrease of $27.5 million. The decrease in net cash used was primarily the result of a decrease in property acquisitions during the three months ended March 31, 2013 compared to the same period in 2012, partially offset by proceeds from our general partner’s sale of equity securities in the amount of approximately $1.3 million in 2012.
41
Table of Contents
Net cash provided by financing activities was $24.1 million for the three months ended March 31, 2013 compared to $58.8 million for the three months ended March 31, 2012, a decrease of $34.7 million. The decrease was primarily due to lower proceeds from our general partner’s equity offerings of $22.7 million (not including an amount due from the general partner of $2.9 million representing proceeds from equity offerings not yet contributed in exchange for common operating partnership units) compared to $88.7 million for the three months ended March 31, 2013 and 2012, respectively. The decrease was partially offset by net borrowings from notes payable of $13.0 million compared to net payments on notes payable of $21.0 million for the three months ended March 31, 2013 and 2012, respectively.
Comparison of the Year Ended December 31, 2012 to the Year Ended December 31, 2011
Cash and cash equivalents were $5.6 million and $5.3 million at December 31, 2012 and December 31, 2011, respectively.
Net cash provided by operating activities was $39.9 million for the year ended December 31, 2012 compared to $21.0 million for the year ended December 31, 2011, an increase of $18.9 million. The increase was primarily due to cash flow generated by acquisitions and cash rent starts on new leases and an increase from non-cash reconciling adjustments recognized (primarily from an increase in the depreciation and amortization to $36.0 million compared to $23.7 million for the years ended December 31, 2012 and 2011, respectively), partially offset by a reduction for gains on the acquisition and sale of real estate totaling approximately $5.5 million for the year ended December 31, 2011.
Net cash used in investing activities was $280.1 million for the year ended December 31, 2012 compared to $123.3 million for the year ended December 31, 2011, an increase of $156.8 million. The increase in net cash used in investing activities was primarily the result of an increase in property acquisitions during the year ended December 31, 2012 compared to the same period in 2011, partially offset by proceeds from the contribution of our La Costa Town Center property that was contributed to an unconsolidated entity in September 2012, proceeds from the sale of equity securities in the amount of approximately $9.4 million and the collection of an outstanding mortgage loan receivable in the amount of $2.0 million.
Net cash provided by financing activities was $240.5 million for the year ended December 31, 2012 compared to $101.1 million for the year ended December 31, 2011, an increase of $139.4 million. The increase was primarily due to net proceeds from notes payable and mortgages payable of $63.4 million in 2012 compared to net repayments of $70.5 million in 2011 and higher net proceeds from common and preferred stock offerings of our general partner (which were contributed to us in exchange for the issuance of corresponding common operating partnership units) of $214.4 million compared to $197.6 million for the year ended December 31, 2012 and 2011, respectively, The increase was partially offset by an increase in distributions paid of $14.5 million and cash payments totaling $3.5 million in 2012 pursuant to the redemption of common operating partnership units and the payment of contingent consideration.
Comparison of the Year Ended December 31, 2011 to the Year Ended December 31, 2010
Cash and cash equivalents were $5.3 million and $6.5 million at December 31, 2011 and December 31, 2010, respectively.
Net cash provided by operating activities increased $16.8 million to $21.0 million for the year ended December 31, 2011 compared to $4.2 million for the year ended December 31, 2010. The increase was primarily due to (1) net income of $499,000 for the year ended December 31, 2011 compared to a net loss of $3.7 million for the year ended December 31, 2010, (2) an increase in depreciation and amortization expense of approximately $16.4 million in 2011 as compared to 2010 and (3) an increase in the amortization of non-cash share-based compensation of approximately $4.1 million. This increase was partially offset by a reduction to net cash provided by operating activities in 2011 of approximately $5.6 million as a result of (1) a gain on sale of real estate assets of $4.0 million, (2) a gain on changes in the fair value of earn-outs of $434,000 and (3) a gain on changes in fair value of financial instruments of $1.2 million. Changes in assets and liabilities resulted in a further reduction of approximately $2.4 million in 2011 as compared to 2010.
42
Table of Contents
Net cash used in investing activities decreased $204.2 million to $123.3 million for the year ended December 31, 2011 compared to $327.5 million for the year ended December 31, 2010. The decrease was primarily the result of a decrease in property acquisitions, development and improvements to $116.8 million in 2011 as compared to $320.4 million in 2010, partially offset by the purchase of $9.1 million in equity securities during 2011.
Net cash provided by financing activities decreased by $228.1 million to $101.1 million for the year ended December 31, 2011 compared to $329.2 million for the year ended December 31, 2010. The decrease was primarily the result of the difference in offering proceeds contributed to us from our general partner’s common stock offerings in 2011 of $149.9 million compared to net proceeds from the initial public offering of $194.6 million in 2010. In addition, we repaid a majority of the outstanding borrowings on our revolving credit facility, resulting in a reduction of net cash provided by financing activities of approximately $63.8 million (net proceeds from the issuance of Series A preferred units and a portion of the proceeds from the issuance of common operating partnership units pursuant to our general partner’s equity offerings were used to repay such outstanding borrowings), partially offset by cash utilized for the repurchase of shares of our general partner’s common stock (and the repurchase of a corresponding number of common operating partnership units) for total consideration of approximately $6.7 million.
Funds From Operations
We present funds from operations, or FFO, available to operating partnership units because we consider FFO an important supplemental measure of our operating performance and believe it is frequently used by securities analysts, investors and other interested parties in the evaluation of REITs, many of which present FFO when reporting their results. FFO is intended to exclude GAAP historical cost depreciation and amortization of real estate and related assets, which assumes that the value of real estate assets diminishes ratably over time. Historically, however, real estate values have risen or fallen with market conditions. Because FFO excludes depreciation and amortization unique to real estate, gains and losses from property dispositions and extraordinary items, it provides a performance measure that, when compared year-over-year, reflects the impact to operations from trends in occupancy rates, rental rates, operating costs, development activities and interest costs, providing perspective not immediately apparent from net income. We compute FFO in accordance with standards established by the National Association of Real Estate Investment Trusts, or NAREIT. As defined by NAREIT, FFO represents net income (loss) (computed in accordance with GAAP), excluding real estate-related depreciation and amortization, impairment charges and net gains (losses) on the disposition of real estate assets and after adjustments for unconsolidated partnerships and joint ventures. Our computation may differ from the methodology for calculating FFO utilized by other equity REITs and, accordingly, may not be comparable to such other REITs. Further, FFO does not represent amounts available for management’s discretionary use because of needed capital replacement or expansion, debt service obligations, or other commitments and uncertainties. FFO should not be considered as an alternative to net income (loss) (computed in accordance with GAAP) as an indicator of our financial performance or to cash flow from operating activities (computed in accordance with GAAP) as an indicator of our liquidity, nor is it indicative of funds available to fund our cash needs, including our ability to make distributions.
43
Table of Contents
Our FFO available to operating partnership units and a reconciliation to net income for the three months ended March 31, 2013 and 2012 and for the years ended December 31, 2012 and 2011 and the periods from April 28, 2010 to December 31, 2010 and from January 1, 2010 to April 27, 2010 (in thousands) was as follows:
| The Operating Partnership | The Predecessor | |||||||||||||||||||||||
| Three Months Ended March 31, 2013 |
Three Months Ended March 31, 2012 |
Year Ended December 31, 2012 |
Year Ended December 31, 2011 |
Period from April 28, 2010 to December 31, 2010 |
Period from January 1, 2010 to April 27, 2010 |
|||||||||||||||||||
| Net (loss) income attributable to the unitholders and the Predecessor |
$ | (2,507 | ) | $ | (1,754 | ) | $ | (8,787 | ) | $ | (2,833 | ) | $ | (3,873 | ) | $ | 156 | |||||||
| Depreciation and amortization |
12,390 | 8,279 | 36,021 | 23,705 | 6,727 | 542 | ||||||||||||||||||
| Depreciation and amortization related to joint ventures(1) |
411 | (62 | ) | 72 | (199 | ) | — | — | ||||||||||||||||
| Gain on acquisition of real estate and sale of land parcel |
— | — | — | (1,479 | ) | (978 | ) | — | ||||||||||||||||
| Gain on sale of real estate assets |
— | — | — | (3,976 | ) | — | — | |||||||||||||||||
|
|
|
|
|
|
|
|
|
|
|
|
|
|||||||||||||
| Funds from operations |
$ | 10,294 | $ | 6,463 | $ | 27,306 | $ | 15,218 | $ | 1,876 | $ | 698 | ||||||||||||
|
|
|
|
|
|
|
|
|
|
|
|
|
|||||||||||||
| (1) | Includes a reduction for 50% of the depreciation and amortization expense associated with the proportionate share of our consolidated Dothan property not owned by us and an increase for our proportionate share of depreciation and amortization expense at our unconsolidated La Costa Town Center and The Fountains at Bay Hill properties. |
Liquidity and Capital Resources
At March 31, 2013, we had $3.7 million of cash and cash equivalents on hand.
Our short-term liquidity requirements consist primarily of funds to pay for operating expenses and other expenditures directly associated with our properties, including:
| • | interest expense and scheduled principal payments on outstanding indebtedness, |
| • | general and administrative expenses, |
| • | future distributions expected to be paid to our general partner’s stockholders and our unitholders, |
| • | anticipated and unanticipated capital expenditures, tenant improvements and leasing commissions, |
| • | construction of our non-operating properties, and |
| • | properties under contract or acquired after March 31, 2013. |
Our long term liquidity requirements consist primarily of funds to pay for property acquisitions, scheduled debt maturities, renovations, expansions, capital commitments, construction obligations and other non-recurring capital expenditures that need to be made periodically, and the costs associated with acquisitions and developments of new properties that we pursue.
44
Table of Contents
We intend to satisfy our short-term liquidity requirements primarily through our existing working capital and cash provided by our operations. We believe our rental revenue net of operating expenses will generally provide sufficient cash inflows to meet our debt service obligations (excluding debt maturities), pay general and administrative expenses and fund regular distributions. We anticipate being able to refinance our debt service obligations or borrow from our unsecured credit facility to pay for upcoming debt maturities. In February 2013, we extended the maturity date for $13.9 million of our indebtedness with an original maturity date of 2013 through March 2014 (with one additional extension through March 2015 available at our option). In April 2013, we refinanced the outstanding loan at our West Broad Village property, extending the maturity date for $39.7 million of the outstanding indebtedness through May 2020 at a fixed rate of 3.3% ($10.3 million of the balance outstanding at March 31, 2013 was prepaid in connection with the refinancing, see Note 21 to the accompanying consolidated and combined financial statements contained elsewhere herein for further discussion). In addition, in April 2013, we utilized borrowings of approximately $20.0 million from our unsecured credit facility to prepay the outstanding loan balances at our Five Forks Place and Grant Creek Town Center properties. The only remaining loan maturity date in 2013 is the $55.8 million mortgage note at our Park West Place property, which is scheduled to mature in December 2013, but can be extended through December 2014 (see Note 8 to the accompanying consolidated and combined financial statements contained elsewhere herein for further discussion). We expect to incur approximately $27.8 million in construction costs relating to redevelopment or development projects on portions of existing operating properties (including the redevelopment of our unconsolidated La Costa Town Center property). Funds for these costs are expected to come from new mortgage financing, borrowings from our unsecured revolving credit facility and existing cash. We intend to satisfy our other long-term liquidity requirements through our existing working capital, cash provided by indebtedness, long-term secured and unsecured indebtedness and the use of net proceeds from the disposition of non-strategic assets. In addition, our general partner may, from time to time, offer and sell additional shares of common stock and preferred stock, as well as debt securities, warrants, rights and other securities to the extent necessary or advisable to meet our liquidity needs.
45
Table of Contents
As of March 31, 2013, our mortgage indebtedness consisted of the following (dollars in thousands):
| Property Pledged as Collateral |
Principal Balance |
Contractual Interest Rate |
Monthly Payment(1) |
Maturity Date |
||||||||||||
| West Broad Village(2) |
$ | 50,000 | 2.69 | % | 112 | 2013 | ||||||||||
| Five Forks Place |
4,833 | 5.50 | % | 39 | 2013 | |||||||||||
| Grant Creek Town Center |
15,247 | 5.75 | % | 105 | 2013 | |||||||||||
| Park West Place(3) |
55,800 | 2.50 | % | 120 | 2013 | |||||||||||
| Red Rock Commons(4) |
13,884 | 1.86 | % | 29 | 2014 | |||||||||||
| Excel Centre |
12,216 | 6.08 | % | 85 | 2014 | |||||||||||
| Merchant Central |
4,443 | 5.94 | % | 30 | 2014 | |||||||||||
| Edwards Theatre |
11,774 | 6.74 | % | 95 | 2014 | |||||||||||
| Gilroy Crossing |
46,439 | 5.01 | % | 263 | 2014 | |||||||||||
| The Promenade |
49,266 | 4.80 | % | 344 | 2015 | |||||||||||
| 5000 South Hulen |
13,598 | 5.60 | % | 83 | 2017 | |||||||||||
| Lake Pleasant Pavilion |
28,092 | 6.09 | % | 143 | 2017 | |||||||||||
| Rite Aid-Vestavia Hills |
1,143 | 7.25 | % | 21 | 2018 | |||||||||||
| Lowe’s |
13,425 | 7.20 | % | 110 | 2031 | |||||||||||
| Northside Plaza(5) |
12,000 | 0.13 | % | 1 | 2035 | |||||||||||
|
|
|
|||||||||||||||
| 332,160 | ||||||||||||||||
| Less: premium(6) |
572 | |||||||||||||||
|
|
|
|||||||||||||||
| Mortgage notes payable, net |
$ | 332,732 | ||||||||||||||
|
|
|
|||||||||||||||
| (1) | Amount represents the monthly payment of principal and interest at March 31, 2013. |
| (2) | The loan at the West Broad Village property was refinanced and the maturity date extended subsequent to March 31, 2013; see Note 21 of the accompanying consolidated and combined financial statements contained elsewhere herein for further discussion. |
| (3) | The loan bears interest at a rate of LIBOR plus 2.25% (variable interest rate of 2.50% at March 31, 2013). In December 2010, we entered into interest rate swap contracts, which fix LIBOR at an average of 1.41% for the term of the loan. The maturity date may be extended for an additional one-year period through December 2014 at our option and upon the satisfaction of conditions precedent and the payment of an extension fee. |
| (4) | The maturity date for the Red Rock Commons construction loan was extended to March 2014 and may be extended for an additional one-year period through March 2015 at our option and upon the satisfaction of conditions precedent and the payment of an extension fee. The construction loan bears interest at the rate of LIBOR plus a margin of 165 basis points to 225 basis points, depending on our leverage ratio (variable interest rate of 1.86% at March 31, 2013). |
| (5) | The debt represents redevelopment revenue bonds to be used for the redevelopment of this property, which mature in November 2035. Interest is reset weekly and determined by the bond remarketing agent based on the market value of the bonds (interest rate of 0.13% at March 31, 2013). The interest rate on the bonds is currently priced off of the Securities Industry and Financial Markets Association index but could change based on the credit of the bonds. The bonds are secured by a $12.1 million letter of credit we issued from our unsecured revolving credit facility. An underwriter’s discount related to the original issuance of the bonds with a remaining balance of $108,000 at March 31, 2013 will be amortized as additional interest expense through November 2035. |
| (6) | Represents (a) the fair value adjustment on assumed debt on acquired properties at the time of acquisition to account for below- or above-market interest rates and (b) an underwriter’s discount for the issuance of redevelopment bonds. |
46
Table of Contents
Our unsecured revolving credit facility has a borrowing capacity of $250.0 million, which may be increased from time to time up to an additional $200.0 million for a total borrowing capacity of $450.0 million, subject to receipt of lender commitments and other conditions precedent. The maturity date is July 19, 2016 and may be extended for one additional year at our option. The unsecured revolving credit facility bears interest at the rate of LIBOR plus a margin of 165 basis points to 225 basis points, depending on our leverage ratio. We also pay a fee of 0.25% or 0.35% for any unused portion of the unsecured revolving credit facility, depending on our utilization of the borrowing capacity. Borrowings under the unsecured revolving credit facility were $88.0 million at March 31, 2013 at a weighted-average interest rate of 1.86%. In addition, we issued a $12.1 million letter of credit from the unsecured revolving credit facility, which secures an outstanding $12.0 million bond payable for the Northside Mall. This bond is included with the mortgages payable on our condensed consolidated balance sheets. At March 31, 2013, there was approximately $149.9 million available for borrowing under the unsecured revolving credit facility.
Our ability to borrow funds under the credit agreement, and the amount of funds available under the credit agreement at any particular time, are subject to our meeting borrowing base requirements. The amount of funds we can borrow is determined by the net operating income of our unencumbered assets that comprise the borrowing base (as defined in the credit agreement). We are also subject to financial covenants relating to maximum leverage ratios on unsecured, secured and overall debt, minimum fixed coverage ratios, minimum amount of net worth, dividend payment restrictions and certain investment limitations.
The following is a summary of key financial covenants and their covenant levels as of March 31, 2013:
| Required | Actual | |||||||
| Key financial covenants: |
||||||||
| Ratio of total liabilities to total asset value (maximum) |
60.0 | % | 38.3 | % | ||||
| Ratio of adjusted EBITDA to fixed charges (minimum) |
1.50 | 1.92 | ||||||
| Ratio of secured indebtedness to total asset value (maximum) |
40.0 | % | 30.5 | % | ||||
As of March 31, 2013, we believe that we were in compliance with all of the covenants under our credit agreement.
Our general partner has entered into amended and restated equity distribution agreements with four sales agents, under which it can issue and sell shares of its common stock having an aggregate offering price of up to $100.0 million from time to time through, at our general partner’s discretion, any of the sales agents. The equity distribution agreements that our general partner originally entered into with the same four sales agents provided for the sale of shares of our general partner’s common stock having an aggregate offering price of up to $50.0 million. The sales of common stock made under the equity distribution agreements are made in “at the market” offerings as defined in the Securities Act of 1933, as amended, or the Securities Act. Between March 2012 and April 2013, our general partner issued and sold shares of its common stock with an aggregate offering price of approximately $49.9 million of the $50.0 million approved under the original equity distribution agreements. During the three months ended March 31, 2013, our general partner completed the issuance of 2,063,828 shares of its common stock pursuant to the original equity distribution agreements, resulting in net proceeds of approximately $25.6 million at an average stock issuance price of $12.63 per share. During the year ended December 31, 2012 our general partner completed the issuance of 1,082,051 shares of its common stock, resulting in net proceeds of approximately $12.6 million at an average stock issuance price of $11.92 per unit. Subsequent to March 31, 2013 (unaudited), our general partner completed the issuance of 897,900 shares of its common stock, resulting in net proceeds of approximately $12.1 million at an average stock issuance price of $13.76 per share. The proceeds from such issuances were contributed to us in exchange for an equal number of common operating partnership units and we utilized the proceeds to repay outstanding indebtedness under our unsecured revolving credit facility and for other general corporate and working capital purposes.
Our general partner may from time to time seek to repurchase or redeem outstanding shares of its common stock or preferred stock or other securities in open market purchases, privately negotiated transactions or otherwise. Such repurchases or redemptions, if any, will depend on prevailing market conditions, our liquidity requirements, contractual restrictions and other factors. The amounts involved may be material. In the event of such repurchases, we would repurchase an equivalent number of outstanding common or preferred operating partnership units.
47
Table of Contents
As of March 31, 2013, our ratio of debt-to-gross undepreciated asset value was approximately 36.6%. Our company’s organizational documents do not limit the amount or percentage of debt that we may incur, nor do they limit the types of properties we may acquire or develop, and our general partner’s board of directors may modify our company’s debt policy from time to time. The amount of leverage we will deploy for particular investments in our target assets will depend upon the assessment by our company’s management team of a variety of factors, which may include the anticipated liquidity and price volatility of the target assets in our investment portfolio, the potential for losses, the availability and cost of financing the assets, our opinion of the creditworthiness of our financing counterparties, the health of the U.S. economy and commercial mortgage markets, our outlook for the level, slope and volatility of interest rates, the credit quality of our target assets and the collateral underlying our target assets. Accordingly, the ratio of debt-to-gross undepreciated asset value may increase or decrease beyond the current amount.
Commitments, Contingencies and Contractual Obligations
The following table outlines our contractual obligations (dollars in thousands) at March 31, 2013 related to our mortgage and note indebtedness and other commitments:
| Payments by Period | ||||||||||||||||||||
| 2013 (nine months) |
2014-2015 | 2016-2017 | Thereafter | Total | ||||||||||||||||
| Principal payments — fixed rate debt(1) |
$ | 79,156 | $ | 124,130 | $ | 41,331 | $ | 11,659 | $ | 256,276 | ||||||||||
| Principal payments — variable rate debt(2) |
50,000 | 13,884 | 88,000 | 12,000 | 163,884 | |||||||||||||||
| Interest payments — fixed rate debt(1) |
9,194 | 13,244 | 5,524 | 6,631 | 34,593 | |||||||||||||||
| Interest payments — variable rate debt(2) |
1,610 | 3,348 | 881 | 252 | 6,091 | |||||||||||||||
| Contingent consideration related to business combinations(3) |
1,787 | — | — | — | 1,787 | |||||||||||||||
| Construction costs(4) |
9,263 | 18,552 | — | — | 27,815 | |||||||||||||||
|
|
|
|
|
|
|
|
|
|
|
|||||||||||
| $ | 151,010 | $ | 173,158 | $ | 135,736 | $ | 30,542 | $ | 490,446 | |||||||||||
|
|
|
|
|
|
|
|
|
|
|
|||||||||||
| (1) | Includes a mortgage payable at our Park West Place property, which was amended in July 2012 and now bears interest at a rate of LIBOR plus 2.25% (contractual interest rate of 2.5% at March 31, 2013). In December 2010, we entered into two interest rate swap contracts equal to the notional value of the mortgage payable, which fix LIBOR at an average of 1.41% for the term of the mortgage. |
| (2) | Includes redevelopment revenue bonds at our Northside Mall property, a construction loan at our Red Rock Commons property, a mortgage note at our West Broad Village property, and outstanding borrowings on our unsecured revolving credit facility (our unsecured revolving credit facility had a balance of $88.0 million at March 31, 2013). Interest on the redevelopment bonds is reset weekly and determined by the bond remarketing agent based on the market value of the bonds (interest rate of 0.13% at March 31, 2013). The construction loan bears interest at the rate of LIBOR plus a margin of 165 basis points to 225 basis points, depending on our leverage ratio (interest rate of 1.86% at March 31, 2013). The mortgage note at West Broad Village bears interest at the rate of LIBOR plus a margin of 250 basis points (interest rate of 2.69% at March 31, 2013). The unsecured revolving credit facility bears interest at the rate of LIBOR plus a margin of 165 basis points to 225 basis points (weighted-average interest rate of 1.86% at March 31, 2013), depending on our leverage ratio. |
| (3) | Additional consideration is due to the prior owners of two properties purchased in 2012 based on their ability to lease-up vacant space at those properties during 2013. The balance of $1.8 million at March 31, 2013 represents our best estimate of the fair value of funds expected to be paid to the former owners (see Note 18 to the consolidated and combined financial statements contained elsewhere herein). |
| (4) | Amount represents our estimate of costs expected to be incurred primarily to complete the redevelopment of our unconsolidated La Costa Town Center property (representing our proportionate share of the estimated costs) and to complete the undeveloped portion of our Chimney Rock property. |
Off-Balance Sheet Arrangements
In September 2012, PC Retail, LLC repaid in full a $2.0 million note receivable that we issued to facilitate the land acquisition and development of a shopping center anchored by Publix in Brandon, Florida, including interest accrued through the date of repayment. In conjunction with issuance of the note receivable, we entered into a purchase and sale agreement with PC Retail, LLC to acquire the property upon completion of development. On October 1, 2012, we completed the acquisition of the retail shopping center with 68,000 square feet of gross leasable area in Brandon, Florida for a purchase price of approximately $13.1 million.
48
Table of Contents
We hold a 20% ownership interest in an unconsolidated limited liability company, La Costa LLC. In connection with the formation of La Costa LLC in September 2012, we contributed the La Costa Town Center property to the entity in exchange for proceeds of approximately $21.2 million (see Note 14 to the accompanying consolidated and combined financial statements contained elsewhere herein for further discussion). La Costa LLC does not qualify as a variable interest entity, or VIE, and consolidation is not required as we do not control the operations of the property. The majority owner will bear the majority of any losses incurred. We will receive 20% of the cash flow distributions and may receive a greater portion of cash distributions in the future based upon the performance of the property and the availability of cash for distribution. In addition, we receive fees in our role as the day-to-day property manager and for any development services that we provide. We account for our interest in La Costa LLC as a profit-sharing arrangement, which is reflected in a manner that is similar to the equity method of accounting. The assets and liabilities of La Costa LLC were $25.8 million and $14.9 million, respectively, at March 31, 2013.
We hold a 50% tenant-in-common ownership interest in a company, Bay Hill Fountains, LLC, or Bay Hill. In connection with our acquisition of a portfolio of properties in October 2012, we acquired a 50% undivided interest in Bay Hill. Bay Hill does not qualify as a VIE and consolidation is not required as we do not control the operations of the property owned by Bay Hill. We will receive 50% of the cash flow distributions and recognize 50% of the results of operations. In addition, we receive fees in our role as the day-to-day property manager. We account for our interest in Bay Hill under the equity method of accounting. The assets and liabilities of Bay Hill were $41.5 million and $33.8 million, respectively, at March 31, 2013.
Our proportionate share of outstanding indebtedness at the unconsolidated entities as of March 31, 2013 is as follows (dollars in thousands):
| Name |
Ownership Interest | Principal Amount(1) | Interest Rate | Maturity Date | ||||||||||||
| La Costa LLC |
20 | % | $ | 2,820 | 6.0 | % | October 1, 2014 | |||||||||
| Bay Hill |
50 | % | $ | 11,877 | 3.5 | % | April 2, 2015 | |||||||||
| (1) | Amount represents our proportionate share of a secured mortgage note, which bears interest at the rate of LIBOR plus a margin of 575 basis points (La Costa LLC) and at a rate of LIBOR plus a margin of 325 basis points (Bay Hill). |
We do not have any other relationships with unconsolidated entities or financial partnerships, such as entities often referred to as structured finance or special purposes entities, which typically are established for the purpose of facilitating off-balance sheet arrangements or other contractually narrow or limited purposes. Further, we have not guaranteed any obligations of unconsolidated entities nor do we have any commitments or intent to provide funding to any such entities. Accordingly, we are not materially exposed to any other financing, liquidity, market or credit risk that could arise if we had engaged in these relationships, other than as described above.
49
Table of Contents
Distribution Policy
All distributions on our units are made at the discretion of our general partner’s board of directors. The following table provides historical information for distributions paid on our common and preferred units for the prior two fiscal years:
| Quarter Ended |
Date Declared | Date Paid | Distribution per Common Unit |
Distribution per Series A Preferred Unit |
Distribution per Series B Preferred Unit |
|||||||||||
| March 31, 2011 |
February 7, 2011 | April 15, 2011 | $ | 0.14 | $ | 0.4375 | $ | — | ||||||||
| June 30, 2011 |
May 5, 2011 | July 15, 2011 | 0.15 | 0.4375 | — | |||||||||||
| September 30, 2011 |
August 10, 2011 | October 17, 2011 | 0.155 | 0.4375 | — | |||||||||||
| December 31, 2011 |
November 2, 2011 | January 16, 2012 | 0.16 | 0.4375 | — | |||||||||||
| March 31, 2012 |
February 1, 2012 | April 16, 2012 | 0.1625 | 0.4375 | 0.423177 | |||||||||||
| June 30, 2012 |
May 2, 2012 | July 16, 2012 | 0.1625 | 0.4375 | 0.5078 | |||||||||||
| September 30, 2012 |
August 1, 2012 | October 15, 2012 | 0.1625 | 0.4375 | 0.5078 | |||||||||||
| December 31, 2012 |
November 7, 2012 | January 15, 2013 | 0.1625 | 0.4375 | 0.5078 | |||||||||||
| March 31, 2013 |
February 27, 2013 | April 15, 2013 | 0.17 | 0.4375 | 0.5078 | |||||||||||
Inflation
Some of our leases contain provisions designed to mitigate the adverse impact of inflation. These provisions generally increase rental rates during the terms of the leases either at fixed rates or indexed escalations (based on the Consumer Price Index or other measures). We may be adversely impacted by inflation on our leases that do not contain indexed escalation provisions. In addition, most of our leases require the tenant to pay its share of operating expenses, including common area maintenance costs, real estate taxes and insurance. This may reduce our exposure to increases in costs and operating expenses resulting from inflation, assuming our properties remain leased and tenants fulfill their obligations to reimburse us for such expenses.
Quantitative and Qualitative Disclosures About Market Risk
Our future income, cash flows and fair values relevant to financial instruments depend upon prevailing market interest rates. Market risk is the exposure to loss resulting from changes in interest rates, foreign currency exchange rates, commodity prices and equity prices. The primary market risk to which we believe we are exposed is interest rate risk. Many factors, including governmental monetary and tax policies, domestic and international economic and political considerations and other factors that are beyond our control contribute to interest rate risk.
The fair value of mortgages payable at March 31, 2013, including our construction loan, was approximately $340.2 million compared to the carrying amount of $332.7 million. A 100 basis point increase in market interest rates would result in a decrease in the fair value of our fixed-rate debt by approximately $4.8 million at March 31, 2013. A 100 basis point decrease in market interest rates would result in an increase in the fair market value of our fixed-rate debt by approximately $5.1 million at March 31, 2013.
We have entered into a $250.0 million unsecured revolving credit facility. The unsecured revolving credit facility bears interest at the rate of LIBOR plus a margin of 165 basis points to 225 basis points, depending on our leverage ratio. As of March 31, 2013, we had $100.1 million of debt and commitments outstanding under our unsecured revolving credit facility, which includes a $12.1 million letter of credit issued under the facility. At March 31, 2013, the outstanding balance on our unsecured revolving credit facility was $88.0 million at a weighted-average interest rate of 1.86%. The fair value of our unsecured revolving credit facility at March 31, 2013 was approximately $88.0 million. Based on outstanding borrowings of $88.0 million at March 31, 2013, an increase of 100 basis points in LIBOR would result in an increase in the interest we incur in the amount of approximately $880,000.
50
Table of Contents
We have entered into an $18.0 million construction loan agreement in connection with construction activities at one of our development properties. The construction loan bears interest at the rate of LIBOR plus a margin of 165 basis points to 225 basis points, depending on our leverage ratio. At March 31, 2013, the outstanding balance on our construction loan was $13.9 million at an interest rate of 1.86%. Based on outstanding borrowings of $13.9 million at March 31, 2013, an increase of 100 basis points in LIBOR would result in an increase in the interest we incur in the amount of approximately $139,000.
In order to modify and manage the interest rate characteristics of our outstanding debt and to limit the effects of interest rate risks on our operations, we may utilize a variety of financial instruments, including interest rate swaps, caps, floors and other interest rate exchange contracts. The use of these types of instruments to hedge our exposure to changes in interest rates carries additional risks, including counterparty credit risk, the enforceability of hedging contracts and the risk that unanticipated and significant changes in interest rates will cause a significant loss of basis in the contract. To limit counterparty credit risk we will seek to enter into such agreements with major financial institutions with high credit ratings. There can be no assurance that we will be able to adequately protect against the foregoing risks and that we will ultimately realize an economic benefit that exceeds the related amounts incurred in connection with engaging in such hedging activities. We do not enter into such contracts for speculative or trading purposes.
As of March 31, 2013, we had two interest rate derivatives that were designated as cash flow hedges of interest rate risk. Both derivatives were interest rate swaps and the notional amount totaled $55.8 million. The interest rate swap contracts fixed LIBOR at an average of 1.41% for the term of a mortgage loan which expires in December 2013. The fair value of these derivative financial instruments was approximately $515,000 at March 31, 2013, and is classified in accounts payable and other liabilities on the accompanying condensed consolidated balance sheets.
Our Properties
As of March 31, 2013, we owned an operating portfolio consisting of 31 retail properties totaling approximately 5.3 million square feet of gross leasable area (including a consolidated joint venture owned 50% by us), which were approximately 93.2% leased and had a weighted average remaining lease term of approximately seven years, based on gross leasable area (one retail property also contains 339 apartment units on the upper levels of the shopping center, which were 92.9% leased as of March 31, 2013). We also owned two commercial office properties, Excel Center, a portion of which is utilized as our company’s corporate headquarters, and the Promenade Corporate Center. These properties total 338,339 square feet of gross leasable area and were approximately 82.3% leased as of March 31, 2013. In addition, we held ownership interests in two unconsolidated retail properties totaling 225,070 square feet of gross leasable area, which were approximately 65.5% leased as of March 31, 2013. Our non-operating property consists of Phase II of our Chimney Rock property, which is held for future development. Phase I of our Chimney Rock property is classified as an operating property.
On January 24, 2013, we completed the acquisition of Tracy Pavilion, a retail shopping center with approximately 162,000 square feet of gross leasable area located in Tracy, California.
51
Table of Contents
Operating Properties
The table below sets forth relevant information with respect to the properties in our portfolio as of March 31, 2013 (dollars in thousands).
| Property/Location |
Year Built(1) |
Total GLA(2) |
Percent Leased |
Number of Tenants |
Major Tenants(3) |
Major Lease Expiration Date |
Annualized Base Rent(4) |
|||||||||||||||||||
| Retail Properties: |
||||||||||||||||||||||||||
| West Broad Village, Richmond, VA(5) |
2009 | 386,047 | 75.7 | % | 29 | Whole Foods* | 2028 | $ | 10,529 | |||||||||||||||||
| The Promenade, Scottsdale, AZ |
1999 | 433,538 | 97.3 | 68 | Nordstrom Rack* | 2015 | 7,897 | |||||||||||||||||||
| Park West Place, Stockton, CA |
2005 | 598,152 | (6) | 100.0 | 55 | Lowe’s* | 2026 | 7,158 | ||||||||||||||||||
| Gilroy Crossing, Gilroy, CA |
2004 | 325,431 | 98.4 | 30 | Kohl’s* | 2025 | 5,115 | |||||||||||||||||||
| Plaza at Rockwall, Rockwall, TX |
|
2007 /2012 |
|
431,338 | (7) | 98.4 | 33 | Dick’s Sporting Goods* |
2018 | 4,928 | ||||||||||||||||
| Brandywine Crossing, Brandywine, MD |
2009 | 198,384 | (8) | 97.1 | 29 | Safeway* | 2028 | 3,757 | ||||||||||||||||||
| Lake Pleasant Pavilion, Peoria, AZ |
2007 | 178,376 | 83.3 | 28 | Marshalls* Bed Bath & |
|
2017 2018 |
|
2,909 | |||||||||||||||||
| Dellagio, Orlando, FL |
2009 | 123,198 | 94.8 | 29 | Cantina Laredo* |
2019 | 2,863 | |||||||||||||||||||
| Vestavia Hills City Center, Vestavia Hills, AL(9) |
2002 | 391,899 | 82.8 | 58 | Publix* Rave Motion |
|
2022 2022 |
|
4,303 | |||||||||||||||||
| The Crossings of Spring Hill, Spring Hill, TN |
2008 | 219,842 | (10) | 96.9 | 34 | Ross Dress for Less* PetSmart* |
|
2019 2018 |
|
2,686 | ||||||||||||||||
| Tracy Pavilion, Tracy, CA |
2012 | 162,353 | 92.4 | 24 | Marshalls* PetSmart* |
|
2014 2018 |
|
2,217 | |||||||||||||||||
| Red Rock Commons, St. George, UT |
2012 | 118,550 | 95.8 | 14 | Dick’s Sporting Goods* |
2023 | 1,724 | |||||||||||||||||||
| Edwards Theatres, San Diego, CA |
1999 | 100,551 | 100.0 | 1 | Edwards Theatres* |
2019 | 2,184 | |||||||||||||||||||
| Rosewick Crossing, La Plata, MD |
2008 | 115,972 | (11) | 84.2 | 14 | Giant Food* | 2028 | 1,783 | ||||||||||||||||||
| EastChase Market Center, AL |
2008 | 181,431 | 98.9 | 10 | Dick’s Sporting Goods* |
2019 | 1,940 | |||||||||||||||||||
| 5000 South Hulen, Fort Worth, TX |
2005 | 86,833 | 94.9 | 20 | Barnes & Noble* | 2015 | 2,007 | |||||||||||||||||||
| Chimney Rock, Odessa, TX |
2012 | 151,339 | 97.8 | 5 | Academy Sports* |
2026 | 818 | |||||||||||||||||||
| Grant Creek Town Center, Missoula, MT |
1998 | 163,291 | 89.1 | 30 | REI* TJ Maxx* |
|
2020 2017 |
|
1,999 | |||||||||||||||||
| Lowe’s, Shippensburg, PA |
2008 | 171,069 | 100.0 | 1 | Lowe’s* | 2031 | 1,475 | |||||||||||||||||||
| Anthem Highlands, Las Vegas, NV |
2006 | 118,763 | 84.4 | 17 | Albertsons* | 2027 | 1,494 | |||||||||||||||||||
| Pavilion Crossing, Brandon, FL |
2012 | 68,400 | 92.7 | 13 | Publix* | 2031 | 1,003 | |||||||||||||||||||
| Shops at Foxwood, Ocala, FL |
2010 | 78,660 | 90.8 | 13 | Publix* | 2030 | 939 | |||||||||||||||||||
| Northside Plaza, Dothan, AL |
2010 | 171,670 | (12) | 94.8 | 14 | Publix* Hobby Lobby* |
|
2031 2026 |
|
1,376 | ||||||||||||||||
| Meadow Ridge Plaza, Orlando, FL |
2007 | 45,199 | 88.9 | 16 | Fifth Third Bank* |
2028 | 753 | |||||||||||||||||||
| Shoppes of Belmere, Orlando, FL |
2008 | 26,502 | 100.0 | 8 | CVS* | 2035 | 722 | |||||||||||||||||||
| Lake Burden Shoppes, Orlando, FL |
2008 | 20,598 | 100.0 | 6 | Walgreens* | 2034 | (13) | 629 | ||||||||||||||||||
| Five Forks Place, Simpsonville, SC |
2002 | 61,191 | 98.0 | 11 | Publix* | 2022 | 724 | |||||||||||||||||||
| Mariner’s Point, St. Marys, GA |
2001 | 45,215 | 95.6 | 17 | Shoe Show(14) | 2016 | 651 | |||||||||||||||||||
| Newport Towne Center, Newport, TN |
2006 | 60,100 | 91.3 | 13 | Dollar Tree(15) | 2016 | 485 | |||||||||||||||||||
| Merchant Central, Milledgeville, GA |
2004 | 45,013 | 83.9 | 15 | Dollar Tree(16) | 2014 | 501 | |||||||||||||||||||
| Walgreens, Corbin, KY — North |
2009 | 13,650 | 100.0 | 1 | Walgreens* | 2034 | (17) | 282 | ||||||||||||||||||
|
|
|
|
|
|
|
|
|
|||||||||||||||||||
| Subtotal/Weighted Average Retail Properties |
5,292,555 | 93.2 | % | 656 | 77,851 | |||||||||||||||||||||
|
|
|
|
|
|
|
|
|
|||||||||||||||||||
52
Table of Contents
| Property/Location |
Year Built(1) |
Total GLA(2) |
Percent Leased |
Number of Tenants |
Major Tenants(3) |
Major Lease Expiration Date |
Annualized Base Rent(4) |
|||||||||||||||||||
| Office Properties: |
||||||||||||||||||||||||||
| Excel Centre, San Diego, CA |
1999 | 82,157 | 83.6 | % | 8 | Kaiser Permanente | 2019 | 2,356 | ||||||||||||||||||
| Promenade Corporate Center, Scottsdale, AZ |
2004 | 256,182 | 81.9 | 30 | Fitch, Inc. | 2014 | 4,639 | |||||||||||||||||||
|
|
|
|
|
|
|
|
|
|||||||||||||||||||
| Subtotal/Weighted Average Office Properties |
338,339 | 82.3 | % | 38 | 6,995 | |||||||||||||||||||||
|
|
|
|
|
|
|
|
|
|||||||||||||||||||
| Unconsolidated Properties: |
||||||||||||||||||||||||||
| La Costa Town Center, La Costa, CA(18) |
1980 | 121,303 | 40.6 | % | 30 | Laboratory Data Consultants |
2013 | 1,271 | ||||||||||||||||||
| The Fountains at Bay Hill, Orlando, FL(19) |
2001 | 103,767 | 94.6 | 34 | CVS | 2026 | 2,943 | |||||||||||||||||||
|
|
|
|
|
|
|
|
|
|||||||||||||||||||
| Subtotal/Weighted Average Unconsolidated Properties |
225,070 | 65.5 | % | 64 | 4,214 | |||||||||||||||||||||
|
|
|
|
|
|
|
|
|
|||||||||||||||||||
| Total/Weighted Average(20) |
5,855,964 | 91.5 | % | 766 | $ | 89,060 | ||||||||||||||||||||
|
|
|
|
|
|
|
|
|
|||||||||||||||||||
| Non-Operating Properties(21) |
||||||||||||||||||||||||||
| Chimney Rock-Phase II, Odessa, TX |
||||||||||||||||||||||||||
| * | Denotes anchor tenant. |
| (1) | Year built represents the year in which construction was completed. |
| (2) | Total gross leasable area, or GLA, represents total square feet of GLA owned by us at the property (includes GLA of buildings under ground lease). |
| (3) | Major tenant represents the tenant(s) in each property that have the highest annualized base rent. |
| (4) | Annualized base rent, or ABR, means annualizing the cash base rental amount in effect under existing leases as of March 31, 2013. Amount does not include reimbursements for real estate taxes and insurance, common area and other operating expenses, substantially all of which are borne by the tenants, percentage rent or amounts attributable to future rent increases, where applicable. Amount includes rent attributable to ground leases. |
| (5) | The West Broad Village property is a retail shopping center that also includes 339 apartment units. Of the total GLA for West Broad Village 7,600 square feet, 7,000 square feet, 6,700 square feet, 6,330 square feet, 5,581 square feet, 4,500 square feet and 2,750 square feet are leased under ground leases to Chuy’s, Kona Grill, Mimi’s Café, Carrabba’s Italian Grill, Bonefish Grill, Wells Fargo and Union First Market Bank, respectively. |
| (6) | Of the total GLA for Park West Place, , 154,794 square feet, 88,248 square feet and 31,629 square feet are leased under ground leases to Lowe’s, Kohl’s and Babies R’ Us, respectively. |
| (7) | Of the total GLA for Plaza at Rockwall Phase I, 103,256 square feet and 75,524 square feet are leased under ground leases to J.C. Penney and Belk Department Store, respectively. |
| (8) | Of the total GLA for Brandywine Crossing, 59,678 square feet is leased under a ground lease to Safeway. |
| (9) | Includes Rite Aid, an outparcel to Vestavia Hills City Center, which was acquired in 2011. |
| (10) | Of the total GLA for The Crossings of Spring Hill, 10,160 square feet, 7,290 square feet and 6,387 square feet are leased under ground leases to Cracker Barrel, Logan’s Roadhouse and O’Charley’s, respectively. |
| (11) | Of the total GLA for Rosewick Crossing, 58,432 square feet is leased under a ground lease to Giant Food. |
| (12) | Of the total GLA for Northside Plaza (a 50% consolidated joint venture), 21,160 square feet, 4,202 square feet, 4,000 square feet and 4,000 square feet are leased under ground leases to Davis Theatre Company, Chili’s, Wells Fargo and Panera Bread, respectively. |
| (13) | Represents the earliest date this lease can be terminated by the tenant. Without early termination, the lease will expire in 2084. |
| (14) | Shoe Show is not the anchor tenant of this property. Mariner’s Point is anchored by a non-owned Super Wal-Mart. |
| (15) | Dollar Tree is not the anchor tenant of this property. Newport Towne Center is anchored by a non-owned Super Wal-Mart. |
| (16) | Dollar Tree is not the anchor tenant of this property. Merchant Central is anchored by a non-owned Super Wal-Mart. |
53
Table of Contents
| (17) | Represents the earliest date this lease can be terminated by the tenant. Without early termination, the lease will expire in 2084. |
| (18) | We hold a 20% ownership interest in the unconsolidated La Costa Town Center property. |
| (19) | We hold a 50% tenant-in-common ownership interest in the unconsolidated The Fountains at Bay Hill property. |
| (20) | Total/Weighted Average is calculated based on total GLA excluding the apartment units at our West Broad Village property. |
| (21) | A non-operating property is reclassified as an operating property at the earlier of (a) 85.0% occupancy or (b) one year from completion and delivery of the space. |
Non-Operating Property
Chimney Rock-Phase II is the undeveloped portion of our Chimney Rock property in Odessa, Texas. Based on our current development plans which are subject to change based on leasing demand and other market factors, we intend to continue development of the shopping center for an additional 150,000 square feet of gross leasable area.
Major Tenants
As of March 31, 2013, we had leases with numerous nationally recognized retailers. The following table sets forth information regarding the ten largest tenants in our operating portfolio based on total retail annualized base rent as of March 31, 2013.
| Retail Tenants (Leases) |
Total GLA | Percent of Total Retail GLA |
ABR ($ in 000s) |
Percent of Total Retail ABR |
ABR per leased square foot |
|||||||||||||||
| Publix Super Markets, Inc. |
244,151 | 4.6 | % | $ | 2,702 | 3.7 | % | $ | 11.07 | |||||||||||
| Lowe’s Home Centers, Inc. |
325,863 | 6.2 | 2,195 | 3.0 | 6.74 | |||||||||||||||
| Edwards Theatres |
100,551 | 1.9 | 2,184 | 3.0 | 21.72 | |||||||||||||||
| Dick’s Sporting Goods |
140,018 | 2.6 | 1,776 | 2.4 | 12.69 | |||||||||||||||
| PetSmart |
113,347 | 2.1 | 1,688 | 2.3 | 14.89 | |||||||||||||||
| Ross Dress for Less |
143,519 | 2.7 | 1,621 | 2.2 | 11.29 | |||||||||||||||
| TJX Companies |
168,207 | 3.2 | 1,555 | 2.1 | 9.25 | |||||||||||||||
| Bed Bath & Beyond |
131,864 | 2.5 | 1,441 | 2.0 | 10.93 | |||||||||||||||
| Kohl’s |
176,656 | 3.3 | 1,347 | 1.8 | 7.63 | |||||||||||||||
| Jo-Ann |
105,955 | 2.0 | 1,236 | 1.7 | 11.66 | |||||||||||||||
|
|
|
|
|
|
|
|
|
|
|
|||||||||||
| Total Top Ten Tenants/Weighted Average |
1,650,131 | 31.1 | % | $ | 17,745 | 24.2 | % | $ | 10.75 | |||||||||||
|
|
|
|
|
|
|
|
|
|
|
|||||||||||
As of March 31, 2013, we had leases with 38 distinct office tenants. The following table sets forth information regarding our three largest office tenants in our operating portfolio based on total office annualized base rent as of March 31, 2013. As of March 31, 2013, 13,834 square feet were leased by us for our and our general partner’s corporate offices and a regional management office.
| Office Tenants |
Total GLA | Percent of Total Office GLA |
ABR ($ in 000s) |
Percent of Total Office ABR |
ABR per leased square foot |
|||||||||||||||
| Kaiser Permanente |
38,432 | 11.4 | % | $ | 1,652 | 23.6 | % | $ | 42.99 | |||||||||||
| Fitch, Inc. |
20,878 | 6.2 | 632 | 9.0 | 30.25 | |||||||||||||||
| Buchalter Nemer |
18,204 | 5.4 | 519 | 7.4 | 28.50 | |||||||||||||||
|
|
|
|
|
|
|
|
|
|
|
|||||||||||
| Total Top Tenants/Weighted Average |
77,514 | 23.0 | % | $ | 2,803 | 40.0 | % | $ | 36.16 | |||||||||||
|
|
|
|
|
|
|
|
|
|
|
|||||||||||
54
Table of Contents
Lease Expirations
The following table sets forth information with respect to the lease expirations of our retail and office operating properties based on leased gross leasable area as of March 31, 2013.
| Lease Expiration Year |
Total Expiring GLA |
Percent of Total GLA Expiring |
Expiring Annualized Base Rent ($ in 000s) |
Percent of Total Annualized Base Rent |
Expiring Annualized Base Rent per leased square foot |
|||||||||||||||
| Available |
419,543 | 7.5 | % | $ | — | — | % | $ | — | |||||||||||
| 2013 |
237,632 | 4.2 | 4,255 | 5.3 | 17.78 | |||||||||||||||
| 2014 |
412,240 | 7.3 | 8,246 | 10.3 | 20.00 | |||||||||||||||
| 2015 |
643,341 | 11.4 | 11,000 | 13.8 | 17.10 | |||||||||||||||
| 2016 |
412,998 | 7.3 | 7,167 | 9.0 | 17.35 | |||||||||||||||
| 2017 |
285,339 | 5.1 | 5,513 | 6.9 | 19.32 | |||||||||||||||
| 2018 |
462,015 | 8.2 | 7,816 | 9.8 | 16.92 | |||||||||||||||
| 2019 |
497,008 | 8.8 | 9,456 | 11.8 | 19.03 | |||||||||||||||
| 2020 |
211,237 | 3.8 | 4,357 | 5.5 | 20.63 | |||||||||||||||
| 2021 |
139,665 | 2.5 | 1,574 | 2.0 | 11.27 | |||||||||||||||
| 2022 |
365,230 | 6.5 | 4,250 | 5.3 | 11.64 | |||||||||||||||
| 2023 and thereafter |
1,544,646 | 27.4 | 16,308 | 20.3 | 10.56 | |||||||||||||||
|
|
|
|
|
|
|
|
|
|
|
|||||||||||
| Total/Weighted Average |
5,630,894 | 100.0 | % | $ | 79,912 | 100.0 | % | $ | 14.19 | |||||||||||
|
|
|
|
|
|
|
|
|
|
|
|||||||||||
Property Management and Leasing Strategy
Our property management and substantially all of our leasing activities and operating and administrative functions (including leasing, legal, acquisitions, development, data processing, finance and accounting) are administered or coordinated by our personnel. On-site functions such as maintenance, landscaping, sweeping, plumbing and electrical are subcontracted out at each location and, to the extent permitted by their respective leases, the cost of these functions is passed on to the tenants.
We believe that focused property management, leasing and customer retention are essential to maximizing the sales per square foot, operating cash flow and value of our properties. Our primary goal in property management is to maintain an attractive shopping environment on a cost-effective basis for our tenants.
The majority of our property management and leasing functions are supervised and administered by personnel at our San Diego, California office. Our property managers maintain regular contact with our tenants and frequently visit each asset to ensure the proper implementation and execution of our market strategies. As part of our ongoing property management, we conduct regular physical property reviews to improve our properties, react to changing market conditions and ensure proper maintenance.
Our leasing representatives have become experienced in the markets in which we operate by becoming familiar with current tenants as well as potential local, regional and national tenants that would complement our current tenant base. We study demographics, customer sales and merchandising mix to optimize the sales performance of our centers and thereby increase rents. We believe this hands-on approach maximizes the value of our shopping centers.
55
Table of Contents
Item 4. Security Ownership of Certain Beneficial Owners and Management.
The following table sets forth as of May 20, 2013, except as otherwise set forth in the footnotes to the table, the beneficial ownership of common operating partnership units for (1) each person who is the beneficial owner of 5% or more of our outstanding common operating partnership units, (2) each executive officer named in the Summary Compensation Table below, (3) each director of our general partner and (4) directors and executive officers as a group. Each person named in the table has sole voting and investment power with respect to all of the common operating partnership units shown as beneficially owned by such person, except as otherwise set forth in the footnotes to the table. The address of each named person is c/o Excel Trust, Inc., 17140 Bernardo Center Drive, Suite 300, San Diego, California 92128. We are not aware of any arrangements, including any pledge of our common operating partnership units that could result in a change in control of us or our general partner.
| Name of Beneficial Owner |
Number of Common Operating Partnership Units Beneficially Owned |
Percent of All Common Operating Partnership Units(1) |
||||||
| Excel Trust, Inc. |
47,930,985 | 97.5 | % | |||||
| Gary B. Sabin(2) |
471,370 | 1.0 | ||||||
| Spencer G. Plumb |
— | * | ||||||
| James Y. Nakagawa |
56,564 | * | ||||||
| Mark T. Burton |
56,564 | * | ||||||
| S. Eric Ottesen |
56,564 | * | ||||||
| Bruce G. Blakley |
— | * | ||||||
| Burland B. East |
— | * | ||||||
| Robert E. Parsons |
— | * | ||||||
| Warren R. Staley |
— | * | ||||||
| All directors and executive officers as a group (nine persons) |
641,062 | 1.3 | ||||||
| * | Less than 1%. |
| (1) | Based on at total of 49,156,100 common operating partnership units outstanding as of May 20, 2013. |
| (2) | Includes 471,370 operating partnership units held by the Gary B. Sabin Family Trust dated May 20, 1982, for which Mr. Sabin is the trustee. Mr. Sabin disclaims beneficial ownership except to the extent of his pecuniary interest therein. Mr. Sabin has pledged his operating partnership units as security for a personal loan. |
Item 5. Directors and Executive Officers.
This section reflects information with respect to the directors and executive officers of our general partner. We are managed by our general partner. Consequently, we do not have our own separate directors. Our executive officers are employees of Excel Trust, Inc. and Excel Trust, L.P.
Our general partner held its annual meeting of stockholders on May 7, 2013. At that time, our general partner’s stockholders voted on the election of directors. At the annual meeting, all of the nominees for election as directors of our general partner were elected.
The following table sets forth the names and ages as of May 20, 2013 of the directors of our general partner:
| Name |
Age | Position | ||||
| Gary B. Sabin |
58 | Chairman of the Board of Directors and Chief Executive Officer | ||||
| Spencer G. Plumb |
38 | President, Chief Operating Officer and Director | ||||
| Mark T. Burton |
52 | Chief Investment Officer, Senior Vice President of Acquisitions and Director | ||||
| Bruce G. Blakley |
68 | Director | ||||
| Burland B. East III |
53 | Director | ||||
| Robert E. Parsons, Jr. |
57 | Director | ||||
| Warren R. Staley |
70 | Director | ||||
56
Table of Contents
The following are biographical summaries for the directors of our general partner:
Gary B. Sabin has served as our general partner’s Chairman and Chief Executive Officer since our general partner’s formation in December 2009. Since October 2003, Mr. Sabin has served as Chairman, Chief Executive Officer and President of Excel Realty Holdings. From September 2001 to October 2003, Mr. Sabin served as Co-Chairman and Chief Executive Officer of Price Legacy Corporation. From November 1997 to September 2001, Mr. Sabin served as Chairman, President and Chief Executive Officer of Excel Legacy Corporation. From September 1998 to April 1999, Mr. Sabin served as a Director and President of New Plan Excel Realty Trust. From January 1989 to September 1998, Mr. Sabin served as Chairman, President and Chief Executive Officer of Excel Realty Trust. In addition, Mr. Sabin has served as Chief Executive Officer of various companies since his founding of Excel Realty Trust Inc.’s predecessor company and its affiliates beginning in 1978. He has been active for over 30 years in diverse aspects of the real estate industry, including the evaluation and negotiation of real estate acquisitions, management, financing, development and dispositions. Mr. Sabin also currently serves as Chairman of The Sabin Children’s Foundation and Vice Chairman of the Cystic Fibrosis Foundation. Mr. Sabin received a Master’s Degree in Management from Stanford University as a Sloan Fellow and a Bachelor of Science in Finance from Brigham Young University. Mr. Sabin is the father-in-law of Spencer Plumb. Our general partner’s board of directors concluded that Mr. Sabin should serve as our general partner’s Chairman based on his executive leadership experience in public real estate investment trusts, or REITs, and other real estate companies, his entrepreneurship and creativity, his network of relationships with real estate professionals across the United States and his experience in finance.
Spencer G. Plumb has served as our general partner’s President and Chief Operating Officer since our general partner’s formation in December 2009 and has served as a director since the completion of our general partner’s initial public offering in April 2010. Since January 2008, Mr. Plumb has served as Chief Operating Officer of Excel Realty Holdings. From October 2003 to January 2008, Mr. Plumb served as Senior Vice President of Investments of Excel Realty Holdings. From September 2001 to October 2003, Mr. Plumb served as Investment Analyst of Price Legacy Corporation. From November 1997 to September 2001, Mr. Plumb served as Investment Analyst of Excel Legacy Corporation. From September 1998 to April 1999, Mr. Plumb served as Property Analyst, Asset Management of New Plan Excel Realty Trust. From May 1997 to September 1998, Mr. Plumb served as Property Analyst of Excel Realty Trust. Mr. Plumb also currently serves on the investment committee of The Sabin Children’s Foundation and as a director of the San Diego chapter of the Cystic Fibrosis Foundation. Mr. Plumb received a Bachelor of Arts in Economics from Brigham Young University. Mr. Plumb is the son-in-law of Gary Sabin. Our general partner’s board of directors concluded that Mr. Plumb should serve as a director based on his experience working with public REITs and other real estate companies and his experience with public markets.
Mark T. Burton has served as our general partner’s Chief Investment Officer and Senior Vice President of Acquisitions since our general partner’s formation in December 2009 and has served as a director since the completion of our general partner’s initial public offering in April 2010. Since October 2003, Mr. Burton has served as Senior Vice President of Acquisitions/Dispositions of Excel Realty Holdings. From September 2001 to February 2004, Mr. Burton served as Senior Vice President — Acquisitions of Price Legacy Corporation. From November 1997 to September 2001, Mr. Burton served as Senior Vice President — Acquisitions of Excel Legacy Corporation. From September 1998 to April 1999, Mr. Burton served as Senior Vice President — Acquisitions of New Plan Excel Realty Trust. From October 1995 to September 1998, Mr. Burton served as Senior Vice President — Acquisitions, and from January 1989 to October 1995 as Vice President — Acquisitions, of Excel Realty Trust. Mr. Burton was associated with Excel Realty Trust and its affiliates beginning in 1983, primarily in the evaluation and selection of property acquisitions. Mr. Burton also currently serves as a director of The Sabin Children’s Foundation. Mr. Burton received a Bachelor of Arts in Finance from Brigham Young University. Our general partner’s board of directors concluded that Mr. Burton should serve as a director based on his extensive experience directing acquisitions and dispositions for public and private real estate companies, including REITs.
Bruce G. Blakley has served as a director of our general partner since the completion of our general partner’s initial public offering in April 2010. Mr. Blakley retired from PricewaterhouseCoopers LLP in 2005 after a career of 32 years, including 23 years as an audit partner. Mr. Blakley currently serves as an adjunct faculty member at the Rady School of Management at the University of California, San Diego. He currently serves on the board of directors of Cubic Corporation, a public company, where he chairs the Audit Committee, HDOS Enterprises, a private company, where he is the Chair and serves on the Audit Committee, and NP Strategies, a not-for-profit. Mr. Blakley received a Bachelor of Arts in Business with an accounting major from Bowling Green State University. Mr. Blakley is a certified public accountant in California. Our general partner’s board of directors concluded that Mr. Blakley should serve as a director and as chairman of the audit committee based on his career with PricewaterhouseCoopers LLP, his significant public REIT experience, particularly in the areas of finance, tax and audit, and his service on other boards and audit committees.
57
Table of Contents
Burland B. East III has served as a director of our general partner since the completion of our general partner’s initial public offering in April 2010. Mr. East is the Chief Executive Officer of American Assets Investment Management, LLC, an SEC-registered investment advisor based in San Diego with over $900 million in assets under management. Mr. East was a Managing Principal of Silver Portal Capital, LLC, a FINRA-regulated investment bank specializing in institutional real estate from October 2001 to July 2010. From August 1992 to February 2001, Mr. East was a Managing Director, Senior Equity Analyst and Group Co-Head at First Union Securities, EVEREN Securities Inc. and Kemper Securities Inc., with primary responsibility for equity research coverage of all forms of publicly traded real estate companies and related investment banking. Since 2003, Mr. East has served on the Leadership Council of the Lusk Center for Real Estate at the University of Southern California. Mr. East is a NAREIT member and was a NAREIT Board Associate in 1998/1999. Mr. East received both a Bachelor of Arts in Business and Master’s Degree in Business Administration from Loyola College in Maryland. Mr. East holds a Chartered Financial Analyst (CFA) designation. Our general partner’s board of directors concluded that Mr. East should serve as a director based on his depth of experience working with institutional and retail real estate investors, as well as his significant experience in general commercial real estate matters.
Robert E. Parsons, Jr. has served as a director of our general partner since the completion of our general partner’s initial public offering in April 2010. Mr. Parsons has served as Executive Vice President and Chief Financial Officer of Exclusive Resorts, LLC since June 2004. Prior to joining Exclusive Resorts, Mr. Parsons had worked for over 20 years at Marriott Corporation and then Host Marriott Corporation in various financial positions, including serving as Executive Vice President and Chief Financial Officer of Host Marriott Corporation for more than seven years. Since September 2010, Mr. Parsons has served on the board of directors of Carey Watermark Investors Incorporated, a public REIT. Mr. Parsons served on the board of directors of Tenfold Corporation from September 2004 to May 2008 and CNL Hotels & Resorts, Inc. from September 2003 to April 2007. Mr. Parsons received a Master’s Degree in Business Administration from the Graduate School of Management at Brigham Young University and a Bachelor of Arts in Accounting from Brigham Young University. Our general partner’s board of directors concluded that Mr. Parsons should serve as a director based on his extensive experience as a director and senior officer in public REITs and other real estate companies and his experience in finance.
Warren R. Staley has served as a director of our general partner since the completion of our general partner’s initial public offering in April 2010. Mr. Staley served as Chief Executive Officer of Cargill, Inc., an international marketer, processor and distributor of agricultural food, financial and industrial products, from 1999 until his retirement in 2007. He served on Cargill’s board of directors from 1995 to 2007, including as Chairman from 2000 to 2007. Mr. Staley currently serves on the board of directors of PACCAR Inc., and previously served on the boards of directors of U.S. Bancorp from 1999 to 2008 and Target Corporation from 2001 to 2007. Mr. Staley received a Master’s Degree in Business Administration from Cornell University and a Bachelor of Science in Electrical Engineering from Kansas State University. Our general partner’s board of directors concluded that Mr. Staley should serve as a director based on his global and diversified business knowledge, leadership expertise and experience as a director and senior officer of large public and private companies.
Executive Officers
Our general partner’s executive officers and other significant employees and their ages as of May 20, 2013 are as follows:
| Name |
Age | Position | ||||
| Gary B. Sabin |
58 | Chairman of the Board of Directors and Chief Executive Officer | ||||
| Spencer G. Plumb |
38 | President, Chief Operating Officer and Director | ||||
| James Y. Nakagawa |
47 | Chief Financial Officer and Treasurer | ||||
| Mark T. Burton |
52 | Chief Investment Officer, Senior Vice President of Acquisitions and Director | ||||
| S. Eric Ottesen |
57 | Senior Vice President, General Counsel and Secretary | ||||
| Matthew S. Romney |
41 | Senior Vice President of Capital Markets | ||||
| William J. Stone |
69 | Senior Vice President of Asset Management/Development | ||||
58
Table of Contents
The following are biographical summaries for our general partner’s executive officers other than Messrs. Sabin, Plumb and Burton, for whom biographical summaries can be found in the preceding section.
James Y. Nakagawa has served as our general partner’s Chief Financial Officer and Treasurer since our general partner’s formation in December 2009. Since October 2003, Mr. Nakagawa has served as Chief Financial Officer of Excel Realty Holdings. From September 2001 to January 2004, Mr. Nakagawa served as Chief Financial Officer of Price Legacy Corporation. From October 1998 to September 2001, Mr. Nakagawa served as Chief Financial Officer, and from March 1998 to October 1998, as Controller of Excel Legacy Corporation. From September 1998 to April 1999, Mr. Nakagawa served as Controller of New Plan Excel Realty Trust. From September 1994 to September 1998, Mr. Nakagawa served as Controller of Excel Realty Trust. Prior to joining Excel Realty Trust, Mr. Nakagawa was a manager at Coopers & Lybrand LLP. Mr. Nakagawa received a Bachelor of Science in Business Administration with a concentration in accounting from San Diego State University and is a certified public accountant. He is a member of the AICPA and the California Society of CPAs.
S. Eric Ottesen has served as our general partner’s Senior Vice President, General Counsel and Secretary since our general partner’s formation in December 2009. Since October 2003, Mr. Ottesen has served as Senior Vice President, General Counsel and Secretary of Excel Realty Holdings. From September 2001 to October 2003, Mr. Ottesen served as Senior Vice President, General Counsel and Secretary of Price Legacy Corporation. From November 1997 to September 2001, Mr. Ottesen served as Senior Vice President, General Counsel and Assistant Secretary of Excel Legacy Corporation. From September 1998 to April 1999, Mr. Ottesen served as Senior Vice President — Legal Affairs and Secretary of New Plan Excel Realty Trust. From September 1996 to September 1998, Mr. Ottesen served as Senior Vice President, General Counsel and Assistant Secretary of Excel Realty Trust. From 1987 to 1995, he was a senior partner in a San Diego law firm. Mr. Ottesen also currently serves as a director of The Sabin Children’s Foundation and the San Diego chapter of the Cystic Fibrosis Foundation. Mr. Ottesen received a Juris Doctor from Southwestern University and a Bachelor of Arts in English from Brigham Young University.
Matthew S. Romney has served as our general partner’s Senior Vice President of Capital Markets since our general partner’s formation in December 2009. Since January 2008, Mr. Romney has served as Vice President of Strategy/Investments of Excel Realty Holdings. From September 2005 to January 2008, Mr. Romney served as Vice President Property Management for Excel Realty Holdings. From September 2003 to July 2005, Mr. Romney served as Product Manager for Microsoft Corporation. Prior to joining Microsoft Corporation, Mr. Romney held various marketing and project management positions for Lavastorm, Inc. and Polaroid Corporation. Mr. Romney received a Master’s Degree in Business Administration from Harvard Business School and a Bachelor of Arts in Political Science from Brigham Young University.
William J. Stone has served as our general partner’s Senior Vice President of Asset Management/Development since our general partner’s formation in December 2009. Since October 2003, Mr. Stone has served as Senior Vice President of Development of Excel Realty Holdings. From September 2001 to October 2003, Mr. Stone served as Senior Vice President of Development of Price Legacy Corporation. From October 1999 to September 2001, Mr. Stone served as Senior Vice President of Development of Excel Legacy Corporation. Prior to joining Excel Legacy Corporation, Mr. Stone served as Executive Vice President of DDR/Oliver McMillan where he oversaw the development of urban retail redevelopment projects. Mr. Stone attended Cal Poly Pomona.
Item 6. Executive Compensation.
This section reflects information with respect to the directors and executive officers of our general partner. We are managed by our general partner. Consequently, we do not have our own separate directors. Our executive officers are employees of Excel Trust, Inc. and Excel Trust, L.P.
59
Table of Contents
Compensation Discussion and Analysis
This Compensation Discussion and Analysis section discusses the compensation policies and programs for Excel Trust, Inc.’s and Excel Trust, L.P.’s named executive officers. This section provides an overview and analysis of our compensation program and policies, the material compensation decisions we have made under those programs and policies with respect to the named executive officers, and the material factors that we considered in making those decisions. The named executive officers include:
| • | Gary B. Sabin, the Chairman of the board of directors of our general partner and Chief Executive Officer of Excel Trust, Inc. and Excel Trust, L.P., |
| • | Spencer G. Plumb, President and Chief Operating Officer of Excel Trust, Inc. and Excel Trust, L.P., |
| • | James Y. Nakagawa, Chief Financial Officer and Treasurer of Excel Trust, Inc. and Excel Trust, L.P., |
| • | Mark T. Burton, Chief Investment Officer and Senior Vice President of Acquisitions of Excel Trust, Inc. and Excel Trust, L.P., and |
| • | S. Eric Ottesen, Senior Vice President, General Counsel and Secretary of Excel Trust, Inc. and Excel Trust, L.P. |
Executive Summary
Fiscal 2012 Executive Compensation
The compensation committee of our general partner’s board of directors, or the compensation committee, has retained Christenson Advisors, an independent compensation consultant, to provide it with data regarding market practices and advice regarding executive annual base salaries, bonuses and long-term incentive compensation, consistent with our general partner’s compensation philosophies and objectives. As a result of its annual review of our general partner’s executive compensation program, and based on the input of the compensation consultant, the compensation committee established the following compensation program for the named executive officers for 2012:
| • | No Base Salary Increases: No adjustments were made to the base salaries of the named executive officers during 2012, which remained at the levels originally established in connection with our general partner’s initial public offering in April 2010. |
| • | Emphasis on Performance-Based Compensation: The majority of the named executive officers’ target total direct compensation is in the form of variable compensation, consisting of annual incentive bonuses and long-term equity incentive awards, which aligns executive compensation with the interests of our and our general partner’s equityholders by tying a significant majority of total direct compensation to the achievement of performance goals or stockholder returns. Currently, the compensation committee intends that the three elements of Mr. Sabin’s total annual compensation will be earned in the following approximate proportions: 30% base salary, 30% annual bonus and 40% long-term incentives. For the other named executive officers, total annual compensation is intended to be earned in the following approximate proportions: 40% base salary, 25% annual bonus and 35% long-term incentives. |
| • | Emphasis on Performance-Based Restricted Stock Awards: The compensation committee has instituted the use of performance-based restricted stock awards as a significant portion of long-term equity incentive compensation. Of the restricted stock awards granted to the named executive officers during 2011, over 70% are subject to performance-based vesting based on our general partner’s absolute total stockholder return during 2011, 2012 and 2013 and the three-year performance period beginning on January 1, 2011. The value of these awards is tied 100% to our general partner’s total stockholder return and could be as little as zero if our general partner’s total stockholder return over the performance measurement period falls below the threshold for vesting. No additional equity awards were granted to the named executive officers during 2012. |
60
Table of Contents
| • | Realized Pay for 2012: As noted above, approximately 70% of Mr. Sabin’s total annual compensation and approximately 60% of the total annual target compensation of our other named executive officers is “at-risk” or tied to the achievement of company or individual performance objectives. Of these amounts, a significant portion of each executive’s total annual compensation is comprised of the opportunity provided by the performance-based restricted stock awards granted in 2011, the value of which may never be realized by the named executive officers. As required by SEC disclosure rules, the Summary Compensation Table set forth below reflects the full grant date fair value of these performance-based awards for accounting purposes, which value does not represent the realizable value of these awards to the executives. Our general partner’s total stockholder return performance for 2012 was 11.4%, and 74.4% of the shares eligible to vest during 2012 under the performance-based restricted stock awards vested (or 55,800 shares for Mr. Sabin and 13,020 shares for the other named executive officers). The unvested portion of these awards remain eligible for vesting based on total stockholder return during the three year period ending December 31, 2013. |
Response to 2012 Say-on-Pay Vote
In April 2012, our general partner’s stockholders overwhelmingly approved the compensation of the named executive officers, with over 99% of stockholder votes cast in favor of our general partner’s 2012 say-on-pay resolution (excluding abstentions and broker non-votes). As our general partner evaluated its and our compensation practices and talent needs after April 2012, the compensation committee was mindful of the strong support our general partner’s stockholders expressed for our general partner’s compensation philosophy. In addition, during 2012, we met in person with over 100 of our general partner’s institutional investors and contacted over 200 additional investors in our general partner. Following its annual review of our general partner’s executive compensation practices, the compensation committee decided generally to retain the approach to executive compensation it had previously adopted for 2012.
Executive Compensation Program Overview
Our general partner’s executive compensation program is administered under the direction of the compensation committee.
Elements of Our Executive Compensation Program
The compensation committee believes that each of the elements of our general partner’s executive compensation program plays an important role in helping our general partner achieve its and our compensation objectives. The compensation committee intends for the executive compensation program overall to be aligned with the following long-term philosophical positioning:
| • | Base Salary: The compensation committee intends that annual base salaries for the named executive officers provide a stable annual income at a level that is consistent with the individual executive officer’s role and contribution to the company. |
| • | Annual Incentive Bonuses: Annual incentive bonus opportunities are intended to link each executive officer’s compensation to the company’s overall financial and operating performance relative to established company goals, and the officer’s individual and business unit performance, for a particular year. |
| • | Long-Term Equity Incentive Awards: Long-term equity incentive awards, consisting primarily of awards of restricted stock in our general partner, are intended to promote retention through time-based and performance-based vesting, to align the financial interests of the executives with those of our and our general partner’s equityholders and to encourage actions that maximize long-term equityholder value. |
61
Table of Contents
| • | Other Compensation: The named executive officers also are eligible to receive other elements of compensation, including health and retirement benefits, as described below under “—Other Benefits.” All of these compensation elements are considered by the compensation committee in setting the compensation of the named executive officers. To the extent that the named executive officers receive any perquisites or benefits beyond those provided to all other employees, such arrangements will be limited in scope and conservative in relation to market practices. We and our general partner have also entered into employment agreements with each of the named executive officers, which are described below under “—Employment Agreements” and “— Potential Payments Upon Termination or Change in Control.” |
| • | Total Compensation: The compensation committee intends to target total compensation for the named executive officers at a level that is approximately the 75th percentile among comparable companies of similar size (based on the company’s performance at its annual operating plan). In order to meet the targeted total compensation positioning, the compensation committee expects that base salaries will be below the 75th percentile of executives holding comparable positions within our peer group. The compensation committee does expect, however, that over the long-term annual incentive compensation (assuming performance at the targeted levels) will be above the 75th percentile of executives holding comparable positions within our peer group. This higher on-target positioning relative to annual incentive compensation reflects that annual equity compensation for executive officers (not including new hire awards) is believed to result in better alignment with the interests of equityholders and a focus on long-term performance. |
| • | Allocation of Compensation: The compensation committee also intends to allocate total compensation between cash and equity compensation based on a number of factors, including the compensation mix of our peer group companies, total compensation targets, and the salary and bonus guidelines and requirements established in the executives’ employment agreements at the time of our general partner’s initial public offering. Currently, the compensation committee intends that the majority of the named executive officers’ total compensation will consist of annual bonus and long-term incentives. |
The compensation committee may make adjustments to the compensation of our executive officers to implement fully this stated compensation philosophy. Regardless of the stated compensation positioning, the compensation committee strives to strike an appropriate balance among base salary, annual bonus and long-term incentives, and it may adjust the allocation of pay to facilitate the achievement of our objectives or remain competitive in the market for executive talent. Neither we nor our general partner guarantees that any executive will receive a specific market-derived compensation level and actual compensation may be above or below targets based on both company and individual performance.
The compensation levels of the named executive officers reflect to a significant degree their varying roles and responsibilities. Mr. Sabin, in his role as Chairman of our general partner and our Chief Executive Officer, has the greatest level of responsibility among the named executive officers and, therefore, receives the highest level of pay. This philosophy is also consistent with competitive practices among the companies in our peer group.
Determination of Compensation Awards
The compensation committee annually reviews and determines the total compensation to be paid to the named executive officers.
Role of Management. Mr. Sabin, our general partner’s Chairman and the Chief Executive Officer of Excel Trust, Inc. and Excel Trust, L.P., makes recommendations and presents analyses to the compensation committee based on its requests. He also discusses with the compensation committee members:
| • | our financial performance and that of our peers, |
| • | the financial and other impacts of proposed compensation changes on our business, |
| • | peer group compensation data, and |
| • | the performance of each of the other named executive officers, including his evaluation of their individual and business unit performances. |
62
Table of Contents
The compensation committee gathers data on the Chief Executive Officer’s performance through several channels, including qualitative and quantitative assessments of the company’s performance, discussions with other members of the management team and discussions with other members of the board of directors.
The compensation committee generally meets without any members of management present. To the extent Mr. Sabin or any of the other named executive officers attends a compensation committee meeting, he does not attend any portion of the compensation committee meeting intended to be held without members of management present or any executive sessions relating to his own compensation.
Competitive Market Data and Compensation Consultant. During 2012, the compensation committee retained Christenson Advisors, an independent compensation consultant, to advise it with respect to the overall design of our executive compensation program and 2012 compensation decisions. Neither the compensation committee nor our general partner has any other professional relationship with Christenson Advisors. After review and consultation with Christenson Advisors, the compensation committee has determined that there is no conflict of interest resulting from retaining Christenson Advisors currently or during the year ended December 31, 2012. In reaching these conclusions, the compensation committee considered the factors set forth in Exchange Act Rule 10C-1. In connection with the compensation committee’s annual compensation review in early 2012, Christenson Advisors provided data regarding market practices and provided advice regarding executive annual base salaries, bonuses and long-term incentive compensation.
In determining compensation for the named executive officers, the compensation committee utilized data provided by Christenson Advisors for a comparable group of companies, as discussed below, and examined each peer company’s compensation practices. The compensation committee used this information in determining the long-term objectives of our general partner’s executive compensation program and the target levels of each compensation component.
The compensation committee, with input from its compensation consultant and our management team, intends to review annually the composition of our peer group and the criteria and data used in compiling the peer group and to make appropriate modifications to account for certain factors such as peer company size, market capitalization, asset focus and growth statistics. The compensation committee does not consider companies’ compensation methodology as a factor in selecting the companies for inclusion in the peer group.
The 2012 peer group established by the compensation committee consists of the following public REITs focused primarily on the development, ownership and operation of retail properties, each having a total capitalization comparable to our general partner’s:
| Acadia Realty Trust |
Kite Realty Group Trust | |
| American Assets Trust |
Ramco-Gershenson Properties Trust | |
| Cedar Shopping Centers, Inc. |
Retail Opportunity Investments Corp. | |
| Equity One, Inc. |
Saul Centers, Inc. | |
| Inland Real Estate Corporation |
Urstadt Biddle Properties, Inc. | |
Although the compensation committee obtains and reviews compensation data from our peers, it does not establish compensation levels based solely on benchmarking. Instead, the compensation committee relies upon its own judgment in making compensation decisions, after reviewing the specific performance criteria of the company and carefully evaluating an executive officer’s individual performance during the year and, for executive officers other than Mr. Sabin, business unit performance during the year, each as more specifically described below.
63
Table of Contents
Elements of the Executive Compensation Program
Base Salary
The initial base salary for each executive officer is provided in the employment agreement among us, our general partner and such officer, as described below under “— Employment Agreements,” subject to annual increases in the discretion of the board of directors or the compensation committee. In determining base salary increases, the compensation committee will consider each executive officer’s individual performance and business unit performance, as well as the company’s overall performance, market conditions and competitive salary information. No adjustments were made to the base salaries of the named executive officers during 2012, which remained at the levels originally established in connection with our general partner’s initial public offering in April 2010.
In February 2013, the compensation committee approved increases to the base salaries of the named executive officers for 2013. Each named executive officer received a base salary increase of 15% over 2012 levels, resulting in a 2013 base salary of $370,000 for Mr. Sabin and a 2013 base salary of $200,000 for each of the other named executive officers.
Annual Bonuses
We pay annual bonuses to the named executive officers to reward them for company and individual achievement. Each named executive officer’s target annual bonus is set forth in his employment agreement. Mr. Sabin’s target annual bonus is equal to 100% of his annual base salary and his maximum bonus is equal to 150% of his annual base salary. The target annual bonus for each of the other named executive officers is equal to 75% of his annual base salary and the maximum bonus for each other named executive officer is equal to 100% of his annual base salary. The actual bonuses awarded in any given year, if any, may be more or less than the target (but in no event greater than the maximum bonus level), depending on individual and business unit performance and the achievement of company objectives and may vary based on other factors at the discretion of the compensation committee.
2012 Annual Incentive Program. In March 2012, the compensation committee established the 2012 annual incentive program, a cash bonus program under the 2010 Equity Incentive Award Plan of Excel Trust, Inc. and Excel Trust, L.P., or the 2010 Plan. In determining the named executive officers’ respective annual bonuses for 2012, the compensation committee considered the performance of the company, while also taking into consideration the respective individual performances of each of the named executive officers and the respective business unit performances for each of Messrs. Plumb, Nakagawa, Burton and Ottesen. The total bonus for each of the named executive officers is tied 40% to our general partner’s adjusted funds from operations (adjusted FFO) per diluted share, 25% to individual performance, and 35% to a combination of the following general company or business unit objectives that most closely relate to such executive’s area of responsibility: (1) minimize cash general and administrative expenses, or G&A (for Messrs. Plumb and Nakagawa); (2) capital raising activities (for Messrs. Sabin, Plumb, Nakagawa, Burton and Ottesen); (3) dispositions of non-core assets (for Mr. Burton); (4) operation of properties at or above budgeted net operating income levels (for Mr. Plumb); (5) target acquisition levels (for Messrs. Sabin, Plumb, Nakagawa, Burton and Ottesen); and (6) targeted savings on legal fees (for Mr. Ottesen), as further described below. The compensation committee selected the foregoing performance measures and their relative weightings because they represent the key financial and operational performance metrics that the executives are responsible for, thereby creating the clearest link between executive actions and results. In addition, the compensation committee believes that the selected performance measures are well-balanced and important to sustaining the long-term performance of the company.
For 2012, the targeted level of adjusted FFO per diluted share of our general partner was $0.84, and our general partner achieved adjusted FFO per diluted share of $0.78. With respect to the business unit objectives, the targeted levels and corresponding performance relative to those targeted levels for 2012 were as follows: (1) with respect to capital raising activities, our general partner’s goal for 2012 was to raise $150 million and it raised $270 million in equity issuances; (2) for 2012, cash G&A expenses were $7.2 million, which met our goal of minimizing cash G&A expenses; (3) we sought to dispose of non-core assets with a value of at least $15 million, and we did not sell any assets; (4) our target acquisition level was $250 million, and we acquired twelve properties, for total acquisitions of approximately $438.4 million; and (5) we targeted savings on legal fees of at least $200,000, which target level was exceeded. Overall, the named executive officers were awarded approximately 116% of target, in the aggregate, for their respective business unit objectives.
64
Table of Contents
Individual performance of the named executive officers is evaluated subjectively. The compensation committee, with input and approval of our general partner’s board of directors, evaluates the individual performance of our Chief Executive Officer, and our Chief Executive Officer evaluates the individual performance of the other named executive officers and makes recommendations to the compensation committee regarding bonus scoring relative to that performance. The executives all received individual performance ratings of at least 130% of target for 2012 based on the compensation committee’s subjective review of each named executive officer’s individual performance for 2012.
For 2012, after considering the performance of the company and the named executive officers, the compensation committee awarded the following annual bonuses to the named executive officers: Mr. Sabin, $422,500 (130% of target); Mr. Plumb, $155,000 (118% of target); Mr. Nakagawa, $155,000 (118% of target); Mr. Burton, $155,000 (118% of target); and Mr. Ottesen, $155,000 (118% of target).
Throughout this compensation discussion and analysis, we refer to our general partner’s adjusted FFO per diluted share, which is a non-GAAP financial measure. For an explanation of how our general partner calculates FFO per diluted share, see “Management’s Discussion and Analysis of Financial Condition and Results of Operations.” Our general partner computes adjusted FFO by adding to FFO non-cash compensation expense, amortization of prepaid financing costs and non-recurring transaction costs, and other one-time items, then subtracting or adding straight-line rents, amortization of above and below market leases and non-incremental capital expenditures. Our general partner’s computation of FFO and adjusted FFO may differ from the methodology for calculating FFO and adjusted FFO utilized by other equity REITs and, accordingly, may not be comparable to such other REITs.
Long-Term Equity Incentive Awards
Long-term equity incentives are provided to the named executive officers through grants of restricted stock of our general partner by the compensation committee pursuant to the 2010 Plan, as further described below. Subject to the terms of the 2010 Plan, the compensation committee, as plan administrator, has the discretion to determine both the recipients of awards and the terms and provisions of such awards, including the applicable exercise or purchase price, expiration date, vesting schedule and terms of exercise. The 2010 Plan provides certain limitations on the maximum number of shares granted or cash awards payable in any calendar year.
The compensation committee intends that long-term incentive awards, which generally will vest over three to four years, will be designed to increase our executive officers’ stock ownership in our general partner, to align employee compensation with the interests of our and our general partner’s equityholders and to encourage actions that maximize long-term equityholder value. Dividends will be paid on the entirety of each restricted stock grant from the date of the grant. Our general partner does not coordinate the timing of equity award grants with the release of material non-public information nor do we time the release of material non-public information for purposes of affecting the value of executive compensation.
2011 Long-Term Equity Incentive Awards. In March 2011, the compensation committee approved long-term equity incentive awards for each of the named executive officers. Based on the recommendations of management and the compensation consultant to the compensation committee, the compensation committee included both time-based and performance-based restricted stock awards in our annual equity award program, reflecting the compensation committee’s desire to have a higher portion of each named executive officer’s compensation tied to increasing equityholder value. It also supports our pay-for-performance philosophy by placing more emphasis on the incentive components of pay.
65
Table of Contents
Time-Based Awards. Mr. Sabin was granted 100,000 shares of time-based restricted stock and each of the other named executive officers was granted 20,000 shares of time-based restricted stock. Consistent with the time-based restricted stock awards previously awarded to the named executive officers, these awards will vest over four years, with 25% of the shares subject to each award vesting on the first anniversary of the grant date and the remainder vesting in equal quarterly installments thereafter. In general, each named executive officer must be employed on a vesting date to be eligible to vest in these time-based awards. However, upon a named executive officer’s termination without cause or resignation for good reason, such number of shares subject to each award as would have vested during the twelve-month period following the date of termination will vest on the date of termination. In addition, the vesting of these awards will accelerate in full upon a named executive officer’s termination without cause or resignation for good reason within 18 months following the occurrence of a change in control transaction.
Vesting of Performance-Based Awards. Mr. Sabin was granted 225,000 shares of performance-based restricted stock and each of the other named executive officers was granted 52,500 shares of performance-based restricted stock. The performance-based restricted stock awards provide the named executive officers with the potential to earn equity awards subject to our general partner creating stockholder value over a three-year performance period commencing January 1, 2011. For each fiscal year during the three-year performance period, up to one-third of the shares subject to the restricted stock award may vest based on performance relative to the total stockholder return objectives. Threshold, target and maximum achievement levels were established and each named executive officer will vest in the shares based on performance relative to these objectives. Full vesting credit will be given for achievement at or above the maximum targeted level (total stockholder returns of 14% annually) and no vesting credit will be given for achievement below the threshold level (total stockholder returns of 8% annually). Vesting will be calculated on a linear basis for performance between the threshold and maximum performance target levels.
Following the completion of each fiscal year during the three-year performance period, the compensation committee will determine the number of shares to which a named executive officer will be entitled based on our general partner’s performance relative to the total stockholder return objectives. If the threshold performance hurdle is not met for any of the fiscal years, none of the shares will vest at that time. Any unvested shares remaining at the end of the three-year performance period may vest if the threshold total stockholder return objective is achieved for the full three-year performance period, although the number of shares that will vest will depend on performance relative to the targets. In general, each named executive officer must be employed on a vesting date to be eligible to vest in these performance-based awards. However, in the event of the occurrence of a change in control transaction during the three-year performance period, the vesting of the awards will accelerate upon a named executive officer’s termination without cause or resignation for good reason within 18 months following the occurrence of the change in control.
Because our general partner’s total stockholder return for 2011 of 5% was lower than the threshold performance level, none of the shares of restricted stock vested with respect to the 2011 fiscal year. Our general partner’s total stockholder return for 2012 of 11.4% was higher than the threshold performance level, and 74.4% of the shares of restricted stock eligible to vest based on 2012 performance (or 55,800 shares for Mr. Sabin and 13,020 shares for the other named executive officers) vested with respect to the 2012 fiscal year. The shares that did not vest will remain eligible for vesting based on performance during the full three-year performance period, as described above.
The foregoing restricted stock award levels were determined by the compensation committee so that, if the target performance objectives are achieved, and based on the price of our general partner’s common stock at the time of grant, the total annual equity incentive compensation for the named executive officers would, for Mr. Sabin, represent approximately 40% of his total compensation, and for the other named executive officers, represent approximately 35% of their total compensation.
No long-term incentive awards were granted to the named executive officers during 2012.
Other Benefits
We provide benefits such as medical, dental and life insurance and disability coverage for all of our employees, including the named executive officers. We also provide personal paid time off and other paid holidays to all employees, including the named executive officers. We believe that our employee benefit plans are an appropriate element of compensation and are necessary to attract and retain employees.
66
Table of Contents
401(k) Plan
We maintain a retirement savings plan under section 401(k) of the Internal Revenue Code of 1986, as amended, or the Code, to cover our eligible employees. The Code allows eligible employees to defer a portion of their compensation, within prescribed limits, on a pre-tax basis through contributions to the 401(k) plan. We currently match each eligible participant’s contributions, within prescribed limits, with an amount equal to 100.0% of such participant’s initial 3.0% of tax-deferred contributions and 50.0% of the participant’s additional 2.0% of contributions. In addition, we reserve the right to make additional discretionary contributions on behalf of eligible participants.
Employment Agreements
In order to specify our expectations with regard to our executive officers’ duties and responsibilities and to provide greater certainty with regard to the amounts payable to our executive officers in connection with certain terminations or change in control events, our general partner’s board of directors has approved and we and our general partner have entered into employment agreements with each of our executive officers that became effective as of April 28, 2010. These employment agreements are described in more detail below under “—Employment Agreements” and “— Potential Payments Upon Termination or Change in Control” below.
2010 Equity Incentive Award Plan
We and our general partner have adopted the 2010 Plan, which became effective immediately prior to the completion of our general partner’s initial public offering. Our 2010 Plan provides for the grant to our and our general partner’s (and our respective subsidiaries’) employees and consultants, and to directors of our general partner, of stock options, restricted stock, stock appreciation rights, long-term incentive operating partnership units, or LTIP units, dividend equivalents, restricted stock units and other stock-based awards. Only employees of our general partner and its qualifying subsidiaries (including us) are eligible to receive incentive stock options under our 2010 Plan. Our general partner has reserved a total of 1,350,000 shares of its common stock for issuance pursuant to the 2010 Plan, subject to certain adjustments as set forth in the 2010 Plan. As of December 31, 2012, 1,100,042 shares of restricted stock had been granted and 249,958 shares remained available for future grants under the 2010 Plan.
Tax Deductibility of Executive Compensation
The compensation committee considers the anticipated tax treatment to us and our general partner and to our executive officers in its review and establishment of compensation programs and payments. The deductibility of some types of compensation payments can depend upon the timing of the executive’s vesting or exercise of previously granted rights. Interpretations of and changes in applicable tax laws and regulations as well as other factors beyond the compensation committee’s control also can affect deductibility of compensation. The committee’s general policy is to maintain flexibility in compensating executive officers in a manner designed to promote varying company goals. Accordingly, the compensation committee has not adopted a policy that all compensation must be deductible.
Accounting Standards
ASC Topic 718 requires us to recognize an expense for the fair value of equity-based compensation awards. Grants of equity awards under our 2010 Plan will be accounted for under ASC Topic 718. The compensation committee will consider regularly the accounting implications of significant compensation decisions, especially in connection with decisions that relate to our equity plans and programs. As accounting standards change, the compensation committee may revise certain programs to align accounting expenses of equity awards with its overall executive compensation philosophy and objectives.
67
Table of Contents
Summary Compensation Table
The table below summarizes the total compensation paid or earned by each of the named executive officers for the fiscal years ended December 31, 2012, 2011 and 2010.
| Name and Principal Position |
Fiscal Year |
Salary ($)(1) |
Bonus ($) |
Stock Awards ($)(2) |
Option Awards ($) |
Non-Equity Incentive Plan Compensation ($) |
All
Other Compensation ($)(3) |
Total ($) |
||||||||||||||||||||||||
| Gary B. Sabin |
2012 | 325,000 | — | — | — | 422,500 | 222,727 | 970,227 | ||||||||||||||||||||||||
| 2011 | 325,000 | — | 3,191,750 | — | 357,094 | 168,089 | 4,041,933 | |||||||||||||||||||||||||
| 2010 | 203,125 | 227,500 | 561,978 | — | — | 9,338 | 1,001,941 | |||||||||||||||||||||||||
| Spencer G. Plumb |
2012 | 175,000 | — | — | — | 155,000 | 51,158 | 381,158 | ||||||||||||||||||||||||
| 2011 | 175,000 | — | 704,875 | — | 140,778 | 49,384 | 1,070,037 | |||||||||||||||||||||||||
| 2010 | 109,375 | 87,500 | 281,002 | — | — | 4,898 | 482,775 | |||||||||||||||||||||||||
| James Y. Nakagawa |
2012 | 175,000 | — | — | — | 155,000 | 51,158 | 381,158 | ||||||||||||||||||||||||
| 2011 | 175,000 | — | 704,875 | — | 140,127 | 49,384 | 1,069,386 | |||||||||||||||||||||||||
| 2010 | 109,375 | 87,500 | 281,002 | — | — | 4,898 | 482,775 | |||||||||||||||||||||||||
| Mark T. Burton |
2012 | 175,000 | — | — | — | 155,000 | 51,158 | 381,158 | ||||||||||||||||||||||||
| 2011 | 175,000 | — | 704,875 | — | 141,008 | 49,384 | 1,070,267 | |||||||||||||||||||||||||
| 2010 | 109,375 | 87,500 | 281,002 | — | — | 4,898 | 482,775 | |||||||||||||||||||||||||
| S. Eric Ottesen |
2012 | 175,000 | — | — | — | 155,000 | 51,158 | 381,158 | ||||||||||||||||||||||||
| 2011 | 175,000 | — | 704,875 | — | 135,309 | 49,384 | 1,064,568 | |||||||||||||||||||||||||
| 2010 | 109,375 | 87,500 | 281,002 | — | — | 1,680 | 479,557 | |||||||||||||||||||||||||
| (1) | Represents actual base salary paid during the years ended December 31, 2012, 2011 and 2010. The named executive officers’ annual base salary rates, as set forth in their employment agreements, are discussed under “— Employment Agreements” below. |
| (2) | Approximately 70% of the stock awards granted to the named executive officers during 2011 vest on the basis of performance objectives. The value of such stock awards reflected in the table does not necessarily correspond to the compensation that may ultimately be realized by the named executive officers with respect to these stock awards. Instead, the value actually realized by the named executive officers from such stock awards will depend on the extent to which the performance-based vesting conditions are satisfied and the market value of the shares subject to such stock awards at the time of vesting. |
Amounts reflect the full grant-date fair value of restricted stock awards granted to each of the named executive officers during the relevant fiscal year, computed in accordance with ASC Topic 718. We recognize compensation expense for these shares on a straight-line basis over the vesting period based on the fair value of the award on the date of grant.
With respect to the performance-based restricted stock awards, the performance objectives applicable to those awards relate to our general partner’s total stockholder return and thus are entirely market-based. With the assistance of independent valuation specialists and based upon the then-probable outcome of the market conditions at the time of grant, we determined the grant-date fair value of these performance-based restricted stock awards to be $8.87 per share. The value actually realized by the named executive officers from such stock awards will depend on the extent to which the performance-based vesting conditions are satisfied and the market value of the shares subject to such stock awards at the time of vesting.
For information regarding the assumptions made in connection with the calculation of these amounts, please see Note 12 to our consolidated financial statements included elsewhere in this registration statement.
68
Table of Contents
| (3) | All other compensation for 2012 represents 401(k) matching contributions and dividends on unvested restricted stock (and excludes dividends on vested restricted stock), as follows: |
| Name |
401(k) Matching Contributions |
Dividends Paid on Unvested Stock |
Total Other Compensation |
|||||||||
| Gary B. Sabin |
$ | 13,000 | $ | 209,727 | $ | 222,727 | ||||||
| Spencer G. Plumb |
7,000 | 51,158 | 58,158 | |||||||||
| James Y. Nakagawa |
7,000 | 51,158 | 58,158 | |||||||||
| Mark T. Burton |
7,000 | 51,158 | 58,158 | |||||||||
| S. Eric Ottesen |
7,000 | 51,158 | 58,158 | |||||||||
Outstanding Equity Awards at Fiscal Year-End
The table below provides information about outstanding equity awards for each of the named executive officers as of December 31, 2012.
| Name |
Award Grant Date |
Number of Shares or Units of Stock that Have Not Vested (#) (1) |
Market Value of Stock that Have Not Vested ($) (2) |
Equity Incentive Plan Awards: Number of Unearned Shares, Units or Other Rights that Have not Vested (#) (3) |
Equity Incentive Plan Awards: Market or Payout Value of Unearned Shares, Units or Other Rights that Have not Vested ($)(2) |
|||||||||||||||
| Gary B. Sabin |
4/23/10 | 15,844 | 200,743 | — | — | |||||||||||||||
| 3/7/2011 | 56,250 | 712,688 | — | — | ||||||||||||||||
| 3/7/2011 | — | — | 169,200 | 2,143,764 | ||||||||||||||||
| Spencer G. Plumb |
4/23/10 | 7,920 | 100,346 | — | — | |||||||||||||||
| 3/7/2011 | 11,250 | 142,538 | — | — | ||||||||||||||||
| 3/7/2011 | — | — | 39,480 | 500,212 | ||||||||||||||||
| James Y. Nakagawa |
4/23/10 | 7,920 | 100,346 | — | — | |||||||||||||||
| 3/7/2011 | 11,250 | 142,538 | — | — | ||||||||||||||||
| 3/7/2011 | — | — | 39,480 | 500,212 | ||||||||||||||||
| Mark T. Burton |
4/23/10 | 7,920 | 100,346 | — | — | |||||||||||||||
| 3/7/2011 | 11,250 | 142,538 | — | — | ||||||||||||||||
| 3/7/2011 | — | — | 39,480 | 500,212 | ||||||||||||||||
| S. Eric Ottesen |
4/23/10 | 7,920 | 100,346 | — | — | |||||||||||||||
| 3/7/2011 | 11,250 | 142,538 | — | — | ||||||||||||||||
| 3/7/2011 | — | — | 39,480 | 500,212 | ||||||||||||||||
| (1) | The restricted stock awards vest over four years, with 25% of the shares subject to each award vesting on the first anniversary of the grant date and the remainder vesting in equal quarterly installments thereafter, subject to earlier vesting upon certain terminations of employment as specified in the executive’s employment agreement. Dividends are paid on the entirety of the grant from the date of the grant. |
| (2) | Market value has been calculated as the number of outstanding shares of unvested restricted stock for each named executive officer, multiplied by $12.67, the closing market price of our general partner’s common stock on December 31, 2012. |
| (3) | These awards consist of performance-based restricted stock awards. The shares subject to these performance-based restricted stock awards will vest or be forfeited based upon our general partner’s absolute total stockholder return during the three-year performance period beginning on January 1, 2011, subject to earlier vesting upon certain terminations of employment as specified in the executive’s employment agreement. Dividends are paid on the entirety of the grant from the date of the grant. The number of shares reflected above is the maximum remaining number of shares that may vest under these awards if the highest level of performance relative to the absolute total stockholder return objectives is attained during the performance period. The number of shares that ultimately vest will depend upon the extent to which the performance measures have been satisfied during the performance period, and may be fewer or greater than the number reported in the table. For more information about these awards, please see “—Elements of the Executive Compensation Program—Long-Term Equity Incentive Awards” above. |
69
Table of Contents
Stock Vested
The following table summarizes the vesting of restricted stock for the named executive officers during the fiscal year ended December 31, 2012.
| Option Awards | Stock Awards | |||||||||||||||
| Name |
Number of Shares Acquired on Exercise (#) |
Value Realized on Exercise ($) |
Number of Shares Acquired on Vesting (#) |
Value Realized on Vesting ($) (1) |
||||||||||||
| Gary B. Sabin |
— | — | 110,114 | 1,330,016 | ||||||||||||
| Spencer G. Plumb |
— | — | 27,054 | 327,211 | ||||||||||||
| James Y. Nakagawa |
— | — | 27,054 | 327,211 | ||||||||||||
| Mark T. Burton |
— | — | 27,054 | 327,211 | ||||||||||||
| S. Eric Ottesen |
— | — | 27,054 | 327,211 | ||||||||||||
| (1) | Based on the closing stock price per share on the last trading dates prior to the dates on which the restricted stock awards vested during 2012. |
Employment Agreements
We and our general partner have entered into employment agreements, effective as of April 28, 2010, with each of the named executive officers. We believe that the protections contained in these employment agreements will help to ensure the day-to-day security and stability necessary to our executives to enable them to focus their attention on their duties and responsibilities with the company, thereby limiting concern and uncertainty and promoting productivity. The following is a summary of the material terms of the agreements.
The employment agreements have a term of three years. Each employment agreement provides for automatic one-year extensions thereafter, unless either party provides at least three months’ notice of non-renewal. The employment agreements require each executive officer to devote substantially all of his business time to our affairs.
The employment agreements provide for:
| • | an annual base salary of $325,000 for Mr. Sabin and $175,000 for each of the other named executive officers, subject to further increases on an annual basis in the discretion of our general partner’s board of directors or the compensation committee, |
| • | eligibility for annual cash performance bonuses based on the satisfaction of performance goals established by our general partner’s board of directors or the compensation committee, |
70
Table of Contents
| • | participation in our long-term incentive program, as well as other incentive, savings and retirement plans applicable generally to our senior executives, and |
| • | medical and other group welfare plan coverage. |
Under his employment agreement, Mr. Sabin has a target annual cash performance bonus equal to 100% of his base salary. Each of the other named executive officers has a target annual cash performance bonus equal to 75% of his base salary.
The employment agreements provide that, if a named executive officer’s employment is terminated by us without “cause” or by the executive for “good reason” (each as defined in the applicable employment agreement), the executive will be entitled to the following severance payments and benefits, subject to his execution and non-revocation of a general release of claims:
| • | an amount equal to the sum of the executive’s then-current annual base salary plus his annual average bonus over the prior three years, multiplied by (1) three, for Mr. Sabin, or (2) one and one-half, for the other named executive officers, which amount will be paid in a lump sum, |
| • | health benefits for the executive and his eligible family members for twelve months following the executive’s termination of employment at the same level as in effect immediately preceding such termination, subject to reduction to the extent that the executive receives comparable benefits from a subsequent employer, |
| • | with respect to the time-based restricted stock awards granted to the executive at the time of our general partner’s initial public offering, 100% of such stock awards held by the executive will become fully vested and/or exercisable, |
| • | with respect to any time-based stock awards granted to the executive following our general partner’s initial public offering, such number of shares subject to such awards held by the executive as would have vested during the twelve-month period following the date of termination will become vested and/or exercisable, and |
| • | in the event such termination occurs within 18 months following the occurrence of a change in control, 100% of all stock awards held by the executive, whether the vesting of such stock awards is time-based or performance-based, will become fully vested and/or exercisable. |
Each employment agreement also provides that the executive or his estate will be entitled to certain severance benefits in the event of his death or disability. Specifically, each named executive officer or, in the event of the executive’s death, his beneficiaries, will receive:
| • | an amount equal to the sum of the executive’s then-current annual base salary plus his annual average bonus over the prior three years, multiplied by (1) three, for Mr. Sabin, or (2) one and one-half, for the other named executive officers, and |
| • | health benefits for the executive and/or his eligible family members for twelve months following the executive’s termination of employment at the same level as in effect immediately preceding the executive’s death or disability. |
The employment agreements also contain standard confidentiality provisions and non-competition provisions.
71
Table of Contents
Potential Payments Upon Termination or Change in Control
The table below reflects the amount of compensation that each of the named executive officers would be entitled to receive under his existing employment agreement with us and our general partner upon termination of such executive’s employment in certain circumstances. The amounts shown assume that such termination was effective as of December 31, 2012, and are only estimates of the amounts that would be paid out to such executives upon termination of their employment. The actual amounts to be paid out can be determined only at the time of such executive’s separation from us and our general partner. In the event of a termination by us or our general partner for cause or by the executive without good reason, including in connection with a change in control, such executive would not be entitled to any of the amounts reflected in the table.
| Name |
Benefit |
Termination Without Cause or Resignation for Good Reason |
Termination Without Cause or Resignation for Good Reason + Change in Control |
Death or Disability |
||||||||||
| Gary B. Sabin |
Severance Payment(1) | $ | 2,079,594 | $ | 2,079,594 | $ | 2,079,594 | |||||||
| Accelerated Equity Award Vesting(2) | 316,750 | 3,057,195 | — | |||||||||||
| Medical Benefits(3) | 13,152 | 13,152 | 13,152 | |||||||||||
|
|
|
|
|
|
|
|||||||||
| Total Value: |
$ | 2,409,496 | $ | 5,149,941 | $ | 2,092,746 | ||||||||
|
|
|
|
|
|
|
|||||||||
| Spencer G. Plumb |
Severance Payment(1) | $ | 477,889 | $ | 477,889 | $ | 477,889 | |||||||
| Accelerated Equity Award Vesting(2) | 63,350 | 743,096 | — | |||||||||||
| Medical Benefits(3) | 11,111 | 11,111 | 11,111 | |||||||||||
|
|
|
|
|
|
|
|||||||||
| Total Value: |
$ | 552,350 | $ | 1,232,096 | $ | 489,000 | ||||||||
|
|
|
|
|
|
|
|||||||||
| James Y. Nakagawa |
Severance Payment(1) | $ | 477,564 | $ | 477,564 | $ | 477,564 | |||||||
| Accelerated Equity Award Vesting(2) | 63,350 | 743,096 | — | |||||||||||
| Medical Benefits(3) | 11,534 | 11,534 | 11,534 | |||||||||||
|
|
|
|
|
|
|
|||||||||
| Total Value: |
$ | 552,448 | $ | 1,232,194 | $ | 489,098 | ||||||||
|
|
|
|
|
|
|
|||||||||
| Mark T. Burton |
Severance Payment(1) | $ | 478,004 | $ | 478,004 | $ | 478,004 | |||||||
| Accelerated Equity Award Vesting(2) | 63,350 | 743,096 | — | |||||||||||
| Medical Benefits(3) | 14,147 | 14,147 | 14,147 | |||||||||||
|
|
|
|
|
|
|
|||||||||
| Total Value: |
$ | 555,501 | $ | 1,235,247 | $ | 492,151 | ||||||||
|
|
|
|
|
|
|
|||||||||
| S. Eric Ottesen |
Severance Payment(1) | $ | 475,155 | $ | 475,155 | $ | 475,155 | |||||||
| Accelerated Equity Award Vesting(2) | 63,350 | 743,096 | — | |||||||||||
| Medical Benefits(3) | 14,147 | 14,147 | 14,147 | |||||||||||
|
|
|
|
|
|
|
|||||||||
| Total Value: |
$ | 552,652 | $ | 1,232,398 | $ | 489,302 | ||||||||
|
|
|
|
|
|
|
|||||||||
| (1) | The severance payment is an amount equal to the sum of the then-current annual base salary plus average bonus over the prior three years (or such lesser number of years as the executive has been employed by us), multiplied by (a) three, for Mr. Sabin, or (b) one and one-half, for the other named executive officers. The calculations in the table are based on the named executive officers’ annual base salaries on December 31, 2012 and each executive’s average bonus for the prior three years using the target bonus for 2010. The severance payment will be paid in a lump sum. |
72
Table of Contents
| (2) | For purposes of this calculation, each executive’s total unvested shares of restricted stock on December 31, 2012 are multiplied by $12.67, the closing market price of our general partner’s common stock on December 31, 2012. |
| (3) | This figure represents the amount needed to pay for health benefits for the executive and his eligible family members for twelve months following the executive’s termination of employment at the same level as in effect immediately preceding his termination of employment. |
Risk Assessment of Compensation Program
In March 2013, management assessed our general partner’s compensation program for the purpose of reviewing and considering any risks presented by the compensation policies and practices of our general partner that are likely to have a material adverse effect on us or our general partner.
As part of that assessment, management reviewed the primary elements of our general partner’s compensation program, including base salary, annual short-term incentive compensation, long-term incentive compensation and severance arrangements. Management’s risk assessment included a review of the overall design of each primary element of our general partner’s compensation program, and an analysis of the various design features, controls and approval rights in place with respect to compensation paid to management and other employees that mitigate potential risks to us that could arise from our general partner’s compensation program.
Following the assessment, management determined that our general partner’s compensation policies and practices did not create risks that were reasonably likely to have a material adverse effect on us or our general partner and reported the results of the assessment to the compensation committee.
Item 7. Certain Relationships and Related Transactions, and Director Independence.
Our general partner has adopted a written policy regarding the review, approval and ratification of any related party transaction. Under this policy, our general partner’s audit committee will review the relevant facts and circumstances of each related party transaction, including if the transaction is on terms comparable to those that could be obtained in arm’s-length dealings with an unrelated third party and the extent of the related party’s interest in the transaction, and either approve or disapprove the related party transaction. Any related party transaction shall be consummated and shall continue only if the audit committee has approved or ratified the transaction in accordance with the guidelines set forth in the policy. For purposes of the policy, a “Related Party Transaction” is a transaction, arrangement or relationship (or any series of similar transactions, arrangements or relationships) requiring disclosure under Item 404(a) of Regulation S-K promulgated by the SEC, or any successor provision, as then in effect.
Contribution Agreements
In connection with our general partner’s initial public offering in April 2010, we received interests in four properties contributed by our general partner’s directors and officers and their affiliates under contribution agreements with the individuals or entities that held those interests. Each contribution was subject to all of the terms and conditions of the applicable contribution agreement. The contributors transferred their interests in the properties or the entities that hold them to us for common stock, units or cash, or a combination thereof. We assumed or succeeded to all of each contributor’s rights, obligations and responsibilities with respect to the properties and the property entities contributed. The contribution agreements generally contain representations by the contributors with respect to the ownership of their interests, litigation and other limited matters. Messrs. Sabin, Nakagawa, Burton and Ottesen made additional customary representations and warranties regarding various matters concerning the contributed properties, including environmental conditions on the properties and compliance with environmental laws, payment of applicable taxes, physical condition of the properties, no current condemnation or similar proceedings that would affect the properties and compliance with laws generally. The contributors agreed to indemnify us for breach of these representations and warranties for one year from the date we acquired each property in May 2010, subject to certain thresholds.
We agreed for a period of up to ten years following May 4, 2010, the date we acquired Excel Centre, to use commercially reasonable efforts consistent with our fiduciary duties to maintain at least $457,500 of debt and to enable the contributors of the Excel Centre property to guarantee such debt in order to defer the taxable gain such contributors may otherwise incur.
73
Table of Contents
We provided registration rights to our general partner’s directors and officers and their affiliates relating to the shares of our general partner’s common stock (including shares of our general partner’s common stock issuable upon redemption of units) that were issued in connection with our general partner’s formation transactions.
Redemption or Exchange of Our Limited Partnership Units
Our limited partners, including Messrs. Sabin, Nakagawa, Burton and Ottesen, have the right to require us to redeem all or a part of their units for cash, based upon the fair market value of an equivalent number of shares of our general partner’s common stock at the time of the redemption, or, at our general partner’s election, shares of our general partner’s common stock in exchange for such units, subject to certain ownership limits set forth in our charter. We presently anticipate that we will elect to issue shares of our general partner’s common stock in exchange for units in connection with each redemption request, rather than having us redeem the units for cash. With each redemption or exchange of units, we will increase our general partner’s percentage ownership interest in us and our general partner’s share of our cash distributions and profits and losses. In addition, with each exchange of units, we will dilute stockholders’ percentage ownership interest in our general partner’s common stock.
Director Independence
NYSE listing standards require NYSE-listed companies, such as our general partner, to have a majority of independent board members and a nominating and corporate governance committee, compensation committee and audit committee each composed solely of independent directors. Under the NYSE listing standards, no director of a company qualifies as “independent” unless the board of directors of such company affirmatively determines that the director has no material relationship with such company (either directly or as a partner, stockholder or officer of an organization that has a relationship with such company).
In addition, the NYSE listing standards provide that a director is not independent if:
1. the director is, or has been within the last three years, an employee of the listed company, or an immediate family member is, or has been within the last three years, an executive officer of the listed company;
2. the director has received, or has an immediate family member who has received, during any twelve-month period within the last three years, more than $120,000 in direct compensation from the listed company, other than director and committee fees and pension or other forms of deferred compensation for prior service (provided such compensation is not contingent in any way on continued service);
3. (a) the director is a current partner or employee of a firm that is the listed company’s internal or external auditor; (b) the director has an immediate family member who is a current partner of such a firm; (c) the director has an immediate family member who is a current employee of such a firm and personally works on the listed company’s audit; or (d) the director or an immediate family member was within the last three years a partner or employee of such a firm and personally worked on the listed company’s audit within that time;
4. the director or an immediate family member is, or has been with the last three years, employed as an executive officer of another company where any of the listed company’s present executive officers at the same time serves or served on that company’s compensation committee; or
5. the director is a current employee, or an immediate family member is a current executive officer, of a company that has made payments to, or received payments from, the listed company for property or services in an amount which, in any of the last three fiscal years, exceeds the greater of $1 million, or 2% of such other company’s consolidated gross revenues.
The board of directors of our general partner by resolution has affirmatively determined that, based on the standards set forth in NYSE rules and our general partner’s corporate governance documents, all of the directors elected to our general partner’s board at the 2012 Annual Meeting are independent, except for Messrs. Sabin, Plumb and Burton.
74
Table of Contents
Although we are involved in legal proceedings arising in the ordinary course of business, we are not currently a party to any legal proceedings, nor is any legal proceeding threatened against us that we believe would have a material adverse effect on our financial position, results of operations or liquidity.
Item 9. Market Price of and Dividends on the Registrant’s Common Equity and Related Stockholder Matters.
There is no established public trading market for our common operating partnership units. As of May 20, 2013, there were 10 holders of record of our common operating partnership units, including our general partner. The following table sets forth, for the periods indicated, the distributions we declared with respect to our common operating partnership units for the periods indicated.
| Distributions Declared | ||||
| First Quarter 2011 |
$ | 0.140 | ||
| Second Quarter 2011 |
$ | 0.150 | ||
| Third Quarter 2011 |
$ | 0.155 | ||
| Fourth Quarter 2011 |
$ | 0.160 | ||
| First Quarter 2012 |
$ | 0.1625 | ||
| Second Quarter 2012 |
$ | 0.1625 | ||
| Third Quarter 2012 |
$ | 0.1625 | ||
| Fourth Quarter 2012 |
$ | 0.1625 | ||
| First Quarter 2013 |
$ | 0.17 | ||
We intend to continue to declare quarterly distributions on our common operating partnership units. The actual amount and timing of distributions, however, will be at the discretion of our general partner’s board of directors and will depend upon our financial condition in addition to the requirements of the Code, and no assurance can be given as to the amounts or timing of future distributions. In addition, our unsecured revolving credit facility contains limitations on our ability to pay distributions on our common operating partnership units. Specifically, our cash distributions may not exceed the greater of (1) 95% of our FFO (as defined in the credit agreement) and (2) the amount required for our general partner to qualify and maintain its REIT status. If an event of default exists, we may only make distributions sufficient for our general partner to qualify and maintain its REIT status.
As of May 20, 2013, there were 49,156,100 common operating partnership units outstanding, and (1) there were no common operating partnership units subject to outstanding options or warrants to purchase, (2) there were 2,000,000 Series A cumulative convertible perpetual preferred operating partnership units that were convertible into 3,333,400 common operating partnership units and (3) there were no common operating partnership units that have been, or are proposed to be, publicly offered by us. As of May 20, 2013, there were 48,446,254 common operating partnership units which could be sold pursuant to Rule 144 under the Securities Act, subject to other restrictions on transfer in the securities laws or in our partnership agreement. Currently, pursuant to the terms of our partnership agreement, any transfer of units by the limited partners, except to our general partner, to an affiliate of the transferring limited partner, to other original limited partners, to immediate family members of the transferring limited partner, to a trust for the benefit of a charitable beneficiary, or to a lending institution as collateral for a bona fide loan, subject to specified limitations, will be subject to a right of first refusal by our general partner and must be made only to “accredited investors” as defined under Rule 501 of the Securities Act. See “Description of Registrant’s Securities to be Registered—Transferability of Interests.”
75
Table of Contents
Securities Authorized for Issuance Under Equity Compensation Plans
The following table sets forth certain equity compensation plan information for us as of December 31, 2012.
| Number of Securities | ||||||||||||
| Remaining Available for | ||||||||||||
| Number of Securities to Be | Weighted-Average Exercise | Future Issuance under | ||||||||||
| Issued upon Exercise of | Price of Outstanding | Equity Compensation Plans | ||||||||||
| Outstanding Options, | Options, Warrants and | (excluding securities | ||||||||||
| Plan Category |
Warrants and Rights | Rights | reflected in column (a)) | |||||||||
| (a) | (b) | (c) | ||||||||||
| Equity compensation plans approved by security holders |
— | — | 249,958 | |||||||||
| Equity compensation plans not approved by security holders |
— | — | — | |||||||||
|
|
|
|
|
|
|
|||||||
| Total |
— | — | 249,958 | |||||||||
|
|
|
|
|
|
|
|||||||
Item 10. Recent Sales of Unregistered Securities.
Common Operating Partnership Units
During the past three years, we have issued common operating partnership units in private placements in reliance on the exemption from registration provided by Section 4(2) of the Securities Act, in the amounts and for the consideration set forth below:
From our general partner’s initial public offering through March 31, 2013, our general partner issued, net of forfeitures, an aggregate of 1,141,542 shares of its common stock in connection with restricted stock awards under its incentive award plan for no cash consideration. For each share of common stock issued by our general partner in connection with such an award, we issued a restricted common operating partnership unit to our general partner. From our general partner’s initial public offering through March 31, 2013, we issued, net of forfeitures, an aggregate of 1,141,542 restricted common operating partnership units to our general partner, as required by our partnership agreement.
On April 28, 2010, our general partner sold 15,000,000 shares of its common stock, in its initial public offering, to Morgan Stanley & Co. Incorporated, Barclays Capital Inc. and UBS Securities LLC, as representatives of the several underwriters. Our general partner contributed the net proceeds from this offering of approximately $193.1 million, after deducting the underwriters’ discount and commissions and estimated offering expenses, to us in exchange for 15,000,000 common operating partnership units. The shares of common stock were offered and sold under a prospectus filed with the SEC pursuant to our general partner’s registration statement on Form S-11 (File No. 333-164031).
In May 2010, in connection with our formation and our general partner’s initial public offering, our general partner issued 507,993 shares of its common stock to entities in which several of our officers and/or directors held beneficial interests, in exchange for the contribution of interests in several properties. The fair value of these shares of common stock was approximately $7.1 million. Our general partner contributed the properties received in these transactions to us in exchange for 507,993 common operating partnership units. The shares of common stock were offered and sold in private placements in reliance on the exemption from registration provided by Section 4(2) of the Securities Act. The shares were issued without general solicitation or advertising and the recipients of common stock represented that they were “accredited investors” within the meaning of Regulation D of the Securities Act.
76
Table of Contents
On May 4, 2010, in connection with our formation and our general partner’s initial public offering, we issued 641,062 common operating partnership units to several of our officers and/or directors in exchange for the contribution to us of interests in the Excel Centre in San Diego, California. The fair value of these units was approximately $9.0 million. The units were issued without general solicitation or advertising and the recipients of the units represented that they were “accredited investors” within the meaning of Regulation D of the Securities Act.
In March 2011, we issued 764,343 common operating partnership units to various unrelated third parties in connection with the acquisition of the Edwards Theatres property in San Diego, California. The fair value of these units was approximately $9.0 million. The units were issued without general solicitation or advertising and the recipients of the units represented that they were “accredited investors” within the meaning of Regulation D of the Securities Act. These units are redeemable by us at the holder’s option for cash, but at our general partner’s option, our general partner can satisfy the redemption obligation with common stock on a one-for-one basis, with additional common stock provided as a result of an accompanying additional redemption obligation that guaranteed consideration equal to $14.00 per unit during the period from March 11, 2012 to March 11, 2013. During the period from March 11, 2012 to March 11, 2013, we issued an additional 77,055 common operating partnership units to our general partner in connection with its issuance of 77,055 additional shares of common stock above the one-for-one ratio in redemption of certain of these units. The shares of common stock issued by our general partner in redemption of such units were offered and sold in private placements in reliance on the exemption from registration provided by Section 4(2) of the Securities Act. The shares were issued without general solicitation or advertising and the recipients of common stock represented that they were “accredited investors” within the meaning of Regulation D of the Securities Act.
On June 29, 2011, our general partner sold 14,375,000 shares of its common stock, including the exercise in full of the underwriters’ over-allotment option with respect to 1,875,000 shares, to Morgan Stanley & Co. LLC, Barclays Capital Inc., KeyBanc Capital Markets Inc. and Wells Fargo Securities, LLC, as representatives of the several underwriters. Our general partner contributed the net proceeds from this offering of approximately $149.8 million, after deducting the underwriters’ discount and commissions and estimated offering expenses, to us in exchange for 14,375,000 common operating partnership units. The shares of common stock were offered and sold under a prospectus supplement and related prospectus filed with the SEC pursuant to our general partner’s shelf registration statement on Form S-3 (File No. 333-174020).
On January 23, 2012, our general partner issued 3,230,769 shares of its common stock to an unrelated third party in connection with the acquisition of the Promenade Corporate Center in Scottsdale, Arizona. The fair value of the shares of common stock was approximately $39.1 million. Our general partner contributed this property to us in exchange for 3,230,769 common operating partnership units. The shares of common stock were offered and sold in private placements in reliance on the exemption from registration provided by Section 4(2) of the Securities Act. The shares were issued without general solicitation or advertising and the recipient of common stock represented that it was an “accredited investor” within the meaning of Regulation D of the Securities Act.
On March 9, 2012, our general partner entered into sales agreements with each of Cantor Fitzgerald & Co., Barclays Capital Inc., Merrill Lynch, Pierce, Fenner & Smith Incorporated and Wells Fargo Securities, LLC, under which it could offer and sell shares of its common stock having an aggregate offering price of up to $50.0 million over time. Through May 20, 2013, our general partner had issued an aggregate of 3,985,479 shares under these sales agreements. Our general partner contributed the net proceeds from this program of approximately $49.6 million, after deducting the underwriters’ discount and commissions and estimated offering expenses, to us in exchange for 3,985,479 common operating partnership units. The shares of common stock were offered and sold under a prospectus supplement and related prospectus filed with the SEC pursuant to our general partner’s shelf registration statement on Form S-3 (File No. 333-174020).
On October 19, 2012, we issued 411,184 common operating partnership units to unrelated third parties in connection with the acquisition of the West Broad Village property in Richmond, Virginia. The fair value of these units was approximately $5.1 million. The units were issued without general solicitation or advertising and the recipients of the units represented that they were “accredited investors” within the meaning of Regulation D of the Securities Act.
77
Table of Contents
On October 30, 2012, our general partner sold 9,775,000 shares of its common stock, including the exercise of the underwriters’ over-allotment option with respect to 1,275,000 shares, to Merrill Lynch, Pierce, Fenner & Smith Incorporated, Morgan Stanley & Co. LLC and Raymond James & Associates, Inc., as representatives of the several underwriters. Our general partner contributed the net proceeds from this offering of approximately $113.1 million, after deducting the underwriters’ discount and commissions and estimated offering expenses, to us in exchange for 9,775,000 common operating partnership units. The shares of common stock were offered and sold under a prospectus supplement and related prospectus filed with the SEC pursuant to our general partner’s shelf registration statement on Form S-3 (File No. 333-174020).
On May 2, 2013, our general partner entered into amended and restated sales agreements with each of Cantor Fitzgerald & Co., Barclays Capital Inc., Merrill Lynch, Pierce, Fenner & Smith Incorporated and Wells Fargo Securities, LLC, under which it could offer and sell shares of its common stock having an aggregate offering price of up to $100.0 million over time. Through May 20, 2013, our general partner had issued an aggregate of 4,043,779 shares under these amended and restated sales agreements. Our general partner contributed the net proceeds from this program of approximately $50.4 million, after deducting the underwriters’ discount and commissions and estimated offering expenses, to us in exchange for 4,043,779 common operating partnership units. The shares of common stock were offered and sold under a prospectus supplement and related prospectus filed with the SEC pursuant to our general partner’s shelf registration statement on Form S-3 (File No. 333-187871).
For all issuances of common units to our general partner, we relied on our general partner’s status as a publicly traded NYSE-listed company with approximately $1.1 billion in total consolidated assets at December 31, 2012 and as our majority owner and general partner as the basis for the exemption under Section 4(2) of the Securities Act.
Preferred Operating Partnership Units
During the past three years, we have issued preferred operating partnership units in private placements in reliance on the exemption from registration provided by Section 4(2) of the Securities Act, in the amounts and for the consideration set forth below:
On January 28, 2011, our general partner sold 2,000,000 shares of its Series A preferred stock to the initial purchasers Stifel, Nicolaus & Company, Incorporated and Raymond James & Associates, Inc. Our general partner contributed the net proceeds from this offering of approximately $47.7 million, after deducting the initial purchasers’ discount and commissions and estimated offering expenses, to us in exchange for 2,000,000 Series A preferred operating partnership units. The shares of Series A preferred stock were offered and sold in private placements in reliance on the exemption from registration provided by Rule 144A under the Securities Act, and were offered and sold only to qualified institutional buyers in accordance with such rule.
On January 31, 2012, our general partner sold 3,680,000 shares of its Series B preferred stock, including the exercise of the underwriters’ over-allotment option with respect to 480,000 shares, to Wells Fargo Securities, LLC, Raymond James & Associates, Inc. and UBS Securities LLC, as representatives of the several underwriters. Our general partner contributed the net proceeds from this offering of approximately $88.9 million, after deducting the underwriters’ discount and commissions and estimated offering expenses, to us in exchange for 3,680,000 Series B preferred operating partnership units. The shares of Series B preferred stock were offered and sold under a prospectus supplement and related prospectus filed with the SEC pursuant to our general partner’s shelf registration statement on Form S-3 (File No. 333-174020).
For these issuances of preferred units to our general partner, we relied on our general partner’s status as a publicly traded NYSE-listed company with approximately $1.1 billion in total consolidated assets at December 31, 2012 and as our majority owner and general partner as the basis for the exemption under Section 4(2) of the Securities Act.
Item 11. Description of Registrant’s Securities to be Registered.
The material terms and provisions of our Agreement of Limited Partnership, as amended, which we refer to as the “partnership agreement” are summarized below. For more detail, you should refer to the partnership agreement itself, a copy of which is filed as an exhibit to this registration statement.
78
Table of Contents
Management
Excel Trust, L.P. is a Delaware limited partnership that was formed on December 16, 2009. Excel Trust, Inc. is our sole general partner and conducts substantially all of its business and operations through us. As our sole general partner, Excel Trust, Inc. exercises exclusive and complete discretion over our day-to-day management and control, subject to the consent of the limited partners in certain limited circumstances (as discussed below) and except as expressly limited in the partnership agreement. Our general partner can cause us to enter into certain major transactions, including acquisitions, dispositions and refinancings and cause changes in our line of business, capital structure and distribution policies. Our limited partners may not transact business for us, or participate in our management activities or decisions, except as provided in the partnership agreement and as required by applicable law. Some restrictions in the partnership agreement restrict our ability to engage in a business combination as more fully described in “— Transferability of Partnership Interests; Termination Transactions” below.
Transferability of Interests; Termination Transactions
Our general partner may not voluntarily withdraw from or transfer or assign its interest in us, other than to its affiliates (as defined under United States federal securities laws), without the consent of limited partners holding more than 50% of the operating partnership units held by all limited partners (excluding any limited partners owned or controlled by our general partner).
Any transfer of operating partnership units by limited partners, other than to our general partner or to family members, affiliates (as defined under United States federal securities laws), original limited partners and charitable organizations and as collateral in connection with certain lending transactions, subject to specified limitations, will be subject to a right of first refusal by our general partner and must be made only to “accredited investors” as defined under Rule 501 of the Securities Act. In each case, the transferee must agree to assume the transferor’s obligations under the partnership agreement.
In addition, without our consent, limited partners may not transfer their operating partnership units:
| • | to any person who lacks the legal right, power or capacity to own the operating partnership units, |
| • | in violation of applicable law, |
| • | where the transfer is for only a portion of the rights represented by the operating partnership units, such as the partner’s capital account or right to distributions, |
| • | if our general partner believes the transfer could cause our termination or could cause us to no longer be classified as a partnership for federal or state income tax purposes, |
| • | if the transfer would cause us to become, with respect to any employee benefit plan subject to Title I of the Employee Retirement Income Security Act of 1974, as amended, or ERISA, a “party-in-interest” (as defined in ERISA Section 3(14)) or a “disqualified person” (as defined in Code Section 4975(c)), |
| • | if the transfer could, based on the advice of counsel to our general partner or us, cause any portion of our assets to constitute assets of any employee benefit plan pursuant to United States Department of Labor Regulations Section 2510.3-101, |
| • | if the transfer would require registration under applicable federal or state securities laws, |
| • | if the transfer could be treated as effectuated through an “established security market” or a “secondary market” under the Code and applicable Treasury regulations, |
| • | if the transfer could cause us to become a “publicly traded partnership” under the Code, |
79
Table of Contents
| • | if the transfer could cause us to fail one or more of the “safe harbors” provided by the Code or applicable Treasury regulations, |
| • | if the transfer would cause us to become a reporting company under the Exchange Act, |
| • | if the transfer could cause us to be regulated under the Investment Company Act of 1940, as amended, or the Investment Advisors Act of 1940, as amended, |
| • | if the transferee or assignee is unable to make the representations regarding ownership required by the partnership agreement, or |
| • | if the transfer would adversely affect our general partner’s ability to maintain its qualification as a REIT or subject our company to additional taxes. |
Our general partner may not engage in a merger, consolidation or other combination with or into another entity, sale of all or substantially all of our assets, or any reclassification, recapitalization or change of our outstanding equity interests, each of which we refer to as a “termination transaction,” unless the termination transaction has been approved by partners holding more than 50% of all outstanding common operating partnership units, including the ones held by our general partner, or in connection with which all limited partners will either receive, or will have the right to elect to receive, for each operating partnership unit an amount of cash, securities or other property equal to the product of:
| • | the number of shares of common stock into which each operating partnership unit is then exchangeable, and |
| • | the greatest amount of cash, securities or other property paid to the holder of one share of common stock in consideration for one share of common stock pursuant to the termination transaction. |
If, in connection with a termination transaction, a purchase, tender or exchange offer is made to holders of our general partner’s common stock, and the common stockholders accept this purchase, tender or exchange offer, each holder of operating partnership units must either receive, or must have the right to elect to receive, the greatest amount of cash, securities or other property which that holder would have received if immediately prior to the expiration of the purchase, tender or exchange offer, it had exercised its right to redemption, received shares of common stock in exchange for its operating partnership units, and accepted the purchase, tender or exchange offer.
We also may merge or otherwise combine our assets with another entity if the following conditions are met:
| • | immediately after the merger or other combination, substantially all of the assets directly or indirectly owned by the surviving entity, other than operating partnership units held by our general partner, are owned directly or indirectly by us as the surviving partnership or another limited partnership or limited liability company which is the surviving partnership of a merger, consolidation or combination of assets with us, |
| • | the limited partners own a percentage interest of the surviving partnership based on the relative fair market value of our net assets and the other net assets of the surviving partnership immediately prior to the consummation of this transaction, |
| • | the rights, preferences and privileges of the limited partners in the surviving partnership are at least as favorable as those in effect immediately prior to the consummation of the transaction and as those applicable to any other limited partners or non-managing members of the surviving partnership, and |
| • | the limited partners may exchange their interests in the surviving partnership for at least one of (1) the consideration available to the limited partners pursuant to the second preceding paragraph, (2) the right to redeem their operating partnership units for cash on terms equivalent to those in effect with respect to their operating partnership units immediately prior to the consummation of the transaction or (3) if the ultimate controlling person of the surviving partnership has publicly traded common equity securities, shares of those common equity securities, at an exchange ratio based on the relative fair market value of those securities and our general partner’s common stock. |
80
Table of Contents
Our general partner’s board of directors will reasonably determine relative fair market values and rights, preferences and privileges of the limited partners as of the time of the termination transaction. These values may not be less favorable to the limited partners than the relative values reflected in the terms of the termination transaction.
Our general partner must use commercially reasonable efforts to structure transactions like those described above to avoid causing the limited partners to recognize gain for United States federal income tax purposes by virtue of the occurrence of or their participation in the transaction. In addition, we must use commercially reasonable efforts to cooperate with the limited partners to minimize any taxes payable in connection with any repayment, refinancing, replacement or restructuring of indebtedness, or any sale, exchange or other disposition of our assets.
Issuance of Additional Operating Partnership Units Representing Partnership Interests
Our general partner has the ability to cause us to issue additional operating partnership units representing general and limited partnership interests or other partnership interests in one or more classes, or one or more series of any such classes, including preferred operating partnership units. In addition, our general partner may issue additional shares of its common stock or convertible securities, but only if it causes us to issue to it partnership interests or rights, options, warrants or convertible or exchangeable securities having designations, preferences and other rights, so that the economic interests of our partnership interests issued are substantially similar to the economic interests of the securities that our general partner has issued.
Capital Contributions
Our general partner contributed to us all of the net proceeds of its initial public offering as its initial capital contribution in exchange for a 96.1% general partnership interest. Some of our company’s directors, officers and their affiliates contributed properties and assets to us and became limited partners and, together with other limited partners, initially owned the remaining 3.9% limited partnership interest. As of March 31, 2013, our general partner owned a 97.4% partnership interest and other limited partners, including some of our company’s directors, officers and their affiliates, owned the remaining 2.6% partnership interest.
The partnership agreement provides that our general partner may determine that we require additional funds for the acquisition of additional properties or for other purposes. Under the partnership agreement, our general partner is obligated to contribute the proceeds of any offering of stock as additional capital to us. We are authorized to cause partnership interests to be issued for no tangible value or less than fair market value if we conclude in good faith that such issuance is in our best interests.
The partnership agreement provides that our general partner may make additional capital contributions, including properties, to us in exchange for additional operating partnership units. If our general partner contributes additional capital and receives additional partnership interests for the capital contribution, our general partner’s percentage interests will be increased on a proportionate basis based on the amount of the additional capital contributions and our value at the time of the contributions. Conversely, the percentage interests of the other limited partners will be decreased on a proportionate basis. In addition, if our general partner contributes additional capital and receives additional partnership interests for the capital contribution, the capital accounts of the partners may be adjusted upward or downward to reflect any unrealized gain or loss attributable to the properties as if there were an actual sale of the properties at the fair market value thereof. No person has any preemptive, preferential or other similar right with respect to making additional capital contributions or loans to us or the issuance or sale of any operating partnership units or other partnership interests.
We could issue preferred partnership interests in connection with acquisitions of property or otherwise. Any such preferred partnership interests would have priority over common partnership interests with respect to distributions from us, including the partnership interests that our wholly owned subsidiaries own.
81
Table of Contents
Amendments of the Partnership Agreement
Amendments to the partnership agreement may be proposed by our general partner or by limited partners owning at least 25% of the operating partnership units held by limited partners.
Generally, the partnership agreement may be amended, modified or terminated only with the approval of partners holding 50% of all outstanding operating partnership units (including the operating partnership units held by our general partner). However, our general partner has the power to unilaterally amend the partnership agreement without obtaining the consent of the limited partners as may be required to:
| • | add to our general partner’s obligations or surrender any right or power granted to our general partner for the benefit of the limited partners, |
| • | reflect the issuance of additional operating partnership units or the admission, substitution, termination, reduction in operating partnership units or withdrawal of partners in accordance with the terms of the partnership agreement, |
| • | set forth or amend the designations, rights, powers, duties and preferences of the holders of any additional partnership interests issued by us, |
| • | reflect a change of an inconsequential nature that does not adversely affect the limited partners in any material respect, |
| • | cure any ambiguity in, correct or supplement any provisions in, or make other changes with respect to matters arising under the partnership agreement that will not otherwise be inconsistent with the partnership agreement or law, |
| • | satisfy any requirements, conditions or guidelines of federal or state law, |
| • | reflect changes that are reasonably necessary for our general partner to maintain its status as a REIT, |
| • | modify the manner in which capital accounts are computed, and |
| • | amend or modify any provision of the partnership agreement in connection with a termination transaction. |
Our general partner must approve, and each limited partner that would be adversely affected must approve, certain amendments to the partnership agreement, including amendments effected directly or indirectly through a merger or sale of our assets or otherwise, that would, among other things,
| • | convert a limited partner’s interest into a general partner’s interest, |
| • | modify the limited liability of a limited partner, |
| • | alter a partner’s right to receive any distributions or allocations of profits or losses, or |
| • | materially alter the limited partner’s redemption or exchange right. |
Distributions to Unitholders
The partnership agreement provides that holders of common operating partnership units are entitled to receive quarterly distributions of available cash on a pro rata basis in accordance with their respective percentage interests. In addition, the partnership agreement reflects the creation and issuance of Series A preferred units and Series B preferred units. The Series A preferred units and Series B preferred units have distribution rights substantially similar to the dividend rights of the Series A preferred stock and Series B preferred stock, respectively, of our general partner. Our general partner, as the sole holder of our Series A preferred units and Series B preferred units, will receive distributions from us with respect to such preferred units in order to make distributions to its Series A preferred stockholders and Series B preferred stockholders.
82
Table of Contents
Redemption/Exchange Rights
Limited partners who acquired operating partnership units in our formation transactions have the right to require us to redeem part or all of their operating partnership units for cash based upon the fair market value of an equivalent number of shares of our general partner’s common stock at the time of the redemption. Alternatively, we may elect to acquire those operating partnership units tendered for redemption in exchange for shares of our general partner’s common stock. Our acquisition will be on a one-for-one basis, subject to adjustment in the event of stock splits, stock dividends, reverse stock splits, issuances of stock rights, warrants and options, distributions of evidence of indebtedness and similar events. We presently anticipate that we will elect to issue shares of our general partner’s common stock in exchange for operating partnership units in connection with each redemption request, rather than redeeming the operating partnership units for cash. With each redemption or exchange, we will increase our general partner’s percentage ownership interest in us. This redemption/exchange right will be limited when, as a consequence of shares of our general partner’s common stock being issued, any person’s actual or constructive stock ownership would exceed our general partner’s ownership limits, or any other limit as provided in our general partner’s charter or as otherwise determined by our general partner’s board of directors.
Tax Matters
Our general partner is our tax matters partner. Our general partner has authority to make tax elections under the Code on our behalf.
Allocations of Net Income and Net Losses to Partners
Our net income generally will be allocated to our general partner to the extent of the accrued preferred return on our Series A preferred units and Series B preferred units and then to our general partner and limited partners in accordance with their respective percentage interests in the common units issued by us. Net loss will generally be allocated to our general partner and limited partners in accordance with their respective percentage interests in the common units issued by us until the limited partners’ capital is reduced to zero and any remaining net loss would be allocated to our general partner. However, in some cases gain or loss may be disproportionately allocated to partners who have contributed appreciated property or guaranteed our debt. The allocations described above are subject to special rules relating to depreciation deductions and to compliance with the provisions of Sections 704(b) and 704(c) of the Code and the associated Treasury regulations. In addition, upon the occurrence of certain specific events, we will revalue our assets and any net increase in valuation will be allocated first to holders of LTIP units, if any, to equalize the capital account balances of such holders with the capital account balances of holders of operating partnership units.
Costs and Expenses
The partnership agreement provides that we will assume and pay when due, or reimburse our general partner for payment of, all costs and expenses relating to our operations or for our benefit.
Term
We will continue in full force and effect until December 31, 2109, or until sooner dissolved in accordance with the terms of the partnership agreement or as otherwise provided by law.
Indemnification and Limitation of Liability
To the fullest extent permitted by applicable law, the partnership agreement requires us to indemnify Excel Trust, Inc., as general partner, and its officers, directors, employees, agents and any other persons we may designate from and against any and all claims arising from our operations in which any indemnitee may be involved, or is threatened to be involved, as a party or otherwise, unless it is established that:
| • | the act or omission of the indemnitee was material to the matter giving rise to the proceeding and either was committed in bad faith, fraud or was the result of active and deliberate dishonesty, |
| • | the indemnitee actually received an improper personal benefit in money, property or services, or |
| • | in the case of any criminal proceeding, the indemnitee had reasonable cause to believe that the act or omission was unlawful. |
83
Table of Contents
Similarly, Excel Trust, Inc., as our general partner, and its officers, directors, agents or employees, are not liable or accountable to us for losses sustained, liabilities incurred or benefits not derived as a result of errors in judgment or mistakes of fact or law or any act or omission so long as it acted in good faith.
Item 12. Indemnification of Directors and Officers.
We are managed by Excel Trust, Inc. as our sole general partner. This section reflects information with respect to the directors and executive officers of our general partner.
Maryland law permits a Maryland corporation to include in its charter a provision limiting the liability of its directors and officers to the corporation and its stockholders for money damages except for liability resulting from (1) actual receipt of an improper benefit or profit in money, property or services or (2) active and deliberate dishonesty established by a final judgment and which is material to the cause of action. Our general partner’s charter contains a provision which eliminates directors’ and officers’ liability to the maximum extent permitted by Maryland law.
Our general partner’s charter authorizes it, to the maximum extent permitted by Maryland law, to obligate itself to indemnify and to pay or reimburse reasonable expenses in advance of final disposition of a proceeding without requiring a preliminary determination as to the entitlement to indemnification to (1) any present or former director or officer or (2) any individual who, while a director or officer of our general partner and at its request, serves or has served another REIT, corporation, partnership, joint venture, trust, limited liability company, employee benefit plan or other enterprise as a trustee, director, officer, agent or partner of such REIT, corporation, partnership, joint venture, trust, limited liability company, employee benefit plan or other enterprise from and against any claim or liability to which such individual may become subject or which such individual may incur by reason of his or her service in such capacity. Our general partner’s bylaws obligate it, to the maximum extent permitted by Maryland law, to indemnify and to pay or reimburse reasonable expenses in advance of final disposition of a proceeding to (1) any present or former director or officer who is made, or threatened to be made, a party to the proceeding by reason of his or her service in that capacity or (2) any individual who, while a director or officer of our general partner and at our general partner’s request, serves or has served another REIT, corporation, partnership, joint venture, trust, limited liability company, employee benefit plan or other enterprise as a trustee, director, officer, agent or partner and who is made, or threatened to be made, a party to the proceeding by reason of his or her service in that capacity. Our general partner’s charter and bylaws also permit our general partner to indemnify and advance expenses to any individual who served a predecessor of our general partner in any of the capacities described above and to any employee or agent of our general partner or a predecessor of our general partner.
Maryland law requires a corporation (unless its charter provides otherwise, which our general partner’s charter does not) to indemnify a director or officer who has been successful, on the merits or otherwise, in the defense of any proceeding to which he or she is made, or threatened to be made, a party by reason of his or her service in that capacity. Maryland law permits a corporation to indemnify its present and former directors and officers, among others, against judgments, penalties, fines, settlements and reasonable expenses actually incurred by them in connection with any proceeding to which they may be made, or threatened to be made, a party by reason of their service in those or other capacities unless it is established that (1) the act or omission of the director or officer was material to the matter giving rise to the proceeding and (a) was committed in bad faith or (b) was a result of active and deliberate dishonesty, (2) the director or officer actually received an improper personal benefit in money, property or services or (3) in the case of any criminal proceeding, the director or officer had reasonable cause to believe that the act or omission was unlawful. However, a Maryland corporation may not indemnify for an adverse judgment in a suit by or in the right of the corporation or for a judgment of liability on the basis that personal benefit was improperly received, unless in either case a court orders indemnification and then only for expenses. Maryland law permits a corporation to advance reasonable expenses to a director or officer upon the corporation’s receipt of (1) a written affirmation by the director or officer of his or her good faith belief that he or she has met the standard of conduct necessary for indemnification by the corporation and (2) a written undertaking by him or her or on his or her behalf to repay the amount paid or reimbursed by the corporation if it shall ultimately be determined that the standard of conduct was not met.
84
Table of Contents
Our general partner has entered into indemnification agreements with each of its executive officers and directors whereby our general partner agrees to indemnify such executive officers and directors to the maximum extent permitted by Maryland law against all expenses and liabilities, subject to limited exceptions. The indemnification agreements require our general partner to indemnify the director or officer party thereto, the indemnitee, against all judgments, penalties, fines and amounts paid in settlement and all expenses actually and reasonably incurred by the indemnitee or on his or her behalf in connection with a proceeding, unless it is established that one of the exceptions to indemnification under Maryland law set forth above exists. The indemnification agreements prohibit indemnification in connection with a proceeding that is brought by or in the right of our general partner if the director or officer is adjudged liable to our general partner.
In addition, the indemnification agreements require our general partner to advance reasonable expenses incurred by the indemnitee within ten days of the receipt by our general partner of a statement from the indemnitee requesting the advance, provided the statement evidences the expenses and is accompanied by:
| • | a written affirmation of the indemnitee’s good faith belief that he or she has met the standard of conduct necessary for indemnification, and |
| • | an undertaking by or on behalf of the Indemnitee to repay the amount if it is ultimately determined that the standard of conduct was not met. |
The indemnification agreements also provide for procedures for the determination of entitlement to indemnification, including requiring such determination be made by independent counsel after a change of control of us.
In addition, our general partner’s directors and officers are indemnified for specified liabilities and expenses pursuant to our partnership agreement.
Insofar as the foregoing provisions permit indemnification of directors, officers or persons controlling us or our general partner for liability arising under the Securities Act, we have been informed that, in the opinion of the SEC, this indemnification is against public policy as expressed in the Securities Act and is therefore unenforceable.
85
Table of Contents
Item 13. Financial Statements and Supplementary Data.
EXCEL TRUST, L.P.
INDEX TO CONSOLIDATED FINANCIAL STATEMENTS
86
Table of Contents
87
Table of Contents
REPORT OF INDEPENDENT REGISTERED PUBLIC ACCOUNTING FIRM
To the Partners of Excel Trust, L.P. and the Owners of Excel Trust, L.P. Predecessor
San Diego, California
We have audited the accompanying consolidated balance sheets of Excel Trust, L.P. and subsidiaries (the “Operating Partnership”) as of December 31, 2012 and 2011, and the related consolidated and combined statements of operations and comprehensive income (loss), capital, and cash flows for the years ended December 31, 2012 and 2011, and for the period from April 28, 2010 to December 31, 2010 of the Operating Partnership and for the period from January 1, 2010 to April 27, 2010 of Excel Trust, L.P. Predecessor (the “Predecessor”). Our audits also included the consolidated and combined financial statement schedules listed in the Index to the Financial Statements. These financial statements and financial statement schedules are the responsibility of the Operating Partnership’s management. Our responsibility is to express an opinion on these financial statements and financial statement schedules based on our audits.
We conducted our audits in accordance with the standards of the Public Company Accounting Oversight Board (United States). Those standards require that we plan and perform the audit to obtain reasonable assurance about whether the financial statements are free of material misstatement. The Operating Partnership is not required to have, nor were we engaged to perform, an audit of its internal control over financial reporting. Our audits included consideration of internal control over financial reporting as a basis for designing audit procedures that are appropriate in the circumstances, but not for the purpose of expressing an opinion on the effectiveness of the Operating Partnership’s internal control over financial reporting. Accordingly, we express no such opinion. An audit includes examining, on a test basis, evidence supporting the amounts and disclosures in the financial statements. An audit also includes assessing the accounting principles used and significant estimates made by management, as well as evaluating the overall financial statement presentation. We believe that our audits provide a reasonable basis for our opinion.
In our opinion, such consolidated and combined financial statements present fairly, in all material respects, the financial position of the Operating Partnership as of December 31, 2012 and 2011, and the results of the operations and the cash flows of the Operating Partnership for the years ended December 31, 2012 and 2011 and for the period from April 28, 2010 to December 31, 2010 and of the Predecessor for the period from January 1, 2010 to April 27, 2010, in conformity with accounting principles generally accepted in the United States of America. Also, in our opinion, such financial statement schedules, when considered in relation to the basic consolidated financial statements taken as a whole, present fairly in all material respects the information set forth therein.
/s/ DELOITTE & TOUCHE LLP
Los Angeles, California
May 28, 2013
88
Table of Contents
CONSOLIDATED BALANCE SHEETS
(Dollars in thousands)
| March 31, 2013 (unaudited) |
December 31, 2012 |
December 31, 2011 |
||||||||||
| ASSETS: |
||||||||||||
| Property: |
||||||||||||
| Land |
$ | 326,669 | $ | 320,289 | $ | 236,941 | ||||||
| Buildings |
585,304 | 564,352 | 287,226 | |||||||||
| Site improvements |
53,503 | 51,875 | 28,257 | |||||||||
| Tenant improvements |
45,537 | 42,903 | 28,517 | |||||||||
| Construction in progress |
3,135 | 1,709 | 21,312 | |||||||||
| Less accumulated depreciation |
(43,125 | ) | (36,765 | ) | (18,294 | ) | ||||||
|
|
|
|
|
|
|
|||||||
| Property, net |
971,023 | 944,363 | 583,959 | |||||||||
| Cash and cash equivalents |
3,711 | 5,596 | 5,292 | |||||||||
| Restricted cash |
6,344 | 5,657 | 3,680 | |||||||||
| Tenant receivables, net |
3,486 | 5,376 | 4,174 | |||||||||
| Lease intangibles, net |
80,961 | 85,646 | 68,556 | |||||||||
| Mortgage loan receivable |
— | — | 2,000 | |||||||||
| Deferred rent receivable |
6,851 | 5,983 | 2,997 | |||||||||
| Other assets |
21,444 | 17,618 | 17,013 | |||||||||
| Investment in unconsolidated entities |
9,021 | 9,015 | — | |||||||||
|
|
|
|
|
|
|
|||||||
| Total assets(1) |
$ | 1,102,841 | $ | 1,079,254 | $ | 687,671 | ||||||
|
|
|
|
|
|
|
|||||||
| LIABILITIES AND CAPITAL: |
||||||||||||
| Liabilities: |
||||||||||||
| Mortgages payable, net |
$ | 332,732 | $ | 333,935 | $ | 244,961 | ||||||
| Notes payable |
88,000 | 75,000 | 21,000 | |||||||||
| Accounts payable and other liabilities |
22,061 | 25,319 | 21,080 | |||||||||
| Lease intangibles, net |
25,320 | 26,455 | 13,843 | |||||||||
| Distributions payable |
10,491 | 9,773 | 5,801 | |||||||||
|
|
|
|
|
|
|
|||||||
| Total liabilities(2) |
478,604 | 470,482 | 306,685 | |||||||||
| Commitments and contingencies |
||||||||||||
| Capital: |
||||||||||||
| Partners’ capital: |
||||||||||||
| Preferred operating partnership units, 50,000,000 units authorized: |
||||||||||||
| 7.00% Series A cumulative convertible perpetual preferred operating partnership units, $50,000 liquidation preference ($25.00 per unit) 2,000,000 units issued and outstanding at each of March 31, 2013 (unaudited), December 31, 2012 and December 31, 2011 |
47,703 | 47,703 | 47,703 | |||||||||
| 8.125% Series B cumulative redeemable preferred operating partnership units, $92,000 liquidation preference ($25.00 per unit) 3,680,000, 3,680,000 and 0 units issued and outstanding at March 31, 2013 (unaudited), December 31, 2012 and December 31, 2011, respectively |
88,720 | 88,720 | — | |||||||||
| Limited partners’ capital, 1,225,115, 1,245,019 and 1,405,405 common operating partnership units issued and outstanding at March 31, 2013 (unaudited), December 31, 2012 and December 31, 2011, respectively |
5,010 | 5,512 | 8,230 | |||||||||
89
Table of Contents
| March 31, 2013 (unaudited) |
December 31, 2012 |
December 31, 2011 |
||||||||||
| General partner’s capital, 47,033,085, 44,905,683 and 30,289,813 common operating partnership units issued and outstanding at March 31, 2013 (unaudited), December 31, 2012 and December 31, 2011, respectively |
481,432 | 465,612 | 323,914 | |||||||||
|
|
|
|
|
|
|
|||||||
| 622,865 | 607,547 | 379,847 | ||||||||||
| Accumulated other comprehensive loss |
(459 | ) | (620 | ) | (872 | ) | ||||||
|
|
|
|
|
|
|
|||||||
| Total partners’ capital |
622,406 | 606,927 | 378,975 | |||||||||
| Non-controlling interests |
1,831 | 1,845 | 2,011 | |||||||||
|
|
|
|
|
|
|
|||||||
| Total capital |
624,237 | 608,772 | 380,986 | |||||||||
|
|
|
|
|
|
|
|||||||
| Total liabilities and capital |
$ | 1,102,841 | $ | 1,079,254 | $ | 687,671 | ||||||
|
|
|
|
|
|
|
|||||||
| (1) | Excel Trust, L.P.’s consolidated total assets at March 31, 2013 (unaudited), December 31, 2012 and December 31, 2011, include $15,811, $15,871 and $16,481, respectively, of assets of a variable interest entity (“VIE”) that can only be used to settle the liabilities of that VIE. |
| (2) | Excel Trust, L.P.’s consolidated total liabilities at March 31, 2013 (unaudited), December 31, 2012 and December 31, 2011, include $147, $154 and $338 of accounts payable and other liabilities, respectively, that do not have recourse to Excel Trust, L.P. |
The accompanying notes are an integral part of these consolidated and combined financial statements.
90
Table of Contents
EXCEL TRUST, L.P. PREDECESSOR
CONSOLIDATED AND COMBINED STATEMENTS OF OPERATIONS AND
COMPREHENSIVE INCOME (LOSS)
(In thousands, except per unit data and distributions per unit)
| The Operating Partnership | The Predecessor | |||||||||||||||||||||||
| Three Months Ended March 31, 2013 (unaudited) |
Three Months Ended March 31, 2012 (unaudited) |
Year Ended December 31, 2012 |
Year Ended December 31, 2011 |
Period from April 28, 2010 to December 31, 2010 |
Period from January 1, 2010 to April 27, 2010 |
|||||||||||||||||||
| Revenues: |
||||||||||||||||||||||||
| Rental revenue |
$ | 22,481 | $ | 16,153 | $ | 71,522 | $ | 44,265 | $ | 12,034 | $ | 1,455 | ||||||||||||
| Tenant recoveries |
4,732 | 3,267 | 14,190 | 10,300 | 2,134 | 113 | ||||||||||||||||||
| Other income |
316 | 360 | 1,432 | 662 | 143 | — | ||||||||||||||||||
|
|
|
|
|
|
|
|
|
|
|
|
|
|||||||||||||
| Total revenues |
27,529 | 19,780 | 87,144 | 55,227 | 14,311 | 1,568 | ||||||||||||||||||
|
|
|
|
|
|
|
|
|
|
|
|
|
|||||||||||||
| Expenses: |
||||||||||||||||||||||||
| Maintenance and repairs |
1,715 | 1,322 | 5,688 | 3,792 | 707 | 98 | ||||||||||||||||||
| Real estate taxes |
3,026 | 2,065 | 9,921 | 6,373 | 1,685 | 140 | ||||||||||||||||||
| Management fees |
234 | 191 | 914 | 576 | 104 | 43 | ||||||||||||||||||
| Other operating expenses |
1,527 | 829 | 4,085 | 3,106 | 850 | 98 | ||||||||||||||||||
| Changes in fair value of contingent consideration |
— | — | (281 | ) | (434 | ) | — | — | ||||||||||||||||
| General and administrative |
3,834 | 3,502 | 13,778 | 12,773 | 7,095 | 8 | ||||||||||||||||||
| Depreciation and amortization |
12,390 | 8,279 | 36,021 | 23,290 | 6,277 | 542 | ||||||||||||||||||
|
|
|
|
|
|
|
|
|
|
|
|
|
|||||||||||||
| Total expenses |
22,726 | 16,188 | 70,126 | 49,476 | 16,718 | 929 | ||||||||||||||||||
|
|
|
|
|
|
|
|
|
|
|
|
|
|||||||||||||
| Net operating income (loss) |
4,803 | 3,592 | 17,018 | 5,751 | (2,407 | ) | 639 | |||||||||||||||||
| Interest expense |
(4,798 | ) | (3,674 | ) | (16,556 | ) | (13,181 | ) | (3,692 | ) | (483 | ) | ||||||||||||
| Interest income |
50 | 53 | 173 | 297 | 166 | — | ||||||||||||||||||
| Income (loss) from equity in unconsolidated entities |
39 | — | (320 | ) | — | — | — | |||||||||||||||||
| Gain on acquisition of real estate and sale of land parcel |
— | — | — | 1,479 | 978 | — | ||||||||||||||||||
| Changes in fair value of financial instruments and gain on common operating partnership unit redemption |
230 | 462 | 1,530 | 1,154 | — | — | ||||||||||||||||||
|
|
|
|
|
|
|
|
|
|
|
|
|
|||||||||||||
| Income (loss) from continuing operations |
324 | 433 | 1,845 | (4,500 | ) | (4,955 | ) | 156 | ||||||||||||||||
| Income from discontinued operations before gain on sale of real estate assets |
— | — | — | 1,023 | 1,082 | — | ||||||||||||||||||
| Gain on sale of real estate assets |
— | — | — | 3,976 | — | — | ||||||||||||||||||
|
|
|
|
|
|
|
|
|
|
|
|
|
|||||||||||||
| Income from discontinued operations |
— | — | — | 4,999 | 1,082 | — | ||||||||||||||||||
|
|
|
|
|
|
|
|
|
|
|
|
|
|||||||||||||
| Net income (loss) |
324 | 433 | 1,845 | 499 | (3,873 | ) | 156 | |||||||||||||||||
| Net (income) loss attributable to non-controlling interests |
(87 | ) | (66 | ) | (279 | ) | (104 | ) | — | (290 | ) | |||||||||||||
|
|
|
|
|
|
|
|
|
|
|
|
|
|||||||||||||
| Net income (loss) attributable to Excel Trust, L.P. and the Predecessor |
237 | 367 | 1,566 | 395 | (3,873 | ) | (134 | ) | ||||||||||||||||
| Preferred operating partnership unit distributions |
(2,744 | ) | (2,121 | ) | (10,353 | ) | (3,228 | ) | — | — | ||||||||||||||
|
|
|
|
|
|
|
|
|
|
|
|
|
|||||||||||||
| Net (loss) income attributable to the unitholders and the Predecessor |
$ | (2,507 | ) | $ | (1,754 | ) | $ | (8,787 | ) | $ | (2,833 | ) | $ | (3,873 | ) | $ | (134 | ) | ||||||
|
|
|
|
|
|
|
|
|
|
|
|
|
|||||||||||||
| Loss from continuing operations per unit attributable to the unitholders — basic and diluted |
(0.06 | ) | (0.06 | ) | (0.26 | ) | (0.36 | ) | (0.31 | ) | ||||||||||||||
| Net loss per unit attributable to the unitholders — basic and diluted |
$ | (0.06 | ) | $ | (0.06 | ) | $ | (0.26 | ) | $ | (0.15 | ) | $ | (0.24 | ) | |||||||||
|
|
|
|
|
|
|
|
|
|
|
|||||||||||||||
| Weighted-average common operating partnership unit outstanding — basic and diluted |
46,594 | 33,154 | 35,912 | 23,726 | 16,151 | |||||||||||||||||||
|
|
|
|
|
|
|
|
|
|
|
|||||||||||||||
| Net income (loss) |
$ | 324 | $ | 433 | $ | 1,845 | $ | 499 | $ | (3,873 | ) | $ | 156 | |||||||||||
| Other comprehensive income: |
||||||||||||||||||||||||
| Change in unrealized gain on investment in equity securities |
— | 32 | 79 | 92 | — | — | ||||||||||||||||||
| Gain on sale of equity securities (reclassification adjustment) |
— | (11 | ) | (171 | ) | — | — | — | ||||||||||||||||
| Change in unrealized loss on interest rate swaps |
161 | (16 | ) | 344 | (576 | ) | (388 | ) | — | |||||||||||||||
|
|
|
|
|
|
|
|
|
|
|
|
|
|||||||||||||
| Comprehensive income (loss) attributable to Excel Trust, L.P. and controlling interests of the Predecessor. |
$ | 485 | $ | 438 | $ | 2,097 | $ | 15 | $ | (4,261 | ) | $ | 156 | |||||||||||
|
|
|
|
|
|
|
|
|
|
|
|
|
|||||||||||||
The accompanying notes are an integral part of these consolidated and combined financial statements.
91
Table of Contents
EXCEL TRUST, L.P. PREDECESSOR
CONSOLIDATED AND COMBINED STATEMENTS OF CAPITAL
(Dollars in thousands)
The Predecessor
| Total Owner’s Capital |
Non-controlling Interests |
Total Capital |
||||||||||
| Balance January 1, 2010 |
$ | 8,622 | $ | 900 | $ | 9,522 | ||||||
| Contributions |
316 | 63 | 379 | |||||||||
| Distributions |
(707 | ) | (290 | ) | (997 | ) | ||||||
| Net (loss) income |
(134 | ) | 290 | 156 | ||||||||
|
|
|
|
|
|
|
|||||||
| Balance April 27, 2010 |
$ | 8,097 | $ | 963 | $ | 9,060 | ||||||
|
|
|
|
|
|
|
|||||||
92
Table of Contents
EXCEL TRUST, L.P. AND
EXCEL TRUST, L.P. PREDECESSOR
CONSOLIDATED AND COMBINED STATEMENTS OF CAPITAL
(Dollars in thousands)
| Preferred Operating Partnership Units |
Limited Partners’ Capital |
General Partner’s Capital |
Accumulated other Comprehensive Loss |
Total Partners’ Capital |
Non- controlling Interests |
Owner’s Capital |
Total Capital |
|||||||||||||||||||||||||||||||||||||
| Series A | Series B | Common Operating Partnership Units |
Amount | Common Operating Partnership Units |
Amount | |||||||||||||||||||||||||||||||||||||||
| Balance at April 28, 2010 |
$ | — | $ | — | — | $ | — | — | $ | — | $ | — | $ | — | $ | 963 | $ | 8,097 | $ | 9,060 | ||||||||||||||||||||||||
| Net proceeds from issuance of common operating partnership units |
— | — | — | — | 15,000,000 | 194,602 | — | 194,602 | — | — | 194,602 | |||||||||||||||||||||||||||||||||
| Initial contribution and acquisition of Predecessor interests: |
||||||||||||||||||||||||||||||||||||||||||||
| Exchange of Predecessor capital for common operating partnership units |
— | — | 641,062 | 291 | 454,008 | 8,220 | — | 8,511 | — | (8,097 | ) | 414 | ||||||||||||||||||||||||||||||||
| Exchange of Predecessor non-controlling interests for common operating partnership units |
— | — | — | — | 53,985 | 1,049 | — | 1,049 | (963 | ) | — | 86 | ||||||||||||||||||||||||||||||||
| Predecessor non-controlling interests purchased |
— | — | — | — | — | (1,812 | ) | — | (1,812 | ) | — | — | (1,812 | ) | ||||||||||||||||||||||||||||||
| Issuance of restricted common operating partnership unit awards |
— | — | — | — | 155,338 | — | — | — | — | — | — | |||||||||||||||||||||||||||||||||
| Noncash amortization of share-based compensation |
— | — | — | — | — | 357 | — | 357 | — | — | 357 | |||||||||||||||||||||||||||||||||
| Common operating partnership unit distributions ($0.20 per unit) |
— | — | — | (128 | ) | — | (3,133 | ) | — | (3,261 | ) | — | — | (3,261 | ) | |||||||||||||||||||||||||||||
| Contributions from non-controlling interests |
— | — | — | — | — | — | — | — | 1,425 | — | 1,425 | |||||||||||||||||||||||||||||||||
| Net loss |
— | — | — | (148 | ) | — | (3,725 | ) | — | (3,873 | ) | — | — | (3,873 | ) | |||||||||||||||||||||||||||||
| Change in unrealized loss on interest rate swaps |
— | — | — | — | — | — | (388 | ) | (388 | ) | — | — | (388 | ) | ||||||||||||||||||||||||||||||
| Balance at December 31, 2010 |
— | — | 641,062 | 15 | 15,663,331 | 195,558 | (388 | ) | 195,185 | 1,425 | — | 196,610 | ||||||||||||||||||||||||||||||||
| Net proceeds from sale of preferred operating partnership units |
47,703 | — | — | — | — | — | — | 47,703 | — | — | 47,703 | |||||||||||||||||||||||||||||||||
| Net proceeds from sale of common operating partnership units |
— | — | — | — | 14,375,000 | 149,887 | — | 149,887 | — | — | 149,887 | |||||||||||||||||||||||||||||||||
| Issuance of restricted common operating partnership unit awards |
— | — | — | — | 929,348 | — | — | — | — | — | — | |||||||||||||||||||||||||||||||||
| Repurchase of common operating partnership units |
— | — | — | — | (674,866 | ) | (6,742 | ) | — | (6,742 | ) | — | — | (6,742 | ) | |||||||||||||||||||||||||||||
| Forfeitures of restricted common operating partnership unit awards |
— | — | — | — | (3,000 | ) | — | — | — | — | — | — | ||||||||||||||||||||||||||||||||
| Noncash amortization of share-based compensation |
— | — | — | — | — | 4,497 | — | 4,497 | — | — | 4,497 | |||||||||||||||||||||||||||||||||
| Common operating partnership unit distributions ($0.605 per unit) |
(3,228 | ) | — | — | (767 | ) | — | (16,506 | ) | — | (20,501 | ) | (235 | ) | — | (20,736 | ) | |||||||||||||||||||||||||||
| Issuance of common operating partnership units for acquisition |
— | — | 764,343 | 9,035 | — | — | — | 9,035 | — | — | 9,035 | |||||||||||||||||||||||||||||||||
| Contributions from non-controlling interests |
— | — | — | — | — | — | — | — | 717 | — | 717 | |||||||||||||||||||||||||||||||||
| Net income (loss) |
3,228 | — | — | (53 | ) | — | (2,780 | ) | — | 395 | 104 | — | 499 | |||||||||||||||||||||||||||||||
| Change in unrealized gain on investment in equity securities |
— | — | — | — | — | — | 92 | 92 | — | — | 92 | |||||||||||||||||||||||||||||||||
| Change in unrealized loss on interest rate swaps |
— | — | — | — | — | — | (576 | ) | (576 | ) | — | — | (576 | ) | ||||||||||||||||||||||||||||||
| Balance at December 31, 2011 |
47,703 | — | 1,405,405 | 8,230 | 30,289,813 | 323,914 | (872 | ) | 378,975 | 2,011 | — | 380,986 | ||||||||||||||||||||||||||||||||
| Net proceeds from sale of preferred operating partnership units |
— | 88,720 | — | — | — | — | — | 88,720 | — | — | 88,720 | |||||||||||||||||||||||||||||||||
| Net proceeds from sale of common operating partnership units |
— | — | — | — | 10,857,051 | 125,683 | — | 125,683 | — | — | 125,683 | |||||||||||||||||||||||||||||||||
| Issuance of restricted common operating partnership unit awards |
— | — | — | — | 18,356 | — | — | — | — | — | — | |||||||||||||||||||||||||||||||||
| Redemption of common operating partnership units |
— | — | (571,570 | ) | (6,756 | ) | 509,694 | 6,090 | — | (666 | ) | — | — | (666 | ) | |||||||||||||||||||||||||||||
| Issuance of common operating partnership units for acquisition |
— | — | 411,184 | 5,082 | 3,230,769 | 39,108 | — | 44,190 | — | — | 44,190 | |||||||||||||||||||||||||||||||||
| Noncash amortization of share-based compensation |
— | — | — | — | — | 3,223 | — | 3,223 | — | — | 3,223 | |||||||||||||||||||||||||||||||||
| Common operating partnership unit distributions ($0.65 per unit) |
(3,500 | ) | (6,853 | ) | — | (747 | ) | — | (23,916 | ) | — | (35,016 | ) | (445 | ) | — | (35,461 | ) | ||||||||||||||||||||||||||
| Net income (loss) |
3,500 | 6,853 | — | (297 | ) | — | (8,490 | ) | — | 1,566 | 279 | — | 1,845 | |||||||||||||||||||||||||||||||
| Change in unrealized gain on investment in equity securities |
— | — | — | — | — | — | (92 | ) | (92 | ) | — | — | (92 | ) | ||||||||||||||||||||||||||||||
| Change in unrealized loss on interest rate swaps |
— | — | — | — | — | — | 344 | 344 | — | — | 344 | |||||||||||||||||||||||||||||||||
| Balance at December 31, 2012 |
47,703 | 88,720 | 1,245,019 | $ | 5,512 | 44,905,683 | 465,612 | (620 | ) | 606,927 | 1,845 | — | 608,772 | |||||||||||||||||||||||||||||||
| Net proceeds from sale of common operating partnership units |
— | — | — | — | 2,063,858 | 25,423 | — | 25,423 | — | — | 25,423 | |||||||||||||||||||||||||||||||||
| Issuance of restricted common operating partnership unit awards |
— | — | — | — | 41,500 | — | — | — | — | — | — | |||||||||||||||||||||||||||||||||
| Redemption of common operating partnership units |
— | — | (19,904 | ) | (235 | ) | 22,074 | 279 | — | 44 | — | — | 44 | |||||||||||||||||||||||||||||||
| Noncash amortization of share-based compensation |
— | — | — | — | — | 562 | — | 562 | — | — | 562 | |||||||||||||||||||||||||||||||||
| Common operating partnership unit distributions ($0.17 per unit) |
(875 | ) | (1,869 | ) | — | (208 | ) | — | (7,996 | ) | — | (10,948 | ) | (101 | ) | — | (11,049 | ) | ||||||||||||||||||||||||||
| Net income (loss) |
875 | 1,869 | — | (59 | ) | — | (2,448 | ) | — | 237 | 87 | — | 324 | |||||||||||||||||||||||||||||||
| Change in unrealized loss on interest rate swaps |
— | — | — | — | — | — | 161 | 161 | — | — | 161 | |||||||||||||||||||||||||||||||||
|
|
|
|
|
|
|
|
|
|
|
|
|
|
|
|
|
|
|
|
|
|
|
|||||||||||||||||||||||
| Balance at March 31, 2013 (unaudited) |
$ | 47,703 | $ | 88,720 | 1,225,115 | $ | 5,010 | 47,033,085 | $ | 481,432 | $ | (459 | ) | $ | 622,406 | $ | 1,831 | $ | — | $ | 624,237 | |||||||||||||||||||||||
|
|
|
|
|
|
|
|
|
|
|
|
|
|
|
|
|
|
|
|
|
|
|
|||||||||||||||||||||||
The accompanying notes are an integral part of these consolidated and combined financial statements.
93
Table of Contents
EXCEL TRUST, L.P. PREDECESSOR
CONSOLIDATED AND COMBINED STATEMENTS OF CASH FLOWS
(Dollars in thousands)
| The Operating Partnership | The Predecessor | |||||||||||||||||||||||
| Three Months ended March 31, 2013 (unaudited) |
Three Months ended March 31, 2012 (unaudited) |
Year
ended December 31, 2012 |
Year
ended December 31, 2011 |
Period from April 28, 2010 to December 31, 2010 |
Period from January 1, 2010 to April 27, 2010 |
|||||||||||||||||||
| Cash flows from operating activities: |
||||||||||||||||||||||||
| Net income (loss) |
$ | 324 | $ | 433 | $ | 1,845 | $ | 499 | $ | (3,873 | ) | $ | 156 | |||||||||||
| Adjustments to reconcile net income (loss) to net cash provided by operating activities: |
||||||||||||||||||||||||
| Depreciation and amortization |
12,390 | 8,279 | 36,021 | 23,705 | 6,727 | 542 | ||||||||||||||||||
| Gain on acquisition of real estate and sale of land parcel |
— | — | — | (1,479 | ) | (978 | ) | — | ||||||||||||||||
| Changes in fair value of financial instruments and gain on common operating partnership unit redemption |
(230 | ) | (462 | ) | (1,530 | ) | (1,154 | ) | — | — | ||||||||||||||
| Gain on sale of real estate |
— | — | — | (3,976 | ) | — | — | |||||||||||||||||
| Gain on sale of marketable securities |
— | — | (171 | ) | — | — | — | |||||||||||||||||
| Changes in fair value of contingent consideration |
— | — | (281 | ) | (434 | ) | — | — | ||||||||||||||||
| Loss from equity in unconsolidated entities |
(39 | ) | — | 320 | — | — | — | |||||||||||||||||
| Deferred rent receivable |
(877 | ) | (751 | ) | (3,148 | ) | (1,968 | ) | (499 | ) | (66 | ) | ||||||||||||
| Amortization of above - (below) market leases |
40 | (227 | ) | 65 | 152 | (113 | ) | (20 | ) | |||||||||||||||
| Amortization of deferred balances |
442 | 483 | 1,763 | 1,393 | 295 | 22 | ||||||||||||||||||
| Bad debt expense |
337 | 247 | 690 | 800 | 348 | 16 | ||||||||||||||||||
| Amortization of share-based compensation |
562 | 785 | 3,223 | 4,497 | 357 | — | ||||||||||||||||||
| Change in assets and liabilities (net of the effect of acquisitions): |
||||||||||||||||||||||||
| Tenant and other receivables |
1,565 | 365 | (1,754 | ) | (2,910 | ) | (2,276 | ) | 64 | |||||||||||||||
| Other assets |
(1,020 | ) | (1,074 | ) | (873 | ) | (241 | ) | (562 | ) | (86 | ) | ||||||||||||
| Accounts payable and other liabilities |
(2,885 | ) | 1,100 | 3,722 | 2,102 | 4,494 | (327 | ) | ||||||||||||||||
|
|
|
|
|
|
|
|
|
|
|
|
|
|||||||||||||
| Net cash provided by operating activities |
10,609 | 9,178 | 39,892 | 20,986 | 3,920 | 301 | ||||||||||||||||||
|
|
|
|
|
|
|
|
|
|
|
|
|
|||||||||||||
| Cash flows from investing activities: |
||||||||||||||||||||||||
| Acquisitions of property |
(30,707 | ) | (61,031 | ) | (290,987 | ) | (88,159 | ) | (317,096 | ) | — | |||||||||||||
| Development of property and property improvements |
(4,691 | ) | (3,076 | ) | (9,101 | ) | (28,669 | ) | (3,127 | ) | (132 | ) | ||||||||||||
| Investments in unconsolidated entities |
(106 | ) | — | (7,829 | ) | — | — | — | ||||||||||||||||
| Return of capital from unconsolidated entities |
139 | — | — | — | — | — | ||||||||||||||||||
| Receipt of master lease payments |
162 | — | — | — | — | — | ||||||||||||||||||
| Proceeds from contribution of real estate assets to unconsolidated entity |
— | — | 21,317 | — | — | — | ||||||||||||||||||
| Advance for mortgage loan receivable |
— | — | — | — | (2,000 | ) | — | |||||||||||||||||
| Capitalized leasing costs |
(728 | ) | (789 | ) | (2,048 | ) | (1,286 | ) | (432 | ) | (94 | ) | ||||||||||||
| Advance for note receivable |
— | — | (750 | ) | — | — | — | |||||||||||||||||
| Collection of mortgage loan receivable |
— | — | 2,000 | — | — | — | ||||||||||||||||||
| Purchase of equity securities |
— | — | (125 | ) | (9,072 | ) | — | — | ||||||||||||||||
| Proceeds from sale of equity securities |
— | 1,289 | 9,368 | — | — | — | ||||||||||||||||||
| Restricted cash |
(687 | ) | (485 | ) | (1,977 | ) | 3,891 | (4,629 | ) | (12 | ) | |||||||||||||
|
|
|
|
|
|
|
|
|
|
|
|
|
|||||||||||||
| Net cash used in investing activities |
(36,618 | ) | (64,092 | ) | (280,132 | ) | (123,295 | ) | (327,284 | ) | (238 | ) | ||||||||||||
|
|
|
|
|
|
|
|
|
|
|
|
|
|||||||||||||
| Cash flows from financing activities: |
||||||||||||||||||||||||
| Issuance of common operating partnership units |
22,663 | — | 125,683 | 149,887 | 194,602 | — | ||||||||||||||||||
| Repurchase of common operating partnership units |
— | — | — | (6,742 | ) | — | — | |||||||||||||||||
| Issuance of preferred operating partnership units |
— | 88,710 | 88,720 | 47,703 | — | — | ||||||||||||||||||
| Redemption of common operating partnership units |
— | — | (1,915 | ) | — | — | — | |||||||||||||||||
| Payments on mortgages payable |
(1,234 | ) | (1,066 | ) | (4,392 | ) | (6,653 | ) | (11,969 | ) | (227 | ) | ||||||||||||
| Proceeds from mortgages payable |
84 | — | 13,800 | — | 67,800 | — | ||||||||||||||||||
| Payments on notes payable |
(24,000 | ) | (40,500 | ) | (189,000 | ) | (114,849 | ) | — | — | ||||||||||||||
| Proceeds from notes payable |
37,000 | 19,500 | 243,000 | 51,000 | 85,384 | — | ||||||||||||||||||
| Payments of contingent consideration |
— | (1,613 | ) | (1,613 | ) | — | — | — | ||||||||||||||||
| Purchase of Predecessor non-controlling interests |
— | — | — | — | (1,812 | ) | — | |||||||||||||||||
| (Payments to) and proceeds from Predecessor controlling interests |
— | — | — | — | (1,337 | ) | 121 | |||||||||||||||||
| Contributions from Operating Partnership non-controlling interests |
— | — | — | 130 | 1,425 | — | ||||||||||||||||||
| Contributions from Predecessor controlling interests |
— | — | — | — | — | 316 | ||||||||||||||||||
| Contributions from Predecessor non-controlling interests |
— | — | — | — | — | 63 | ||||||||||||||||||
| Distributions to Predecessor controlling interests |
— | — | — | — | — | (707 | ) | |||||||||||||||||
| Distributions to Predecessor non-controlling interests |
— | — | — | — | — | (290 | ) | |||||||||||||||||
| Distributions to non-controlling interests |
(101 | ) | (101 | ) | (445 | ) | (235 | ) | — | — | ||||||||||||||
| Common operating partnership unit distributions |
(10,230 | ) | (5,948 | ) | (31,044 | ) | (16,657 | ) | (1,304 | ) | — | |||||||||||||
| Deferred financing costs |
(58 | ) | (135 | ) | (2,250 | ) | (2,508 | ) | (3,014 | ) | — | |||||||||||||
| Tenant security deposits |
— | — | — | — | 114 | — | ||||||||||||||||||
|
|
|
|
|
|
|
|
|
|
|
|
|
|||||||||||||
| Net cash provided by (used in) financing activities |
24,124 | 58,847 | 240,544 | 101,076 | 329,889 | (724 | ) | |||||||||||||||||
|
|
|
|
|
|
|
|
|
|
|
|
|
|||||||||||||
| Net increase (decrease) |
(1,885 | ) | 3,933 | 304 | (1,233 | ) | 6,525 | (661 | ) | |||||||||||||||
| Cash and cash equivalents, beginning of period |
5,596 | 5,292 | 5,292 | 6,525 | — | 661 | ||||||||||||||||||
|
|
|
|
|
|
|
|
|
|
|
|
|
|||||||||||||
| Cash and cash equivalents, end of period |
$ | 3,711 | $ | 9,225 | $ | 5,596 | $ | 5,292 | $ | 6,525 | $ | — | ||||||||||||
|
|
|
|
|
|
|
|
|
|
|
|
|
|||||||||||||
| Supplemental cash flow information: |
||||||||||||||||||||||||
| Cash payments for interest, net of amounts capitalized |
$ | 3,891 | $ | 2,945 | $ | 13,030 | $ | 10,522 | $ | 2,664 | $ | 480 | ||||||||||||
|
|
|
|
|
|
|
|
|
|
|
|
|
|||||||||||||
| Non-cash investing and financing activity: |
||||||||||||||||||||||||
| Contribution of properties for common operating partnership units |
$ | — | $ | — | $ | — | $ | — | $ | 9,060 | $ | — | ||||||||||||
|
|
|
|
|
|
|
|
|
|
|
|
|
|||||||||||||
| Acquisition of real estate for common operating partnership units |
$ | — | $ | 39,108 | $ | 44,190 | $ | 9,035 | $ | — | $ | — | ||||||||||||
|
|
|
|
|
|
|
|
|
|
|
|
|
|||||||||||||
| Assumption of net mortgage debt in connection with property acquisitions |
$ | — | $ | — | $ | 79,670 | $ | 114,546 | $ | 51,748 | $ | — | ||||||||||||
|
|
|
|
|
|
|
|
|
|
|
|
|
|||||||||||||
| Assets received in connection with property acquisitions |
$ | — | $ | 772 | $ | 772 | $ | 693 | $ | 705 | $ | — | ||||||||||||
|
|
|
|
|
|
|
|
|
|
|
|
|
|||||||||||||
| Liabilities assumed in connection with property acquisitions |
$ | 44 | $ | 385 | $ | 5,171 | $ | 4,578 | $ | 3,530 | $ | — | ||||||||||||
|
|
|
|
|
|
|
|
|
|
|
|
|
|||||||||||||
| Dispositions of real estate assets classified as a 1031 exchange (net of gain on sale of real estate of $4,518) |
$ | — | $ | — | $ | — | $ | 35,790 | $ | — | $ | — | ||||||||||||
|
|
|
|
|
|
|
|
|
|
|
|
|
|||||||||||||
| Acquisition of real estate assets classified as a 1031 exchange |
$ | — | $ | — | $ | — | $ | 39,300 | $ | — | $ | — | ||||||||||||
|
|
|
|
|
|
|
|
|
|
|
|
|
|||||||||||||
| Common operating partnership unit distributions payable |
$ | 10,491 | $ | 7,797 | $ | 9,773 | $ | 5,801 | $ | 1,957 | $ | — | ||||||||||||
|
|
|
|
|
|
|
|
|
|
|
|
|
|||||||||||||
| Conversion of note payable to contribution from non-controlling interests |
$ | — | $ | — | $ | — | $ | 587 | $ | — | $ | — | ||||||||||||
|
|
|
|
|
|
|
|
|
|
|
|
|
|||||||||||||
| Accrued additions to operating and development properties |
$ | 1,816 | $ | 593 | $ | 2,705 | $ | 3,385 | $ | 773 | $ | — | ||||||||||||
|
|
|
|
|
|
|
|
|
|
|
|
|
|||||||||||||
| Change in unrealized loss on interest rate swaps |
$ | 161 | $ | 16 | $ | 344 | $ | 576 | $ | 388 | $ | — | ||||||||||||
|
|
|
|
|
|
|
|
|
|
|
|
|
|||||||||||||
| Change in unrealized gain on marketable securities |
$ | — | $ | — | $ | 92 | $ | 92 | $ | — | $ | — | ||||||||||||
|
|
|
|
|
|
|
|
|
|
|
|
|
|||||||||||||
| Common operating partnership unit redemptions |
$ | 279 | $ | — | $ | 6,090 | $ | — | $ | — | $ | — | ||||||||||||
|
|
|
|
|
|
|
|
|
|
|
|
|
|||||||||||||
| Investment in unconsolidated entities |
$ | — | $ | — | $ | 1,506 | $ | — | $ | — | $ | — | ||||||||||||
|
|
|
|
|
|
|
|
|
|
|
|
|
|||||||||||||
| Exchange of notes receivable for real estate |
$ | — | $ | — | $ | — | $ | — | $ | 33,400 | $ | — | ||||||||||||
|
|
|
|
|
|
|
|
|
|
|
|
|
|||||||||||||
| Reclassification of offering costs |
$ | 187 | $ | — | $ | — | $ | — | $ | — | $ | — | ||||||||||||
|
|
|
|
|
|
|
|
|
|
|
|
|
|||||||||||||
| Amount due from general partner (proceeds from issuance of common operating partnership units) |
$ | 2,947 | $ | — | $ | — | $ | — | $ | — | $ | — | ||||||||||||
|
|
|
|
|
|
|
|
|
|
|
|
|
|||||||||||||
The accompanying notes are an integral part of these consolidated and combined financial statements.
94
Table of Contents
EXCEL TRUST, L.P. PREDECESSOR
NOTES TO CONSOLIDATED AND COMBINED FINANCIAL STATEMENTS
1. Organization:
Excel Trust, L.P., a Delaware limited partnership (the “Operating Partnership” or “OP”), is an entity through which its general partner, Excel Trust, Inc., a Maryland corporation (the “general partner” or the “Parent Company”), conducts its business and owns its assets. On April 28, 2010, the general partner completed an initial public offering (the “Offering”) of 15,000,000 shares of its common stock at an aggregate public offering price of $210.0 million. The net proceeds of $194.6 million were contributed to the Operating Partnership in exchange for 15,000,000 common operating partnership units. In connection with the Offering, the Parent Company and the Operating Partnership, for which the Parent Company is the sole general partner, together with the partners and members of the affiliated partnerships and limited liability companies of Excel Trust, L.P. Predecessor (“ETP” or the “Predecessor”) and other parties which hold direct or indirect ownership interests in the Properties (defined below) engaged in certain formation transactions (the “Formation Transactions”). The Formation Transactions were designed to (1) continue the operations of ETP, (2) enable the general partner to raise the necessary capital to acquire increased interests in certain of the Properties, (3) provide capital for future acquisitions, (4) fund certain development costs at the Operating Partnership’s development property, (5) establish a capital reserve for general corporate purposes, and (6) fund future joint venture capital commitments.
Following the Offering, ETP was contributed to the Operating Partnership in exchange for 507,993 common operating partnership interests (the “common OP units”) held by the general partner and 641,062 common OP units held by the limited partners. The exchange of entities or interests therein for common OP units of the Operating Partnership has been accounted for as a reorganization of entities under common control, and accordingly, the related assets and liabilities of ETP have been reflected at their historical cost basis. The general partner elected to be taxed as a real estate investment trust (“REIT”) under the Internal Revenue Code of 1986, as amended (the “Code”), beginning with its taxable year ended December 31, 2010.
ETP, which was not a legal entity but rather a combination of real estate entities and operations, was engaged in the business of owning, managing, leasing, acquiring and developing commercial real estate, consisting of retail properties, an office property and undeveloped land (the “Properties”). The Properties are located in South Carolina, Tennessee, California and Utah. During the periods presented in the accompanying combined financial statements prior to the Offering, ETP was the general partner or managing member of the real estate entities that directly or indirectly own the Properties, and ETP had responsibility for the day-to-day operations of such entities. The ultimate owners of ETP were Mr. Gary B. Sabin and certain others who had non-controlling interests.
The Operating Partnership is a vertically integrated, self-administered, self-managed real estate firm with the principal objective of acquiring, financing, developing, leasing, owning and managing value oriented community and power centers, grocery anchored neighborhood centers and freestanding retail properties. The Operating Partnership seeks investment opportunities throughout the United States, but focuses on the Northeast, Northwest and Sunbelt regions. The Operating Partnership generally leases anchor space to national and regional supermarket chains, big-box retailers and select national retailers that frequently offer necessity and value oriented items and generate regular consumer traffic.
Excel Trust, Inc. is the sole general partner of the Operating Partnership and, as of March 31, 2013 (unaudited), December 31, 2012, December 31, 2011 and December 31, 2010 owned a 97.4%, 97.3%, 95.4% and 96.1% interest, respectively, in the Operating Partnership. The remaining 2.6%, 2.7%, 4.6% and 3.9% interest, respectively, in the Operating Partnership was held by limited partners. Each partner’s percentage interest in the Operating Partnership is determined based on the number of common OP units owned as compared to total common OP units (and potentially issuable common OP units, as applicable) outstanding as of each period end and is used as the basis for the allocation of net income or loss to each partner.
2. Summary of Significant Accounting Policies
Basis of Presentation:
The accompanying consolidated and combined financial statements of the Operating Partnership include all the accounts of the Operating Partnership and all entities in which the Operating Partnership has a controlling interest. The exchange of Predecessor controlling and non-controlling interests for common OP units has been reflected on the Predecessor historical cost basis as a reorganization of entities under common control. The Predecessor’s combined financial statements reflect presentation of properties on a combined historical cost basis because of their common ownership. All significant intercompany Partnership balances and transactions have been eliminated in consolidation and combination.
The unaudited interim financial statements as of March 31, 2013 and for the three months ended March 31, 2013 and 2012 should be read in conjunction with the audited financial statements and notes thereto contained herein for the years ended December 31, 2012 and 2011 and for the periods from April 28, 2010 to December 31, 2010 and from January 1, 2010 to April 27, 2010. In the opinion of management, all adjustments (consisting of normal recurring adjustments) necessary for a fair presentation of the financial statements for the interim periods have been made. Operating results for the three months ended March 31, 2013 are not necessarily indicative of the results that may be expected for the year ending December 31, 2013. All significant intercompany balances and transactions have been eliminated in consolidation.
95
Table of Contents
The Operating Partnership is required to continually evaluate its variable interest entity (“VIE”) relationships and consolidate investments in these entities when it is determined to be the primary beneficiary of their operations. A VIE is broadly defined as an entity where either (1) the equity investors as a group, if any, lack the power through voting or similar rights to direct the activities of an entity that most significantly impact the entity’s economic performance or (2) the equity investment at risk is insufficient to finance that entity’s activities without additional subordinated financial support.
A variable interest holder is considered to be the primary beneficiary of a VIE if it has both (1) the power to direct matters that most significantly impact the VIE’s economic performance and (2) the obligation to absorb losses or the right to receive benefits of the VIE that could potentially be significant to the VIE. The Operating Partnership considers a variety of factors in identifying the entity that holds the power to direct matters that most significantly impact the VIE’s economic performance including, but not limited to, the ability to direct financing, leasing, construction and other operating decisions and activities. In addition, the Operating Partnership considers the form of ownership interest, voting interest, the size of the investment (including loans) and the rights of other investors to participate in policy making decisions, to replace or remove the manager and to liquidate or sell the entity. The obligation to absorb losses and the right to receive benefits when a reporting entity is affiliated with a VIE must be based on ownership, contractual, and/or other pecuniary interests in that VIE.
The significant accounting policies discussed as follows are consistent between the Operating Partnership and the Predecessor.
Cash and Cash Equivalents:
The Operating Partnership considers all highly liquid investments with an original maturity of three months or less when purchased to be cash equivalents, for which cost approximates fair value, due to their short term maturities.
Restricted Cash:
Restricted cash comprises impound reserve accounts for property taxes, insurance, capital improvements and tenant improvements.
Accounts Payable and Other Liabilities:
Included in accounts payable and other liabilities is deferred rent in the amount of $4.1million, $4.4 million and $3.0 million at March 31, 2013 (unaudited), December 31, 2012 and December 31, 2011, respectively.
Revenue Recognition:
The Operating Partnership commences revenue recognition on its leases based on a number of factors. In most cases, revenue recognition under a lease begins when the lessee takes possession of or controls the physical use of the leased asset. Generally, this occurs on the lease commencement date. In determining what constitutes the leased asset, the Operating Partnership evaluates whether the Operating Partnership or the lessee is the owner, for accounting purposes, of the tenant improvements. If the Operating Partnership is the owner, for accounting purposes, of the tenant improvements, then the leased asset is the finished space and revenue recognition begins when the lessee takes possession of the finished space, typically when the improvements are substantially complete. If the Operating Partnership concludes that it is not the owner, for accounting purposes, of the tenant improvements (the lessee is the owner), then the leased asset is the unimproved space and any tenant improvement allowances funded under the lease are treated as lease incentives, which reduce revenue recognized on a straight-line basis over the remaining non-cancelable term of the respective lease. In these circumstances, the Operating Partnership begins revenue recognition when the lessee takes possession of the unimproved space for the lessee to construct improvements. The determination of who is the owner, for accounting purposes, of the tenant improvements is highly subjective and determines the nature of the leased asset and when revenue recognition under a lease begins. The Operating Partnership considers a number of different factors to evaluate whether it or the lessee is the owner of the tenant improvements for accounting purposes. These factors include:
| • | whether the lease stipulates how and on what a tenant improvement allowance may be spent; |
| • | whether the tenant or landlord retains legal title to the improvements; |
| • | the uniqueness of the improvements; |
| • | the expected economic life of the tenant improvements relative to the length of the lease; |
| • | the responsible party for construction cost overruns; and |
| • | who constructs or directs the construction of the improvements. |
The determination of who owns the tenant improvements, for accounting purposes, is subject to significant judgment. In making that determination the Operating Partnership considers all of the above factors. However, no one factor is determinative in reaching a conclusion.
96
Table of Contents
All leases are classified as operating leases and minimum rental revenues are recognized on a straight-line basis over the terms of the related lease. The difference between the amount of rent due in a year and the amount recorded as rental income is referred to as the “straight-line rent adjustment.” Rental income was increased by $877,000, $751,000, $3.1 million, $2.0 million, and $580,000 for the three months ended March 31, 2013 and 2012 (unaudited) and for the years ended December 31, 2012, 2011 and 2010, respectively, due to the straight-line rent adjustment. Percentage rent is recognized after tenant sales have exceeded defined thresholds (if applicable) and was $385,000, $208,000, $720,000, $271,000 and $46,000 for the three months ended March 31, 2013 and 2012 (unaudited) and for the years ended December 31, 2012, 2011 and 2010, respectively.
Estimated recoveries from certain tenants for their pro rata unit of real estate taxes, insurance and other operating expenses are recognized as revenues in the period the applicable expenses are incurred or as specified in the leases. Other tenants pay a fixed rate and these tenant recoveries are recognized as revenue on a straight-line basis over the term of the related leases.
Total estimated minimum rents under non-cancelable operating tenant leases in effect at December 31, 2012 were as follows (in thousands):
| 2013 |
$ | 77,606 | ||
| 2014 |
73,853 | |||
| 2015 |
65,099 | |||
| 2016 |
56,303 | |||
| 2017 |
50,430 | |||
| Thereafter |
249,526 | |||
|
|
|
|||
| $ | 572,817 | |||
|
|
|
Property:
Costs incurred in connection with the development or construction of properties and improvements are capitalized. Capitalized costs include pre-construction costs essential to the development of the property, development costs, construction costs, interest costs, real estate taxes and related costs and other direct costs incurred during the period of development. The Operating Partnership capitalizes costs on land and buildings under development until construction is substantially complete and the property is held available for occupancy. The determination of when a development project is substantially complete and when capitalization must cease involves a degree of judgment. The Operating Partnership considers a construction project as substantially complete and held available for occupancy upon the completion of landlord-owned tenant improvements or when the lessee takes possession of the unimproved space for construction of its own improvements, but no later than one year from cessation of major construction activity. The Operating Partnership ceases capitalization on the portion substantially completed and occupied or held available for occupancy, and capitalizes only those costs associated with any remaining portion under construction. In March 2012, the Operating Partnership reclassified the majority of construction in progress costs relating to two non-operating properties into the corresponding buildings, site improvements and tenant improvements financial statement line items upon substantial completion of development activities.
Maintenance and repairs expenses are charged to operations as incurred. Costs for major replacements and betterments, which includes HVAC equipment, roofs, parking lots, etc., are capitalized and depreciated over their estimated useful lives. Gains and losses are recognized upon disposal or retirement of the related assets and are reflected in earnings.
Property is recorded at cost and is depreciated using the straight-line method over the estimated lives of the assets as follows:
| Building and improvements |
15 to 40 years | |
| Tenant improvements |
Shorter of the useful lives or the terms of the related leases |
Impairment of Long-Lived Assets and Long-Lived Assets to be Disposed:
The Operating Partnership reviews long-lived assets and certain identifiable intangible assets for impairment whenever events or circumstances indicate that the carrying amount of an asset may not be recoverable. This assessment considers expected future operating income, trends and prospects, as well as the effects of demand, competition and other economic factors. Such factors include the tenants’ ability to perform their duties and pay rent under the terms of the leases. The determination of recoverability is made based upon the estimated undiscounted future net cash flows, excluding interest expense, expected to result from the long-lived asset’s use and eventual disposition. The Operating Partnership’s evaluation as to whether impairment may exist, including estimates of future anticipated cash flows, are highly subjective and could differ materially from actual results in future periods. The amount of impairment loss, if any, is determined by comparing the fair value, as determined by a discounted cash flows analysis, with the carrying value of the related assets. Although the Operating Partnership’s strategy is to hold its properties over a long-term period, if the strategy changes or market conditions dictate that the sale of properties at an earlier date would be preferable, a property may be classified as held for sale and an impairment loss may be recognized to reduce the property to the lower of the carrying amount or fair value less cost to sell. There was no impairment recorded for the three months ended March 31, 2013 (unaudited) or for the years ended December 31, 2012, 2011 or 2010.
97
Table of Contents
Investments in Unconsolidated Entities:
The Operating Partnership evaluates its investments in unconsolidated entities to determine whether such entities may be a VIE and, if a VIE, whether the Operating Partnership is the primary beneficiary. Generally, an entity is determined to be a VIE when either (1) the equity investment at risk is insufficient to finance that entity’s activities without additional subordinated financial support provided by any parties or (2) as a group, the holders of the equity investment lack one or more of the essential characteristics of a controlling financial interest. The primary beneficiary is the entity that has both (1) the power to direct matters that most significantly impact the VIE’s economic performance and (2) the obligation to absorb losses or the right to receive benefits of the VIE that could potentially be significant to the VIE. The Operating Partnership considers a variety of factors in identifying the entity that holds the power to direct matters that most significantly impact the VIE’s economic performance including, but not limited to, the ability to direct financing, leasing, construction and other operating decisions and activities. In addition, the Operating Partnership considers the form of ownership interest, voting interest, the size of the investment (including loans) and the rights of other investors to participate in policy making decisions, to replace or remove the manager and to liquidate or sell the entity. The obligation to absorb losses and the right to receive benefits when a reporting entity is affiliated with a VIE must be based on ownership, contractual, and/or other pecuniary interests in that VIE.
If the foregoing conditions do not apply, the Operating Partnership considers whether a general partner or managing member controls an unconsolidated entity. The general partner in a limited partnership or managing member in a limited liability company is presumed to control that limited partnership or limited liability company. The presumption may be overcome if the limited partners or members have either (1) the substantive ability to dissolve the limited partnership or limited liability company or otherwise remove the general partner or managing member without cause or (2) substantive participating rights, which provide the limited partners or members with the ability to effectively participate in significant decisions that would be expected to be made in the ordinary course of the limited partnership’s or limited liability company’s business and thereby preclude the general partner or managing member from exercising unilateral control over the partnership or company. If these criteria are not met and the Operating Partnership is the general partner or the managing member, as applicable, the consolidation of the unconsolidated entity is required.
Investments over which the Operating Partnership exercises significant influence, but does not control are not consolidated, but are accounted for under the equity method of accounting. These investments are recorded initially at cost and subsequently adjusted for the Operating Partnership’s portion of earnings or losses and for cash contributions and distributions. Under the equity method of accounting, the Operating Partnership’s investment is reflected in the consolidated balance sheets and its unit of net income or loss is included in the consolidated and combined statements of income.
Investments in Equity Securities:
The Operating Partnership may hold investments in equity securities in certain publicly-traded companies. The Operating Partnership does not acquire investments for trading purposes and, as a result, all of the Operating Partnership’s investments in publicly-traded companies are considered “available-for-sale” and are recorded at fair value. Changes in the fair value of investments classified as available-for-sale are recorded in other comprehensive income. The fair value of the Operating Partnership’s equity securities in publicly-traded companies is determined based upon the closing trading price of the equity security as of the balance sheet date. The cost of investments sold is determined by the specific identification method, with net realized gains and losses included in other income. For all investments in equity securities, if a decline in the fair value of an investment below its carrying value is determined to be other-than-temporary, such investment is written down to its estimated fair value with a non-cash charge to earnings. The factors that the Operating Partnership considers in making these assessments include, but are not limited to, severity and duration of the unrealized loss, market prices, market conditions, the occurrence of ongoing financial difficulties, available financing, new product initiatives and new collaborative agreements.
Investments in equity securities, which are included in other assets on the accompanying consolidated balance sheets, consisted of the following (in thousands):
| December 31, | ||||||||||||
| March 31,
2013 (unaudited) |
2012 | 2011 | ||||||||||
| Equity securities, initial cost basis |
$ | — | $ | — | $ | 9,072 | ||||||
| Gross unrealized gains |
— | — | 138 | |||||||||
| Gross unrealized losses |
— | — | (46 | ) | ||||||||
|
|
|
|
|
|
|
|||||||
| Equity securities, fair value(1) |
$ | — | $ | — | $ | 9,164 | ||||||
|
|
|
|
|
|
|
|||||||
| (1) | Determination of fair value is classified as Level 1 in the fair value hierarchy based on the use of quoted prices in active markets (see section entitled “Fair Value of Financial Instruments” that follows herein). |
During the year ended December 31, 2012, the Operating Partnership sold all of its investments in equity securities, comprising 370,692 shares of preferred stock (including 138,157 shares of preferred stock redeemed by the issuing company) based on a specific identification of the shares sold. The sales resulted in net proceeds of approximately $9.4 million and the recognition of a gain on sale of approximately $171,000, which is included in other income in the accompanying consolidated and combined statements of operations.
98
Table of Contents
Share-Based Payments:
All share-based payments to employees are recognized in earnings based on their fair value on the date of grant. Through March 31, 2013 and December 31, 2012, the general partner has awarded only restricted stock awards under its incentive award plan, which are based on shares of the general partner‘s common stock. For each share of common stock the general partner issues pursuant to its equity compensation plans, the Operating Partnership issues a corresponding number of operating partnership units to the general partner. The fair value of equity awards made by the general partner that include only service or performance vesting conditions is determined based on the closing market price of the underlying common stock on the date of grant. The fair value of equity awards that include one or more market vesting conditions is determined based on the use of a widely accepted valuation model. The fair value of equity grants is amortized to general and administrative expense ratably over the requisite service period for awards that include only service vesting conditions and utilizing a graded vesting method (an accelerated vesting method in which the majority of compensation expense is recognized in earlier periods) for awards that include one or more performance or market vesting conditions, adjusted for anticipated forfeitures.
Mortgage Loan Receivables:
Mortgage loan receivable consists of loans originated by the Operating Partnership. Mortgage loan receivables are recorded at stated principal amounts net of any discount or premium or deferred loan origination costs or fees. The related discounts or premiums on mortgage loan receivables are amortized or accreted over the life of the related loan receivable. The Operating Partnership defers certain loan origination and commitment fees, net of certain origination costs and amortizes them as an adjustment of the loan’s yield over the term of the related loan. The Operating Partnership evaluates the collectability of both interest and principal on each loan to determine whether it is impaired. A loan is considered to be impaired, when based upon current information and events, it is probable that the Operating Partnership will be unable to collect all amounts due according to the existing contractual terms. When a loan is considered to be impaired, the amount of loss is calculated by comparing the recorded receivable to the value determined by discounting the expected future cash flows at the loan’s effective interest rate or to the value of the underlying collateral if the loan is collateralized. Interest income on performing loans is accrued as earned. Interest income on impaired loans is recognized on a cash basis.
Purchase Accounting:
The Operating Partnership, with the assistance of independent valuation specialists, records the purchase price of acquired properties to tangible and identified intangible assets and liabilities based on their respective fair values. Tangible assets (building and land) are recorded based upon the Operating Partnership’s determination of the value of the property as if it were vacant using discounted cash flow models similar to those used by independent appraisers. Factors considered include an estimate of carrying costs during the expected lease-up periods taking into account current market conditions and costs to execute similar leases. The fair value of land is derived from comparable sales of land within the same submarket and/or region. The fair value of buildings and improvements, tenant improvements, site improvements and leasing costs are based upon current market replacement costs and other relevant market rate information. Additionally, the purchase price of the applicable property is recorded to the above—or below-market value of in-place leases, the value of in-place leases and above—or below-market value of debt assumed, as applicable.
The value recorded to the above—or below-market component of the acquired in-place leases is determined based upon the present value (using a discount rate which reflects the risks associated with the acquired leases) of the difference between: (1) the contractual amounts to be paid pursuant to the lease over its remaining term, and (2) the Operating Partnership’s estimate of the amounts that would be paid using fair market rates over the remaining term of the lease. The amounts recorded to above-market leases are included in lease intangible assets, net in the Operating Partnership’s accompanying consolidated balance sheets and amortized to rental income over the remaining non-cancelable lease term of the acquired leases with each property. The amounts recorded to below-market lease values are included in lease intangible liabilities, net in the Operating Partnership’s accompanying consolidated balance sheets and amortized to rental income over the remaining non-cancelable lease term plus any below-market fixed price renewal options of the acquired leases with each property.
The value recorded to above—or below-market debt is determined based upon the present value of the difference between the cash flow stream of the assumed mortgage and the cash flow stream of a market rate mortgage. The amounts recorded to above—or below-market debt are included in mortgage payables, net in the Operating Partnership’s accompanying consolidated balance sheets and are amortized to interest expense over the remaining term of the assumed mortgage.
99
Table of Contents
Tenant receivables:
Tenant receivables and deferred rent are carried net of the allowances for uncollectible current tenant receivables and deferred rent. An allowance is maintained for estimated losses resulting from the inability of certain tenants to meet the contractual obligations under their lease agreements. The Operating Partnership maintains an allowance for deferred rent receivable arising from the straight-lining of rents. Such allowance is charged to bad debt expense, which is included in other operating expenses on the accompanying consolidated and combined statements of operations. The Operating Partnership’s determination of the adequacy of these allowances is based primarily upon evaluations of historical loss experience, the tenant’s financial condition, security deposits, letters of credit, lease guarantees, current economic conditions and other relevant factors. At March 31, 2013 (unaudited), December 31, 2012 and December 31, 2011, the Operating Partnership had $877,000, $719,000 and $631,000, respectively, in allowances for uncollectible accounts as determined to be necessary to reduce receivables to the estimate of the amount recoverable. During the three months ended March 31, 2013 and 2012 (unaudited), the years ended December 31, 2012 and 2011 and for the periods from April 28, 2010 to December 31, 2010 and January 1, 2010 to April 27, 2010, $337,000, $247,000, $690,000, $800,000, $348,000 and $16,000, respectively, of receivables were charged to bad debt expense.
Non-controlling Interests
Non-controlling interest represents the portion of equity that the Operating Partnership does not own in those entities it consolidates. Equity interests not held by the Operating Partnership are reflected as non-controlling interests in the Operating Partnership’s consolidated and combined financial statements.
Concentration of Risk:
The Operating Partnership maintains its cash accounts in a number of commercial banks. Accounts at these banks are guaranteed by the Federal Deposit Insurance Corporation (“FDIC”) up to $250,000. At various times during the periods, the Operating Partnership and ETP had deposits in excess of the FDIC insurance limit.
In the three months ended March 31, 2013 (unaudited), in the years ended December 31, 2012 and 2011 and in the period from April 28, 2010 to December 31, 2010, no tenant accounted for more than 10% of the Operating Partnership’s revenues. In the period from January 1, 2010 to April 27, 2010, one tenant accounted for 29.1% of the Predecessor’s revenues.
At March 31, 2013 (unaudited), the Operating Partnership’s gross real estate assets in the states of California, Arizona and Virginia represented approximately 22.1%, 18.3% and 16.1% of the Operating Partnership’s total assets, respectively. At December 31, 2012, the Operating Partnership’s gross real estate assets in the states of Arizona, California and Virginia represented approximately 16.6%, 16.5% and 14.6% of the Operating Partnership’s total assets, respectively. For the three months ended March 31, 2013 (unaudited), the Operating Partnership’s revenues derived from properties located in the states of California, Arizona, Virginia and Texas represented approximately 20.5%, 19.0%, 11.9% and 11.0% of the Operating Partnership’s total revenues, respectively. For the year ended December 31, 2012, the Operating Partnership’s revenues derived from properties located in the states of California, Arizona, Texas and Alabama represented approximately 24.7%, 22.1%, 10.5% and 10.2% of the Operating Partnership’s total revenues, respectively.
Management Estimates:
The preparation of financial statements in conformity with generally accepted accounting principles (“GAAP”) requires management to make estimates and assumptions that affect the reported amounts of assets and liabilities and disclosure of contingent assets and liabilities at the date of the financial statements and the reported amounts of revenues and expenses during the reporting period. Actual results could differ from those estimates.
Fair Value of Financial Instruments:
The Operating Partnership measures financial instruments and other items at fair value where required under GAAP, but has elected not to measure any additional financial instruments and other items at fair value as permitted under fair value option accounting guidance.
Fair value measurement is determined based on the assumptions that market participants would use in pricing the asset or liability. As a basis for considering market participant assumptions in fair value measurements, there is a fair value hierarchy that distinguishes between market participant assumptions based on market data obtained from sources independent of the reporting entity (observable inputs that are classified within Levels 1 and 2 of the hierarchy) and the reporting entity’s own assumptions about market participant assumptions (unobservable inputs classified within Level 3 of the hierarchy).
100
Table of Contents
Level 1 inputs utilize quoted prices in active markets for identical assets or liabilities that the Operating Partnership has the ability to access. Level 2 inputs are inputs other than quoted prices included in Level 1 that are observable for the asset or liability, either directly or indirectly. Level 2 inputs may include quoted prices for similar assets and liabilities in active markets, as well as inputs that are observable for the asset or liability (other than quoted prices), such as interest rates, foreign exchange rates and yield curves that are observable at commonly quoted intervals. Level 3 inputs are unobservable inputs for the assets or liabilities, which are typically based on an entity’s own assumptions, as there is little, if any, related market activity. In instances where the determination of the fair value measurement is based on inputs from different levels of the fair value hierarchy, the level in the fair value hierarchy within which the entire fair value measurement falls is based on the lowest level input that is significant to the fair value measurement in its entirety.
The Operating Partnership’s assessment of the significance of a particular input to the fair value measurement in its entirety requires judgment, and considers factors specific to the asset or liability.
The Operating Partnership has used interest rate swaps to manage its interest rate risk (see Note 11). The valuation of these instruments is determined using widely accepted valuation techniques, including discounted cash flow analysis on the expected cash flows of each derivative. This analysis reflects the contractual terms of the derivatives, including the period to maturity, and uses observable market-based inputs, including interest rate curves. The fair values of interest rate swaps are determined using the market standard methodology of netting the discounted future fixed cash receipts (or payments) and the discounted expected variable cash payments (or receipts). The variable cash payments (or receipts) are based on an expectation of future interest rates (forward curves) derived from observable market interest rate curves. The Operating Partnership incorporates credit valuation adjustments to appropriately reflect both its own nonperformance risk and the respective counterparty’s nonperformance risk in the fair value measurements. In adjusting the fair value of its derivative contracts for the effect of nonperformance risk, the Operating Partnership has considered the impact of netting and any applicable credit enhancements, such as collateral postings, thresholds, mutual puts and guarantees.
Although the Operating Partnership has determined that the majority of the inputs used to value its derivatives classified as cash flow hedges fall within Level 2 of the fair value hierarchy, the credit valuation adjustments associated with its derivatives utilize Level 3 inputs, such as estimates of current credit spreads to evaluate the likelihood of default by itself and its counterparties. However, as of December 31, 2012, the Operating Partnership has determined that the impact of the credit valuation adjustments on the overall valuation of its derivative positions is not significant. As a result, the Operating Partnership has determined that its valuations related to derivatives classified as cash flow hedges in their entirety are classified in Level 2 of the fair value hierarchy (see Note 18).
Changes in the fair value of financial instruments (other than derivative instruments for which an effective hedging relationship exists and available-for-sale securities) are recorded as a charge against earnings in the consolidated and combined statements of operations in the period in which they occur. The Operating Partnership estimates the fair value of financial instruments at least quarterly based on current facts and circumstances, projected cash flows, quoted market prices, and other criteria (primarily utilizing Level 3 inputs). The Operating Partnership may also utilize the services of independent third-party valuation experts to estimate the fair value of financial instruments, as necessary.
The Operating Partnership’s investments in equity securities fall within Level 1 of the fair value hierarchy as the Operating Partnership utilizes observable market-based inputs, based on the closing trading price of securities as of the balance sheet date, to determine the fair value of the investments.
Derivative Instruments:
The Operating Partnership is exposed to certain risk arising from both its business operations and economic conditions. The Operating Partnership principally manages its exposures to a wide variety of business and operational risks through management of its core business activities. The Operating Partnership manages economic risks, including interest rate, liquidity, and credit risk primarily by managing the amount, sources, and duration of its debt funding and the use of derivative financial instruments. Specifically, from time to time the Operating Partnership enters into derivative financial instruments to manage exposures that arise from business activities that result in the receipt or payment of future known and uncertain cash amounts, the value of which are determined by interest rates. The Operating Partnership’s derivative financial instruments are used to manage differences in the amount, timing, and duration of the Operating Partnership’s known or expected cash receipts and its known or expected cash payments principally related to the Operating Partnership’s investments and borrowings.
In addition, from time to time the Operating Partnership may execute agreements in connection with business combinations that include embedded derivative instruments as part of the consideration provided to the sellers of the properties. Although these embedded derivative instruments are not intended as hedges of risks faced by the Operating Partnership, they can provide additional consideration to the Operating Partnership’s selling counterparties and may be a key component of negotiations.
101
Table of Contents
The Operating Partnership’s objectives in using interest rate derivatives are to add stability to interest expense and to manage its exposure to interest rate movements. To accomplish this objective, the Operating Partnership primarily uses interest rate swaps as part of its interest rate risk management strategy. Interest rate swaps designated as cash flow hedges involve the receipt of variable amounts from a counterparty in exchange for the Operating Partnership making fixed-rate payments over the life of the agreements without exchange of the underlying notional amount.
The Operating Partnership records all derivative instruments on the consolidated balance sheets at their fair value. In determining the fair value of derivative instruments, the Operating Partnership also considers the credit risk of its counterparties, which typically constitute larger financial institutions engaged in providing a wide variety of financial services. These financial institutions generally face similar risks regarding changes in market and economic conditions, including, but not limited to, changes in interest rates, exchange rates, equity and commodity pricing and credit spreads.
Accounting for changes in the fair value of derivative instruments depends on the intended use of the derivative, whether it has been designated as a hedging instrument and whether the hedging relationship has continued to satisfy the criteria to apply hedge accounting. For derivative instruments qualifying as cash flow hedges, the effective portion of changes in the fair value is initially recorded in Accumulated Other Comprehensive Income and is subsequently reclassified into earnings in the period that the hedged forecasted transaction affects earnings. The ineffective portion of the change in fair value of the derivatives is recognized directly in earnings. The Operating Partnership assesses the effectiveness of each hedging relationship by comparing the changes in the cash flows of the derivative hedging instrument with the changes in the cash flows of the hedged item or transaction.
The Operating Partnership formally documents the hedging relationship for all derivative instruments, has accounted for its interest rate swap agreements as cash flow hedges and does not utilize derivative instruments for trading or speculative purposes.
Recent Accounting Pronouncements:
In May 2011, the Financial Accounting Standards Board (the “FASB”) issued Accounting Standards Update (“ASU”) No. 2011-04, Amendment to Achieve Common Fair Value Measurement and Disclosure Requirements in U.S. GAAP and IFRSs (“ASU 2011-04”), which amended Accounting Standards Codification Topic 820, Fair Value Measurement. The objective of this guidance is to develop common requirements for measuring fair value and for disclosing information about fair value measurements in accordance with GAAP and International Financial Reporting Standards. The guidance further explains how to measure fair value, but does not require additional fair value measurements. ASU 2011-04 is to be applied prospectively for fiscal years and interim periods within those years beginning after December 15, 2011. The Operating Partnership’s adoption of this guidance effective January 1, 2012 resulted in additional disclosures in the notes to the Operating Partnership’s consolidated and combined financial statements, but did not have a material quantitative effect.
In July 2012, the FASB issued ASU No. 2012-02, Testing Indefinite-Lived Intangible Assets for Impairment (“ASU 2012-02”). The amendments in this update provide an entity with the option to make a qualitative assessment about the likelihood that an indefinite-lived intangible asset is impaired to determine whether it should perform a quantitative impairment test. ASC 2012-02 is effective for fiscal years and interim periods beginning after September 15, 2012. The adoption of ASU 2012-02 on January 1, 2013 did not have a material impact on the Operating Partnership’s condensed consolidated financial position or results of operations.
In January 2013, the FASB issued ASU No. 2013-02, Reporting of Amounts Reclassified Out of Accumulated Other Comprehensive Income (“ASU 2013-02”). The amendments in this update require an entity to provide information about the amounts reclassified from accumulated other comprehensive income by component. In addition, an entity is required to present, either on the face of the income statement or in the notes, significant amounts reclassified from accumulated other comprehensive income by the net income line item. The adoption of ASU 2013-02 on January 1, 2013 did not have a material impact on the Operating Partnership’s consolidated financial position or results of operations.
3. Acquisitions
The Operating Partnership completed one acquisition (in the Retail property operating segment) in the three months ended March 31, 2013 (unaudited), which was acquired for cash unless specified below (in thousands):
| Consolidated Property |
Date Acquired | Location | Debt Assumed |
|||||||||
| Tracy Pavilion |
January 24, 2013 | Tracy, CA | $ | — | ||||||||
102
Table of Contents
The following provides a summary of the recorded purchase price for the above acquisition (dollars in thousands).
| Consolidated Property |
Building | Land | Above-Market Lease |
Below-Market Lease |
In-Place Lease |
Debt (Premium)/ Discount |
Other | Purchase Price |
||||||||||||||||||||||||
| Tracy Pavilion |
$ | 22,611 | $ | 6,193 | $ | 163 | $ | (1,136 | ) | $ | 2,907 | $ | — | $ | — | $ | 30,738 | |||||||||||||||
|
|
|
|
|
|
|
|
|
|
|
|
|
|
|
|
|
|||||||||||||||||
| Total |
$ | 22,611 | $ | 6,193 | $ | 163 | $ | (1,136 | ) | $ | 2,907 | $ | — | $ | — | $ | 30,738 | |||||||||||||||
|
|
|
|
|
|
|
|
|
|
|
|
|
|
|
|
|
|||||||||||||||||
| Remaining useful life(1) |
54 | 95 | 62 | |||||||||||||||||||||||||||||
| (1) | Weighted-average remaining useful life (months) for recorded intangible assets and liabilities as of the date of acquisition. |
The Operating Partnership completed twelve acquisitions (primarily in the Retail property operating segment) in the year ended December 31, 2012, which were acquired for cash unless specified below (in thousands):
| Consolidated Property |
Date Acquired | Location | Debt Assumed |
|||||||||
| Promenade Corporate Center |
January 23, 2012 | Scottsdale, AZ | $ | — | ||||||||
| EastChase Market Center |
February 17, 2012 | Montgomery, AL | — | |||||||||
| Lake Pleasant Pavilion |
May 16, 2012 | Peoria, AZ | 28,250 | |||||||||
| Chimney Rock |
August 30, 2012 | Odessa, TX | — | |||||||||
| Pavilion Crossing |
October 1, 2012 | Brandon, FL | — | |||||||||
| Dellagio(2) |
October 19, 2012 | Orlando, FL | — | |||||||||
| Lake Burden Shoppes(1) |
October 19, 2012 | Orlando, FL | — | |||||||||
| Meadow Ridge Plaza(1) |
October 19, 2012 | Orlando, FL | — | |||||||||
| Shoppes of Belmere(1) |
October 19, 2012 | Orlando, FL | — | |||||||||
| West Broad Village(1) |
October 19, 2012 | Richmond, VA | 50,000 | |||||||||
| Unconsolidated Property |
Date Acquired | Location | Debt Assumed |
|||||||||
| La Costa Town Center(2) |
February 29, 2012 | Carlsbad, CA | — | |||||||||
| The Fountains at Bay Hill(1) |
October 19, 2012 | Orlando, FL | 11,985 | |||||||||
The following provides a summary of the recorded purchase price for the 2012 acquisitions (dollars in thousands).
| Consolidated Property |
Building | Land | Above-Market Lease |
Below-Market Lease |
In-Place Lease |
Debt (Premium)/ Discount |
Other | Purchase Price |
||||||||||||||||||||||||
| Promenade Corporate Center(3) |
$ | 44,465 | $ | 4,477 | $ | 781 | $ | (749 | ) | $ | 3,279 | $ | — | $ | — | $ | 52,253 | |||||||||||||||
| EastChase Market Center |
19,567 | 4,215 | 360 | (1,296 | ) | 1,804 | — | — | 24,650 | |||||||||||||||||||||||
| Lake Pleasant Pavilion |
28,127 | 9,958 | 2,857 | (184 | ) | 2,412 | (1,420 | ) | — | 41,750 | ||||||||||||||||||||||
| Chimney Rock(4) |
14,089 | 7,368 | — | (2,291 | ) | 2,532 | — | 2,106 | 23,804 | |||||||||||||||||||||||
| Pavilion Crossing |
9,268 | 3,729 | 153 | (1,344 | ) | 1,490 | — | — | 13,296 | |||||||||||||||||||||||
| Dellagio(5) |
20,501 | 16,610 | 1,264 | (2,536 | ) | 4,265 | — | — | 40,104 | |||||||||||||||||||||||
| Lake Burden Shoppes(5) |
4,020 | 3,981 | — | (79 | ) | 601 | — | — | 8,523 | |||||||||||||||||||||||
| Meadow Ridge Plaza(5) |
4,853 | 3,970 | 355 | (251 | ) | 802 | — | — | 9,729 | |||||||||||||||||||||||
| Shoppes of Belmere(5) |
5,122 | 4,701 | 166 | (1,160 | ) | 864 | — | — | 9,693 | |||||||||||||||||||||||
| West Broad Village(5)(6) |
138,575 | 24,339 | 2,375 | (6,434 | ) | 10,049 | — | 2,398 | 171,302 | |||||||||||||||||||||||
|
|
|
|
|
|
|
|
|
|
|
|
|
|
|
|
|
|||||||||||||||||
| Total |
$ | 288,587 | $ | 83,348 | $ | 8,311 | $ | (16,324 | ) | $ | 28,098 | $ | (1,420 | ) | $ | 4,504 | $ | 395,104 | ||||||||||||||
|
|
|
|
|
|
|
|
|
|
|
|
|
|
|
|
|
|||||||||||||||||
| Remaining useful life(7) |
76 | 169 | 105 | 65 | ||||||||||||||||||||||||||||
| Unconsolidated Property |
Building | Land | Above-Market Lease |
Below-Market Lease |
In-Place Lease |
Debt (Premium)/ Discount |
Other | Purchase Price |
||||||||||||||||||||||||
| La Costa Town Center(2) |
$ | 15,054 | $ | 8,383 | $ | 86 | $ | (2,069 | ) | $ | 2,046 | $ | — | $ | — | $ | 23,500 | |||||||||||||||
| The Fountains at Bay Hill(5) (8) |
9,029 | 9,905 | 249 | (1,030 | ) | 1,653 | — | — | 19,806 | |||||||||||||||||||||||
|
|
|
|
|
|
|
|
|
|
|
|
|
|
|
|
|
|||||||||||||||||
| Total |
$ | 24,083 | $ | 18,288 | $ | 335 | $ | (3,099 | ) | $ | 3,699 | $ | — | $ | — | $ | 43,306 | |||||||||||||||
|
|
|
|
|
|
|
|
|
|
|
|
|
|
|
|
|
|||||||||||||||||
| Remaining useful life(7) |
34 | 106 | 55 | |||||||||||||||||||||||||||||
| (1) | On October 19, 2012, the Operating Partnership completed the acquisition of a portfolio of five retail shopping centers and a 50% tenant-in-common interest in a sixth retail shopping center (an unconsolidated property, The Fountains at Bay Hill), which |
103
Table of Contents
| are located in Florida and Virginia. The purchase price of $259.2 million includes $192.1 million in cash paid, the assumption of $62.0 million in mortgage notes (including $12.0 million at The Fountains at Bay Hill) and the issuance of 411,184 common OP units with a fair value of approximately $5.1 million based on a closing price of $12.36 per share of the general partner‘s common stock on the date of acquisition. |
Five of the shopping centers are located in Orange County, Florida and comprise a total of approximately 319,000 square feet of gross leasable area (“GLA”) (the shopping center in which the Operating Partnership has a 50% tenant-in-common interest comprises approximately 104,000 square feet of GLA). The sixth retail shopping center is located in Richmond, Virginia and comprises approximately 386,000 square feet of retail and commercial GLA, with an additional 339 apartment units on the
upper levels of the shopping center. The Operating Partnership has an agreement to purchase the remaining 50% tenant-in-common interest in the Florida shopping center if certain approvals are obtained. The Operating Partnership’s proportionate share of the assets purchased and liabilities and debt assumed with the acquisition of The Fountains at Bay Hill property are reflected on the accompanying consolidated balance sheets as an investment in unconsolidated entities (for more details, see Note 14).
In connection with the acquisition of one of the Florida properties, the Operating Partnership entered into a put option whereby it may resell the property to the former owner after a period of five years for a price equal to the original purchase price. The Operating Partnership has estimated the asset to have a value of approximately $354,000 (unaudited) based on the fair value of the put option on the date of acquisition. In addition, the Operating Partnership has entered into a call option related to the acquisition of another Florida property whereby the former owner may purchase approximately 13,000 square feet of GLA currently utilized as its headquarters during a three-year period. The Operating Partnership will account for the underlying lease as a direct finance lease and will continue to reflect the corresponding premises as leased and occupied until such time as the call option is exercised by the former owner. In connection with the acquisition, the value associated with the acquired building has been recorded net of the estimated fair value of the call option of $4.3 million.
| (2) | In September 2012, the La Costa Town Center property was contributed in exchange for proceeds of approximately $21.2 million to a newly-formed entity, La Costa LLC, in which the Operating Partnership holds a 20% ownership interest (see Note 14). The Operating Partnership accounts for its remaining equity ownership in the property in a manner similar to the equity method of accounting, which is reflected in the accompanying consolidated balance sheets as an investment in unconsolidated entities. |
| (3) | The purchase price of $52.3 million reflects $13.9 million in cash paid and the issuance of 3,230,769 shares of the general partner’s common stock (the Operating Partnership issued a corresponding number of common OP units to the general partner) with a fair value of approximately $39.1 million based on a closing price of $12.11 per share of the general partner’s common stock on the date of acquisition. The purchase price noted above is net of master lease agreements between the Operating Partnership and the seller in the amount of $772,000 (included in other assets on the accompanying consolidated balance sheets) based on the estimated fair value of funds expected to be received from escrow in connection with the acquisition. Payments under the master lease agreements commence upon the expiration of two existing leases in June 2012 and February 2013 (with terms through May 2013 and January 2015, respectively) unless the related spaces are re-leased with base rents equaling or exceeding the master lease payments. In addition, the seller has agreed to reimburse the Operating Partnership for any expenditures resulting from tenant improvements or leasing commissions related to the spaces to the extent that funds remain available pertaining to the master lease agreements. See Note 18 for a discussion of changes in the fair value of this asset after the initial acquisition. |
| (4) | The purchase price of $23.8 million noted above includes a long-term asset recognized at acquisition with a valuation of approximately $3.0 million (included in other assets) and a long-term liability with a preliminary valuation of approximately $906,000 (included in accounts payable and other liabilities). The long-term asset and the long-term liability reflect the estimated fair value of funds expected to be received pursuant to an economic development agreement executed between the previous owner of the property and the City of Odessa and the portion of such funds that is owed to a third party. As a result of the agreement, the Operating Partnership is eligible to receive a refund of up to $5.1 million in municipal sales taxes generated by retail sales at the property over a period of up to 15 years. Both the long-term asset and the long-term liability will be accreted to their respective gross balances of $5.1 million and $1.0 million, respectively, over periods of 14 years and three years, respectively. |
| (5) | As of December 31, 2012, the purchase price allocation related to the acquisition of these properties was preliminary. However, as of March 31, 2013 the Operating Partnership had completed the valuation of the related assets and liabilities and the final purchase price allocation with the exception of one item as noted below. |
| (6) | Amount indicated as other for the West Broad Village acquisition includes approximately $2.4 million of furniture, fixtures and equipment associated with 339 apartment units on the property. |
| (7) | Weighted-average remaining useful life (months) for recorded intangible assets and liabilities as of the date of acquisition. |
| (8) | Amount of assets acquired and liabilities assumed for The Fountains at Bay Hill property reflect the Operating Partnership’s 50% tenant-in-common interest in the property. These balances, as well as the Operating Partnership’s $12.0 million proportionate share of the outstanding indebtedness at the property, are reflected as investment in unconsolidated entities on the accompanying consolidated balance sheets. |
104
Table of Contents
The Operating Partnership completed six acquisitions in the year ended December 31, 2011, which were acquired for cash unless specified below (in thousands):
| Property |
Date Acquired | Location | Debt Assumed |
|||||
| Edwards Theatres |
March 11, 2011 | San Marcos, CA | $ | 12,418 | ||||
| Rite Aid(1) |
March 22, 2011 | Vestavia Hills, AL | 1,452 | |||||
| Gilroy Crossing |
April 5, 2011 | Gilroy, CA | 48,009 | |||||
| The Promenade |
July 11, 2011 | Scottsdale, AZ | 52,150 | |||||
| Anthem Highlands |
December 1, 2011 | Las Vegas, NV | — | |||||
| The Crossings of Spring Hill |
December 19, 2011 | Spring Hill, TN | — | |||||
The following provides a summary of the recorded purchase price for the 2011 acquisitions (dollars in thousands).
| Building | Land | Above-Market Lease |
Below-Market Lease |
In-Place Lease |
Debt (Premium)/ Discount |
Purchase Price |
||||||||||||||||||||||
| Edwards Theatres(1) |
$ | 13,600 | $ | 10,283 | $ | — | $ | (405 | ) | $ | 3,109 | $ | (437 | ) | $ | 26,150 | ||||||||||||
| Rite Aid(2) |
1,474 | 550 | — | — | 347 | — | 2,371 | |||||||||||||||||||||
| Gilroy Crossing |
39,890 | 22,520 | 620 | (3,038 | ) | 8,442 | — | 68,434 | ||||||||||||||||||||
| The Promenade |
47,202 | 51,024 | 4,500 | (3,879 | ) | 11,178 | — | 110,025 | ||||||||||||||||||||
| Anthem Highlands |
9,819 | 5,929 | 1,028 | (186 | ) | 910 | — | 17,500 | ||||||||||||||||||||
| The Crossings of Spring Hill |
23,196 | 5,103 | 106 | (1,039 | ) | 3,634 | — | 31,000 | ||||||||||||||||||||
|
|
|
|
|
|
|
|
|
|
|
|
|
|
|
|||||||||||||||
| Total |
$ | 135,181 | $ | 95,409 | $ | 6,254 | $ | (8,547 | ) | $ | 27,620 | $ | (437 | ) | $ | 255,480 | ||||||||||||
|
|
|
|
|
|
|
|
|
|
|
|
|
|
|
|||||||||||||||
| Remaining useful life(3) |
67 | 96 | 70 | 35 | ||||||||||||||||||||||||
| (1) | In addition to the cash consideration paid in connection with the acquisition, 764,343 common OP units were issued with a fair value of $11.82 per unit at the time of issuance (based on the closing price of the general partner’s common stock on the date of issuance). These common OP units are redeemable for cash or, at the general partner’s election, for shares of the general partner’s common stock (an equivalent number of common OP units would be issued for every share of the general partner’s common stock). If the redemption takes place during the period from March 2012 through March 2013 and the price of shares of the general partner’s common stock is less than $14.00 per share at the date of redemption, the general partner must issue additional shares of its common stock or cash for the difference (an equivalent number of common OP units would be issued for every share of the general partner’s common stock). The Operating Partnership originally recorded a liability of approximately $4.2 million within accounts payable and other liabilities on the accompanying consolidated balance sheets to reflect the estimated fair value of this redemption provision (see Note 18 for a discussion of changes in the fair value of this liability and common OP unit redemptions occurring after the initial acquisition). |
| (2) | Rite Aid is an outparcel to Vestavia Hills City Center and not considered to be a separate property. A gain of $937,000 was recognized on the acquisition of this property, which represented the difference between the fair value at the date of closing and the price paid. |
| (3) | Weighted-average remaining useful life (months) for recorded intangible assets and liabilities as of the date of acquisition. |
The Operating Partnership completed 19 acquisitions in the year ended December 31, 2010, which were acquired for cash unless specified below (in thousands):
| Property |
Date Acquired | Location | Debt Assumed |
|||||
| 500 South Hulen |
May 12, 2010 | Fort Worth, TX | $ | 14,200 | ||||
| Jewel-Osco |
May 14, 2010 | Morris, IL | — | |||||
| Walgreens (North Corbin) |
May 24, 2010 | Corbin, KY | — | |||||
| Walgreens (South Corbin) |
May 24, 2010 | Corbin, KY | — | |||||
| Walgreens (Barbourville) |
May 24, 2010 | Barbourville, KY | — | |||||
| Shop’n Save |
May 28, 2010 | Ballwin, MO | — | |||||
| Walgreens (Beckley) |
June 17, 2010 | Beckley, WV | — | |||||
| Lowe’s |
June 22, 2010 | Shippensburg, PA | 14,300 | |||||
| Plaza at Rockwall |
June 29, 2010 | Rockwall, TX | — | |||||
| Merchant Central |
June 30, 2010 | Milledgeville, GA | 4,700 | |||||
| Mariner’s Point |
July 20, 2010 | St. Mary’s, GA | 3,500 | |||||
| Grant Creek Town Center |
August 27, 2010 | Missoula, MT | 16,200 | |||||
| Vestavia Hill City Center |
August 30, 2010 | Vestavia Hills, AL | — | |||||
| Brandywine Crossing |
October 1, 2010 | Brandywine, MD | — | |||||
105
Table of Contents
| Property |
Date Acquired | Location | Debt Assumed |
|||||
| Rosewick Crossing |
October 1, 2010 | La Plata, MD | — | |||||
| Shops at Foxwood |
October 19, 2010 | Ocala, FL | — | |||||
| Walgreens (Princeton) |
October 28, 2010 | Princeton, WV | — | |||||
| Northside Plaza |
November 15, 2010 | Dothan, AL | — | |||||
| Park West Place |
December 14, 2010 | Stockton, CA | — | |||||
The following provides a summary of the recorded purchase price for the 2010 acquisitions (dollars in thousands).
| Building | Land | Above-Market Lease |
Below-Market Lease |
In-Place Lease |
Debt (Premium)/ Discount |
Purchase Price |
||||||||||||||||||||||
| Plaza at Rockwall |
$ | 21,247 | $ | 14,941 | $ | 78 | $ | (2,306 | ) | $ | 6,791 | $ | — | $ | 40,751 | |||||||||||||
| Vestavia Hills City Center |
18,955 | 7,806 | 1,346 | (635 | ) | 5,917 | — | 33,389 | ||||||||||||||||||||
| Brandywine Crossing |
18,621 | 20,047 | 752 | (518 | ) | 5,532 | — | 44,434 | ||||||||||||||||||||
| Park West Place |
37,991 | 41,287 | 4,102 | (978 | ) | 10,098 | — | 92,500 | ||||||||||||||||||||
| Other Property Acquisitions |
88,064 | 54,220 | 1,811 | (2,666 | ) | 19,043 | 1,167 | 161,639 | ||||||||||||||||||||
|
|
|
|
|
|
|
|
|
|
|
|
|
|
|
|||||||||||||||
| Total |
$ | 184,878 | $ | 138,301 | $ | 8,089 | $ | (7,103 | ) | $ | 47,381 | $ | 1,167 | $ | 372,713 | |||||||||||||
|
|
|
|
|
|
|
|
|
|
|
|
|
|
|
|||||||||||||||
| Remaining useful life(1) |
86 | 122 | 105 | 76 | ||||||||||||||||||||||||
| (1) | Weighted-average remaining useful life (months) for recorded intangible assets and liabilities as of the date of acquisition. |
The Operating Partnership recorded revenues and a net loss for the three months ended March 31, 2013 (unaudited) of $549,000 and $2,000, respectively, related to the 2013 acquisition. The Operating Partnership recorded revenues and net income for the year ended December 31, 2012 of $15.7 million and $1.3 million, respectively, related to the 2012 acquisitions. The Operating Partnership recorded revenues and net income for the year ended December 31, 2011 of $13.1 million and $158,000 respectively, related to the 2011 acquisitions. The Operating Partnership recorded revenues and a net loss for the period from April 28, 2010 to December 31, 2010 of $10.9 million and $434,000 respectively, related to the 2010 acquisitions (excluding the six properties acquired in 2010 and subsequently sold in June 2011, which are reflected in discontinued operations in the accompanying consolidated and combined statements of operations — see Note 13).
At March 31, 2013, the allocation of purchase price to tangible and intangible assets for all 2012 and 2013 acquisitions had been completed with the exception of one item pertaining to the Operating Partnership’s acquisition of the West Broad Village property. In connection with the acquisition of this property, the Operating Partnership received a credit at closing in the amount of $450,000 (recorded as a liability) representing the estimated amount due to the property’s tenants for prior periods in which the landlord had not yet completed a reconciliation of common area maintenance expenses. The seller has not provided the Operating Partnership with the information necessary to complete the reconciliations as of March 31, 2013, but the Operating Partnership expects to receive the necessary information prior to June 30, 2013.
The following unaudited pro forma information for the three months ended March 31, 2013 and 2012 has been prepared to reflect the incremental effect of the property acquired in 2013 as if such acquisition had occurred on January 1, 2012 (unaudited – in thousands).
| Three Months Ended March 31, | ||||||||
| 2013 | 2012 | |||||||
| Revenues |
$ | 27,722 | $ | 21,301 | ||||
| Net income(1) |
140 | (150 | ) | |||||
| (1) | Pro forma results for the three months ended March 31, 2013 were adjusted to exclude non-recurring acquisition costs of approximately $47,000 related to the 2013 acquisition. The pro forma results for the three months ended March 31, 2012 were adjusted to include these costs relating to the 2013 acquisitions. |
106
Table of Contents
The following unaudited pro forma information for the years ended December 31, 2012, 2011, and 2010 has been prepared to reflect the incremental effect of the properties as if the 2012 acquisitions were acquired on January 1, 2011, the 2011 acquisitions were acquired on January 1, 2010, and the 2010 acquisitions were acquired on January 1, 2009 (unaudited – in thousands).
| Years Ended December 31, | ||||||||||||
| 2012 | 2011 | 2010 | ||||||||||
| Revenues |
$ | 106,053 | $ | 104,249 | $ | 63,311 | ||||||
| Net income(1) |
3,431 | 6,142 | 2,670 | |||||||||
| (1) | The pro forma results for the year ended December 31, 2012 was adjusted to exclude non-recurring acquisition costs relating to the 2012 acquisitions of approximately $919,000. The pro forma results for the year ended December 31, 2011 were adjusted to include the non-recurring acquisition costs related to the 2012 acquisitions of $919,000, but exclude non-recurring acquisition costs related to the 2011 acquisitions of $805,000. The pro forma results for the year ended December 31, 2010 were adjusted to include the non-recurring acquisition costs related to the 2011 acquisitions of $805,000, but exclude non-recurring acquisition costs related to the 2010 acquisitions of $1.6 million. A portion of the 2012 acquisitions were funded by proceeds from the Series B preferred stock offering and a portion of the 2011 acquisitions were funded by proceeds from the Series A preferred stock offering (discussed in Note 12 below). However, pro forma net income for the years ended December 31, 2012 and 2011 is not adjusted for this funding as the assumed Series A and Series B preferred stock quarterly distributions of approximately $875,000 and $1.9 million, respectively, are not included in the determination of net income (this funding is included only as a reduction of net income (loss) attributable to the unitholders). |
4. Lease Intangible Assets, Net
Lease intangible assets, net consisted of the following at March 31, 2013 (unaudited), December 31, 2012 and December 31, 2011 (in thousands):
| March 31, 2013 (unaudited) |
December 31, 2012 |
December 31, 2011 |
||||||||||
| In-place leases, net of accumulated amortization of $22.8 million, $20.7 million and $11.8 million as of March 31, 2013 (unaudited), December 31, 2012 and December 31, 2011, respectively (with a weighted average remaining life of 80, 82 and 83 months as of March 31, 2013 (unaudited), December 31, 2012 and December 31, 2011, respectively) |
$ | 47,486 | $ | 50,666 | $ | 44,356 | ||||||
| Above-market leases, net of accumulated amortization of $5.8 million, $5.2 million and $2.6 million as of March 31, 2013 (unaudited), December 31, 2012 and December 31, 2011, respectively (with a weighted average remaining life of 67, 70 and 75 months as of March 31, 2013 (unaudited), December 31, 2012 and December 31, 2011, respectively) |
15,220 | 15,888 | 11,056 | |||||||||
| Leasing commissions, net of accumulated amortization of $5.5 million, $4.9 million and $2.8 million as of March 31, 2013 (unaudited), December 31, 2012 and December 31, 2011, respectively (with a weighted average remaining life of 109, 111 and 113 months as of March 31, 2013 (unaudited), December 31, 2012 and December 31, 2011, respectively) |
18,255 | 19,092 | 13,144 | |||||||||
|
|
|
|
|
|
|
|||||||
| $ | 80,961 | $ | 85,646 | $ | 68,556 | |||||||
|
|
|
|
|
|
|
|||||||
Estimated amortization of lease intangible assets as of March 31, 2013 and for each of the next five years and thereafter is as follows (in thousands):
| Year |
Amount (unaudited) |
|||
| 2013 (remaining nine months) |
$ | 14,299 | ||
| 2014 |
14,856 | |||
| 2015 |
10,632 | |||
| 2016 |
7,879 | |||
| 2017 |
6,893 | |||
| Thereafter |
26,402 | |||
|
|
|
|||
| Total |
$ | 80,961 | ||
|
|
|
|||
107
Table of Contents
Estimated amortization of lease intangible assets as of December 31, 2012 and for each of the next five years and thereafter is as follows (in thousands):
| Year |
Amount | |||
| 2013 |
$ | 19,463 | ||
| 2014 |
14,691 | |||
| 2015 |
10,572 | |||
| 2016 |
7,782 | |||
| 2017 |
6,798 | |||
| Thereafter |
26,340 | |||
|
|
|
|||
| Total |
$ | 85,646 | ||
|
|
|
|||
Amortization expense recorded on the lease intangible assets for the three months ended March 31, 2013 and 2012 (unaudited), for the years ended December 31, 2012 and 2011 and for the periods from April 28, 2010 to December 31, 2010 and January 1, 2010 to April 27, 2010 was $7.3 million, $4.9 million, $19.8 million, $14.2 million, $3.3 million and $152,000, respectively. Included in these amounts are $1.5 million (unaudited), $747,000 (unaudited), $3.4 million, $2.0 million, $353,000 and $17,000, respectively, of amortization recorded against rental revenue in the Operating Partnership and ETP’s combined statements of operations for above-market leases.
108
Table of Contents
5. Lease Intangible Liabilities, Net
Lease intangible liabilities, net consisted of the following at March 31, 2013, December 31, 2012 and December 31, 2011 (in thousands):
| March
31, 2013 (unaudited) |
December 31, 2012 |
December 31, 2011 |
||||||||||
| Below-market leases, net of accumulated amortization of $5.4 million, $5.0 million and $2.5 million as of March, 31, 2013 (unaudited), December 31, 2012 and December 31, 2011, respectively (with a weighted average remaining life of 134, 134 and 106 months as of March, 31, 2013 (unaudited), December 31, 2012 and December 31, 2011, respectively) |
$ | 25,320 | $ | 26,455 | $ | 13,843 | ||||||
|
|
|
|
|
|
|
|||||||
Amortization recorded on the lease intangible liabilities for the three months ended March 31, 2013 and 2012 (unaudited), for the years ended December 31, 2012 and 2011 and for the periods from April 28, 2010 to December 31, 2010 and January 1, 2010 to April 27, 2010 was $1.5 million, $974,000, $3.4 million, $1.9 million, $495,000 and $38,000, respectively. These amounts were recorded to rental revenue in the Operating Partnership and ETP’s combined statements of operations.
Estimated amortization of lease intangible liabilities as of March 31, 2013 and for each of the next five years and thereafter is as follows (in thousands):
| Year |
Amount (unaudited) |
|||
| 2013 (remaining nine months) |
$ | 2,625 | ||
| 2014 |
3,130 | |||
| 2015 |
2,600 | |||
| 2016 |
2,266 | |||
| 2017 |
2,143 | |||
| Thereafter |
12,556 | |||
|
|
|
|||
| Total |
$ | 25,320 | ||
|
|
|
|||
Estimated amortization of lease intangible liabilities as of December 31, 2012 and for each of the next five years and thereafter is as follows (in thousands):
| Year |
Amount | |||
| 2013 |
$ | 3,353 | ||
| 2014 |
3,037 | |||
| 2015 |
2,563 | |||
| 2016 |
2,222 | |||
| 2017 |
2,109 | |||
| Thereafter |
13,171 | |||
|
|
|
|||
| Total |
$ | 26,455 | ||
|
|
|
|||
6. Variable Interest Entities
Consolidated Variable Interest Entities
Included within the consolidated and combined financial statements is the 50% owned joint venture with AB Dothan, LLC, that is deemed a VIE, and for which the Operating Partnership is the primary beneficiary as it has the power to direct activities that most significantly impact the economic performance of the VIE. The joint venture’s activities principally consist of owning and operating a neighborhood retail center with 171,670 square feet of GLA located in Dothan, Alabama.
As of March 31, 2013 (unaudited), December 31, 2012 and December 31, 2011, total carrying amount of assets was approximately $15.8 million, $15.9 million and $16.5 million, respectively, which includes approximately $13.6 million, $13.6 million and $14.0 million, respectively, of real estate assets. As of March 31, 2013 (unaudited), December 31, 2012 and December 31, 2011, the total carrying amount of liabilities was approximately $14.3 million, $14.3 million and $14.6 million, respectively.
Unconsolidated Variable Interest Entities
On December 9, 2010, the Operating Partnership loaned $2.0 million to an unaffiliated borrower which has been identified as a VIE. In June 2012, the counterparty repaid the loan in full. The Operating Partnership did not consolidate the VIE because it did not have the ability to control the activities that most significantly impacted the VIE’s economic performance. See Note 14 for an additional description of the nature, purposes and activities of the Operating Partnership’s VIE and interests therein.
109
Table of Contents
7. Mortgage Loan and Note Receivable
On December 9, 2010, the Operating Partnership loaned $2.0 million to an unaffiliated borrower. The proceeds were used to facilitate the land acquisition and development of a shopping center anchored by Publix in Brandon, Florida. The loan was secured with a second mortgage trust deed on the property and was personally guaranteed by members of the borrower. In June 2012, the mortgage loan receivable was repaid in full, including interest accrued through the date of repayment.
In connection with the loan, the Operating Partnership entered into a purchase and sale agreement to acquire this property upon completion of development, at the Operating Partnership’s election. In June 2012, the Operating Partnership executed an amendment whereby the closing date for the potential acquisition was extended through December 31, 2012. On October 1, 2012, the Operating Partnership completed the acquisition of the retail shopping center with 68,000 square feet of GLA in Brandon, Florida for a purchase price of approximately $13.1 million.
In June 2012, the Operating Partnership extended a note receivable in the amount of $750,000 to a third party. The note receivable bears interest at 10.0% per annum, with the principal and accrued interest due upon maturity in June 2014. The loan is recourse to the borrower. The balance is included in other assets on the accompanying consolidated balance sheets.
8. Mortgages Payable, net
Mortgages payable at March 31, 2013 (unaudited), December 31, 2012 and December 31, 2011 consist of the following (in thousands):
| Carrying Amount
of Mortgage Notes |
||||||||||||||||||||||||||||
| Property Pledged as Collateral |
March
31, 2013 (unaudited) |
December
31, 2012 |
December
31, 2011 |
Contractual Interest Rate |
Effective Interest Rate |
Monthly Payment(1) |
Maturity Date |
|||||||||||||||||||||
| West Broad Village(2) |
$ | 50,000 | $ | 50,000 | $ | — | 2.69 | % | 2.69 | % | $ | 112 | 2013 | |||||||||||||||
| Five Forks Place |
4,833 | 4,882 | 5,067 | 5.50 | % | 5.50 | % | 39 | 2013 | |||||||||||||||||||
| Grant Creek Town Center |
15,247 | 15,342 | 15,694 | 5.75 | % | 5.75 | % | 105 | 2013 | |||||||||||||||||||
| Park West Place(3) |
55,800 | 55,800 | 55,800 | 2.50 | % | 3.66 | % | 120 | 2013 | |||||||||||||||||||
| Red Rock Commons(4) |
13,884 | 13,800 | — | 1.86 | % | 1.86 | % | 29 | 2014 | |||||||||||||||||||
| Excel Centre |
12,216 | 12,284 | 12,532 | 6.08 | % | 6.08 | % | 85 | 2014 | |||||||||||||||||||
| Merchant Central |
4,443 | 4,468 | 4,560 | 5.94 | % | 6.75 | % | 30 | 2014 | |||||||||||||||||||
| Edwards Theatres |
11,774 | 11,859 | 12,174 | 6.74 | % | 5.50 | % | 95 | 2014 | |||||||||||||||||||
| Gilroy Crossing |
46,439 | 46,646 | 47,409 | 5.01 | % | 5.01 | % | 263 | 2014 | |||||||||||||||||||
| The Promenade |
49,266 | 49,703 | 51,359 | 4.80 | % | 4.80 | % | 344 | 2015 | |||||||||||||||||||
| 5000 South Hulen |
13,598 | 13,655 | 13,876 | 5.60 | % | 6.90 | % | 83 | 2017 | |||||||||||||||||||
| Lake Pleasant Pavilion |
28,092 | 28,176 | — | 6.09 | % | 5.00 | % | 143 | 2017 | |||||||||||||||||||
| Rite Aid – Vestavia Hills |
1,143 | 1,184 | 1,341 | 7.25 | % | 7.25 | % | 21 | 2018 | |||||||||||||||||||
| Lowe’s, Shippensburg |
13,425 | 13,511 | 13,840 | 7.20 | % | 7.20 | % | 110 | 2031 | |||||||||||||||||||
| Northside Mall(5) |
12,000 | 12,000 | 12,000 | 0.13 | % | 1.13 | % | 1 | 2035 | |||||||||||||||||||
|
|
|
|
|
|
|
|||||||||||||||||||||||
| 332,160 | 333,310 | 245,652 | ||||||||||||||||||||||||||
| Less: premium/discount(6) |
572 | 625 | (691 | ) | ||||||||||||||||||||||||
|
|
|
|
|
|
|
|||||||||||||||||||||||
| Mortgage notes payable, net |
$ | 332,732 | $ | 333,935 | $ | 244,961 | ||||||||||||||||||||||
|
|
|
|
|
|
|
|||||||||||||||||||||||
| (1) | Amount represents the monthly payment of principal and interest at March 31, 2013 (unaudited). |
| (2) | The mortgage note at West Broad Village bears interest at the rate of LIBOR plus a margin of 250 basis points (variable interest rate of 2.69% and 2.75% at March 31, 2013 (unaudited) and December 31, 2012, respectively). The loan at the West Broad Village property was refinanced and the maturity date extended subsequent to March 31, 2013; see Note 21 for further discussion. |
| (3) | The loan bears interest at a rate of LIBOR plus 2.25% (variable interest rate of 2.50% at each of March 31, 2013 (unaudited) and December 31, 2012 and 2.82% at December 31, 2011). In December 2010, the Operating Partnership’s entered into interest rate swap contracts, which fix LIBOR at an average of 1.41% for the term of the loan. The maturity date may be extended for an additional one-year period through December 2014 at the Operating Partnership’s option and upon the satisfaction of conditions precedent and the payment of an extension fee. |
| (4) | In February 2013, the maturity date for the Red Rock Commons construction loan was extended to March 2014, which may be extended for an additional one-year period through March 2015 at the Operating Partnership’s option and upon the satisfaction of conditions precedent and the payment of an extension fee. The construction loan bears interest at the rate of LIBOR plus a margin of 165 basis points to 225 basis points, depending on the Operating Partnership’s leverage ratio (variable interest rate of 1.86% and 2.45% at March 31, 2013 (unaudited) and December 31, 2012, respectively). |
110
Table of Contents
| (5) | The debt represents redevelopment revenue bonds to be used for the redevelopment of this property, which mature in November 2035. Interest is reset weekly and determined by the bond remarketing agent based on the market value of the bonds (interest rate of 0.13%, 0.14% and 0.13% at March 31, 2013 (unaudited), December 31, 2012 and December 31, 2011, respectively). The interest rate on the bonds is currently priced off of the Securities Industry and Financial Markets Association index but could change based on the credit of the bonds. The bonds are secured by a $12.1 million letter of credit issued from the Operating Partnership’s unsecured revolving credit facility. An underwriter’s discount related to the original issuance of the bonds with a remaining balance of $108,000, $110,000 and $114,000 at March 31, 2013 (unaudited), December 31, 2012 and December 31, 2011, respectively, will be amortized as additional interest expense through November 2035. |
| (6) | Represents (a) the fair value adjustment on assumed debt on acquired properties at the time of acquisition to account for below- or above-market interest rates and (b) an underwriter’s discount for the issuance of redevelopment bonds. |
Total interest cost capitalized for the three months ended March 31, 2013 (unaudited) and for the years ended December 31, 2012, 2011 and 2010 was $0, $243,000, $411,000 and $106,000, respectively (interest cost capitalized for the year ended December 31, 2010 related to the Predecessor).
The Operating Partnership’s mortgage debt maturities as of March 31, 2013 and during the next five years are as follows (in thousands):
| Year Ending December 31, |
Amount (unaudited) |
|||
| 2013 (remaining nine months) |
$ | 129,156 | ||
| 2014 |
90,633 | |||
| 2015 |
47,381 | |||
| 2016 |
1,341 | |||
| 2017 |
39,990 | |||
| Thereafter |
23,659 | |||
|
|
|
|||
| $ | 332,160 | |||
|
|
|
|||
The Company’s mortgage debt maturities as of December 31, 2012 and during the next five years is as follows (in thousands):
| Year Ending December 31, |
Amount | |||
| 2013 |
$ | 144,190 | ||
| 2014 |
76,749 | |||
| 2015 |
47,381 | |||
| 2016 |
1,341 | |||
| 2017 |
39,990 | |||
| Thereafter |
23,659 | |||
|
|
|
|||
| $ | 333,310 | |||
|
|
|
|||
9. Notes Payable
On July 8, 2010, the Operating Partnership entered into an unsecured revolving credit facility, which provided up to $125.0 million in borrowings. On June 3, 2011, the Operating Partnership entered into a third amendment to its credit agreement, which provided an increase in borrowings available from $125.0 million to $200.0 million, decreased the fees pertaining to the unused capacity and the applicable interest rate, and extended the maturity date. On July 20, 2012, the Operating Partnership entered into an amended and restated credit agreement, which provided an increase in borrowings available under its unsecured revolving credit facility to $250.0 million, decreased the fees pertaining to the unused capacity depending on utilization of the borrowing capacity, decreased the applicable interest rate and extended the maturity date. The Operating Partnership has the ability from time to time to increase the size of the unsecured revolving credit facility by up to an additional $200.0 million for a total borrowing capacity of $450.0 million, subject to receipt of lender commitments and other conditions precedent. The amended maturity date is July 19, 2016 and may be extended for one additional year at the Operating Partnership’s option. The Operating Partnership, among other things, is subject to covenants requiring the maintenance of (1) maximum leverage ratios on unsecured, secured and overall debt and (2) minimum fixed coverage ratios. At March 31, 2013 (unaudited) and December 31, 2012, the Operating Partnership believes that it was in compliance with all the covenants in the credit agreement.
The unsecured revolving credit facility bears interest at the rate of LIBOR plus a margin of 165 basis points to 225 basis points, depending on the Operating Partnership’s leverage ratio. The Operating Partnership also pays a fee of 0.25% or 0.35% for any unused portion of the unsecured revolving credit facility, depending on the Operating Partnership’s utilization of the borrowing capacity. Borrowings from the unsecured revolving credit facility were $88.0 million and $75.0 million at March 31, 2013 (unaudited) and December 31, 2012, respectively, at a weighted-average interest rate of 1.86% and 1.87%, respectively. The Operating Partnership issued a $12.1 million letter of credit from the unsecured revolving credit facility, which secures an outstanding $12.0 million bond payable for the Northside Mall. This bond is included with the mortgages payable on the Operating Partnership’s consolidated balance sheets. At March 31, 2013 (unaudited) and December 31, 2012, there was approximately $149.9 million and $162.9 million, respectively, available for borrowing under the unsecured revolving credit facility.
111
Table of Contents
10. Earnings Per Unit
Basic earnings (loss) per unit is computed by dividing income (loss) available to unitholders by the weighted average common OP units outstanding, as adjusted for the effect of participating securities. The Operating Partnership’s unvested restricted common OP units are participating securities as they contain non-forfeitable rights to distributions. The impact of unvested restricted common OP units on earnings (loss) per unit has been calculated using the two-class method whereby earnings are allocated to the unvested restricted common OP units based on distributions and the unvested restricted common OP units’ participation rights in undistributed earnings (losses).
The calculation of diluted earnings per unit for the three months ended March 31, 2013 (unaudited) does not include 699,719 unvested restricted common OP units as the effect of including these equity securities was anti-dilutive to net loss attributable to the unitholders. The calculation of diluted earnings per unit for the year ended December 31, 2012 does not include 701,396 unvested restricted common OP units or 72,944 common OP units that are contingently issuable (see Note 3) as the effect of including these equity securities was anti-dilutive to net loss attributable to the unitholders. The calculation of diluted earnings per unit for the year ended December 31, 2011 does not include 1,018,220 unvested restricted common OP units or 206,121 common OP units that are contingently issuable (see Note 3) as the effect of including these equity securities was anti-dilutive to loss from continuing operations and net loss attributable to the unitholders. The calculation of diluted earnings per unit for the period from April 28, 2010 to December 31, 2010 does not include 153,131 unvested restricted common OP units as the effect of including these equity securities was anti-dilutive to loss from continuing operations and net loss attributable to the unitholders. In addition, 3,333,400 common OP units issuable upon settlement of the conversion feature of the 7.00% Series A Cumulative Convertible Perpetual Preferred Units were anti-dilutive and were not included in the calculation of diluted earnings per unit based on the “if converted” method for the three months ended March 31, 2013 (unaudited) and for the years ended December 31, 2012 and 2011.
Computations of basic and diluted earnings per unit for the three months ended March 31, 2013 and 2012, for the years ended December 31, 2012 and 2011 and for the period from April 28, 2010 to December 31, 2010 were as follows (in thousands, except unit data):
| Three Months Ended March 31, 2013 (unaudited) |
Three Months Ended March 31, 2012 (unaudited) |
Year Ended December 31, 2012 |
Year Ended December 31, 2011 |
Period from April 28, 2010 to December 31, 2010 |
||||||||||||||||
| Basic earnings per unit: |
||||||||||||||||||||
| Income (loss) from continuing operations |
$ | 324 | $ | 433 | $ | 1,845 | $ | (4,500 | ) | $ | (4,955 | ) | ||||||||
| Preferred distributions |
(2,744 | ) | (2,121 | ) | (10,353 | ) | (3,228 | ) | — | |||||||||||
| Allocation to participating securities |
(121 | ) | (152 | ) | (456 | ) | (628 | ) | (31 | ) | ||||||||||
| Loss from continuing operations attributable to non-controlling interests |
(87 | ) | (66 | ) | (279 | ) | (104 | ) | — | |||||||||||
|
|
|
|
|
|
|
|
|
|
|
|||||||||||
| Loss from continuing operations applicable to the unitholders |
$ | (2,628 | ) | $ | (1,906 | ) | $ | (9,243 | ) | $ | (8,460 | ) | $ | (4,986 | ) | |||||
|
|
|
|
|
|
|
|
|
|
|
|||||||||||
| Net loss attributable to the unitholders |
$ | (2,507 | ) | $ | (1,754 | ) | $ | (8,787 | ) | $ | (2,833 | ) | $ | (3,873 | ) | |||||
| Allocation to participating securities |
(121 | ) | (152 | ) | (456 | ) | (628 | ) | (31 | ) | ||||||||||
|
|
|
|
|
|
|
|
|
|
|
|||||||||||
| Net loss applicable to the unitholders |
$ | (2,628 | ) | $ | (1,906 | ) | $ | (9,243 | ) | $ | (3,461 | ) | $ | (3,904 | ) | |||||
|
|
|
|
|
|
|
|
|
|
|
|||||||||||
| Weighted-average common OP units outstanding: |
||||||||||||||||||||
| Basic and diluted |
46,593,748 | 33,154,212 | 35,912,370 | 23,725,616 | 16,151,262 | |||||||||||||||
|
|
|
|
|
|
|
|
|
|
|
|||||||||||
| Basic and diluted earnings per unit: |
||||||||||||||||||||
| Loss from continuing operations per unit attributable to the unitholders |
$ | (0.06 | ) | $ | (0.06 | ) | $ | (0.26 | ) | $ | (0.36 | ) | $ | (0.31 | ) | |||||
| Income from discontinued operations per unit attributable to the unitholders |
— | — | — | 0.21 | 0.07 | |||||||||||||||
|
|
|
|
|
|
|
|
|
|
|
|||||||||||
| Net loss per unit attributable to the unitholders |
$ | (0.06 | ) | $ | (0.06 | ) | $ | (0.26 | ) | $ | (0.15 | ) | $ | (0.24 | ) | |||||
|
|
|
|
|
|
|
|
|
|
|
|||||||||||
112
Table of Contents
11. Derivatives and Hedging Activities
In December 2010, the Operating Partnership executed two pay-fixed interest rate swaps with a notional value of $55.8 million (weighted average interest rate of 1.41%) to hedge the variable cash flows associated with one of the Operating Partnership’s mortgage payables. As a result of the interest rate swaps, the Operating Partnership either (1) receives the difference between a fixed interest rate (the “Strike Rate”) and one-month LIBOR if the Strike Rate is less than LIBOR or (2) pays such difference if the Strike Rate is greater than LIBOR. No initial investment was made to enter into either of the interest rate swap agreements. The Operating Partnership had no derivative financial instruments prior to the execution of the two swaps.
During the three months ended March 31, 2013 (unaudited) and for the years ended December 31, 2012 and 2011, the Operating Partnership did not record any amounts in earnings attributable to hedge ineffectiveness. During the next twelve months, the Operating Partnership estimates that an additional $459,000 will be reclassified from other comprehensive income as an increase to interest expense.
Interest rate swaps and other derivatives instruments at March 31, 2013 (unaudited), December 31, 2012 and December 31, 2011 consist of the following (in thousands):
| Fair Value(1) | Current Notional Amount |
Strike Rate | Expiration Date | |||||||||||||||||||||
| Type of Derivative Instrument |
March 31,
2013 (unaudited) |
December 31, 2012 |
December 31, 2011 |
|||||||||||||||||||||
| Interest rate swaps(2) |
$ | 459 | $ | 620 | $ | 965 | $ | 55,800 | 1.34% to 1.48% | December 2013 | ||||||||||||||
| Other derivative instrument(3) |
— | 274 | 3,050 | March 2013 | ||||||||||||||||||||
|
|
|
|
|
|
|
|||||||||||||||||||
| Total derivative instruments |
$ | 459 | $ | 894 | $ | 4,015 | ||||||||||||||||||
|
|
|
|
|
|
|
|||||||||||||||||||
| (1) | Fair value of derivative instruments does not include any related accrued interest payable to the counterparty. |
| (2) | The interest rate swaps (designated as hedging instruments) are classified within accounts payable and other liabilities on the accompanying consolidated balance sheets. |
| (3) | The Operating Partnership’s purchase agreement executed in connection with the acquisition of the Edwards Theatres property in March 2011 contained a provision determined to be an embedded derivative instrument. The embedded derivative provided a guaranteed fair value for the common OP units provided to the sellers of the property if redeemed for shares of the general partner’s common stock or cash, at the Operating Partnership’s election, prior to its expiration in March 2013. The fair value of the embedded derivative at each period was calculated through the use of a Monte Carlo valuation model based on the historical volatility and closing price of the general partner’s common stock and a risk-free interest rate (see Note 18 for discussion of changes in the fair value of this derivative). The embedded derivative was classified within accounts payable and other liabilities in the accompanying condensed consolidated balance sheets. |
Tabular Disclosure of the Effect of Derivative Instruments on the Income Statement
The tables below present the effect of the Operating Partnership’s derivative financial instruments on the consolidated and combined statements of operations for the three months ended March 31, 2013 and 2012, for the years ended December 31, 2012, 2011 and for the period from April 28, 2010 to December 31, 2010 (in thousands):
| March
31, 2013 (unaudited) |
March
31, 2012 (unaudited) |
December 31, 2012 |
December 31, 2011 |
April 28, 2010 to December 31, 2010 |
||||||||||||||||
| Amount of unrealized gain (loss) recognized in OCI (effective portion): |
||||||||||||||||||||
| Interest rate swaps |
$ | (1 | ) | $ | (173 | ) | $ | (305 | ) | $ | (1,221 | ) | $ | (415 | ) | |||||
| Other derivatives |
— | — | — | — | — | |||||||||||||||
|
|
|
|
|
|
|
|
|
|
|
|||||||||||
| Total |
$ | (1 | ) | $ | (173 | ) | $ | (305 | ) | $ | (1,221 | ) | $ | (415 | ) | |||||
|
|
|
|
|
|
|
|
|
|
|
|||||||||||
| Amount of gain (loss) reclassified from accumulated OCI into income (effective portion): |
||||||||||||||||||||
| Interest rate swaps (interest expense) |
$ | (162 | ) | $ | (157 | ) | $ | (649 | ) | $ | (645 | ) | $ | (26 | ) | |||||
| Other derivatives |
— | — | — | — | — | |||||||||||||||
|
|
|
|
|
|
|
|
|
|
|
|||||||||||
| Total |
$ | (162 | ) | $ | (157 | ) | $ | (649 | ) | $ | (645 | ) | $ | (26 | ) | |||||
|
|
|
|
|
|
|
|
|
|
|
|||||||||||
| Amount of gain (loss) recognized in income (ineffective portion and amount excluded from effectiveness testing): |
||||||||||||||||||||
| Interest rate swaps (other income/expense) |
$ | — | $ | — | $ | — | $ | — | $ | — | ||||||||||
| Other derivatives (changes in fair value of financial instruments and gain on common operating partnership unit redemption) |
230 | 462 | 1,530 | 1,154 | — | |||||||||||||||
|
|
|
|
|
|
|
|
|
|
|
|||||||||||
| Total |
$ | 230 | $ | 462 | $ | 1,530 | $ | 1,154 | $ | — | ||||||||||
|
|
|
|
|
|
|
|
|
|
|
|||||||||||
113
Table of Contents
Credit-risk-related Contingent Features
Under the terms of the two interest rate swaps detailed above, the Operating Partnership could be declared in default on its obligations under the swap agreements in the event that it defaults on any of its indebtedness, even if repayment of the indebtedness has not been accelerated by the lender. Additionally, because the Operating Partnership’s derivative counterparty is also the lender for the hedged floating rate credit agreement, the swap agreements incorporate the loan covenant provisions of the Operating Partnership’s indebtedness. Failure to comply with the loan covenant provisions would result in the Operating Partnership being in default on any derivative instrument obligations covered by the agreement.
If the Operating Partnership had breached any of these provisions at March 31, 2013 (unaudited), December 31, 2012, December 31, 2011 or December 31, 2010, it could have been required to settle its obligations under the agreements at their termination value. As of March 31, 2013 (unaudited) and December 31, 2012, the termination value defined as the fair value of derivatives in a net liability position, which includes accrued interest but excludes any adjustment for nonperformance risk, was a liability of approximately $515,000 and $672,000, respectively. As of March 31, 2013 (unaudited) and December 31, 2012, the Operating Partnership has not posted any collateral related to these agreements.
Although the Operating Partnership’s derivative contracts are subject to a master netting arrangement, the Operating Partnership does not net its derivative fair values or any existing rights or obligations to cash collateral on the consolidated balance sheets.
12. Capital
The Operating Partnership has issued common OP units to the general partner pursuant to grants of restricted common stock awards to the operating partnership’s senior executives, directors and employees totaling 1,141,542 and 1,100,042 shares of common stock (each net of forfeitures of 3,000 shares), which are included in the total common OP units outstanding as of March 31, 2013 unaudited and December 31, 2012, respectively.
As of March 31, 2013 (unaudited), December 31, 2012 and December 31, 2011, the Operating Partnership had outstanding 2,000,000 units of 7.00% Series A Cumulative Convertible Perpetual Preferred Units (“Series A preferred units”), which were issued to the general partner in exchange for contributed proceeds following the general partner’s issuance of 7.00% Series A Cumulative Convertible Perpetual Preferred Stock (“Series A preferred stock”). The Series A preferred units have a liquidation preference of $25.00 per unit. The Operating Partnership pays cumulative distributions on the Series A preferred units when, as and if declared by the Operating Partnership, at a rate of 7.00% per annum, subject to adjustment in certain circumstances. The annual distribution on each Series A preferred unit is $1.75, payable quarterly in arrears on or about the 15th day of January, April, July and October of each year. The Series A preferred units generally have no voting rights except for limited voting rights if the Operating Partnership fails to pay distributions for six or more quarterly periods (whether or not consecutive) and in certain other circumstances.
The Series A preferred stock is convertible, at the holders’ option, at any time and from time to time, into shares of the general partner’s common stock at an initial conversion rate of 1.6667 shares per Series A preferred stock, which is equivalent to an initial conversion price of $15.00 per share. The conversion price will be subject to customary adjustments in certain circumstances. On or after April 1, 2014, the general partner may, at its option, convert some or all of the Series A preferred stock if the closing price of the general partner’s common stock equals or exceeds 140% of the conversion price for at least 20 of the 30 consecutive trading days ending the day before the notice of exercise of conversion is sent and the general partner has either declared and paid, or declared and set apart for payment, any unpaid distributions that are in arrears on the Series A preferred stock. In the event of the conversion of any Series A preferred stock, the general partner would convert an equivalent number of Series A preferred units into common OP units based upon the same terms and conditions (i.e. – equivalent conversion rate).
At March 31, 2013 (unaudited) and December 31, 2012 , the Operating Partnership had outstanding 3,680,000 units of 8.125% Series B Cumulative Redeemable Preferred Units (“Series B preferred units”), which were issued to the general partner in exchange for contributed proceeds following the general partner’s issuance of 8.125% Series B Cumulative Redeemable Preferred Stock (“Series B preferred stock”). The Series B preferred units have a liquidation preference of $25.00 per unit. The Operating Partnership pays cumulative distributions on the Series B preferred units, when, as and if declared by the Operating Partnership, at a rate of 8.125% per annum, subject to adjustment in certain circumstances. The annual distribution on each Series B preferred unit is $2.03125, payable quarterly in arrears on or about the 15th day of January, April, July and October of each year. The Series B preferred units generally have no voting rights except for limited voting rights if the Operating Partnership fails to pay distributions for six or more quarterly periods (whether or not consecutive) and in certain other circumstances. At any time on and after January 31, 2017, the general partner may, at its option, redeem the Series B preferred stock, in whole or from time to time in part, by paying $25.00 per share, plus any accrued and unpaid distributions to, but not including, the date of redemption. In addition, upon the occurrence of a change of control of the general partner, the general partner or a successor may, at its option, redeem the Series B preferred stock, in whole or in part and within 120 days after the first date on which such change of control occurred, by paying $25.00 per share, plus any accrued and unpaid distributions to, but not including, the date of redemption. In the event of the redemption of any Series B preferred stock, the Operating Partnership would redeem an equivalent number of Series B preferred units by paying $25.00 per unit, plus any accrued and unpaid distributions to, but not including, the date of redemption.
114
Table of Contents
The general partner’s board of directors has authorized a share repurchase program under which the general partner may acquire up to $30.0 million of its common stock in open market and negotiated purchases with no expiration date. As of March 31, 2013 (unaudited), approximately $23.3 million remained available under the share repurchase program to acquire outstanding shares of the general partner’s common stock (corresponding common OP units related to the general partner’s common stock would also be repurchased and retired).
The general partner has entered into amended and restated equity distribution agreements with four sales agents (the “2013 Equity Distribution Agreements”), under which it can currently issue and sell shares of its common stock having an aggregate offering price of up to $100.0 million from time to time through, at the general partner’s discretion, any of the sales agents. The equity distribution agreements that the general partner originally entered into with the same four sales agents in 2012 (the “2012 Equity Distribution Agreements”) provided for the sale of shares of the general partner’s common stock having an aggregate offering price of up to $50.0 million. The sales of common stock made under the 2013 Equity Distribution Agreements are, and the sales made under the 2012 Equity Distribution Agreements were made in “at the market” offerings as defined in Rule 415 of the Securities Act of 1933, as amended (the “Securities Act”). During the three months ended March 31, 2013 (unaudited) the general partner completed the issuance of 2,063,828 shares of its common stock pursuant to the 2012 Equity Distribution Agreements, resulting in net proceeds of approximately $25.6 million at an average stock issuance price of $12.63 per share. During the year ended December 31, 2012 the general partner completed the issuance of 1,082,051 shares of its common stock pursuant to the 2012 Equity Distribution Agreements, resulting in net proceeds of approximately $12.6 million at an average stock issuance price of $11.92 per unit. Subsequent to March 31, 2013 (unaudited), the general partner completed the issuance of 897,900 shares of its common stock pursuant to the 2012 Equity Distribution Agreements, resulting in net proceeds of approximately $12.1 million at an average stock issuance price of $13.76 per share. The proceeds were contributed to the Operating Partnership in exchange for an equal number of common OP units and the proceeds were used by the Operating Partnership to repay outstanding indebtedness under its unsecured revolving credit facility and for other general corporate and working capital purposes.
In October 2012, the Operating Partnership issued an additional 411,184 common OP units in connection with the acquisition of the West Broad Village property.
On October 30, 2012, the general partner completed the issuance of 9,775,000 shares of common stock, including the exercise of an overallotment option of 1,275,000 shares, resulting in net proceeds of approximately $113.1 million, after deducting the underwriters’ discount and commissions and offering expenses. The net proceeds of $113.1 million were contributed to the Operating Partnership in exchange for 9,775,000 common OP units. A portion of the proceeds from this offering were used by the Operating Partnership to repay the outstanding indebtedness under the Operating Partnership’s unsecured revolving credit facility and for other general corporate and working capital purposes.
Consolidated net income is reported in the Operating Partnership’s consolidated and combined financial statements at amounts that include the amounts attributable to both the unitholders and the non-controlling interests.
During the year ended December 31, 2012, a total of 571,570 common OP units related to the Edwards Theatres acquisition were tendered to the general partner for redemption, resulting in the issuance of an additional 509,694 shares of the general partner’s common stock (and the issuance of an equivalent number of common OP units to the general partner) and cash payments totaling approximately $1.9 million to former unitholders (see Note 18 for further discussion). During the three months ended March 31, 2013(unaudited), a total of 19,904 common OP units related to the Edwards Theatres acquisition were tendered to the general partner for redemption, resulting in the issuance of an additional 22,074 shares of the general partner’s common stock to former unitholders (and the issuance of an equivalent number of common OP units to the general partner—see Note 18 for further discussion).
The following table shows the vested ownership interests in the Operating Partnership as of March 31, 2013, December 31, 2012 and December 31, 2011:
| March 31,
2013 (unaudited) |
December 31, 2012 | December 31, 2011 | ||||||||||||||||||||||
| OP Units | Percentage of Total |
OP Units | Percentage of Total |
OP Units | Percentage of Total |
|||||||||||||||||||
| General partner (Excel Trust, Inc.) |
46,323,239 | 97.4 | % | 44,204,287 | 97.3 | % | 29,271,593 | 95.4 | % | |||||||||||||||
| Limited partners(1) |
1,225,115 | 2.6 | % | 1,245,019 | 2.7 | % | 1,405,405 | 4.6 | % | |||||||||||||||
|
|
|
|
|
|
|
|
|
|
|
|
|
|||||||||||||
| Total |
47,548,354 | 100.0 | % | 45,449,306 | 100.0 | % | 30,676,998 | 100.0 | % | |||||||||||||||
|
|
|
|
|
|
|
|
|
|
|
|
|
|||||||||||||
| (1) | The limited partners OP Units may be redeemed by the unitholders for cash. The general partner, at its option, may satisfy the cash redemption with shares of the general partner’s stock on a one-for-one basis. |
2010 Equity Incentive Award Plan
The general partner and the Operating Partnership have established the 2010 Equity Incentive Award Plan of Excel Trust, Inc. and Excel Trust, L.P. (the “2010 Plan”), pursuant to which the general partner’s board of directors or a committee of its independent directors may make grants of stock options, restricted stock (and corresponding restricted common OP units issued by the Operating Partnership), stock appreciation rights and other stock-based awards to its non-employee directors, employees and consultants. The maximum number of shares of the general partner’s common stock that may be issued pursuant to the 2010 Plan is 1,350,000 (of which 208,458 and 249,958 shares of common stock remain available for issuance as of March 31, 2013 – unaudited and December 31, 2012, respectively).
115
Table of Contents
The following shares of restricted common stock were issued by the general partner during the three months ended March 31, 2013 (unaudited) and the year ended December 31, 2012:
| Grant Data |
Price at Grant Date |
Number | Vesting Period (yrs.) |
|||||||||
| During the three months ended March 31, 2012(1) |
$ | 12.42 | 5,000 | 4 | ||||||||
| During the three months ended June 30, 2012(2) |
$ | 11.99 | 13,356 | 1 | ||||||||
| During the three months ended March 31, 2013(1) |
$ | 13.43 | 41,500 | 4 | ||||||||
| (1) | Shares issued to certain employees of the Operating Partnership. These shares vest over four years with 25% vesting on the first anniversary of the grant date and the remainder vesting in equal quarterly installments thereafter. |
| (2) | Shares issued to members of the general partner’s board of directors. These shares vest in equal monthly installments. |
Shares of the general partner’s restricted common stock (and corresponding restricted common OP units issued by the Operating Partnership) generally may not be sold, pledged, assigned or transferred in any manner other than by will or the laws of descent and distribution or, subject to the consent of the administrator of the 2010 Plan, a domestic relations order, unless and until all restrictions applicable to such shares of common stock have lapsed. Such restrictions expire upon vesting. Shares of the general partner’s restricted common stock (and corresponding restricted common OP units) have full voting rights and rights to distributions upon grant. During the three months ended March 31, 2013 and 2012 (unaudited), for the years ended December 31, 2012 and 2011 and for the period from April 28, 2010 to December 31, 2010, the Operating Partnership recognized compensation expense of $562,000, $785,000, $3.2 million, $4.5 million and $357,000, respectively, related to the restricted common stock grants ultimately expected to vest. ASC Topic 718, Compensation — Stock Compensation, requires forfeitures to be estimated at the time of grant and revised, if necessary, in subsequent periods if actual forfeitures differ from those estimates. The general partner has estimated $0 in forfeitures. Stock compensation expense is included in general and administrative in the accompanying consolidated and combined statements of operations.
As of March 31, 2013 (unaudited), December 31, 2012 and December 31, 2011, there was $3.4 million, $3.4 million and $6.4 million, respectively; of total unrecognized compensation expense related to the non-vested shares of the general partner’s restricted common stock. As of March 31, 2013 (unaudited), December 31, 2012 and December 31, 2011, this expense was expected to be recognized over a remaining period of 1.9 years, 2.0 years and 2.9 years, respectively.
| Number of Nonvested Shares of Restricted Common Stock |
Weighted Average Grant Date Fair Value |
|||||||
| Balance — January 1, 2012 |
1,018,220 | $ | 10.69 | |||||
| Grants |
18,356 | $ | 12.11 | |||||
| Forfeitures |
— | $ | — | |||||
| Vested |
(335,180 | ) | $ | 10.70 | ||||
|
|
|
|
|
|||||
| Balance — December 31, 2012 |
701,396 | $ | 10.02 | |||||
|
|
|
|
|
|||||
| Expected to vest — December 31, 2012 |
701,396 | $ | 10.02 | |||||
|
|
|
|
|
|||||
| Number of Nonvested Shares of Restricted Common Stock (unaudited) |
Weighted Average Grant Date Fair Value (unaudited) |
|||||||
| Balance — January 1, 2013 |
701,396 | $ | 10.02 | |||||
| Grants |
41,500 | $ | 13.43 | |||||
| Forfeitures |
— | $ | — | |||||
| Vested |
(33,050 | ) | $ | 12.37 | ||||
|
|
|
|
|
|||||
| Balance — March 31, 2013 |
709,846 | $ | 10.11 | |||||
|
|
|
|
|
|||||
| Expected to vest — March 31, 2013 |
709,846 | $ | 10.11 | |||||
|
|
|
|
|
|||||
401(k) Retirement Plan
The Operating Partnership maintains a 401(k) retirement plan covering substantially all employees, which permits participants to defer up to the maximum allowable amount of their eligible compensation as determined by the Internal Revenue Service. This deferred compensation, together with matching contributions equal to 100% of employee deferrals up to 3.0% of eligible compensation and 50% of employee deferrals for the next 2.0% of eligible compensation, is fully vested and funded as of March 31, 2013 (unaudited), December 31, 2012, December 31, 2011 and December 31, 2010. Costs related to the matching portion for the three months ended March 31, 2013 and 2012 (unaudited), for the years ended December 31, 2012 and 2011 and for the period from April 28, 2010 to December 31, 2010 were approximately $36,000, $27,000, $119,000, $90,000 and $33,000, respectively. The Operating Partnership did not provide matching contributions to employees for its 401(k) retirement plan prior to the Offering.
116
Table of Contents
13. Discontinued Operations
On June 30, 2011, the Operating Partnership sold the following properties as a portfolio, which was a part of the Retail Properties segment (see Note 19):
| (in thousands) | ||||||||||||||||
| Property |
Sales Price | Gain on Sale | Date of Sale | Acquisition Date | ||||||||||||
| Walgreens — Corbin (South) |
$ | 4,646 | $ | 510 | 6/30/2011 | 5/24/2010 | ||||||||||
| Walgreens — Beckley |
7,986 | 902 | 6/30/2011 | 6/17/2010 | ||||||||||||
| Walgreens — Barbourville |
4,680 | 511 | 6/30/2011 | 5/24/2010 | ||||||||||||
| Walgreens — Princeton |
4,493 | 458 | 6/30/2011 | 10/28/2010 | ||||||||||||
| Jewel-Osco |
8,431 | 459 | 6/30/2011 | 5/14/2010 | ||||||||||||
| Shop’n Save (SuperValu) |
9,395 | 1,136 | 6/30/2011 | 5/28/2010 | ||||||||||||
|
|
|
|
|
|||||||||||||
| Total |
$ | 39,631 | $ | 3,976 | ||||||||||||
|
|
|
|
|
|||||||||||||
The results of operations for the above properties is reported as discontinued operations for all periods presented in the accompanying consolidated and combined statements of operations.
The following table summarizes the revenue and expense components that comprise income from discontinued operations (in thousands):
| Years Ended December 31, |
For the period from April 28, 2010 to December 31, |
|||||||||||
| 2012 | 2011 | 2010 | ||||||||||
| Total revenues |
$ | — | $ | 1,459 | $ | 1,607 | ||||||
| Total expenses |
— | 436 | 525 | |||||||||
|
|
|
|
|
|
|
|||||||
| Income before gain on sale of real estate assets |
— | 1,023 | 1,082 | |||||||||
| Gain on sale of real estate assets |
— | 3,976 | — | |||||||||
|
|
|
|
|
|
|
|||||||
| Income from discontinued operations available to the unitholders |
$ | — | $ | 4,999 | $ | 1,082 | ||||||
|
|
|
|
|
|
|
|||||||
14. Investment in Unconsolidated Entities
On September 7, 2012, the Operating Partnership contributed the La Costa Town Center property to a limited liability company (the “La Costa LLC”) with GEM Realty Capital, L.P. (“GEM”) in which the Operating Partnership and GEM hold 20% and 80% ownership interests, respectively. The Operating Partnership received approximately $21.2 million in exchange for the 80% ownership interest acquired by GEM. The Operating Partnership’s remaining interest is reflected in the accompanying balance sheets at the Operating Partnership’s historical cost basis as an investment in a profit-sharing arrangement. The contribution was not considered a sale of real estate due to terms in the La Costa LLC formation documents that could require the Operating Partnership’s continuing participation in the future under certain circumstances. La Costa LLC does not qualify as a VIE and consolidation is not required as the Operating Partnership does not control the operations of the property. The majority owner will bear the majority of any losses incurred. The Operating Partnership will receive 20% of the cash flow distributions and may receive a greater portion of cash distributions in the future based upon the performance of the property and the availability of cash for distribution. In addition, the Operating Partnership receives fees from its role as the day-to-day property manager and for any development services that it provides, which are reflected in other income in the consolidated and combined statements of operations. The Operating Partnership’s interest in the income or losses of the underlying venture is reflected in a manner similar to the equity method of accounting.
On October 19, 2012, the Operating Partnership acquired a 50% tenant-in-common ownership interest in a property (“Bay Hill”) for a purchase price of approximately $19.8 million as a part of a larger acquisition. The remaining 50% undivided interest in the Bay Hill property is held by MDC Fountains, LLC (“MDC”). The Bay Hill property does not qualify as a VIE and consolidation is not required as the Operating Partnership does not control the operations of the property. The Operating Partnership will receive 50% of the cash flow distributions and recognize 50% of the results of operations. In addition, the Operating Partnership receives fees from its role as the day-to-day property manager, which are reflected in other income in the consolidated and combined statements of operations. The Operating Partnership’s 50% ownership interest is reflected in the accompanying balance sheets as an investment in unconsolidated entities and the Operating Partnership’s interest in the income or losses of the property is recorded based on the equity method of accounting.
117
Table of Contents
General information on the La Costa LLC and Bay Hill properties as of March 31, 2013 (unaudited) and December 31, 2012 was as follows:
| Unconsolidated Investment |
Partner | Ownership Interest | Formation/ Acquisition Date |
Property | ||||||||
| La Costa LLC(1) |
GEM | 20 | % | September 7, 2012 | La Costa Town Center | |||||||
| Bay Hill(2) |
MDC | 50 | % | October 19, 2012 | The Fountains at Bay Hill | |||||||
| (1) | At March 31, 2013 (unaudited), La Costa, LLC, had real estate assets of $23.5 million, total assets of $25.8 million, mortgages payable of $14.1 million and total liabilities of $14.9 million. For the three months ended March 31, 2013 (unaudited), total revenues were $1.9 million, total expenses were $1.4 million and net income was $186,000. At December 31, 2012, La Costa, LLC, had real estate assets of $23.4 million, total assets of $26.3 million, mortgages payable of $14.1 million and total liabilities of $16.0 million. For the year ended December 31, 2012, total revenues were $0.8 million, total expenses were $2.1 million and the net loss was $1.3 million. The mortgage note was assumed with the contribution of the property. The mortgage note bears interest at the rate of LIBOR plus a margin of 575 basis points (6.0% at each of March 31, 2013 (unaudited) and December 31, 2012). The mortgage note has a maturity date of October 1, 2014, which may be extended for three additional one-year periods at the LLC’s election and upon the satisfaction of certain conditions (including the payment of an extension fee upon the exercise of the 2nd and 3rd renewal options, execution of an interest rate cap and the establishment of certain reserve accounts). The La Costa LLC has also entered into an interest rate cap related to the mortgage note, which limits LIBOR to a maximum of 3.0% and expires on October 1, 2014. |
| (2) | At March 31, 2013 (unaudited) and December 31, 2012, there were $23.8 million and $23.9 million, respectively, in outstanding borrowings on the mortgage note assumed with the acquisition of the property. The mortgage note bears interest at the rate of LIBOR plus a margin of 325 basis points (3.5% at each of March 31, 2013 (unaudited) and December 31, 2012). The mortgage note has a maturity date of April 2, 2015, which may be extended for two additional one-year periods at the borrower’s election and upon the satisfaction of certain conditions. |
15. Related Party Transactions
Prior to the Offering, Excel Realty Holdings, LLC, a company wholly-owned by Mr. Sabin (“ERH”), managed operations of ETP under various management agreements. Fees paid to ERH for property management services were $43,000 from January 1, 2010 to April 27, 2010.
Subsequent to the Offering, many of the employees of ERH became employees of the general partner. ERH reimburses the general partner for estimated time the general partner employees spend on ERH related matters. For the three months ended March 31, 2013 and 2012 (unaudited), for the years ended December 31, 2012 and 2011 and for the period from April 28, 2010 to December 31, 2010, approximately $83,000, $68,000, $313,000, $261,000 and $118,000, respectively, was reimbursed to the general partner from ERH and included in other income in the consolidated and combined statements of operations.
At March 31, 2013 (unaudited), the Operating Partnership had recognized an amount due from its general partner of approximately $2.9 million (classified within other assets in the consolidated balance sheets) relating to proceeds from the issuance of the general partner’s common stock (with the issuance of an equivalent number of common OP units to the general partner), which had not yet been contributed to the Operating Partnership. The Operating Partnership collected the receivable in April 2013.
16. Income Taxes
As a partnership, the allocated share of income of the Operating Partnership is included in the income tax returns of the general and limited partners. Accordingly, no accounting for income taxes is required in the accompanying consolidated financial statements. The Operating Partnership may be subject to certain state or local taxes on its income and property.
The Operating Partnership has formed a taxable REIT subsidiary (the “TRS”) on behalf of the general partner. In general, the TRS may perform non-customary services for tenants, hold assets that the general partner cannot hold directly and, except for the operation or management of health care facilities or lodging facilities or the providing of any person, under a franchise, license or otherwise, rights to any brand name under which any lodging facility or health care facility is operated, may engage in any real estate or non-real estate related business. The TRS is subject to corporate federal income taxes on its taxable income at regular corporate tax rates. There is no tax provision for the TRS for the periods presented in the accompanying consolidated statements of income due to net operating losses incurred. No tax benefits have been recorded since it is not considered more likely than not that the deferred tax asset related to the net operating loss carryforwards will be utilized.
The common OP units and Series A and Series B preferred units distributions made to holders of record as of December 31, 2012 and paid in 2013 were considered 2013 distributions for federal income tax purposes.
ETP’s real estate entities were partnerships and limited liability companies. Under applicable federal and state income tax rules, the allocated unit of net income or loss from partnerships and limited liability companies is reportable in the income tax returns of the partners and members. Accordingly, no income tax provision is included in the accompanying combined financial statements of the Predecessor.
118
Table of Contents
17. Commitments and Contingencies
Litigation:
The Operating Partnership is not presently subject to any material litigation nor, to its knowledge, is any material litigation threatened against it which if determined unfavorably, would have a material adverse effect on its consolidated and combined financial position, results of operations or cash flows.
Environmental Matters:
The Operating Partnership follows the policy of monitoring its properties for the presence of hazardous or toxic substances. While there can be no assurance that a material environmental liability does not exist at its properties, the Operating Partnership is not currently aware of any environmental liability with respect to its properties that would have a material effect on its consolidated and combined financial position, results of operations or cash flows. Further, the Operating Partnership is not aware of any environmental liability or any unasserted claim or assessment with respect to an environmental liability that it believes would require additional disclosure or the recording of a loss contingency.
Other:
The Operating Partnership’s other commitments and contingencies include the usual obligations of real estate owners and operators in the normal course of business. In management’s opinion, these matters are not expected to have a material adverse effect on its consolidated balance sheets, results of operations or cash flows. In addition, the Operating Partnership expects to incur construction costs relating to development projects on portions of existing operating properties (including the Operating Partnership’s proportionate share of costs related to the redevelopment of the unconsolidated La Costa Town Center property).
18. Fair Value of Financial Instruments
The Operating Partnership is required to disclose fair value information relating to financial instruments that are remeasured on a recurring basis and those that are only initially recognized at fair value (not required to be subsequently remeasured). The Operating Partnership’s disclosures of estimated fair value of financial instruments were determined using available market information and appropriate valuation methods. The use of different assumptions or methods of estimation may have a material effect on the estimated fair value of financial instruments.
The following tables reflects the fair values of the Operating Partnership’s financial assets and liabilities that are required to be measured at fair value on a recurring basis (in thousands):
| Balance at March 31, 2013 (unaudited) |
Quoted Prices in Active Markets (Level 1) (unaudited) |
Significant Other Observable Inputs (Level 2) (unaudited) |
Significant Unobservable Inputs (Level 3) (unaudited) |
|||||||||||||
| Fair value measurements on a recurring basis: |
||||||||||||||||
| Assets: |
||||||||||||||||
| Other assets related to business combinations(1) |
$ | 830 | $ | — | $ | — | $ | 830 | ||||||||
| Liabilities: |
||||||||||||||||
| Interest rate swaps (see Note 11) |
$ | (459 | ) | $ | — | $ | (459 | ) | $ | — | ||||||
| Contingent consideration related to business combinations(2) |
(1,787 | ) | — | — | (1,787 | ) | ||||||||||
|
|
|
|
|
|
|
|
|
|||||||||
| Total |
$ | (2,246 | ) | $ | — | $ | (459 | ) | $ | (1,787 | ) | |||||
|
|
|
|
|
|
|
|
|
|||||||||
| Balance at December 31, 2012 |
Quoted Prices in Active Markets (Level 1) |
Significant Other Observable Inputs (Level 2) |
Significant Unobservable Inputs (Level 3) |
|||||||||||||
| Fair value measurements on a recurring basis: |
||||||||||||||||
| Assets: |
||||||||||||||||
| Other assets related to business combinations(1) |
$ | 992 | $ | — | $ | — | $ | 992 | ||||||||
| Liabilities: |
||||||||||||||||
| Interest rate swaps (see Note 11) |
$ | (620 | ) | $ | — | $ | (620 | ) | $ | — | ||||||
| Contingent consideration related to business combinations(2) |
(1,787 | ) | — | — | (1,787 | ) | ||||||||||
| Derivative instrument related to business combinations (see Note 11)(3) |
(274 | ) | — | — | (274 | ) | ||||||||||
|
|
|
|
|
|
|
|
|
|||||||||
| Total |
$ | (2,681 | ) | $ | — | $ | (620 | ) | $ | (2,061 | ) | |||||
|
|
|
|
|
|
|
|
|
|||||||||
119
Table of Contents
| Balance at December 31, 2011 |
Quoted Prices in Active Markets (Level 1) |
Significant Other Observable Inputs (Level 2) |
Significant Unobservable Inputs (Level 3) |
|||||||||||||
| Fair value measurements on a recurring basis: |
||||||||||||||||
| Assets: |
||||||||||||||||
| Investment in equity securities (see Note 2) |
$ | 9,164 | $ | 9,164 | $ | — | $ | — | ||||||||
| Liabilities: |
||||||||||||||||
| Interest rate swaps (see Note 11) |
$ | (965 | ) | $ | — | $ | (965 | ) | $ | — | ||||||
| Contingent consideration related to business combinations(2) |
(1,613 | ) | — | — | (1,613 | ) | ||||||||||
| Derivative instrument related to business combinations (see Note 11)(3) |
(3,050 | ) | — | — | (3,050 | ) | ||||||||||
|
|
|
|
|
|
|
|
|
|||||||||
| Total |
$ | (5,628 | ) | $ | — | $ | (965 | ) | $ | (4,663 | ) | |||||
|
|
|
|
|
|
|
|
|
|||||||||
| (1) | Amount reflects the fair value of funds expected to be received pursuant to master lease agreements executed in connection with the Promenade Corporate Center acquisition. The Operating Partnership has estimated the fair value of the asset based on its expectations of the probability of leasing or releasing spaces within the term of the master lease agreements and corresponding estimates for time required to lease, lease rates and funds required for tenant improvements and lease commissions. This amount has been included in other assets in the accompanying consolidated balance sheets, with subsequent changes in the fair value of the asset recorded as a gain (loss) in earnings in the period in which the change occurs. |
| (2) | Additional consideration was due to the prior owners of two properties acquired in 2010 based on their ability to lease-up vacant space or sell a land parcel through a defined period following the acquisition date. Additional consideration in the amount of $391,000 relating to one of the two properties was paid in 2011. The remaining contingent consideration included in the balance of accounts payable and other liabilities in the accompanying consolidated balance sheet at December 31, 2011 represents approximately $1.6 million in earn-outs paid to a prior owner in January 2012. Additional consideration may be due to the prior owners of two properties purchased in 2012 based upon their ability to lease-up vacant space at those properties during 2013. The balance of $1.8 million at March 31, 2013 (unaudited) and December 31, 2012 represents the Operating Partnership’s best estimate of the fair value of funds expected to be paid to the former owners (the maximum amount of contingent consideration that may be contractually earned by the prior owners is $8.0 million—unaudited). |
| (3) | Amount reflects the fair value of a provision within a purchase agreement that provides a guaranteed redemption value for common OP units provided to the sellers of a property acquired in March 2011 (see Note 3 for additional details). The Operating Partnership has estimated the fair value of the embedded derivative instrument using a Monte Carlo valuation model based on the historical volatility and closing price of the general partner’s common stock and a risk-free interest rate. This amount is included in accounts payable and other liabilities in the accompanying consolidated balance sheets, with changes in the fair value of the embedded derivative recorded as gain (loss) on changes in fair value of financial instruments and gain on common operating partnership unit redemption in the consolidated and combined statements of operations. This embedded derivative instrument expired on March 11, 2013. |
During the year ended December 31, 2012, a total of 571,570 common OP units related to the Edwards Theatres acquisition were tendered to the general partner for redemption, resulting in the issuance of an additional 509,694 shares of the general partner’s common stock (and the issuance of an equivalent number of common OP units to the general partner) and cash payments totaling approximately $1.9 million to former unitholders. During the three months ended March 31, 2013(unaudited), a total of 19,904 common OP units related to the Edwards Theatres acquisition were tendered to the general partnership for redemption, resulting in the issuance of an additional 22,074 shares of the general partner’s common stock to former unitholders (and the issuance of an equivalent number of common OP units to the general partner. The Operating Partnership has recognized the redemption of common OP units based on the fair value of shares of the general partner’s common stock issuable in connection with the one-for-one redemption right available to all holders of common OP units. The Operating Partnership recognized a loss of approximately $16,000 and a gain of approximately $536,000 for the three months ended March 31, 2013 (unaudited) and for the year ended December 31, 2012, respectively, as a result of the deficit or excess of the fair value of the guarantee over the fair value of the consideration required to settle. In total, the Operating Partnership recognized increases in general partnership interest, of approximately $279,000 and $6.1 million for the three months ended March 31, 2013 (unaudited) and for the year ended December 31, 2012, respectively. The Operating Partnership also recognized additional gains of $246,000 and $994,000 for the three months ended March 31, 2013 (unaudited) and for the year ended December 31, 2012, respectively, as a result of revaluations of the redemption obligation.
120
Table of Contents
The following table reconciles the beginning and ending balances of financial instruments that are remeasured on a recurring basis using significant unobservable inputs (Level 3) as of March 31, 2013 (unaudited-in thousands):
| Other Assets Related to Business Combinations(1) |
Contingent Consideration Related to Business Combinations(2) |
Derivative Instruments Related to Business Combinations(3) |
||||||||||
| Beginning balance, January 1, 2013 |
$ | 992 | $ | (1,787 | ) | $ | (274 | ) | ||||
| Total gains: |
||||||||||||
| Included in earnings |
— | — | 246 | |||||||||
| Purchases, issuances, or settlements |
(162 | ) | — | 28 | ||||||||
|
|
|
|
|
|
|
|||||||
| Ending balance, March 31, 2013 |
$ | 830 | $ | (1,787 | ) | $ | — | |||||
|
|
|
|
|
|
|
|||||||
| (1) | The change of $162,000 for other assets related to business combinations during the three months ended March 31, 2013 is comprised of payments received on the master lease assets. |
| (2) | There was no change in the contingent consideration related to business combinations during the three months ended March 31, 2013, with the earn-out periods related to the two applicable acquisitions ending on June 30, 2013 and September 30, 2013, respectively. |
| (3) | The change of $274,000 for derivative instruments related to business combinations during the three months ended March 31, 2013 is related to changes to the redemption provision for common OP units issued in connection with the 2011 Edwards Theatres acquisition as a result of (a) a decrease of $246,000 due to recognition of a gain included in earnings related to changes in the fair value of the redemption obligation and (b) a decrease of $28,000 due to the redemption of corresponding common OP units. |
The following table reconciles the beginning and ending balances of financial instruments that are remeasured on a recurring basis using significant unobservable inputs (Level 3) as of December 31, 2012 (in thousands):
| Other Assets Related to Business Combinations(1) |
Contingent Consideration Related to Business Combinations(2) |
Derivative Instruments Related to Business Combinations(3) |
||||||||||
| Beginning balance, January 1, 2012 |
$ | — | $ | (1,613 | ) | $ | (3,050 | ) | ||||
| Total gains: |
||||||||||||
| Included in earnings |
281 | — | 1,530 | |||||||||
| Purchases, issuances, or settlements |
711 | (174 | ) | 1,246 | ||||||||
|
|
|
|
|
|
|
|||||||
| Ending balance, December 31, 2012 |
$ | 992 | $ | (1,787 | ) | $ | (274 | ) | ||||
|
|
|
|
|
|
|
|||||||
| (1) | The change of $992,000 for other assets related to business combinations during the year ended December 31, 2012 is comprised of (a) an increase in the master lease asset of $281,000 due to changes in the Operating Partnership’s initial estimates of the fair value of funds expected to be received from escrow that was included in earnings (b) an increase due to the recognition of an original master lease asset of $772,000 related to the acquisition of the Promenade Corporate Center property and (c) a decrease in the master lease asset due to payments received in the amount of $61,000. |
| (2) | The change of $174,000 for contingent consideration related to business combinations (liability) is comprised of (a) a decrease in the liability balance due to the payment of approximately $1.6 million in earn-outs in January 2012 and (b) an increase from the recognition of contingent consideration due to former owners of two properties purchased in 2012 in the amount of approximately $1.8 million based on the Operating Partnership’s best estimate of the fair value of funds expected to be paid as of December 31, 2012. |
| (3) | The change of $2.8 million for derivative instruments related to business combinations during the year ended December 31, 2012 is comprised of changes to the redemption provision related to common OP units issued in connection with the 2011 Edwards Theatres acquisition due to (a) a gain of $1.5 million included in earnings related to changes in the fair value of the redemption obligation and (b) a decrease of $1.2 million due to the redemption of corresponding common OP units. |
121
Table of Contents
The following table reconciles the beginning and ending balances of financial instruments that are remeasured on a recurring basis using significant unobservable inputs (Level 3) as of December 31, 2011 (in thousands):
| Contingent Consideration Related to Business Combinations(1) |
Derivative Instruments Related to Business Combinations(2) |
|||||||
| Beginning balance, January 1, 2011 |
$ | (2,438 | ) | $ | — | |||
| Total gains: |
||||||||
| Included in earnings |
434 | 1,154 | ||||||
| Purchases, issuances, or settlements |
391 | (4,204 | ) | |||||
|
|
|
|
|
|||||
| Ending balance, December 31, 2011 |
$ | (1,613 | ) | $ | (3,050 | ) | ||
|
|
|
|
|
|||||
| (1) | The change of $825,000 for contingent consideration related to business combinations during the year ended December 31, 2011 is due to (a) the payment of additional consideration in the amount of $391,000 to the former owners of a property purchased in 2010 and (b) a gain of $434,000 recognized as a change in the fair value of contingent consideration due to changes in the Operating Partnership’s initial estimates of the fair value of contingent consideration as a result of a fewer number of executed leases or purchase agreements. |
| (2) | The change of $3.1 million for derivative instruments related to business combinations during the year ended December 31, 2011 is comprised of (a) the recognition of a liability in the amount of $4.2 million in connection with the purchase of the Edwards Theatres property in March 2011 and (b) a cumulative gain of $1.2 million included in earnings related to the change in the fair value of the derivative liability for the cumulative period since the recognition of the liability in March 2011. |
There were no additional gains or losses, purchases, sales, issuances, settlements, or transfers in or out related to any of the three levels of the fair value hierarchy during the three months ended March 31, 2013 (unaudited) and for the years ended December 31, 2012, 2011 and 2010.
The following table provides quantitative disclosure about significant unobservable inputs related to financial assets and liabilities measured on a recurring basis (Level 3 of the fair value hierarchy) as of March 31, 2013 (unaudited – in thousands):
| Fair Value at March 31, 2013 |
Valuation Technique(s) |
Unobservable Input | Range (Weighted Average) | |||||||||||
| Other assets related to business combinations(1) |
$ | 830 | Cash flow |
|
Tenant improvement allowance Lease commission TI construction period |
|
$12.00-$35.00/sf 6.0% 2-5 months | |||||||
| Contingent consideration related to business combinations(2) |
$ | (1,787 | ) | Cash flow |
|
Tenant improvement Costs Lease commission TI construction period |
|
$12.00-$33.00/sf 6.0% 2 months | ||||||
| (1) | The significant unobservable inputs used in the fair value measurement of the master lease agreement asset are any estimated tenant improvement allowances, leasing commissions and the construction periods associated with projected new leasing. Significant increases (decreases) in any of these inputs in isolation would result in a significantly higher (lower) fair value measurement. Generally, a change in the assumption used for market lease rates is accompanied by a directionally similar change in the assumption used for tenant improvement allowances and/or leasing commissions. |
| (2) | The significant unobservable inputs used in the fair value measurement of the contingent consideration are any estimated tenant improvement allowances, leasing commissions and lease rates. Significant increases (decreases) in any of these inputs in isolation would result in a significantly lower (higher) fair value measurement. Generally, a change in the assumption used for market lease rates is accompanied by a directionally similar change in the assumption used for tenant improvement allowances and/or leasing commissions. |
122
Table of Contents
The following table provides quantitative disclosure about significant unobservable inputs related to financial assets and liabilities measured on a recurring basis (Level 3 of the fair value hierarchy) as of December 31, 2012 (in thousands):
| Fair Value at December 31, 2012 |
Valuation Technique(s) |
Unobservable Input | Range (Weighted Average) | |||||||||||
| Other assets related to business combinations(1) |
$ | 992 | Cash flow |
|
Tenant improvement allowance Lease commission TI construction period |
|
$30.00/sf-$35.00/sf 6.0% 5 months | |||||||
| Contingent consideration related to business combinations(2) |
$ | (1,787 | ) | Cash flow |
|
Tenant improvement costs Lease rate |
|
$35.00-$45.00/sf $10.00-$24.00/sf | ||||||
| Derivative instrument related to business combinations(3) |
$ | (274 | ) | Monte Carlo |
|
Share volatility Expected term Risk free rate |
|
21.0% 0.2 years 0.05% | ||||||
| (1) | The significant unobservable inputs used in the fair value measurement of the master lease agreement asset are any estimated tenant improvement allowances, leasing commissions and the construction periods associated with projected new leasing. Significant increases (decreases) in any of these inputs in isolation would result in a significantly higher (lower) fair value measurement. Generally, a change in the assumption used for market lease rates is accompanied by a directionally similar change in the assumption used for tenant improvement allowances and/or leasing commissions. |
| (2) | The significant unobservable inputs used in the fair value measurement of the contingent consideration are any estimated tenant improvement allowances, leasing commissions and lease rates. Significant increases (decreases) in any of these inputs in isolation would result in a significantly lower (higher) fair value measurement. Generally, a change in the assumption used for market lease rates is accompanied by a directionally similar change in the assumption used for tenant improvement allowances and/or leasing commissions. |
| (3) | The significant unobservable inputs used in the fair value measurement of the redemption provision are share volatility, risk-free rate and expected term. Significant increases (decreases) in any of these inputs in isolation would result in a significantly higher (lower) fair value measurement. Generally, a change in the assumption used for the share volatility is reflective of changes in the underlying fair value of the Company’s common stock and those of peer companies utilized in the analysis (Level 1 of the fair value hierarchy), which could significantly affect the estimated fair value of the underlying derivative instrument. |
The Operating Partnership has not elected the fair value measurement option for any of its other financial assets or liabilities. The Operating Partnership has estimated the fair value of its financial assets using a discounted cash flow analysis based on an appropriate market rate for a similar type of instrument. The Operating Partnership has estimated the fair value of its financial liabilities by using either (1) a discounted cash flow analysis using an appropriate market discount rate for similar types of instruments, or (2) a present value model and an interest rate that includes a credit value adjustment based on the estimated value of the property that serves as collateral for the underlying debt. The fair values of financial instruments not included in this table are estimated to be equal to their carrying amounts.
The fair values of certain additional financial assets and liabilities at March 31, 2013 (unaudited), December 31, 2012 and December 31, 2011 (fair value measurements categorized as Level 3 of the fair value hierarchy) are as follows (in thousands):
| March 31, 2013 | December 31, 2012 | December 31, 2011 | ||||||||||||||||||||||
| Carrying Amount |
Fair Value | Carrying Amount |
Fair Value | Carrying Amount |
Fair Value | |||||||||||||||||||
| Financial assets: |
||||||||||||||||||||||||
| Note receivable (Other Assets) |
$ | 750 | $ | 750 | $ | 750 | $ | 750 | $ | — | $ | — | ||||||||||||
| Mortgage loan receivable |
— | — | — | — | 2,000 | 2,000 | ||||||||||||||||||
| Financial liabilities: |
||||||||||||||||||||||||
| Mortgage notes payable |
332,732 | 340,158 | 333,935 | 341,288 | 244,961 | 248,597 | ||||||||||||||||||
| Notes payable |
88,000 | 88,047 | 75,000 | 74,862 | 21,000 | 20,661 | ||||||||||||||||||
19. Segment Disclosure
The Operating Partnership’s reportable segments consist of the three types of commercial real estate properties for which management internally evaluates operating performance and financial results: Office Properties, Multi-family Properties (new in 2012) and Retail Properties. The Operating Partnership was formed for the primary purpose of owning and operating Retail Properties. As such, administrative costs after the Offering are shown under the Retail Properties segment. The Retail Properties operating segment also includes undeveloped land which the Operating Partnership intends to develop into retail properties.
123
Table of Contents
The Operating Partnership evaluates the performance of the operating segments based upon property operating income. “Property Operating Income” is defined as operating revenues (rental revenue and tenant recoveries) less property operating expenses (maintenance and repairs, real estate taxes, management fees, and other operating expenses). The Operating Partnership also evaluates interest expense, interest income and depreciation and amortization by segment. Corporate general and administrative expense, interest expense related to corporate indebtedness and other non-recurring gains or losses are reflected within the Retail Properties operating segment as this constitutes the Operating Partnership’s primary business objective and represents the majority of its operations. There is no intersegment activity.
The following table reconciles the Operating Partnership and ETP’s segment activity to their combined results of operations for the three months ended March 31, 2013 and 2012, for the years ended December 31, 2012 and 2011 and for the periods from January 1, 2010 to April 27, 2010 and April 28, 2010 to December 31, 2010 (in thousands).
| For the Three Months Ended March 31, 2013 (unaudited) |
For the Three Months Ended March 31, 2012 (unaudited) |
For the Year Ended December 31, 2012 |
For the Year Ended December 31, 2011 |
For the Period from April 28, 2010 to December 31, 2010 |
For the Period from January 1, 2010 to April 27, 2010 |
|||||||||||||||||||
| Office Properties: |
||||||||||||||||||||||||
| Total revenues |
$ | 2,050 | $ | 1,832 | $ | 8,522 | $ | 3,180 | $ | 2,349 | $ | 1,021 | ||||||||||||
| Property operating expenses |
(845 | ) | (598 | ) | (3,253 | ) | (712 | ) | (437 | ) | (212 | ) | ||||||||||||
|
|
|
|
|
|
|
|
|
|
|
|
|
|||||||||||||
| Property operating income, as defined |
1,205 | 1,234 | 5,269 | 2,468 | 1,912 | 809 | ||||||||||||||||||
| General and administrative costs |
(5 | ) | (67 | ) | (102 | ) | (1 | ) | — | (5 | ) | |||||||||||||
| Depreciation and amortization |
(940 | ) | (794 | ) | (3,748 | ) | (957 | ) | (687 | ) | (326 | ) | ||||||||||||
| Interest expense |
(192 | ) | (198 | ) | (791 | ) | (803 | ) | (545 | ) | (269 | ) | ||||||||||||
| Changes in fair value of contingent consideration |
— | — | 281 | — | — | — | ||||||||||||||||||
|
|
|
|
|
|
|
|
|
|
|
|
|
|||||||||||||
| Net income |
$ | 68 | $ | 175 | $ | 909 | $ | 707 | $ | 680 | $ | 209 | ||||||||||||
|
|
|
|
|
|
|
|
|
|
|
|
|
|||||||||||||
| Multi-family Properties: |
||||||||||||||||||||||||
| Total revenues |
$ | 1,320 | $ | — | $ | 1,074 | $ | — | $ | — | $ | — | ||||||||||||
| Property operating expenses |
(304 | ) | — | (233 | ) | — | — | — | ||||||||||||||||
|
|
|
|
|
|
|
|
|
|
|
|
|
|||||||||||||
| Property operating income, as defined |
1,016 | — | 841 | — | — | — | ||||||||||||||||||
| General and administrative costs |
(144 | ) | — | (135 | ) | — | — | — | ||||||||||||||||
| Depreciation and amortization |
(1,149 | ) | — | (766 | ) | — | — | — | ||||||||||||||||
|
|
|
|
|
|
|
|
|
|
|
|
|
|||||||||||||
| Net loss |
$ | (277) | $ | — | $ | (60 | ) | $ | — | $ | — | $ | — | |||||||||||
|
|
|
|
|
|
|
|
|
|
|
|
|
|||||||||||||
| Retail Properties: |
||||||||||||||||||||||||
| Total revenues |
$ | 24,159 | $ | 17,948 | $ | 77,548 | $ | 52,047 | $ | 11,962 | $ | 547 | ||||||||||||
| Property operating expenses |
(5,353 | ) | (3,809 | ) | (17,122 | ) | (12,701 | ) | (2,909 | ) | (167 | ) | ||||||||||||
|
|
|
|
|
|
|
|
|
|
|
|
|
|||||||||||||
| Property operating income, as defined |
18,806 | 14,139 | 60,426 | 39,346 | 9,053 | 380 | ||||||||||||||||||
| General and administrative costs |
(3,685 | ) | (3,435 | ) | (13,541 | ) | (12,772 | ) | (7,095 | ) | (3 | ) | ||||||||||||
| Depreciation and amortization |
(10,301 | ) | (7,485 | ) | (31,507 | ) | (22,333 | ) | (5,590 | ) | (216 | ) | ||||||||||||
| Interest expense |
(4,606 | ) | (3,476 | ) | (15,765 | ) | (12,378 | ) | (3,147 | ) | (214 | ) | ||||||||||||
| Interest income |
50 | 53 | 173 | 297 | 166 | — | ||||||||||||||||||
| Income (loss) from equity in unconsolidated entities |
39 | — | (320 | ) | — | — | — | |||||||||||||||||
| Gain on acquisition of real estate and sale of land parcel |
— | — | — | 1,479 | 978 | — | ||||||||||||||||||
124
Table of Contents
| For the Three Months Ended March 31, 2013 (unaudited) |
For the Three Months Ended March 31, 2012 (unaudited) |
For the Year Ended December 31, 2012 |
For the Year Ended December 31, 2011 |
For the Period from April 28, 2010 to December 31, 2010 |
For the Period from January 1, 2010 to April 27, 2010 |
|||||||||||||||||||
| Changes in fair value of financial instruments and gain on common operating partnership unit redemption |
230 | 462 | 1,530 | 1,154 | — | — | ||||||||||||||||||
|
|
|
|
|
|
|
|
|
|
|
|
|
|||||||||||||
| Income (loss) from continuing operations |
533 | 258 | 996 | (5,207 | ) | (5,635 | ) | (53 | ) | |||||||||||||||
| Income from discontinued operations |
— | — | — | 4,999 | 1,082 | — | ||||||||||||||||||
|
|
|
|
|
|
|
|
|
|
|
|
|
|||||||||||||
| Net income (loss) |
$ | 533 | $ | 258 | $ | 996 | $ | (208 | ) | $ | (4,553 | ) | $ | (53 | ) | |||||||||
|
|
|
|
|
|
|
|
|
|
|
|
|
|||||||||||||
| Total Reportable Segments: |
||||||||||||||||||||||||
| Total revenues |
$ | 27,529 | $ | 19,780 | $ | 87,144 | $ | 55,227 | $ | 14,311 | $ | 1,568 | ||||||||||||
| Property operating expenses |
(6,502 | ) | (4,407 | ) | (20,608 | ) | (13,413 | ) | (3,346 | ) | (379 | ) | ||||||||||||
|
|
|
|
|
|
|
|
|
|
|
|
|
|||||||||||||
| Property operating income, as defined |
21,027 | 15,373 | 66,536 | 41,814 | 10,965 | 1,189 | ||||||||||||||||||
| General and administrative expenses |
(3,834 | ) | (3,502 | ) | (13,778 | ) | (12,773 | ) | (7,095 | ) | (8 | ) | ||||||||||||
| Depreciation and amortization |
(12,390 | ) | (8,279 | ) | (36,021 | ) | (23,290 | ) | (6,277 | ) | (542 | ) | ||||||||||||
| Interest expense |
(4,798 | ) | (3,674 | ) | (16,556 | ) | (13,181 | ) | (3,692 | ) | (483 | ) | ||||||||||||
| Interest income |
50 | 53 | 173 | 297 | 166 | — | ||||||||||||||||||
| Income (loss) from equity in unconsolidated entities |
39 | — | (320 | ) | — | — | — | |||||||||||||||||
| Gain on acquisition of real estate and sale of land parcel |
— | — | — | 1,479 | 978 | — | ||||||||||||||||||
| Changes in fair value of contingent consideration |
— | — | 281 | — | — | — | ||||||||||||||||||
| Changes in fair value of financial instruments and gain on common operating partnership unit redemption |
230 | 462 | 1,530 | 1,154 | — | — | ||||||||||||||||||
|
|
|
|
|
|
|
|
|
|
|
|
|
|||||||||||||
| Income (loss) from continuing operations |
324 | 433 | 1,845 | (4,500 | ) | (4,955 | ) | 156 | ||||||||||||||||
| Income from discontinued operations |
— | — | — | 4,999 | 1,082 | — | ||||||||||||||||||
|
|
|
|
|
|
|
|
|
|
|
|
|
|||||||||||||
| Net income (loss) |
$ | 324 | $ | 433 | $ | 1,845 | $ | 499 | $ | (3,873 | ) | $ | 156 | |||||||||||
|
|
|
|
|
|
|
|
|
|
|
|
|
|||||||||||||
125
Table of Contents
| For the Three Months Ended March 31, 2013 (unaudited) |
For the Three Months Ended March 31, 2012 (unaudited) |
For the Year Ended December 31, 2012 |
For the Year Ended December 31, 2011 |
For the Period from April 28, 2010 to December 31, 2010 |
For the Period from January 1, 2010 to April 27, 2010 |
|||||||||||||||||||
| Reconciliation to Consolidated and Combined Net Income Attributable to the Unitholders and Controlling Interest of the Predecessor: |
||||||||||||||||||||||||
| Total net income (loss) for reportable segments |
324 | 433 | 1,845 | 499 | (3,873 | ) | 156 | |||||||||||||||||
| Net (income) loss attributable to non-controlling interests |
(87 | ) | (66 | ) | (279 | ) | (104 | ) | — | — | ||||||||||||||
|
|
|
|
|
|
|
|
|
|
|
|
|
|||||||||||||
| Net income (loss) attributable to the Operating Partnership and controlling interests of the Predecessor |
$ | 237 | $ | 367 | $ | 1,566 | $ | 395 | $ | (3,873 | ) | $ | 156 | |||||||||||
|
|
|
|
|
|
|
|
|
|
|
|
|
|||||||||||||
126
Table of Contents
The following table shows the Operating Partnership’s consolidated total assets by segment at March 31, 2013, December 31, 2012 and 2011 (in thousands).
| December 31, | ||||||||||||
| March 31, 2013 (unaudited) |
2012 | 2011 | ||||||||||
| Assets: |
||||||||||||
| Office Properties: |
||||||||||||
| Total assets |
$ | 68,532 | $ | 70,473 | $ | 15,562 | ||||||
| Multi-family Properties: |
||||||||||||
| Total assets |
71,638 | 72,627 | — | |||||||||
| Retail Properties: |
||||||||||||
| Total assets |
962,671 | 936,154 | 672,109 | |||||||||
|
|
|
|
|
|
|
|||||||
| Total Reportable Segments and Consolidated Assets: |
||||||||||||
| Total assets |
$ | 1,102,841 | $ | 1,079,254 | $ | 687,671 | ||||||
|
|
|
|
|
|
|
|||||||
20. Supplemental Financial Information (unaudited)
The following represents the results of operations, expressed in thousands, except per unit amounts for each quarter during the years ended December 31, 2012 and 2011. The sum of the quarterly financial data may vary from the annual data due to rounding (in thousands, except per unit data):
| 2012 |
Mar. 31 | Jun. 30 | Sep. 30 | Dec. 31 | ||||||||||||
| Revenues |
$ | 19,780 | $ | 20,528 | $ | 21,753 | $ | 25,082 | ||||||||
| Changes in fair value of contingent consideration |
— | — | 121 | 160 | ||||||||||||
| Loss from equity in unconsolidated entities |
— | — | (158 | ) | (162 | ) | ||||||||||
| Changes in fair value of financial instruments and gain on common operating partnership unit redemption |
462 | 589 | 61 | 418 | ||||||||||||
| Net loss attributable to the unitholders |
(1,754 | ) | (2,462 | ) | (2,316 | ) | (2,255 | ) | ||||||||
| Net loss per unit-basic and diluted |
$ | (0.06 | ) | $ | (0.08 | ) | $ | (0.07 | ) | $ | (0.06 | ) | ||||
| 2011 |
Mar. 31 | Jun. 30 | Sep. 30 | Dec. 31 | ||||||||||||
| Revenues |
$ | 10,479 | $ | 12,789 | $ | 15,383 | $ | 16,576 | ||||||||
| Gain on acquisition of real estate and sale of land parcel |
937 | — | — | 542 | ||||||||||||
| Changes in fair value of financial instruments |
— | 512 | (596 | ) | 1,238 | |||||||||||
| Income from discontinued operations |
516 | 4,483 | — | — | ||||||||||||
| Net (loss) income attributable to the unitholders |
(634 | ) | 1,150 | (2,730 | ) | (625 | ) | |||||||||
| Loss from continuing operations per unit-basic and diluted |
(0.07 | ) | (0.20 | ) | (0.09 | ) | (0.03 | ) | ||||||||
| Net loss per unit-basic and diluted |
$ | (0.04 | ) | $ | 0.06 | $ | (0.09 | ) | $ | (0.03 | ) | |||||
21. Subsequent Events (unaudited)
On April 10, 2013, the Operating Partnership executed a first amendment to the loan agreement at its West Broad Village property, resulting in an extension of the maturity date to June 1, 2013. In connection with the extension, the Operating Partnership prepaid $10.0 million of the outstanding borrowings, leaving a remaining outstanding balance of $40.0 million. On April 19, 2013, the Operating Partnership refinanced the loan associated with the West Broad Village property with a new principal amount of $39.7 million, which will bear interest at a fixed rate of 3.3%. The refinancing extended the maturity date of the loan to May 1, 2020.
On April 1, 2013, the Operating Partnership executed a purchase and sale agreement for the sale of the Pavilions Crossing property (retail properties segment) for a sale price of approximately $16.3 million, which would result in a gain on sale if consummated. The sale of this property is subject to due diligence and other customary closing conditions.
On April 29, 2013, the Operating Partnership utilized borrowings from its unsecured credit facility to prepay approximately $20.0 million in mortgage notes maturing in 2013 at its Five Forks Place and Grant Creek Town Center properties.
Subsequent events have been evaluated through May 28, 2013, the date the financial statements were issued.
127
Table of Contents
EXCEL TRUST L.P. PREDECESSOR
SCHEDULE II — VALUATION AND QUALIFYING ACCOUNTS
(Dollars in thousands)
| Additions | Deductions | Adjustments | ||||||||||||||||||
| Balance at Beginning of Year |
Charged to Bad Debt Expense |
Accounts Receivable Written- off’ |
Accounts Receivable Assumed |
Balance at End of Year |
||||||||||||||||
| Allowance for bad debts: |
||||||||||||||||||||
| Year ended December 31, 2012 |
$ | 631 | $ | 690 | $ | (602 | ) | $ | — | $ | 719 | |||||||||
|
|
|
|
|
|
|
|
|
|
|
|||||||||||
| Year ended December 31, 2011 |
$ | 605 | $ | 800 | $ | (774 | ) | $ | — | $ | 631 | |||||||||
|
|
|
|
|
|
|
|
|
|
|
|||||||||||
| Period from April 28, 2010 to December 31, 2010 |
$ | 69 | $ | 348 | $ | (88 | ) | $ | 276 | $ | 605 | |||||||||
|
|
|
|
|
|
|
|
|
|
|
|||||||||||
| Period from January 1, 2010 to April 27, 2010 |
$ | 58 | $ | 16 | $ | (5 | ) | $ | — | $ | 69 | |||||||||
|
|
|
|
|
|
|
|
|
|
|
|||||||||||
128
Table of Contents
EXCEL TRUST L.P. PREDECESSOR
SCHEDULE III — REAL ESTATE AND ACCUMULATED DEPRECIATION
December 31, 2012
(Dollars in thousands)
| Initial Cost | Cost Capitalized Subsequent to Acquisition |
Carrying Amount as of the Close of Period |
||||||||||||||||||||||||||||||||||||||||||
| Properties |
Encum- brances |
Land | Building & Improve- ments |
Land | Building & Improve- ments |
Land | Building & Improve- ments |
TOTAL | Accumlated Depre- ciation |
Total Cost Net of Depre- ciation |
Year Acquired |
|||||||||||||||||||||||||||||||||
| West Broad Village(2) |
$ | 50,000 | $ | 24,339 | $ | 138,857 | $ | — | $ | 430 | $ | 24,339 | $ | 139,287 | $ | 163,626 | $ | (646 | ) | $ | 162,980 | 2012 | ||||||||||||||||||||||
| The Promenade |
49,703 | 51,025 | 47,202 | — | 185 | 51,025 | 47,387 | 98,412 | (2,648 | ) | 95,764 | 2011 | ||||||||||||||||||||||||||||||||
| Park West Place |
55,800 | 41,287 | 37,991 | — | 729 | 41,287 | 38,720 | 80,007 | (3,415 | ) | 76,592 | 2010 | ||||||||||||||||||||||||||||||||
| Gilroy Crossing |
46,646 | 22,520 | 39,903 | — | 39 | 22,520 | 39,942 | 62,462 | (2,713 | ) | 59,749 | 2011 | ||||||||||||||||||||||||||||||||
| Promenade Corporate Center |
— | 4,477 | 44,465 | — | 624 | 4,477 | 45,089 | 49,566 | (1,478 | ) | 48,088 | 2012 | ||||||||||||||||||||||||||||||||
| Plaza at Rockwall(3) |
— | 14,935 | 21,247 | (553 | ) | 10,963 | 14,382 | 32,210 | 46,592 | (2,636 | ) | 43,956 | 2010 | |||||||||||||||||||||||||||||||
| Brandywine Crossing |
— | 20,047 | 18,620 | — | 602 | 20,047 | 19,222 | 39,269 | (1,756 | ) | 37,513 | 2010 | ||||||||||||||||||||||||||||||||
| Lake Pleasant Pavilion |
28,176 | 9,958 | 28,127 | — | (2 | ) | 9,958 | 28,125 | 38,083 | (563 | ) | 37,520 | 2012 | |||||||||||||||||||||||||||||||
| Dellagio(2) |
— | 16,610 | 19,964 | — | — | 16,610 | 19,964 | 36,574 | (149 | ) | 36,425 | 2012 | ||||||||||||||||||||||||||||||||
| Vestavia Hills City Center(1) |
1,184 | 8,356 | 20,429 | — | 2,037 | 8,356 | 22,466 | 30,822 | (1,923 | ) | 28,899 | 2010/2011 | ||||||||||||||||||||||||||||||||
| The Crossings of Spring Hill |
— | 5,103 | 23,196 | — | — | 5,103 | 23,196 | 28,299 | (993 | ) | 27,306 | 2011 | ||||||||||||||||||||||||||||||||
| Red Rock Commons |
13,800 | 10,823 | — | — | 18,418 | 10,823 | 18,418 | 29,241 | (684 | ) | 28,557 | 2007 | ||||||||||||||||||||||||||||||||
| Edwards Theatres |
11,859 | 10,283 | 13,600 | — | — | 10,283 | 13,600 | 23,883 | (1,105 | ) | 22,778 | 2011 | ||||||||||||||||||||||||||||||||
| Rosewick Crossing |
— | 12,024 | 10,499 | — | 35 | 12,024 | 10,534 | 22,558 | (1,114 | ) | 21,444 | 2010 | ||||||||||||||||||||||||||||||||
| EastChase Market Center |
— | 4,215 | 19,567 | — | 7 | 4,215 | 19,574 | 23,789 | (654 | ) | 23,135 | 2012 | ||||||||||||||||||||||||||||||||
| Excel Centre |
12,284 | 1,095 | 10,716 | — | 7,117 | 1,095 | 17,833 | 18,928 | (4,530 | ) | 14,398 | 2004 | ||||||||||||||||||||||||||||||||
| 5000 South Hulen |
13,655 | 2,230 | 16,514 | — | 46 | 2,230 | 16,560 | 18,790 | (1,634 | ) | 17,156 | 2010 | ||||||||||||||||||||||||||||||||
| Chimney Rock |
— | 7,369 | 14,627 | — | 176 | 7,369 | 14,803 | 22,172 | (174 | ) | 21,998 | 2012 | ||||||||||||||||||||||||||||||||
| Grant Creek Town Center |
15,342 | 6,805 | 13,116 | — | 56 | 6,805 | 13,172 | 19,977 | (1,401 | ) | 18,576 | 2010 | ||||||||||||||||||||||||||||||||
| Lowe’s |
13,511 | 6,774 | 8,986 | — | 281 | 6,774 | 9,267 | 16,041 | (789 | ) | 15,252 | 2010 | ||||||||||||||||||||||||||||||||
| Anthem Highlands |
— | 5,929 | 9,819 | — | — | 5,929 | 9,819 | 15,748 | (399 | ) | 15,349 | 2011 | ||||||||||||||||||||||||||||||||
| Pavilion Crossing |
— | 3,729 | 9,268 | — | — | 3,729 | 9,268 | 12,997 | (81 | ) | 12,916 | 2012 | ||||||||||||||||||||||||||||||||
| Shops at Foxwood |
— | 4,680 | 6,889 | — | 66 | 4,680 | 6,955 | 11,635 | (504 | ) | 11,131 | 2010 | ||||||||||||||||||||||||||||||||
| Northside Plaza |
12,000 | 6,477 | 893 | — | 6,765 | 6,477 | 7,658 | 14,135 | (509 | ) | 13,626 | 2010 | ||||||||||||||||||||||||||||||||
| Meadow Ridge Plaza(2) |
— | 3,969 | 4,490 | — | — | 3,969 | 4,490 | 8,459 | (36 | ) | 8,423 | 2012 | ||||||||||||||||||||||||||||||||
| Shoppes of Belmere(2) |
— | 4,701 | 5,122 | — | — | 4,701 | 5,122 | 9,823 | (28 | ) | 9,795 | 2012 | ||||||||||||||||||||||||||||||||
| Lake Burden Shoppes(2) |
— | 3,981 | 4,020 | — | — | 3,981 | 4,020 | 8,001 | (22 | ) | 7,979 | 2012 | ||||||||||||||||||||||||||||||||
| Five Forks Place |
4,882 | 1,796 | 6,874 | — | (109 | ) | 1,796 | 6,765 | 8,561 | (1,744 | ) | 6,817 | 2005 | |||||||||||||||||||||||||||||||
| Mariner’s Point |
— | 1,950 | 4,220 | — | 24 | 1,950 | 4,244 | 6,194 | (403 | ) | 5,791 | 2010 | ||||||||||||||||||||||||||||||||
| Newport Town Center |
— | 1,586 | 6,571 | — | (119 | ) | 1,586 | 6,452 | 8,038 | (1,431 | ) | 6,607 | 2007 | |||||||||||||||||||||||||||||||
| Merchant Central |
4,468 | 1,059 | 4,298 | — | (4 | ) | 1,059 | 4,294 | 5,353 | (398 | ) | 4,955 | 2010 | |||||||||||||||||||||||||||||||
| Walgreens (North Corbin) |
— | 710 | 2,383 | — | — | 710 | 2,383 | 3,093 | (205 | ) | 2,888 | 2010 | ||||||||||||||||||||||||||||||||
|
|
|
|
|
|
|
|
|
|
|
|
|
|
|
|
|
|
|
|
|
|||||||||||||||||||||||||
| $ | 333,310 | $ | 320,842 | $ | 612,473 | $ | (553 | ) | $ | 48,366 | $ | 320,289 | $ | 660,839 | $ | 981,128 | $ | (36,765 | ) | $ | 944,363 | |||||||||||||||||||||||
|
|
|
|
|
|
|
|
|
|
|
|
|
|
|
|
|
|
|
|
|
|||||||||||||||||||||||||
| (1) | Includes Rite Aid, an outparcel to Vestavia Hills City Center. |
| (2) | These properties were part of a larger acquisition completed by the Operating Partnership in October 2012 (see Note 3 of the consolidated and combined financial statements contained elsewhere herein). |
| (3) | During the year ended December 31, 2011, a land parcel was sold. |
129
Table of Contents
The following is a reconciliation of total real estate carrying value and related accumulated depreciation for the years ended December 31:
| 2012 | 2011 | 2010 | ||||||||||
| Real Estate: |
||||||||||||
| Balance, beginning of period |
$ | 602,253 | $ | 373,472 | $ | 46,350 | ||||||
| Dispositions |
(23,439 | ) | (35,655 | ) | — | |||||||
| Acquisitions and additions |
402,314 | 264,436 | 327,122 | |||||||||
|
|
|
|
|
|
|
|||||||
| Balance, end of period |
$ | 981,128 | $ | 602,253 | $ | 373,472 | ||||||
|
|
|
|
|
|
|
|||||||
| Accumulated Depreciation: |
||||||||||||
| Balance, beginning of period |
$ | (18,294 | ) | $ | (8,360 | ) | $ | (4,481 | ) | |||
| Dispositions |
366 | 918 | — | |||||||||
| Acquisitions and additions |
(18,837 | ) | (10,852 | ) | (3,879 | ) | ||||||
|
|
|
|
|
|
|
|||||||
| Balance, end of period |
$ | (36,765 | ) | $ | (18,294 | ) | $ | (8,360 | ) | |||
|
|
|
|
|
|
|
|||||||
The Operating Partnership’s Federal Tax Basis at December 31, 2012 was approximately $1.1 billion.
130
Table of Contents
To the Board of Directors and Stockholders of Excel Trust, Inc.
We have audited the accompanying statement of revenues and certain expenses, (the “Historical Summary”) of Plaza at Rockwall located in Rockwall, Texas (the “Property”) for the year ended December 31, 2009. This Historical Summary is the responsibility of the Property’s management. Our responsibility is to express an opinion on the Historical Summary based on our audit.
We conducted our audit in accordance with auditing standards generally accepted in the United States of America. Those standards require that we plan and perform the audit to obtain reasonable assurance about whether the Historical Summary is free of material misstatement. An audit includes consideration of internal control over financial reporting as a basis for designing audit procedures that are appropriate in the circumstances, but not for the purpose of expressing an opinion on the effectiveness of the Property’s internal control over financial reporting. Accordingly, we express no such opinion. An audit also includes examining, on a test basis, evidence supporting the amounts and disclosures in the Historical Summary, assessing the accounting principles used and significant estimates made by management, as well as evaluating the overall presentation of the Historical Summary. We believe that our audit provides a reasonable basis for our opinion.
The accompanying Historical Summary was prepared for the purpose of complying with the rules and regulations of the Securities and Exchange Commission (for inclusion in this Registration Statement on Form 10) as described in Note 1 to the Historical Summary and is not intended to be a complete presentation of the Property’s revenue and expenses.
In our opinion, the Historical Summary of the Property presents fairly, in all material respects, the revenues and certain expenses described in Note 1 to the Historical Summary of Plaza at Rockwall located in Rockwall, Texas for the year ended December 31, 2009, in conformity with accounting principles generally accepted in the United States of America.
| /s/ DELOITTE & TOUCHE LLP |
| Los Angeles, California |
| March 4, 2010 |
| (September 9, 2010 as to paragraphs 1 and 4 in Note 1) |
131
Table of Contents
PLAZA AT ROCKWALL, ROCKWALL, TEXAS
STATEMENTS OF REVENUES AND CERTAIN EXPENSES
For the Six Months Ended June 30, 2010 and the Year Ended December 31, 2009
| Six months ended June 30, 2010 |
Year ended December 31, 2009 |
|||||||
| (unaudited) | ||||||||
| Revenues: |
||||||||
| Rental revenues |
$ | 1,434,000 | $ | 2,909,000 | ||||
| Tenant reimbursements |
569,000 | 1,149,000 | ||||||
| Other income |
— | 10,000 | ||||||
|
|
|
|
|
|||||
| Total revenue |
2,003,000 | 4,068,000 | ||||||
| Certain Expenses |
||||||||
| Property operating and maintenance |
186,000 | 345,000 | ||||||
| Property taxes |
569,000 | 1,098,000 | ||||||
| Insurance |
16,000 | 36,000 | ||||||
|
|
|
|
|
|||||
| Total certain expenses |
771,000 | 1,479,000 | ||||||
|
|
|
|
|
|||||
| Revenues in excess of certain expenses |
$ | 1,232,000 | $ | 2,589,000 | ||||
|
|
|
|
|
|||||
See accompanying notes to statements of revenues and certain expenses.
132
Table of Contents
PLAZA AT ROCKWALL, ROCKWALL, TEXAS
NOTES TO STATEMENTS OF REVENUES AND CERTAIN EXPENSES
1. Organization and Summary of Significant Accounting Policies
Organization
The accompanying statements of revenues and certain expenses include the operations of Plaza at Rockwall located in Rockwall, Texas (the “Property”) which was acquired by Excel Trust, L.P. (the “Operating Partnership”), from a nonaffiliated third party on June 29, 2010. The Property was acquired for approximately $40.8 million and has 332,989 of leasable square feet and approximately 12.7 acres of vacant land for future development.
Basis of Presentation
The statements of revenues and certain operating expenses (the “Historical Summary”) have been prepared for the purpose of complying with the provisions of Article 3-14 of Regulation S-X promulgated by the Securities and Exchange Commission (the “SEC”), which requires certain information with respect to real estate operations to be included with certain filings with the SEC. The Historical Summary includes the historical revenues and certain operating expenses of the Property, exclusive of items which may not be comparable to the proposed future operations of the Property. Material amounts that would not be directly attributable to future operating results of the Property are excluded, and the Historical Summary is not intended to be a complete presentation of the Property’s revenues and expenses. Items excluded consist of depreciation, interest expense and federal and state income taxes.
The accompanying statements are not representative of the actual operations for the period presented, as certain expenses that may not be comparable to the expenses expected to be incurred by the Operating Partnership in the future operations of the Property have been excluded. The Historical Summary for the period from January 1, 2010 to June 30, 2010 is unaudited and reflects all adjustments (consisting only of normal recurring adjustments), which are, in the opinion of management, necessary for a fair presentation of the operating results for the interim period presented. The results of operations for the period from January 1, 2010 to June 30, 2010 (unaudited) are not necessarily indicative of the expected results for the entire fiscal year ending December 31, 2010.
In the preparation of the accompanying Historical Summary, subsequent events were evaluated through September 9, 2010 the date the financial statements were issued.
Revenue Recognition
Rental revenue is recognized on an accrual basis as it is earned over the lives of the respective tenant leases on a straight-line basis. Rental receivables are periodically evaluated for collectability.
Repairs and Maintenance
Expenditures for repairs and maintenance are expensed as incurred.
Use of Estimates
The preparation of financial statements in conformity with accounting principles generally accepted in the United States of America requires management to make estimates and assumptions that affect the reported amounts of revenues and certain expenses during the reporting period. Actual results could differ materially from the estimates.
Concentration of Credit Risk
The Property had two tenants account for more than 10% of the revenues in the six months ended June 30, 2010 (unaudited) and in the year ended December 31, 2009. In the six months ended June 30, 2009 (unaudited), these tenants represented approximately 21.6% and 11.8% of total revenues respectively. In 2009, these tenants represented approximately 21.5% and 11.8% of total revenues, respectively.
2. Leases
The aggregate annual future minimum lease payments to be received under existing operating leases as of December 31, 2009, are as follows:
| 2010 |
$ | 2,945,000 | ||
| 2011 |
2,971,000 | |||
| 2012 |
2,978,000 | |||
| 2013 |
2,812,000 | |||
| 2014 |
2,741,000 | |||
| 2015 and thereafter |
15,549,000 | |||
|
|
|
|||
| $ | 29,996,000 | |||
|
|
|
133
Table of Contents
The Property was built in 2007 and was approximately 94.8% occupied at June 30, 2010 (unaudited). The Property is generally leased to tenants under lease terms that provide for the tenants to pay a pro rata share of their operating expenses. The above future minimum lease payments do not include specified payments for tenant reimbursements of operating expenses.
Certain tenants have lease termination options built into their leases, which are subject to termination fees. In the event that a tenant does exercise its option to terminate its lease early and the terminated space is not subsequently leased out, the amount of future minimum rent received will be reduced.
3. Related Party Transactions
In the six months ended June 30, 2010 (unaudited) and the year ended December 31, 2009, $45,000 and $86,000 in property management fees were paid to a company affiliated with the sellers of the Property, respectively as included in property operating and maintenance expense in the statements of revenues and certain expenses.
4. Commitments and Contingencies
The Operating Partnership may be subject to legal claims in the ordinary course of business as a property owner. The Operating Partnership believes that the ultimate settlement of any potential claims will not have a material impact on the Property’s results of operations.
134
Table of Contents
To the Board of Directors and Stockholders of Excel Trust, Inc.
We have audited the accompanying statement of revenues and certain expenses (the “Historical Summary”) of Vestavia Hills City Center located in Vestavia Hills, Alabama (the “Property”) for the year ended December 31, 2009. This Historical Summary is the responsibility of the Property’s management. Our responsibility is to express an opinion on the Historical Summary based on our audit.
We conducted our audit in accordance with auditing standards generally accepted in the United States of America. Those standards require that we plan and perform the audit to obtain reasonable assurance about whether the Historical Summary is free of material misstatement. An audit includes consideration of internal control over financial reporting as a basis for designing audit procedures that are appropriate in the circumstances, but not for the purpose of expressing an opinion on the effectiveness of the Property’s internal control over financial reporting. Accordingly, we express no such opinion. An audit also includes examining, on a test basis, evidence supporting the amounts and disclosures in the Historical Summary, assessing the accounting principles used and significant estimates made by management, as well as evaluating the overall presentation of the Historical Summary. We believe that our audit provides a reasonable basis for our opinion.
The accompanying Historical Summary was prepared for the purpose of complying with the rules and regulations of the Securities and Exchange Commission (for inclusion in this Registration Statement on Form 10) as described in Note 1 to the Historical Summary and is not intended to be a complete presentation of the Property’s revenue and expenses.
In our opinion, the Historical Summary of the Property presents fairly, in all material respects, the revenues and certain expenses described in Note 1 to the Historical Summary of Vestavia Hills City Center located in Vestavia Hills, Alabama for the year ended December 31, 2009, in conformity with accounting principles generally accepted in the United States of America.
/s/ DELOITTE & TOUCHE LLP
Los Angeles, California
November 10, 2010
135
Table of Contents
VESTAVIA HILLS CITY CENTER, VESTAVIA HILLS, ALABAMA
STATEMENTS OF REVENUES AND CERTAIN EXPENSES
For the Six Months Ended June 30, 2010 and the Year Ended December 31, 2009
| Six months ended June 30, 2010 |
Year ended December 31, 2009 |
|||||||
| (unaudited) | ||||||||
| Revenues: |
||||||||
| Rental revenues |
$ | 2,075,000 | $ | 4,235,000 | ||||
| Tenant reimbursements |
523,000 | 1,041,000 | ||||||
| Other income |
1,000 | — | ||||||
|
|
|
|
|
|||||
| Total revenue |
2,599,000 | 5,276,000 | ||||||
| Certain Expenses |
||||||||
| Property operating and maintenance |
284,000 | 463,000 | ||||||
| Property taxes |
299,000 | 584,000 | ||||||
| Management fees |
93,000 | 240,000 | ||||||
| Insurance |
21,000 | 43,000 | ||||||
|
|
|
|
|
|||||
| Total certain expenses |
697,000 | 1,330,000 | ||||||
|
|
|
|
|
|||||
| Revenues in excess of certain expenses |
$ | 1,902,000 | $ | 3,946,000 | ||||
|
|
|
|
|
|||||
See accompanying notes to statements of revenues and certain expenses.
136
Table of Contents
VESTAVIA HILLS CITY CENTER, VESTAVIA HILLS, ALABAMA
NOTES TO STATEMENTS OF REVENUES AND CERTAIN EXPENSES
1. Organization and Summary of Significant Accounting Policies
Organization
The accompanying statement of revenues and certain expenses includes the operations of Vestavia Hills City Center located in Vestavia Hills, Alabama (the “Property”) which was acquired by Excel Trust, L.P. (the “Operating Partnership”), from a nonaffiliated third party. The Property was acquired for approximately $33.4 million and has 378,805 of leasable square feet. The Operating Partnership acquired the property by acquiring the mortgage loan that was secured by the Property. Concurrently with the acquisition of the mortgage loan, the borrower of the mortgage loan, AIG Baker Vestavia, a Delaware limited liability company (“Borrower”), gave the Operating Partnership a deed in lieu on the property in exchange for a release of certain liability under the mortgage loan. In addition, Vestavia Holdings, LLC, an affiliate of the Borrower, was granted a 30% subordinate profits participation in the Property as follows: (a) 30% of distributions of net cash from operations of the Property, after the Operating Partnership receives an 11% preferred return on its cash invested in the Property, and (b) 30% of distributions of net cash from capital events, after the Operating Partnership receives an 11% preferred return on its cash invested, as well as its unreimbursed capital, in the Property.
Basis of Presentation
The statement of revenues and certain operating expenses (the “Historical Summary”) has been prepared for the purpose of complying with the provisions of Article 3-14 of Regulation S-X promulgated by the Securities and Exchange Commission (the “SEC”), which requires certain information with respect to real estate operations to be included with certain filings with the SEC. The Historical Summary includes the historical revenues and certain operating expenses of the Property, exclusive of items which may not be comparable to the proposed future operations of the Property. Material amounts that would not be directly attributable to future operating results of the Property are excluded, and the Historical Summary is not intended to be a complete presentation of the Property’s revenues and expenses. Items excluded consist of depreciation, interest expense and federal and state income taxes.
The accompanying statement is not representative of the actual operations for the period presented, as certain expenses that may not be comparable to the expenses expected to be incurred by the Operating Partnership in the future operations of the Property have been excluded. The Historical Summary for the period from January 1, 2010 to June 30, 2010 is unaudited and reflects all adjustments (consisting only of normal recurring adjustments), which are, in the opinion of management, necessary for a fair presentation of the operating results for the interim period presented. The results of operations for the period from January 1, 2010 to June 30, 2010 (unaudited) are not necessarily indicative of the expected results for the entire fiscal year ending December 31, 2010.
In the preparation of the accompanying Historical Summary, subsequent events were evaluated through November 10, 2010 the date the financial statements were issued.
Revenue Recognition
Rental revenue is recognized on an accrual basis as it is earned over the lives of the respective tenant leases on a straight-line basis. Estimated recoveries from certain tenants for their pro rata share of real estate taxes, insurance and other operating expense are recognized as revenues in the period the applicable expenses are incurred or as specified in the leases. Rental receivables are periodically evaluated for collectibility.
Repairs and Maintenance
Expenditures for repairs and maintenance are expensed as incurred.
Use of Estimates
The preparation of financial statements in conformity with accounting principles generally accepted in the United States of America requires management to make estimates and assumptions that affect the reported amounts of revenues and certain expenses during the reporting period. Actual results could differ materially from the estimates in the near term.
Concentration of Credit Risk
The Property had two tenants account for more than 10% of the revenues in the six months ended June 30, 2010 (unaudited) and in the year ended December 31, 2009. In the six months ended June 30, 2010 (unaudited), these tenants represented approximately 20.1 % and 12.7% of total revenues respectively. In 2009, these tenants represented approximately 18.3% and 11.5% of total revenues, respectively.
137
Table of Contents
2. Leases
The aggregate annual future minimum lease payments to be received under existing operating leases as of December 31, 2009, are as follows:
| 2010 |
$ | 3,731,000 | ||
| 2011 |
3,538,000 | |||
| 2012 |
3,145,000 | |||
| 2013 |
2,791,000 | |||
| 2014 |
2,184,000 | |||
| 2015 and thereafter |
13,837,000 | |||
|
|
|
|||
| $ | 29,226,000 | |||
|
|
|
The Property was built in 2002 and was approximately 79.4% occupied at June 30, 2010 (unaudited). The Property is generally leased to tenants under lease terms that provide for the tenants to pay a pro rata share of their operating expenses. The above future minimum lease payments do not include specified payments for tenant reimbursements of operating expenses.
Certain tenants have lease termination options built into their leases, which are subject to termination fees. In the event that a tenant does exercise its option to terminate its lease early and the terminated space is not subsequently leased out, the amount of future minimum rent received will be reduced.
3. Related Party Transactions
In the six months ended June 30, 2010 (unaudited) and the year ended December 31, 2009, $93,000 and $240,000 in property management fees were paid to a company affiliated with the sellers of the Property, respectively.
4. Commitments and Contingencies
The Operating Partnership may be subject to legal claims in the ordinary course of business as a property owner. The Operating Partnership believes that the ultimate settlement of any potential claims will not have a material impact on the Property’s results of operations.
138
Table of Contents
To the Board of Directors and Stockholders of Excel Trust, Inc.
We have audited the accompanying statement of revenues and certain expenses (the “Historical Summary”) of Brandywine Crossing Shopping Center located in Brandywine, Maryland (the “Property”) for the year ended December 31, 2009. This Historical Summary is the responsibility of the Property’s management. Our responsibility is to express an opinion on the Historical Summary based on our audit.
We conducted our audit in accordance with auditing standards generally accepted in the United States of America. Those standards require that we plan and perform the audit to obtain reasonable assurance about whether the Historical Summary is free of material misstatement. An audit includes consideration of internal control over financial reporting as a basis for designing audit procedures that are appropriate in the circumstances, but not for the purpose of expressing an opinion on the effectiveness of the Property’s internal control over financial reporting. Accordingly, we express no such opinion. An audit also includes examining, on a test basis, evidence supporting the amounts and disclosures in the Historical Summaries, assessing the accounting principles used and significant estimates made by management, as well as evaluating the overall presentation of the Historical Summary. We believe that our audit provides a reasonable basis for our opinion.
The accompanying Historical Summary was prepared for the purpose of complying with the rules and regulations of the Securities and Exchange Commission (for inclusion in this Registration Statement on Form 10) as described in Note 1 to the Historical Summary and are not intended to be a complete presentation of the Property’s revenue and expenses.
In our opinion, the Historical Summary of the Property presents fairly, in all material respects, the revenues and certain expenses described in Note 1 to the Historical Summary of Brandywine Crossing Shopping Center located in Brandywine, Maryland for the year ended December 31, 2009, in conformity with accounting principles generally accepted in the United States of America.
/s/ DELOITTE & TOUCHE LLP
Los Angeles, California
December 15, 2010
139
Table of Contents
BRANDYWINE CROSSING SHOPPING CENTER, BRANDYWINE, MARYLAND
STATEMENTS OF REVENUES AND CERTAIN EXPENSES
For the Nine Months Ended September 30, 2010 and the Year Ended December 31, 2009
| Nine months ended September 30, 2010 |
Year ended December 31, 2009 |
|||||||
| (unaudited) | ||||||||
| Revenues: |
||||||||
| Rental revenues |
$ | 2,550,000 | $ | 1,459,000 | ||||
| Tenant reimbursements |
580,000 | 634,000 | ||||||
| Other income |
3,000 | 27,000 | ||||||
|
|
|
|
|
|||||
| Total revenue |
3,133,000 | 2,120,000 | ||||||
| Certain expenses |
||||||||
| Property operating and maintenance |
463,000 | 445,000 | ||||||
| Property taxes |
334,000 | 459,000 | ||||||
| Management fees |
104,000 | 62,000 | ||||||
| Insurance |
19,000 | 32,000 | ||||||
|
|
|
|
|
|||||
| Total certain expenses |
920,000 | 998,000 | ||||||
|
|
|
|
|
|||||
| Revenues in excess of certain expenses |
$ | 2,213,000 | $ | 1,122,000 | ||||
|
|
|
|
|
|||||
See accompanying notes to statements of revenues and certain expenses.
140
Table of Contents
BRANDYWINE CROSSING SHOPPING CENTER, BRANDYWINE, MARYLAND
NOTES TO STATEMENTS OF REVENUES AND CERTAIN EXPENSES
1. Organization and Summary of Significant Accounting Policies
Organization
The accompanying statement of revenues and certain expenses includes the operations of Brandywine Crossing Shopping Center located in Brandywine, Maryland (the “Property”) which was acquired by Excel Trust, L.P. (the “Operating Partnership”) from a nonaffiliated third party. The Property was acquired for approximately $45.1 million.
Basis of Presentation
The statement of revenues and certain operating expenses (the “Historical Summary”) has been prepared for the purpose of complying with the provisions of Article 3-14 of Regulation S-X promulgated by the Securities and Exchange Commission (the “SEC”), which requires certain information with respect to real estate operations to be included with certain filings with the SEC. The Historical Summary includes the historical revenues and certain operating expenses of the Property, exclusive of items which may not be comparable to the proposed future operations of the Property. Material amounts that would not be directly attributable to future operating results of the Property are excluded, and the Historical Summary is not intended to be a complete presentation of the Property’s revenues and expenses. Items excluded consist of depreciation, interest expense and federal and state income taxes.
The accompanying statement is not representative of the actual operations for the period presented, as certain expenses that may not be comparable to the expenses expected to be incurred by the Operating Partnership in the future operations of the Property have been excluded. The Historical Summary for the period from January 1, 2010 to September 30, 2010 is unaudited and reflects all adjustments (consisting only of normal recurring adjustments), which are, in the opinion of management, necessary for a fair presentation of the operating results for the interim period presented. The results of operations for the period from January 1, 2010 to September 30, 2010 (unaudited) are not necessarily indicative of the expected results for the entire fiscal year ending December 31, 2010.
In the preparation of the accompanying Historical Summary, subsequent events were evaluated through December 15, 2010 the date the financial statements were issued.
Revenue Recognition
Rental revenue is recognized on an accrual basis as it is earned over the lives of the respective tenant leases on a straight-line basis. Estimated recoveries from certain tenants for their pro rata share of real estate taxes, insurance and other operating expense are recognized as revenues in the period the applicable expenses are incurred or as specified in the leases. Rental receivables are periodically evaluated for collectibility.
Repairs and Maintenance
Expenditures for repairs and maintenance are expensed as incurred.
Use of Estimates
The preparation of financial statements in conformity with accounting principles generally accepted in the United States of America requires management to make estimates and assumptions that affect the reported amounts of revenues and certain expenses during the reporting period. Actual results could differ materially from the estimates in the near term.
Concentration of Credit Risk
The Property had three tenants account for more than 10% of revenues in the nine months ended September 30, 2010 (unaudited) and three tenants account for more than 10% of revenues in the year ended December 31, 2009. In the nine months ended September 30, 2010 (unaudited), these tenants represented approximately 19.4%, 10.5%, and 11.0% of total revenues. In 2009, these tenants represented approximately 23.8%, 18.3%, and 17.1% of total revenues, respectively.
141
Table of Contents
2. Leases
The aggregate annual future minimum lease payments to be received under existing operating leases as of December 31, 2009 are as follows:
| 2010 |
$ | 3,142,000 | ||
| 2011 |
3,533,000 | |||
| 2012 |
3,560,000 | |||
| 2013 |
3,634,000 | |||
| 2014 |
3,450,000 | |||
| 2015 and thereafter |
25,556,000 | |||
|
|
|
|||
| $ | 42,875,000 | |||
|
|
|
The Property was built in 2009 and was approximately 98% occupied at September 30, 2010 (unaudited). The Property is generally leased to tenants under lease terms that provide for the tenants to pay a pro rata share of their operating expenses. The above future minimum lease payments do not include amounts for tenant reimbursements of operating expenses.
Certain tenants have lease termination options built into their leases, which are subject to termination fees. In the event that a tenant does exercise its option to terminate its lease early and the terminated space is not subsequently leased out, the amount of future minimum rent received will be reduced.
3. Related Party Transactions
In the nine months ended September 30, 2010 (unaudited) and the year ended December 31, 2009, $104,000 and $62,000 in property management fees were expensed to a company affiliated with the sellers of the Property, respectively.
4. Commitments and Contingencies
The Operating Partnership may be subject to legal claims in the ordinary course of business as a property owner. The Operating Partnership believes that the ultimate settlement of any potential claims will not have a material impact on the Property’s results of operations.
142
Table of Contents
To the Board of Directors and Stockholders of Excel Trust, Inc.
We have audited the accompanying statement of revenues and certain expenses (the “Historical Summary”) of Rosewick Crossing Shopping Center located in La Plata, Maryland (the “Property”) for the year ended December 31, 2009. This Historical Summary is the responsibility of the Property’s management. Our responsibility is to express an opinion on the Historical Summary based on our audit.
We conducted our audit in accordance with auditing standards generally accepted in the United States of America. Those standards require that we plan and perform the audit to obtain reasonable assurance about whether the Historical Summary is free of material misstatement. An audit includes consideration of internal control over financial reporting as a basis for designing audit procedures that are appropriate in the circumstances, but not for the purpose of expressing an opinion on the effectiveness of the Property’s internal control over financial reporting. Accordingly, we express no such opinion. An audit also includes examining, on a test basis, evidence supporting the amounts and disclosures in the Historical Summary, assessing the accounting principles used and significant estimates made by management, as well as evaluating the overall presentation of the Historical Summary. We believe that our audit provides a reasonable basis for our opinion.
The accompanying Historical Summaries were prepared for the purpose of complying with the rules and regulations of the Securities and Exchange Commission (for inclusion in this Registration Statement on Form 10) as described in Note 1 to the Historical Summary and are not intended to be a complete presentation of the Property’s revenue and expenses.
In our opinion, the Historical Summary of the Property presents fairly, in all material respects, the revenues and certain expenses described in Note 1 to the Historical Summary of Rosewick Crossing Shopping Center located in La Plata, Maryland for the year ended December 31, 2009, in conformity with accounting principles generally accepted in the United States of America.
/s/ DELOITTE & TOUCHE LLP
Los Angeles, California
December 15, 2010
143
Table of Contents
ROSEWICK CROSSING SHOPPING CENTER, LA PLATA, MARYLAND
STATEMENTS OF REVENUES AND CERTAIN EXPENSES
For the Nine Months Ended September 30, 2010 and the Year Ended December 31, 2009
| Nine months ended September 30, 2010 |
Year ended December 31, 2009 |
|||||||
| (unaudited) | ||||||||
| Revenues: |
||||||||
| Rental revenues |
$ | 1,494,000 | $ | 1,890,000 | ||||
| Tenant reimbursements |
258,000 | 411,000 | ||||||
| Other income |
9,000 | 10,000 | ||||||
|
|
|
|
|
|||||
| Total revenue |
1,761,000 | 2,311,000 | ||||||
| Certain expenses |
||||||||
| Property operating and maintenance |
214,000 | 244,000 | ||||||
| Property taxes |
159,000 | 215,000 | ||||||
| Management fees |
55,000 | 72,000 | ||||||
| Insurance |
15,000 | 15,000 | ||||||
|
|
|
|
|
|||||
| Total certain expenses |
443,000 | 546,000 | ||||||
|
|
|
|
|
|||||
| Revenues in excess of certain expenses |
$ | 1,318,000 | $ | 1,765,000 | ||||
|
|
|
|
|
|||||
See accompanying notes to statements of revenues and certain expenses.
144
Table of Contents
ROSEWICK CROSSING SHOPPING CENTER, LA PLATA, MARYLAND
NOTES TO STATEMENTS OF REVENUES AND CERTAIN EXPENSES
1. Organization and Summary of Significant Accounting Policies
Organization
The accompanying statement of revenues and certain expenses includes the operations of Rosewick Crossing Shopping Center located in La Plata, Maryland (the “Property”) which was acquired by Excel Trust, L.P. (the “Operating Partnership”) from a nonaffiliated third party. The Property was acquired for approximately $24.9 million.
Basis of Presentation
The statement of revenues and certain operating expenses (the “Historical Summary”) has been prepared for the purpose of complying with the provisions of Article 3-14 of Regulation S-X promulgated by the Securities and Exchange Commission (the “SEC”), which requires certain information with respect to real estate operations to be included with certain filings with the SEC. The Historical Summary includes the historical revenues and certain operating expenses of the Property, exclusive of items which may not be comparable to the proposed future operations of the Property. Material amounts that would not be directly attributable to future operating results of the Property are excluded, and the Historical Summary is not intended to be a complete presentation of the Property’s revenues and expenses. Items excluded consist of depreciation, interest expense and federal and state income taxes.
The accompanying statement is not representative of the actual operations for the period presented, as certain expenses that may not be comparable to the expenses expected to be incurred by the Operating Partnership in the future operations of the Property have been excluded. The Historical Summary for the period from January 1, 2010 to September 30, 2010 is unaudited and reflects all adjustments (consisting only of normal recurring adjustments), which are, in the opinion of management, necessary for a fair presentation of the operating results for the interim period presented. The results of operations for the period from January 1, 2010 to September 30, 2010 (unaudited) are not necessarily indicative of the expected results for the entire fiscal year ending December 31, 2010.
In the preparation of the accompanying Historical Summary, subsequent events were evaluated through December 15, 2010 the date the financial statements were issued.
Revenue Recognition
Rental revenue is recognized on an accrual basis as it is earned over the lives of the respective tenant leases on a straight-line basis. Estimated recoveries from certain tenants for their pro rata share of real estate taxes, insurance and other operating expense are recognized as revenues in the period the applicable expenses are incurred or as specified in the leases. Rental receivables are periodically evaluated for collectability.
Repairs and Maintenance
Expenditures for repairs and maintenance are expensed as incurred.
Use of Estimates
The preparation of financial statements in conformity with accounting principles generally accepted in the United States of America requires management to make estimates and assumptions that affect the reported amounts of revenues and certain expenses during the reporting period. Actual results could differ materially from the estimates in the near term.
Concentration of Credit Risk
The Property had two tenants account for more than 10% of revenues in the nine months ended September 30, 2010 (unaudited) and in the year ended December 31, 2009. In the nine months ended September 30, 2010 (unaudited), these tenants represented approximately 40.5% and 12.0% of total revenues, respectively. In 2009, these tenants represented approximately 54.0% and 16.0% of total revenues, respectively.
2. Leases
The aggregate annual future minimum lease payments to be received under existing operating leases as of December 31, 2009 are as follows:
| 2010 |
$ | 1,823,000 | ||
| 2011 |
1,865,000 | |||
| 2012 |
1,899,000 | |||
| 2013 |
1,863,000 | |||
| 2014 |
1,465,000 | |||
| 2015 and thereafter |
16,383,000 | |||
|
|
|
|||
| $ | 25,298,000 | |||
|
|
|
145
Table of Contents
The Property was built in 2008 and was approximately 84.6% occupied at September 30, 2010 (unaudited). The Property is generally leased to tenants under lease terms that provide for the tenants to pay a pro rata share of their operating expenses. The above future minimum lease payments do not include amounts for tenant reimbursements of operating expenses.
Certain tenants have lease termination options built into their leases, which are subject to termination fees. In the event that a tenant does exercise its option to terminate its lease early and the terminated space is not subsequently leased out, the amount of future minimum rent received will be reduced.
3. Related Party Transactions
In the nine months ended September 30, 2010 (unaudited) and the year ended December 31, 2009, $55,000 and $72,000 in property management fees were expensed to a company affiliated with the sellers of the Property, respectively.
4. Commitments and Contingencies
The Operating Partnership may be subject to legal claims in the ordinary course of business as a property owner. The Operating Partnership believes that the ultimate settlement of any potential claims will not have a material impact on the Property’s results of operations.
146
Table of Contents
To the Board of Directors and Stockholders of Excel Trust, Inc.
We have audited the accompanying statement of revenues and certain expenses (the “Historical Summary”) of Park West Place Shopping Center located in Stockton, California (the “Property”) for the year ended December 31, 2009. This Historical Summary is the responsibility of the Property’s management. Our responsibility is to express an opinion on the Historical Summary based on our audit.
We conducted our audit in accordance with auditing standards generally accepted in the United States of America. Those standards require that we plan and perform the audit to obtain reasonable assurance about whether the Historical Summary is free of material misstatement. An audit includes consideration of internal control over financial reporting as a basis for designing audit procedures that are appropriate in the circumstances, but not for the purpose of expressing an opinion on the effectiveness of the Property’s internal control over financial reporting. Accordingly, we express no such opinion. An audit also includes examining, on a test basis, evidence supporting the amounts and disclosures in the Historical Summaries, assessing the accounting principles used and significant estimates made by management, as well as evaluating the overall presentation of the Historical Summary. We believe that our audit provides a reasonable basis for our opinion.
The accompanying Historical Summary was prepared for the purpose of complying with the rules and regulations of the Securities and Exchange Commission (for inclusion in this Registration Statement on Form 10) as described in Note 1 to the Historical Summary and are not intended to be a complete presentation of the Property’s revenue and expenses.
In our opinion, the Historical Summary of the Property presents fairly, in all material respects, the revenues and certain expenses described in Note 1 to the Historical Summary of Park West Place Shopping Center located in Stockton, California for the year ended December 31, 2009, in conformity with accounting principles generally accepted in the United States of America.
/s/ DELOITTE & TOUCHE LLP
Los Angeles, California
February 24, 2011
147
Table of Contents
PARK WEST PLACE SHOPPING CENTER, STOCKTON, CALIFORNIA
STATEMENTS OF REVENUES AND CERTAIN EXPENSES
For the Nine Months Ended September 30, 2010 and the Year Ended December 31, 2009
| Nine months ended September 30, 2010 |
Year ended December 31, 2009 |
|||||||
| (unaudited) | ||||||||
| Revenues: |
||||||||
| Rental revenues |
$ | 5,721,000 | $ | 7,367,000 | ||||
| Tenant reimbursements |
1,651,000 | 2,122,000 | ||||||
| Other income |
(6,000 | ) | 30,000 | |||||
|
|
|
|
|
|||||
| Total revenue |
7,366,000 | 9,519,000 | ||||||
| Certain expenses |
||||||||
| Property operating and maintenance |
417,000 | 639,000 | ||||||
| Property taxes |
961,000 | 1,257,000 | ||||||
| Management fees |
212,000 | 285,000 | ||||||
| Insurance |
64,000 | 48,000 | ||||||
|
|
|
|
|
|||||
| Total certain expenses |
1,654,000 | 2,228,000 | ||||||
|
|
|
|
|
|||||
| Revenues in excess of certain expenses |
$ | 5,712,000 | $ | 7,291,000 | ||||
|
|
|
|
|
|||||
See accompanying notes to statements of revenues and certain expenses.
148
Table of Contents
PARK WEST PLACE SHOPPING CENTER, STOCKTON, CALIFORNIA
NOTES TO STATEMENTS OF REVENUES AND CERTAIN EXPENSES
1. Organization and Summary of Significant Accounting Policies
Organization
The accompanying statement of revenues and certain expenses includes the operations of Park West Place Shopping Center located in Stockton, California (the “Property”) which was acquired by Excel Trust, L.P. (the “Operating Partnership”) from a nonaffiliated third party. The Property was acquired for approximately $92.5 million.
Basis of Presentation
The statement of revenues and certain operating expenses (the “Historical Summary”) has been prepared for the purpose of complying with the provisions of Article 3-14 of Regulation S-X promulgated by the Securities and Exchange Commission (the “SEC”), which requires certain information with respect to real estate operations to be included with certain filings with the SEC. The Historical Summary includes the historical revenues and certain operating expenses of the Property, exclusive of items which may not be comparable to the proposed future operations of the Property. Material amounts that would not be directly attributable to future operating results of the Property are excluded, and the Historical Summary is not intended to be a complete presentation of the Property’s revenues and expenses. Items excluded consist of depreciation, interest expense and federal and state income taxes.
The accompanying statement is not representative of the actual operations for the period presented, as certain expenses that may not be comparable to the expenses expected to be incurred by the Operating Partnership in the future operations of the Property have been excluded. The Historical Summary for the period from January 1, 2010 to September 30, 2010 is unaudited and reflects all adjustments (consisting only of normal recurring adjustments), which are, in the opinion of management, necessary for a fair presentation of the operating results for the interim period presented. The results of operations for the period from January 1, 2010 to September 30, 2010 (unaudited) are not necessarily indicative of the expected results for the entire fiscal year ending December 31, 2010.
In the preparation of the accompanying Historical Summary, subsequent events were evaluated through February 24, 2011 the date the financial statements were issued.
Revenue Recognition
Rental revenue is recognized on an accrual basis as it is earned over the lives of the respective tenant leases on a straight-line basis. Estimated recoveries from certain tenants for their pro rata share of real estate taxes, insurance and other operating expense are recognized as revenues in the period the applicable expenses are incurred or as specified in the leases. Rental receivables are periodically evaluated for collectability.
Repairs and Maintenance
Expenditures for repairs and maintenance are expensed as incurred.
Use of Estimates
The preparation of financial statements in conformity with accounting principles generally accepted in the United States of America requires management to make estimates and assumptions that affect the reported amounts of revenues and certain expenses during the reporting period. Actual results could differ materially from the estimates in the near term.
Concentration of Credit Risk
The Property had no tenants account for more than 10% of revenues in the nine months ended September 30, 2010 (unaudited) or the year ended December 31, 2009.
2. Leases
The aggregate annual future minimum lease payments to be received under existing operating leases as of December 31, 2009 are as follows:
| 2010 |
$ | 7,053,000 | ||
| 2011 |
7,308,000 | |||
| 2012 |
7,172,000 | |||
| 2013 |
6,884,000 | |||
| 2014 |
6,539,000 | |||
| 2015 and thereafter |
29,164,000 | |||
|
|
|
|||
| $ | 64,121,000 | |||
|
|
|
149
Table of Contents
The Property was completed in 2005 and was approximately 99% occupied at September 30, 2010 (unaudited). The Property is generally leased to tenants under lease terms that provide for the tenants to pay a pro rata share of their operating expenses. The above future minimum lease payments do not include amounts for tenant reimbursements of operating expenses.
Certain tenants have lease termination options built into their leases, which are subject to termination fees. In the event that a tenant does exercise its option to terminate its lease early and the terminated space is not subsequently leased out, the amount of future minimum rent received will be reduced.
3. Related Party Transactions
In the nine months ended September 30, 2010 (unaudited) and the year ended December 31, 2009, $212,000 and $285,000 in property management fees were expensed to a company affiliated with the sellers of the Property, respectively.
4. Commitments and Contingencies
The Operating Partnership may be subject to legal claims in the ordinary course of business as a property owner. The Operating Partnership believes that the ultimate settlement of any potential claims will not have a material impact on the Property’s results of operations.
150
Table of Contents
To the Board of Directors and Stockholders of Excel Trust, Inc.
We have audited the accompanying statement of revenues and certain expenses (the “Historical Summary”) of Gilroy Crossing located in Gilroy, California (the “Property”) for the year ended December 31, 2010. This Historical Summary is the responsibility of the Property’s management. Our responsibility is to express an opinion on the Historical Summary based on our audit.
We conducted our audit in accordance with auditing standards generally accepted in the United States of America. Those standards require that we plan and perform the audit to obtain reasonable assurance about whether the Historical Summary is free of material misstatement. An audit includes consideration of internal control over financial reporting as a basis for designing audit procedures that are appropriate in the circumstances, but not for the purpose of expressing an opinion on the effectiveness of the Property’s internal control over financial reporting. Accordingly, we express no such opinion. An audit also includes examining, on a test basis, evidence supporting the amounts and disclosures in the Historical Summaries, assessing the accounting principles used and significant estimates made by management, as well as evaluating the overall presentation of the Historical Summary. We believe that our audit provides a reasonable basis for our opinion.
The accompanying Historical Summary was prepared for the purpose of complying with the rules and regulations of the Securities and Exchange Commission (for inclusion in this Registration Statement on Form 10) as described in Note 1 to the Historical Summary and are not intended to be a complete presentation of the Property’s revenue and expenses.
In our opinion, the Historical Summary of the Property presents fairly, in all material respects, the revenues and certain expenses described in Note 1 to the Historical Summary of Gilroy Crossing located in Gilroy, California for the year ended December 31, 2010, in conformity with accounting principles generally accepted in the United States of America.
/s/ DELOITTE & TOUCHE LLP
Los Angeles, California
May 4, 2011
151
Table of Contents
GILROY CROSSING, GILROY, CALIFORNIA
STATEMENTS OF REVENUE AND CERTAIN EXPENSES
For the Three Months Ended March 31, 2011 and the Year Ended December 31, 2010
| Three months ended March 31, 2011 |
Year ended December 31, 2010 |
|||||||
| (unaudited) | ||||||||
| Revenues: |
||||||||
| Rental revenues |
$ | 1,296,000 | $ | 5,245,000 | ||||
| Tenant reimbursements |
398,000 | 1,562,000 | ||||||
| Other income |
(1,000 | ) | 10,000 | |||||
|
|
|
|
|
|||||
| Total revenues |
1,693,000 | 6,817,000 | ||||||
| Certain expenses |
||||||||
| Property operating and maintenance |
130,000 | 639,000 | ||||||
| Property taxes |
230,000 | 909,000 | ||||||
| Management fees |
75,000 | 257,000 | ||||||
| Insurance |
23,000 | 71,000 | ||||||
|
|
|
|
|
|||||
| Total certain expenses |
458,000 | 1,876,000 | ||||||
|
|
|
|
|
|||||
| Revenues in excess of certain expenses |
$ | 1,235,000 | $ | 4,941,000 | ||||
|
|
|
|
|
|||||
See accompanying notes to statements of revenues and certain expenses.
152
Table of Contents
GILROY CROSSING, GILROY, CALIFORNIA
NOTES TO STATEMENTS OF REVENUES AND CERTAIN EXPENSES
1. Organization and Summary of Significant Accounting Policies
Organization
The accompanying statement of revenues and certain expenses includes the operations of Gilroy Crossing located in Gilroy, California (the “Property”). The Property represents a 473,640 square foot retail shopping center (unaudited) (of which 325,431 square feet are owned). Gilroy Crossing was acquired on April 5, 2011 by Excel Trust, L.P. (the “Operating Partnership”) from a nonaffiliated third party for a purchase price of approximately $68.5 million, of which approximately $48.0 million was assumed mortgage debt.
Basis of Presentation
The statement of revenues and certain operating expenses (the “Historical Summary”) has been prepared for the purpose of complying with the provisions of Article 3-14 of Regulation S-X promulgated by the Securities and Exchange Commission (the “SEC”), which requires certain information with respect to real estate operations to be included with certain filings with the SEC. The Historical Summary includes the historical revenues and certain operating expenses of the Property, exclusive of items which may not be comparable to the proposed future operations of the Property. Material amounts that would not be directly attributable to future operating results of the Property are excluded, and the Historical Summary is not intended to be a complete presentation of the Property’s revenues and expenses. Items excluded consist of depreciation, interest expense and federal and state income taxes.
The accompanying statement is not representative of the actual operations for the period presented, as certain expenses that may not be comparable to the expenses expected to be incurred by the Operating Partnership in the future operations of the Property have been excluded. The Historical Summary for the period from January 1, 2011 to March 31, 2011 is unaudited and reflects all adjustments (consisting only of normal recurring adjustments), which are, in the opinion of management, necessary for a fair presentation of the operating results for the interim period presented. The results of operations for the period January 1, 2011 to March 31, 2011 (unaudited) are not necessarily indicative of the expected results for the entire fiscal year ending December 31, 2011.
In the preparation of the accompanying Historical Summary, subsequent events were evaluated through May 4, 2011, the date the financial statements were issued.
Revenue Recognition
Rental revenue is recognized on an accrual basis as it is earned over the lives of the respective tenant leases on a straight-line basis. Estimated recoveries from certain tenants for their pro rata share of real estate taxes, insurance and other operating expense are recognized as revenues in the period the applicable expenses are incurred or as specified in the leases. Rental receivables are periodically evaluated for collectability.
Repairs and Maintenance
Expenditures for repairs and maintenance are expensed as incurred.
Use of Estimates
The preparation of financial statements in conformity with accounting principles generally accepted in the United States of America requires management to make estimates and assumptions that affect the reported amounts of revenues and certain expenses during the reporting period. Actual results could differ materially from the estimates in the near term.
Concentration of Credit Risk
The Property had no tenants account for more than 10% of revenues in the three months ended March 31, 2011 (unaudited) and in the year ended December 31, 2010.
153
Table of Contents
2. Leases
The aggregate annual future minimum lease payments to be received under existing operating leases as of December 31, 2010 are as follows:
| 2011 |
$ | 5,242,000 | ||
| 2012 |
5,134,000 | |||
| 2013 |
5,097,000 | |||
| 2014 |
4,024,000 | |||
| 2015 |
1,853,000 | |||
| 2016 and thereafter |
11,822,000 | |||
|
|
|
|||
| $ | 33,172,000 | |||
|
|
|
The Property was completed in 2004 and was approximately 100% occupied at March 31, 2011 (unaudited) . The Property is generally leased to tenants under lease terms that provide for the tenants to pay a pro rata share of their operating expenses. The above future minimum lease payments do not include amounts for tenant reimbursements of operating expenses.
Certain tenants have lease termination options built into their leases, which are subject to termination fees. In the event that a tenant does exercise its option to terminate its lease early and the terminated space is not subsequently leased out, the amount of future minimum rent received will be reduced.
3. Related Party Transactions
In the three months ended March 31, 2011 (unaudited) and the year ended December 31, 2010, $75,000 and $257,000 in property management fees were paid to a company affiliated with the sellers of the Property, respectively.
4. Commitments and Contingencies
The Operating Partnership may be subject to legal claims in the ordinary course of business as a property owner. The Operating Partnership believes that the ultimate settlement of any potential claims will not have a material impact on the Property’s results of operations.
154
Table of Contents
To the Board of Directors and Stockholders of Excel Trust, Inc.
We have audited the accompanying statement of revenues and certain expenses (the “Historical Summary”) of the Shopping Center located in Arizona (the “Property”) for the year ended December 31, 2010. This Historical Summary is the responsibility of the Property’s management. Our responsibility is to express an opinion on the Historical Summary based on our audit.
We conducted our audit in accordance with auditing standards generally accepted in the United States of America. Those standards require that we plan and perform the audit to obtain reasonable assurance about whether the Historical Summary is free of material misstatement. An audit includes consideration of internal control over financial reporting as a basis for designing audit procedures that are appropriate in the circumstances, but not for the purpose of expressing an opinion on the effectiveness of the Property’s internal control over financial reporting. Accordingly, we express no such opinion. An audit also includes examining, on a test basis, evidence supporting the amounts and disclosures in the Historical Summaries, assessing the accounting principles used and significant estimates made by management, as well as evaluating the overall presentation of the Historical Summary. We believe that our audit provides a reasonable basis for our opinion.
The accompanying Historical Summary was prepared for the purpose of complying with the rules and regulations of the Securities and Exchange Commission (for inclusion in this Registration Statement on Form 10) as described in Note 1 to the Historical Summary and are not intended to be a complete presentation of the Property’s revenue and expenses.
In our opinion, the Historical Summary of the Property presents fairly, in all material respects, the revenues and certain expenses described in Note 1 to the Historical Summary of the Shopping Center located in Arizona for the year ended December 31, 2010, in conformity with accounting principles generally accepted in the United States of America.
/s/ DELOITTE & TOUCHE LLP
Los Angeles, California
May 4, 2011
155
Table of Contents
THE SHOPPING CENTER, ARIZONA
STATEMENT OF REVENUES AND CERTAIN EXPENSES
For the Three Months Ended March 31, 2011 and the Year Ended December 31, 2010
| Three months ended March 31, 2011 |
Year ended December 31, 2010 |
|||||||
| (unaudited) | ||||||||
| Revenues: |
||||||||
| Rental revenues |
$ | 2,152,000 | $ | 8,579,000 | ||||
| Tenant reimbursements |
598,000 | 3,089,000 | ||||||
| Other income |
4,000 | 44,000 | ||||||
|
|
|
|
|
|||||
| Total revenues |
2,754,000 | 11,712,000 | ||||||
| Certain expenses |
||||||||
| Property operating and maintenance |
337,000 | 1,876,000 | ||||||
| Property taxes |
409,000 | 1,637,000 | ||||||
| Management fees |
61,000 | 244,000 | ||||||
| Insurance |
18,000 | 71,000 | ||||||
|
|
|
|
|
|||||
| Total certain expenses |
825,000 | 3,828,000 | ||||||
|
|
|
|
|
|||||
| Revenues in excess of certain expenses |
$ | 1,929,000 | $ | 7,884,000 | ||||
|
|
|
|
|
|||||
See accompanying notes to statements of revenues and certain expenses.
156
Table of Contents
NOTES TO STATEMENT OF REVENUES AND CERTAIN EXPENSES
1. Organization and Summary of Significant Accounting Policies
Organization
The accompanying statement of revenues and certain expenses includes the operations of a Shopping Center located in Arizona (the “Property”). The Property contains approximately 433,000 square feet (unaudited) of retail space. The acquisition of the Shopping Center by Excel Trust, L.P. (the “Operating Partnership”) from a nonaffiliated third party is expected to close in the second quarter of 2011 for a purchase price of approximately $110.0 million, of which approximately $52.8 million would be assumed mortgage debt.
Basis of Presentation
The statement of revenues and certain operating expenses (the “Historical Summary”) has been prepared for the purpose of complying with the provisions of Article 3-14 of Regulation S-X promulgated by the Securities and Exchange Commission (the “SEC”), which requires certain information with respect to real estate operations to be included with certain filings with the SEC. The Historical Summary includes the historical revenues and certain operating expenses of the Property, exclusive of items which may not be comparable to the proposed future operations of the Property. Material amounts that would not be directly attributable to future operating results of the Property are excluded, and the Historical Summary is not intended to be a complete presentation of the Property’s revenues and expenses. Items excluded consist of depreciation, interest expense and federal and state income taxes.
The accompanying statement is not representative of the actual operations for the period presented, as certain expenses that may not be comparable to the expenses expected to be incurred by the Operating Partnership in the future operations of the Property have been excluded. The Historical Summary for the period from January 1, 2011 to March 31, 2011 is unaudited and reflects all adjustments (consisting only of normal recurring adjustments), which are, in the opinion of management, necessary for a fair presentation of the operating results for the interim period presented. The results of operations for the period January 1, 2011 to March 31, 2011 (unaudited) are not necessarily indicative of the expected results for the entire fiscal year ending December 31, 2011.
In the preparation of the accompanying Historical Summary, subsequent events were evaluated through May 4, 2011, the date the financial statements were issued.
Revenue Recognition
Rental revenue is recognized on an accrual basis as it is earned over the lives of the respective tenant leases on a straight-line basis. Estimated recoveries from certain tenants for their pro rata share of real estate taxes, insurance and other operating expense are recognized as revenues in the period the applicable expenses are incurred or as specified in the leases. Rental receivables are periodically evaluated for collectability.
Repairs and Maintenance
Expenditures for repairs and maintenance are expensed as incurred.
Use of Estimates
The preparation of financial statements in conformity with accounting principles generally accepted in the United States of America requires management to make estimates and assumptions that affect the reported amounts of revenues and certain expenses during the reporting period. Actual results could differ materially from the estimates in the near term.
Concentration of Credit Risk
The Property had no tenants account for more than 10% of revenues in the three months ended March 31, 2011 (unaudited) and the year ended December 31, 2010.
2. Leases
The aggregate annual future minimum lease payments to be received under existing operating leases as of December 31, 2010 are as follows:
| 2011 |
$ | 7,872,000 | ||
| 2012 |
7,836,000 | |||
| 2013 |
7,493,000 | |||
| 2014 |
6,813,000 | |||
| 2015 |
5,036,000 | |||
| 2016 and thereafter |
12,741,000 | |||
|
|
|
|||
| $ | 47,791,000 | |||
|
|
|
157
Table of Contents
The Property was completed in 1999 and was approximately 99% occupied at March 31, 2011 (unaudited). The Property is generally leased to tenants under lease terms that provide for the tenants to pay a pro rata share of their operating expenses. The above future minimum lease payments do not include amounts for tenant reimbursements of operating expenses.
Certain tenants have lease termination options built into their leases, which are subject to termination fees. In the event that a tenant does exercise its option to terminate its lease early and the terminated space is not subsequently leased out, the amount of future minimum rent received will be reduced.
3. Related Party Transactions
In the three months ended March 31, 2011 (unaudited) and the year ended December 31, 2010, $61,000 and $244,000 in property management fees were paid to a company affiliated with the sellers of the Property, respectively.
4. Commitments and Contingencies
The Operating Partnership may be subject to legal claims in the ordinary course of business as a property owner. The Operating Partnership believes that the ultimate settlement of any potential claims will not have a material impact on the Property’s results of operations.
158
Table of Contents
To the Board of Directors and Stockholders of Excel Trust, Inc.
We have audited the accompanying statement of revenues and certain expenses (the “Historical Summary”) of the Promenade Corporate Center located in Scottsdale, Arizona (the “Property”) for the year ended December 31, 2011. This Historical Summary is the responsibility of the Property’s management. Our responsibility is to express an opinion on the Historical Summary based on our audit.
We conducted our audit in accordance with auditing standards generally accepted in the United States of America. Those standards require that we plan and perform the audit to obtain reasonable assurance about whether the Historical Summary is free of material misstatement. An audit includes consideration of internal control over financial reporting as a basis for designing audit procedures that are appropriate in the circumstances, but not for the purpose of expressing an opinion on the effectiveness of the Property’s internal control over financial reporting. Accordingly, we express no such opinion. An audit also includes examining, on a test basis, evidence supporting the amounts and disclosures in the Historical Summary, assessing the accounting principles used and significant estimates made by management, as well as evaluating the overall presentation of the Historical Summary. We believe that our audit provides a reasonable basis for our opinion.
The accompanying Historical Summary was prepared for the purpose of complying with the rules and regulations of the Securities and Exchange Commission (for inclusion in this Registration Statement on Form 10) as described in Note 1 to the Historical Summary and is not intended to be a complete presentation of the Property’s revenues and expenses.
In our opinion, the Historical Summary of the Property presents fairly, in all material respects, the revenues and certain expenses described in Note 1 to the Historical Summary of the Property for the year ended December 31, 2011, in conformity with accounting principles generally accepted in the United States of America.
/s/ DELOITTE & TOUCHE LLP
Los Angeles, California
May 14, 2012
159
Table of Contents
THE PROMENADE CORPORATE CENTER, ARIZONA
STATEMENT OF REVENUES AND CERTAIN EXPENSES
For the Year Ended December 31, 2011
| Year ended December 31, 2011 |
||||
| Revenues: |
||||
| Rental revenues |
$ | 5,962,000 | ||
| Tenant reimbursements |
604,000 | |||
| Other income |
135,000 | |||
|
|
|
|||
| Total revenues |
6,701,000 | |||
| Certain expenses |
||||
| Property operating and maintenance |
1,479,000 | |||
| Property taxes |
879,000 | |||
| Management fees |
116,000 | |||
| Insurance |
51,000 | |||
|
|
|
|||
| Total certain expenses |
2,525,000 | |||
|
|
|
|||
| Revenues in excess of certain expenses |
$ | 4,176,000 | ||
|
|
|
|||
See accompanying notes to statements of revenues and certain expenses.
160
Table of Contents
THE PROMENADE CORPORATE CENTER, ARIZONA
NOTES TO STATEMENT OF REVENUES AND CERTAIN EXPENSES
1. Organization and Summary of Significant Accounting Policies
Organization
The accompanying statement of revenues and certain expenses includes the operations of the Promenade Corporate Center located in Scottsdale, Arizona (the “Property”). The Property contains approximately 256,000 square feet (unaudited) of commercial office space. The acquisition of the Promenade Corporate Center by Excel Trust, L.P. (the “Operating Partnership”) from a nonaffiliated third party was completed on January 23, 2012 for a purchase price of approximately $53.0 million. The purchase price of $53.0 million was comprised of $13.9 million in cash paid and the issuance of 3,230,769 shares of common stock of the Operating Partnership’s general partner, Excel Trust, Inc., with a fair value of approximately $39.1 million based on a closing price of $12.11 per share of the general partner’s common stock on the date of acquisition.
Basis of Presentation
The statement of revenues and certain operating expenses (the “Historical Summary”) has been prepared for the purpose of complying with the provisions of Article 3-14 of Regulation S-X promulgated by the Securities and Exchange Commission (the “SEC”), which requires certain information with respect to real estate operations to be included with certain filings with the SEC. The Historical Summary includes the historical revenues and certain operating expenses of the Property, exclusive of items which may not be comparable to the proposed future operations of the Property. Material amounts that would not be directly attributable to future operating results of the Property are excluded, and the Historical Summary is not intended to be a complete presentation of the Property’s revenues and expenses. Items excluded consist of depreciation, interest expense and federal and state income taxes.
The accompanying statement is not representative of the actual operations for the period presented, as certain expenses that may not be comparable to the expenses expected to be incurred by the Operating Partnership in the future operations of the Property have been excluded. The Historical Summary for the period from January 1, 2011 to December 31, 2011 reflects all adjustments (consisting only of normal recurring adjustments), which are, in the opinion of management, necessary for a fair presentation of the operating results for the period presented. The results of operations for the period from January 1, 2011 to December 31, 2011 are not necessarily indicative of the future operations and results.
In the preparation of the accompanying Historical Summary, subsequent events were evaluated through May 14, 2012, the date the financial statements were issued.
Revenue Recognition
Rental revenue is recognized on an accrual basis as it is earned over the lives of the respective tenant leases on a straight-line basis. Estimated recoveries from certain tenants for their pro rata share of real estate taxes, insurance and other operating expense are recognized as revenues in the period the applicable expenses are incurred or as specified in the leases. Rental receivables are periodically evaluated for collectability.
Repairs and Maintenance
Expenditures for repairs and maintenance are expensed as incurred.
Use of Estimates
The preparation of financial statements in conformity with accounting principles generally accepted in the United States of America requires management to make estimates and assumptions that affect the reported amounts of revenues and certain expenses during the reporting period. Actual results could differ materially from the estimates in the near term.
Concentration of Credit Risk
The Property had one tenant that accounted for approximately 10% of revenues in the year ended December 31, 2011.
2. Leases
The aggregate annual future minimum lease payments to be received under existing operating leases as of December 31, 2011 are as follows:
| 2012 |
$ | 4,845,000 | ||
| 2013 |
3,900,000 | |||
| 2014 |
3,483,000 | |||
| 2015 |
2,315,000 | |||
| 2016 |
786,000 | |||
| 2017 and thereafter |
607,000 | |||
|
|
|
|||
| $ | 15,936,000 | |||
|
|
|
161
Table of Contents
The Property was completed in 2007 and was approximately 83% occupied at December 31, 2011 (unaudited). The Property is generally leased to tenants under lease terms that provide for the tenants to pay a pro rata share of their operating expenses. The above future minimum lease payments do not include amounts for tenant reimbursements of operating expenses.
Certain tenants have lease termination options built into their leases, which are subject to termination fees. In the event that a tenant does exercise its option to terminate its lease early and the terminated space is not subsequently leased out, the amount of future minimum rent received will be reduced.
3. Related Party Transactions
In the year ended December 31, 2011, $116,000 in property management fees were paid or payable to a company affiliated with the sellers of the Property.
4. Commitments and Contingencies
The Operating Partnership may be subject to legal claims in the ordinary course of business as a property owner. The Operating Partnership believes that the ultimate settlement of any potential claims will not have a material impact on the Property’s results of operations.
162
Table of Contents
To the Board of Directors and Stockholders of Excel Trust, Inc.
We have audited the accompanying statement of revenues and certain expenses (the “Historical Summary”) of Lake Pleasant Pavilion located in Peoria, Arizona (the “Property”) for the year ended December 31, 2011. This Historical Summary is the responsibility of the Property’s management. Our responsibility is to express an opinion on the Historical Summary based on our audit.
We conducted our audit in accordance with auditing standards generally accepted in the United States of America. Those standards require that we plan and perform the audit to obtain reasonable assurance about whether the Historical Summary is free of material misstatement. An audit includes consideration of internal control over financial reporting as a basis for designing audit procedures that are appropriate in the circumstances, but not for the purpose of expressing an opinion on the effectiveness of the Property’s internal control over financial reporting. Accordingly, we express no such opinion. An audit also includes examining, on a test basis, evidence supporting the amounts and disclosures in the Historical Summary, assessing the accounting principles used and significant estimates made by management, as well as evaluating the overall presentation of the Historical Summary. We believe that our audit provides a reasonable basis for our opinion.
The accompanying Historical Summary was prepared for the purpose of complying with the rules and regulations of the Securities and Exchange Commission (for inclusion in this Registration Statement on Form 10) as described in Note 1 to the Historical Summary and is not intended to be a complete presentation of the Property’s revenue and expenses.
In our opinion, the Historical Summary of the Property presents fairly, in all material respects, the revenues and certain expenses described in Note 1 to the Historical Summary of the Property for the year ended December 31, 2011, in conformity with accounting principles generally accepted in the United States of America.
/s/ DELOITTE & TOUCHE LLP
Los Angeles, California
May 25, 2012
163
Table of Contents
LAKE PLEASANT PAVILION, ARIZONA
STATEMENTS OF REVENUES AND CERTAIN EXPENSES
For the Three Months Ended March 31, 2012 and for the Year Ended December 31, 2011
| Three months ended March 31, 2012 |
Year ended December 31, 2011 |
|||||||
| (unaudited) | ||||||||
| Revenues: |
||||||||
| Rental revenues |
$ | 819,000 | $ | 3,225,000 | ||||
| Tenant reimbursements |
161,000 | 678,000 | ||||||
| Other income |
7,000 | 18,000 | ||||||
|
|
|
|
|
|||||
| Total revenues |
987,000 | 3,921,000 | ||||||
| Certain expenses |
||||||||
| Property operating and maintenance |
61,000 | 248,000 | ||||||
| Property taxes |
130,000 | 513,000 | ||||||
| Management fees |
24,000 | 97,000 | ||||||
| Insurance |
7,000 | 30,000 | ||||||
|
|
|
|
|
|||||
| Total certain expenses |
222,000 | 888,000 | ||||||
|
|
|
|
|
|||||
| Revenues in excess of certain expenses |
$ | 765,000 | $ | 3,033,000 | ||||
|
|
|
|
|
|||||
See accompanying notes to statements of revenues and certain expenses.
164
Table of Contents
LAKE PLEASANT PAVILION, ARIZONA
NOTES TO STATEMENTS OF REVENUES AND CERTAIN EXPENSES
1. Organization and Summary of Significant Accounting Policies
Organization
The accompanying statements of revenues and certain expenses include the operations of Lake Pleasant Pavilion located in Peoria, Arizona (the “Property”). The Property contains approximately 178,000 square feet (unaudited) of retail space. The acquisition of the Property by Excel Trust, L.P. (the “Operating Partnership”) from a nonaffiliated third party was completed on May 16, 2012 for a purchase price of approximately $41.8 million, including the assumption of a mortgage note in the amount of approximately $28.3 million, with a fixed interest rate of 6.1%.
Basis of Presentation
The statement of revenues and certain operating expenses (the “Historical Summary”) has been prepared for the purpose of complying with the provisions of Article 3-14 of Regulation S-X promulgated by the Securities and Exchange Commission (the “SEC”), which requires certain information with respect to real estate operations to be included with certain filings with the SEC. The Historical Summary includes the historical revenues and certain operating expenses of the Property, exclusive of items which may not be comparable to the proposed future operations of the Property. Material amounts that would not be directly attributable to future operating results of the Property are excluded, and the Historical Summary is not intended to be a complete presentation of the Property’s revenues and expenses. Items excluded consist of depreciation, interest expense and federal and state income taxes.
The accompanying statement is not representative of the actual operations for the period presented, as certain expenses that may not be comparable to the expenses expected to be incurred by the Operating Partnership in the future operations of the Property have been excluded. The Historical Summary for the three months ended March 31, 2012 (unaudited) reflects all adjustments (consisting only of normal recurring adjustments), which are, in the opinion of management, necessary for a fair presentation of revenues and certain expenses for the period presented. The revenues and certain expenses for the three months ended March 31, 2012 are not necessarily indicative of the expected results for the entire fiscal year ending December 31, 2012.
In the preparation of the accompanying Historical Summary, subsequent events were evaluated through May 25, 2012, the date the financial statements were issued.
Revenue Recognition
Rental revenue is recognized on an accrual basis as it is earned over the lives of the respective tenant leases on a straight-line basis. Estimated recoveries from certain tenants for their pro rata share of real estate taxes, insurance and other operating expense are recognized as revenues in the period the applicable expenses are incurred or as specified in the leases. Rental receivables are periodically evaluated for collectability.
Repairs and Maintenance
Expenditures for repairs and maintenance are expensed as incurred.
Use of Estimates
The preparation of financial statements in conformity with accounting principles generally accepted in the United States of America requires management to make estimates and assumptions that affect the reported amounts of revenues and certain expenses during the reporting period. Actual results could differ materially from the estimates in the near term.
Concentration of Credit Risk
The Property had one tenant that accounted for approximately 10% of revenues in the three months ended March 31, 2012 and in the year ended December 31, 2011.
165
Table of Contents
2. Leases
The aggregate annual future minimum lease payments to be received under existing operating leases as of December 31, 2011 are as follows:
| 2012 |
$ | 3,286,000 | ||
| 2013 |
2,613,000 | |||
| 2014 |
2,443,000 | |||
| 2015 |
2,223,000 | |||
| 2016 |
2,065,000 | |||
| 2017 and thereafter |
4,050,000 | |||
|
|
|
|||
| $ | 16,680,000 | |||
|
|
|
The Property was completed in 2007 and was approximately 85% occupied at December 31, 2011 (unaudited). The Property is generally leased to tenants under lease terms that provide for the tenants to pay a pro rata share of their operating expenses. The above future minimum lease payments do not include amounts for tenant reimbursements of operating expenses.
Certain tenants have lease termination options built into their leases, which are subject to termination fees. In the event that a tenant does exercise its option to terminate its lease early and the terminated space is not subsequently leased out, the amount of future minimum rent received will be reduced.
3. Commitments and Contingencies
The Operating Partnership may be subject to legal claims in the ordinary course of business as a property owner. The Operating Partnership believes that the ultimate settlement of any potential claims will not have a material impact on the Property’s results of operations.
166
Table of Contents
To the Board of Directors and Stockholders of Excel Trust, Inc.
We have audited the accompanying combined statement of revenues and certain expenses (the “Historical Summary”) of the Southeast Portfolio (the “Properties”) for the year ended December 31, 2011. This Historical Summary is the responsibility of the Properties’ management. Our responsibility is to express an opinion on the Historical Summary based on our audit.
We conducted our audit in accordance with auditing standards generally accepted in the United States of America. Those standards require that we plan and perform the audit to obtain reasonable assurance about whether the Historical Summary is free of material misstatement. An audit includes consideration of internal control over financial reporting as a basis for designing audit procedures that are appropriate in the circumstances, but not for the purpose of expressing an opinion on the effectiveness of the Properties’ internal control over financial reporting. Accordingly, we express no such opinion. An audit also includes examining, on a test basis, evidence supporting the amounts and disclosures in the Historical Summary, assessing the accounting principles used and significant estimates made by management, as well as evaluating the overall presentation of the Historical Summary. We believe that our audit provides a reasonable basis for our opinion.
The accompanying Historical Summary was prepared for the purpose of complying with the rules and regulations of the Securities and Exchange Commission (for inclusion in this Registration Statement on Form 10) as described in Note 1 to the Historical Summary and is not intended to be a complete presentation of the Properties’ revenues and expenses.
In our opinion, the Historical Summary of the Properties presents fairly, in all material respects, the revenues and certain expenses described in Note 1 to the Historical Summary of the Properties for the year ended December 31, 2011, in conformity with accounting principles generally accepted in the United States of America.
/s/ DELOITTE & TOUCHE LLP
Los Angeles, California
November 2, 2012
167
Table of Contents
COMBINED STATEMENTS OF REVENUES AND CERTAIN EXPENSES
For the Six Months Ended June 30, 2012 and for the Year Ended December 31, 2011
| Six months ended June 30, 2012 |
Year ended December 31, 2011 |
|||||||
| (unaudited) | ||||||||
| Revenues: |
||||||||
| Rental revenues |
$ | 8,827,000 | $ | 17,140,000 | ||||
| Tenant reimbursements |
1,211,000 | 2,175,000 | ||||||
| Other income |
178,000 | 367,000 | ||||||
|
|
|
|
|
|||||
| Total revenues |
10,216,000 | 19,682,000 | ||||||
| Certain expenses |
||||||||
| Property operating and maintenance |
1,659,000 | 2,758,000 | ||||||
| Property taxes |
789,000 | 1,547,000 | ||||||
| Management fees |
270,000 | 539,000 | ||||||
| Insurance |
197,000 | 311,000 | ||||||
|
|
|
|
|
|||||
| Total certain expenses |
2,915,000 | 5,155,000 | ||||||
|
|
|
|
|
|||||
| Revenues in excess of certain expenses |
$ | 7,301,000 | $ | 14,527,000 | ||||
|
|
|
|
|
|||||
See accompanying notes to combined statements of revenues and certain expenses.
168
Table of Contents
NOTES TO COMBINED STATEMENTS OF REVENUES AND CERTAIN EXPENSES
1. Organization and Summary of Significant Accounting Policies
Organization
The accompanying combined statements of revenues and certain expenses (the “Historical Summary”) include the operations of the Southeast Portfolio (the “Properties”), which have been combined for purposes of this Historical Summary as each of the Properties was under common control or management prior to the acquisition. The Properties collectively contain approximately 705,000 square feet of retail and commercial space (unaudited), with an additional 339 apartment units (unaudited) on the upper levels of one of the shopping centers. The acquisition of the Properties by Excel Trust, L.P. (the “Operating Partnership”) from an unaffiliated third party closed on October 19, 2012 for a purchase price of approximately $262.4 million, including the issuance of OP units valued at approximately $5.1 million and the assumption of indebtedness in the amount of approximately $62.0 million, with a weighted-average interest rate of 2.6%.
Basis of Presentation
The Historical Summary has been prepared for the purpose of complying with the provisions of Article 3-14 of Regulation S-X promulgated by the Securities and Exchange Commission (the “SEC”), which requires certain information with respect to real estate operations to be included with certain filings with the SEC. The Historical Summary includes the historical revenues and certain operating expenses of the Properties, exclusive of items which may not be comparable to the proposed future operations of the Properties. Material amounts that would not be directly attributable to future operating results of the Properties are excluded, and the Historical Summary is not intended to be a complete presentation of the Properties’ revenues and expenses. Items excluded consist of depreciation and amortization, interest expense and federal and state income taxes.
The accompanying statement is not representative of the actual operations for the period presented, as certain expenses that may not be comparable to the expenses expected to be incurred by the Operating Partnership in the future operations of the Properties have been excluded. The Historical Summary for the six months ended June 30, 2012 (unaudited) reflects all adjustments (consisting only of normal recurring adjustments), which are, in the opinion of management, necessary for a fair presentation of revenues and certain expenses for the period presented. The revenues and certain expenses for the six months ended June 30, 2012 are not necessarily indicative of the expected results for the entire fiscal year ending December 31, 2012.
The accompanying statement also includes 100% of the revenues and certain operating expenses of one property in which the Operating Partnership will be acquiring a 50% tenant-in-common interest (revenues of $1.7 million and $3.5 million and certain expenses of $268,000 and $619,000 for the six months ended June 30, 2012 and for the year ended December 31, 2011, respectively).
In the preparation of the accompanying Historical Summary, subsequent events were evaluated through November 2, 2012, the date the financial statements were issued.
Revenue Recognition
Rental revenue is recognized on an accrual basis as it is earned over the lives of the respective tenant leases on a straight-line basis. Tenant reimbursements, which represent estimated recoveries from certain tenants for their pro rata share of real estate taxes, insurance and other operating expenses are recognized as revenues in the period the applicable expenses are incurred or as specified in the leases. Rental receivables are periodically evaluated for collectability.
Repairs and Maintenance
Expenditures for repairs and maintenance are expensed as incurred.
Use of Estimates
The preparation of financial statements in conformity with accounting principles generally accepted in the United States of America requires management to make estimates and assumptions that affect the reported amounts of revenues and certain expenses during the reporting period. Actual results could differ materially from the estimates in the near term.
Concentration of Credit Risk
No tenants accounted for more than 10% of the Properties’ revenues in the six months ended June 30, 2012 or in the year ended December 31, 2011.
169
Table of Contents
2. Leases
The aggregate annual future minimum lease payments to be received under existing operating leases as of December 31, 2011 are as follows (excludes apartment units, which have lease terms of one year or less):
| 2012 |
$ | 12,702,000 | ||
| 2013 |
12,936,000 | |||
| 2014 |
11,589,000 | |||
| 2015 |
10,804,000 | |||
| 2016 |
10,272,000 | |||
| 2017 and thereafter |
87,800,000 | |||
|
|
|
|||
| $ | 146,103,000 | |||
|
|
|
The Properties are generally leased to tenants under lease terms that provide for the retail and office tenants to pay a pro rata share of their operating expenses. The above future minimum lease payments do not include amounts for tenant reimbursements of operating expenses.
Certain tenants have lease termination options built into their leases, which are subject to termination fees. In the event that a tenant exercises its option to terminate its lease early and the terminated space is not subsequently released, the amount of future minimum rent received will be reduced.
3. Related Party Transactions
In the six months ended June 30, 2012 (unaudited) and the year ended December 31, 2011, property management fees of $270,000 and $539,000, respectively, were paid or payable to a company affiliated with the sellers of the Properties.
4. Commitments and Contingencies
The Operating Partnership may be subject to legal claims in the ordinary course of business as a property owner. The Operating Partnership believes that the ultimate settlement of any potential claims will not have a material impact on the Properties’ results of operations.
Item 14. Changes in and Disagreements with Accountants on Accounting and Financial Disclosure.
Not applicable
Item 15. Financial Statements and Exhibits.
(a) Financial Statements
See Item 13.
(b) Exhibits
170
Table of Contents
Excel Trust, L.P.
Pro Forma Consolidated Financial Statements
(Unaudited)
The following unaudited pro forma financial information of Excel Trust, L.P. (the “Operating Partnership”) is based on the historical financial statements of the Operating Partnership. The unaudited pro forma consolidated statement of operations of the Operating Partnership for the year ended December 31, 2012 has been prepared as if the acquisition of the properties indicated below (the “Properties”) had occurred on January 1, 2012.
Such unaudited pro forma financial information should be read in conjunction with the historical consolidated financial statements of the Operating Partnership, which are included elsewhere herein. The unaudited pro forma financial information is for informational purposes only and is not necessarily indicative of the results of operations of the Operating Partnership that would have occurred if the acquisition of the Properties had been completed on the date indicated, nor does it purport to represent the Operating Partnership’s results of operations as of any future date or for any future period. The pro forma condensed consolidated statements of operations of the Operating Partnership are adjusted to include the acquisition of the Properties and reflect the operations of the property in which the Operating Partnership holds a 50% tenant-in-common interest under the equity method of accounting. In addition, the pro forma condensed consolidated financial statements are based upon pro forma allocations of the purchase price of the Properties based upon preliminary estimates of fair value of the assets acquired and liabilities assumed in connection with the acquisition. These allocations may be adjusted in the future upon finalization of these preliminary estimates. Management believes all material adjustments necessary to reflect the effect of the acquisition have been made to the unaudited pro forma financial information. No pro forma financial information is presented for the consolidated balance as of December 31, 2012 or for the consolidated statement of operations for the three months ended March 31, 2013 as the effect of the acquisition of the Properties is already reflected in these historical financial statements.
171
Table of Contents
UNAUDITED PRO FORMA CONSOLIDATED STATEMENT OF OPERATIONS
Year ended December 31, 2012
(in thousands, except per share amounts)
| Operating Partnership Historical(A) |
Acquisition of The Promenade Corporate Center(B) |
Acquisition of Lake Pleasant Pavilion(C) |
Acquisition of the Southeast Portfolio(D) |
Operating Partnership Pro Forma |
||||||||||||||||
| REVENUES: |
||||||||||||||||||||
| Rental revenue |
$ | 71,522 | $ | 349 | $ | 1,124 | 12,357 | $ | 85,352 | |||||||||||
| Tenant recoveries |
14,190 | 34 | 318 | 2,447 | 16,989 | |||||||||||||||
| Other income |
1,432 | 8 | 11 | 285 | 1,735 | |||||||||||||||
|
|
|
|
|
|
|
|
|
|
|
|||||||||||
| Total revenues |
87,144 | 391 | 1,452 | 15,089 | 104,076 | |||||||||||||||
| EXPENSES: |
||||||||||||||||||||
| Maintenance and repairs |
5,688 | 53 | 12 | 833 | 6,586 | |||||||||||||||
| Real estate taxes |
9,921 | 45 | 282 | 3,478 | 13,726 | |||||||||||||||
| Management fees |
914 | — | — | — | 914 | |||||||||||||||
| Other operating expenses |
4,085 | 39 | 90 | 1,896 | 6,110 | |||||||||||||||
| Changes in fair value of earn-outs |
(281 | ) | — | — | — | (281 | ) | |||||||||||||
| General and administrative |
13,778 | — | — | — | 13,778 | |||||||||||||||
| Depreciation and amortization |
36,021 | 120 | 410 | 5,441 | 41,991 | |||||||||||||||
|
|
|
|
|
|
|
|
|
|
|
|||||||||||
| Total expenses |
70,126 | 257 | 794 | 11,646 | 82,823 | |||||||||||||||
|
|
|
|
|
|
|
|
|
|
|
|||||||||||
| Net operating income |
17,018 | 134 | 659 | 3,442 | 21,253 | |||||||||||||||
| Interest expense |
(16,556 | ) | (21 | ) | (717 | ) | (4,381 | ) | (21,675 | ) | ||||||||||
| Interest income |
173 | — | — | — | 173 | |||||||||||||||
| Loss from equity in unconsolidated entities |
(320 | ) | — | — | 5 | (315 | ) | |||||||||||||
| Gain on acquisition of real estate and sale of land parcel |
— | — | — | — | — | |||||||||||||||
| Changes in fair value of financial instruments |
1,530 | — | — | — | 1,530 | |||||||||||||||
|
|
|
|
|
|
|
|
|
|
|
|||||||||||
| Net income (loss) |
1,845 | 113 | (59 | ) | (934 | ) | 965 | |||||||||||||
| Net income attributable to non-controlling interests |
(279 | ) | — | — | — | (279 | ) | |||||||||||||
|
|
|
|
|
|
|
|
|
|
|
|||||||||||
| Net income (loss) attributable to Excel Trust, L.P. |
1,566 | 113 | (59 | ) | (934 | ) | 686 | |||||||||||||
| Preferred stock dividends |
(10,353 | ) | — | — | — | (10,353 | ) | |||||||||||||
|
|
|
|
|
|
|
|
|
|
|
|||||||||||
| Net loss attributable to the unitholders |
$ | (8,787 | ) | $ | 113 | $ | (59 | ) | (934 | ) | $ | (9,667 | ) | |||||||
|
|
|
|
|
|
|
|
|
|
|
|||||||||||
| Net loss per unit attributable to the unitholders — basic and diluted |
$ | (0.26 | ) | $ | (0.28 | ) | ||||||||||||||
|
|
|
|
|
|||||||||||||||||
| Weighted-average common operating partnership unit outstanding — basic and diluted |
35,912 | 194 | 328 | 36,434 | ||||||||||||||||
|
|
|
|
|
|
|
|
|
|
|
|||||||||||
See accompanying notes
172
Table of Contents
NOTES TO PRO FORMA CONSOLIDATED STATEMENT OF OPERATIONS
(Unaudited)
(A) Derived from the Operating Partnership’s consolidated statement of operations and comprehensive loss for the year ended December 31, 2012.
(B) To reflect the acquisition of The Promenade Corporate Center property (the “PCC Property”) as if it were acquired on January 1, 2012 (representing the period from January 1, 2012 through the acquisition date of January 24, 2012). The pro forma adjustments include the pro forma operations of the PCC Property. The acquisition method of accounting was used to allocate the purchase price to tangible and identified intangible assets and liabilities according to their fair values. The amount allocated to building and site improvements and tenant improvements is depreciated over an estimated useful life of 40 years and four years, respectively. The amounts allocated to intangible lease assets and liabilities are amortized over the lives of the leases with an average life of three years and six years, respectively.
Historical revenue of $359,000 is decreased by $10,000 for the pro forma net amortization of above and below market leases for the period from January 1, 2012 to January 22, 2012.
Expenses are based on historical operations of the previous owner except for real estate property tax which is calculated based on an estimated reassessed tax basis subsequent to the acquisition. Tenant recoveries have been adjusted to reflect the estimated property tax expense.
Interest expense reflects estimated interest costs incurred for the period from January 1, 2012 to January 22, 2012 based on borrowings of $13.9 million from the Operating Partnership’s unsecured revolving credit facility used to fund the acquisition. At January 1, 2012, the Operating Partnership’s unsecured revolving credit facility bore interest at the rate of LIBOR plus a margin of 220 basis points to 300 basis points, depending on the Operating Partnership’s leverage ratio. Interest is assumed to be 2.5% for the period presented based on the interest rate in effect at January 1, 2012 (a 0.125% variance in the assumed interest rate of 2.5% would result in an increase or decrease in interest expense of approximately $1,000 for the period from January 1, 2012 to January 22, 2012).
The addition to weighted average common operating partnership units outstanding of approximately 194,000 common operating partnership units (“common OP units”) reflects the weighted-average effect of the issuance of 3,230,769 shares of common stock of the Operating Partnership’s general partner (and the issuance of an equivalent number of common OP units to the general partner) for the acquisition of the PCC Property as if the acquisition had occurred on January 1, 2012. The purchase price for the PCC Property of $53.0 million was comprised of $13.9 million in cash paid and the issuance of 3,230,769 shares of common stock of the general partner with a fair value of approximately $39.1 million based on a closing price of $12.11 per share of the general partner’s common stock on the date of acquisition.
(C) To reflect the acquisition of the Lake Pleasant Pavilion property (the “Lake Pleasant Property”) as if it were acquired on January 1, 2012 (representing the period from January 1, 2012 through the acquisition date of May 16, 2012). The pro forma adjustments include the pro forma operations of the Lake Pleasant Property. The acquisition method of accounting was used to allocate the purchase price to tangible and identified intangible assets and liabilities according to their fair values. The amount allocated to building, site improvements and tenant improvements is depreciated over an estimated useful life of 40 years, 11 years and six years, respectively. The amounts allocated to intangible lease assets and liabilities are amortized over the lives of the leases with an average life of five years and six years, respectively.
Historical revenue of $1.2 million is decreased by $105,000 for the pro forma net amortization of above and below market leases for the period from January 1, 2012 to May 16, 2012.
Expenses are based on historical operations of the previous owner except for real estate property tax which is calculated using an estimated reassessed tax basis subsequent to the acquisition (based on the purchase price and prevailing tax rates). Tenant recoveries have been adjusted to reflect the estimated property tax expense.
173
Table of Contents
Interest expense reflects estimated interest costs incurred for the period from January 1, 2012 to May 16, 2012 based on the assumption of a mortgage note in the amount of approximately $28.3 million, with a fixed interest rate of 6.1%, and borrowings of $13.5 million from the Operating Partnership’s unsecured revolving credit facility used to fund the acquisition. At January 1, 2012, the Operating Partnership’s unsecured revolving credit facility bore interest at the rate of LIBOR plus a margin of 220 basis points to 300 basis points, depending on the Operating Partnership’s leverage ratio. Interest is assumed to be 2.5% for the period presented based on the interest rate in effect at January 1, 2012 and historic LIBOR rates during the period from January 1, 2012 to May 31, 2012, which have ranged from 0.24% to 0.28% (a 0.125% variance in the assumed interest rate of 2.5% would result in an increase or decrease in interest expense of approximately $6,000 for the period from January 1, 2012 to May 16, 2012). Interest expense also reflects a reduction to interest expense for the amortization of $1.1 million of debt premium and an increase for the amortization of $283,000 of loan fees over the remaining life of the loan, which matures in October 2017.
(D) To reflect the acquisition of the Southeast Portfolio (the “Portfolio”) as if it were acquired on January 1, 2012 (representing the period from January 1, 2012 through the acquisition date of October 19, 2012). The pro forma adjustments include the pro forma operations of the Portfolio (including the pro forma operations of a property in which the Operating Partnership owns a 50% tenant-in-common interest, which is reflected as loss from equity in unconsolidated entities). The acquisition method of accounting was used to allocate the purchase price to tangible and identified intangible assets and liabilities according to their fair values. The amount allocated to building, site improvements and tenant improvements is depreciated over an estimated useful life of 40 years, 11 years and 12 years, respectively. The amounts allocated to intangible lease assets and liabilities are amortized over the lives of the leases with an average life of 13 years and seven years, respectively.
Historical revenue of $11.9 million is increased by $492,000 for the pro forma net amortization of above- and below-market leases for the period from January 1, 2012 to October 19, 2012 (not including the historical revenue and pro forma net amortization of above- and below-market leases pertaining to the property in which the Operating Partnership owns a 50% tenant-in-common interest).
Expenses are based on historical operations of the previous owner except for real estate property tax, which is calculated using an estimated reassessed tax basis subsequent to the acquisition (based on the purchase price and prevailing tax rates). Tenant recoveries have been adjusted to reflect the estimated property tax expense.
Interest expense reflects estimated interest costs incurred for the period from January 1, 2012 to October 19, 2012 based on the assumption of a mortgage note at the unconsolidated property in the amount of approximately $12.0 million, with a floating interest rate of LIBOR plus a margin of 325 bps (assumed to be 3.5%), a bridge loan in the amount of $50.0 million executed concurrent with the acquisition at a floating rate of LIBOR plus a margin of 250 bps (assumed to be 2.7%) and borrowings of $195.3 million from the Operating Partnership’s unsecured revolving credit facility used to fund the acquisition. At January 1, 2012, the Operating Partnership’s unsecured revolving credit facility bore interest at the rate of LIBOR plus a margin of 220 basis points to 300 basis points, depending on the Operating Partnership’s leverage ratio. The unsecured revolving credit facility was later amended in July 2012, lowering the interest rate to LIBOR plus a margin of 165 basis points to 225 basis points, depending on the Operating Partnership’s leverage ratio. Interest is assumed to be 2.1% for the period presented based on the interest rates in effect during the period from January 1, 2012 to October 19, 2012, which have ranged from 2.5% to 1.9%. (a 0.125% variance in the assumed interest rate of 2.1% would result in an increase or decrease in interest expense of approximately $195,000 for the period from January 1, 2012 to October 19, 2012).
The addition to weighted average common operating partnership units outstanding of approximately 328,000 common OP units for the period from January 1, 2012 to October 19, 2012 reflects the issuance of 411,184 common OP units as if the acquisition had occurred on January 1, 2012. The purchase price for the Portfolio of $259.2 million was comprised of $192.1 million in cash paid, the issuance of 411,184 common OP units with a fair value of approximately $5.1 million based on a closing price of $12.36 per share of the general partner’s common stock on the date of acquisition and the assumption of approximately $62.0 million of indebtedness.
174
Table of Contents
| Exhibit |
Description | |
| 3.1 | Articles of Amendment and Restatement of Excel Trust, Inc. (1) | |
| 3.2 | Amended and Restated Bylaws of Excel Trust, Inc. (1) | |
| 3.3 | Articles Supplementary Classifying 7.00% Series A Cumulative Convertible Perpetual Preferred Stock of Excel Trust, Inc. (2) | |
| 3.4 | Articles Supplementary Classifying 8.125% Series B Cumulative Redeemable Preferred Stock of Excel Trust, Inc. (3) | |
| 4.1* | Form of Certificate for Partnership Units of Excel Trust, L.P. | |
| 4.2 | Form of Certificate for Common Stock of Excel Trust, Inc. (1) | |
| 4.3 | Specimen Certificate for 7.00% Series A Cumulative Convertible Perpetual Preferred Stock of Excel Trust, Inc. (2) | |
| 4.4 | Specimen Certificate for 8.125% Series B Cumulative Redeemable Preferred Stock of Excel Trust, Inc. (3) | |
| 10.1 | Second Amended and Restated Agreement of Limited Partnership of Excel Trust, L.P. (3) | |
| 10.2 | Registration Rights Agreement, dated May 4, 2010, by and among Excel Trust, Inc., Excel Trust, L.P. and the persons named therein. (4) | |
| 10.3 | Contribution Agreement (operating partnership units) between Excel Trust, L.P. and Gary B. Sabin dated as of December 24, 2009. (1) | |
| 10.4 | Contribution Agreement (operating partnership units) between Excel Trust, L.P. and James Y. Nakagawa dated as of December 24, 2009. (1) | |
| 10.5 | Contribution Agreement (operating partnership units) between Excel Trust, L.P. and S. Eric Ottesen dated as of December 24, 2009. (1) | |
| 10.6 | Contribution Agreement (operating partnership units) between Excel Trust, L.P. and Mark T. Burton dated as of December 24, 2009. (1) | |
| 10.7 | Form of Contribution Agreement (operating partnership units) between Excel Trust, L.P. and additional contributors dated as of December 24, 2009. (1) | |
| 10.8 | First Amendment to Contribution Agreement (operating partnership units) between Excel Trust, L.P. and Gary B. Sabin dated as of April 21, 2010. (1) | |
| 10.9 | First Amendment to Contribution Agreement (operating partnership units) between Excel Trust, L.P. and James Y. Nakagawa dated as of April 21, 2010. (1) | |
| 10.10 | First Amendment to Contribution Agreement (operating partnership units) between Excel Trust, L.P. and S. Eric Ottesen dated as of April 21, 2010. (1) | |
| 10.11 | First Amendment to Contribution Agreement (operating partnership units) between Excel Trust, L.P. and Mark T. Burton dated as of April 21, 2010. (1) | |
| 10.12 | First Amendment to Contribution Agreement (operating partnership units) between Excel Trust, L.P. and additional contributor dated as of April 21, 2010. (1) | |
| 10.13 | 2010 Equity Incentive Award Plan. (5) | |
175
Table of Contents
| Exhibit |
Description | |
| 10.14 | Excel Trust, Inc. and Excel Trust, L.P. Incentive Bonus Plan. (4) | |
| 10.15 | Form of Restricted Stock Award Agreement under the 2010 Equity Incentive Award Plan (Time-Based Vesting). (6) | |
| 10.16 | Form of Restricted Stock Award Agreement under the 2010 Equity Incentive Award Plan (Performance-Based Vesting). (6) | |
| 10.17 | Form of Indemnification Agreement between Excel Trust, Inc. and each of its directors and officers. (1) | |
| 10.18 | Employment Agreement among Excel Trust, Inc., Excel Trust, L.P. and Gary B. Sabin. (7) | |
| 10.19 | Employment Agreement among Excel Trust, Inc., Excel Trust, L.P. and Spencer G. Plumb. (7) | |
| 10.20 | Employment Agreement among Excel Trust, Inc., Excel Trust, L.P. and James Y. Nakagawa. (7) | |
| 10.21 | Employment Agreement among Excel Trust, Inc., Excel Trust, L.P. and Mark T. Burton. (7) | |
| 10.22 | Employment Agreement among Excel Trust, Inc., Excel Trust, L.P. and S. Eric Ottesen. (7) | |
| 10.23 | First Amendment to Employment Agreement among Excel Trust, Inc., Excel Trust, L.P. and Gary B. Sabin. (6) | |
| 10.24 | First Amendment to Employment Agreement among Excel Trust, Inc., Excel Trust, L.P. and James Y. Nakagawa. (6) | |
| 10.25 | First Amendment to Employment Agreement among Excel Trust, Inc., Excel Trust, L.P. and S. Eric Ottesen. (6) | |
| 10.26 | First Amendment to Employment Agreement among Excel Trust, Inc., Excel Trust, L.P. and Spencer G. Plumb. (6) | |
| 10.27 | First Amendment to Employment Agreement among Excel Trust, Inc., Excel Trust, L.P. and Mark T. Burton. (6) | |
| 10.28 | Credit Agreement, dated July 8, 2010, by and among Excel Trust, L.P., as Borrower, Excel Trust, Inc., as Parent, Wells Fargo Securities, LLC and KeyBanc Capital Markets, as Joint Lead Arrangers and Joint Bookrunners, Wells Fargo Bank, National Association, as Administrative Agent, KeyBank National Association, as Syndication Agent, PNC Capital Markets, LLC and U.S. Bank National Association as Documentation Agents, and certain other lenders party thereto. (8) | |
| 10.29 | First Amendment to Credit Agreement, dated September 8, 2010, by and among Excel Trust, L.P., as Borrower, Excel Trust, Inc., as Parent, each of the Lenders party thereto, and Wells Fargo Bank, National Association, as Administrative Agent. (9) | |
| 10.30 | Second Amendment to Credit Agreement, dated December 3, 2010, by and among Excel Trust, L.P., as Borrower, Excel Trust, Inc., as Parent, each of the Lenders party thereto, and Wells Fargo Bank, National Association, as Administrative Agent. (9) | |
| 10.31 | Third Amendment to Credit Agreement, dated June 3, 2011, by and among Excel Trust, L.P., as Borrower, Excel Trust, Inc., as Parent, each of the Lenders party thereto, and Wells Fargo Bank, National Association, as Administrative Agent. (10) | |
| 10.32 | Fourth Amendment to Credit Agreement, dated January 23, 2012, by and among Excel Trust, L.P., as Borrower, Excel Trust, Inc., as Parent, each of the Lenders party thereto, and Wells Fargo Bank, National Association, as Administrative Agent. (15) | |
176
Table of Contents
| Exhibit |
Description | |
| 10.33 | Amended and Restated Credit Agreement, dated July 20, 2012, by and among Excel Trust, L.P., as Borrower, Excel Trust, Inc., as Parent, Wells Fargo Securities, LLC and KeyBanc Capital Markets, Inc., as Joint Lead Arrangers and Joint Bookrunners, Wells Fargo Bank, National Association, as Administrative Agent, KeyBank National Association, as Syndication Agent, US Bank, National Association, PNC Bank, National Association and Union Bank, N.A., as Documentation Agents, and certain other lenders party thereto. (16) | |
| 10.34 | Purchase and Sale Agreement and Joint Escrow Instructions, dated May 6, 2010, between CNLRS Rockwall, L.P. and Excel Trust, L.P. (4) | |
| 10.35 | First Amendment to Purchase and Sale Agreement and Joint Escrow Instructions, dated May 19, 2010, between CNLRS Rockwall, L.P. and Excel Trust, L.P. (4) | |
| 10.36 | Loan Purchase Agreement dated August 30, 2010 between Propst Vestavia LLC and Excel Vestavia LLC (Vestavia Hills City Center). (11) | |
| 10.37 | Release Agreement and Covenant Not to Sue dated August 30, 2010 among AIG Baker Vestavia, L.L.C., AIG/Baker Partnership and Excel Vestavia LLC (Vestavia Hills City Center). (11) | |
| 10.38 | Purchase and Sale Agreement and Joint Escrow Instructions dated September 3, 2010 between Faison-Brandywine, LLC and Excel Trust, L.P. (Brandywine Crossing). (12) | |
| 10.39 | Purchase and Sale Agreement and Joint Escrow Instructions dated September 3, 2010 between Faison-Rosewick, LLC and Excel Trust, L.P. (Rosewick Crossing). (12) | |
| 10.40 | Purchase and Sale Agreement and Joint Escrow Instructions dated September 23, 2010 (Park West Place). (13) | |
| 10.41 | Purchase and Sale Agreement and Joint Escrow Instructions between Lakha Properties — Gilroy LLC and Excel Trust, L.P. dated December 9, 2010. (Gilroy Crossing) (14) | |
| 10.42 | Purchase and Sale Agreement and Joint Escrow Instructions dated March 21, 2011 between Pacific Promenade, LLC and Excel Trust, L.P. (6) | |
| 10.43 | Purchase and Sale Agreement and Joint Escrow Instructions dated October 25, 2011 between Levine Investments Limited Partnership and Excel Trust, L.P., as amended. (15) | |
| 10.44 | Purchase and Sale Agreement and Joint Escrow Instructions, as amended, between Della Road Development, LLC and Excel Trust, L.P., dated October 9, 2012. (17) | |
| 10.45 | Purchase and Sale Agreement and Joint Escrow Instructions, as amended, among Lake Burden/Overstreet 1, LLC, Maguire Shoppes LLC, Maguire Shoppes II, LLC and Excel Trust, L.P., dated May 31, 2012. (17) | |
| 10.46 | Purchase and Sale Agreement and Joint Escrow Instructions, as amended, among West Broad Village III, LLC, West Broad Village V, LLC and Excel Trust, L.P., dated May 31, 2012. (17) | |
| 10.47 | Purchase and Sale Agreement and Joint Escrow Instructions, as amended, between Bay Hill Fountains, L.L.C. and Excel Trust, L.P., dated May 31, 2012. (17) | |
| 12.1* | Ratio of Earnings to Fixed Charges. | |
177
Table of Contents
| Exhibit |
Description | |
| 21.1 | List of Subsidiaries of Excel Trust, Inc. (18) | |
| * | Filed herewith. |
| (1) | Incorporated herein by reference to Excel Trust, Inc.’s Registration Statement on Form S-11, as amended (File No. 333-164031), filed with the Securities and Exchange Commission on December 24, 2009. |
| (2) | Incorporated herein by reference to Excel Trust, Inc.’s Current Report on Form 8-K filed with the Securities and Exchange Commission on January 31, 2011. |
| (3) | Incorporated herein by reference to Excel Trust, Inc.’s Current Report on Form 8-K filed with the Securities and Exchange Commission on February 2, 2012. |
| (4) | Incorporated herein by reference to Excel Trust, Inc.’s Quarterly Report on Form 10-Q filed with the Securities and Exchange Commission on June 4, 2010. |
| (5) | Incorporated herein by reference to Excel Trust, Inc.’s Registration Statement on Form S-8 (File No. 333-166267) filed with the Securities and Exchange Commission on April 23, 2010. |
| (6) | Incorporated herein by reference to Excel Trust, Inc.’s Quarterly Report on Form 10-Q filed with the Securities and Exchange Commission on May 10, 2011. |
| (7) | Incorporated herein by reference to Excel Trust, Inc.’s Current Report on Form 8-K filed with the Securities and Exchange Commission on April 28, 2010. |
| (8) | Incorporated herein by reference to Excel Trust, Inc.’s Current Report on Form 8-K filed with the Securities and Exchange Commission on July 13, 2010. |
| (9) | Incorporated herein by reference to Excel Trust, Inc.’s Current Report on Form 8-K filed with the Securities and Exchange Commission on December 8, 2010. |
| (10) | Incorporated herein by reference to Excel Trust, Inc.’s Current Report on Form 8-K filed with the Securities and Exchange Commission on June 6, 2011. |
| (11) | Incorporated herein by reference to Excel Trust, Inc.’s Current Report on Form 8-K filed with the Securities and Exchange Commission on September 3, 2010. |
| (12) | Incorporated herein by reference to Excel Trust, Inc.’s Current Report on Form 8-K filed with the Securities and Exchange Commission on September 9, 2010. |
| (13) | Incorporated herein by reference to Excel Trust, Inc.’s Current Report on Form 8-K filed with the Securities and Exchange Commission on September 28, 2010. |
| (14) | Incorporated herein by reference to Excel Trust, Inc.’s Current Report on Form 8-K filed with the Securities and Exchange Commission on December 15, 2010. |
| (15) | Incorporated herein by reference to Excel Trust, Inc.’s Annual Report on Form 10-K filed with the Securities and Exchange Commission on March 1, 2012. |
| (16) | Incorporated herein by reference to Excel Trust, Inc.’s Current Report on Form 8-K filed with the Securities and Exchange Commission on July 25, 2012. |
| (17) | Incorporated herein by reference to Excel Trust, Inc.’s Current Report on Form 8-K filed with the Securities and Exchange Commission on October 19, 2012. |
| (18) | Incorporated herein by reference to Excel Trust, Inc.’s Annual Report on Form 10-K filed with the Securities and Exchange Commission on March 1, 2013. |
178
Table of Contents
SIGNATURES
Pursuant to the requirements of Section 12 of the Securities Exchange Act of 1934, the registrant has duly caused this registration statement to be signed on its behalf by the undersigned, thereunto duly authorized.
| EXCEL TRUST, L.P. | ||
| By: | Excel Trust, Inc. | |
| Its general partner | ||
| By: | /s/ Gary B. Sabin | |
| Chairman and Chief Executive Officer |
Date: May 28, 2013
Table of Contents
| Exhibit |
Description | |
| 3.1 | Articles of Amendment and Restatement of Excel Trust, Inc. (1) | |
| 3.2 | Amended and Restated Bylaws of Excel Trust, Inc. (1) | |
| 3.3 | Articles Supplementary Classifying 7.00% Series A Cumulative Convertible Perpetual Preferred Stock of Excel Trust, Inc. (2) | |
| 3.4 | Articles Supplementary Classifying 8.125% Series B Cumulative Redeemable Preferred Stock of Excel Trust, Inc. (3) | |
| 4.1* | Form of Certificate for Partnership Units of Excel Trust, L.P. | |
| 4.2 | Form of Certificate for Common Stock of Excel Trust, Inc. (1) | |
| 4.3 | Specimen Certificate for 7.00% Series A Cumulative Convertible Perpetual Preferred Stock of Excel Trust, Inc. (2) | |
| 4.4 | Specimen Certificate for 8.125% Series B Cumulative Redeemable Preferred Stock of Excel Trust, Inc. (3) | |
| 10.1 | Second Amended and Restated Agreement of Limited Partnership of Excel Trust, L.P. (3) | |
| 10.2 | Registration Rights Agreement, dated May 4, 2010, by and among Excel Trust, Inc., Excel Trust, L.P. and the persons named therein. (4) | |
| 10.3 | Contribution Agreement (operating partnership units) between Excel Trust, L.P. and Gary B. Sabin dated as of December 24, 2009. (1) | |
| 10.4 | Contribution Agreement (operating partnership units) between Excel Trust, L.P. and James Y. Nakagawa dated as of December 24, 2009. (1) | |
| 10.5 | Contribution Agreement (operating partnership units) between Excel Trust, L.P. and S. Eric Ottesen dated as of December 24, 2009. (1) | |
| 10.6 | Contribution Agreement (operating partnership units) between Excel Trust, L.P. and Mark T. Burton dated as of December 24, 2009. (1) | |
| 10.7 | Form of Contribution Agreement (operating partnership units) between Excel Trust, L.P. and additional contributors dated as of December 24, 2009. (1) | |
| 10.8 | First Amendment to Contribution Agreement (operating partnership units) between Excel Trust, L.P. and Gary B. Sabin dated as of April 21, 2010. (1) | |
| 10.9 | First Amendment to Contribution Agreement (operating partnership units) between Excel Trust, L.P. and James Y. Nakagawa dated as of April 21, 2010. (1) | |
| 10.10 | First Amendment to Contribution Agreement (operating partnership units) between Excel Trust, L.P. and S. Eric Ottesen dated as of April 21, 2010. (1) | |
| 10.11 | First Amendment to Contribution Agreement (operating partnership units) between Excel Trust, L.P. and Mark T. Burton dated as of April 21, 2010. (1) | |
| 10.12 | First Amendment to Contribution Agreement (operating partnership units) between Excel Trust, L.P. and additional contributor dated as of April 21, 2010. (1) | |
Table of Contents
| Exhibit |
Description | |
| 10.13 | 2010 Equity Incentive Award Plan. (5) | |
| 10.14 | Excel Trust, Inc. and Excel Trust, L.P. Incentive Bonus Plan. (4) | |
| 10.15 | Form of Restricted Stock Award Agreement under the 2010 Equity Incentive Award Plan (Time-Based Vesting). (6) | |
| 10.16 | Form of Restricted Stock Award Agreement under the 2010 Equity Incentive Award Plan (Performance-Based Vesting). (6) | |
| 10.17 | Form of Indemnification Agreement between Excel Trust, Inc. and each of its directors and officers. (1) | |
| 10.18 | Employment Agreement among Excel Trust, Inc., Excel Trust, L.P. and Gary B. Sabin. (7) | |
| 10.19 | Employment Agreement among Excel Trust, Inc., Excel Trust, L.P. and Spencer G. Plumb. (7) | |
| 10.20 | Employment Agreement among Excel Trust, Inc., Excel Trust, L.P. and James Y. Nakagawa. (7) | |
| 10.21 | Employment Agreement among Excel Trust, Inc., Excel Trust, L.P. and Mark T. Burton. (7) | |
| 10.22 | Employment Agreement among Excel Trust, Inc., Excel Trust, L.P. and S. Eric Ottesen. (7) | |
| 10.23 | First Amendment to Employment Agreement among Excel Trust, Inc., Excel Trust, L.P. and Gary B. Sabin. (6) | |
| 10.24 | First Amendment to Employment Agreement among Excel Trust, Inc., Excel Trust, L.P. and James Y. Nakagawa. (6) | |
| 10.25 | First Amendment to Employment Agreement among Excel Trust, Inc., Excel Trust, L.P. and S. Eric Ottesen. (6) | |
| 10.26 | First Amendment to Employment Agreement among Excel Trust, Inc., Excel Trust, L.P. and Spencer G. Plumb. (6) | |
| 10.27 | First Amendment to Employment Agreement among Excel Trust, Inc., Excel Trust, L.P. and Mark T. Burton. (6) | |
| 10.28 | Credit Agreement, dated July 8, 2010, by and among Excel Trust, L.P., as Borrower, Excel Trust, Inc., as Parent, Wells Fargo Securities, LLC and KeyBanc Capital Markets, as Joint Lead Arrangers and Joint Bookrunners, Wells Fargo Bank, National Association, as Administrative Agent, KeyBank National Association, as Syndication Agent, PNC Capital Markets, LLC and U.S. Bank National Association as Documentation Agents, and certain other lenders party thereto. (8) | |
| 10.29 | First Amendment to Credit Agreement, dated September 8, 2010, by and among Excel Trust, L.P., as Borrower, Excel Trust, Inc., as Parent, each of the Lenders party thereto, and Wells Fargo Bank, National Association, as Administrative Agent. (9) | |
| 10.30 | Second Amendment to Credit Agreement, dated December 3, 2010, by and among Excel Trust, L.P., as Borrower, Excel Trust, Inc., as Parent, each of the Lenders party thereto, and Wells Fargo Bank, National Association, as Administrative Agent. (9) | |
| 10.31 | Third Amendment to Credit Agreement, dated June 3, 2011, by and among Excel Trust, L.P., as Borrower, Excel Trust, Inc., as Parent, each of the Lenders party thereto, and Wells Fargo Bank, National Association, as Administrative Agent. (10) | |
Table of Contents
| Exhibit |
Description | |
| 10.32 | Fourth Amendment to Credit Agreement, dated January 23, 2012, by and among Excel Trust, L.P., as Borrower, Excel Trust, Inc., as Parent, each of the Lenders party thereto, and Wells Fargo Bank, National Association, as Administrative Agent. (15) | |
| 10.33 | Amended and Restated Credit Agreement, dated July 20, 2012, by and among Excel Trust, L.P., as Borrower, Excel Trust, Inc., as Parent, Wells Fargo Securities, LLC and KeyBanc Capital Markets, Inc., as Joint Lead Arrangers and Joint Bookrunners, Wells Fargo Bank, National Association, as Administrative Agent, KeyBank National Association, as Syndication Agent, US Bank, National Association, PNC Bank, National Association and Union Bank, N.A., as Documentation Agents, and certain other lenders party thereto. (16) | |
| 10.34 | Purchase and Sale Agreement and Joint Escrow Instructions, dated May 6, 2010, between CNLRS Rockwall, L.P. and Excel Trust, L.P. (4) | |
| 10.35 | First Amendment to Purchase and Sale Agreement and Joint Escrow Instructions, dated May 19, 2010, between CNLRS Rockwall, L.P. and Excel Trust, L.P. (4) | |
| 10.36 | Loan Purchase Agreement dated August 30, 2010 between Propst Vestavia LLC and Excel Vestavia LLC (Vestavia Hills City Center). (11) | |
| 10.37 | Release Agreement and Covenant Not to Sue dated August 30, 2010 among AIG Baker Vestavia, L.L.C., AIG/Baker Partnership and Excel Vestavia LLC (Vestavia Hills City Center). (11) | |
| 10.38 | Purchase and Sale Agreement and Joint Escrow Instructions dated September 3, 2010 between Faison-Brandywine, LLC and Excel Trust, L.P. (Brandywine Crossing). (12) | |
| 10.39 | Purchase and Sale Agreement and Joint Escrow Instructions dated September 3, 2010 between Faison-Rosewick, LLC and Excel Trust, L.P. (Rosewick Crossing). (12) | |
| 10.40 | Purchase and Sale Agreement and Joint Escrow Instructions dated September 23, 2010 (Park West Place). (13) | |
| 10.41 | Purchase and Sale Agreement and Joint Escrow Instructions between Lakha Properties — Gilroy LLC and Excel Trust, L.P. dated December 9, 2010. (Gilroy Crossing) (14) | |
| 10.42 | Purchase and Sale Agreement and Joint Escrow Instructions dated March 21, 2011 between Pacific Promenade, LLC and Excel Trust, L.P. (6) | |
| 10.43 | Purchase and Sale Agreement and Joint Escrow Instructions dated October 25, 2011 between Levine Investments Limited Partnership and Excel Trust, L.P., as amended. (15) | |
| 10.44 | Purchase and Sale Agreement and Joint Escrow Instructions, as amended, between Della Road Development, LLC and Excel Trust, L.P., dated October 9, 2012. (17) | |
| 10.45 | Purchase and Sale Agreement and Joint Escrow Instructions, as amended, among Lake Burden/Overstreet 1, LLC, Maguire Shoppes LLC, Maguire Shoppes II, LLC and Excel Trust, L.P., dated May 31, 2012. (17) | |
| 10.46 | Purchase and Sale Agreement and Joint Escrow Instructions, as amended, among West Broad Village III, LLC, West Broad Village V, LLC and Excel Trust, L.P., dated May 31, 2012. (17) | |
| 10.47 | Purchase and Sale Agreement and Joint Escrow Instructions, as amended, between Bay Hill Fountains, L.L.C. and Excel Trust, L.P., dated May 31, 2012. (17) | |
Table of Contents
| Exhibit |
Description | |
| 12.1* | Ratio of Earnings to Fixed Charges. | |
| 21.1 | List of Subsidiaries of Excel Trust, Inc. (18) | |
| * | Filed herewith. |
| (1) | Incorporated herein by reference to Excel Trust, Inc.’s Registration Statement on Form S-11, as amended (File No. 333-164031), filed with the Securities and Exchange Commission on December 24, 2009. |
| (2) | Incorporated herein by reference to Excel Trust, Inc.’s Current Report on Form 8-K filed with the Securities and Exchange Commission on January 31, 2011. |
| (3) | Incorporated herein by reference to Excel Trust, Inc.’s Current Report on Form 8-K filed with the Securities and Exchange Commission on February 2, 2012. |
| (4) | Incorporated herein by reference to Excel Trust, Inc.’s Quarterly Report on Form 10-Q filed with the Securities and Exchange Commission on June 4, 2010. |
| (5) | Incorporated herein by reference to Excel Trust, Inc.’s Registration Statement on Form S-8 (File No. 333-166267) filed with the Securities and Exchange Commission on April 23, 2010. |
| (6) | Incorporated herein by reference to Excel Trust, Inc.’s Quarterly Report on Form 10-Q filed with the Securities and Exchange Commission on May 10, 2011. |
| (7) | Incorporated herein by reference to Excel Trust, Inc.’s Current Report on Form 8-K filed with the Securities and Exchange Commission on April 28, 2010. |
| (8) | Incorporated herein by reference to Excel Trust, Inc.’s Current Report on Form 8-K filed with the Securities and Exchange Commission on July 13, 2010. |
| (9) | Incorporated herein by reference to Excel Trust, Inc.’s Current Report on Form 8-K filed with the Securities and Exchange Commission on December 8, 2010. |
| (10) | Incorporated herein by reference to Excel Trust, Inc.’s Current Report on Form 8-K filed with the Securities and Exchange Commission on June 6, 2011. |
| (11) | Incorporated herein by reference to Excel Trust, Inc.’s Current Report on Form 8-K filed with the Securities and Exchange Commission on September 3, 2010. |
| (12) | Incorporated herein by reference to Excel Trust, Inc.’s Current Report on Form 8-K filed with the Securities and Exchange Commission on September 9, 2010. |
| (13) | Incorporated herein by reference to Excel Trust, Inc.’s Current Report on Form 8-K filed with the Securities and Exchange Commission on September 28, 2010. |
| (14) | Incorporated herein by reference to Excel Trust, Inc.’s Current Report on Form 8-K filed with the Securities and Exchange Commission on December 15, 2010. |
| (15) | Incorporated herein by reference to Excel Trust, Inc.’s Annual Report on Form 10-K filed with the Securities and Exchange Commission on March 1, 2012. |
| (16) | Incorporated herein by reference to Excel Trust, Inc.’s Current Report on Form 8-K filed with the Securities and Exchange Commission on July 25, 2012. |
| (17) | Incorporated herein by reference to Excel Trust, Inc.’s Current Report on Form 8-K filed with the Securities and Exchange Commission on October 19, 2012. |
| (18) | Incorporated herein by reference to Excel Trust, Inc.’s Annual Report on Form 10-K filed with the Securities and Exchange Commission on March 1, 2013. |