| Exhibit 99.1 |
ANNUAL INFORMATION FORM
For the year ended September 30, 2011
November 16, 2011
TABLE OF CONTENTS
|
CORPORATE STRUCTURE
|
4 | |||
|
Name, Address and Background Information
|
4 | |||
|
Intercorporate and Intracorporate Relationships
|
5 | |||
|
GENERAL DEVELOPMENT OF THE BUSINESS
|
5 | |||
|
Three Year History
|
5 | |||
|
Acquisitions
|
5 | |||
|
DESCRIPTION OF THE BUSINESS
|
5 | |||
|
General
|
5 | |||
|
Operations
|
6 | |||
|
Corporate Office
|
8 | |||
|
Risk Factors
|
8 | |||
|
DIVIDENDS
|
8 | |||
|
DESCRIPTION OF CAPITAL STRUCTURE
|
14 | |||
|
General Description of Capital Structure
|
14 | |||
|
MARKET FOR SECURITIES
|
15 | |||
|
TRADING PRICE AND VOLUME
|
15 | |||
|
DIRECTORS AND OFFICERS
|
16 | |||
|
Cease Trade Orders, Bankruptcies, Penalties or Sanctions
|
17 | |||
|
Conflicts of Interest
|
18 | |||
|
LEGAL PROCEEDINGS
|
19 | |||
|
INTEREST OF MANAGEMENT AND OTHERS IN MATERIAL TRANSACTIONS
|
20 | |||
|
TRANSFER AGENTS AND REGISTRARS
|
20 | |||
|
EXPERTS
|
20 | |||
|
AUDIT COMMITTEE INFORMATION
|
20 | |||
|
ADDITIONAL INFORMATION
|
22 | |||
|
APPENDIX “A” - AUDIT COMMITTEE CHARTER
|
23 |
- 2 -
Non-GAAP Financial Measures
This Annual Information Form (“AIF”) refers to certain financial measures that are not determined in accordance with generally accepted accounting principles (“GAAP”) in Canada. These measures do not have standardized meanings and may not be comparable to similar measures presented by other companies. Although measures such as “Earnings Before Interest, Income Taxes, Extraordinary Items, Stock-based Compensation, Depreciation of Property and equipment and Amortization of Intangible Assets” (“EBITDA”) do not have standardized meanings prescribed by GAAP, these measures are used
herein or can be determined by reference to its financial statements. “Same branch revenues” is a non-GAAP measure tracked and reported by us and is generally used to compare the average revenue for a particular group of branches in a current period to that same particular group of branches in a prior period. This non-GAAP measure is a way to gauge the performance of a particular group of branches and is directly related to, and helps explain, changes in total revenue. Average revenue is defined as revenue for the period divided by the number branches. “Branch operating income” (“BOI”) is a non-GAAP measure tracked and reported by us and is generally used to compare performance at the branch level. It includes
expenses which primarily relate to the operations of the branch network. “Regional expenses” is a non-GAAP measure which is used to gauge expenditures at the regional and divisional level and includes compensation of associates including centralized regional departments, Regional Managers, Divisional Vice Presidents and President, as well as other expenses related to the functions of these groups. “Corporate expenses” is a non-GAAP measure which is used to gauge expenditures at the corporate level and includes compensation of associates and related expenses at the corporate office level. These measures are discussed because management believes that they facilitate the understanding of The Cash Store Financial Services Inc.’s results and of its operational and financial position.
Readers are cautioned that non-GAAP measures used herein are not alternatives to measures under GAAP and should not, on their own, be construed as indicators of the Company’s performance or cash flows, measures of liquidity or as measures of actual return on the Company’s common shares. These non-GAAP measures, as presented, should only be used in conjunction with the consolidated financial statements of the Company. See “Risk Factors”.
Reporting Currency
All dollar amounts are presented in Canadian dollars unless otherwise indicated. The Company’s quarterly and annual financial statements are presented in Canadian dollars and are reported in accordance with Canadian generally accepted accounting principles, with a reconciliation to US GAAP.
Cautionary Statement Regarding Forward-looking Information
This AIF contains “forward-looking information” within the meaning of applicable Canadian and United States securities legislation. Forward-looking information includes, but is not limited to, information with respect to its objectives, strategies, operations and
financial results, competition as well initiatives to grow revenue or reduce retention payments. Generally, forward-looking information can be identified by the use of forward-looking terminology such as “plans”, “expects”, or “does not expect”, “is expected”, “budget”, “scheduled”, “estimates”, “forecasts”, “intends”, “anticipates”, or “does not anticipate”, “believes” or variations of such words and phrases.Forward-looking information contains statements that certain actions, events or results “may”, “could”, “would”, “might”, or “will be taken”, “occur”, or “be achieved”. Known and unknown risks, uncertainties and other factors may cause the actual results,
level of activity, performance or achievements of the Company, to be materially different from those expressed or implied by such forward-looking information.These risks include, but are not limited to, changes in economic and political conditions, legislative or regulatory developments, technological developments, third-party arrangements, competition, litigation, risks associated with, but not limited to, market conditions, the availability of alternative transactions, shareholder, legal, regulatory and court approvals and third-party consents, and other factors described elsewhere herein and in other documents of the Company filed on SEDAR at www.sedar.com. Although we have attempted to identify important factors that could cause actual results to differ
materially from those contained in forward-looking information, there may be other factors that cause results not to be as anticipated, estimated or intended. There can be no assurance that such information will prove to be accurate, as actual results and future events could differ materially from those anticipated in such information. Accordingly, readers should not place undue reliance on forward-looking information. We do not undertake to update any forward-looking information, except in accordance with applicable securities laws.
Other
The Cash Store Financial Services Inc. is a Canadian corporation that is not affiliated with Cottonwood Financial Ltd. or the outlets Cottonwood Financial Ltd. operates in the United States under the name "Cash Store." The Cash Store Financial Services Inc. does not do business under the name "Cash Store" in the United States and does not own or provide any consumer lending services in the United States.
- 3 -
CORPORATE STRUCTURE
Name, Address and Background Information
The Cash Store Financial Services Inc. (“Cash Store Financial” or the “Company”) operates in the business of providing short-term advances and other financial services. Through its subsidiaries, Cash Store Financial acts as a broker and lender to facilitate the short term advances. In this AIF, references to Cash Store Financial or the Company include its subsidiaries unless the context requires otherwise.
The Company was incorporated on February 23, 2001, under the Business Corporations Act (Ontario) (the “OBCA”), as B&B Capital Corporation. On August 1, 2001, B&B Capital Corporation changed its name to “Rentcash Inc.” and subsequently amalgamated with Larkfield Capital Corp. (“Larkfield”), under the OBCA, effective January 17, 2002 (the “Amalgamation”), with the amalgamated company continuing as Rentcash Inc. Larkfield was incorporated under the Company Act (British Columbia) on May 15, 2000, under the name Willow Creek Capital Corp.
(“Willow Creek”). The name of Willow Creek was changed to “Larkfield Capital Corp.”on August 24, 2000, and Larkfield was subsequently continued into Ontario under the OBCA,effective January 15, 2002.
Pursuant to the Amalgamation, each common share of Rentcash was exchanged for one common share of the Company, and each three common shares of Larkfield were exchanged for one common share of the Company.
The Company changed its name on March 31, 2008, from Rentcash Inc. to “The Cash Store Financial Services Inc.” in connection with the spin-off of its rental division. Cash Store Financial’s common shares (the “Common Shares”) are traded on the Toronto Stock Exchange (“TSX”) under the symbol“CSF”, formerly “RCS”. On June 8, 2010, the Company began trading its shares on the New York Stock Exchange (“NYSE”) under the symbol “CSFS”.
On March 31, 2008, pursuant to a Plan of Arrangement the Company separated its rental business and certain of its assets and liabilities into an independent, publicly-traded company. Each existing shareholder of Cash Store Financial received one common share of Insta-Rent for each Common Share held on March 31, 2008.
On April 28, 2010, its board of directors approved a change in its fiscal year end from June 30 to September 30. The fiscal year end change has resulted in a fifteen month reporting period from July 1, 2009, to September 30, 2010.
The registered office of the Company is located at Scotia Plaza, Suite 2100,and 40 King Street West, Toronto, Ontario M5H 3C2. The head office of the Company is located at 17631-103 Avenue, Edmonton, Alberta, T5S 1N8.
- 4 -
Intercorporate and Intracorporate Relationships
Cash Store Financial’s principal direct and indirect subsidiaries are as set forth in the following chart. The Company owns 100% of the issued and outstanding shares of each principal subsidiary. The Cash Store Inc., in turn, owns 100% of the issued and outstanding shares of Instaloans Inc.; and The Cash Store Financial Limited owns 100% of the issued and outstanding shares of The Cash Store Limited and CSF Insurance Services Limited. Included in parenthesis within the corporate organization chart is the respective province or country of incorporation of each entity:

GENERAL DEVELOPMENT OF THE BUSINESS
Three Year History
Cash Store Financial is the only broker and lender of short‐term advances and provider of other financial services publicly traded in Canada. The Company operates in Canada and the United Kingdom. The Company’s overall operating strategy is to fulfil the needs of a large segment of the population that are not being met by traditional financial institutions.
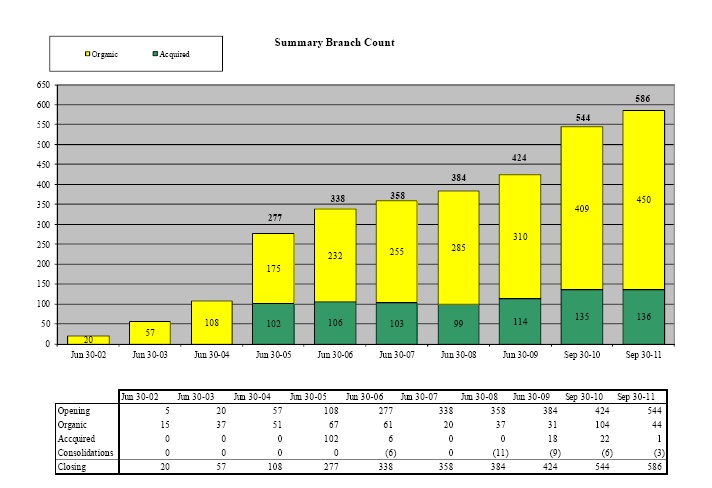
The Company’s number of branches in operation has grown to 586 as at September 30, 2011, which compares to 384 as at July 1, 2008. The strategic approach has been to grow rapidly and secure a dominant market footprint, and to then build revenues, followed by infrastructure enhancements and product diversification. The Company’s associates at branch level, along with regional managers, have grown from a staff of 1,500 in fiscal 2008 to a staff of over 2,300 by the end of fiscal 2011.
To support the growth of its branches, the Company’s corporate office has grown from a staff of 100 in fiscal 2008 to a staff of over 155 by fiscal 2011. The increase reflects management’s approach of adding infrastructure for future growth, and the strengthening of management and staff in key areas including operations, business development and in its national collection center.
Acquisitions
On October 16, 2010, the Company acquired all the business assets of Dash for Cash representing one branch in Manitoba for total cash consideration of $25,000. Dash for Cash operated in the short-term advances industry.
On April 26, 2010, the Company acquired all the business assets of 101019134 Saskatchewan Ltd. (“EZ Cash”), representing 14 branches in Saskatchewan, for total cash consideration of $4.5 million. EZ Cash operated in the short-term advances industry.
On September 1, 2009, the Company acquired all the business assets of Affordable Payday Loans Inc. representing eight branches in Ontario and two branches in Alberta for total cash consideration of $800,000. Affordable Payday Loans Inc. operated in the short-term advances industry.
DESCRIPTION OF THE BUSINESS
General
Cash Store Financial operates under two branch banners, Cash Store Financial and Instaloans, which act as brokers and lenders to facilitate short term advances and provide other financial services.
- 5 -
As at September 30, 2011, Cash Store Financial operated 586 (September 30, 2010 - 544) short-term advance branches across Canada and the United Kingdom. The Company employed over 2,300 associates across Canada and in the United Kingdom. The branch count by location for the twelve month period ended September 30, 2011, was as follows:
|
Canada
|
Branches
|
|
British Columbia
|
110
|
|
Alberta
|
131
|
|
Saskatchewan
|
36
|
|
Manitoba
|
34
|
|
Ontario
|
200
|
|
New Brunswick
|
15
|
|
Nova Scotia
|
27
|
|
Prince Edward Island
|
4
|
|
Newfoundland and Labrador
|
14
|
|
Northwest Territories
|
2
|
|
Yukon
|
1
|
|
574
|
|
|
United Kingdom
|
12
|
|
Total
|
586
|
Operations
Summary
For the twelve month fiscal period ended September 30, 2011, the Company’s operations generated revenues of $189.9 million, compared to $221.8 million for the fifteen months ended September 30, 2010.
The Company, under its Cash Store Financial and Instaloans banners, provides consumers with short-term cash advances without having to provide a credit history or security on the loan by acting as a broker between the customer and third-party lenders or directly lending to the customer. In terms of process for a brokered loan, after an application is completed and other relevant information is obtained from a customer, the Company brokers the customer’s loan request to third-party lenders. Based on approval criteria established by the third-party lenders, the customers’ eligibility for an advance is assessed. If the customer is approved, the Company provides the
lender’s loan documentation to the customer. Upon fulfillment of the loan documentation requirements, the Company is authorized by the lender to forward the cash advance to the customer on behalf of the lender. When an advance becomes due and payable, the customer must make repayment of the principal and interest owing to the lender through the Company, which, in turn, remits the funds to the third-party lender. If there is difficulty with the collection process, the customer’s account may be turned over to an independent collection agency.
In Q5 of fiscal 2010, the Company started providing loans to customers directly. When lending directly to a customer, the process is similar to the above except that the lending criteria are established internally and loan approvals are completed internally. Loan volumes related to internally originated loans increased to $41.4 million in the year from $7.9 million in the fifteen month period last year.
The Company typically arranges for advances to customers ranging from $100 to $1,500. In order to receive an advance, a consumer is required to provide proof of income, copies of recent bank statements, current proof of residence and current telephone and utility bills. The customer must then either write a cheque or execute a pre-authorized debit agreement for the amount of the advance plus the third-party lender’s pre-calculated interest, where applicable. Deposit of the cheque is deferred until the due date of the loan, which is the consumer’s next payday (normally 7 to 14 days but no later than 31
days). The cheque is not post-dated. When the agreement expires, the cheque may be deposited to repay the advance, or the consumer may redeem the cheque by paying cash in the amount of the cheque.
Customers have the option to receive their advance through a cheque from the third-party lender, or they may have the funds loaded on a private labelled debit card or a prepaid credit card, both of which are offered by the Company through an arrangement with a third-party service provider or through an electronic fund transfer into their bank account. This arrangement allows the branches to load cash advances and other amounts onto a debit or credit card. The customer can then immediately use the debit or credit card at any ABM or point of sale terminal in Canada where traditional debit or credit cards are accepted.
- 6 -
As at September 30, 2011, the Company operated 586 branches across Canada, and in the United Kingdom. which are located primarily in strip malls within high traffic areas. Branches are open seven days a week, where permitted by law, with operating hours from 9 a.m. to 8 p.m. Monday to Friday, 9 a.m. to 5 p.m. on Saturdays, and 11 a.m. to 4 p.m. on Sundays. Typically, the branches range in size from 500 to 1,500 square feet.
There is some seasonality in the Company’s business. Historically revenues have been stronger in the quarters ended June 30 and September 30 followed by the quarters ended December 31 and March 31.
Competition
Competition for the Company exists in the short-term advance market with the Company having a market share of approximately 36% by branches. There are approximately 1,600 short-term advance branches across Canada. The Company’s biggest competitor is DFC Global Corp. (“Dollar Financial”), a U.S.-based public company. Dollar Financial operates approximately 444 branches in Canada under the banner “Money Mart”. This includes 37 branches in Quebec which do not provide short-term advances. “Cash Money” is the next largest operator in Canada with 113 branches. The rest of the market
consists of small, single store operations and regional operations that may have a number of short-term advance branches in a given region. Competition also comes from companies, such as cheque cashers, pawnshops, rental stores and others, that offer the short-term advance service as an ancillary service. Several companies also provide short-term advances via the Internet.
The regulatory environment in Canada is stabilizing due to the recent passing of regulations by most provinces.The Company will likely face increased competition from both U.S. and Canadian based companies as a result. The largest short-term advance lender in the U.S., “Advance America, Cash Advance Centers, Inc.”, has already entered the Canadian market. In addition, a large US company, EZCorp Inc., moved into the Canadian market during the year. EZCorp Inc. operates 59 branches in Canada under the banner “Cash-Max”.
Additional information on U.S. companies operating in the short-term cash advance business is included in the table below. This information is provided for reference only. It is based on publicly available information as at the date hereof and is not intended to be exhaustive.
|
Company Name
|
Approximate Market Cap. as of September 30, 2011
|
Estimated number of locations as at September 30, 2011
|
Rank by loan revenue
|
Stock Symbol and Stock Exchange
|
|
DFC Global Corp.
|
US $948 million
|
1,285 (franchise locations included)
|
1
|
DLLR (Nasdaq)
|
|
EZCorp Inc.
|
US $1.3 billion
|
1,600
|
2
|
EZPW (Nasdaq)
|
|
Advance America, Cash Advance Centers, Inc.
|
US $460 million
|
2,600
|
3
|
AEA (NYSE)
|
|
Ace Cash Express, Inc.
|
N/A
|
1,754 (May 6, 2010)
|
4
|
N/A - private
|
|
QC Holdings Inc.
|
US $50 million
|
500
|
5
|
QCCO (Nasdaq)
|
New Products
No new products were introduced during the twelve months ended September 30, 2011 however the Company had new products under development in the year.
Suppliers and Contractual Business Arrangements
The Company does not fund all of the short-term advances made to its customers. The majority of short-term advances made to the Company’s customers are provided by independent third-party lenders. The short-term advances made to the Company’s customers are repayable solely to the third-party lenders and are assets of the third-party lenders; accordingly, they are not included in the Company’s consolidated financial statements. To facilitate the short-term cash advance business, the Company has entered into written agreements with third-party lenders that are prepared to consider lending to customers. The Company believes that its current arrangements with third-party lenders are
satisfactory to meet near-term and future requirements, and that it will be able to successfully source additional funds from either existing third-party lenders or from new third-party lenders in order to meet the longer-term requirements of the Company’s customers. The absence of third-party lenders willing to lend to customers could have a material adverse impact on the Company’s business.
- 7 -
The Company has a contractual arrangement with a third-party provider of bank accounts, debit card, prepaid credit card, point-of-sale and other electronic payment services. The Company is dependent on this supplier as a majority of the advances provided to customers by the third-party lenders are completed through the debit card and prepaid credit card services offered by this supplier. While there are a number of suppliers of these services, any adverse condition experienced by the existing supplier could have a material adverse impact on the operations of the Company.
Associates
As of September 30, 2011, the Company had over 2,300 full-time and part-time associates.
Foreign Operations
The Company opened ten branches in the United Kingdom during the twelve month fiscal period ended September 30, 2011. As of September 30, 2011 there were a total of twelve branches in the United Kingdom.
The Company has an investment in The Cash Store Australia Holdings Inc. that currently operates 81 branches in Australia under the name “The Cash Store Pty.” which is a subsidiary of The Cash Store Australia Holdings Inc. The Company owns approximately 18.3% of the outstanding common shares of The Cash Store Australia Holdings Inc.
The Company also has an investment in RTF Financial Holdings Inc. that is in the business of short-term lending by utilizing highly automated mobile technology (SMS text message lending). RTF Financial Holdings Inc. currently operates in Finland, Sweden, Denmark, the Netherlands and the United Kingdom with plans to expand to other European countries. The Company owns approximately 15.7% of the outstanding common shares of RTF Financial Holdings Inc.
Corporate Office
The Company’s corporate office performs corporate, compliance, management and administrative functions. The corporate office is a management group that oversees the operations of all subsidiaries in conjunction with the Company’s responsibilities as a public company. As of September 30, 2011, the corporate office had approximately 200 full-time and part-time associates.
Risk Factors
The Company’s business is subject to risks and uncertainties that could result in material adverse effects on its business and financial results. Additional risks and uncertainties not presently known to Cash Store Financial, or that it currently deems immaterial, may also impair its business operations. The Company cannot assure you that any of the events discussed in the risk factors below will not occur. If they do, the Company’s business, financial condition and results of operations could be materially adversely affected. See “Cautionary Statement Regarding Forward-Looking Information.”
The industry in which Cash Store Financial operates is strictly regulated in each jurisdiction in which it operates. Failure to comply with, or changes to, existing or future laws and regulations could result in significant unforeseen costs and limitations, and have an adverse impact on the Company’s business, results of operations and financial condition.
The alternative financial services industry is regulated at the federal and provincial level in Canada and at the national level in the UK. This regulation is extensive and designed to protect consumers and the public, while providing standard guidelines for business operations. The laws and regulations are subject to change which could impose significant costs or limitations on the way Cash Store Financial conducts or expands its business. These laws and regulations typically impose restrictions and requirements governing interest rates and fees; maximum loan amounts; the number of simultaneous or consecutive loans and required waiting periods between loans; loan extensions and refinancings; payment
schedules (including maximum and minimum loan durations); required repayment plans for borrowers claiming inability to repay loans; disclosures to borrowers; security for loans and payment mechanisms; and licensing. In Canada, the Company is also subject to federal and provincial laws and regulations relating to its other financial products, including laws and regulations governing cost of credit disclosure, recording and reporting certain financial transactions, identifying and reporting suspicious activities and safeguarding the privacy of customers’ non-public personal information. The Company believes that it is in substantial compliance with all federal and provincial laws and regulations although many of the rules that apply to it have only recently been implemented, are complex and sometimes ambiguous and, accordingly, it cannot assure that it is in 100% compliance with all
applicable laws, much less that all courts, arbitrators and regulators would agree that it is in 100% compliance. In May 2011, the regulatory authority in the province of Alberta issued an order directing us to cease certain specified alleged practices in contravention of the Alberta payday loan regulations. The Company is disputing the allegations and appealed the order on June 9, 2011. See ‘‘Legal Proceedings.’’
- 8 -
The provincial regulatory environment has not yet stabilized and is constantly changing as new regulations are introduced and existing regulations are repealed, amended and modified and there can be no assurance that these regulations will not have a detrimental effect on the Company’s business in the future. Although Cash Store Financial believes that it is also in substantial compliance with all laws and regulations that apply to it in the UK, there is no assurance that existing laws and regulations in the UK will not change and that such change will not have a detrimental effect on its business in the future.
On July 16, 2011, the Ontario Ministry of Consumer Services published amendments to the general regulation of the Payday Loans Act, 2008 (Ontario) (the ‘‘Ontario Act’’) which include, among other requirements, the requirement that the lender ensures that the borrower is informed orally of all the means for obtaining a payday loan from the lender. The regulations also specify certain types of fees charged directly or indirectly to a borrower that has entered into a payday loan agreement that must be included in the cost of borrowing. These fees include charges related to the use of a ‘‘device’’ such as a debit card, pre-paid card or cheque. The effect of the
amendments to the regulation is to prohibit licensees from providing or offering to provide other goods or services in connection with a payday loan, whether on the licensee’s own behalf or on behalf of any other person. The amendments also prescribe certain circumstances under which a payday lender must provide and disclose to the borrower the availability of the option to remit a device to the payday lender and receive, in cash, the balance outstanding on the device.
The amendments came into force September 1, 2011 and may significantly impact the profitability of the Company’s business in Ontario. Following legal advice, the Company is commencing an application for judicial review seeking a declaration that the amendments are outside the scope of the regulator’s authority and unenforceable. Pending the application for judicial review, the Company is considering what, if any, changes to its business practices may be required by the amendments. The regulations apply to provincially licensed payday lenders.
Legal, class action and regulatory proceedings directed towards the Company’s industry or the Company itself may have a material adverse impact on its results of operations, cash flows and financial condition.
The Company’s business is subject to lawsuits and regulatory proceedings that could generate adverse publicity and cause it to incur substantial legal expenditures. Class action litigation proceedings are underway against most of the significant short-term advance businesses in Canada, including proceedings against the Company in Alberta and Manitoba. See ‘‘Legal Proceedings.’’ In addition, the Company may be subject to additional legal and regulatory proceedings in the future. The resolution of any current or future legal proceeding could cause the Company to have to refund fees and/or interest collected, refund the
principal amount of advances, pay damages or other monetary penalties and/or modify or terminate its operations in particular local and federal jurisdictions. Defense of any legal proceedings, even if successful, requires substantial time and attention of the Company’s senior officers and other management personnel that would otherwise be spent on other aspects of the Company’s business and requires the expenditure of significant amounts for legal fees and other related costs. Settlement of lawsuits may also result in significant payments and modifications to the Company’s operations. The Company’s failure to successfully defend itself in any of the currently filed class action lawsuits, or future legal or regulatory actions, could have a material adverse effect on its ability to conduct its business, results of operations and financial condition in future
periods.
Transitioning the Company’s business model from primarily brokering loans to a direct-lending model may not have a positive effect on our business.
Subject to a variety of factors, including the availability of acceptable financing, the Company expects that over time it will move the balance of its loan portfolio in regulated provinces onto its balance sheet and will lend directly to its customers in regulated provinces, rather than through third-party lenders. While the Company believes that moving its loan portfolio onto its balance sheet will lower its costs of capital and allow it to capture a greater portion of revenue by reducing retention payments to third party lenders, there is no guarantee that the desired outcome will occur and the transition of its business model to directly lending to its customers carries significant risk. The transition
from primarily brokering loans to primarily directly lending to customers will require additional infrastructure and knowledge on the part of Cash Store Financial’s associates. In addition, the Company may face adverse tax consequences as a result of the change in its business model if, for income tax purposes, its business should be characterized differently than it is currently characterized. Failure to successfully implement the transition to a primarily direct lending model, or operate as a direct provider of short-term advances could negatively impact the Company’s business and financial condition.
- 9 -
The Company relies on third-party lenders to advance funds to its customers.
The Company’s business is currently dependent on third-party lenders who are willing to make funds available for lending to its customers. There are no assurances that existing or new third-party lenders will continue to make funds available to the Company’s customers. Any reduction or withdrawal of funds could have a significant material adverse impact on this portion of the Company’s business.
To facilitate the short-term advance business, the Company has entered into written agreements with the third-party lenders who are prepared to consider lending to its customers. Pursuant to these agreements, Cash Store Financial provides services to the lenders related to the collection of documents and information as well as loan collection services. The agreements also provide that the third-party lenders are responsible for losses suffered on account of uncollectible loans provided the Company has properly performed its obligations under the terms of the agreements. In the event the Company does not properly perform its obligations and the lenders make a claim as required under the agreement, it may be
liable to the lenders for losses they have incurred. Material terms of Cash Store Financial’s agreements with third-party lenders include ensuring that any proposed loan was applied for through an authorized outlet, ensuring each potential customer meets the loan selection criteria as set forth by the third-party lender prior to approval and release of funding, satisfying the documentation requirements in a full and timely manner, providing loan management services throughout the term of the loan, and providing default realization services on behalf of the third-party lender for all loans funded which are not paid in full by the due date, all while ensuring information system integrity is maintained. Losses suffered on account of uncollectible loans are not contractually Cash Store Financial’s responsibility as long as it has performed and fulfilled its obligations under the
terms of the third-party lender agreements. A liability is recorded when it is determined that the Company has a liability under the agreement. The contingent risk is the balance of the third-party lenders’ loan portfolio which totalled approximately $104 million as at September 30, 2011 (September 30, 2010 - $109 million).
While no claims have been made by the third-party lenders to date, pursuant to these agreements between the Company and the third-party lenders, there have not been any guaranteed returns. The Company has made the decision to voluntarily make retention payments to the third-party lenders as consideration for continuing to advance funds to its customers. The retention payments are made pursuant to a resolution approved by Cash Store Financial’s board of directors which authorizes management to pay a maximum amount of retention payments per quarter, and the retention payments are recorded in the period in which a commitment is made to a lender pursuant to the resolution.
If the Company’s estimates of loan losses are not adequate to absorb losses, its results of operations and financial condition may be adversely affected.
If the Company transitions its business from a model based primarily on brokering loans between customers and third party lenders to a direct lending model, it will need to maintain an allowance for loan losses for anticipated losses on loans it funds and loans in default. To estimate the appropriate level of loan loss reserves, the Company considers known and relevant internal and external factors affecting loan collectability, including the amount of loans owed to it, historical percentages of loans written off, current collection patterns and current economic trends. As of September 30, 2011 Cash Store Financial’s allowance for loan losses on company funded loans that was $2.8 million. The Company
only began materially originating loans within the past fifteen months and is still gathering information to substantiate default rates. These amounts will likely increase if the Company transitions to a direct lending model, as it intends. These reserves, however, are estimates, and if actual loan losses are materially greater than loan loss reserves, the Company’s results of operations and financial condition could be materially adversely affected.
The Company is dependent on existing corporate relationships, the loss or impairment of which may have a material adverse impact on its results of operations, cash flows, and financial condition.
The Company is highly dependent on a number of corporate relationships, and the loss of one of these key relationships could have a material adverse impact on its operations, cash flows and financial condition. Further, the Company cannot be certain it will be able to enter into new relationships on terms as favourable as its current relationships if these relationships and/or agreements were terminated or not renewed. The loss of a material relationship could have an immediate adverse impact on the Company’s business. Cash Store Financial’s operations are dependent on DirectCash Bank, which provides its pre-paid debit and credit cards, consumer bank accounts, point-of-sale and other electronic
payment services, and Trans Global Insurance, which provides optional product insurance. A majority of the advances provided to customers are completed through the debit card and pre-paid credit card services offered by DirectCash Bank, and all of the Company’s optional product insurance is provided by Trans Global Insurance. While there are a number of suppliers of these services, any adverse condition experienced by the Company’s existing suppliers could have a material impact on the operations of its business.
- 10 -
Current and future competition in the financial services industry could cause the Company to lose market share and revenues.
The Company is subject to significant and varied competitive risks. The competitive environment within which the Company operates is somewhat fragmented but could consolidate if large U.S.-based companies decide to directly increase their involvement in Canada. There are few barriers to entry to the Company’s industry. In the short-term advance market, Cash Store Financial’s largest competitor is Dollar Financial Corp. (‘‘Dollar Financial’’), a U.S.-based public company. Dollar Financial operates approximately 429 branches in Canada under the banner ‘‘Money Mart.’’ This excludes 33 branches in Quebec which do not provide short-term advances.
‘‘Cash Money’’ is the next largest operator in Canada with approximately 113 branches. The rest of the market consists of small, single branch operations and regional operations that may have a number of short-term advance branches in a given region. Competition also comes from companies, such as cheque cashers, pawnshops, rental stores and others, that offer short-term advances as an ancillary service. Several companies also provide short-term advances via the Internet. Some of the Company’s competitors may have larger local or regional customer bases, more locations, and larger financial, marketing and other resources than it. There are indications that the implementation of provincial regulations has caused new market entrants to open locations in Canada that will compete with Cash Store Financial. For example, the largest short-term lender in the U.S.,
‘‘Advance America, Cash Advance Centers, Inc.’’ has opened several locations within Canada on a test basis. Advance America currently operates 2,313 retail outlets in 29 U.S. jurisdictions. In addition, a large U.S. company, EZCorp Inc., moved into the Canadian market following the end of calendar year 2010. EZCorp Inc. operates 59 branches in Canada under the banner ‘‘CASHMAX’’ and three financial and retail services stores under the banner ‘‘Cash Converters.’’ The Company also faces competition with respect to the increasing range of financial products and services it offers its customers. The Company’s competitors may offer the same, substantially the same, or a greater number of financial products and services than it offers. As a result of increasing competition, the Company could lose market share,
possibly resulting in a decline in future revenues and earnings.
The Company has a significant shareholder whose interests may differ from yours.
Mr. Gordon J. Reykdal, Cash Store Financial’s founder, Chairman and Chief Executive Officer, beneficially owned, directly or indirectly, or had control or direction over, approximately 20.6% of the Company’s common shares outstanding as at September 30, 2011. Accordingly, Mr. Reykdal may be able to exercise significant influence over all matters requiring shareholder approval, including the election of directors and approval of significant corporate transactions. Mr. Reykdal’s interests may conflict with those of other common shareholders. Mr. Reykdal might also have an interest in pursuing transactions that, in his judgment, could enhance his equity investments, even though
such transactions might involve risks.
If the Company loses key management personnel or is unable to attract and retain the talent required to operate and grow its business or if it is required to substantially increase its labor costs to attract and retain qualified employees, its business, results of operations, cash flows and financial condition could be adversely affected.
The Company’s success is dependent on the efforts, skills and performance of a limited number of key individuals, in particular, Mr. Gordon J. Reykdal, Chairman and Chief Executive Officer, as well as other members of senior management and key associates. The loss of their services for any reason could have a material adverse impact on the Company. There is competition for such personnel and there can be no assurance that the Company will be successful in attracting and retaining such personnel as its business may require. Failure to attract and retain key associates with the necessary skills could have a material adverse impact on the Company.
The Company’s business may be affected if its growth is not managed effectively.
The Company has undergone rapid expansion and growth since its inception and plans to grow by opening additional branches in markets in which it currently operates as well as expanding into new markets. In Canada, Cash Store Financial’s number of branches in operation has grown to 586 as of September 30, 2011, which compares to 544 as of September 30, 2010. The Company anticipates opening no branches over the next year in Canada and we anticipate growing our branch network aggressively in the UK over the next calendar year. There is no guarantee that current or future revenue and earnings from this expansion and growth will be sufficient to maintain current valuations.
The Company’s business strategy depends on its ability to compete for suitable locations, to adapt infrastructure and systems to accommodate growth, and to obtain adequate financing for expansion plans in order to ensure continued product diversification. The start-up costs and the losses from initial operations attributable to each newly opened location place additional demands upon liquidity and cash flow. In addition, the Company’s ability to execute its growth, product diversification and infrastructure enhancement strategies will depend on a number of other factors, some of which may be beyond its control, including:
- 11 -
• the prevailing laws and regulatory environment of each province or jurisdiction in which the Company operates, which are subject to change at any time;
• the Company’s ability to obtain and maintain any regulatory approvals, government permits or licenses that may be required;
• the degree of competition in new markets and for new products and services and its effect on the Company’s ability to attract new customers;
• the ability to compete for expansion opportunities in suitable locations;
• the Company’s ability to manage increased credit risk;
• the ability to recruit, train and retain qualified personnel; and
• the ability of the Company’s systems, procedures, controls and existing space to continue to support the expansion of its operations.
Current branch levels and future expansion, if any, may further strain Cash Store Financial’s management, financial and other resources. The Company’s future results of operations will substantially depend on the ability of its officers and key associates to manage changing business conditions and regulatory environments and to implement and improve its technical, administrative, and financial control and reporting systems.
Opening or acquiring new branches can involve significant start-up costs and place demands upon the Company’s liquidity and cash flow, and the Company cannot assure you that it will be able to satisfy these demands. Additionally, new branches may not reach profitability in their first year, or ever. As a result, opening a number of new branches over a short period of time may materially decrease the Company’s net income. Further, there can be no assurance that the Company will fully recover these start-up costs.
The Company’s ability to open and acquire new branches is subject outside factors and circumstances over which it has limited control or that are beyond its control which could adversely affect its growth potential.
The Company’s expansion strategy includes opening new branches and acquiring existing branches. The success of this strategy is subject to numerous outside factors, such as the availability of attractive acquisition candidates, the availability of acceptable business locations, the ability to access capital to acquire and open such branches and the ability to obtain required permits and licenses. The Company has limited control, and in some cases, no control, over these factors. A failure by the Company to execute its expansion strategy would adversely affect its ability to expand its business and could materially adversely affect its results of operations and financial
condition.
The international scope of the Company’s expansion and operations may contribute to increased costs and negatively impact its operations.
The Company’s operations and expansion in the UK are significant to its business and will likely be more significant in the future, and present risks which may vary from those it faces domestically. The Company’s expansion will require significant investment in infrastructure and other associated start-up costs. At September 30, 2011, the Company’s UK operations represented 5.2% of its total assets. Since international operations increase the complexity of an organization, the Company may face additional administrative costs in managing its business. In addition, most countries typically impose additional burdens on non-domestic companies through the use of local regulations, tariffs and
labor controls. Unexpected changes to the foregoing could negatively impact Cash Store Financial’s results of operations and financial condition.
Foreign currency fluctuations may adversely affect Cash Store Financial’s results of operations.
The Company derives revenue, earnings and cash flow from its operations in the UK, and expects the amount of such revenue, earnings and cash flow from the UK to grow significantly. The Company’s results of operations are vulnerable to currency exchange rate fluctuations principally in the British Pound against the Canadian dollar. Variations in the value of these currencies against each other may have a material impact on Cash Store Financial’s business, plans for expansion, results of operations and financial condition.
- 12 -
If the Company does not generate a sufficient amount of cash, which depends on many factors beyond its control, its liquidity and ability to fund its operations would be harmed.
The Company believes that its cash flow from operations and available cash will be adequate to meet its future liquidity needs. However, Cash Store Financial cannot assure you that its business will generate sufficient cash flow from operations or that its anticipated revenue growth will be realized.
A failure or disruption in the Company’s information systems could have a material adverse impact on its results of operations, cash flows and financial condition.
The Company relies upon information systems to manage and operate its operations. The Company maintains a standalone computer system and, on a daily basis, each branch forwards their daily transaction files to its head office via the Internet to permit the Company to reconcile cash balances and to report revenues and loan transactions to its head office. In addition, the branches utilize the Internet to load customer advances on debit cards and pre-paid credit cards. The Company is reliant on a third-party provider for these debit and credit card services. Any extended disruption to Cash Store Financial’s computer systems or the Internet could adversely affect its business, results of operations
and/or financial condition.
The Company’s success is dependent on sustained consumer demand for its products and services. A change in economic condition could have an adverse effect on consumer demand for short-term advances, and thus the Company’s results of operations, cash flows and financial condition.
The majority of the Company’s revenue is derived from loan fees. Factors that may influence demand for the Company’s products and services include macroeconomic conditions such as employment, personal income and consumer sentiment. The underwriting standards of Cash Store Financial’s third party lenders require, and the Company itself requires and expects to continue to require as a direct lender, among other things, that its customers have a steady source of income as a prerequisite for making a loan. If consumers become more pessimistic regarding their economic prospects (and the prospects of the economy generally) and therefore spend less and save more, demand for short-term advances in
general may decline. Negative press coverage and efforts of special interest groups to persuade customers that short-term advances and other alternative financial services provided by the Company are predatory and abusive could also negatively affect demand for its products and services. If consumers accept this negative characterization of Cash Store Financials’ business and/or its products on a widespread basis, demand for its loans could significantly decline, which would negatively affect its revenues and results of operations. Should the Company fail to adapt to significant changes in its customers’ demand for its products or services, its revenues could decrease significantly and its results of operations could be harmed. Even if the Company does make changes to existing products or services or introduce new products or services to fulfill changing customer demands,
its customers may resist or reject such products or services.
During periods of economic and financial market uncertainty, the Company analyzes the impact of market fluctuations on the industry, particularly in the areas of revenue growth, default rates and access to capital. To date, the Company has not experienced any substantial negative effects to its business or to its ability to meet its customers’ needs; however, there is a risk that economic and financial market uncertainty could have a negative impact on the Company.
The Company has a significant amount of goodwill which is subject to periodic review and testing for impairment.
As of September 30, 2011, the Company had goodwill of $39.1 million, representing a significant portion of the $121.8 million in total assets reflected on its consolidated balance sheet as of such date. Accounting for intangible assets such as goodwill requires the Company to make significant estimates and judgments, and as a result the Company may not realize the value of such intangible assets. In accordance with Canadian and U.S. generally accepted accounting principles, Cash Store Financial conducts an impairment analysis of its goodwill annually and at such other times when an event or change in circumstances occurs which would indicate potential impairment. A variety of factors could cause the
carrying value of an intangible asset to become impaired, including that the Company’s cash flow from operations is not sufficient to meet its future liquidity needs. Should such a review indicate impairment, a write-down of the carrying value of the intangible asset would occur, resulting in a non-cash charge, which could adversely affect the Company’s reported results of operations and could materially impact the reported balance of its total shareholders’ equity.
The Company’s business is seasonal in nature, which causes its revenues and income to fluctuate.
The Company’s business is seasonal. Historically, Cash Store Financial has generally experienced its highest revenues and earnings during the quarter ending June 30, when revenues from financial services associated with tax filings and tax refunds peak. The annual distribution of holidays also affects the seasonal nature of the Company’s business. This seasonality requires the Company to manage its cash flows over the course of the year. If the Company’s revenues were to fall substantially below what it would normally expect during certain periods its financial results would be adversely impacted.
- 13 -
Changes in local rules and regulations such as local zoning ordinances could negatively impact the Company’s business, results of operations and financial condition.
In addition to provincial and federal laws and regulations, the Company’s business can be subject to various local rules and regulations such as local zoning regulations. Any actions taken in the future by local zoning boards or other local governing bodies to require special use permits for, or impose other restrictions on, the Company’s ability to provide products and services could adversely affect its ability to expand its operations or relocate existing branches.
Improper disclosure of personal data could result in liability and harm the Company’s reputation.
The Company stores and processes large amounts of personally identifiable information, consisting primarily of customer information. It is possible that the Company’s security controls over personal data, its training of employees and other practices it follows may not prevent the improper disclosure of personally identifiable information. Such disclosure could harm Cash Store Financial’s reputation and subject it to liability under laws that protect personal data, resulting in increased costs or loss of revenue.
DIVIDENDS
Prior to August 31, 2007, the Company had not declared or paid a dividend on the Company’s common shares. The Company declared the first dividend on August 31, 2007, in the amount of $.025 cents per common share. In total, dividends of $3.6 million were paid to holders of common shares in fiscal 2008, $5.3 million in fiscal 2009, and $9.1 million in the fifteen months of fiscal 2010 and $7.9 million for fiscal 2011. Dividends declared per common share for the twelve month period ended September 30, 2011, totalled $0.46, down from $0.54 for the fifteen month period ended September 30, 2010.
On November 16, 2011, the Company declared a quarterly dividend of $0.12 per common share. The dividend is payable on December 14, 2011, to shareholders of record on November 29, 2011.
The Company reviews its dividend distribution policy on a quarterly basis, evaluating its financial position, profitability, cash flow and other factors the Board of Directors considers relevant.
DESCRIPTION OF CAPITAL STRUCTURE
General Description of Capital Structure
Cash Store Financial is authorized to issue an unlimited number of common shares having the following rights, privileges, restrictions and conditions:
|
1.
|
The holders of common shares are entitled to receive notice of, and vote at, every meeting of the shareholders of Cash Store Financial and shall have one vote for each such common share held.
|
|
2.
|
Subject to the rights, privileges, restrictions and conditions attached to any preferred shares of Cash Store Financial, the holders of common shares are entitled to receive such dividends as the directors may from time to time, by resolution, declare.
|
|
3.
|
Subject to the rights, privileges, restrictions and conditions attached to any shares of Cash Store Financial, in the event of liquidation, dissolution or winding up of Cash Store Financial or upon any distribution of the assets of Cash Store Financial among shareholders being made (other than by way of dividends out of monies properly applicable to the payment of dividends), the holders of common shares shall be entitled to share pro rata.
|
- 14 -
MARKET FOR SECURITIES
Trading Price and Volume
The Company’s common shares are listed on the Toronto Stock Exchange (TSX) under the symbol “CSF” and on the New York Stock Exchange (NYSE) under the symbol “CSFS”. The volume and price range for the common shares as traded on the TSX for each month for the twelve month period ended September 30, 2011, were as follows:
|
Month ended
|
Volume of shares traded
|
Price Range ($CDN)
|
|
|
Low
|
High
|
||
|
October, 2010
|
570,146
|
14.72
|
15.96
|
|
November, 2010
|
918,486
|
13.09
|
15.99
|
|
December, 2010
|
1,085,112
|
13.72
|
15.50
|
|
January, 2011
|
1,533,119
|
12.81
|
17.33
|
|
February, 2011
|
1,666,430
|
11.60
|
13.44
|
|
March, 2011
|
634,347
|
13.11
|
14.25
|
|
April, 2011
|
641,472
|
13.94
|
15.00
|
|
May, 2011
|
873,807
|
12.07
|
15.27
|
|
June, 2011
|
277,417
|
12.15
|
13.45
|
|
July, 2011
|
198,385
|
11.50
|
13.50
|
|
August, 2011
|
946,833
|
8.39
|
11.75
|
|
September, 2011
|
236,259
|
8.26
|
9.99
|
The volume and price range for the common shares as traded on the NYSE for each month for the twelve month period ended September 30, 2011, were as follows:
|
Month ended
|
Volume of shares traded
|
Price Range ($US)
|
|
|
Low
|
High
|
||
|
October, 2010
|
353,850
|
14.80
|
15.27
|
|
November, 2010
|
179,605
|
13.32
|
15.69
|
|
December, 2010
|
274,252
|
13.88
|
15.22
|
|
January, 2011
|
298,332
|
13.70
|
16.93
|
|
February, 2011
|
827,319
|
11.95
|
13.44
|
|
March, 2011
|
102,436
|
13.59
|
14.50
|
|
April, 2011
|
225,302
|
14.47
|
15.57
|
|
May, 2011
|
118,683
|
13.38
|
15.87
|
|
June, 2011
|
97,441
|
12.46
|
13.66
|
|
July, 2011
|
58,622
|
12.33
|
14.00
|
|
August, 2011
|
74,617
|
9.57
|
12.29
|
|
September, 2011
|
47,640
|
8.36
|
9.84
|
- 15 -
DIRECTORS AND OFFICERS
The names and municipalities of residence of the directors and officers of the Company, the date when the individual first became a director, their principal occupations, the positions in the Company held by them and the number and percentage of voting securities of the Company as at November 16, 2011, are as follows:
|
Name, Municipality of Residence
|
Position with the Company and Date First Became a Director
|
Principal Occupation (5 preceding years unless otherwise indicated)
|
Number and percentage of Common Shares beneficially owned, directly or indirectly, or over which control or
direction is exercised
|
|
Gordon J. Reykdal
Edmonton, Alberta, Canada
|
Chairman and Chief Executive Officer
February 23, 2001
|
Founder, Chairman and Chief Executive Officer of the Company since February 2001, prior to, which he was the founder, Chairman, President and Chief Executive Officer of RTO Enterprises Inc. which was renamed easyhome Ltd.
|
3,583,700(4)
20.6%
|
|
William C. Dunn (2) (3)
Calgary, Alberta, Canada
|
Director
May 14, 2002
|
Chairman of Bellatrix Exploration Inc., an oil & gas exploration company, past Director for Precision Drilling Corp until May of 2011. Past President of Cardium Service and Supply Ltd. from 1982 to 1999. Past Director of Vero Energy Inc.
|
725,000
4.2%
|
|
Edward C. McClelland(3)
Burlington, Ontario, Canada
|
Director
November 8, 2005
|
CEO of The Cash Store Australia Holdings Inc., listed on the TSX-V exchange since 2009. Chairman of TEC (The Executive Committee) Group #223 since 1997. Previously Vice President for CIBC Finance and President of Transamerica Commercial Finance Canada.
|
29,500
0.2%
|
|
Robert J.S. Gibson,
CD, ICD.D (2), (3)
Calgary, Alberta, Canada
|
Director
April 8, 2008
|
President of Stuart & Company Limited, a private investment firm, since 1973. Director of Precision Drilling Corp. since 1996 and served as a Trustee on the Board of Trustees until it was reconverted in June 2009.
|
10,000
0.1%
|
|
J. Albert Mondor,
FCA, ICD.D (1)
Edmonton, Alberta, Canada
|
Director
April 8, 2008
|
Chair of Alberta Pension Services Corporation and also serves on the boards of Alberta Municipal Service Corporation and Cleankeys Inc. He was a partner with Grant Thornton LLP where he held positions as senior audit partner and managing partner in its Edmonton practice.
|
11,225
0.1%
|
|
Ron Chicoyne,
CFA, CF, ICD.D (1), (2)
Calgary, Alberta, Canada
|
Director
October 29, 2008
|
Founder & Managing Director of Links Capital Partners, an independent corporate finance firm, since August 2005. Previously, Partner and Director of Mercantile Bancorp Limited.
|
8,450
0.0%
|
- 16 -
|
Name, Municipality of Residence
|
Position with the Company and Date First Became a Director
|
Principal Occupation (5 preceding years unless otherwise indicated)
|
Number and percentage of Common Shares beneficially owned, directly or indirectly, or over which control or
direction is exercised
|
|
Michael M. Shaw, B.Comm (1) (2)
Calgary, Alberta, Canada
|
Director
October 29, 2009
|
Corporate Director and President of Amkco Inc. Spent 30 years with the ATCO group of Companies in a variety of roles.
|
81,133
0.5%
|
|
Barret Reykdal (5)
Edmonton, Alberta, Canada
|
President and Chief Operating Officer
N/A
|
Chief Operating Officer of the Company’s Operations since April 2005, prior to which he was the Director of Operations for the Company’s Western Canadian operations from March 2003 to April 2005, and prior to which he was the Company’s Northern Alberta Regional Manager since June 2001.
|
163,700
0.9%
|
|
Nancy Bland
Spruce Grove, Alberta, Canada
|
Chief Financial Officer
N/A
|
Chief Financial Officer of the Company since October 2007, prior to which she was the Vice President Finance of the Company. Prior to joining the Company, her experience includes positions with Capital Health, Luscar Ltd., The Northwest Territories Power Corporation, and Grant Thornton Chartered Accountants.
|
12,500
0.1%
|
|
S.W. (Bill) Johnson
Edmonton, Alberta, Canada
|
Senior Executive Vice President
N/A
|
Senior Executive Vice President since November 2008, prior to which he was the President and CEO of Insta-Rent Inc., a public company listed on the TSX-V and prior to which he was the President and COO of the Company’s rental division. Prior to joining the Company his experience included the position of Executive Vice President and Chief Financial Officer of easyhome Ltd. since January 1996.
|
35,600
0.2%
|
|
Michael Thompson
Edmonton, Alberta, Canada
|
Senior Vice President and Corporate Secretary
N/A
|
Senior Vice President and Corporate Secretary since February 2008, prior to which he was the Vice President Investor relations and government affairs. Prior to joining the Company, he was the President of The Canadian Payday Loan Association.
|
7,383
0.0%
|
Notes
(1) Member of Audit Committee.
(2) Member of Corporate Governance and Nominating Committee.
(3) Member of Compensation Committee.
|
(4)
|
3,222,635 of these shares are directly owned by 424187 Alberta Inc., a company controlled by Mr. Reykdal; 223,468 are held by Mr. Reykdal directly and 137,597 are held by Mr. Reykdal’s spouse.
|
|
(5)
|
Mr. Barret J. Reykdal is the son of Mr. Reykdal, the Corporation’s Chairman and Chief Executive Officer.
|
As at November 16, 2011, the Company’s directors and executive officers together beneficially owned 4,668,191 (26.8%) of the Company’s outstanding Common Shares.
- 17 -
Cease Trade Orders, Bankruptcies, Penalties or Sanctions
Corporate Cease-Trade Orders or Bankruptcies
Other than as set out below, no director, executive officer of the Company, or shareholder of the Company holding a sufficient number of securities of the Company to affect materially the control of the Company, or personal holding company of any of such persons, as applicable, is or has been, within the preceding 10 years, a director or executive officer of any company that, while that person was acting in such capacity:
|
|
a)
|
was the subject of a cease-trade order or similar order or an order that denied the relevant company access to any exemptions under securities legislation for a period of more than 30 consecutive days;
|
|
|
b)
|
was subject to an event that resulted, after the director or executive officer ceased to be a director or executive officer, in the Company being the subject of a cease-trade or similar order or an order that denied the other company access to any exemption under securities legislation, for a period of more than 30 consecutive days; or
|
|
|
c)
|
within a year of that person ceasing to act in that capacity, became bankrupt, made a proposal under any legislation relating to bankruptcy or insolvency or was subject to or instituted any proceedings, arrangement, or compromise with creditors or had a receiver, receiver-manager or trustee appointed to hold its assets.
|
Disclosure of Ron Chicoyne as a Director of a bankrupt company
Ron Chicoyne served as a director of Paintearth Energy Services Ltd. (“Paintearth”), a private Alberta oilfield services company, from June 2008 to May 18, 2010. Mr. Chicoyne resigned from Paintearth several months before an interim receiver was appointed by the Court of Queen’s Bench of Alberta in respect of the property of Paintearth. On December 20, 2010, the Court of Queen’s Bench of Alberta approved a purchase and sale transaction for the sale of all of the assets of Paintearth to a third party.
Penalties or Sanctions
No director, executive officer of the Company, or shareholder of the Company holding a sufficient number of securities of the Company to affect materially the control of the Company, or personal holding company of any such persons, is or has been subject to any penalties or sanctions relating to securities legislation imposed by a court or by a securities regulatory authority, or has entered into a settlement agreement with a securities regulatory authority or has been subject to any other penalties or sanction imposed by a court or regulatory body that would likely be considered important to a reasonable investor in making an investment decision concerning the Company’s securities.
Personal Bankruptcies
No director, executive officer of the Company, or shareholder of the Company holding a sufficient number of securities of the Company to affect materially the control of the Company, or a personal holding company of any such persons, is or has, within the preceding 10 years, become bankrupt, made a proposal under any legislation relating to bankruptcy or insolvency, or was subject to or instituted any proceedings, arrangement, or compromise with creditors, or had a receiver, receiver-manager or trustee appointed to hold its assets.
The directors, officers, and shareholders of the Company holding a sufficient number of securities of the Company to affect materially the control of the Company have furnished the information pertaining to Corporate Cease-Trade Orders or Bankruptcies, Penalties or Sanctions and Personal Bankruptcies.
Conflicts of Interest
To the best of its knowledge, no director or executive officer of the Company has an existing or potential material conflict of interest with Cash Store Financial or any of its subsidiaries with the exception of the following:
|
|
•
|
Mr. Gordon Reykdal, Mr. S. William Johnson and Mr. Edward McClelland are currently on the Board of Directors of The Cash Store Australia Holdings Inc., a Company in which the Company has an investment as described above in “Foreign Operations”. The Company has a service agreement with The Cash Store Australia Holdings Inc. to provide certain administrative functions;
|
|
|
•
|
Mr. Gordon Reykdal and Mr. S. William Johnson are currently on the Board of Directors of RTF Financial Holdings Inc., a Company in which the Company has an investment as described above in “Foreign Operations”. The Company has a service agreement with RTF Financial Holdings Inc. to provide certain administrative functions; and
|
|
|
•
|
Mr. Barret J. Reykdal, the Company’s President and Chief Operating Officer, is the son of Mr. Gordon Reykdal, the Company’s Chairman and Chief Executive Officer.
|
- 18 -
LEGAL PROCEEDINGS
In prior periods, the Company was served with three separate Statements of Claim by individuals resident in Alberta, British Columbia, Manitoba and Ontario alleging that Cash Store Financial is in breach of s. 347 of the Code (the interest rate provision) and certain provincial consumer protection statutes. The claims seek various declarations and damages including the reimbursement of any amounts judged to be illegal. In each of these proceedings, the claimants sought to have their lawsuits certified as Class Actions. As of September 30, 2011, the status of the three actions is as follows:
|
|
1.
|
On March 5, 2004, an action under the Class Proceedings Act was commenced in the Supreme Court of British Columbia by Andrew Bodnar and others proposing that a class action be certified on his own behalf and on behalf of all persons who have borrowed money from the defendants: The Cash Store Inc. (Canada), Cash Store Financial and All Trans Credit Union Ltd. The action stems from the allegations that all payday loan fees collected by the defendants constitute interest and therefore violate s. 347 of the Criminal Code of Canada. On May 25, 2006, the claim in British Columbia was affirmed as a certified class proceeding of Canada by the B.C. Court of Appeal. In fiscal 2007, the plaintiffs in the British Columbia action brought
forward an application to have certain of its customers’ third-party lenders added to the claim. On March 18, 2008, another action commenced in the Supreme Court of British Columbia by David Witsnell and others against Cash Store Financial, Instaloans Inc. and others in respect of the business carried out under the name Instaloans since April 2005. Collectively, these actions are referred to as the “British Columbia Related Actions”.
|
On May 12, 2009, the Company settled the British Columbia Related Actions in principle. The settlement has been approved by the Court. The settlement does not constitute any admission of liability by the Company. The settlement is a compromise of disputed claims.
Under the terms of the court approved settlement, the Company is to pay to the eligible class members who were advanced funds under a loan agreement and who repaid the payday loan plus brokerage fees and interest in full, or who met certain other eligibility criteria, a maximum estimated amount of $9.4 million in cash and $9.4 million in credit vouchers. Thus, the estimated maximum exposure with respect to this settlement is approximately $18.8 million including approved legal expenses. The credit vouchers may be used to pay existing outstanding brokerage fees and interest or to pay a portion of brokerage fees and interest which may arise in the future through new loans advanced. The credit
vouchers are not transferable and have no expiry date. In addition, the Company is to pay the legal fees and costs of the class. Based on the Company’s estimate of the rate of take-up of the available cash and credit vouchers, an expense of $10.9 million to date has been recorded to cover the estimated costs of the settlement, including legal fees of the Class and costs to administer the settlement fund. It is possible that additional settlement costs could be required. In the current year, the Company increased the provision by $3.2 million due to new information being received (2010 - $2.9 million). As at September 30, 2011, the remaining accrual is $4.0 million. Subsequent to year-end the administration of the settlement fund was transferred to a third-party based on a court approved order. The total amount transferred was $6.3 million.
|
|
2.
|
The Company has been served in prior fiscal periods with a Statement of Claim issued in Alberta alleging that the Company is in breach of s. 347 of the Code (the interest rate provision) and certain provincial consumer protection statutes.
|
The certification motion has been pending since fiscal 2006 and has not yet been heard. On January 19, 2010, the plaintiffs in the Alberta action brought forward an application to have a related subsidiary, as well as certain of the Company’s customers’ third-party lenders, directors and officers added to the Claim.
The certification motion has been pending since fiscal 2006 and has not yet been heard. On January 19, 2010, the plaintiffs in the Alberta action brought forward an application to have a related subsidiary, as well as certain of its customers’ third-party lenders, directors and officers added to the Claim.
The Company has agreed to a motion to certify the class proceeding such that the lenders, officers and directors are removed as defendants. Class counsel has agreed to its proposal.
The Company believes that it conducts its business in accordance with applicable laws and is defending the action vigorously. However, the likelihood of loss, if any, is not determinable at this time.
- 19 -
|
|
3.
|
On April 23, 2010, an action under the Manitoba Class Proceedings Act was commenced in the Manitoba Court of Queen’s Bench by Scott Meeking against The Cash Store (Canada), Instaloans, and Cash Store Financial proposing that a class action be certified on his own behalf and on behalf of all persons in Manitoba and others outside the province who elect to claim in Manitoba and who obtained a payday loan from The Cash Store (Canada) or Instaloans. The action stems from the allegations that all payday loan fees collected by the defendants constitute interest and therefore violate s. 347 of the Criminal Code of Canada.
|
The Company conducts business in accordance with applicable laws and is defending the action vigorously. Further, it will be maintained that most of the proposed class members are bound by the judgment in the settlement of the Ontario class action in 2008, as approved by the Ontario Superior Court of Justice and that accordingly the action should be dismissed. However, the likelihood of loss, if any, is not determinable at this time.
The Company is also involved in other claims related to the normal course of operations. Management believes that it has adequately provided for these claims.
INTEREST OF MANAGEMENT AND OTHERS IN MATERIAL TRANSACTIONS
To the best of the knowledge of the directors and executive officers of the Company, no director or executive officer of the Company or person or company that is the direct or indirect beneficial owner of, or who exercises control or direction over more than 10% of the outstanding common shares of the Company, or any of their associates or affiliates, had any material interest, direct or indirect, in any transaction within the three most recently completed financial years, or during the current financial year, that has materially affected, or will materially affect, the Company.
TRANSFER AGENTS AND REGISTRARS
Computershare Investor Services Inc. acts as the transfer agent and registrar for Cash Store Financial through its office in Toronto, Ontario.
EXPERTS
KPMG LLP, Chartered Accountants (“KPMG”) were the auditors of the Company for the twelve month period ended September 30, 2011, and prepared and executed the audit report accompanying the annual financial statements. KPMG has confirmed their independence with respect to the Company within the meaning of the Rules of Professional Conduct of the Institute of Chartered Accountants of Alberta.
AUDIT COMMITTEE INFORMATION
Audit Committee’s Charter
The Company’s Audit Committee charter sets out its roles and objectives, responsibilities and duties, and membership standards for reporting to the Board of Directors. A copy of the charter is attached hereto as Appendix “A”.
Composition of the Audit Committee
The Company’s board of directors has a separately-designated standing audit committee established in accordance with Section 3(a)(58)(A) of the Securities Exchange Act of 1934 (the “Exchange Act”). The Company’s Audit Committee is composed of J. Albert Mondor, Michael Shaw and Ron Chicoyne, all of whom, in the opinion of the Company’s Board, are independent and financially literate. Each member of the Audit Committee is “financially literate” within the meaning of applicable Canadian securities laws.
Relevant Education and Expertise
The following section lists the relevant education and experience for each Audit Committee member.
|
|
1.
|
J. Albert Mondor, FCA, ICD.D (Chairman of the Audit Committee)
|
Mr. Mondor is a Fellow of Chartered Accountants and holds the ICD.D designation of the Institute of Corporate Directors. Currently, he is Chair of the Alberta Pension Services Corporation which administers contributions, transfers and pension payments on behalf of 9 Alberta public sector pension plans. He also serves on the boards of Alberta Municipal Service Corporation and Cleankeys Inc. Until his retirement from public practice, he was a partner with Grant Thornton LLP where he held positions as senior audit partner and managing partner in its Edmonton practice.
- 20 -
|
|
2.
|
Ron Chicoyne, CFA, CF, ICD.D
|
Mr. Chicoyne holds a Chartered Financial Analyst designation, Corporate Finance Qualification, Institute of Corporate Directors designation and received his Bachelor of Commerce (Honours) degree from the University of Manitoba. He is the founder and Managing Director of Links Capital Partners Ltd., a boutique corporate finance firm. Prior to this, he was a partner and director of the private equity firm Mercantile Bancorp Limited.
|
|
3.
|
Michael Shaw, B.Comm.
|
Mr. Shaw graduated from Queen’s University with a Bachelor of Commerce (Honours) degree and currently serves on 4 other boards of directors. Over 30 years with the ATCO Group of companies, Mr. Shaw held a wide variety of positions including Managing Director, Global Enterprises (responsible for the activities of 6 non-regulated companies operating in various locations around the globe).
Audit Committee Financial Expert
The Company’s board of directors has determined that it has at least one audit committee financial expert serving on its audit committee. The Company’s board has determined that J. Albert Mondor is an audit committee financial expert and is independent (as determined under Rule 10A-3 of the Exchange Act and Section 303A.06 of the New York Stock Exchange’s Listed Company Manual).
The Securities and Exchange Commission has indicated that the designation of a person as an audit committee financial expert does not make such person an “expert” for any purpose, impose on such person any duties, obligations or liability that are greater than those imposed on such person as a member of the audit committee and the Company’s board in the absence of such designation and does not affect the duties, obligations or liability of any other member of the audit committee or the board.
Pre-approval Policies and Procedures
As part of the Company’s corporate governance structure, the Audit Committee annually reviews and approves the terms and scope of the auditor’s engagement. To further ensure that the independence of the auditors is not compromised, company policy requires that the Audit Committee also pre-approve all significant engagements of the auditors for non-audit services and monitor all other engagements.
In addition, all non-audit service engagements, regardless of the cost estimate, are required to be coordinated by the Company’s Chief Financial Officer, or a designate, to further ensure that adherence to this policy is monitored. All non-audit service engagements must also be reported to the Audit Committee on a quarterly basis.
External Audit Fees by Category
KPMG has served continually as the Company’s external shareholders’ auditor since January 2002. The following table lists the fees billed by KPMG, by category, during the last two fiscal years:
|
Year ended
September 30,
2011
|
Fifteen months
ended September 30, 2010
|
|
|
Audit fees
|
$397,000
|
$329,831
|
|
Audit-related fees
|
$217,700
|
$83,100
|
|
Tax fees
|
$12,700
|
$8,450
|
|
Total fees
|
$627,400
|
$421,381
|
Audit Fees
Audit fees were paid for professional services rendered by the auditors for the audit of the Company’s annual financial statements or services provided in connection with statutory and regulatory filings or engagements and the review of the Company’s interim financial statements.
- 21 -
Audit-related Fees
Audit-related fees were paid for assurance and related services that are reasonably related to the performance of the audit or review of the annual financial statements and are not reported under the audit fees item above. These services consisted of special attest services as required by various government entities and include services provided in relation to foreign investments and services in respect of special transactions.
Tax Fees
Tax fees were paid for professional services relating to tax compliance, tax advice and tax planning. These services consisted of the review of a goods and services tax re-assessment.
ADDITIONAL INFORMATION
Additional information relating to the Company is available at www.sedar.com.
Additional information, including directors’ and officers’ remuneration and indebtedness, principal holders of the Company’s securities, and securities authorized for issuance under equity compensation plans is contained in the Company’s management information circular dated November 16, 2011.
Additional financial information is provided in the Company’s audited consolidated financial statements and Management’s Discussion and Analysis (“MD&A”) for the twelve month period ended September 30, 2011, both of which are available on SEDAR at www.sedar.com. Security-holders may also obtain a copy of the Company’s financials statements and MD&A by writing to the Company at 17631 - 103 Avenue, Edmonton, Alberta, T5S 1N8, or through the Company’s website at www.csfinancial.ca.
- 22 -
Appendix “A” - Audit Committee Charter
THE CASH STORE FINANCIAL SERVICES INC.
(the “Corporation”)
AUDIT COMMITTEE
CHARTER AND TERMS OF REFERENCE
GENERAL
The purpose of this document is to establish the Charter of the Audit Committee of The Cash Store Financial Services Inc.
PURPOSE
|
|
The purpose of the Audit Committee is to:
|
|
|
(a)
|
review and recommend to the Board for acceptance, prior to their public release, all material financial information required to be gathered and disclosed by the Corporation;
|
|
|
(b)
|
oversee management designed and implemented accounting systems and internal controls; and
|
|
|
(c)
|
recommend, engage, supervise, arrange for the compensation and ensure the independence of the external auditor to the Corporation.
|
STRUCTURE
The Audit Committee will be comprised of at least three members of the Board each of whom will at all times be independent and financially literate as those terms are defined in Multilateral Instrument 52-110, and Section 303A.06 of the NYSE Listed Company Manual, and possess:
|
|
(a)
|
an understanding of the accounting principles used by the Corporation to prepare its financial statements;
|
|
|
(b)
|
the ability to assess the general application of such accounting principles in connection with the accounting for estimates, accruals and reserves;
|
|
|
(c)
|
experience preparing, auditing, analyzing or evaluating financial statements that present a breadth and level of complexity of accounting issues that are generally comparable to the breadth and complexity of issues that can reasonably be expected to be raised by the Corporation’s financial statements, or experience actively supervising one or more individuals engaged in such activities;
|
|
|
(d)
|
an understanding of internal controls and procedures for financial reporting; and
|
|
|
(e)
|
in the case of the Audit Committee financial expert, an understanding of audit committee functions.
|
The Audit Committee shall have at least one audit committee financial expert who has acquired the attributes listed above through education and experience as a principal financial officer, principal accounting officer, controller, public accountant, auditor, experience in positions performing similar functions, experience supervising persons performing similar functions, experience overseeing or assessing the performance of companies or public accountants with respect to preparation, auditing or evaluation of financial statements, or other relevant experience.
The Audit Committee is required to meet in person, or by telephone conference call, at least once each quarter and as often thereafter as required to discharge the duties of the Audit Committee.
Each member of the Audit Committee shall serve during the pleasure of the Board of Directors and, in any event, only so long as that person shall be a director. The Directors may fill vacancies in the Audit Committee by election from among their number. The Board of Directors may remove a member of the Audit Committee at any time in its sole discretion by resolution of the Board of Directors.
In connection with the appointment of the members of the Audit Committee, the Board of Directors will determine whether any proposed nominee for the Committee serves on the audit committees of more than three public companies. To the extent that any proposed nominee for membership on the Audit Committee serves on the audit committees of more than three public companies, the Board of Directors will make a determination as to whether such simultaneous services would impair the ability of such member to effectively serve on the Audit Committee and may disclose such determination in the Corporation’s annual report on Form 40-F filed with the United States Securities and Exchange Commission.
- 23 -
The Chair of the Audit Committee appointed by the Board will, in consultation with the members, determine the schedule, time and place of meetings, and in consultation with management and the external auditor, establish the agenda for meetings.
A quorum for a meeting of the Audit Committee shall be a majority of members present in person or by telephone conference call.
Notice of the time and place of every meeting shall be given in writing, by email or facsimile to each member of the Audit Committee at least 24 hours prior to the time fixed for such meeting, provided that a member may in any manner waive a notice of meeting.
RESPONSIBILITIES
|
The Audit Committee is responsible for:
|
|
|
(a)
|
assisting Board oversight of the integrity of the Corporation’s financial statements, and the Corporation’s compliance with legal and regulatory requirements;
|
|
|
(b)
|
discussing issues of its choosing with the external auditor, management and corporate counsel;
|
|
|
(c)
|
establishing procedures for the confidential anonymous submission by employees of the Corporation of concerns regarding questionable accounting or auditing matters. Following the receipt of any complaints received submitted through the confidential process established by the Corporation, if a complaint is deemed to require further investigation, the Audit Committee shall take appropriate steps to carry out such investigation, including appointing the appropriate investigators with respect to such complaint;
|
|
|
(d)
|
establishing procedures for the receipt and treatment of complaints received by the Corporation regarding accounting, internal accounting controls and auditing matters and the retention (for at least 7 years) of copies of concerns and evidence of investigations; and
|
|
|
(e)
|
making inquiries of the external auditor and legal counsel to the Corporation regarding potential claims, assessments, contingent liabilities, and legal and regulatory matters that may have a material impact on the financial statements of the Corporation.
|
To preserve the independence of the external auditor responsible for preparing or issuing an auditor’s report or performing other audit, review or attest services for the Corporation, the Audit Committee is responsible to:
|
|
(a)
|
recommend to the Board the external auditor to be nominated;
|
|
|
(b)
|
recommend to the Board the external auditor’s compensation;
|
|
|
(c)
|
evaluate the external auditor’s qualifications, performance and independence including by annually reviewing:
|
|
|
(i)
|
a report of the auditor describing its internal quality-control procedures;
|
|
|
(ii)
|
material issues raised by its most recent internal quality-control review; and
|
|
|
(iii)
|
the results of any inquiry or investigation by government or professional authorities of the auditor within the last five years;
|
- 24 -
|
|
(d)
|
review the experience and qualifications of the senior members of the external auditors, ensure that the lead audit partner is replaced periodically in accordance with applicable law, and that the audit firm continues to be independent;
|
|
|
(e)
|
review and pre-approve any engagements for non-audit services to be provided by the external auditor and its affiliates in light of the estimated fees and impact on the external auditor’s independence;
|
|
|
(f)
|
review with management and with the external auditor:
|
|
|
(i)
|
any proposed changes in major accounting policies;
|
|
|
(ii)
|
the presentation and impact of significant risks and uncertainties; and
|
|
|
(iii)
|
key estimates and judgments of management that may be material to financial reporting; and
|
|
|
(g)
|
review and approve the Corporation’s hiring policies regarding partners, employees and former partners and employees of the present and most recent former external auditor of the Corporation in compliance with the requirements set out in section 2.4 of Multilateral Instrument 52-110.
|
The Audit Committee is required to:
|
|
(a)
|
maintain direct communications with the internal and external auditors;
|
|
|
(b)
|
discuss and review specific issues with the external auditor;
|
|
|
(c)
|
oversee the work of the external auditor;
|
|
|
(d)
|
resolve any disagreements between management and the external auditor;
|
|
|
(e)
|
meet with the external auditor at least annually in the absence of management;
|
|
|
(f)
|
ensure that the external auditor is answerable to the Audit Committee, as representatives of the shareholders, rather than to the executive officers and management;
|
|
|
(g)
|
pre-approve all audit services;
|
|
|
(h)
|
meet with the external auditor prior to the audit to review the scope and general extent of the external auditor’s annual audit including planning and staffing the audit and the factors considered in determining the audit scope, including risk factors;
|
|
|
(i)
|
upon completion of the annual audit and prior to public disclosure, review the following with the CEO, CFO and executive officers:
|
|
|
(i)
|
annual financial statements, footnotes and management discussion and analysis of financial condition and results of operations;
|
|
|
(ii)
|
significant accounting judgments and reporting principles, practices and procedures applied in preparing the financial statements, including newly adopted accounting policies and the reasons for their adoption;
|
|
|
(iii)
|
results of the combined audit of the financial statements and internal controls over financial reporting, if applicable;
|
|
|
(iv)
|
significant changes to the audit plan, if any, and any disputes or difficulties with management encountered during the audit, including any disagreements which, if not resolved, would have caused the external auditor to issue a non-standard report on the Corporation’s financial statements; and
|
|
|
(v)
|
co-operation received by the external auditor during its audit including access to all requested records, data and information.
|
- 25 -
|
|
The Audit Committee will:
|
|
|
(a)
|
be satisfied and obtain reasonable assurances from management and the external auditors that:
|
|
|
(i)
|
accounting systems are reliable;
|
|
|
(ii)
|
prescribed internal controls are effective; and
|
|
|
(iii)
|
adequate procedures are in place for the review of the disclosure of financial information extracted or derived from the Corporation’s financial statements;
|
|
|
(b)
|
periodically assess the adequacy of accounting systems, internal controls and procedures for the review of disclosure of financial information;
|
|
|
(c)
|
direct the external auditor’s examinations to particular issues;
|
|
|
(d)
|
review control weaknesses identified by the external auditor and management’s response;
|
|
|
(e)
|
review with the external auditor its view of the qualifications and performance of the key financial and accounting executives:
|
|
|
(f)
|
consider and review the following issues with management and the Director of internal audit:
|
|
|
(i)
|
significant findings of the internal audit group as well as management’s response to them;
|
|
|
(ii)
|
any difficulties encountered in the course of their internal audits, including any restrictions on the scope of their work or access to required information;
|
(iii) the internal auditing budget and staffing;
(iv) the Audit Services Charter; and
|
|
(v)
|
compliance with the The Institute of Internal Auditors’ Standards for the Professional Practice of Internal Auditing;
|
|
|
(g)
|
approve the appointment, replacement, or dismissal of the Director of the internal audit group;
|
|
|
(h)
|
review and approve the compensation of the Director of the internal audit group;
|
|
|
(i)
|
review and approve the reporting relationship of the internal auditor to ensure that an appropriate segregation of duties is maintained and that the internal auditor has an obligation to report directly to the Audit Committee on matters affecting the Audit Committee’s duties, irrespective of his or her other reporting relationships;
|
|
|
(j)
|
direct the Director of the internal audit group to review any specific areas the Committee deems necessary; and
|
|
|
(k)
|
discuss the Corporation’s policies with respect to risk assessment and risk management, including guidelines and policies to govern the process by which risk assessment and risk management are undertaken.
|
REPORTING
The Audit Committee is responsible, following each meeting, to report to the Board regarding its activities, findings, recommendations, any issues that arise with respect to the quality or integrity of the Corporation’s financial statements, compliance with applicable law, the performance and independence of the external auditor and the effectiveness of the internal audit function.
The Audit Committee is responsible for reviewing and recommending their approval to the Board, prior to their distribution, of all:
|
|
(a)
|
interim and annual financial statements and notes thereto;
|
|
|
(b)
|
management’s discussion and analysis of financial condition and results of operations;
|
|
|
(c)
|
relevant sections of the annual report, annual information form and management information circular containing financial information;
|
|
|
(d)
|
forecasted financial information and forward-looking statements;
|
- 26 -
|
|
(e)
|
press releases and other documents in which financial statements, earnings forecasts, results of operations or other financial information is disclosed; and
|
|
|
(f)
|
disclosure of the selection of accounting policies (and changes thereto), major accounting judgments, accruals and estimates.
|
The Audit Committee will annually, prior to public disclosure of its annual financial statements, ensure that the external auditor has current participant status with, and is in compliance with, any restriction or sanction imposed by the Canadian Public Accountability Board.
The Audit Committee will prepare any reports required to be prepared by the Committee under applicable law including quarterly reports regarding ongoing investigations made pursuant to the Company’s Whistleblower Policy.
The Audit Committee is responsible to annually review, and in its discretion, make recommendations to the Board regarding changes to its Charter and the position description of its Chair.
The Audit Committee has the power, at the expense of the Company, to retain, instruct, compensate and terminate independent advisors to assist the Audit Committee in the discharge of its duties.
Approved by the Board of Directors - July 27, 2011