EX 99.1

FOR IMMEDIATE RELEASE
Velti Announces a Strong Fourth Quarter and Fiscal Year 2011 With 63% Year on Year Revenue and 95% Adjusted EBITDA Growth, Provides Guidance for a Robust 2012
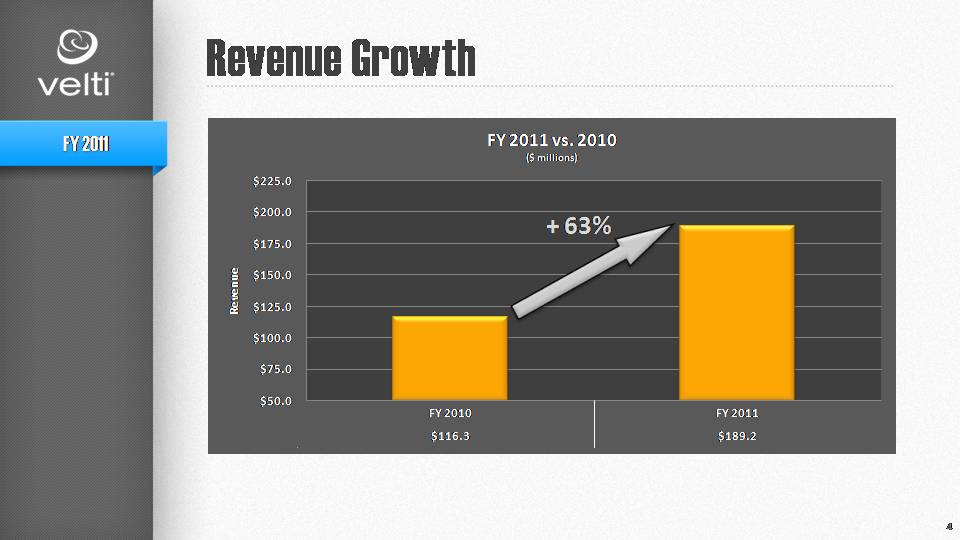
• | Announces fourth quarter revenue of $87.1 million and full year revenue of $189.2 million, a growth of 52% and 63%, respectively; |
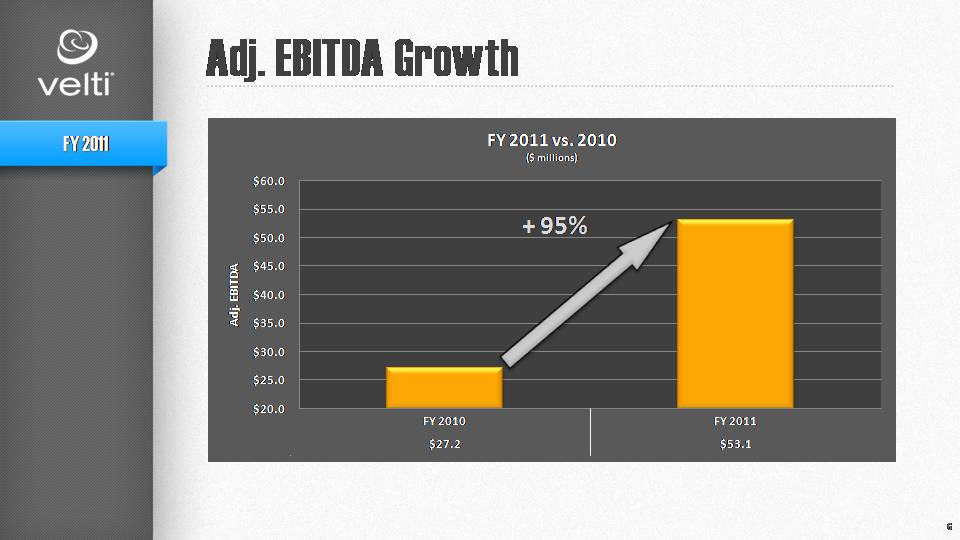
• | Announces fourth quarter Adjusted EBITDA of $43.1 million and full year Adjusted EBITDA of $53.1 million, a growth of 92% and 95%, respectively. |
DUBLIN, Ireland and SAN FRANCISCO, March 12, 2012 (GLOBE NEWSWIRE) -- Velti plc (Nasdaq:VELT), the leading global provider of mobile marketing and advertising technology and solutions, today announced its financial results for the fourth quarter and fiscal year ended December 31, 2011.
"We are very pleased with our fourth quarter and fiscal year results. We continued to expand our presence across numerous geographies. This past year we have had considerable successes throughout the United States and Asia, diversifying our global business. Our revenue growth was characterized by a significant increase of our customers across brands and advertising agencies, with existing customers spending in 2011 44% more dollars for Velti software solutions that allow them to access the mobile market in a targeted and measurable way," said Alex Moukas, Chief Executive Officer.
"2012 is going to be a great year for Velti. We are at the inflection point with consumers moving to the post-PC world and Velti is very well positioned to benefit from this, offering complete solutions for companies seeking to access the mobile marketing and advertising space."
Fiscal Year 2011 Financial Highlights
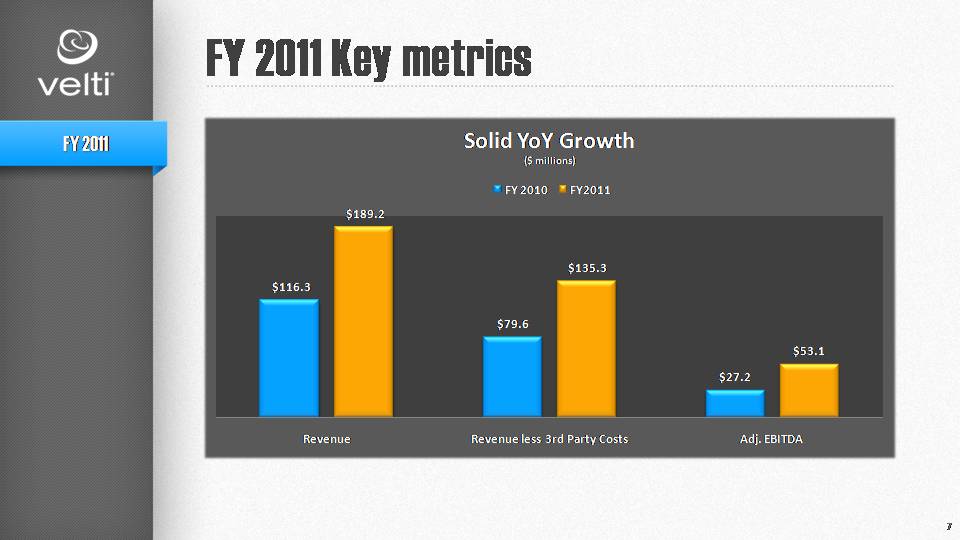
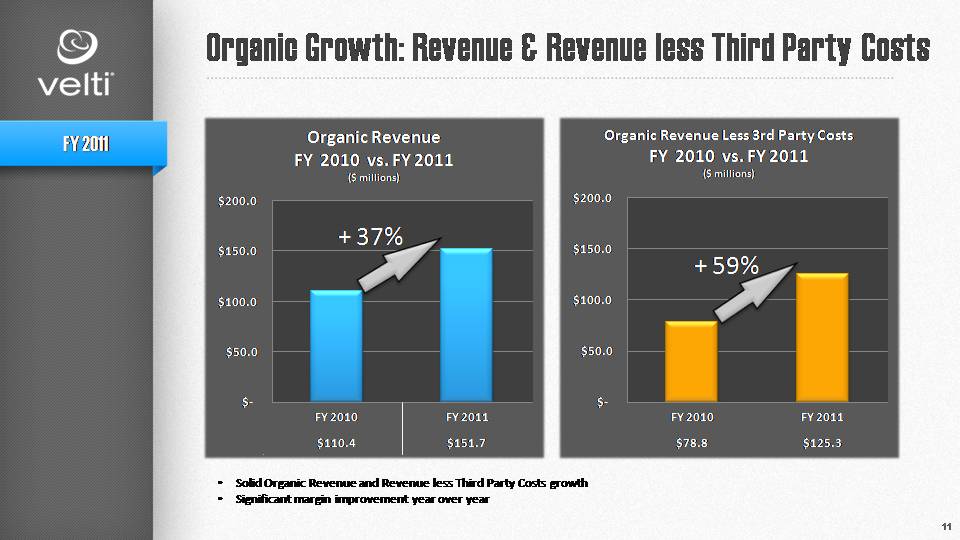
• | Revenue of $189.2 million, an increase of 63% from fiscal year 2010; |
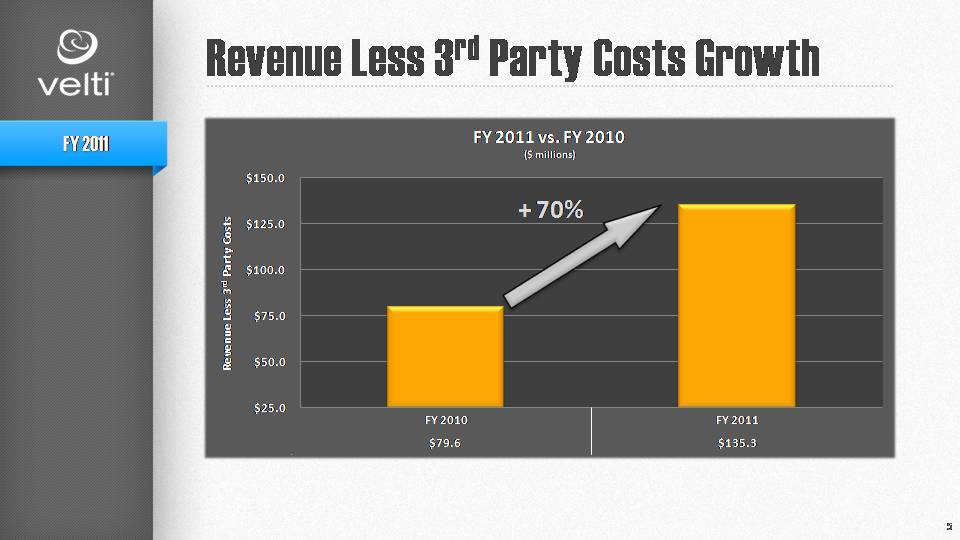
• | Revenue less 3rd party costs of $135.3 million (resulting in a margin of 72% as a percentage of revenue), an increase of 70% from fiscal year 2010; |
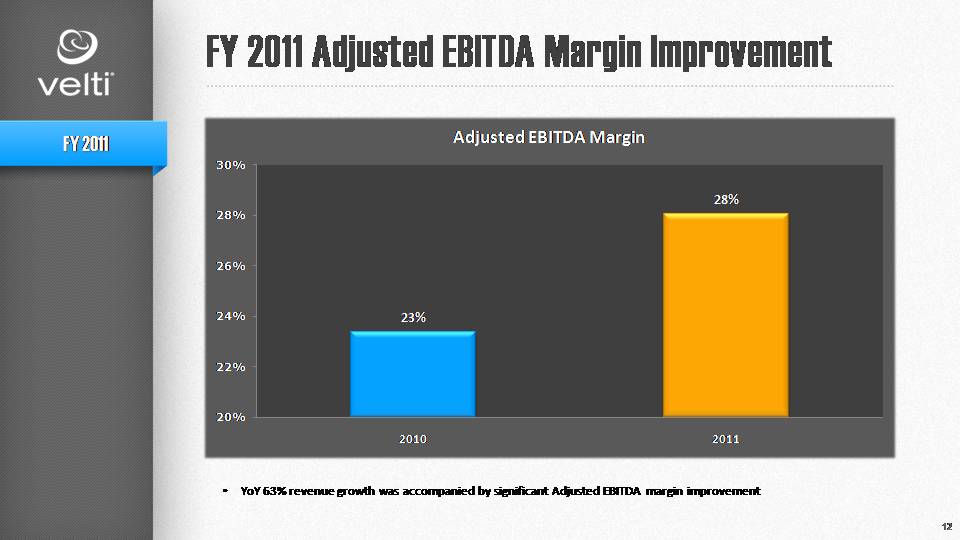
• | Adjusted EBITDA of $53.1 million, compared with $27.2 million in fiscal year 2010, an increase of 95%; |
• | GAAP net loss attributable to Velti of $15.4 million and EPS of $(0.28) compared with a net loss of $15.7 million and EPS of $(0.41) for fiscal year 2010; and |
• | Adjusted net income of $29.0 million and adjusted diluted EPS of $0.50 compared with adjusted net income of $3.0 million and adjusted diluted EPS of $0.07 for 2010. |
Mobile Advertising and Marketing Revenues and Third Party Costs
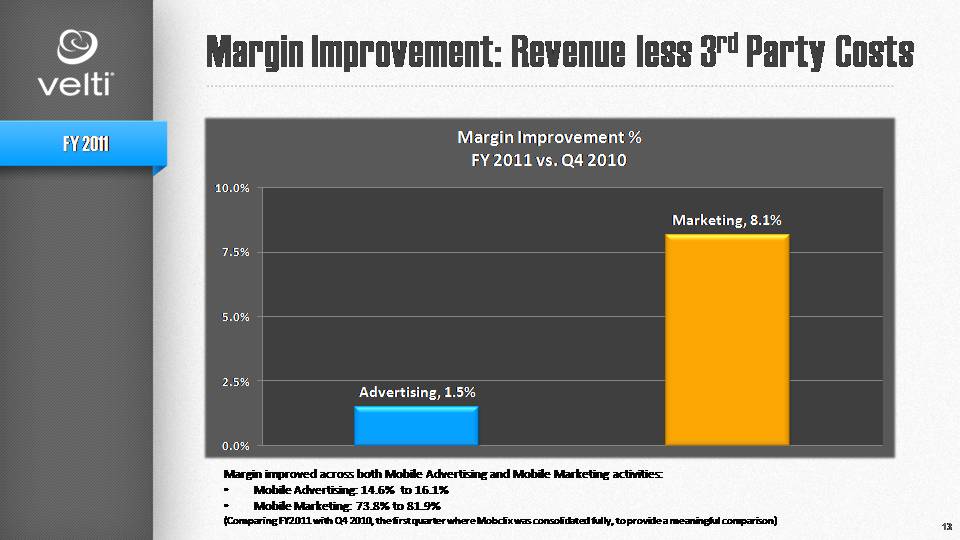
• | Mobile advertising revenue of $29.8 million and mobile advertising 3rd party costs of $25.0 million; resultant mobile advertising revenue less 3rd party costs of $4.8 million (16% as a percentage of revenue); |
• | Mobile marketing revenue of $159.4 million, an increase of 45% from fiscal year 2010 and mobile marketing 3rd party costs of $28.9 million; resultant mobile marketing revenue less 3rd party costs of $130.5 million (82% as a percentage of revenue), an increase of 67% from fiscal year 2010; |
Reach, Customers and SaaS Revenue Contribution
• | Velti's platforms provide marketers the ability to reach more than 4.3 billion consumers in 67 countries and our customers have already connected with 1.4 billion consumers; |
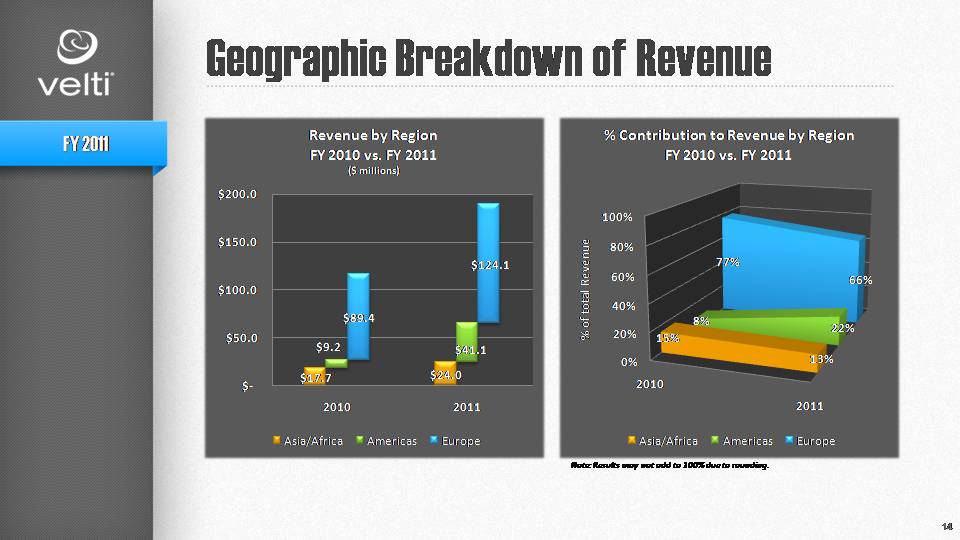
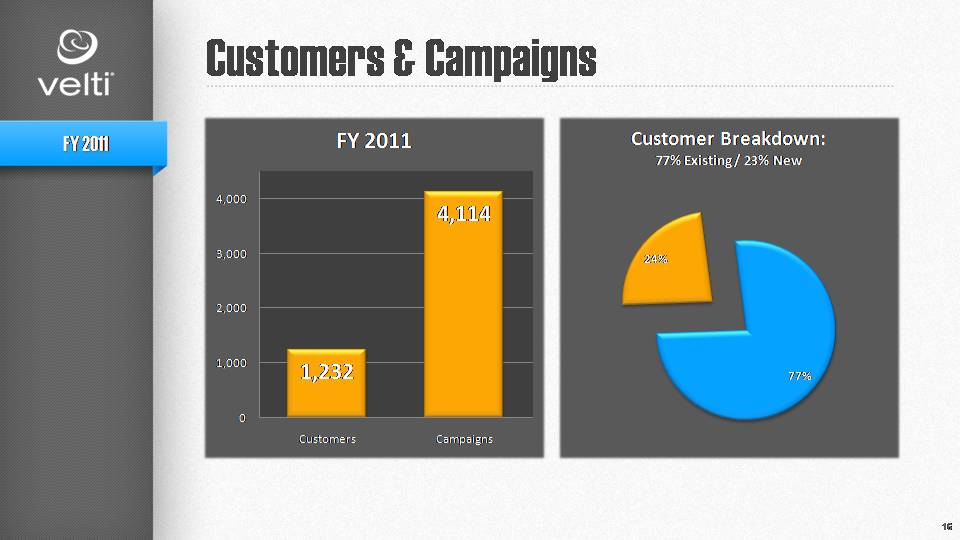
• | During 2011, our 1,232 customers executed 4,114 campaigns on our platforms;Americas is the fastest growing region with $41.1 million of 2011 revenue (compared to $9.2 million in 2010), representing 22% of revenues (compared to 8% in 2010); and |
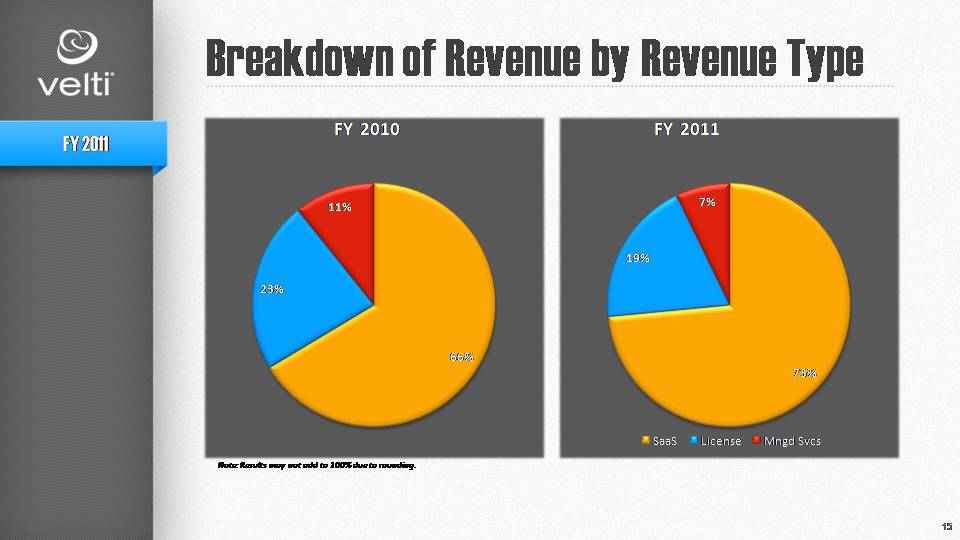
• | Velti increased its SaaS revenue contribution to 73% of total revenue for the fiscal year ended December 31, 2011, compared to 66% for the fiscal year ended December 31, 2010. |
Q4 Financial Highlights
• | Revenue of $87.1 million, an increase of 52% from Q4 2010; |
• | Revenue less 3rd party costs of $68.3 million (resulting in a margin of 78% as a percentage of revenue), an increase of 76% from Q4 2010; |
• | Adjusted EBITDA of $43.1 million, compared with $22.5 million in Q4 2010, an increase of 92%; |
• | GAAP net income attributable to Velti of $25.0 million and diluted EPS of $0.40 compared with net income of $2.0 million and EPS of $0.05 for Q4 2010; |
• | Adjusted net income of $37.3 million and adjusted diluted EPS of $0.59 compared with adjusted net income of $13.5 million and adjusted diluted EPS of $0.34 for Q4 2010; |
• | Mobile advertising revenue of $10.0 million, an increase of 67% from Q4 2010; and |
• | Mobile marketing revenue of $77.2 million, an increase of 50% from Q4 2010. |
Please see the reconciliation of net income (loss) before non-controlling interest to Adjusted EBITDA later in this release.
Fourth Quarter and Fiscal Year 2011 Business Highlights
During the fourth quarter and fiscal year 2011, Velti:
Global Expansion
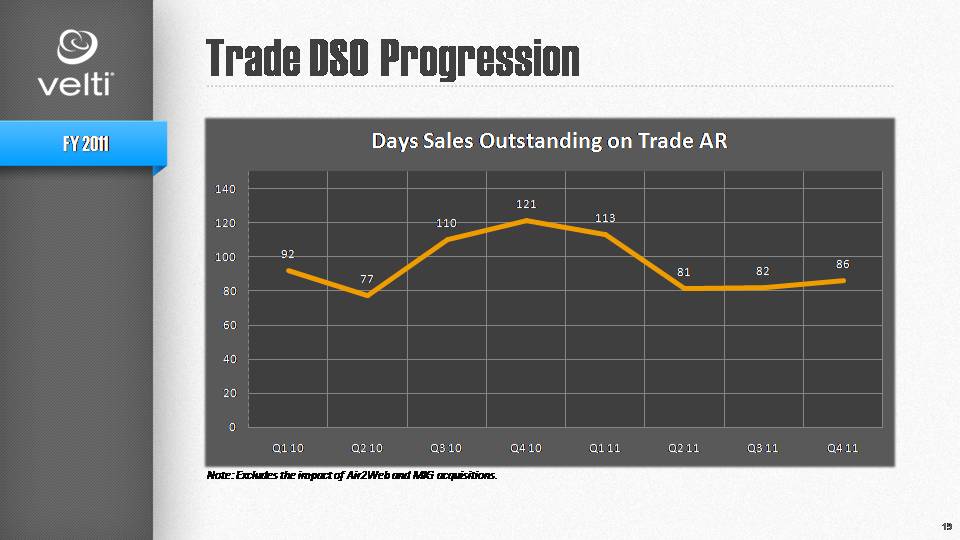
• | Completed the acquisitions of both Air2Web and Mobile Interactive Group, significantly expanding Velti's geographic presence in the United States, the United Kingdom and India, and simultaneously expanding the mGage Platform's product offering with mobile customer relationship management, mobile commerce and mobile billing solutions; |
• | Expanded its global presence, opening new offices in high growth markets, including, among others Sao Paolo, Brazil, Dubai, U.A.E. and Istanbul, Turkey. |
Major Customer Wins
• | Achieved numerous new customer wins, including, among others such blue chip brands as Armani Exchange, Bath & Body Works, Budget Rent A Car, MoneySupermarket.com, Motorola and Subway Restaurants; |
• | Facilitated, via the Company's mGage platform a large scale mobile marketing campaign in the United States for T-Mobile to promote "America's Largest 4G network," attracting 1.3 million T-Mobile customers; |
• | Further expanded its emerging and developing markets expertise, successfully completing a 16 country mobile marketing campaign for the Middle East Broadcasting Center; |
• | Established a long-term partnership with Bharti Airtel, the world's 3rd largest telecom operator by subscribers. |
Product Excellence
• | Launched 5ml, enabling simple, efficient creation of rich media enabled mobile ad units which utilize the mobile device's native functionality; and |
• | Won the prestigious 2011 OMMA (Online Media, Marketing and Advertising) Global Award for its Integrated Online Campaign for National Geographic's documentary, "The Last Lions," resulting in over a quarter million mobile consumers engaged. |
For additional information related to our fourth quarter and fiscal year 2011 results, please see the 2011 Earnings Slide Deck available on the Events section of the investor website at http://investors.velti.com/events.cfm.
Business Outlook
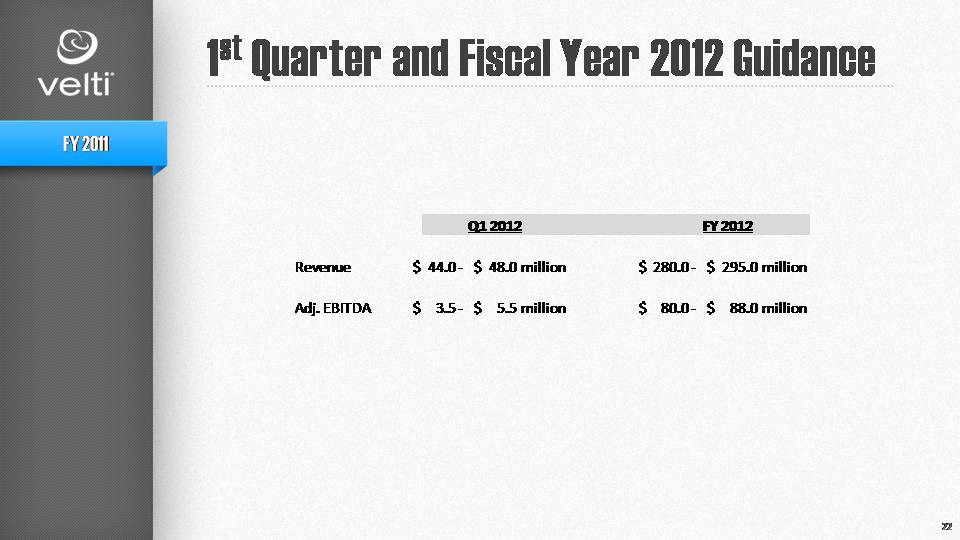
Velti is announcing 2012 revenue and adjusted EBITDA guidance for the first quarter ending March 31st and the fiscal year ending December 31st as follows:
($ in millions) | Quarter Ending March 31st | Fiscal Year Ending December 31st | |||||||||||
Low | High | Low | High | ||||||||||
Revenue | $ | 44.0 | $ | 48.0 | $ | 280.0 | $ | 295.0 | |||||
Adjusted EBITDA | $ | 3.5 | $ | 5.5 | $ | 80.0 | $ | 88.0 | |||||
Conference Call and Webcast Information
The Velti fourth quarter 2011 teleconference and webcast are scheduled to begin at 8:30 AM, Eastern Time on Monday, March 12, 2012. To participate in the live call, analysts and investors should dial (877) 415-4117 or (708) 290-1138 (International), conference ID# 56407689 at least ten minutes prior to the call. The call will also be simulcast on the Internet at http://investors.velti.com. A replay of the call will be available on the Events section of the investor website at http://investors.velti.com/events.cfm for three months. To listen to the telephone replay, call toll-free (855) 859-2056 or (404) 537-3406 (International), conference ID# 56407689. The telephone replay will be available from 11:30 AM Eastern Time March 12 through March 27, 2012. Additional investor information can be accessed at http://velti.com.
Use of Non-GAAP Measures
This press release includes non-GAAP financial measures such as adjusted EBITDA, adjusted net income and adjusted earnings per share. These non-GAAP financial measures are not a measure of financial performance or liquidity calculated in accordance with accounting principles generally accepted in the U.S., referred to herein as GAAP, and should be viewed as a supplement to, not a substitute for, our results of operations presented on the basis of GAAP. Reconciliation of these non-GAAP financial measures to the most directly comparable GAAP financial measures is detailed in the table below.
Our non-GAAP measures should be read in conjunction with the corresponding GAAP measures. These non-GAAP financial measures have limitations as an analytical tool and you should not consider them in isolation from, or as a substitute for, analysis of our results as reported in accordance with GAAP.
We define adjusted net income (loss) by excluding foreign exchange gains or losses, share-based compensation expense, non-recurring and acquisition related expenses, deferrals of net profits of our equity method investments related to transactions with us, and acquisition-related depreciation and amortization.
We define adjusted EBITDA by excluding from adjusted net income (loss), gains or losses from our equity method investments, the remaining depreciation and amortization, the provision for income taxes, net interest expense, and other income.
Adjusted net income (loss) and adjusted EBITDA are not necessarily comparable to similarly-titled measures reported by other companies.
Adjusted income (loss) per share is adjusted net income (loss) divided by diluted shares outstanding.
We believe these non-GAAP financial measures are useful to management, investors and other users of our financial statements in evaluating our operating performance because these financial measures are additional tools to compare business performance across companies and across periods. We believe that:
• | these non-GAAP financial measures are often used by investors to measure a company's operating performance without regard to items such as interest expense, taxes, depreciation and amortization and foreign exchange gains and losses, which can vary substantially from company to company depending upon accounting methods and book value of assets, capital structure and the method by which assets were acquired; and |
• | investors commonly use these non-GAAP financial measures to eliminate the effect of restructuring and share-based compensation expenses, one-time non-recurring expenses, and acquisition-related expenses, which vary widely from company to company and impair comparability. |
We use these non-GAAP financial measures:
• | as a measure of operating performance to assist in comparing performance from period to period on a consistent basis; |
• | as a measure for planning and forecasting overall expectations and for evaluating actual results against such expectations; |
• | as a primary measure to review and assess the operating performance of our company and management team in connection with our executive compensation plan incentive payments; |
• | and in communications with our board of directors, stockholders, analysts and investors concerning our financial performance. |
Note to Financial Statements
The financial information in this announcement does not constitute statutory financial statements as defined in Article 102 of the Companies (Jersey) Law 1991. Copies of our annual report and financial statements will be available at our registered office: First Floor, 28-32 Pembroke Street Upper, Dublin 2, Republic of Ireland or can be downloaded at the Company's website at www.velti.com.
Forward-Looking Statements
"Safe harbor" statement under the Private Securities Litigation Reform Act of 1995: This press release contains forward-looking statements including statements regarding expected growth, continued expansion as the leading global provider of integrated, comprehensive mobile marketing and advertising technology and the adoption of our SaaS platform. The achievement or success of the matters covered by such forward-looking statements involve risks, uncertainties and assumptions, and if any such risks or uncertainties materialize or if any of the assumptions prove incorrect, the company's results could differ materially from the results expressed or implied by the forward-looking statements we make. These risks and uncertainties include - but are not limited to - risks associated with our ability to continue to expand as the leading global provider of integrated, comprehensive mobile marketing and advertising technology, expand our customer base, achieve the benefits of our acquisitions, keep pace with technological and market developments and remain competitive against potential new entrants into our markets. Further information on these and other factors that could affect the company's results is included in our Annual Report on Form 20-F and our current reports on Form 6-K filed with the Securities and Exchange Commission and in other filings we may make with the Securities and Exchange Commission from time to time.
Velti assumes no obligation and does not intend to update these forward-looking statements, except as required by law.
About Velti
Velti is a leading global provider of mobile marketing and advertising technology and solutions that enable brands, advertising agencies, mobile operators and media to implement highly targeted, interactive and measurable campaigns by communicating with and engaging consumers via their mobile devices. The Velti platform, called Velti mGage™, allows customers to use mobile and traditional media to reach targeted consumers, engage the consumer through the mobile Internet and applications, convert them into customers and continue to actively manage the relationship through the mobile channel. Velti is a publicly-held corporation based in Jersey, and trades on the NASDAQ Global Select Market under the symbol VELT. For more information, visit www.velti.com.
The Velti logo is available at http://www.globenewswire.com/newsrooms/prs/?pkgid=7438
For the Three Months Ended December 31, | For the Year Ended December 31, | ||||||||||||||
2011 | 2010 | 2011 | 2010 | ||||||||||||
Reconciliation to adjusted EBITDA: | (in thousands except per share amounts) | ||||||||||||||
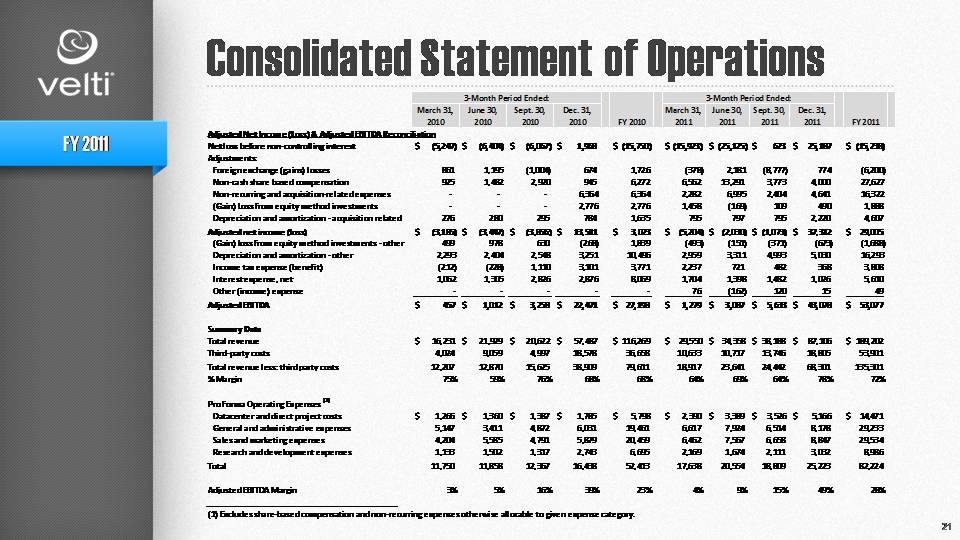
Net income (loss) before non-controlling interest | $ | 25,187 | $ | 1,968 | $ | (15,238 | ) | $ | (15,750 | ) | |||||
Adjustments: | |||||||||||||||
Foreign exchange (gains) losses | 774 | 674 | (6,200 | ) | 1,726 | ||||||||||
Non-cash share based compensation (1) | 4,000 | 945 | 27,626 | 6,272 | |||||||||||
Non-recurring and acquisition-related expenses (2) | 4,641 | 6,364 | 16,322 | 6,364 | |||||||||||
Loss from equity method investments (3) | 490 | 2,776 | 1,888 | 2,776 | |||||||||||
Depreciation and amortization - acquisition related | 2,220 | 784 | 4,607 | 1,635 | |||||||||||
Adjusted net income (loss) | $ | 37,312 | $ | 13,511 | $ | 29,005 | $ | 3,023 | |||||||
Loss (gain) from equity method investments - other | (673 | ) | (268 | ) | (1,688 | ) | 1,839 | ||||||||
Depreciation and amortization - other | 5,030 | 3,251 | 16,293 | 10,496 | |||||||||||
Income tax expense (benefit) | 368 | 3,101 | 3,808 | 3,771 | |||||||||||
Interest expense, net | 1,026 | 2,876 | 5,610 | 8,069 | |||||||||||
Other expense (income) | 15 | — | 49 | — | |||||||||||
Adjusted EBITDA | $ | 43,078 | $ | 22,471 | $ | 53,077 | $ | 27,198 | |||||||
Adjusted net loss per share - basic | $ | 0.60 | $ | 0.35 | $ | 0.52 | $ | 0.08 | |||||||
Adjusted net loss per share - diluted | $ | 0.59 | $ | 0.34 | $ | 0.50 | $ | 0.07 | |||||||
Basic shares | 61,718 | 38,297 | 55,865 | 37,933 | |||||||||||
Diluted shares | 62,921 | 39,551 | 58,071 | 40,382 | |||||||||||
(1) In March 2011, certain performance based deferred share awards granted to employees in 2009 were approved for vesting. The performance metrics of these awards were set at the time of grant based on then current projections of company performance under IFRS for 2009 and 2010. These metrics did not contemplate our conversion to US GAAP, the impact of acquisitions completed during 2009 and 2010, or the impact on our results of preparing for and completing our US public offering. Due to the judgment required to reconcile actual company performance with the original metrics, it was determined that any vesting would be required to be treated as a modification under the guidance in ASC 718. This required the fair value of the awards to be remeasured on the vesting approval date, with the incremental fair value charged to expense over the remaining vesting period. As a result, we recognized additional compensation expense of approximately $10.5 million during the fiscal year ended December 31, 2011. Similarly, in May 2010, we allowed for the vesting of certain deferred share awards granted to employees in 2008 under IFRS based on then current projections of company performance under IFRS for 2008 and 2009. As a result of this modification, we recognized additional compensation expense of approximately $1.1 million during the fiscal year ended December 31, 2010. Share based expenses were included in the condensed consolidated statements of operations for the three months and year ended December 31, 2010 and 2011 as follows:
For the Three Months Ended December 31, | For the Year Ended December 31, | ||||||||||||||
2011 | 2010 | 2011 | 2010 | ||||||||||||
(in thousands) | |||||||||||||||
Datacenter and direct project | $ | 568 | $ | 87 | $ | 3,549 | $ | 443 | |||||||
General and administrative | 1,516 | 880 | 11,735 | 2,613 | |||||||||||
Sales and marketing | 1,266 | (321 | ) | 8,288 | 2,231 | ||||||||||
Research and development | 650 | 299 | 4,055 | 985 | |||||||||||
$ | 4,000 | $ | 945 | $ | 27,627 | $ | 6,272 | ||||||||
(2) Non-recurring and acquisition-related expenses in 2011 included primarily expenses to complete acquisitions, impairment of certain intangible assets following acquisitions in the fourth quarter, interest expense to recognize the remaining debt discount upon repayment of certain loan facilities, interest expense related to a lender fee in connection with our IPO, and other non-recurring items offset by the reversal of a one-time tax liability related to pre-IPO performance share awards that were released to employees in 2010.
(3) Loss (gain) from equity method investments represents deferral of our equity investments' net profits related to transactions with Velti.
1
Velti plc
Consolidated Statements of Operations
(in thousands, except per share amounts)
(unaudited)
For the Three Months Ended December 31, | For the Year Ended December 31, | ||||||||||||||
2011 | 2010 | 2011 | 2010 | ||||||||||||
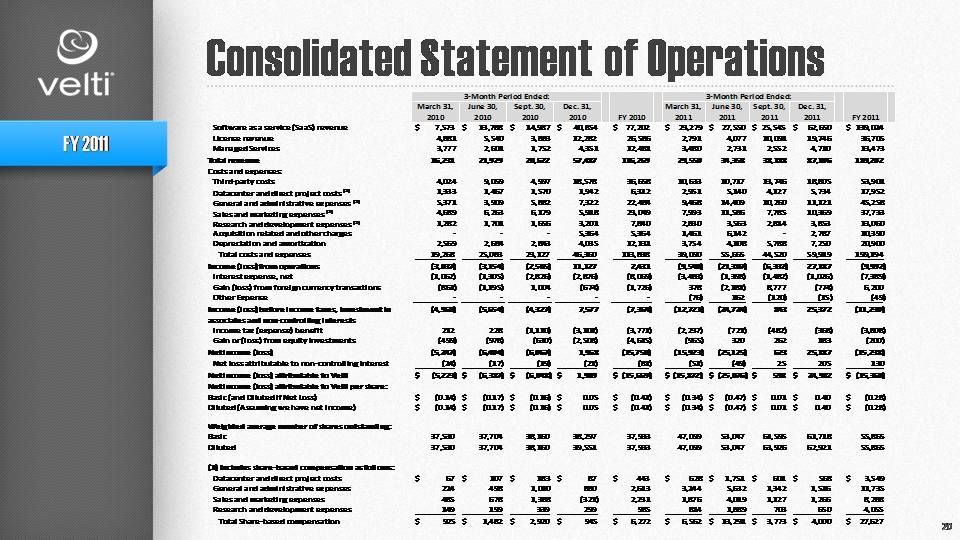
Revenue: | |||||||||||||||
Software as a service (SaaS) revenue | $ | 62,650 | $ | 40,854 | $ | 139,024 | $ | 77,202 | |||||||
License and software revenue | 19,746 | 12,282 | 36,705 | 26,586 | |||||||||||
Managed services revenue | 4,710 | 4,351 | 13,473 | 12,481 | |||||||||||
Total revenue | 87,106 | 57,487 | 189,202 | 116,269 | |||||||||||
Cost and expenses: | |||||||||||||||
Third-party costs | 18,805 | 18,578 | 53,901 | 36,658 | |||||||||||
Datacenter and direct project costs | 5,734 | 1,942 | 17,952 | 6,312 | |||||||||||
General and administrative expenses | 11,121 | 7,322 | 45,258 | 22,484 | |||||||||||
Sales and marketing expenses | 10,369 | 5,918 | 37,733 | 23,049 | |||||||||||
Research and development expenses | 3,853 | 3,201 | 13,060 | 7,840 | |||||||||||
Acquisition related and other charges | 2,787 | 5,364 | 10,390 | 5,364 | |||||||||||
Depreciation and amortization | 7,250 | 4,035 | 20,900 | 12,131 | |||||||||||
Total cost and expenses | 59,919 | 46,360 | 199,194 | 113,838 | |||||||||||
Income (loss) from operations | 27,187 | 11,127 | (9,992 | ) | 2,431 | ||||||||||
Interest expense, net | (1,026 | ) | (2,876 | ) | (7,389 | ) | (8,069 | ) | |||||||
Gain (loss) from foreign currency transactions | (774 | ) | (674 | ) | 6,200 | (1,726 | ) | ||||||||
Other expenses | (15 | ) | — | (49 | ) | — | |||||||||
Income (loss) before income taxes, equity method investments and non-controlling interest | 25,372 | 7,577 | (11,230 | ) | (7,364 | ) | |||||||||
Income tax expense | (368 | ) | (3,101 | ) | (3,808 | ) | (3,771 | ) | |||||||
Income (loss) from equity method investments | 183 | (2,508 | ) | (200 | ) | (4,615 | ) | ||||||||
Net income (loss) | 25,187 | 1,968 | (15,238 | ) | (15,750 | ) | |||||||||
Net income (loss) attributable to non-controlling interest | 205 | (21 | ) | 130 | (81 | ) | |||||||||
Net income (loss) attributable to Velti | $ | 24,982 | $ | 1,989 | $ | (15,368 | ) | $ | (15,669 | ) | |||||
Net income (loss) attributable to Velti per share: | |||||||||||||||
Basic | $ | 0.40 | $ | 0.05 | $ | (0.28 | ) | $ | (0.41 | ) | |||||
Diluted | $ | 0.40 | $ | 0.05 | $ | (0.28 | ) | $ | (0.41 | ) | |||||
Weighted average number of shares outstanding for use in computing per share amounts: | |||||||||||||||
Basic | 61,718 | 38,297 | 55,865 | 37,933 | |||||||||||
Diluted | 62,921 | 39,551 | 55,865 | 37,933 | |||||||||||
7
Velti plc
Condensed Consolidated Balance Sheets
(in thousands, except share and per share amounts)
(unaudited)
December 31, | December 31, | ||||||
2011 | 2010 | ||||||
ASSETS | |||||||
Current assets: | |||||||
Cash and cash equivalents | $ | 75,765 | $ | 17,354 | |||
Trade receivables (including related party receivables of $0.5 million and $3.7 million as of December 31, 2011 and 2010), net of allowance for doubtful accounts | 70,968 | 39,114 | |||||
Accrued contract receivables (including related party receivables of $3.8 million and $0 as of December 31, 2011 and 2010) | 98,203 | 33,588 | |||||
Prepayments | 22,664 | 9,533 | |||||
Other receivables and current assets (including related party receivables of $4.4 million and $0.7 million as of December 31, 2011 and 2010) | 53,963 | 28,307 | |||||
Total current assets | 321,563 | 127,896 | |||||
Property and equipment, net | 5,922 | 3,253 | |||||
Intangible assets, net | 91,192 | 45,650 | |||||
Equity investments | 2,270 | 2,328 | |||||
Goodwill | 52,956 | 18,451 | |||||
Other assets | 19,720 | 11,590 | |||||
Total assets | $ | 493,623 | $ | 209,168 | |||
LIABILITIES AND SHAREHOLDERS' EQUITY | |||||||
Current liabilities: | |||||||
Accounts payable | $ | 41,565 | $ | 32,514 | |||
Accrued liabilities | 49,621 | 27,515 | |||||
Deferred revenue and current portion of deferred government grant | 6,217 | 2,849 | |||||
Current portion of acquisition related liabilities | 26,900 | 8,529 | |||||
Current portion of long-term debt and short-term financings (including related party debt of $0 and $500,000 as of December 31, 2011 and 2010) | 2,881 | 50,430 | |||||
Income tax liabilities | 21,686 | 9,875 | |||||
Total current liabilities | 148,870 | 131,712 | |||||
Long-term debt | 6,859 | 19,685 | |||||
Deferred government grant - non-current | 3,162 | 4,335 | |||||
Acquisition related liabilities - non-current | 18,772 | 10,915 | |||||
Other non-current liabilities | 18,469 | 6,252 | |||||
Total liabilities | 196,132 | 172,899 | |||||
Commitments and contingencies (See Note 15) | |||||||
Shareholders' equity: | |||||||
Share capital, nominal value £0.05, 100,000,000 ordinary shares authorized; 61,790,985 and 38,341,760 shares issued and outstanding as of December 31, 2011 and 2010 | 5,148 | 3,397 | |||||
Additional paid-in capital | 346,031 | 50,415 | |||||
Accumulated deficit | (34,726 | ) | (19,358 | ) | |||
Accumulated other comprehensive income | (19,046 | ) | 1,639 | ||||
Total Velti shareholders' equity | 297,407 | 36,093 | |||||
Non-controlling interests | 84 | 176 | |||||
Total equity | 297,491 | 36,269 | |||||
Total liabilities and shareholders' equity | $ | 493,623 | $ | 209,168 | |||
8
For further information, please contact:
Velti plc Wilson W. Cheung Chief Financial Officer wcheung@velti.com |
Investor Relations Contact: ICR ir@velti.com |
9