UNITED STATES
SECURITIES AND EXCHANGE COMMISSION
Washington, D.C. 20549
SECURITIES AND EXCHANGE COMMISSION
Washington, D.C. 20549
FORM N-CSR
CERTIFIED SHAREHOLDER REPORT OF REGISTERED
MANAGEMENT INVESTMENT COMPANIES
Investment Company Act file number 811-22398
Spinnaker ETF Series
(Exact name of registrant as specified in charter)
(Exact name of registrant as specified in charter)
116 South Franklin Street, Post Office Box 69, Rocky Mount, North Carolina 27802
(Address of principal executive offices) (Zip code)
Corporation Trust Company
1209 Orange Street, Wilmington, DE 19801
(Name and address of agent for service)
Registrant's telephone number, including area code: 252-972-9922
Date of fiscal year end: June 30
Date of reporting period: June 30, 2018
Item 1. REPORTS TO STOCKHOLDERS.
Annual Report 2018
For the period from August 18, 2017 (Commencement
of Operations) through June 30, 2018
Fieldstone UVA Unconstrained
Medium-Term Fixed Income ETF
This report and the financial statements contained herein are submitted for the general information of the shareholders of the Fieldstone UVA Unconstrained Medium-Term Fixed Income ETF (the "Fund"). The Fund's shares are not deposits or obligations of, or guaranteed by, any depository institution. The Fund's shares are not insured by the FDIC, Federal Reserve Board or any other agency, and are subject to investment risks, including possible loss of principal amount invested.
|
Statements in this Annual Report that reflect projections or expectations of future financial or economic performance of the Fieldstone UVA Unconstrained Medium-Term Fixed Income ETF ("Fund") and of the market in general and statements of the Fund's plans and objectives for future operations are forward-looking statements. No assurance can be given that actual results or events will not differ materially from those projected, estimated, assumed or anticipated in any such forward-looking statements. Important factors that could result in such differences, in addition to the other factors noted with such forward-looking statements, include, without limitation, general economic conditions such as inflation, recession and interest rates. Past performance is not a guarantee of future results.
An investor should consider the investment objectives, risks, charges and expenses of the Fund carefully before investing. The prospectus contains this and other information about the Fund. A copy of the prospectus is available at ncfunds.com or by calling The Nottingham Company at 800-773-3863. The prospectus should be read carefully before investing.
|
For More Information on the Fieldstone UVA Unconstrained Medium-Term Fixed Income ETF:
See Our Web site @ ncfunds.com
or
Call Our Administrative Services Group at 800-773-3863.
Letter to Shareholders (Unaudited)
Dear Shareholder,
The Fieldstone UVA Unconstrained Medium-Term Fixed Income ETF (the "ETF") commenced operations on August 18, 2017. This is the first Annual Report to Shareholders. The portfolio managers have a significant number of years of experience in managing fixed income portfolios, in macroeconomic analysis, and in the parsing of financial statements. We use these skills and that experience in the strategic positioning of the ETF and in its daily management.
The ETF is actively managed. It invests in a diversified portfolio of fixed income assets with a duration objective of "intermediate" (4 years to 7 years). We use both top-down macroeconomic analysis and bottom-up assets selection in managing the ETF. Each of these are intended to produce long-term benefits to our Shareholders as described below.
Top-Down Macroeconomics
Since the ETF's inception, the Federal Reserve (Fed) has been raising its target Federal Funds Rate (Fed Funds). This rate generally sets the lower boundary for short-term interest rates in the U.S. The Fed has raised this rate 7 times in one-quarter point intervals (0.25 percentage points) over the 18 month period ended June 30, 2018, and, as of the date of this letter, the Fed Funds rate currently is targeted for a 1.75%-2.00% interval. Short-term rates have generally followed suit. Long-term rates, however, march to the tune of a different drummer, with more emphasis on long-term prospects of inflation and world growth (which has slowed considerably in 2018, especially in China). As a result, longer-term interest rates have not risen in lock-step with Fed Funds, and the spread between long-term and short-term rates has narrowed to the point where some economists believe that a yield curve inversion (short-term rates higher than long-term rates) is likely.
Early on, we recognized these interest rate developments and moved the ETF's assets into securities with a shorter duration. As of June 30, 2018, the ETF's effective duration was 3.06 years with more than 41% of the assets maturing within one year. It now appears that the decade long period of administered interest rates is slowly coming to an end. With our current asset positioning, we believe that we will soon have the opportunity to roll those maturing assets into higher yielding fixed income securities.
Of late, the U.S. economy has shown continued signs of strength, especially in the labor markets and in consumer spending. We believe that, as a result, over the foreseeable horizon, the Fed will continue to raise its Fed Funds target and that short-term rates will continue to move up. We also believe that long-term rates will soon have upward pressures, both because of a significant rise in the U.S. Treasury's borrowing needs due to rising U.S. budget deficits, and the fact that the world's other major central banks are also beginning to move toward tighter policies.
However, as has been typical in the post-WWII modern era, there will come a time when the U.S. economy slows. If history is any teacher, it tells us that 100% of the time, interest rates fall when the economy slows significantly. At that time, the best performing fixed income ETFs will be the ones with average durations at the higher end of their mandates.
1
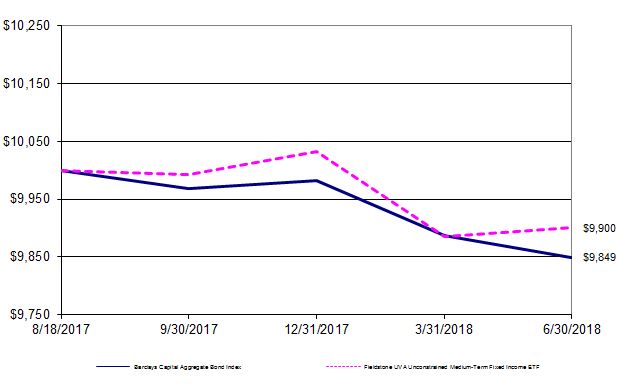
The use of top-down macroeconomic analysis allows us to recognize the interest rate environment. As of June 30, 2018, for the ETF, since inception NAV return was -1.00%, compared to the Barclays Capital Aggregate Bond Index's -1.51% return.
Asset Selection
The assets in the ETF's portfolio had an average S&P rating of between BBB+ and A- as of June 30th. But, as the ETF's managers, we don't rely on the rating agencies. Rather, we independently analyze an issuer's current and prospective financial condition up to the point of the maturation of the asset under consideration. The ratings agencies assess and rate with a long-term view of company viability, while our assessment concentrates on balance sheet, income, and cash flow perspectives up to and including the repayment date of the bond. Often, we are able to find companies with a currently strong balance sheet, income statement, and cash flow, which satisfy us that the instrument under consideration will be paid as agreed, but with more long-term debt than the rating agencies would like to see to assign an A rating. Nevertheless, for us, the short-term issue may represent the equivalent of an A+ or AA rating. The yield in the marketplace reflects that lower agency rating. Using our approach, we are often able to obtain what for us is a high-quality asset but at an outsized yield.
Looking forward, by following the macroeconomic trends and the use of our financial parsing skills in evaluating fixed asset investments, we will strive to keep the ETF at the high end of the relative performance spectrum.
Robert Barone, Ph.D.
Joshua Barone
Universal Value Advisors
(RCFUU0818001)
2
|
Fieldstone UVA Unconstrained Medium-Term Fixed Income ETF
|
||||||||||||||||||
|
Performance Update
|
||||||||||||||||||
|
(Unaudited)
|
||||||||||||||||||
|
For the period from August 18, 2017 (Commencement of Operations) through June 30, 2018
|
||||||||||||||||||
|
Comparison of the Change in Value of a $10,000 Investment
|
||||||||||||||||||
|
This graph assumes an initial investment of $10,000 on August 18, 2017 (Commencement of Operations). All dividends and distributions, if any, are reinvested. This graph depicts the performance of the Fieldstone UVA Unconstrained Medium-Term Fixed Income ETF versus the Barclays Capital Aggregate Bond Index. It is important to note that the ETF is a professionally managed exchange-traded fund while the indices are not available for investment and are unmanaged. The comparison is shown for illustrative purposes only.
|
|||||||||||||||||||
|
Average Annual Total Returns
|
|||||||||||||||||||
|
Gross
|
Net
|
||||||||||||||||||
|
As of
|
Since
|
Inception
|
Expense
|
Expense
|
|||||||||||||||
|
June 30, 2018
|
Inception*
|
Date
|
Ratio**
|
Ratio**
|
|||||||||||||||
|
Fieldstone UVA Unconstrained Medium-Term Fixed
|
-1.00%
|
08/18/17
|
1.23%
|
0.50%
|
|||||||||||||||
|
Income ETF
|
|||||||||||||||||||
|
Barclays Capital Aggregate Bond Index
|
-1.51%
|
N/A
|
N/A
|
N/A
|
|||||||||||||||
|
*Not annualized.
|
|||||||||||||||||||
|
**The gross and net expense ratios shown are from the ETF's most recent Prospectus dated August 18, 2017.
|
|||||||||||||||||||
|
Performance quoted above represents past performance, which is no guarantee of future results. Investment return and principal value will fluctuate so that shares, when redeemed, may be worth more or less than their original cost. Current performance may be lower or higher than the performance data quoted. An investor may obtain performance data, current to the most recent month-end, by visiting ncfunds.com.
|
|||||||||||||||||||
|
The graph and table do not reflect the deduction of taxes that an investor would pay on ETF distributions or the redemption of ETF shares. Average annual total returns are historical in nature and measure net investment income and capital gain or loss from portfolio investments assuming reinvestments of distributions, if any.
|
|||||||||||||||||||
3
|
Fieldstone UVA Unconstrained Medium-Term Fixed Income ETF
|
|||||||||||||
|
Schedule of Investments
|
|||||||||||||
|
As of June 30, 2018
|
|||||||||||||
|
Principal
|
Interest
Rate
|
Maturity
Date
|
Value (Note 1)
|
||||||||||
|
CORPORATE BONDS - 74.28%
|
|||||||||||||
|
21st Century Fox America
|
$
|
750,000 |
6.900%
|
3/1/2019
|
$ |
770,153
|
|||||||
|
Abbvie, Inc.
|
15,000
|
2.000%
|
11/6/2018
|
14,957
|
|||||||||
|
Air Lease Corp.
|
452,000
|
3.375%
|
1/15/2019
|
452,922
|
|||||||||
|
Allergan, Inc.
|
450,000
|
2.800%
|
3/15/2023
|
425,348
|
|||||||||
|
American Express Credit Co.
|
250,000
|
2.125%
|
7/27/2018
|
249,944
|
|||||||||
|
American Museum of Natural History
|
300,000
|
2.729%
|
7/15/2022
|
288,873
|
|||||||||
|
Amgen, Inc.
|
216,000
|
2.200%
|
5/22/2019
|
214,856
|
|||||||||
|
Amgen, Inc.
|
400,000
|
2.650%
|
5/11/2022
|
387,721
|
|||||||||
|
Aon Corp.
|
250,000
|
8.205%
|
1/1/2027
|
309,111
|
|||||||||
|
AT&T, Inc.
|
500,000
|
3.950%
|
1/15/2025
|
489,710
|
|||||||||
|
Avnet, Inc.
|
250,000
|
4.625%
|
4/15/2026
|
246,747
|
|||||||||
|
Bank of America Corp.
|
500,000
|
6.300%
|
3/10/2026
|
529,375
|
|||||||||
|
Becton Dickinson and Co.
|
63,000
|
2.133%
|
6/6/2019
|
62,707
|
|||||||||
|
Becton Dickinson and Co.
|
200,000
|
2.675%
|
12/15/2019
|
198,570
|
|||||||||
|
Berkshire Hathaway Energy
|
1,000,000
|
2.000%
|
11/15/2018
|
997,966
|
|||||||||
|
Best Buy Co., Inc.
|
1,042,000
|
5.000%
|
8/1/2018
|
1,043,686
|
|||||||||
|
Best Buy Co., Inc.
|
475,000
|
5.500%
|
3/15/2021
|
498,219
|
|||||||||
|
Biogen, Inc.
|
400,000
|
3.625%
|
9/15/2022
|
399,751
|
|||||||||
|
Broadcom Corp.
|
225,000
|
2.700%
|
11/1/2018
|
224,508
|
|||||||||
|
CA, Inc.
|
200,000
|
2.875%
|
8/15/2018
|
200,039
|
|||||||||
|
CA, Inc.
|
350,000
|
4.500%
|
8/15/2023
|
362,000
|
|||||||||
|
CA, Inc.
|
250,000
|
4.700%
|
3/15/2027
|
252,862
|
|||||||||
|
Caterpillar Financial Services
|
90,000
|
2.450%
|
9/6/2018
|
90,006
|
|||||||||
|
Celgene Corp.
|
200,000
|
2.875%
|
8/15/2020
|
198,570
|
|||||||||
|
Celgene Corp.
|
400,000
|
3.250%
|
8/15/2022
|
392,491
|
|||||||||
|
Citigroup, Inc.
|
350,000
|
2.050%
|
12/7/2018
|
349,366
|
|||||||||
|
Citigroup, Inc.
|
1,000,000
|
6.250%
|
8/15/2026
|
1,038,750
|
|||||||||
|
CVS Health Corp.
|
54,000
|
1.900%
|
7/20/2018
|
53,989
|
|||||||||
|
Discover Bank
|
670,000
|
2.600%
|
11/13/2018
|
669,672
|
|||||||||
|
Discovery Communications LLC
|
407,000
|
5.625%
|
8/15/2019
|
418,620
|
|||||||||
|
Discovery Communications LLC
|
250,000
|
3.800%
|
3/13/2024
|
246,357
|
|||||||||
|
Domtar Corp.
|
300,000
|
4.400%
|
4/1/2022
|
305,780
|
|||||||||
|
Ebay, Inc.
|
500,000
|
3.600%
|
6/5/2027
|
473,620
|
|||||||||
|
Ecolab, Inc.
|
70,000
|
2.000%
|
1/14/2019
|
69,742
|
|||||||||
|
Fedex Corp.
|
170,000
|
8.000%
|
1/15/2019
|
174,711
|
|||||||||
|
Goldman Sachs Group, Inc.
|
400,000
|
7.500%
|
2/15/2019
|
411,112
|
|||||||||
|
Goldman Sachs Group, Inc.
|
250,000
|
5.700%
|
5/10/2019
|
253,750
|
|||||||||
|
Helmerich & Payne International Drilling
|
193,000
|
4.650%
|
3/15/2025
|
199,551
|
|||||||||
|
Hollyfrontier Corp.
|
262,000
|
5.875%
|
4/1/2026
|
279,947
|
|||||||||
|
Hewlett Packard Enterprise Co.
|
158,000
|
2.850%
|
10/5/2018
|
158,239
|
|||||||||
|
Infinity Property and Casualty Corp.
|
250,000
|
5.000%
|
9/19/2022
|
256,201
|
|||||||||
|
Ingram Micro, Inc.
|
400,000
|
5.000%
|
8/10/2022
|
394,555
|
|||||||||
|
International Paper Co.
|
250,000
|
3.800%
|
1/15/2026
|
243,179
|
|||||||||
| (Continued) | |||||||||||||
4
|
Fieldstone UVA Unconstrained Medium-Term Fixed Income ETF
|
||||||||||||||
|
Schedule of Investments - Continued
|
||||||||||||||
|
As of June 30, 2018
|
||||||||||||||
|
Principal
|
Interest
Rate
|
Maturity
Date
|
Value (Note 1)
|
|||||||||||
|
CORPORATE BONDS - Continued
|
||||||||||||||
|
Jabil, Inc.
|
$
|
210,000 |
4.700%
|
9/15/2022
|
$
|
216,531 | ||||||||
|
Jefferies Financial Group, Inc.
|
200,000
|
5.500%
|
10/18/2023
|
206,877
|
||||||||||
|
Johnson & Johnson
|
70,000
|
1.650%
|
12/5/2018
|
69,766
|
||||||||||
|
Juniper Networks, Inc.
|
256,000
|
3.125%
|
2/26/2019
|
256,527
|
||||||||||
|
Juniper Networks, Inc.
|
500,000
|
4.350%
|
6/15/2025
|
499,204
|
||||||||||
|
Key Bank N.A.
|
500,000
|
3.400%
|
5/20/2026
|
476,732
|
||||||||||
|
Keycorp
|
175,000
|
2.300%
|
12/13/2018
|
174,811
|
||||||||||
|
Kraft Heinz Foods Co.
|
500,000
|
2.000%
|
7/2/2018
|
500,000
|
||||||||||
|
Kraft Heinz Foods Co.
|
400,000
|
3.500%
|
6/6/2022
|
396,398
|
||||||||||
|
Kroger Co.
|
200,000
|
3.700%
|
8/1/2027
|
190,549
|
||||||||||
|
L Brands, Inc.
|
250,000
|
6.625%
|
4/1/2021
|
265,000
|
||||||||||
|
L Brands, Inc.
|
320,000
|
5.625%
|
2/15/2022
|
326,400
|
||||||||||
|
LAM Research Corp.
|
395,000
|
2.800%
|
6/15/2021
|
388,534
|
||||||||||
|
Levi Strauss & Co.
|
500,000
|
5.000%
|
5/1/2025
|
500,000
|
||||||||||
|
Marathon Oil Corp.
|
550,000
|
3.850%
|
6/1/2025
|
541,886
|
||||||||||
|
McDonald's Corp.
|
295,000
|
2.100%
|
12/7/2018
|
294,463
|
||||||||||
|
McKesson Corp.
|
400,000
|
2.284%
|
3/15/2019
|
398,557
|
||||||||||
|
McKesson Corp.
|
222,000
|
2.850%
|
3/15/2023
|
212,556
|
||||||||||
|
Medtronic Global Holdings
|
500,000
|
1.700%
|
3/28/2019
|
496,845
|
||||||||||
|
Micron Technology, Inc.
|
450,000
|
5.500%
|
2/1/2025
|
470,813
|
||||||||||
|
Microsoft Corp.
|
75,000
|
1.300%
|
11/3/2018
|
74,726
|
||||||||||
|
Microsoft Corp.
|
50,000
|
1.625%
|
12/6/2018
|
49,870
|
||||||||||
|
Microsoft Corp.
|
148,000
|
4.200%
|
6/1/2019
|
150,249
|
||||||||||
|
Mid-American Energy Corp.
|
327,000
|
2.400%
|
3/15/2019
|
326,218
|
||||||||||
|
Morgan Stanley
|
175,000
|
2.200%
|
12/7/2018
|
174,772
|
||||||||||
|
Morgan Stanley
|
500,000
|
6.250%
|
8/9/2026
|
564,375
|
||||||||||
|
Newell Brands, Inc.
|
200,000
|
5.000%
|
11/15/2023
|
204,566
|
||||||||||
|
Nordstrom, Inc.
|
831,000
|
4.750%
|
5/1/2020
|
849,945
|
||||||||||
|
Oceaneering International, Inc.
|
200,000
|
4.650%
|
11/15/2024
|
191,312
|
||||||||||
|
Oracle Corp.
|
305,000
|
2.375%
|
1/15/2019
|
304,987
|
||||||||||
|
Oracle Corp.
|
120,000
|
5.000%
|
7/8/2019
|
122,762
|
||||||||||
|
Pitney Bowes, Inc.
|
200,000
|
3.625%
|
10/1/2021
|
189,010
|
||||||||||
|
Princeton University
|
250,000
|
2.612%
|
7/1/2026
|
234,524
|
||||||||||
|
QUALCOMM, Inc.
|
130,000
|
1.850%
|
5/21/2019
|
129,772
|
||||||||||
|
QUALCOMM, Inc.
|
370,000
|
2.250%
|
5/20/2020
|
364,711
|
||||||||||
|
QUALCOMM, Inc.
|
500,000
|
2.900%
|
5/20/2024
|
472,855
|
||||||||||
|
RPM International, Inc.
|
250,000
|
3.750%
|
3/15/2027
|
238,757
|
||||||||||
|
Schlumberger Holdings Corp.
|
450,000
|
2.350%
|
12/21/2018
|
449,169
|
||||||||||
|
Seagate Technology
|
525,000
|
3.750%
|
11/15/2018
|
526,662
|
||||||||||
|
Stanley Black & Decker
|
500,000
|
1.622%
|
11/17/2018
|
498,059
|
||||||||||
|
Starbucks Corp.
|
70,000
|
2.000%
|
12/5/2018
|
69,829
|
||||||||||
|
Stryker Corp.
|
500,000
|
2.000%
|
3/8/2019
|
497,473
|
||||||||||
|
Stryker Corp.
|
359,000
|
3.375%
|
11/1/2025
|
345,426
|
||||||||||
|
Symantec Corp.
|
500,000
|
4.200%
|
9/15/2020
|
502,704
|
||||||||||
| (Continued) | ||||||||||||||
5
|
Fieldstone UVA Unconstrained Medium-Term Fixed Income ETF
|
||||||||||||||
|
Schedule of Investments - Continued
|
||||||||||||||
|
As of June 30, 2018
|
||||||||||||||
|
Principal
|
Interest
Rate
|
Maturity
Date
|
Value (Note 1)
|
|||||||||||
|
CORPORATE BONDS - Continued
|
||||||||||||||
|
Tapestry, Inc.
|
$
|
500,000 |
4.250%
|
4/1/2025
|
$
|
494,739 | ||||||||
|
Tapestry, Inc.
|
200,000
|
4.125%
|
7/15/2027
|
191,073
|
||||||||||
|
Target Corp.
|
500,000
|
2.500%
|
4/15/2026
|
459,899
|
||||||||||
|
The Coca-Cola Co.
|
341,000
|
1.375%
|
5/30/2019
|
337,470
|
||||||||||
|
The Gap, Inc.
|
250,000
|
5.950%
|
4/12/2021
|
261,987
|
||||||||||
|
The Western Union Co.
|
598,000
|
3.650%
|
8/22/2018
|
598,699
|
||||||||||
|
United Health Group, Inc.
|
250,000
|
1.625%
|
3/15/2019
|
248,197
|
||||||||||
|
Valero Energy Corp.
|
502,000
|
3.650%
|
3/15/2025
|
491,035
|
||||||||||
|
VMWare, Inc.
|
200,000
|
2.300%
|
8/21/2020
|
195,905
|
||||||||||
|
VMWare, Inc.
|
250,000
|
2.950%
|
8/21/2022
|
240,136
|
||||||||||
|
VMWare, Inc.
|
250,000
|
3.900%
|
8/21/2027
|
231,279
|
||||||||||
|
Walgreens Boots Alliance
|
250,000
|
3.800%
|
11/18/2024
|
246,785
|
||||||||||
|
Walgreens Boots Alliance
|
500,000
|
3.450%
|
6/1/2026
|
466,820
|
||||||||||
|
Walt Disney Co.
|
13,000
|
1.500%
|
9/17/2018
|
12,974
|
||||||||||
|
Wells Fargo & Co.
|
1,000,000
|
5.900%
|
6/15/2024
|
1,005,000
|
||||||||||
|
Total Corporate Bonds (Cost $36,151,349)
|
35,195,413
|
|||||||||||||
|
FOREIGN BONDS - 5.49%
|
||||||||||||||
|
Anheuser-Busch InBev Finance
|
400,000
|
3.300%
|
2/1/2023
|
397,073
|
||||||||||
|
Astrazeneca PLC
|
20,000
|
1.750%
|
11/16/2018
|
19,941
|
||||||||||
|
Flex Ltd.
|
250,000
|
5.000%
|
2/15/2023
|
255,330
|
||||||||||
|
HSBC Holdings PLC
|
750,000
|
4.250%
|
3/14/2024
|
747,109
|
||||||||||
|
Janus Capital Group, Inc.
|
500,000
|
4.875%
|
8/1/2025
|
511,915
|
||||||||||
|
Royal Bank of Canada
|
179,000
|
2.000%
|
12/10/2018
|
178,605
|
||||||||||
|
Seagate Technology
|
250,000
|
4.750%
|
6/1/2023
|
248,091
|
||||||||||
|
TransCanada Pipelines
|
242,000
|
3.125%
|
1/15/2019
|
242,393
|
||||||||||
|
Total Foreign Bonds (Cost $2,706,559)
|
2,600,457
|
|||||||||||||
|
MUNICIPAL BONDS - 5.16%
|
||||||||||||||
|
Kentucky Property and Buildings Community
|
340,000
|
2.564%
|
5/1/2021
|
331,357
|
||||||||||
|
Michigan State Taxable Grant Anticipation
|
||||||||||||||
|
Bonds Series B
|
250,000
|
7.625%
|
9/15/2027
|
252,745
|
||||||||||
|
New Brunswick New Jersey Parking
|
||||||||||||||
|
Authority
|
215,000
|
8.420%
|
9/1/2040
|
239,532
|
||||||||||
|
New York City Transitional Finance
|
||||||||||||||
|
Authority
|
325,000
|
4.905%
|
11/1/2024
|
349,632
|
||||||||||
|
North Carolina Turnpike Authority
|
405,000
|
6.700%
|
1/1/2039
|
414,007
|
||||||||||
|
Pennsylvania State Government
|
300,000
|
5.450%
|
2/15/2030
|
341,328
|
||||||||||
|
Sacramento Count Public Financing
|
||||||||||||||
|
Authority
|
265,000
|
3.793%
|
4/1/2022
|
265,384
|
||||||||||
|
State of Oregon
|
250,000
|
3.577%
|
8/1/2029
|
254,585
|
||||||||||
|
Total Municipal Bonds (Cost $2,513,224)
|
2,448,570
|
|||||||||||||
|
(Continued)
|
||||||||||||||
6
|
Fieldstone UVA Unconstrained Medium-Term Fixed Income ETF
|
|||||||||||||
|
Schedule of Investments - Continued
|
|||||||||||||
|
As of June 30, 2018
|
|||||||||||||
|
Shares
|
Value (Note 1)
|
||||||||||||
|
EXCHANGE-TRADED FUNDS - 4.10%
|
|||||||||||||
|
Financials - 4.10%
|
|||||||||||||
|
Invesco Exchange Traded Fund Variable Rate Preferred
|
38,711
|
$
|
961,968 | ||||||||||
|
Vaneck Vectors ETF Trust
|
50,000
|
979,500
|
|||||||||||
|
Total Exchange-Traded Funds (Cost $2,004,916)
|
1,941,468
|
||||||||||||
|
SHORT-TERM INVESTMENT - 10.26%
|
|||||||||||||
|
§
|
Blackrock Treasury Trust, 1.70%
|
4,861,401
|
4,861,401
|
||||||||||
|
Total Short-Term Investment (Cost $4,861,401)
|
4,861,401
|
||||||||||||
|
Total Investments (Cost $48,237,449) - 99.29%
|
$
|
47,047,309
|
|||||||||||
|
Other Assets Less Liabilities - 0.71%
|
337,476
|
||||||||||||
|
Net Assets - 100%
|
$
|
47,384,785
|
|||||||||||
|
§
|
Represents 7 day effective yield
|
||||||||||||
|
The following acronyms or abbreviations are used in this schedule of investments:
|
|||||||||||||
|
PLC - Public Limited Company
|
|||||||||||||
|
LLC - Limited Liability Company
|
|||||||||||||
|
Summary of Investments
|
|||||||||||||
|
% of Net
|
|||||||||||||
|
Assets
|
Value
|
||||||||||||
|
Corporate Bonds
|
74.28%
|
$
|
35,195,413
|
||||||||||
|
Foreign Bonds
|
5.49%
|
2,600,457
|
|||||||||||
|
Municipal Bonds
|
5.16%
|
2,448,570
|
|||||||||||
|
Exchange-Traded Funds
|
4.10%
|
1,941,468
|
|||||||||||
|
Short-Term Investment
|
10.26%
|
4,861,401
|
|||||||||||
|
Other Assets Less Liabililties
|
0.71%
|
337,476
|
|||||||||||
|
Total Net Assets
|
100.00%
|
$
|
47,384,785
|
||||||||||
|
See Notes to Financial Statements
|
|||||||||||||
7
|
Fieldstone UVA Unconstrained Medium-Term Fixed Income ETF
|
|||
|
Statement of Assets and Liabilities
|
|||
|
As of June 30, 2018
|
|||
|
Assets:
|
|||
|
Investments, at value (cost $48,237,449)
|
$
|
47,047,309
|
|
|
Receivables:
|
|||
|
Dividends
|
7,094
|
||
|
Interest
|
440,604
|
||
|
Due from sub-advisor
|
16,516
|
||
|
Advance to Administrator for Fund expenses
|
29,260
|
||
|
Total assets
|
47,540,783
|
||
|
Liabilities:
|
|||
|
Payables:
|
|||
|
Distributions
|
107,250
|
||
|
Accrued expenses:
|
|||
|
Operating expenses
|
48,748
|
||
|
Total liabilities
|
155,998
|
||
|
Total Net Assets
|
$
|
47,384,785
|
|
|
Net Assets Consist of:
|
|||
|
Paid in Capital
|
$
|
48,558,225
|
|
|
Undistributed net investment income
|
22,439
|
||
|
Accumulated net realized loss on investments
|
(5,739)
|
||
|
Net unrealized depreciation on investment transactions
|
(1,190,140)
|
||
|
Total Net Assets
|
$
|
47,384,785
|
|
|
Shares Outstanding, no par value (unlimited authorized shares)
|
1,950,000
|
||
|
Net Asset Value, Offering Price, and Redemption Price Per Share
|
$
|
24.30
|
|
|
See Notes to Financial Statements
|
|||
8
|
Fieldstone UVA Unconstrained Medium-Term Fixed Income ETF
|
|||
|
Statement of Operations
|
|||
|
For the fiscal period ended June 30, 2018*
|
|||
|
Investment Income:
|
|||
|
Interest
|
$
|
852,443
|
|
|
Dividends (net of withholding tax $118)
|
118,242
|
||
|
Total Investment Income
|
970,685
|
||
|
Expenses:
|
|||
|
Advisory fees (note 2)
|
86,214
|
||
|
Administration fees (note 2)
|
39,795
|
||
|
Fund accounting fees
|
22,500
|
||
|
Compliance fees
|
18,000
|
||
|
Custody fees
|
18,000
|
||
|
Audit fees
|
17,000
|
||
|
Legal fees
|
15,000
|
||
|
Pricing fees
|
12,000
|
||
|
Exchange listing fees
|
10,000
|
||
|
Trustee fees
|
10,000
|
||
|
Other operating expenses
|
9,213
|
||
|
Distribution fees
|
5,000
|
||
|
Transfer agent fees
|
3,000
|
||
|
|
|||
|
Total Expenses
|
265,722
|
||
|
Expenses waived and/or reimbursed by the sub-advisor (note 2)
|
(110,537)
|
||
|
Net Expenses
|
155,185
|
||
|
Net Investment Income
|
815,500
|
||
|
Realized and Unrealized Loss on Investments:
|
|||
|
Net realized loss from investment transactions
|
(5,739)
|
||
|
Net change in unrealized depreciation on investments
|
(1,190,140)
|
||
|
Net Realized and Unrealized Loss on Investments
|
(1,195,879)
|
||
|
Net Decrease in Net Assets Resulting from Operations
|
$
|
(380,379)
|
|
|
* The Fund commenced operations on August 18, 2017.
|
|||
|
See Notes to Financial Statements
|
|||
9
|
Fieldstone UVA Unconstrained Medium-Term Fixed Income ETF
|
|
||||||
|
Statement of Changes in Net Assets
|
|||||||
|
For the fiscal period from August 18, 2017 (Commencement of Operations) through June 30, 2018
|
|||||||
|
Operations:
|
|||||||
|
Net investment income
|
$
|
815,500
|
|||||
|
Net realized loss from investment transactions
|
(5,739)
|
||||||
|
Net change in unrealized depreciation on investments
|
(1,190,140)
|
||||||
|
Net Decrease in Net Assets Resulting from Operations
|
(380,379)
|
||||||
|
Distributions to Investors
|
|||||||
|
From net investment income
|
(793,061)
|
||||||
|
Decrease from Distributions to Investors
|
(793,061)
|
||||||
|
Beneficial Interest Transactions:
|
|||||||
|
Shares sold
|
48,558,225
|
||||||
|
Reinvested dividends and distributions
|
-
|
||||||
|
Shares repurchased
|
-
|
||||||
|
Increase from Beneficial Interest Transactions
|
48,558,225
|
||||||
|
Net Increase in Net Assets
|
47,384,785
|
||||||
|
Net Assets:
|
|||||||
|
Beginning of period
|
-
|
||||||
|
End of period
|
$
|
47,384,785
|
|||||
|
Undistributed Net Investment Income
|
$
|
22,439
|
|||||
|
Share Information:
|
|||||||
|
Shares Sold
|
1,950,000
|
||||||
|
Reinvested dividends and distributions
|
-
|
||||||
|
Shares Repurchased
|
-
|
||||||
|
Net Increase in Shares of Beneficial Interest
|
1,950,000
|
||||||
|
See Notes to Financial Statements
|
|||||||
10
|
Fieldstone UVA Unconstrained Medium-Term Fixed Income ETF
|
|||||||
|
Financial Highlights
|
|||||||
|
For a share outstanding during the period from August 18, 2017
|
|||||||
|
(Commencement of Operations) through June 30, 2018
|
|||||||
|
Net Asset Value, Beginning of Period
|
$
|
25.00
|
|||||
|
Income (Loss) from Investment Operations:
|
|||||||
|
Net investment income
|
0.46
|
||||||
|
Net realized and unrealized loss on investments
|
(0.71)
|
||||||
|
Total from Investment Operations
|
(0.25)
|
||||||
|
Distributions to Investors:
|
|||||||
|
From net investment income
|
(0.45)
|
||||||
|
Total from Distributions to Investors
|
(0.45)
|
||||||
|
Net Asset Value, End of Period
|
$
|
24.30
|
|||||
|
Total Return
|
(1.00)%
|
(b)
|
|||||
|
Net Assets, End of Period (in thousands)
|
$
|
47,385
|
|||||
|
Ratios of:
|
|||||||
|
Gross Expenses to Average Net Assets (c)
|
0.77%
|
(a)
|
|||||
|
Net Expenses to Average Net Assets (c)
|
0.45%
|
(a)
|
|||||
|
Net Investment Income to Average Net Assets
|
2.36%
|
(a)
|
|||||
|
Portfolio turnover rate
|
6.85%
|
(b)
|
|||||
|
(a)
|
Annualized.
|
||||||
|
(b)
|
Not annualized.
|
||||||
|
(c)
|
The expense ratios listed reflect total expenses prior to any waivers (gross expense ratio) and after any waivers (net expense ratio).
|
||||||
|
See Notes to Financial Statements
|
|||||||
11
Fieldstone UVA Unconstrained Medium-Term Fixed Income ETF
Notes to Financial Statements
As of June 30, 2018
1. Organization and Significant Accounting Policies
The Fieldstone UVA Unconstrained Medium-Term Fixed Income ETF, an exchange-traded fund (the "Fund"), is a diversified series of the Spinnaker ETF Series (the "Trust"). The Trust was established as a Delaware statutory trust under and Agreement and Declaration of Trust on December 21, 2016, and is registered under the Investment Company Act of 1940, as amended (the "1940 Act").
The Fund commenced operations on August 18, 2017. The investment objective of the Fund is to seek current income by investing principally in fixed income securities of any kind, and, under normal circumstances, the Fund intends to invest at least 80% of its net assets (plus the amount of borrowings for investment purposes) in such securities. Fixed income securities include bonds, debt securities, and income-producing instruments of any kind issued by governmental or private-sector entities.
The Trust will issue and redeem shares at Net Asset Value ("NAV") only in a large specified number of shares called a "Creation Unit" or multiples thereof. A Creation Unit consists of 50,000 shares. Creation Unit transactions are typically conducted in exchange for the deposit or delivery of in kind securities and/or cash. As a practical matter, only authorized participants may purchase or redeem these Creation Units. Except when aggregated in Creation Units, the shares are not redeemable securities of the Fund. The prices at which creations and redemptions occur are based on the next calculation of NAV after an order is received in proper form by Capital Investment Group, Inc. (the "Distributor"). Individual shares of the Fund may only be purchased and sold in secondary market transactions through brokers. Shares of the Fund are listed for trading on NYSE Arca under the trading symbol FFIU, and because shares will trade at market prices rather than NAV, shares of the Fund may trade at a price greater than or less than NAV.
The following is a summary of significant accounting policies consistently followed by the Fund. The policies are in conformity with accounting principles generally accepted in the United States of America ("GAAP"). The Fund follows the accounting and reporting guidance in the Financial Accounting Standards Board ("FASB") Accounting Standards Codification 946 "Financial Services – Investment Companies," and Financial Accounting Standards Update ("ASU") 2013-08.
Investment Valuation
The Fund's investments in securities are carried at value. Securities listed on an exchange or quoted on a national market system are valued at the last sales price as of 4:00 p.m. Eastern Time. Securities traded in the NASDAQ over-the-counter market are generally valued at the NASDAQ Official Closing Price. Other securities traded in the over-the-counter market and listed securities for which no sale was reported on that date are valued at the most recent bid price. Securities and assets for which representative market quotations are not readily available (e.g., if the exchange on which the security is principally traded closes early or if trading of the particular security is halted during the day and does not resume prior to the Fund's net asset value calculation) or which cannot be accurately valued using the Fund's normal pricing procedures are valued at fair value as determined in good faith under policies approved by the Board of Trustees (the "Board" or the "Trustees"). A security's "fair value" price may differ from the price next available for that security using the Fund's normal pricing procedures. Instruments with maturities of 60 days or less are valued at amortized cost, which approximates market value.
With respect to any portion of a Fund's assets that may be invested in other mutual funds, the value of the Fund's shares is based on the NAV of the shares of the other mutual funds in which the Fund invests. The valuation methods used by mutual funds in pricing their shares, including the circumstances under which they will use fair value pricing and the effects of using fair value pricing, are included in the prospectuses of such funds. To the extent a Fund invests a portion of its assets in non-registered investment vehicles, the Fund's shares in the non-registered vehicles are fair valued at NAV.
With respect to a Fund's assets invested directly in securities, the Fund's investments are generally valued at current market prices. Equity securities, debt securities, options and futures are generally valued at the official closing price or, if none, the last reported sales price on the primary exchange or market on which they are listed (closing price). Equity securities and debt securities that are not traded primarily on an exchange are generally valued at the quoted bid price obtained from a broker-dealer.
(Continued)
12
Fieldstone UVA Unconstrained Medium-Term Fixed Income ETF
Notes to Financial Statements
As of June 30, 2018
Fair Value Measurement
Various inputs are used in determining the value of the Fund's investments. These inputs are summarized in the three broad levels listed below:
Level 1: unadjusted quoted prices in active markets for identical securities
Level 2: other significant observable inputs (including quoted prices for similar securities and identical securities in inactive markets, interest rates, credit risk, etc.)
Level 3: significant unobservable inputs (including the Fund's own assumptions in determining fair value of investments)
The availability of observable inputs can vary from security to security and is affected by a wide variety of factors, including, for example, the type of security, whether the security is new and not yet established in the marketplace, the liquidity of markets, and other characteristics particular to the security. To the extent that valuation is based on models or inputs that are less observable or unobservable in the market, the determination of fair value requires more judgment. Accordingly, the degree of judgment exercised in determining fair value is greatest for instruments categorized in Level 3.
The inputs used to measure fair value may fall into different levels of the fair value hierarchy. In such cases, for disclosure purposes, the level in the fair value hierarchy within which the fair value measurement falls in its entirety, is determined based on the lowest level input that is significant to the fair value measurement in its entirety.
The inputs or methodology used for valuing securities are not necessarily an indication of the risk associated with investing in those securities. The following table summarizes the inputs as of June 30, 2018 for the Fund's assets measured at fair value:
|
Investments in Securities (a)
|
Total
|
Level 1
|
Level 2
|
Level 3
|
||||
|
Assets
|
||||||||
|
Corporate Bonds
|
$
|
35,195,413
|
$
|
-
|
$
|
35,195,413
|
$
|
-
|
|
Foreign Bonds
|
2,600,457
|
-
|
2,600,457
|
-
|
||||
|
Municipal Bonds
|
2,448,570
|
-
|
2,448,570
|
-
|
||||
|
Exchange-Traded Funds
|
1,941,468
|
1,941,468
|
-
|
-
|
||||
|
Short-Term Investment
|
4,861,401
|
4,861,401
|
-
|
-
|
||||
|
Total Assets
|
$
|
47,047,309
|
$
|
6,802,869
|
$
|
40,244,440
|
$
|
-
|
|
(a)
|
The Fund had no transfers into or out of Level 1, 2, or 3 during the fiscal period ended June 30, 2018. The Fund did not hold any Level 3 securities during the period. The Fund recognizes transfers at the end of each reporting period.
|
Investment Transactions and Investment Income
Investment transactions are accounted for as of the date purchased or sold (trade date). Dividend income and expense are recorded on the ex-dividend date. Interest income is recorded on the accrual basis and includes accretion/amortization of discounts and premiums using the effective interest method. Gains and losses are determined on the identified cost basis, which is the same basis used for Federal income tax purposes.
Expenses
The Fund bears expenses incurred specifically on its behalf as well as a portion of general expenses, which are allocated according to methods reviewed annually by the Trustees.
(Continued)
13
Fieldstone UVA Unconstrained Medium-Term Fixed Income ETF
Notes to Financial Statements
As of June 30, 2018
Distributions
The Fund may declare and distribute dividends from net investment income, if any, monthly. The Fund generally declares and distributes capital gains, if any, annually. Dividends and distributions to shareholders are recorded on ex-date.
Estimates
The preparation of financial statements in conformity with GAAP requires management to make estimates and assumptions that affect the reported amounts of assets and liabilities and the disclosure of contingent assets and liabilities at the date of the financial statements and the reported amounts of increases and decreases in the net assets from operations during the reporting period. Actual results could differ from those estimates.
Federal Income Taxes
No provision for income taxes is included in the accompanying financial statements, as the Fund intends to distribute to shareholders all taxable investment income and realized gains and otherwise comply with Subchapter M of the Internal Revenue Code applicable to regulated investment companies.
2. Transactions with Related Parties and Service Providers
Advisor
The Fund pays a monthly fee to OBP Capital, LLC (the "Advisor") calculated at the annual rate of 0.25% of the Fund's average daily net assets.
For the initial period from August 18, 2017 (Commencement of Operations) through June 30, 2018, the Fund incurred $86,214 in advisory fees.
The Advisor has engaged Universal Value Advisors (the "Sub-Advisor") as the sub-advisor of the Fund (the "Sub-Advisor") to provide day to day portfolio management of the Fund. The Sub-Advisor is paid directly by the Advisor out of the fees disclosed above.
The Fund and the Sub-advisor have entered into a contractual agreement (the "Expense Limitation Agreement") with the Trust, on behalf of the Fund, under which the Sub-Advisor has agreed to waive or reduce its fees and to assume other expenses of the Fund, if necessary, in amounts that limit the Fund's total operating expenses (exclusive of those expenses and other expenditures which are capitalized in accordance with generally accepted accounting principles, acquired fund fees and expenses, other extraordinary expenses not incurred in the ordinary course of each Fund's business, and amounts, if any, payable pursuant to a plan adopted in accordance with Rule 12b-1 under the Investment Company Act of 1940) to not more than 0.45% of the average daily net assets of the Fund.. The current term of the Expense Limitation Agreement is through August 31, 2018. While there can be no assurance that the Expense Limitation Agreement will continue after that date, it is expected to continue from year-to-year thereafter.
For the fiscal period from August 18, 2017 through June 30, 2018, the Sub-Advisor waived and/or reimbursed $110,537 of expenses to the Fund, of which $16,516 was Due from the Sub-Advisor as of June 30, 2018.
Administrator
The Fund pays a monthly fee to the Fund's administrator, The Nottingham Company (the "Administrator"), based upon the average daily net assets of the Fund and calculated at the annual rates as shown in the schedule below, which is subject to a minimum of $3,750 per month.
(Continued)
14
Fieldstone UVA Unconstrained Medium-Term Fixed Income ETF
Notes to Financial Statements
As of June 30, 2018
A breakdown of these fees is provided in the following table:
|
Net Assets
|
Annual Fee
|
|
On the first $100 million
|
0.100%
|
|
$100 million to $200 million
|
0.080%
|
|
On all assets over $200 million
|
0.060%
|
The Fund incurred $39,795 in administration fees for the initial period from August 18, 2017 (Commencement of Operations) through June 30, 2018. The Administrator is responsible for collecting expense amounts from the Fund, as well as expense reimbursement payments from the Sub-Advisor, and remitting these amounts to the companies that furnish services to the Fund. As of June 30, 2018, the Administrator had collected $29,260 from the Fund and Sub-Advisor for Fund expenses that are payable to the companies that furnish services to the Fund.
Compliance Services
For the fiscal period ended June 30, 2018, Cipperman Compliance Services, LLC provided services as the Trust's Chief Compliance Officer (the "CCO"). Cipperman Compliance Services, LLC is entitled to receive customary fees from the Fund for its services pursuant to the Compliance Services agreement with the Fund.
Transfer Agent
The Bank of New York Mellon ("Transfer Agent") serves as transfer, dividend paying, and shareholder servicing agent for the Fund. For its services, the Transfer Agent is entitled to receive compensation from the Fund pursuant to the Transfer Agent's fee arrangements with the Fund.
3. Trustees and Officers
The Board is responsible for the management and supervision of the Fund. The Trustees approve all significant agreements between the Trust, on behalf of the Fund, and those companies that furnish services to the Fund; review performance of the Advisor and the Fund; and oversee activities of the Fund. Officers of the Trust and Trustees who are interested persons of the Trust or the Advisor will receive no salary or fees from the Trust. Trustees who are not "interested persons" of the Trust or the Advisor within the meaning of the 1940 Act (the "Independent Trustees") receive $5,000 per year payable quarterly and $2,000 per series in the Trust. The Trust will reimburse each Trustee and officer of the Trust for his or her travel and other expenses relating to attendance of Board meetings. Additional fees may also be incurred during the year as special meetings are necessary in addition to the regularly scheduled meetings of the Board.
Certain officers of the Trust may also be officers of the Advisor or the Administrator.
4. Purchases and Sales of Investment Securities
For the fiscal period ended June 30, 2018, the aggregate cost of purchases and proceeds from sales of investment securities (excluding short-term securities and securities sold short) were as follows:
|
Purchases of Securities
|
Proceeds from
Sales of Securities
(excluding Maturities)
|
|
$29,623,109
|
$ 1,866,999
|
There were no long-term purchases or sales of U.S Government Obligations during the fiscal period ended June 30, 2018.
(Continued)
15
Fieldstone UVA Unconstrained Medium-Term Fixed Income ETF
Notes to Financial Statements
As of June 30, 2018
5. Federal Income Tax
Distributions are determined in accordance with Federal income tax regulations, which differ from GAAP, and, therefore, may differ significantly in amount or character from net investment income and realized gains for financial reporting purposes. The general ledger is adjusted for permanent book/tax differences to reflect tax character but is not adjusted for temporary differences.
Management has reviewed the Fund's tax positions to be taken on the federal income tax returns and, for the fiscal period ended June 30, 2018 and determined that the Fund does not have a liability for uncertain tax positions. The Fund recognizes interest and penalties, if any, related to unrecognized tax benefits as income tax expense in the Statement of Operations. During the fiscal period from August 18, 2017 (Commencement of Operations) through June 30, 2018, the Fund did not incur any interest or penalties.
For the fiscal period ended June 30, 2018, the Fund paid $793,061 in income distributions but no capital gain distributions.
At June 30, 2018, the tax-basis cost of investments and components of distributable earnings were as follows:
|
Cost of Investments
|
$48,237,449
|
|
|
Gross Unrealized Appreciation
|
2,018
|
|
|
Gross Unrealized Depreciation
|
(1,192,158)
|
|
|
Net Unrealized Depreciation
|
(1,190,140)
|
|
|
Undistributed Net Investment Income
|
22,439
|
|
|
Deferred Post October Losses
|
(5,739)
|
|
|
Accumulated Deficit
|
$(1,173,440)
|
Realized losses of $5,739 reflected in the accompanying financial statements include net capital losses realized between November 1 and the Fund's fiscal year-end that have not been recognized for tax purposes (Deferred Post October Capital Losses).
7. New Accounting Pronouncement
In March 2017, the Financial Accounting Standards Board (FASB) issued Accounting Standards Update (ASU) No. 2017-08, Receivables—Nonrefundable Fees and Other Costs (Subtopic 310-20): Premium Amortization on Purchased Callable Debt Securities. The amendments in the ASU shorten the amortization period for certain callable debt securities, held at a premium, to be amortized to the earliest call date. The ASU does not require an accounting change for securities held at a discount; which continues to be amortized to maturity. The ASU is effective for fiscal years and interim periods within those fiscal years beginning after December 15, 2018. Management is currently evaluating the impact, if any, of applying this provision.
8. Commitments and Contingencies
Under the Trust's organizational documents, its officers and Trustees are indemnified against certain liabilities arising out of the performance of their duties to the Fund. In addition, in the normal course of business, the Trust entered into contracts with its service providers, on behalf of the Fund, and others that provide for general indemnifications. The Fund's maximum exposure under these arrangements is unknown, as this would involve future claims that may be made against the Fund. The Fund expects risk of loss to be remote.
(Continued)
16
Fieldstone UVA Unconstrained Medium-Term Fixed Income ETF
Notes to Financial Statements
As of June 30, 2018
9. Subsequent Events
In accordance with GAAP, management has evaluated the need for disclosures and/or adjustments resulting from subsequent events through the date of issuance of these financial statements.
Distributions
Per share distributions for the Fund during the subsequent period were as follows:
|
Record Date
|
Ex-Date
|
Payable Date
|
Ordinary Income
|
|
7/31/18
|
7/30/18
|
8/1/18
|
$0.05
|
Management has concluded there are no additional matters, other than those noted above, requiring recognition or disclosure.
17

REPORT OF INDEPENDENT REGISTERED PUBLIC ACCOUNTING FIRM
To the Board of Trustees of Spinnaker ETF Series
and the Shareholders of Fieldstone UVA Unconstrained Medium-Term Fixed Income ETF
Opinion on the Financial Statements
We have audited the accompanying statement of assets and liabilities of Fieldstone UVA Unconstrained Medium-Term Fixed Income ETF, a series of shares of beneficial interest in Spinnaker ETF Series (the "Fund"), including the schedule of investments, as of June 30, 2018, and the related statement of operations, the statement of changes in net assets, and the financial highlights for the period August 18, 2017 (commencement of operations) to June 30, 2018, and the related notes (collectively referred to as the "financial statements"). In our opinion, the financial statements present fairly, in all material respects, the financial position of the Fund as of June 30, 2018, and the results of its operations, the change in its net assets, and its financial highlights for the period August 18, 2017 to June 30, 2018, in conformity with accounting principles generally accepted in the United States of America.
Basis for Opinion
These financial statements are the responsibility of the Fund's management. Our responsibility is to express an opinion on the Fund's financial statements based on our audits. We are a public accounting firm registered with the Public Company Accounting Oversight Board (United States) ("PCAOB") and are required to be independent with respect to the Fund in accordance with the U.S. federal securities law and the applicable rules and regulations of the Securities and Exchange Commission and the PCAOB.
We conducted our audit in accordance with the standards of the PCAOB. Those standards require that we plan and perform the audit to obtain reasonable assurance about whether the financial statements are free of material misstatement, whether due to error or fraud. The Fund is not required to have, nor were we engaged to perform, an audit of its internal control over financial reporting. As part of our audits we are required to obtain an understanding of internal control over financial reporting but not for the purpose of expressing an opinion on the effectiveness of the Fund's internal control over financial reporting. Accordingly, we express no such opinion.
Our audits included performing procedures to assess the risk of material misstatement of those financial statements, whether due to error or fraud, and performing procedures that respond to those risks. Such procedures included examining, on a test basis, evidence regarding the amounts and disclosures in the financial statements. Our procedures included confirmation of securities owned as of June 30, 2018 by correspondence with the custodian. Our audits also included evaluating the accounting principles used and significant estimates made by management, as well as evaluating the overall presentation of the financial statements. We believe that our audit provides a reasonable basis for our opinion.

BBD, LLP
We have served as the auditor of one or more of the Funds in the Spinnaker ETF Series since 2017.
Philadelphia, Pennsylvania
August 29, 2018
Fieldstone UVA Unconstrained Medium-Term Fixed Income ETF
Additional Information
(Unaudited)
As of June 30, 2018
1. Proxy Voting Policies and Voting Record
A copy of the Trust's Proxy Voting and Disclosure Policy and the Advisor's Disclosure Policy are included as Appendix B to the Fund's Statement of Additional Information and are available, without charge, upon request, by calling 800-773-3863, and on the website of the Securities and Exchange Commission ("SEC") at sec.gov. Information regarding how the Fund voted proxies relating to portfolio securities during the most recent 12-month period ended June 30, is available (1) without charge, upon request, by calling the Fund at the number above and (2) on the SEC's website at sec.gov.
2. Quarterly Portfolio Holdings
The Fund files its complete schedule of portfolio holdings with the SEC for the first and third quarters of each fiscal year on Form N-Q. The Fund's Forms N-Q are available on the SEC's website at sec.gov. You may review and make copies at the SEC's Public Reference Room in Washington, D.C. Information on the operation of the Public Reference Room may be obtained by calling the SEC at 800-SEC-0330. You may also obtain copies without charge, upon request, by calling the Fund at 800-773-3863.
3. Tax Information
We are required to advise you within 60 days of the Fund's fiscal year-end regarding federal tax status of certain distributions received by shareholders during each fiscal year. The following information is provided for the Fund's fiscal period ended June 30, 2018.
During the fiscal period, the Fund paid $793,061 in income distributions but no long-term capital gain distributions.
Dividend and distributions received by retirement plans such as IRAs, Keogh-type plans, and 403(b) plans need not be reported as taxable income. However, many retirement plans may need this information for their annual information meeting.
4. Schedule of Shareholder Expenses
As a shareholder of the Fund, you incur ongoing costs, including management fees and other Fund expenses. This Example is intended to help you understand your ongoing costs (in dollars) of investing in the Fund and to compare these costs with the ongoing costs of investing in other mutual funds.
The Example is based on an investment of $1,000 invested at the beginning of the period and held for the entire initial period from January 1, 2018 through June 30, 2018.
Actual Expenses – The first line of the table below provides information about actual account values and actual expenses. You may use the information in this line, together with the amount you invested, to estimate the expenses that you paid over the period. Simply divide your account value by $1,000 (e.g., an $8,600 account value divided by $1,000 = 8.6), then multiply the result by the number in the first line under the heading entitled "Expenses Paid During Period" to estimate the expenses you paid on your account during this period.
Hypothetical Example for Comparison Purposes – The second line of the table below provides information about hypothetical account values and hypothetical expenses based on the Fund's actual expense ratio and an assumed rate of return of 5% per year before expenses, which is not the Fund's actual return. The hypothetical account values and expenses may not be used to estimate the actual ending account balance or expenses you paid for the period. You may use this information to compare the ongoing costs of investing in the Fund and other funds. To do so, compare this 5% hypothetical example with the 5% hypothetical examples that appear in the shareholder reports of the other funds.
(Continued)
19
Fieldstone UVA Unconstrained Medium-Term Fixed Income ETF
Additional Information
(Unaudited)
As of June 30, 2018
Please note that the expenses shown in the table are meant to highlight your ongoing costs only and do not reflect any transactional costs, such as sales charges (loads), redemption fees, or exchange fees. Therefore, the second line of the table is useful in comparing ongoing costs only, and will not help you determine the relative total costs of owning different funds. In addition, if these transactional costs were included, your costs would have been higher.
|
Beginning
Account Value
January 1, 2018
|
Ending
Account Value
June 30, 2018
|
Expenses Paid
During Period*
|
|
|
Actual
Hypothetical (5% annual return before expenses)
|
|||
|
$1,000.00
|
$ 991.50
|
$2.22
|
|
|
$1,000.00
|
$1,022.56
|
$2.26
|
*Expenses are equal to the average account value over the period multiplied by the Fund's annualized expense ratio of 0.45%, for the period, multiplied by 181/365 (to reflect the initial period).
5. Information about Trustees and Officers
The business and affairs of the Fund and the Trust are managed under the direction of the Board of Trustees of the Trust. Information concerning the Trustees and officers of the Trust and Fund is set forth below. Generally, each Trustee and officer serves an indefinite term or until certain circumstances such as their resignation, death, or otherwise as specified in the Trust's organizational documents. Any Trustee may be removed at a meeting of shareholders by a vote meeting the requirements of the Trust's organizational documents. The Statement of Additional Information of the Fund includes additional information about the Trustees and officers and is available, without charge, upon request by calling the Fund toll-free at 800-773-3863. The address of each Trustee and officer, unless otherwise indicated below, is 116 South Franklin Street, Rocky Mount, North Carolina 27804. The Independent Trustees each received aggregate compensation of $5,625 during the fiscal period ended June 30, 2018 from the Fund for their services to the Fund and Trust.
|
Name, Age
and Address |
Position
held with Funds or Trust |
Length
of Time Served
|
Principal Occupation
During Past 5 Years |
Number of Portfolios
in Fund
Complex
Overseen
by Trustee
|
Other Directorships
Held by Trustee During Past 5 Years |
|
Independent Trustees
|
|||||
|
Thomas R. Galloway
Date of Birth: 10/1963 |
Independent
Trustee,
Chairman
|
Since
12/16
|
Independent Investor since 2012: Previously, Bank Loan Analyst at WAMCO from 2000 to 2012.
|
3
|
Independent Trustee of the Leeward Investment Trust for its one series; Prophecy Alpha Fund I, a closed-end interval fund (all registered investment companies).
|
|
Jesse S. Eberdt, III
Date of Birth: 10/1959 |
Independent
Trustee
|
Since
12/16
|
Managing Director at Tempus Durham, LLC (advisory firm) since 2010.
|
3
|
None.
|
|
Other Officers
|
|||||
|
Katherine M. Honey
Date of Birth: 09/1973 |
President and
Principal
Executive
Officer
|
Since
12/16
|
EVP of The Nottingham Company since 2008.
|
n/a
|
n/a
|
(Continued)
20
Fieldstone UVA Unconstrained Medium-Term Fixed Income ETF
Additional Information
(Unaudited)
As of June 30, 2018
|
Name, Age
and Address |
Position
held with Funds or Trust |
Length
of Time Served
|
Principal Occupation
During Past 5 Years |
Number of Portfolios
in Fund
Complex
Overseen
by Trustee
|
Other Directorships
Held by Trustee During Past 5 Years |
|
Ashley E. Harris
Date of Birth: 03/1984
|
Treasurer and
Principal
Financial Officer
|
Since
12/16
|
Fund Accounting Manager and Financial Reporting, The Nottingham Company since 2008.
|
n/a
|
n/a
|
|
Stacey Gillespie
Date of Birth: 05/1974
|
Chief
Compliance
Officer
|
Since
12/16
|
Compliance Director, Cipperman Compliance Services, LLC (09/15-present). Formerly, Chief Compliance Officer of Boenning & Scattergood, Inc. (2013-2015) and Director of Investment Compliance at Boenning & Scattergood, Inc. (2007-2013).
|
n/a
|
n/a
|
21
Fieldstone UVA Unconstrained Medium-Term Fixed Income ETF
is a series of
Spinnaker ETF Series
| For Shareholder Service Inquiries: |
For Investment Advisor Inquiries:
|
|
|
|
| The Bank of New York Mellon |
Universal Value Advsiors
|
| 225 Liberty Street |
1 E. Liberty Street #406
|
| New York, New York 10286 |
Reno, Nevada 89501
|
| Telephone: |
Telephone:
|
| 800-773-3863 | 800-773-3863 |
| World Wide Web @: | World Wide Web @: |
| bnymellon.com | www.ncfunds.com |
Item 2. CODE OF ETHICS.
|
(a)
|
The registrant, as of the end of the period covered by this report, has adopted a code of ethics that applies to its Principal Executive Officer(s), Principal Financial Officer(s), and Principal Accounting Officer(s), or persons performing similar functions, regardless of whether these individuals are employed by the registrant or a third party.
|
|
(b)
|
There have been no substantive amendments during the period covered by this report.
|
|
(c)
|
The registrant has not granted, during the period covered by this report, any waivers, including an implicit waiver.
|
| (d)(1) |
A copy of the code of ethics that applies to the registrant's Principal Executive Officers and Principal Financial Officers is filed pursuant to Item 12.(a)(1) below.
|
Item 3. AUDIT COMMITTEE FINANCIAL EXPERT.
At this time, the registrant believes that the collective knowledge and experience provided by the members of the audit committee together offer the registrant adequate oversight for the registrant's level of financial complexity.
Item 4. PRINCIPAL ACCOUNTANT FEES AND SERVICES.
|
(a)
|
Audit Fees – Audit fees billed for the registrant for the fiscal year ended June 30, 2018 are reflected in the table below. These amounts represent aggregate fees billed by the registrant's independent accountant, BBD, LLC ("Accountant"), in connection with the annual audits of the registrant's financial statements and for services normally provided by the Accountant in connection with the registrant's statutory and regulatory filings for those fiscal years.
|
|
Fund
|
2018
|
|
Fieldstone UVA Unconstrained Medium-Term Fixed Income ETF
|
$14,000
|
|
(b)
|
Audit-Related Fees – There were no additional fees billed in the fiscal year ended June 30, 2018 for assurance and related services by the Accountant that were reasonably related to the performance of the audit of the registrant's financial statements that were not reported under paragraph (a) of this Item.
|
|
(c)
|
Tax Fees – The tax fees billed in each of the fiscal year ended June 30, 2018 for professional services rendered by the Accountant for tax compliance, tax advice, and tax planning are reflected in the table below. These services were for the completion of each fund's federal and state income tax returns, excise tax returns, and assistance with distribution calculations.
|
|
Fund
|
2018
|
|
Fieldstone UVA Unconstrained Medium-Term Fixed Income ETF
|
$3,000
|
|
(d)
|
All Other Fees – There were no other fees paid to the Accountant which were not disclosed in Items (a) through (c) above during the last fiscal year.
|
| (e)(1) |
The registrant's Board of Trustees pre-approved the engagement of the Accountant for the last fiscal year at an audit committee meeting of the Board of Trustees called for such purpose; and will pre-approve the Accountant for each fiscal year thereafter at an audit committee meeting called for such purpose. The charter of the audit committee states that the audit committee should pre-approve any audit services and, when appropriate, evaluate and pre-approve any non-audit services provided by the Accountant to the registrant and to pre-approve, when appropriate, any non-audit services provided by the Accountant to the registrant's investment adviser, or any entity controlling, controlled by, or under common control with the investment adviser that provides ongoing services to the registrant if the engagement relates directly to the operations and financial reporting of the registrant.
|
| (2) |
There were no services as described in each of paragraph (b) through (d) of this Item that were approved by the audit committee pursuant to paragraph (c)(7)(i)(C) of Rule 2-01 of Regulation S-X.
|
| (f) |
Not Applicable.
|
| (g) |
Aggregate non-audit fees billed by the Accountant to the registrant for services rendered for the fiscal year ended June 30, 2018 were $3,000. There were no fees billed by the Accountant for non-audit services rendered to the registrant's investment adviser, or any other entity controlling, controlled by, or under common control with the registrant's investment adviser.
|
| (h) |
Not applicable.
|
Item 5. AUDIT COMMITTEE OF LISTED REGISTRANTS.
|
(a)
|
The registrant is a listed issuer as defined in Rule 10A-3 under the Exchange Act of 1934 and has a separately-designed audit committee established in accordance with Section 3(s)(58(A) of the Exchange Act of 1934. The registrant's audit committee members are Thomas R. Galloway and Jesse S. Eberdt, III.
|
| (b) |
Not Applicable.
|
Item 6. SCHEDULE OF INVESTMENTS.
A copy of the schedule of investments of unaffiliated issuers as of the close of the reporting period is included as part of the report to shareholders filed under Item 1 of this Form.
| Item 7. |
DISCLOSURE OF PROXY VOTING POLICIES AND PROCEDURES FOR CLOSED-END MANAGEMENT INVESTMENT COMPANIES.
|
Not applicable.
| Item 8. |
PORTFOLIO MANAGERS OF CLOSED-END MANAGEMENT INVESTMENT COMPANIES.
|
Not applicable.
| Item 9. |
PURCHASES OF EQUITY SECURITIES BY CLOSED-END MANAGEMENT INVESTMENT COMPANY AND AFFILIATED PURCHASERS.
|
Not applicable.
Item 10. SUBMISSION OF MATTERS TO A VOTE OF SECURITY HOLDERS.
None.
Item 11. CONTROLS AND PROCEDURES.
| (a) |
The Principal Executive Officer/Principal Financial Officer has concluded that the registrant's disclosure controls and procedures are effective based on his evaluation of the disclosure controls and procedures as of a date within 90 days of the filing of this report.
|
| (b) |
There were no changes in the registrant's internal control over financial reporting that occurred during the registrant's second fiscal quarter of the period covered by this report that have materially affected, or are reasonably likely to materially affect, the registrant's internal control over financial reporting.
|
| Item 12. |
DISCLOSURE OF SECURITIES LENDING ACTIVITIES FOR CLOSED-END FUND MANAGEMENT INVESTMENT COMPANIES
|
Not applicable.
Item 13. EXHIBITS.
| (a)(1) |
Code of Ethics required by Item 2 of Form N-CSR is filed herewith as Exhibit 12.(a)(1).
|
| (a)(2) |
Certifications required by Item 12.(a)(2) of Form N-CSR are filed herewith as Exhibit 12.(a)(2).
|
| (a)(3) |
Not applicable.
|
| (b) |
Certifications required by Item 12.(b) of Form N-CSR are filed herewith as Exhibit 12.(b).
|
SIGNATURES
Pursuant to the requirements of the Securities Exchange Act of 1934 and the Investment Company Act of 1940, the registrant has duly caused this report to be signed on its behalf by the undersigned, thereunto duly authorized.
|
Spinnaker ETF Series
|
|
|
/s/ Katherine M. Honey
|
|
|
Date: September 7, 2018
|
Katherine M. Honey
President and Principal Executive Officer
|
Pursuant to the requirements of the Securities Exchange Act of 1934 and the Investment Company Act of 1940, this report has been signed below by the following persons on behalf of the registrant and in the capacities and on the dates indicated.
|
/s/ Katherine M. Honey
|
|
|
Date: September 7, 2018
|
Katherine M. Honey
President and Principal Executive Officer
|
|
/s/ Ashley E. Harris
|
|
|
Date: September 7, 2018
|
Ashley E. Harris
Treasurer and Principal Financial Officer
|