PIMCO Equity Series VIT
UNITED STATES
SECURITIES AND EXCHANGE COMMISSION
Washington, D.C. 20549
FORM N-CSR
CERTIFIED SHAREHOLDER REPORT OF REGISTERED MANAGEMENT
INVESTMENT
COMPANIES
Investment Company Act file number:
811-22376
PIMCO Equity Series VIT
(Exact name of registrant as specified in charter)
840 Newport Center Drive, Newport Beach, CA 92660
(Address of principal
executive offices)
John P. Hardaway
Treasurer and Principal Financial Officer
PIMCO Equity Series VIT
840 Newport Center Drive
Newport Beach, CA 92660
(Name and address of agent for service)
Copies to:
Brendan C. Fox
Dechert LLP
1775 I Street, N.W.
Washington, D.C. 20006
Registrant’s telephone number, including area code: (800) 927-4648
Date of fiscal year end: December 31
Date of reporting period: December 31, 2011
Form N-CSR is to be used by management investment companies to file reports with the Commission not later than 10 days after the transmission to stockholders of any report that is required to be
transmitted to stockholders under Rule 30e-1 under the Investment Company Act of 1940 (17 CFR 270.30e-1). The Commission may use the information provided on Form N-CSR in its regulatory, disclosure review, inspection, and policymaking roles.
A registrant is required to disclose the information specified by Form N-CSR, and the Commission will make this information
public. A registrant is not required to respond to the collection of information contained in Form N-CSR unless the Form displays a currently valid Office of Management and Budget (“OMB”) control number. Please direct comments concerning
the accuracy of the information collection burden estimate and any suggestions for reducing the burden to Secretary, Securities and Exchange Commission, 450 Fifth Street, NW, Washington, DC 20549-0609. The OMB has reviewed this collection of
information under the clearance requirements of 44 U.S.C. § 3507.
Item 1. Reports to Stockholders.
The following is a copy of the report transmitted to stockholders pursuant to Rule 30e-1 under the Investment Company Act of 1940, as amended (the “1940 Act”) (17 CFR 270.30e-1).
| |
• |
|
PIMCO Equity Series VIT—Institutional Class |
| |
• |
|
PIMCO Equity Series VIT—Advisor Class |

Your Global Investment Authority
PIMCO Equity Series VIT
Annual Report
December 31, 2011

PIMCO EqS Pathfinder Portfolio™
Share Class

Table of Contents
This material is authorized for use only when preceded
or accompanied by the current PIMCO Equity Series VIT (the “Trust”) prospectus for the Portfolio. The variable product prospectus may be obtained by contacting your Investment Consultant.
Chairman’s Letter
Dear Shareholder,
Please find enclosed the Annual Report for the PIMCO Equity Series VIT covering the
twelve-month reporting period ended December 31, 2011.
On the
following pages are specific details about the investment performance of the PIMCO EqS Pathfinder Portfolio™ and a discussion of the factors that affected performance during the reporting period. In addition, the letter from the portfolio
managers provides a further review of such factors as well as an overview of their investment strategy, philosophy, and process.
General highlights of the financial markets during our twelve-month reporting period include:
| |
n |
|
Equity markets worldwide remained volatile throughout the reporting period as investors responded to muted global economic growth prospects, rising concerns over
the European sovereign debt crisis, and political gridlock in Washington. U.S. equities, as measured by the S&P 500 Index, returned 2.11%, while global equities, as represented by the MSCI World Index, declined 5.54%. Emerging market (EM)
equities, as represented by the MSCI Emerging Markets Index, declined 18.42% and underperformed developed market equities. |
| |
n |
|
Yields on U.S. Treasury securities ended the period significantly lower (with prices on these securities therefore higher) due to a flight-to-quality brought on
by the European sovereign debt crisis. This combined with a weaker global growth outlook, resulting in increased demand for bonds of nations with perceived stronger balance sheets, top credit ratings, and independent currency and monetary policy.
The Federal Reserve kept the Federal Funds Rate anchored within a range of zero to 0.25%; the Bank of England held its key lending rate at 0.50%; and the European Central Bank reduced its main policy rate to 1.00%. The benchmark ten-year U.S.
Treasury note yielded 1.95% at the end of the reporting period, as compared to 3.29% on December 31, 2010. |
Thank you again for the trust you have placed in us. We value your commitment and will continue to work diligently to meet your broad investment needs.
|
|
|
|
|

|
|
Sincerely,

Brent R. Harris Chairman of the
Board, PIMCO Equity Series VIT January 25, 2012 |
|
|
|
|
|
|
|
|
|
DECEMBER 31, 2011 |
|
ANNUAL REPORT |
|
1 |
Important Information About the Portfolio
PIMCO Equity Series VIT (the “Trust”) is an open-end management investment company
currently consisting of one investment portfolio, the PIMCO EqS Pathfinder PortfolioTM (the “Portfolio”). The Portfolio is only available as a funding vehicle under variable life insurance policies or variable annuity contracts issued by insurance companies (“Variable
Contracts”). Individuals may not purchase shares of the Portfolio directly. Shares of the Portfolio also may be sold to qualified pension and retirement plans outside of the separate account context.
The Portfolio seeks capital appreciation by investing under normal circumstances in
equity securities, including common and preferred stock (and securities convertible into, or that PIMCO expects to be exchanged for, common or preferred stock), of issuers that PIMCO believes are undervalued. The Portfolio’s bottom-up value
investment style attempts to identify securities that are undervalued by the market in comparison to PIMCO’s own determination of the company’s value, taking into account criteria such as asset value, book value and cash flow and earnings
estimates.
The Portfolio may be subject to various risks as described in
the Portfolio’s prospectus. Some of these risks may include, but are not limited to, the following: equity risk, value investing risk, foreign (non-U.S.) investment risk, emerging markets risk, market risk, issuer risk, interest rate risk,
credit risk, high yield and distressed company risk, currency risk, liquidity risk, leveraging risk, management risk, small-cap and mid-cap company risk, arbitrage risk, derivatives risk, short sale risk, commodity risk, tax risk and subsidiary
risk. A complete description of these risks and other risks is contained in the Portfolio’s prospectus. The Portfolio may use derivative instruments for hedging purposes or as part of an investment strategy. Use of these instruments may involve
certain costs and risks such as liquidity risk, interest rate risk, market risk, credit risk, management risk, leverage risk, mispricing or improper valuation risk and the risk that the Portfolio could not close out a position when it would be most
advantageous to do so. The Portfolio could lose more than the principal amount invested in these derivative instruments.
On the Performance Summary page in this Annual Report (“Shareholder Report”), the Average Annual Total Return table and Cumulative Returns chart measure
performance assuming that any dividend and capital gain distributions were reinvested. The Portfolio measures its performance against a broad-based securities market index (benchmark index). The Portfolio’s past performance, before and after
taxes, is not necessarily an indication of how the Portfolio will perform in the future.
An investment in the Portfolio is not a deposit of a bank and is not guaranteed or insured by the Federal Deposit
Insurance Corporation or any other government agency. It is possible to lose money on investments in the Portfolio.
PIMCO has adopted written proxy voting policies and procedures (“Proxy Policy”) as required by Rule 206(4)-6 under the Investment Advisers Act of 1940, as amended. The Proxy Policy has been adopted by the
Trust as the policies and procedures that PIMCO will use when voting proxies on behalf of the Portfolio. A description of the policies and procedures that PIMCO uses to vote proxies relating to portfolio securities of the Portfolio, and information
about how the Portfolio voted proxies relating to portfolio securities held during the most recent twelve-month period ended June 30th, are available without charge, upon request, by calling the Trust at 1-800-927-4648, on the Portfolio’s
website at http://pvit.pimco-funds.com, and on the Securities and Exchange Commission’s (“SEC”) website at http://www.sec.gov.
The Portfolio files a complete schedule of the Portfolio’s holdings with the SEC for the first and third quarters of each fiscal year on Form N-Q. A copy of
the Portfolio’s Form N-Q is available on the SEC’s website at http://www.sec.gov and may be reviewed and copied at the SEC’s Public Reference Room in Washington, D.C. The Portfolio’s Form N-Q will also be available without
charge, upon request, by calling the Trust at 1-800-927-4648 and on the Portfolio’s website at http://pvit.pimco-funds.com. Information on the operation of the Public Reference Room may be obtained by calling 1-800-SEC-0330.
|
|
|
|
|
|
|
| 2 |
|
PIMCO EQUITY SERIES VIT |
|
|
|
|
The following disclosure provides important information regarding the Portfolio’s Expense Example
(“Example” or “Expense Example”), which appears in this Shareholder Report. Please refer to this information when reviewing the Expense Example for the Portfolio.
Expense Example
As a shareholder of the Portfolio, you incur two types of costs: (1) transaction costs and (2) ongoing costs, including management fees, distribution and/or service
(12b-1) fees (Advisor Class only), and other Portfolio expenses. The Example is intended to help you understand your ongoing costs (in dollars) of investing in the Portfolio and to compare these costs with the ongoing costs of investing in other
mutual funds. The Expense Example does not reflect any fees or other expenses imposed by the Variable Contracts. If it did, the expenses reflected in the Expense Example would be higher. The Example is based on an investment of $1,000 invested at
the beginning of the period and held for the entire period, from July 1, 2011 to December 31, 2011.
Actual Expenses
The information
in the table under the heading “Actual Performance” provides information about actual account values and actual expenses. You may use the information in these columns, together with the amount you invested, to estimate the expenses that
you paid over the period. Simply divide your account value by $1,000 (for example, an $8,600 account value divided by $1,000 = $8.60), then multiply the result by the number in the appropriate column for your share class, in the row entitled
“Expenses Paid During Period” to estimate the expenses you paid on your account during this period.
Hypothetical Example for Comparison Purposes
The information in the table under the heading “Hypothetical Performance (5% return before expenses)” provides information
about hypothetical account values and hypothetical expenses based on the Portfolio’s actual expense ratio and an assumed rate of return of 5% per year before expenses, which is not the Portfolio’s actual return. The hypothetical account
values and expenses may not be used to estimate the actual ending account balance or expenses you paid for the period. You may use this information to compare the ongoing costs of investing in the Portfolio and other portfolios. To do so, compare
this 5% hypothetical example with the 5% hypothetical examples that appear in the shareholder reports of the other portfolios.
Please note that the expenses shown in the table are meant to highlight your ongoing costs only and do not reflect any transactional costs. Therefore, the
information under the heading “Hypothetical Performance (5% return before expenses)” is useful in comparing ongoing costs only, and will not help you determine the relative total costs of owning different portfolios. In addition, if these
transactional costs were included, your costs would have been higher.
Expense ratios may vary from period to period because of various factors such as an increase in expenses that are not covered by the management fees, such as fees
and expenses of the independent trustees and their counsel, extraordinary expenses and interest expense.
|
|
|
|
|
|
|
|
|
DECEMBER 31, 2011 |
|
ANNUAL REPORT |
|
3 |
Insights from the Portfolio Managers PIMCO EqS Pathfinder Portfolio™
Dear Shareholder,
Thank you to all who have invested in the PIMCO EqS Pathfinder Portfolio™ (the “Portfolio”) since its launch in April of
2010. For all those who are reading and have an interest in the Portfolio, we have organized our thoughts to update you on the current state of the investment world, on the Portfolio itself and on our outlook.
Review of the Last Period
Over the year, your investment in the Portfolio outperformed its benchmark, the MSCI
World Index, despite posting negative returns. The Portfolio’s outperformance relative to its benchmark occurred during a period marked by extremely high correlation across securities, distinct “risk on” and “risk off” modes
within the market and many professional money managers in both the long only and hedge fund world underperforming their benchmarks by wide margins due to this environment.
While the high correlation and resulting volatility in markets had an impact on the
Portfolio, our historical track record of offering reduced downside exposure stayed intact and was a critical part of outperforming the benchmark over the reporting period. In the following remarks, we’ll relate what we saw in a market that is
multifaceted to the extent that on the one hand, the earnings produced by companies are growing at an attractive rate but on the other hand, some of the macro risks we’re seeing are looming large in the background.
First, we’ll cover the positive developments we saw. Despite a global economy
that can’t be described as strong, companies in the U.S., Asia and even Europe significantly grew their earnings over the reporting period. Growth has been so persistent that many are calling for operating margin declines because it just
doesn’t seem possible that profitability can continue to expand so predictably. For example, revenues and earnings for the MSCI World Index (which includes a healthy number of areas that are perceived to be challenged in Europe and the banking
sector) grew by 6.6% and 2.6% over the year, respectively. In the U.S., as measured by the S&P 500 Index, growth was even stronger with revenues and earnings growth of 8.0% and 6.1%, respectively. Return of capital to shareholders in 2011 was up
over 40% year over year with authorized share repurchases set to be over $550 billion and dividends were up 13.5% in the same period (according to industry reports). In our opinion, this is leaving behind some very attractively valued stocks in all
economies as earnings multiples are stagnant to contracting in many cases.
Second, let’s address what we see in the broader economy, which isn’t as positive and is somewhat in contrast with what we’re seeing with many
individual companies. Over the review period, a number of negative developments came out of Europe and Asia despite a
surprising pick up in the U.S. economy. In Europe, a litany of events revolving around a lack of consensus on how to deal with the overleveraged sovereign balance sheets of peripheral countries
caused volatility in equity markets and has many evaluating the consequences of a Eurozone breakup—once an unimaginable outcome. In Asia, China’s enormous engine of global growth has been sputtering as property values have dropped by as
much as 50% in some areas and the country’s GDP is anticipated to have only expanded at a 9.2% rate in 2011, the lowest since 2009 (according to industry reports). As for the U.S., after a weak report by the Institute for Supply Management
(ISM) at the end of July 2011 and the downgrade of U.S. long-term sovereign debt from AAA to AA+ by independent credit rating agency Standard & Poor’s in early August, the S&P 500 Index experienced a steep decline and the
bears warned us of further downside. However, in a remarkable turnaround, the U.S. economy responded with report after report of better job creation and economic growth than many expected throughout the second half of the reporting period and U.S.
equity markets responded in kind, putting in a 15% advance from the bottom of the market on October 3 (as measured by the S&P 500 Index). Unfortunately, the risks in other parts of the world are likely to inevitably put pressure on the U.S.
if things continue to sour in Europe and Asia.
With these concepts
painting a picture of a tug-of-war between the good and the bad, let’s talk about some of the investment ideas in the Portfolio, including both positive and negative contributors to performance, that we find interesting and how they performed
over the reporting period.
Among the securities that contributed to
performance were the Portfolio’s investments in Phillip Morris and White Mountains Insurance.
Philip Morris
There are often negative headlines on the tobacco sector that deter many investors, but we find
intriguing for the Portfolio, including: declining volumes, litigation risk, increased taxation, plain packaging, and smoking bans. However, the tobacco industry has some characteristics that we consider unique; relatively inelastic pricing power,
growth from emerging markets, highly cash generative business models and generally shareholder friendly managements.
Our security selection process has identified significant value amongst various tobacco companies, and one of them, Philip Morris International, was our top
performer for the period under review.
Philip Morris International is the world’s largest
tobacco manufacturer (excluding China), and owns the market leading brand, Marlboro. It was spun out of the Altria Group in March 2008 (Altria retained its US operations) and owns approximately a 15.6% cigarette market share outside the U.S.
(according to industry reports). The international
|
|
|
|
|
|
|
| 4 |
|
PIMCO EQUITY SERIES VIT |
|
|
|
|
company benefits from its non-U.S. footprint, which to some extent limits its litigation risk compared to its U.S. peers, however, its acquisition of Rothmans in Canada does not make it
completely immune. We believe Philip Morris International benefits from its brand portfolio and size, its international diversification, and its strong cash flow generation. The company is also managed in a very shareholder friendly manner. After
the completion of its first $13 billion share repurchase program, management initiated another share buyback of $12 billion for 2010-2012 and then followed that with an announcement in February 2011 that it would add an additional $5 billion to the
three year repurchase plan.
Although this name had performed well through
the first seven months of the reporting period, the stock began to pull back in early August 2011 as the equity markets began to weaken on heightened fears of contagion from the European debt crisis. We seized upon the opportunity to increase our
exposure to this company and also added selectively to other positions in the portfolio.
White Mountains Insurance
Another area where we have been finding value is in the financial sector. While we
do hold what we believe to be a few select well-managed U.S. thrifts in the Portfolio, our focus has been primarily drawn to the attractive valuations we have uncovered in the property & casualty re-insurance industry. One such company that
we have owned for some time which was a particularly strong performer in the Portfolio over the reporting period was White Mountain Insurance, a Bermuda-domiciled property & casualty insurance and re-insurance business that at the beginning
of the year had a price to book value of 0.75, a 43% discount to its ten-year price-to-book average. Our analysis appears to have been confirmed by other marketplace participants as the company announced in May 2011 that it had signed a definitive
agreement to sell its Esurance and Answer Financial businesses to Allstate for $700 million in cash plus the tangible book value at the time of closing. In addition, management offered a self-tender to purchase up to 300,000 of its own shares in
September 2011. The stock of White Mountain Insurance returned 35% over the year and we continue to find the company an attractive opportunity within the Portfolio.
Among the securities that detracted from performance were the Portfolio’s
investments in Nintendo and Marine Harvest.
Nintendo
Nintendo is a company for which investors appear to have lost faith, however, as somewhat contrarian investors, it intrigues us. While we fully recognize that
Nintendo has made missteps, has wounds that are self-inflicted and faces increased competition, we believe the stock is being priced by investors at a level which anticipates a worst case scenario. The company ended the year with its stock valued at
1.3
times its book value with approximately 73% of the company’s market capitalization held in cash and cash equivalents on its balance sheet. Expectations appear to have been reset to
unreasonably low levels and investors appear to believe the company will never correct its ills, or that there will be a 3DS failure followed by a large amount of wasted money on the second generation Wii console. We, however, believe the company is
worth more than its current price implies, given the quality of its business and its intellectual property rights. Nintendo is also working hard to develop new software and hardware, which we expect to see in early 2012. We believe there is still
room for three major players in the gaming business, and that Nintendo will not only survive, but will do well.
Marine Harvest
Salmon farming is the primary business of Oslo, Norway based Marine Harvest, and to its
detriment salmon pricing has recently come under pressure due to optimistic salmon production forecasts. We see many investors believing there is going to be significant production growth coming out of Norway and Chile, two of the major
commercial salmon growing areas of the world. However, we believe the forecasts for salmon production growth coming out of Chile, in particular, might be difficult to achieve due to challenging biological conditions and prevalent
disease.
Salmon farming enjoys the lowest feed to protein conversion ratio
of any of the major sources of protein. Over the long-term, we believe the emerging markets are going to consume greater and greater quantities of protein as their per capita incomes and standards of living increase. Hence, we continue to
believe there will be increased demand for salmon in the foreseeable future.
Looking Ahead
After a tumultuous 2011 in which global equity markets on a consolidated basis either eked out a small gain or were down, we believe 2012 promises to be just as interesting, but our sense is that a flattish outcome
from equity markets for two years in a row is unlikely. This is the bi-modal world that we discuss at PIMCO where on one hand, a sizeable risk to the global economy and asset markets exists due to imbalances and stretched balance sheets, but on the
other hand, many central banks are drowning their banking systems in fiat currency (paper money declared legal tender) which could lead to a bout of reflation.
To align our portfolio with that view, we expect that high quality stocks trading at steep discounts to their intrinsic value will continue to be added to the
portfolio in addition to the ones we already own. Not only do stocks like these tend to have high margins, little financial leverage and strong cash flow generation, but they also haven’t been offered at such attractive prices in decades, in
our opinion. We’d like
|
|
|
|
|
|
|
|
|
DECEMBER 31, 2011 |
|
ANNUAL REPORT |
|
5 |
Insights from the Portfolio Managers PIMCO EqS Pathfinder
Portfolio™ (Cont.)
to think that “you can have your cake and eat it too” and stocks like these should be well positioned to benefit: if the equity market rallies strongly, we will seek to participate and
deliver a positive return. But if the equity market drops precipitously due to the external environment, we expect companies like these may be less impacted than other stocks and could ultimately have the potential to return to a normal valuation,
in our opinion. Also, we expect stocks with the ability to return capital to shareholders in the form of dividends and share buybacks will be a focus. In a world that has such a divergence in outcomes, companies that are returning cold hard cash
should be favored and if they’re buying back their stock at cheap valuations, so much the better.
To close this letter, we repeat our thanks for staying the course with the PIMCO EqS Pathfinder Portfolio™, just as we’re staying the course and sticking with our discipline of seeking capital
appreciation while also looking to help mitigate downside risk. We’re privileged to have the opportunity to steward your capital and our intent is to use all of the tools at our disposal to continue to serve in that role.
Sincerely,
|
|
|
|
|

|
|

|
|
|
|

Charles Lahr, CFA Co-Portfolio
Manager |
|

Anne Gudefin, CFA Co-Portfolio
Manager |
Top Holdings1
|
|
|
|
|
|
|
| SPDR Gold Trust |
|
|
|
|
3.60% |
|
| Imperial Tobacco Group PLC |
|
|
|
|
3.40% |
|
| British American Tobacco PLC |
|
|
|
|
3.00% |
|
| Danone |
|
|
|
|
2.50% |
|
| Microsoft Corp. |
|
|
|
|
2.40% |
|
| Intel Corp. |
|
|
|
|
2.20% |
|
| Lorillard, Inc. |
|
|
|
|
2.10% |
|
| Lancashire Holdings Ltd. |
|
|
|
|
2.10% |
|
| BP PLC |
|
|
|
|
1.90% |
|
| Koninklijke KPN NV |
|
|
|
|
1.90% |
|
Geographic Breakdown1
|
|
|
|
|
|
|
| United States |
|
|
|
|
35.5% |
|
| United Kingdom |
|
|
|
|
12.1% |
|
| France |
|
|
|
|
11.1% |
|
| Bermuda |
|
|
|
|
6.1% |
|
| Netherlands |
|
|
|
|
5.8% |
|
| Switzerland |
|
|
|
|
4.2% |
|
| Hong Kong |
|
|
|
|
3.1% |
|
| Denmark |
|
|
|
|
2.0% |
|
| Canada |
|
|
|
|
1.5% |
|
| Japan |
|
|
|
|
1.5% |
|
| Norway |
|
|
|
|
1.5% |
|
| Other |
|
|
|
|
7.7% |
|
Sector Breakdown1
|
|
|
|
|
|
|
| Consumer Staples |
|
|
|
|
27.2% |
|
| Financials |
|
|
|
|
21.6% |
|
| Information Technology |
|
|
|
|
8.5% |
|
| Industrials |
|
|
|
|
6.8% |
|
| Energy |
|
|
|
|
6.7% |
|
| Health Care |
|
|
|
|
6.7% |
|
| Consumer Discretionary |
|
|
|
|
5.3% |
|
| Exchange-Traded Funds |
|
|
|
|
3.6% |
|
| Materials |
|
|
|
|
2.9% |
|
| Telecommunication Services |
|
|
|
|
1.8% |
|
| Utilities |
|
|
|
|
0.6% |
|
| 1 |
% of Total Investments as of 12/31/2011. Top Holdings, Geographic and Sector Breakdown solely reflect long positions. Securities sold short, derivatives, and
short-term instruments are not taken into consideration. |
|
|
|
|
|
|
|
| 6 |
|
PIMCO EQUITY SERIES VIT |
|
|
|
|
PIMCO EqS Pathfinder
Portfolio™
Cumulative Returns Through
December 31, 2011
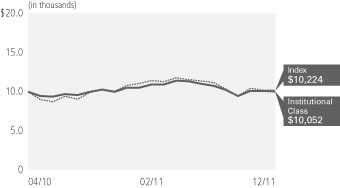
$10,000 invested at the end of the month when the Portfolio’s Institutional Class commenced operations.
|
|
|
|
|
|
|
|
|
|
|
| Average Annual Total Return for the period ended December 31, 2011 |
|
|
|
|
| |
|
|
|
1 Year |
|
|
Class Inception
(04/14/2010) |
|

|
|
PIMCO EqS Pathfinder PortfolioTM Institutional Class |
|
|
-4.54% |
|
|
|
-0.81% |
|

|
|
MSCI World
Index± |
|
|
-5.54% |
|
|
|
-0.58% |
|
All Portfolio returns are net of fees and expenses.
Performance quoted represents past performance. Past performance is not
a guarantee or a reliable indicator of future results. Investment return and the principal value of an investment will fluctuate. Shares may be worth more or less than original cost when redeemed. The Portfolio’s performance does not reflect
the deduction of additional charges and expenses imposed in connection with investing in Variable Contracts, which will reduce returns. Current performance may be lower or higher than performance shown. For performance current to the most recent
month-end, visit http://pvit.pimco-funds.com. The Portfolio’s total annual operating expense ratio as stated in the Portfolio’s current prospectus, as supplemented to date, is 1.16% for Institutional Class shares.
± The MSCI World Index is a free float-adjusted market capitalization weighted
index that is designed to measure the equity market performance of developed markets. As of May 27, 2010 the MSCI World Index consisted of the following 24 developed market country indices: Australia, Austria, Belgium, Canada, Denmark, Finland,
France, Germany, Greece, Hong Kong, Ireland, Israel, Italy, Japan, Netherlands, New Zealand, Norway, Portugal, Singapore, Spain, Sweden, Switzerland, the United Kingdom, and the United States. The index represents the unhedged performance of the
constituent stocks, in US dollars. It is not possible to invest directly in an unmanaged index.
|
|
|
|
|
|
|
|
|
| Expense Example |
|
Actual Performance |
|
|
Hypothetical Performance |
|
| |
|
|
|
|
(5% return before expenses) |
|
| |
|
Institutional Class |
|
|
Institutional Class |
|
| Beginning Account Value (07/01/11) |
|
$ |
1,000.00 |
|
|
$ |
1,000.00 |
|
| Ending Account Value (12/31/11) |
|
$ |
910.50 |
|
|
$ |
1,020.27 |
|
| Expenses Paid During Period* |
|
$ |
4.72 |
|
|
$ |
4.99 |
|
| Net Annualized Expense Ratio** |
|
|
0.98 |
% |
|
|
0.98 |
% |
* Expenses are equal to the net annualized expense
ratio for the class, multiplied by the average account value over the period, multiplied by 184/365 (to reflect the one-half year period). Overall fees and expenses of investing in the Portfolio will be higher because the example does not reflect
variable contract fees and expenses.
** The net annualized expense
ratio is reflective of any applicable waivers related to contractual agreements for voluntary fee waivers and special purpose vehicles. Details regarding fee waivers can be found in note 8 in the Notes to Financial Statements.
Please refer to the Important Information section for an explanation of the
information presented in the above Expense Example.
Portfolio Insights
| » |
|
The PIMCO EqS Pathfinder Portfolio™ seeks capital appreciation by investing under normal circumstances in equity securities, including common and preferred
stock (and securities convertible into, or that PIMCO expects to be exchanged for, common or preferred stock), of issuers that PIMCO believes are undervalued. The Portfolio’s bottom-up value investment style attempts to identify securities that
are undervalued by the market in comparison to PIMCO’s own determination of the company’s value, taking into account criteria such as asset value, book value, cash flow and earnings estimates. |
| » |
|
During the reporting period, the Portfolio’s Institutional class shares declined 4.54% after fees, and the Portfolio’s benchmark index,
the MSCI World Index, declined 5.54%. The Portfolio’s performance, although negative, outperformed its benchmark by 1.00% after fees. |
| » |
|
Holdings in Lloyds Banking, Nintendo, and Marine Harvest were notable detractors from returns as prices on these securities declined during the reporting period.
|
| » |
|
In a challenging period for equities, stock selection in the consumer staples sector helped make some notable contributions to the Portfolio’s return.
|
| » |
|
Holdings in Lorillard, Philip Morris International, and White Mountains Insurance were notable performers as prices on these securities appreciated during
the reporting period. |
| » |
|
Given the decline in the equity markets over the reporting period, the Portfolio’s market risk and currency hedging strategies, including its position in a
gold exchange-traded fund (ETF), contributed to performance as these hedging strategies appreciated in value. |
| » |
|
At the end of the reporting period, the Portfolio held approximately 83% in equities we believe are undervalued, approximately 3% (on the long side only) in
merger arbitrage investments, approximately 10% in cash equivalents, and held the balance of the portfolio in currency and market risk hedges, including approximately 4% in gold. |
|
|
|
|
|
|
|
|
|
DECEMBER 31, 2011 |
|
ANNUAL REPORT |
|
7 |
Financial Highlights PIMCO EqS
Pathfinder Portfolio™
|
|
|
|
|
|
|
|
|
| Selected Per Share Data for the Year
or Period Ended: |
|
12/31/2011 |
|
|
04/14/2010-12/31/2010 |
|
|
|
|
| Institutional Class |
|
|
|
|
|
|
|
|
| Net asset value beginning of year or period |
|
$ |
10.33 |
|
|
$ |
10.00 |
|
| Net investment income
(a) |
|
|
0.11 |
|
|
|
0.12 |
|
| Net realized/unrealized gain (loss) |
|
|
(0.58 |
) |
|
|
0.21 |
|
| Total income (loss) from investment operations |
|
|
(0.47 |
) |
|
|
0.33 |
|
| Dividends from net investment income |
|
|
(0.01 |
) |
|
|
0.00 |
|
| Total distributions |
|
|
(0.01 |
) |
|
|
0.00 |
|
| Net asset value end of year or period |
|
$ |
9.85 |
|
|
$ |
10.33 |
|
| Total return |
|
|
(4.54 |
)% |
|
|
3.30 |
% |
| Net assets end of year or period (000s) |
|
$ |
66,439 |
|
|
$ |
3,276 |
|
| Ratio of expenses to average net assets |
|
|
0.98 |
% |
|
|
1.01 |
%* |
| Ratio of expenses to average net assets excluding waivers |
|
|
1.18 |
% |
|
|
3.72 |
%* |
| Ratio of expenses to average net assets excluding interest expense and dividends on securities sold
short |
|
|
0.97 |
% |
|
|
0.97 |
%* |
| Ratio of expenses to average net assets excluding interest expense, dividends on securities sold
short and waivers |
|
|
1.17 |
% |
|
|
3.68 |
%* |
| Ratio of net investment income to average net assets |
|
|
1.14 |
% |
|
|
1.69 |
%* |
| Portfolio turnover rate |
|
|
238 |
%** |
|
|
25 |
%** |
| ** |
The ratio excludes PIMCO Short-Term Floating NAV Portfolio. |
| (a) |
Per share amounts based on average number of shares outstanding during the year or period.
|
|
|
|
|
|
|
|
|
|
| 8 |
|
PIMCO EQUITY SERIES VIT |
|
|
|
|
See Accompanying Notes |
|
Consolidated Statement of Assets and Liabilities PIMCO EqS Pathfinder Portfolio™
|
|
|
|
|
| (Amounts in thousands, except per share amounts) |
|
December 31, 2011 |
|
|
|
| Assets: |
|
|
|
|
| Investments, at value |
|
$ |
416,247 |
|
| Investments in Affiliates, at value |
|
|
34,238 |
|
| Repurchase agreements, at value |
|
|
663 |
|
| Cash |
|
|
1 |
|
| Deposits with counterparty |
|
|
11,409 |
|
| Foreign currency, at value |
|
|
649 |
|
| Receivable for investments sold |
|
|
11 |
|
| Receivable for Portfolio shares sold |
|
|
94 |
|
| Interest and dividends receivable |
|
|
348 |
|
| Dividends receivable from Affiliates |
|
|
8 |
|
| Reimbursement receivable from PIMCO |
|
|
4 |
|
| Unrealized appreciation on foreign currency contracts |
|
|
4,863 |
|
| Unrealized appreciation on OTC swap agreements |
|
|
20 |
|
| |
|
|
468,555 |
|
|
|
| Liabilities: |
|
|
|
|
| Payable for investments purchased |
|
$ |
1 |
|
| Payable for investments in Affiliates purchased |
|
|
8 |
|
| Payable for short sales |
|
|
7,815 |
|
| Deposits from counterparty |
|
|
3,540 |
|
| Payable for Portfolio shares redeemed |
|
|
86 |
|
| Dividends payable |
|
|
10 |
|
| Written options outstanding |
|
|
233 |
|
| Accrued investment advisory fees |
|
|
261 |
|
| Accrued supervisory and administrative fees |
|
|
146 |
|
| Accrued distribution fees |
|
|
87 |
|
| Unrealized depreciation on foreign currency contracts |
|
|
2,259 |
|
| Unrealized depreciation on OTC swap agreements |
|
|
15 |
|
| Other liabilities |
|
|
4 |
|
| |
|
|
14,465 |
|
|
|
| Net Assets |
|
$ |
454,090 |
|
|
|
| Net Assets Consist of: |
|
|
|
|
| Paid in capital |
|
$ |
454,433 |
|
| Undistributed net investment income |
|
|
259 |
|
| Accumulated undistributed net realized (loss) |
|
|
(12,191 |
) |
| Net unrealized appreciation |
|
|
11,589 |
|
| |
|
$ |
454,090 |
|
|
|
| Net Assets: |
|
|
|
|
| Institutional Class |
|
$ |
66,439 |
|
| Advisor Class |
|
|
387,651 |
|
|
|
| Shares Issued and Outstanding: |
|
|
|
|
| Institutional Class |
|
|
6,743 |
|
| Advisor Class |
|
|
39,458 |
|
|
|
| Net Asset Value and Redemption Price Per Share (Net Asset Value Per Share Outstanding): |
|
|
|
|
| Institutional Class |
|
$ |
9.85 |
|
| Advisor Class |
|
|
9.82 |
|
|
|
| Cost of Investments |
|
$ |
407,210 |
|
| Cost of Investments in Affiliates |
|
$ |
34,237 |
|
| Cost of Repurchase Agreements |
|
$ |
663 |
|
| Cost of Foreign Currency Held |
|
$ |
650 |
|
| Proceeds Received on Short Sales |
|
$ |
7,710 |
|
| Premiums Received on Written Options |
|
$ |
372 |
|
|
|
|
|
|
|
|
| See Accompanying Notes |
|
DECEMBER 31, 2011 |
|
ANNUAL REPORT |
|
9 |
Consolidated Statement of Operations PIMCO EqS Pathfinder Portfolio™
|
|
|
|
|
| (Amounts in thousands) |
|
Year Ended
December 31, 2011 |
|
|
|
| Investment Income: |
|
|
|
|
| Interest |
|
$ |
14 |
|
| Dividends, net of foreign taxes* |
|
|
2,778 |
|
| Dividends from Affiliate investments |
|
|
33 |
|
| Total Income |
|
|
2,825 |
|
|
|
| Expenses: |
|
|
|
|
| Investment advisory fees |
|
|
1,050 |
|
| Supervisory and administrative fees |
|
|
489 |
|
| Distribution and/or servicing fees – Advisor Class |
|
|
287 |
|
| Dividends on short sales |
|
|
11 |
|
| Trustees’ fees |
|
|
60 |
|
| Interest expense |
|
|
3 |
|
| Total Expenses |
|
|
1,900 |
|
| Waiver by PIMCO |
|
|
(267 |
) |
| Net Expenses |
|
|
1,633 |
|
|
|
| Net Investment Income |
|
|
1,192 |
|
|
|
| Net Realized and Unrealized Gain (Loss): |
|
|
|
|
| Net realized (loss) on investments |
|
|
(12,410 |
) |
| Net realized gain on Affiliate investments |
|
|
3 |
|
| Net realized gain on futures contracts, written options and swaps |
|
|
255 |
|
| Net realized (loss) on short sales |
|
|
(4 |
) |
| Net realized (loss) on foreign currency transactions |
|
|
(796 |
) |
| Net change in unrealized appreciation on investments |
|
|
8,588 |
|
| Net change in unrealized appreciation on Affiliate investments |
|
|
1 |
|
| Net change in unrealized appreciation on futures contracts, written options and
swaps |
|
|
144 |
|
| Net change in unrealized appreciation on short sales |
|
|
104 |
|
| Net change in unrealized appreciation on translation of assets and liabilities denominated in
foreign currencies |
|
|
2,504 |
|
| Net (Loss) |
|
|
(1,611 |
) |
|
|
| Net (Decrease) in Net Assets Resulting from Operations |
|
$ |
(419 |
) |
|
|
| *Foreign tax withholdings – Dividends |
|
$ |
140 |
|
|
|
|
|
|
|
|
|
|
| 10 |
|
PIMCO EQUITY SERIES VIT |
|
|
|
|
See Accompanying Notes |
|
Consolidated Statements of Changes in Net Assets PIMCO EqS Pathfinder Portfolio™
|
|
|
|
|
|
|
|
|
| (Amounts In thousands) |
|
Year Ended
December 31, 2011 |
|
|
Period From
April 14, 2011-December 31, 2010 |
|
|
|
|
| Increase in Net Assets from: |
|
|
|
|
|
|
|
|
|
|
|
| Operations: |
|
|
|
|
|
|
|
|
| Net investment income |
|
$ |
1,192 |
|
|
$ |
45 |
|
| Net realized (loss) |
|
|
(12,955 |
) |
|
|
(71 |
) |
| Net realized gain on Affiliate investments |
|
|
3 |
|
|
|
0 |
|
| Net change in unrealized appreciation |
|
|
11,340 |
|
|
|
248 |
|
| Net change in unrealized appreciation on Affiliate investments |
|
|
1 |
|
|
|
0 |
|
| Net increase (decrease) resulting from operations |
|
|
(419 |
) |
|
|
222 |
|
|
|
|
| Distributions to Shareholders: |
|
|
|
|
|
|
|
|
| From net investment income |
|
|
|
|
|
|
|
|
| Institutional Class |
|
|
(75 |
) |
|
|
0 |
|
| Advisor Class |
|
|
(138 |
) |
|
|
0 |
|
|
|
|
| Total Distributions |
|
|
(213 |
) |
|
|
0 |
|
|
|
|
| Portfolio Share Transactions: |
|
|
|
|
|
|
|
|
| Net increase resulting from Portfolio share transactions** |
|
|
448,948 |
|
|
|
5,552 |
|
|
|
|
| Total Increase in Net Assets |
|
|
448,316 |
|
|
|
5,774 |
|
|
|
|
| Net Assets: |
|
|
|
|
|
|
|
|
| Beginning of year or period |
|
|
5,774 |
|
|
|
0 |
|
| End of year* |
|
$ |
454,090 |
|
|
$ |
5,774 |
|
|
|
|
| *Including undistributed net investment income of: |
|
$ |
259 |
|
|
$ |
22 |
|
| ** |
See note 11 in the Notes to Financial Statements. |
|
|
|
|
|
|
|
| See Accompanying Notes |
|
DECEMBER 31, 2011 |
|
ANNUAL REPORT |
|
11 |
Consolidated Schedule of Investments PIMCO EqS Pathfinder Portfolio™
|
|
|
|
|
|
|
|
|
|
|
|
|
| |
|
|
|
SHARES |
|
|
|
|
MARKET VALUE (000S) |
|
| COMMON STOCKS 86.6% |
|
|
|
| BERMUDA 6.1% |
|
|
|
| ENERGY 2.7% |
|
| North
Atlantic Drilling Ltd. |
|
|
|
|
3,077,543 |
|
|
$ |
|
|
4,760 |
|
| Seadrill
Ltd. |
|
|
|
|
223,835 |
|
|
|
|
|
7,464 |
|
|
|
|
|
|
|
|
|
|
|
|
|
|
|
|
|
|
|
|
|
|
|
|
|
12,224 |
|
|
|
|
|
|
|
|
|
|
|
|
|
|
|
|
| FINANCIALS 3.4% |
|
| Hiscox
Ltd. |
|
|
|
|
1,011,892 |
|
|
|
|
|
5,860 |
|
| Lancashire
Holdings Ltd. |
|
|
|
|
834,820 |
|
|
|
|
|
9,397 |
|
|
|
|
|
|
|
|
|
|
|
|
|
|
|
|
|
|
|
|
|
|
|
|
|
15,257 |
|
|
|
|
|
|
|
|
|
|
|
|
|
|
| Total Bermuda |
|
|
|
|
|
|
|
|
|
|
27,481 |
|
|
|
|
|
|
|
|
|
|
|
|
|
|
|
|
| BRAZIL 1.0% |
|
|
|
| FINANCIALS 1.0% |
|
| Itau
Unibanco Holding S.A. SP - ADR |
|
|
|
|
256,175 |
|
|
|
|
|
4,755 |
|
|
|
|
|
|
|
|
|
|
|
|
|
|
| Total Brazil |
|
|
|
|
|
|
|
|
|
|
4,755 |
|
|
|
|
|
|
|
|
|
|
|
|
|
|
|
|
| CANADA 1.5% |
|
|
|
| MATERIALS 1.5% |
|
| Cameco
Corp. |
|
|
|
|
154,112 |
|
|
|
|
|
2,782 |
|
| Kinross Gold
Corp. |
|
|
|
|
168,579 |
|
|
|
|
|
1,922 |
|
| Silver
Wheaton Corp. |
|
|
|
|
75,557 |
|
|
|
|
|
2,188 |
|
|
|
|
|
|
|
|
|
|
|
|
|
|
|
|
|
|
|
|
|
|
|
|
|
6,892 |
|
|
|
|
|
|
|
|
|
|
|
|
|
|
| Total Canada |
|
|
|
|
|
|
|
|
|
|
6,892 |
|
|
|
|
|
|
|
|
|
|
|
|
|
|
|
|
| DENMARK 2.0% |
|
|
|
| CONSUMER STAPLES 1.5% |
|
| Carlsberg
A/S |
|
|
|
|
99,326 |
|
|
|
|
|
6,994 |
|
|
|
|
|
|
|
|
|
|
|
|
|
|
|
|
| FINANCIALS 0.5% |
|
| Jyske Bank
A/S (a) |
|
|
|
|
83,722 |
|
|
|
|
|
2,052 |
|
|
|
|
|
|
|
|
|
|
|
|
|
|
| Total Denmark |
|
|
|
|
|
|
|
|
|
|
9,046 |
|
|
|
|
|
|
|
|
|
|
|
|
|
|
|
|
| FAEROE ISLANDS 0.4% |
|
|
|
| CONSUMER STAPLES 0.3% |
|
| Bakkafrost
P/F |
|
|
|
|
199,159 |
|
|
|
|
|
1,219 |
|
|
|
|
|
|
|
|
|
|
|
|
|
|
|
|
| FINANCIALS 0.1% |
|
| BankNordik
P/F |
|
|
|
|
52,480 |
|
|
|
|
|
731 |
|
|
|
|
|
|
|
|
|
|
|
|
|
|
| Total Faeroe Islands |
|
|
|
|
|
|
|
|
|
|
1,950 |
|
|
|
|
|
|
|
|
|
|
|
|
|
|
|
|
| FRANCE 10.0% |
|
|
|
| CONSUMER DISCRETIONARY 3.0% |
|
| Eutelsat
Communications S.A. |
|
|
|
|
156,431 |
|
|
|
|
|
6,093 |
|
| JCDecaux
S.A. (a) |
|
|
|
|
109,825 |
|
|
|
|
|
2,521 |
|
|
Teleperformance
S.A. |
|
|
|
|
216,278 |
|
|
|
|
|
4,805 |
|
|
|
|
|
|
|
|
|
|
|
|
|
|
|
|
|
|
|
|
|
|
|
|
|
13,419 |
|
|
|
|
|
|
|
|
|
|
|
|
|
|
|
|
| CONSUMER STAPLES 6.5% |
|
| Carrefour
S.A. |
|
|
|
|
341,156 |
|
|
|
|
|
7,762 |
|
|
Danone |
|
|
|
|
182,633 |
|
|
|
|
|
11,461 |
|
| L’Oreal
S.A. |
|
|
|
|
21,550 |
|
|
|
|
|
2,244 |
|
|
|
|
|
|
|
|
|
|
|
|
|
|
| |
|
|
|
SHARES |
|
|
|
|
MARKET VALUE (000S) |
|
|
Pernod-Ricard
S.A. |
|
|
|
|
86,614 |
|
|
$ |
|
|
8,017 |
|
|
|
|
|
|
|
|
|
|
|
|
|
|
|
|
|
|
|
|
|
|
|
|
|
29,484 |
|
|
|
|
|
|
|
|
|
|
|
|
|
|
|
|
| ENERGY 0.5% |
|
| Bourbon
S.A. |
|
|
|
|
83,881 |
|
|
|
|
|
2,297 |
|
|
|
|
|
|
|
|
|
|
|
|
|
|
| Total France |
|
|
|
|
|
|
|
|
|
|
45,200 |
|
|
|
|
|
|
|
|
|
|
|
|
|
|
|
|
| GERMANY 1.4% |
|
|
|
| HEALTH CARE 0.5% |
|
| Rhoen
Klinikum AG |
|
|
|
|
110,904 |
|
|
|
|
|
2,111 |
|
|
|
|
|
|
|
|
|
|
|
|
|
|
|
|
| INDUSTRIALS 0.3% |
|
|
Kloeckner & Co.
SE |
|
|
|
|
93,597 |
|
|
|
|
|
1,198 |
|
|
|
|
|
|
|
|
|
|
|
|
|
|
|
|
| UTILITIES 0.6% |
|
| E.ON
AG |
|
|
|
|
130,509 |
|
|
|
|
|
2,812 |
|
|
|
|
|
|
|
|
|
|
|
|
|
|
| Total Germany |
|
|
|
|
|
|
|
|
|
|
6,121 |
|
|
|
|
|
|
|
|
|
|
|
|
|
|
|
|
| GUERNSEY, CHANNEL ISLANDS 0.9% |
|
|
|
| FINANCIALS 0.9% |
|
| Resolution
Ltd. |
|
|
|
|
1,085,376 |
|
|
|
|
|
4,231 |
|
|
|
|
|
|
|
|
|
|
|
|
|
|
| Total Guernsey, Channel Islands |
|
|
|
|
|
|
|
|
|
|
4,231 |
|
|
|
|
|
|
|
|
|
|
|
|
|
|
|
|
| HONG KONG 3.0% |
|
|
|
| CONSUMER DISCRETIONARY 0.4% |
|
| Television
Broadcasts Ltd. |
|
|
|
|
286,000 |
|
|
|
|
|
1,732 |
|
|
|
|
|
|
|
|
|
|
|
|
|
|
|
|
| FINANCIALS 2.3% |
|
| AIA Group
Ltd. |
|
|
|
|
2,518,400 |
|
|
|
|
|
7,840 |
|
| First
Pacific Co. Ltd. |
|
|
|
|
2,526,000 |
|
|
|
|
|
2,627 |
|
|
|
|
|
|
|
|
|
|
|
|
|
|
|
|
|
|
|
|
|
|
|
|
|
10,467 |
|
|
|
|
|
|
|
|
|
|
|
|
|
|
|
|
| INDUSTRIALS 0.3% |
|
| Jardine
Matheson Holdings Ltd. |
|
|
|
|
20,300 |
|
|
|
|
|
954 |
|
| Jardine
Strategic Holdings Ltd. |
|
|
|
|
23,700 |
|
|
|
|
|
655 |
|
|
|
|
|
|
|
|
|
|
|
|
|
|
|
|
|
|
|
|
|
|
|
|
|
1,609 |
|
|
|
|
|
|
|
|
|
|
|
|
|
|
| Total Hong Kong |
|
|
|
|
|
|
|
|
|
|
13,808 |
|
|
|
|
|
|
|
|
|
|
|
|
|
|
|
|
| ISRAEL 0.6% |
|
|
|
| HEALTH CARE 0.6% |
|
| Teva
Pharmaceutical Industries Ltd. SP - ADR |
|
|
|
|
68,846 |
|
|
|
|
|
2,779 |
|
|
|
|
|
|
|
|
|
|
|
|
|
|
| Total Israel |
|
|
|
|
|
|
|
|
|
|
2,779 |
|
|
|
|
|
|
|
|
|
|
|
|
|
|
|
|
| JAPAN 1.5% |
|
|
|
| INFORMATION TECHNOLOGY 1.5% |
|
| Nintendo Co.
Ltd. |
|
|
|
|
48,717 |
|
|
|
|
|
6,688 |
|
|
|
|
|
|
|
|
|
|
|
|
|
|
| Total Japan |
|
|
|
|
|
|
|
|
|
|
6,688 |
|
|
|
|
|
|
|
|
|
|
|
|
|
|
|
|
| NETHERLANDS 5.8% |
|
|
|
| CONSUMER STAPLES 1.2% |
|
|
CSM |
|
|
|
|
359,506 |
|
|
|
|
|
5,588 |
|
|
|
|
|
|
|
|
|
|
|
|
|
|
|
|
|
|
|
|
|
|
|
|
|
|
|
|
|
| |
|
|
|
SHARES |
|
|
|
|
MARKET VALUE (000S) |
|
| ENERGY 0.9% |
|
| Royal Dutch
Shell PLC ‘A’ |
|
|
|
|
105,104 |
|
|
$ |
|
|
3,856 |
|
|
|
|
|
|
|
|
|
|
|
|
|
|
|
|
| FINANCIALS 1.3% |
|
| ING Groep NV
- Dutch Certificate (a) |
|
|
|
|
827,071 |
|
|
|
|
|
5,915 |
|
|
|
|
|
|
|
|
|
|
|
|
|
|
|
|
| INFORMATION TECHNOLOGY 0.5% |
|
| Gemalto
NV |
|
|
|
|
49,524 |
|
|
|
|
|
2,400 |
|
|
|
|
|
|
|
|
|
|
|
|
|
|
|
|
| TELECOMMUNICATION SERVICES 1.9% |
|
| Koninklijke
KPN NV |
|
|
|
|
698,996 |
|
|
|
|
|
8,344 |
|
|
|
|
|
|
|
|
|
|
|
|
|
|
| Total Netherlands |
|
|
|
|
|
|
|
|
|
|
26,103 |
|
|
|
|
|
|
|
|
|
|
|
|
|
|
|
|
| NORWAY 1.5% |
|
|
|
| CONSUMER STAPLES 0.9% |
|
| Marine
Harvest ASA |
|
|
|
|
9,741,864 |
|
|
|
|
|
4,201 |
|
|
|
|
|
|
|
|
|
|
|
|
|
|
|
|
| INDUSTRIALS 0.6% |
|
| Orkla
ASA |
|
|
|
|
322,316 |
|
|
|
|
|
2,400 |
|
|
|
|
|
|
|
|
|
|
|
|
|
|
| Total Norway |
|
|
|
|
|
|
|
|
|
|
6,601 |
|
|
|
|
|
|
|
|
|
|
|
|
|
|
|
|
| SINGAPORE 0.7% |
|
|
|
| FINANCIALS 0.0% |
|
| Great
Eastern Holdings Ltd. |
|
|
|
|
1,160 |
|
|
|
|
|
11 |
|
|
|
|
|
|
|
|
|
|
|
|
|
|
|
|
| INDUSTRIALS 0.7% |
|
| Keppel Corp.
Ltd. |
|
|
|
|
452,700 |
|
|
|
|
|
3,241 |
|
|
|
|
|
|
|
|
|
|
|
|
|
|
| Total Singapore |
|
|
|
|
|
|
|
|
|
|
3,252 |
|
|
|
|
|
|
|
|
|
|
|
|
|
|
|
|
| SOUTH AFRICA 0.9% |
|
|
|
| MATERIALS 0.9% |
|
| AngloGold
Ashanti Ltd. SP - ADR |
|
|
|
|
99,032 |
|
|
|
|
|
4,204 |
|
|
|
|
|
|
|
|
|
|
|
|
|
|
| Total South Africa |
|
|
|
|
|
|
|
|
|
|
4,204 |
|
|
|
|
|
|
|
|
|
|
|
|
|
|
|
|
| SOUTH KOREA 0.5% |
|
|
|
| CONSUMER DISCRETIONARY 0.5% |
|
| GS Home
Shopping, Inc. |
|
|
|
|
21,083 |
|
|
|
|
|
2,126 |
|
|
|
|
|
|
|
|
|
|
|
|
|
|
| Total South Korea |
|
|
|
|
|
|
|
|
|
|
2,126 |
|
|
|
|
|
|
|
|
|
|
|
|
|
|
|
|
| SPAIN 0.3% |
|
|
|
| CONSUMER STAPLES 0.3% |
|
|
Distribuidora Internacional de
Alimentacion S.A. (a) |
|
|
|
|
270,409 |
|
|
|
|
|
1,217 |
|
|
|
|
|
|
|
|
|
|
|
|
|
|
| Total Spain |
|
|
|
|
|
|
|
|
|
|
1,217 |
|
|
|
|
|
|
|
|
|
|
|
|
|
|
|
|
| SWEDEN 1.0% |
|
|
|
| CONSUMER DISCRETIONARY 1.0% |
|
| Loomis
AB |
|
|
|
|
315,094 |
|
|
|
|
|
4,527 |
|
|
|
|
|
|
|
|
|
|
|
|
|
|
| Total Sweden |
|
|
|
|
|
|
|
|
|
|
4,527 |
|
|
|
|
|
|
|
|
|
|
|
|
|
|
|
|
| SWITZERLAND 4.1% |
|
|
|
| CONSUMER STAPLES 1.3% |
|
| Nestle
S.A. |
|
|
|
|
105,866 |
|
|
|
|
|
6,079 |
|
|
|
|
|
|
|
|
|
|
|
|
|
|
|
|
|
|
|
|
|
|
|
|
|
| 12 |
|
PIMCO EQUITY SERIES VIT |
|
|
|
|
See Accompanying Notes |
|
December 31, 2011
|
|
|
|
|
|
|
|
|
|
|
|
|
| |
|
|
|
SHARES |
|
|
|
|
MARKET VALUE (000S) |
|
| HEALTH CARE 1.7% |
|
| Novartis
AG |
|
|
|
|
18,590 |
|
|
$ |
|
|
1,061 |
|
| Roche
Holding AG |
|
|
|
|
39,184 |
|
|
|
|
|
6,627 |
|
|
|
|
|
|
|
|
|
|
|
|
|
|
|
|
|
|
|
|
|
|
|
|
|
7,688 |
|
|
|
|
|
|
|
|
|
|
|
|
|
|
|
|
| INDUSTRIALS 0.7% |
|
| Schindler
Holding AG |
|
|
|
|
25,635 |
|
|
|
|
|
2,971 |
|
|
|
|
|
|
|
|
|
|
|
|
|
|
|
|
| MATERIALS 0.4% |
|
| Sika
AG |
|
|
|
|
1,086 |
|
|
|
|
|
2,042 |
|
|
|
|
|
|
|
|
|
|
|
|
|
|
| Total Switzerland |
|
|
|
|
|
|
|
|
|
|
18,780 |
|
|
|
|
|
|
|
|
|
|
|
|
|
|
|
|
| UNITED KINGDOM 11.9% |
|
|
|
| CONSUMER DISCRETIONARY 0.5% |
|
| British Sky
Broadcasting Group PLC |
|
|
|
|
187,957 |
|
|
|
|
|
2,138 |
|
|
|
|
|
|
|
|
|
|
|
|
|
|
|
|
| CONSUMER STAPLES 7.3% |
|
| British
American Tobacco PLC |
|
|
|
|
281,362 |
|
|
|
|
|
13,348 |
|
| Imperial
Tobacco Group PLC |
|
|
|
|
409,244 |
|
|
|
|
|
15,486 |
|
| Reckitt
Benckiser Group PLC |
|
|
|
|
87,011 |
|
|
|
|
|
4,291 |
|
|
|
|
|
|
|
|
|
|
|
|
|
|
|
|
|
|
|
|
|
|
|
|
|
33,125 |
|
|
|
|
|
|
|
|
|
|
|
|
|
|
|
|
| ENERGY 2.6% |
|
| BP
PLC |
|
|
|
|
1,205,905 |
|
|
|
|
|
8,590 |
|
| Ensco PLC SP
- ADR |
|
|
|
|
70,876 |
|
|
|
|
|
3,326 |
|
|
|
|
|
|
|
|
|
|
|
|
|
|
|
|
|
|
|
|
|
|
|
|
|
11,916 |
|
|
|
|
|
|
|
|
|
|
|
|
|
|
|
|
| FINANCIALS 1.5% |
|
| Barclays
PLC |
|
|
|
|
960,761 |
|
|
|
|
|
2,631 |
|
| Lloyds
Banking Group PLC (a) |
|
|
|
|
10,987,550 |
|
|
|
|
|
4,414 |
|
|
|
|
|
|
|
|
|
|
|
|
|
|
|
|
|
|
|
|
|
|
|
|
|
7,045 |
|
|
|
|
|
|
|
|
|
|
|
|
|
|
| Total United Kingdom |
|
|
|
|
|
54,224 |
|
|
|
|
|
|
|
|
|
|
|
|
|
|
|
|
| UNITED STATES 31.5% |
|
|
|
| CONSUMER STAPLES 7.7% |
|
| Altria
Group, Inc. |
|
|
|
|
202,101 |
|
|
|
|
|
5,992 |
|
| CVS Caremark
Corp. |
|
|
|
|
198,833 |
|
|
|
|
|
8,109 |
|
| Lorillard,
Inc. |
|
|
|
|
82,773 |
|
|
|
|
|
9,436 |
|
| Philip
Morris International, Inc. |
|
|
|
|
60,515 |
|
|
|
|
|
4,749 |
|
| Reynolds
American, Inc. |
|
|
|
|
100,007 |
|
|
|
|
|
4,142 |
|
| Wal-Mart
Stores, Inc. |
|
|
|
|
40,407 |
|
|
|
|
|
2,415 |
|
|
|
|
|
|
|
|
|
|
|
|
|
|
|
|
|
|
|
|
|
|
|
|
|
34,843 |
|
|
|
|
|
|
|
|
|
|
|
|
|
|
|
|
| FINANCIALS 9.4% |
|
| Alleghany
Corp. (a) |
|
|
|
|
11,995 |
|
|
|
|
|
3,422 |
|
| BankUnited,
Inc. |
|
|
|
|
253,745 |
|
|
|
|
|
5,580 |
|
| Berkshire
Hathaway, Inc. ‘B’ (a) |
|
|
|
|
107,753 |
|
|
|
|
|
8,221 |
|
|
|
|
|
|
|
|
|
|
|
|
|
|
| |
|
|
|
SHARES |
|
|
|
|
MARKET VALUE (000S) |
|
| Capitol
Federal Financial, Inc. |
|
|
|
|
81,325 |
|
|
$ |
|
|
938 |
|
| CBOE
Holdings, Inc. |
|
|
|
|
183,408 |
|
|
|
|
|
4,743 |
|
| Northwest
Bancshares, Inc. |
|
|
|
|
241,285 |
|
|
|
|
|
3,001 |
|
| NYSE
Euronext |
|
|
|
|
85,024 |
|
|
|
|
|
2,219 |
|
| SLM
Corp. |
|
|
|
|
256,693 |
|
|
|
|
|
3,440 |
|
| TFS
Financial Corp. (a) |
|
|
|
|
249,854 |
|
|
|
|
|
2,239 |
|
|
Transatlantic Holdings,
Inc. |
|
|
|
|
5,074 |
|
|
|
|
|
278 |
|
| ViewPoint
Financial Group |
|
|
|
|
148,867 |
|
|
|
|
|
1,937 |
|
| Washington
Federal, Inc. |
|
|
|
|
180,338 |
|
|
|
|
|
2,523 |
|
| White
Mountains Insurance Group Ltd. |
|
|
|
|
9,290 |
|
|
|
|
|
4,213 |
|
|
|
|
|
|
|
|
|
|
|
|
|
|
|
|
|
|
|
|
|
|
|
|
|
42,754 |
|
|
|
|
|
|
|
|
|
|
|
|
|
|
|
|
| HEALTH CARE 3.8% |
|
| Medco Health
Solutions, Inc. (a) |
|
|
|
|
93,828 |
|
|
|
|
|
5,245 |
|
| Pfizer,
Inc. |
|
|
|
|
328,655 |
|
|
|
|
|
7,112 |
|
| PharMerica
Corp. (a) |
|
|
|
|
45,993 |
|
|
|
|
|
698 |
|
| Synthes,
Inc. |
|
|
|
|
24,573 |
|
|
|
|
|
4,113 |
|
|
|
|
|
|
|
|
|
|
|
|
|
|
|
|
|
|
|
|
|
|
|
|
|
17,168 |
|
|
|
|
|
|
|
|
|
|
|
|
|
|
|
|
| INDUSTRIALS 4.2% |
|
| 3M
Co. |
|
|
|
|
81,802 |
|
|
|
|
|
6,686 |
|
|
Deere &
Co. |
|
|
|
|
58,707 |
|
|
|
|
|
4,541 |
|
| General
Dynamics Corp. |
|
|
|
|
36,870 |
|
|
|
|
|
2,449 |
|
| Goodrich
Corp. |
|
|
|
|
43,447 |
|
|
|
|
|
5,374 |
|
|
|
|
|
|
|
|
|
|
|
|
|
|
|
|
|
|
|
|
|
|
|
|
|
19,050 |
|
|
|
|
|
|
|
|
|
|
|
|
|
|
|
|
| INFORMATION TECHNOLOGY 6.4% |
|
| Dell, Inc.
(a) |
|
|
|
|
337,636 |
|
|
|
|
|
4,940 |
|
| Intel
Corp. |
|
|
|
|
410,262 |
|
|
|
|
|
9,949 |
|
| Microsoft
Corp. |
|
|
|
|
415,933 |
|
|
|
|
|
10,798 |
|
| Motorola
Mobility Holdings, Inc. (a) |
|
|
|
|
93,132 |
|
|
|
|
|
3,613 |
|
|
|
|
|
|
|
|
|
|
|
|
|
|
|
|
|
|
|
|
|
|
|
|
|
29,300 |
|
|
|
|
|
|
|
|
|
|
|
|
|
|
| Total United States |
|
|
|
|
|
|
|
|
|
|
143,115 |
|
|
|
|
|
|
|
|
|
|
|
|
|
|
| Total Common Stocks (Cost $381,237) |
|
|
393,100 |
|
|
|
|
|
|
|
|
|
|
|
|
|
|
|
|
| |
|
|
|
UNITS |
|
|
|
|
|
|
| EQUITY-LINKED SECURITIES 0.9% |
|
|
|
| FRANCE 0.9% |
|
|
|
| FINANCIALS 0.9% |
|
| Morgan
Stanley BV, Total S.A. - Exp. 07/19/2012 |
|
|
|
|
79,866 |
|
|
|
|
|
4,198 |
|
|
|
|
|
|
|
|
|
|
|
|
|
|
| Total Equity-Linked Securities (Cost $3,604) |
|
|
4,198 |
|
|
|
|
|
|
|
|
|
|
|
|
|
|
|
|
|
|
|
|
|
|
|
|
|
|
|
|
|
| |
|
|
|
SHARES |
|
|
|
|
MARKET VALUE (000S) |
|
| EXCHANGE-TRADED FUNDS 3.6% |
|
|
|
| UNITED STATES 3.6% |
|
| SPDR Gold Trust |
|
|
|
|
108,236 |
|
|
$ |
|
|
16,451 |
|
|
|
|
|
|
|
|
|
|
|
|
|
|
| Total Exchange-Traded Funds (Cost $18,933) |
|
|
16,451 |
|
|
|
|
|
|
|
|
|
|
|
|
|
|
|
|
| RIGHTS 0.1% |
|
|
|
| FRANCE 0.1% |
|
|
|
| HEALTH CARE 0.1% |
|
| Sanofi - Exp. 12/31/2020 |
|
|
|
|
310,070 |
|
|
|
|
|
372 |
|
|
|
|
|
|
|
|
|
|
|
|
|
|
| Total Rights (Cost $341) |
|
|
|
|
|
372 |
|
|
|
|
|
|
|
|
|
|
|
|
|
|
|
|
| |
|
|
|
PRINCIPAL
AMOUNT
(000S) |
|
|
|
|
|
|
| SHORT-TERM INSTRUMENTS 7.9% |
|
|
|
| REPURCHASE AGREEMENTS 0.1% |
|
|
State Street Bank and Trust
Co. |
|
|
|
|
| 0.010% due 01/03/2012 |
|
$ |
|
|
663 |
|
|
|
|
|
663 |
|
|
|
|
|
|
|
|
|
|
|
|
|
|
| (Dated 12/30/2011. Collateralized by Federal Home Loan Bank 0.230% due 08/28/2012 valued at $535 and Freddie Mac 5.500% due
08/20/2012 valued at $148. Repurchase proceeds are $663.) |
|
|
|
|
|
|
| U.S. TREASURY BILLS 0.2% |
|
| 0.038% due 05/31/2012 (d) |
|
|
590 |
|
|
|
|
|
590 |
|
|
|
|
|
|
|
|
|
|
|
|
|
|
|
|
| |
|
|
|
SHARES |
|
|
|
|
|
|
| PIMCO SHORT-TERM FLOATING NAV PORTFOLIO (b) 7.6% |
|
|
|
|
|
|
3,419,000 |
|
|
|
|
|
34,238 |
|
|
|
|
|
|
|
|
|
|
|
|
|
|
| Total Short-Term Instruments (Cost $35,490) |
|
|
35,491 |
|
|
|
|
|
|
|
|
|
|
|
|
|
|
|
|
| PURCHASED OPTIONS (g) 0.3% |
|
| (Cost $2,505) |
|
|
|
|
|
|
|
|
|
|
1,536 |
|
|
|
|
|
|
|
|
|
|
|
|
|
|
| Total Investments 99.4% (Cost $442,110) |
|
|
$ |
|
|
451,148 |
|
|
|
| Written Options (h) (0.1%) (Premiums $372) |
|
|
(233 |
) |
|
|
| Other Assets and Liabilities (Net) 0.7% |
|
|
3,175 |
|
|
|
|
|
|
|
|
|
|
|
|
|
|
| Net Assets 100.0% |
|
|
$ |
|
|
454,090 |
|
|
|
|
|
|
|
|
|
|
|
|
|
|
Notes to Schedule of Investments (amounts in thousands*, except number of contracts and shares):
| * |
A zero balance may reflect actual amounts rounding to less than one thousand. |
| (a) |
Non-income producing security. |
| (b) |
Affiliated to the Portfolio. |
| (c) |
Cash of $3,800 has been pledged as collateral for equity options as of December 31, 2011.
|
|
|
|
|
|
|
|
| See Accompanying Notes |
|
DECEMBER 31, 2011 |
|
ANNUAL REPORT |
|
13 |
Consolidated Schedule of Investments PIMCO EqS Pathfinder
Portfolio™
(Cont.)
| (d) |
Securities with an aggregate market value of $320 have been pledged as collateral as of December 31, 2011 for OTC
swap, swaption and foreign currency contracts as governed by International Swaps and Derivatives Association, Inc. Master Agreements. |
| (e) |
Cash of $7,609 has been pledged as collateral for securities sold short as of December 31, 2011.
|
| (f) |
OTC swap agreements outstanding on December 31, 2011: |
|
|
|
|
|
|
|
|
|
|
|
|
|
|
|
|
|
|
|
|
|
|
|
|
|
|
|
| Total Return Swaps on Securities |
|
|
|
|
|
|
|
|
|
Pay/Receive
Total Return on
Reference Entity |
|
Reference Entity |
|
# of Shares |
|
|
Financing Rate (1) |
|
Notional
Amount |
|
|
Maturity
Date |
|
|
Counterparty |
|
Unrealized
Appreciation/
(Depreciation) |
|
| Pay (2) |
|
Rio Tinto Ltd. |
|
|
23,832 |
|
|
3-Month USD-LIBOR less a specified spread |
|
|
AUD |
|
|
|
1,457 |
|
|
|
12/20/2012 |
|
|
CBK |
|
$ |
20 |
|
| Receive (2) |
|
Rio Tinto Ltd. |
|
|
30,597 |
|
|
3-Month USD-LIBOR plus a specified spread |
|
|
|
|
|
|
1,457 |
|
|
|
12/20/2012 |
|
|
CBK |
|
|
(15 |
) |
|
|
|
|
|
|
|
|
|
|
|
|
|
|
|
|
|
|
|
|
|
|
|
|
|
|
|
|
|
|
|
|
|
|
|
|
|
|
|
|
|
|
|
|
|
|
|
|
|
|
|
$ |
5 |
|
|
|
|
|
|
|
|
|
|
|
|
|
|
|
|
|
|
|
|
|
|
|
|
|
|
|
|
| (1) |
Financing rate is based upon predetermined notional amounts, which may be a multiple of the number of shares disclosed. |
| (2) |
At the maturity date, a net cash flow is exchanged where the total return is equivalent to the return of the reference entity less a financing rate, if any. As a
receiver, the Portfolio would receive payments based on any positive total return and would owe payments in the event of a negative total return. As the payer, the Portfolio would owe payments on any net positive total return, and would receive
payment in the event of a negative total return. |
| (g) |
Purchased options outstanding on December 31, 2011: |
|
|
|
|
|
|
|
|
|
|
|
|
|
|
|
|
|
|
|
|
|
| Options on Exchange-Traded Futures Contracts |
|
|
|
|
|
|
|
|
|
|
|
|
|
|
|
| Description |
|
Index
Value |
|
|
Expiration
Date |
|
|
# of
Contracts |
|
|
Cost |
|
|
Market
Value |
|
| Put - CBOT S&P 500 Index March Futures |
|
|
1,125.000 |
|
|
|
03/17/2012 |
|
|
|
105 |
|
|
$ |
389 |
|
|
$ |
192 |
|
|
|
|
|
|
|
|
|
|
|
|
|
|
|
|
|
|
|
|
|
|
|
|
|
|
|
|
|
|
|
|
|
|
|
|
|
|
|
|
|
|
|
|
|
|
|
|
|
|
|
|
|
| Foreign Currency Options |
|
|
|
|
|
|
|
|
|
|
|
|
|
|
|
|
|
|
|
|
|
|
|
| Description |
|
Counterparty |
|
Exercise
Price |
|
|
Expiration
Date |
|
|
Notional
Amount |
|
|
Cost |
|
|
Market
Value |
|
| Put - OTC EUR versus USD |
|
BPS |
|
$ |
|
|
|
|
1.200 |
|
|
|
03/13/2012 |
|
|
|
EUR |
|
|
|
13,600 |
|
|
$ |
166 |
|
|
$ |
115 |
|
| Put - OTC EUR versus USD |
|
BOA |
|
|
|
|
|
|
1.205 |
|
|
|
03/13/2012 |
|
|
|
|
|
|
|
500 |
|
|
|
10 |
|
|
|
4 |
|
| Put - OTC EUR versus USD |
|
BRC |
|
|
|
|
|
|
1.205 |
|
|
|
03/13/2012 |
|
|
|
|
|
|
|
16,500 |
|
|
|
244 |
|
|
|
150 |
|
| Put - OTC EUR versus USD |
|
MYI |
|
|
|
|
|
|
1.205 |
|
|
|
03/13/2012 |
|
|
|
|
|
|
|
10,585 |
|
|
|
138 |
|
|
|
96 |
|
|
|
|
|
|
|
|
|
|
|
|
|
|
|
|
|
|
|
|
|
|
|
|
|
|
|
|
|
|
|
|
|
|
|
|
|
|
|
|
|
|
|
|
|
|
|
|
|
|
|
|
|
|
|
|
$ |
558 |
|
|
$ |
365 |
|
|
|
|
|
|
|
|
|
|
|
|
|
|
|
|
|
|
|
|
|
|
|
|
|
|
|
|
|
|
|
|
|
|
|
|
|
|
|
|
|
|
|
|
|
|
|
|
|
|
|
|
|
| Options on Exchanged-Traded Funds |
|
|
|
|
|
|
|
|
|
|
|
|
|
|
|
| Description |
|
Strike
Price |
|
|
Expiration
Date |
|
|
# of
Contracts |
|
|
Cost |
|
|
Market
Value |
|
| Put - CBOE iShares MSCI EAFE Index Fund |
|
$ |
46.000 |
|
|
|
03/17/2012 |
|
|
|
2,930 |
|
|
$ |
700 |
|
|
$ |
425 |
|
| Put - CBOE iShares MSCI EAFE Index Fund |
|
|
48.000 |
|
|
|
03/17/2012 |
|
|
|
2,626 |
|
|
|
651 |
|
|
|
533 |
|
|
|
|
|
|
|
|
|
|
|
|
|
|
|
|
|
|
|
|
|
|
|
|
|
|
|
|
|
|
|
|
|
|
|
|
$ |
1,351 |
|
|
$ |
958 |
|
|
|
|
|
|
|
|
|
|
|
|
|
|
|
|
|
|
|
|
|
|
|
|
|
|
|
|
|
|
|
|
|
|
|
|
|
|
|
|
|
|
|
|
|
|
|
|
|
|
|
|
|
| Options on Securities |
|
|
|
|
|
|
|
|
|
|
|
|
|
|
|
|
|
|
|
|
|
|
|
| Description |
|
Counterparty |
|
Strike
Price |
|
|
Expiration
Date |
|
|
Shares |
|
|
Cost |
|
|
Market
Value |
|
| Put - OTC Johnson & Johnson, Inc. |
|
GSC |
|
|
CHF |
|
|
|
58.730 |
|
|
|
03/16/2012 |
|
|
|
CHF |
|
|
|
4,721 |
|
|
$ |
195 |
|
|
$ |
20 |
|
| Put - OTC Johnson & Johnson, Inc. |
|
FBF |
|
|
|
|
|
|
68.878 |
|
|
|
03/16/2012 |
|
|
|
|
|
|
|
113 |
|
|
|
12 |
|
|
|
1 |
|
|
|
|
|
|
|
|
|
|
|
|
|
|
|
|
|
|
|
|
|
|
|
|
|
|
|
|
|
|
|
|
|
|
|
|
|
|
|
|
|
|
|
|
|
|
|
|
|
|
|
|
|
|
|
|
$ |
207 |
|
|
$ |
21 |
|
|
|
|
|
|
|
|
|
|
|
|
|
|
|
|
|
|
|
|
|
|
|
|
|
|
|
|
|
|
|
|
| (h) |
Written options outstanding on December 31, 2011: |
|
|
|
|
|
|
|
|
|
|
|
|
|
|
|
|
|
|
|
|
|
| Options on Exchanged-Traded Funds |
|
|
|
|
|
|
|
|
|
|
|
|
|
|
|
| Description |
|
Strike
Price |
|
|
Expiration
Date |
|
|
# of
Contracts |
|
|
Premium |
|
|
Market
Value |
|
| Put - CBOE iShares MSCI EAFA Index Fund |
|
$ |
36.000 |
|
|
|
03/17/2012 |
|
|
|
2,930 |
|
|
$ |
227 |
|
|
$ |
(79 |
) |
|
|
|
|
|
|
|
|
|
|
|
|
|
|
|
|
|
|
|
|
|
Options on Securities
|
|
|
|
|
|
|
|
|
|
|
|
|
|
|
|
|
|
|
|
|
|
|
|
|
|
|
|
|
|
|
| Description |
|
Counterparty |
|
Strike
Price |
|
|
Expiration
Date |
|
|
Shares |
|
|
Premium |
|
|
Market
Value |
|
| Call - OTC Johnson & Johnson, Inc. |
|
FBF |
|
|
CHF |
|
|
|
67.610 |
|
|
|
03/16/2012 |
|
|
|
CHF |
|
|
|
42,015 |
|
|
$ |
145 |
|
|
$ |
(154 |
) |
|
|
|
|
|
|
|
|
|
|
|
|
|
|
|
|
|
|
|
|
|
|
|
|
|
|
|
|
|
|
|
|
|
|
|
|
|
|
|
|
| 14 |
|
PIMCO EQUITY SERIES VIT |
|
|
|
|
See Accompanying Notes |
|
December 31, 2011
Transactions in written call and put options for the period ended December 31, 2011:
|
|
|
|
|
|
|
|
|
|
|
|
|
|
|
|
|
|
|
|
|
| |
|
# of
Contracts |
|
|
Notional
Amount in CHF |
|
|
Notional
Amount in EUR |
|
|
Notional
Amount in GBP |
|
|
Premium |
|
| Balance at 12/31/2010 |
|
|
0 |
|
|
CHF |
1 |
|
|
EUR |
0 |
|
|
GBP |
0 |
|
|
$ |
0 |
|
| Sales |
|
|
48,066 |
|
|
|
0 |
|
|
|
4 |
|
|
|
14 |
|
|
|
778 |
|
| Closing Buys |
|
|
(2,789 |
) |
|
|
(1 |
) |
|
|
(3 |
) |
|
|
(14 |
) |
|
|
(335 |
) |
| Expirations |
|
|
0 |
|
|
|
0 |
|
|
|
0 |
|
|
|
0 |
|
|
|
0 |
|
| Exercised |
|
|
(332 |
) |
|
|
0 |
|
|
|
(1 |
) |
|
|
0 |
|
|
|
(71 |
) |
|
|
|
|
|
|
|
|
|
|
|
|
|
|
|
|
|
|
|
|
|
| Balance at 12/31/2011 |
|
|
44,945 |
|
|
CHF |
0 |
|
|
EUR |
0 |
|
|
GBP |
0 |
|
|
$ |
372 |
|
|
|
|
|
|
|
|
|
|
|
|
|
|
|
|
|
|
|
|
|
|
| (i) |
Short sales outstanding on December 31, 2011: |
|
|
|
|
|
|
|
|
|
|
|
|
|
| Description |
|
Shares |
|
|
Proceeds |
|
|
Market
Value |
|
| Deutsche Boerse AG |
|
|
39,960 |
|
|
$ |
2,274 |
|
|
$ |
(2,091 |
) |
| Express Scripts, Inc. |
|
|
76,001 |
|
|
|
3,125 |
|
|
|
(3,397 |
) |
| Temple-Inland, Inc. |
|
|
73,375 |
|
|
|
2,311 |
|
|
|
(2,327 |
) |
|
|
|
|
|
|
|
|
|
|
|
|
|
|
|
|
|
|
|
$ |
7,710 |
|
|
$ |
(7,815 |
) |
|
|
|
|
|
|
|
|
|
|
|
|
|
| (j) |
Foreign currency contracts outstanding on December 31, 2011: |
|
|
|
|
|
|
|
|
|
|
|
|
|
|
|
|
|
|
|
|
|
|
|
|
|
|
|
|
|
|
|
|
|
|
|
| Type |
|
Currency |
|
|
Principal
Amount
Covered
by Contract |
|
|
Settlement
Month |
|
|
Counterparty |
|
Unrealized
Appreciation |
|
|
Unrealized
(Depreciation) |
|
|
Net Unrealized
Appreciation/
(Depreciation) |
|
| Buy |
|
|
AUD |
|
|
|
4,972 |
|
|
|
01/2012 |
|
|
BRC |
|
$ |
128 |
|
|
$ |
0 |
|
|
$ |
128 |
|
| Buy |
|
|
|
|
|
|
4,972 |
|
|
|
01/2012 |
|
|
CBK |
|
|
133 |
|
|
|
0 |
|
|
|
133 |
|
| Buy |
|
|
|
|
|
|
4,972 |
|
|
|
01/2012 |
|
|
DUB |
|
|
133 |
|
|
|
0 |
|
|
|
133 |
|
| Sell |
|
|
|
|
|
|
4,972 |
|
|
|
01/2012 |
|
|
DUB |
|
|
0 |
|
|
|
(78 |
) |
|
|
(78 |
) |
| Sell |
|
|
|
|
|
|
4,972 |
|
|
|
01/2012 |
|
|
FBL |
|
|
0 |
|
|
|
(81 |
) |
|
|
(81 |
) |
| Sell |
|
|
|
|
|
|
4,972 |
|
|
|
01/2012 |
|
|
HUS |
|
|
0 |
|
|
|
(81 |
) |
|
|
(81 |
) |
| Buy |
|
|
|
|
|
|
4,972 |
|
|
|
02/2012 |
|
|
DUB |
|
|
78 |
|
|
|
0 |
|
|
|
78 |
|
| Buy |
|
|
|
|
|
|
4,972 |
|
|
|
02/2012 |
|
|
FBL |
|
|
81 |
|
|
|
0 |
|
|
|
81 |
|
| Buy |
|
|
|
|
|
|
4,972 |
|
|
|
02/2012 |
|
|
HUS |
|
|
81 |
|
|
|
0 |
|
|
|
81 |
|
| Buy |
|
|
BRL |
|
|
|
8,523 |
|
|
|
01/2012 |
|
|
HUS |
|
|
26 |
|
|
|
0 |
|
|
|
26 |
|
| Sell |
|
|
|
|
|
|
8,523 |
|
|
|
01/2012 |
|
|
HUS |
|
|
80 |
|
|
|
(98 |
) |
|
|
(18 |
) |
| Buy |
|
|
|
|
|
|
8,523 |
|
|
|
01/2012 |
|
|
UAG |
|
|
0 |
|
|
|
(189 |
) |
|
|
(189 |
) |
| Sell |
|
|
|
|
|
|
8,523 |
|
|
|
01/2012 |
|
|
UAG |
|
|
0 |
|
|
|
(26 |
) |
|
|
(26 |
) |
| Sell |
|
|
|
|
|
|
8,523 |
|
|
|
03/2012 |
|
|
UAG |
|
|
193 |
|
|
|
0 |
|
|
|
193 |
|
| Sell |
|
|
CAD |
|
|
|
10,440 |
|
|
|
01/2012 |
|
|
CBK |
|
|
0 |
|
|
|
(4 |
) |
|
|
(4 |
) |
| Sell |
|
|
|
|
|
|
10,440 |
|
|
|
01/2012 |
|
|
GST |
|
|
1 |
|
|
|
0 |
|
|
|
1 |
|
| Buy |
|
|
|
|
|
|
31,321 |
|
|
|
01/2012 |
|
|
RBC |
|
|
325 |
|
|
|
0 |
|
|
|
325 |
|
| Sell |
|
|
|
|
|
|
10,441 |
|
|
|
01/2012 |
|
|
UAG |
|
|
0 |
|
|
|
(2 |
) |
|
|
(2 |
) |
| Buy |
|
|
|
|
|
|
10,440 |
|
|
|
02/2012 |
|
|
CBK |
|
|
4 |
|
|
|
0 |
|
|
|
4 |
|
| Buy |
|
|
|
|
|
|
10,440 |
|
|
|
02/2012 |
|
|
GST |
|
|
0 |
|
|
|
(1 |
) |
|
|
(1 |
) |
| Buy |
|
|
|
|
|
|
10,441 |
|
|
|
02/2012 |
|
|
UAG |
|
|
2 |
|
|
|
0 |
|
|
|
2 |
|
| Buy |
|
|
CHF |
|
|
|
7,646 |
|
|
|
01/2012 |
|
|
BRC |
|
|
0 |
|
|
|
(48 |
) |
|
|
(48 |
) |
| Sell |
|
|
|
|
|
|
4,155 |
|
|
|
01/2012 |
|
|
BRC |
|
|
95 |
|
|
|
0 |
|
|
|
95 |
|
| Sell |
|
|
|
|
|
|
4,155 |
|
|
|
01/2012 |
|
|
DUB |
|
|
98 |
|
|
|
0 |
|
|
|
98 |
|
| Buy |
|
|
|
|
|
|
664 |
|
|
|
01/2012 |
|
|
JPM |
|
|
0 |
|
|
|
(11 |
) |
|
|
(11 |
) |
| Sell |
|
|
|
|
|
|
5,327 |
|
|
|
02/2012 |
|
|
BRC |
|
|
20 |
|
|
|
0 |
|
|
|
20 |
|
| Buy |
|
|
CNY |
|
|
|
63,451 |
|
|
|
02/2012 |
|
|
DUB |
|
|
66 |
|
|
|
0 |
|
|
|
66 |
|
| Buy |
|
|
|
|
|
|
21,742 |
|
|
|
02/2012 |
|
|
JPM |
|
|
22 |
|
|
|
0 |
|
|
|
22 |
|
| Buy |
|
|
DKK |
|
|
|
54,588 |
|
|
|
01/2012 |
|
|
BRC |
|
|
0 |
|
|
|
(90 |
) |
|
|
(90 |
) |
| Sell |
|
|
|
|
|
|
54,588 |
|
|
|
01/2012 |
|
|
BRC |
|
|
273 |
|
|
|
0 |
|
|
|
273 |
|
| Sell |
|
|
|
|
|
|
54,588 |
|
|
|
02/2012 |
|
|
BRC |
|
|
92 |
|
|
|
0 |
|
|
|
92 |
|
| Sell |
|
|
EUR |
|
|
|
182 |
|
|
|
01/2012 |
|
|
BRC |
|
|
6 |
|
|
|
0 |
|
|
|
6 |
|
| Sell |
|
|
|
|
|
|
23,165 |
|
|
|
01/2012 |
|
|
FBL |
|
|
965 |
|
|
|
0 |
|
|
|
965 |
|
| Buy |
|
|
|
|
|
|
30,103 |
|
|
|
01/2012 |
|
|
GST |
|
|
0 |
|
|
|
(534 |
) |
|
|
(534 |
) |
| Sell |
|
|
|
|
|
|
1,307 |
|
|
|
01/2012 |
|
|
JPM |
|
|
56 |
|
|
|
0 |
|
|
|
56 |
|
| Sell |
|
|
|
|
|
|
5,252 |
|
|
|
01/2012 |
|
|
RBC |
|
|
221 |
|
|
|
0 |
|
|
|
221 |
|
| Sell |
|
|
|
|
|
|
197 |
|
|
|
01/2012 |
|
|
UAG |
|
|
7 |
|
|
|
0 |
|
|
|
7 |
|
| Sell |
|
|
|
|
|
|
30,103 |
|
|
|
02/2012 |
|
|
GST |
|
|
536 |
|
|
|
0 |
|
|
|
536 |
|
| Buy |
|
|
GBP |
|
|
|
1,455 |
|
|
|
01/2012 |
|
|
BRC |
|
|
13 |
|
|
|
0 |
|
|
|
13 |
|
| Sell |
|
|
|
|
|
|
142 |
|
|
|
01/2012 |
|
|
BRC |
|
|
2 |
|
|
|
0 |
|
|
|
2 |
|
| Sell |
|
|
|
|
|
|
18 |
|
|
|
01/2012 |
|
|
CBK |
|
|
0 |
|
|
|
0 |
|
|
|
0 |
|
| Sell |
|
|
|
|
|
|
24,014 |
|
|
|
01/2012 |
|
|
DUB |
|
|
49 |
|
|
|
0 |
|
|
|
49 |
|
|
|
|
|
|
|
|
| See Accompanying Notes |
|
DECEMBER 31, 2011 |
|
ANNUAL REPORT |
|
15 |
Consolidated Schedule of Investments PIMCO EqS Pathfinder
Portfolio™
(Cont.)
|
|
|
|
|
|
|
|
|
|
|
|
|
|
|
|
|
|
|
|
|
|
|
|
|
|
|
|
|
|
|
|
|
|
|
| Type |
|
Currency |
|
|
Principal
Amount
Covered
by Contract |
|
|
Settlement
Month |
|
|
Counterparty |
|
Unrealized
Appreciation |
|
|
Unrealized
(Depreciation) |
|
|
Net Unrealized
Appreciation/
(Depreciation) |
|
| Sell |
|
|
GBP |
|
|
|
38 |
|
|
|
01/2012 |
|
|
GST |
|
$ |
0 |
|
|
$ |
0 |
|
|
$ |
0 |
|
| Buy |
|
|
|
|
|
|
1,244 |
|
|
|
01/2012 |
|
|
JPM |
|
|
0 |
|
|
|
(13 |
) |
|
|
(13 |
) |
| Sell |
|
|
|
|
|
|
209 |
|
|
|
01/2012 |
|
|
JPM |
|
|
1 |
|
|
|
0 |
|
|
|
1 |
|
| Buy |
|
|
|
|
|
|
21,754 |
|
|
|
01/2012 |
|
|
RBC |
|
|
0 |
|
|
|
(283 |
) |
|
|
(283 |
) |
| Sell |
|
|
|
|
|
|
32 |
|
|
|
01/2012 |
|
|
UAG |
|
|
0 |
|
|
|
0 |
|
|
|
0 |
|
| Sell |
|
|
|
|
|
|
21,754 |
|
|
|
02/2012 |
|
|
RBC |
|
|
283 |
|
|
|
0 |
|
|
|
283 |
|
| Sell |
|
|
HKD |
|
|
|
24,752 |
|
|
|
02/2012 |
|
|
UAG |
|
|
0 |
|
|
|
(9 |
) |
|
|
(9 |
) |
| Buy |
|
|
JPY |
|
|
|
2,842,754 |
|
|
|
01/2012 |
|
|
UAG |
|
|
0 |
|
|
|
(90 |
) |
|
|
(90 |
) |
| Sell |
|
|
|
|
|
|
2,842,754 |
|
|
|
01/2012 |
|
|
UAG |
|
|
0 |
|
|
|
(338 |
) |
|
|
(338 |
) |
| Buy |
|
|
|
|
|
|
2,842,754 |
|
|
|
02/2012 |
|
|
UAG |
|
|
335 |
|
|
|
0 |
|
|
|
335 |
|
| Buy |
|
|
KRW |
|
|
|
5,351,710 |
|
|
|
02/2012 |
|
|
CBK |
|
|
0 |
|
|
|
(190 |
) |
|
|
(190 |
) |
| Sell |
|
|
|
|
|
|
2,349,864 |
|
|
|
02/2012 |
|
|
DUB |
|
|
54 |
|
|
|
0 |
|
|
|
54 |
|
| Sell |
|
|
NOK |
|
|
|
28,116 |
|
|
|
01/2012 |
|
|
FBL |
|
|
62 |
|
|
|
0 |
|
|
|
62 |
|
| Buy |
|
|
|
|
|
|
27,289 |
|
|
|
01/2012 |
|
|
GST |
|
|
0 |
|
|
|
(24 |
) |
|
|
(24 |
) |
| Sell |
|
|
|
|
|
|
28,117 |
|
|
|
01/2012 |
|
|
GST |
|
|
63 |
|
|
|
0 |
|
|
|
63 |
|
| Buy |
|
|
|
|
|
|
27,289 |
|
|
|
01/2012 |
|
|
HUS |
|
|
0 |
|
|
|
(22 |
) |
|
|
(22 |
) |
| Buy |
|
|
|
|
|
|
2,482 |
|
|
|
01/2012 |
|
|
JPM |
|
|
0 |
|
|
|
(16 |
) |
|
|
(16 |
) |
| Buy |
|
|
|
|
|
|
27,289 |
|
|
|
01/2012 |
|
|
MSC |
|
|
0 |
|
|
|
(25 |
) |
|
|
(25 |
) |
| Sell |
|
|
|
|
|
|
28,116 |
|
|
|
01/2012 |
|
|
UAG |
|
|
99 |
|
|
|
0 |
|
|
|
99 |
|
| Sell |
|
|
|
|
|
|
27,289 |
|
|
|
02/2012 |
|
|
GST |
|
|
24 |
|
|
|
0 |
|
|
|
24 |
|
| Sell |
|
|
|
|
|
|
27,289 |
|
|
|
02/2012 |
|
|
HUS |
|
|
22 |
|
|
|
0 |
|
|
|
22 |
|
| Buy |
|
|
|
|
|
|
1,737 |
|
|
|
02/2012 |
|
|
MSC |
|
|
3 |
|
|
|
0 |
|
|
|
3 |
|
| Sell |
|
|
|
|
|
|
27,289 |
|
|
|
02/2012 |
|
|
MSC |
|
|
24 |
|
|
|
0 |
|
|
|
24 |
|
| Buy |
|
|
NZD |
|
|
|
97 |
|
|
|
01/2012 |
|
|
CBK |
|
|
2 |
|
|
|
0 |
|
|
|
2 |
|
| Sell |
|
|
|
|
|
|
97 |
|
|
|
01/2012 |
|
|
CBK |
|
|
0 |
|
|
|
(1 |
) |
|
|
(1 |
) |
| Buy |
|
|
|
|
|
|
96 |
|
|
|
01/2012 |
|
|
DUB |
|
|
2 |
|
|
|
0 |
|
|
|
2 |
|
| Sell |
|
|
|
|
|
|
97 |
|
|
|
01/2012 |
|
|
FBL |
|
|
0 |
|
|
|
(1 |
) |
|
|
(1 |
) |
| Buy |
|
|
|
|
|
|
97 |
|
|
|
01/2012 |
|
|
HUS |
|
|
2 |
|
|
|
0 |
|
|
|
2 |
|
| Sell |
|
|
|
|
|
|
97 |
|
|
|
01/2012 |
|
|
HUS |
|
|
0 |
|
|
|
(1 |
) |
|
|
(1 |
) |
| Buy |
|
|
|
|
|
|
97 |
|
|
|
02/2012 |
|
|
CBK |
|
|
1 |
|
|
|
0 |
|
|
|
1 |
|
| Buy |
|
|
|
|
|
|
97 |
|
|
|
02/2012 |
|
|
FBL |
|
|
1 |
|
|
|
0 |
|
|
|
1 |
|
| Buy |
|
|
|
|
|
|
97 |
|
|
|
02/2012 |
|
|
HUS |
|
|
1 |
|
|
|
0 |
|
|
|
1 |
|
| Sell |
|
|
PLN |
|
|
|
17 |
|
|
|
02/2012 |
|
|
CBK |
|
|
1 |
|
|
|
0 |
|
|
|
1 |
|
| Sell |
|
|
SEK |
|
|
|
14,276 |
|
|
|
01/2012 |
|
|
BRC |
|
|
2 |
|
|
|
0 |
|
|
|
2 |
|
| Buy |
|
|
|
|
|
|
14,276 |
|
|
|
01/2012 |
|
|
DUB |
|
|
7 |
|
|
|
0 |
|
|
|
7 |
|
| Buy |
|
|
|
|
|
|
14,276 |
|
|
|
02/2012 |
|
|
BRC |
|
|
0 |
|
|
|
(3 |
) |
|
|
(3 |
) |
| Buy |
|
|
SGD |
|
|
|
572 |
|
|
|
02/2012 |
|
|
JPM |
|
|
2 |
|
|
|
0 |
|
|
|
2 |
|
| Sell |
|
|
ZAR |
|
|
|
12,645 |
|
|
|
01/2012 |
|
|
CBK |
|
|
39 |
|
|
|
0 |
|
|
|
39 |
|
| Sell |
|
|
|
|
|
|
499 |
|
|
|
01/2012 |
|
|
HUS |
|
|
2 |
|
|
|
0 |
|
|
|
2 |
|
| Sell |
|
|
|
|
|
|
21,992 |
|
|
|
01/2012 |
|
|
JPM |
|
|
45 |
|
|
|
0 |
|
|
|
45 |
|
|
|
|
|
|
|
|
|
|
|
|
|
|
|
|
|
|
|
|
|
|
|
|
|
|
|
|
|
|
|
|
|
|
|
|
|
|
|
|
|
|
|
|
$ |
4,863 |
|
|
$ |
(2,259 |
) |
|
$ |
2,604 |
|
|
|
|
|
|
|
|
|
|
|
|
|
|
|
|
|
|
|
|
|
|
|
|
|
|
|
|
| (k) |
Fair Value
Measurements (1) |
The following is a summary of the fair valuations according to the inputs used as of December 31, 2011 in valuing the Portfolio’s
assets and liabilities (2):
|
|
|
|
|
|
|
|
|
|
|
|
|
|
|
|
|
| Category and Subcategory (3) |
|
Level 1 (4) |
|
|
Level 2 (5) |
|
|
Level 3 (6) |
|
|
Fair
Value at
12/31/2011 |
|
| Investments, at
value |
|
|
|
|
|
|
|
|
|
|
|
|
|
|
|
|
| Common Stocks |
|
|
|
|
|
|
|
|
|
|
|
|
|
|
|
|
| Bermuda |
|
|
|
|
|
|
|
|
|
|
|
|
|
|
|
|
| Energy |
|
$ |
4,760 |
|
|
$ |
7,464 |
|
|
$ |
0 |
|
|
$ |
12,224 |
|
| Financials |
|
|
0 |
|
|
|
15,257 |
|
|
|
0 |
|
|
|
15,257 |
|
| Brazil |
|
|
|
|
|
|
|
|
|
|
|
|
|
|
|
|
| Financials |
|
|
4,755 |
|
|
|
0 |
|
|
|
0 |
|
|
|
4,755 |
|
| Canada |
|
|
|
|
|
|
|
|
|
|
|
|
|
|
|
|
| Materials |
|
|
6,892 |
|
|
|
0 |
|
|
|
0 |
|
|
|
6,892 |
|
| Denmark |
|
|
|
|
|
|
|
|
|
|
|
|
|
|
|
|
| Consumer Staples |
|
|
0 |
|
|
|
6,994 |
|
|
|
0 |
|
|
|
6,994 |
|
| Financials |
|
|
0 |
|
|
|
2,052 |
|
|
|
0 |
|
|
|
2,052 |
|
| Faeroe Islands |
|
|
|
|
|
|
|
|
|
|
|
|
|
|
|
|
| Consumer Staples |
|
|
1,219 |
|
|
|
0 |
|
|
|
0 |
|
|
|
1,219 |
|
| Financials |
|
|
731 |
|
|
|
0 |
|
|
|
0 |
|
|
|
731 |
|
| France |
|
|
|
|
|
|
|
|
|
|
|
|
|
|
|
|
| Consumer Discretionary |
|
|
0 |
|
|
|
13,419 |
|
|
|
0 |
|
|
|
13,419 |
|
|
|
|
|
|
|
|
|
|
|
|
|
|
|
|
|
|
| Category and Subcategory (3) |
|
Level 1 (4) |
|
|
Level 2 (5) |
|
|
Level 3 (6) |
|
|
Fair
Value at
12/31/2011 |
|
| Consumer Staples |
|
$ |
0 |
|
|
$ |
29,484 |
|
|
$ |
0 |
|
|
$ |
29,484 |
|
| Energy |
|
|
0 |
|
|
|
2,297 |
|
|
|
0 |
|
|
|
2,297 |
|
| Germany |
|
|
|
|
|
|
|
|
|
|
|
|
|
|
|
|
| Health Care |
|
|
0 |
|
|
|
2,111 |
|
|
|
0 |
|
|
|
2,111 |
|
| Industrials |
|
|
0 |
|
|
|
1,198 |
|
|
|
0 |
|
|
|
1,198 |
|
| Utilities |
|
|
0 |
|
|
|
2,812 |
|
|
|
0 |
|
|
|
2,812 |
|
| Guernsey, Channel Islands |
|
|
|
|
|
|
|
|
|
|
|
|
|
|
|
|
| Financials |
|
|
0 |
|
|
|
4,231 |
|
|
|
0 |
|
|
|
4,231 |
|
| Hong Kong |
|
|
|
|
|
|
|
|
|
|
|
|
|
|
|
|
| Consumer Discretionary |
|
|
0 |
|
|
|
1,732 |
|
|
|
0 |
|
|
|
1,732 |
|
| Financials |
|
|
0 |
|
|
|
10,467 |
|
|
|
0 |
|
|
|
10,467 |
|
| Industrials |
|
|
0 |
|
|
|
1,609 |
|
|
|
0 |
|
|
|
1,609 |
|
| Israel |
|
|
|
|
|
|
|
|
|
|
|
|
|
|
|
|
| Health Care |
|
|
2,779 |
|
|
|
0 |
|
|
|
0 |
|
|
|
2,779 |
|
| Japan |
|
|
|
|
|
|
|
|
|
|
|
|
|
|
|
|
| Information Technology |
|
|
0 |
|
|
|
6,688 |
|
|
|
0 |
|
|
|
6,688 |
|
|
|
|
|
|
|
|
|
|
| 16 |
|
PIMCO EQUITY SERIES VIT |
|
|
|
|
See Accompanying Notes |
|
December 31, 2011
|
|
|
|
|
|
|
|
|
|
|
|
|
|
|
|
|
| Category and Subcategory (3) |
|
Level 1 (4) |
|
|
Level 2 (5) |
|
|
Level 3 (6) |
|
|
Fair
Value at
12/31/2011 |
|
| Netherlands |
|
|
|
|
|
|
|
|
|
|
|
|
|
|
|
|
| Consumer Staples |
|
$ |
0 |
|
|
$ |
5,588 |
|
|
$ |
0 |
|
|
$ |
5,588 |
|
| Energy |
|
|
0 |
|
|
|
3,856 |
|
|
|
0 |
|
|
|
3,856 |
|
| Financials |
|
|
0 |
|
|
|
5,915 |
|
|
|
0 |
|
|
|
5,915 |
|
| Information Technology |
|
|
0 |
|
|
|
2,400 |
|
|
|
0 |
|
|
|
2,400 |
|
| Telecommunication Services |
|
|
0 |
|
|
|
8,344 |
|
|
|
0 |
|
|
|
8,344 |
|
| Norway |
|
|
|
|
|
|
|
|
|
|
|
|
|
|
|
|
| Consumer Staples |
|
|
0 |
|
|
|
4,201 |
|
|
|
0 |
|
|
|
4,201 |
|
| Industrials |
|
|
0 |
|
|
|
2,400 |
|
|
|
0 |
|
|
|
2,400 |
|
| Singapore |
|
|
|
|
|
|
|
|
|
|
|
|
|
|
|
|
| Financials |
|
|
0 |
|
|
|
11 |
|
|
|
0 |
|
|
|
11 |
|
| Industrials |
|
|
0 |
|
|
|
3,241 |
|
|
|
0 |
|
|
|
3,241 |
|
| South Africa |
|
|
|
|
|
|
|
|
|
|
|
|
|
|
|
|
| Materials |
|
|
4,204 |
|
|
|
0 |
|
|
|
0 |
|
|
|
4,204 |
|
| South Korea |
|
|
|
|
|
|
|
|
|
|
|
|
|
|
|
|
| Consumer Discretionary |
|
|
0 |
|
|
|
2,126 |
|
|
|
0 |
|
|
|
2,126 |
|
| Spain |
|
|
|
|
|
|
|
|
|
|
|
|
|
|
|
|
| Consumer Staples |
|
|
0 |
|
|
|
1,217 |
|
|
|
0 |
|
|
|
1,217 |
|
| Sweden |
|
|
|
|
|
|
|
|
|
|
|
|
|
|
|
|
| Consumer Discretionary |
|
|
0 |
|
|
|
4,527 |
|
|
|
0 |
|
|
|
4,527 |
|
| Switzerland |
|
|
|
|
|
|
|
|
|
|
|
|
|
|
|
|
| Consumer Staples |
|
|
0 |
|
|
|
6,079 |
|
|
|
0 |
|
|
|
6,079 |
|
| Health Care |
|
|
0 |
|
|
|
7,688 |
|
|
|
0 |
|
|
|
7,688 |
|
| Industrials |
|
|
0 |
|
|
|
2,971 |
|
|
|
0 |
|
|
|
2,971 |
|
| Materials |
|
|
0 |
|
|
|
2,042 |
|
|
|
0 |
|
|
|
2,042 |
|
| United Kingdom |
|
|
|
|
|
|
|
|
|
|
|
|
|
|
|
|
| Consumer Discretionary |
|
|
0 |
|
|
|
2,138 |
|
|
|
0 |
|
|
|
2,138 |
|
| Consumer Staples |
|
|
0 |
|
|
|
33,125 |
|
|
|
0 |
|
|
|
33,125 |
|
| Energy |
|
|
3,326 |
|
|
|
8,590 |
|
|
|
0 |
|
|
|
11,916 |
|
| Financials |
|
|
0 |
|
|
|
7,045 |
|
|
|
0 |
|
|
|
7,045 |
|
| United States |
|
|
|
|
|
|
|
|
|
|
|
|
|
|
|
|
| Consumer Staples |
|
|
34,843 |
|
|
|
0 |
|
|
|
0 |
|
|
|
34,843 |
|
| Financials |
|
|
42,754 |
|
|
|
0 |
|
|
|
0 |
|
|
|
42,754 |
|
| Health Care |
|
|
13,055 |
|
|
|
4,113 |
|
|
|
0 |
|
|
|
17,168 |
|
|
|
|
|
|
|
|
|
|
|
|
|
|
|
|
|
|
| Category and Subcategory (3) |
|
Level 1 (4) |
|
|
Level 2 (5) |
|
|
Level 3 (6) |
|
|
Fair
Value at
12/31/2011 |
|
| Industrials |
|
$ |
19,050 |
|
|
$ |
0 |
|
|
$ |
0 |
|
|
$ |
19,050 |
|
| Information Technology |
|
|
29,300 |
|
|
|
0 |
|
|
|
0 |
|
|
|
29,300 |
|
| Equity-Linked Securities |
|
|
|
|
|
|
|
|
|
|
|
|
|
|
|
|
| France |
|
|
0 |
|
|
|
4,198 |
|
|
|
0 |
|
|
|
4,198 |
|
| Exchange-Traded Funds |
|
|
|
|
|
|
|
|
|
|
|
|
|
|
|
|
| United States |
|
|
16,451 |
|
|
|
0 |
|
|
|
0 |
|
|
|
16,451 |
|
| Rights |
|
|
|
|
|
|
|
|
|
|
|
|
|
|
|
|
| France |
|
|
|
|
|
|
|
|
|
|
|
|
|
|
|
|
| Health Care |
|
|
372 |
|
|
|
0 |
|
|
|
0 |
|
|
|
372 |
|
| Short-Term Instruments |
|
|
|
|
|
|
|
|
|
|
|
|
|
|
|
|
| Repurchase Agreements |
|
|
0 |
|
|
|
663 |
|
|
|
0 |
|
|
|
663 |
|
| U.S. Treasury Bills |
|
|
0 |
|
|
|
590 |
|
|
|
0 |
|
|
|
590 |
|
| PIMCO Short-Term Floating NAV Portfolio |
|
|
34,238 |
|
|
|
0 |
|
|
|
0 |
|
|
|
34,238 |
|
| Purchased Options |
|
|
|
|
|
|
|
|
|
|
|
|
|
|
|
|
| Equity Contracts |
|
|
1,150 |
|
|
|
0 |
|
|
|
21 |
|
|
|
1,171 |
|
| Foreign Exchange Contracts |
|
|
0 |
|
|
|
365 |
|
|
|
0 |
|
|
|
365 |
|
|
|
$ |
219,879 |
|
|
$ |
231,248 |
|
|
$ |
21 |
|
|
$ |
451,148 |
|
|
|
|
|
|
| Short Sales, at
value |
|
$ |
(5,724 |
) |
|
$ |
(2,091 |
) |
|
$ |
0 |
|
|
$ |
(7,815 |
) |
|
|
Financial Derivative
Instruments (7) - Assets |
|
| Equity Contracts |
|
|
0 |
|
|
|
20 |
|
|
|
0 |
|
|
|
20 |
|
| Foreign Exchange Contracts |
|
|
0 |
|
|
|
4,863 |
|
|
|
0 |
|
|
|
4,863 |
|
|
|
$ |
0 |
|
|
$ |
4,883 |
|
|
$ |
0 |
|
|
$ |
4,883 |
|
|
|
Financial Derivative Instruments (7) - Liabilities |
|
| Equity Contracts |
|
|
(79 |
) |
|
|
(15 |
) |
|
|
(154 |
) |
|
|
(248 |
) |
| Foreign Exchange Contracts |
|
|
0 |
|
|
|
(2,259 |
) |
|
|
0 |
|
|
|
(2,259 |
) |
|
|
$ |
(79 |
) |
|
$ |
(2,274 |
) |
|
$ |
(154 |
) |
|
$ |
(2,507 |
) |
|
|
|
|
|
| Totals |
|
$ |
214,076 |
|
|
$ |
231,766 |
|
|
$ |
(133 |
) |
|
$ |
445,709 |
|
The following is a reconciliation of
the fair valuations using significant unobservable inputs (Level 3) for the Portfolio during the period ended December 31, 2011:
|
|
|
|
|
|
|
|
|
|
|
|
|
|
|
|
|
|
|
|
|
|
|
|
|
|
|
|
|
|
|
|
|
|
|
|
|
|
|
|
|
| Category and Subcategory (3) |
|
Beginning
Balance
at
12/31/2010 |
|
|
Net
Purchases (8) |
|
|
Net
Sales (8) |
|
|
Accrued
Discounts/
(Premiums) |
|
|
Realized
Gain/(Loss) |
|
|
Net Change in
Unrealized
Appreciation/
(Depreciation) (9) |
|
|
Transfers
into
Level 3 |
|
|
Transfers
out
of Level 3 |
|
|
Ending
Balance
at
12/31/2011 |
|
|
Net Change in
Unrealized
Appreciation/
(Depreciation)
on
Investments
Held at
12/31/2011 (9) |
|
| Investments, at
value |
|
|
|
|
|
|
|
|
|
|
|
|
|
|
|
|
|
|
|
|
|
|
|
|
|
|
|
|
|
|
|
|
|
|
|
|
|
|
|
|
| Purchased Options |
|
|
|
|
|
|
|
|
|
|
|
|
|
|
|
|
|
|
|
|
|
|
|
|
|
|
|
|
|
|
|
|
|
|
|
|
|
|
|
|
| Equity Contracts |
|
$ |
0 |
|
|
$ |
207 |
|
|
$ |
0 |
|
|
$ |
0 |
|
|
$ |
0 |
|
|
$ |
(186 |
) |
|
$ |
0 |
|
|
$ |
0 |
|
|
$ |
21 |
|
|
$ |
(186 |
) |
|
|
|
|
|
|
|
|
|
|
|
|
|
|
|
|
|
|
|
|
|
|
|
|
|
|
|
|
|
|
|
|
|
|
|
|
|
|
|
|
|
|
|
|
Financial Derivative
Instruments (7) - Assets |
|
|
|
|
|
| Equity Contracts |
|
$ |
0 |
|
|
$ |
0 |
|
|
$ |
(146 |
) |
|
$ |
0 |
|
|
$ |
0 |
|
|
$ |
(8 |
) |
|
$ |
0 |
|
|
$ |
0 |
|
|
$ |
(154 |
) |
|
$ |
(8 |
) |
|
|
|
|
|
|
|
|
|
|
|
|
|
|
|
|
|
|
|
|
|
|
|
|
|
|
|
|
|
|
|
|
|
|
|
|
|
|
|
|
|
| Totals |
|
$ |
0 |
|
|
$ |
207 |
|
|
$ |
(146 |
) |
|
$ |
0 |
|
|
$ |
0 |
|
|
$ |
(194 |
) |
|
$ |
0 |
|
|
$ |
0 |
|
|
$ |
(133 |
) |
|
$ |
(194 |
) |
|
|
|
|
|
|
|
|
|
|
|
|
|
|
|
|
|
|
|
|
|
|
|
|
|
|
|
|
|
|
|
|
|
|
|
|
|
|
|
|
|
| (1) |
See note 3 in the Notes to Financial Statements for more information regarding pricing inputs and valuation techniques. |
| (2) |
There were no significant transfers into or out of level 1, 2, and 3 during the period ended December 31, 2011. |
| (3) |
Refer to the Schedule of Investments for additional information. |
| (4) |
Quoted prices in active markets for identical investments. |
| (5) |
Significant other observable inputs. |
| (6) |
Significant unobservable inputs. |
| (7) |
Financial Derivative Instruments may include open futures contracts, swap agreements, written options, and foreign currency contracts.
|
| (8) |
Net Purchases and Sales for Financial Derivative Instruments may include payments made or received upon entering into swap agreements to compensate for
differences between the stated terms of the swap agreement and prevailing market conditions. |
| (9) |
Any difference between Net Change in Unrealized Appreciation/(Depreciation) and Net Change in Unrealized Appreciation/(Depreciation) on Investments Held at
12/31/2011 may be due to an investment no longer held or categorized as level 3 at period end. |
|
|
|
|
|
|
|
| See Accompanying Notes |
|
DECEMBER 31, 2011 |
|
ANNUAL REPORT |
|
17 |
Consolidated Schedule of Investments PIMCO EqS Pathfinder
Portfolio™
(Cont.)
December 31, 2011
| (l) |
Fair Value of Financial Derivative Instruments (1) |
The following is a summary of the fair valuation of the Portfolio’s derivative instruments categorized by risk exposure:
Fair Values of Financial Derivative Instruments on the Statement of Assets and
Liabilities as of December 31, 2011:
|
|
|
|
|
|
|
|
|
|
|
|
|
|
|
|
|
|
|
|
|
|
|
|
|
| |
|
Derivatives not accounted for as hedging instruments |
|
| |
|
Commodity
Contracts |
|
|
Credit
Contracts |
|
|
Equity
Contracts |
|
|
Foreign
Exchange
Contracts |
|
|
Interest
Rate Contracts |
|
|
Total |
|
|
Assets: |
|
|
|
|
|
|
|
|
|
|
|
|
|
|
|
|
|
|
|
|
|
|
|
|
| Investments, at value (purchased options) |
|
$ |
0 |
|
|
$ |
0 |
|
|
$ |
1,171 |
|
|
$ |
365 |
|
|
$ |
0 |
|
|
$ |
1,536 |
|
| Unrealized appreciation on foreign currency contracts |
|
|
0 |
|
|
|
0 |
|
|
|
0 |
|
|
|
4,863 |
|
|
|
0 |
|
|
|
4,863 |
|
| Unrealized appreciation on OTC swap agreements |
|
|
0 |
|
|
|
0 |
|
|
|
20 |
|
|
|
0 |
|
|
|
0 |
|
|
|
20 |
|
|
|
|
|
|
|
|
|
|
|
|
|
|
|
|
|
|
|
|
|
|
|
|
|
|
|
|
$ |
0 |
|
|
$ |
0 |
|
|
$ |
1,191 |
|
|
$ |
5,228 |
|
|
$ |
0 |
|
|
$ |
6,419 |
|
|
|
|
|
|
|
|
|
|
|
|
|
|
|
|
|
|
|
|
|
|
|
|
|
|
|
|
|
|
|
|
|
|
Liabilities:
|
|
|
|
|
|
|
|
|
|
|
|
|
|
|
|
|
|
|
|
|
|
|
|
|
| Written options outstanding |
|
$ |
0 |
|
|
$ |
0 |
|
|
$ |
233 |
|
|
$ |
0 |
|
|
$ |
0 |
|
|
$ |
233 |
|
| Unrealized depreciation on foreign currency contracts |
|
|
0 |
|
|
|
0 |
|
|
|
0 |
|
|
|
2,259 |
|
|
|
0 |
|
|
|
2,259 |
|
| Unrealized depreciation on OTC swap agreements |
|
|
0 |
|
|
|
0 |
|
|
|
15 |
|
|
|
0 |
|
|
|
0 |
|
|
|
15 |
|
|
|
|
|
|
|
|
|
|
|
|
|
|
|
|
|
|
|
|
|
|
|
|
|
|
|
|
$ |
0 |
|
|
$ |
0 |
|
|
$ |
248 |
|
|
$ |
2,259 |
|
|
$ |
0 |
|
|
$ |
2,507 |
|
|
|
|
|
|
|
|
|
|
|
|
|
|
|
|
|
|
|
|
|
|
|
|
|
|
The Effect of Financial Derivative Instruments on
the Statement of Operations for the Period Ended December 31, 2011:
|
|
|
|
|
|
|
|
|
|
|
|
|
|
|
|
|
|
|
|
|
|
|
|
|
| |
|
Derivatives not accounted for as hedging instruments |
|
| |
|
Commodity
Contracts |
|
|
Credit
Contracts |
|
|
Equity
Contracts |
|
|
Foreign
Exchange
Contracts |
|
|
Interest
Rate Contracts |
|
|
Total |
|
| Realized Gain
(Loss) on Derivatives Recognized as a Result from Operations: |
|
|
|
|
|
|
|
|
|
|
|
|
|
|
|
|
|
|
|
|
|
|
|
|
| Net realized (loss) on investments (purchased options) |
|
$ |
0 |
|
|
$ |
0 |
|
|
$ |
(1,730 |
) |
|
$ |
0 |
|
|
$ |
(545 |
) |
|
$ |
(2,275 |
) |
| Net realized gain on futures contracts, written options and swaps |
|
|
0 |
|
|
|
0 |
|
|
|
255 |
|
|
|
0 |
|
|
|
0 |
|
|
|
255 |
|
| Net realized (loss) on foreign currency transactions |
|
|
0 |
|
|
|
0 |
|
|
|
0 |
|
|
|
(576 |
) |
|
|
0 |
|
|
|
(576 |
) |
|
|
|
|
|
|
|
|
|
|
|
|
|
|
|
|
|
|
|
|
|
|
|
|
|
|
|
$ |
0 |
|
|
$ |
0 |
|
|
$ |
(1,475 |
) |
|
$ |
(576 |
) |
|
$ |
(545 |
) |
|
$ |
(2,596 |
) |
|
|
|
|
|
|
|
|
|
|
|
|
|
|
|
|
|
|
|
|
|
|
|
|
|
|
|
|
|
|
|
|
| Net Change in
Unrealized Appreciation (Depreciation) on Derivatives Recognized as a Result of Operations: |
|
|
|
|
|
|
|
|
|
|
|
|
|
|
|
|
|
|
|
|
|
|
|
|
| Net change in unrealized (depreciation) on investments (purchased options) |
|
$ |
0 |
|
|
$ |
0 |
|
|
$ |
(776 |
) |
|
$ |
(193 |
) |
|
$ |
0 |
|
|
$ |
(969 |
) |
| Net change in unrealized appreciation on futures contracts, written options and swaps |
|
|
0 |
|
|
|
0 |
|
|
|
144 |
|
|
|
0 |
|
|
|
0 |
|
|
|
144 |
|
| Net change in unrealized appreciation on translation of assets and liabilities denominated in foreign currencies |
|
|
0 |
|
|
|
0 |
|
|
|
0 |
|
|
|
2,602 |
|
|
|
0 |
|
|
|
2,602 |
|
|
|
|
|
|
|
|
|
|
|
|
|
|
|
|
|
|
|
|
|
|
|
|
|
|
|
|
$ |
0 |
|
|
$ |
0 |
|
|
$ |
(632 |
) |
|
$ |
2,409 |
|
|
$ |
0 |
|
|
$ |
1,777 |
|
|
|
|
|
|
|
|
|
|
|
|
|
|
|
|
|
|
|
|
|
|
|
|
|
|
| (1) |
See note 5 in the Notes to Financial Statements for additional information.
|
| (m) |
Collateral (Received)/Pledged for OTC Financial Derivative Instruments |
The following is a summary by counterparty of the market value of OTC financial
derivative instruments and collateral (received)/pledged as of December 31, 2011:
|
|
|
|
|
|
|
|
|
|
|
|
|
|
|
|
|
|
|
|
|
|
|
|
|
|
|
|
|
| Counterparty |
|
|
|
Total Market
Value of OTC
Derivatives |
|
|
Collateral
(Received)/Pledged |
|
|
Net Exposures (1) |
|
|
|
|
Total Market
Value of OTC
Derivatives |
|
|
Collateral
(Received)/Pledged |
|
|
Net Exposures (1) |
|
| |
|
|
|
PIMCO EqS Pathfinder
PortfolioTM |
|
|
|
|
PIMCO Cayman Commodity Portfolio III Ltd. (Subsidiary) |
|
| BOA |
|
|
|
$ |
4 |
|
|
$ |
0 |
|
|
$ |
4 |
|
|
|
|
$ |
0 |
|
|
$ |
0 |
|
|
$ |
0 |
|
| BPS |
|
|
|
|
115 |
|
|
|
0 |
|
|
|
115 |
|
|
|
|
|
0 |
|
|
|
0 |
|
|
|
0 |
|
| BRC |
|
|
|
|
640 |
|
|
|
(590 |
) |
|
|
50 |
|
|
|
|
|
0 |
|
|
|
0 |
|
|
|
0 |
|
| CBK |
|
|
|
|
(10 |
) |
|
|
0 |
|
|
|
(10 |
) |
|
|
|
|
0 |
|
|
|
0 |
|
|
|
0 |
|
| DUB |
|
|
|
|
409 |
|
|
|
(480 |
) |
|
|
(71 |
) |
|
|
|
|
0 |
|
|
|
0 |
|
|
|
0 |
|
| FBF |
|
|
|
|
(153 |
) |
|
|
0 |
|
|
|
(153 |
) |
|
|
|
|
0 |
|
|
|
0 |
|
|
|
0 |
|
| FBL |
|
|
|
|
1,027 |
|
|
|
(1,050 |
) |
|
|
(23 |
) |
|
|
|
|
0 |
|
|
|
0 |
|
|
|
0 |
|
| GSC |
|
|
|
|
20 |
|
|
|
0 |
|
|
|
20 |
|
|
|
|
|
0 |
|
|
|
0 |
|
|
|
0 |
|
| GST |
|
|
|
|
65 |
|
|
|
0 |
|
|
|
65 |
|
|
|
|
|
0 |
|
|
|
0 |
|
|
|
0 |
|
| HUS |
|
|
|
|
12 |
|
|
|
0 |
|
|
|
12 |
|
|
|
|
|
0 |
|
|
|
0 |
|
|
|
0 |
|
| JPM |
|
|
|
|
86 |
|
|
|
(290 |
) |
|
|
(204 |
) |
|
|
|
|
0 |
|
|
|
0 |
|
|
|
0 |
|
| MSC |
|
|
|
|
2 |
|
|
|
(150 |
) |
|
|
(148 |
) |
|
|
|
|
0 |
|
|
|
0 |
|
|
|
0 |
|
| MYI |
|
|
|
|
96 |
|
|
|
(890 |
) |
|
|
(794 |
) |
|
|
|
|
0 |
|
|
|
0 |
|
|
|
0 |
|
| RBC |
|
|
|
|
546 |
|
|
|
(380 |
) |
|
|
166 |
|
|
|
|
|
0 |
|
|
|
0 |
|
|
|
0 |
|
| UAG |
|
|
|
|
(18 |
) |
|
|
320 |
|
|
|
302 |
|
|
|
|
|
0 |
|
|
|
0 |
|
|
|
0 |
|
| (1) |
Net Exposure represents the net receivable/(payable) that would be due from/to the counterparty in the event of default. Exposure from OTC derivatives can only
be netted across transactions governed under the same Master Agreement with the same legal entity. The Portfolio and subsidiary are recognized as two separate legal entities. As such, exposure cannot be netted. See note 6 Principal Risks in the
Notes to Financial Statements for more information regarding Credit and Counterparties Risk. |
|
|
|
|
|
|
|
|
|
| 18 |
|
PIMCO EQUITY SERIES VIT |
|
|
|
|
See Accompanying Notes |
|
Notes to Financial Statements
December 31, 2011
1. ORGANIZATION
The PIMCO EqS Pathfinder PortfolioTM (the “Portfolio”) is a series of the PIMCO Equity Series VIT (the
“Trust”). The Trust is registered under the Investment Company Act of 1940, as amended (the “Act”), as an open-end management investment company organized as a Delaware statutory trust on December 28, 2009. The Portfolio
currently offers two classes of shares: Institutional and Advisor. Information presented on these financial statements pertains to the Institutional Class of the Portfolio. Certain detailed financial information for the Advisor Class is provided
separately and is available upon request. The Trust is designed to be used as an investment vehicle by separate accounts of insurance companies that fund variable annuity contracts and variable life insurance policies and by qualified pension and
retirement plans.
2. SIGNIFICANT ACCOUNTING POLICIES
The following is a summary of significant accounting policies
consistently followed by the Portfolio in the preparation of its financial statements in conformity with accounting principles generally accepted in the United States of America (“U.S. GAAP”). The preparation of financial statements in
accordance with U.S. GAAP may require management to make estimates and assumptions that affect the reported amounts of assets and liabilities and disclosure of contingent assets and liabilities at the date of the financial statements and the
reported amounts of increases and decreases in net assets from operations during the reporting period. Actual results could differ from those estimates.
(a) Determination of Net Asset Value The Net Asset
Value (“NAV”) of the Portfolio’s shares is valued as of the close of regular trading (normally 4:00 p.m., Eastern time) (the “NYSE Close”) on each day that the New York Stock Exchange (“NYSE”) is open.
Information that becomes known to the Portfolio or its agents after the NAV has been calculated on a particular day will not generally be used to retroactively adjust the price of a security or the NAV determined earlier that day.
(b) Securities Transactions and
Investment Income Securities transactions are recorded as of the trade date for financial reporting purposes. Realized gains and losses from securities sold are recorded on the
identified cost basis. Dividend income is recorded on the ex-dividend date, except certain dividends from foreign securities where the ex-dividend date may have passed, which are recorded as soon as the Portfolio is informed of the ex-dividend date.
Interest income, adjusted for the accretion of discounts and amortization of premiums, is recorded on the accrual basis from settlement date. Estimated tax liabilities on certain foreign securities are recorded on an accrual basis and are reflected
as components of interest income or a net change in unrealized gain/loss on investments on the Consolidated Statement of Operations, as appropriate. Tax liabilities realized as a result of such security sales are reflected as a component of net
realized gain/loss on investments on the Consolidated Statement of Operations. Income or short-term capital gain distributions received from underlying funds are recorded as dividend income. Long-term capital gain distributions received from
underlying funds are recorded as realized gains.
(c) Foreign Currency Translation Portfolio securities and other assets and liabilities denominated in foreign currencies are translated into U.S.
dollars based on the exchange rate of such currencies against U.S. dollars on the date of valuation. Purchases and sales of securities, income and expense items denominated in foreign currencies are translated into U.S. dollars at the exchange rate
in effect on the transaction date.
The Portfolio does not separately report
the effect of changes in foreign exchange rates from changes in market prices on securities held. Such changes are included in net realized and unrealized gain or loss from investments on the Consolidated Statement of Operations.
Realized foreign exchange gains or losses arise from sales of foreign currencies,
currency gains or losses realized between the trade and settlement dates on securities transactions and the difference between the recorded amounts of
dividend, interest, and foreign withholding taxes and the U.S. dollar equivalent of the amounts actually received or paid. Net unrealized foreign exchange gains and losses arise from changes in
foreign exchange rates on foreign denominated assets and liabilities other than investments in securities held at the end of the reporting period.
(d) Multiclass Operations Each class offered by
the Portfolio has equal rights as to assets and voting privileges (except that shareholders of a class have exclusive voting rights regarding any matter relating solely to that class of shares). Income and non-class specific expenses are allocated
daily to each class on the basis of the relative net assets. Realized and unrealized capital gains and losses of each class are allocated daily based on the relative net assets of each class of the Portfolio. Class specific expenses, where
applicable, currently include supervisory and administrative and distribution and servicing fees.
(e) Dividends and Distributions to Shareholders Dividends from net investment income, if any, are
declared and distributed to shareholders annually. Net realized capital gains earned by the Portfolio, if any, will be distributed no less frequently than once each year.
Income dividends and capital gain distributions are determined in accordance with
income tax regulations which may differ from U.S. GAAP. Differences between tax regulations and U.S. GAAP may change the fiscal year when income and capital items are recognized for tax and U.S. GAAP purposes. Examples of events that give rise to
timing differences include wash sales and capital loss carryforwards. Further, the character of investment income and capital gains may be different for certain transactions under the two methods of accounting. Examples of characterization
differences include the treatment of swaps, foreign currency transactions and investments in passive foreign investment companies. As a result, income dividends and capital gain distributions declared during a fiscal period may differ significantly
from the net investment income and realized capital gain reported on the Portfolio’s annual financial statements presented under U.S. GAAP.
Distributions classified as a tax basis return of capital, if any, are reflected on the accompanying Consolidated Statements of Changes in Net Assets and have been
reclassified to paid in capital. In addition, other amounts have been reclassified between undistributed net investment income, accumulated undistributed net realized gains or losses and/or paid in capital to more appropriately conform financial
accounting to tax characterizations of dividend distributions.
(f) New Accounting Pronouncements In April 2011, the Financial Accounting Standards Board (“FASB”) issued an Accounting Standards Update
(“ASU”) related to the accounting for repurchase agreements and similar agreements that both entitle and obligate a transferor to repurchase or redeem financial assets before their maturity. The ASU modifies the criteria for determining
effective control of transferred assets and as a result certain agreements may now be accounted for as secured borrowings. The ASU is effective prospectively for new transfers and existing transactions that are modified in the first interim or
annual period beginning on or after December 15, 2011. Management anticipates the Portfolio may incur additional borrowing expenses (interest expense) as a result of the change of accounting treatment. The magnitude of this change has not been
determined at this time.
In May 2011, FASB issued an ASU to develop common
requirements for measuring fair value and for disclosing information about fair value measurements in accordance with U.S. GAAP and International Financial Reporting Standards (“IFRS”). FASB concluded that the amendments in this ASU will
improve the comparability of fair value measurements presented and disclosed in financial statements prepared in accordance with U.S. GAAP and IFRS. The ASU is effective prospectively during interim or annual periods beginning on or after
December 15, 2011. At this time, management is evaluating the implications of these changes and their impact on the financial statements have not been determined.
|
|
|
|
|
|
|
|
|
DECEMBER 31, 2011 |
|
ANNUAL REPORT |
|
19 |
Notes to Financial Statements (Cont.)
3. INVESTMENT VALUATION
AND FAIR VALUE MEASUREMENTS
For purposes of calculating the NAV,
portfolio securities and other assets for which market quotes are readily available are valued at fair market value. Fair market value is generally determined on the basis of last reported sales prices, or if no sales are reported, based on quotes
obtained from a quotation reporting system, established market makers, or pricing services.
Investments initially valued in currencies other than the U.S. dollar are converted to the U.S. dollar using exchange rates obtained from pricing service providers. As a result, the NAV of the Portfolio’s
shares may be affected by changes in the value of currencies in relation to the U.S. dollar. The value of securities traded in markets outside the United States or denominated in currencies other than the U.S. dollar may be affected significantly on
a day that the NYSE is closed and the NAV may change on days when an investor is not able to purchase, redeem or exchange shares.
U.S. GAAP defines fair market value as the price that the Portfolio would receive to sell an asset or pay to transfer a liability in an orderly transaction between
market participants at the measurement date. It establishes a fair value hierarchy that prioritizes inputs to valuation methods and requires disclosure of the fair value hierarchy, separately for each major category of assets and liabilities, that
segregates fair value measurements into levels (Level 1, 2, and 3). The inputs or methodology used for valuing securities are not necessarily an indication of the risk associated with investing in those securities. Levels 1, 2, and 3 of the
fair value hierarchy are defined as follows:
| |
• |
|
Level 1—Inputs using quoted prices in active markets or exchanges for identical assets and liabilities. |
| |
• |
|
Level 2—Significant other observable inputs, which may include, but are not limited to, quoted prices for similar assets or liabilities in markets that are
active, quoted prices for identical or similar assets or liabilities in markets that are not active, inputs other than quoted prices that are observable for the assets or liabilities (such as interest rates, yield curves, volatilities, prepayment
speeds, loss severities, credit risks and default rates) or other market corroborated inputs. |
| |
• |
|
Level 3—Significant unobservable inputs based on the best information available in the circumstances, to the extent observable inputs are not available,
which may include assumptions made by the Board of Trustees (the “Board”) or persons acting at their direction that are used in determining the fair market value of investments. |
Level 1 and Level 2 trading assets
and trading liabilities, at fair market value The valuation techniques and significant inputs used in determining the fair market values of financial instruments classified as Level 1
and Level 2 of the fair value hierarchy are as follows:
Common stocks,
exchange-traded funds and financial derivative instruments, such as futures contracts or options contracts that are traded on a national securities exchange, are stated at the last reported sale or settlement price on the day of valuation. To the
extent these securities are actively traded and valuation adjustments are not applied, they are categorized as Level 1 of the fair value hierarchy. Valuation adjustments may be applied to certain securities that are solely traded on a foreign
exchange to account for the market movement between the close of the foreign market and the close of the NYSE. These securities are valued using pricing service providers that consider the correlation of the trading patterns of the foreign security
to the intraday trading in the U.S. markets for investments. Securities using these valuation adjustments are categorized as Level 2 of the fair value hierarchy. Preferred securities and other equities traded on inactive markets or valued by
reference to similar instruments are also categorized as Level 2 of the fair value hierarchy.
Equity-linked securities are valued by referencing the last reported sale or settlement price of the linked referenced equity on the day of valuation. Foreign
exchange adjustments are applied to the last reported price to convert the linked equity’s trading currency to the contracts settling currency. These investments are categorized as Level 2
of the fair value hierarchy.
Investments in registered open-end investment
management companies will be valued based upon the NAVs of such investments and are categorized as Level 1 of the fair value hierarchy. Investments in unregistered open-end management investment companies will be calculated based upon the NAVs
of such investments and are considered Level 1 provided that the NAVs are observable, calculated daily and are the value at which both purchases and sales will be conducted. Investments in privately held investment funds will be valued based upon
the NAVs of such investments and are categorized as Level 2 of the fair value hierarchy. Investments in privately held investment funds where the inputs of the NAVs are unobservable will be calculated based upon the NAVs of such investments and
are categorized as Level 3 of the fair value hierarchy.
Short-term
investments having a maturity of 60 days or less are generally valued at amortized cost which approximates fair market value. These investments are categorized as Level 2 of the fair value hierarchy.
Over-the-counter financial derivative instruments, such as foreign currency contracts,
options contracts, or swap agreements, derive their value from underlying asset prices, indices, reference rates, and other inputs or a combination of these factors. These contracts are normally valued on the basis of broker dealer quotations or by
pricing service providers. Depending on the product and the terms of the transaction, the value of financial derivatives can be estimated by a pricing service provider using a series of techniques, including simulation pricing models. The pricing
models use inputs that are observed from actively quoted markets such as issuer details, indices, spreads, interest rates, curves, dividends and exchange rates. Financial derivatives that use similar valuation techniques and inputs as described
above are categorized as Level 2 of the fair value hierarchy.
Level 3 trading assets and trading liabilities, at fair market value The valuation techniques and significant inputs used in determining the fair
market values of financial instruments classified as Level 3 of the fair value hierarchy are as follows:
Securities and other assets for which market quotes are not readily available are valued at fair market value as determined in good faith by the Board or persons acting at their direction and are categorized as
Level 3 of the fair value hierarchy.
Market quotes are considered not
readily available in circumstances where there is an absence of current or reliable market-based data (e.g., trade information or broker quotes), including where events occur after the close of the relevant market, but prior to the NYSE Close, that
materially affect the values of the Portfolio’s securities or assets. In addition, market quotes are considered not readily available when, due to extraordinary circumstances, the exchanges or markets on which the securities trade, do not open
for trading for the entire day and no other market prices are available. The Board has delegated to the investment adviser, Pacific Investment Management Company LLC (“PIMCO”), the responsibility for monitoring significant events that may
materially affect the values of the Portfolio’s securities or assets and for determining whether the value of the applicable securities or assets should be re-evaluated in light of such significant events.
The Board has adopted methods for valuing securities and other assets in circumstances
where market quotes are not readily available, and has delegated the responsibility for applying the valuation methods to PIMCO. For instances in which daily market quotes are not readily available, investments may be valued, pursuant to guidelines
established by the Board, with reference to other securities or indices. In the event that the security or asset cannot be valued pursuant to one of the valuation methods established by the Board, the value of the security or asset will be
determined in good faith by the Valuation Committee of the Board, generally based upon recommendations provided by PIMCO. When the Portfolio uses fair valuation methods applied by PIMCO that use significant unobservable inputs to determine its NAV,
securities will be
|
|
|
|
|
|
|
| 20 |
|
PIMCO EQUITY SERIES VIT |
|
|
|
|
December 31, 2011
priced by another method that the Board or persons acting at their direction believe accurately reflects fair market value and are categorized as Level 3 of the fair value hierarchy. These
methods may require subjective determinations about the value of the security. While the Trust’s policy is intended to result in a calculation of the Portfolio’s NAV that fairly reflects security values as of the time of pricing, the Trust
cannot guarantee that values determined by the Board or persons acting at their direction would accurately reflect the price that the Portfolio could obtain for a security if it were to dispose of that security as of the time of pricing (for
instance, in a forced or distressed sale). The prices used by the Portfolio may differ from the value that would be realized if the securities were sold.
For fair valuations using significant unobservable inputs, U.S. GAAP requires a reconciliation of the beginning to ending balances for reported fair market values
that presents changes attributable to total realized and unrealized gains or losses, purchases and sales, and transfers in or out of the Level 3 category during the period. The end of period timing recognition is used for the significant transfers
between Levels of the Portfolio’s assets and liabilities. In accordance with the requirements of U.S. GAAP, a fair value hierarchy and Level 3 reconciliation, if any, have been included in the Notes to the Consolidated Schedule of Investments
for the Portfolio.
4. SECURITIES AND OTHER INVESTMENTS
(a) Equity-Linked
Securities The Portfolio may purchase equity-linked securities, also known as participation notes, equity swaps, and zero strike calls and warrants. Equity-linked securities are
primarily used by the Portfolio as an alternative means to more efficiently and effectively access what is generally an emerging securities market. The Portfolio deposits cash with its custodian (or broker, if legally permitted) in an amount near or
equal to the selling price of the underlying security in exchange for an equity-linked security. Upon sale, the Portfolio receives cash from the broker or custodian equal to the value of the underlying security. Aside from market risk of the
underlying securities, there is a risk of default by the counterparty to the transaction. In the event of insolvency of the counterparty, the Portfolio might be unable to obtain its expected benefit. In addition, while the Portfolio will seek to
enter into such transactions only with parties that are capable of entering into closing transactions with the Portfolio, there can be no assurance that the Portfolio will be able to close out such a transaction with the counterparty or obtain an
offsetting position with any counterparty, at any time prior to the end of the term of the underlying agreement. This may impair the Portfolio’s ability to enter into other transactions at a time when doing so might be advantageous.
(b) Exchange-Traded Funds The Portfolio may invest in exchange-traded funds (“ETFs”), which generally are index-based investment companies that hold substantially all of their assets in securities representing their
specific index. ETFs are funds that issue shares that trade throughout the day on an exchange and represent an investment in a portfolio of securities and assets. As a shareholder of another investment company, the Portfolio would bear its pro rata
portion of the other investment company’s expenses, including advisory fees, in addition to the expenses the Portfolio bears directly in connection with its own operations.
(c) Repurchase Agreements The Portfolio may engage in repurchase agreements. Under the terms of a typical repurchase agreement, the Portfolio takes possession of an underlying debt obligation (collateral) subject to an
obligation of the seller to repurchase, and the Portfolio to resell, the obligation at an agreed-upon price and time. The underlying securities for all repurchase agreements are held in safekeeping at the Portfolio’s custodian or designated
subcustodians under tri-party repurchase agreements. The market value of the collateral must be equal to or exceed the total amount of the repurchase obligations, including interest. Securities purchased under repurchase agreements are reflected as
an asset on the Consolidated Statement of Assets and Liabilities. Interest earned is recorded as a component of interest income on the Consolidated Statement of Operations. In periods of increased demand for collateral, the Portfolio may pay a fee
for receipt of collateral, which may result in interest expense to the Portfolio. Generally, in the event of counterparty default, the Portfolio has the right to use the collateral to offset
losses incurred. If the counterparty should default, the Portfolio will seek to sell the securities which it holds as collateral. This could involve procedural costs or delays in addition to a
loss on the securities if their value should fall below their repurchase price.
(d) Short Sales The Portfolio may enter into short sales transactions. Short sales are transactions
in which the Portfolio sells a security or other instrument (such as an option, forward, future or other derivative contract) that it does not own. When the Portfolio engages in a short sale, it must borrow the security sold short and deliver it to
the counterparty. The Portfolio will ordinarily have to pay a fee or premium to borrow a security and be obligated to repay the lender of the security any dividend or interest that accrues on the security during the period of the loan. The Portfolio
may enter into a specific agreement with a prime broker giving the Portfolio the opportunity to borrow a predetermined amount of a thinly traded security for the duration of the term (the “Term Borrow Agreement”). In exchange for the
opportunity to borrow the specified security, the Portfolio will pay the prime broker a fee as detailed in the Term Borrow Agreement. See Note 6 for risks associated with Prime Broker Account Agreements. Securities sold in short sale transactions
and the dividend or interest payable on such securities, if any, are reflected as payable for short sales on the Consolidated Statement of Assets and Liabilities. Short sales expose the Portfolio to the risk that it will be required to cover its
short position at a time when the security or other asset has appreciated in value, thus resulting in losses to the Portfolio. A short sale is “against the box” if the Portfolio holds in its portfolio or has the right to acquire the
security sold short at no additional cost. The Portfolio will be subject to additional risks to the extent that it engages in short sales that are not “against the box.” The Portfolio’s loss on a short sale could theoretically be
unlimited in cases where the Portfolio is unable, for whatever reason, to close out its short position.
(e) U.S. Government Agencies or Government-Sponsored Enterprises The Fund may invest in securities
of U.S. Government agencies or government-sponsored enterprises. U.S. Government securities are obligations of and, in certain cases, guaranteed by, the U.S. Government, its agencies or instrumentalities. Some U.S. Government securities, such as
Treasury bills are supported by the full faith and credit of the U.S. Government. U.S. Government securities may include zero coupon securities, which do not distribute interest on a current basis and tend to be subject to greater risk than
interest-paying securities of similar maturities.
5. FINANCIAL DERIVATIVE INSTRUMENTS
The following disclosures contain information on how and why the Portfolio uses financial derivative instruments, the credit-risk-related contingent features in
certain financial derivative instruments, and how financial derivative instruments affect the Portfolio’s financial position, results of operations and cash flows. The location and fair value amounts of these instruments on the Consolidated
Statement of Assets and Liabilities and the realized and changes in unrealized gains and losses on the Consolidated Statement of Operations, each categorized by type of financial derivative contract, are included in a table in the Notes to
Consolidated Schedule of Investments. The financial derivative instruments outstanding as of period end as disclosed in the Notes to Consolidated Schedule of Investments and the amounts of realized and changes in unrealized gains and losses on
financial derivative instruments during the period as disclosed on the Consolidated Statement of Operations serve as indicators of the volume of financial derivative activity for the Portfolio.
(a) Foreign Currency
Contracts The Portfolio may enter into foreign currency contracts in connection with settling planned purchases or sales of securities, to hedge the currency exposure associated with
some or all of the Portfolio’s securities or as a part of an investment strategy. A foreign currency contract is an agreement between two parties to buy and sell a currency at a set price on a future date. The market value of a foreign currency
contract fluctuates with changes in foreign currency exchange rates. Foreign currency contracts are marked to market daily and the change in value is recorded by the Portfolio as an unrealized gain or loss. Realized gains or losses equal to the
difference between the value of the contract at the time it was opened and the value at the time it was closed are recorded upon delivery or receipt of the
|
|
|
|
|
|
|
|
|
DECEMBER 31, 2011 |
|
ANNUAL REPORT |
|
21 |
Notes to Financial Statements (Cont.)
currency. These contracts may involve market risk in excess of the unrealized gain or loss reflected on the Consolidated Statement of Assets and Liabilities. In addition, the Portfolio could be
exposed to risk if the counterparties are unable to meet the terms of the contracts or if the value of the currency changes unfavorably to the U.S. dollar. In connection with these contracts, securities may be identified as collateral in accordance
with the terms of the respective contracts.
(b) Options Contracts The Portfolio may write call and put options on securities and financial derivative instruments it owns or in which it may
invest. Writing put options tends to increase the Portfolio’s exposure to the underlying instrument. Writing call options tends to decrease the Portfolio’s exposure to the underlying instrument. When the Portfolio writes a call or put, an
amount equal to the premium received is recorded as a liability and subsequently marked to market to reflect the current value of the option written. These liabilities are reflected as written options outstanding on the Consolidated Statement of
Assets and Liabilities. Premiums received from writing options which expire are treated as realized gains. Premiums received from writing options which are exercised or closed are added to the proceeds or offset against amounts paid on the
underlying futures, swap, security or currency transaction to determine the realized gain or loss. Certain options may be written with premiums to be determined on a future date. The Portfolio as a writer of an option has no control over whether the
underlying instrument may be sold (call) or purchased (put) and as a result bears the market risk of an unfavorable change in the price of the instrument underlying the written option. There is the risk the Portfolio may not be able to enter into a
closing transaction because of an illiquid market.
The Portfolio may also
purchase put and call options. Purchasing call options tends to increase the Portfolio’s exposure to the underlying instrument. Purchasing put options tends to decrease the Portfolio’s exposure to the underlying instrument. The Portfolio
pays a premium which is included on the Portfolio’s Consolidated Statement of Assets and Liabilities as an investment and subsequently marked to market to reflect the current value of the option. Premiums paid for purchasing options which
expire are treated as realized losses. Certain options may be purchased with premiums to be determined on a future date. The premiums for these options are based upon implied volatility parameters at specified terms. The risk associated with
purchasing put and call options is limited to the premium paid. Premiums paid for purchasing options which are exercised or closed are added to the amounts paid or offset against the proceeds on the underlying investment transaction to determine the
realized gain or loss when the underlying transaction is sold.
Options on Exchange-Traded Futures Contracts The Portfolio may write or purchase options on exchange-traded futures contracts (“Futures
Option”). A Futures Option is an option contract in which the underlying is a single futures contract. The Portfolio may write a Futures Option for income purposes or to hedge an existing position or future investment. The Portfolio may
purchase Futures Options for speculative purposes or to manage exposure to market movements.
Foreign Currency Options The Portfolio may write or purchase foreign currency options. These options
may be used as a short or long hedge against possible variations in foreign exchange rates or to gain exposure to foreign currencies. A foreign currency option will specify the amount of currency and a rate of exchange that may be exercised by a
specified date.
Options
on Securities The Portfolio may enter into options on securities (“Equity Option”). An Equity Option uses a specified equity security as the underlying for the option contract.
The Portfolio may write or purchase options for income purposes or to hedge an existing position or future investment.
Options on Exchange-Traded Funds The Portfolio may
enter into options on exchange-traded funds (“ETF Option”). An ETF Option uses a specified exchange-traded fund as the underlying for the option contract. The Portfolio may write or purchase options for income purposes or to hedge an
existing position or future investment.
(c) Swap Agreements The Portfolio may invest in swap agreements. Swap agreements are bilaterally negotiated agreements between the Portfolio and a counterparty to exchange or swap investment cash flows, assets, foreign
currencies or market-linked returns at specified, future intervals. Swap agreements are privately negotiated in the over-the-counter market (“OTC swaps”) or may be executed in a multilateral or other trade facility platform, such as a
registered exchange (“centrally cleared swaps”). The Portfolio may enter into total return and other forms of swap agreements to manage its exposure to credit, currency, interest rate, commodity, equity and inflation risk. In connection
with these agreements, securities or cash may be identified as collateral or margin in accordance with the terms of the respective swap agreements to provide assets of value and recourse in the event of default or bankruptcy/insolvency.
Swaps are marked to market daily based upon values from third party vendors, which may
include a registered exchange, or quotations from market makers to the extent available. In the event that market quotes are not readily available and the swap cannot be valued pursuant to one of the valuation methods, the value of the swap will be
determined in good faith by the Valuation Committee of the Board of Trustees, generally based upon recommendations provided by PIMCO. Changes in market value, if any, are reflected as a component of net changes in unrealized
appreciation/(depreciation) on the Consolidated Statement of Operations. Daily changes in valuation of centrally cleared swaps, if any, are recorded as a receivable or payable for the change in value as appropriate (“variation margin”) on
the Consolidated Statement of Assets and Liabilities. OTC swap payments received or made at the beginning of the measurement period are reflected as such on the Consolidated Statement of Assets and Liabilities and represent premiums paid or received
upon entering into the swap agreement to compensate for differences between the stated terms of the swap agreement and prevailing market conditions (credit spreads, currency exchange rates, interest rates, and other relevant factors). These upfront
premiums are recorded as realized gains or losses on the Consolidated Statement of Operations upon termination or maturity of the swap. A liquidation payment received or made at the termination of the swap is recorded as realized gain or loss on the
Consolidated Statement of Operations. Net periodic payments received or paid by the Portfolio are included as part of realized gains or losses on the Consolidated Statement of Operations.
Entering into these agreements involves, to varying degrees, elements of interest, credit, market and documentation risk in excess of the
amounts recognized on the Consolidated Statement of Assets and Liabilities. Such risks involve the possibility that there will be no liquid market for these agreements, that the counterparty to the agreements may default on its obligation to perform
or disagree as to the meaning of contractual terms in the agreements and that there may be unfavorable changes in interest rates.
The Portfolio’s maximum risk of loss from counterparty credit risk is the discounted net value of the cash flows to be received from the counterparty over the
contract’s remaining life, to the extent that amount is positive. The risk is mitigated by having a master netting arrangement between the Portfolio and the counterparty and by the posting of collateral to the Portfolio to cover the
Portfolio’s exposure to the counterparty.
Total Return Swap Agreements The Portfolio may enter into total return swap agreements to gain or mitigate exposure of the underlying reference
securities. Total return swap agreements on commodities involve commitments where cash flows are exchanged based on the price of a commodity and based on a fixed or variable rate. One party would receive payments based on the market value of the
commodity involved and pay a fixed amount. Total return swap agreements on indices involve commitments to pay interest in exchange for a market-linked return. One counterparty pays out the total return of a specific reference asset, which may be an
equity, index, or bond, and in return receives a regular stream of payments. To the extent the total return of the security or index underlying the transaction exceeds or falls short of the offsetting interest rate obligation, the Portfolio will
receive a payment from or make a payment to the counterparty.
|
|
|
|
|
|
|
| 22 |
|
PIMCO EQUITY SERIES VIT |
|
|
|
|
December 31, 2011
6. PRINCIPAL RISKS
In the normal course of business the Portfolio trades financial
instruments and enters into financial transactions where risk of potential loss exists due to changes in the market (market risk), or failure or inability of the other party to a transaction to perform (credit and counterparty risk). See below for a
detailed description of select principal risks. For a list of potential risks the Portfolio may be subject to, please see the Important Information About the Portfolio.
Market Risks The Portfolio’s investments in financial derivatives and other financial instruments expose the Portfolio to various risks such as, but not limited to, equity, interest rate, foreign currency and
commodity risks.
The market values of equities, such as common stocks and
preferred securities or equity related investments such as futures and options, may decline due to general market conditions which are not specifically related to a particular company, such as real or perceived adverse economic conditions, changes
in the general outlook for corporate earnings, changes in interest or currency rates or adverse investor sentiment generally. They may also decline due to factors which affect a particular industry or industries, such as labor shortages or increased
production costs and competitive conditions within an industry. Equity securities and equity related investments generally have greater market price volatility than fixed income securities.
Interest rate risk is the risk that fixed income securities will decline in value because of changes in interest rates. As nominal
interest rates rise, the value of certain fixed income securities held by the Portfolio is likely to decrease. A nominal interest rate can be described as the sum of a real interest rate and an expected inflation rate. Fixed income securities with
longer durations tend to be more sensitive to changes in interest rates, usually making them more volatile than securities with shorter durations. Duration is useful primarily as a measure of the sensitivity of a fixed income’s market price to
interest rate (i.e. yield) movements.
If the Portfolio invests
directly in foreign currencies or in securities that trade in, and receive revenues in, foreign currencies, or in financial derivatives that provide exposure to foreign currencies, it will be subject to the risk that those currencies will decline in
value relative to the base currency of the Portfolio, or, in the case of hedging positions, that the Portfolio’s base currency will decline in value relative to the currency being hedged. Currency rates in foreign countries may fluctuate
significantly over short periods of time for a number of reasons, including changes in interest rates, intervention (or the failure to intervene) by U.S. or foreign governments, central banks or supranational entities such as the International
Monetary Fund, or by the imposition of currency controls or other political developments in the United States or abroad. As a result, the Portfolio’s investments in foreign currency denominated securities may reduce the returns of the
Portfolio.
The Portfolio’s investments in commodity-linked financial
derivative instruments may subject the Portfolio to greater market price volatility than investments in traditional securities. The value of commodity-linked financial derivative instruments may be affected by changes in overall market movements,
commodity index volatility, changes in interest rates, or factors affecting a particular industry or commodity, such as drought, floods, weather, livestock disease, embargoes, tariffs and international economic, political and
regulatory developments.
Credit and Counterparty Risks The Portfolio will
be exposed to credit risk on parties with whom it trades and will also bear the risk of settlement default. The Portfolio minimizes concentrations of credit risk by undertaking transactions with a large number of customers and counterparties on
recognized and reputable exchanges. The Portfolio could lose money if the issuer or guarantor of a fixed income security, or the counterparty to a financial derivatives contract, repurchase agreement or a loan of portfolio securities, is unable or
unwilling to make timely principal and/or interest payments, or to otherwise honor its obligations. Securities are subject to varying degrees of credit risk, which are often reflected in credit ratings.
Similar to credit risk, the Portfolio may be exposed to counterparty risk, or the risk that an institution or other
entity with which the Portfolio has unsettled or open transactions will default. Financial assets, which potentially expose the Portfolio to counterparty risk, consist principally of cash due from counterparties and investments. PIMCO, as the
investment adviser, minimizes counterparty risks to the Portfolio by performing extensive reviews of each counterparty and obtaining approval from the PIMCO Counterparty Risk Committee prior to entering into transactions with a third party.
Furthermore, to the extent that unpaid amounts owed to the Portfolio exceed a predetermined threshold agreed to with the counterparty, such counterparty shall advance collateral to the Portfolio in the form of cash or cash equivalents equal in value
to the unpaid amount owed to the Portfolio. The Portfolio may invest such collateral in securities or other instruments and will typically pay interest to the counterparty on the collateral received. If the unpaid amount owed to the Portfolio
subsequently decreases, the Portfolio would be required to return to the counterparty all or a portion of the collateral previously advanced to the Portfolio.
All transactions in listed securities are settled/paid for upon delivery using approved counterparties. The risk of default is considered minimal, as delivery of
securities sold is only made once the Portfolio has received payment. Payment is made on a purchase once the securities have been delivered by the counterparty. The trade will fail if either party fails to meet its obligation.
The Portfolio is subject to various Master Agreements, which govern the terms of
certain transactions with select counterparties. These Master Agreements reduce the counterparty risk associated with relevant transactions by specifying credit protection mechanisms and providing standardization that improves legal certainty. Since
different types of forward and OTC financial derivative transactions have different mechanics and are sometimes traded out of different legal entities of a particular counterparty organization, each type of transaction may be covered by a different
Master Agreement and result in the need for multiple agreements with a single counterparty. Therefore, exposure cannot be netted and collateralized across all types of transactions. Exposures can only be netted across transactions governed under the
same Master Agreement with the same legal entity.
Master Agreements can
also help limit counterparty risk by specifying collateral posting arrangements at pre-arranged exposure levels. Under the Master Agreements, collateral is routinely transferred if the total net exposure to certain transactions (net of existing
collateral already in place) governed under the relevant master agreement with a counterparty in a given account exceeds a specified threshold, which typically ranges from zero to $250,000 depending on the counterparty and the type of Master
Agreement. United States Treasury Bills and U.S. dollar cash are generally the preferred forms of collateral, although other forms of AAA rated paper may be used. The Portfolio’s overall exposure to counterparty risk can change substantially
within a short period, as it is affected by each transaction subject to the relevant Master Agreement.
Master Repurchase Agreements (“Master Repo Agreements”) govern transactions between the Portfolio and select counterparties. The Master Repo Agreements maintain provisions for, among other things,
initiation, income payments, events of default, and maintenance of collateral for Repurchase Agreements.
International Swaps and Derivatives Association, Inc. Master Agreements (“ISDA Master Agreements”) govern OTC financial derivative transactions entered into by the Portfolio and select counterparties. The
ISDA Master Agreements maintain provisions for general obligations, representations, agreements, collateral and events of default or termination. Events of termination include conditions that may entitle counterparties to elect to terminate early
and cause settlement of all outstanding transactions under the applicable ISDA Master Agreement. Any election to early terminate could be material to the financial statements. The market value of OTC financial derivative transactions net of
collateral received in or pledged by counterparty as of period end is disclosed in the Notes to the Consolidated Schedule of Investments.
|
|
|
|
|
|
|
|
|
DECEMBER 31, 2011 |
|
ANNUAL REPORT |
|
23 |
Notes to Financial Statements (Cont.)
Prime Broker Account Agreements between the Portfolio and selected Prime Brokers govern the considerations and
factors surrounding accounts opened for short selling transactions and activities, including, but not limited to, margin,
execution, and settlement. The Prime Broker Account Agreements maintain provisions for, among other things, payments, maintenance of collateral, events of default, and termination. See Note 4(d)
for additional information.
7. BASIS FOR CONSOLIDATION OF THE PIMCO EqS PATHFINDER PORTFOLIO™
The PIMCO Cayman Commodity Portfolio III Ltd. (the “Commodity Subsidiary”), a Cayman Islands exempted company, was incorporated as a wholly owned subsidiary acting as an investment vehicle for the
Portfolio in order to effect certain investments for the Portfolio consistent with the Portfolio’s investment objectives and policies as specified in its prospectus and statement of additional information. The Portfolio’s investment
portfolio has been consolidated and includes the portfolio holdings of the Portfolio and the Commodity Subsidiary. The consolidated financial statements include the accounts of the Portfolio and the Commodity Subsidiary. All inter-company
transactions and balances have been eliminated. A subscription agreement was entered into between the Portfolio and the Commodity Subsidiary, comprising the entire issued share capital of the Commodity Subsidiary with the intent that the Portfolio
will remain the sole shareholder and retain all rights. Under the Articles of Association, shares issued by the Commodity Subsidiary confer upon a shareholder the right to receive notice of, to attend and to vote at general meetings of the Commodity
Subsidiary and shall confer upon the shareholder rights in a winding-up or repayment of capital and the right to participate in the profits or assets of the Commodity Subsidiary. See the table below for details regarding the structure, incorporation
and relationship as of December 31, 2011 of the Commodity Subsidiary to the Portfolio (amounts in thousands).
|
|
|
|
|
|
|
|
|
|
|
|
|
|
|
|
|
|
|
|
|
|
|
| Subsidiary |
|
|
|
Date of
Incorporation |
|
|
Subscription
Agreement |
|
|
Fund Net Assets |
|
|
Subsidiary
Net Assets |
|
|
% of
Fund Net Assets |
|
| PIMCO Cayman Commodity Portfolio III Ltd. |
|
|
|
|
06/06/2011 |
|
|
|
06/20/2011 |
|
|
$ |
454,090 |
|
|
$ |
16,362 |
|
|
|
3.6% |
|
8. FEES AND EXPENSES
(a) Investment Advisory
Fee PIMCO is a majority-owned subsidiary of Allianz Asset Management of America L.P. (“Allianz Asset Management”) formerly known as Allianz Global Investors of America L.P.,
and serves as investment adviser (the “Adviser”) to the Trust, pursuant to an investment advisory contract. The Adviser receives a monthly fee from the Portfolio, at an annual rate based on average daily net assets (the “Investment
Advisory Fee”). The Investment Advisory Fee for all classes is charged at an annual rate of 0.75%.
(b) Supervisory and Administrative Fee PIMCO serves as administrator (the
“Administrator”), and provides supervisory and administrative services to the Trust for which it receives a monthly supervisory and administrative fee based on each share class’s average daily net assets (the “Supervisory and
Administrative Fee”). As the Administrator, PIMCO bears the costs of various third-party services, including audit, custodial, portfolio accounting, legal, transfer agency and printing costs. The Supervisory and Administrative Fee for all
classes is charged at the annual rate of 0.35%.
(c) Distribution and Servicing Fees PIMCO Investments LLC (“PI”), a wholly-owned subsidiary of PIMCO, serves as the distributor
(“Distributor”) of the Trust’s shares. Prior to February 14, 2011, Allianz Global Investors Distributors LLC, an indirect wholly-owned subsidiary of Allianz Asset Management, was the Distributor of the Trust’s shares. The
Trust has adopted a Distribution Plan for the Advisor Class shares of the Portfolio (the “Plan”). The Plan has been adopted pursuant to Rule 12b-1 under the Act. The Plan permits payments for expenses in connection with the distribution
and marketing of Advisor Class shares and/or the provision of shareholder services to Advisor Class shareholders. The Plan permits the Portfolio to make total payments at an annual rate of 0.25% of its average daily net assets attributable to its
Advisor Class shares.
(d) Portfolio Expenses The Trust is responsible
for the following expenses: (i) salaries and other compensation of any of the Trust’s executive officers and employees who are not officers, directors, stockholders or employees of PIMCO or its subsidiaries or affiliates; (ii) taxes
and governmental fees; (iii) brokerage fees and commissions and other portfolio transaction expenses; (iv) the costs of borrowing money, including interest expenses and bank overdraft charges; (v) fees and expenses of the Trustees who
are not “interested persons” of PIMCO or the Trust, and any counsel retained exclusively for their benefit; (vi) extraordinary expenses, including costs of litigation and indemnification expenses; (vii) organization expenses and
(viii) any expenses allocated or allocable to a specific class of shares (“class-specific expenses”). The ratio of expenses to average net assets per share class, as disclosed on the Financial Highlights, may differ from the annual
portfolio operating expenses per share class as disclosed in the Prospectus for the reasons set forth above.
Each Trustee, other than those affiliated with PIMCO or its affiliates, receives an annual retainer of $10,000, plus
$1,500 for each Board of Trustees meeting attended in person, $250 ($375 in the case of the audit committee chair with respect to audit committee meetings) for each committee meeting attended and $375 for each Board of Trustees meeting attended
telephonically, plus reimbursement of related expenses. In addition, the audit committee chair receives an additional annual retainer of $2,000 and each other committee chair receives an additional annual retainer of $250. The Trust pays no
compensation directly to any Trustee or any other officer who is affiliated with the Administrator, all of whom receive remuneration for their services to the Trust from the Administrator or its affiliates.
(e) Expense Limitation PIMCO has also contractually agreed, through May 1, 2012, to reduce total annual operating expenses for each of the Portfolio’s separate classes of shares, by reducing the Portfolio’s
Supervisory and Administrative fee or reimbursing the Portfolio, to the extent that organizational expenses and pro rata Trustees’ fees attributable to a class of shares of the Portfolio exceed 0.0049% of the Portfolio’s average net assets
attributable to separate classes of shares. This Expense Limitation Agreement renews annually for a full year unless terminated by PIMCO upon at least 30 days prior notice to the end of the contract term.
PIMCO has contractually agreed, through May 1, 2012, to waive a portion of its
Investment Advisory Fee equal to 0.13% of average daily net assets. Under the Fee Limitation Agreement, PIMCO is entitled to reimbursement by the Portfolio of any portion of the Supervisory and Administrative Fee and/or Investment Advisory Fee
waived, reduced or reimbursed pursuant to the Fee Limitation Agreement (the “Reimbursement Amount”) during the previous three years, provided that such amount paid to PIMCO will not: 1) together with any recoupment of organizational
expenses and pro rata Trustees’ fees pursuant to the Expense Limitation Agreement, exceed the Expense Limit: 2) exceed the total Reimbursement Amount; or 3) include any amounts previously reimbursed to PIMCO. The Fee Limitation Agreement will
automatically renew for one-year terms unless PIMCO provides written notice to the Trust at least 30 days prior to the end of the then current term.
PIMCO has also contractually agreed, through September 16, 2013, to reduce total annual operating expenses for the Portfolio’s Institutional Class and
Advisor Class shares, by reducing the Portfolio’s Investment Advisory or Supervisory and Administrative Fees or reimbursing the Portfolio to the extent that total annual portfolio operating expenses net of acquired fund fees and expenses, after
taking into account other applicable fee waivers and reimbursements exceed 1.00% and 1.25% of the Portfolio’s average net assets attributable to the Institutional Class and Advisor Class shares, respectively. PIMCO may recoup these waivers and
reimbursements for a period not exceeding three years, provided that total expenses, including such
|
|
|
|
|
|
|
| 24 |
|
PIMCO EQUITY SERIES VIT |
|
|
|
|
December 31, 2011
recoupment, do not exceed the annual expense limit. As of December 31, 2011, the remaining recoverable amount to
PIMCO was $334,802.
(f)
Acquired Fund Fees and Expenses The Commodity Subsidiary has entered into a separate contract with PIMCO for the management of the Commodity Subsidiary’s portfolio pursuant
to which the Commodity Subsidiary pays PIMCO a management fee and administrative services fee at the annual rates of 0.49% and 0.20%, respectively, of its net assets. PIMCO has
contractually agreed to waive the Investment Advisory Fee and the Supervisory and Administrative Fee it receives from the Portfolio in an amount equal to the management fee and administrative
services fee, respectively, paid to PIMCO by the Commodity Subsidiary. This waiver may not be terminated by PIMCO and will remain in effect for as long as PIMCO’s contract with the Commodity Subsidiary is in place. The waiver is reflected in
the Consolidated Statement of Operations as a component of Waiver and/or Reimbursement by PIMCO. For the period ended December 31, 2011, the amount was $35,587.
9. RELATED PARTY
TRANSACTIONS
The Adviser, Administrator, and Distributors are related
parties. Fees payable to these parties are disclosed in Note 8 and the accrued related party fees amounts are disclosed on the Consolidated Statement of Assets and Liabilities.
The Portfolio may invest in the PIMCO Short-Term Floating NAV Portfolio to the extent
permitted by the Act and rules thereunder. The PIMCO Short-Term Floating NAV Portfolio is a registered investment company created for use solely by the series of the Trust and series of the PIMCO Funds, PIMCO Variable Insurance Trust, PIMCO ETF
Trust, PIMCO Equity Series, and other series of registered investment companies advised by PIMCO, in connection with their cash management activities. The main investments of the PIMCO Short-Term Floating NAV Portfolio are money market instruments
and short maturity fixed income instruments. The PIMCO Short-Term Floating NAV Portfolio may incur expenses related to its investment activities, but does not pay Investment Advisory or Supervisory and Administrative Fees to PIMCO. The PIMCO
Short-Term Floating NAV Portfolio is considered to be affiliated with the Portfolio. The table below shows the Portfolio’s transactions in and earnings from investments in the PIMCO Short-Term Floating NAV Portfolio for the period ended
December 31, 2011 (amounts in thousands):
|
|
|
|
|
|
|
|
|
|
|
|
|
|
|
|
|
|
|
|
|
|
|
|
|
|
|
Market Value
12/31/2010 |
|
|
Purchases
at Cost |
|
|
Proceeds from
Sales |
|
|
Net Capital
and Realized
Gain |
|
|
Change in
Unrealized
Appreciation |
|
|
Market Value
12/31/2011 |
|
|
Dividend
Income |
|
| $ |
901 |
|
|
$ |
103,433 |
|
|
|
$ (70,100) |
|
|
$ |
3 |
|
|
$ |
1 |
|
|
$ |
34,238 |
|
|
$ |
33 |
|
10. GUARANTEES AND INDEMNIFICATIONS
Under the Trust’s organizational documents, each Trustee or officer of the Trust is indemnified and each employee or other agent of
the Trust (including the Trust’s investment manager) may be indemnified, to the extent permitted by the Act, against certain liabilities that may arise out of performance of their duties to the Portfolio. Additionally, in the normal course of
business, the Portfolio enters into contracts that contain a variety of indemnification clauses. The Portfolio’s maximum exposure under these arrangements is unknown as this would involve future claims that may be made against the Portfolio
that has not yet occurred. However, the Portfolio has not had prior claims or losses pursuant to these contracts.
11. PURCHASES AND SALES OF SECURITIES
The length of time the Portfolio has held a particular security is not generally a consideration in investment decisions. A change in the securities held by the Portfolio is known as “portfolio turnover.”
The Portfolio may engage in
frequent and active trading of portfolio securities to achieve its investment objective, particularly during periods of volatile market movements. High portfolio turnover (e.g., over 100%)
involves correspondingly greater expenses to the Portfolio, including brokerage commissions or dealer mark-ups and other transaction costs on the sale of securities and reinvestments in other securities. Such sales may also result in realization of
taxable capital gains, including short-term capital gains (which are generally taxed at ordinary income tax rates). The trading costs and tax effects associated with portfolio turnover may adversely affect the Portfolio’s performance. The
portfolio turnover rates are reported in the Financial Highlights.
Purchases and sales of securities (excluding short-term instruments) for the period ended December 31, 2011, were as follows (amounts in thousands):
|
|
|
|
|
|
|
|
|
|
|
|
|
|
|
| U.S. Government/Agency |
|
|
All Other |
|
| Purchases |
|
|
Sales |
|
|
Purchases |
|
|
Sales |
|
| $ |
3,366 |
|
|
$ |
0 |
|
|
$ |
753,157 |
|
|
$ |
327,523 |
|
12. SHARES OF BENEFICIAL
INTEREST
The Portfolio may issue an unlimited number of shares of
beneficial interest with a $0.001 par value. Changes in shares of beneficial interest were as follows (shares and amounts in thousands):
|
|
|
|
|
|
|
|
|
|
|
|
|
|
|
|
|
|
|
| |
|
|
|
Year Ended
12/31/2011 |
|
|
Period from 04/14/2010
to 12/31/2010 |
|
| |
|
|
|
Shares |
|
|
Amount |
|
|
Shares |
|
|
Amount |
|
|
|
|
|
|
|
| Receipts for shares sold |
|
|
|
|
|
|
|
|
|
|
|
|
|
|
|
|
|
|
| Institutional Class |
|
|
|
|
6,970 |
|
|
$ |
68,614 |
|
|
|
349 |
|
|
$ |
3,472 |
|
| Advisor Class |
|
|
|
|
41,590 |
|
|
|
408,419 |
|
|
|
274 |
|
|
|
2,697 |
|
| Issued as reinvestment of distributions |
|
|
|
|
|
|
|
|
|
|
|
|
|
|
|
|
|
|
| Institutional Class |
|
|
|
|
8 |
|
|
|
75 |
|
|
|
0 |
|
|
|
0 |
|
| Advisor Class |
|
|
|
|
14 |
|
|
|
138 |
|
|
|
0 |
|
|
|
0 |
|
| Cost of shares redeemed |
|
|
|
|
|
|
|
|
|
|
|
|
|
|
|
|
|
|
| Institutional Class |
|
|
|
|
(552 |
) |
|
|
(5,347 |
) |
|
|
(32 |
) |
|
|
(306 |
) |
| Advisor Class |
|
|
|
|
(2,388 |
) |
|
|
(22,951 |
) |
|
|
(32 |
) |
|
|
(311 |
) |
| Net increase resulting from Portfolio share transactions |
|
|
|
|
45,642 |
|
|
$ |
448,948 |
|
|
|
559 |
|
|
$ |
5,552 |
|
As of December 31, 2011, Allianz Life Insurance
Co. of North America, a direct subsidiary of Allianz of America and a related party to the Portfolio, owned 25% or more of the outstanding shares of beneficial interest of the Portfolio and therefore may be presumed to “control” the
Portfolio, as that term is defined in the 1940 Act.
|
|
|
|
|
|
|
|
|
DECEMBER 31, 2011 |
|
ANNUAL REPORT |
|
25 |
Notes to Financial Statements (Cont.)
13. REGULATORY AND LITIGATION MATTERS
The Trust is not engaged in any material litigation or arbitration proceedings and is not aware of any material litigation or claim
pending or threatened by or against it.
14. FEDERAL INCOME
TAX MATTERS
The Portfolio intends to qualify as a regulated investment
company under Subchapter M of the Internal Revenue Code (the “Code”) and distribute all of its taxable income and net realized gains, if applicable, to shareholders. Accordingly, no provision for Federal income taxes has been made.
In accordance with provisions set forth under U.S. GAAP, the Investment
Adviser has reviewed the Portfolio’s tax positions for all open tax years. As of December 31, 2011, the Portfolio has recorded no liability for net unrecognized tax benefits relating to uncertain income tax positions it has taken or
expects to take in future tax returns.
The Portfolio files U.S. tax
returns. While the statute of limitations remains open to examine the Portfolio’s U.S. tax return filed for the 2010 fiscal year, no examinations are in progress or anticipated at this time. The Portfolio is not aware of any tax positions for
which it is reasonably possible that the total amounts of unrecognized tax benefits will significantly change in the next twelve months.
The Portfolio may gain exposure to the commodities markets primarily through index-linked notes, and may invest in other commodity-linked derivative instruments,
including commodity swap agreements, options, futures contracts, options on futures contracts and foreign funds investing in similar commodity-linked derivatives.
One of the requirements for favorable tax treatment as a regulated investment company
under the Code is that the Portfolio derive at least 90% of its gross income from certain qualifying sources of income. The IRS has issued a revenue ruling which holds that income derived from commodity index-linked swaps is not qualifying income
under Subchapter M of the Code. Subsequently, the IRS issued a private letter ruling to the PIMCO CommodityRealReturn Strategy
Fund® in which the IRS specifically concluded that income from
certain commodity index-linked notes is qualifying income. In addition, the IRS issued another private letter ruling to the PIMCO CommodityRealReturn Strategy Fund® in which the IRS specifically concluded that income derived from the Fund’s investment in it’s Subsidiary, which invests primarily in commodity index-linked
swaps, will also constitute qualifying income to the Fund. Based on such rulings, the Portfolio will continue to seek to gain exposure to the commodity markets primarily through investments in commodity-linked notes and through investments in
its Subsidiary.
It should be noted, however, that the IRS currently
has suspended the issuance of such rulings pending further review. There can be no assurance that the IRS will not change its position that income derived from commodity-linked notes and wholly-owned subsidiaries is qualifying
income. Furthermore, the tax treatment of commodity linked notes, other commodity-linked derivatives, and the Fund’s investments in the Subsidiary may otherwise be adversely affected by future legislation, Treasury Regulations and/or
guidance issued by the IRS. Such developments could affect the character, timing and/or amount of the Fund’s taxable income or any distributions made by the Fund or result in the inability of the Fund to operate as described in its
Prospectus.
If, during a taxable year, the Commodity Subsidiary’s
taxable losses (and other deductible items) exceed its income and gains, the net loss will not pass through to the Portfolio as a deductible amount for Federal income tax purposes. Note that the loss from the Commodity Subsidiary’s contemplated
activities also cannot be carried forward to reduce future Commodity Subsidiary’s income in subsequent years. However, if the Commodity Subsidiary’s taxable gains exceed its losses and other deductible items during a taxable year, the net
gain will pass through to the Portfolio as income for Federal income tax purposes.
Shares of the Portfolio currently are sold to segregate asset accounts (“Separate Accounts”) of insurance companies that fund variable annuity contracts and variable life insurance policies
(“Variable Contracts”). Please refer to the prospectus for the Separate Account and Variable Contract for information regarding federal income tax treatment of distributions to the Separate Account.
As of December 31, 2011, the components
of distributable taxable earnings are as follows (amounts in thousands):
|
|
|
|
|
|
|
|
|
|
|
|
|
|
|
|
|
|
|
|
|
|
|
|
|
|
|
Undistributed
Ordinary
Income |
|
|
Undistributed
Long-Term
Capital Gains |
|
|
Net Tax Basis
Unrealized
Appreciation/
(Depreciation)(1) |
|
|
Other
Book-to-Tax
Accounting
Differences(2) |
|
|
Accumulated
Capital
Losses(3)
|
|
|
Post-October
Deferral |
|
|
Qualified
Late-Year Loss
Deferral |
|
| $ |
2,581 |
|
|
$ |
— |
|
|
$ |
9,550 |
|
|
$ |
|
(1) |
|
$ |
(12,472) |
|
|
$ |
— |
|
|
$ |
— |
|
| (1) |
Adjusted for open wash sale loss deferrals and the accelerated recognition of unrealized gain or loss on certain futures, options and forward contracts for
federal income tax purposes. Also adjusted for differences between book and tax realized and unrealized gain (loss) on swap contracts. |
| (2) |
Represents differences in income tax regulations and financial accounting principles generally accepted in the United States of America, namely for straddle loss
deferrals and distributions payable at fiscal year-end. |
| (3) |
Capital losses available to offset future net capital gains expire in varying amounts in the years shown below. |
As of December 31, 2011, the Portfolio had accumulated capital losses expiring in the
following years (amounts in thousands). The Portfolio will resume capital gain distributions in the future to the extent gains are realized in excess of accumulated capital losses.
|
|
|
|
|
|
|
|
|
|
|
|
|
|
|
|
|
|
|
|
|
|
|
|
|
|
|
| Expiration of Accumulated Capital Losses |
|
| 12/31/2012 |
|
|
12/31/2013 |
|
|
12/31/2014 |
|
|
12/31/2015 |
|
|
12/31/2016 |
|
|
12/31/2017 |
|
|
12/31/2018 |
|
| $ |
— |
|
|
$ |
— |
|
|
$ |
— |
|
|
$ |
— |
|
|
$ |
— |
|
|
$ |
— |
|
|
$ |
30 |
|
Under the recently enacted Regulated Investment Company
Act of 2010, a fund is permitted to carry forward any new capital losses for an unlimited period. Additionally, such capital losses that are carried forward will retain their character as either short-term or long-term capital losses rather than
being considered all short-term under previous law.
As of December 31,
2011, the Portfolio had the following post-effective capital losses with no expiration:
|
|
|
|
|
|
|
| Short-Term |
|
|
Long-Term |
|
| $ |
11,460 |
|
|
$ |
982 |
|
|
|
|
|
|
|
|
| 26 |
|
PIMCO EQUITY SERIES VIT |
|
|
|
|
December 31, 2011
As of December 31, 2011, the aggregate cost and the net unrealized appreciation/(depreciation) of investments for federal income tax purposes are as follows
(amounts in thousands):
|
|
|
|
|
|
|
|
|
|
|
|
|
|
|
Federal Tax
Cost |
|
|
Unrealized
Appreciation |
|
|
Unrealized
(Depreciation) |
|
|
Net Unrealized
Appreciation/
(Depreciation)(4) |
|
| $ |
442,252 |
|
|
$ |
22,196 |
|
|
$ |
(13,300) |
|
|
$ |
8,896 |
|
| (4) |
Primary differences, if any, between book and tax net unrealized appreciation/(depreciation) on investments are attributable to open wash sale loss deferrals,
convertible preferred debt instruments, and passive foreign investment companies. |
For the fiscal years ended December 31, 2011 and December 31, 2010, respectively, the Portfolio made the following tax basis distributions (amounts in thousands):
|
|
|
|
|
|
|
|
|
|
|
|
|
|
|
Fiscal Year
Ended |
|
|
Ordinary
Income
Distributions(5)
|
|
|
Long-Term
Capital Gain
Distributions |
|
|
Return of
Capital |
|
| |
12/31/2011 |
|
|
$ |
212 |
|
|
$ |
— |
|
|
$ |
— |
|
| |
12/31/2010 |
|
|
$ |
— |
|
|
$ |
— |
|
|
$ |
— |
|
| (5) |
Includes short-term capital gains, if any, distributed. |
15. SUBSEQUENT EVENTS
The investment adviser has evaluated the possibility of subsequent events and has
determined that there are no material events that would require disclosure in the Portfolio’s financial statements.
|
|
|
|
|
|
|
|
|
DECEMBER 31, 2011 |
|
ANNUAL REPORT |
|
27 |
Report of Independent Registered Public Accounting Firm
To the Board of Trustees of PIMCO Equity Series VIT and
Institutional Class Shareholders of PIMCO EqS Pathfinder Portfolio™:
In our opinion, the accompanying consolidated statement of assets and liabilities, including the consolidated schedule of investments, and the related consolidated statements of operations and of changes in net
assets and the financial highlights for the Institutional Class present fairly, in all material respects, the financial position of PIMCO EqS Pathfinder PortfolioTM and its wholly owned subsidiary (constituting PIMCO Equity Series VIT, hereinafter referred to as the “Portfolio”) at
December 31, 2011, the results of their operations for the year then ended, and the changes in their net assets and the financial highlights for the Institutional Class for each of the periods presented, in conformity with accounting principles
generally accepted in the United States of America. These financial statements and financial highlights (hereafter referred to as “financial statements”) are the responsibility of the Portfolio’s management; our responsibility is to
express an opinion on these financial statements based on our audits. We conducted our audits of these financial statements in accordance with the standards of the Public Company Accounting Oversight Board (United States). Those standards require
that we plan and perform the audit to obtain reasonable assurance about whether the financial statements are free of material misstatement. An audit includes examining, on a test basis, evidence supporting the amounts and disclosures in the
financial statements, assessing the accounting principles used and significant estimates made by management, and evaluating the overall financial statement presentation. We believe that our audits, which included confirmation of securities at
December 31, 2011 by correspondence with the custodian and brokers, provide a reasonable basis for our opinion.
PricewaterhouseCoopers LLP
Kansas City, Missouri
February 17, 2012
|
|
|
|
|
|
|
| 28 |
|
PIMCO EQUITY SERIES VIT |
|
|
|
|
Glossary: (abbreviations that may be used in
the preceding statements)
(Unaudited)
|
|
|
|
|
|
|
|
|
|
|
|
|
|
|
|
| Counterparty Abbreviations: |
|
|
|
|
|
|
|
|
| BOA |
|
Bank of America N.A. |
|
FBF |
|
Credit Suisse International |
|
JPM |
|
JPMorgan Chase Bank N.A. |
| BPS |
|
BNP Paribas S.A. |
|
FBL |
|
Credit Suisse AG |
|
MSC |
|
Morgan Stanley & Co., Inc. |
| BRC |
|
Barclays Bank PLC |
|
GSC |
|
Goldman Sachs & Co. |
|
MYI |
|
Morgan Stanley & Co. International PLC |
| CBK |
|
Citibank N.A. |
|
GST |
|
Goldman Sachs International |
|
RBC |
|
Royal Bank of Canada |
| DUB |
|
Deutsche Bank AG |
|
HUS |
|
HSBC Bank USA N.A. |
|
UAG |
|
UBS AG Stamford |
|
|
|
|
|
| Currency Abbreviations: |
|
|
|
|
|
|
|
|
| AUD |
|
Australian Dollar |
|
EUR |
|
Euro |
|
NZD |
|
New Zealand Dollar |
| BRL |
|
Brazilian Real |
|
GBP |
|
British Pound |
|
PLN |
|
Polish Zloty |
| CAD |
|
Canadian Dollar |
|
HKD |
|
Hong Kong Dollar |
|
SEK |
|
Swedish Krona |
| CHF |
|
Swiss Franc |
|
JPY |
|
Japanese Yen |
|
SGD |
|
Singapore Dollar |
| CNY |
|
Chinese Renminbi |
|
KRW |
|
South Korean Won |
|
USD |
|
United States Dollar |
| DKK |
|
Danish Krone |
|
NOK |
|
Norwegian Krone |
|
ZAR |
|
South African Rand |
|
|
|
|
|
| Exchange Abbreviations: |
|
|
|
|
|
|
|
|
| CBOE |
|
Chicago Board Options Exchange |
|
CBOT |
|
Chicago Board of Trade |
|
OTC |
|
Over-the-Counter |
|
|
|
|
|
| Index Abbreviations: |
|
|
|
|
|
|
|
|
| EAFA |
|
Europe, Australasia, and Far East Stock Index |
|
|
|
|
|
|
|
|
|
|
|
|
|
| Other Abbreviations: |
|
|
|
|
|
|
|
|
| LIBOR |
|
London Interbank Offered Rate |
|
SP-ADR |
|
Sponsored American Depositary Receipt |
|
SPDR |
|
Standard & Poor’s Depository Receipts |
| MSCI |
|
Morgan Stanley Capital International |
|
|
|
|
|
|
|
|
|
|
|
|
|
|
|
|
|
DECEMBER 31, 2011 |
|
ANNUAL REPORT |
|
29 |
Federal Income Tax Information
(Unaudited)
As required by the Internal Revenue Code (“Code”) and Treasury Regulations, if applicable, shareholders must be notified within
60 days of the Portfolio’s fiscal year end regarding the status of qualified dividend income and the dividend received deduction.
Qualified Dividend Income. Under the Jobs and
Growth Tax Relief Reconciliation Act of 2003 (the “Act”), the following percentage of ordinary dividends paid during the calendar year was designated as “qualified dividend income”, as defined in the Act, subject to reduced tax
rates in 2011:
Dividend Received Deduction. Corporate
shareholders are generally entitled to take the dividend received deduction on the portion of a Portfolio’s dividend distribution that qualifies under tax law. The percentage of the following Portfolio’s calendar year ordinary income
dividend that qualifies for the corporate dividend received deduction is set forth below:
Shareholders are advised to consult their own tax
advisor with respect to the tax consequences of their investment in the Trust. However, income received by tax-exempt recipients need not be reported as taxable income.
|
|
|
|
|
|
|
| 30 |
|
PIMCO EQUITY SERIES VIT |
|
|
|
|
Management of the Trust
(Unaudited)
The chart below identifies the Trustees and Officers of the Trust. Each “interested” Trustee as defined by the 1940 Act, is indicated by an asterisk (*).
Unless otherwise indicated, the address of all persons below is 840 Newport Center Drive, Newport Beach, CA 92660.
The Portfolio’s Statement of Additional Information includes more information about the Trustees and Officers. To request a free copy, call PIMCO at (800) 927-4648 or visit our website at
http://pvit.pimco-funds.com.
Trustees of the Trust
|
|
|
|
|
|
|
|
|
| Name, Year of Birth and Position Held with Trust |
|
Term of
Office** and
Length of
Time Served |
|
Principal Occupation(s) During Past 5 Years |
|
Number of Funds in
Fund Complex
Overseen by Trustee |
|
Other Directorships Held by Trustee |
|
|
|
|
|
| Interested Trustees |
|
|
|
|
|
|
|
|
|
|
|
|
|
| Brent R. Harris* (1959) Chairman
of the Board and Trustee |
|
03/2010 to present |
|
Managing Director and member of Executive Committee, PIMCO. |
|
156 |
|
Chairman and Trustee, PIMCO Funds, PIMCO Variable Insurance Trust, PIMCO ETF Trust, PIMCO Equity Series; Director,
StocksPLUS® Management, Inc.; and member of Board of Governors, Investment Company Institute. Board Member and Owner, Harris Holdings, LLC (1992-present). Formerly
Chairman and Director, PCM Fund, Inc. Formerly, Chairman and Director, PIMCO Strategic Global Government Fund, Inc. |
|
|
|
|
|
| Neel T. Kashkari* (1973) Trustee |
|
09/2011 to present |
|
Managing Director, PIMCO. Formerly, Interim Assistant Secretary for Financial Stability, Assistant Secretary for International Economics and Senior
Advisor to Secretary Paulson, United States Department of Treasury; Vice President, Goldman Sachs Group, Inc. |
|
6 |
|
Trustee, PIMCO Equity Series |
|
|
|
|
|
| Independent Trustees |
|
|
|
|
|
|
|
|
|
|
|
|
|
| E. Philip Cannon (1940)
Trustee |
|
03/2010 to present |
|
Private Investor. Formerly, President, Houston Zoo. |
|
156 |
|
Trustee, PIMCO Equity Series; Trustee, PIMCO ETF Trust; Trustee, PIMCO Funds; and Trustee, PIMCO Variable Insurance Trust. Formerly, Director, PCM Fund, Inc. |
|
|
|
|
|
| Vern O. Curtis (1934)
Trustee |
|
03/2010 to present |
|
Private Investor. |
|
156 |
|
Trustee, PIMCO Equity Series; Trustee, PIMCO ETF Trust; Trustee, PIMCO Funds; and Trustee, PIMCO Variable Insurance Trust. Formerly, Director, PCM Fund, Inc. |
|
|
|
|
|
| Allan B. Hubbard (1947)
Trustee |
|
02/2011 to present |
|
Chairman, E&A Holdings, Inc. (Private Holding Company). Formerly, Assistant to the President for Economic Policy and Director, National Economic Council—President George W. Bush
administration. |
|
6 |
|
Trustee, PIMCO Equity Series; Independent Director, Simon Property Group |
|
|
|
|
|
| Peter B. McCarthy (1950) Trustee |
|
09/2011 to present |
|
Formerly, Assistant Secretary and Chief Financial Officer, United States Department of Treasury; Deputy Managing Director, Institute of International
Finance. |
|
6 |
|
Trustee, PIMCO Equity Series |
* Mr. Harris and Mr. Kashkari are
“interested persons” of the Trust (as that term is defined in the 1940 Act) because of their affiliation with PIMCO.
** Trustees serve until
their successors are duly elected and qualified.
|
|
|
|
|
|
|
|
|
DECEMBER 31, 2011 |
|
ANNUAL REPORT |
|
31 |
Management of the Trust
(Unaudited)
Executive Officers
|
|
|
|
|
Name, Year of Birth and
Position Held with Trust |
|
Term of Office and
Length of Time Served |
|
Principal Occupation(s) During Past 5 Years |
|
|
|
| Neel T. Kashkari (1973)
President |
|
03/2010 to present |
|
Managing Director, PIMCO. Formerly, Interim Assistant Secretary for Financial Stability, Assistant Secretary for International Economics and Senior Advisor to Secretary Paulson, United States
Department of Treasury. |
|
|
|
| David C. Flattum (1964) Chief
Legal Officer |
|
03/2010 to present |
|
Managing Director and General Counsel, PIMCO. Formerly, Executive Vice President, PIMCO, Managing Director, Chief Operating Officer and General Counsel, Allianz Asset Management of America
L.P. and Partner at Latham & Watkins LLP. |
|
|
|
| Jennifer E. Durham (1970) Chief
Compliance Officer |
|
03/2010 to present |
|
Executive Vice President and Chief Compliance Officer, PIMCO. Formerly; Senior Vice President, PIMCO. Formerly, Vice President and Legal/Compliance Manager, PIMCO. |
|
|
|
| William H. Gross (1944) Senior
Vice President |
|
03/2010 to present |
|
Managing Director and Co-Chief Investment Officer, PIMCO. |
|
|
|
| Mohamed El-Erian (1958) Senior
Vice President |
|
03/2010 to present |
|
Managing Director, Co-Chief Investment Officer and Chief Executive Officer, PIMCO. Formerly, President and CEO of Harvard Management Company. Formerly, Managing Director,
PIMCO. |
|
|
|
| Brent R. Harris (1959) Senior
Vice President |
|
03/2010 to present |
|
Managing Director and member of Executive Committee, PIMCO. |
|
|
|
| Douglas M. Hodge (1957) Senior
Vice President |
|
03/2010 to present |
|
Managing Director; Chief Operating Officer (since 7/09); Member of Executive Committee and Head of PIMCO’s Asia Pacific region. Member Global Executive Committee, Allianz Asset
Management. |
|
|
|
| J. Stephen King, Jr. (1962)
Vice President - Senior Counsel, Secretary |
|
03/2010 to present |
|
Senior Vice President and Attorney, PIMCO. Formerly Vice President, PIMCO and Associate, Dechert LLP. |
|
|
|
| Peter G. Strelow (1970) Vice
President |
|
03/2010 to present |
|
Executive Vice President, PIMCO. Formerly, Senior Vice President and Vice President, PIMCO. |
|
|
|
| Henrik P. Larsen (1970) Vice
President |
|
03/2010 to present |
|
Senior Vice President, PIMCO. Formerly, Vice President, PIMCO. |
|
|
|
| Eric D. Johnson (1970) Vice
President |
|
05/2011 to present |
|
Senior Vice President, PIMCO. Formerly Vice President, PIMCO. |
|
|
|
| Greggory S. Wolf (1970) Vice
President |
|
05/2011 to present |
|
Senior Vice President, PIMCO. Formerly, Vice President and Manager, PIMCO. |
|
|
|
| John P. Hardaway (1957)
Treasurer |
|
03/2010 to present |
|
Executive Vice President, PIMCO. Formerly, Senior Vice President, PIMCO. |
|
|
|
| Stacie D. Anctil (1969) Assistant
Treasurer |
|
03/2010 to present |
|
Senior Vice President, PIMCO. Formerly, Vice President, PIMCO. Formerly, Specialist, PIMCO. |
|
|
|
| Erik C. Brown (1967) Assistant
Treasurer |
|
03/2010 to present |
|
Senior Vice President, PIMCO. Formerly, Vice President, PIMCO. |
|
|
|
| Trent W. Walker (1974) Assistant Treasurer |
|
03/2010 to present |
|
Senior Vice President, PIMCO. Formerly, Vice President, PIMCO. |
|
|
|
|
|
|
|
| 32 |
|
PIMCO EQUITY SERIES VIT |
|
|
|
|
Privacy Policy
(Unaudited)
The Portfolio considers customer privacy to be a fundamental aspect of its relationships with shareholders and is
committed to maintaining the confidentiality, integrity and security of its current, prospective and former shareholders’ personal information. To ensure its shareholders’ privacy, the Portfolio has developed policies that are designed to
protect this confidentiality, while allowing shareholder needs to be served.
Obtaining Personal Information
In the course of providing shareholders with products and services, the Portfolio and certain service providers to the Portfolio, such as the Portfolio’s
investment adviser (“Adviser”), may obtain non-public personal information about shareholders, which may come from sources such as account applications and other forms, from other written, electronic or verbal correspondence, from
shareholder transactions, from a shareholder’s brokerage or financial advisory firm, financial adviser or consultant, and/or from information captured on the Portfolio’s internet websites.
Respecting Your Privacy
As a matter of policy, the Portfolio does not disclose any personal or account
information provided by shareholders or gathered by the Portfolio to non-affiliated third parties, except as required or permitted by law or as necessary for such third parties to perform their agreements with respect to the Portfolio. As is common
in the industry, non-affiliated companies may from time to time be used to provide certain services, such as preparing and mailing prospectuses, reports, account statements and other information, conducting research on shareholder satisfaction and
gathering shareholder proxies. The Portfolio’s Distributor may also retain non-affiliated companies to market the Portfolio’s shares or products which use the Portfolio’s shares and enter into joint marketing agreements with other
companies. These companies may have access to a shareholder’s personal and account information, but are permitted to use this information solely to provide the specific service or as otherwise permitted by law. In most cases, the shareholders
will be clients of a third party, but the Portfolio may also provide a shareholder’s personal and account information to the shareholder’s respective brokerage or financial advisory firm.
Sharing Information with Third Parties
The Portfolio reserves the right to disclose or report personal information to
non-affiliated third parties, in limited circumstances, where the Portfolio believes in good faith that disclosure is required under law to cooperate with regulators or law enforcement authorities, to protect its rights or property or upon
reasonable request by the Portfolio in which a shareholder has chosen to invest. In addition, the Portfolio may disclose information about a shareholder’s accounts to a non-affiliated third party with the consent of the shareholder.
Sharing Information with Affiliates
The Portfolio may share shareholder information with its affiliates in connection with
servicing its shareholders’ accounts, and subject to applicable law may provide shareholders with information about products and services that the Portfolio or its Adviser, principal underwriters or their affiliates (“Service
Affiliates”) believe may be of interest to such shareholders. The information that the Portfolio shares may include, for example, a shareholder’s participation in the Portfolio or in other investment programs sponsored by a Service
Affiliate, a shareholder’s ownership of certain types of accounts (such as IRAs), or other data about a shareholder’s accounts, subject to applicable law. The Portfolio’s Service Affiliates, in turn, are not permitted to share
shareholder information with non-affiliated entities, except as required or permitted by law.
Procedures to Safeguard Private Information
The
Portfolio takes seriously the obligation to safeguard shareholder non-public personal information. In addition to this policy, the Portfolio has also implemented procedures that are designed to restrict access to a shareholder’s non-public
personal information only to internal personnel who need to know that information in order to provide products or services to such shareholders. In order to guard a shareholder’s non-public personal information, physical, electronic and
procedural safeguards are in place.
|
|
|
|
|
|
|
|
|
DECEMBER 31, 2011 |
|
ANNUAL REPORT |
|
33 |
Shareholder Meeting Results
(Unaudited)
A special meeting of shareholders of the PIMCO EqS Pathfinder Portfolio, a series of the Trust, was held on October 24, 2011 at 10:00 a.m.,
Pacific time, at 800 Newport Center Drive, 6th Floor, Newport Beach,
California 92660, pursuant to notice duly given to shareholders of the Portfolio contained in the definitive proxy statement filed with the Securities and Exchange Commission on September 20, 2011 (the “Meeting”).
At the Meeting, shareholders were asked to provide voting instructions to elect three
Trustees to the Board of Trustees. The results of the shareholder vote were as follows:
|
|
|
|
|
|
|
| |
|
Affirmative |
|
Withheld Authority |
|
Total |
| Election of Allan B. Hubbard |
|
826,831.7386 |
|
26,484.1834 |
|
853,315.9220 |
| Election of Neel T. Kashkari |
|
825,285.6172 |
|
28,030.3048 |
|
853,315.9220 |
| Election of Peter B. McCarthy |
|
826,831.7386 |
|
26,484.1834 |
|
853,315.9220 |
The other members of the Board of Trustees at the time
of the Meeting, E. Philip Cannon, Vern O. Curtis and Brent R. Harris, continue to serve as Trustees.
|
|
|
|
|
|
|
| 34 |
|
PIMCO EQUITY SERIES VIT |
|
|
|
|
Approval of Renewal of the Investment Advisory Contract and Supervision and
Administration Agreement
(Unaudited)
On August 15, 2011, the Board of Trustees (the “Board”) of PIMCO Equity Series VIT
(the “Trust”), including all of the independent Trustees, approved the Investment Advisory Contract and Supervision and Administration Agreement (together, with the Investment Advisory Contract, the “Agreements”) with Pacific
Investment Management Company LLC (“PIMCO”), on behalf of the PIMCO EqS Pathfinder PortfolioTM (the “Portfolio”), for an additional one-year term through August 31, 2012.
The information, material factors and conclusions that formed the basis for the Board’s approval of the Agreements are described below.
During the course of each
year, the Trustees receive a wide variety of materials relating to the services provided by PIMCO. At each of its quarterly meetings, the Board reviews the Portfolio’s investment performance and a significant amount of information relating to
Portfolio operations, including the Portfolio’s compliance program, shareholder services, valuation, custody, distribution, and other information relating to the nature, extent and quality of services provided by PIMCO to the Trust. In
considering whether to approve the renewal of the Agreements, the Board also reviewed supplementary information, including, but not limited to, comparative industry data with regard to investment performance, advisory and supervisory and
administrative fees and expenses, financial information regarding PIMCO, information about the personnel providing investment management services and supervisory and administrative services to the Portfolio and, if available, information about the
fees charged and services provided by PIMCO to other clients with similar investment mandates as the Portfolio. The Board also reviewed material provided by counsel to the Trust and the independent Trustees, which included, among other things,
memorandum outlining legal duties of the Board in considering the continuation of the Agreements.
In connection with the
approval of the renewal of the Agreements, the Board reviewed written materials prepared by PIMCO in response to a request from counsel to the Trust. The Board also requested and received assistance and advice regarding applicable legal standards
from Trust counsel, and reviewed comparative fee and performance data prepared at the Board’s request by Lipper, Inc. (“Lipper”), an independent provider of investment company performance and fee and expense data. The Board also heard
oral presentations on matters related to the Agreements and met both as a full Board and as the independent Trustees, without management present, at the August 15, 2011 meeting. The independent Trustees also met with counsel to the Trust on
August 4, 2011 to discuss the materials presented.
The
approval determinations were made on the basis of each Trustee’s business judgment after consideration of all the information presented. Individual Trustees may have given different weights to certain factors and assigned various degrees of
materiality to information received in connection with the approval process. In deciding to approve the renewal of the Agreements, the Board did not identify any single factor or particular information that, in isolation, was controlling. This
summary describes the most important, but not all, of the factors considered by the Board.
| 2. |
Nature, Extent and Quality of Services |
| |
A. |
PIMCO, its Personnel, and Resources |
The
Board considered the depth and quality of PIMCO’s investment management process, including: the experience, capability and integrity of its senior management and other personnel; the low turnover rates of its key personnel; the overall
financial strength and stability of its organization; and the ability of its organizational structure to address
the recent growth in assets under management. The Board also considered that PIMCO makes available to its investment professionals a variety of resources and systems relating to investment
management, compliance, trading, performance and portfolio accounting. The Board noted that PIMCO has hired and will seek to hire additional personnel with equity experience, including traders, research analysts and compliance personnel to
supplement existing PIMCO personnel. The Board considered PIMCO’s commitment to investing in information technology supporting investment management and compliance, as well as PIMCO’s continuing efforts to attract and retain qualified
personnel and to maintain and enhance its resources and systems. The Board considered PIMCO’s policies, procedures and systems to assure compliance with applicable laws and regulations and its commitment to these programs; its efforts to keep
the Trustees informed about matters relevant to the Portfolio and its shareholders; and its attention to matters that may involve conflicts of interest.
The Trustees considered the steps that PIMCO has taken in recent years with respect to active management of counterparty risk, such as implementing
procedures requiring daily collateral adjustments and frequent communication between credit analysts and the counterparty risk committee. The Trustees considered that, over the last year, PIMCO has continued to strengthen the process it uses to
assess the financial stability of broker-dealers with which the Portfolio does business, to manage collateral and to protect portfolios from an unforeseen deterioration in the creditworthiness of trading counterparties. The Trustees noted that PIMCO
continued to invest in automated documentation management systems to better track trade documentation with broker-dealers.
The Trustees also considered new services and service enhancements that PIMCO has implemented since the Agreements were approved in 2010 in
connection with the launch of the Portfolio, including, but not limited to, undertaking significant technology initiatives; broadening the PIMCO Retail Oversight (“PRO”) group to include oversight of institutional classes; implementing a
quality management system for processes/activities; converting to a prospectus content management system; developing a “Pricing Portal” to streamline and automate certain pricing functions; continuing to implement fair valuation level
assignments per FAS 157; planning to outsource net asset value delivery to another service provider to accelerate delivery timing to intermediaries; improving the review of Boston Financial Data Services’ large trade processing; implementing
new cost basis reporting obligations; and creating the PIMCO Risk Committee, which is the global risk oversight committee at PIMCO.
Ultimately, the Board concluded that the nature, extent and quality of services provided by PIMCO under the Agreements has benefited and will likely
continue to benefit the Portfolio and its shareholders.
The Board considered
PIMCO’s policies, procedures and systems to assure compliance with applicable laws and regulations and its commitment to these programs; its efforts to keep the Trustees informed about matters relevant to the Portfolio and its shareholders; and
its attention to matters that may involve conflicts of interest. The Board also considered the nature, extent, quality and cost of supervisory and administrative services provided by PIMCO to the Portfolio under the Agreements.
The Board considered the terms of Trust’s Supervision and
Administration Agreement, under which the Trust pays for the supervisory and administrative services it requires under what is essentially an all-in fee structure (the “unified fee”). In return, PIMCO provides or procures supervisory and
administrative services and bears the costs of various third party services required by the Portfolio,
|
|
|
|
|
|
|
|
|
DECEMBER 31, 2011 |
|
ANNUAL REPORT |
|
35 |
Approval of Renewal of the Investment Advisory Contract and Supervision and Administration Agreement (Cont.)
including audit, custodial, portfolio accounting, legal, transfer agency and printing costs. The Board considered PIMCO’s provision of these services and its supervision of the Trust’s
third party service providers.
Ultimately, the Board
concluded that the nature, extent and quality of the services provided by PIMCO has benefited and will likely continue to benefit the Portfolio and its shareholders.
| 3. |
Investment Performance |
The Board received and examined
information from PIMCO concerning the Portfolio’s performance for the one-year and since inception periods ended May 31, 2011 and other performance data, as available, for the periods ended June 30, 2011 (the “PIMCO Report”)
and from Lipper concerning the Portfolio’s performance, as available, for the periods ended May 31, 2011 (the “Lipper Report”). The Board noted that long-term performance information was not available due to the Portfolio’s
relatively recent commencement of operations. The Board considered the Portfolio’s investment performance relative to its peer group and benchmark index as provided to the Board in advance of each of its quarterly meetings throughout the year,
including the PIMCO Report and the Lipper Report, which were provided in advance of the August 15, 2011 meeting.
The Board discussed with PIMCO the reasons for the Portfolio’s underperformance in comparison to its benchmark index and Lipper peer group. Although the
Portfolio had underperformed in comparison to its benchmark index, the Board noted that the Portfolio had outperformed its benchmark index during periods of market downturn. The Board also considered the risk-adjusted performance of the Portfolio
and noted that the Portfolio compared favorably to competitor funds.
The
Board ultimately determined within the context of all of its considerations in connection with the Agreements, that PIMCO’s performance record and process in managing the Portfolio indicates that its continued management is likely to benefit
the Portfolio and its shareholders, and merits the approval of the continuation of the Agreements.
| 4. |
Advisory Fees, Supervisory and Administrative Fees and Total Expenses |
PIMCO reported to the Board that, in proposing fees for the Portfolio, it considers a number of factors, including the type and complexity of the services provided, the cost of providing services, the risk assumed
by PIMCO in the provision of services, the impact on potential returns from different levels of fees, the competitive marketplace for financial products, and the attractiveness of Portfolio returns to investors.
The Board reviewed the advisory fee, supervisory and administrative fee and total
expenses of the Portfolio (each as a percentage of average net assets) and compared such amounts with the average and median fees and expenses of other similar funds. With respect to advisory fees, the Board reviewed data from Lipper that compared
the average and median advisory fees of other funds in a “Peer Group Expense Comparison” of comparable funds, as well as the universe of other similar funds. The Board compared the Portfolio’s total expenses to other funds in the Peer
Group Expense Comparison provided by Lipper and found the Portfolio’s total expenses to be reasonable. The Board also noted that PIMCO had contractually agreed, through May 1, 2012, to reduce its advisory fee by 0.13% of the average daily
net assets of the Portfolio.
The Board also reviewed data comparing
the Portfolio’s advisory fees to the standard fee rate PIMCO charges to separate accounts and other investment companies with a similar investment strategy. In cases where the advisory fees for certain separate account clients were lower than
those charged to the Portfolio, the Trustees noted that the differences in fees were attributable to various factors, including differences in the services provided by PIMCO to the Portfolio, the manner in which similar portfolios may be managed,
different
requirements with respect to liquidity management and the implementation of other regulatory requirements, and the fact that separate accounts may have other contractual arrangements that justify
different levels of fees.
The Board considered the Portfolio’s
supervisory and administrative fees, comparing them to similar funds in the report supplied by Lipper. The Board considered that PIMCO has provided a broad array of fund supervisory and administrative functions. The Board also considered the
Trust’s unified fee structure, under which the Portfolio pays for the supervisory and administrative services it requires for one set fee, and in return, PIMCO provides or procures supervisory and administrative services and bears the costs of
various third party services required by the Portfolio, including audit, custodial, portfolio accounting, legal, transfer agency and printing costs. The Board noted that many other funds pay for these services separately, and thus it is difficult to
directly compare the Portfolio’s unified supervisory and administrative fees with the fees paid by other funds for administrative services alone. The Board noted that the unified supervisory and administrative fee leads to fund fees that are
fixed, rather than variable, and that fixed fees were viewed by many in the industry as a positive attribute of the Portfolio. The Board concluded that the Portfolio’s supervisory and administrative fees were reasonable in relation to the value
of the services provided, including the services provided to different classes of shareholders, and that the expenses assumed contractually by PIMCO under the Supervision and Administration Agreement represent, in effect, a cap on overall fund
expenses which is beneficial to the Portfolio and its shareholders. The Board further noted that, although the unified fee structure does not have break points, it implicitly reflects economies of scale by fixing the absolute level of Portfolio fees
at competitive levels, in effect, setting the fees as if the Portfolio was already at scale.
Based on the information presented by PIMCO and Lipper, members of the Board then determined, in the exercise of their business judgment, that the level of the advisory and supervisory and administrative fees
charged by PIMCO, as well as the total expenses of the Portfolio, are reasonable and renewal of the Agreements would likely benefit the Portfolio and its shareholders.
| 5. |
Adviser Costs, Level of Profits and Economies of Scale |
The
Board reviewed information regarding PIMCO’s costs of providing services to the Portfolio and considered that PIMCO continues to invest in the equity asset management platform and does not expect to derive any profit from the Portfolio during
its current fiscal year. The Board noted that it had also received information regarding the structure and manner in which PIMCO’s investment professionals were compensated, and PIMCO’s view of the relationship of such compensation to the
attraction and retention of quality personnel. The Board considered PIMCO’s need to invest in technology, infrastructure and staff to reinforce and offer new services and to accommodate changing regulatory requirements.
With respect to potential economies of scale, the Board found that because the unified
fee protects shareholders against unanticipated increases in expense ratios due to redemptions, declines in asset values, or increases in the costs of services provided or procured by PIMCO, economies of scale are implicitly recognized in the level
of the unified fee (which, together with the advisory fee, serves as a proxy for the Portfolio’s overall expense ratio). The Board noted that PIMCO may share the benefits of economies of scale with the Portfolio and its shareholders in a number
of ways, including through fee reductions or waivers, the pricing of the Portfolio to scale from inception and the enhancement of services provided in return for fees paid. The Trustees also considered that the unified fee has provided inherent
economies of scale by maintaining fixed fees even if the Portfolio’s operating costs rise.
The Board concluded that the Portfolio’s cost structure was reasonable and that the unified fee structure inherently involves the sharing of economies of scale between PIMCO and the Portfolio, to the benefit
of Portfolio shareholders.
|
|
|
|
|
|
|
| 36 |
|
PIMCO EQUITY SERIES VIT |
|
|
|
|
(Unaudited)
The Board considered other benefits
received by PIMCO and its affiliates as a result of PIMCO’s relationship with the Trust, including possible ancillary benefits to PIMCO’s institutional investment management business due to the reputation and market penetration of the
Portfolio. The Board also considered that affiliates of PIMCO will provide distribution and shareholder services to the Portfolio and its shareholders, for which the affiliates of PIMCO may be compensated under the unified supervisory and
administrative fee, or through distribution fees paid pursuant to the Portfolio’s Rule 12b-1 plans. The Board reviewed PIMCO’s soft dollar policies and procedures, noting that while PIMCO has the authority to receive the benefit of
research provided by broker-dealers executing portfolio transactions on behalf of the Portfolio, it has adopted a policy not to enter into contractual soft dollar arrangements.
Based on its review, including its consideration
of each of the factors referred to above, the Board concluded that the nature, extent and quality of the services rendered to the Portfolio by PIMCO continued to be excellent and favored the renewal of the Agreements. The Board concluded that the
Agreements continued to be fair and reasonable to the Portfolio and its shareholders, that the Portfolio’s shareholders received reasonable value in return for the advisory fees and other amounts paid to PIMCO by the Portfolio, and that the
approval of the Agreements was in the best interests of the Portfolio and its shareholders.
|
|
|
|
|
|
|
|
|
DECEMBER 31, 2011 |
|
ANNUAL REPORT |
|
37 |
General Information
Investment Adviser and Administrator
Pacific Investment Management Company LLC
840 Newport Center Drive
Newport Beach, CA 92660
Distributor
PIMCO Investments LLC
1633 Broadway
New York,
NY 10019
Custodian
State Street Bank and Trust Company
801 Pennsylvania
Kansas City, MO 64105
Transfer Agent
Boston Financial Data Services, Inc.
P.O. Box 55060
Boston, MA
02205-8050
Legal Counsel
Dechert LLP
1775 I Street, N.W.
Washington, D.C. 20006
Independent Registered Public Accounting Firm
PricewaterhouseCoopers LLP
1100
Walnut Street
Kansas City, MO 64106
This report is submitted for the general information of the shareholders of the PIMCO Equity Series VIT.
pvit.pimco-funds.com

EVIT02AR_123111

Your Global Investment Authority
PIMCO Equity Series VIT
Annual Report
December 31, 2011

PIMCO EqS Pathfinder Portfolio™
Share Class

Table of Contents
This material is authorized for use only when preceded
or accompanied by the current PIMCO Equity Series VIT (the “Trust”) prospectus for the Portfolio. The variable product prospectus may be obtained by contacting your Investment Consultant.
Chairman’s Letter
Dear Shareholder,
Please find enclosed the Annual Report for the PIMCO Equity Series VIT covering the
twelve-month reporting period ended December 31, 2011.
On the
following pages are specific details about the investment performance of the PIMCO EqS Pathfinder Portfolio™ and a discussion of the factors that affected performance during the reporting period. In addition, the letter from the portfolio
managers provides a further review of such factors as well as an overview of their investment strategy, philosophy, and process.
General highlights of the financial markets during our twelve-month reporting period include:
| |
n |
|
Equity markets worldwide remained volatile throughout the reporting period as investors responded to muted global economic growth prospects, rising concerns over
the European sovereign debt crisis, and political gridlock in Washington. U.S. equities, as measured by the S&P 500 Index, returned 2.11%, while global equities, as represented by the MSCI World Index, declined 5.54%. Emerging market (EM)
equities, as represented by the MSCI Emerging Markets Index, declined 18.42% and underperformed developed market equities. |
| |
n |
|
Yields on U.S. Treasury securities ended the period significantly lower (with prices on these securities therefore higher) due to a flight-to-quality brought on
by the European sovereign debt crisis. This combined with a weaker global growth outlook, resulting in increased demand for bonds of nations with perceived stronger balance sheets, top credit ratings, and independent currency and monetary policy.
The Federal Reserve kept the Federal Funds Rate anchored within a range of zero to 0.25%; the Bank of England held its key lending rate at 0.50%; and the European Central Bank reduced its main policy rate to 1.00%. The benchmark ten-year U.S.
Treasury note yielded 1.95% at the end of the reporting period, as compared to 3.29% on December 31, 2010. |
Thank you again for the trust you have placed in us. We value your commitment and will continue to work diligently to meet your broad investment needs.
|
|
|
|
|

|
|
Sincerely,

Brent R. Harris Chairman of the
Board, PIMCO Equity Series VIT January 25, 2012 |
|
|
|
|
|
|
|
|
|
DECEMBER 31, 2011 |
|
ANNUAL REPORT |
|
1 |
Important Information About the Portfolio
PIMCO Equity Series VIT (the “Trust”) is an open-end management investment company
currently consisting of one investment portfolio, the PIMCO EqS Pathfinder PortfolioTM (the “Portfolio”). The Portfolio is only available as a funding vehicle under variable life insurance policies or variable annuity contracts issued by insurance companies (“Variable
Contracts”). Individuals may not purchase shares of the Portfolio directly. Shares of the Portfolio also may be sold to qualified pension and retirement plans outside of the separate account context.
The Portfolio seeks capital appreciation by investing under normal circumstances in
equity securities, including common and preferred stock (and securities convertible into, or that PIMCO expects to be exchanged for, common or preferred stock), of issuers that PIMCO believes are undervalued. The Portfolio’s bottom-up value
investment style attempts to identify securities that are undervalued by the market in comparison to PIMCO’s own determination of the company’s value, taking into account criteria such as asset value, book value and cash flow and earnings
estimates.
The Portfolio may be subject to various risks as described in
the Portfolio’s prospectus. Some of these risks may include, but are not limited to, the following: equity risk, value investing risk, foreign (non-U.S.) investment risk, emerging markets risk, market risk, issuer risk, interest rate risk,
credit risk, high yield and distressed company risk, currency risk, liquidity risk, leveraging risk, management risk, small-cap and mid-cap company risk, arbitrage risk, derivatives risk, short sale risk, commodity risk, tax risk and subsidiary
risk. A complete description of these risks and other risks is contained in the Portfolio’s prospectus. The Portfolio may use derivative instruments for hedging purposes or as part of an investment strategy. Use of these instruments may involve
certain costs and risks such as liquidity risk, interest rate risk, market risk, credit risk, management risk, leverage risk, mispricing or improper valuation risk and the risk that the Portfolio could not close out a position when it would be most
advantageous to do so. The Portfolio could lose more than the principal amount invested in these derivative instruments.
On the Performance Summary page in this Annual Report (“Shareholder Report”), the Average Annual Total Return table and Cumulative Returns chart measure
performance assuming that any dividend and capital gain distributions were reinvested. The Portfolio measures its performance against a broad-based securities market index (benchmark index). The Portfolio’s past performance, before and after
taxes, is not necessarily an indication of how the Portfolio will perform in the future.
An investment in the Portfolio is not a deposit of a bank and is not guaranteed or insured by the Federal Deposit Insurance Corporation or any other government agency. It is possible to lose money on investments in
the Portfolio.
PIMCO has adopted written proxy voting policies and procedures (“Proxy Policy”) as required by Rule
206(4)-6 under the Investment Advisers Act of 1940, as amended. The Proxy Policy has been adopted by the Trust as the policies and procedures that PIMCO will use when voting proxies on behalf of the Portfolio. A description of the policies and
procedures that PIMCO uses to vote proxies relating to portfolio securities of the Portfolio, and information about how the Portfolio voted proxies relating to portfolio securities held during the most recent twelve-month period ended June 30th, are
available without charge, upon request, by calling the Trust at 1-800-927-4648, on the Portfolio’s website at http://pvit.pimco-funds.com, and on the Securities and Exchange Commission’s (“SEC”) website at http://www.sec.gov.
The Portfolio files a complete schedule of the Portfolio’s holdings
with the SEC for the first and third quarters of each fiscal year on Form N-Q. A copy of the Portfolio’s Form N-Q is available on the SEC’s website at http://www.sec.gov and may be reviewed and copied at the SEC’s Public Reference
Room in Washington, D.C. The Portfolio’s Form N-Q will also be available without charge, upon request, by calling the Trust at 1-800-927-4648 and on the Portfolio’s website at http://pvit.pimco-funds.com. Information on the operation of
the Public Reference Room may be obtained by calling 1-800-SEC-0330.
The
following disclosure provides important information regarding the Portfolio’s Expense Example (“Example” or “Expense Example”), which appears in this Shareholder Report. Please refer to this information when reviewing the
Expense Example for the Portfolio.
Expense Example
As a shareholder of the Portfolio, you incur two types of costs: (1) transaction costs
and (2) ongoing costs, including management fees, distribution and/or service (12b-1) fees (Advisor Class only), and other Portfolio expenses. The Example is intended to help you understand your ongoing costs (in dollars) of investing in the
Portfolio and to compare these costs with the ongoing costs of investing in other mutual funds. The Expense Example does not reflect any fees or other expenses imposed by the Variable Contracts. If it did, the expenses reflected in the Expense
Example would be higher. The Example is based on an investment of $1,000 invested at the beginning of the period and held for the entire period, from July 1, 2011 to December 31, 2011.
Actual Expenses
The information in the table under the heading “Actual Performance” provides information about actual account values and actual
expenses. You may use the information in these columns, together with the amount you invested, to estimate the expenses that you paid over the period. Simply divide your account value by $1,000 (for example, an $8,600 account value divided by $1,000
= $8.60), then multiply the
|
|
|
|
|
|
|
| 2 |
|
PIMCO EQUITY SERIES VIT |
|
|
|
|
result by the number in the appropriate column for your share class, in the row entitled “Expenses Paid During Period” to estimate the expenses you paid on your account during this
period.
Hypothetical Example for Comparison Purposes
The information in the table under the heading “Hypothetical Performance (5%
return before expenses)” provides information about hypothetical account values and hypothetical expenses based on the Portfolio’s actual expense ratio and an assumed rate of return of 5% per year before expenses, which is not the
Portfolio’s actual return. The hypothetical account values and expenses may not be used to estimate the actual ending account balance or expenses you paid for the period. You may use this information to compare the ongoing costs of investing in
the Portfolio and other portfolios. To do so, compare this 5% hypothetical example with the 5% hypothetical examples that appear in the shareholder reports of the other portfolios.
Please note that the expenses shown in the table are meant to highlight your ongoing costs only and do not reflect
any transactional costs. Therefore, the information under the heading “Hypothetical Performance (5% return before expenses)” is useful in comparing ongoing costs only, and will not help you determine the relative total costs of owning
different portfolios. In addition, if these transactional costs were included, your costs would have been higher.
Expense ratios may vary from period to period because of various factors such as an increase in expenses that are not covered by the management fees, such as fees and expenses of the independent trustees and their
counsel, extraordinary expenses and interest expense.
|
|
|
|
|
|
|
|
|
DECEMBER 31, 2011 |
|
ANNUAL REPORT |
|
3 |
Insights from the Portfolio Managers PIMCO EqS Pathfinder Portfolio™
Dear Shareholder,
Thank you to all who have invested in the PIMCO EqS Pathfinder Portfolio™ (the “Portfolio”) since its launch in April of
2010. For all those who are reading and have an interest in the Portfolio, we have organized our thoughts to update you on the current state of the investment world, on the Portfolio itself and on our outlook.
Review of the Last Period
Over the year, your investment in the Portfolio outperformed its benchmark, the MSCI
World Index, despite posting negative returns. The Portfolio’s outperformance relative to its benchmark occurred during a period marked by extremely high correlation across securities, distinct “risk on” and “risk off” modes
within the market and many professional money managers in both the long only and hedge fund world underperforming their benchmarks by wide margins due to this environment.
While the high correlation and resulting volatility in markets had an impact on the
Portfolio, our historical track record of offering reduced downside exposure stayed intact and was a critical part of outperforming the benchmark over the reporting period. In the following remarks, we’ll relate what we saw in a market that is
multifaceted to the extent that on the one hand, the earnings produced by companies are growing at an attractive rate but on the other hand, some of the macro risks we’re seeing are looming large in the background.
First, we’ll cover the positive developments we saw. Despite a global economy
that can’t be described as strong, companies in the U.S., Asia and even Europe significantly grew their earnings over the reporting period. Growth has been so persistent that many are calling for operating margin declines because it just
doesn’t seem possible that profitability can continue to expand so predictably. For example, revenues and earnings for the MSCI World Index (which includes a healthy number of areas that are perceived to be challenged in Europe and the banking
sector) grew by 6.6% and 2.6% over the year, respectively. In the U.S., as measured by the S&P 500 Index, growth was even stronger with revenues and earnings growth of 8.0% and 6.1%, respectively. Return of capital to shareholders in 2011 was up
over 40% year over year with authorized share repurchases set to be over $550 billion and dividends were up 13.5% in the same period (according to industry reports). In our opinion, this is leaving behind some very attractively valued stocks in all
economies as earnings multiples are stagnant to contracting in many cases.
Second, let’s address what we see in the broader economy, which isn’t as positive and is somewhat in contrast with what we’re seeing with many
individual companies. Over the review period, a number of negative developments came out of Europe and Asia despite a
surprising pick up in the U.S. economy. In Europe, a litany of events revolving around a lack of consensus on how to deal with the overleveraged sovereign balance sheets of peripheral countries
caused volatility in equity markets and has many evaluating the consequences of a Eurozone breakup—once an unimaginable outcome. In Asia, China’s enormous engine of global growth has been sputtering as property values have dropped by as
much as 50% in some areas and the country’s GDP is anticipated to have only expanded at a 9.2% rate in 2011, the lowest since 2009 (according to industry reports). As for the U.S., after a weak report by the Institute for Supply Management
(ISM) at the end of July 2011 and the downgrade of U.S. long-term sovereign debt from AAA to AA+ by independent credit rating agency Standard & Poor’s in early August, the S&P 500 Index experienced a steep decline and the
bears warned us of further downside. However, in a remarkable turnaround, the U.S. economy responded with report after report of better job creation and economic growth than many expected throughout the second half of the reporting period and U.S.
equity markets responded in kind, putting in a 15% advance from the bottom of the market on October 3 (as measured by the S&P 500 Index). Unfortunately, the risks in other parts of the world are likely to inevitably put pressure on the U.S.
if things continue to sour in Europe and Asia.
With these concepts
painting a picture of a tug-of-war between the good and the bad, let’s talk about some of the investment ideas in the Portfolio, including both positive and negative contributors to performance, that we find interesting and how they performed
over the reporting period.
Among the securities that contributed to
performance were the Portfolio’s investments in Phillip Morris and White Mountains Insurance.
Philip Morris
There are often negative headlines on the tobacco sector that deter many investors, but we find
intriguing for the Portfolio, including: declining volumes, litigation risk, increased taxation, plain packaging, and smoking bans. However, the tobacco industry has some characteristics that we consider unique; relatively inelastic pricing power,
growth from emerging markets, highly cash generative business models and generally shareholder friendly managements.
Our security selection process has identified significant value amongst various tobacco companies, and one of them, Philip Morris International, was our top
performer for the period under review.
Philip Morris International is the
world’s largest tobacco manufacturer (excluding China), and owns the market leading brand, Marlboro. It was spun out of the Altria Group in March 2008 (Altria retained its US operations) and owns approximately a 15.6% cigarette market share
outside the U.S. (according to industry reports). The international
|
|
|
|
|
|
|
| 4 |
|
PIMCO EQUITY SERIES VIT |
|
|
|
|
company benefits from its non-U.S. footprint, which to some extent limits its litigation risk compared to its U.S. peers, however, its acquisition of Rothmans in Canada does not make it
completely immune. We believe Philip Morris International benefits from its brand portfolio and size, its international diversification, and its strong cash flow generation. The company is also managed in a very shareholder friendly manner. After
the completion of its first $13 billion share repurchase program, management initiated another share buyback of $12 billion for 2010-2012 and then followed that with an announcement in February 2011 that it would add an additional $5 billion to the
three year repurchase plan.
Although this name had performed well through
the first seven months of the reporting period, the stock began to pull back in early August 2011 as the equity markets began to weaken on heightened fears of contagion from the European debt crisis. We seized upon the opportunity to increase our
exposure to this company and also added selectively to other positions in the portfolio.
White Mountains Insurance
Another area where we have been finding value is in the financial sector. While we
do hold what we believe to be a few select well-managed U.S. thrifts in the Portfolio, our focus has been primarily drawn to the attractive valuations we have uncovered in the property & casualty re-insurance industry. One such company that
we have owned for some time which was a particularly strong performer in the Portfolio over the reporting period was White Mountain Insurance, a Bermuda-domiciled property & casualty insurance and re-insurance business that at the beginning
of the year had a price to book value of 0.75, a 43% discount to its ten-year price-to-book average. Our analysis appears to have been confirmed by other marketplace participants as the company announced in May 2011 that it had signed a definitive
agreement to sell its Esurance and Answer Financial businesses to Allstate for $700 million in cash plus the tangible book value at the time of closing. In addition, management offered a self-tender to purchase up to 300,000 of its own shares in
September 2011. The stock of White Mountain Insurance returned 35% over the year and we continue to find the company an attractive opportunity within the Portfolio.
Among the securities that detracted from performance were the Portfolio’s
investments in Nintendo and Marine Harvest.
Nintendo
Nintendo is a company for which investors appear to have lost faith, however, as somewhat contrarian investors, it intrigues us. While we fully recognize that
Nintendo has made missteps, has wounds that are self-inflicted and faces increased competition, we believe the stock is being priced by investors at a level which anticipates a worst case scenario. The company ended the year with its stock valued at
1.3
times its book value with approximately 73% of the company’s market capitalization held in cash and cash equivalents on its balance sheet. Expectations appear to have been reset to
unreasonably low levels and investors appear to believe the company will never correct its ills, or that there will be a 3DS failure followed by a large amount of wasted money on the second generation Wii console. We, however, believe the company is
worth more than its current price implies, given the quality of its business and its intellectual property rights. Nintendo is also working hard to develop new software and hardware, which we expect to see in early 2012. We believe there is still
room for three major players in the gaming business, and that Nintendo will not only survive, but will do well.
Marine Harvest
Salmon farming is the primary business of Oslo, Norway based Marine Harvest, and to its
detriment salmon pricing has recently come under pressure due to optimistic salmon production forecasts. We see many investors believing there is going to be significant production growth coming out of Norway and Chile, two of the major
commercial salmon growing areas of the world. However, we believe the forecasts for salmon production growth coming out of Chile, in particular, might be difficult to achieve due to challenging biological conditions and prevalent
disease.
Salmon farming enjoys the lowest feed to protein conversion ratio
of any of the major sources of protein. Over the long-term, we believe the emerging markets are going to consume greater and greater quantities of protein as their per capita incomes and standards of living increase. Hence, we continue to
believe there will be increased demand for salmon in the foreseeable future.
Looking Ahead
After a tumultuous 2011 in which global equity markets on a consolidated basis either eked out a small gain or were down, we believe 2012 promises to be just as interesting, but our sense is that a flattish outcome
from equity markets for two years in a row is unlikely. This is the bi-modal world that we discuss at PIMCO where on one hand, a sizeable risk to the global economy and asset markets exists due to imbalances and stretched balance sheets, but on the
other hand, many central banks are drowning their banking systems in fiat currency (paper money declared legal tender) which could lead to a bout of reflation.
To align our portfolio with that view, we expect that high quality stocks trading at steep discounts to their intrinsic value will continue to be added to the
portfolio in addition to the ones we already own. Not only do stocks like these tend to have high margins, little financial leverage and strong cash flow generation, but they also haven’t been offered at such attractive prices in decades, in
our opinion. We’d like
|
|
|
|
|
|
|
|
|
DECEMBER 31, 2011 |
|
ANNUAL REPORT |
|
5 |
Insights from the Portfolio Managers PIMCO EqS Pathfinder
Portfolio™ (Cont.)
to think that “you can have your cake and eat it too” and stocks like these should be well positioned to benefit: if the equity market rallies strongly, we will seek to participate and
deliver a positive return. But if the equity market drops precipitously due to the external environment, we expect companies like these may be less impacted than other stocks and could ultimately have the potential to return to a normal valuation,
in our opinion. Also, we expect stocks with the ability to return capital to shareholders in the form of dividends and share buybacks will be a focus. In a world that has such a divergence in outcomes, companies that are returning cold hard cash
should be favored and if they’re buying back their stock at cheap valuations, so much the better.
To close this letter, we repeat our thanks for staying the course with the PIMCO EqS Pathfinder Portfolio™, just as we’re staying the course and sticking with our discipline of seeking capital
appreciation while also looking to help mitigate downside risk. We’re privileged to have the opportunity to steward your capital and our intent is to use all of the tools at our disposal to continue to serve in that role.
Sincerely,
|
|
|
|
|

|
|

|
|
|
|

Charles Lahr, CFA Co-Portfolio
Manager |
|

Anne Gudefin, CFA Co-Portfolio
Manager |
Top Holdings1
|
|
|
|
|
|
|
| SPDR Gold Trust |
|
|
|
|
3.60% |
|
| Imperial Tobacco Group PLC |
|
|
|
|
3.40% |
|
| British American Tobacco PLC |
|
|
|
|
3.00% |
|
| Danone |
|
|
|
|
2.50% |
|
| Microsoft Corp. |
|
|
|
|
2.40% |
|
| Intel Corp. |
|
|
|
|
2.20% |
|
| Lorillard, Inc. |
|
|
|
|
2.10% |
|
| Lancashire Holdings Ltd. |
|
|
|
|
2.10% |
|
| BP PLC |
|
|
|
|
1.90% |
|
| Koninklijke KPN NV |
|
|
|
|
1.90% |
|
Geographic Breakdown1
|
|
|
|
|
|
|
| United States |
|
|
|
|
35.5% |
|
| United Kingdom |
|
|
|
|
12.1% |
|
| France |
|
|
|
|
11.1% |
|
| Bermuda |
|
|
|
|
6.1% |
|
| Netherlands |
|
|
|
|
5.8% |
|
| Switzerland |
|
|
|
|
4.2% |
|
| Hong Kong |
|
|
|
|
3.1% |
|
| Denmark |
|
|
|
|
2.0% |
|
| Canada |
|
|
|
|
1.5% |
|
| Japan |
|
|
|
|
1.5% |
|
| Norway |
|
|
|
|
1.5% |
|
| Other |
|
|
|
|
7.7% |
|
Sector Breakdown1
|
|
|
|
|
|
|
| Consumer Staples |
|
|
|
|
27.2% |
|
| Financials |
|
|
|
|
21.6% |
|
| Information Technology |
|
|
|
|
8.5% |
|
| Industrials |
|
|
|
|
6.8% |
|
| Energy |
|
|
|
|
6.7% |
|
| Health Care |
|
|
|
|
6.7% |
|
| Consumer Discretionary |
|
|
|
|
5.3% |
|
| Exchange-Traded Funds |
|
|
|
|
3.6% |
|
| Materials |
|
|
|
|
2.9% |
|
| Telecommunication Services |
|
|
|
|
1.8% |
|
| Utilities |
|
|
|
|
0.6% |
|
| 1 |
% of Total Investments as of 12/31/2011. Top Holdings, Geographic and Sector Breakdown solely reflect long positions. Securities sold short, derivatives, and
short-term instruments are not taken into consideration. |
|
|
|
|
|
|
|
| 6 |
|
PIMCO EQUITY SERIES VIT |
|
|
|
|
PIMCO EqS Pathfinder
Portfolio™
Cumulative Returns Through December 31, 2011
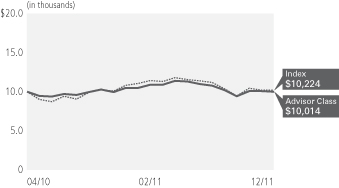
$10,000 invested at the end of the month when the Portfolio’s Advisor Class commenced operations .
|
|
|
|
|
|
|
|
|
|
|
| Average Annual Total Return for the period ended December 31, 2011 |
|
|
|
|
|
|
| |
|
|
|
1 Year |
|
|
Class Inception
(04/14/2010) |
|

|
|
PIMCO EqS Pathfinder Portfolio™ Advisor Class |
|
|
-4.72% |
|
|
|
-1.03% |
|

|
|
MSCI World Index± |
|
|
-5.54% |
|
|
|
-0.58% |
|
All Portfolio returns are net of fees and expenses.
Performance quoted represents past performance. Past performance is not
a guarantee or a reliable indicator of future results. Investment return and the principal value of an investment will fluctuate. Shares may be worth more or less than original cost when redeemed. The Portfolio’s performance does not reflect
the deduction of additional charges and expenses imposed in connection with investing in Variable Contracts, which will reduce returns. Current performance may be lower or higher than performance shown. For performance current to the most recent
month-end, visit http://pvit.pimco-funds.com. The Portfolio’s total annual operating expense ratio as stated in the Portfolio’s current prospectus, as supplemented to date, is 1.39% for Advisor Class shares.
± The MSCI World Index is a free float-adjusted market capitalization weighted
index that is designed to measure the equity market performance of developed markets. As of May 27, 2010 the MSCI World Index consisted of the following 24 developed market country indices: Australia, Austria, Belgium, Canada, Denmark, Finland,
France, Germany, Greece, Hong Kong, Ireland, Israel, Italy, Japan, Netherlands, New Zealand, Norway, Portugal, Singapore, Spain, Sweden, Switzerland, the United Kingdom, and the United States. The index represents the unhedged performance of the
constituent stocks, in US dollars. It is not possible to invest directly in an unmanaged index.
|
|
|
|
|
|
|
|
|
| Expense Example |
|
Actual Performance |
|
|
Hypothetical Performance |
|
| |
|
|
|
|
(5% return before expenses) |
|
| Beginning Account Value (07/01/11) |
|
$ |
1,000.00 |
|
|
$ |
1,000.00 |
|
| Ending Account Value (12/31/11) |
|
$ |
909.60 |
|
|
$ |
1,019.00 |
|
| Expenses Paid During Period* |
|
$ |
5.92 |
|
|
$ |
6.26 |
|
| Net Annualized Expense Ratio** |
|
|
1.23 |
% |
|
|
1.23 |
% |
* Expenses are equal to the net annualized expense
ratio for the class, multiplied by the average account value over the period, multiplied by 184/365 (to reflect the one-half year period). Overall fees and expenses of investing in the Portfolio will be higher because the example does not reflect
variable contract fees and expenses.
** The net annualized expense
ratio is reflective of any applicable waivers related to contractual agreements for voluntary fee waivers and special purpose vehicles. Details regarding fee waivers can be found in note 8 in the Notes to Financial Statements.
Please refer to the Important Information section for an explanation of the
information presented in the above Expense Example.
Portfolio Insights
| » |
|
The PIMCO EqS Pathfinder Portfolio™ seeks capital appreciation by investing under normal circumstances in equity securities, including common and preferred
stock (and securities convertible into, or that PIMCO expects to be exchanged for, common or preferred stock), of issuers that PIMCO believes are undervalued. The Portfolio’s bottom-up value investment style attempts to identify securities that
are undervalued by the market in comparison to PIMCO’s own determination of the company’s value, taking into account criteria such as asset value, book value, cash flow and earnings estimates. |
| » |
|
During the reporting period, the Portfolio’s Advisor class shares declined 4.72% after fees, and the Portfolio’s benchmark index, the MSCI
World Index, declined 5.54%. The Portfolio’s performance, although negative, outperformed its benchmark by 0.82% after fees. |
| » |
|
Holdings in Lloyds Banking, Nintendo, and Marine Harvest were notable detractors from returns as prices on these securities declined during the reporting period.
|
| » |
|
In a challenging period for equities, stock selection in the consumer staples sector helped make some notable contributions to the Portfolio’s return.
|
| » |
|
Holdings in Lorillard, Philip Morris International, and White Mountains Insurance were notable performers as prices on these securities appreciated during
the reporting period. |
| » |
|
Given the decline in the equity markets over the reporting period, the Portfolio’s market risk and currency hedging strategies, including its position in a
gold exchange-traded fund (ETF), contributed to performance as these hedging strategies appreciated in value. |
| » |
|
At the end of the reporting period, the Portfolio held approximately 83% in equities we believe are undervalued, approximately 3% (on the long side only) in
merger arbitrage investments, approximately 10% in cash equivalents, and held the balance of the portfolio in currency and market risk hedges, including approximately 4% in gold. |
|
|
|
|
|
|
|
|
|
DECEMBER 31, 2011 |
|
ANNUAL REPORT |
|
7 |
Financial Highlights PIMCO EqS
Pathfinder PortfolioTM
|
|
|
|
|
|
|
|
|
Selected Per Share Data
for the Year or Period Ended: |
|
12/31/2011 |
|
|
04/14/2010-12/31/2010 |
|
|
|
|
| Advisor Class |
|
|
|
|
|
|
|
|
| Net asset value beginning of year or period |
|
$ |
10.31 |
|
|
$ |
10.00 |
|
| Net investment income
(a) |
|
|
0.08 |
|
|
|
0.08 |
|
| Net realized/unrealized gain (loss) |
|
|
(0.57 |
) |
|
|
0.23 |
|
| Total income (loss) from investment operations |
|
|
(0.49 |
) |
|
|
0.31 |
|
| Net asset value end of year or period |
|
$ |
9.82 |
|
|
$ |
10.31 |
|
| Total return |
|
|
(4.72 |
)% |
|
|
3.10 |
% |
| Net assets end of year or period (000s) |
|
$ |
387,651 |
|
|
$ |
2,498 |
|
| Ratio of expenses to average net assets |
|
|
1.23 |
% |
|
|
1.24 |
%* |
| Ratio of expenses to average net assets excluding waivers |
|
|
1.43 |
% |
|
|
7.02 |
%* |
| Ratio of expenses to average net assets excluding interest expense and dividends on short
sales |
|
|
1.22 |
% |
|
|
1.22 |
%* |
| Ratio of expenses to average net assets excluding interest expense, dividends on short sales and
waivers |
|
|
1.42 |
% |
|
|
7.00 |
%* |
| Ratio of net investment income to average net assets |
|
|
0.83 |
% |
|
|
1.10 |
%* |
| Portfolio turnover rate |
|
|
238 |
%** |
|
|
25 |
%** |
| ** |
The ratio excludes PIMCO Short-Term Floating NAV Portfolio. |
| (a) |
Per share amounts based on average number of shares outstanding during the year or period. |
|
|
|
|
|
|
|
|
|
| 8 |
|
PIMCO EQUITY SERIES VIT |
|
|
|
|
See Accompanying Notes |
|
Consolidated Statement of Assets and Liabilities PIMCO EqS Pathfinder Portfolio™
|
|
|
|
|
| (Amounts in thousands, except per share amounts) |
|
December 31, 2011 |
|
|
|
| Assets: |
|
|
|
|
| Investments, at value |
|
$ |
416,247 |
|
| Investments in Affiliates, at value |
|
|
34,238 |
|
| Repurchase agreements, at value |
|
|
663 |
|
| Cash |
|
|
1 |
|
| Deposits with counterparty |
|
|
11,409 |
|
| Foreign currency, at value |
|
|
649 |
|
| Receivable for investments sold |
|
|
11 |
|
| Receivable for Portfolio shares sold |
|
|
94 |
|
| Interest and dividends receivable |
|
|
348 |
|
| Dividends receivable from Affiliates |
|
|
8 |
|
| Reimbursement receivable from PIMCO |
|
|
4 |
|
| Unrealized appreciation on foreign currency contracts |
|
|
4,863 |
|
| Unrealized appreciation on OTC swap agreements |
|
|
20 |
|
| |
|
|
468,555 |
|
|
|
| Liabilities: |
|
|
|
|
| Payable for investments purchased |
|
$ |
1 |
|
| Payable for investments in Affiliates purchased |
|
|
8 |
|
| Payable for short sales |
|
|
7,815 |
|
| Deposits from counterparty |
|
|
3,540 |
|
| Payable for Portfolio shares redeemed |
|
|
86 |
|
| Dividends payable |
|
|
10 |
|
| Written options outstanding |
|
|
233 |
|
| Accrued investment advisory fees |
|
|
261 |
|
| Accrued supervisory and administrative fees |
|
|
146 |
|
| Accrued distribution fees |
|
|
87 |
|
| Unrealized depreciation on foreign currency contracts |
|
|
2,259 |
|
| Unrealized depreciation on OTC swap agreements |
|
|
15 |
|
| Other liabilities |
|
|
4 |
|
| |
|
|
14,465 |
|
|
|
| Net Assets |
|
$ |
454,090 |
|
|
|
| Net Assets Consist of: |
|
|
|
|
| Paid in capital |
|
$ |
454,433 |
|
| Undistributed net investment income |
|
|
259 |
|
| Accumulated undistributed net realized (loss) |
|
|
(12,191 |
) |
| Net unrealized appreciation |
|
|
11,589 |
|
| |
|
$ |
454,090 |
|
|
|
| Net Assets: |
|
|
|
|
| Institutional Class |
|
$ |
66,439 |
|
| Advisor Class |
|
|
387,651 |
|
|
|
| Shares Issued and Outstanding: |
|
|
|
|
| Institutional Class |
|
|
6,743 |
|
| Advisor Class |
|
|
39,458 |
|
|
|
| Net Asset Value and Redemption Price Per Share (Net Asset Value Per Share Outstanding): |
|
|
|
|
| Institutional Class |
|
$ |
9.85 |
|
| Advisor Class |
|
|
9.82 |
|
|
|
| Cost of Investments |
|
$ |
407,210 |
|
| Cost of Investments in Affiliates |
|
$ |
34,237 |
|
| Cost of Repurchase Agreements |
|
$ |
663 |
|
| Cost of Foreign Currency Held |
|
$ |
650 |
|
| Proceeds Received on Short Sales |
|
$ |
7,710 |
|
| Premiums Received on Written Options |
|
$ |
372 |
|
|
|
|
|
|
|
|
| See Accompanying Notes |
|
DECEMBER 31, 2011 |
|
ANNUAL REPORT |
|
9 |
Consolidated Statement of Operations PIMCO EqS Pathfinder Portfolio™
|
|
|
|
|
| (Amounts in thousands) |
|
Year Ended
December 31, 2011 |
|
|
|
| Investment Income: |
|
|
|
|
| Interest |
|
$ |
14 |
|
| Dividends, net of foreign taxes* |
|
|
2,778 |
|
| Dividends from Affiliate investments |
|
|
33 |
|
| Total Income |
|
|
2,825 |
|
|
|
| Expenses: |
|
|
|
|
| Investment advisory fees |
|
|
1,050 |
|
| Supervisory and administrative fees |
|
|
489 |
|
| Distribution and/or servicing fees – Advisor Class |
|
|
287 |
|
| Dividends on short sales |
|
|
11 |
|
| Trustees’ fees |
|
|
60 |
|
| Interest expense |
|
|
3 |
|
| Total Expenses |
|
|
1,900 |
|
| Waiver by PIMCO |
|
|
(267 |
) |
| Net Expenses |
|
|
1,633 |
|
|
|
| Net Investment Income |
|
|
1,192 |
|
|
|
| Net Realized and Unrealized Gain (Loss): |
|
|
|
|
| Net realized (loss) on investments |
|
|
(12,410 |
) |
| Net realized gain on Affiliate investments |
|
|
3 |
|
| Net realized gain on futures contracts, written options and swaps |
|
|
255 |
|
| Net realized (loss) on short sales |
|
|
(4 |
) |
| Net realized (loss) on foreign currency transactions |
|
|
(796 |
) |
| Net change in unrealized appreciation on investments |
|
|
8,588 |
|
| Net change in unrealized appreciation on Affiliate investments |
|
|
1 |
|
| Net change in unrealized appreciation on futures contracts, written options and
swaps |
|
|
144 |
|
| Net change in unrealized appreciation on short sales |
|
|
104 |
|
| Net change in unrealized appreciation on translation of assets and liabilities denominated in
foreign currencies |
|
|
2,504 |
|
| Net (Loss) |
|
|
(1,611 |
) |
|
|
| Net (Decrease) in Net Assets Resulting from Operations |
|
$ |
(419 |
) |
|
|
| *Foreign tax withholdings – Dividends |
|
$ |
140 |
|
|
|
|
|
|
|
|
|
|
| 10 |
|
PIMCO EQUITY SERIES VIT |
|
|
|
|
See Accompanying Notes |
|
Consolidated Statements of Changes in Net Assets PIMCO EqS Pathfinder Portfolio™
|
|
|
|
|
|
|
|
|
| (Amounts In thousands) |
|
Year Ended
December 31, 2011 |
|
|
Period From
April 14, 2011-December 31, 2010 |
|
|
|
|
| Increase in Net Assets from: |
|
|
|
|
|
|
|
|
|
|
|
| Operations: |
|
|
|
|
|
|
|
|
| Net investment income |
|
$ |
1,192 |
|
|
$ |
45 |
|
| Net realized (loss) |
|
|
(12,955 |
) |
|
|
(71 |
) |
| Net realized gain on Affiliate investments |
|
|
3 |
|
|
|
0 |
|
| Net change in unrealized appreciation |
|
|
11,340 |
|
|
|
248 |
|
| Net change in unrealized appreciation on Affiliate investments |
|
|
1 |
|
|
|
0 |
|
| Net increase (decrease) resulting from operations |
|
|
(419 |
) |
|
|
222 |
|
|
|
|
| Distributions to Shareholders: |
|
|
|
|
|
|
|
|
| From net investment income |
|
|
|
|
|
|
|
|
| Institutional Class |
|
|
(75 |
) |
|
|
0 |
|
| Advisor Class |
|
|
(138 |
) |
|
|
0 |
|
|
|
|
| Total Distributions |
|
|
(213 |
) |
|
|
0 |
|
|
|
|
| Portfolio Share Transactions: |
|
|
|
|
|
|
|
|
| Net increase resulting from Portfolio share transactions** |
|
|
448,948 |
|
|
|
5,552 |
|
|
|
|
| Total Increase in Net Assets |
|
|
448,316 |
|
|
|
5,774 |
|
|
|
|
| Net Assets: |
|
|
|
|
|
|
|
|
| Beginning of year or period |
|
|
5,774 |
|
|
|
0 |
|
| End of year* |
|
$ |
454,090 |
|
|
$ |
5,774 |
|
|
|
|
| *Including undistributed net investment income of: |
|
$ |
259 |
|
|
$ |
22 |
|
| ** |
See note 11 in the Notes to Financial Statements. |
|
|
|
|
|
|
|
| See Accompanying Notes |
|
DECEMBER 31, 2011 |
|
ANNUAL REPORT |
|
11 |
Consolidated Schedule of Investments PIMCO EqS Pathfinder Portfolio™
|
|
|
|
|
|
|
|
|
|
|
|
|
| |
|
|
|
SHARES |
|
|
|
|
MARKET VALUE (000S) |
|
| COMMON STOCKS 86.6% |
|
|
|
| BERMUDA 6.1% |
|
|
|
| ENERGY 2.7% |
|
| North
Atlantic Drilling Ltd. |
|
|
|
|
3,077,543 |
|
|
$ |
|
|
4,760 |
|
| Seadrill
Ltd. |
|
|
|
|
223,835 |
|
|
|
|
|
7,464 |
|
|
|
|
|
|
|
|
|
|
|
|
|
|
|
|
|
|
|
|
|
|
|
|
|
12,224 |
|
|
|
|
|
|
|
|
|
|
|
|
|
|
|
|
| FINANCIALS 3.4% |
|
| Hiscox
Ltd. |
|
|
|
|
1,011,892 |
|
|
|
|
|
5,860 |
|
| Lancashire
Holdings Ltd. |
|
|
|
|
834,820 |
|
|
|
|
|
9,397 |
|
|
|
|
|
|
|
|
|
|
|
|
|
|
|
|
|
|
|
|
|
|
|
|
|
15,257 |
|
|
|
|
|
|
|
|
|
|
|
|
|
|
| Total Bermuda |
|
|
|
|
|
|
|
|
|
|
27,481 |
|
|
|
|
|
|
|
|
|
|
|
|
|
|
|
|
| BRAZIL 1.0% |
|
|
|
| FINANCIALS 1.0% |
|
| Itau
Unibanco Holding S.A. SP - ADR |
|
|
|
|
256,175 |
|
|
|
|
|
4,755 |
|
|
|
|
|
|
|
|
|
|
|
|
|
|
| Total Brazil |
|
|
|
|
|
|
|
|
|
|
4,755 |
|
|
|
|
|
|
|
|
|
|
|
|
|
|
|
|
| CANADA 1.5% |
|
|
|
| MATERIALS 1.5% |
|
| Cameco
Corp. |
|
|
|
|
154,112 |
|
|
|
|
|
2,782 |
|
| Kinross Gold
Corp. |
|
|
|
|
168,579 |
|
|
|
|
|
1,922 |
|
| Silver
Wheaton Corp. |
|
|
|
|
75,557 |
|
|
|
|
|
2,188 |
|
|
|
|
|
|
|
|
|
|
|
|
|
|
|
|
|
|
|
|
|
|
|
|
|
6,892 |
|
|
|
|
|
|
|
|
|
|
|
|
|
|
| Total Canada |
|
|
|
|
|
|
|
|
|
|
6,892 |
|
|
|
|
|
|
|
|
|
|
|
|
|
|
|
|
| DENMARK 2.0% |
|
|
|
| CONSUMER STAPLES 1.5% |
|
| Carlsberg
A/S |
|
|
|
|
99,326 |
|
|
|
|
|
6,994 |
|
|
|
|
|
|
|
|
|
|
|
|
|
|
|
|
| FINANCIALS 0.5% |
|
| Jyske Bank
A/S (a) |
|
|
|
|
83,722 |
|
|
|
|
|
2,052 |
|
|
|
|
|
|
|
|
|
|
|
|
|
|
| Total Denmark |
|
|
|
|
|
|
|
|
|
|
9,046 |
|
|
|
|
|
|
|
|
|
|
|
|
|
|
|
|
| FAEROE ISLANDS 0.4% |
|
|
|
| CONSUMER STAPLES 0.3% |
|
| Bakkafrost
P/F |
|
|
|
|
199,159 |
|
|
|
|
|
1,219 |
|
|
|
|
|
|
|
|
|
|
|
|
|
|
|
|
| FINANCIALS 0.1% |
|
| BankNordik
P/F |
|
|
|
|
52,480 |
|
|
|
|
|
731 |
|
|
|
|
|
|
|
|
|
|
|
|
|
|
| Total Faeroe Islands |
|
|
|
|
|
|
|
|
|
|
1,950 |
|
|
|
|
|
|
|
|
|
|
|
|
|
|
|
|
| FRANCE 10.0% |
|
|
|
| CONSUMER DISCRETIONARY 3.0% |
|
| Eutelsat
Communications S.A. |
|
|
|
|
156,431 |
|
|
|
|
|
6,093 |
|
| JCDecaux
S.A. (a) |
|
|
|
|
109,825 |
|
|
|
|
|
2,521 |
|
|
Teleperformance
S.A. |
|
|
|
|
216,278 |
|
|
|
|
|
4,805 |
|
|
|
|
|
|
|
|
|
|
|
|
|
|
|
|
|
|
|
|
|
|
|
|
|
13,419 |
|
|
|
|
|
|
|
|
|
|
|
|
|
|
|
|
| CONSUMER STAPLES 6.5% |
|
| Carrefour
S.A. |
|
|
|
|
341,156 |
|
|
|
|
|
7,762 |
|
|
Danone |
|
|
|
|
182,633 |
|
|
|
|
|
11,461 |
|
| L’Oreal
S.A. |
|
|
|
|
21,550 |
|
|
|
|
|
2,244 |
|
|
|
|
|
|
|
|
|
|
|
|
|
|
| |
|
|
|
SHARES |
|
|
|
|
MARKET VALUE (000S) |
|
|
Pernod-Ricard
S.A. |
|
|
|
|
86,614 |
|
|
$ |
|
|
8,017 |
|
|
|
|
|
|
|
|
|
|
|
|
|
|
|
|
|
|
|
|
|
|
|
|
|
29,484 |
|
|
|
|
|
|
|
|
|
|
|
|
|
|
|
|
| ENERGY 0.5% |
|
| Bourbon
S.A. |
|
|
|
|
83,881 |
|
|
|
|
|
2,297 |
|
|
|
|
|
|
|
|
|
|
|
|
|
|
| Total France |
|
|
|
|
|
|
|
|
|
|
45,200 |
|
|
|
|
|
|
|
|
|
|
|
|
|
|
|
|
| GERMANY 1.4% |
|
|
|
| HEALTH CARE 0.5% |
|
| Rhoen
Klinikum AG |
|
|
|
|
110,904 |
|
|
|
|
|
2,111 |
|
|
|
|
|
|
|
|
|
|
|
|
|
|
|
|
| INDUSTRIALS 0.3% |
|
|
Kloeckner & Co.
SE |
|
|
|
|
93,597 |
|
|
|
|
|
1,198 |
|
|
|
|
|
|
|
|
|
|
|
|
|
|
|
|
| UTILITIES 0.6% |
|
| E.ON
AG |
|
|
|
|
130,509 |
|
|
|
|
|
2,812 |
|
|
|
|
|
|
|
|
|
|
|
|
|
|
| Total Germany |
|
|
|
|
|
|
|
|
|
|
6,121 |
|
|
|
|
|
|
|
|
|
|
|
|
|
|
|
|
| GUERNSEY, CHANNEL ISLANDS 0.9% |
|
|
|
| FINANCIALS 0.9% |
|
| Resolution
Ltd. |
|
|
|
|
1,085,376 |
|
|
|
|
|
4,231 |
|
|
|
|
|
|
|
|
|
|
|
|
|
|
| Total Guernsey, Channel Islands |
|
|
|
|
|
|
|
|
|
|
4,231 |
|
|
|
|
|
|
|
|
|
|
|
|
|
|
|
|
| HONG KONG 3.0% |
|
|
|
| CONSUMER DISCRETIONARY 0.4% |
|
| Television
Broadcasts Ltd. |
|
|
|
|
286,000 |
|
|
|
|
|
1,732 |
|
|
|
|
|
|
|
|
|
|
|
|
|
|
|
|
| FINANCIALS 2.3% |
|
| AIA Group
Ltd. |
|
|
|
|
2,518,400 |
|
|
|
|
|
7,840 |
|
| First
Pacific Co. Ltd. |
|
|
|
|
2,526,000 |
|
|
|
|
|
2,627 |
|
|
|
|
|
|
|
|
|
|
|
|
|
|
|
|
|
|
|
|
|
|
|
|
|
10,467 |
|
|
|
|
|
|
|
|
|
|
|
|
|
|
|
|
| INDUSTRIALS 0.3% |
|
| Jardine
Matheson Holdings Ltd. |
|
|
|
|
20,300 |
|
|
|
|
|
954 |
|
| Jardine
Strategic Holdings Ltd. |
|
|
|
|
23,700 |
|
|
|
|
|
655 |
|
|
|
|
|
|
|
|
|
|
|
|
|
|
|
|
|
|
|
|
|
|
|
|
|
1,609 |
|
|
|
|
|
|
|
|
|
|
|
|
|
|
| Total Hong Kong |
|
|
|
|
|
|
|
|
|
|
13,808 |
|
|
|
|
|
|
|
|
|
|
|
|
|
|
|
|
| ISRAEL 0.6% |
|
|
|
| HEALTH CARE 0.6% |
|
| Teva
Pharmaceutical Industries Ltd. SP - ADR |
|
|
|
|
68,846 |
|
|
|
|
|
2,779 |
|
|
|
|
|
|
|
|
|
|
|
|
|
|
| Total Israel |
|
|
|
|
|
|
|
|
|
|
2,779 |
|
|
|
|
|
|
|
|
|
|
|
|
|
|
|
|
| JAPAN 1.5% |
|
|
|
| INFORMATION TECHNOLOGY 1.5% |
|
| Nintendo Co.
Ltd. |
|
|
|
|
48,717 |
|
|
|
|
|
6,688 |
|
|
|
|
|
|
|
|
|
|
|
|
|
|
| Total Japan |
|
|
|
|
|
|
|
|
|
|
6,688 |
|
|
|
|
|
|
|
|
|
|
|
|
|
|
|
|
| NETHERLANDS 5.8% |
|
|
|
| CONSUMER STAPLES 1.2% |
|
|
CSM |
|
|
|
|
359,506 |
|
|
|
|
|
5,588 |
|
|
|
|
|
|
|
|
|
|
|
|
|
|
|
|
|
|
|
|
|
|
|
|
|
|
|
|
|
| |
|
|
|
SHARES |
|
|
|
|
MARKET VALUE (000S) |
|
| ENERGY 0.9% |
|
| Royal Dutch
Shell PLC ‘A’ |
|
|
|
|
105,104 |
|
|
$ |
|
|
3,856 |
|
|
|
|
|
|
|
|
|
|
|
|
|
|
|
|
| FINANCIALS 1.3% |
|
| ING Groep NV
- Dutch Certificate (a) |
|
|
|
|
827,071 |
|
|
|
|
|
5,915 |
|
|
|
|
|
|
|
|
|
|
|
|
|
|
|
|
| INFORMATION TECHNOLOGY 0.5% |
|
| Gemalto
NV |
|
|
|
|
49,524 |
|
|
|
|
|
2,400 |
|
|
|
|
|
|
|
|
|
|
|
|
|
|
|
|
| TELECOMMUNICATION SERVICES 1.9% |
|
| Koninklijke
KPN NV |
|
|
|
|
698,996 |
|
|
|
|
|
8,344 |
|
|
|
|
|
|
|
|
|
|
|
|
|
|
| Total Netherlands |
|
|
|
|
|
|
|
|
|
|
26,103 |
|
|
|
|
|
|
|
|
|
|
|
|
|
|
|
|
| NORWAY 1.5% |
|
|
|
| CONSUMER STAPLES 0.9% |
|
| Marine
Harvest ASA |
|
|
|
|
9,741,864 |
|
|
|
|
|
4,201 |
|
|
|
|
|
|
|
|
|
|
|
|
|
|
|
|
| INDUSTRIALS 0.6% |
|
| Orkla
ASA |
|
|
|
|
322,316 |
|
|
|
|
|
2,400 |
|
|
|
|
|
|
|
|
|
|
|
|
|
|
| Total Norway |
|
|
|
|
|
|
|
|
|
|
6,601 |
|
|
|
|
|
|
|
|
|
|
|
|
|
|
|
|
| SINGAPORE 0.7% |
|
|
|
| FINANCIALS 0.0% |
|
| Great
Eastern Holdings Ltd. |
|
|
|
|
1,160 |
|
|
|
|
|
11 |
|
|
|
|
|
|
|
|
|
|
|
|
|
|
|
|
| INDUSTRIALS 0.7% |
|
| Keppel Corp.
Ltd. |
|
|
|
|
452,700 |
|
|
|
|
|
3,241 |
|
|
|
|
|
|
|
|
|
|
|
|
|
|
| Total Singapore |
|
|
|
|
|
|
|
|
|
|
3,252 |
|
|
|
|
|
|
|
|
|
|
|
|
|
|
|
|
| SOUTH AFRICA 0.9% |
|
|
|
| MATERIALS 0.9% |
|
| AngloGold
Ashanti Ltd. SP - ADR |
|
|
|
|
99,032 |
|
|
|
|
|
4,204 |
|
|
|
|
|
|
|
|
|
|
|
|
|
|
| Total South Africa |
|
|
|
|
|
|
|
|
|
|
4,204 |
|
|
|
|
|
|
|
|
|
|
|
|
|
|
|
|
| SOUTH KOREA 0.5% |
|
|
|
| CONSUMER DISCRETIONARY 0.5% |
|
| GS Home
Shopping, Inc. |
|
|
|
|
21,083 |
|
|
|
|
|
2,126 |
|
|
|
|
|
|
|
|
|
|
|
|
|
|
| Total South Korea |
|
|
|
|
|
|
|
|
|
|
2,126 |
|
|
|
|
|
|
|
|
|
|
|
|
|
|
|
|
| SPAIN 0.3% |
|
|
|
| CONSUMER STAPLES 0.3% |
|
|
Distribuidora Internacional de
Alimentacion S.A. (a) |
|
|
|
|
270,409 |
|
|
|
|
|
1,217 |
|
|
|
|
|
|
|
|
|
|
|
|
|
|
| Total Spain |
|
|
|
|
|
|
|
|
|
|
1,217 |
|
|
|
|
|
|
|
|
|
|
|
|
|
|
|
|
| SWEDEN 1.0% |
|
|
|
| CONSUMER DISCRETIONARY 1.0% |
|
| Loomis
AB |
|
|
|
|
315,094 |
|
|
|
|
|
4,527 |
|
|
|
|
|
|
|
|
|
|
|
|
|
|
| Total Sweden |
|
|
|
|
|
|
|
|
|
|
4,527 |
|
|
|
|
|
|
|
|
|
|
|
|
|
|
|
|
| SWITZERLAND 4.1% |
|
|
|
| CONSUMER STAPLES 1.3% |
|
| Nestle
S.A. |
|
|
|
|
105,866 |
|
|
|
|
|
6,079 |
|
|
|
|
|
|
|
|
|
|
|
|
|
|
|
|
|
|
|
|
|
|
|
|
|
| 12 |
|
PIMCO EQUITY SERIES VIT |
|
|
|
|
See Accompanying Notes |
|
December 31, 2011
|
|
|
|
|
|
|
|
|
|
|
|
|
| |
|
|
|
SHARES |
|
|
|
|
MARKET VALUE (000S) |
|
| HEALTH CARE 1.7% |
|
| Novartis
AG |
|
|
|
|
18,590 |
|
|
$ |
|
|
1,061 |
|
| Roche
Holding AG |
|
|
|
|
39,184 |
|
|
|
|
|
6,627 |
|
|
|
|
|
|
|
|
|
|
|
|
|
|
|
|
|
|
|
|
|
|
|
|
|
7,688 |
|
|
|
|
|
|
|
|
|
|
|
|
|
|
|
|
| INDUSTRIALS 0.7% |
|
| Schindler
Holding AG |
|
|
|
|
25,635 |
|
|
|
|
|
2,971 |
|
|
|
|
|
|
|
|
|
|
|
|
|
|
|
|
| MATERIALS 0.4% |
|
| Sika
AG |
|
|
|
|
1,086 |
|
|
|
|
|
2,042 |
|
|
|
|
|
|
|
|
|
|
|
|
|
|
| Total Switzerland |
|
|
|
|
|
|
|
|
|
|
18,780 |
|
|
|
|
|
|
|
|
|
|
|
|
|
|
|
|
| UNITED KINGDOM 11.9% |
|
|
|
| CONSUMER DISCRETIONARY 0.5% |
|
| British Sky
Broadcasting Group PLC |
|
|
|
|
187,957 |
|
|
|
|
|
2,138 |
|
|
|
|
|
|
|
|
|
|
|
|
|
|
|
|
| CONSUMER STAPLES 7.3% |
|
| British
American Tobacco PLC |
|
|
|
|
281,362 |
|
|
|
|
|
13,348 |
|
| Imperial
Tobacco Group PLC |
|
|
|
|
409,244 |
|
|
|
|
|
15,486 |
|
| Reckitt
Benckiser Group PLC |
|
|
|
|
87,011 |
|
|
|
|
|
4,291 |
|
|
|
|
|
|
|
|
|
|
|
|
|
|
|
|
|
|
|
|
|
|
|
|
|
33,125 |
|
|
|
|
|
|
|
|
|
|
|
|
|
|
|
|
| ENERGY 2.6% |
|
| BP
PLC |
|
|
|
|
1,205,905 |
|
|
|
|
|
8,590 |
|
| Ensco PLC SP
- ADR |
|
|
|
|
70,876 |
|
|
|
|
|
3,326 |
|
|
|
|
|
|
|
|
|
|
|
|
|
|
|
|
|
|
|
|
|
|
|
|
|
11,916 |
|
|
|
|
|
|
|
|
|
|
|
|
|
|
|
|
| FINANCIALS 1.5% |
|
| Barclays
PLC |
|
|
|
|
960,761 |
|
|
|
|
|
2,631 |
|
| Lloyds
Banking Group PLC (a) |
|
|
|
|
10,987,550 |
|
|
|
|
|
4,414 |
|
|
|
|
|
|
|
|
|
|
|
|
|
|
|
|
|
|
|
|
|
|
|
|
|
7,045 |
|
|
|
|
|
|
|
|
|
|
|
|
|
|
| Total United Kingdom |
|
|
|
|
|
54,224 |
|
|
|
|
|
|
|
|
|
|
|
|
|
|
|
|
| UNITED STATES 31.5% |
|
|
|
| CONSUMER STAPLES 7.7% |
|
| Altria
Group, Inc. |
|
|
|
|
202,101 |
|
|
|
|
|
5,992 |
|
| CVS Caremark
Corp. |
|
|
|
|
198,833 |
|
|
|
|
|
8,109 |
|
| Lorillard,
Inc. |
|
|
|
|
82,773 |
|
|
|
|
|
9,436 |
|
| Philip
Morris International, Inc. |
|
|
|
|
60,515 |
|
|
|
|
|
4,749 |
|
| Reynolds
American, Inc. |
|
|
|
|
100,007 |
|
|
|
|
|
4,142 |
|
| Wal-Mart
Stores, Inc. |
|
|
|
|
40,407 |
|
|
|
|
|
2,415 |
|
|
|
|
|
|
|
|
|
|
|
|
|
|
|
|
|
|
|
|
|
|
|
|
|
34,843 |
|
|
|
|
|
|
|
|
|
|
|
|
|
|
|
|
| FINANCIALS 9.4% |
|
| Alleghany
Corp. (a) |
|
|
|
|
11,995 |
|
|
|
|
|
3,422 |
|
| BankUnited,
Inc. |
|
|
|
|
253,745 |
|
|
|
|
|
5,580 |
|
| Berkshire
Hathaway, Inc. ‘B’ (a) |
|
|
|
|
107,753 |
|
|
|
|
|
8,221 |
|
|
|
|
|
|
|
|
|
|
|
|
|
|
| |
|
|
|
SHARES |
|
|
|
|
MARKET VALUE (000S) |
|
| Capitol
Federal Financial, Inc. |
|
|
|
|
81,325 |
|
|
$ |
|
|
938 |
|
| CBOE
Holdings, Inc. |
|
|
|
|
183,408 |
|
|
|
|
|
4,743 |
|
| Northwest
Bancshares, Inc. |
|
|
|
|
241,285 |
|
|
|
|
|
3,001 |
|
| NYSE
Euronext |
|
|
|
|
85,024 |
|
|
|
|
|
2,219 |
|
| SLM
Corp. |
|
|
|
|
256,693 |
|
|
|
|
|
3,440 |
|
| TFS
Financial Corp. (a) |
|
|
|
|
249,854 |
|
|
|
|
|
2,239 |
|
|
Transatlantic Holdings,
Inc. |
|
|
|
|
5,074 |
|
|
|
|
|
278 |
|
| ViewPoint
Financial Group |
|
|
|
|
148,867 |
|
|
|
|
|
1,937 |
|
| Washington
Federal, Inc. |
|
|
|
|
180,338 |
|
|
|
|
|
2,523 |
|
| White
Mountains Insurance Group Ltd. |
|
|
|
|
9,290 |
|
|
|
|
|
4,213 |
|
|
|
|
|
|
|
|
|
|
|
|
|
|
|
|
|
|
|
|
|
|
|
|
|
42,754 |
|
|
|
|
|
|
|
|
|
|
|
|
|
|
|
|
| HEALTH CARE 3.8% |
|
| Medco Health
Solutions, Inc. (a) |
|
|
|
|
93,828 |
|
|
|
|
|
5,245 |
|
| Pfizer,
Inc. |
|
|
|
|
328,655 |
|
|
|
|
|
7,112 |
|
| PharMerica
Corp. (a) |
|
|
|
|
45,993 |
|
|
|
|
|
698 |
|
| Synthes,
Inc. |
|
|
|
|
24,573 |
|
|
|
|
|
4,113 |
|
|
|
|
|
|
|
|
|
|
|
|
|
|
|
|
|
|
|
|
|
|
|
|
|
17,168 |
|
|
|
|
|
|
|
|
|
|
|
|
|
|
|
|
| INDUSTRIALS 4.2% |
|
| 3M
Co. |
|
|
|
|
81,802 |
|
|
|
|
|
6,686 |
|
|
Deere &
Co. |
|
|
|
|
58,707 |
|
|
|
|
|
4,541 |
|
| General
Dynamics Corp. |
|
|
|
|
36,870 |
|
|
|
|
|
2,449 |
|
| Goodrich
Corp. |
|
|
|
|
43,447 |
|
|
|
|
|
5,374 |
|
|
|
|
|
|
|
|
|
|
|
|
|
|
|
|
|
|
|
|
|
|
|
|
|
19,050 |
|
|
|
|
|
|
|
|
|
|
|
|
|
|
|
|
| INFORMATION TECHNOLOGY 6.4% |
|
| Dell, Inc.
(a) |
|
|
|
|
337,636 |
|
|
|
|
|
4,940 |
|
| Intel
Corp. |
|
|
|
|
410,262 |
|
|
|
|
|
9,949 |
|
| Microsoft
Corp. |
|
|
|
|
415,933 |
|
|
|
|
|
10,798 |
|
| Motorola
Mobility Holdings, Inc. (a) |
|
|
|
|
93,132 |
|
|
|
|
|
3,613 |
|
|
|
|
|
|
|
|
|
|
|
|
|
|
|
|
|
|
|
|
|
|
|
|
|
29,300 |
|
|
|
|
|
|
|
|
|
|
|
|
|
|
| Total United States |
|
|
|
|
|
|
|
|
|
|
143,115 |
|
|
|
|
|
|
|
|
|
|
|
|
|
|
| Total Common Stocks (Cost $381,237) |
|
|
393,100 |
|
|
|
|
|
|
|
|
|
|
|
|
|
|
|
|
| |
|
|
|
UNITS |
|
|
|
|
|
|
| EQUITY-LINKED SECURITIES 0.9% |
|
|
|
| FRANCE 0.9% |
|
|
|
| FINANCIALS 0.9% |
|
| Morgan
Stanley BV, Total S.A. - Exp. 07/19/2012 |
|
|
|
|
79,866 |
|
|
|
|
|
4,198 |
|
|
|
|
|
|
|
|
|
|
|
|
|
|
| Total Equity-Linked Securities (Cost $3,604) |
|
|
4,198 |
|
|
|
|
|
|
|
|
|
|
|
|
|
|
|
|
|
|
|
|
|
|
|
|
|
|
|
|
|
| |
|
|
|
SHARES |
|
|
|
|
MARKET VALUE (000S) |
|
| EXCHANGE-TRADED FUNDS 3.6% |
|
|
|
| UNITED STATES 3.6% |
|
| SPDR Gold Trust |
|
|
|
|
108,236 |
|
|
$ |
|
|
16,451 |
|
|
|
|
|
|
|
|
|
|
|
|
|
|
| Total Exchange-Traded Funds (Cost $18,933) |
|
|
16,451 |
|
|
|
|
|
|
|
|
|
|
|
|
|
|
|
|
| RIGHTS 0.1% |
|
|
|
| FRANCE 0.1% |
|
|
|
| HEALTH CARE 0.1% |
|
| Sanofi - Exp. 12/31/2020 |
|
|
|
|
310,070 |
|
|
|
|
|
372 |
|
|
|
|
|
|
|
|
|
|
|
|
|
|
| Total Rights (Cost $341) |
|
|
|
|
|
372 |
|
|
|
|
|
|
|
|
|
|
|
|
|
|
|
|
| |
|
|
|
PRINCIPAL
AMOUNT
(000S) |
|
|
|
|
|
|
| SHORT-TERM INSTRUMENTS 7.9% |
|
|
|
| REPURCHASE AGREEMENTS 0.1% |
|
|
State Street Bank and Trust
Co. |
|
|
|
|
| 0.010% due 01/03/2012 |
|
$ |
|
|
663 |
|
|
|
|
|
663 |
|
|
|
|
|
|
|
|
|
|
|
|
|
|
| (Dated 12/30/2011. Collateralized by Federal Home Loan Bank 0.230% due 08/28/2012 valued at $535 and Freddie Mac 5.500% due
08/20/2012 valued at $148. Repurchase proceeds are $663.) |
|
|
|
|
|
|
| U.S. TREASURY BILLS 0.2% |
|
| 0.038% due 05/31/2012 (d) |
|
|
590 |
|
|
|
|
|
590 |
|
|
|
|
|
|
|
|
|
|
|
|
|
|
|
|
| |
|
|
|
SHARES |
|
|
|
|
|
|
| PIMCO SHORT-TERM FLOATING NAV PORTFOLIO (b) 7.6% |
|
|
|
|
|
|
3,419,000 |
|
|
|
|
|
34,238 |
|
|
|
|
|
|
|
|
|
|
|
|
|
|
| Total Short-Term Instruments (Cost $35,490) |
|
|
35,491 |
|
|
|
|
|
|
|
|
|
|
|
|
|
|
|
|
| PURCHASED OPTIONS (g) 0.3% |
|
| (Cost $2,505) |
|
|
|
|
|
|
|
|
|
|
1,536 |
|
|
|
|
|
|
|
|
|
|
|
|
|
|
| Total Investments 99.4% (Cost $442,110) |
|
|
$ |
|
|
451,148 |
|
|
|
| Written Options (h) (0.1%) (Premiums $372) |
|
|
(233 |
) |
|
|
| Other Assets and Liabilities (Net) 0.7% |
|
|
3,175 |
|
|
|
|
|
|
|
|
|
|
|
|
|
|
| Net Assets 100.0% |
|
|
$ |
|
|
454,090 |
|
|
|
|
|
|
|
|
|
|
|
|
|
|
Notes to Schedule of Investments (amounts in thousands*, except number of contracts and shares):
| * |
A zero balance may reflect actual amounts rounding to less than one thousand. |
| (a) |
Non-income producing security. |
| (b) |
Affiliated to the Portfolio. |
| (c) |
Cash of $3,800 has been pledged as collateral for equity options as of December 31, 2011.
|
|
|
|
|
|
|
|
| See Accompanying Notes |
|
DECEMBER 31, 2011 |
|
ANNUAL REPORT |
|
13 |
Consolidated Schedule of Investments PIMCO EqS Pathfinder
Portfolio™
(Cont.)
| (d) |
Securities with an aggregate market value of $320 have been pledged as collateral as of December 31, 2011 for OTC
swap, swaption and foreign currency contracts as governed by International Swaps and Derivatives Association, Inc. Master Agreements. |
| (e) |
Cash of $7,609 has been pledged as collateral for securities sold short as of December 31, 2011.
|
| (f) |
OTC swap agreements outstanding on December 31, 2011: |
|
|
|
|
|
|
|
|
|
|
|
|
|
|
|
|
|
|
|
|
|
|
|
|
|
|
|
| Total Return Swaps on Securities |
|
|
|
|
|
|
|
|
|
Pay/Receive
Total Return on
Reference Entity |
|
Reference Entity |
|
# of Shares |
|
|
Financing Rate (1) |
|
Notional
Amount |
|
|
Maturity
Date |
|
|
Counterparty |
|
Unrealized
Appreciation/
(Depreciation) |
|
| Pay (2) |
|
Rio Tinto Ltd. |
|
|
23,832 |
|
|
3-Month USD-LIBOR less a specified spread |
|
|
AUD |
|
|
|
1,457 |
|
|
|
12/20/2012 |
|
|
CBK |
|
$ |
20 |
|
| Receive (2) |
|
Rio Tinto Ltd. |
|
|
30,597 |
|
|
3-Month USD-LIBOR plus a specified spread |
|
|
|
|
|
|
1,457 |
|
|
|
12/20/2012 |
|
|
CBK |
|
|
(15 |
) |
|
|
|
|
|
|
|
|
|
|
|
|
|
|
|
|
|
|
|
|
|
|
|
|
|
|
|
|
|
|
|
|
|
|
|
|
|
|
|
|
|
|
|
|
|
|
|
|
|
|
|
$ |
5 |
|
|
|
|
|
|
|
|
|
|
|
|
|
|
|
|
|
|
|
|
|
|
|
|
|
|
|
|
| (1) |
Financing rate is based upon predetermined notional amounts, which may be a multiple of the number of shares disclosed. |
| (2) |
At the maturity date, a net cash flow is exchanged where the total return is equivalent to the return of the reference entity less a financing rate, if any. As a
receiver, the Portfolio would receive payments based on any positive total return and would owe payments in the event of a negative total return. As the payer, the Portfolio would owe payments on any net positive total return, and would receive
payment in the event of a negative total return. |
| (g) |
Purchased options outstanding on December 31, 2011: |
|
|
|
|
|
|
|
|
|
|
|
|
|
|
|
|
|
|
|
|
|
| Options on Exchange-Traded Futures Contracts |
|
|
|
|
|
|
|
|
|
|
|
|
|
|
|
| Description |
|
Index
Value |
|
|
Expiration
Date |
|
|
# of
Contracts |
|
|
Cost |
|
|
Market
Value |
|
| Put - CBOT S&P 500 Index March Futures |
|
|
1,125.000 |
|
|
|
03/17/2012 |
|
|
|
105 |
|
|
$ |
389 |
|
|
$ |
192 |
|
|
|
|
|
|
|
|
|
|
|
|
|
|
|
|
|
|
|
|
|
|
|
|
|
|
|
|
|
|
|
|
|
|
|
|
|
|
|
|
|
|
|
|
|
|
|
|
|
|
|
|
|
| Foreign Currency Options |
|
|
|
|
|
|
|
|
|
|
|
|
|
|
|
|
|
|
|
|
|
|
|
| Description |
|
Counterparty |
|
Exercise
Price |
|
|
Expiration
Date |
|
|
Notional
Amount |
|
|
Cost |
|
|
Market
Value |
|
| Put - OTC EUR versus USD |
|
BPS |
|
$ |
|
|
|
|
1.200 |
|
|
|
03/13/2012 |
|
|
|
EUR |
|
|
|
13,600 |
|
|
$ |
166 |
|
|
$ |
115 |
|
| Put - OTC EUR versus USD |
|
BOA |
|
|
|
|
|
|
1.205 |
|
|
|
03/13/2012 |
|
|
|
|
|
|
|
500 |
|
|
|
10 |
|
|
|
4 |
|
| Put - OTC EUR versus USD |
|
BRC |
|
|
|
|
|
|
1.205 |
|
|
|
03/13/2012 |
|
|
|
|
|
|
|
16,500 |
|
|
|
244 |
|
|
|
150 |
|
| Put - OTC EUR versus USD |
|
MYI |
|
|
|
|
|
|
1.205 |
|
|
|
03/13/2012 |
|
|
|
|
|
|
|
10,585 |
|
|
|
138 |
|
|
|
96 |
|
|
|
|
|
|
|
|
|
|
|
|
|
|
|
|
|
|
|
|
|
|
|
|
|
|
|
|
|
|
|
|
|
|
|
|
|
|
|
|
|
|
|
|
|
|
|
|
|
|
|
|
|
|
|
|
$ |
558 |
|
|
$ |
365 |
|
|
|
|
|
|
|
|
|
|
|
|
|
|
|
|
|
|
|
|
|
|
|
|
|
|
|
|
|
|
|
|
|
|
|
|
|
|
|
|
|
|
|
|
|
|
|
|
|
|
|
|
|
| Options on Exchanged-Traded Funds |
|
|
|
|
|
|
|
|
|
|
|
|
|
|
|
| Description |
|
Strike
Price |
|
|
Expiration
Date |
|
|
# of
Contracts |
|
|
Cost |
|
|
Market
Value |
|
| Put - CBOE iShares MSCI EAFE Index Fund |
|
$ |
46.000 |
|
|
|
03/17/2012 |
|
|
|
2,930 |
|
|
$ |
700 |
|
|
$ |
425 |
|
| Put - CBOE iShares MSCI EAFE Index Fund |
|
|
48.000 |
|
|
|
03/17/2012 |
|
|
|
2,626 |
|
|
|
651 |
|
|
|
533 |
|
|
|
|
|
|
|
|
|
|
|
|
|
|
|
|
|
|
|
|
|
|
|
|
|
|
|
|
|
|
|
|
|
|
|
|
$ |
1,351 |
|
|
$ |
958 |
|
|
|
|
|
|
|
|
|
|
|
|
|
|
|
|
|
|
|
|
|
|
|
|
|
|
|
|
|
|
|
|
|
|
|
|
|
|
|
|
|
|
|
|
|
|
|
|
|
|
|
|
|
| Options on Securities |
|
|
|
|
|
|
|
|
|
|
|
|
|
|
|
|
|
|
|
|
|
|
|
| Description |
|
Counterparty |
|
Strike
Price |
|
|
Expiration
Date |
|
|
Shares |
|
|
Cost |
|
|
Market
Value |
|
| Put - OTC Johnson & Johnson, Inc. |
|
GSC |
|
|
CHF |
|
|
|
58.730 |
|
|
|
03/16/2012 |
|
|
|
CHF |
|
|
|
4,721 |
|
|
$ |
195 |
|
|
$ |
20 |
|
| Put - OTC Johnson & Johnson, Inc. |
|
FBF |
|
|
|
|
|
|
68.878 |
|
|
|
03/16/2012 |
|
|
|
|
|
|
|
113 |
|
|
|
12 |
|
|
|
1 |
|
|
|
|
|
|
|
|
|
|
|
|
|
|
|
|
|
|
|
|
|
|
|
|
|
|
|
|
|
|
|
|
|
|
|
|
|
|
|
|
|
|
|
|
|
|
|
|
|
|
|
|
|
|
|
|
$ |
207 |
|
|
$ |
21 |
|
|
|
|
|
|
|
|
|
|
|
|
|
|
|
|
|
|
|
|
|
|
|
|
|
|
|
|
|
|
|
|
| (h) |
Written options outstanding on December 31, 2011: |
|
|
|
|
|
|
|
|
|
|
|
|
|
|
|
|
|
|
|
|
|
| Options on Exchanged-Traded Funds |
|
|
|
|
|
|
|
|
|
|
|
|
|
|
|
| Description |
|
Strike
Price |
|
|
Expiration
Date |
|
|
# of
Contracts |
|
|
Premium |
|
|
Market
Value |
|
| Put - CBOE iShares MSCI EAFA Index Fund |
|
$ |
36.000 |
|
|
|
03/17/2012 |
|
|
|
2,930 |
|
|
$ |
227 |
|
|
$ |
(79 |
) |
|
|
|
|
|
|
|
|
|
|
|
|
|
|
|
|
|
|
|
|
|
Options on Securities
|
|
|
|
|
|
|
|
|
|
|
|
|
|
|
|
|
|
|
|
|
|
|
|
|
|
|
|
|
|
|
| Description |
|
Counterparty |
|
Strike
Price |
|
|
Expiration
Date |
|
|
Shares |
|
|
Premium |
|
|
Market
Value |
|
| Call - OTC Johnson & Johnson, Inc. |
|
FBF |
|
|
CHF |
|
|
|
67.610 |
|
|
|
03/16/2012 |
|
|
|
CHF |
|
|
|
42,015 |
|
|
$ |
145 |
|
|
$ |
(154 |
) |
|
|
|
|
|
|
|
|
|
|
|
|
|
|
|
|
|
|
|
|
|
|
|
|
|
|
|
|
|
|
|
|
|
|
|
|
|
|
|
|
| 14 |
|
PIMCO EQUITY SERIES VIT |
|
|
|
|
See Accompanying Notes |
|
December 31, 2011
Transactions in written call and put options for the period ended December 31, 2011:
|
|
|
|
|
|
|
|
|
|
|
|
|
|
|
|
|
|
|
|
|
| |
|
# of
Contracts |
|
|
Notional
Amount in CHF |
|
|
Notional
Amount in EUR |
|
|
Notional
Amount in GBP |
|
|
Premium |
|
| Balance at 12/31/2010 |
|
|
0 |
|
|
CHF |
1 |
|
|
EUR |
0 |
|
|
GBP |
0 |
|
|
$ |
0 |
|
| Sales |
|
|
48,066 |
|
|
|
0 |
|
|
|
4 |
|
|
|
14 |
|
|
|
778 |
|
| Closing Buys |
|
|
(2,789 |
) |
|
|
(1 |
) |
|
|
(3 |
) |
|
|
(14 |
) |
|
|
(335 |
) |
| Expirations |
|
|
0 |
|
|
|
0 |
|
|
|
0 |
|
|
|
0 |
|
|
|
0 |
|
| Exercised |
|
|
(332 |
) |
|
|
0 |
|
|
|
(1 |
) |
|
|
0 |
|
|
|
(71 |
) |
|
|
|
|
|
|
|
|
|
|
|
|
|
|
|
|
|
|
|
|
|
| Balance at 12/31/2011 |
|
|
44,945 |
|
|
CHF |
0 |
|
|
EUR |
0 |
|
|
GBP |
0 |
|
|
$ |
372 |
|
|
|
|
|
|
|
|
|
|
|
|
|
|
|
|
|
|
|
|
|
|
| (i) |
Short sales outstanding on December 31, 2011: |
|
|
|
|
|
|
|
|
|
|
|
|
|
| Description |
|
Shares |
|
|
Proceeds |
|
|
Market
Value |
|
| Deutsche Boerse AG |
|
|
39,960 |
|
|
$ |
2,274 |
|
|
$ |
(2,091 |
) |
| Express Scripts, Inc. |
|
|
76,001 |
|
|
|
3,125 |
|
|
|
(3,397 |
) |
| Temple-Inland, Inc. |
|
|
73,375 |
|
|
|
2,311 |
|
|
|
(2,327 |
) |
|
|
|
|
|
|
|
|
|
|
|
|
|
|
|
|
|
|
|
$ |
7,710 |
|
|
$ |
(7,815 |
) |
|
|
|
|
|
|
|
|
|
|
|
|
|
| (j) |
Foreign currency contracts outstanding on December 31, 2011: |
|
|
|
|
|
|
|
|
|
|
|
|
|
|
|
|
|
|
|
|
|
|
|
|
|
|
|
|
|
|
|
|
|
|
|
| Type |
|
Currency |
|
|
Principal
Amount
Covered
by Contract |
|
|
Settlement
Month |
|
|
Counterparty |
|
Unrealized
Appreciation |
|
|
Unrealized
(Depreciation) |
|
|
Net Unrealized
Appreciation/
(Depreciation) |
|
| Buy |
|
|
AUD |
|
|
|
4,972 |
|
|
|
01/2012 |
|
|
BRC |
|
$ |
128 |
|
|
$ |
0 |
|
|
$ |
128 |
|
| Buy |
|
|
|
|
|
|
4,972 |
|
|
|
01/2012 |
|
|
CBK |
|
|
133 |
|
|
|
0 |
|
|
|
133 |
|
| Buy |
|
|
|
|
|
|
4,972 |
|
|
|
01/2012 |
|
|
DUB |
|
|
133 |
|
|
|
0 |
|
|
|
133 |
|
| Sell |
|
|
|
|
|
|
4,972 |
|
|
|
01/2012 |
|
|
DUB |
|
|
0 |
|
|
|
(78 |
) |
|
|
(78 |
) |
| Sell |
|
|
|
|
|
|
4,972 |
|
|
|
01/2012 |
|
|
FBL |
|
|
0 |
|
|
|
(81 |
) |
|
|
(81 |
) |
| Sell |
|
|
|
|
|
|
4,972 |
|
|
|
01/2012 |
|
|
HUS |
|
|
0 |
|
|
|
(81 |
) |
|
|
(81 |
) |
| Buy |
|
|
|
|
|
|
4,972 |
|
|
|
02/2012 |
|
|
DUB |
|
|
78 |
|
|
|
0 |
|
|
|
78 |
|
| Buy |
|
|
|
|
|
|
4,972 |
|
|
|
02/2012 |
|
|
FBL |
|
|
81 |
|
|
|
0 |
|
|
|
81 |
|
| Buy |
|
|
|
|
|
|
4,972 |
|
|
|
02/2012 |
|
|
HUS |
|
|
81 |
|
|
|
0 |
|
|
|
81 |
|
| Buy |
|
|
BRL |
|
|
|
8,523 |
|
|
|
01/2012 |
|
|
HUS |
|
|
26 |
|
|
|
0 |
|
|
|
26 |
|
| Sell |
|
|
|
|
|
|
8,523 |
|
|
|
01/2012 |
|
|
HUS |
|
|
80 |
|
|
|
(98 |
) |
|
|
(18 |
) |
| Buy |
|
|
|
|
|
|
8,523 |
|
|
|
01/2012 |
|
|
UAG |
|
|
0 |
|
|
|
(189 |
) |
|
|
(189 |
) |
| Sell |
|
|
|
|
|
|
8,523 |
|
|
|
01/2012 |
|
|
UAG |
|
|
0 |
|
|
|
(26 |
) |
|
|
(26 |
) |
| Sell |
|
|
|
|
|
|
8,523 |
|
|
|
03/2012 |
|
|
UAG |
|
|
193 |
|
|
|
0 |
|
|
|
193 |
|
| Sell |
|
|
CAD |
|
|
|
10,440 |
|
|
|
01/2012 |
|
|
CBK |
|
|
0 |
|
|
|
(4 |
) |
|
|
(4 |
) |
| Sell |
|
|
|
|
|
|
10,440 |
|
|
|
01/2012 |
|
|
GST |
|
|
1 |
|
|
|
0 |
|
|
|
1 |
|
| Buy |
|
|
|
|
|
|
31,321 |
|
|
|
01/2012 |
|
|
RBC |
|
|
325 |
|
|
|
0 |
|
|
|
325 |
|
| Sell |
|
|
|
|
|
|
10,441 |
|
|
|
01/2012 |
|
|
UAG |
|
|
0 |
|
|
|
(2 |
) |
|
|
(2 |
) |
| Buy |
|
|
|
|
|
|
10,440 |
|
|
|
02/2012 |
|
|
CBK |
|
|
4 |
|
|
|
0 |
|
|
|
4 |
|
| Buy |
|
|
|
|
|
|
10,440 |
|
|
|
02/2012 |
|
|
GST |
|
|
0 |
|
|
|
(1 |
) |
|
|
(1 |
) |
| Buy |
|
|
|
|
|
|
10,441 |
|
|
|
02/2012 |
|
|
UAG |
|
|
2 |
|
|
|
0 |
|
|
|
2 |
|
| Buy |
|
|
CHF |
|
|
|
7,646 |
|
|
|
01/2012 |
|
|
BRC |
|
|
0 |
|
|
|
(48 |
) |
|
|
(48 |
) |
| Sell |
|
|
|
|
|
|
4,155 |
|
|
|
01/2012 |
|
|
BRC |
|
|
95 |
|
|
|
0 |
|
|
|
95 |
|
| Sell |
|
|
|
|
|
|
4,155 |
|
|
|
01/2012 |
|
|
DUB |
|
|
98 |
|
|
|
0 |
|
|
|
98 |
|
| Buy |
|
|
|
|
|
|
664 |
|
|
|
01/2012 |
|
|
JPM |
|
|
0 |
|
|
|
(11 |
) |
|
|
(11 |
) |
| Sell |
|
|
|
|
|
|
5,327 |
|
|
|
02/2012 |
|
|
BRC |
|
|
20 |
|
|
|
0 |
|
|
|
20 |
|
| Buy |
|
|
CNY |
|
|
|
63,451 |
|
|
|
02/2012 |
|
|
DUB |
|
|
66 |
|
|
|
0 |
|
|
|
66 |
|
| Buy |
|
|
|
|
|
|
21,742 |
|
|
|
02/2012 |
|
|
JPM |
|
|
22 |
|
|
|
0 |
|
|
|
22 |
|
| Buy |
|
|
DKK |
|
|
|
54,588 |
|
|
|
01/2012 |
|
|
BRC |
|
|
0 |
|
|
|
(90 |
) |
|
|
(90 |
) |
| Sell |
|
|
|
|
|
|
54,588 |
|
|
|
01/2012 |
|
|
BRC |
|
|
273 |
|
|
|
0 |
|
|
|
273 |
|
| Sell |
|
|
|
|
|
|
54,588 |
|
|
|
02/2012 |
|
|
BRC |
|
|
92 |
|
|
|
0 |
|
|
|
92 |
|
| Sell |
|
|
EUR |
|
|
|
182 |
|
|
|
01/2012 |
|
|
BRC |
|
|
6 |
|
|
|
0 |
|
|
|
6 |
|
| Sell |
|
|
|
|
|
|
23,165 |
|
|
|
01/2012 |
|
|
FBL |
|
|
965 |
|
|
|
0 |
|
|
|
965 |
|
| Buy |
|
|
|
|
|
|
30,103 |
|
|
|
01/2012 |
|
|
GST |
|
|
0 |
|
|
|
(534 |
) |
|
|
(534 |
) |
| Sell |
|
|
|
|
|
|
1,307 |
|
|
|
01/2012 |
|
|
JPM |
|
|
56 |
|
|
|
0 |
|
|
|
56 |
|
| Sell |
|
|
|
|
|
|
5,252 |
|
|
|
01/2012 |
|
|
RBC |
|
|
221 |
|
|
|
0 |
|
|
|
221 |
|
| Sell |
|
|
|
|
|
|
197 |
|
|
|
01/2012 |
|
|
UAG |
|
|
7 |
|
|
|
0 |
|
|
|
7 |
|
| Sell |
|
|
|
|
|
|
30,103 |
|
|
|
02/2012 |
|
|
GST |
|
|
536 |
|
|
|
0 |
|
|
|
536 |
|
| Buy |
|
|
GBP |
|
|
|
1,455 |
|
|
|
01/2012 |
|
|
BRC |
|
|
13 |
|
|
|
0 |
|
|
|
13 |
|
| Sell |
|
|
|
|
|
|
142 |
|
|
|
01/2012 |
|
|
BRC |
|
|
2 |
|
|
|
0 |
|
|
|
2 |
|
| Sell |
|
|
|
|
|
|
18 |
|
|
|
01/2012 |
|
|
CBK |
|
|
0 |
|
|
|
0 |
|
|
|
0 |
|
| Sell |
|
|
|
|
|
|
24,014 |
|
|
|
01/2012 |
|
|
DUB |
|
|
49 |
|
|
|
0 |
|
|
|
49 |
|
|
|
|
|
|
|
|
| See Accompanying Notes |
|
DECEMBER 31, 2011 |
|
ANNUAL REPORT |
|
15 |
Consolidated Schedule of Investments PIMCO EqS Pathfinder
Portfolio™
(Cont.)
|
|
|
|
|
|
|
|
|
|
|
|
|
|
|
|
|
|
|
|
|
|
|
|
|
|
|
|
|
|
|
|
|
|
|
| Type |
|
Currency |
|
|
Principal
Amount
Covered
by Contract |
|
|
Settlement
Month |
|
|
Counterparty |
|
Unrealized
Appreciation |
|
|
Unrealized
(Depreciation) |
|
|
Net Unrealized
Appreciation/
(Depreciation) |
|
| Sell |
|
|
GBP |
|
|
|
38 |
|
|
|
01/2012 |
|
|
GST |
|
$ |
0 |
|
|
$ |
0 |
|
|
$ |
0 |
|
| Buy |
|
|
|
|
|
|
1,244 |
|
|
|
01/2012 |
|
|
JPM |
|
|
0 |
|
|
|
(13 |
) |
|
|
(13 |
) |
| Sell |
|
|
|
|
|
|
209 |
|
|
|
01/2012 |
|
|
JPM |
|
|
1 |
|
|
|
0 |
|
|
|
1 |
|
| Buy |
|
|
|
|
|
|
21,754 |
|
|
|
01/2012 |
|
|
RBC |
|
|
0 |
|
|
|
(283 |
) |
|
|
(283 |
) |
| Sell |
|
|
|
|
|
|
32 |
|
|
|
01/2012 |
|
|
UAG |
|
|
0 |
|
|
|
0 |
|
|
|
0 |
|
| Sell |
|
|
|
|
|
|
21,754 |
|
|
|
02/2012 |
|
|
RBC |
|
|
283 |
|
|
|
0 |
|
|
|
283 |
|
| Sell |
|
|
HKD |
|
|
|
24,752 |
|
|
|
02/2012 |
|
|
UAG |
|
|
0 |
|
|
|
(9 |
) |
|
|
(9 |
) |
| Buy |
|
|
JPY |
|
|
|
2,842,754 |
|
|
|
01/2012 |
|
|
UAG |
|
|
0 |
|
|
|
(90 |
) |
|
|
(90 |
) |
| Sell |
|
|
|
|
|
|
2,842,754 |
|
|
|
01/2012 |
|
|
UAG |
|
|
0 |
|
|
|
(338 |
) |
|
|
(338 |
) |
| Buy |
|
|
|
|
|
|
2,842,754 |
|
|
|
02/2012 |
|
|
UAG |
|
|
335 |
|
|
|
0 |
|
|
|
335 |
|
| Buy |
|
|
KRW |
|
|
|
5,351,710 |
|
|
|
02/2012 |
|
|
CBK |
|
|
0 |
|
|
|
(190 |
) |
|
|
(190 |
) |
| Sell |
|
|
|
|
|
|
2,349,864 |
|
|
|
02/2012 |
|
|
DUB |
|
|
54 |
|
|
|
0 |
|
|
|
54 |
|
| Sell |
|
|
NOK |
|
|
|
28,116 |
|
|
|
01/2012 |
|
|
FBL |
|
|
62 |
|
|
|
0 |
|
|
|
62 |
|
| Buy |
|
|
|
|
|
|
27,289 |
|
|
|
01/2012 |
|
|
GST |
|
|
0 |
|
|
|
(24 |
) |
|
|
(24 |
) |
| Sell |
|
|
|
|
|
|
28,117 |
|
|
|
01/2012 |
|
|
GST |
|
|
63 |
|
|
|
0 |
|
|
|
63 |
|
| Buy |
|
|
|
|
|
|
27,289 |
|
|
|
01/2012 |
|
|
HUS |
|
|
0 |
|
|
|
(22 |
) |
|
|
(22 |
) |
| Buy |
|
|
|
|
|
|
2,482 |
|
|
|
01/2012 |
|
|
JPM |
|
|
0 |
|
|
|
(16 |
) |
|
|
(16 |
) |
| Buy |
|
|
|
|
|
|
27,289 |
|
|
|
01/2012 |
|
|
MSC |
|
|
0 |
|
|
|
(25 |
) |
|
|
(25 |
) |
| Sell |
|
|
|
|
|
|
28,116 |
|
|
|
01/2012 |
|
|
UAG |
|
|
99 |
|
|
|
0 |
|
|
|
99 |
|
| Sell |
|
|
|
|
|
|
27,289 |
|
|
|
02/2012 |
|
|
GST |
|
|
24 |
|
|
|
0 |
|
|
|
24 |
|
| Sell |
|
|
|
|
|
|
27,289 |
|
|
|
02/2012 |
|
|
HUS |
|
|
22 |
|
|
|
0 |
|
|
|
22 |
|
| Buy |
|
|
|
|
|
|
1,737 |
|
|
|
02/2012 |
|
|
MSC |
|
|
3 |
|
|
|
0 |
|
|
|
3 |
|
| Sell |
|
|
|
|
|
|
27,289 |
|
|
|
02/2012 |
|
|
MSC |
|
|
24 |
|
|
|
0 |
|
|
|
24 |
|
| Buy |
|
|
NZD |
|
|
|
97 |
|
|
|
01/2012 |
|
|
CBK |
|
|
2 |
|
|
|
0 |
|
|
|
2 |
|
| Sell |
|
|
|
|
|
|
97 |
|
|
|
01/2012 |
|
|
CBK |
|
|
0 |
|
|
|
(1 |
) |
|
|
(1 |
) |
| Buy |
|
|
|
|
|
|
96 |
|
|
|
01/2012 |
|
|
DUB |
|
|
2 |
|
|
|
0 |
|
|
|
2 |
|
| Sell |
|
|
|
|
|
|
97 |
|
|
|
01/2012 |
|
|
FBL |
|
|
0 |
|
|
|
(1 |
) |
|
|
(1 |
) |
| Buy |
|
|
|
|
|
|
97 |
|
|
|
01/2012 |
|
|
HUS |
|
|
2 |
|
|
|
0 |
|
|
|
2 |
|
| Sell |
|
|
|
|
|
|
97 |
|
|
|
01/2012 |
|
|
HUS |
|
|
0 |
|
|
|
(1 |
) |
|
|
(1 |
) |
| Buy |
|
|
|
|
|
|
97 |
|
|
|
02/2012 |
|
|
CBK |
|
|
1 |
|
|
|
0 |
|
|
|
1 |
|
| Buy |
|
|
|
|
|
|
97 |
|
|
|
02/2012 |
|
|
FBL |
|
|
1 |
|
|
|
0 |
|
|
|
1 |
|
| Buy |
|
|
|
|
|
|
97 |
|
|
|
02/2012 |
|
|
HUS |
|
|
1 |
|
|
|
0 |
|
|
|
1 |
|
| Sell |
|
|
PLN |
|
|
|
17 |
|
|
|
02/2012 |
|
|
CBK |
|
|
1 |
|
|
|
0 |
|
|
|
1 |
|
| Sell |
|
|
SEK |
|
|
|
14,276 |
|
|
|
01/2012 |
|
|
BRC |
|
|
2 |
|
|
|
0 |
|
|
|
2 |
|
| Buy |
|
|
|
|
|
|
14,276 |
|
|
|
01/2012 |
|
|
DUB |
|
|
7 |
|
|
|
0 |
|
|
|
7 |
|
| Buy |
|
|
|
|
|
|
14,276 |
|
|
|
02/2012 |
|
|
BRC |
|
|
0 |
|
|
|
(3 |
) |
|
|
(3 |
) |
| Buy |
|
|
SGD |
|
|
|
572 |
|
|
|
02/2012 |
|
|
JPM |
|
|
2 |
|
|
|
0 |
|
|
|
2 |
|
| Sell |
|
|
ZAR |
|
|
|
12,645 |
|
|
|
01/2012 |
|
|
CBK |
|
|
39 |
|
|
|
0 |
|
|
|
39 |
|
| Sell |
|
|
|
|
|
|
499 |
|
|
|
01/2012 |
|
|
HUS |
|
|
2 |
|
|
|
0 |
|
|
|
2 |
|
| Sell |
|
|
|
|
|
|
21,992 |
|
|
|
01/2012 |
|
|
JPM |
|
|
45 |
|
|
|
0 |
|
|
|
45 |
|
|
|
|
|
|
|
|
|
|
|
|
|
|
|
|
|
|
|
|
|
|
|
|
|
|
|
|
|
|
|
|
|
|
|
|
|
|
|
|
|
|
|
|
$ |
4,863 |
|
|
$ |
(2,259 |
) |
|
$ |
2,604 |
|
|
|
|
|
|
|
|
|
|
|
|
|
|
|
|
|
|
|
|
|
|
|
|
|
|
|
|
| (k) |
Fair Value
Measurements (1) |
The following is a summary of the fair valuations according to the inputs used as of December 31, 2011 in valuing the Portfolio’s
assets and liabilities (2):
|
|
|
|
|
|
|
|
|
|
|
|
|
|
|
|
|
| Category and Subcategory (3) |
|
Level 1 (4) |
|
|
Level 2 (5) |
|
|
Level 3 (6) |
|
|
Fair
Value at
12/31/2011 |
|
| Investments, at
value |
|
|
|
|
|
|
|
|
|
|
|
|
|
|
|
|
| Common Stocks |
|
|
|
|
|
|
|
|
|
|
|
|
|
|
|
|
| Bermuda |
|
|
|
|
|
|
|
|
|
|
|
|
|
|
|
|
| Energy |
|
$ |
4,760 |
|
|
$ |
7,464 |
|
|
$ |
0 |
|
|
$ |
12,224 |
|
| Financials |
|
|
0 |
|
|
|
15,257 |
|
|
|
0 |
|
|
|
15,257 |
|
| Brazil |
|
|
|
|
|
|
|
|
|
|
|
|
|
|
|
|
| Financials |
|
|
4,755 |
|
|
|
0 |
|
|
|
0 |
|
|
|
4,755 |
|
| Canada |
|
|
|
|
|
|
|
|
|
|
|
|
|
|
|
|
| Materials |
|
|
6,892 |
|
|
|
0 |
|
|
|
0 |
|
|
|
6,892 |
|
| Denmark |
|
|
|
|
|
|
|
|
|
|
|
|
|
|
|
|
| Consumer Staples |
|
|
0 |
|
|
|
6,994 |
|
|
|
0 |
|
|
|
6,994 |
|
| Financials |
|
|
0 |
|
|
|
2,052 |
|
|
|
0 |
|
|
|
2,052 |
|
| Faeroe Islands |
|
|
|
|
|
|
|
|
|
|
|
|
|
|
|
|
| Consumer Staples |
|
|
1,219 |
|
|
|
0 |
|
|
|
0 |
|
|
|
1,219 |
|
| Financials |
|
|
731 |
|
|
|
0 |
|
|
|
0 |
|
|
|
731 |
|
| France |
|
|
|
|
|
|
|
|
|
|
|
|
|
|
|
|
| Consumer Discretionary |
|
|
0 |
|
|
|
13,419 |
|
|
|
0 |
|
|
|
13,419 |
|
|
|
|
|
|
|
|
|
|
|
|
|
|
|
|
|
|
| Category and Subcategory (3) |
|
Level 1 (4) |
|
|
Level 2 (5) |
|
|
Level 3 (6) |
|
|
Fair
Value at
12/31/2011 |
|
| Consumer Staples |
|
$ |
0 |
|
|
$ |
29,484 |
|
|
$ |
0 |
|
|
$ |
29,484 |
|
| Energy |
|
|
0 |
|
|
|
2,297 |
|
|
|
0 |
|
|
|
2,297 |
|
| Germany |
|
|
|
|
|
|
|
|
|
|
|
|
|
|
|
|
| Health Care |
|
|
0 |
|
|
|
2,111 |
|
|
|
0 |
|
|
|
2,111 |
|
| Industrials |
|
|
0 |
|
|
|
1,198 |
|
|
|
0 |
|
|
|
1,198 |
|
| Utilities |
|
|
0 |
|
|
|
2,812 |
|
|
|
0 |
|
|
|
2,812 |
|
| Guernsey, Channel Islands |
|
|
|
|
|
|
|
|
|
|
|
|
|
|
|
|
| Financials |
|
|
0 |
|
|
|
4,231 |
|
|
|
0 |
|
|
|
4,231 |
|
| Hong Kong |
|
|
|
|
|
|
|
|
|
|
|
|
|
|
|
|
| Consumer Discretionary |
|
|
0 |
|
|
|
1,732 |
|
|
|
0 |
|
|
|
1,732 |
|
| Financials |
|
|
0 |
|
|
|
10,467 |
|
|
|
0 |
|
|
|
10,467 |
|
| Industrials |
|
|
0 |
|
|
|
1,609 |
|
|
|
0 |
|
|
|
1,609 |
|
| Israel |
|
|
|
|
|
|
|
|
|
|
|
|
|
|
|
|
| Health Care |
|
|
2,779 |
|
|
|
0 |
|
|
|
0 |
|
|
|
2,779 |
|
| Japan |
|
|
|
|
|
|
|
|
|
|
|
|
|
|
|
|
| Information Technology |
|
|
0 |
|
|
|
6,688 |
|
|
|
0 |
|
|
|
6,688 |
|
|
|
|
|
|
|
|
|
|
| 16 |
|
PIMCO EQUITY SERIES VIT |
|
|
|
|
See Accompanying Notes |
|
December 31, 2011
|
|
|
|
|
|
|
|
|
|
|
|
|
|
|
|
|
| Category and Subcategory (3) |
|
Level 1 (4) |
|
|
Level 2 (5) |
|
|
Level 3 (6) |
|
|
Fair
Value at
12/31/2011 |
|
| Netherlands |
|
|
|
|
|
|
|
|
|
|
|
|
|
|
|
|
| Consumer Staples |
|
$ |
0 |
|
|
$ |
5,588 |
|
|
$ |
0 |
|
|
$ |
5,588 |
|
| Energy |
|
|
0 |
|
|
|
3,856 |
|
|
|
0 |
|
|
|
3,856 |
|
| Financials |
|
|
0 |
|
|
|
5,915 |
|
|
|
0 |
|
|
|
5,915 |
|
| Information Technology |
|
|
0 |
|
|
|
2,400 |
|
|
|
0 |
|
|
|
2,400 |
|
| Telecommunication Services |
|
|
0 |
|
|
|
8,344 |
|
|
|
0 |
|
|
|
8,344 |
|
| Norway |
|
|
|
|
|
|
|
|
|
|
|
|
|
|
|
|
| Consumer Staples |
|
|
0 |
|
|
|
4,201 |
|
|
|
0 |
|
|
|
4,201 |
|
| Industrials |
|
|
0 |
|
|
|
2,400 |
|
|
|
0 |
|
|
|
2,400 |
|
| Singapore |
|
|
|
|
|
|
|
|
|
|
|
|
|
|
|
|
| Financials |
|
|
0 |
|
|
|
11 |
|
|
|
0 |
|
|
|
11 |
|
| Industrials |
|
|
0 |
|
|
|
3,241 |
|
|
|
0 |
|
|
|
3,241 |
|
| South Africa |
|
|
|
|
|
|
|
|
|
|
|
|
|
|
|
|
| Materials |
|
|
4,204 |
|
|
|
0 |
|
|
|
0 |
|
|
|
4,204 |
|
| South Korea |
|
|
|
|
|
|
|
|
|
|
|
|
|
|
|
|
| Consumer Discretionary |
|
|
0 |
|
|
|
2,126 |
|
|
|
0 |
|
|
|
2,126 |
|
| Spain |
|
|
|
|
|
|
|
|
|
|
|
|
|
|
|
|
| Consumer Staples |
|
|
0 |
|
|
|
1,217 |
|
|
|
0 |
|
|
|
1,217 |
|
| Sweden |
|
|
|
|
|
|
|
|
|
|
|
|
|
|
|
|
| Consumer Discretionary |
|
|
0 |
|
|
|
4,527 |
|
|
|
0 |
|
|
|
4,527 |
|
| Switzerland |
|
|
|
|
|
|
|
|
|
|
|
|
|
|
|
|
| Consumer Staples |
|
|
0 |
|
|
|
6,079 |
|
|
|
0 |
|
|
|
6,079 |
|
| Health Care |
|
|
0 |
|
|
|
7,688 |
|
|
|
0 |
|
|
|
7,688 |
|
| Industrials |
|
|
0 |
|
|
|
2,971 |
|
|
|
0 |
|
|
|
2,971 |
|
| Materials |
|
|
0 |
|
|
|
2,042 |
|
|
|
0 |
|
|
|
2,042 |
|
| United Kingdom |
|
|
|
|
|
|
|
|
|
|
|
|
|
|
|
|
| Consumer Discretionary |
|
|
0 |
|
|
|
2,138 |
|
|
|
0 |
|
|
|
2,138 |
|
| Consumer Staples |
|
|
0 |
|
|
|
33,125 |
|
|
|
0 |
|
|
|
33,125 |
|
| Energy |
|
|
3,326 |
|
|
|
8,590 |
|
|
|
0 |
|
|
|
11,916 |
|
| Financials |
|
|
0 |
|
|
|
7,045 |
|
|
|
0 |
|
|
|
7,045 |
|
| United States |
|
|
|
|
|
|
|
|
|
|
|
|
|
|
|
|
| Consumer Staples |
|
|
34,843 |
|
|
|
0 |
|
|
|
0 |
|
|
|
34,843 |
|
| Financials |
|
|
42,754 |
|
|
|
0 |
|
|
|
0 |
|
|
|
42,754 |
|
| Health Care |
|
|
13,055 |
|
|
|
4,113 |
|
|
|
0 |
|
|
|
17,168 |
|
|
|
|
|
|
|
|
|
|
|
|
|
|
|
|
|
|
| Category and Subcategory (3) |
|
Level 1 (4) |
|
|
Level 2 (5) |
|
|
Level 3 (6) |
|
|
Fair
Value at
12/31/2011 |
|
| Industrials |
|
$ |
19,050 |
|
|
$ |
0 |
|
|
$ |
0 |
|
|
$ |
19,050 |
|
| Information Technology |
|
|
29,300 |
|
|
|
0 |
|
|
|
0 |
|
|
|
29,300 |
|
| Equity-Linked Securities |
|
|
|
|
|
|
|
|
|
|
|
|
|
|
|
|
| France |
|
|
0 |
|
|
|
4,198 |
|
|
|
0 |
|
|
|
4,198 |
|
| Exchange-Traded Funds |
|
|
|
|
|
|
|
|
|
|
|
|
|
|
|
|
| United States |
|
|
16,451 |
|
|
|
0 |
|
|
|
0 |
|
|
|
16,451 |
|
| Rights |
|
|
|
|
|
|
|
|
|
|
|
|
|
|
|
|
| France |
|
|
|
|
|
|
|
|
|
|
|
|
|
|
|
|
| Health Care |
|
|
372 |
|
|
|
0 |
|
|
|
0 |
|
|
|
372 |
|
| Short-Term Instruments |
|
|
|
|
|
|
|
|
|
|
|
|
|
|
|
|
| Repurchase Agreements |
|
|
0 |
|
|
|
663 |
|
|
|
0 |
|
|
|
663 |
|
| U.S. Treasury Bills |
|
|
0 |
|
|
|
590 |
|
|
|
0 |
|
|
|
590 |
|
| PIMCO Short-Term Floating NAV Portfolio |
|
|
34,238 |
|
|
|
0 |
|
|
|
0 |
|
|
|
34,238 |
|
| Purchased Options |
|
|
|
|
|
|
|
|
|
|
|
|
|
|
|
|
| Equity Contracts |
|
|
1,150 |
|
|
|
0 |
|
|
|
21 |
|
|
|
1,171 |
|
| Foreign Exchange Contracts |
|
|
0 |
|
|
|
365 |
|
|
|
0 |
|
|
|
365 |
|
|
|
$ |
219,879 |
|
|
$ |
231,248 |
|
|
$ |
21 |
|
|
$ |
451,148 |
|
|
|
|
|
|
| Short Sales, at
value |
|
$ |
(5,724 |
) |
|
$ |
(2,091 |
) |
|
$ |
0 |
|
|
$ |
(7,815 |
) |
|
|
Financial Derivative
Instruments (7) - Assets |
|
| Equity Contracts |
|
|
0 |
|
|
|
20 |
|
|
|
0 |
|
|
|
20 |
|
| Foreign Exchange Contracts |
|
|
0 |
|
|
|
4,863 |
|
|
|
0 |
|
|
|
4,863 |
|
|
|
$ |
0 |
|
|
$ |
4,883 |
|
|
$ |
0 |
|
|
$ |
4,883 |
|
|
|
Financial Derivative Instruments (7) - Liabilities |
|
| Equity Contracts |
|
|
(79 |
) |
|
|
(15 |
) |
|
|
(154 |
) |
|
|
(248 |
) |
| Foreign Exchange Contracts |
|
|
0 |
|
|
|
(2,259 |
) |
|
|
0 |
|
|
|
(2,259 |
) |
|
|
$ |
(79 |
) |
|
$ |
(2,274 |
) |
|
$ |
(154 |
) |
|
$ |
(2,507 |
) |
|
|
|
|
|
| Totals |
|
$ |
214,076 |
|
|
$ |
231,766 |
|
|
$ |
(133 |
) |
|
$ |
445,709 |
|
The following is a reconciliation of
the fair valuations using significant unobservable inputs (Level 3) for the Portfolio during the period ended December 31, 2011:
|
|
|
|
|
|
|
|
|
|
|
|
|
|
|
|
|
|
|
|
|
|
|
|
|
|
|
|
|
|
|
|
|
|
|
|
|
|
|
|
|
| Category and Subcategory (3) |
|
Beginning
Balance
at
12/31/2010 |
|
|
Net
Purchases (8) |
|
|
Net
Sales (8) |
|
|
Accrued
Discounts/
(Premiums) |
|
|
Realized
Gain/(Loss) |
|
|
Net Change in
Unrealized
Appreciation/
(Depreciation) (9) |
|
|
Transfers
into
Level 3 |
|
|
Transfers
out
of Level 3 |
|
|
Ending
Balance
at
12/31/2011 |
|
|
Net Change in
Unrealized
Appreciation/
(Depreciation)
on
Investments
Held at
12/31/2011 (9) |
|
| Investments, at
value |
|
|
|
|
|
|
|
|
|
|
|
|
|
|
|
|
|
|
|
|
|
|
|
|
|
|
|
|
|
|
|
|
|
|
|
|
|
|
|
|
| Purchased Options |
|
|
|
|
|
|
|
|
|
|
|
|
|
|
|
|
|
|
|
|
|
|
|
|
|
|
|
|
|
|
|
|
|
|
|
|
|
|
|
|
| Equity Contracts |
|
$ |
0 |
|
|
$ |
207 |
|
|
$ |
0 |
|
|
$ |
0 |
|
|
$ |
0 |
|
|
$ |
(186 |
) |
|
$ |
0 |
|
|
$ |
0 |
|
|
$ |
21 |
|
|
$ |
(186 |
) |
|
|
|
|
|
|
|
|
|
|
|
|
|
|
|
|
|
|
|
|
|
|
|
|
|
|
|
|
|
|
|
|
|
|
|
|
|
|
|
|
|
|
|
|
Financial Derivative
Instruments (7) - Assets |
|
|
|
|
|
| Equity Contracts |
|
$ |
0 |
|
|
$ |
0 |
|
|
$ |
(146 |
) |
|
$ |
0 |
|
|
$ |
0 |
|
|
$ |
(8 |
) |
|
$ |
0 |
|
|
$ |
0 |
|
|
$ |
(154 |
) |
|
$ |
(8 |
) |
|
|
|
|
|
|
|
|
|
|
|
|
|
|
|
|
|
|
|
|
|
|
|
|
|
|
|
|
|
|
|
|
|
|
|
|
|
|
|
|
|
| Totals |
|
$ |
0 |
|
|
$ |
207 |
|
|
$ |
(146 |
) |
|
$ |
0 |
|
|
$ |
0 |
|
|
$ |
(194 |
) |
|
$ |
0 |
|
|
$ |
0 |
|
|
$ |
(133 |
) |
|
$ |
(194 |
) |
|
|
|
|
|
|
|
|
|
|
|
|
|
|
|
|
|
|
|
|
|
|
|
|
|
|
|
|
|
|
|
|
|
|
|
|
|
|
|
|
|
| (1) |
See note 3 in the Notes to Financial Statements for more information regarding pricing inputs and valuation techniques. |
| (2) |
There were no significant transfers into or out of level 1, 2, and 3 during the period ended December 31, 2011. |
| (3) |
Refer to the Schedule of Investments for additional information.
|
| (4) |
Quoted prices in active markets for identical investments. |
| (5) |
Significant other observable inputs. |
| (6) |
Significant unobservable inputs. |
| (7) |
Financial Derivative Instruments may include open futures contracts, swap agreements, written options, and foreign currency contracts.
|
| (8) |
Net Purchases and Sales for Financial Derivative Instruments may include payments made or received upon entering into swap agreements to compensate for
differences between the stated terms of the swap agreement and prevailing market conditions. |
| (9) |
Any difference between Net Change in Unrealized Appreciation/(Depreciation) and Net Change in Unrealized Appreciation/(Depreciation) on Investments Held at
12/31/2011 may be due to an investment no longer held or categorized as level 3 at period end. |
|
|
|
|
|
|
|
| See Accompanying Notes |
|
DECEMBER 31, 2011 |
|
ANNUAL REPORT |
|
17 |
Consolidated Schedule of Investments PIMCO EqS Pathfinder
Portfolio™
(Cont.)
December 31, 2011
| (l) |
Fair Value of Financial Derivative Instruments (1) |
The following is a summary of the fair valuation of the Portfolio’s derivative instruments categorized by risk exposure:
Fair Values of Financial Derivative Instruments on the Statement of Assets and
Liabilities as of December 31, 2011:
|
|
|
|
|
|
|
|
|
|
|
|
|
|
|
|
|
|
|
|
|
|
|
|
|
| |
|
Derivatives not accounted for as hedging instruments |
|
| |
|
Commodity
Contracts |
|
|
Credit
Contracts |
|
|
Equity
Contracts |
|
|
Foreign
Exchange
Contracts |
|
|
Interest
Rate Contracts |
|
|
Total |
|
|
Assets: |
|
|
|
|
|
|
|
|
|
|
|
|
|
|
|
|
|
|
|
|
|
|
|
|
| Investments, at value (purchased options) |
|
$ |
0 |
|
|
$ |
0 |
|
|
$ |
1,171 |
|
|
$ |
365 |
|
|
$ |
0 |
|
|
$ |
1,536 |
|
| Unrealized appreciation on foreign currency contracts |
|
|
0 |
|
|
|
0 |
|
|
|
0 |
|
|
|
4,863 |
|
|
|
0 |
|
|
|
4,863 |
|
| Unrealized appreciation on OTC swap agreements |
|
|
0 |
|
|
|
0 |
|
|
|
20 |
|
|
|
0 |
|
|
|
0 |
|
|
|
20 |
|
|
|
|
|
|
|
|
|
|
|
|
|
|
|
|
|
|
|
|
|
|
|
|
|
|
|
|
$ |
0 |
|
|
$ |
0 |
|
|
$ |
1,191 |
|
|
$ |
5,228 |
|
|
$ |
0 |
|
|
$ |
6,419 |
|
|
|
|
|
|
|
|
|
|
|
|
|
|
|
|
|
|
|
|
|
|
|
|
|
|
|
|
|
|
|
|
|
|
Liabilities:
|
|
|
|
|
|
|
|
|
|
|
|
|
|
|
|
|
|
|
|
|
|
|
|
|
| Written options outstanding |
|
$ |
0 |
|
|
$ |
0 |
|
|
$ |
233 |
|
|
$ |
0 |
|
|
$ |
0 |
|
|
$ |
233 |
|
| Unrealized depreciation on foreign currency contracts |
|
|
0 |
|
|
|
0 |
|
|
|
0 |
|
|
|
2,259 |
|
|
|
0 |
|
|
|
2,259 |
|
| Unrealized depreciation on OTC swap agreements |
|
|
0 |
|
|
|
0 |
|
|
|
15 |
|
|
|
0 |
|
|
|
0 |
|
|
|
15 |
|
|
|
|
|
|
|
|
|
|
|
|
|
|
|
|
|
|
|
|
|
|
|
|
|
|
|
|
$ |
0 |
|
|
$ |
0 |
|
|
$ |
248 |
|
|
$ |
2,259 |
|
|
$ |
0 |
|
|
$ |
2,507 |
|
|
|
|
|
|
|
|
|
|
|
|
|
|
|
|
|
|
|
|
|
|
|
|
|
|
The Effect of Financial Derivative Instruments on
the Statement of Operations for the Period Ended December 31, 2011:
|
|
|
|
|
|
|
|
|
|
|
|
|
|
|
|
|
|
|
|
|
|
|
|
|
| |
|
Derivatives not accounted for as hedging instruments |
|
| |
|
Commodity
Contracts |
|
|
Credit
Contracts |
|
|
Equity
Contracts |
|
|
Foreign
Exchange
Contracts |
|
|
Interest
Rate Contracts |
|
|
Total |
|
| Realized Gain
(Loss) on Derivatives Recognized as a Result from Operations: |
|
|
|
|
|
|
|
|
|
|
|
|
|
|
|
|
|
|
|
|
|
|
|
|
| Net realized (loss) on investments (purchased options) |
|
$ |
0 |
|
|
$ |
0 |
|
|
$ |
(1,730 |
) |
|
$ |
0 |
|
|
$ |
(545 |
) |
|
$ |
(2,275 |
) |
| Net realized gain on futures contracts, written options and swaps |
|
|
0 |
|
|
|
0 |
|
|
|
255 |
|
|
|
0 |
|
|
|
0 |
|
|
|
255 |
|
| Net realized (loss) on foreign currency transactions |
|
|
0 |
|
|
|
0 |
|
|
|
0 |
|
|
|
(576 |
) |
|
|
0 |
|
|
|
(576 |
) |
|
|
|
|
|
|
|
|
|
|
|
|
|
|
|
|
|
|
|
|
|
|
|
|
|
|
|
$ |
0 |
|
|
$ |
0 |
|
|
$ |
(1,475 |
) |
|
$ |
(576 |
) |
|
$ |
(545 |
) |
|
$ |
(2,596 |
) |
|
|
|
|
|
|
|
|
|
|
|
|
|
|
|
|
|
|
|
|
|
|
|
|
|
|
|
|
|
|
|
|
| Net Change in
Unrealized Appreciation (Depreciation) on Derivatives Recognized as a Result of Operations: |
|
|
|
|
|
|
|
|
|
|
|
|
|
|
|
|
|
|
|
|
|
|
|
|
| Net change in unrealized (depreciation) on investments (purchased options) |
|
$ |
0 |
|
|
$ |
0 |
|
|
$ |
(776 |
) |
|
$ |
(193 |
) |
|
$ |
0 |
|
|
$ |
(969 |
) |
| Net change in unrealized appreciation on futures contracts, written options and swaps |
|
|
0 |
|
|
|
0 |
|
|
|
144 |
|
|
|
0 |
|
|
|
0 |
|
|
|
144 |
|
| Net change in unrealized appreciation on translation of assets and liabilities denominated in foreign currencies |
|
|
0 |
|
|
|
0 |
|
|
|
0 |
|
|
|
2,602 |
|
|
|
0 |
|
|
|
2,602 |
|
|
|
|
|
|
|
|
|
|
|
|
|
|
|
|
|
|
|
|
|
|
|
|
|
|
|
|
$ |
0 |
|
|
$ |
0 |
|
|
$ |
(632 |
) |
|
$ |
2,409 |
|
|
$ |
0 |
|
|
$ |
1,777 |
|
|
|
|
|
|
|
|
|
|
|
|
|
|
|
|
|
|
|
|
|
|
|
|
|
|
| (1) |
See note 5 in the Notes to Financial Statements for additional information.
|
| (m) |
Collateral (Received)/Pledged for OTC Financial Derivative Instruments |
The following is a summary by counterparty of the market value of OTC financial
derivative instruments and collateral (received)/pledged as of December 31, 2011:
|
|
|
|
|
|
|
|
|
|
|
|
|
|
|
|
|
|
|
|
|
|
|
|
|
|
|
|
|
| Counterparty |
|
|
|
Total Market
Value of OTC
Derivatives |
|
|
Collateral
(Received)/Pledged |
|
|
Net Exposures (1) |
|
|
|
|
Total Market
Value of OTC
Derivatives |
|
|
Collateral
(Received)/Pledged |
|
|
Net Exposures (1) |
|
| |
|
|
|
PIMCO EqS Pathfinder
PortfolioTM |
|
|
|
|
PIMCO Cayman Commodity Portfolio III Ltd. (Subsidiary) |
|
| BOA |
|
|
|
$ |
4 |
|
|
$ |
0 |
|
|
$ |
4 |
|
|
|
|
$ |
0 |
|
|
$ |
0 |
|
|
$ |
0 |
|
| BPS |
|
|
|
|
115 |
|
|
|
0 |
|
|
|
115 |
|
|
|
|
|
0 |
|
|
|
0 |
|
|
|
0 |
|
| BRC |
|
|
|
|
640 |
|
|
|
(590 |
) |
|
|
50 |
|
|
|
|
|
0 |
|
|
|
0 |
|
|
|
0 |
|
| CBK |
|
|
|
|
(10 |
) |
|
|
0 |
|
|
|
(10 |
) |
|
|
|
|
0 |
|
|
|
0 |
|
|
|
0 |
|
| DUB |
|
|
|
|
409 |
|
|
|
(480 |
) |
|
|
(71 |
) |
|
|
|
|
0 |
|
|
|
0 |
|
|
|
0 |
|
| FBF |
|
|
|
|
(153 |
) |
|
|
0 |
|
|
|
(153 |
) |
|
|
|
|
0 |
|
|
|
0 |
|
|
|
0 |
|
| FBL |
|
|
|
|
1,027 |
|
|
|
(1,050 |
) |
|
|
(23 |
) |
|
|
|
|
0 |
|
|
|
0 |
|
|
|
0 |
|
| GSC |
|
|
|
|
20 |
|
|
|
0 |
|
|
|
20 |
|
|
|
|
|
0 |
|
|
|
0 |
|
|
|
0 |
|
| GST |
|
|
|
|
65 |
|
|
|
0 |
|
|
|
65 |
|
|
|
|
|
0 |
|
|
|
0 |
|
|
|
0 |
|
| HUS |
|
|
|
|
12 |
|
|
|
0 |
|
|
|
12 |
|
|
|
|
|
0 |
|
|
|
0 |
|
|
|
0 |
|
| JPM |
|
|
|
|
86 |
|
|
|
(290 |
) |
|
|
(204 |
) |
|
|
|
|
0 |
|
|
|
0 |
|
|
|
0 |
|
| MSC |
|
|
|
|
2 |
|
|
|
(150 |
) |
|
|
(148 |
) |
|
|
|
|
0 |
|
|
|
0 |
|
|
|
0 |
|
| MYI |
|
|
|
|
96 |
|
|
|
(890 |
) |
|
|
(794 |
) |
|
|
|
|
0 |
|
|
|
0 |
|
|
|
0 |
|
| RBC |
|
|
|
|
546 |
|
|
|
(380 |
) |
|
|
166 |
|
|
|
|
|
0 |
|
|
|
0 |
|
|
|
0 |
|
| UAG |
|
|
|
|
(18 |
) |
|
|
320 |
|
|
|
302 |
|
|
|
|
|
0 |
|
|
|
0 |
|
|
|
0 |
|
| (1) |
Net Exposure represents the net receivable/(payable) that would be due from/to the counterparty in the event of default. Exposure from OTC derivatives can only
be netted across transactions governed under the same Master Agreement with the same legal entity. The Portfolio and subsidiary are recognized as two separate legal entities. As such, exposure cannot be netted. See note 6 Principal Risks in the
Notes to Financial Statements for more information regarding Credit and Counterparties Risk. |
|
|
|
|
|
|
|
|
|
| 18 |
|
PIMCO EQUITY SERIES VIT |
|
|
|
|
See Accompanying Notes |
|
Notes to Financial Statements
December 31, 2011
1. ORGANIZATION
The PIMCO EqS Pathfinder PortfolioTM (the “Portfolio”) is a series of the PIMCO Equity Series VIT (the
“Trust”). The Trust is registered under the Investment Company Act of 1940, as amended (the “Act”), as an open-end management investment company organized as a Delaware statutory trust on December 28, 2009. The Portfolio
currently offers two classes of shares: Institutional and Advisor. Information presented on these financial statements pertains to the Advisor Class of the Portfolio. Certain detailed financial information for the Institutional Class is provided
separately and is available upon request. The Trust is designed to be used as an investment vehicle by separate accounts of insurance companies that fund variable annuity contracts and variable life insurance policies and by qualified pension and
retirement plans.
2. SIGNIFICANT ACCOUNTING POLICIES
The following is a summary of significant accounting policies
consistently followed by the Portfolio in the preparation of its financial statements in conformity with accounting principles generally accepted in the United States of America (“U.S. GAAP”). The preparation of financial statements in
accordance with U.S. GAAP may require management to make estimates and assumptions that affect the reported amounts of assets and liabilities and disclosure of contingent assets and liabilities at the date of the financial statements and the
reported amounts of increases and decreases in net assets from operations during the reporting period. Actual results could differ from those estimates.
(a) Determination of Net Asset Value The Net Asset
Value (“NAV”) of the Portfolio’s shares is valued as of the close of regular trading (normally 4:00 p.m., Eastern time) (the “NYSE Close”) on each day that the New York Stock Exchange (“NYSE”) is open.
Information that becomes known to the Portfolio or its agents after the NAV has been calculated on a particular day will not generally be used to retroactively adjust the price of a security or the NAV determined earlier that day.
(b) Securities Transactions and
Investment Income Securities transactions are recorded as of the trade date for financial reporting purposes. Realized gains and losses from securities sold are recorded on the
identified cost basis. Dividend income is recorded on the ex-dividend date, except certain dividends from foreign securities where the ex-dividend date may have passed, which are recorded as soon as the Portfolio is informed of the ex-dividend date.
Interest income, adjusted for the accretion of discounts and amortization of premiums, is recorded on the accrual basis from settlement date. Estimated tax liabilities on certain foreign securities are recorded on an accrual basis and are reflected
as components of interest income or a net change in unrealized gain/loss on investments on the Consolidated Statement of Operations, as appropriate. Tax liabilities realized as a result of such security sales are reflected as a component of net
realized gain/loss on investments on the Consolidated Statement of Operations. Income or short-term capital gain distributions received from underlying funds are recorded as dividend income. Long-term capital gain distributions received from
underlying funds are recorded as realized gains.
(c) Foreign Currency Translation Portfolio securities and other assets and liabilities denominated in foreign currencies are translated into U.S.
dollars based on the exchange rate of such currencies against U.S. dollars on the date of valuation. Purchases and sales of securities, income and expense items denominated in foreign currencies are translated into U.S. dollars at the exchange rate
in effect on the transaction date.
The Portfolio does not separately report
the effect of changes in foreign exchange rates from changes in market prices on securities held. Such changes are included in net realized and unrealized gain or loss from investments on the Consolidated Statement of Operations.
Realized foreign exchange gains or losses arise from sales of foreign currencies,
currency gains or losses realized between the trade and settlement dates on securities transactions and the difference between the recorded amounts of
dividend, interest, and foreign withholding taxes and the U.S. dollar equivalent of the amounts actually received or paid. Net unrealized foreign exchange gains and losses arise from changes in
foreign exchange rates on foreign denominated assets and liabilities other than investments in securities held at the end of the reporting period.
(d) Multiclass Operations Each class offered by
the Portfolio has equal rights as to assets and voting privileges (except that shareholders of a class have exclusive voting rights regarding any matter relating solely to that class of shares). Income and non-class specific expenses are allocated
daily to each class on the basis of the relative net assets. Realized and unrealized capital gains and losses of each class are allocated daily based on the relative net assets of each class of the Portfolio. Class specific expenses, where
applicable, currently include supervisory and administrative and distribution and servicing fees.
(e) Dividends and Distributions to Shareholders Dividends from net investment income, if any, are
declared and distributed to shareholders annually. Net realized capital gains earned by the Portfolio, if any, will be distributed no less frequently than once each year.
Income dividends and capital gain distributions are determined in accordance with
income tax regulations which may differ from U.S. GAAP. Differences between tax regulations and U.S. GAAP may change the fiscal year when income and capital items are recognized for tax and U.S. GAAP purposes. Examples of events that give rise to
timing differences include wash sales and capital loss carryforwards. Further, the character of investment income and capital gains may be different for certain transactions under the two methods of accounting. Examples of characterization
differences include the treatment of swaps, foreign currency transactions and investments in passive foreign investment companies. As a result, income dividends and capital gain distributions declared during a fiscal period may differ significantly
from the net investment income and realized capital gain reported on the Portfolio’s annual financial statements presented under U.S. GAAP.
Distributions classified as a tax basis return of capital, if any, are reflected on the accompanying Consolidated Statements of Changes in Net Assets and have been
reclassified to paid in capital. In addition, other amounts have been reclassified between undistributed net investment income, accumulated undistributed net realized gains or losses and/or paid in capital to more appropriately conform financial
accounting to tax characterizations of dividend distributions.
(f) New Accounting Pronouncements In April 2011, the Financial Accounting Standards Board (“FASB”) issued an Accounting Standards Update
(“ASU”) related to the accounting for repurchase agreements and similar agreements that both entitle and obligate a transferor to repurchase or redeem financial assets before their maturity. The ASU modifies the criteria for determining
effective control of transferred assets and as a result certain agreements may now be accounted for as secured borrowings. The ASU is effective prospectively for new transfers and existing transactions that are modified in the first interim or
annual period beginning on or after December 15, 2011. Management anticipates the Portfolio may incur additional borrowing expenses (interest expense) as a result of the change of accounting treatment. The magnitude of this change has not been
determined at this time.
In May 2011, FASB issued an ASU to develop common
requirements for measuring fair value and for disclosing information about fair value measurements in accordance with U.S. GAAP and International Financial Reporting Standards (“IFRS”). FASB concluded that the amendments in this ASU will
improve the comparability of fair value measurements presented and disclosed in financial statements prepared in accordance with U.S. GAAP and IFRS. The ASU is effective prospectively during interim or annual periods beginning on or after
December 15, 2011. At this time, management is evaluating the implications of these changes and their impact on the financial statements have not been determined.
|
|
|
|
|
|
|
|
|
DECEMBER 31, 2011 |
|
ANNUAL REPORT |
|
19 |
Notes to Financial Statements (Cont.)
3. INVESTMENT VALUATION
AND FAIR VALUE MEASUREMENTS
For purposes of calculating the NAV,
portfolio securities and other assets for which market quotes are readily available are valued at fair market value. Fair market value is generally determined on the basis of last reported sales prices, or if no sales are reported, based on quotes
obtained from a quotation reporting system, established market makers, or pricing services.
Investments initially valued in currencies other than the U.S. dollar are converted to the U.S. dollar using exchange rates obtained from pricing service providers. As a result, the NAV of the Portfolio’s
shares may be affected by changes in the value of currencies in relation to the U.S. dollar. The value of securities traded in markets outside the United States or denominated in currencies other than the U.S. dollar may be affected significantly on
a day that the NYSE is closed and the NAV may change on days when an investor is not able to purchase, redeem or exchange shares.
U.S. GAAP defines fair market value as the price that the Portfolio would receive to sell an asset or pay to transfer a liability in an orderly transaction between
market participants at the measurement date. It establishes a fair value hierarchy that prioritizes inputs to valuation methods and requires disclosure of the fair value hierarchy, separately for each major category of assets and liabilities, that
segregates fair value measurements into levels (Level 1, 2, and 3). The inputs or methodology used for valuing securities are not necessarily an indication of the risk associated with investing in those securities. Levels 1, 2, and 3 of the
fair value hierarchy are defined as follows:
| |
• |
|
Level 1—Inputs using quoted prices in active markets or exchanges for identical assets and liabilities. |
| |
• |
|
Level 2—Significant other observable inputs, which may include, but are not limited to, quoted prices for similar assets or liabilities in markets that are
active, quoted prices for identical or similar assets or liabilities in markets that are not active, inputs other than quoted prices that are observable for the assets or liabilities (such as interest rates, yield curves, volatilities, prepayment
speeds, loss severities, credit risks and default rates) or other market corroborated inputs. |
| |
• |
|
Level 3—Significant unobservable inputs based on the best information available in the circumstances, to the extent observable inputs are not available,
which may include assumptions made by the Board of Trustees (the “Board”) or persons acting at their direction that are used in determining the fair market value of investments. |
Level 1 and Level 2 trading assets
and trading liabilities, at fair market value The valuation techniques and significant inputs used in determining the fair market values of financial instruments classified as Level 1
and Level 2 of the fair value hierarchy are as follows:
Common stocks,
exchange-traded funds and financial derivative instruments, such as futures contracts or options contracts that are traded on a national securities exchange, are stated at the last reported sale or settlement price on the day of valuation. To the
extent these securities are actively traded and valuation adjustments are not applied, they are categorized as Level 1 of the fair value hierarchy. Valuation adjustments may be applied to certain securities that are solely traded on a foreign
exchange to account for the market movement between the close of the foreign market and the close of the NYSE. These securities are valued using pricing service providers that consider the correlation of the trading patterns of the foreign security
to the intraday trading in the U.S. markets for investments. Securities using these valuation adjustments are categorized as Level 2 of the fair value hierarchy. Preferred securities and other equities traded on inactive markets or valued by
reference to similar instruments are also categorized as Level 2 of the fair value hierarchy.
Equity-linked securities are valued by referencing the last reported sale or settlement price of the linked referenced equity on the day of valuation. Foreign
exchange adjustments are applied to the last reported price to convert the linked equity’s trading currency to the contracts settling currency. These investments are categorized as Level 2
of the fair value hierarchy.
Investments in registered open-end investment
management companies will be valued based upon the NAVs of such investments and are categorized as Level 1 of the fair value hierarchy. Investments in unregistered open-end management investment companies will be calculated based upon the NAVs
of such investments and are considered Level 1 provided that the NAVs are observable, calculated daily and are the value at which both purchases and sales will be conducted. Investments in privately held investment funds will be valued based upon
the NAVs of such investments and are categorized as Level 2 of the fair value hierarchy. Investments in privately held investment funds where the inputs of the NAVs are unobservable will be calculated based upon the NAVs of such investments and
are categorized as Level 3 of the fair value hierarchy.
Short-term
investments having a maturity of 60 days or less are generally valued at amortized cost which approximates fair market value. These investments are categorized as Level 2 of the fair value hierarchy.
Over-the-counter financial derivative instruments, such as foreign currency contracts,
options contracts, or swap agreements, derive their value from underlying asset prices, indices, reference rates, and other inputs or a combination of these factors. These contracts are normally valued on the basis of broker dealer quotations or by
pricing service providers. Depending on the product and the terms of the transaction, the value of financial derivatives can be estimated by a pricing service provider using a series of techniques, including simulation pricing models. The pricing
models use inputs that are observed from actively quoted markets such as issuer details, indices, spreads, interest rates, curves, dividends and exchange rates. Financial derivatives that use similar valuation techniques and inputs as described
above are categorized as Level 2 of the fair value hierarchy.
Level 3 trading assets and trading liabilities, at fair market value The valuation techniques and significant inputs used in determining the fair
market values of financial instruments classified as Level 3 of the fair value hierarchy are as follows:
Securities and other assets for which market quotes are not readily available are valued at fair market value as determined in good faith by the Board or persons acting at their direction and are categorized as
Level 3 of the fair value hierarchy.
Market quotes are considered not
readily available in circumstances where there is an absence of current or reliable market-based data (e.g., trade information or broker quotes), including where events occur after the close of the relevant market, but prior to the NYSE Close, that
materially affect the values of the Portfolio’s securities or assets. In addition, market quotes are considered not readily available when, due to extraordinary circumstances, the exchanges or markets on which the securities trade, do not open
for trading for the entire day and no other market prices are available. The Board has delegated to the investment adviser, Pacific Investment Management Company LLC (“PIMCO”), the responsibility for monitoring significant events that may
materially affect the values of the Portfolio’s securities or assets and for determining whether the value of the applicable securities or assets should be re-evaluated in light of such significant events.
The Board has adopted methods for valuing securities and other assets in circumstances
where market quotes are not readily available, and has delegated the responsibility for applying the valuation methods to PIMCO. For instances in which daily market quotes are not readily available, investments may be valued, pursuant to guidelines
established by the Board, with reference to other securities or indices. In the event that the security or asset cannot be valued pursuant to one of the valuation methods established by the Board, the value of the security or asset will be
determined in good faith by the Valuation Committee of the Board, generally based upon recommendations provided by PIMCO. When the Portfolio uses fair valuation methods applied by PIMCO that use significant unobservable inputs to determine its NAV,
securities will be
|
|
|
|
|
|
|
| 20 |
|
PIMCO EQUITY SERIES VIT |
|
|
|
|
December 31, 2011
priced by another method that the Board or persons acting at their direction believe accurately reflects fair market value and are categorized as Level 3 of the fair value hierarchy. These
methods may require subjective determinations about the value of the security. While the Trust’s policy is intended to result in a calculation of the Portfolio’s NAV that fairly reflects security values as of the time of pricing, the Trust
cannot guarantee that values determined by the Board or persons acting at their direction would accurately reflect the price that the Portfolio could obtain for a security if it were to dispose of that security as of the time of pricing (for
instance, in a forced or distressed sale). The prices used by the Portfolio may differ from the value that would be realized if the securities were sold.
For fair valuations using significant unobservable inputs, U.S. GAAP requires a reconciliation of the beginning to ending balances for reported fair market values
that presents changes attributable to total realized and unrealized gains or losses, purchases and sales, and transfers in or out of the Level 3 category during the period. The end of period timing recognition is used for the significant transfers
between Levels of the Portfolio’s assets and liabilities. In accordance with the requirements of U.S. GAAP, a fair value hierarchy and Level 3 reconciliation, if any, have been included in the Notes to the Consolidated Schedule of Investments
for the Portfolio.
4. SECURITIES AND OTHER INVESTMENTS
(a) Equity-Linked
Securities The Portfolio may purchase equity-linked securities, also known as participation notes, equity swaps, and zero strike calls and warrants. Equity-linked securities are
primarily used by the Portfolio as an alternative means to more efficiently and effectively access what is generally an emerging securities market. The Portfolio deposits cash with its custodian (or broker, if legally permitted) in an amount near or
equal to the selling price of the underlying security in exchange for an equity-linked security. Upon sale, the Portfolio receives cash from the broker or custodian equal to the value of the underlying security. Aside from market risk of the
underlying securities, there is a risk of default by the counterparty to the transaction. In the event of insolvency of the counterparty, the Portfolio might be unable to obtain its expected benefit. In addition, while the Portfolio will seek to
enter into such transactions only with parties that are capable of entering into closing transactions with the Portfolio, there can be no assurance that the Portfolio will be able to close out such a transaction with the counterparty or obtain an
offsetting position with any counterparty, at any time prior to the end of the term of the underlying agreement. This may impair the Portfolio’s ability to enter into other transactions at a time when doing so might be advantageous.
(b) Exchange-Traded Funds The Portfolio may invest in exchange-traded funds (“ETFs”), which generally are index-based investment companies that hold substantially all of their assets in securities representing their
specific index. ETFs are funds that issue shares that trade throughout the day on an exchange and represent an investment in a portfolio of securities and assets. As a shareholder of another investment company, the Portfolio would bear its pro rata
portion of the other investment company’s expenses, including advisory fees, in addition to the expenses the Portfolio bears directly in connection with its own operations.
(c) Repurchase Agreements The Portfolio may engage in repurchase agreements. Under the terms of a typical repurchase agreement, the Portfolio takes possession of an underlying debt obligation (collateral) subject to an
obligation of the seller to repurchase, and the Portfolio to resell, the obligation at an agreed-upon price and time. The underlying securities for all repurchase agreements are held in safekeeping at the Portfolio’s custodian or designated
subcustodians under tri-party repurchase agreements. The market value of the collateral must be equal to or exceed the total amount of the repurchase obligations, including interest. Securities purchased under repurchase agreements are reflected as
an asset on the Consolidated Statement of Assets and Liabilities. Interest earned is recorded as a component of interest income on the Consolidated Statement of Operations. In periods of increased demand for collateral, the Portfolio may pay a fee
for receipt of collateral, which may result in interest expense to the Portfolio. Generally, in the event of counterparty default, the Portfolio has the right to use the collateral to offset
losses incurred. If the counterparty should default, the Portfolio will seek to sell the securities which it holds as collateral. This could involve procedural costs or delays in addition to a
loss on the securities if their value should fall below their repurchase price.
(d) Short Sales The Portfolio may enter into short sales transactions. Short sales are transactions
in which the Portfolio sells a security or other instrument (such as an option, forward, future or other derivative contract) that it does not own. When the Portfolio engages in a short sale, it must borrow the security sold short and deliver it to
the counterparty. The Portfolio will ordinarily have to pay a fee or premium to borrow a security and be obligated to repay the lender of the security any dividend or interest that accrues on the security during the period of the loan. The Portfolio
may enter into a specific agreement with a prime broker giving the Portfolio the opportunity to borrow a predetermined amount of a thinly traded security for the duration of the term (the “Term Borrow Agreement”). In exchange for the
opportunity to borrow the specified security, the Portfolio will pay the prime broker a fee as detailed in the Term Borrow Agreement. See Note 6 for risks associated with Prime Broker Account Agreements. Securities sold in short sale transactions
and the dividend or interest payable on such securities, if any, are reflected as payable for short sales on the Consolidated Statement of Assets and Liabilities. Short sales expose the Portfolio to the risk that it will be required to cover its
short position at a time when the security or other asset has appreciated in value, thus resulting in losses to the Portfolio. A short sale is “against the box” if the Portfolio holds in its portfolio or has the right to acquire the
security sold short at no additional cost. The Portfolio will be subject to additional risks to the extent that it engages in short sales that are not “against the box.” The Portfolio’s loss on a short sale could theoretically be
unlimited in cases where the Portfolio is unable, for whatever reason, to close out its short position.
(e) U.S. Government Agencies or Government-Sponsored Enterprises The Fund may invest in securities
of U.S. Government agencies or government-sponsored enterprises. U.S. Government securities are obligations of and, in certain cases, guaranteed by, the U.S. Government, its agencies or instrumentalities. Some U.S. Government securities, such as
Treasury bills are supported by the full faith and credit of the U.S. Government. U.S. Government securities may include zero coupon securities, which do not distribute interest on a current basis and tend to be subject to greater risk than
interest-paying securities of similar maturities.
5. FINANCIAL DERIVATIVE INSTRUMENTS
The following disclosures contain information on how and why the Portfolio uses financial derivative instruments, the credit-risk-related contingent features in
certain financial derivative instruments, and how financial derivative instruments affect the Portfolio’s financial position, results of operations and cash flows. The location and fair value amounts of these instruments on the Consolidated
Statement of Assets and Liabilities and the realized and changes in unrealized gains and losses on the Consolidated Statement of Operations, each categorized by type of financial derivative contract, are included in a table in the Notes to
Consolidated Schedule of Investments. The financial derivative instruments outstanding as of period end as disclosed in the Notes to Consolidated Schedule of Investments and the amounts of realized and changes in unrealized gains and losses on
financial derivative instruments during the period as disclosed on the Consolidated Statement of Operations serve as indicators of the volume of financial derivative activity for the Portfolio.
(a) Foreign Currency
Contracts The Portfolio may enter into foreign currency contracts in connection with settling planned purchases or sales of securities, to hedge the currency exposure associated with
some or all of the Portfolio’s securities or as a part of an investment strategy. A foreign currency contract is an agreement between two parties to buy and sell a currency at a set price on a future date. The market value of a foreign currency
contract fluctuates with changes in foreign currency exchange rates. Foreign currency contracts are marked to market daily and the change in value is recorded by the Portfolio as an unrealized gain or loss. Realized gains or losses equal to the
difference between the value of the contract at the time it was opened and the value at the time it was closed are recorded upon delivery or receipt of the
|
|
|
|
|
|
|
|
|
DECEMBER 31, 2011 |
|
ANNUAL REPORT |
|
21 |
Notes to Financial Statements (Cont.)
currency. These contracts may involve market risk in excess of the unrealized gain or loss reflected on the Consolidated Statement of Assets and Liabilities. In addition, the Portfolio could be
exposed to risk if the counterparties are unable to meet the terms of the contracts or if the value of the currency changes unfavorably to the U.S. dollar. In connection with these contracts, securities may be identified as collateral in accordance
with the terms of the respective contracts.
(b) Options Contracts The Portfolio may write call and put options on securities and financial derivative instruments it owns or in which it may
invest. Writing put options tends to increase the Portfolio’s exposure to the underlying instrument. Writing call options tends to decrease the Portfolio’s exposure to the underlying instrument. When the Portfolio writes a call or put, an
amount equal to the premium received is recorded as a liability and subsequently marked to market to reflect the current value of the option written. These liabilities are reflected as written options outstanding on the Consolidated Statement of
Assets and Liabilities. Premiums received from writing options which expire are treated as realized gains. Premiums received from writing options which are exercised or closed are added to the proceeds or offset against amounts paid on the
underlying futures, swap, security or currency transaction to determine the realized gain or loss. Certain options may be written with premiums to be determined on a future date. The Portfolio as a writer of an option has no control over whether the
underlying instrument may be sold (call) or purchased (put) and as a result bears the market risk of an unfavorable change in the price of the instrument underlying the written option. There is the risk the Portfolio may not be able to enter into a
closing transaction because of an illiquid market.
The Portfolio may also
purchase put and call options. Purchasing call options tends to increase the Portfolio’s exposure to the underlying instrument. Purchasing put options tends to decrease the Portfolio’s exposure to the underlying instrument. The Portfolio
pays a premium which is included on the Portfolio’s Consolidated Statement of Assets and Liabilities as an investment and subsequently marked to market to reflect the current value of the option. Premiums paid for purchasing options which
expire are treated as realized losses. Certain options may be purchased with premiums to be determined on a future date. The premiums for these options are based upon implied volatility parameters at specified terms. The risk associated with
purchasing put and call options is limited to the premium paid. Premiums paid for purchasing options which are exercised or closed are added to the amounts paid or offset against the proceeds on the underlying investment transaction to determine the
realized gain or loss when the underlying transaction is sold.
Options on Exchange-Traded Futures Contracts The Portfolio may write or purchase options on exchange-traded futures contracts (“Futures
Option”). A Futures Option is an option contract in which the underlying is a single futures contract. The Portfolio may write a Futures Option for income purposes or to hedge an existing position or future investment. The Portfolio may
purchase Futures Options for speculative purposes or to manage exposure to market movements.
Foreign Currency Options The Portfolio may write or purchase foreign currency options. These options
may be used as a short or long hedge against possible variations in foreign exchange rates or to gain exposure to foreign currencies. A foreign currency option will specify the amount of currency and a rate of exchange that may be exercised by a
specified date.
Options
on Securities The Portfolio may enter into options on securities (“Equity Option”). An Equity Option uses a specified equity security as the underlying for the option contract.
The Portfolio may write or purchase options for income purposes or to hedge an existing position or future investment.
Options on Exchange-Traded Funds The Portfolio may
enter into options on exchange-traded funds (“ETF Option”). An ETF Option uses a specified exchange-traded fund as the underlying for the option contract. The Portfolio may write or purchase options for income purposes or to hedge an
existing position or future investment.
(c) Swap Agreements The Portfolio may invest in swap agreements. Swap agreements are bilaterally negotiated agreements between the Portfolio and a counterparty to exchange or swap investment cash flows, assets, foreign
currencies or market-linked returns at specified, future intervals. Swap agreements are privately negotiated in the over-the-counter market (“OTC swaps”) or may be executed in a multilateral or other trade facility platform, such as a
registered exchange (“centrally cleared swaps”). The Portfolio may enter into total return and other forms of swap agreements to manage its exposure to credit, currency, interest rate, commodity, equity and inflation risk. In connection
with these agreements, securities or cash may be identified as collateral or margin in accordance with the terms of the respective swap agreements to provide assets of value and recourse in the event of default or bankruptcy/insolvency.
Swaps are marked to market daily based upon values from third party vendors, which may
include a registered exchange, or quotations from market makers to the extent available. In the event that market quotes are not readily available and the swap cannot be valued pursuant to one of the valuation methods, the value of the swap will be
determined in good faith by the Valuation Committee of the Board of Trustees, generally based upon recommendations provided by PIMCO. Changes in market value, if any, are reflected as a component of net changes in unrealized
appreciation/(depreciation) on the Consolidated Statement of Operations. Daily changes in valuation of centrally cleared swaps, if any, are recorded as a receivable or payable for the change in value as appropriate (“variation margin”) on
the Consolidated Statement of Assets and Liabilities. OTC swap payments received or made at the beginning of the measurement period are reflected as such on the Consolidated Statement of Assets and Liabilities and represent premiums paid or received
upon entering into the swap agreement to compensate for differences between the stated terms of the swap agreement and prevailing market conditions (credit spreads, currency exchange rates, interest rates, and other relevant factors). These upfront
premiums are recorded as realized gains or losses on the Consolidated Statement of Operations upon termination or maturity of the swap. A liquidation payment received or made at the termination of the swap is recorded as realized gain or loss on the
Consolidated Statement of Operations. Net periodic payments received or paid by the Portfolio are included as part of realized gains or losses on the Consolidated Statement of Operations.
Entering into these agreements involves, to varying degrees, elements of interest, credit, market and documentation risk in excess of the
amounts recognized on the Consolidated Statement of Assets and Liabilities. Such risks involve the possibility that there will be no liquid market for these agreements, that the counterparty to the agreements may default on its obligation to perform
or disagree as to the meaning of contractual terms in the agreements and that there may be unfavorable changes in interest rates.
The Portfolio’s maximum risk of loss from counterparty credit risk is the discounted net value of the cash flows to be received from the counterparty over the
contract’s remaining life, to the extent that amount is positive. The risk is mitigated by having a master netting arrangement between the Portfolio and the counterparty and by the posting of collateral to the Portfolio to cover the
Portfolio’s exposure to the counterparty.
Total Return Swap Agreements The Portfolio may enter into total return swap agreements to gain or mitigate exposure of the underlying reference
securities. Total return swap agreements on commodities involve commitments where cash flows are exchanged based on the price of a commodity and based on a fixed or variable rate. One party would receive payments based on the market value of the
commodity involved and pay a fixed amount. Total return swap agreements on indices involve commitments to pay interest in exchange for a market-linked return. One counterparty pays out the total return of a specific reference asset, which may be an
equity, index, or bond, and in return receives a regular stream of payments. To the extent the total return of the security or index underlying the transaction exceeds or falls short of the offsetting interest rate obligation, the Portfolio will
receive a payment from or make a payment to the counterparty.
|
|
|
|
|
|
|
| 22 |
|
PIMCO EQUITY SERIES VIT |
|
|
|
|
December 31, 2011
6. PRINCIPAL RISKS
In the normal course of business the Portfolio trades financial
instruments and enters into financial transactions where risk of potential loss exists due to changes in the market (market risk), or failure or inability of the other party to a transaction to perform (credit and counterparty risk). See below for a
detailed description of select principal risks. For a list of potential risks the Portfolio may be subject to, please see the Important Information About the Portfolio.
Market Risks The Portfolio’s investments in financial derivatives and other financial instruments expose the Portfolio to various risks such as, but not limited to, equity, interest rate, foreign currency and
commodity risks.
The market values of equities, such as common stocks and
preferred securities or equity related investments such as futures and options, may decline due to general market conditions which are not specifically related to a particular company, such as real or perceived adverse economic conditions, changes
in the general outlook for corporate earnings, changes in interest or currency rates or adverse investor sentiment generally. They may also decline due to factors which affect a particular industry or industries, such as labor shortages or increased
production costs and competitive conditions within an industry. Equity securities and equity related investments generally have greater market price volatility than fixed income securities.
Interest rate risk is the risk that fixed income securities will decline in value because of changes in interest rates. As nominal
interest rates rise, the value of certain fixed income securities held by the Portfolio is likely to decrease. A nominal interest rate can be described as the sum of a real interest rate and an expected inflation rate. Fixed income securities with
longer durations tend to be more sensitive to changes in interest rates, usually making them more volatile than securities with shorter durations. Duration is useful primarily as a measure of the sensitivity of a fixed income’s market price to
interest rate (i.e. yield) movements.
If the Portfolio invests
directly in foreign currencies or in securities that trade in, and receive revenues in, foreign currencies, or in financial derivatives that provide exposure to foreign currencies, it will be subject to the risk that those currencies will decline in
value relative to the base currency of the Portfolio, or, in the case of hedging positions, that the Portfolio’s base currency will decline in value relative to the currency being hedged. Currency rates in foreign countries may fluctuate
significantly over short periods of time for a number of reasons, including changes in interest rates, intervention (or the failure to intervene) by U.S. or foreign governments, central banks or supranational entities such as the International
Monetary Fund, or by the imposition of currency controls or other political developments in the United States or abroad. As a result, the Portfolio’s investments in foreign currency denominated securities may reduce the returns of the
Portfolio.
The Portfolio’s investments in commodity-linked financial
derivative instruments may subject the Portfolio to greater market price volatility than investments in traditional securities. The value of commodity-linked financial derivative instruments may be affected by changes in overall market movements,
commodity index volatility, changes in interest rates, or factors affecting a particular industry or commodity, such as drought, floods, weather, livestock disease, embargoes, tariffs and international economic, political and
regulatory developments.
Credit and Counterparty Risks The Portfolio will
be exposed to credit risk on parties with whom it trades and will also bear the risk of settlement default. The Portfolio minimizes concentrations of credit risk by undertaking transactions with a large number of customers and counterparties on
recognized and reputable exchanges. The Portfolio could lose money if the issuer or guarantor of a fixed income security, or the counterparty to a financial derivatives contract, repurchase agreement or a loan of portfolio securities, is unable or
unwilling to make timely principal and/or interest payments, or to otherwise honor its obligations. Securities are subject to varying degrees of credit risk, which are often reflected in credit ratings.
Similar to credit risk, the Portfolio may be exposed to counterparty risk, or the risk that an institution or other
entity with which the Portfolio has unsettled or open transactions will default. Financial assets, which potentially expose the Portfolio to counterparty risk, consist principally of cash due from counterparties and investments. PIMCO, as the
investment adviser, minimizes counterparty risks to the Portfolio by performing extensive reviews of each counterparty and obtaining approval from the PIMCO Counterparty Risk Committee prior to entering into transactions with a third party.
Furthermore, to the extent that unpaid amounts owed to the Portfolio exceed a predetermined threshold agreed to with the counterparty, such counterparty shall advance collateral to the Portfolio in the form of cash or cash equivalents equal in value
to the unpaid amount owed to the Portfolio. The Portfolio may invest such collateral in securities or other instruments and will typically pay interest to the counterparty on the collateral received. If the unpaid amount owed to the Portfolio
subsequently decreases, the Portfolio would be required to return to the counterparty all or a portion of the collateral previously advanced to the Portfolio.
All transactions in listed securities are settled/paid for upon delivery using approved counterparties. The risk of default is considered minimal, as delivery of
securities sold is only made once the Portfolio has received payment. Payment is made on a purchase once the securities have been delivered by the counterparty. The trade will fail if either party fails to meet its obligation.
The Portfolio is subject to various Master Agreements, which govern the terms of
certain transactions with select counterparties. These Master Agreements reduce the counterparty risk associated with relevant transactions by specifying credit protection mechanisms and providing standardization that improves legal certainty. Since
different types of forward and OTC financial derivative transactions have different mechanics and are sometimes traded out of different legal entities of a particular counterparty organization, each type of transaction may be covered by a different
Master Agreement and result in the need for multiple agreements with a single counterparty. Therefore, exposure cannot be netted and collateralized across all types of transactions. Exposures can only be netted across transactions governed under the
same Master Agreement with the same legal entity.
Master Agreements can
also help limit counterparty risk by specifying collateral posting arrangements at pre-arranged exposure levels. Under the Master Agreements, collateral is routinely transferred if the total net exposure to certain transactions (net of existing
collateral already in place) governed under the relevant master agreement with a counterparty in a given account exceeds a specified threshold, which typically ranges from zero to $250,000 depending on the counterparty and the type of Master
Agreement. United States Treasury Bills and U.S. dollar cash are generally the preferred forms of collateral, although other forms of AAA rated paper may be used. The Portfolio’s overall exposure to counterparty risk can change substantially
within a short period, as it is affected by each transaction subject to the relevant Master Agreement.
Master Repurchase Agreements (“Master Repo Agreements”) govern transactions between the Portfolio and select counterparties. The Master Repo Agreements maintain provisions for, among other things,
initiation, income payments, events of default, and maintenance of collateral for Repurchase Agreements.
International Swaps and Derivatives Association, Inc. Master Agreements (“ISDA Master Agreements”) govern OTC financial derivative transactions entered into by the Portfolio and select counterparties. The
ISDA Master Agreements maintain provisions for general obligations, representations, agreements, collateral and events of default or termination. Events of termination include conditions that may entitle counterparties to elect to terminate early
and cause settlement of all outstanding transactions under the applicable ISDA Master Agreement. Any election to early terminate could be material to the financial statements. The market value of OTC financial derivative transactions net of
collateral received in or pledged by counterparty as of period end is disclosed in the Notes to the Consolidated Schedule of Investments.
|
|
|
|
|
|
|
|
|
DECEMBER 31, 2011 |
|
ANNUAL REPORT |
|
23 |
Notes to Financial Statements (Cont.)
Prime Broker Account Agreements between the Portfolio and selected Prime Brokers govern the considerations and
factors surrounding accounts opened for short selling transactions and activities, including, but not limited to, margin,
execution, and settlement. The Prime Broker Account Agreements maintain provisions for, among other things, payments, maintenance of collateral, events of default, and termination. See Note 4(d)
for additional information.
7. BASIS FOR CONSOLIDATION OF THE PIMCO EqS PATHFINDER PORTFOLIO™
The PIMCO Cayman Commodity Portfolio III Ltd. (the “Commodity Subsidiary”), a Cayman Islands exempted company, was incorporated as a wholly owned subsidiary acting as an investment vehicle for the
Portfolio in order to effect certain investments for the Portfolio consistent with the Portfolio’s investment objectives and policies as specified in its prospectus and statement of additional information. The Portfolio’s investment
portfolio has been consolidated and includes the portfolio holdings of the Portfolio and the Commodity Subsidiary. The consolidated financial statements include the accounts of the Portfolio and the Commodity Subsidiary. All inter-company
transactions and balances have been eliminated. A subscription agreement was entered into between the Portfolio and the Commodity Subsidiary, comprising the entire issued share capital of the Commodity Subsidiary with the intent that the Portfolio
will remain the sole shareholder and retain all rights. Under the Articles of Association, shares issued by the Commodity Subsidiary confer upon a shareholder the right to receive notice of, to attend and to vote at general meetings of the Commodity
Subsidiary and shall confer upon the shareholder rights in a winding-up or repayment of capital and the right to participate in the profits or assets of the Commodity Subsidiary. See the table below for details regarding the structure, incorporation
and relationship as of December 31, 2011 of the Commodity Subsidiary to the Portfolio (amounts in thousands).
|
|
|
|
|
|
|
|
|
|
|
|
|
|
|
|
|
|
|
|
|
|
|
| Subsidiary |
|
|
|
Date of
Incorporation |
|
|
Subscription
Agreement |
|
|
Fund Net Assets |
|
|
Subsidiary
Net Assets |
|
|
% of
Fund Net Assets |
|
| PIMCO Cayman Commodity Portfolio III Ltd. |
|
|
|
|
06/06/2011 |
|
|
|
06/20/2011 |
|
|
$ |
454,090 |
|
|
$ |
16,362 |
|
|
|
3.6% |
|
8. FEES AND EXPENSES
(a) Investment Advisory
Fee PIMCO is a majority-owned subsidiary of Allianz Asset Management of America L.P. (“Allianz Asset Management”) formerly known as Allianz Global Investors of America L.P.,
and serves as investment adviser (the “Adviser”) to the Trust, pursuant to an investment advisory contract. The Adviser receives a monthly fee from the Portfolio, at an annual rate based on average daily net assets (the “Investment
Advisory Fee”). The Investment Advisory Fee for all classes is charged at an annual rate of 0.75%.
(b) Supervisory and Administrative Fee PIMCO serves as administrator (the
“Administrator”), and provides supervisory and administrative services to the Trust for which it receives a monthly supervisory and administrative fee based on each share class’s average daily net assets (the “Supervisory and
Administrative Fee”). As the Administrator, PIMCO bears the costs of various third-party services, including audit, custodial, portfolio accounting, legal, transfer agency and printing costs. The Supervisory and Administrative Fee for all
classes is charged at the annual rate of 0.35%.
(c) Distribution and Servicing Fees PIMCO Investments LLC (“PI”), a wholly-owned subsidiary of PIMCO, serves as the distributor
(“Distributor”) of the Trust’s shares. Prior to February 14, 2011, Allianz Global Investors Distributors LLC, an indirect wholly-owned subsidiary of Allianz Asset Management, was the Distributor of the Trust’s shares. The
Trust has adopted a Distribution Plan for the Advisor Class shares of the Portfolio (the “Plan”). The Plan has been adopted pursuant to Rule 12b-1 under the Act. The Plan permits payments for expenses in connection with the distribution
and marketing of Advisor Class shares and/or the provision of shareholder services to Advisor Class shareholders. The Plan permits the Portfolio to make total payments at an annual rate of 0.25% of its average daily net assets attributable to its
Advisor Class shares.
(d) Portfolio Expenses The Trust is responsible
for the following expenses: (i) salaries and other compensation of any of the Trust’s executive officers and employees who are not officers, directors, stockholders or employees of PIMCO or its subsidiaries or affiliates; (ii) taxes
and governmental fees; (iii) brokerage fees and commissions and other portfolio transaction expenses; (iv) the costs of borrowing money, including interest expenses and bank overdraft charges; (v) fees and expenses of the Trustees who
are not “interested persons” of PIMCO or the Trust, and any counsel retained exclusively for their benefit; (vi) extraordinary expenses, including costs of litigation and indemnification expenses; (vii) organization expenses and
(viii) any expenses allocated or allocable to a specific class of shares (“class-specific expenses”). The ratio of expenses to average net assets per share class, as disclosed on the Financial Highlights, may differ from the annual
portfolio operating expenses per share class as disclosed in the Prospectus for the reasons set forth above.
Each Trustee, other than those affiliated with PIMCO or its affiliates, receives an annual retainer of $10,000, plus $1,500 for each Board of Trustees meeting
attended in person, $250 ($375 in the case of the audit committee chair with respect to audit committee meetings) for each committee meeting attended and $375 for each Board of Trustees meeting
attended telephonically, plus reimbursement of related expenses. In addition, the audit committee chair receives an additional annual retainer of $2,000 and each other committee chair receives an additional annual retainer of $250. The Trust pays no
compensation directly to any Trustee or any other officer who is affiliated with the Administrator, all of whom receive remuneration for their services to the Trust from the Administrator or its affiliates.
(e) Expense Limitation PIMCO has also contractually agreed, through May 1, 2012, to reduce total annual operating expenses for each of the Portfolio’s separate classes of shares, by reducing the Portfolio’s
Supervisory and Administrative fee or reimbursing the Portfolio, to the extent that organizational expenses and pro rata Trustees’ fees attributable to a class of shares of the Portfolio exceed 0.0049% of the Portfolio’s average net assets
attributable to separate classes of shares. This Expense Limitation Agreement renews annually for a full year unless terminated by PIMCO upon at least 30 days prior notice to the end of the contract term.
PIMCO has contractually agreed, through May 1, 2012, to waive a portion of its
Investment Advisory Fee equal to 0.13% of average daily net assets. Under the Fee Limitation Agreement, PIMCO is entitled to reimbursement by the Portfolio of any portion of the Supervisory and Administrative Fee and/or Investment Advisory Fee
waived, reduced or reimbursed pursuant to the Fee Limitation Agreement (the “Reimbursement Amount”) during the previous three years, provided that such amount paid to PIMCO will not: 1) together with any recoupment of organizational
expenses and pro rata Trustees’ fees pursuant to the Expense Limitation Agreement, exceed the Expense Limit: 2) exceed the total Reimbursement Amount; or 3) include any amounts previously reimbursed to PIMCO. The Fee Limitation Agreement will
automatically renew for one-year terms unless PIMCO provides written notice to the Trust at least 30 days prior to the end of the then current term.
PIMCO has also contractually agreed, through September 16, 2013, to reduce total annual operating expenses for the Portfolio’s Institutional Class and
Advisor Class shares, by reducing the Portfolio’s Investment Advisory or Supervisory and Administrative Fees or reimbursing the Portfolio to the extent that total annual portfolio operating expenses net of acquired fund fees and expenses, after
taking into account other applicable fee waivers and reimbursements exceed 1.00% and 1.25% of the Portfolio’s average net assets attributable to the Institutional Class and Advisor Class shares, respectively. PIMCO may recoup these waivers and
reimbursements for a period not exceeding three years, provided that total expenses, including such recoupment, do not exceed the annual expense limit. As of December 31, 2011, the remaining recoverable amount to PIMCO was $334,802.
(f) Acquired Fund Fees and
Expenses The Commodity Subsidiary has entered into a separate contract with PIMCO for the management of the
|
|
|
|
|
|
|
| 24 |
|
PIMCO EQUITY SERIES VIT |
|
|
|
|
December 31, 2011
Commodity Subsidiary’s portfolio pursuant to which the Commodity Subsidiary pays PIMCO a management fee and administrative services fee at the annual rates of 0.49% and 0.20%, respectively,
of its net assets. PIMCO has contractually agreed to waive the Investment Advisory Fee and the Supervisory and Administrative Fee it receives from the Portfolio in an amount equal to the management fee and administrative services fee, respectively,
paid to PIMCO
by the Commodity Subsidiary. This waiver may not be terminated by PIMCO and will remain in effect for as long as PIMCO’s contract with the Commodity Subsidiary is in place. The waiver is
reflected in the Consolidated Statement of Operations as a component of Waiver and/or Reimbursement by PIMCO. For the period ended December 31, 2011, the amount was $35,587.
9. RELATED PARTY
TRANSACTIONS
The Adviser, Administrator, and Distributors are related
parties. Fees payable to these parties are disclosed in Note 8 and the accrued related party fees amounts are disclosed on the Consolidated Statement of Assets and Liabilities.
The Portfolio may invest in the PIMCO Short-Term Floating NAV Portfolio to the extent
permitted by the Act and rules thereunder. The PIMCO Short-Term Floating NAV Portfolio is a registered investment company created for use solely by the series of the Trust and series of the PIMCO Funds, PIMCO Variable Insurance Trust, PIMCO ETF
Trust, PIMCO Equity Series, and other series of registered investment companies advised by PIMCO, in connection with their cash management activities. The main investments of the PIMCO Short-Term Floating NAV Portfolio are money market instruments
and short maturity fixed income instruments. The PIMCO Short-Term Floating NAV Portfolio may incur expenses related to its investment activities, but does not pay Investment Advisory or Supervisory and Administrative Fees to PIMCO. The PIMCO
Short-Term Floating NAV Portfolio is considered to be affiliated with the Portfolio. The table below shows the Portfolio’s transactions in and earnings from investments in the PIMCO Short-Term Floating NAV Portfolio for the period ended
December 31, 2011 (amounts in thousands):
|
|
|
|
|
|
|
|
|
|
|
|
|
|
|
|
|
|
|
|
|
|
|
|
|
|
|
Market Value
12/31/2010 |
|
|
Purchases
at Cost |
|
|
Proceeds from
Sales |
|
|
Net Capital
and Realized
Gain |
|
|
Change in
Unrealized
Appreciation |
|
|
Market Value
12/31/2011 |
|
|
Dividend
Income |
|
| $ |
901 |
|
|
$ |
103,433 |
|
|
|
$ (70,100) |
|
|
$ |
3 |
|
|
$ |
1 |
|
|
$ |
34,238 |
|
|
$ |
33 |
|
10. GUARANTEES AND INDEMNIFICATIONS
Under the Trust’s organizational documents, each Trustee or officer of the Trust is indemnified and each employee or other agent of
the Trust (including the Trust’s investment manager) may be indemnified, to the extent permitted by the Act, against certain liabilities that may arise out of performance of their duties to the Portfolio. Additionally, in the normal course of
business, the Portfolio enters into contracts that contain a variety of indemnification clauses. The Portfolio’s maximum exposure under these arrangements is unknown as this would involve future claims that may be made against the Portfolio
that has not yet occurred. However, the Portfolio has not had prior claims or losses pursuant to these contracts.
11. PURCHASES AND SALES OF SECURITIES
The length of time the Portfolio has held a particular security is not generally a consideration in investment decisions. A change in the securities held by the Portfolio is known as “portfolio turnover.”
The Portfolio may engage in
frequent and active trading of portfolio securities to achieve its investment objective, particularly during periods of volatile market movements. High portfolio turnover (e.g., over 100%)
involves correspondingly greater expenses to the Portfolio, including brokerage commissions or dealer mark-ups and other transaction costs on the sale of securities and reinvestments in other securities. Such sales may also result in realization of
taxable capital gains, including short-term capital gains (which are generally taxed at ordinary income tax rates). The trading costs and tax effects associated with portfolio turnover may adversely affect the Portfolio’s performance. The
portfolio turnover rates are reported in the Financial Highlights.
Purchases and sales of securities (excluding short-term instruments) for the period ended December 31, 2011, were as follows (amounts in thousands):
|
|
|
|
|
|
|
|
|
|
|
|
|
|
|
| U.S. Government/Agency |
|
|
All Other |
|
| Purchases |
|
|
Sales |
|
|
Purchases |
|
|
Sales |
|
| $ |
3,366 |
|
|
$ |
0 |
|
|
$ |
753,157 |
|
|
$ |
327,523 |
|
12. SHARES OF BENEFICIAL
INTEREST
The Portfolio may issue an unlimited number of shares of
beneficial interest with a $0.001 par value. Changes in shares of beneficial interest were as follows (shares and amounts in thousands):
|
|
|
|
|
|
|
|
|
|
|
|
|
|
|
|
|
|
|
| |
|
|
|
Year Ended
12/31/2011 |
|
|
Period from 04/14/2010
to 12/31/2010 |
|
| |
|
|
|
Shares |
|
|
Amount |
|
|
Shares |
|
|
Amount |
|
|
|
|
|
|
|
| Receipts for shares sold |
|
|
|
|
|
|
|
|
|
|
|
|
|
|
|
|
|
|
| Institutional Class |
|
|
|
|
6,970 |
|
|
$ |
68,614 |
|
|
|
349 |
|
|
$ |
3,472 |
|
| Advisor Class |
|
|
|
|
41,590 |
|
|
|
408,419 |
|
|
|
274 |
|
|
|
2,697 |
|
| Issued as reinvestment of distributions |
|
|
|
|
|
|
|
|
|
|
|
|
|
|
|
|
|
|
| Institutional Class |
|
|
|
|
8 |
|
|
|
75 |
|
|
|
0 |
|
|
|
0 |
|
| Advisor Class |
|
|
|
|
14 |
|
|
|
138 |
|
|
|
0 |
|
|
|
0 |
|
| Cost of shares redeemed |
|
|
|
|
|
|
|
|
|
|
|
|
|
|
|
|
|
|
| Institutional Class |
|
|
|
|
(552 |
) |
|
|
(5,347 |
) |
|
|
(32 |
) |
|
|
(306 |
) |
| Advisor Class |
|
|
|
|
(2,388 |
) |
|
|
(22,951 |
) |
|
|
(32 |
) |
|
|
(311 |
) |
| Net increase resulting from Portfolio share transactions |
|
|
|
|
45,642 |
|
|
$ |
448,948 |
|
|
|
559 |
|
|
$ |
5,552 |
|
As of December 31, 2011, Allianz Life Insurance
Co. of North America, a direct subsidiary of Allianz of America and a related party to the Portfolio, owned 25% or more of the outstanding shares of beneficial interest of the Portfolio and therefore may be presumed to “control” the
Portfolio, as that term is defined in the 1940 Act.
|
|
|
|
|
|
|
|
|
DECEMBER 31, 2011 |
|
ANNUAL REPORT |
|
25 |
Notes to Financial Statements (Cont.)
13. REGULATORY AND LITIGATION MATTERS
The Trust is not engaged in any material litigation or arbitration proceedings and is not aware of any material litigation or claim
pending or threatened by or against it.
14. FEDERAL INCOME
TAX MATTERS
The Portfolio intends to qualify as a regulated investment
company under Subchapter M of the Internal Revenue Code (the “Code”) and distribute all of its taxable income and net realized gains, if applicable, to shareholders. Accordingly, no provision for Federal income taxes has been made.
In accordance with provisions set forth under U.S. GAAP, the Investment
Adviser has reviewed the Portfolio’s tax positions for all open tax years. As of December 31, 2011, the Portfolio has recorded no liability for net unrecognized tax benefits relating to uncertain income tax positions it has taken or
expects to take in future tax returns.
The Portfolio files U.S. tax
returns. While the statute of limitations remains open to examine the Portfolio’s U.S. tax return filed for the 2010 fiscal year, no examinations are in progress or anticipated at this time. The Portfolio is not aware of any tax positions for
which it is reasonably possible that the total amounts of unrecognized tax benefits will significantly change in the next twelve months.
The Portfolio may gain exposure to the commodities markets primarily through index-linked notes, and may invest in other commodity-linked derivative instruments,
including commodity swap agreements, options, futures contracts, options on futures contracts and foreign funds investing in similar commodity-linked derivatives.
One of the requirements for favorable tax treatment as a regulated investment company
under the Code is that the Portfolio derive at least 90% of its gross income from certain qualifying sources of income. The IRS has issued a revenue ruling which holds that income derived from commodity index-linked swaps is not qualifying income
under Subchapter M of the Code. Subsequently, the IRS issued a private letter ruling to the PIMCO CommodityRealReturn Strategy
Fund® in which the IRS specifically concluded that income from
certain commodity index-linked notes is qualifying income. In addition, the IRS issued another private letter ruling to the PIMCO CommodityRealReturn Strategy Fund® in which the IRS specifically concluded that income derived from the Fund’s investment in it’s Subsidiary, which invests primarily in commodity index-linked
swaps, will also constitute qualifying income to the Fund. Based on such rulings, the Portfolio will continue to seek to gain exposure to the commodity markets primarily through investments in commodity-linked notes and through investments in
its Subsidiary.
It should be noted, however, that the IRS currently
has suspended the issuance of such rulings pending further review. There can be no assurance that the IRS will not change its position that income derived from commodity-linked notes and wholly-owned subsidiaries is qualifying
income. Furthermore, the tax treatment of commodity linked notes, other commodity-linked derivatives, and the Fund’s investments in the Subsidiary may otherwise be adversely affected by future legislation, Treasury Regulations and/or
guidance issued by the IRS. Such developments could affect the character, timing and/or amount of the Fund’s taxable income or any distributions made by the Fund or result in the inability of the Fund to operate as described in its
Prospectus.
If, during a taxable year, the Commodity Subsidiary’s
taxable losses (and other deductible items) exceed its income and gains, the net loss will not pass through to the Portfolio as a deductible amount for Federal income tax purposes. Note that the loss from the Commodity Subsidiary’s contemplated
activities also cannot be carried forward to reduce future Commodity Subsidiary’s income in subsequent years. However, if the Commodity Subsidiary’s taxable gains exceed its losses and other deductible items during a taxable year, the net
gain will pass through to the Portfolio as income for Federal income tax purposes.
Shares of the Portfolio currently are sold to segregate asset accounts (“Separate Accounts”) of insurance companies that fund variable annuity contracts and variable life insurance policies
(“Variable Contracts”). Please refer to the prospectus for the Separate Account and Variable Contract for information regarding federal income tax treatment of distributions to the Separate Account.
As of December 31, 2011, the components
of distributable taxable earnings are as follows (amounts in thousands):
|
|
|
|
|
|
|
|
|
|
|
|
|
|
|
|
|
|
|
|
|
|
|
|
|
|
|
Undistributed
Ordinary
Income |
|
|
Undistributed
Long-Term
Capital Gains |
|
|
Net Tax Basis
Unrealized
Appreciation/
(Depreciation)(1) |
|
|
Other
Book-to-Tax
Accounting
Differences(2) |
|
|
Accumulated
Capital
Losses(3)
|
|
|
Post-October
Deferral |
|
|
Qualified
Late-Year Loss
Deferral |
|
| $ |
2,581 |
|
|
$ |
— |
|
|
$ |
9,550 |
|
|
$ |
|
(1) |
|
$ |
(12,472) |
|
|
$ |
— |
|
|
$ |
— |
|
| (1) |
Adjusted for open wash sale loss deferrals and the accelerated recognition of unrealized gain or loss on certain futures, options and forward contracts for
federal income tax purposes. Also adjusted for differences between book and tax realized and unrealized gain (loss) on swap contracts. |
| (2) |
Represents differences in income tax regulations and financial accounting principles generally accepted in the United States of America, namely for straddle loss
deferrals and distributions payable at fiscal year-end. |
| (3) |
Capital losses available to offset future net capital gains expire in varying amounts in the years shown below. |
As of December 31, 2011, the Portfolio had accumulated capital losses expiring in the
following years (amounts in thousands). The Portfolio will resume capital gain distributions in the future to the extent gains are realized in excess of accumulated capital losses.
|
|
|
|
|
|
|
|
|
|
|
|
|
|
|
|
|
|
|
|
|
|
|
|
|
|
|
| Expiration of Accumulated Capital
Losses(4) |
|
| 12/31/2012 |
|
|
12/31/2013 |
|
|
12/31/2014 |
|
|
12/31/2015 |
|
|
12/31/2016 |
|
|
12/31/2017 |
|
|
12/31/2018 |
|
| $ |
— |
|
|
$ |
— |
|
|
$ |
— |
|
|
$ |
— |
|
|
$ |
— |
|
|
$ |
— |
|
|
$ |
30 |
|
| (4) |
Portion of amount represents realized loss and recognized built-in loss under IRC 382-383, which is carried forward to future years to offset future realized
gain subject to certain limitations. |
Under the recently
enacted Regulated Investment Company Act of 2010, a fund is permitted to carry forward any new capital losses for an unlimited period. Additionally, such capital losses that are carried forward will retain their character as either short-term or
long-term capital losses rather than being considered all short-term under previous law.
As of December 31, 2011, the Portfolio had the following post-effective capital losses with no expiration:
|
|
|
|
|
|
|
| Short-Term |
|
|
Long-Term |
|
| $ |
11,460 |
|
|
$ |
982 |
|
|
|
|
|
|
|
|
| 26 |
|
PIMCO EQUITY SERIES VIT |
|
|
|
|
December 31, 2011
As of December 31, 2011, the aggregate cost and the net unrealized appreciation/(depreciation) of investments for federal income tax purposes are as follows
(amounts in thousands):
|
|
|
|
|
|
|
|
|
|
|
|
|
|
|
Federal Tax
Cost |
|
|
Unrealized
Appreciation |
|
|
Unrealized
(Depreciation) |
|
|
Net Unrealized
Appreciation/
(Depreciation)(5) |
|
| $ |
442,252 |
|
|
$ |
22,196 |
|
|
$ |
(13,300) |
|
|
$ |
8,896 |
|
| (5) |
Primary differences, if any, between book and tax net unrealized appreciation/(depreciation) on investments are attributable to open wash sale loss deferrals,
convertible preferred debt instruments, and passive foreign investment companies. |
For the fiscal years ended December 31, 2011 and December 31, 2010, respectively, the Portfolio made the following tax basis distributions (amounts in thousands):
|
|
|
|
|
|
|
|
|
|
|
|
|
|
|
Fiscal Year
Ended |
|
|
Ordinary
Income
Distributions(6)
|
|
|
Long-Term
Capital Gain
Distributions |
|
|
Return of
Capital |
|
| |
12/31/2011 |
|
|
$ |
212 |
|
|
$ |
— |
|
|
$ |
— |
|
| |
12/31/2010 |
|
|
$ |
— |
|
|
$ |
— |
|
|
$ |
— |
|
| (6) |
Includes short-term capital gains, if any, distributed. |
15. SUBSEQUENT EVENTS
The investment adviser has evaluated the possibility of subsequent events and has
determined that there are no material events that would require disclosure in the Portfolio’s financial statements.
|
|
|
|
|
|
|
|
|
DECEMBER 31, 2011 |
|
ANNUAL REPORT |
|
27 |
Report of Independent Registered Public Accounting Firm
To the Board of Trustees of PIMCO Equity Series VIT and
Advisor Class Shareholders of PIMCO EqS Pathfinder PortfolioTM:
In our opinion, the accompanying consolidated statement of assets and liabilities, including the consolidated schedule of investments, and the
related consolidated statements of operations and of changes in net assets and the financial highlights for the Advisor Class present fairly, in all material respects, the financial position of PIMCO EqS Pathfinder PortfolioTM and its wholly owned subsidiary (constituting PIMCO Equity Series VIT, hereinafter
referred to as the “Portfolio”) at December 31, 2011, the results of their operations for the year then ended, and the changes in their net assets and the financial highlights for the Advisor Class for each of the periods presented,
in conformity with accounting principles generally accepted in the United States of America. These financial statements and financial highlights (hereafter referred to as “financial statements”) are the responsibility of the
Portfolio’s management; our responsibility is to express an opinion on these financial statements based on our audits. We conducted our audits of these financial statements in accordance with the standards of the Public Company Accounting
Oversight Board (United States). Those standards require that we plan and perform the audit to obtain reasonable assurance about whether the financial statements are free of material misstatement. An audit includes examining, on a test basis,
evidence supporting the amounts and disclosures in the financial statements, assessing the accounting principles used and significant estimates made by management, and evaluating the overall financial statement presentation. We believe that our
audits, which included confirmation of securities at December 31, 2011 by correspondence with the custodian and brokers, provide a reasonable basis for our opinion.
PricewaterhouseCoopers LLP
Kansas City, Missouri
February 17, 2012
|
|
|
|
|
|
|
| 28 |
|
PIMCO EQUITY SERIES VIT |
|
|
|
|
Glossary: (abbreviations that may be used in
the preceding statements)
(Unaudited)
|
|
|
|
|
|
|
|
|
|
|
|
|
|
|
|
| Counterparty Abbreviations: |
|
|
|
|
|
|
|
|
| BOA |
|
Bank of America N.A. |
|
FBF |
|
Credit Suisse International |
|
JPM |
|
JPMorgan Chase Bank N.A. |
| BPS |
|
BNP Paribas S.A. |
|
FBL |
|
Credit Suisse AG |
|
MSC |
|
Morgan Stanley & Co., Inc. |
| BRC |
|
Barclays Bank PLC |
|
GSC |
|
Goldman Sachs & Co. |
|
MYI |
|
Morgan Stanley & Co. International PLC |
| CBK |
|
Citibank N.A. |
|
GST |
|
Goldman Sachs International |
|
RBC |
|
Royal Bank of Canada |
| DUB |
|
Deutsche Bank AG |
|
HUS |
|
HSBC Bank USA N.A. |
|
UAG |
|
UBS AG Stamford |
|
|
|
|
|
| Currency Abbreviations: |
|
|
|
|
|
|
|
|
| AUD |
|
Australian Dollar |
|
EUR |
|
Euro |
|
NZD |
|
New Zealand Dollar |
| BRL |
|
Brazilian Real |
|
GBP |
|
British Pound |
|
PLN |
|
Polish Zloty |
| CAD |
|
Canadian Dollar |
|
HKD |
|
Hong Kong Dollar |
|
SEK |
|
Swedish Krona |
| CHF |
|
Swiss Franc |
|
JPY |
|
Japanese Yen |
|
SGD |
|
Singapore Dollar |
| CNY |
|
Chinese Renminbi |
|
KRW |
|
South Korean Won |
|
USD |
|
United States Dollar |
| DKK |
|
Danish Krone |
|
NOK |
|
Norwegian Krone |
|
ZAR |
|
South African Rand |
|
|
|
|
|
| Exchange Abbreviations: |
|
|
|
|
|
|
|
|
| CBOE |
|
Chicago Board Options Exchange |
|
CBOT |
|
Chicago Board of Trade |
|
OTC |
|
Over-the-Counter |
|
|
|
|
|
| Index Abbreviations: |
|
|
|
|
|
|
|
|
| EAFA |
|
Europe, Australasia, and Far East Stock Index |
|
|
|
|
|
|
|
|
|
|
|
|
|
| Other Abbreviations: |
|
|
|
|
|
|
|
|
| LIBOR |
|
London Interbank Offered Rate |
|
SP-ADR |
|
Sponsored American Depositary Receipt |
|
SPDR |
|
Standard & Poor’s Depository Receipts |
| MSCI |
|
Morgan Stanley Capital International |
|
|
|
|
|
|
|
|
|
|
|
|
|
|
|
|
|
DECEMBER 31, 2011 |
|
ANNUAL REPORT |
|
29 |
Federal Income Tax Information
(Unaudited)
As required by the Internal Revenue Code (“Code”) and Treasury Regulations, if applicable, shareholders must be notified within
60 days of the Portfolio’s fiscal year end regarding the status of qualified dividend income and the dividend received deduction.
Qualified Dividend Income. Under the Jobs and
Growth Tax Relief Reconciliation Act of 2003 (the “Act”), the following percentage of ordinary dividends paid during the calendar year was designated as “qualified dividend income”, as defined in the Act, subject to reduced tax
rates in 2011:
Dividend Received Deduction. Corporate
shareholders are generally entitled to take the dividend received deduction on the portion of a Portfolio’s dividend distribution that qualifies under tax law. The percentage of the following Portfolio’s calendar year ordinary income
dividend that qualifies for the corporate dividend received deduction is set forth below:
Shareholders are advised to consult their own tax
advisor with respect to the tax consequences of their investment in the Trust. However, income received by tax-exempt recipients need not be reported as taxable income.
|
|
|
|
|
|
|
| 30 |
|
PIMCO EQUITY SERIES VIT |
|
|
|
|
Management of the Trust
(Unaudited)
The chart below identifies the Trustees and Officers of the Trust. Each “interested” Trustee as defined by the 1940 Act, is indicated by an asterisk (*).
Unless otherwise indicated, the address of all persons below is 840 Newport Center Drive, Newport Beach, CA 92660.
The Portfolio’s Statement of Additional Information includes more information about the Trustees and Officers. To request a free copy, call PIMCO at (800) 927-4648 or visit our website at
http://pvit.pimco-funds.com.
Trustees of the Trust
|
|
|
|
|
|
|
|
|
| Name, Year of Birth and Position Held with Trust |
|
Term of
Office** and
Length of
Time Served |
|
Principal Occupation(s) During Past 5 Years |
|
Number of Funds in
Fund Complex
Overseen by Trustee |
|
Other Directorships Held by Trustee |
|
|
|
|
|
| Interested Trustees |
|
|
|
|
|
|
|
|
|
|
|
|
|
| Brent R. Harris* (1959) Chairman
of the Board and Trustee |
|
03/2010 to present |
|
Managing Director and member of Executive Committee, PIMCO. |
|
156 |
|
Chairman and Trustee, PIMCO Funds, PIMCO Variable Insurance Trust, PIMCO ETF Trust, PIMCO Equity Series; Director,
StocksPLUS® Management, Inc.; and member of Board of Governors, Investment Company Institute. Board Member and Owner, Harris Holdings, LLC (1992-present). Formerly
Chairman and Director, PCM Fund, Inc. Formerly, Chairman and Director, PIMCO Strategic Global Government Fund, Inc. |
|
|
|
|
|
| Neel T. Kashkari* (1973) Trustee |
|
09/2011 to present |
|
Managing Director, PIMCO. Formerly, Interim Assistant Secretary for Financial Stability, Assistant Secretary for International Economics and Senior
Advisor to Secretary Paulson, United States Department of Treasury; Vice President, Goldman Sachs Group, Inc. |
|
6 |
|
Trustee, PIMCO Equity Series |
|
|
|
|
|
| Independent Trustees |
|
|
|
|
|
|
|
|
|
|
|
|
|
| E. Philip Cannon (1940)
Trustee |
|
03/2010 to present |
|
Private Investor. Formerly, President, Houston Zoo. |
|
156 |
|
Trustee, PIMCO Equity Series; Trustee, PIMCO ETF Trust; Trustee, PIMCO Funds; and Trustee, PIMCO Variable Insurance Trust. Formerly, Director, PCM Fund, Inc. |
|
|
|
|
|
| Vern O. Curtis (1934)
Trustee |
|
03/2010 to present |
|
Private Investor. |
|
156 |
|
Trustee, PIMCO Equity Series; Trustee, PIMCO ETF Trust; Trustee, PIMCO Funds; and Trustee, PIMCO Variable Insurance Trust. Formerly, Director, PCM Fund, Inc. |
|
|
|
|
|
| Allan B. Hubbard (1947)
Trustee |
|
02/2011 to present |
|
Chairman, E&A Holdings, Inc. (Private Holding Company). Formerly, Assistant to the President for Economic Policy and Director, National Economic Council—President George W. Bush
administration. |
|
6 |
|
Trustee, PIMCO Equity Series; Independent Director, Simon Property Group |
|
|
|
|
|
| Peter B. McCarthy (1950) Trustee |
|
09/2011 to present |
|
Formerly, Assistant Secretary and Chief Financial Officer, United States Department of Treasury; Deputy Managing Director, Institute of International
Finance. |
|
6 |
|
Trustee, PIMCO Equity Series |
* Mr. Harris and Mr. Kashkari are
“interested persons” of the Trust (as that term is defined in the 1940 Act) because of their affiliation with PIMCO.
** Trustees serve until
their successors are duly elected and qualified.
|
|
|
|
|
|
|
|
|
DECEMBER 31, 2011 |
|
ANNUAL REPORT |
|
31 |
Management of the Trust
(Unaudited)
Executive Officers
|
|
|
|
|
Name, Year of Birth and
Position Held with Trust |
|
Term of Office and
Length of Time Served |
|
Principal Occupation(s) During Past 5 Years |
|
|
|
| Neel T. Kashkari (1973)
President |
|
03/2010 to present |
|
Managing Director, PIMCO. Formerly, Interim Assistant Secretary for Financial Stability, Assistant Secretary for International Economics and Senior Advisor to Secretary Paulson, United States
Department of Treasury. |
|
|
|
| David C. Flattum (1964) Chief
Legal Officer |
|
03/2010 to present |
|
Managing Director and General Counsel, PIMCO. Formerly, Executive Vice President, PIMCO, Managing Director, Chief Operating Officer and General Counsel, Allianz Asset Management of America
L.P. and Partner at Latham & Watkins LLP. |
|
|
|
| Jennifer E. Durham (1970) Chief
Compliance Officer |
|
03/2010 to present |
|
Executive Vice President and Chief Compliance Officer, PIMCO. Formerly; Senior Vice President, PIMCO. Formerly, Vice President and Legal/Compliance Manager, PIMCO. |
|
|
|
| William H. Gross (1944) Senior
Vice President |
|
03/2010 to present |
|
Managing Director and Co-Chief Investment Officer, PIMCO. |
|
|
|
| Mohamed El-Erian (1958) Senior
Vice President |
|
03/2010 to present |
|
Managing Director, Co-Chief Investment Officer and Chief Executive Officer, PIMCO. Formerly, President and CEO of Harvard Management Company. Formerly, Managing Director,
PIMCO. |
|
|
|
| Brent R. Harris (1959) Senior
Vice President |
|
03/2010 to present |
|
Managing Director and member of Executive Committee, PIMCO. |
|
|
|
| Douglas M. Hodge (1957) Senior
Vice President |
|
03/2010 to present |
|
Managing Director; Chief Operating Officer (since 7/09); Member of Executive Committee and Head of PIMCO’s Asia Pacific region. Member Global Executive Committee, Allianz Asset
Management. |
|
|
|
| J. Stephen King, Jr. (1962)
Vice President - Senior Counsel, Secretary |
|
03/2010 to present |
|
Senior Vice President and Attorney, PIMCO. Formerly Vice President, PIMCO and Associate, Dechert LLP. |
|
|
|
| Peter G. Strelow (1970) Vice
President |
|
03/2010 to present |
|
Executive Vice President, PIMCO. Formerly, Senior Vice President and Vice President, PIMCO. |
|
|
|
| Henrik P. Larsen (1970) Vice
President |
|
03/2010 to present |
|
Senior Vice President, PIMCO. Formerly, Vice President, PIMCO. |
|
|
|
| Eric D. Johnson (1970) Vice
President |
|
05/2011 to present |
|
Senior Vice President, PIMCO. Formerly Vice President, PIMCO. |
|
|
|
| Greggory S. Wolf (1970) Vice
President |
|
05/2011 to present |
|
Senior Vice President, PIMCO. Formerly, Vice President and Manager, PIMCO. |
|
|
|
| John P. Hardaway (1957)
Treasurer |
|
03/2010 to present |
|
Executive Vice President, PIMCO. Formerly, Senior Vice President, PIMCO. |
|
|
|
| Stacie D. Anctil (1969) Assistant
Treasurer |
|
03/2010 to present |
|
Senior Vice President, PIMCO. Formerly, Vice President, PIMCO. Formerly, Specialist, PIMCO. |
|
|
|
| Erik C. Brown (1967) Assistant
Treasurer |
|
03/2010 to present |
|
Senior Vice President, PIMCO. Formerly, Vice President, PIMCO. |
|
|
|
| Trent W. Walker (1974) Assistant Treasurer |
|
03/2010 to present |
|
Senior Vice President, PIMCO. Formerly, Vice President, PIMCO. |
|
|
|
|
|
|
|
| 32 |
|
PIMCO EQUITY SERIES VIT |
|
|
|
|
Privacy Policy
(Unaudited)
The Portfolio considers customer privacy to be a fundamental aspect of its relationships with shareholders and is
committed to maintaining the confidentiality, integrity and security of its current, prospective and former shareholders’ personal information. To ensure its shareholders’ privacy, the Portfolio has developed policies that are designed to
protect this confidentiality, while allowing shareholder needs to be served.
Obtaining Personal Information
In the course of providing shareholders with products and services, the Portfolio and certain service providers to the Portfolio, such as the Portfolio’s
investment adviser (“Adviser”), may obtain non-public personal information about shareholders, which may come from sources such as account applications and other forms, from other written, electronic or verbal correspondence, from
shareholder transactions, from a shareholder’s brokerage or financial advisory firm, financial adviser or consultant, and/or from information captured on the Portfolio’s internet websites.
Respecting Your Privacy
As a matter of policy, the Portfolio does not disclose any personal or account
information provided by shareholders or gathered by the Portfolio to non-affiliated third parties, except as required or permitted by law or as necessary for such third parties to perform their agreements with respect to the Portfolio. As is common
in the industry, non-affiliated companies may from time to time be used to provide certain services, such as preparing and mailing prospectuses, reports, account statements and other information, conducting research on shareholder satisfaction and
gathering shareholder proxies. The Portfolio’s Distributor may also retain non-affiliated companies to market the Portfolio’s shares or products which use the Portfolio’s shares and enter into joint marketing agreements with other
companies. These companies may have access to a shareholder’s personal and account information, but are permitted to use this information solely to provide the specific service or as otherwise permitted by law. In most cases, the shareholders
will be clients of a third party, but the Portfolio may also provide a shareholder’s personal and account information to the shareholder’s respective brokerage or financial advisory firm.
Sharing Information with Third Parties
The Portfolio reserves the right to disclose or report personal information to
non-affiliated third parties, in limited circumstances, where the Portfolio believes in good faith that disclosure is required under law to cooperate with regulators or law enforcement authorities, to protect its rights or property or upon
reasonable request by the Portfolio in which a shareholder has chosen to invest. In addition, the Portfolio may disclose information about a shareholder’s accounts to a non-affiliated third party with the consent of the shareholder.
Sharing Information with Affiliates
The Portfolio may share shareholder information with its affiliates in connection with
servicing its shareholders’ accounts, and subject to applicable law may provide shareholders with information about products and services that the Portfolio or its Adviser, principal underwriters or their affiliates (“Service
Affiliates”) believe may be of interest to such shareholders. The information that the Portfolio shares may include, for example, a shareholder’s participation in the Portfolio or in other investment programs sponsored by a Service
Affiliate, a shareholder’s ownership of certain types of accounts (such as IRAs), or other data about a shareholder’s accounts, subject to applicable law. The Portfolio’s Service Affiliates, in turn, are not permitted to share
shareholder information with non-affiliated entities, except as required or permitted by law.
Procedures to Safeguard Private Information
The Portfolio takes seriously the obligation to safeguard shareholder non-public personal information. In addition to this policy, the Portfolio has also implemented procedures that are designed to restrict access
to a shareholder’s non-public personal information only to internal personnel who need to know that information in order to provide products or services to such shareholders. In order to guard a shareholder’s non-public personal
information, physical, electronic and procedural safeguards are in place.
|
|
|
|
|
|
|
|
|
DECEMBER 31, 2011 |
|
ANNUAL REPORT |
|
33 |
Shareholder Meeting Results
(Unaudited)
A special meeting of shareholders of the PIMCO EqS Pathfinder Portfolio, a series of the Trust, was held on
October 24, 2011 at 10:00 a.m., Pacific time, at 800 Newport Center Drive, 6th Floor, Newport Beach, California 92660, pursuant to notice duly given to shareholders of the Portfolio contained in the definitive proxy statement filed with the Securities and Exchange Commission on
September 20, 2011 (the “Meeting”).
At the Meeting,
shareholders were asked to provide voting instructions to elect three Trustees to the Board of Trustees. The results of the shareholder vote were as follows:
|
|
|
|
|
|
|
| |
|
Affirmative |
|
Withheld Authority |
|
Total |
| Election of Allan B. Hubbard |
|
826,831.7386 |
|
26,484.1834 |
|
853,315.9220 |
| Election of Neel T. Kashkari |
|
825,285.6172 |
|
28,030.3048 |
|
853,315.9220 |
| Election of Peter B. McCarthy |
|
826,831.7386 |
|
26,484.1834 |
|
853,315.9220 |
The other members of the Board of Trustees at the time
of the Meeting, E. Philip Cannon, Vern O. Curtis and Brent R. Harris, continue to serve as Trustees.
|
|
|
|
|
|
|
| 34 |
|
PIMCO EQUITY SERIES VIT |
|
|
|
|
Approval of Renewal of the Investment Advisory Contract and Supervision and
Administration Agreement
(Unaudited)
On August 15, 2011, the Board of Trustees (the “Board”) of PIMCO Equity Series VIT
(the “Trust”), including all of the independent Trustees, approved the Investment Advisory Contract and Supervision and Administration Agreement (together, with the Investment Advisory Contract, the “Agreements”) with Pacific
Investment Management Company LLC (“PIMCO”), on behalf of the PIMCO EqS Pathfinder PortfolioTM (the “Portfolio”), for an additional one-year term through August 31, 2012.
The information, material factors and conclusions that formed the basis for the Board’s approval of the Agreements are described below.
During the course of each
year, the Trustees receive a wide variety of materials relating to the services provided by PIMCO. At each of its quarterly meetings, the Board reviews the Portfolio’s investment performance and a significant amount of information relating to
Portfolio operations, including the Portfolio’s compliance program, shareholder services, valuation, custody, distribution, and other information relating to the nature, extent and quality of services provided by PIMCO to the Trust. In
considering whether to approve the renewal of the Agreements, the Board also reviewed supplementary information, including, but not limited to, comparative industry data with regard to investment performance, advisory and supervisory and
administrative fees and expenses, financial information regarding PIMCO, information about the personnel providing investment management services and supervisory and administrative services to the Portfolio and, if available, information about the
fees charged and services provided by PIMCO to other clients with similar investment mandates as the Portfolio. The Board also reviewed material provided by counsel to the Trust and the independent Trustees, which included, among other things,
memorandum outlining legal duties of the Board in considering the continuation of the Agreements.
In connection with the
approval of the renewal of the Agreements, the Board reviewed written materials prepared by PIMCO in response to a request from counsel to the Trust. The Board also requested and received assistance and advice regarding applicable legal standards
from Trust counsel, and reviewed comparative fee and performance data prepared at the Board’s request by Lipper, Inc. (“Lipper”), an independent provider of investment company performance and fee and expense data. The Board also heard
oral presentations on matters related to the Agreements and met both as a full Board and as the independent Trustees, without management present, at the August 15, 2011 meeting. The independent Trustees also met with counsel to the Trust on
August 4, 2011 to discuss the materials presented.
The
approval determinations were made on the basis of each Trustee’s business judgment after consideration of all the information presented. Individual Trustees may have given different weights to certain factors and assigned various degrees of
materiality to information received in connection with the approval process. In deciding to approve the renewal of the Agreements, the Board did not identify any single factor or particular information that, in isolation, was controlling. This
summary describes the most important, but not all, of the factors considered by the Board.
| 2. |
Nature, Extent and Quality of Services |
| |
A. |
PIMCO, its Personnel, and Resources |
The
Board considered the depth and quality of PIMCO’s investment management process, including: the experience, capability and integrity of its senior management and other personnel; the low turnover rates of its key personnel; the overall
financial strength and stability of its organization; and the ability of its organizational structure to address
the recent growth in assets under management. The Board also considered that PIMCO makes available to its investment professionals a variety of resources and systems relating to investment
management, compliance, trading, performance and portfolio accounting. The Board noted that PIMCO has hired and will seek to hire additional personnel with equity experience, including traders, research analysts and compliance personnel to
supplement existing PIMCO personnel. The Board considered PIMCO’s commitment to investing in information technology supporting investment management and compliance, as well as PIMCO’s continuing efforts to attract and retain qualified
personnel and to maintain and enhance its resources and systems. The Board considered PIMCO’s policies, procedures and systems to assure compliance with applicable laws and regulations and its commitment to these programs; its efforts to keep
the Trustees informed about matters relevant to the Portfolio and its shareholders; and its attention to matters that may involve conflicts of interest.
The Trustees considered the steps that PIMCO has taken in recent years with respect to active management of counterparty risk, such as implementing
procedures requiring daily collateral adjustments and frequent communication between credit analysts and the counterparty risk committee. The Trustees considered that, over the last year, PIMCO has continued to strengthen the process it uses to
assess the financial stability of broker-dealers with which the Portfolio does business, to manage collateral and to protect portfolios from an unforeseen deterioration in the creditworthiness of trading counterparties. The Trustees noted that PIMCO
continued to invest in automated documentation management systems to better track trade documentation with broker-dealers.
The Trustees also considered new services and service enhancements that PIMCO has implemented since the Agreements were approved in 2010 in
connection with the launch of the Portfolio, including, but not limited to, undertaking significant technology initiatives; broadening the PIMCO Retail Oversight (“PRO”) group to include oversight of institutional classes; implementing a
quality management system for processes/activities; converting to a prospectus content management system; developing a “Pricing Portal” to streamline and automate certain pricing functions; continuing to implement fair valuation level
assignments per FAS 157; planning to outsource net asset value delivery to another service provider to accelerate delivery timing to intermediaries; improving the review of Boston Financial Data Services’ large trade processing; implementing
new cost basis reporting obligations; and creating the PIMCO Risk Committee, which is the global risk oversight committee at PIMCO.
Ultimately, the Board concluded that the nature, extent and quality of services provided by PIMCO under the Agreements has benefited and will likely
continue to benefit the Portfolio and its shareholders.
The Board considered
PIMCO’s policies, procedures and systems to assure compliance with applicable laws and regulations and its commitment to these programs; its efforts to keep the Trustees informed about matters relevant to the Portfolio and its shareholders; and
its attention to matters that may involve conflicts of interest. The Board also considered the nature, extent, quality and cost of supervisory and administrative services provided by PIMCO to the Portfolio under the Agreements.
The Board considered the terms of Trust’s Supervision and
Administration Agreement, under which the Trust pays for the supervisory and administrative services it requires under what is essentially an all-in fee structure (the “unified fee”). In return, PIMCO provides or procures supervisory and
administrative services and bears the costs of various third party services required by the Portfolio,
|
|
|
|
|
|
|
|
|
DECEMBER 31, 2011 |
|
ANNUAL REPORT |
|
35 |
Approval of Renewal of the Investment Advisory Contract and Supervision and Administration Agreement (Cont.)
including audit, custodial, portfolio accounting, legal, transfer agency and printing costs. The Board considered PIMCO’s provision of these services and its supervision of the Trust’s
third party service providers.
Ultimately, the Board
concluded that the nature, extent and quality of the services provided by PIMCO has benefited and will likely continue to benefit the Portfolio and its shareholders.
| 3. |
Investment Performance |
The Board received and examined
information from PIMCO concerning the Portfolio’s performance for the one-year and since inception periods ended May 31, 2011 and other performance data, as available, for the periods ended June 30, 2011 (the “PIMCO Report”)
and from Lipper concerning the Portfolio’s performance, as available, for the periods ended May 31, 2011 (the “Lipper Report”). The Board noted that long-term performance information was not available due to the Portfolio’s
relatively recent commencement of operations. The Board considered the Portfolio’s investment performance relative to its peer group and benchmark index as provided to the Board in advance of each of its quarterly meetings throughout the year,
including the PIMCO Report and the Lipper Report, which were provided in advance of the August 15, 2011 meeting.
The Board discussed with PIMCO the reasons for the Portfolio’s underperformance in comparison to its benchmark index and Lipper peer group. Although the
Portfolio had underperformed in comparison to its benchmark index, the Board noted that the Portfolio had outperformed its benchmark index during periods of market downturn. The Board also considered the risk-adjusted performance of the Portfolio
and noted that the Portfolio compared favorably to competitor funds.
The
Board ultimately determined within the context of all of its considerations in connection with the Agreements, that PIMCO’s performance record and process in managing the Portfolio indicates that its continued management is likely to benefit
the Portfolio and its shareholders, and merits the approval of the continuation of the Agreements.
| 4. |
Advisory Fees, Supervisory and Administrative Fees and Total Expenses |
PIMCO reported to the Board that, in proposing fees for the Portfolio, it considers a number of factors, including the type and complexity of the services provided, the cost of providing services, the risk assumed
by PIMCO in the provision of services, the impact on potential returns from different levels of fees, the competitive marketplace for financial products, and the attractiveness of Portfolio returns to investors.
The Board reviewed the advisory fee, supervisory and administrative fee and total
expenses of the Portfolio (each as a percentage of average net assets) and compared such amounts with the average and median fees and expenses of other similar funds. With respect to advisory fees, the Board reviewed data from Lipper that compared
the average and median advisory fees of other funds in a “Peer Group Expense Comparison” of comparable funds, as well as the universe of other similar funds. The Board compared the Portfolio’s total expenses to other funds in the Peer
Group Expense Comparison provided by Lipper and found the Portfolio’s total expenses to be reasonable. The Board also noted that PIMCO had contractually agreed, through May 1, 2012, to reduce its advisory fee by 0.13% of the average daily
net assets of the Portfolio.
The Board also reviewed data comparing
the Portfolio’s advisory fees to the standard fee rate PIMCO charges to separate accounts and other investment companies with a similar investment strategy. In cases where the advisory fees for certain separate account clients were lower than
those charged to the Portfolio, the Trustees noted that the differences in fees were attributable to various factors, including differences in the services provided by PIMCO to the Portfolio, the manner in which similar portfolios may be managed,
different
requirements with respect to liquidity management and the implementation of other regulatory requirements, and the fact that separate accounts may have other contractual arrangements that justify
different levels of fees.
The Board considered the Portfolio’s
supervisory and administrative fees, comparing them to similar funds in the report supplied by Lipper. The Board considered that PIMCO has provided a broad array of fund supervisory and administrative functions. The Board also considered the
Trust’s unified fee structure, under which the Portfolio pays for the supervisory and administrative services it requires for one set fee, and in return, PIMCO provides or procures supervisory and administrative services and bears the costs of
various third party services required by the Portfolio, including audit, custodial, portfolio accounting, legal, transfer agency and printing costs. The Board noted that many other funds pay for these services separately, and thus it is difficult to
directly compare the Portfolio’s unified supervisory and administrative fees with the fees paid by other funds for administrative services alone. The Board noted that the unified supervisory and administrative fee leads to fund fees that are
fixed, rather than variable, and that fixed fees were viewed by many in the industry as a positive attribute of the Portfolio. The Board concluded that the Portfolio’s supervisory and administrative fees were reasonable in relation to the value
of the services provided, including the services provided to different classes of shareholders, and that the expenses assumed contractually by PIMCO under the Supervision and Administration Agreement represent, in effect, a cap on overall fund
expenses which is beneficial to the Portfolio and its shareholders. The Board further noted that, although the unified fee structure does not have break points, it implicitly reflects economies of scale by fixing the absolute level of Portfolio fees
at competitive levels, in effect, setting the fees as if the Portfolio was already at scale.
Based on the information presented by PIMCO and Lipper, members of the Board then determined, in the exercise of their business judgment, that the level of the advisory and supervisory and administrative fees
charged by PIMCO, as well as the total expenses of the Portfolio, are reasonable and renewal of the Agreements would likely benefit the Portfolio and its shareholders.
| 5. |
Adviser Costs, Level of Profits and Economies of Scale |
The
Board reviewed information regarding PIMCO’s costs of providing services to the Portfolio and considered that PIMCO continues to invest in the equity asset management platform and does not expect to derive any profit from the Portfolio during
its current fiscal year. The Board noted that it had also received information regarding the structure and manner in which PIMCO’s investment professionals were compensated, and PIMCO’s view of the relationship of such compensation to the
attraction and retention of quality personnel. The Board considered PIMCO’s need to invest in technology, infrastructure and staff to reinforce and offer new services and to accommodate changing regulatory requirements.
With respect to potential economies of scale, the Board found that because the unified
fee protects shareholders against unanticipated increases in expense ratios due to redemptions, declines in asset values, or increases in the costs of services provided or procured by PIMCO, economies of scale are implicitly recognized in the level
of the unified fee (which, together with the advisory fee, serves as a proxy for the Portfolio’s overall expense ratio). The Board noted that PIMCO may share the benefits of economies of scale with the Portfolio and its shareholders in a number
of ways, including through fee reductions or waivers, the pricing of the Portfolio to scale from inception and the enhancement of services provided in return for fees paid. The Trustees also considered that the unified fee has provided inherent
economies of scale by maintaining fixed fees even if the Portfolio’s operating costs rise.
The Board concluded that the Portfolio’s cost structure was reasonable and that the unified fee structure inherently involves the sharing of economies of scale between PIMCO and the Portfolio, to the benefit
of Portfolio shareholders.
|
|
|
|
|
|
|
| 36 |
|
PIMCO EQUITY SERIES VIT |
|
|
|
|
(Unaudited)
The Board considered other benefits
received by PIMCO and its affiliates as a result of PIMCO’s relationship with the Trust, including possible ancillary benefits to PIMCO’s institutional investment management business due to the reputation and market penetration of the
Portfolio. The Board also considered that affiliates of PIMCO will provide distribution and shareholder services to the Portfolio and its shareholders, for which the affiliates of PIMCO may be compensated under the unified supervisory and
administrative fee, or through distribution fees paid pursuant to the Portfolio’s Rule 12b-1 plans. The Board reviewed PIMCO’s soft dollar policies and procedures, noting that while PIMCO has the authority to receive the benefit of
research provided by broker-dealers executing portfolio transactions on behalf of the Portfolio, it has adopted a policy not to enter into contractual soft dollar arrangements.
Based on its review, including its consideration
of each of the factors referred to above, the Board concluded that the nature, extent and quality of the services rendered to the Portfolio by PIMCO continued to be excellent and favored the renewal of the Agreements. The Board concluded that the
Agreements continued to be fair and reasonable to the Portfolio and its shareholders, that the Portfolio’s shareholders received reasonable value in return for the advisory fees and other amounts paid to PIMCO by the Portfolio, and that the
approval of the Agreements was in the best interests of the Portfolio and its shareholders.
|
|
|
|
|
|
|
|
|
DECEMBER 31, 2011 |
|
ANNUAL REPORT |
|
37 |
General Information
Investment Adviser and Administrator
Pacific Investment Management Company LLC
840 Newport Center Drive
Newport Beach, CA 92660
Distributor
PIMCO Investments LLC
1633 Broadway
New York,
NY 10019
Custodian
State Street Bank and Trust Company
801 Pennsylvania
Kansas City, MO 64105
Transfer Agent
Boston Financial Data Services, Inc.
P.O. Box 55060
Boston, MA
02205-8050
Legal Counsel
Dechert LLP
1775 I Street, N.W.
Washington, D.C. 20006
Independent Registered Public Accounting Firm
PricewaterhouseCoopers LLP
1100
Walnut Street
Kansas City, MO 64106
This report is submitted for the general information of the shareholders of the PIMCO Equity Series VIT.
pvit.pimco-funds.com

EVIT01AR_123111
|
|
|
|
|
|
|
|
|
|
|
| Item 2. |
|
Code of Ethics. |
|
|
|
|
As of the end of the period covered by this report, the Registrant has adopted a code of ethics (the “Code”) that
applies to the Registrant’s principal executive officer and principal financial officer. During the period, the Code was amended to reflect a change in the principal underwriter of the series of the Registrant. The Registrant did not grant any
waivers, including implicit waivers, from any provisions of the Code to the principal executive officer or principal financial officer during the period covered by this report.
A copy of the Code is included as an exhibit to this report. |
|
|
| Item 3. |
|
Audit Committee Financial Expert. |
|
|
|
|
|
|
|
|
|
|
|
|
(a) |
|
The Board of Trustees has determined that Vern O. Curtis, who serves on the Board’s audit committee, qualifies as an “audit committee financial expert”
as such term is defined in the instructions to this Item 3. The Board has also determined that Mr. Curtis is “independent” as such term is interpreted under this
Item 3. |
|
|
|
|
|
|
|
|
|
|
|
| Item 4. |
|
Principal Accountant Fees and Services. |
|
|
|
|
|
|
|
|
|
|
|
|
|
|
|
|
| |
|
(a) |
|
Fiscal Year
Ended |
|
Audit Fees |
|
|
|
|
|
|
|
December 31, 2011 |
|
$ |
44,697 |
|
|
|
|
|
|
|
December 31, 2010 |
|
$ |
24,561 |
|
|
|
|
|
|
|
|
| |
|
(b) |
|
Fiscal Year Ended |
|
Audit-Related Fees |
|
|
|
|
|
|
|
December 31, 2011 |
|
$ |
— |
|
|
|
|
|
|
|
December 31, 2010 |
|
$ |
— |
|
|
|
|
|
|
|
|
| |
|
(c) |
|
Fiscal Year Ended |
|
Tax Fees(1) |
|
|
|
|
|
|
|
December 31, 2011 |
|
$ |
— |
|
|
|
|
|
|
|
December 31, 2010 |
|
$ |
— |
|
|
|
|
|
|
|
|
| |
|
(d) |
|
Fiscal Year Ended |
|
All Other
Fees(2) |
|
|
|
|
|
|
|
December 31, 2011 |
|
$ |
— |
|
|
|
|
|
|
|
December 31, 2010 |
|
$ |
— |
|
|
|
|
|
|
|
|
|
|
“Audit Fees” represents aggregate fees billed for each of the last two fiscal years for professional services rendered for the audit of the PIMCO Equity
Series VIT (the “Trust” or “Registrant”) annual financial statements for those fiscal years or services that are normally provided by the accountant in connection with statutory or regulatory filings or engagements for those
fiscal years. |
|
|
|
|
|
|
|
“Audit-Related Fees” represents aggregate fees billed for each of the last two fiscal years for assurance and related services reasonably related to the
performance of the audit of the Trust’s annual financial statements for those years. |
|
|
|
|
|
|
|
“Tax Fees” represents aggregate fees billed for each of the last two fiscal years for professional services related to tax compliance, tax advice and tax
planning, including review of federal and state income tax returns, review of excise tax distribution requirements and preparation of excise tax returns. |
|
|
|
|
|
|
|
“All Other Fees” represents aggregate fees, if any, billed for other products and services rendered by the principal accountant to the Trust for the last
two fiscal years. |
|
|
|
|
|
|
|
|
|
(1) There were no “Tax Fees” for the last two fiscal years.
(2) There were no “All Other Fees” for the last two fiscal
years. |
|
|
|
|
|
|
|
|
|
|
|
|
|
|
(e) |
|
Pre-approval policies and procedures |
|
|
|
|
|
|
|
(1) The Registrant’s Audit Committee has adopted pre-approval policies and procedures
(the “Procedures”) to govern the Audit Committee’s pre-approval of (i) all audit services and permissible non-audit services to be provided to the Registrant by its independent accountant, and (ii) all permissible non-audit services
to be provided by such independent accountant to the Registrant’s investment adviser and to any entity controlling, controlled by, or under common control with the investment adviser that provides ongoing services to the Registrant
(collectively, the “Service Affiliates”) if the services provided directly relate to the Registrant’s operations and financial reporting. In accordance with the Procedures, the Audit Committee is responsible for the engagement of the
independent accountant to certify the Registrant’s financial statements for each fiscal year. With respect to the pre-approval of non-audit services provided to the Registrant and its Service Affiliates, the Procedures provide that the Audit
Committee may annually pre-approve a list of types or categories of non-audit services that may be provided to the Registrant or its Service Affiliates, or the Audit Committee may pre-approve such services on a project-by-project basis as they
arise. Unless a type of service has received general pre-approval, it will require specific pre-approval by the Audit Committee if it is to be provided by the independent accountant. The Procedures also permit the Audit Committee to delegate
authority to one or more of its members to pre-approve any proposed non-audit services that have not been previously pre-approved by the Committee, subject to the ratification by the full Audit Committee no later than its next scheduled
meeting. |
|
|
|
|
|
|
|
(2) With respect to the services described in paragraphs (b) through (d) of this Item 4, no
amount was approved by the Audit Committee pursuant to paragraph (c)(7)(i)(C) of Rule 2-01 of Regulation S-X. |
|
|
|
|
|
(f) |
|
Not applicable. |
|
|
|
|
|
|
|
(g) |
|
|
|
|
|
|
|
|
|
|
|
|
|
|
|
|
|
|
|
| |
|
|
|
|
|
Aggregate Non-Audit Fees Billed to Entity |
|
|
|
|
|
|
| |
|
|
|
Entity |
|
December 31, 2011 |
|
|
December 31, 2010 |
|
|
|
|
|
PIMCO Equity Series VIT |
|
$ |
0 |
|
|
$ |
0 |
|
|
|
|
|
Pacific Investment Management Company LLC (“PIMCO”) |
|
$ |
4,226,779 |
|
|
$ |
2,214,446 |
|
|
|
|
|
Allianz Global Investors Fund Management LLC |
|
$ |
632,815 |
|
|
$ |
851,470 |
|
|
|
|
|
Allianz Asset Management of America L.P. (formerly known as Allianz Global Investors of America L.P.) |
|
$ |
3,134,831 |
|
|
$ |
2,945,767 |
|
|
|
|
|
|
|
|
|
|
|
|
|
|
|
|
|
|
Totals |
|
$ |
7,994,425 |
|
|
$ |
6,011,683 |
|
|
|
|
|
|
|
|
|
|
|
|
|
|
|
|
|
|
|
|
|
|
|
|
|
|
|
|
|
|
|
|
|
|
|
|
|
|
(h) |
|
The Registrant’s Audit Committee has considered whether the provision of non-audit services that were rendered to the Registrant’s investment adviser, and
any entity controlling, controlled by, or under common control with the investment adviser that provides ongoing services to the Registrant which were not pre-approved (not requiring pre-approval) is compatible with maintaining the principal
accountant’s independence. |
|
|
|
|
|
|
|
|
|
|
|
| Item 5. |
|
Audit Committee of Listed Registrants. |
|
|
|
|
The Registrant has a separately-designated standing audit committee established in accordance with Section 3(a)(58)(A)
of the Securities Exchange Act of 1934, as amended. The audit committee is comprised of: E. Philip Cannon; Vern O. Curtis; Allan B. Hubbard; Peter B. McCarthy |
|
|
| Item 6. |
|
Schedule of Investments. |
|
|
|
|
The Schedule of Investments is included as part of the report to shareholders under Item 1. |
|
|
|
|
|
|
|
|
|
| Item 7. |
|
Disclosure of Proxy Voting Policies and Procedures for Closed-End Management Investment Companies. |
|
|
|
|
Not applicable. |
|
|
| Item 8. |
|
Portfolio Managers of Closed-End Management Investment Companies. |
|
|
|
|
Not applicable. |
|
|
| Item 9. |
|
Purchases of Equity Securities by Closed-End Management Investment Company and Affiliated Purchasers. |
|
|
|
|
Not applicable. |
|
|
| Item 10. |
|
Submission of Matters to a Vote of Security Holders. |
|
|
|
|
Not applicable. |
|
|
|
|
|
|
|
|
|
| Item 11. |
|
Controls and Procedures. |
|
|
|
|
|
(a) |
|
The principal executive officer and principal financial officer have concluded that the Registrant’s disclosure controls and procedures (as defined in Rule
30a-3(c) under the Investment Company Act of 1940, as amended (“1940 Act”)) provide reasonable assurances that material information relating to the Trust is made known to them by the appropriate persons, based on their evaluation of these
controls and procedures as of a date within 90 days of the filing of this report. |
|
|
|
|
|
(b) |
|
There were no changes in the Registrant’s internal control over financial reporting (as defined in Rule 30a-3(d) under the 1940 Act) that occurred during the
second fiscal quarter of the period covered by this report that have materially affected, or are reasonably likely to materially affect, the Registrant’s internal control over financial reporting. |
|
|
|
| Item 12. |
|
Exhibits. |
|
|
|
|
|
|
|
(a)(1) |
|
Exhibit 99.CODE—Code of Ethics pursuant to Section 406 of the Sarbanes-Oxley Act of 2002. |
|
|
|
|
|
(a)(2) |
|
Exhibit 99.CERT—Certifications pursuant to Section 302 of the Sarbanes-Oxley Act of 2002. |
|
|
|
|
|
(b) |
|
Exhibit 99.906CERT—Certifications pursuant to Section 906 of the Sarbanes-Oxley Act of 2002. |
Signatures
Pursuant to the requirements of the Securities Exchange Act of 1934 and the Investment Company Act of 1940, the registrant has duly caused this report to be signed on its behalf by the undersigned,
thereunto duly authorized.
|
|
|
| PIMCO Equity Series VIT |
|
|
| By: |
|
/s/ NEEL T.
KASHKARI |
|
|
Neel T. Kashkari |
|
|
President and Trustee, Principal Executive Officer |
|
|
|
|
Date: February 27, 2012 |
Pursuant to the requirements of the Securities Exchange Act of 1934 and the Investment Company Act of 1940, this
report has been signed below by the following persons on behalf of the registrant and in the capacities and on the dates indicated.
|
|
|
|
|
| By: |
|
/s/ NEEL T.
KASHKARI |
|
|
Neel T. Kashkari |
|
|
President and Trustee, Principal Executive Officer |
|
|
|
|
Date: February 27, 2012 |
|
|
| By: |
|
/s/ JOHN P.
HARDAWAY |
|
|
John P. Hardaway |
|
|
Treasurer, Principal Financial Officer |
|
|
|
|
Date: February 27, 2012 |