Exhibit 99.2

Supplemental Operating and Financial Data
For the Period Ended December 31, 2013
Table of Contents
| Page | ||
| Company Overview |
3 | |
| Property Locations |
4 | |
| Analyst Coverage |
5 | |
| Summary Financial and Portfolio Data |
6 | |
| Financial Summary |
||
| Consolidated Balance Sheets |
7 | |
| Consolidated Statements of Operations |
8 | |
| Reconciliation of Net Income to EBITDA |
9 | |
| Reconciliation of Net Income to FFO and AFFO |
10 | |
| Debt Summary |
11 | |
| Common and Preferred Stock Data |
12 | |
| Portfolio Summary |
||
| Acquisitions & Developments |
13 | |
| Operating Portfolio Summary |
14 | |
| Summary of Retail Leasing Activity |
15 | |
| Same Property Analysis |
16 | |
| Major Tenants |
17 | |
| Expiration Schedule |
18 | |
| Unconsolidated Investments |
19 | |
| Definitions |
20 | |
*Note: Financial and portfolio information reflects the consolidated operations of the
company and excludes unconsolidated entities unless otherwise noted.
Company Overview
| Corporate Headquarters | Other Offices | |||||||
| Excel Trust, Inc. | Atlanta, GA | Salt Lake City, UT | ||||||
| 17140 Bernardo Center Dr., Ste 300 | Dallas, TX | Scottsdale, AZ | ||||||
| San Diego, CA 92128 | Orlando, FL | Stockton, CA | ||||||
| Tel: 858-613-1800 | Richmond, VA | |||||||
| Email: info@exceltrust.com | ||||||||
| Website: www.exceltrust.com | ||||||||
| Executives & Senior Management | ||||||||
| Gary B. Sabin - Chairman & CEO | Spencer G. Plumb - President & COO | |||||||
| James Y. Nakagawa - CFO, Treasurer | Mark T. Burton - CIO & SVP, Acquisitions | |||||||
| S. Eric Ottesen - SVP, General Counsel | Matthew S. Romney - SVP, Capital Markets | |||||||
| Board of Directors | ||||||||
| Gary B. Sabin (Chairman) | Spencer G. Plumb | |||||||
| Mark T. Burton | Bruce G. Blakley | |||||||
| Burland B. East III | Robert E. Parsons, Jr. | |||||||
| Warren R. Staley | ||||||||
| Transfer Agent and Registrar | Corporate Counsel | |||||||
| Broadridge Corporate Issuer Solutions, Inc. | Latham & Watkins | |||||||
| PO Box 1342 | 12636 High Bluff Drive, Suite 400 | |||||||
| Brentwood, NY 11717 | San Diego, CA 92130 | |||||||
| Tel: 877-830-4936 | Tel: 858-523-5400 | |||||||
| Email: shareholder@broadridge.com | ||||||||
| Website: www.broadridge.com | ||||||||
Reported results and other information herein are preliminary and not final until the filing of Excel Trust's report on Form 10-Q or Form 10-K with the Securities and Exchange Commission and, therefore, remain subject to adjustment.
Forward-Looking Statements
This document contains forward-looking statements that are based on current expectations, forecasts and assumptions that involve risks and uncertainties that could cause actual outcomes and results to differ materially. These risks include, without limitation: adverse economic or real estate developments in the retail industry or the markets in which Excel Trust operates; defaults on or non-renewal of leases by tenants; increased interest rates and operating costs; decreased rental rates or increased vacancy rates; Excel Trust's failure to obtain necessary outside financing on favorable terms or at all; changes in the availability of additional acquisition opportunities; Excel Trust's inability to successfully complete real estate acquisitions or successfully operate acquired properties and Excel Trust's failure to qualify or maintain its status as a REIT. For a further list and description of such risks and uncertainties that could impact Excel Trust's future results, performance or transactions, see the reports filed by Excel Trust with the Securities and Exchange Commission, including its final prospectus relating to its initial public offering, quarterly reports on Form 10-Q and annual report on Form 10-K. Excel Trust disclaims any intention or obligation to update or revise any forward-looking statements, whether as a result of new information, future events or otherwise.
Page 3
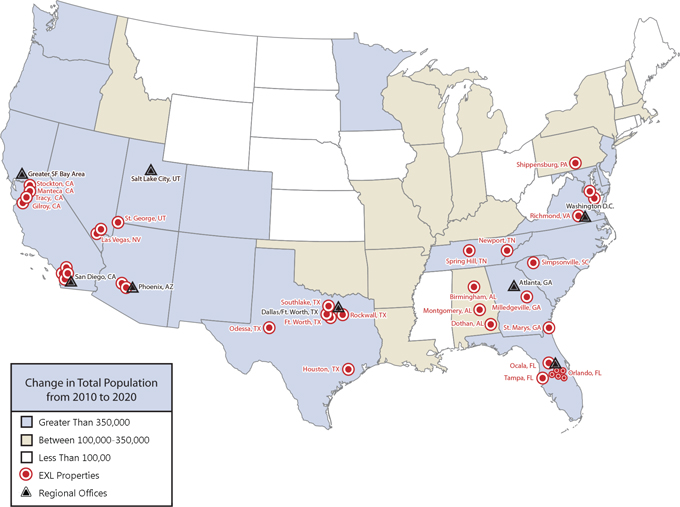
Property Locations
Page 4
Analyst Coverage
| Company |
Analyst |
Contact | ||
| Barclays Capital |
Ross Smotrich |
(212) 526-2306 | ||
|
Linda Tsai |
(212) 526-9937 | |||
| Bank of America Merrill Lynch |
Craig Schmidt |
(646) 855-3640 | ||
|
Katharine Hutchins |
(646) 855-1681 | |||
| Cantor Fitzgerald |
David Toti |
(212) 915-1219 | ||
|
Evan Smith |
(212) 915-1220 | |||
| Hilliard Lyons |
Carol Kemple |
(502) 588-1839 | ||
| KeyBanc |
Jordan Sadler |
(917) 368-2280 | ||
|
Todd Thomas |
(917) 368-2286 | |||
| Raymond James |
Paul D. Puryear |
(727) 567-2253 | ||
|
R.J. Milligan |
(727) 567-2660 | |||
| Sandler O'Neill + Partners |
Alexander Goldfarb |
(212) 466-7937 | ||
|
Andrew Schaffer |
(212) 466-8062 | |||
| Stifel, Nicolaus |
Nathan Isbee |
(443) 224-1346 | ||
|
Jennifer Hummert |
(443) 224-1288 | |||
| Wells Fargo |
Jeff Donnelly |
(617) 603-4262 | ||
|
Tamara Fique |
(443) 263-6568 | |||
Page 5
Summary Financial and Portfolio Data (Consolidated)
| For the Period Ended December 31, 2013 | ||||
|
(Dollars and share data in thousands, except per share data) |
||||
| Portfoilio Summary |
||||
| Total Gross Leasable Square Feet (GLA)-Operating Portfolio (1) |
6,175,069 | |||
| Percent Leased-Operating Portfolio |
93.7% | |||
| Percent Occupied-Operating Portfolio |
92.5% | |||
| Annualized Base Rent (2) |
$ | 88,484 | ||
| Total no. retail leases signed or renewed |
38 | |||
| Total sq. ft. retail leases signed or renewed |
202,513 | |||
| Financial Results |
||||
| Net income (loss) attributable to the common stockholders |
$ | (366) | ||
| Net income (loss) per diltued share |
$ | (0.01) | ||
| Funds from operations (FFO) |
$ | 11,255 | ||
| FFO per diluted share |
$ | 0.23 | ||
| Adjusted funds from operations (AFFO) |
$ | 11,446 | ||
| AFFO per diluted share |
$ | 0.23 | ||
| EBITDA |
$ | 19,105 | ||
| Assets |
||||
| Gross undepreciated real estate |
$ | 1,147,565 | ||
| Gross undepreciated assets |
$ | 1,280,300 | ||
| Total liabilities to gross undepreciated assets |
46.2% | |||
| Debt to gross undepreciated assets |
41.3% | |||
| Capitalization |
||||
| Common shares outstanding |
48,381 | |||
| OP units oustanding |
1,020 | |||
|
|
|
|||
| Total common shares and OP units |
49,401 | |||
| Closing price at quarter end |
$ | 11.39 | ||
| Equity capitalization |
$ | 562,677 | ||
| Series A convertible preferred shares (at liquidation preference of $25.00 per share) |
50,000 | |||
| Series B preferred shares (at liquidation preference of $25.00 per share) |
92,000 | |||
| Total debt (3) |
529,394 | |||
|
|
|
|||
| Total capitalization |
$ | 1,234,071 | ||
|
|
|
|||
| Debt/total capitalization |
42.9% | |||
| Debt/EBITDA |
6.9 | |||
| Common Stock Data |
||||
| Range of closing prices for the quarter |
$ | 11.39-12.41 | ||
| Weighted average common shares outstanding - diluted (EPS) |
47,672 | |||
| Weighted average common shares outstanding - diluted (FFO and AFFO) |
48,913 | |||
| Shares of common stock outstanding |
48,381 | |||
| (1) | Includes retail and office gross leasable area, but excludes gross leasable area from developments under construction and any planned development. |
| (2) | Annualized Base Rent excludes rental revenue from non-stabilized development properties. |
| (3) | Excludes debt discount or premium. |
Page 6
Balance Sheets
CONSOLIDATED BALANCE SHEETS
(Dollars in thousands)
| December 31, 2013 | September 30, 2013 | June 30, 2013 | March 31, 2013 | December 31, 2012 | ||||||||||||||||
| ASSETS: |
||||||||||||||||||||
| Property: |
||||||||||||||||||||
| Land |
$ | 380,366 | $ | 355,509 | $ | 326,633 | $ | 326,669 | $ | 320,289 | ||||||||||
| Buildings |
642,356 | 620,840 | 585,396 | 585,304 | 564,352 | |||||||||||||||
| Site improvements |
63,242 | 60,459 | 54,165 | 53,503 | 51,875 | |||||||||||||||
| Tenant improvements |
54,025 | 52,254 | 47,080 | 45,537 | 42,903 | |||||||||||||||
| Construction in progress |
7,576 | 3,297 | 3,370 | 3,135 | 1,709 | |||||||||||||||
| Less accumulated depreciation |
(61,479) | (54,409) | (49,294) | (43,125) | (36,765) | |||||||||||||||
|
|
|
|
|
|
|
|
|
|
|
|||||||||||
| Property, net |
1,086,086 | 1,037,950 | 967,350 | 971,023 | 944,363 | |||||||||||||||
| Cash and cash equivalents |
3,245 | 3,483 | 7,199 | 6,658 | 5,596 | |||||||||||||||
| Restricted cash |
8,147 | 41,139 | 7,193 | 6,344 | 5,657 | |||||||||||||||
| Tenant receivables, net |
5,117 | 3,500 | 2,798 | 3,486 | 5,376 | |||||||||||||||
| Lease intangibles, net |
78,345 | 80,273 | 75,059 | 80,961 | 85,646 | |||||||||||||||
| Mortgage loan receivable |
- | - | - | - | - | |||||||||||||||
| Deferred rent receivable |
9,226 | 8,462 | 7,911 | 6,851 | 5,983 | |||||||||||||||
| Other assets (1) |
20,135 | 18,944 | 18,616 | 18,497 | 17,618 | |||||||||||||||
| Real estate held for sale, net of accumulated amortization |
- | - | 3,226 | - | - | |||||||||||||||
| Investment in unconsolidated entities |
8,520 | 8,371 | 8,654 | 9,021 | 9,015 | |||||||||||||||
|
|
|
|
|
|
|
|
|
|
|
|||||||||||
| Total assets |
$ | 1,218,821 | $ | 1,202,122 | $ | 1,098,006 | $ | 1,102,841 | $ | 1,079,254 | ||||||||||
|
|
|
|
|
|
|
|
|
|
|
|||||||||||
| LIABILITIES AND EQUITY: |
||||||||||||||||||||
| Liabilities: |
||||||||||||||||||||
| Mortgages payable, net |
$ | 251,191 | $ | 308,365 | $ | 301,235 | $ | 332,732 | $ | 333,935 | ||||||||||
| Notes payable |
279,500 | 193,500 | 109,000 | 88,000 | 75,000 | |||||||||||||||
| Accounts payable and other liabilities |
21,700 | 25,893 | 22,016 | 22,061 | 25,319 | |||||||||||||||
| Lease intangibles, net |
28,114 | 27,884 | 24,444 | 25,320 | 26,455 | |||||||||||||||
| Dividends/distributions payable |
10,932 | 10,684 | 10,659 | 10,491 | 9,773 | |||||||||||||||
|
|
|
|
|
|
|
|
|
|
|
|||||||||||
| Total liabilities |
591,437 | 566,326 | 467,354 | 478,604 | 470,482 | |||||||||||||||
| Equity: |
||||||||||||||||||||
| Stockholders’ equity |
||||||||||||||||||||
| Preferred stock |
136,423 | 136,423 | 136,423 | 136,423 | 136,423 | |||||||||||||||
| Common stock |
482 | 480 | 479 | 468 | 448 | |||||||||||||||
| Additional paid-in capital |
460,431 | 469,034 | 477,369 | 474,321 | 459,151 | |||||||||||||||
| Cumulative deficit |
18,110 | 15,732 | 2,249 | (1,118) | (1,414) | |||||||||||||||
|
|
|
|
|
|
|
|
|
|
|
|||||||||||
| 615,446 | 621,669 | 616,520 | 610,094 | 594,608 | ||||||||||||||||
| Accumulated other comprehensive loss |
- | (107) | (267) | (415) | (572) | |||||||||||||||
|
|
|
|
|
|
|
|
|
|
|
|||||||||||
| Total stockholders’ equity |
615,446 | 621,562 | 616,253 | 609,679 | 594,036 | |||||||||||||||
| Non-controlling interests |
11,938 | 14,234 | 14,399 | 14,558 | 14,736 | |||||||||||||||
|
|
|
|
|
|
|
|
|
|
|
|||||||||||
| Total equity |
627,384 | 635,796 | 630,652 | 624,237 | 608,772 | |||||||||||||||
|
|
|
|
|
|
|
|
|
|
|
|||||||||||
| Total liabilities and equity |
$ | 1,218,821 | $ | 1,202,122 | $ | 1,098,006 | $ | 1,102,841 | $ | 1,079,254 | ||||||||||
|
|
|
|
|
|
|
|
|
|
|
|||||||||||
(1) Other assets is primarily comprised of deposits, notes receivable, prepaid expenses and furniture, fixtures, and equipment
Page 7
Statements of Operations
CONSOLIDATED STATEMENTS OF OPERATIONS
(In thousands, except per share data and dividends per share)
| Three Months Ended December 31, 2013 |
Three Months Ended December 31, 2012 |
Twelve Months Ended December 31, 2013 |
Twelve Months Ended December 31, 2012 |
|||||||||||||||||||
| Revenues: |
||||||||||||||||||||||
| Rental revenue |
$ | 24,609 | $ | 20,354 | $ | 92,294 | $ | 69,155 | ||||||||||||||
| Tenant recoveries |
4,777 | 3,538 | 18,875 | 13,835 | ||||||||||||||||||
| Other income |
419 | 459 | 1,373 | 1,431 | ||||||||||||||||||
|
|
|
|
|
|
|
|
|
|||||||||||||||
| Total revenues |
29,805 | 24,351 | 112,542 | 84,421 | ||||||||||||||||||
| Expenses: |
||||||||||||||||||||||
| Maintenance and repairs |
2,089 | 1,537 | 7,328 | 5,557 | ||||||||||||||||||
| Real estate taxes |
3,444 | 2,764 | 12,756 | 9,693 | ||||||||||||||||||
| Management fees |
440 | 313 | 1,772 | 851 | ||||||||||||||||||
| Other operating expenses |
1,487 | 1,293 | 6,194 | 4,028 | ||||||||||||||||||
| Changes in fair value of contingent consideration |
- | (160) | (1,568) | (281) | ||||||||||||||||||
| General and administrative |
3,335 | 3,641 | 13,871 | 13,796 | ||||||||||||||||||
| Depreciation and amortization |
11,534 | 10,311 | 46,146 | 34,800 | ||||||||||||||||||
|
|
|
|
|
|
|
|
|
|||||||||||||||
| Total expenses |
22,329 | 19,699 | 86,499 | 68,444 | ||||||||||||||||||
|
|
|
|
|
|
|
|
|
|||||||||||||||
| Net operating income |
7,476 | 4,652 | 26,043 | 15,977 | ||||||||||||||||||
| Interest expense |
(5,193) | (4,501) | (18,944) | (15,650) | ||||||||||||||||||
| Interest income |
58 | 48 | 204 | 173 | ||||||||||||||||||
| Income (loss) from equity in unconsolidated entities |
53 | - | 40 | - | ||||||||||||||||||
| Changes in fair value of financial instruments and gain on OP unit redemption |
- | 418 | 230 | 1,530 | ||||||||||||||||||
|
|
|
|
|
|
|
|
|
|||||||||||||||
| Net income (loss) from continuing operations |
2,394 | 617 | 7,573 | 2,030 | ||||||||||||||||||
| Income from discontinued operations before gain on sale of real estate assets |
(18) | 97 | 464 | 135 | ||||||||||||||||||
| Gain on sale of real estate assets |
81 | - | 12,055 | - | ||||||||||||||||||
|
|
|
|
|
|
|
|
|
|||||||||||||||
| Income from discontinued operations |
63 | 97 | 12,519 | 135 | ||||||||||||||||||
|
|
|
|
|
|
|
|
|
|||||||||||||||
| Net income (loss) |
2,457 | 714 | 20,092 | 2,165 | ||||||||||||||||||
| Net (income) loss attributable to non-controlling interests |
(79) | 4 | (568) | 18 | ||||||||||||||||||
|
|
|
|
|
|
|
|
|
|||||||||||||||
| Net income (loss) attributable to Excel Trust, Inc. |
2,378 | 718 | 19,524 | 2,183 | ||||||||||||||||||
| Preferred stock dividends |
(2,744) | (2,744) | (10,976) | (10,353) | ||||||||||||||||||
|
|
|
|
|
|
|
|
|
|||||||||||||||
| Net income (loss) attributable to the common stockholders |
$ | (366) | $ | (2,026) | $ | 8,548 | $ | (8,170) | ||||||||||||||
|
|
|
|
|
|
|
|
|
|||||||||||||||
| Basic and diluted net income (loss) per share |
$ | (0.01) | $ | - | $ | 0.17 | $ | - | ||||||||||||||
|
|
|
|
|
|
|
|
|
|||||||||||||||
| Weighted-average common shares outstanding - basic and diluted |
47,672 | - | 46,926 | - | ||||||||||||||||||
|
|
|
|
|
|
|
|
|
|||||||||||||||
The notes in the Form 10-Q or 10-K are an integral part of these condensed consolidated financial statements.
Page 8
Reconciliation of Net Income to EBITDA
(Earnings before Interest, Taxes, Depreciation & Amortization)
Excel Trust, Inc.’s EBITDA and a reconciliation to net income (loss) for the periods presented is as follows:
| Three Months Ended December 31, 2013 |
Three Months Ended September 30, 2013 |
Three Months Ended June 30, 2013 |
Three Months Ended March 31, 2013 |
Three Months Ended December 31, 2012 |
||||||||||||||||
| Net income attributable to Excel Trust, Inc. |
$ | 2,378 | $ | 13,483 | $ | 3,367 | $ | 296 | $ | 556 | ||||||||||
| Add: |
||||||||||||||||||||
| Interest expense |
5,193 | 4,728 | 4,517 | 4,798 | 4,727 | |||||||||||||||
| Depreciation and amortization(1) |
|
11,534
|
|
|
11,766
|
|
|
11,149
|
|
|
12,390
|
|
|
10,588
|
| |||||
|
|
|
|
|
|
|
|
|
|
|
|||||||||||
| EBITDA |
$ | 19,105 | $ | 29,977 | $ | 19,033 | $ | 17,484 | $ | 15,871 | ||||||||||
|
|
|
|
|
|
|
|
|
|
|
|||||||||||
(1) Total consolidated depreciation and amortization, a portion of which is included in discontinued operations on the statements of operations.
Page 9
Reconciliation of Net Income to FFO and AFFO
For the Periods Ended December 31, 2013
(In thousands, except per share data)
Excel Trust, Inc.'s FFO and AFFO available to common stockholders and operating partnership unitholders and a reconciliation to net income(loss) for the three and twelve months ended December 31, 2013 and 2012 is as follows:
| Three Months Ended December 31, 2013 |
Three Months Ended December 31, 2012 |
Twelve Months Ended December 31, 2013 |
Twelve Months Ended December 31, 2012 |
|||||||||||||||
| Net income (loss) attributable to the common stockholders |
$ | (366) | $ | (2,188) | $ | 8,548 | $ | (8,490) | ||||||||||
| Add: |
||||||||||||||||||
| Non-controlling interests in operating partnership |
(7) | (67) | 233 | (297) | ||||||||||||||
| Depreciation and amortization (1) |
11,534 | 10,588 | 46,839 | 36,021 | ||||||||||||||
| Deduct: |
||||||||||||||||||
| Depreciation and amortization related to joint venture (2) |
175 | 237 | 1,054 | 72 | ||||||||||||||
| Gain on sale of real estate assets |
(81) | - | (12,055) | - | ||||||||||||||
|
|
|
|
|
|
|
|
|
|||||||||||
| Funds from operations (3) |
$ | 11,255 | $ | 8,570 | $ | 44,619 | $ | 27,306 | ||||||||||
| Adjustments: |
||||||||||||||||||
| Transaction costs |
112 | 387 | 1,159 | 1,572 | ||||||||||||||
| Deferred financing costs |
448 | 457 | 1,748 | 1,867 | ||||||||||||||
| Stock-based and other non-cash compensation expense |
583 | 817 | 2,291 | 3,223 | ||||||||||||||
| Changes in fair value of contingent consideration |
- | (160) | (1,568) | (281) | ||||||||||||||
| Changes in fair value of financial instruments |
- | (418) | (230) | (1,530) | ||||||||||||||
| Straight-line effects of lease revenue |
(764) | (1,130) | (3,352) | (3,139) | ||||||||||||||
| Amortization of above- and below-market leases |
213 | 77 | 417 | 65 | ||||||||||||||
| Non-incremental capital expenditures |
(396) | (97) | (973) | (469) | ||||||||||||||
| Non-cash expenses (income) related to joint venture |
(5) | - | (280) | - | ||||||||||||||
|
|
|
|
|
|
|
|
|
|||||||||||
| Adjusted funds from operations (3) |
$ | 11,446 | $ | 8,503 | $ | 43,831 | $ | 28,614 | ||||||||||
|
|
|
|
|
|
|
|
|
|||||||||||
| Weighted average common shares outstanding |
47,672 | 40,830 | 46,926 | 34,681 | ||||||||||||||
| Add (4): |
||||||||||||||||||
| OP units |
1,100 | 1,272 | 1,198 | 1,231 | ||||||||||||||
| Restricted stock |
141 | 254 | 190 | 306 | ||||||||||||||
| Contingent consideration related to business combinations |
- | 20 | 73 | |||||||||||||||
| LTIP restricted stock |
- | - | - | - | ||||||||||||||
| Common stock issuable upon conversion of preferred stock |
- | - | - | - | ||||||||||||||
|
|
|
|
|
|
|
|
|
|||||||||||
| Weighted average common shares outstanding - diluted (FFO and AFFO) |
48,913 | 42,376 | 48,314 | 36,291 | ||||||||||||||
|
|
|
|
|
|
|
|
|
|||||||||||
| Funds from operations per share (diluted) (5) |
$ | 0.23 | $ | 0.20 | $ | 0.92 | $ | 0.74 | ||||||||||
| Adjusted funds from operations per share (diluted) (5) |
$ | 0.23 | $ | 0.20 | $ | 0.90 | $ | 0.78 | ||||||||||
|
|
|
|
|
|
|
|
||||||||||||
| Other Information (6): |
||||||||||||||||||
| Leasing commissions paid |
$ | 382 | $ | 333 | $ | 1,748 | $ | 755 | ||||||||||
| Tenant improvements paid |
$ | 1,065 | $ | 1,830 | $ | 7,548 | $ | 3,270 | ||||||||||
| (1) | Total consolidated depreciation and amortization, a portion of which is included in discontinued operations on the statements of operations (for the three and twelve months ended December 31, 2013 and 2012). |
| (2) | Includes a reduction for the portion of consolidated depreciation and amortization expense that would be allocable to non-controlling interests in the operating partnership and an increase for the the Company's portion of depreciation and amortization expense related to its investment in the unconsolidated La Costa Town Center and The Fountains at Bay Hill properties. |
| (3) | FFO and AFFO are described on the Definitions page. |
| (4) | The three months ended December 31, 2013 and 2012 include 1,241,000 and 1,546,000 OP units, shares of restricted stock and additional common shares contingently issuable related to business combinations, which are considered antidilutive for purposes of calculating diluted earnings per share. The three months ended December 31, 2013 and 2012 also exclude 3,367,200 and 3,333,400 shares of common stock, respectively, potentially issuable pursuant to the conversion feature of the preferred stock based on the "if converted" method. The year ended December 31, 2013 and 2012 include 1,388,000 and 1,610,000 OP units, shares of restricted stock and additional common shares contingently issuable related to business combinations, which are considered antidilutive for purposes of calculating diluted earnings per share. The year ended December 31, 2013 and 2012 also exclude 3,347,661 and 3,333,400, respectively, shares of common stock potentially issuable pursuant to the conversion feature of the preferred stock based on the "if converted" method. |
| (5) | The calculation of funds from operations per share (diluted) and adjusted funds from operations per share (diluted) for the three months ended December 31, 2013 and 2012 includes a reduction of $107,000 and $114,000, respectively, for dividends paid to shares of restricted common stock in excess of earnings. The calculation of funds from operations per share (diluted) and adjusted funds from operations per share (diluted) for the year ended December 31, 2013 and 2012 includes a reduction of $419,000 and $456,000, respectively, for dividends paid to shares of restricted common stock in excess of earnings. |
| (6) | Excludes development properties and shell construction costs for value-add opportunities at operating properties. |
Page 10
Debt Summary (Consolidated)
For the Period Ended December 31, 2013
(Dollars in thousands)
| % Total Debt | ||||||||||||||||
| Fixed Rate Debt(1) |
$ | 323,924 | 61% | |||||||||||||
| Variable Rate Debt(2) | 205,470 | 39% | ||||||||||||||
|
|
||||||||||||||||
| Total Debt(1) |
$ | 529,394 | 100% | |||||||||||||
| Debt(1)/Gross Undepreciated Assets |
41.3% | |||||||||||||||
| % Total Debt | ||||||||||||||||
| Secured Debt(1)(2) |
$ | 249,894 | 47% | |||||||||||||
| Unsecured Debt |
279,500 | 53% | ||||||||||||||
|
|
||||||||||||||||
| Total Debt |
$ | 529,394 | 100% | |||||||||||||
| Secured Debt to Gross Undepreciated Assets |
|
19.5% | ||||||||||||||
| Maturities by Year-Secured(3) | Amount | % Total Debt | Maturities by Year-Unsecured(3) | Amount | % Total Debt | |||||||||||
|
|
| |||||||||||||||
| 2014(5) |
$ | 91,130 | 17.2% | 2014 |
$ | - | 0.0% | |||||||||
| 2015 |
47,918 | 9.1% | 2015 |
- | 0.0% | |||||||||||
| 2016 |
2,362 | 0.4% | 2016 |
- | 0.0% | |||||||||||
| 2017 |
41,431 | 7.8% | 2017 |
- | 0.0% | |||||||||||
| 2018 |
2,196 | 0.4% | 2018(4) |
179,500 | 33.9% | |||||||||||
| 2019 |
5,615 | 1.1% | 2019 |
- | 0.0% | |||||||||||
| 2020 |
37,419 | 7.1% | 2020 |
75,000 | 14.2% | |||||||||||
| 2021 |
628 | 0.1% | 2021 |
- | 0.0% | |||||||||||
| 2022 |
675 | 0.1% | 2022 |
- | 0.0% | |||||||||||
| 2023 |
726 | 0.1% | 2023 |
25,000 | 4.7% | |||||||||||
| Beyond 2023 |
19,794 | 3.7% | Beyond 2023 |
- | 0.0% | |||||||||||
|
|
| |||||||||||||||
| Total |
$ | 249,894 | 47.2% | Total |
$ | 279,500 | 52.8% | |||||||||
| Mortgage Notes | Amount | Contractual Interest Rate |
Maturity | |||||||||||||
|
|
||||||||||||||||
| Edwards Theatres, San Marcos |
$ | 11,520 | 6.7% | Feb-14 | ||||||||||||
| Red Rock Commons(5) |
13,970 | 1.7% | Mar-14 | |||||||||||||
| Excel Centre |
12,018 | 6.1% | May-14 | |||||||||||||
| Merchant Central |
4,370 | 5.9% | Jul-14 | |||||||||||||
| Gilroy Crossing |
45,836 | 5.0% | Oct-14 | |||||||||||||
| The Promenade |
47,957 | 4.8% | Oct-15 | |||||||||||||
| 5000 South Hulen |
13,421 | 5.6% | Apr-17 | |||||||||||||
| Lake Pleasant Pavilion |
27,855 | 6.1% | Oct-17 | |||||||||||||
| Rite Aid, Vestavia |
1,015 | 7.3% | Oct-18 | |||||||||||||
| Living Spaces-Promenade |
7,075 | 7.9% | Nov-19 | |||||||||||||
| West Broad Village(6) |
39,700 | 3.3% | May-20 | |||||||||||||
| Lowe's, Shippensburg |
13,157 | 7.2% | Oct-31 | |||||||||||||
| Northside Mall |
12,000 | 0.1% | Nov-35 | |||||||||||||
|
|
||||||||||||||||
| Total |
249,894 | 4.8% | ||||||||||||||
| Debt (discount) or premium |
1,297 | |||||||||||||||
|
|
|
|||||||||||||||
| Mortgage notes, net |
$ | 251,191 | ||||||||||||||
|
|
||||||||||||||||
(1) Amount excludes debt discount or premium.
(2) Includes the Northside Plaza redevelopment revenue bonds to be used for the redevelopment of this property, a construction loan at our Red Rock Commons property, the mortgage note at our Park West Place Property and our unsecured revolving credit facility. The revenue bonds are priced off the SIFMA index and reset weekly (the rate as of December 31, 2013 was 0.10%). The revenue bonds are secured by a $12.1 million letter of credit issued by the Company from the Company’s credit facility. The interest rate on the construction loan bears interest at LIBOR plus 1.45% to 2.05% (rate as of December 31, 2013 was 1.69%).
(3) Includes monthly payments on outstanding principal as well as principal due at maturity.
(4) Reflects the amount outstanding on the unsecured revolving credit facility at quarter end. The credit facility was amended on October 8, 2013, increasing the borrowing capacity to $300.0 million, reducing the interest rate and extending the maturity date to April 6, 2018.
(5) The Red Rock construction loan matures in March 2014, but may be extended for an additional year at the Company's election, through March 2015, after satisfying certain conditions and payment of an extension fee.
(6) The West Broad Village mortgage was refinanced in April 2013 at a fixed rate of 3.3%, which also extended the maturity date through May 2020 (approximately $10.3 million of the outstanding balance at March 31, 2013 was prepaid in connection with the refinancing).
Page 11
Common and Preferred Stock Data
For the Period Ended December 31, 2013
(In thousands, except per share data)
| Three Months Ended December 31, 2013 |
Three Months Ended September 30, 2013 |
Three Months Ended June 30, 2013 |
Three Months Ended March 31, 2013 |
|||||||||||||
| Earning per share - share data |
||||||||||||||||
| Weighted average common shares outstanding - diluted |
47,672 | 47,669 | 47,150 | 45,352 | ||||||||||||
|
|
|
|
|
|
|
|
|
|||||||||
| Diluted common shares - EPS |
47,672 | 47,669 | 47,150 | 45,352 | ||||||||||||
|
|
|
|
|
|
|
|
|
|||||||||
| Funds from operations - share data |
||||||||||||||||
| Weighted average common shares outstanding |
47,672 | 47,497 | 47,150 | 45,352 | ||||||||||||
| Weighted average OP units outstanding |
1,100 | 1,225 | 1,225 | 1,241 | ||||||||||||
| Weighted average restricted stock outstanding |
141 | 172 | 213 | 234 | ||||||||||||
| Dilutive effect of contingent consideration related to business combinations |
- | - | - | - | ||||||||||||
| Dilutive effect of LTIP restricted stock outstanding |
- | - | - | 190 | ||||||||||||
|
|
|
|
|
|
|
|
|
|||||||||
| Total potential dilutive common shares |
48,913 | 48,894 | 48,588 | 47,017 | ||||||||||||
|
|
|
|
|
|
|
|
|
|||||||||
| Total common shares (including restricted stock) outstanding |
48,381 | 48,173 | 48,026 | 47,033 | ||||||||||||
| Total OP units outstanding |
1,020 | 1,225 | 1,225 | 1,225 | ||||||||||||
| Total Series A convertible preferred shares oustanding |
2,000 | 2,000 | 2,000 | 2,000 | ||||||||||||
| Total Series B preferred shares outstanding |
3,680 | 3,680 | 3,680 | 3,680 | ||||||||||||
| Common share data |
||||||||||||||||
| High closing share price |
$ | 12.41 | $ | 13.92 | $ | 15.23 | $ | 13.82 | ||||||||
| Low closing share price |
$ | 11.39 | $ | 11.51 | $ | 12.12 | $ | 12.34 | ||||||||
| Average closing share price |
$ | 11.82 | $ | 12.61 | $ | 14.08 | $ | 12.89 | ||||||||
| Closing price at end of period |
$ | 11.39 | $ | 12.00 | $ | 12.81 | $ | 13.65 | ||||||||
| Dividends per share - annualized |
$ | 0.70 | $ | 0.68 | $ | 0.68 | $ | 0.68 | ||||||||
| Dividend yield (based on closing share price at end of period) |
6.1 | % | 5.7 | % | 5.3 | % | 5.0 | % | ||||||||
| Dividends per share |
||||||||||||||||
| Common stock (EXL) |
$ | 0.1750 | $ | 0.1700 | $ | 0.1700 | $ | 0.1700 | ||||||||
| Series A Convertible Perpetual Preferred stock |
$ | 0.4375 | $ | 0.4375 | $ | 0.4375 | $ | 0.4375 | ||||||||
| Series B Preferred stock |
$ | 0.5078 | $ | 0.5078 | $ | 0.5078 | $ | 0.5078 | ||||||||
Page 12
Acquisitions & Developments
For the Period Ended December 31, 2013
(Dollars in thousands, except price per square foot)
| Acquisition Property Name | City | State | Year Built (1) |
Total GLA (2) |
Acquisition Date |
Price Sq. Ft. |
Initial Cost Basis (3) |
Major Tenants | ||||||||||||||||||||
| Tracy Pavilion |
Tracy | CA | 2006 | 162,463 | 1/24/2013 | $ | 189 | $ | 30,738 | Marshalls, Ross, PetSmart, Staples, Ulta | ||||||||||||||||||
| Stadium Center |
Manteca | CA | 2006 | 160,726 | 7/1/2013 | $ | 256 | $ | 41,150 | |
Ross, Jo-Ann, Office Max, Old Navy, Costco (non-owned) and Kohl’s (non-owned) | |||||||||||||||||
| League City Town Center |
League City (Houston) | TX | 2008 | 194,736 | 8/1/2013 | $ | 203 | $ | 39,500 | |
Ross, TJ Maxx, Michael’s, PetSmart, Staples, SuperTarget (non-owned) and Home Depot (non-owned) | |||||||||||||||||
| The Promenade - Living Spaces |
Scottsdale | CA | 1999 | 133,120 | 8/27/2013 | $ | 120 | $ | 16,000 | Living Spaces | ||||||||||||||||||
| LA Fitness |
San Diego | CA | 2006 | 38,000 | 10/4/2013 | $ | 376 | $ | 14,300 | LA Fitness | ||||||||||||||||||
| Cedar Square |
Duncanville (Dallas) | TX | 1978 | 75,550 | 11/4/2013 | $ | 57 | $ | 4,300 | Beall’s, Walgreens | ||||||||||||||||||
| Southlake Park Village |
Southlake (Dallas) | TX | TBD | 186,043 | 11/18/2013 | $ | 87 | $ | 16,254 | Fresh Market, REI | ||||||||||||||||||
| Centennial Crossroads |
Las Vegas | NV | 2003 | 105,415 | 11/22/2013 | $ | 156 | $ | 16,400 | Vons, Chase Bank | ||||||||||||||||||
| Total |
1,056,053 | $ | 169 | $ | 178,642 | |||||||||||||||||||||||
| Value-add Opportunities | City | State | Estimated Opening Date(4) |
GLA to be Constructed |
Land(5) | Improvements | Total Carrying
Amount(6) |
Remaining Estimated Cost to Complete |
% GLA Leased / Committed(7) |
Major Tenants | ||||||||||||||||||
| Red Rock Commons(8) |
St. George | UT | Q2 2014 | 15,606 | $ | - | $ | 1,464 | $ | 1,464 | $ | 1,949 | 66% | Café Rio, Charming Charlies | ||||||||||||||
| West Broad Village - Expansion A |
Richmond | VA | Q4 2014 | 10,000 | $ | - | $ | - | $ | - | $ | 2,347 | 100% | Children of America | ||||||||||||||
| Park West Place - Expansion A(9) |
Stockon | CA | Completed | 5,500 | $ | - | $ | 724 | $ | 724 | $ | - | 100% | Sally Beauty | ||||||||||||||
| Total |
31,106 | $ | - | $ | 2,188 | $ | 2,188 | $ | 4,296 | |||||||||||||||||||
| Developments Under Construction | City | State | Estimated Opening Date(4) |
GLA to be Constructed |
Land(5) | Improvements | Total Carrying Amount(6) |
Remaining Estimated Cost to Complete |
% GLA Leased / Committed(7) |
Major Tenants | ||||||||||||||||||
| Chimney Rock - Phase II |
Odessa | TX | TBD | 149,517 | $ | 2,030 | $ | 2,685 | $ | 4,715 | $ | 10,210 | 47% | Jo-Ann, Aeropostale | ||||||||||||||
| Southlake Park Village |
Southlake (Dallas) | TX | TBD | 186,043 | $ | 16,064 | $ | 2,638 | $ | 18,701 | $ | 26,275 | 50% | Fresh Market, REI | ||||||||||||||
| Total |
335,560 | $ | 18,094 | $ | 5,323 | $ | 23,416 | $ | 36,485 | |||||||||||||||||||
| Future Developments / Land | City | State | Estimated GLA to be Constructed / Land |
Estimated Start Date |
Estimated Project Cost |
Projected Use | ||||||||||||||||||||||
| Plaza at Rockwall - Phase III |
Rockwall | TX | 22,700 | Q4 2013 | $ | 2,248 | Additional shop space | |||||||||||||||||||||
| Park West Place - Expansion B |
Stockton | CA | 9,700 | TBD | NA | Additional shop space | ||||||||||||||||||||||
| Shops at Foxwood |
Ocala | FL | 1.0 acres | TBD | NA | Additional land to be sold or developed | ||||||||||||||||||||||
| Chimney Rock - Phase III |
Odessa | TX | 4.2 acres | TBD | NA | Additional land to be sold or developed | ||||||||||||||||||||||
| West Broad Village - Expansion B |
Richmond | VA | 1.2 acres | TBD | NA | Additional land to be sold or developed | ||||||||||||||||||||||
| Stadium Center - Expansion |
Manteca | CA | 2.0 acres | TBD | NA | Additional land to be sold or developed | ||||||||||||||||||||||
| League City Town Center |
League City | TX | 0.9 acres | TBD | NA | Additional land to be sold or developed | ||||||||||||||||||||||
(1) Year built represents the year in which construction was completed.
(2) Total GLA represents total gross leasable area owned by the Company at the property (includes GLA of buildings on ground lease).
(3) The initial cost basis is subject to change based on the final property valuation and may differ from amounts reported in prior periods.
(4) Opening Date represents the date at which the Company estimates that the majority of the gross leasable area will be open for business. A property is reclassified from development to the operating portfolio at the earlier of (i) 85.0% occupancy or (ii) one year from completion and delivery of the space.
(5) The Company has not allocated a separate value to land parcels at certain properties for developments that represent only a small portion of the overall property.
(6) Total Carrying Amount includes land value (where applicable), whereas Construction In Progress (CIP) values for development properties as listed in the Company’s SEC filings excludes land values.
(7) Includes square footage of buildings leased to tenants (including square footage of buildings on outparcels owned by the Company and ground leased to tenants) as well as signed non-binding letters of intent as of February 2014.
(8) Does not include 5,040 square feet of GLA at Red Rock Commons that was completed and turned over to the tenants in December 2013.
(9) Construction of the 5,500 square feet of GLA at Park West Place was completed and turned over to the tenants in January 2014.
Page 13
Operating Portfolio Summary (Consolidated)
For the Period Ended December 31, 2013
(Dollars in thousands, except price per square foot)
| Property Name | City | State | Year Built(1) |
Total GLA(2) |
Acquisition Date |
Price Sq. Ft. |
Initial Cost Basis |
Percent Leased 12/31/2013 |
Percent Leased 9/30/2013 |
Major Tenants | ||||||||||
| Operating Portfolio | ||||||||||||||||||||
| West Broad Village(3) |
Richmond | VA | 2009 | 396,923 | 10/19/2012 | $257 | $170,200 | 78.8% | 78.8% | Whole Foods, REI, HomeGoods, Dave & Buster’s, South University | ||||||||||
| The Promenade(4) | Scottsdale | AZ | 1999 | 566,663 | 7/11/2011 | $222 | $126,000 | 95.3% | 94.0% | Nordstrom Rack, Trader Joe’s, OfficeMax, PetSmart, Old Navy, Michael’s, Stein Mart, Cost Plus, Living Spaces, Lowe’s (non-owned) | ||||||||||
| Park West Place | Stockton | CA | 2005 | 603,564 | 12/14/2010 | $153 | $92,500 | 99.1% | 99.6% | Lowe’s, Kohl’s, Sports Authority, Jo-Ann, Ross, PetSmart, Office Depot, Target (non-owned) | ||||||||||
| Gilroy Crossing | Gilroy | CA | 2004 | 325,431 | 4/5/2011 | $210 | $68,400 | 99.0% | 98.7% | Kohl’s, Ross, Michaels, Bed Bath & Beyond, Target (non-owned) | ||||||||||
| Promenade Corporate Center |
Scottsdale | AZ | 2004 | 256,182 | 1/23/2012 | $207 | $53,000 | 84.0% | 78.9% | Fitch, Healthcare Trust of America, Regus, Meridian Bank | ||||||||||
| Plaza at Rockwall | Rockwall | TX | 2007/2012 | 428,461 | 6/29/2010 | $119 | $50,800 | 100.0% | 98.4% | Best Buy, Dick’s, Staples, Ulta, JC Penney, Belk, HomeGoods, Jo-Ann | ||||||||||
| Brandywine Crossing |
Brandywine | MD | 2009 | 198,384 | 10/1/2010 | $224 | $44,500 | 96.9% | 96.1% | Safeway, Marshalls, Jo-Ann, Target (non-owned), Costco (non-owned) | ||||||||||
| Lake Pleasant Pavilion |
Phoenix (Peoria) |
AZ | 2007 | 178,376 | 5/16/2012 | $234 | $41,800 | 90.3% | 88.4% | Target (non-owned), Marshalls, Bed Bath & Beyond, BevMo!, Tilly’s, Kirkland’s, The Dress Barn | ||||||||||
| Stadium Center | Manteca | CA | 2006 | 160,726 | 7/1/2013 | $256 | $41,150 | 96.3% | 96.3% | Ross, Jo-Ann, Office Max, Old Navy, Costco (non-owned) and Kohl’s (non-owned) | ||||||||||
| Dellagio | Orlando | FL | 2009 | 123,198 | 10/19/2012 | $325 | $40,100 | 90.3% | 93.3% | Flemings, Fifth Third Bank | ||||||||||
| League City Town Center |
League City (Houston) |
TX | 2008 | 194,736 | 8/1/2013 | $203 | $39,500 | 100.0% | 100.0% | Ross, TJ Maxx, Michael’s, PetSmart, Staples, SuperTarget (non-owned) and Home Depot (non-owned) | ||||||||||
| Vestavia Hills City Center |
Birmingham (Vestavia |
AL | 2002 | 391,899 | 8/30/2010 | $89 | $34,900 | 83.6% | 82.2% | Publix, Dollar Tree, Stein Mart, Rave Motion Pictures | ||||||||||
| The Crossings of Spring Hill |
Nashville (Spring Hill) |
TN | 2008 | 219,842 | 12/19/2011 | $141 | $31,000 | 98.0% | 98.0% | SuperTarget (non-owned), Kohl’s (non-owned), PetSmart, Ross, Bed Bath & Beyond | ||||||||||
| Tracy Pavilion | Tracy | CA | 2006 | 162,463 | 1/24/2013 | $189 | $30,738 | 91.4% | 91.4% | Marshalls, Ross, PetSmart, Staples, Ulta | ||||||||||
| Red Rock Commons |
St. George | UT | 2012 | 118,593 | 4//23/2010 | $242 | $28,700 | 100.0% | 100.0% | Dick’s, PetSmart, Old Navy, Gap Outlet, Ulta | ||||||||||
| Edwards Theatres | San Diego (San Marcos) |
CA | 1999 | 100,551 | 3/11/2011 | $261 | $26,200 | 100.0% | 100.0% | Edwards Theatres (a subsidiary of Regal Cinemas) | ||||||||||
| Rosewick Crossing | La Plata | MD | 2008 | 115,972 | 10/1/2010 | $215 | $24,900 | 80.5% | 85.2% | Giant Food, Lowe’s (non-owned) | ||||||||||
| EastChase Market Center |
Montgomery | AL | 2008 | 181,431 | 2/17/2012 | $136 | $24,700 | 98.9% | 98.9% | Dick’s, Jo-Ann, Bed Bath & Beyond, Michaels, Old Navy, Costco (non-owned) | ||||||||||
| Chimney Rock | Odessa | TX | 2012 | 151,339 | 8/30/2012 | $157 | $23,800 | 97.8% | 97.8% | Academy Sports, Best Buy, Marshalls, Kirkland’s, Ulta | ||||||||||
| Excel Centre | San Diego | CA | 1999 | 82,157 | 4//23/2010 | $288 | $23,700 | 90.4% | 86.8% | Kaiser Permanente, Excel Trust, UBS | ||||||||||
| 5000 South Hulen | Fort Worth | TX | 2005 | 86,833 | 5/12/2010 | $252 | $21,900 | 94.8% | 94.9% | Barnes & Noble, Old Navy | ||||||||||
| Lowe’s | Shippensburg | PA | 2008 | 171,069 | 6/22/2010 | $103 | $17,600 | 100.0% | 100.0% | Lowe’s | ||||||||||
| Anthem Highlands | Las Vegas (Henderson) |
NV | 2006 | 118,763 | 12/1/2011 | $147 | $17,500 | 89.2% | 89.2% | Albertsons, CVS, Wells Fargo, Bank of America | ||||||||||
| Centennial Crossroads |
Las Vegas | NV | 2003 | 105,415 | 11/22/2013 | $156 | $16,400 | 88.8% | n/a | Vons, Chase Bank | ||||||||||
| LA Fitness | San Diego | CA | 2006 | 38,000 | 10/4/2013 | $376 | $14,300 | 100.0% | n/a | LA Fitness | ||||||||||
| Pavilion Crossing | Brandon | FL | 2012 | 68,400 | 10/1/2012 | $192 | $13,100 | 96.2% | 96.2% | Publix | ||||||||||
| Shops at Foxwood | Ocala | FL | 2010 | 78,660 | 10/19/2010 | $160 | $12,600 | 90.8% | 90.8% | Publix, McDonald’s (non-owned) | ||||||||||
| Northside Plaza | Dothan | AL | 2010 | 171,670 | 11/15/2010 | $70 | $12,400 | 94.8% | 94.8% | Publix, Hobby Lobby, Books A Million | ||||||||||
| Meadow Ridge Plaza |
Orlando | FL | 2007 | 45,199 | 10/19/2012 | $215 | $9,700 | 86.1% | 88.9% | Fifth Third Bank | ||||||||||
| Shoppes of Belmere |
Orlando | FL | 2008 | 26,502 | 10/19/2012 | $366 | $9,700 | 100.0% | 100.0% | CVS | ||||||||||
| Lake Burden Shoppes |
Orlando | FL | 2008 | 20,598 | 10/19/2012 | $413 | $8,500 | 100.0% | 100.0% | Walgreens | ||||||||||
| Five Forks Place | Simpsonville | SC | 2002 | 61,191 | 4//23/2010 | $127 | $7,800 | 98.0% | 98.0% | Publix | ||||||||||
| Mariner’s Point | St. Marys | GA | 2001 | 45,215 | 7/20/2010 | $146 | $6,600 | 91.2% | 91.2% | Shoe Show, Super Wal-Mart (non-owned) | ||||||||||
| Newport Towne Center |
Newport | TN | 2006 | 60,100 | 4//23/2010 | $108 | $6,500 | 94.5% | 98.0% | Stage Stores (DBA Goody’s), Dollar Tree, Super Wal-Mart (non-owned) | ||||||||||
| Merchant Central | Milledgeville | GA | 2004 | 45,013 | 6/30/2010 | $136 | $6,100 | 89.2% | 89.2% | Dollar Tree, Super Wal-Mart (non-owned) | ||||||||||
| Cedar Square | Duncanville (Dallas) |
TX | 1978 | 75,550 | 11/4/2013 | $57 | $4,300 | 94.7% | n/a | Beall’s, Walgreens | ||||||||||
| Total Operating Portfolio |
Total | 6,175,069 | $184 | $1,201,588 | 93.7% | 93.1% |
(1) Year built represents the year in which construction was completed.
(2) Total GLA represents total gross leasable area owned by the Company at the property (includes GLA of buildings on ground lease).
(3) The West Broad Village property is a mixed use shopping center that includes retail, office and 339 apartment units on the upper levels of the shopping center. However, the property’s total GLA listed herein excludes square footage of the apartments. As such, the approximate initial cost basis of the apartments of $68 million has been deducted from the price per square foot calculation.
(4) Includes an additional land parcel acquired in August 2013 with an initial cost basis of approximately $16.0 million.
Page 14
Summary of Retail Leasing Activity (Consolidated)
For the Period Ended December 31, 2013
| Number of Leases(1) |
GLA | Weighted Average- New Lease Rate(2) |
Weighted Average- Prior Lease Rate(2) |
Percentage Increase or (Decrease) |
Tenant Improvement Allowance per Sq. Ft. |
Weighted-Average Lease Term (Yrs.) |
||||||||||||||||||||||
|
|
| |||||||||||||||||||||||||||
| Comparable Leases |
||||||||||||||||||||||||||||
| New leases(3) |
4 | 10,753 | $ | 24.09 | $ | 19.05 | 26.5% | $ | 1.99 | 8.6 | ||||||||||||||||||
| Renewals/Options |
27 | 174,547 | 16.82 | 16.26 | 3.4% | 0.06 | 4.6 | |||||||||||||||||||||
|
|
| |||||||||||||||||||||||||||
| Total: Comparable Leases |
31 | 185,300 | $ | 17.24 | $ | 16.42 | 5.0% | $ | 0.17 | 4.9 | ||||||||||||||||||
| Non-Comparable Leases |
||||||||||||||||||||||||||||
| Operating portfolio |
7 | 17,213 | $ | 20.25 | n/a | n/a | $ | 14.65 | 4.7 | |||||||||||||||||||
| Development |
- | - | - | n/a | n/a | - | - | |||||||||||||||||||||
|
|
| |||||||||||||||||||||||||||
| Total: Non-Comparable Leases |
7 | 17,213 | $ | 20.25 | n/a | n/a | $ | 14.65 | 4.7 | |||||||||||||||||||
| Total Leasing Activity |
38 | 202,513 | $ | 17.49 | n/a | n/a | $ | 1.40 | 4.8 | |||||||||||||||||||
|
|
|
|
|
|||||||||||||||||||||||||
(1) Excludes month-to-month leases and leases involving office GLA.
(2) Lease rate represents final cash rent from the previous lease and the intial cash rent from the new lease and excludes the impact of changes in lease rates during the term.
(3) Represents leases signed on spaces for which there was a tenant within the last 12 months. Excludes leases signed at development properties.
Page 15
Same Property Analysis
For the Periods Ended December 31, 2013
(In thousands, except per share amounts)
| Three Months Ended
December 31, 2013 |
Three Months Ended
December 31, 2012 |
Percentage
Change |
Twelve Months Ended
December 31, 2013 |
Twelve Months Ended
December 31, 2012 |
Percentage
Change |
|||||||||||||||||||
| Same Property Portfolio (1) |
||||||||||||||||||||||||
| Number of properties |
24 | 24 | 19 | 19 | ||||||||||||||||||||
| Rentable square feet |
4,624,239 | 4,624,239 | 3,551,192 | 3,551,192 | ||||||||||||||||||||
| Percent leased |
94.6% | 93.9% | 0.7% | 95.0% | 94.6% | 0.4% | ||||||||||||||||||
| Percentage of total operating portfolio |
74.9% | 84.6% | 57.5% | 65.0% | ||||||||||||||||||||
| Total revenues |
$ | 20,773 | $ | 20,120 | 3.2% | $ | 67,806 | $ | 66,631 | 1.8% | ||||||||||||||
| Total expenses |
5,487 | 5,333 | 2.9% | 16,947 | 16,376 | 3.5% | ||||||||||||||||||
|
|
|
|
|
|
|
|
|
|||||||||||||||||
| Same property - net operating income (GAAP basis) |
$ | 15,286 | $ | 14,787 | 3.4% | $ | 50,859 | $ | 50,255 | 1.2% | ||||||||||||||
|
|
|
|
|
|
|
|
|
|||||||||||||||||
| Less: straight line rents, fair-value lease revenue, lease incentive revenue |
(285) | (660) | -56.8% | (778) | (1,753) | -55.6% | ||||||||||||||||||
| Same property - net operating income (cash basis) |
$ | 15,001 | $ | 14,127 | 6.2% | $ | 50,081 | $ | 48,502 | 3.3% | ||||||||||||||
|
|
|
|
|
|
|
|
|
|||||||||||||||||
| (1) | Includes all properties purchased prior to October 1, 2012, including the Plaza at Rockwall property (a portion of which was under development through Q2 2012) for the three months ended December 31, 2013. Includes all properties purchased prior to January 1, 2012, for the year ended December 31, 2013. Excludes adjustments relating to prior year reimbursements. Also excludes our La Costa Town Center property, which was contributed to a joint venture in September 2012. |
Page 16
Major Tenants By GLA (Consolidated)
For the Period Ended December 31, 2013
(Dollars in thousands, except rent per square foot)
| Total GLA-Operating Portfolio(1) | 6,175,069 | |||||||
|
|
||||||||
| Tenants | # Stores | Square Feet | % of Total GLA | |||||
|
| ||||||||
| 1 | Lowe’s | 2 | 325,863 | 5.3% | ||||
| 2 | Publix | 5 | 245,351 | 4.0% | ||||
| 3 | Ross Dress For Less | 7 | 201,168 | 3.3% | ||||
| 4 | TJX Companies | 7 | 194,207 | 3.1% | ||||
| 5 | Kohl’s | 2 | 176,656 | 2.9% | ||||
| 6 | Dick’s Sporting Goods | 3 | 140,018 | 2.3% | ||||
| 7 | Jo-Ann | 6 | 139,922 | 2.3% | ||||
| 8 | Living Spaces(2) | 1 | 133,120 | 2.2% | ||||
| 9 | Bed Bath & Beyond | 5 | 131,864 | 2.1% | ||||
| 10 | PetSmart | 7 | 131,691 | 2.1% | ||||
|
| ||||||||
| Total Top 10 GLA | 45 | 1,819,860 | 29.5% | |||||
Major Tenants By ABR (Consolidated)
| Annualized Base Rent-Operating Portfolio (3) | $ 88,484 | |||||||||||||||
|
|
||||||||||||||||
| Tenants | # Stores | Square Feet | Rent Per Sq. Ft. | ABR | % ABR | |||||||||||
|
| ||||||||||||||||
| 1 | Publix | 5 | 245,351 | $ | 11.15 | $ | 2,734 | 3.1% | ||||||||
| 2 | Ross Dress For Less | 7 | 201,168 | $ | 11.35 | $ | 2,283 | 2.6% | ||||||||
| 3 | Lowe’s | 2 | 325,863 | $ | 6.74 | $ | 2,195 | 2.5% | ||||||||
| 4 | Edwards Theatres (Regal Cinemas) | 1 | 100,551 | $ | 21.72 | $ | 2,184 | 2.5% | ||||||||
| 5 | TJX Companies | 7 | 194,207 | $ | 10.28 | $ | 1,997 | 2.3% | ||||||||
| 6 | PetSmart | 7 | 131,691 | $ | 14.66 | $ | 1,931 | 2.2% | ||||||||
| 7 | Dick’s Sporting Goods | 3 | 140,018 | $ | 12.69 | $ | 1,776 | 2.0% | ||||||||
| 8 | Kaiser Permanente | 1 | 38,432 | $ | 42.99 | $ | 1,652 | 1.9% | ||||||||
| 9 | Jo-Ann | 6 | 139,922 | $ | 11.37 | $ | 1,591 | 1.8% | ||||||||
| 10 | Ulta | 7 | 72,236 | $ | 20.11 | $ | 1,453 | 1.6% | ||||||||
| Total Top 10 Annualized Rent | 46 | 1,589,439 | $ | 12.45 | $ | 19,796 | 22.4% | |||||||||
(1) Includes gross leasable area associated with buildings on ground lease.
(2) Living Spaces is sub-leasing the building from Sears.
(3) Annualized Base Rent does not include rental revenue from multi-family properties and is further described on the Definitions page.
Page 17
Expiration Schedule (Consolidated)
For the Period Ended December 31, 2013
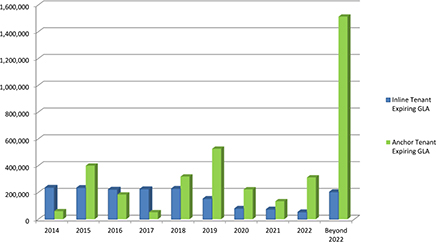
| Occupied Retail GLA |
% of Occupied Retail GLA |
Total Occupied Retail ABR |
% of Total Occupied Retail ABR | |||||||||
| Occupied Retail Anchor GLA(3) |
3,722,149 | 68.5% | $ | 43,035 | 52.3% | |||||||
| Occupied Retail Inline GLA(3) |
1,713,489 | 31.5% | 39,185 | 47.7% | ||||||||
|
|
| |||||||||||
| Total Occupied Retail GLA |
5,435,638 | 100.0% | $ | 82,220 | 100.0% | |||||||
| Year | Anchor GLA Expiring |
% of Total Occupied Retail GLA |
Anchor Rent Per Sq. Ft. |
Inline GLA Expiring |
% of Total Occupied Retail GLA |
Inline Rent Per Sq. Ft. |
Total Occupied Retail GLA Expiring |
% of Total Occupied Retail GLA |
Total Occupied Retail ABR Expiring |
% of Total Retail ABR |
Average Rent Per Sq. Ft. |
|||||||||||||||||||||||
|
|
|
|
||||||||||||||||||||||||||||||||
| 2014 |
(4) |
59,903 | 1.1% | $ | 15.89 | 236,496 | 4.4% | $ | 20.30 | 296,399 | 5.5% | $ | 5,754 | 7.0% | $ | 19.41 | ||||||||||||||||||
| 2015 |
399,986 | 7.4% | $ | 13.56 | 235,073 | 4.3% | $ | 22.69 | 635,059 | 11.7% | $ | 10,759 | 13.1% | 16.94 | ||||||||||||||||||||
| 2016 |
184,021 | 3.4% | $ | 10.00 | 222,476 | 4.1% | $ | 23.78 | 406,497 | 7.5% | $ | 7,132 | 8.7% | 17.55 | ||||||||||||||||||||
| 2017 |
51,839 | 1.0% | $ | 14.21 | 225,584 | 4.2% | $ | 22.90 | 277,423 | 5.1% | $ | 5,903 | 7.2% | 21.28 | ||||||||||||||||||||
| 2018 |
318,514 | 5.9% | $ | 14.01 | 228,651 | 4.2% | $ | 20.20 | 547,165 | 10.1% | $ | 9,080 | 11.0% | 16.59 | ||||||||||||||||||||
| 2019 |
526,091 | 9.7% | $ | 13.64 | 153,449 | 2.8% | $ | 21.32 | 679,540 | 12.5% | $ | 10,450 | 12.7% | 15.38 | ||||||||||||||||||||
| 2020 |
223,075 | 4.1% | $ | 17.24 | 80,021 | 1.5% | $ | 25.23 | 303,096 | 5.6% | $ | 5,866 | 7.1% | 19.35 | ||||||||||||||||||||
| 2021 |
134,163 | 2.5% | $ | 10.60 | 74,295 | 1.4% | $ | 20.01 | 208,458 | 3.8% | $ | 2,908 | 3.5% | 13.95 | ||||||||||||||||||||
| 2022 |
312,047 | 5.7% | $ | 12.49 | 53,556 | 1.0% | $ | 20.13 | 365,603 | 6.7% | $ | 4,976 | 6.1% | 13.61 | ||||||||||||||||||||
| Beyond 2022 |
1,512,510 | 27.8% | $ | 8.78 | 203,888 | 3.8% | $ | 30.01 | 1,716,398 | 31.6% | $ | 19,392 | 23.6% | 11.30 | ||||||||||||||||||||
|
|
|
|
||||||||||||||||||||||||||||||||
| Total |
3,722,149 | 68.5% | $ | 11.56 | 1,713,489 | 31.5% | $ | 22.87 | 5,435,638 | 100.0% | $ | 82,220 | 100.0% | $ | 15.13 | |||||||||||||||||||
|
|
|
|
|
|||||||||||||||||||||||||||||||
(1) Retail figures exclude the Excel Centre and Promenade Corporate Center office properties.
(2) Same property GLA percent leased (sequential) excludes any properties that were reclassified to the operating portfolio, acquired, or disposed of during the quarter.
(3) Anchor Tenants and Inline Tenants are described on the Definitions page.
(4) Includes month-to-month leases and ground leases, but excludes percentage rent.
(5) 10,000 square feet which was previously considered inline space was reclassified as anchor space for the third quarter of 2013.
Page 18
Unconsolidated Investments
For the Period Ended December 31, 2013
(Dollars in thousands)
| Financial Information | Leasing Information | |||||||||||||||||||
| Investment Partner | Formation/Acquisition Date | Property | City | State | Total GLA(1) |
Total Assets | Total Debt | Ownership Interest | Percent Leased | ABR | ||||||||||
|
|
|
| ||||||||||||||||||
| GEM | September 7, 2012 | La Costa Town Center | Carlsbad | CA | 121,165 | $25,706 | $14,100 | 20% | 43.2% | $1,193 | ||||||||||
| MDC | October 19, 2012 | The Fountains at Bay Hill | Orlando | FL | 103,767 | $39,906 | $23,423 | 50% | 100.0% | $3,007 | ||||||||||
|
|
|
| ||||||||||||||||||
(1) Total GLA represents total gross leasable area owned by the Company at the property (includes GLA of buildings on ground lease).
Summary Financial Information:
| Balance Sheet |
December 31, 2013 | Company Pro Rata | December 31, 2012 | Company Pro Rata | ||||||||||||||||||||||||
| Assets: |
||||||||||||||||||||||||||||
| Investments in Real Estate |
$ | 60,391 | $ | 23,187 | $ | 61,156 | $ | 23,553 | ||||||||||||||||||||
| Cash & cash equivalents |
277 | 136 | 224 | 111 | ||||||||||||||||||||||||
| Other assets |
4,944 | 1,773 | 6,756 | 2,500 | ||||||||||||||||||||||||
|
|
|
|
|
|
|
|
|
|||||||||||||||||||||
| Total assets |
$ | 65,612 | $ | 25,096 | $ | 68,136 | $ | 26,164 | ||||||||||||||||||||
|
|
|
|
|
|
|
|
|
|||||||||||||||||||||
| Liabilities and members’ equity: |
||||||||||||||||||||||||||||
| Mortgage notes payable and secured loan |
$ | 37,523 | $ | 14,532 | $ | 37,962 | $ | 14,751 | ||||||||||||||||||||
| Other liabilities |
10,236 | 5,008 | 12,300 | 5,566 | ||||||||||||||||||||||||
| Members’ equity |
17,853 | 5,556 | 17,874 | 5,847 | ||||||||||||||||||||||||
|
|
|
|
|
|
|
|
|
|||||||||||||||||||||
| Total liabilities and equity |
$ | 65,612 | $ | 25,096 | $ | 68,136 | $ | 26,164 | ||||||||||||||||||||
|
|
|
|
|
|
|
|
|
|||||||||||||||||||||
| Company’s investment in unconsolidated entities |
$ | 8,520 | $ | 8,371 | ||||||||||||||||||||||||
|
|
|
|
|
|||||||||||||||||||||||||
| Income Statement(2) |
Three Months Ended December 31, 2013 |
Company Pro Rata | Twelve Months Ended December 31, 2013 |
Company Pro Rata | ||||||||||||||||||||||||
| Total revenues |
$ | 1,323 | $ | 562 | $ | 6,837 | $ | 2,514 | ||||||||||||||||||||
| Expenses: |
||||||||||||||||||||||||||||
| Property operating expenses |
344 | 118 | 1,311 | 445 | ||||||||||||||||||||||||
| General and administrative |
10 | 2 | 505 | 105 | ||||||||||||||||||||||||
| Depreciation and amortization |
610 | 233 | 3,608 | 1,287 | ||||||||||||||||||||||||
|
|
|
|
|
|
|
|
|
|||||||||||||||||||||
| Total expenses |
964 | 353 | 5,424 | 1,837 | ||||||||||||||||||||||||
| Interest expense |
(483) | (156) | (1,937) | (637) | ||||||||||||||||||||||||
|
|
|
|
|
|
|
|
|
|||||||||||||||||||||
| Net income (loss) |
$ | (124) | $ | 53 | $ | (524) | $ | 40 | ||||||||||||||||||||
|
|
|
|
|
|
|
|
|
|||||||||||||||||||||
| Company’s loss from equity in unconsolidated entities |
$ | 53 | $ | 40 | ||||||||||||||||||||||||
|
|
|
|
|
|||||||||||||||||||||||||
|
|
||||||||||||||||||||||||||||
(2) Represents results since the formation of the La Costa joint-venture partnership on September 7, 2012 and the purchase of the Fountains at Bay Hill property on October 19, 2012.
| Unconsolidated Debt: | ||||
|
|
||||
| La Costa Town Center |
December 31, 2013 | |||
| Proportionate share of debt: |
$ | 2,820 | ||
| Maturity date: |
October 1, 2014 | |||
| Current interest rate: |
5.9% | |||
| Fountains at Bay Hill: |
December 31, 2013 | |||
| Proportionate share of debt: |
$ | 11,712 | ||
| Maturity date: |
April 2, 2015 | |||
| Current interest rate: |
3.4% | |||
Page 19
Definitions
Adjusted Funds From Operations (AFFO): Adjusted Funds From Operations (AFFO) is a non-GAAP financial measure we believe is a useful supplemental measure of our performance. We compute AFFO by adding to FFO the non-cash compensation expense, amortization of prepaid financing costs and non-recurring transaction costs, and other one-time items, then subtracting straight-line rents, amortization of above and below market leases and non-incremental capital expenditures. Our computation may differ from the methodology for calculating AFFO utilized by other equity REITs and, accordingly, may not be comparable to such other REITs. AFFO should not be considered as an alternative to net income (loss) (computed in accordance with GAAP) as an indicator of Excel Trust’s financial performance or to cash flow from operating activities (computed in accordance with GAAP) as an indicator of Excel Trust’s liquidity, nor is it indicative of funds available to fund Excel Trust’s cash needs, including Excel Trust’s ability to pay dividends or make distributions.
Anchor Tenant: A tenant who occupies 10,000 square feet or more.
Annualized Base Rent: Annualized Base Rent is obtained by annualizing the cash rental rate (excluding reimbursements and percentage rent) for the final month of a reporting period. Annualized Base Rent does not include rental revenue from multi-family properties.
EBITDA: Earnings (excluding preferred stock dividends) before interest, taxes, depreciation and amortization.
Funds From Operations (FFO): Excel Trust considers FFO an important supplemental measure of its operating performance and believe it is frequently used by securities analysts, investors and other interested parties in the evaluation of REITs, many of which present FFO when reporting their results. FFO is intended to exclude GAAP historical cost depreciation and amortization of real estate and related assets, which assumes that the value of real estate assets diminishes ratably over time. Historically, however, real estate values have risen or fallen with market conditions. Because FFO excludes depreciation and amortization unique to real estate, gains and losses from property dispositions and extraordinary items, it provides a performance measure that, when compared year-over-year, reflects the impact to operations from trends in occupancy rates, rental rates, operating costs, development activities and interest costs, providing perspective not immediately apparent from net income.
Excel Trust computes FFO in accordance with standards established by the National Association of Real Estate Investment Trusts, or NAREIT. As defined by NAREIT, FFO represents net income (loss) (computed in accordance with generally accepted accounting principles, or GAAP), excluding real estate-related depreciation and amortization, impairment charges and net gains (losses) on the disposition of real estate assets and after adjustments for unconsolidated partnerships and joint ventures. Excel Trust’s computation may differ from the methodology for calculating FFO utilized by other equity REITs and, accordingly, may not be comparable to such other REITs. Further, FFO does not represent amounts available for management’s discretionary use because of needed capital service obligations, or other commitments and uncertainties. FFO should not be considered as an alternative to net income (loss) replacement or expansion, debt (computed in accordance with GAAP) as an indicator of Excel Trust’s financial performance or to cash flow from operating activities (computed in accordance with GAAP) as an indicator of Excel Trust’s liquidity, nor is it indicative of funds available to fund Excel Trust’s cash needs, including Excel Trust’s ability to pay dividends or make distributions.
Inline Tenant: Any tenant who does not qualify as an anchor tenant.
Leased: A space is considered leased when both Excel Trust and the tenant have executed the lease agreement.
Occupied: A space is considered occupied when the tenant has access to the space and revenue recognition has commenced (includes month-to-month tenants). If a tenant has vacated a space and Excel Trust has agreed to terminate the lease, the space is considered unoccupied as of the date of execution of the amended lease agreement.
Page 20