UNITED STATES
SECURITIES AND EXCHANGE COMMISSION
Washington, D.C. 20549
FORM N-CSR
CERTIFIED SHAREHOLDER REPORT OF REGISTERED MANAGEMENT
INVESTMENT COMPANIES
Investment Company Act File Number 811-22363
SteelPath MLP Funds Trust
(Exact name of registrant as specified in charter)
2100 McKinney Avenue, Suite 1401
Dallas, TX 75201
(Address of principal executive offices) (Zip Code)
Gabriel Hammond
SteelPath Fund Advisors, LLC
2100 McKinney Avenue, Suite 1401
Dallas, TX 75201
(Name and address of agent for service)
Registrant's telephone number, including area code: (214) 740-6040
Date of fiscal year end: November 30
Date of reporting period: May 31, 2012
Item 1. Reports to Stockholders.
The following is a copy of the report transmitted to shareholders pursuant to Rule 30e-1 under the Investment Company Act of 1940 (17 CFR 270.30e-1).
TABLE OF CONTENTS
SteelPath MLP Funds
|
|
Page
|
|
Letter to Shareholders
|
1
|
|
Schedules of Investments
|
|
|
Select 40 Fund
|
3
|
|
Alpha Fund
|
4
|
|
Income Fund
|
5
|
|
Alpha Plus Fund
|
6
|
|
Statements of Assets and Liabilities
|
7
|
|
Statements of Operations
|
8
|
|
Statements of Changes in Net Assets
|
9
|
|
Statements of Cash Flows
|
13
|
|
Financial Highlights
|
|
|
Select 40 Fund
|
14
|
|
Alpha Fund
|
14
|
|
Income Fund
|
16
|
|
Alpha Plus Fund
|
16
|
|
Notes to Financial Statements
|
18
|
|
Expense Example
|
26
|
|
Other Information
|
28
|
|
Approval of Investment Advisory Agreements
|
29
|
|
Privacy Policy
|
33
|
LETTER TO SHAREHOLDERS
To Our Shareholders:
We thank you for investing with SteelPath MLP Funds. We would like to share our thoughts on the six-month period ended May 31, 2012.
The Master Limited Partnership (MLP) space ended last year on a good note as European-related fears subsided. However, similar concerns have reemerged since and once again have impacted the sector. Further, recent weakness has impacted the MLP and broader energy sectors relatively more than the broader markets. MLPs, as measured by the Alerian MLP Index (AMZ)1, provided a simple2 price loss of 0.9% for the first half of the 2012 fiscal year. This performance came in behind the 5.1% gain posted by the broader markets using the S&P 500 Index3 as a proxy. After including distributions or dividends paid, MLPs provided a 2.0% total return, making up some valuable ground compared to the 6.2% total return generated by the S&P 500 Index. The sector closed the semi-annual period with a 6.6% yield versus the 6.4% yield at the end of the last fiscal year as distribution growth was generally ahead of price performance which pushed the Index’s yield modestly higher.
Macro Review
Once again, MLP large-cap names outperformed the small- and mid-cap peer groups during the period. More specifically, those names able to tout aggressive near-term distribution growth potential, either through acquisition activity or accretive new build project slates, typically outperformed those names with slower near-term distribution growth expectations. However, large-cap outperformance for the six month period was not as pronounced as experienced during 2011. Note, the market-cap, float adjusted AMZ Index loss of 0.9% for the semi-annual period was only slightly better than the 1.9% loss derived from an equal-weighted4 performance measure of the same constituents. The bottom quartile of performance was represented by the Coal and Propane sub-sectors. These sub-sectors were plagued by a particularly warm winter which meant less coal and propane was needed for power generation and heating homes. Further, secondary equity issuances over the first half of the year were relatively robust once again. Secondary equity issuances have historically pressured stock performance, all else being equal.
Outlook
Potential price performance for the remainder of the year will likely be driven, in part, by those factors influencing the broader markets and, more particularly, the broader energy markets. Risks to the broader markets remain focused on the Eurozone and the potential for a greater than expected slow-down of the Chinese economy. Though most energy infrastructure MLPs have little to no margin exposure to commodity prices, the MLP sector tends to reflect heightened correlation to the broader energy markets during periods of market turbulence. More recently, lower oil and natural gas liquids (NGLs) prices have been putting some downward pressure on the more commodity-exposed MLP sub-sectors.
We continue to believe most infrastructure MLPs with primarily fee-based or fee-like margins should experience little business impact from these broader market gyrations. However, price performance has been and may likely continue to be impacted. Additionally, it is important to note some MLPs, such as upstream MLPs, that drill for and produce crude oil and natural gas, as well as those MLPs with natural gas processing assets can have margin exposure to commodity prices. We seek to limit the potential impact of commodity price changes on our portfolios through rigorous risk assessment of portfolio holdings with the goal of limiting exposure to those names that might be forced to suspend or lower distribution rates in downside commodity price cases.
Though investors will likely continue to allocate and reallocate across equity and fixed income asset classes in reaction to emerging events in the global markets and, therefore, will likely sustain a pattern of heightened market volatility, we believe midstream infrastructure MLPs will do what they do best – generate stable and even growing cash flows sufficient to pay and grow distributions to investors. This business growth is supported by the demand for midstream infrastructure such as pipelines and terminals. Currently, NGL and crude oil logistical assets are experiencing particularly elevated demand. Importantly, we believe demand for these services should be resilient as these infrastructure needs are driven by advancements in drilling technologies rather than a specific outlook for the broader economy.
|
May 31, 2012
|
1 |
Finally, we believe the majority of names in the sector may continue to offer very healthy underlying fundamentals at attractive valuations. Yield spreads have widened substantially over this period, with the AMZ Index’s spread to the 10-year Treasury at 505 basis points5 as of May 31, 2012 versus a normalized historical average of 288 basis points (an average based on a time series that dates back to 2000 but excludes the outlier years of 2008 and 2009). Other valuation metrics, such as EV/EBITDA6 and Price/DCF7, have also fallen below historical averages.
Perhaps more importantly, MLP capex8 budgets continue to expand as infrastructure growth opportunities related to burgeoning shale play production remain abundant. Such “organic” growth opportunities combined with our expectation for continued acquisition of existing assets underlies our distribution growth expectations.
We sincerely appreciate your trust and continued confidence in SteelPath.
Gabriel Hammond
President
This material is not authorized for use unless accompanied or preceded by a prospectus.
Past performance is no guarantee of future results. The investment return and the principal value of an investment will fluctuate and shares, when redeemed, may be worth more or less than their original cost. Total returns of the Fund current to the most recent month-end can be obtained by visiting our website at www.steelpath.com.
|
1
|
The Alerian MLP Index is a composite of the 50 most prominent energy Master Limited Partnerships that provides investors with an unbiased, comprehensive benchmark for this emerging asset class. The index, which is calculated using a float-adjusted, capitalization-weighted methodology, is disseminated real-time on a price-return basis (AMZ). It is not possible to invest directly in an index. Performance information provided for the Alerian MLP Index is not indicative of the performance of the SteelPath Funds.
|
|
2
|
Simple return reflects Index performance without including the impact of distributions/dividends. A simple return is also referred to as price return or price appreciation. Total return reflects Index performance including the impact of distributions/dividends.
|
|
3
|
The S&P 500 Index is an unmanaged index of common stocks that is frequently used as a general measure of stock market performance and typically does not include fees and expenses. It is not possible to invest directly in an index.
|
|
4
|
Equal-weighted basis refers to a type of weighting that gives the same weight, or importance, to each stock in an index. The smallest companies are given equal weight to the largest companies in an equal-weight index. This allows all of the companies to be considered on an even playing field.
|
|
5
|
Basis points refers to a unit that is equal to 1/100th of 1%, and is used to denote the change in a financial instrument. The basis point is commonly used for calculating changes in interest rates, equity indexes and the yield of a fixed-income security. The relationship between percentage changes and basis points can be summarized as follows: 1% change = 100 basis points, and 0.01% = 1 basis point.
|
|
6
|
Enterprise Value (EV) is a measure of a company’s value, often used as an alternative to straightforward market capitalization. Enterprise value is calculated as market cap plus debt, minority interest and preferred shares, minus total cash and cash equivalents.
|
|
|
Earnings Before Interest, Taxes, Depreciation and Amortization (EBITDA) is an indicator of a company’s financial performance. EBITDA is essentially net income with interest, taxes, depreciation, and amortization added back into the calculation. EBITDA can be used to analyze and compare profitability between companies and industries because it eliminates the effects of financing and accounting decisions.
|
|
7
|
Distributable cash flow (DCF) is generally calculated as earnings before interest, taxes, depreciation and amortization (EBITDA) plus non-cash losses, minus interest expense, maintenance capital expenditures, and non-cash gains.
|
|
8
|
Capital Expenditure (capex) funds are used by a company to acquire or upgrade physical assets such as property, industrial buildings or equipment. This type of outlay is made by companies to maintain or increase the scope of their operations.
|
| 2 |
SteelPath MLP Funds Semi-Annual Report
|
SCHEDULE OF INVESTMENTS
May 31, 2012 (Unaudited)
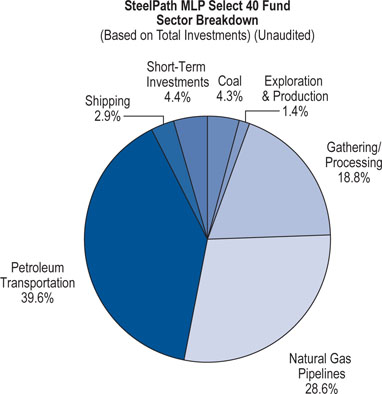
SteelPath MLP Select 40 Fund
|
Description
|
Shares
|
Fair Value
|
||||||
|
Master Limited Partnership Shares — 97.3%
|
||||||||
|
Coal — 4.4%
|
||||||||
|
Alliance Holdings GP LP
|
273,149 | $ | 11,354,804 | |||||
|
Alliance Resource Partners LP
|
266,805 | 15,210,553 | ||||||
|
Natural Resource Partners LP
|
390,726 | 8,963,255 | ||||||
|
Rhino Resource Partners LP
|
125,903 | 1,766,419 | ||||||
|
Total Coal
|
37,295,031 | |||||||
|
Exploration & Production — 1.4%
|
||||||||
|
EV Energy Partners LP
|
144,543 | 7,412,165 | ||||||
|
Linn Energy LLC
|
136,726 | 4,857,875 | ||||||
|
Total Exploration & Production
|
12,270,040 | |||||||
|
Gathering/Processing — 19.1%
|
||||||||
|
Chesapeake Midstream Partners LP
|
535,324 | 13,399,160 | ||||||
|
Compressco Partners LP
|
358,083 | 4,655,079 | ||||||
|
Copano Energy LLC
|
477,020 | 12,784,136 | ||||||
|
Crosstex Energy LP
|
388,784 | 6,061,142 | ||||||
|
DCP Midstream Partners LP
|
383,202 | 15,071,335 | ||||||
|
Exterran Partners LP
|
767,345 | 15,139,717 | ||||||
|
MarkWest Energy Partners LP
|
543,929 | 26,075,956 | ||||||
|
Regency Energy Partners LP
|
1,091,458 | 23,488,176 | ||||||
|
Targa Resources Partners LP
|
604,591 | 23,712,059 | ||||||
|
Western Gas Partners LP
|
487,056 | 21,474,299 | ||||||
|
Total Gathering/Processing
|
161,861,059 | |||||||
|
Natural Gas Pipelines — 29.1%
|
||||||||
|
Boardwalk Pipeline Partners LP
|
812,566 | 21,086,087 | ||||||
|
El Paso Pipeline Partners LP
|
859,638 | 28,204,723 | ||||||
|
Energy Transfer Equity LP
|
784,375 | 28,496,344 | ||||||
|
Energy Transfer Partners LP
|
399,702 | 17,343,070 | ||||||
|
Enterprise Products Partners LP
|
892,926 | 43,539,072 | ||||||
|
ONEOK Partners LP
|
548,580 | 29,952,468 | ||||||
|
Spectra Energy Partners LP
|
815,636 | 25,423,374 | ||||||
|
TC Pipelines LP
|
462,892 | 18,978,572 | ||||||
|
Williams Partners LP
|
619,845 | 32,789,800 | ||||||
|
Total Natural Gas Pipelines
|
245,813,510 | |||||||
|
Petroleum Transportation — 40.3%
|
||||||||
|
Buckeye Partners LP
|
734,668 | 34,911,423 | ||||||
|
Enbridge Energy Partners LP
|
1,282,217 | 37,492,025 | ||||||
|
Genesis Energy LP
|
1,032,427 | 29,702,925 | ||||||
|
Global Partners LP
|
910,658 | 19,715,746 | ||||||
|
Holly Energy Partners LP
|
587,626 | 33,242,003 | ||||||
|
Magellan Midstream Partners LP
|
495,747 | 34,112,351 | ||||||
|
Martin Midstream Partners LP
|
161,136 | 5,186,968 | ||||||
|
NuStar Energy LP
|
615,200 | 32,119,592 | ||||||
|
NuStar GP Holdings LLC
|
573,424 | 18,286,491 | ||||||
|
Oiltanking Partners LP
|
426,482 | 13,263,590 | ||||||
|
Plains All American Pipeline LP
|
549,322 | 43,138,257 | ||||||
|
Sunoco Logistics Partners LP
|
739,968 | 24,922,122 | ||||||
|
Tesoro Logistics LP
|
295,668 | 9,322,412 | ||||||
|
TransMontaigne Partners LP
|
180,292 | 5,686,410 | ||||||
|
Total Petroleum Transportation
|
341,102,315 | |||||||
|
Shipping — 3.0%
|
||||||||
|
Teekay LNG Partners LP
|
675,040 | $ | 25,185,742 | |||||
|
Total Master Limited Partnership Shares
|
||||||||
|
(identified cost $741,976,671)
|
823,527,697 | |||||||
|
Short-Term Investments — 4.5%
|
||||||||
|
Money Market — 4.5%
|
||||||||
|
Fidelity Treasury Portfolio, 0.010% (1)
|
38,111,760 | 38,111,760 | ||||||
|
Total Short-Term Investments
|
||||||||
|
(identified cost $38,111,760)
|
38,111,760 | |||||||
|
Total Investments — 101.8%
|
||||||||
|
(identified cost $780,088,431)
|
861,639,457 | |||||||
|
Liabilities In Excess of Other Assets — (1.8)%
|
(15,358,292 | ) | ||||||
|
Net Assets — 100.0%
|
$ | 846,281,165 | ||||||
LLC — Limited Liability Company
LP — Limited Partnership
|
(1)
|
Variable rate security; the coupon rate represents the rate at May 31, 2012.
|
See accompanying Notes to Financial Statements.
|
May 31, 2012
|
3 |
SCHEDULE OF INVESTMENTS
May 31, 2012 (Unaudited)
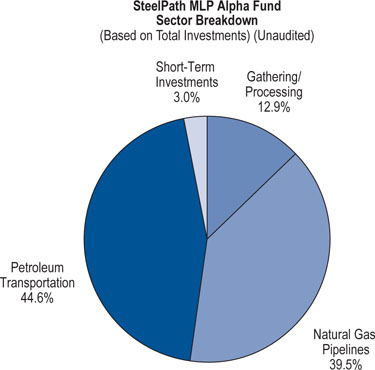
SteelPath MLP Alpha Fund
|
Description
|
Shares
|
Fair Value
|
||||||
|
Master Limited Partnership Shares — 98.9%
|
||||||||
|
Gathering/Processing — 13.2%
|
||||||||
|
MarkWest Energy Partners LP
|
711,490 | $ | 34,108,831 | |||||
|
Regency Energy Partners LP
|
1,660,293 | 35,729,505 | ||||||
|
Western Gas Partners LP
|
332,579 | 14,663,408 | ||||||
|
Total Gathering/Processing
|
84,501,744 | |||||||
|
Natural Gas Pipelines — 40.3%
|
||||||||
|
El Paso Pipeline Partners LP
|
1,316,631 | 43,198,663 | ||||||
|
Energy Transfer Equity LP
|
989,289 | 35,940,869 | ||||||
|
Enterprise Products Partners LP
|
947,101 | 46,180,645 | ||||||
|
ONEOK Partners LP
|
766,003 | 41,823,764 | ||||||
|
Spectra Energy Partners LP
|
888,709 | 27,701,060 | ||||||
|
TC Pipelines LP
|
820,381 | 33,635,621 | ||||||
|
Williams Partners LP
|
560,299 | 29,639,817 | ||||||
|
Total Natural Gas Pipelines
|
258,120,439 | |||||||
|
Petroleum Transportation — 45.4%
|
||||||||
|
Buckeye Partners LP
|
536,617 | 25,500,040 | ||||||
|
Enbridge Energy Partners LP
|
1,129,424 | 33,024,358 | ||||||
|
Genesis Energy LP
|
968,581 | 27,866,075 | ||||||
|
Holly Energy Partners LP
|
719,977 | 40,729,099 | ||||||
|
Magellan Midstream Partners LP
|
457,440 | 31,476,446 | ||||||
|
NuStar Energy LP
|
619,265 | 32,331,826 | ||||||
|
Oiltanking Partners LP
|
115,614 | 3,595,595 | ||||||
|
Plains All American Pipeline LP
|
653,685 | 51,333,883 | ||||||
|
Sunoco Logistics Partners LP
|
929,795 | 31,315,496 | ||||||
|
TransMontaigne Partners LP
|
437,889 | 13,811,019 | ||||||
|
Total Petroleum Transportation
|
290,983,837 | |||||||
|
Total Master Limited Partnership Shares
|
||||||||
|
(identified cost $574,472,352)
|
633,606,020 | |||||||
|
Short-Term Investments — 3.0%
|
||||||||
|
Money Market — 3.0%
|
||||||||
|
Fidelity Treasury Portfolio, 0.010% (1)
|
19,329,320 | $ | 19,329,320 | |||||
|
Total Short-Term Investments
|
||||||||
|
(identified cost $19,329,320)
|
19,329,320 | |||||||
|
Total Investments — 101.9%
|
||||||||
|
(identified cost $593,801,672)
|
652,935,340 | |||||||
|
Liabilities In Excess of Other Assets — (1.9)%
|
(11,889,831 | ) | ||||||
|
Net Assets — 100.0%
|
$ | 641,045,509 | ||||||
LLC — Limited Liability Company
|
LP — Limited Partnership
|
|
(1)
|
Variable rate security; the coupon rate represents the rate at May 31, 2012.
|
See accompanying Notes to Financial Statements.
| 4 |
SteelPath MLP Funds Semi-Annual Report
|
SCHEDULE OF INVESTMENTS
May 31, 2012 (Unaudited)
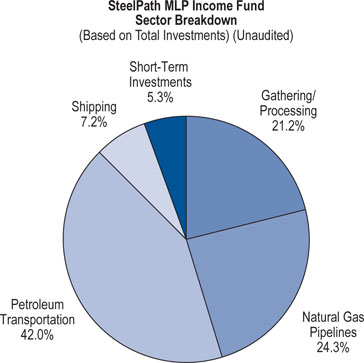
SteelPath MLP Income Fund
|
Description
|
Shares
|
Fair Value
|
||||||
|
Master Limited Partnership Shares — 95.3%
|
||||||||
|
Gathering/Processing — 21.4%
|
||||||||
|
American Midstream Partners LP
|
377,713 | $ | 7,456,055 | |||||
|
Compressco Partners LP
|
399,251 | 5,190,263 | ||||||
|
Copano Energy LLC
|
229,237 | 6,143,552 | ||||||
|
Crosstex Energy LP
|
538,466 | 8,394,685 | ||||||
|
Exterran Partners LP
|
998,100 | 19,692,513 | ||||||
|
Regency Energy Partners LP
|
1,213,554 | 26,115,682 | ||||||
|
Targa Resources Partners LP
|
219,315 | 8,601,534 | ||||||
|
Total Gathering/Processing
|
81,594,284 | |||||||
|
Natural Gas Pipelines — 24.3%
|
||||||||
|
Boardwalk Pipeline Partners LP
|
524,647 | 13,614,590 | ||||||
|
Energy Transfer Equity LP
|
345,220 | 12,541,843 | ||||||
|
Energy Transfer Partners LP
|
581,890 | 25,248,207 | ||||||
|
Inergy Midstream LLC
|
1,367,343 | 28,509,101 | ||||||
|
TC Pipelines LP
|
325,380 | 13,340,580 | ||||||
|
Total Natural Gas Pipelines
|
93,254,321 | |||||||
|
Petroleum Transportation — 42.0%
|
||||||||
|
Buckeye Partners LP
|
451,357 | 21,448,485 | ||||||
|
Enbridge Energy Partners LP
|
859,427 | 25,129,645 | ||||||
|
Global Partners LP
|
986,236 | 21,352,009 | ||||||
|
Holly Energy Partners LP
|
412,197 | 23,317,984 | ||||||
|
Martin Midstream Partners LP
|
572,083 | 18,415,352 | ||||||
|
NuStar Energy LP
|
499,730 | 26,090,903 | ||||||
|
Plains All American Pipeline LP
|
149,919 | 11,773,139 | ||||||
|
TransMontaigne Partners LP
|
438,890 | 13,842,591 | ||||||
|
Total Petroleum Transportation
|
161,370,108 | |||||||
|
Shipping — 7.2%
|
||||||||
|
Teekay LNG Partners LP
|
737,137 | 27,502,581 | ||||||
|
Total Master Limited Partnership Shares
|
||||||||
|
(identified cost $361,091,771)
|
363,721,294 | |||||||
|
Short-Term Investments — 5.3%
|
||||||||
|
Money Market — 5.3%
|
||||||||
|
Fidelity Treasury Portfolio, 0.010% (1)
|
20,483,035 | $ | 20,483,035 | |||||
|
Total Short-Term Investments
|
||||||||
|
(identified cost $20,483,035)
|
20,483,035 | |||||||
|
Total Investments — 100.7%
|
||||||||
|
(identified cost $381,574,806)
|
384,204,329 | |||||||
|
Liabilities In Excess of Other Assets — (0.7)%
|
(2,538,028 | ) | ||||||
|
Net Assets — 100.0%
|
$ | 381,666,301 | ||||||
|
LLC — Limited Liability Company
|
|
LP — Limited Partnership
|
|
(1)
|
Variable rate security; the coupon rate represents the rate at May 31, 2012.
|
See accompanying Notes to Financial Statements.
|
May 31, 2012
|
5 |
SCHEDULE OF INVESTMENTS
May 31, 2012 (Unaudited)
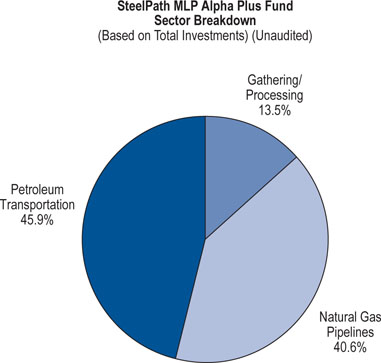
SteelPath MLP Alpha Plus Fund
|
Description
|
Shares
|
Fair Value
|
||||||
|
Master Limited Partnership Shares — 114.7%
|
||||||||
|
Gathering/Processing — 15.4%
|
||||||||
|
MarkWest Energy Partners LP(1)
|
1,169 | $ | 56,042 | |||||
|
Regency Energy Partners LP(1)
|
2,634 | 56,683 | ||||||
|
Western Gas Partners LP(1)
|
534 | 23,544 | ||||||
|
Total Gathering/Processing
|
136,269 | |||||||
|
Natural Gas Pipelines — 46.6%
|
||||||||
|
El Paso Pipeline Partners LP(1)
|
2,096 | 68,770 | ||||||
|
Energy Transfer Equity LP(1)
|
1,586 | 57,620 | ||||||
|
Enterprise Products Partners LP(1)
|
1,511 | 73,676 | ||||||
|
ONEOK Partners LP(1)
|
1,225 | 66,885 | ||||||
|
Spectra Energy Partners LP(1)
|
1,418 | 44,199 | ||||||
|
TC Pipelines LP(1)
|
1,312 | 53,792 | ||||||
|
Williams Partners LP(1)
|
891 | 47,134 | ||||||
|
Total Natural Gas Pipelines
|
412,076 | |||||||
|
Petroleum Transportation — 52.7%
|
||||||||
|
Buckeye Partners LP(1)
|
862 | $ | 40,962 | |||||
|
Enbridge Energy Partners LP(1)
|
1,799 | 52,603 | ||||||
|
Genesis Energy LP(1)
|
1,555 | 44,737 | ||||||
|
Holly Energy Partners LP(1)
|
1,151 | 65,112 | ||||||
|
Magellan Midstream Partners LP(1)
|
730 | 50,231 | ||||||
|
NuStar Energy LP(1)
|
994 | 51,897 | ||||||
|
Oiltanking Partners LP
|
186 | 5,785 | ||||||
|
Plains All American Pipeline LP(1)
|
1,043 | 81,907 | ||||||
|
Sunoco Logistics Partners LP(1)
|
1,491 | 50,217 | ||||||
|
TransMontaigne Partners LP(1)
|
701 | 22,109 | ||||||
|
Total Petroleum Transportation
|
465,560 | |||||||
|
Total Master Limited Partnership Shares
|
||||||||
|
(identified cost $1,116,522)
|
1,013,905 | |||||||
|
Total Investments — 114.7%
|
||||||||
|
(identified cost $1,116,522)
|
1,013,905 | |||||||
|
Liabilities In Excess of Other Assets — (14.7)%
|
(130,042 | ) | ||||||
|
Net Assets — 100.0%
|
$ | 883,863 | ||||||
|
LLC — Limited Liability Company
|
|
LP — Limited Partnership
|
|
(1)
|
As of May 31, 2012, all or a portion of the security has been pledged as collateral for a Fund loan. The market value of the securities in the pledged account totaled $858,783 as of May 31, 2012. The loan agreement requires continuous collateral whether the loan has a balance or not. See Note 7 to the financial statements.
|
See accompanying Notes to Financial Statements.
| 6 |
SteelPath MLP Funds Semi-Annual Report
|
STATEMENTS OF ASSETS AND LIABILITIES
May 31, 2012 (Unaudited)
SteelPath MLP Funds
|
SteelPath MLP
Select 40 Fund
|
SteelPath MLP
Alpha Fund
|
SteelPath MLP
Income Fund
|
SteelPath MLP
Alpha Plus Fund
|
|||||||||||||
|
Assets:
|
||||||||||||||||
|
Investment securities:
|
||||||||||||||||
|
At acquisition cost
|
$ | 780,088,431 | $ | 593,801,672 | $ | 381,574,806 | $ | 1,116,522 | ||||||||
|
At fair value
|
$ | 861,639,457 | $ | 652,935,340 | $ | 384,204,329 | $ | 1,013,905 | ||||||||
|
Dividends receivable
|
188 | 58 | 135 | — | ||||||||||||
|
Due from Advisor
|
— | — | — | 63,191 | ||||||||||||
|
Receivable for investments sold
|
4,634,015 | 940,479 | 1,165,773 | 53,058 | ||||||||||||
|
Receivable for capital stock sold
|
2,119,301 | 2,286,303 | 898,781 | 25,000 | ||||||||||||
|
Deferred tax asset
|
23,857,033 | 20,238,174 | 4,134,218 | 60,736 | ||||||||||||
|
Prepaid expenses
|
274,798 | 289,137 | 104,407 | 48,698 | ||||||||||||
|
Total assets
|
892,524,792 | 676,689,491 | 390,507,643 | 1,264,588 | ||||||||||||
|
Liabilities:
|
||||||||||||||||
|
Due to custodian
|
— | — | — | 52,348 | ||||||||||||
|
Interest Expense Payable
|
— | — | — | 436 | ||||||||||||
|
Payable for capital stock redeemed
|
485,999 | 203,518 | 1,176,979 | — | ||||||||||||
|
Payable for investments purchased
|
— | — | — | 12,263 | ||||||||||||
|
Deferred tax liability
|
45,020,902 | 34,679,605 | 7,109,770 | — | ||||||||||||
|
Payable to Advisor
|
494,381 | 579,124 | 268,299 | — | ||||||||||||
|
Payable for 12b-1 fees, Class A
|
78,486 | 71,650 | 171,581 | 109 | ||||||||||||
|
Payable for 12b-1 fees, Class C
|
21,600 | 7,356 | 28,080 | 4 | ||||||||||||
|
Line Of Credit
|
— | — | — | 264,050 | ||||||||||||
|
Other liabilities
|
142,259 | 102,729 | 86,633 | 51,515 | ||||||||||||
|
Total liabilities
|
46,243,627 | 35,643,982 | 3,841,342 | 380,725 | ||||||||||||
|
Total Net Assets
|
$ | 846,281,165 | $ | 641,045,509 | $ | 381,666,301 | $ | 883,863 | ||||||||
|
Net Assets Consist of:
|
||||||||||||||||
|
Paid-in capital
|
$ | 811,008,050 | $ | 616,976,456 | $ | 376,707,048 | $ | 985,091 | ||||||||
|
Undistributed net investment loss, net of deferred taxes
|
(5,451,340 | ) | (6,180,082 | ) | (3,254,157 | ) | (4,539 | ) | ||||||||
|
Accumulated undistributed net realized gains/(losses) on investments, net of deferred taxes
|
(10,244,937 | ) | (6,709,408 | ) | 6,569,958 | (32,553 | ) | |||||||||
|
Net unrealized appreciation/(depreciation) on investments, net of deferred taxes
|
50,969,392 | 36,958,543 | 1,643,452 | (64,136 | ) | |||||||||||
|
Total Net Assets
|
$ | 846,281,165 | $ | 641,045,509 | $ | 381,666,301 | $ | 883,863 | ||||||||
|
Net Asset Value, Offering Price and Redemption Proceeds Per Share ($0.001 Par Value, Unlimited Shares Authorized)
|
||||||||||||||||
|
Class A Shares:
|
||||||||||||||||
|
Net asset value and redemption proceeds per share
|
$ | 10.21 | $ | 10.12 | $ | 9.82 | $ | 9.31 | ||||||||
|
Offering price per share*
|
$ | 10.83 | $ | 10.74 | $ | 10.42 | $ | 9.88 | ||||||||
|
Class C Shares:
|
||||||||||||||||
|
Net asset value, offering price and redemption proceeds per share
|
$ | 10.22 | $ | 10.11 | $ | 9.78 | $ | 9.32 | ||||||||
|
Class I Shares:
|
||||||||||||||||
|
Net asset value, offering price and redemption proceeds per share
|
$ | 10.29 | $ | 10.19 | $ | 9.87 | $ | 9.32 | ||||||||
|
Class Y Shares:
|
||||||||||||||||
|
Net asset value, offering price and redemption proceeds per share
|
$ | 10.29 | $ | — | $ | — | $ | — | ||||||||
|
Net Assets:
|
||||||||||||||||
|
Class A shares
|
$ | 174,215,663 | $ | 146,456,264 | $ | 251,332,311 | $ | 179,681 | ||||||||
|
Class C shares
|
10,296,739 | 3,822,664 | 14,095,924 | 37,341 | ||||||||||||
|
Class I shares
|
605,221,863 | 490,766,581 | 116,238,066 | 666,841 | ||||||||||||
|
Class Y shares
|
56,546,900 | — | — | — | ||||||||||||
|
Total Net Assets
|
$ | 846,281,165 | $ | 641,045,509 | $ | 381,666,301 | $ | 883,863 | ||||||||
|
Shares Outstanding:
|
||||||||||||||||
|
Class A shares
|
17,058,406 | 14,466,611 | 25,591,351 | 19,307 | ||||||||||||
|
Class C shares
|
1,007,535 | 378,138 | 1,441,285 | 4,007 | ||||||||||||
|
Class I shares
|
58,799,684 | 48,170,356 | 11,774,876 | 71,525 | ||||||||||||
|
Class Y shares
|
5,493,793 | — | — | — | ||||||||||||
|
Total Shares Outstanding
|
82,359,418 | 63,015,105 | 38,807,512 | 94,839 | ||||||||||||
|
*
|
Computation of offering price per share 100/94.25 of net asset value.
|
See accompanying Notes to Financial Statements.
|
May 31, 2012
|
7 |
STATEMENTS OF OPERATIONS
For the Six Months Ended May 31, 2012 (Unaudited)
SteelPath MLP Funds
|
|
SteelPath MLP
Select 40 Fund
|
SteelPath MLP
Alpha Fund
|
SteelPath MLP
Income Fund
|
SteelPath MLP
Alpha Plus Fund*
|
||||||||||||
|
Investment Income:
|
||||||||||||||||
|
Distributions from Master Limited Partnerships
|
$ | 26,379,225 | $ | 19,578,708 | $ | 13,109,747 | $ | 34,394 | ||||||||
|
Less return of capital on distributions
|
(26,379,225 | ) | (19,578,708 | ) | (13,109,747 | ) | (34,394 | ) | ||||||||
|
Dividend income
|
2,128 | 1,818 | 979 | — | ||||||||||||
|
Total investment income
|
2,128 | 1,818 | 979 | — | ||||||||||||
|
Expenses:
|
||||||||||||||||
|
Investment advisory fee
|
2,882,538 | 3,628,133 | 1,664,257 | 5,093 | ||||||||||||
|
Registration fees
|
76,863 | 54,535 | 51,288 | 22,947 | ||||||||||||
|
Administrative fees
|
347,714 | 307,431 | 223,128 | 24,593 | ||||||||||||
|
Transfer agent fees
|
84,809 | 66,300 | 107,192 | 14,279 | ||||||||||||
|
Directors' fees
|
26,836 | 25,659 | 26,836 | 10,286 | ||||||||||||
|
Insurance premiums
|
20,331 | 14,454 | 8,644 | 214 | ||||||||||||
|
Interest Expense
|
— | — | — | 832 | ||||||||||||
|
Auditing fees
|
20,682 | 21,040 | 21,040 | 7,601 | ||||||||||||
|
Custody fees
|
29,071 | 23,330 | 18,036 | 6,364 | ||||||||||||
|
CCO fees
|
8,838 | 8,837 | 8,838 | 6,584 | ||||||||||||
|
Legal fees
|
95,000 | 71,667 | 39,333 | 40,587 | ||||||||||||
|
Printing and postage
|
8,459 | 8,871 | 8,943 | 8,434 | ||||||||||||
|
12b-1 fees, Class A
|
210,404 | 175,852 | 292,354 | 117 | ||||||||||||
|
12b-1 fees, Class C
|
34,854 | 9,999 | 40,758 | 5 | ||||||||||||
|
Miscellaneous
|
7,994 | 6,419 | 4,147 | 3,892 | ||||||||||||
|
Total expenses, before waivers and deferred taxes
|
3,854,393 | 4,422,527 | 2,514,794 | 151,828 | ||||||||||||
|
Less expense waivers
|
(108,909 | ) | (113,798 | ) | (254,647 | ) | (144,567 | ) | ||||||||
|
Net expenses, before deferred taxes
|
3,745,484 | 4,308,729 | 2,260,147 | 7,261 | ||||||||||||
|
Net investment loss, before deferred taxes
|
(3,743,356 | ) | (4,306,911 | ) | (2,259,168 | ) | (7,261 | ) | ||||||||
|
Deferred tax benefit
|
1,403,758 | 1,615,091 | 847,188 | 2,722 | ||||||||||||
|
Net investment loss, net of deferred taxes
|
(2,339,598 | ) | (2,691,820 | ) | (1,411,980 | ) | (4,539 | ) | ||||||||
|
Net Realized and Unrealized Gains/(Losses) on Investments:
|
||||||||||||||||
|
Net Realized Gains/(Losses)
|
||||||||||||||||
|
Investments
|
(14,420,547 | ) | (12,771,798 | ) | 10,921,693 | (52,085 | ) | |||||||||
|
Deferred tax benefit/(expense)
|
5,407,705 | 4,789,424 | (4,095,634 | ) | 19,532 | |||||||||||
|
Net realized gains/(losses), net of deferred taxes
|
(9,012,842 | ) | (7,982,374 | ) | 6,826,059 | (32,553 | ) | |||||||||
|
Net Change in Unrealized Appreciation/(Depreciation)
|
||||||||||||||||
|
Investments
|
7,105,505 | 22,502,605 | (15,071,486 | ) | (102,617 | ) | ||||||||||
|
Deferred tax benefit/(expense)
|
(2,664,564 | ) | (8,438,476 | ) | 5,651,807 | 38,481 | ||||||||||
|
Net change in unrealized appreciation/(depreciation),
net of deferred taxes
|
4,440,941 | 14,064,129 | (9,419,679 | ) | (64,136 | ) | ||||||||||
|
Net realized and unrealized gains/(losses) on investments, net of deferred taxes
|
(4,571,901 | ) | 6,081,755 | (2,593,620 | ) | (96,689 | ) | |||||||||
|
Change in net assets resulting from operations
|
$ | (6,911,499 | ) | $ | 3,389,935 | $ | (4,005,600 | ) | $ | (101,228 | ) | |||||
|
*
|
Fund commenced operations at the close of business December 30, 2011.
|
See accompanying Notes to Financial Statements.
| 8 |
SteelPath MLP Funds Semi-Annual Report
|
STATEMENTS OF CHANGES IN NET ASSETS
SteelPath MLP Funds
|
SteelPath MLP Select 40 Fund
|
SteelPath MLP Alpha Fund
|
|||||||||||||||
|
|
For the Six Months Ended May 31, 2012 (Unaudited)
|
For the
Year Ended
November 30, 2011
|
For the Six Months Ended May 31, 2012 (Unaudited)
|
For the
Year Ended
November 30, 2011
|
||||||||||||
|
Increase (Decrease) in Net Assets
|
||||||||||||||||
|
Operations:
|
||||||||||||||||
|
Net investment loss, net of deferred taxes
|
$ | (2,339,598 | ) | $ | (2,802,108 | ) | $ | (2,691,820 | ) | $ | (3,101,216 | ) | ||||
|
Net realized gains/(losses) on investments, net of deferred taxes
|
(9,012,842 | ) | (1,359,063 | ) | (7,982,374 | ) | 1,416,368 | |||||||||
|
Net change in unrealized appreciation on investments, net of deferred taxes
|
4,440,941 | 24,191,728 | 14,064,129 | 8,895,045 | ||||||||||||
|
Change in net assets resulting from operations
|
(6,911,499 | ) | 20,030,557 | 3,389,935 | 7,210,197 | |||||||||||
|
Distributions to Shareholders:
|
||||||||||||||||
|
Distributions to shareholders from return of capital:
|
||||||||||||||||
|
Class A shares
|
(5,779,168 | ) | (5,094,158 | ) | (4,742,095 | ) | (3,992,751 | ) | ||||||||
|
Class C shares
|
(255,219 | ) | (31,821 | ) | (78,035 | ) | (3,466 | ) | ||||||||
|
Class I shares
|
(18,852,362 | ) | (22,839,711 | ) | (16,363,002 | ) | (22,703,858 | ) | ||||||||
|
Class Y shares
|
(2,429,776 | ) | (5,455,860 | ) | — | — | ||||||||||
|
Change in net assets resulting from distributions to shareholders
|
(27,316,525 | ) | (33,421,550 | ) | (21,183,132 | ) | (26,700,075 | ) | ||||||||
|
Capital Share Transactions:
|
||||||||||||||||
|
Class A
|
||||||||||||||||
|
Shares sold
|
106,538,443 | 88,843,761 | 72,344,011 | 102,233,663 | ||||||||||||
|
Shares issued for reinvestment of distributions
|
5,377,307 | 4,784,179 | 4,157,834 | 3,399,959 | ||||||||||||
|
Shares redeemed
|
(44,467,353 | ) | (21,890,675 | ) | (33,880,044 | ) | (27,710,127 | ) | ||||||||
|
Net increase
|
67,448,397 | 71,737,265 | 42,621,801 | 77,923,495 | ||||||||||||
|
Class C
|
||||||||||||||||
|
Shares sold
|
9,446,056 | 2,861,390 | 3,693,071 | 311,945 | ||||||||||||
|
Shares issued for reinvestment of distributions
|
177,367 | 16,178 | 57,248 | 1,676 | ||||||||||||
|
Shares redeemed
|
(1,638,646 | ) | (17,352 | ) | (30,329 | ) | — | |||||||||
|
Net increase
|
7,984,777 | 2,860,216 | 3,719,990 | 313,621 | ||||||||||||
|
Class I
|
||||||||||||||||
|
Shares sold
|
216,423,226 | 324,932,937 | 122,543,852 | 367,669,736 | ||||||||||||
|
Shares issued for reinvestment of distributions
|
17,214,986 | 18,189,109 | 14,539,725 | 21,187,525 | ||||||||||||
|
Shares redeemed
|
(59,164,196 | ) | (63,879,658 | ) | (85,478,199 | ) | (86,890,001 | ) | ||||||||
|
Net increase
|
174,474,016 | 279,242,388 | 51,605,378 | 301,967,260 | ||||||||||||
|
Class Y
|
||||||||||||||||
|
Shares sold
|
9,233,233 | 18,414,339 | — | — | ||||||||||||
|
Shares issued for reinvestment of distributions
|
2,199,449 | 5,286,443 | — | — | ||||||||||||
|
Shares redeemed
|
(43,220,313 | ) | (29,625,086 | ) | — | — | ||||||||||
|
Net increase/(decrease)
|
(31,787,631 | ) | (5,924,304 | ) | — | — | ||||||||||
|
Change in net assets resulting from capital share transactions
|
218,119,559 | 347,915,565 | 97,947,169 | 380,204,376 | ||||||||||||
|
Change in net assets
|
183,891,535 | 334,524,572 | 80,153,972 | 360,714,498 | ||||||||||||
|
Net Assets:
|
||||||||||||||||
|
Beginning of period
|
662,389,630 | 327,865,058 | 560,891,537 | 200,177,039 | ||||||||||||
|
End of period
|
$ | 846,281,165 | $ | 662,389,630 | $ | 641,045,509 | $ | 560,891,537 | ||||||||
|
Undistributed net investment loss, net of deferred taxes
|
$ | (5,451,340 | ) | $ | (3,335,528 | ) | $ | (6,180,082 | ) | $ | (3,634,763 | ) | ||||
See accompanying Notes to Financial Statements.
|
May 31, 2012
|
9 |
STATEMENTS OF CHANGES IN NET ASSETS (Continued)
SteelPath MLP Funds
|
SteelPath MLP Select 40 Fund
|
SteelPath MLP Alpha Fund
|
|||||||||||||||
|
|
For the Six Months Ended May 31, 2012 (Unaudited)
|
For the
Year Ended
November 30, 2011
|
For the Six Months Ended May 31, 2012 (Unaudited)
|
For the
Year Ended
November 30, 2011
|
||||||||||||
|
Transactions in Shares:
|
||||||||||||||||
|
Class A
|
||||||||||||||||
|
Shares sold
|
9,777,685 | 8,249,610 | 6,813,491 | 9,809,925 | ||||||||||||
|
Shares reinvested
|
497,201 | 450,461 | 389,775 | 325,145 | ||||||||||||
|
Shares redeemed
|
(4,101,271 | ) | (2,056,342 | ) | (3,186,786 | ) | (2,629,370 | ) | ||||||||
|
Net increase
|
6,173,615 | 6,643,729 | 4,016,480 | 7,505,700 | ||||||||||||
|
Class C
|
||||||||||||||||
|
Shares sold
|
867,919 | 273,663 | 345,393 | 30,209 | ||||||||||||
|
Shares reinvested
|
16,419 | 1,526 | 5,380 | 161 | ||||||||||||
|
Shares redeemed
|
(150,345 | ) | (1,647 | ) | (3,005 | ) | — | |||||||||
|
Net Increase
|
733,993 | 273,542 | 347,768 | 30,370 | ||||||||||||
|
Class I
|
||||||||||||||||
|
Shares sold
|
19,809,515 | 29,909,699 | 11,408,080 | 34,004,107 | ||||||||||||
|
Shares reinvested
|
1,581,141 | 1,700,149 | 1,354,361 | 2,017,337 | ||||||||||||
|
Shares redeemed
|
(5,442,395 | ) | (6,034,881 | ) | (7,956,262 | ) | (8,374,618 | ) | ||||||||
|
Net increase
|
15,948,261 | 25,574,967 | 4,806,179 | 27,646,826 | ||||||||||||
|
Class Y
|
||||||||||||||||
|
Shares sold
|
840,117 | 1,711,481 | — | — | ||||||||||||
|
Shares reinvested
|
201,343 | 492,370 | — | — | ||||||||||||
|
Shares redeemed
|
(3,947,122 | ) | (2,711,194 | ) | — | — | ||||||||||
|
Net increase/(decrease)
|
(2,905,662 | ) | (507,343 | ) | — | — | ||||||||||
|
Net increase from transactions in shares
|
19,950,207 | 31,984,895 | 9,170,427 | 35,182,896 | ||||||||||||
See accompanying Notes to Financial Statements.
| 10 |
SteelPath MLP Funds Semi-Annual Report
|
STATEMENTS OF CHANGES IN NET ASSETS (Continued)
SteelPath MLP Funds
|
SteelPath MLP Income Fund
|
SteelPath MLP Alpha Plus Fund
|
|||||||||||||||
|
|
For the Six Months Ended May 31, 2012 (Unaudited)
|
For the
Year Ended
November 30, 2011
|
For the
Period Ended May 31, 2012 (Unaudited)*
|
For the
Year Ended
November 30, 2011
|
||||||||||||
|
Increase (Decrease) in Net Assets
|
||||||||||||||||
|
Operations:
|
||||||||||||||||
|
Net investment loss, net of deferred taxes
|
$ | (1,411,980 | ) | $ | (1,643,402 | ) | $ | (4,539 | ) | $ | — | |||||
|
Net realized gains/(losses) on investments, net of deferred taxes
|
6,826,059 | (514,420 | ) | (32,553 | ) | — | ||||||||||
|
Net change in unrealized appreciation on investments, net of deferred taxes
|
(9,419,679 | ) | 786,203 | (64,136 | ) | — | ||||||||||
|
Change in net assets resulting from operations
|
(4,005,600 | ) | (1,371,619 | ) | (101,228 | ) | — | |||||||||
|
Distributions to Shareholders:
|
||||||||||||||||
|
Distributions to shareholders from return of capital:
|
||||||||||||||||
|
Class A shares
|
(7,358,431 | ) | (9,881,870 | ) | (3,843 | ) | — | |||||||||
|
Class C shares
|
(262,060 | ) | (39,741 | ) | — | — | ||||||||||
|
Class I shares
|
(3,378,091 | ) | (6,593,570 | ) | (25,401 | ) | — | |||||||||
|
Class Y shares
|
— | — | — | — | ||||||||||||
|
Change in net assets resulting from distributions to shareholders
|
(10,998,582 | ) | (16,515,181 | ) | (29,244 | ) | — | |||||||||
|
Capital Share Transactions:
|
||||||||||||||||
|
Class A
|
||||||||||||||||
|
Shares sold
|
138,340,468 | 169,059,992 | 243,642 | — | ||||||||||||
|
Shares issued for reinvestment of distributions
|
5,216,812 | 7,320,977 | 2,371 | — | ||||||||||||
|
Shares redeemed
|
(54,002,720 | ) | (51,378,677 | ) | (48,808 | ) | — | |||||||||
|
Net increase
|
89,554,560 | 125,002,292 | 197,205 | — | ||||||||||||
|
Class C
|
||||||||||||||||
|
Shares sold
|
12,008,260 | 2,808,325 | 38,000 | — | ||||||||||||
|
Shares issued for reinvestment of distributions
|
169,658 | 27,791 | — | — | ||||||||||||
|
Shares redeemed
|
(142,868 | ) | — | — | — | |||||||||||
|
Net increase
|
12,035,050 | 2,836,116 | 38,000 | — | ||||||||||||
|
Class I
|
||||||||||||||||
|
Shares sold
|
64,050,930 | 54,673,813 | 1,646,502 | — | ||||||||||||
|
Shares issued for reinvestment of distributions
|
3,008,116 | 5,490,034 | 25,401 | — | ||||||||||||
|
Shares redeemed
|
(31,366,938 | ) | (37,558,617 | ) | (892,773 | ) | — | |||||||||
|
Net increase
|
35,692,108 | 22,605,230 | 779,130 | — | ||||||||||||
|
Class Y
|
||||||||||||||||
|
Shares sold
|
— | — | — | — | ||||||||||||
|
Shares issued for reinvestment of distributions
|
— | — | — | — | ||||||||||||
|
Shares redeemed
|
— | — | — | — | ||||||||||||
|
Net increase/(decrease)
|
— | — | — | — | ||||||||||||
|
Change in net assets resulting from capital share transactions
|
137,281,718 | 150,443,638 | 1,014,335 | — | ||||||||||||
|
Change in net assets
|
122,277,536 | 132,556,838 | 883,863 | — | ||||||||||||
|
Net Assets:
|
||||||||||||||||
|
Beginning of period
|
259,388,765 | 126,831,927 | — | — | ||||||||||||
|
End of period
|
$ | 381,666,301 | $ | 259,388,765 | $ | 883,863 | $ | — | ||||||||
|
Undistributed net investment loss, net of deferred taxes
|
$ | (3,254,157 | ) | $ | (1,936,598 | ) | $ | (4,539 | ) | $ | — | |||||
|
*
|
Fund commenced operations at the close of business December 30, 2011.
|
See accompanying Notes to Financial Statements.
|
May 31, 2012
|
11 |
STATEMENTS OF CHANGES IN NET ASSETS (Continued)
SteelPath MLP Funds
|
SteelPath MLP Income Fund
|
SteelPath MLP Alpha Plus Fund
|
|||||||||||||||
|
|
For the Six Months Ended May 31, 2012 (Unaudited)
|
For the
Year Ended
November 30, 2011
|
For the
Period Ended May 31, 2012 (Unaudited)*
|
For the
Year Ended
November 30, 2011
|
||||||||||||
|
Transactions in Shares:
|
||||||||||||||||
|
Class A
|
||||||||||||||||
|
Shares sold
|
13,341,130 | 15,824,526 | 24,187 | — | ||||||||||||
|
Shares reinvested
|
500,265 | 699,339 | 242 | — | ||||||||||||
|
Shares redeemed
|
(5,225,109 | ) | (4,948,478 | ) | (5,122 | ) | — | |||||||||
|
Net increase
|
8,616,286 | 11,575,387 | 19,307 | — | ||||||||||||
|
Class C
|
||||||||||||||||
|
Shares sold
|
1,159,695 | 276,187 | 4,007 | — | ||||||||||||
|
Shares reinvested
|
16,324 | 2,751 | — | — | ||||||||||||
|
Shares redeemed
|
(13,672 | ) | — | — | — | |||||||||||
|
Net Increase
|
1,162,347 | 278,938 | 4,007 | — | ||||||||||||
|
Class I
|
||||||||||||||||
|
Shares sold
|
6,179,236 | 5,071,966 | 162,115 | — | ||||||||||||
|
Shares reinvested
|
287,295 | 518,056 | 2,589 | — | ||||||||||||
|
Shares redeemed
|
(2,998,419 | ) | (3,591,120 | ) | (93,179 | ) | — | |||||||||
|
Net increase
|
3,468,112 | 1,998,902 | 71,525 | — | ||||||||||||
|
Net increase from transactions in shares
|
13,246,745 | 13,853,227 | 94,839 | — | ||||||||||||
|
*
|
Fund commenced operations at the close of business December 30, 2011.
|
See accompanying Notes to Financial Statements.
| 12 |
SteelPath MLP Funds Semi-Annual Report
|
STATEMENT OF CASH FLOWS
Period Ended May 31, 2012 (Unaudited)
SteelPath MLP Alpha Plus Fund
|
Cash flows from operating activities
|
||||
|
Net decrease in net assets resulting from operations
|
$ | (101,228 | ) | |
|
Adjustments to reconcile net decrease in net assets resulting from operations to net cash used in operating activities:
|
||||
|
Purchases of long-term portfolio investments
|
(2,558,629 | ) | ||
|
Sales of long-term portfolio investments
|
1,355,627 | |||
|
Return of capital on distributions
|
34,394 | |||
|
Increase in rec investments sold LT
|
(53,058 | ) | ||
|
Increase in due from advisor
|
(63,191 | ) | ||
|
Increase in prepaid (expenses)
|
(48,698 | ) | ||
|
Increase in taxes payable
|
(60,736 | ) | ||
|
Decrease in pay invest purch LT
|
12,263 | |||
|
Decrease in other liabilities
|
51,515 | |||
|
Decrease in 12b-1 fees payable Class A
|
109 | |||
|
Decrease in 12b-1 fees payable Class C
|
4 | |||
|
Decrease in interest expense payable
|
436 | |||
|
Net realized loss on investments
|
52,085 | |||
|
Net change in accumulated unrealized depreciation on investments
|
102,617 | |||
|
Net cash used in operating activities
|
(1,276,490 | ) | ||
|
Cash flows from financing activities
|
||||
|
Proceeds from sale of shares
|
1,903,144 | |||
|
Payment on shares redeemed
|
(941,581 | ) | ||
|
Dividends paid to shareholders, net of reinvestments
|
(1,471 | ) | ||
|
Net cash provided by loan payable
|
264,050 | |||
|
Net cash provided by financing activities
|
1,224,142 | |||
|
Net change in cash
|
(52,348 | ) | ||
|
Cash at beginning of period
|
— | |||
|
Cash at end of period
|
$ | (52,348 | ) | |
See accompanying Notes to Financial Statements.
|
May 31, 2012
|
13 |
FINANCIAL HIGHLIGHTS
Selected data for a share outstanding throughout the period indicated.
SteelPath MLP Funds
|
Income From Investment Operations:
|
Distributions From:
|
|||||||||||||||||||||||||||||||||||
|
Net Asset Value, Beginning of Year/Period
|
Net investment gain/(loss)(1)
|
Return of Capital (1)
|
Net Realized and Unrealized Gains (losses)(3)
|
Increase (Decrease) from Investment Operations
|
Return of Capital
|
Total Distribution
|
Net Asset Value, End of Year
|
Total Return (2)
|
||||||||||||||||||||||||||||
|
SteelPath Select 40 Fund
|
||||||||||||||||||||||||||||||||||||
|
Class A Shares
|
||||||||||||||||||||||||||||||||||||
|
For the six months ended 5/31/2012
|
$ | 10.56 | (0.04 | ) | 0.22 | (0.18 | ) | — | (0.35 | ) | (0.35 | ) | $ | 10.21 | (0.43 | %)(11) | ||||||||||||||||||||
|
For the year ended 11/30/2011
|
$ | 10.74 | (0.07 | ) | 0.44 | 0.14 | 0.51 | (0.69 | ) | (0.69 | ) | $ | 10.56 | 4.85 | % | |||||||||||||||||||||
|
For the period from 3/31/2010 - 11/30/2010 (6)
|
$ | 10.00 | (0.03 | ) | 0.30 | 0.96 | 1.23 | (0.49 | ) | (0.49 | ) | $ | 10.74 | 12.63 | %(9)(11) | |||||||||||||||||||||
|
Class C Shares
|
||||||||||||||||||||||||||||||||||||
|
For the six months ended 5/31/2012
|
$ | 10.58 | (0.06 | ) | 0.24 | (0.19 | ) | (0.01 | ) | (0.35 | ) | (0.35 | ) | $ | 10.22 | (0.62 | %)(11) | |||||||||||||||||||
|
For the period ended 11/30/2011 (7)
|
$ | 10.90 | (0.05 | ) | 0.22 | (0.14 | ) | 0.03 | (0.35 | ) | (0.35 | ) | $ | 10.58 | 0.33 | %(11) | ||||||||||||||||||||
|
Class I Shares
|
||||||||||||||||||||||||||||||||||||
|
For the six months ended 5/31/2012
|
$ | 10.63 | (0.03 | ) | 0.22 | (0.18 | ) | 0.01 | (0.35 | ) | (0.35 | ) | $ | 10.29 | (0.33 | %)(11) | ||||||||||||||||||||
|
For the year ended 11/30/2011
|
$ | 10.78 | (0.06 | ) | 0.43 | 0.17 | 0.54 | (0.69 | ) | (0.69 | ) | $ | 10.63 | 5.12 | % | |||||||||||||||||||||
|
For the period from 3/31/2010 - 11/30/2010 (6)
|
$ | 10.00 | (0.02 | ) | 0.30 | 0.99 | 1.27 | (0.49 | ) | (0.49 | ) | $ | 10.78 | 13.04 | %(9)(11) | |||||||||||||||||||||
|
Class Y Shares
|
||||||||||||||||||||||||||||||||||||
|
For the six months ended 5/31/2012
|
$ | 10.62 | (0.03 | ) | 0.20 | (0.15 | ) | 0.02 | (0.35 | ) | (0.35 | ) | $ | 10.29 | (0.23 | %)(11) | ||||||||||||||||||||
|
For the year ended 11/30/2011
|
$ | 10.78 | (0.06 | ) | 0.41 | 0.18 | 0.53 | (0.69 | ) | (0.69 | ) | $ | 10.62 | 5.02 | % | |||||||||||||||||||||
|
For the period from 3/31/2010 - 11/30/2010 (6)
|
$ | 10.00 | (0.02 | ) | 0.27 | 1.02 | 1.27 | (0.49 | ) | (0.49 | ) | $ | 10.78 | 13.04 | %(9)(11) | |||||||||||||||||||||
|
SteelPath Alpha Fund
|
||||||||||||||||||||||||||||||||||||
|
Class A Shares
|
||||||||||||||||||||||||||||||||||||
|
For the six months ended 5/31/2012
|
$ | 10.38 | (0.05 | ) | 0.20 | (0.07 | ) | 0.08 | (0.34 | ) | (0.34 | ) | $ | 10.12 | 0.67 | %(11) | ||||||||||||||||||||
|
For the year ended 11/30/2011
|
$ | 10.71 | (0.10 | ) | 0.43 | 0.02 | 0.35 | (0.68 | ) | (0.68 | ) | $ | 10.38 | 3.32 | % | |||||||||||||||||||||
|
For the period from 3/31/2010 - 11/30/2010 (6)
|
$ | 10.00 | (0.05 | ) | 0.28 | 0.97 | 1.20 | (0.49 | ) | (0.49 | ) | $ | 10.71 | 12.24 | %(9)(11) | |||||||||||||||||||||
|
Class C Shares
|
||||||||||||||||||||||||||||||||||||
|
For the six months ended 5/31/2012
|
$ | 10.40 | (0.08 | ) | 0.22 | (0.09 | ) | 0.05 | (0.34 | ) | (0.34 | ) | $ | 10.11 | 0.38 | %(11) | ||||||||||||||||||||
|
For the period ended 11/30/2011 (8)
|
$ | 10.05 | (0.04 | ) | 0.14 | 0.42 | 0.52 | (0.17 | ) | (0.17 | ) | $ | 10.40 | 5.19 | %(11) | |||||||||||||||||||||
|
Class I Shares
|
||||||||||||||||||||||||||||||||||||
|
For the six months ended 5/31/2012
|
$ | 10.43 | (0.04 | ) | 0.19 | (0.05 | ) | 0.10 | (0.34 | ) | (0.34 | ) | $ | 10.19 | 0.86 | %(11) | ||||||||||||||||||||
|
For the year ended 11/30/2011
|
$ | 10.73 | (0.08 | ) | 0.42 | 0.04 | 0.38 | (0.68 | ) | (0.68 | ) | $ | 10.43 | 3.60 | % | |||||||||||||||||||||
|
For the period from 3/31/2010 - 11/30/2010 (6)
|
$ | 10.00 | (0.04 | ) | 0.27 | 0.99 | 1.22 | (0.49 | ) | (0.49 | ) | $ | 10.73 | 12.44 | %(9)(11) | |||||||||||||||||||||
|
(1)
|
Calculated based on average shares outstanding during the period.
|
|
(2)
|
Total return in the above table represents the rate that the investor would have earned or lost on an investment in the Fund, assuming reinvestment of Fund distributions.
|
|
(3)
|
Realized and unrealized gains and losses per share in this caption are balancing amounts necessary to reconcile the change in net asset value per share in the period. It does not agree to the aggregate gains and losses in the Statement of Operations due to the fluctuation in share transactions this period.
|
|
(4)
|
Deferred tax expense/benefit estimate for the ratio calculation is derived from the net investment income/loss, and realized and unrealized gains/losses.
|
|
(5)
|
Deferred tax benefit/(expense) for the ratio calculation is derived from net investment income/loss only.
|
|
(6)
|
The net asset value for the beginning of the period close of business March 31, 2010 (Commencement of Operations) though November 30, 2010 represents the initial contribution per share of $10.
|
|
(7)
|
Class C Shares commenced operations at the close of business July 14, 2011.
|
|
(8)
|
Class C Shares commenced operations at the close of business August 25, 2011.
|
|
(9)
|
Represents performance beginning on the first day of security trading (close of business March 31, 2010).
|
|
(10)
|
Annualized
|
|
(11)
|
Not annualized
|
See accompanying Notes to Financial Statements.
| 14 |
SteelPath MLP Funds Semi-Annual Report
|
FINANCIAL HIGHLIGHTS
Selected data for a share outstanding throughout the period indicated.
SteelPath MLP Funds (Continued)
|
Ratio of Expenses to Average Net Assets:
|
Ratio of Investment Loss to Average Net Assets:
|
|||||||||||||||||||||||||||||||||||||||||||||
|
Net Assets, End of Year (000’s)
|
Before
Waivers and Income Tax Expense
|
Expense Waiver
|
Net of Waivers and Before Income Tax Expense
|
Deferred Tax (Benefit)/
Expense(4)
|
Total Expenses
|
Before Waivers and Income Tax Expense
|
Expense Waiver
|
Net of Waivers and Before Income Tax Expense
|
Deferred Tax Benefit(5)
|
Net Investment Loss
|
Portfolio turnover rate
|
|||||||||||||||||||||||||||||||||||
| $ | 174,216 | 1.13 | %(10) | (0.03 | %)(10) | 1.10 | %(10) | (1.08 | %)(10) | 0.02 | %(10) | (1.13 | %)(10) | (0.03 | %)(10) | (1.10 | %)(10) | 0.41 | %(10) | (0.69 | %)(10) | 7 | %(11) | |||||||||||||||||||||||
| $ | 114,930 | 1.23 | % | (0.13 | %) | 1.10 | % | 1.94 | % | 3.04 | % | (1.23 | %) | (0.13 | %) | (1.10 | %) | 0.41 | % | (0.69 | %) | 10 | % | |||||||||||||||||||||||
| $ | 45,575 | 1.45 | %(10) | (0.35 | %)(10) | 1.10 | %(10) | 14.65 | %(10) | 15.75 | %(10) | (1.08 | %)(10) | (0.35 | %)(10) | (0.73 | %)(10) | 0.29 | %(10) | (0.44 | %)(10) | 15 | %(11) | |||||||||||||||||||||||
| $ | 10,297 | 2.05 | %(10) | (0.20 | %)(10) | 1.85 | %(10) | (1.36 | %)(10) | 0.49 | %(10) | (2.04 | %)(10) | (0.20 | %)(10) | (1.84 | %)(10) | 0.69 | %(10) | (1.15 | %)(10) | 7 | %(11) | |||||||||||||||||||||||
| $ | 2,895 | 4.29 | %(10) | (2.44 | %)(10) | 1.85 | %(10) | 0.82 | %(10) | 2.67 | %(10) | (4.29 | %)(10) | (2.44 | %)(10) | (1.85 | %)(10) | 0.69 | %(10) | (1.16 | %)(10) | 10 | %(11) | |||||||||||||||||||||||
| $ | 605,222 | 0.87 | %(10) | (0.02 | %)(10) | 0.85 | %(10) | (0.98 | %)(10) | (0.13 | %)(10) | (0.87 | %)(10) | (0.02 | %)(10) | (0.85 | %)(10) | 0.32 | %(10) | (0.53 | %)(10) | 7 | %(11) | |||||||||||||||||||||||
| $ | 455,321 | 0.97 | % | (0.12 | %) | 0.85 | % | 2.18 | % | 3.03 | % | (0.97 | %) | (0.12 | %) | (0.85 | %) | 0.31 | % | (0.54 | %) | 10 | % | |||||||||||||||||||||||
| $ | 186,270 | 1.52 | %(10) | (0.71 | %)(10) | 0.81 | %(10) | 14.52 | %(10) | 15.33 | %(10) | (1.19 | %)(10) | (0.71 | %)(10) | (0.48 | %)(10) | 0.19 | %(10) | (0.29 | %)(10) | 15 | %(11) | |||||||||||||||||||||||
| $ | 56,547 | 0.89 | %(10) | (0.04 | %)(10) | 0.85 | %(10) | (0.98 | %)(10) | (0.13 | %)(10) | (0.89 | %)(10) | (0.04 | %)(10) | (0.85 | %)(10) | 0.32 | %(10) | (0.53 | %)(10) | 7 | %(11) | |||||||||||||||||||||||
| $ | 89,244 | 0.97 | % | (0.12 | %) | 0.85 | % | 1.88 | % | 2.73 | % | (0.96 | %) | (0.12 | %) | (0.84 | %) | 0.31 | % | (0.53 | %) | 10 | % | |||||||||||||||||||||||
| $ | 96,020 | 1.11 | %(10) | (0.26 | %)(10) | 0.85 | %(10) | 15.06 | %(10) | 15.91 | %(10) | (0.76 | %)(10) | (0.26 | %)(10) | (0.50 | %)(10) | 0.20 | %(10) | (0.30 | %)(10) | 15 | %(11) | |||||||||||||||||||||||
| $ | 146,456 | 1.56 | %(10) | (0.06 | %)(10) | 1.50 | %(10) | 0.55 | %(10) | 2.05 | %(10) | (1.55 | %)(10) | (0.06 | %)(10) | (1.49 | %)(10) | 0.56 | %(10) | (0.93 | %)(10) | 14 | %(11) | |||||||||||||||||||||||
| $ | 108,422 | 1.67 | % | (0.17 | %) | 1.50 | % | 1.68 | % | 3.18 | % | (1.67 | %) | (0.17 | %) | (1.50 | %) | 0.56 | % | (0.94 | %) | 14 | % | |||||||||||||||||||||||
| $ | 31,525 | 1.94 | %(10) | (0.44 | %)(10) | 1.50 | %(10) | 12.93 | %(10) | 14.43 | %(10) | (1.59 | %)(10) | (0.44 | %)(10) | (1.15 | %)(10) | 0.46 | %(10) | (0.69 | %)(10) | 7 | %(11) | |||||||||||||||||||||||
| $ | 3,823 | 2.86 | %(10) | (0.61 | %)(10) | 2.25 | %(10) | 0.27 | %(10) | 2.52 | %(10) | (2.85 | %)(10) | (0.61 | %)(10) | (2.24 | %)(10) | 0.84 | %(10) | (1.40 | %)(10) | 14 | %(11) | |||||||||||||||||||||||
| $ | 316 | 22.80 | %(10) | (20.55 | %)(10) | 2.25 | %(10) | 12.37 | %(10) | 14.62 | %(10) | (22.80 | %)(10) | (20.55 | %)(10) | (2.25 | %)(10) | 0.84 | %(10) | (1.41 | %)(10) | 14 | %(11) | |||||||||||||||||||||||
| $ | 490,767 | 1.28 | %(10) | (0.03 | %)(10) | 1.25 | %(10) | 0.64 | %(10) | 1.89 | %(10) | (1.28 | %)(10) | (0.03 | %)(10) | (1.25 | %)(10) | 0.47 | %(10) | (0.78 | %)(10) | 14 | %(11) | |||||||||||||||||||||||
| $ | 452,154 | 1.37 | % | (0.12 | %) | 1.25 | % | 0.75 | % | 2.00 | % | (1.37 | %) | (0.12 | %) | (1.25 | %) | 0.46 | % | (0.79 | %) | 14 | % | |||||||||||||||||||||||
| $ | 168,652 | 1.54 | %(10) | (0.29 | %)(10) | 1.25 | %(10) | 13.14 | %(10) | 14.39 | %(10) | (1.20 | %)(10) | (0.29 | %)(10) | (0.91 | %)(10) | 0.36 | %(10) | (0.55 | %)(10) | 7 | %(11) | |||||||||||||||||||||||
See accompanying Notes to Financial Statements.
|
May 31, 2012
|
15 |
FINANCIAL HIGHLIGHTS
Selected data for a share outstanding throughout the period indicated.
SteelPath MLP Funds
|
Income From Investment Operations:
|
Distributions From:
|
|||||||||||||||||||||||||||||||||||
|
Net Asset Value, Beginning of Year/Period
|
Net investment gain/(loss)(1)
|
Return of Capital(1)
|
Net Realized and Unrealized Gains (losses)(3)
|
Increase (Decrease) from Investment Operations
|
Return of Capital
|
Total Distributions
|
Net Asset Value, End of Year
|
Total Return(2)
|
||||||||||||||||||||||||||||
|
SteelPath Income Fund
|
||||||||||||||||||||||||||||||||||||
|
Class A Shares
|
||||||||||||||||||||||||||||||||||||
|
For the six months ended 5/31/2012
|
$ | 10.14 | (0.04 | ) | 0.24 | (0.20 | ) | — | (0.32 | ) | (0.32 | ) | $ | 9.82 | (0.12 | %)(13) | ||||||||||||||||||||
|
For the year ended 11/30/2011
|
$ | 10.83 | (0.09 | ) | 0.47 | (0.24 | ) | 0.14 | (0.83 | ) | (0.83 | ) | $ | 10.14 | 1.27 | % | ||||||||||||||||||||
|
For the period from 3/31/2010 - 11/30/2010 (6)
|
$ | 10.00 | (0.04 | ) | 0.31 | 1.00 | 1.27 | (0.44 | ) | (0.44 | ) | $ | 10.83 | 13.10 | %(8)(13) | |||||||||||||||||||||
|
Class C Shares
|
||||||||||||||||||||||||||||||||||||
|
For the six months ended 5/31/2012
|
$ | 10.13 | (0.07 | ) | 0.26 | (0.22 | ) | (0.03 | ) | (0.32 | ) | (0.32 | ) | $ | 9.78 | (0.42 | %)(13) | |||||||||||||||||||
|
For the period ended 11/30/2011 (7)
|
$ | 10.66 | (0.06 | ) | 0.26 | (0.34 | ) | (0.14 | ) | (0.39 | ) | (0.39 | ) | $ | 10.13 | (1.31 | %)(10)(13) | |||||||||||||||||||
|
Class I Shares
|
||||||||||||||||||||||||||||||||||||
|
For the six months ended 5/31/2012
|
$ | 10.17 | (0.04 | ) | 0.24 | (0.18 | ) | 0.02 | (0.32 | ) | (0.32 | ) | $ | 9.87 | 0.80 | %(13) | ||||||||||||||||||||
|
For the year ended 11/30/2011
|
$ | 10.84 | (0.08 | ) | 0.47 | (0.23 | ) | 0.16 | (0.83 | ) | (0.83 | ) | $ | 10.17 | 1.46 | % | ||||||||||||||||||||
|
For the period from 3/31/2010 - 11/30/2010 (6)
|
$ | 10.00 | (0.03 | ) | 0.29 | 1.02 | 1.28 | (0.44 | ) | (0.44 | ) | $ | 10.84 | 13.20 | %(8)(13) | |||||||||||||||||||||
|
SteelPath Alpha Plus Fund
|
||||||||||||||||||||||||||||||||||||
|
Class A Shares
|
||||||||||||||||||||||||||||||||||||
|
For the period from 2/7/2012 - 5/31/2012 (9)
|
$ | 10.14 | (0.04 | ) | 0.18 | (0.65 | ) | (0.51 | ) | (0.32 | ) | (0.32 | ) | $ | 9.31 | (5.16 | %)(13) | |||||||||||||||||||
|
Class C Shares
|
||||||||||||||||||||||||||||||||||||
|
For the period from 5/23/2012 - 5/31/2012 (10)
|
$ | 9.45 | — | 0.01 | (0.14 | ) | (0.13 | ) | — | — | $ | 9.32 | (1.38 | %)(13) | ||||||||||||||||||||||
|
Class I Shares
|
||||||||||||||||||||||||||||||||||||
|
For the period from 1/3/2012 - 5/31/2012 (11)
|
$ | 10.00 | (0.05 | ) | 0.21 | (0.52 | ) | (0.36 | ) | (0.32 | ) | (0.32 | ) | $ | 9.32 | (3.73 | %)(13) | |||||||||||||||||||
|
(1)
|
Calculated based on average shares outstanding during the period.
|
|
(2)
|
Total return in the above table represents the rate that the investor would have earned or lost on an investment in the Fund, assuming reinvestment of Fund distributions.
|
|
(3)
|
Realized and unrealized gains and losses per share in this caption are balancing amounts necessary to reconcile the change in net asset value per share in the period. It does not agree to the aggregate gains and losses in the Statement of Operations due to the fluctuation in share transactions this period.
|
|
(4)
|
Deferred tax expense/benefit estimate for the ratio calculation is derived from the net investment income/loss, and realized and unrealized gains/losses.
|
|
(5)
|
Deferred tax benefit/(expense) for the ratio calculation is derived from net investment income/loss only.
|
|
(6)
|
The net asset value for the beginning of the period close of business March 31, 2010 (Commencement of Operations) though November 30, 2010 repreents the initial contribution per share of $10.
|
|
(7)
|
Class C Shares commenced operations at the close of business June 10, 2011.
|
|
(8)
|
Represents performance beginning on the first day of security trading (close of business March 31, 2010).
|
|
(9)
|
Class A Shares commenced operations at the close of business February 6, 2012.
|
|
(10)
|
Class C Shares commenced operations at the close of business May 22, 2012.
|
|
(11)
|
The net asset value for the beginning of the period close of business December 30, 2011 (Commencement of Operations) though May 31, 2012 represents the initial contribution per share of $10.
|
|
(12)
|
Annualized
|
|
(13)
|
Not annualized
|
See accompanying Notes to Financial Statements.
| 16 |
SteelPath MLP Funds Semi-Annual Report
|
SteelPath MLP Funds (Continued)
|
Ratio of Expenses to Average Net Assets:
|
Ratio of Investment Loss to Average Net Assets:
|
|||||||||||||||||||||||||||||||||||||||||||||
|
Net Assets, End of Year (000’s)
|
Before Waivers and Income Tax Expense
|
Expense Waiver
|
Net of Waivers and Before Income Tax Expense
|
Deferred
Tax (Benefit)/
Expense(4)
|
Total Expenses
|
Before Waivers and Income Tax Expense
|
Expense Waiver
|
Net of Waivers and Before Income Tax Expense
|
Deferred Tax Benefit(5)
|
Net Investment Loss
|
Portfolio turnover rate
|
|||||||||||||||||||||||||||||||||||
| $ | 251,332 | 1.49 | %(12) | (0.14 | %)(12) | 1.35 | %(12) | (1.40 | %)(12) | (0.05 | %)(12) | (1.49 | %)(12) | (0.14 | %)(12) | (1.35 | %)(12) | 0.51 | %(12) | (0.84 | %)(12) | 29 | %(13) | |||||||||||||||||||||||
| $ | 172,056 | 1.62 | % | (0.27 | %) | 1.35 | % | (0.77 | %) | 0.58 | % | (1.61 | %) | (0.27 | %) | (1.34 | %) | 0.50 | % | (0.84 | %) | 24 | % | |||||||||||||||||||||||
| $ | 58,464 | 1.93 | %(12) | (0.58 | %)(12) | 1.35 | %(12) | 17.05 | %(12) | 18.40 | %(12) | (1.54 | %)(12) | (0.58 | %)(12) | (0.96 | %)(12) | 0.39 | %(12) | (0.57 | %)(12) | 15 | %(13) | |||||||||||||||||||||||
| $ | 14,096 | 2.38 | %(12) | (0.28 | %)(12) | 2.10 | %(12) | (1.68 | %)(12) | 0.42 | %(12) | (2.38 | %)(12) | (0.28 | %)(12) | (2.10 | %)(12) | 0.79 | %(12) | (1.31 | %)(12) | 29 | %(13) | |||||||||||||||||||||||
| $ | 2,826 | 4.44 | %(12) | (2.34 | %)(12) | 2.10 | %(12) | (1.31 | %)(12) | 0.79 | %(12) | (4.44 | %)(12) | (2.34 | %)(12) | (2.10 | %)(12) | 0.79 | %(12) | (1.31 | %)(12) | 24 | %(13) | |||||||||||||||||||||||
| $ | 116,238 | 1.25 | %(12) | (0.15 | %)(12) | 1.10 | %(12) | (1.30 | %)(12) | (0.20 | %)(12) | (1.25 | %)(12) | (0.15 | %)(12) | (1.10 | %)(12) | 0.41 | %(12) | (0.69 | %)(12) | 29 | %(13) | |||||||||||||||||||||||
| $ | 84,506 | 1.37 | % | (0.27 | %) | 1.10 | % | (0.65 | %) | 0.45 | % | (1.37 | %) | (0.27 | %) | (1.10 | %) | 0.41 | % | (0.69 | %) | 24 | % | |||||||||||||||||||||||
| $ | 68,368 | 1.62 | %(12) | (0.52 | %)(12) | 1.10 | %(12) | 17.22 | %(12) | 18.32 | %(12) | (1.24 | %)(12) | (0.52 | %)(12) | (0.72 | %)(12) | 0.29 | %(12) | (0.43 | %)(12) | 15 | %(13) | |||||||||||||||||||||||
| $ | 180 | 33.11 | %(12) | (31.11 | %)(12) | 2.00 | %(12) | (15.17 | %)(12) | (13.17 | %)(12) | (33.11 | %)(12) | (31.11 | %)(12) | (2.00 | %)(12) | 0.75 | %(12) | (1.25 | %)(12) | 109 | %(13) | |||||||||||||||||||||||
| $ | 37 | 106.51 | %(12) | (103.76 | %)(12) | 2.75 | %(12) | 2,446.26 | %(12) | 2,449.01 | %(12) | (106.50 | %)(12) | (103.76 | %)(12) | (2.74 | %)(12) | 1.03 | %(12) | (1.71 | %)(12) | 109 | %(13) | |||||||||||||||||||||||
| $ | 667 | 37.77 | %(12) | (36.02 | %)(12) | 1.75 | %(12) | (17.93 | %)(12) | (16.18 | %)(12) | (37.77 | %)(12) | (36.02 | %)(12) | (1.75 | %)(12) | 0.66 | %(12) | (1.09 | %)(12) | 109 | %(13) | |||||||||||||||||||||||
See accompanying Notes to Financial Statements.
|
May 31, 2012
|
17 |
NOTES TO THE FINANCIAL STATEMENTS
May 31, 2012 (Unaudited)
1. Organization
SteelPath MLP Funds Trust (the “Trust”) was organized as a statutory trust under the laws of the State of Delaware on December 1, 2009. The Trust is registered under the Investment Company Act of 1940, as amended (the “1940 Act”), as an open-end management investment company. The Trust is authorized to issue an unlimited number of shares, which are units of beneficial interest with a par value of $0.001. As of May 31, 2012, the Trust offered shares of five series, each of which has different and distinct investment objectives and policies. The financial statements for four of the five series are included in this report. They are the SteelPath MLP Select 40 Fund (the “Select 40 Fund”), SteelPath MLP Alpha Fund (the “Alpha Fund”), SteelPath MLP Income Fund (the “Income Fund”), and the SteelPath MLP Alpha Plus Fund (the “Alpha Plus Fund”), individually a “Fund,” collectively the “Funds”). The financial statements for the SteelPath MLP and Infrastructure Debt Fund are included in a separate report. The Select 40 Fund, Income Fund and the Alpha Fund commenced operations at the close of business March 31, 2010, the Alpha Plus Fund commenced operations at the close of business December 30, 2011. The Funds offer multiple classes of shares which generally differ in their respective sales charges and distribution and service fees. All shareholders bear the common expenses of the Funds. Dividends are declared separately for each class. Income, non-class specific expenses and realized and unrealized gains and losses are allocated daily to each class of shares based on the value of total shares outstanding of each class, without distinction between share classes. Expenses attributable to a particular class of shares, such as distribution fees, are allocated directly to that class.
Class A Shares of the Funds are subject to an initial sales charge imposed at the time of purchase, in accordance with its prospectus. The maximum sales charge is 5.75% of the offering price or 6.10% of the net asset value. Class A Shares pay an annual Rule 12b-1 fee of 0.25%. Class C Shares are not subject to an initial sales charge, but instead are subject to a contingent deferred sales charge of 1% if redeemed within one year of purchase. Class C Shares pay an annual Rule 12b-1 fee of 1.00%. Class I Shares and Class Y Shares are not subject to either an initial sales charge, or a contingent deferred sales charge and do not pay a 12b-1 fee.
The investment objective of the Select 40 Fund is to provide investors long-term capital appreciation and attractive levels of current income through diversified exposure to the energy infrastructure Master Limited Partnership (“MLP’’) asset class. The investment objective of the Alpha Fund is to provide investors with a concentrated portfolio of energy infrastructure MLP’s which SteelPath Fund Advisors, LLC believes will provide substantial long-term capital appreciation through distribution growth and an attractive level of current income. The investment objective of the Income Fund is to generate a high level of inflation-protected current income, primarily through investments in the larger, more liquid energy MLP’s. The investment objective of the Alpha Plus Fund is to provide investors with capital appreciation and, as a secondary objective, current income.
Each Fund, except for Select 40 Fund, is non-diversified, as that term is defined in the 1940 Act.
2. Accounting Policies:
The preparation of the financial statements in accordance with accounting principles generally accepted in the United States (U.S. GAAP) requires management to make estimates and assumptions that affect the reported amounts of assets and liabilities and disclosure of contingent assets and liabilities at the date of the financial statements, as well as reported amounts of increases and decreases in net assets from operations during the reporting period. Actual results could differ from these estimates. In the normal course of business, the Funds have entered into contracts that contain a variety of representations which provide general indemnifications. The Funds’ maximum exposure under these arrangements is unknown as this would involve future claims that may be made against the Funds that have not yet occurred. However, the Funds expect the risk of loss to be remote.
Investment Valuation:
Exchange traded options on securities and indices generally will be valued at their last sales price or, if no last sales price is available, at their last bid price. Securities are valued at market value as of the close of trading on each business day when the New York Stock Exchange (“NYSE”) is open. Securities, listed on the NYSE or other exchanges are valued on the basis of the last reported sale price on the exchange on which they are primarily traded. Securities listed on the Nasdaq National Market System (“Nasdaq”) will be valued at the Nasdaq Official Closing Price, which may differ from the last sales price reported. If a last sales price is not reported by the principal exchange on which a security is traded, a security will be valued at the mean of the last bid and ask price. Exchange traded options on securities and indices generally will be valued at their last sales price or, if no last sales price is available, at their last bid price. Over the counter options are valued based on the last sales price.
| 18 |
SteelPath MLP Funds Semi-Annual Report
|
NOTES TO THE FINANCIAL STATEMENTS (Continued)
May 31, 2012 (Unaudited)
If there is no trading of a security, the mean of the last bid prices obtained from two or more broker-dealers will be used, unless there is only one broker-dealer, in which case that dealer’s last bid price will be used.
Exchange traded options on securities and indices generally will be valued at their last sales price or, if no last sales price is available, at their last bid price. Options traded in the over-the counter market will be valued on the last bid prices obtained from two or more broker-dealers, unless there is only one broker-dealer, in which case that dealer’s last bid prices will be used. Futures contracts will be valued based upon the last sales price at the close of market on the principal exchange on which they are traded or, in the absence of any transactions on a given day, the mean of the last bid and asked price. Swaps and other privately negotiated agreements will be valued pursuant to a valuation model approved by the Board, by an independent pricing service or prices supplied by the counterparty, which in turn are based on the market prices or fair values of the securities underlying the agreement.
Fixed income securities with maturities greater than 60 days will be valued based on prices received from an independent pricing service. Short-term fixed income securities with maturities of 60 days or less will be valued at amortized cost. If the Board determines that the amortized cost method does not represent the fair value of the short-term debt instrument, the investment will be valued at fair value as determined by procedures as adopted by the Board.
Pursuant to procedures adopted by the Board, the Advisor’s Valuation Committee will determine the fair value of a Fund’s securities when price quotations or valuations are not readily available, readily available price quotations are valuations that are not reflective of market value, or a significant event has been recognized in relation to a security or class of securities. A “significant event” is one that occurred prior to the Fund’s valuation time, is not reflected in the most recent market price of a security, and will affect the value of a security. Generally, a security will be fair valued when trading in the security has been halted, a market price is not available from either a pricing service or a broker or a price has become stale.
Fair value pricing is intended to result in a more accurate determination of a Fund’s net asset value and should reduce the potential for stale pricing arbitrage opportunities in a Fund. However, attempts to determine the fair value of securities introduce an element of subjectivity to the pricing of securities.
As a result, the price of a security determined through fair valuation techniques may differ from the price quoted or published by other sources and may not accurately reflect the market value of the security when trading resumes.
U.S. GAAP establishes a hierarchy that prioritizes the various inputs used in determining the value of a Fund’s investments. The three broad levels of the hierarchy are described below:
|
|
•
|
Level 1 — quoted prices for active markets for identical securities;
|
|
|
•
|
Level 2 — other significant observable inputs (including quoted prices for similar securities, interest rates, prepayment speeds, credit risk, etc.); or
|
|
|
•
|
Level 3 — significant unobservable inputs, including the Funds’ own assumptions in determining the fair value of investments.
|
The inputs or methodology used for valuing securities are not necessarily an indication of the risk associated with investing in those securities. The following is a summary of the inputs used to value the Funds’ investments as of May 31, 2012:
Select 40 Fund
|
Level 1 –
Quoted Prices
|
Level 2 –
Other Significant
Observable Inputs
|
Level 3 –
Significant
Unobservable Inputs
|
Total
|
|||||||||||||
|
Master Limited Partnership Shares*
|
$ | 823,527,697 | $ | — | $ | — | $ | 823,527,697 | ||||||||
|
Short-Term Investments
|
38,111,760 | — | — | 38,111,760 | ||||||||||||
|
Total
|
$ | 861,639,457 | $ | — | $ | — | $ | 861,639,457 | ||||||||
|
May 31, 2012
|
19 |
NOTES TO THE FINANCIAL STATEMENTS (Continued)
May 31, 2012 (Unaudited)
Alpha Fund
|
Level 1 –
Quoted Prices
|
Level 2 –
Other Significant
Observable Inputs
|
Level 3 –
Significant
Unobservable Inputs
|
Total
|
|||||||||||||
|
Master Limited Partnership Shares*
|
$ | 633,606,020 | $ | — | $ | — | $ | 633,606,020 | ||||||||
|
Short-Term Investments
|
19,329,320 | — | — | 19,329,320 | ||||||||||||
|
Total
|
$ | 652,935,340 | $ | — | $ | — | $ | 652,935,340 | ||||||||
Income Fund
|
Level 1 –
Quoted Prices
|
Level 2 –
Other Significant
Observable Inputs
|
Level 3 –
Significant
Unobservable Inputs
|
Total
|
|||||||||||||
|
Master Limited Partnership Shares*
|
$ | 363,721,294 | $ | — | $ | — | $ | 363,721,294 | ||||||||
|
Short-Term Investments
|
20,483,035 | — | — | 20,483,035 | ||||||||||||
|
Total
|
$ | 384,204,329 | $ | — | $ | — | $ | 384,204,329 | ||||||||
Alpha Plus Fund
|
Level 1 –
Quoted Prices
|
Level 2 –
Other Significant
Observable Inputs
|
Level 3 –
Significant
Unobservable Inputs
|
Total
|
|||||||||||||
|
Master Limited Partnership Shares*
|
$ | 1,013,905 | $ | — | $ | — | $ | 1,013,905 | ||||||||
|
Short-Term Investments
|
— | — | — | — | ||||||||||||
|
Total
|
$ | 1,013,905 | $ | — | $ | — | $ | 1,013,905 | ||||||||
|
*
|
For a detailed break-out of Master Limited Partnerships by major industry classification, please refer to the Schedule of Investments.
|
The Funds did not hold any Level 2 or Level 3 securities during the period ended May 31, 2012. There were no transfers into and out of all levels during the period. It is the Funds’ Policy to recognize transfers at the end of the reporting period.
Return of Capital Estimates:
Distributions received from the Funds’ investments in MLPs generally are comprised of income and return of capital. The Funds record investment income and return of capital based on estimates made at the time such distributions are received. Such estimates are based on historical information available from each MLP and other industry sources. These estimates may subsequently be revised based on information received from MLPs after their tax reporting periods are concluded. For the period ended May 31, 2012, the Funds estimated that 100% of the MLP distributions received would be treated as return of capital.
Partnership Accounting Policy:
Each Fund records its pro-rata share of the income/(loss) and capital gains/(losses), to the extent of distributions it has received, allocated from the underlying partnerships and adjusts the cost basis of the underlying partnerships accordingly. These amounts are included in the Funds’ Statements of Operations.
Investment Transactions and Related Income:
Investment transactions are recorded on a trade date plus one basis, except for the last day of the fiscal quarter end, when they are recorded on trade date. Partnership distributions are recorded on the ex-dividend date. Securities gains and losses are calculated based on the last-in, first-out method. Interest income is recognized on the accrual basis and includes, where applicable, the amortization or accretion of premium or discount.
Expenses:
Expenses directly attributable to each Fund are charged directly to the Fund. Expenses relating to the Trust are allocated proportionately to each Fund within the Trust according to the relative net assets of each Fund or on another reasonable basis. Certain class specific expenses are allocated to the specific class in which the expenses were incurred.
| 20 |
SteelPath MLP Funds Semi-Annual Report
|
NOTES TO THE FINANCIAL STATEMENTS (Continued)
May 31, 2012 (Unaudited)
Distributions to Shareholders:
Dividends, if any, are declared and distributed quarterly for the Select 40 Fund, Alpha Fund, and Alpha Plus Fund and monthly for the Income Fund. The estimated characterization of the distributions paid will be either a dividend (ordinary income) or distribution (return of capital). This estimate is based on the individual Fund’s operating results during the period. It is anticipated that a significant portion of its distributions will be comprised of return of capital as a result of the tax character of cash distributions made by the Funds’ investments. The actual characterization of the distributions made during the period will not be determined until after the end of the fiscal year. The Funds will inform shareholders of the final tax character of the distributions on IRS Form DIV in February 2013. For the period ended May 31, 2012, the Funds’ distributions were expected to be comprised of 100% return of capital. Subsequent to the period ended May 31, 2012, the Income Fund made distributions of $0.0646 per share for Class A Shares, Class C Shares, and Class I Shares, to shareholders on June 6, 2012, and on July 6, 2012.
The distributions are determined in accordance with federal income tax regulations and are recorded on the ex-dividend date. They may differ from U.S. GAAP. These “book/tax” differences are either considered temporary or permanent in nature. To the extent these differences are permanent in nature, such amounts are reclassified within the composition of net assets based on their federal tax-basis treatment; temporary differences do not require reclassification.
Federal Income Taxes:
The Funds do not intend to qualify as regulated investment companies pursuant to Subchapter M of the Internal Revenue Code, but will rather be taxed as corporations. As corporations, the Funds are obligated to pay federal, state and local income tax on taxable income. Currently, the maximum marginal regular federal income tax rate for a corporation is 35 percent. The Funds may be subject to a 20 percent alternative minimum tax on its federal alternative minimum taxable income to the extent that its alternative minimum tax exceeds its regular federal income tax. The Funds currently are using an estimated 2.5% for state and local tax, net of federal tax expense.
Each Funds’ income tax provision consists of the following as of May 31, 2012:
|
MLP
Select 40
|
MLP
Alpha
|
MLP
Income
|
MLP
Alpha Plus
|
|||||||||||||
|
Current tax expense (benefit)
|
||||||||||||||||
|
Federal
|
— | — | — | — | ||||||||||||
|
State
|
— | — | — | — | ||||||||||||
|
Total current tax expense
|
$ | — | $ | — | $ | — | $ | — | ||||||||
|
Deferred tax expense (benefit)
|
||||||||||||||||
|
Federal
|
$ | (3,870,440 | ) | $ | 1,898,364 | $ | (2,243,136 | ) | $ | (56,687 | ) | |||||
|
State
|
(276,459 | ) | 135,597 | (160,225 | ) | (4,048 | ) | |||||||||
|
Total deferred tax expense (benefit)
|
$ | (4,146,899 | ) | $ | 2,033,961 | $ | (2,403,361 | ) | $ | (60,735 | ) | |||||
The reconciliation between the federal statutory income tax rate of 35% and the effective tax rate on net investment income (loss) and realized and unrealized gain (loss) follows:
|
MLP Select 40
|
MLP Alpha
|
MLP Income
|
MLP Alpha Plus
|
|||||||||||||||||||||||||||||
|
Amount
|
Rate
|
Amount
|
Rate
|
Amount
|
Rate
|
Amount
|
Rate
|
|||||||||||||||||||||||||
|
Application of staturory income tax rate
|
$ | (3,870,440 | ) | 35.00 | % | $ | 1,898,364 | 35.00 | % | $ | (2,243,136 | ) | 35.00 | % | $ | (56,687 | ) | 35.00 | % | |||||||||||||
|
State income taxes net of federal benefit
|
(276,459 | ) | 2.50 | % | 135,597 | 2.50 | % | (160,225 | ) | 2.50 | % | (4,048 | ) | 2.50 | % | |||||||||||||||||
|
Total income tax expense (benefit)
|
(4,146,899 | ) | 37.50 | % | 2,033,961 | 37.50 | % | (2,403,361 | ) | 37.50 | % | (60,735 | ) | 37.50 | % | |||||||||||||||||
|
May 31, 2012
|
21 |
NOTES TO THE FINANCIAL STATEMENTS (Continued)
May 31, 2012 (Unaudited)
The Funds intend to invest their assets primarily in MLPs, which generally are treated as partnerships for federal income tax purposes. As limited partners in the MLPs, the Funds report their allocable share of the MLP’s taxable income in computing their own taxable income. The Funds’ tax expense or benefit will be included in the Statement of Operations based on the component of income or gains (losses) to which such expense or benefit relates. Deferred income taxes reflect the net tax effects of temporary difference between the carrying amounts of assets and liabilities for financial reporting purposes and the amounts used for income tax purposes. Such temporary differences are principally: (i) taxes on unrealized gains/(losses), which are attributable to the temporary difference between fair market value and tax basis, (ii) the net tax effects of temporary differences btween the carrying amounts of assets and liabilities for financial reporting and income tax purposes and (iii) the net tax benefit of accumulated net operating losses and capital loss carryforwards. Deferred tax assets and liabilities are measured using effective tax rates expected to apply to taxable income in the years such temporary differences are realized or otherwise settled. To the extent the Funds have a deferred tax asset, consideration is given to whether or not a valuation allowance is required. A valuation allowance is required if based on the evaluation criterion provided by ASC 740, Income Taxes (ASC 740), it is more-likely-than-not that some portion or all of the deferred tax asset will not be realized. Among the factors considered in assessing the Funds’ valuation allowance: the nature, frequency and severity of current and cumulative losses, forecasts of future profitability, the duration of the statutory carryforward periods and the associated risks that operating and capital loss carryforwards may expire unused. At May 31, 2012, the Funds determined a valuation allowance was not required. From time to time, as new information becomes available, the Funds will modify their estimates or assumptions regarding the deferred tax liability or asset.
Components of the Funds’ deferred tax assets and liabilities as of May 31, 2012 are as follows:
|
MLP
Select 40
|
MLP
Alpha
|
MLP
Income
|
MLP
Alpha Plus
|
|||||||||||||
|
Deferred tax assets:
|
||||||||||||||||
|
Net operating loss carryforward (tax basis)
|
$ | 18,924,891 | $ | 16,596,981 | $ | 4,134,218 | $ | 2,723 | ||||||||
|
Capital loss carryforward (tax basis)
|
4,920,075 | 3,641,193 | — | 18,825 | ||||||||||||
|
Organization costs
|
12,067 | — | — | — | ||||||||||||
|
Deferred tax liabilities:
|
||||||||||||||||
|
Net unrealized gains on investment securities (tax basis)
|
(45,020,902 | ) | (34,679,605 | ) | (7,109,770 | ) | 39,188 | |||||||||
|
Total net deferred tax asset/(liability)
|
$ | (21,163,869 | ) | $ | (14,441,431 | ) | $ | (2,975,552 | ) | $ | 60,736 | |||||
Unexpected significant decreases in cash distributions from the Funds’ MLP investments or significant declines in the fair value of its investments may change the Funds’ assessment regarding the recoverability of their deferred tax assets and may result in a valuation allowance. If a valuation allowance is required to reduce any deferred tax asset in the future, it could have a material impact on the Funds’ net asset value and results of operations in the period it is recorded.
The Funds may rely, to some extent, on information provided by the MLPs, which may not necessarily be timely, to estimate taxable income allocable to MLP units held in their portfolios, and to estimate their associated deferred tax benefit/(liability). Such estimates are made in good faith. From time to time, as new information becomes available, the Funds will modify their estimates or assumptions regarding their tax benefit/(liability).
The Funds’ policy is to classify interest and penalties associated with underpayment of federal and state income taxes, if any, as income tax expense on their Statements of Operations. As of May 31, 2012, the Funds do not have any interest or penalties associated with the underpayment of any income taxes.
The Funds file income tax returns in the U.S. federal jurisdiction and various states. All tax years since inception remain open and subject to examination by tax jurisdictions. The Funds have reviewed all major jurisdictions and concluded that there is no significant impact on the Funds’ net assets and no tax liability resulting from unrecognized tax benefits relating to uncertain tax positions expected to be taken on their tax returns. Furthermore, management of the Funds is not aware of any tax positions for which it is reasonably possible that the total amounts of unrecognized tax benefits will significantly change in the next 12 months.
| 22 |
SteelPath MLP Funds Semi-Annual Report
|
NOTES TO THE FINANCIAL STATEMENTS (Continued)
May 31, 2012 (Unaudited)
At May 31, 2012, the Funds had net operating loss carryforwards for federal income tax purposes, which may be carried forward for 20 years, as follows:
|
MLP
Select 40
|
MLP
Alpha
|
MLP
Income
|
MLP
Alpha Plus
|
|||||||||||||
|
Expiration Date
|
||||||||||||||||
|
11/30/2030
|
$ | 525,993 | $ | 1,194,164 | $ | 3,877 | $ | — | ||||||||
|
11/30/2031
|
11,179,881 | 7,264,183 | 4,997,354 | — | ||||||||||||
|
11/30/2032
|
38,760,503 | 34,666,073 | 6,023,354 | 7,261 | ||||||||||||
|
Total
|
$ | 50,466,377 | $ | 43,124,420 | $ | 11,024,585 | $ | 7,261 | ||||||||
At May 31, 2012, the Funds had net capital loss carryforwards for federal income tax purposes, which may be carried forward for 5 years, as follows:
|
MLP
Select 40
|
MLP
Alpha
|
MLP
Income
|
MLP
Alpha Plus
|
|||||||||||||
|
ExpirationDate
|
||||||||||||||||
|
11/30/2016
|
$ | 2,698,758 | $ | — | $ | — | $ | — | ||||||||
|
11/30/2017
|
10,421,442 | 10,844,042 | — | 50,200 | ||||||||||||
|
Total
|
$ | 13,120,200 | $ | 10,844,042 | $ | — | $ | 50,200 | ||||||||
Recent Accounting Pronouncements:
In May 2011, the FASB issued ASU No. 2011-04 “Amendments to Achieve Common Fair Value Measurement and Disclosure Requirements’ in U.S. GAAP and the International Financial Reporting Standards (“IFRSs’). ASU No. 2011-04 amends FASB ASC Topic 820, Fair Value Measurements and Disclosures, to establish common requirements for measuring fair value and for disclosing information about fair value measurements in accordance with U.S. GAAP and IFRSs. ASU No. 2011-04 is effective for fiscal years beginning after December 15, 2011 and for interim periods within those fiscal years. Management is currently evaluating the impact these amendments may have on the Funds’ financial statements.
3. Related Party Transactions:
Investment Advisor:
SteelPath Fund Advisors, LLC (the “Advisor”) serves as the investment advisor to each Fund. Under the terms of the investment advisory agreement, the Advisor is entitled to receive fees computed daily and paid monthly at an annual rate of 0.70%, 1.10%, 0.95%, and 1.25% of average net assets, for the Select 40 Fund, Alpha Fund, Income Fund, and Alpha Plus Fund respectively. The Advisor makes the investment decisions for each Fund and continuously reviews, supervises and administers the investment program of each Fund, subject to the supervision of, and policies established by the Board. The amounts charged to the Funds for investment advisory services are reported within the Statement of Operations.
The Advisor has agreed to limit fees and/or reimburse expenses of each Fund until at least March 31, 2013, to the extent that a Fund’s total annual fund operating expenses (exclusive of interest, taxes, such as deferred tax expenses, brokerage commissions, acquired fund fees and expenses, dividend costs related to short sales, and extraordinary expenses, such as litigation expenses, if any) exceed a certain limit with respect to each class of a Fund. The Expense Limitation Agreement has the effect of capping the Select 40 Fund’s class A, C, I, and Y share classes at 1.10%, 1.85%, 0.85%, and 0.85%, respectively, the Alpha Fund’s class A, C, and I share classes at 1.50%, 2.25%, and 1.25%, respectively, the Income Fund’s class A, C, and I share classes at 1.35%, 2.10%, and 1.10%, respectively, and the Alpha Plus Fund’s class A, C, and I share classes at 2.00%, 2.75%, and 1.75%, respectively. A Fund’s net expenses will be higher than these amounts to the extent that the Fund incurs expenses excluded from the expense cap. Because the Fund’s deferred income tax expense is excluded from the expense cap, the Fund’s net expenses for each class of shares is increased by the amount of this expense. The Advisor can be reimbursed by the Fund within three years after the date the fee limitation and/or expense reimbursement has been made by the Advisor, provided that such repayment does not cause the expenses of any class of the Fund to exceed the foregoing limits. The fee limitation and/or expense reimbursement may be terminated or amended prior to March 31, 2013 with the approval of the Trust’s Board of Trustees. During the period ended May 31, 2012, the Advisor did not recoup any expenses.
|
May 31, 2012
|
23 |
NOTES TO THE FINANCIAL STATEMENTS (Continued)
May 31, 2012 (Unaudited)
The following table represents amounts eligible for recovery at May 31, 2012:
|
Eligible expense recoupments expiring:
|
Select 40
Fund
|
Alpha
Fund
|
Income
Fund
|
Alpha Plus
Fund
|
||||||||||||
|
November 30, 2013
|
$ | 274,676 | $ | 213,492 | $ | 216,936 | $ | — | ||||||||
|
November 30, 2014
|
570,608 | 505,009 | 574,482 | — | ||||||||||||
|
May 31, 2015
|
108,909 | 113,798 | 254,647 | 144,567 | ||||||||||||
In addition, pursuant to the Expense Limitation Agreement, the Advisor is entitled to recoup from the Select 40 Fund certain expenses associated with the organization of the Trust for a period of up to three years from March 31, 2010, provided the Select 40 Fund’s operating expenses, including such recouped amounts, do not exceed the stated expense limitations. During the year ended November 30, 2011, the Advisor has waived $54,107 in offering fees which are subject to recoupment under the Expense Limitation Agreement. At November 30, 2011, the total offering and organization fees subject to recoupment under the Expense Limitation Agreement is $271,460, of which $217,353 is recoupable through 2013, and $54,107 is recoupable through 2014.
Distribution Plan:
Each Fund has adopted Distribution Plans, pursuant to Rule 12b-1 under the 1940 Act (the “Distribution Plans”) with respect to its Class A and Class C Shares. The Distribution Plans authorize payments by the Funds to finance activities intended to result in the sale of Class A and Class C Shares and shareholder services. The Distribution Plans provide that the Select 40 Fund, Alpha Fund and Income Fund may incur distribution expenses of 0.25% and 1.00%, respectively, of the average daily net assets of each Fund’s Class A and Class C Shares
4. Purchases and Sales of Securities:
Purchases and sales of investment securities, excluding short-term securities for the year ended November 30, 2011, totaled:
|
Select 40
Fund
|
Alpha
Fund
|
Income
Fund
|
Alpha Plus
Fund
|
|||||||||||||
|
Purchases
|
$ | 290,579,528 | $ | 217,220,604 | $ | 244,028,059 | $ | 2,558,629 | ||||||||
|
Sales
|
56,651,858 | 89,758,771 | 99,308,767 | 1,335,627 | ||||||||||||
There were no purchases or sales of U.S. government securities for the period.
5. Federal Tax Information:
At May 31, 2012, gross unrealized appreciation and depreciation of investments, based on cost for federal income tax purposes were as follows:
|
MLP
Select 40
|
MLP
Alpha
|
MLP
Income
|
MLP
Alpha Plus
|
|||||||||||||
|
Cost of Investments
|
$ | 742,579,482 | $ | 560,418,517 | $ | 365,307,841 | $ | 1,118,407 | ||||||||
|
Gross Unrealized Appreciation
|
$ | 145,937,386 | $ | 109,241,849 | $ | 36,016,571 | $ | 512 | ||||||||
|
Gross Unrealized Depreciation
|
(26,877,411 | ) | (16,725,026 | ) | (17,120,083 | ) | (105,014 | ) | ||||||||
|
Net Unrealized Appreciation (Depreciation) on Investments
|
$ | 119,059,975 | $ | 92,516,823 | $ | 18,896,488 | $ | (104,502 | ) | |||||||
The difference between cost amounts for financial statement and federal income tax purposes is due primarily to timing differences in recognizing certain gains and losses in security transactions.
| 24 |
SteelPath MLP Funds Semi-Annual Report
|
NOTES TO THE FINANCIAL STATEMENTS (Continued)
May 31, 2012 (Unaudited)
6. Concentration of Risk:
Under normal circumstances, the Select 40 Fund, Alpha Fund, and Income Fund intend to invest at least 90% of their total assets in securities of MLPs, which are subject to certain risks, such as supply and demand risk, depletion and exploration risk, commodity pricing risk, acquisition risk, and the risk associated with the hazards inherent in midstream energy industry activities, and the Alpha Plus Fund intends to invest at least 80% of its total assets in securities of MLP’s for their purposes. A substantial portion of the cash flow received by the Funds is derived from investment in equity securities of MLPs. The amount of cash that a MLP has available for distributions, and the tax character of such distributions, are dependent upon the amount of cash generated by the MLP’s operations.
7. Loan and Pledge Agreement:
The SteelPath MLP Alpha Plus Fund has a $15 million revolving credit agreement with Bank of America, N.A. (“BOA Loan Agreement”) to engage in permitted borrowing. The Fund is permitted to borrow up to the lesser of one-third of the Fund’s total assets, or the maximum amount permitted pursuant to the Fund’s investment limitations. Amounts borrowed under the BOA Loan Agreement are invested by the Fund under the direction of the Manager, consistent with the Fund’s investment objectives and policies, and as such are subject to normal market fluctuations and investment risks, including the risk of loss due to a decline in value. The loan is fully collateralized throughout the term of the loan with securities or other assets of the Fund. Securities that have been pledged as collateral for the loan are indicated in the Schedule of Investments.
Borrowings under the BOA Loan Agreement are charged interest at a calculated rate computed by Bank of America based on LIBOR plus 0.90% per annum. A commitment fee at the rate of 0.10% per annum is charged for any undrawn portion of the credit facility. The loan is due 180 days following demand by Bank of America. The loan balance at May 31, 2012 was $264,050. For the period ended May 31, 2012, information related to borrowings under the BOA Loan Agreement is as follows:
|
Weighted Average
Interest Rate
|
Weighted Average
Loan Balance
|
Number of Days
Outstanding
|
Interest Expense
Incurred
|
Maximum Amount
Borrowed During
the Period
|
||||||||
| 1.14% | $506,332 | 53 | $832 | $595,395 |
8. Subsequent Event:
On July 16, 2012, the Advisor entered into an agreement with OppenheimerFunds, Inc. (“Oppenheimer”) pursuant to which Oppenheimer will acquire substantially all of the assets of the Advisor and certain of its affiliates. The transaction is scheduled to close (the “Closing”) in the fourth quarter of this year. The Closing is subject to certain conditions and approvals.
The Funds’ investment advisory agreements with the Advisor will terminate upon the Closing. Accordingly, the Funds’ Board and shareholders will be asked to approve investment advisory agreements with a new investment adviser affiliated with Oppenheimer. It is expected that the Advisor’s investment team and portfolio managers who currently manage the Funds will continue to manage the Funds after the acquisition as employees of the new Oppenheimer investment adviser. Subject to Board approval, a special meeting of the Funds’ shareholders will be held to consider the new investment advisory agreements and such other matters as the Board may deem appropriate. Before the special meeting, shareholders of the Funds will receive proxy materials that discuss the proposed new agreements and other matters.
Subsequent events occurring have been evaluated for potential impact to this report through the date these financial statements and notes to the financial statements were issued. There were no additional subsequent events to report that would have a material impact on the financial statements and notes to the financial statements.
|
May 31, 2012
|
25 |
EXPENSE EXAMPLE
May 31, 2012 (Unaudited)
As a shareholder of the Funds, you may incur two types of costs: (1) transaction costs, including sales charges (loads) on purchase payments; potential deferred sales charges for redemptions within one year of purchase; and (2) ongoing costs, including investment advisory fees, distribution and service (12b-1) fees, and other Fund expenses. This example is intended to help you understand your ongoing costs (in dollars) of investing in the Funds and to compare these costs with the ongoing costs of investing in other mutual funds.
The example is based on an investment of $1,000 invested at the beginning of the period and held for the entire period (December 1, 2011 through May 31, 2012).
Actual Expenses
The first lines of the table below with respect to each class of shares of each Fund provide information about actual account values and actual expenses. You may use the information in these lines, together with the amount you invested, to estimate the expenses that you paid over the period. Simply divide your account value by $1,000 (for example, an $8,600 account value divided by $1,000 = 8.6), then multiply the result by the number in the first line under the heading entitled “Expenses Paid During the Six Month Period Ended May 31, 2012” to estimate the expenses you paid on your account during this period. The only transaction fee you may be required to pay is for outgoing wire transfers charged by UMB Fund Services, Inc., the Fund’s transfer agent. If you request that a redemption be made by wire transfer, currently the Fund’s transfer agent charges a $15 fee. You may also pay a small account fee of $24 if the value of your account with the Fund is less than $10,000. If you paid a transaction or a small account fee, you would add the fee amount of the expenses paid on your account this period to obtain your total expenses paid.
Hypothetical Example for Comparison Purposes
The second lines of the table below with respect to each class of shares of each Fund provide information about hypothetical account values and hypothetical expenses based on the Funds’ actual expense ratios and an assumed rate of return of 5% per year before expenses, which are not the Funds’ actual returns. The hypothetical account values and expenses may not be used to estimate the actual ending account balance or expenses you paid for the period. You may use this information to compare the ongoing costs of investing in the Funds and other funds. To do so, compare this 5% hypothetical example with the 5% hypothetical examples that appear in the shareholder reports of the other funds. A transaction fee of $15 may be assessed on outgoing wire transfers. You may also pay a small account fee of $24 if the value of your account with the Fund is less than $10,000. To include this fee in the calculation, you would add the estimated transaction fee to the hypothetical expenses shown in the table.
Please note that the expenses shown in the table are meant to highlight your ongoing costs only and do not reflect any transactional costs, such as sales charges (loads) or any costs that may be associated with investing in the Funds through a financial intermediary. Therefore, the second lines of the table are useful in comparing the ongoing costs only, and will not help you determine the relative total costs of owning different funds. In addition, if these transactional costs were included, your costs would have been higher.
|
Beginning
Account Value
December 1, 2011
|
Ending
Account Value
May 31, 2012
|
Expenses Paid
During the
Six Month
Period Ended
May 31, 2012*
|
Net Expense
Ratio Annualized
May 31, 2012#
|
Total Return
Period Ended
May 31, 2012
|
|
|
Select 40 Fund
|
|||||
|
Class A Actual
|
$1,000.00
|
$995.70
|
$5.49
|
1.10%
|
(0.43)%
|
|
Class A Hypothetical (5% return before expenses)
|
$1,000.00
|
$1,019.50
|
$5.55
|
1.10%
|
1.95%
|
|
Class C Actual
|
$1,000.00
|
$993.80
|
$9.22
|
1.85%
|
(0.62)%
|
|
Class C Hypothetical (5% return before expenses)
|
$1,000.00
|
$1,015.75
|
$9.33
|
1.85%
|
1.57%
|
|
Class I Actual
|
$1,000.00
|
$996.70
|
$4.24
|
0.85%
|
(0.33)%
|
|
Class I Hypothetical (5% return before expenses)
|
$1,000.00
|
$1,020.75
|
$4.29
|
0.85%
|
2.07%
|
|
Class Y Actual
|
$1,000.00
|
$997.70
|
$4.24
|
0.85%
|
(0.23)%
|
|
Class Y Hypothetical (5% return before expenses)
|
$1,000.00
|
$1,020.75
|
$4.29
|
0.85%
|
2.08%
|
| 26 |
SteelPath MLP Funds Semi-Annual Report
|
EXPENSE EXAMPLE (Continued)
May 31, 2012 (Unaudited)
|
Beginning
Account Value
December 1, 2011
|
Ending
Account Value
May 31, 2012
|
Expenses Paid
During the
Six Month
Period Ended
May 31, 2012*
|
Net Expense
Ratio Annualized
May 31, 2012#
|
Total Return
Period Ended
May 31, 2012
|
|
Alpha Fund
|
|||||
|
Class A Actual
|
$1,000.00
|
$1,006.70
|
$7.52
|
1.50%
|
0.67%
|
|
Class A Hypothetical (5% return before expenses)
|
$1,000.00
|
$1,017.50
|
$7.57
|
1.50%
|
1.75%
|
|
Class C Actual
|
$1,000.00
|
$1,003.80
|
$11.27
|
2.25%
|
0.38%
|
|
Class C Hypothetical (5% return before expenses)
|
$1,000.00
|
$1,013.75
|
$11.33
|
2.25%
|
1.38%
|
|
Class I Actual
|
$1,000.00
|
$1,008.60
|
$6.28
|
1.25%
|
0.86%
|
|
Class I Hypothetical (5% return before expenses)
|
$1,000.00
|
$1,018.75
|
$6.31
|
1.25%
|
1.88%
|
|
Income Fund
|
|||||
|
Class A Actual
|
$1,000.00
|
$998.80
|
$6.75
|
1.35%
|
(0.12)%
|
|
Class A Hypothetical (5% return before expenses)
|
$1,000.00
|
$1,018.25
|
$6.81
|
1.35%
|
1.83%
|
|
Class C Actual (b)
|
$1,000.00
|
$995.80
|
$10.48
|
2.10%
|
(0.42)%
|
|
Class C Hypothetical (5% return before expenses)
|
$1,000.00
|
$1,014.50
|
$10.58
|
2.10%
|
1.45%
|
|
Class I Actual
|
$1,000.00
|
$1,000.80
|
$5.50
|
1.10%
|
0.08%
|
|
Class I Hypothetical (5% return before expenses)
|
$1,000.00
|
$1,019.50
|
$5.55
|
1.10%
|
1.95%
|
|
Alpha Plus Fund
|
|||||
|
Class A Actual(a)
|
$1,000.00
|
$948.40
|
$9.74
|
2.00%
|
(5.16)%
|
|
Class A Hypothetical (5% return before expenses)(a)
|
$1,000.00
|
$1,015.00
|
$10.08
|
2.00%
|
1.50%
|
|
Class C Actual (b)
|
$1,000.00
|
$986.20
|
$13.66
|
2.75%
|
(1.38)%
|
|
Class C Hypothetical (5% return before expenses)(b)
|
$1,000.00
|
$1,011.25
|
$13.83
|
2.75%
|
1.13%
|
|
Class I Actual (c)
|
$1,000.00
|
$962.70
|
$8.59
|
1.75%
|
(3.73)%
|
|
Class I Hypothetical (5% return before expenses)(c)
|
$1,000.00
|
$1,016.25
|
$8.82
|
1.75%
|
1.63%
|
|
*
|
Expenses are equal to each Fund’s annualized expense ratio (based upon the last six months) as reflected in the fourth column above, multiplied by the average account value over the period, multiplied by (# of days in most recent fiscal half-year divided by # of days in current fiscal year (183/366) to reflect the one-half year period.
|
|
#
|
Deferred tax benefit/(expense) is not included in the ratio calculation.
|
|
(a)
|
Class inception date 2/7/2012.
|
|
(b)
|
Class inception date 5/23/2012.
|
|
(c)
|
Class inception date 1/3/2012.
|
|
May 31, 2012
|
27 |
OTHER INFORMATION
May 31, 2012 (Unaudited)
Statement Regarding Availability of Quarterly Portfolio Schedule
The Funds file complete schedules of portfolio holdings for each Fund with the Securities and Exchange Commission (the “Commission”) for the first and third quarters of each fiscal year on Form N-Q. The Funds’ Forms N-Q are available on the Commission’s website at http://www.sec.gov. The Funds’ Form N-Q may be reviewed and copied at the Commission’s Public Reference Room in Washington, D.C., and information on the operation of the Public Reference Room may be obtained by calling 1-800-SEC-0330. The Funds make the information on Form N-Q available upon request without charge by calling the Funds at 1-888-614-6614
Statement Regarding Availability of Proxy Voting Policies and Procedures and Proxy Voting Record
A description of the policies and procedures the Funds use to determine how to vote proxies relating to the portfolio securities is available without charge, upon request, by calling 1-888-614-6614 or on the Commission’s website at http://www.sec.gov. Information regarding how the Funds voted proxies relating to portfolio securities for the most recent 12-month period ended November 30, 2011 is available without charge, at the SEC’s website at http://www.sec.gov., or by calling the Funds at 1-888-614-6614.
Risk Disclosure
Investing in MLPs involves additional risks as compared to the risks of investing in common stock, including risks related to cash flow, dilution and voting rights. Each Fund’s investments are concentrated in the energy infrastructure industry with an emphasis on securities issued by MLPs, which may increase price fluctuation. Energy infrastructure companies are subject to risks specific to the industry, such as fluctuations in commodity prices, reduced volumes of natural gas or other energy commodities, environmental hazards, changes in the macroeconomic or the regulatory environment or extreme weather. MLPs may trade less frequently than larger companies due to their smaller capitalizations which may result in erratic price movement or difficulty in buying or selling. MLPs are subject to significant regulation and may be adversely affected by changes in the regulatory environment including the risk that an MLP could lose its tax status as a partnership. To the extent that a Fund invests in ETFs and other investment companies, there may be a duplication of advisory fees and other expenses.
To the extent that a Fund obtains leverage through borrowings, there will be the potential for greater gains and the risk of magnified losses. Investing in debt securities involves additional risks including interest rate risk, credit risk and duration risk. High yield securities involve more risks than investment grade securities and tend to be more sensitive to economic conditions. Private equity investments may be subject to greater risks than investments in publicly traded companies due to limited public information and lack of regulatory oversight.
Availability of Additional Information
Investors should consider the Funds’ investment objectives, risks, charges, and expenses carefully before investing. The prospectus and summary prospectus contain this and other important information about the Funds. Copies of the prospectus and summary prospectus may be obtained by visiting www.steelpath.com and should be read carefully before investing.
| 28 |
SteelPath MLP Funds Semi-Annual Report
|
APPROVAL OF INVESTMENT ADVISORY AGREEMENTS
SteelPath MLP Funds Trust
Renewal of Investment Advisory Agreement
At a meeting held on January 26, 2012, the Board of Trustees (the “Board” or “Trustees”) of the SteelPath MLP Funds Trust (“Trust”) approved renewal of the Trust’s investment advisory agreement (“Agreement”) with SteelPath Fund Advisors, LLC (“SFA”), with respect to the SteelPath MLP Select 40 Fund (“Select 40 Fund”), the SteelPath MLP Alpha Fund (“Alpha Fund”) and the SteelPath MLP Income Fund (“Income Fund” and collectively, the “Funds”). In voting to approve the renewal of the Agreement, the Board considered the multiple factors when evaluating SFA and in approving the Agreement, including, but not limited to: (1) the nature, extent and quality of the services provided to the Funds under the Agreement; (2) the performance of each Fund for various periods ended December 31, 2011 as compared to the Fund’s benchmark, mutual funds (“Peer Group”) that invest in master limited partnerships (“MLPs”) and ranking relative to an applicable universe of funds compiled by Morningstar, a third-party provider of such data (each, a “Morningstar Category”); (3) the fee rates and overall expense ratios of each Fund and how those fee rates and expense ratios compared to the Peer Group and Morningstar Category; (4) the costs to SFA of providing advisory services to the Fund and the profit (if any) earned by SFA with respect to such services; (5) the effect of changes in each Fund’s asset levels on the Fund’s advisory fee and overall expense ratio (“economies of scale”); and (6) benefits to be derived by SFA from its relationship with the Fund.
In considering the approval of the Agreement, the Board requested and reviewed information provided by SFA, including SFA’s responses to questions relating to its management of the Funds, reports relating to each Fund’s performance, reports regarding each Fund’s advisory fees and total operating expenses, reports on SFA’s profitability and other information that the Board or SFA believed would be material to the Board’s consideration of the Agreement. In addition, legal counsel to the Independent Trustees provided the Board with a memorandum regarding its responsibilities pertaining to the approval of the Agreement.
The Board did not identify any particular information that was most relevant to its determination to approve the Agreement and each Trustee may have afforded different weight to the various factors. In determining whether to approve the continuance of the Agreement, the Board considered the best interest of each Fund separately. In addition, the Board noted that the Trustees have considered various other reports and information provided to them at their regular Board meetings and otherwise. While the Agreement was considered for each Fund at the same Board meeting, the Board considered each Fund’s investment advisory relationship separately.
Nature, Extent, and Quality of Services. The Board considered SFA’s investment philosophy and investment process as well as the background and experience of the portfolio managers who manage the Funds. The Board considered that SFA uses a fundamentally-focused approach to investing each Fund’s assets with an emphasis on cost of capital and valuation. The Board considered SFA’s investment resources and infrastructure, insurance coverage and the adequacy of its compliance program. The Board also considered SFA’s representation that there are no financial constraints that would impair its ability to continue to provide high-quality services to the Funds. Based on this information, the Board concluded that the nature, extent and quality of the advisory services to be provided by SFA were appropriate for the Fund in light of its investment objective and, thus, supported a decision to approve the continuance of the Agreement.
Performance. The Board considered quarterly reports throughout the year related to the performance of the Funds. In addition, the Board evaluated the performance of each Fund, based on the performance of the Fund’s Class I shares, relative to its Peer Group, benchmark index, the Lipper Equity Income Index (“Lipper Index”) and the relevant Morningstar Category for the period ended December 31, 2011.
With respect to the Select 40 Fund and the Alpha Fund, the Board considered that each Fund outperformed its benchmark index and the Lipper Index for the one-year and since inception periods. The Board also considered that, for the one-year period, each Fund outperformed one of the two Peer Group funds for which performance information was available. With respect to the Income Fund, the Board considered that the Fund outperformed its benchmark index and the Lipper Index for the since inception period and underperformed its benchmark and the Lipper Index for the one-year period. The Board also considered that, for the one-year period, the Income Fund underperformed the two Peer Group funds for which performance information was available. Additionally, the Board considered that each Fund ranked in the first quartile of its Morningstar Category for the one-year period.
|
May 31, 2012
|
29 |
APPROVAL OF INVESTMENT ADVISORY AGREEMENTS (Continued)
Comparisons of the amounts paid under the Agreement with the Peer Group and Relevant Morningstar Category. In evaluating the Agreement, the Board considered the contractual advisory fee rate and the total and net expense ratios of each Fund’s Class I shares, net of the deferred tax expense, relative to the Peer Group and the relevant Morningstar Category. The Board also considered the advisory fee rates charged by SFA to a non-registered fund and the two SteelPath Funds that commenced operations on December 30, 2011. Additionally, the Board considered the advisory fees rate charged by an SFA affiliate for separately managed accounts. This information assisted the Board in concluding that SFA’s advisory fee rate for each Fund under the Agreement appeared to be within a reasonable range for the services to be provided to the Fund, in light of all the factors considered.
With respect to the Select 40 Fund, the Board considered that the advisory fee rate, total expense ratio and net expense ratio were lower than the Peer Group funds and the median of the Morningstar Category.
With respect to the Alpha Fund, the Board considered that the advisory fee rate was lower than one Peer Group fund, the same as a second Peer Group fund and higher than a third Peer Group fund and the median of the Morningstar Category. The Board also considered that the Alpha Fund’s total and net expense ratios were lower than the median of the Morningstar Category, and the Alpha Fund’s net expense ratio was within the range of the Peer Group.
With respect to the Income Fund, the Board considered that the advisory fee rate was lower than the Peer Group funds and higher than the median of the Morningstar Category. The Board also considered that the Income Fund’s total and net expense ratios were lower than the median of the Morningstar Category and the Peer Group funds.
Costs of the services provided and profits realized by SFA and its affiliates from SFA’s relationship with the Funds. The Board considered the overall fees paid to SFA by each Fund during the calendar year ended December 31, 2011, including fee waivers. The Board also considered that SFA had agreed to continue its contractual fee waiver and expense reimbursement arrangements to limit each Fund’s total expenses. The Board considered the overall profitability of SFA’s business and its representation that it does not allocate internal costs and assess profitability with respect to its services to individual Funds. Based on these considerations, the Board determined that, in the exercise of its business judgment, the cost of the services provided and the profits realized under the Agreement were fair and reasonable.
Extent to which economies of scale would be realized as the Funds grow and whether fee levels reflect these economies of scale for the benefit of Fund investors. The Board considered that each Fund’s advisory fee rate did not include breakpoints. The Board noted that, to the extent that the continued growth of Fund assets resulted in economies of scale, the Board would consider requesting that the Advisor institute advisory fee breakpoints.
Benefits to be derived by SFA from the relationship with the Funds. The Board considered the “fall-out” or ancillary benefits that may in the future accrue to SFA as a result of its advisory relationship with the Funds, including increased soft dollar credits and enhanced name recognition.
Board’s Conclusion. Based on, but not limited to the above considerations and determinations, the Board determined that the Agreement for the Funds was fair and reasonable in light of the services to be performed and the advisory fees paid by the Funds and such other matters as the Board considered relevant in the exercise of its business judgment. On this basis, the Board determined that the Agreement was in the best interests of the Funds and their shareholders and unanimously voted in favor of the continuance of the Agreement.
| 30 |
SteelPath MLP Funds Semi-Annual Report
|
APPROVAL OF INVESTMENT ADVISORY AGREEMENTS (Continued)
SteelPath MLP Alpha Plus Fund
Approval of Investment Advisory Agreement
At a meeting held on April 27, 2011, SteelPath MLP Fund Advisors, LLC (“SteelPath”) proposed that the Board of Trustees (the “Board” or “Trustees”) of the SteelPath MLP Funds Trust (“Trust”) approve the investment advisory agreement (“Agreement”) between SteelPath and the Trust, on behalf of the SteelPath MLP Alpha Plus Fund (the “Fund”), a newly-created series of the Trust. The Board considered multiple factors when evaluating SteelPath and in approving the Agreement including, but not limited to: (1) the nature, extent and quality of the services to be provided to the Fund under the Agreement; (2) the performance of the three existing series of the Trust (“existing SteelPath Funds”); (3) the projected level of fees and overall expenses of the Fund and how those fees and expenses compare to the existing SteelPath Funds and other mutual funds that invest in master limited partnerships (“MLP mutual funds”); (4) the costs to SteelPath of providing advisory services to the Fund and SteelPath’s projected profitability with respect to such services; (5) the anticipated effect of changes in the Fund’s asset levels on the advisory fee and overall expense ratio (“economies of scale”); and (6) benefits to be derived by SteelPath from its relationship with the Fund.
In considering the approval of the Agreement, the Board requested and reviewed information provided by SteelPath including, SteelPath’s responses to questions relating to its proposed management of the Fund, the personnel who would perform services for the Fund, the performance of the existing SteelPath Funds, the proposed investment advisory fee and projected expenses, SteelPath’s projected profitability and other information that SteelPath believed would be material to the Board’s consideration of the Agreement. In addition, legal counsel to the Independent Trustees provided the Board with a memorandum regarding its responsibilities pertaining to the approval of the Agreement. The Board did not identify any particular information that was most relevant to its determination to approve the Agreement and each Trustee may have afforded different weight to the various factors.
Nature, Extent, and Quality of Services. The Board considered SteelPath’s investment philosophy and investment process as well as the background and experience of the portfolio managers who would manage the Fund. SteelPath represented to the Board that it would manage the Fund in a manner substantially similar to the way it manages the existing SteelPath MLP Alpha Fund (“Alpha Fund”), except that the Fund also would use leverage. The Board considered SteelPath’s investment resources and infrastructure and the adequacy of its compliance program. The Board also considered additional services that SteelPath provides to the existing SteelPath Funds, including the supervision of the Trust’s operations, general oversight of the Trust’s other service providers and the coordination of marketing initiatives. Based on this information, the Board concluded that the nature, extent and quality of the advisory services to be provided by SteelPath were appropriate for the Fund in light of its investment objective, and, thus, supported a decision to approve the Agreement.
Performance. The Board noted SteelPath’s representation that it does not currently manage accounts with comparable investment objectives and policies as the Fund. However, the Board considered the performance of the existing SteelPath Funds from their inception on March 31, 2010 through February 28, 2011. The Board noted that each of the existing SteelPath Funds had outperformed the Lipper Equity Income Index and the S&P 500 Index for that period. The Board concluded that SteelPath’s historical investment performance record was not a material factor in approving the Agreement, but that the performance of the existing SteelPath Funds supported approval of the Agreement.
Comparisons of the amounts to be paid under the Agreement with the existing SteelPath Funds and other MLP mutual funds. In evaluating the Agreement, the Board reviewed the proposed advisory fee rate for services to be performed on behalf of the Fund. The Board considered SteelPath’s representation that the proposed fee rate, which is slightly higher than the fee rate for the Alpha Fund, is appropriate because the Fund’s use of leverage will require SteelPath to commit additional resources to the management of the Fund. The Board also considered the proposed fee rate as compared to the advisory fee rate of other MLP mutual funds and SteelPath’s standard fee for separately managed accounts. In this connection, the Board noted that the other MLP mutual funds and SteelPath’s separately managed accounts generally did not use leverage. The Board also noted SteelPath’s intention to cap the Fund’s total annual operating expenses at competitive levels. This information assisted the Board in concluding that SteelPath’s advisory fee rate under the Agreement appeared to be within a reasonable range for the services to be provided to the Funds, in light of all the factors considered.
|
May 31, 2012
|
31 |
APPROVAL OF INVESTMENT ADVISORY AGREEMENTS (Continued)
Costs of the services to be provided and profits to be realized by SteelPath and its affiliates from the relationship with the Funds. The Board considered SteelPath’s projected profitability in the first year of the Fund’s operations, assuming that the Fund raises $100 million in assets. Recognizing that SteelPath’s projected profitability was dependent on the Fund’s initial asset levels, competitive performance, and the maintenance of competitive expense levels, the Board concluded that while it was not a material factor in approving the Agreement, SteelPath’s projected profitability was reasonable and supported approval of the Agreement.
Extent to which economies of scale would be realized as the Fund grows and whether fee levels reflect these economies of scale for the benefit of Fund investors. The Board considered that the proposed advisory fee did not include breakpoints. However, the Board noted that, because the Fund had not commenced operations, there were no economies of scale that would warrant a change in the proposed fee rate. Based on the foregoing information, the Board concluded that economies of scale were not a material factor in approving the Agreement.
Benefits to be derived by SteelPath from the relationship with the Fund. The Board considered the “fall-out” or ancillary benefits that may accrue to SteelPath as a result of its advisory relationship with the Fund, including increased soft dollar credits, and enhanced name recognition. Based on the foregoing, the Board concluded that any “fall-out” benefits which may accrue to SteelPath were not a material factor in approving the Agreement.
Board’s Conclusion. Based on the various considerations described above, the Board, including a majority of the Trustees who are not “interested persons,” as that term is defined in the Investment Company Act of 1940, as amended, of the Fund or SteelPath, concluded that the proposed investment advisory fee is reasonable and that the approval of the Agreement is in the best interests of the Fund and its shareholders and, as a result, approved the Agreement.
| 32 |
SteelPath MLP Funds Semi-Annual Report
|
PRIVACY POLICY
As a customer of SteelPath MLP Funds Trust, or one of its affiliates, you may share with us non-public, personal information that we may use to provide products or services to you or your business. We are committed to protecting the confidentiality of any non-public, personal information that we collect.
This document summarizes the actions we have taken to ensure the privacy of the information you provide. We encourage you to read this document carefully and to contact us if you have any questions.
Collection of Information
SteelPath collects personal information so that we may offer the highest quality products and services. The information we gather and the extent to which we use it will vary depending on the product or service involved. We collect information that helps serve your financial needs; provide high levels of customer service; develop and offer new products or services for our customers; and fulfill legal and regulatory requirements. This information may include, but is not limited to, name, age, address, Social Security number, annual income, and relevant third-party reports.
Safeguards to Protect Your Personal Information
SteelPath has implemented security standards and processes—including physical, electronic and procedural safeguards—intended to protect the non-public, personal information our customers have entrusted to us.
SteelPath limits access to non-public, personal information to employees, registered representatives or agents who need information to provide our customers with products or services. These individuals are trained to respect the confidentiality of your information and expected to protect this information from inappropriate access, disclosure, and modification.
Disclosure of Information
SteelPath may disclose non-public, personal information you provide, as required to conduct our business and as permitted or required by law. We may share your information with regulatory or law enforcement agencies, reinsurers and others, as permitted or required by law.
SteelPath reserves the right to share or exchange non-public, personal information with companies engaged to work with us, such as third-party administrators and vendors hired to effect, administer or enforce a transaction that you request or authorize; to develop or maintain software; to perform market research; or to provide us with demographic information to develop marketing plans. We require these companies to maintain the confidentiality of customer information and use it only for the purpose for which it was provided.
SteelPath does not however, sell or share customer information with outside parties who want to market their products to you. We will not share non-public, personal information with third-party financial services entities, such as banks, credit unions, credit union service corporations, insurance companies, or securities broker-dealers, for purposes of joint marketing unless you direct us to, or unless we notify you first.
Further Information
If you have questions about our privacy policy, or if you would like to request information we have on file, please write to us at our primary office, SteelPath Fund Advisors LLC, 2100 McKinney Avenue, Suite 1825, Dallas, TX 75201. Please provide your complete name and address. For more detailed information about our privacy policy, please email us at privacy@SteelPath.com or call at 214-740-6040.
Our Commitment to Privacy
In the financial services business, lasting relationships are built upon mutual respect and trust. With that in mind, we will review and revise our privacy policy and procedures at minimum once per year. If any provision of our privacy policy is found to be non-compliant, then that provision will be modified to reflect the appropriate state or federal requirement. If any modifications are made, all remaining provisions of this privacy policy will remain in effect. While our policy may change from time to time, you can always review our current policy online at www.SteelPath.com/privacypolicy.html.
|
May 31, 2012
|
33 |

TABLE OF CONTENTS
SteelPath MLP and Infrastructure Debt Fund
|
|
Page
|
|
Letter to Shareholders
|
2
|
|
Schedule of Investments
|
4
|
|
Statement of Assets and Liabilities
|
5
|
|
Statement of Operations
|
6
|
|
Statement of Changes in Net Assets.
|
7
|
|
Financial Highlights
|
8
|
|
Notes to Financial Statements
|
10
|
|
Expense Example
|
14
|
|
Other Information
|
15
|
|
Approval of Investment Advisory Agreement
|
16
|
|
Privacy Policy
|
18
|
LETTER TO SHAREHOLDERS
To Our Shareholders:
We thank you for investing with SteelPath MLP Funds. We would like to share our thoughts on the period ended May 31, 2012.
The Master Limited Partnership (MLP) space ended last year on a good note as European-related fears subsided. However, similar concerns have reemerged since and once again have impacted the sector. Further, recent weakness has impacted the MLP and broader energy sectors relatively more than the broader markets. MLPs, as measured by the Alerian MLP Index (AMZ)1, provided a simple2 price loss of 0.9% for the first half of the 2012 fiscal year. This performance came in behind the 5.1% gain posted by the broader markets using the S&P 500 Index3 as a proxy. After including distributions or dividends paid, MLPs provided a 2.0% total return, making up some valuable ground compared to the 6.2% total return generated by the S&P 500 Index. The sector closed the semi-annual period with a 6.6% yield versus the 6.4% yield at the end of the last fiscal year as distribution growth was generally ahead of price performance which pushed the Index’s yield modestly higher.
Macro Review
Once again, MLP large-cap names outperformed the small- and mid-cap peer groups during the period. More specifically, those names able to tout aggressive near-term distribution growth potential, either through acquisition activity or accretive new build project slates, typically outperformed those names with slower near-term distribution growth expectations. However, large-cap outperformance for the six month period was not as pronounced as experienced during 2011. Note, the market-cap, float adjusted AMZ Index loss of 0.9% for the semi-annual period was only slightly better than the 1.9% loss derived from an equal-weighted4 performance measure of the same constituents. The bottom quartile of performance was represented by the Coal and Propane sub-sectors. These sub-sectors were plagued by a particularly warm winter which meant less coal and propane was needed for power generation and heating homes. Further, secondary equity issuances over the first half of the year were relatively robust once again. Secondary equity issuances have historically pressured stock performance, all else being equal.
Outlook
Potential price performance for the remainder of the year will likely be driven, in part, by those factors influencing the broader markets and, more particularly, the broader energy markets. Risks to the broader markets remain focused on the Eurozone and the potential for a greater than expected slow-down of the Chinese economy. Though most energy infrastructure MLPs have little to no margin exposure to commodity prices, the MLP sector tends to reflect heightened correlation to the broader energy markets during periods of market turbulence. More recently, lower oil and natural gas liquids (NGLs) prices have been putting some downward pressure on the more commodity-exposed MLP sub-sectors.
We continue to believe most infrastructure MLPs with primarily fee-based or fee-like margins should experience little business impact from these broader market gyrations. However, price performance has been and may likely continue to be impacted. Additionally, it is important to note some MLPs, such as upstream MLPs, that drill for and produce crude oil and natural gas, as well as those MLPs with natural gas processing assets can have margin exposure to commodity prices. We seek to limit the potential impact of commodity price changes on our portfolios through rigorous risk assessment of portfolio holdings with the goal of limiting exposure to those names that might be forced to suspend or lower distribution rates in downside commodity price cases.
Though investors will likely continue to allocate and reallocate across equity and fixed income asset classes in reaction to emerging events in the global markets and, therefore, will likely sustain a pattern of heightened market volatility, we believe midstream infrastructure MLPs will do what they do best – generate stable and even growing cash flows sufficient to pay and grow distributions to investors. This business growth is supported by the demand for midstream infrastructure such as pipelines and terminals. Currently, NGL and crude oil logistical assets are experiencing particularly elevated demand. Importantly, we believe demand for these services should be resilient as these infrastructure needs are driven by advancements in drilling technologies rather than a specific outlook for the broader economy.
| 2 |
SteelPath MLP and Infrastructure Debt Fund Semi-Annual Report
|
Finally, we believe the majority of names in the sector may continue to offer very healthy underlying fundamentals at attractive valuations. Yield spreads have widened substantially over this period, with the AMZ Index’s spread to the 10-year Treasury at 505 basis points5 as of May 31, 2012 versus a normalized historical average of 288 basis points (an average based on a time series that dates back to 2000 but excludes the outlier years of 2008 and 2009). Other valuation metrics, such as EV/EBITDA6 and Price/DCF7, have also fallen below historical averages.
Perhaps more importantly, MLP capex8 budgets continue to expand as infrastructure growth opportunities related to burgeoning shale play production remain abundant. Such “organic” growth opportunities combined with our expectation for continued acquisition of existing assets underlies our distribution growth expectations.
We sincerely appreciate your trust and continued confidence in SteelPath.
Gabriel Hammond
President
This material is not authorized for use unless accompanied or preceded by a prospectus.
Past performance is no guarantee of future results. The investment return and the principal value of an investment will fluctuate and shares, when redeemed, may be worth more or less than their original cost. Total returns of the Fund current to the most recent month-end can be obtained by visiting our website at www.steelpath.com.
|
1
|
The Alerian MLP Index is a composite of the 50 most prominent energy Master Limited Partnerships that provides investors with an unbiased, comprehensive benchmark for this emerging asset class. The index, which is calculated using a float-adjusted, capitalization-weighted methodology, is disseminated real-time on a price-return basis (AMZ). It is not possible to invest directly in an index. Performance information provided for the Alerian MLP Index is not indicative of the performance of the SteelPath Funds.
|
|
2
|
Simple return reflects Index performance without including the impact of distributions/dividends. A simple return is also referred to as price return or price appreciation. Total return reflects Index performance including the impact of distributions/dividends.
|
|
3
|
The S&P 500 Index is an unmanaged index of common stocks that is frequently used as a general measure of stock market performance and typically does not include fees and expenses. It is not possible to invest directly in an index.
|
|
4
|
Equal-weighted basis refers to a type of weighting that gives the same weight, or importance, to each stock in an index. The smallest companies are given equal weight to the largest companies in an equal-weight index. This allows all of the companies to be considered on an even playing field.
|
|
5
|
Basis points refers to a unit that is equal to 1/100th of 1%, and is used to denote the change in a financial instrument. The basis point is commonly used for calculating changes in interest rates, equity indexes and the yield of a fixed-income security. The relationship between percentage changes and basis points can be summarized as follows: 1% change = 100 basis points, and 0.01% = 1 basis point.
|
|
6
|
Enterprise Value (EV) is a measure of a company’s value, often used as an alternative to straightforward market capitalization. Enterprise value is calculated as market cap plus debt, minority interest and preferred shares, minus total cash and cash equivalents.
|
|
|
Earnings Before Interest, Taxes, Depreciation and Amortization (EBITDA) is an indicator of a company’s financial performance. EBITDA is essentially net income with interest, taxes, depreciation, and amortization added back into the calculation. EBITDA can be used to analyze and compare profitability between companies and industries because it eliminates the effects of financing and accounting decisions.
|
|
7
|
Distributable cash flow (DCF) is generally calculated as earnings before interest, taxes, depreciation and amortization (EBITDA) plus non-cash losses, minus interest expense, maintenance capital expenditures, and non-cash gains.
|
|
8
|
Capital Expenditure (capex) funds are used by a company to acquire or upgrade physical assets such as property, industrial buildings or equipment. This type of outlay is made by companies to maintain or increase the scope of their operations.
|
|
May 31, 2012
|
3 |
SCHEDULE OF INVESTMENTS
May 31, 2012 (Unaudited)
SteelPath MLP and Infrastructure Debt Fund
|
Description
|
Principal
|
Fair Value
|
||||||
|
Debt Investments — 41.7%
|
||||||||
|
Gathering/Processing — 9.3%
|
||||||||
|
Chesapeake Midstream Partners LP, 6.13%, 7/15/22, Callable 1/15/17
|
9,000 | $ | 8,595 | |||||
|
Copano Energy LLC 7.13%, 4/1/21, Callable 4/1/16 @ 103.56
|
16,000 | 16,560 | ||||||
|
DCP Midstream LLC, 9.75%, 3/15/19 (1)
|
4,000 | 5,227 | ||||||
|
DCP Midstream Operating LP, 3.25%, 10/1/15
|
8,000 | 8,094 | ||||||
|
MarkWest Energy Partners LP
|
||||||||
|
6.50%, 8/15/21, Callable 2/15/16
|
5,000 | 5,187 | ||||||
|
6.25%, 6/15/22, Callable 12/15/16
|
7,000 | 7,210 | ||||||
|
Regency Energy Partners LP
|
||||||||
|
6.88%, 12/1/18, Callable 12/1/14
|
8,000 | 8,400 | ||||||
|
6.50%, 7/15/21, Callable 7/15/16
|
8,000 | 8,280 | ||||||
|
Targa Resources Partners LP, 6.88%, 2/1/21, Callable 2/1/16 @ 103.44
|
4,000 | 4,140 | ||||||
|
Total Gathering/Processing
|
71,693 | |||||||
|
Natural Gas Pipelines — 18.3%
|
||||||||
|
Boardwalk Pipelines LP, 5.75%, 9/15/19
|
29,000 | 32,791 | ||||||
|
El Paso Pipeline Partners Operating Co. LLC
|
||||||||
|
5.00%, 10/1/21, Callable 7/1/21
|
8,000 | 8,605 | ||||||
|
7.50%, 11/15/40
|
6,000 | 7,625 | ||||||
|
Energy Transfer Equity LP, 7.50%, 10/15/20
|
11,000 | 11,935 | ||||||
|
Enterprise Products Operating LLC
|
||||||||
|
5.95%, 2/1/41
|
19,000 | 21,917 | ||||||
|
5.70%, 2/15/42
|
7,000 | 7,821 | ||||||
|
ONEOK, Inc., 6.88%, 9/30/28
|
8,000 | 9,469 | ||||||
|
Williams Cos., Inc.
|
||||||||
|
7.88%, 9/1/21
|
8,000 | 10,407 | ||||||
|
7.50%, 1/15/31
|
15,000 | 18,973 | ||||||
|
8.75%, 3/15/32
|
9,000 | 12,578 | ||||||
|
Total Natural Gas Pipelines
|
142,121 | |||||||
|
Petroleum Transportation — 14.1%
|
||||||||
|
Genesis Energy LP, 7.88%, 12/15/18, Callable 12/15/14
|
14,000 | 14,245 | ||||||
|
Kinder Morgan Finance Co. ULC, 5.70%, 1/5/16
|
11,000 | 11,577 | ||||||
|
NuStar Logistics LP, 7.65%, 4/15/18
|
3,000 | 3,515 | ||||||
|
Sunoco Logistics Partners Operations LP
|
||||||||
|
4.65%, 2/15/22
|
25,000 | 26,059 | ||||||
|
6.85%, 2/15/40
|
17,000 | 20,264 | ||||||
|
6.10%, 2/15/42
|
32,000 | 33,857 | ||||||
|
Total Petroleum Transportation
|
109,517 | |||||||
|
Total Debt Investments
|
||||||||
|
(identified cost $325,073)
|
323,331 | |||||||
|
Total Investments — 41.7%
|
||||||||
|
(identified cost $325,073)
|
323,331 | |||||||
|
Other Assets In Excess of Liabilities — 58.3%
|
452,822 | |||||||
|
Net Assets — 100.0%
|
$ | 776,153 | ||||||
|
LLC — Limited Liability Company
|
|
LP — Limited Partnership
|
|
ULC — Unlimited Liability Corporation
|
|
(1)
|
Represents a restricted security purchase under rule 144A which is exempt from registration under the Securities Act of 1933 as amended, these securities amounted to $5,227 and 0.7% of net assets.
|
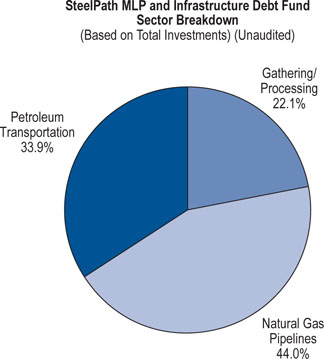
See accompanying Notes to Financial Statements.
| 4 |
SteelPath MLP and Infrastructure Debt Fund Semi-Annual Report
|
STATEMENT OF ASSETS AND LIABILITIES
May 31, 2012 (Unaudited)
SteelPath MLP Funds
|
|
SteelPath MLP and Infrastructure Debt Fund*
|
|||
|
Assets:
|
||||
|
Investment securities:
|
||||
|
At acquisition cost
|
$ | 325,073 | ||
|
At fair value
|
$ | 323,331 | ||
|
Cash
|
364,654 | |||
|
Due from Advisor
|
58,978 | |||
|
Interest receivable
|
5,386 | |||
|
Receivable for capital stock sold
|
195,500 | |||
|
Prepaid expenses
|
42,419 | |||
|
Total assets
|
990,268 | |||
|
Liabilities:
|
||||
|
Payable for investments purchased
|
169,108 | |||
|
Payable for 12b-1 fees, Class A
|
29 | |||
|
Other liabilities
|
44,978 | |||
|
Total liabilities
|
214,115 | |||
|
Total Net Assets
|
$ | 776,153 | ||
|
Net Assets Consist of:
|
||||
|
Paid-in capital
|
$ | 776,689 | ||
|
Undistributed net investment income
|
1,206 | |||
|
Net unrealized depreciation on investments
|
(1,742 | ) | ||
|
Total Net Assets
|
$ | 776,153 | ||
|
Net Asset Value, Offering Price and Redemption Proceeds Per Share ($0.001 Par Value, Unlimited Shares Authorized)
|
||||
|
Class A Shares:
|
||||
|
Net asset value and redemption proceeds per share
|
$ | 9.92 | ||
|
Offering price per share **
|
$ | 10.53 | ||
|
Class I Shares:
|
||||
|
Net asset value, offering price and redemption proceeds per share
|
$ | 9.92 | ||
|
Net Assets:
|
||||
|
Class A shares
|
$ | 493,545 | ||
|
Class I shares
|
282,608 | |||
|
Total Net Assets
|
$ | 776,153 | ||
|
Shares Outstanding:
|
||||
|
Class A shares
|
49,733 | |||
|
Class I shares
|
28,476 | |||
|
Total Shares Outstanding
|
78,209 | |||
|
*
|
Fund commenced operations on January 3, 2012.
|
|
**
|
Computation of offering price per share 100/94.25 of net asset value.
|
See accompanying Notes to Financial Statements.
|
May 31, 2012
|
5 |
STATEMENT OF OPERATIONS
For the Period Ended May 31, 2012 (Unaudited)
SteelPath MLP Funds
|
|
SteelPath MLP and Infrastructure Debt Fund*
|
|||
|
Investment Income:
|
||||
|
Interest income
|
$ | 2,064 | ||
|
Total investment income
|
2,064 | |||
|
Expenses:
|
||||
|
Investment advisory fee
|
709 | |||
|
Legal fees
|
34,960 | |||
|
Administrative fees
|
24,592 | |||
|
Registration fees
|
17,392 | |||
|
Transfer agent fees
|
14,279 | |||
|
Directors' fees
|
9,109 | |||
|
Printing and postage
|
8,164 | |||
|
Auditing fees
|
7,601 | |||
|
CCO fees
|
6,584 | |||
|
Custody fees
|
6,242 | |||
|
12b-1 fees, Class A
|
31 | |||
|
Miscellaneous
|
4,515 | |||
|
Total expenses, before waivers
|
134,178 | |||
|
Less expense waivers
|
(133,320 | ) | ||
|
Net expenses
|
858 | |||
|
Net investment income
|
1,206 | |||
|
Net Unrealized (Losses) on Investments:
|
||||
|
Investments
|
(1,742 | ) | ||
|
Net Unrealized losses on investments
|
(1,742 | ) | ||
|
Change in net assets resulting from operations
|
$ | (536 | ) | |
|
*
|
For the period January 3, 2012 commencement of operations, through May 31, 2012.
|
See accompanying Notes to Financial Statements.
| 6 |
SteelPath MLP and Infrastructure Debt Fund Semi-Annual Report
|
STATEMENT OF CHANGES IN NET ASSETS
SteelPath MLP Funds
|
SteelPath MLP
and Infrastructure Debt Fund
|
||||
|
|
For the Period Ended
May 31, 2012* (Unaudited)
|
|||
|
Increase (Decrease) in Net Assets
|
||||
|
Operations:
|
||||
|
Net investment income
|
$ | 1,206 | ||
|
Net change in unrealized appreciation on investments
|
(1,742 | ) | ||
|
Change in net assets resulting from operations
|
(536 | ) | ||
|
Capital Share Transactions:
|
||||
|
Class A
|
||||
|
Shares sold
|
493,519 | |||
|
Shares redeemed
|
(19 | ) | ||
|
Net increase
|
493,500 | |||
|
Class I
|
||||
|
Shares sold
|
283,189 | |||
|
Net increase
|
283,189 | |||
|
Change in net assets resulting from capital share transactions
|
776,689 | |||
|
Change in net assets
|
776,153 | |||
|
Net Assets:
|
||||
|
Beginning of period
|
— | |||
|
End of period
|
$ | 776,153 | ||
|
Undistributed net investment income
|
$ | 1,206 | ||
|
Transactions in Shares:
|
||||
|
Class A
|
||||
|
Shares sold
|
49,735 | |||
|
Shares redeemed
|
(2 | ) | ||
|
Net increase
|
49,733 | |||
|
Class I
|
||||
|
Shares sold
|
28,476 | |||
|
Net increase
|
28,476 | |||
|
Net increase from transactions in shares
|
78,209 | |||
|
*
|
For the period January 3, 2012 commencement of operations, through May 31, 2012.
|
See accompanying Notes to Financial Statements.
|
May 31, 2012
|
7 |
FINANCIAL HIGHLIGHTS
Selected data for a share outstanding throughout the period indicated.
SteelPath MLP Funds
|
Income From Investment Operations:
|
Distributions From:
|
|||||||||||||||||||||||||||||||||||
|
Net Asset Value, Beginning of Year/Period
|
Net investment income/(loss)(1)
|
Net Realized and Unrealized Gains (losses)(2)
|
Increase (Decrease) from Investment Operations
|
Net investment income
|
Net
Realized gains
|
Total Distributions
|
Net Asset Value, End of Period
|
Total Return(3)(4)
|
||||||||||||||||||||||||||||
|
SteelPath MLP and Infrastructure Debt Fund
|
||||||||||||||||||||||||||||||||||||
|
Class A Shares
|
||||||||||||||||||||||||||||||||||||
|
For the period from 2/7/2012 - 5/31/2012 (8)
|
$ | 9.99 | 0.02 | (0.09 | ) | (0.07 | ) | — | — | — | $ | 9.92 | (0.70 | %) | ||||||||||||||||||||||
|
Class I Shares
|
||||||||||||||||||||||||||||||||||||
|
For the period from 1/3/2012 - 5/31/2012 (9)
|
$ | 10.00 | 0.07 | (0.15 | ) | (0.08 | ) | — | — | — | $ | 9.92 | (0.80 | %) | ||||||||||||||||||||||
|
(1)
|
Calculated based on average shares outstanding during the period.
|
|
(2)
|
Realized and unrealized gains and losses per share in this caption are balancing amounts necessary to reconcile the change in net asset value per share in the period. It does not agree to the aggregate gains and losses in the Statement of Operations due to the fluctuation in share transactions this period.
|
|
(3)
|
Total return in the above table represents the rate that the investor would have earned or lost on an investment in the Fund, assuming reinvestment of Fund distributions.
|
|
(4)
|
Not annualized for periods less than one year
|
|
(5)
|
Annualized for periods less than one year
|
|
(6)
|
Portfolio turnover is calculated on the basis of the Fund as a whole without distinguishing between share classes issued.
|
|
(7)
|
Not annualized
|
|
(8)
|
Class A Shares commenced operations at the close of business February 6, 2012.
|
|
(9)
|
The net asset value for the beginning of the period close of business December 30, 2011 (Commencement of Operations) though May 31, 2012 represents the initial contribution per share of $10.
|
See accompanying Notes to Financial Statements.
| 8 |
SteelPath MLP and Infrastructure Debt Fund Semi-Annual Report
|
FINANCIAL HIGHLIGHTS
SteelPath MLP Funds (Continued)
|
Ratios /Supplemental Data
|
||||||||||||||||||
|
Net Assets, End of Year (000’s)
|
Ratio of gross expenses to average net assets(5)
|
Ratio of net expenses to average net assets(5)
|
Ratio of net investment income (loss) to average net assets
|
Portfolio Turnover Rate(6)(7)
|
||||||||||||||
| $ | 494 | 153.49 | % | 1.19 | % | 0.70 | % | 0 | % | |||||||||
| $ | 283 | 165.71 | % | 1.02 | % | 1.62 | % | 0 | % | |||||||||
See accompanying Notes to Financial Statements.
|
May 31, 2012
|
9 |
NOTES TO THE FINANCIAL STATEMENTS
May 31, 2012 (Unaudited)
1. Organization:
SteelPath MLP Funds Trust (the “Trust”) was organized as a statutory trust under the laws of the State of Delaware on December 1, 2009. The Trust is registered under the Investment Company Act of 1940, as amended (the “1940 Act”), as an open-end management investment company. The Trust is authorized to issue an unlimited number of shares, which are units of beneficial interest with a par value of $0.001. As of May 31, 2012, the Trust offered shares of five series, each of which has different and distinct investment objectives and policies. This report contains the financial statements and financial highlights of the SteelPath MLP and Infrastructure Debt Fund (the “Debt Fund” or “Fund”). The financial statements for the other funds can be found in a separate report. The Debt Fund commenced operations at the close of business December 30, 2011. The Fund offers multiple classes of shares which differ in their respective sales charges and distribution and service fees. All shareholders bear the common expenses of the Fund. Dividends are declared separately for each class. Income, non-class specific expenses and realized and unrealized gains and losses are allocated daily to each class of shares based on the value of total shares outstanding of each class, without distinction between share classes. Expenses attributable to a particular class of shares, such as distribution fees, are allocated directly to that class.
Class A Shares of the Fund are subject to an initial sales charge imposed at the time of purchase, in accordance with its prospectus. The maximum sales charge is 5.75% of the offering price or 6.10% of the net asset value. Class A Shares pay an annual Rule 12b-1 Fee of 0.25%. Class C Shares are not subject to an initial sales charge, but instead are subject to a contingent deferred sales charge of 1% if redeemed within one year of purchase. Class C shares pay an annual distribution fee of 1.00%. Class I Shares are not subject to either an initial sales charge, or a contingent deferred sales charge and do not pay a Rule 12b-1 Fee. The Class C shares are not active as of the date of this report.
The investment objective of the Debt Fund is to provide investors with current income, and as a secondary objective, capital appreciation. The Fund is non-diversified, as that term is defined in the 1940 Act.
2. Accounting Policies:
The preparation of the financial statements in accordance with accounting principles generally accepted in the United States (U.S. GAAP) requires management to make estimates and assumptions that affect the reported amounts of assets and liabilities and disclosure of contingent assets and liabilities at the date of the financial statements, as well as reported amounts of increases and decreases in net assets from operations during the reporting period. Actual results could differ from these estimates. In the normal course of business, the Funds have entered into contracts that contain a variety of representations which provide general indemnifications. The Fund’s maximum exposure under these arrangements is unknown as this would involve future claims that may be made against the Fund that have not yet occurred. However, the Fund expects the risk of loss to be remote.
Investment Valuation:
Fixed income securities with maturities greater than 60 days including corporate, convertible and municipal bonds and notes, U.S. government agencies, U.S. treasury obligations, sovereign issues, bank loans, convertible preferred securities and non-U.S. bonds are normally valued by pricing service providers that use broker dealer quotations, reported trades or valuation estimates from their internal pricing models. The service providers’ internal models use inputs that are observable such as issuer details, interest rates, yield curves, prepayment speeds, credit risks/spreads, default rates and quoted prices for similar assets. Securities that use similar valuation techniques and inputs as described above are categorized as Level 2 of the fair value hierarchy. Fixed income securities with maturities of 60 days or less will be valued at amortized cost.
Pursuant to procedures adopted by the Board, the Advisor’s Valuation Committee will determine the fair value of a Fund’s securities when price quotations or valuations are not readily available, readily available price quotations are valuations that are not reflective of market value, or a significant event has been recognized in relation to a security or class of securities. A “significant event” is one that occurred prior to the Fund’s valuation time, is not reflected in the most recent market price of a security, and will affect the value of a security. Generally, a security will be fair valued when trading in the security has been halted, a market price is not available from either a pricing service or a broker or a price has become stale.
Fair value pricing is intended to result in a more accurate determination of a Fund’s net asset value and should reduce the potential for stale pricing arbitrage opportunities in a Fund. However, attempts to determine the fair value of securities introduce an element of subjectivity to the pricing of securities.
| 10 |
SteelPath MLP and Infrastructure Debt Fund Semi-Annual Report
|
NOTES TO THE FINANCIAL STATEMENTS (Continued)
May 31, 2012 (Unaudited)
As a result, the price of a security determined through fair valuation techniques may differ from the price quoted or published by other sources and may not accurately reflect the market value of the security when trading resumes.
U.S. GAAP establishes a hierarchy that prioritizes the various inputs used in determining the value of a Fund’s investments. The three broad levels of the hierarchy are described below:
|
|
•
|
Level 1 — quoted prices for active markets for identical securities;
|
|
|
•
|
Level 2 — other significant observable inputs (including quoted prices for similar securities, interest rates, prepayment speeds, credit risk, etc.); or
|
|
|
•
|
Level 3 — significant unobservable inputs, including the Fund’s own assumptions in determining the fair value of investments.
|
The inputs or methodology used for valuing securities are not necessarily an indication of the risk associated with investing in those securities. The following is a summary of the inputs used to value the Fund’s investments as of May 31, 2012:
Debt Fund
|
Level 1 –
Quoted Prices
|
Level 2 –
Other Significant
Observable Inputs
|
Level 3 –
Significant
Unobservable Inputs
|
Total
|
|||||||||||||
|
Debt Investments*
|
$ | — | $ | 323,331 | $ | — | $ | 323,331 | ||||||||
|
Total
|
$ | — | $ | 323,331 | $ | — | $ | 323,331 | ||||||||
|
*
|
For a detailed break-out of investments by major industry classification, please refer to the Schedule of Investments.
|
The Fund did not hold any Level 1 or Level 3 securities during the period ended May 31, 2012. There were no transfers into and out of all levels during the period. It is the Fund’s Policy to recognize all transfers at the end of the reporting period.
Investment Transactions and Related Income:
Investment transactions are recorded on a trade date plus one basis, except for the last day of the fiscal quarter end, when they are recorded on trade date. Dividends, income, and distributions are recorded on the ex-dividend date. Securities gains and losses are calculated based on the last-in, first-out method. Interest income is recognized on the accrual basis and includes, where applicable, the amortization or accretion of premium or discount.
Expenses:
Expenses directly attributable to the Fund are charged directly to the Fund. Expenses relating to the Trust are allocated proportionately to each Fund within the Trust according to the relative net assets of each Fund or on another reasonable basis. Certain class specific expenses are allocated to the specific class in which the expenses were incurred.
Distributions to Shareholders:
Dividends, if any, are declared and distributed semi-annually for the Debt Fund. The estimated characterization of the distributions paid will be either a dividend (ordinary income) or distribution (return of capital). This estimate is based on the Fund’s operating results during the period.
The distributions are determined in accordance with federal income tax regulations and are recorded on the ex-dividend date. They may differ from U.S. GAAP. These “book/tax” differences are either considered temporary or permanent in nature. To the extent these differences are permanent in nature, such amounts are reclassified within the composition of net assets based on their federal tax-basis treatment; temporary differences do not require reclassification.
Federal Income Taxes:
The Fund intends to qualify as a regulated investment company by complying with the provisions available to certain investment companies, as defined in Subchapter M of the Internal Revenue Code (the “Code), and to make distributions from net investment income and from net realized gains sufficient to relieve it from all, or substantially all, Federal income and excise taxes. Therefore, no Federal or excise tax provision is recorded.
As of and during the period ended May 31, 2012, the Fund did not have a liability for any unrecognized tax benefits. The Fund recognizes interest and penalties, if any, related to unrecognized tax benefits as income tax expense in the Statement of Operations. During the period, the Fund did not incur any interest or penalties. The Fund is subject to examination by U.S. Federal tax authorities for all open tax years.
|
May 31, 2012
|
11 |
NOTES TO THE FINANCIAL STATEMENTS (Continued)
May 31, 2012 (Unaudited)
Recent Accounting Pronouncements:
In May 2011, the FASB issued ASU No. 2011-04 “Amendments to Achieve Common Fair Value Measurement and Disclosure Requirements’ in U.S. GAAP and the International Financial Reporting Standards (“IFRSs’). ASU No. 2011-04 amends FASB ASC Topic 820, Fair Value Measurements and Disclosures, to establish common requirements for measuring fair value and for disclosing information about fair value measurements in accordance with U.S. GAAP and IFRSs. ASU No. 2011-04 is effective for fiscal years beginning after December 15, 2011 and for interim periods within those fiscal years. Management is currently evaluating the impact these amendments may have on the Fund’s financial statements.
Restricted Securities - Restricted securities are securities that either: (a) cannot be offered for public sale without first being registered, or being able to take advantage of an exemption from registration, under the Securities Act of 1933; or (b) are subject to contractual restrictions on public sales. In some cases, when a security cannot be offered for public sale without first being registered, the issuer of the restricted security has agreed to register such securities for resale, at the issuer’s expense, either upon demand by the Fund or in connection with another registered offering of the securities. Many such restricted securities may be resold in the secondary market in transactions exempt from registration. Restricted securities may be determined to be liquid under criteria established by the Trustees. The Fund will not incur any registration costs upon such resales. The Funds’ restricted securities are valued at the price provided by dealers in the secondary market or, if no market prices are available, at the fair value as determined in accordance with the procedures established by and under the general supervision of the Trustees.
3. Related Party Transactions:
Investment Advisor:
SteelPath Fund Advisors, LLC (the “Advisor”) serves as the investment advisor to the Fund. Under the terms of the investment advisory agreement, the Advisor is entitled to receive fees computed daily and paid monthly at an annual rate of 0.80% of average net assets. Prior to March 30, 2012, the Investment Advisor earned fees computed daily and paid monthly at an annual rate of of 1.00% of average net assets. The Advisor makes the investment decisions for the Fund and continuously reviews, supervises and administers the investment program of the Fund, subject to the supervision of, and policies established by the Board of Trustees. The amounts charged to the Fund for investment advisory services are reported within the Statement of Operations.
The Advisor has agreed to limit fees and/or reimburse expenses of the Fund until at least March 31, 2013, to the extent that the Fund’s total annual fund operating expenses (exclusive of interest, taxes, such as deferred tax expenses, brokerage commissions, acquired fund fees and expenses, dividend costs related to short sales, and extraordinary expenses, such as litigation expenses, if any) exceed 1.15% for Class A shares, 1.90% for Class C shares and 0.90% for Class I shares. The Fund’s net expenses will exceed these amounts to the extent that the Fund incurs expenses excluded from the expense cap. The Advisor can be reimbursed by the Fund within three years after the date the fee limitation and/or expense reimbursement has been made by the Advisor, provided that such repayment does not cause the expenses of any class of the Fund to exceed the foregoing limits. The fee limitation and/or expense reimbursement may be terminated or amended prior to March 31, 2013 with the approval of the Trust’s Board of Trustees. During the period ended May 31, 2012, the Advisor did not recoup any expenses. For the period ended May 31, 2012, the advisor waived expenses totaling $133,320 which are eligible for recoupment through May 31, 2015.
Certain trustees and officers of the Trust are also officers of the Advisor.
Distribution Plan:
The Fund has adopted Distribution Plans, pursuant to Rule 12b-1 under the 1940 Act (the “Distribution Plans”) with respect to its Class A and Class C Shares. The Distribution Plans authorize payments by the Fund to finance activities intended to result in the sale of Class A and Class C Shares and shareholder services. The Distribution Plan provides that the Debt Fund may incur distribution expenses of 0.25% and 1.00%, respectively, of the average daily net assets of the Fund’s Class A and Class C Shares.
| 12 |
SteelPath MLP and Infrastructure Debt Fund Semi-Annual Report
|
NOTES TO THE FINANCIAL STATEMENTS (Continued)
May 31, 2012 (Unaudited)
4. Purchases and Sales of Securities:
Purchases and sales of investment securities, excluding short-term securities for the period ended May 31, 2012, totaled:
|
Debt Fund
|
||||
|
Purchases
|
$ | 325,383 | ||
|
Sales
|
0 | |||
There were no purchases or sales of U.S. government securities for the period.
5. Federal Tax Information:
At May 31, 2012, gross unrealized appreciation and depreciation of investments, based on cost for Federal income tax purposes were as follows:
|
Debt Fund
|
||||
|
Cost of Investments
|
$ | 325,073 | ||
|
Gross Unrealized Appreciation
|
$ | 2,939 | ||
|
Gross Unrealized Depreciation
|
(4,681 | ) | ||
|
Net Unrealized Appreciation (Depreciation) on Investments
|
$ | (1,742 | ) | |
The difference between cost amounts for financial statement and federal income tax purposes is due primarily to timing differences in recognizing certain gains and losses in security transactions.
6. Concentration of Risk:
Under normal circumstances, the Fund intends to invest at least 80% of their total assets in debt and equity securities of MLPs, and energy infrastructure companies which are subject to certain risks, such as supply and demand risk, depletion and exploration risk, commodity pricing risk, acquisition risk, and the risk associated with the hazards inherent in midstream energy industry activities.
7. Control Ownership:
The beneficial ownership, either directly or indirectly, of more than 25% of the voting securities creates a presumption of control of the Funds, under Section 2(a)(9) of the 1940 Act. As of June 30, 2012, SteelPath Fund Advisors, LLC had ownership in the SteelPath MLP and Infrastructure Debt Fund, Class I in the amount of 58.2%.
8. Subsequent Event:
On July 16, 2012, the Advisor entered into an agreement with OppenheimerFunds, Inc. (“Oppenheimer”) pursuant to which Oppenheimer will acquire substantially all of the assets of the Advisor and certain of its affiliates. The transaction is scheduled to close (the “Closing”) in the fourth quarter of this year. The Closing is subject to certain conditions and approvals.
The Funds’ investment advisory agreements with the Advisor will terminate upon the Closing. Accordingly, the Funds’ Board and shareholders will be asked to approve investment advisory agreements with a new investment adviser affiliated with Oppenheimer. It is expected that the Advisor’s investment team and portfolio managers who currently manage the Funds will continue to manage the Funds after the acquisition as employees of the new Oppenheimer investment adviser. Subject to Board approval, a special meeting of the Funds’ shareholders will be held to consider the new investment advisory agreements and such other matters as the Board may deem appropriate. Before the special meeting, shareholders of the Funds will receive proxy materials that discuss the proposed new agreements and other matters.
Subsequent events occurring have been evaluated for potential impact to this report through the date these financial statements and notes to the financial statements were issued. There were no additional subsequent events to report that would have a material impact on the financial statements and notes to the financial statements.
|
May 31, 2012
|
13 |
EXPENSE EXAMPLE
May 31, 2012 (Unaudited)
As a shareholder of the Fund, you may incur two types of costs: (1) transaction costs, including sales charges (loads) on purchase payments; potential deferred sales charges for redemptions within one year of purchase; and (2) ongoing costs, including investment advisory fees, distribution and service (12b-1) fees, and other Fund expenses. This example is intended to help you understand your ongoing costs (in dollars) of investing in the Fund and to compare these costs with the ongoing costs of investing in other mutual funds.
The example is based on an investment of $1,000 invested at the beginning of the period and held for the entire period (December 1, 2011 through May 31, 2012).
Actual Expenses
The first lines of the table below with respect to each class of shares of the Fund provide information about actual account values and actual expenses. You may use the information in these lines, together with the amount you invested, to estimate the expenses that you paid over the period. Simply divide your account value by $1,000 (for example, an $8,600 account value divided by $1,000 = 8.6), then multiply the result by the number in the first line under the heading entitled “Expenses Paid During the Period Ended May 31, 2012” to estimate the expenses you paid on your account during this period. The only transaction fee you may be required to pay is for outgoing wire transfers charged by UMB Fund Services, Inc., the Fund’s transfer agent. If you request that a redemption be made by wire transfer, currently the Fund’s transfer agent charges a $15 fee. You may also pay a small account fee of $24 if the value of your account with the Fund is less than $10,000. If you paid a transaction or a small account fee, you would add the fee amount of the expenses paid on your account this period to obtain your total expenses paid.
Hypothetical Example for Comparison Purposes
The second lines of the table below with respect to each class of shares of the Fund provide information about hypothetical account values and hypothetical expenses based on the Fund’s actual expense ratios and an assumed rate of return of 5% per year before expenses, which are not the Fund’s actual returns. The hypothetical account values and expenses may not be used to estimate the actual ending account balance or expenses you paid for the period. You may use this information to compare the ongoing costs of investing in the Fund and other funds. To do so, compare this 5% hypothetical example with the 5% hypothetical examples that appear in the shareholder reports of the other funds. A transaction fee of $15 may be assessed on outgoing wire transfers. You may also pay a small account fee of $24 if the value of your account with the Fund is less than $10,000. To include this fee in the calculation, you would add the estimated transaction fee to the hypothetical expenses shown in the table.
Please note that the expenses shown in the table are meant to highlight your ongoing costs only and do not reflect any transactional costs, such as sales charges (loads) or any costs that may be associated with investing in the Fund through a financial intermediary. Therefore, the second lines of the table are useful in comparing the ongoing costs only, and will not help you determine the relative total costs of owning different funds. In addition, if these transactional costs were included, your costs would have been higher.
|
Beginning
Account Value
December 1, 2011
|
Ending
Account Value
May 31, 2012
|
Expenses Paid During the
Six Month
Period Ended
May 31, 2012
|
Net Expense
Ratio Annualized
May 31, 2012#
|
Total Return
Period Ended
May 31, 2012
|
|
|
Debt Fund
|
|||||
|
Class A Actual (a)
|
$1,000.00
|
$993.00
|
$5.90
|
1.19%
|
(0.70)%
|
|
Class A Hypothetical (5% return before expenses)(a)
|
$1,000.00
|
$1,019.08
|
$5.97
|
1.19%
|
1.91%
|
|
Class I Actual (b)
|
$1,000.00
|
$992.00
|
$5.05
|
1.02%
|
(0.80)%
|
|
Class I Hypothetical (5% return before expenses)(b)
|
$1,000.00
|
$1,019.93
|
$5.12
|
1.02%
|
1.99%
|
|
*
|
Expenses are equal to the Fund’s annualized expense ratio (based upon the last six months) as reflected in the fourth column above, multiplied by the average account value over the period, multiplied by (# of days in most recent fiscal half-year divided by # of days in current fiscal year (183/366) to reflect the one-half year period.
|
|
(a)
|
Class inception date 2/7/2012.
|
|
(b)
|
Class inception date 1/3/2012.
|
| 14 |
SteelPath MLP and Infrastructure Debt Fund Semi-Annual Report
|
OTHER INFORMATION
May 31, 2012 (Unaudited)
Statement Regarding Availability of Quarterly Portfolio Schedule
The Fund files complete schedules of portfolio holdings for each Fund with the Securities and Exchange Commission (the “Commission”) for the first and third quarters of each fiscal year on Form N-Q. The Fund’s Forms N-Q are available on the Commission’s website at http://www.sec.gov. The Fund’s Form N-Q may be reviewed and copied at the Commission’s Public Reference Room in Washington, D.C., and information on the operation of the Public Reference Room may be obtained by calling 1-800-SEC-0330. The Funds make the information on Form N-Q available upon request without charge by calling the Funds at 1-888-614-6614
Statement Regarding Availability of Proxy Voting Policies and Procedures and Proxy Voting Record
A description of the policies and procedures the Fund uses to determine how to vote proxies relating to the portfolio securities is available without charge, upon request, by calling 1-888-614-6614 or on the Commission’s website at http://www.sec.gov. Information regarding how the Fund voted proxies relating to portfolio securities for the most recent 12-month period ended November 30, 2011 is available without charge, at the SEC’s website at http://www.sec.gov., or by calling the Fund at 1-888-614-6614.
Risk Disclosure
Investing in MLPs involves additional risks as compared to the risks of investing in common stock, including risks related to cash flow, dilution and voting rights. The Fund’s investments are concentrated in the energy infrastructure industry with an emphasis on securities issued by MLPs, which may increase price fluctuation. Energy infrastructure companies are subject to risks specific to the industry, such as fluctuations in commodity prices, reduced volumes of natural gas or other energy commodities, environmental hazards, changes in the macroeconomic or the regulatory environment or extreme weather. MLPs may trade less frequently than larger companies due to their smaller capitalizations which may result in erratic price movement or difficulty in buying or selling. MLPs are subject to significant regulation and may be adversely affected by changes in the regulatory environment including the risk that an MLP could lose its tax status as a partnership. To the extent that the Fund invests in ETFs and other investment companies, there may be a duplication of advisory fees and other expenses.
To the extent that the Fund obtains leverage through borrowings, there will be the potential for greater gains and the risk of magnified losses. Investing debt securities involves additional risks including interest rate risk, credit risk and duration risk. High yield securities involve more risks than investment grade securities and tend to be more sensitive to economic conditions. Private equity investments may be subject to greater risks than investments in publicly traded companies due to limited public information and lack of regulatory oversight.
Availability of Additional Information
Investors should consider the Fund’s investment objectives, risks, charges, and expense carefully before investing. The prospectus and summary prospectus contain this and other important information about the Fund. Copies of the prospectus and summary prospectus may be obtained by visiting www.steelpath.com and should be read carefully before investing.
|
May 31, 2012
|
15 |
APPROVAL OF INVESTMENT ADVISORY AGREEMENT
At a meeting held on October 14, 2011, SteelPath MLP Fund Advisors, LLC (“SFA”) proposed that the Board of Trustees (the “Board” or “Trustees”) of the SteelPath MLP Funds Trust (“Trust”) approve the investment advisory agreement (“Agreement”) between SFA and the Trust, on behalf of the SteelPath MLP and Infrastructure Debt Fund (the “Fund”), a newly-created series of the Trust. The Board considered multiple factors when evaluating SFA and in approving the Agreement, including, but not limited to: (1) the nature, extent and quality of the services to be provided to the Fund under the Agreement; (2) the performance of the three operational series of the Trust (“operational SteelPath Funds”); (3) the projected level of fees and overall expenses of the Fund and how those fees and expenses compare to the operational SteelPath Funds and other mutual funds that invest in master limited partnerships (“MLP mutual funds”); (4) the costs to SFA of providing advisory services to the Fund and SFA’s projected profitability with respect to such services; (5) the anticipated effect of changes in the Fund’s asset levels on the advisory fee and overall expense ratio (“economies of scale”); and (6) benefits to be derived by SFA from its relationship with the Fund.
In considering the approval of the Agreement, the Board requested and reviewed information provided by SFA, including SFA’s responses to questions relating to its proposed management of the Fund, the personnel who would perform services for the Fund, the performance of the operational SteelPath Funds, the proposed investment advisory fee, the Fund’s projected expenses, SFA’s projected profitability and other information that the Board or SFA believed would be material to the Board’s consideration of the Agreement. In addition, legal counsel to the Independent Trustees provided the Board with a memorandum regarding its responsibilities pertaining to the approval of the Agreement. The Board did not identify any particular information that was most relevant to its determination to approve the Agreement and each Trustee may have afforded different weight to the various factors.
Nature, Extent, and Quality of Services. The Board considered SFA’s investment philosophy and investment process as well as the background and experience of the portfolio managers who would manage the Fund. SFA represented to the Board that it would manage the Fund using the same fundamentally-focused approach to investing as SFA uses for the operational SteelPath Funds, but that unlike the operational SteelPath Funds, the Fund would invest in the debt securities, including the high yield debt securities, of energy infrastructure companies. The Board considered SFA’s investment resources and infrastructure and the adequacy of its compliance program. The Board also considered additional services that SFA provides to the operational SteelPath Funds, including monitoring the quality of services provided by the Trust’s other service providers and the coordination of marketing initiatives. Based on this information, the Board concluded that the nature, extent and quality of the advisory services to be provided by SFA were appropriate for the Fund in light of its investment objective and, thus, supported a decision to approve the Agreement.
Performance. The Board noted SFA’s representation that it does not currently manage accounts with comparable investment objectives and policies as the Fund. However, the Board considered the performance of the operational SteelPath Funds from their inception on March 31, 2010 through September 30, 2011 in comparison to the performance of the Lipper Equity Income Index, the S&P 500 Index and the Alerian MLP Index for the same period. The Board concluded that SFA’s historical investment performance record supported approval of the Agreement.
Comparisons of the amounts to be paid under the Agreement with the operational SteelPath Funds and other MLP mutual funds. In evaluating the Agreement, the Board reviewed the proposed advisory fee rate for services to be performed on behalf of the Fund. The Board considered SFA’s representation that the proposed fee rate, which is higher than the fee rate for two of the operational SteelPath Funds, is appropriate because the Fund’s use of debt securities, including high yield debt securities, will require SFA to commit additional resources to the management of the Fund. The Board also considered that the proposed fee rate is the same as SFA’s standard fee for separately managed accounts. The Board also noted SFA’s intention to cap the Fund’s total annual operating expenses at competitive levels. This information assisted the Board in concluding that SFA’s advisory fee rate under the Agreement appeared to be within a reasonable range for the services to be provided to the Fund, in light of all the factors considered.
Costs of the services to be provided and profits to be realized by SFA and its affiliates from the relationship with the Fund. The Board considered SFA’s projected profitability in the first year of the Fund’s operations. Recognizing that SFA’s projected profitability was dependent on the Fund’s asset levels, competitive performance and the maintenance of competitive expense levels, the Board concluded that SFA’s projected profitability was reasonable and supported approval of the Agreement.
| 16 |
SteelPath MLP and Infrastructure Debt Fund Semi-Annual Report
|
APPROVAL OF INVESTMENT ADVISORY AGREEMENT (Continued)
Extent to which economies of scale would be realized as the Fund grows and whether fee levels reflect these economies of scale for the benefit of Fund investors. The Board considered that the proposed advisory fee did not include breakpoints. However, the Board noted that, because the Fund had not commenced operations, there were no current economies of scale that would warrant a change in the proposed fee rate.
Benefits to be derived by SFA from the relationship with the Fund. The Board considered the “fall-out” or ancillary benefits that may accrue to SFA as a result of its advisory relationship with the Fund, including increased soft dollar credits and enhanced name recognition.
Board’s Conclusion. Based on the various considerations described above, the Board, including a majority of the Trustees who are not “interested persons,” as that term is defined in the Investment Company Act of 1940, as amended, of the Fund or SFA, concluded that the proposed investment advisory fee is reasonable and that the approval of the Agreement is in the best interests of the Fund and its shareholders and, as a result, approved the Agreement.
|
May 31, 2012
|
17 |
PRIVACY POLICY
As a customer of SteelPath MLP Funds Trust, or one of its affiliates, you may share with us non-public, personal information that we may use to provide products or services to you or your business. We are committed to protecting the confidentiality of any non-public, personal information that we collect.
This document summarizes the actions we have taken to ensure the privacy of the information you provide. We encourage you to read this document carefully and to contact us if you have any questions.
Collection of Information
SteelPath collects personal information so that we may offer the highest quality products and services. The information we gather and the extent to which we use it will vary depending on the product or service involved. We collect information that helps serve your financial needs; provide high levels of customer service; develop and offer new products or services for our customers; and fulfill legal and regulatory requirements. This information may include, but is not limited to, name, age, address, Social Security number, annual income, and relevant third-party reports.
Safeguards to Protect Your Personal Information
SteelPath has implemented security standards and processes—including physical, electronic and procedural safeguards—intended to protect the non-public, personal information our customers have entrusted to us.
SteelPath limits access to non-public, personal information to employees, registered representatives or agents who need information to provide our customers with products or services. These individuals are trained to respect the confidentiality of your information and expected to protect this information from inappropriate access, disclosure, and modification.
Disclosure of Information
SteelPath may disclose non-public, personal information you provide, as required to conduct our business and as permitted or required by law. We may share your information with regulatory or law enforcement agencies, reinsurers and others, as permitted or required by law.
SteelPath reserves the right to share or exchange non-public, personal information with companies engaged to work with us, such as third-party administrators and vendors hired to effect, administer or enforce a transaction that you request or authorize; to develop or maintain software; to perform market research; or to provide us with demographic information to develop marketing plans. We require these companies to maintain the confidentiality of customer information and use it only for the purpose for which it was provided.
SteelPath does not however, sell or share customer information with outside parties who want to market their products to you. We will not share non-public, personal information with third-party financial services entities, such as banks, credit unions, credit union service corporations, insurance companies, or securities broker-dealers, for purposes of joint marketing unless you direct us to, or unless we notify you first.
Further Information
If you have questions about our privacy policy, or if you would like to request information we have on file, please write to us at our primary office, SteelPath Fund Advisors LLC, 2100 McKinney Avenue, Suite 1825, Dallas, TX 75201. Please provide your complete name and address. For more detailed information about our privacy policy, please email us at privacy@SteelPath.com or call at 214-740-6040.
Our Commitment to Privacy
In the financial services business, lasting relationships are built upon mutual respect and trust. With that in mind, we will review and revise our privacy policy and procedures at minimum once per year. If any provision of our privacy policy is found to be non-compliant, then that provision will be modified to reflect the appropriate state or federal requirement. If any modifications are made, all remaining provisions of this privacy policy will remain in effect. While our policy may change from time to time, you can always review our current policy online at www.SteelPath.com/privacypolicy.html.
| 18 |
SteelPath MLP and Infrastructure Debt Fund Semi-Annual Report
|
[This page intentionally left blank]
[This page intentionally left blank]
[This page intentionally left blank]

Item 2. Code of Ethics.
Not applicable to semi-annual reports.
Item 3. Audit Committee Financial Expert.
Not applicable to semi-annual reports.
Item 4. Principal Accountant Fees and Services.
Not applicable to semi-annual reports.
Item 5. Audit Committee of Listed Registrants.
Not applicable to semi-annual reports.
Item 6. Investments.
Schedules of Investments are included as part of the report to shareholders filed under Item 1 of this Form.
Item 7. Disclosure of Proxy Voting Policies and Procedures for Closed-End Management Investment Companies.
Not applicable.
Item 8. Portfolio Managers of Closed-End Management Investment Companies.
Not applicable.
Item 9. Purchases of Equity Securities by Closed-End Management Investment Company and Affiliated Purchasers.
Not applicable.
Item 10. Submission of Matters to a Vote of Security Holders.
The registrant has not established procedures by which shareholders may recommend nominees to the registrant’s board of trustees.
Item 11. Controls and Procedures.
|
(a)
|
The registrant’s President/Chief Executive Officer and Treasurer/Chief Financial Officer have reviewed the Registrant's disclosure controls and procedures (as defined in Rule 30a-3(c) under the Investment Company Act of 1940, as amended, (the “Act”)) as of a date within 90 days of the filing of this report, as required by Rule 30a-3(b) under the Act and Rules 13a-15(b) or 15d-15(b) under the Securities Exchange Act of 1934. Based on their review, such officers have concluded that the disclosure controls and procedures are effective in ensuring that information required to be disclosed in this report is appropriately recorded, processed, summarized and reported and made known to them by others within the Registrant and by the Registrant’s service providers.
|
|
(b)
|
There were no changes in the Registrant’s internal control over financial reporting (as defined in Rule 30a-3(d) under the Act) that occurred during the Registrant’s second fiscal quarter of the period covered by this report that materially affected, or were reasonably likely to materially affect, the Registrant’s internal control over financial reporting.
|
Item 12. Exhibits.
|
(a)
|
(1)
|
Any code of ethics or amendment thereto, that is the subject of the disclosure required by Item 2, to the extent that the registrant intends to satisfy Item 2 requirements through filing exhibit.
|
Not applicable.
|
|
(2)
|
A separate certification for each principal executive and principal financial officer pursuant to Section 302 of the Sarbanes-Oxley Act of 2002. Filed herewith.
|
|
|
(3)
|
Any written solicitation to purchase securities under Rule 23c-1 under the Act sent or given during the period covered by the report by or on behalf of the registrant to 10 or more persons. Not applicable.
|
|
(b)
|
Certification pursuant to Section 906 of the Sarbanes-Oxley Act of 2002. Filed herewith.
|
SIGNATURES
Pursuant to the requirements of the Securities Exchange Act of 1934 and the Investment Company Act of 1940, the registrant has duly caused this report to be signed on its behalf by the undersigned, thereunto duly authorized.
SteelPath MLP Funds Trust
|
/s/ Gabriel Hammond
|
||
|
By: Gabriel Hammond
|
||
|
President and Principal Executive Officer
|
||
|
Date
|
8/1/2012 | |
Pursuant to the requirements of the Securities Exchange Act of 1934 and the Investment Company Act of 1940, this report has been signed below by the following persons on behalf of the registrant and in the capacities and on the date indicated.
|
/s/ Gabriel Hammond
|
||
|
By: Gabriel Hammond
|
||
|
President and Principal Executive Officer
|
||
|
Date
|
8/1/2012 | |
|
/s/ Stuart Cartner
|
||
|
By: Stuart Cartner
|
||
|
Vice President, Treasurer and Principal Financial Officer
|
||
|
Date
|
8/3/2012 | |