SECURITIES AND EXCHANGE COMMISSION
WASHINGTON, D.C. 20549
FORM 8-K
CURRENT REPORT
Pursuant to Section 13 or 15(d) of
the Securities Exchange Act of 1934
Date of Report (Date of earliest event reported): March 2, 2016
Pure Storage, Inc.
(Exact name of Registrant as Specified in Its Charter)
Delaware |
|
001-37570 |
|
27-1069557 |
|
|
|
|
|
(State or Other Jurisdiction |
|
(Commission |
|
(IRS Employer Identification No.) |
650 Castro Street, Suite 400
Mountain View, California 94041
(Address of Principal Executive Offices)
(800) 379-7873
(Registrant’s Telephone Number, Including Area Code)
Not Applicable
(Former Name or Former Address, if Changed Since Last Report)
Check the appropriate box below if the Form 8-K filing is intended to simultaneously satisfy the filing obligation of the registrant under any of the following provisions (see General Instructions A.2. below):
o |
Written communications pursuant to Rule 425 under the Securities Act (17 CFR 230.425) |
o |
Soliciting material pursuant to Rule 14a-12 under the Exchange Act (17 CFR 240.14a-12) |
o |
Pre-commencement communications pursuant to Rule 14d-2(b) under the Exchange Act (17 CFR 240.14d-2(b)) |
o |
Pre-commencement communications pursuant to Rule 13e-4(c) under the Exchange Act (17 CFR 240.13e-4(c)) |
Item 2.02. Results of Operations and Financial Condition.
On March 2, 2016, Pure Storage, Inc. (“Pure Storage”) issued a press release regarding its financial results for the quarter and the fiscal year ended January 31, 2016. A copy of the press release is furnished as Exhibit 99.1 to this Form 8-K. Pure Storage issued a blog post in connection with the press release, the full text of which is furnished as Exhibit 99.2 to this Current Report on Form 8-K and is incorporated under this Item 2.02 by reference.
This information, including the exhibits hereto, shall not be deemed “filed” for purposes of Section 18 of the Securities Exchange Act of 1934, as amended (the “Exchange Act”), or incorporated by reference in any filing under the Securities Act of 1933, as amended, or the Exchange Act, except as shall be expressly set forth by specific reference in such a filing.
Pure Storage is making reference to non-GAAP financial information in the press release, the blog and the conference call. A reconciliation of these non-GAAP financial measures to the comparable GAAP financial measures is contained in the attached press release. These non-GAAP financial measures are reported in addition to, and not as a substitute for, or superior to, financial measures calculated in accordance with GAAP.
Item 9.01. Financial Statements and Exhibits.
(d) Exhibits.
The following exhibits are furnished herewith:
Exhibit No. |
|
Description |
99.1 99.2 |
|
Press Release entitled “Pure Storage Announces Fourth Quarter and Fiscal Year 2016 Financial Results” Blog Post entitled “Dietz on the Day: Pure Storage Q4 and Full Year Results”
|
Pursuant to the requirements of the Securities and Exchange Act of 1934, the Registrant has duly caused this report to be signed on its behalf by the undersigned thereunto duly authorized.
Pure Storage, Inc. |
||
(Registrant) |
||
|
|
|
By: |
|
/s/ SCOTT DIETZEN |
|
|
Scott Dietzen |
|
|
Chief Executive Officer |
March 2, 2016
Exhibit No. |
|
Description |
99.1 99.2 |
|
Press Release entitled “Pure Storage Announces Fourth Quarter and Fiscal Year 2016 Financial Results” Blog Post entitled “Dietz on the Day: Pure Storage Q4 and Full Year Results”
|
Exhibit 99.1
Pure Storage Announces Fourth Quarter and Fiscal Year 2016 Financial Results
|
· |
Record Quarterly Revenue of $150.2 million, up 128% Y-Y |
|
· |
Record Full Year Revenue of $440.3 million, up 152% Y-Y |
|
· |
Record Quarterly Gross Margin: 65.3% GAAP, up 10.1 ppts Y-Y; 66.0% non-GAAP, up 10.4 ppts Y-Y |
|
· |
Record Quarterly Operating Margin: -28.6% GAAP, up 41.3 ppts Y-Y; -13.9% non-GAAP, up 43.6 ppts Y-Y |
Mountain View, Calif. - March 2, 2016 – Pure Storage (NYSE: PSTG) today announced financial results for the fourth quarter and fiscal year ended January 31, 2016.
Pure Storage posted revenue of $150.2 million compared to revenue of $65.9 million in the year-ago quarter. For the fourth quarter of fiscal 2016, GAAP gross margin was 65.3% and GAAP product gross margin was 68.2%, compared to 55.2% and 58.3%, respectively, in the year-ago quarter. GAAP net loss was $44.3 million for the fourth quarter of fiscal 2016, compared to $47.6 million in the year-ago quarter. Non-GAAP gross margin was 66.0% and non-GAAP product gross margin was 68.3%, compared to 55.6% and 58.3%, respectively, in the year-ago quarter. Non-GAAP net loss was $22.3 million for the fourth quarter of fiscal 2016, compared to $39.5 million in the year-ago quarter.
“We delivered our best ever quarter in Q4, concluding another record setting year for Pure Storage. The business continues to run on all cylinders fueled by the rapid worldwide adoption of FlashArray combined with improved operating efficiency as we scale,” said Scott Dietzen, CEO of Pure Storage. “We grew our customer base by more than 120 percent over the past year, capitalizing on the accelerating secular shift to flash and cloud-friendly storage. Pure is uniquely well positioned to succeed in the year ahead given our differentiation across the board in software, hardware, support automation and our business model.”
“We continue to achieve excellent performance in gross margin, operating margin and cash flow during Q4 and year over year,” said Tim Riitters, CFO of Pure Storage. “We are confident in the strength of our business model and estimate an earlier timeframe to achieve sustained positive free cash flow, in the second half of calendar year 2017 versus our previous estimate of 2018. We will continue to make investments in sales, marketing, and engineering, particularly in the first half of this year which is a seasonal investment period for Pure.”
Pure Storage grew its customer base to more than 1,650 organizations, adding more than 300 new customers in the quarter, including the MERCEDES AMG PETRONAS Formula OneTM Team and the three-time World Series Champion San Francisco Giants.
Fourth Quarter Fiscal 2016 Financial Highlights
The following tables summarize our consolidated financial results for the fourth quarters ended January 31, 2015 and 2016 (in millions except per share amounts, unaudited):
GAAP Quarterly Financial Information |
|||
|
Three Months Ended January 31, 2015 |
Three Months Ended January 31, 2016 |
Year-Over-Year Change |
Revenue |
$65.9 |
$150.2 |
128% |
Gross Margin |
55.2% |
65.3% |
10.1ppts |
Product Gross Margin |
58.3% |
68.2% |
9.9ppts |
Support Gross Margin |
33.0% |
49.5% |
16.5ppts |
Loss from Operations |
-$46.0 |
-$42.9 |
$3.1 |
Operating Margin |
-69.9% |
-28.6% |
41.3ppts |
Net Loss |
-$47.6 |
-$44.3 |
$3.3 |
Net Loss per Share (Basic and Diluted) |
-$1.52 |
-$0.24 |
$1.28 |
Weighted-Average Shares (Basic and Diluted) |
31.4 |
187.4 |
N/A |
1
Non-GAAP Quarterly Financial Information |
|||
|
Three Months Ended January 31, 2015 |
Three Months Ended January 31, 2016 |
Year-Over-Year Change |
Gross Margin |
55.6% |
66.0% |
10.4ppts |
Product Gross Margin |
58.3% |
68.3% |
10.0ppts |
Support Gross Margin |
35.7% |
53.4% |
17.7ppts |
Loss from Operations |
-$37.9 |
-$20.9 |
$17.0 |
Operating Margin |
-57.5% |
-13.9% |
43.6ppts |
Net Loss |
-$39.5 |
-$22.3 |
$17.2 |
Net Loss per Share (Basic and Diluted) |
-$0.26 |
-$0.12 |
$0.14 |
Weighted-Average Shares (Basic and Diluted) |
153.6 |
187.4 |
N/A |
Free Cash Flow |
-$45.3 |
$32.1 |
$77.4 |
A reconciliation between GAAP and non-GAAP information is provided at the end of this release.
Financial Outlook
First Quarter Fiscal 2017 Guidance:
|
· |
Revenue in the range of $135 million to $139 million |
|
· |
Non-GAAP gross margin in the range of 65% to 68% |
|
· |
Non-GAAP operating margin in the range of (34%) to (30%) |
Full Year Fiscal 2017 Guidance:
|
· |
Revenue in the range of $685 million to $725 million |
|
· |
Non-GAAP gross margin in the range of 65% to 68% |
|
· |
Non-GAAP operating margin in the range of (22%) to (18%) |
All forward-looking non-GAAP financial measures contained in this section titled “Financial Outlook” exclude stock-based compensation expense and, as applicable, other special items. We have not reconciled guidance for non-GAAP gross margin and non-GAAP operating margin to their most directly comparable GAAP measures because such items that impact these measures are not within our control and/or cannot be reasonably predicted. Accordingly, a reconciliation of the non-GAAP financial measure guidance to the corresponding GAAP measures is not available without unreasonable effort.
Conference Call Information
Pure Storage will host a teleconference to discuss fourth quarter fiscal 2016 results at 2:00 pm (PT) on March 2, 2016. Pure Storage will post its supplemental earnings presentation to the investor relations website at investor.purestorage.com following the conference call. Teleconference details are as follows:
|
· |
To Listen Via Telephone: 877-883-0383 or 412-902-6506 (for international callers) with passcode 5996290 |
|
· |
To Listen via the Internet: A live and replay audio broadcast of the conference call with corresponding slides will be available at http://investor.purestorage.com/. |
|
· |
Replay: A telephone playback of this conference call is scheduled to be available beginning at 4:00 pm (PT) on March 2, 2016, through 4:00 pm (PT) on March 10, 2016. The replay will be accessible by calling 877-344-7529 (international callers: 412-317-0088), with access code 10080850. The call runs 24 hours per day, including weekends. |
A replay of the webcast will be available for approximately 45 days.
CEO Commentary
Pure Storage has posted a blog from its CEO discussing fourth quarter and full fiscal year results at investor.purestorage.com and blog.purestorage.com.
Upcoming Investor Conference
Pure Storage Vice President of Product, Matthew Kixmoeller, will be participating in a fireside chat at the Morgan Stanley Technology, Media and Telecom Conference in San Francisco on Thursday, March 3, 2016 at 9:55 am (PT).
2
Pure Storage (NYSE: PSTG) accelerates possible, transforming businesses in ways previously unimagined. The company’s disruptive, software-driven storage technology combined with a customer-friendly business model drives business and IT transformation for customers through dramatic increases in performance and efficiency at lower costs. Pure Storage FlashArray//m is simpler, faster and more elegant than any other technology in the datacenter. FlashArray //m is ideal for the move toward big data and for performance-intensive workloads such as cloud computing, database systems, desktop virtualization, real-time analytics and server virtualization. With Pure's certified industry leading NPS score of 79, Pure customers are some of the happiest in the world, and include large and mid-size organizations across a range of industries: cloud-based software and service providers, consumer web, education, energy, financial services, governments, healthcare, manufacturing, media, retail and telecommunications. With Pure Storage, companies push the boundaries of what's possible to become faster, smarter and more innovative.
Join us in March 2016 for the first annual Pure//Accelerate conference, as disruptive to the tech conference space as Pure Storage is to the datacenter, Pure//Accelerate will bring current and future technology/business leaders together to share in a dialogue about what is possible…for their businesses and for themselves.
Forward Looking Statements
This press release contains forward-looking statements regarding our products, business and operations, including our expectations regarding technology differentiation and customer adoption, our ability to maintain growth and take market share, and our financial outlook for the first quarter and full year fiscal 2017 and statements regarding our products, business, operations and results. Forward-looking statements are subject to known and unknown risks and uncertainties and are based on potentially inaccurate assumptions that could cause actual results to differ materially from those expected or implied by the forward-looking statements. Actual results may differ materially from the results predicted, and reported results should not be considered as an indication of future performance. The potential risks and uncertainties that could cause actual results to differ from the results predicted include, among others, those risks and uncertainties included under the captions “Risk Factors” and elsewhere in our filings and reports with the U.S. Securities and Exchange Commission, including, but not limited to, our Quarterly Report on Form 10-Q for the quarter ended October 31, 2015 and in the final Prospectus related to our initial public offering of Class A common stock filed pursuant to Rule 424(b) under the Securities Act of 1933 (Registration No. 333-206312), which are available on our investor relations website at investor.purestorage.com and on the SEC website at www.sec.gov. Additional information will also be set forth in our Annual Report on Form 10-K for the fiscal year ended January 31, 2016. All information provided in this release and in the attachments is as of March 2, 2016, and we undertake no duty to update this information unless required by law.
Non-GAAP Financial Measures
To supplement our condensed consolidated financial statements, which are prepared and presented in accordance with GAAP, we use the following non-GAAP financial measures: non-GAAP gross profit, non-GAAP gross margin, non-GAAP loss from operations, non-GAAP operating margin, non-GAAP net loss, non-GAAP net loss per share, free cash flow, and free cash flow as a percentage of revenue. In computing these non-GAAP financial measures, we exclude the effects of stock-based compensation expense and assumed preferred stock conversion. The presentation of this non-GAAP financial information is not intended to be considered in isolation or as a substitute for, or superior to, the financial information prepared and presented in accordance with GAAP.
We use these non-GAAP financial measures for financial and operational decision-making and as a means to evaluate period-to-period comparisons. Our management believes that these non-GAAP financial measures provide meaningful supplemental information regarding our performance and liquidity by excluding certain expenses and expenditures such as stock-based compensation expense that may not be indicative of our ongoing core business operating results. We believe that both management and investors benefit from referring to these non-GAAP financial measures in assessing our performance and when analyzing historical performance and liquidity and planning, forecasting, and analyzing future periods. The presentation of these non-GAAP financial measures is not meant to be considered in isolation or as a substitute for our financial results prepared in accordance with GAAP, and our non-GAAP measures may be different from non-GAAP measures used by other companies.
For a reconciliation of these non-GAAP financial measures to GAAP measures, please see the tables captioned "Reconciliations of non-GAAP results of operations to the nearest comparable GAAP measures" and "Reconciliation from net cash provided by (used in) operating activities to free cash flow," included at the end of this release.
Andy Connor – IR contact, Pure Storage
Tel: (650) 243-0481
ir@purestorage.com
3
Amy Cronk – PR contact, Pure Storage
Tel: (650) 468-4724
pr@purestorage.com
4
Condensed Consolidated Balance Sheets
(in thousands)
|
|
January 31, |
|
|
January 31, |
|
||
|
|
2015 |
|
|
2016 |
|
||
|
|
|
|
|
|
(unaudited) |
|
|
Assets |
|
|
|
|
|
|
|
|
Current assets: |
|
|
|
|
|
|
|
|
Cash and cash equivalents |
|
$ |
192,707 |
|
|
$ |
604,742 |
|
Accounts receivable, net of allowance of $210 and $944 |
|
|
59,032 |
|
|
|
126,324 |
|
Inventory |
|
|
21,605 |
|
|
|
20,649 |
|
Deferred commissions, current |
|
|
9,431 |
|
|
|
15,703 |
|
Prepaid expenses and other current assets |
|
|
11,195 |
|
|
|
20,652 |
|
Total current assets |
|
|
293,970 |
|
|
|
788,070 |
|
Property and equipment, net |
|
|
39,859 |
|
|
|
52,629 |
|
Intangible assets, net |
|
|
8,284 |
|
|
|
6,980 |
|
Deferred income taxes, non-current |
|
|
— |
|
|
|
536 |
|
Other long-term assets |
|
|
14,177 |
|
|
|
22,568 |
|
Total assets |
|
$ |
356,290 |
|
|
$ |
870,783 |
|
|
|
|
|
|
|
|
|
|
Liabilities, convertible preferred stock, and stockholders' (deficit) equity |
|
|
|
|
|
|
|
|
Current liabilities: |
|
|
|
|
|
|
|
|
Accounts payable |
|
$ |
11,007 |
|
|
$ |
38,187 |
|
Accrued compensation and benefits |
|
|
13,811 |
|
|
|
32,995 |
|
Accrued expenses and other liabilities |
|
|
6,106 |
|
|
|
14,076 |
|
Deferred revenue, current |
|
|
32,199 |
|
|
|
94,514 |
|
Liability related to early exercised stock options |
|
|
6,485 |
|
|
|
4,760 |
|
Total current liabilities |
|
|
69,608 |
|
|
|
184,532 |
|
Deferred revenue, non-current |
|
|
41,470 |
|
|
|
121,690 |
|
Deferred income taxes, non-current |
|
|
300 |
|
|
|
— |
|
Other long-term liabilities |
|
|
802 |
|
|
|
1,207 |
|
Total liabilities |
|
|
112,180 |
|
|
|
307,429 |
|
Convertible preferred stock |
|
|
543,940 |
|
|
|
— |
|
Stockholders’ (deficit) equity: |
|
|
|
|
|
|
|
|
Common stock and additional paid-in capital |
|
|
41,753 |
|
|
|
1,118,689 |
|
Accumulated deficit |
|
|
(341,583 |
) |
|
|
(555,335 |
) |
Total stockholders' (deficit) equity |
|
|
(299,830 |
) |
|
|
563,354 |
|
|
|
|
|
|
|
|
|
|
Total liabilities, convertible preferred stock, and stockholders' equity |
|
$ |
356,290 |
|
|
$ |
870,783 |
|
5
Condensed Consolidated Statements of Operations
(in thousands, except per share data)
|
|
Three Months Ended January 31, |
|
|
Twelve Months Ended January 31, |
|
||||||||||
|
|
2015 |
|
|
2016 |
|
|
2015 |
|
|
2016 |
|
||||
|
|
(unaudited) |
|
|
|
|
|
|
(unaudited) |
|
||||||
Revenue: |
|
|
|
|
|
|
|
|
|
|
|
|
|
|
|
|
Product |
|
$ |
57,830 |
|
|
$ |
127,350 |
|
|
$ |
154,836 |
|
|
$ |
375,733 |
|
Support |
|
|
8,020 |
|
|
|
22,881 |
|
|
|
19,615 |
|
|
|
64,600 |
|
Total revenue |
|
|
65,850 |
|
|
|
150,231 |
|
|
|
174,451 |
|
|
|
440,333 |
|
|
|
|
|
|
|
|
|
|
|
|
|
|
|
|
|
|
Cost of revenue: |
|
|
|
|
|
|
|
|
|
|
|
|
|
|
|
|
Product (1) |
|
|
24,141 |
|
|
|
40,522 |
|
|
|
63,425 |
|
|
|
132,870 |
|
Support (1) |
|
|
5,376 |
|
|
|
11,544 |
|
|
|
14,127 |
|
|
|
35,023 |
|
Total cost of revenue |
|
|
29,517 |
|
|
|
52,066 |
|
|
|
77,552 |
|
|
|
167,893 |
|
|
|
|
|
|
|
|
|
|
|
|
|
|
|
|
|
|
Gross profit |
|
|
36,333 |
|
|
|
98,165 |
|
|
|
96,899 |
|
|
|
272,440 |
|
|
|
|
|
|
|
|
|
|
|
|
|
|
|
|
|
|
Operating expenses: |
|
|
|
|
|
|
|
|
|
|
|
|
|
|
|
|
Research and development (1) |
|
|
29,311 |
|
|
|
53,710 |
|
|
|
92,707 |
|
|
|
166,645 |
|
Sales and marketing (1) |
|
|
42,533 |
|
|
|
68,927 |
|
|
|
152,320 |
|
|
|
240,574 |
|
General and administrative (1) (2) |
|
|
10,520 |
|
|
|
18,461 |
|
|
|
32,354 |
|
|
|
75,402 |
|
Total operating expenses |
|
|
82,364 |
|
|
|
141,098 |
|
|
|
277,381 |
|
|
|
482,621 |
|
|
|
|
|
|
|
|
|
|
|
|
|
|
|
|
|
|
Loss from operations |
|
|
(46,031 |
) |
|
|
(42,933 |
) |
|
|
(180,482 |
) |
|
|
(210,181 |
) |
Other income (expense), net |
|
|
(695 |
) |
|
|
(757 |
) |
|
|
(1,412 |
) |
|
|
(2,002 |
) |
Loss before provision for income taxes |
|
|
(46,726 |
) |
|
|
(43,690 |
) |
|
|
(181,894 |
) |
|
|
(212,183 |
) |
Provision for income taxes |
|
|
909 |
|
|
|
604 |
|
|
|
1,337 |
|
|
|
1,569 |
|
Net loss |
|
$ |
(47,635 |
) |
|
$ |
(44,294 |
) |
|
$ |
(183,231 |
) |
|
$ |
(213,752 |
) |
Net loss per share attributable to common stockholders, basic and diluted |
|
$ |
(1.52 |
) |
|
$ |
(0.24 |
) |
|
$ |
(6.56 |
) |
|
$ |
(2.59 |
) |
|
|
|
|
|
|
|
|
|
|
|
|
|
|
|
|
|
Weighted-average shares used in computing net loss per share attributable to common stockholders, basic and diluted |
|
|
31,357 |
|
|
|
187,365 |
|
|
|
27,925 |
|
|
|
82,460 |
|
(1) Includes stock-based compensation expense as follows:
Cost of revenue -- product |
|
$ |
39 |
|
|
$ |
137 |
|
|
$ |
303 |
|
|
$ |
276 |
|
Cost of revenue -- support |
|
|
216 |
|
|
|
877 |
|
|
|
1,273 |
|
|
|
2,388 |
|
Research and development |
|
|
3,966 |
|
|
|
12,511 |
|
|
|
22,512 |
|
|
|
31,135 |
|
Sales and marketing |
|
|
2,790 |
|
|
|
6,427 |
|
|
|
22,466 |
|
|
|
16,966 |
|
General and administrative |
|
|
1,148 |
|
|
|
2,075 |
|
|
|
6,479 |
|
|
|
7,460 |
|
Total stock-based compensation expense |
|
$ |
8,159 |
|
|
$ |
22,027 |
|
|
$ |
53,033 |
|
|
$ |
58,225 |
|
(2) Includes a one-time charge of $11.9 million for an equity grant to the Pure Good Foundation in the twelve months ended January 31, 2016.
6
Condensed Consolidated Statements of Cash Flows
(in thousands)
|
|
Three Months Ended January 31, |
|
|
Twelve Months Ended January 31, |
|
||||||||||
|
|
2015 |
|
|
2016 |
|
|
2015 |
|
|
2016 |
|
||||
|
|
(unaudited) |
|
|
|
|
|
|
(unaudited) |
|
||||||
Cash flows from operating activities |
|
|
|
|
|
|
|
|
|
|
|
|
|
|
|
|
Net loss |
|
$ |
(47,635 |
) |
|
$ |
(44,294 |
) |
|
$ |
(183,231 |
) |
|
$ |
(213,752 |
) |
Adjustments to reconcile net loss to net cash used in operating activities: |
|
|
|
|
|
|
|
|
|
|
|
|
|
|
|
|
Depreciation and amortization |
|
|
5,641 |
|
|
|
9,136 |
|
|
|
15,392 |
|
|
|
32,254 |
|
Stock-based compensation expense |
|
|
8,159 |
|
|
|
22,027 |
|
|
|
25,399 |
|
|
|
58,225 |
|
Contribution of common stock to Pure Good Foundation |
|
|
— |
|
|
|
— |
|
|
|
— |
|
|
|
11,900 |
|
Other |
|
|
273 |
|
|
|
(1,093 |
) |
|
|
277 |
|
|
|
(1,093 |
) |
Changes in operating assets and liabilities: |
|
|
|
|
|
|
|
|
|
|
|
|
|
|
|
|
Accounts receivable, net |
|
|
(13,462 |
) |
|
|
(14,198 |
) |
|
|
(44,197 |
) |
|
|
(67,292 |
) |
Inventory |
|
|
(641 |
) |
|
|
4,901 |
|
|
|
(13,713 |
) |
|
|
1,481 |
|
Deferred commissions |
|
|
(5,775 |
) |
|
|
(4,549 |
) |
|
|
(9,838 |
) |
|
|
(13,021 |
) |
Prepaid expenses and other assets |
|
|
(4,182 |
) |
|
|
(6,639 |
) |
|
|
(6,550 |
) |
|
|
(8,704 |
) |
Accounts payable |
|
|
(1,101 |
) |
|
|
14,677 |
|
|
|
3,474 |
|
|
|
24,901 |
|
Accrued compensation and other liabilities |
|
|
4,780 |
|
|
|
7,494 |
|
|
|
12,450 |
|
|
|
24,710 |
|
Deferred revenue |
|
|
19,924 |
|
|
|
54,548 |
|
|
|
56,842 |
|
|
|
142,535 |
|
Net cash provided by (used in) operating activities |
|
|
(34,019 |
) |
|
|
42,010 |
|
|
|
(143,695 |
) |
|
|
(7,856 |
) |
|
|
|
|
|
|
|
|
|
|
|
|
|
|
|
|
|
Cash flows from investing activities |
|
|
|
|
|
|
|
|
|
|
|
|
|
|
|
|
Purchases of property and equipment |
|
|
(11,325 |
) |
|
|
(9,861 |
) |
|
|
(42,227 |
) |
|
|
(39,355 |
) |
Purchases of intangible assets |
|
|
— |
|
|
|
— |
|
|
|
(9,125 |
) |
|
|
— |
|
Increase in restricted cash |
|
|
— |
|
|
|
— |
|
|
|
(1,613 |
) |
|
|
(2,485 |
) |
Net cash used in investing activities |
|
|
(11,325 |
) |
|
|
(9,861 |
) |
|
|
(52,965 |
) |
|
|
(41,840 |
) |
|
|
|
|
|
|
|
|
|
|
|
|
|
|
|
|
|
Cash flows from financing activities |
|
|
|
|
|
|
|
|
|
|
|
|
|
|
|
|
Proceeds from initial public offering, net |
|
|
— |
|
|
|
— |
|
|
|
— |
|
|
|
459,425 |
|
Proceeds from issuance of convertible preferred stock |
|
|
150 |
|
|
|
— |
|
|
|
280,970 |
|
|
|
— |
|
Net proceeds from exercise of stock options |
|
|
498 |
|
|
|
1,298 |
|
|
|
7,665 |
|
|
|
6,008 |
|
Repurchase of common stock in connection with tender offer |
|
|
— |
|
|
|
— |
|
|
|
(30,120 |
) |
|
|
— |
|
Payments of deferred offering costs |
|
|
(33 |
) |
|
|
(2,012 |
) |
|
|
(33 |
) |
|
|
(3,702 |
) |
Net cash provided by (used in) financing activities |
|
|
615 |
|
|
|
(714 |
) |
|
|
258,482 |
|
|
|
461,731 |
|
|
|
|
|
|
|
|
|
|
|
|
|
|
|
|
|
|
Net increase (decrease) in cash and cash equivalents |
|
|
(44,729 |
) |
|
|
31,435 |
|
|
|
61,822 |
|
|
|
412,035 |
|
Cash and cash equivalents, beginning of period |
|
|
237,436 |
|
|
|
573,307 |
|
|
|
130,885 |
|
|
|
192,707 |
|
Cash and cash equivalents, end of period |
|
$ |
192,707 |
|
|
$ |
604,742 |
|
|
$ |
192,707 |
|
|
$ |
604,742 |
|
7
Reconciliations of non-GAAP results of operations to the nearest comparable GAAP measures
The following table presents non-GAAP gross margins by revenue source before certain items (in thousands, unaudited):
|
|
Three Months Ended January 31, 2015 |
|
|
Three Months Ended January 31, 2016 |
|
||||||||||||||||||||||||||||||||||||
|
|
GAAP results |
|
|
GAAP gross margin (a) |
|
|
Adjustment |
|
|
|
Non- GAAP results |
|
|
Non- GAAP gross margin (b) |
|
|
GAAP results |
|
|
GAAP gross margin (a) |
|
|
Adjustment |
|
|
|
Non- GAAP results |
|
|
Non- GAAP gross margin (b) |
|
||||||||||
|
|
|
|
|
|
|
|
|
|
|
|
|
|
|
|
|
|
|
|
|
|
|
|
|
|
|
|
|
|
|
|
|
|
|
|
|
|
|
|
|
|
|
|
|
|
|
|
|
|
|
|
|
$ |
39 |
|
(c) |
|
|
|
|
|
|
|
|
|
|
|
|
|
|
|
|
|
$ |
137 |
|
(c) |
|
|
|
|
|
|
|
|
Gross profit -- product |
|
$ |
33,689 |
|
|
|
58.3 |
% |
|
$ |
39 |
|
|
|
$ |
33,728 |
|
|
|
58.3 |
% |
|
$ |
86,828 |
|
|
|
68.2 |
% |
|
$ |
137 |
|
|
|
$ |
86,965 |
|
|
|
68.3 |
% |
|
|
|
|
|
|
|
|
|
|
|
|
|
|
|
|
|
|
|
|
|
|
|
|
|
|
|
|
|
|
|
|
|
|
|
|
|
|
|
|
|
|
|
|
|
|
|
|
|
|
|
|
|
|
|
|
|
|
|
|
|
|
|
|
|
|
|
|
|
|
|
|
|
|
|
|
|
|
|
|
|
|
|
|
|
|
|
|
|
|
|
|
|
|
|
|
$ |
216 |
|
(c) |
|
|
|
|
|
|
|
|
|
|
|
|
|
|
|
|
|
$ |
877 |
|
(c) |
|
|
|
|
|
|
|
|
Gross profit -- support |
|
$ |
2,644 |
|
|
|
33.0 |
% |
|
$ |
216 |
|
|
|
$ |
2,860 |
|
|
|
35.7 |
% |
|
$ |
11,337 |
|
|
|
49.5 |
% |
|
$ |
877 |
|
|
|
$ |
12,214 |
|
|
|
53.4 |
% |
|
|
|
|
|
|
|
|
|
|
|
|
|
|
|
|
|
|
|
|
|
|
|
|
|
|
|
|
|
|
|
|
|
|
|
|
|
|
|
|
|
|
|
|
|
|
|
|
|
|
|
|
|
|
|
|
|
|
|
|
|
|
|
|
|
|
|
|
|
|
|
|
|
|
|
|
|
|
|
|
|
|
|
|
|
|
|
|
|
|
|
|
|
|
|
|
$ |
255 |
|
(c) |
|
|
|
|
|
|
|
|
|
|
|
|
|
|
|
|
|
$ |
1,014 |
|
(c) |
|
|
|
|
|
|
|
|
Total gross profit |
|
$ |
36,333 |
|
|
|
55.2 |
% |
|
$ |
255 |
|
|
|
$ |
36,588 |
|
|
|
55.6 |
% |
|
$ |
98,165 |
|
|
|
65.3 |
% |
|
$ |
1,014 |
|
|
|
$ |
99,179 |
|
|
|
66.0 |
% |
(a) GAAP gross margin is defined as gross profit divided by revenue.
(b) Non-GAAP gross margin is defined as non-GAAP gross profit divided by revenue.
(c) To eliminate stock-based compensation expense.
The following table presents certain non-GAAP consolidated results before certain items (in thousands, except per share amounts, unaudited):
|
|
Three Months Ended January 31, 2015 |
|
|
Three Months Ended January 31, 2016 |
|
||||||||||||||||||||||||||||||||||||
|
|
GAAP results |
|
|
GAAP operating margin (a) |
|
|
Adjustment |
|
|
|
Non- GAAP results |
|
|
Non- GAAP operating margin (b) |
|
|
GAAP results |
|
|
GAAP operating margin (a) |
|
|
Adjustment |
|
|
|
Non- GAAP results |
|
|
Non- GAAP operating margin (b) |
|
||||||||||
|
|
|
|
|
|
|
|
|
|
|
|
|
|
|
|
|
|
|
|
|
|
|
|
|
|
|
|
|
|
|
|
|
|
|
|
|
|
|
|
|
|
|
|
|
|
|
|
|
|
|
|
|
$ |
8,159 |
|
(c) |
|
|
|
|
|
|
|
|
|
|
|
|
|
|
|
|
|
$ |
22,027 |
|
(c) |
|
|
|
|
|
|
|
|
Loss from operations |
|
$ |
(46,031 |
) |
|
|
-69.9 |
% |
|
$ |
8,159 |
|
|
|
$ |
(37,872 |
) |
|
|
-57.5 |
% |
|
$ |
(42,933 |
) |
|
|
-28.6 |
% |
|
$ |
22,027 |
|
|
|
$ |
(20,906 |
) |
|
|
-13.9 |
% |
|
|
|
|
|
|
|
|
|
|
|
|
|
|
|
|
|
|
|
|
|
|
|
|
|
|
|
|
|
|
|
|
|
|
|
|
|
|
|
|
|
|
|
|
|
|
|
|
|
|
|
|
|
|
|
|
|
|
|
|
|
|
|
|
|
|
|
|
|
|
|
|
|
|
|
|
|
|
|
|
|
|
|
|
|
|
|
|
|
|
|
|
|
|
|
|
$ |
8,159 |
|
(c) |
|
|
|
|
|
|
|
|
|
|
|
|
|
|
|
|
|
$ |
22,027 |
|
(c) |
|
|
|
|
|
|
|
|
Net loss |
|
$ |
(47,635 |
) |
|
|
|
|
|
$ |
8,159 |
|
|
|
$ |
(39,476 |
) |
|
|
|
|
|
$ |
(44,294 |
) |
|
|
|
|
|
$ |
22,027 |
|
|
|
$ |
(22,267 |
) |
|
|
|
|
|
|
|
|
|
|
|
|
|
|
|
|
|
|
|
|
|
|
|
|
|
|
|
|
|
|
|
|
|
|
|
|
|
|
|
|
|
|
|
|
|
|
|
Net loss per share -- basic and diluted |
|
$ |
(1.52 |
) |
|
|
|
|
|
|
|
|
|
|
$ |
(0.26 |
) |
|
|
|
|
|
$ |
(0.24 |
) |
|
|
|
|
|
|
|
|
|
|
$ |
(0.12 |
) |
|
|
|
|
|
|
|
|
|
|
|
|
|
|
|
|
|
|
|
|
|
|
|
|
|
|
|
|
|
|
|
|
|
|
|
|
|
|
|
|
|
|
|
|
|
|
|
Weighted-average shares used in per share calculation -- basic and diluted |
|
|
31,357 |
|
|
|
|
|
|
|
122,281 |
|
(d) |
|
|
153,638 |
|
|
|
|
|
|
|
187,365 |
|
|
|
|
|
|
|
|
|
|
|
|
187,365 |
|
|
|
|
|
(a) GAAP operating margin is defined as loss from operations divided by revenue.
(b) Non-GAAP operating margin is defined as non-GAAP loss from operations divided by revenue.
(c) To eliminate stock-based compensation expense.
(d) To assume preferred stock conversion as of the beginning of the period.
8
Reconciliation from net cash provided by (used in) operating activities to free cash flow (in thousands, unaudited):
|
|
Three Months Ended January 31, |
|
|||||
|
|
2015 |
|
|
2016 |
|
||
Net cash provided by (used in) operating activities |
|
$ |
(34,019 |
) |
|
$ |
42,010 |
|
Less: purchases of property and equipment |
|
|
(11,325 |
) |
|
|
(9,861 |
) |
Free cash flow |
|
$ |
(45,344 |
) |
|
$ |
32,149 |
|
Free cash flow as % of revenue |
|
|
-68.9 |
% |
|
|
21.4 |
% |
9
Exhibit 99.2
Dietz on the Day: Pure Storage Q4 and Full Year Results
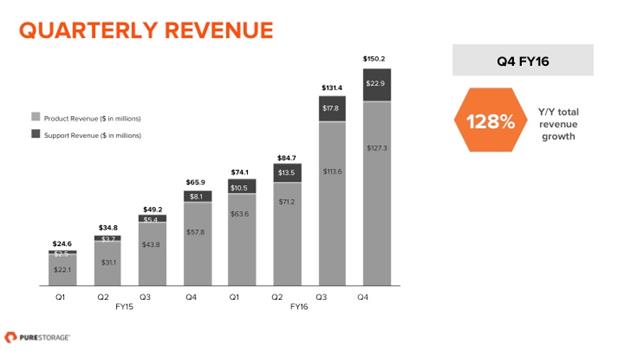
Our 4th quarter results wrap up another outstanding year for Pure Storage (NYSE: PSTG). Let me begin by quantifying our progress, and then turn to the road ahead.
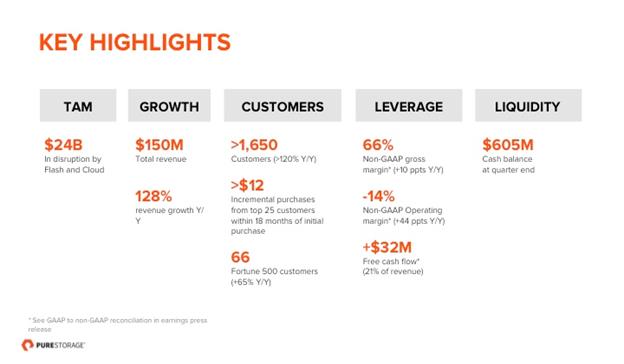
We are thrilled with the overall performance of our business. We achieved new high water marks in revenues of $150 million, total customers at 1,650+, non-GAAP product gross margins of 68% and non-GAAP operating margin of -14%. For the first time in company history, we generated free cash flow, adding $32 million (21% of our 4th quarter revenues) to our balance sheet, which stands at over $600 million. And in fact, we now expect to reach cash flow break-even on a sustained basis in the second half of 2017 - ahead of our previous projection of 2018. While we continue to invest aggressively in the business - R&D was 27% of revenue in the latest quarter - our operating expenses are growing considerably more slowly year over year than our top line.
We now count among our customers 66 of the Fortune 500 (up from 59 last quarter). Among our top 25 customers, each initial $1 spent on Pure Storage led to greater than $12 in the next 18 months.
We continue to align with partners that share our vision for the modern data center, such as ePlus, Datalink and SHI, who are strategically leading with Pure. We are committed to working diligently empower the channel, driving win/win partnerships while maintaining our industry-best customer satisfaction.
In our view, the secular shifts to flash and cloud-friendly storage are dominating enterprise data storage. Pure is enjoying perhaps the greatest growth in industry history, during what some are considering to be a challenging market for IT spending, because our platform is purpose-built for both. Pure is winning because our innovations are transforming the storage industry.
In 2011, we launched FlashArray, arguing then that all performance applications belonged on flash rather than mechanical disk, and moreover that Pure’s recipe actually saved customers money. In recent weeks, EMC and NetApp made it clear that they agree, with NetApp’s George Kurian stating that “Flash is becoming the de facto technology for primary workloads.” When incumbents who lead the market for disk-based storage, and hence the vendors with the most to lose, endorse our position, it further validates Pure’s founding vision.
Despite legacy vendor claims to the contrary, we remain convinced the transition to solid-state flash memory and the simplicity and elasticity demanded by the cloud require a holistic redesign of storage technology and business model. Loading SSDs into twenty year old designs crafted for mechanical disk and for traditional, services intensive IT cannot deliver on the promise of flash and cloud (see our recent blog This Is Your Father’s Storage Industry, But Not for Long).
Pure Storage’s success in disrupting the storage landscape and our differentiation is built on four pillars of innovation:
|
· |
Purpose-built flash and cloud software; |
|
· |
Efficient and extensible flash hardware; |
|
· |
Proactive and predictive cloud automation; and |
|
· |
Our disruptive Evergreen™ business model. |
Evidence that Pure is unique in getting this right can be seen in our industry leading:
|
· |
Growth – Pure continues to grow faster than any systems vendor we have done compares with, including Cisco and Arista in networking, NetApp in storage, and Palo Alto Networks in security; |
|
· |
Customer satisfaction – Satmetrix validated a Net Promoter Score of 79 for Pure, best across enterprise tech, and dramatically higher than third party accountings of our competitors; |
|
· |
Repeat purchasing trends (cited above); and |
|
· |
Product gross margins (cited above). |
While others are trying to catch up, Pure is winning.
The cloud voyage ahead.
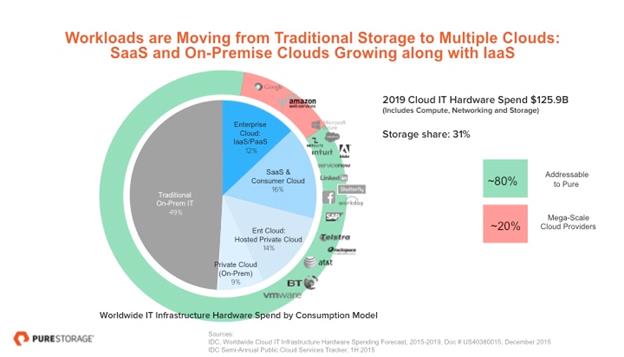
In parallel with leading the transition to all-flash, Pure has been focused since inception on building a storage platform and business model that enables cloud computing. As illustrated in our most recent blog post, the experts at IDC are forecasting that more than half of the data center spend is expected to move to the cloud model by 2019. This represents a massive opportunity for Pure. For years, we have been working closely with cloud customers like LinkedIn, Intuit and Workday to dramatically lower costs and deliver better customer experiences. IDC anticipates that the SaaS (Salesforce, ServiceNow) and Consumer cloud (Facebook, Apple) segments will
be larger than the public cloud. These vendors are building their own clouds in order to differentiate their products and because, at the scale at which they operate, they save money versus the public cloud alternatives. While we do not anticipate selling our current product offerings to public cloud hardcore “do it yourselfers” like AWS and Google, IDC’s analysis suggests 80% of the aggregate storage market is available to Pure in 2019.
To date, over a quarter of our business has been for cloud customers, including SaaS, IaaS, and consumer web properties. Moreover, within the SaaS, IaaS and Consumer cloud segment, the repeat purchase rate is approximately 50 percent higher than that of the rest of our customer base. Here are three recent illustrations of Pure’s cloud success:
|
· |
We added Neustar to our growing list of large storage customers in the fourth quarter. The real-time information services provider has been a long-time public cloud customer, and as their business grew, so did the bill from its cloud provider. In an effort to cut operating costs and gain competitive edge, Neustar decided to create a private cloud with Pure at the center. Ease of use, security and lower costs were all driving factors in implementing Pure. |
|
· |
Also in Q4, Cornerstone OnDemand selected Pure in continued support of its SaaS business. Cornerstone OnDemand is a leading global provider of cloud-based talent management software. It’s a rapidly growing business that’s constantly rolling out new features services to its customer base. Pure helps the company optimize feature delivery, meet customer service level agreements, add capacity and perform system maintenance non-disruptively while managing an increasing global workload and footprint supporting millions of users in 191 countries. |
|
· |
Pure continued to work with Granite Construction to accelerate its business in Q4. Granite is a full-service general contractor, construction management firm and construction materials producer that is consistently recognized as one of the top 25 largest construction companies in the United States. While not a cloud customer themselves, the company opted for Pure Storage instead of a public cloud to help them consolidate a sprawling data center while saving several millions dollars over a six year period. |
We couldn’t be more excited about our future—thanks to Pure’s uniquely simple, efficient and extensible storage platform, our world-class team and our fanatical customer-first approach, we are poised to continue our success.
Words of Thanks
Let me close with sincere gratitude for all those that have joined Pure along our journey. To our customers and partners: We will continue to give you our best—striving to deliver storage that pays for itself by both unleashing innovation in your business and substantially reducing cost of ownership. We know all we need to do is to continue to serve your businesses dramatically better than our competitors and our winning streak will continue.
Let me also thank our long-term investors. We appreciate your confidence in the Pure team, our products and strategy, and your enthusiasm for the opportunity before us, which is to win perhaps the biggest available market in B2B tech. To you, we promise to continue to do the right thing for the long term, maximizing growth while continuing to improve operating efficiency year over year.
To the Puritan Nation: we made tremendous progress in 2015 toward our ultimate goal of becoming the #1 global brand in storage. A heartfelt and sincere thanks to each and every one of you. While we are thrilled with our success to date, remember that this is only the beginning. Carpe diem Team Orange!
For the road ahead in 2016, let me just say that our innovation pipeline is bursting at the seams. Come join us at Pure’s Accelerate Conference to learn more!
Forward Looking Statements
This post contains forward-looking statements regarding industry and technology trends, our product innovation, technology differentiation and customer spending, our positioning, strategy and opportunity, and our products, business and operations, including our future margins, growth prospects and operating model. Forward-looking statements are subject to known and unknown risks and uncertainties and are based on potentially inaccurate assumptions that could cause actual results to differ materially from those expected or implied by the forward-looking statements. Actual results may differ materially from the results predicted, and reported results should not be considered as an indication of future performance. The potential risks and uncertainties that could cause actual results to differ from the results predicted include, among others, those risks and uncertainties included under the caption “Risk Factors” and elsewhere in our filings and reports with the U.S. Securities and Exchange Commission, including, but not limited to, our Quarterly Report on Form 10-Q for the quarter ended October 31, 2015 and the final Prospectus related to our initial public offering of Class A common stock filed pursuant to Rule 424(b) under the Securities Act of 1933 (Registration No. 333-206312), which are available on our investor relations website at investor.purestorage.com and on the SEC website at www.sec.gov. Additional information will also be set forth in our Annual Report on Form 10-K for the fiscal year ended January 31, 2016. All information provided in this post is as of March 2, 2016, and we undertake no duty to update this information unless required by law.
Non-GAAP Financial Measures
This post contains certain non-GAAP financial measures about the company’s performance. For the most directly comparable GAAP financial measures and a reconciliation of these non-GAAP financial measures to GAAP measures, please see our earnings release issued on March 2, 2016, which includes tables captioned “Reconciliations of non-GAAP results of operations to the nearest comparable GAAP measures” and “Reconciliation from net cash provided by (used in) operating activities to free cash flow.”
5KJ&Y9M@&
M6C4#'T.* -VBBB@ HHHH **** "BBB@ HHHH **** "BBB@ HHHH **** "B
MBB@ HHHH **** "BBB@ HHHH **** "BBB@ HHHH **** "BBB@ HHHH **P
MO&6MW7A[PK?:I9P133P)E4ED"K]??'IWKF(/B:7U QFSCDMOLOG*T18NS[0<
M!2,XR<=.,9S0!Z)17$P>,[R^\)Z7JUE%9/=WDJPM:L[
N/>N
MA?0=,DU!;Y[.,W(=7#Y/WE& <=,@<9K)T_P1IUI/+)I5@G?=-:PR. %W,#D@<#O5[3M,T^\A;&F1.ZM@G)51^M8MS'>/
M<*8)E2+'S BMS1['49-)D NE5BQV\<9R.34Q>ISX:
=;21_WE(KBR,$@]N*[FN1U2#[/J$J
M@<,=P_&ID<.-AHI%.E5BK!AU!R*2BI. ZV:--4TEX_X9H\?0_P#ZZ\Q=&BD:
M-QAE)4@^HKT'0+G="]NQY0[E^E
4
M0><<9]::MT_FQ1M#&JN[HV.<8; ]/Y5=BACA39&@5