Exhibit 99.1

R1 RCM Reports Third Quarter 2020 Results
CHICAGO - November 3, 2020 - R1 RCM Inc. (NASDAQ: RCM), a leading provider of technology-enabled revenue cycle management services to healthcare providers, today announced results for the three months ended September 30, 2020.
Third Quarter 2020 Results:
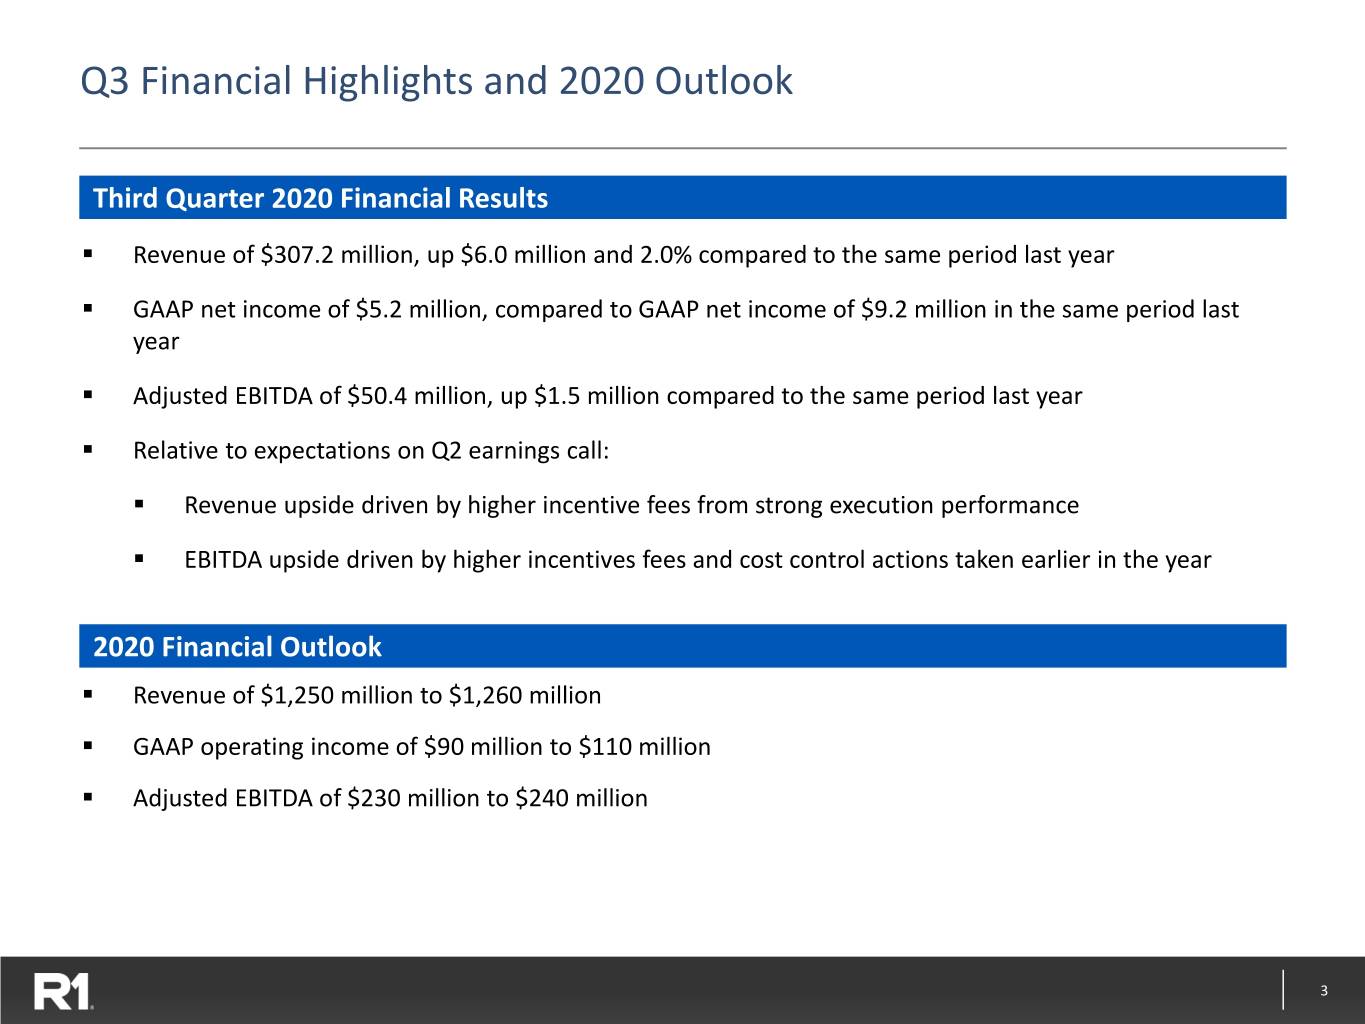
•Revenue of $307.2 million, up $6.0 million and 2.0% compared to the same period last year
•GAAP net income of $5.2 million, compared to net income of $9.2 million in the same period last year
•Adjusted EBITDA of $50.4 million, up $1.5 million compared to the same period last year
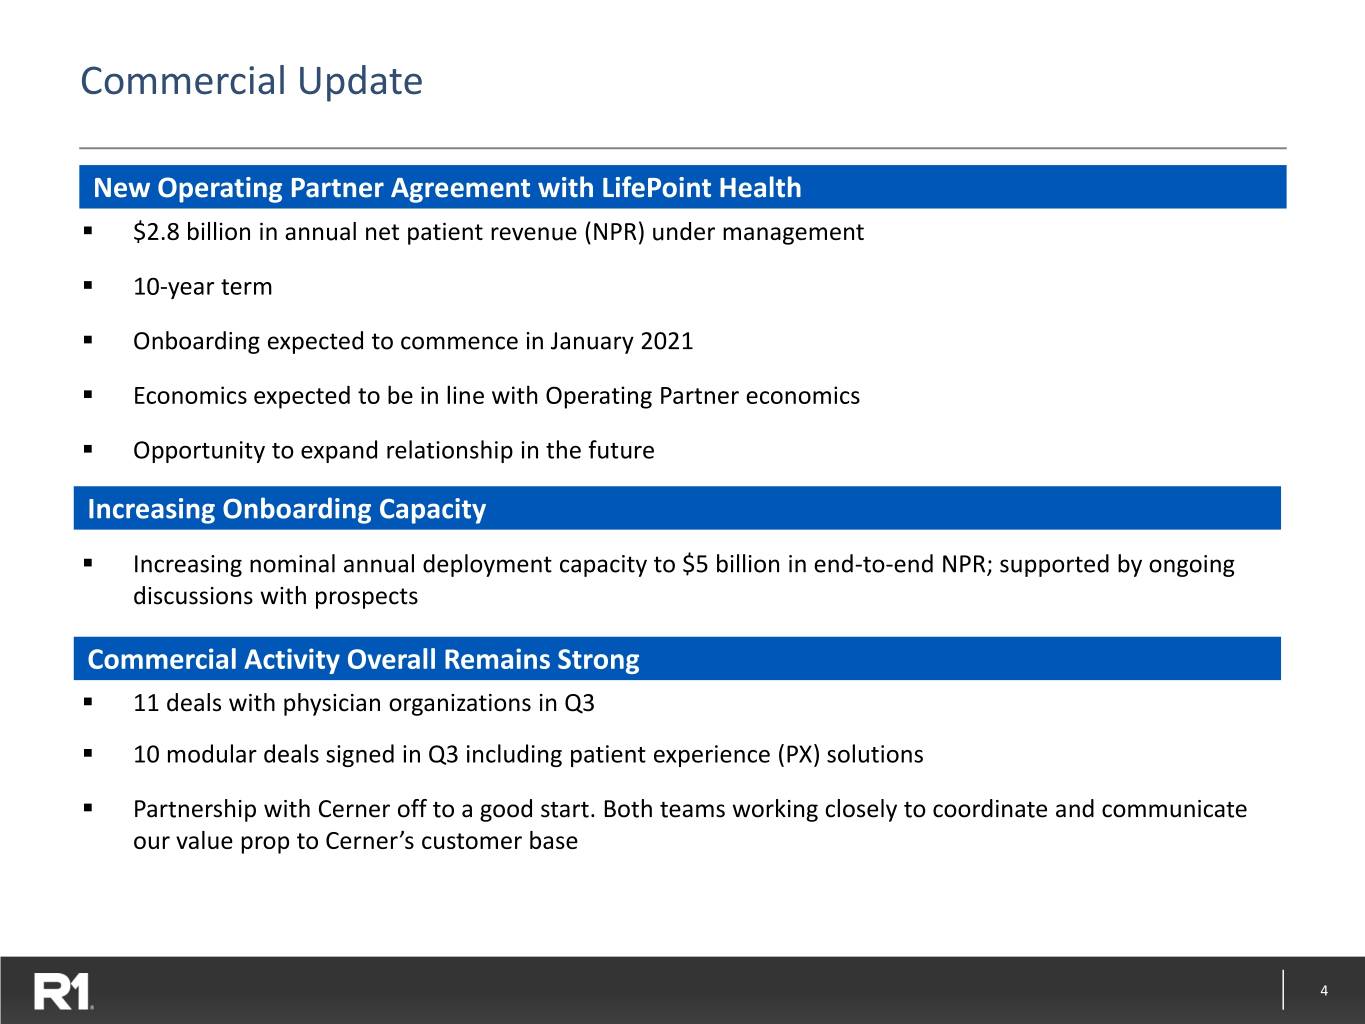
“I am incredibly proud of the team's continued dedication in delivering outstanding performance to our customers during these challenging times. Given our learnings over the past several months, we are very well prepared to help customers navigate challenges presented by the pandemic going forward,” said Joe Flanagan, President and Chief Executive Officer of R1. “We continue to see strong demand for our solutions and are pleased to have signed end-to-end agreements covering $5 billion in annual net patient revenue to date in 2020, well ahead of the $3 billion target we set at the start of the year.”
“Our third quarter results reflect continued strong execution by the team. The quarter was noteworthy as we absorbed the peak of Covid-19 pressure and delivered results ahead of our expectations,” added Rachel Wilson, Chief Financial Officer and Treasurer. “The fundamentals of the business are strong and we look forward to our continued growth, driven by the new business we have signed this year.”
Outlook
For 2020, R1 expects to generate:
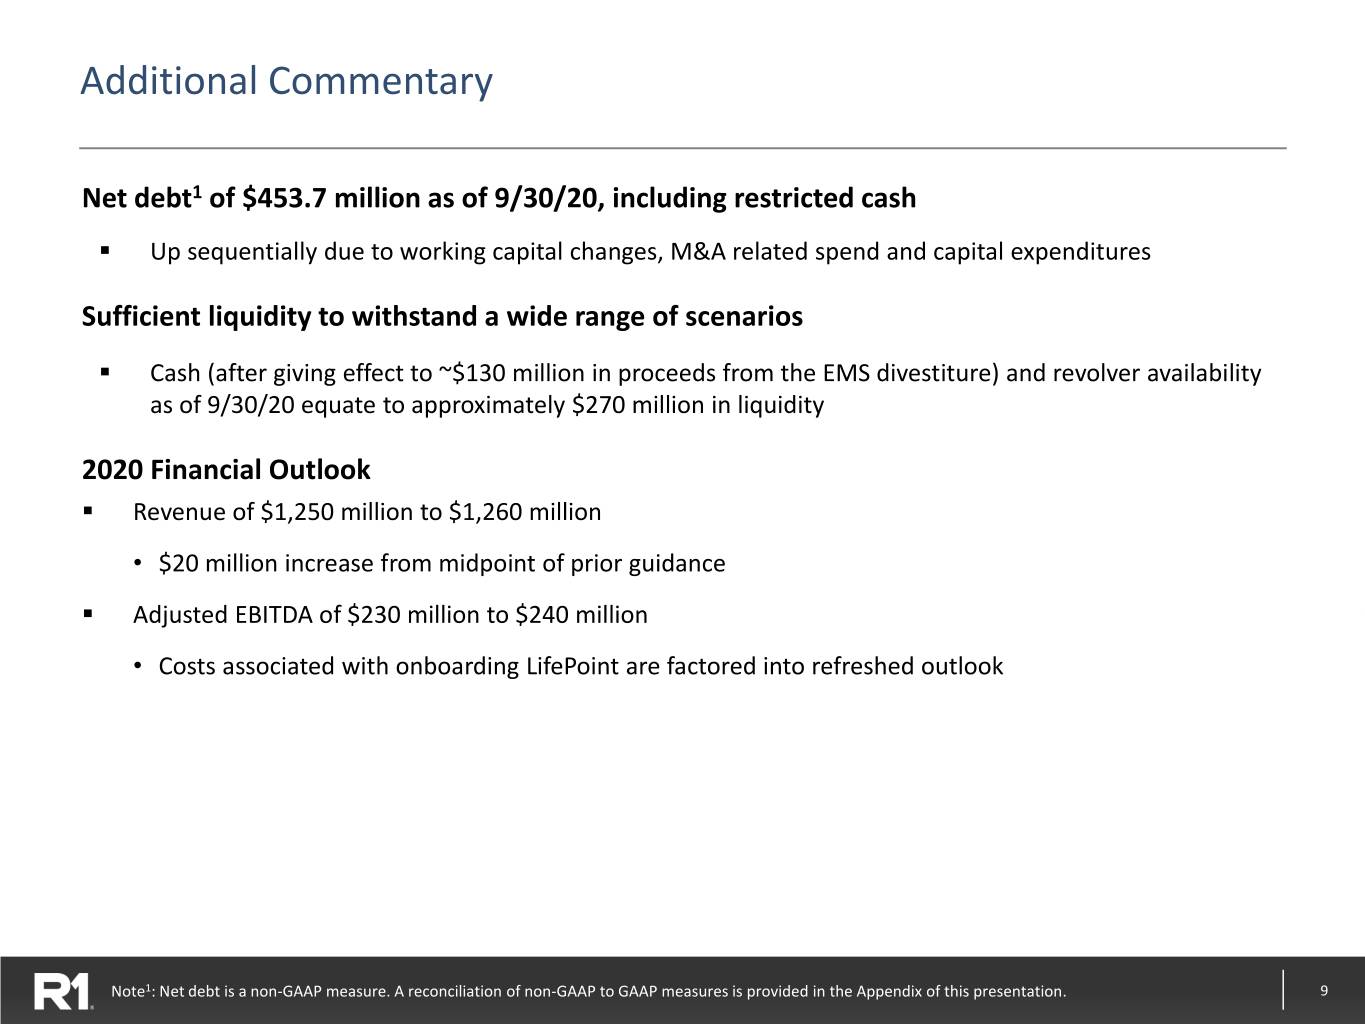
•Revenue of between $1,250 million and $1,260 million
•GAAP operating income of $90 million to $110 million
•Adjusted EBITDA of $230 million to $240 million
Conference Call and Webcast Details
R1’s management team will host a conference call today at 8:00 a.m. Eastern Time to discuss its financial results and business outlook. To participate, please dial 833-968-2190 (778-560-2796 outside the U.S. and Canada) using conference code number 1778649. A live webcast and replay of the call will be available at the Investor Relations section of the Company’s web site at ir.r1rcm.com.
Non-GAAP Financial Measures
In order to provide a more comprehensive understanding of the information used by R1’s management team in financial and operational decision making, the Company supplements its GAAP consolidated financial statements with certain non-GAAP financial performance measures, including adjusted EBITDA and net debt. Adjusted EBITDA is defined as GAAP net income before net interest income/expense, income tax provision/benefit, depreciation and amortization expense, share-based compensation expense, expense arising from debt extinguishment, strategic initiatives costs, transitioned employee restructuring expense, digital transformation office expenses, and certain other items. Net debt is defined as debt less cash and cash equivalents, inclusive of restricted cash.
Our board of directors and management team use adjusted EBITDA as (i) one of the primary methods for planning and forecasting overall expectations and for evaluating actual results against such expectations and (ii) a performance evaluation metric in determining achievement of certain executive incentive compensation programs, as well as for incentive compensation programs for employees.
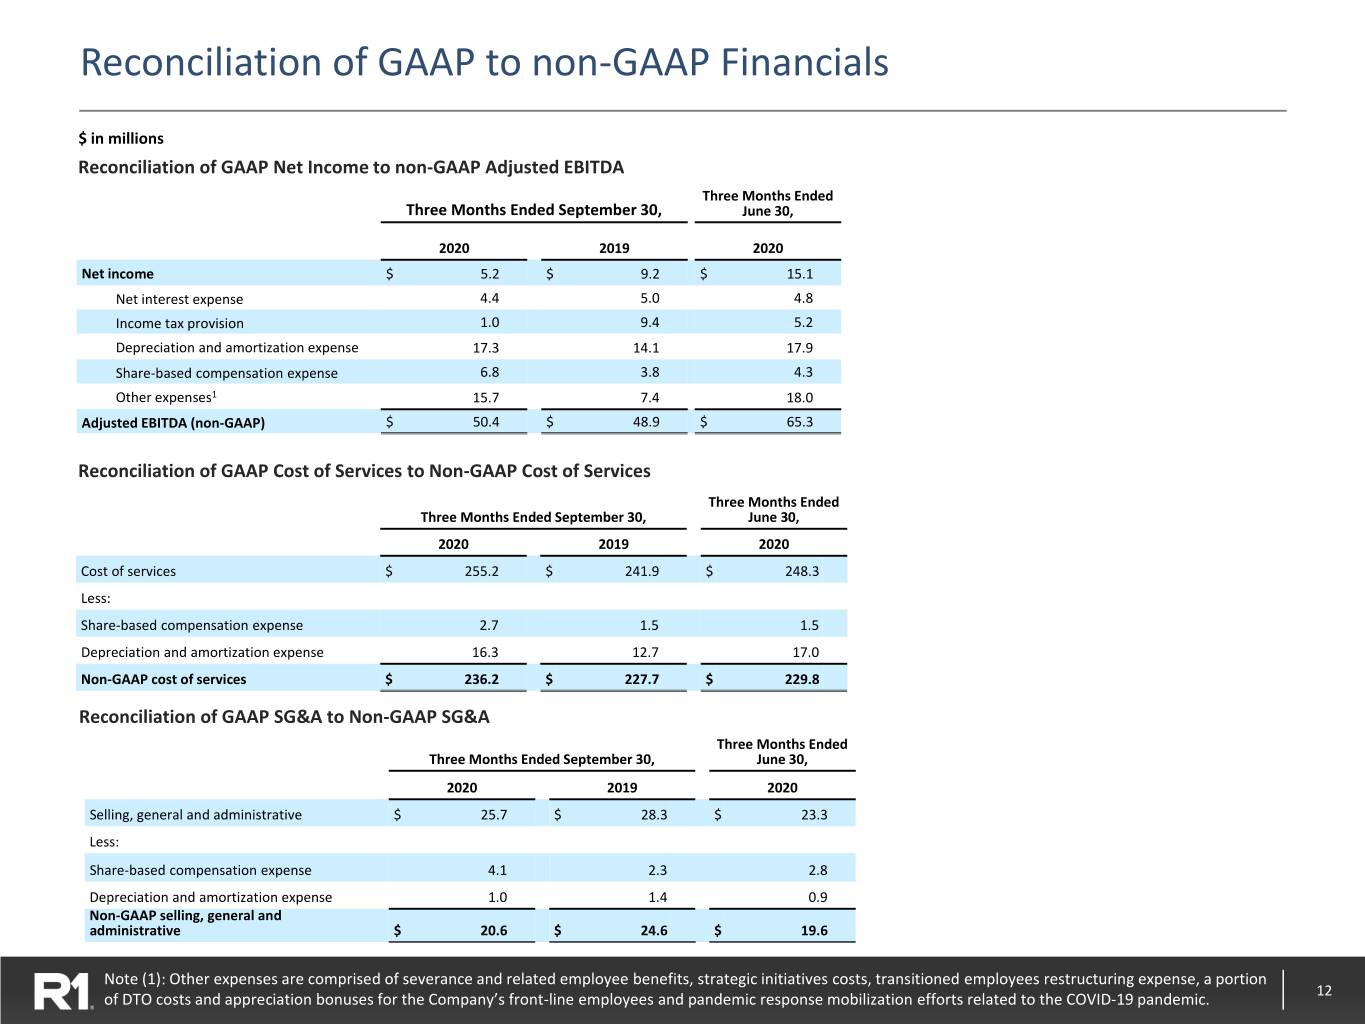
Tables 4 through 9 present a reconciliation of GAAP financial measures to non-GAAP financial measures, including adjusted EBITDA. Adjusted EBITDA should be considered in addition to, but not as a substitute for, the information prepared in accordance with GAAP.
Forward Looking Statements
This press release includes information that may constitute “forward-looking statements,” made pursuant to the safe harbor provisions of the Private Securities Litigation Reform Act of 1995. Forward-looking statements relate to future, not past, events and often address our expected future growth, plans and performance or forecasts. These forward-looking statements are often identified by the use of words such as “anticipate,” “believe,” “designed,” “estimate,” “expect,” “forecast,” “intend,” “may,” “plan,” “predict,” “project,” “target,” “will,” or “would,” and similar expressions or variations, although not all forward-looking statements contain these identifying words. These forward-looking statements include, among other things, statements about the potential impacts of the COVID-19 pandemic, our strategic initiatives, our capital plans, our costs, our ability to successfully deliver on our commitments to our customers, our ability to deploy new business as planned, our ability to successfully implement new technologies, our future financial performance, and our liquidity. Such forward-looking statements are based on management’s current expectations about future events as of the date hereof and involve many risks and uncertainties that could cause our actual results to differ materially from those expressed or implied in our forward-looking statements. Subsequent events and developments, including actual results or changes in our assumptions, may cause our views to change. We do not undertake to update our forward-looking statements except to the extent required by applicable law. Readers are cautioned not to place undue reliance on such forward-looking statements. All forward-looking statements included herein are expressly qualified in their entirety by these cautionary statements. Our actual results and outcomes could differ materially from those included in these forward-looking statements as a result of various factors, including, but not limited to, the severity, magnitude and duration of the COVID-19 pandemic; responses to the pandemic by the government and healthcare providers and the direct and indirect impacts of the pandemic on our customers and personnel; the disruption of national, state and local economies as a result of the pandemic; the impact of the pandemic on our financial results, including possible lost revenue and increased expenses; and the factors discussed under the heading “Risk Factors” in our annual report on Form 10-K for the year ended December 31, 2019 and any other periodic reports that the Company files with the Securities and Exchange Commission.
About R1 RCM
R1 is a leading provider of technology-enabled revenue cycle management services which transform a health system’s revenue cycle performance across settings of care. R1’s proven and scalable operating models seamlessly complement a healthcare organization’s infrastructure, quickly driving sustainable improvements to net patient revenue and cash flows while reducing operating costs and enhancing the patient experience. To learn more, visit: r1rcm.com
Contact:
R1 RCM Inc.
Investor Relations:
Atif Rahim
312-324-5476
investorrelations@r1rcm.com
Media Relations:
Natalie Joslin
678-585-1206
media@r1rcm.com
| Table 1 | ||||||||||||||
| R1 RCM Inc. | ||||||||||||||
| Consolidated Balance Sheets | ||||||||||||||
| (In millions) | ||||||||||||||
| (Unaudited) | ||||||||||||||
| September 30, | December 31, | |||||||||||||
| 2020 | 2019 | |||||||||||||
| Assets | ||||||||||||||
| Current assets: | ||||||||||||||
| Cash and cash equivalents | $ | 106.3 | $ | 92.0 | ||||||||||
| Accounts receivable, net of $3.6 million and $2.8 million allowance | 76.7 | 52.3 | ||||||||||||
| Accounts receivable, net of $0.1 million and $0.0 million allowance - related party | 35.5 | 30.8 | ||||||||||||
| Prepaid expenses and other current assets | 62.4 | 41.6 | ||||||||||||
| Assets held for sale | 101.5 | — | ||||||||||||
| Total current assets | 382.4 | 216.7 | ||||||||||||
| Property, equipment and software, net | 102.8 | 116.9 | ||||||||||||
| Operating lease right-of-use assets | 63.5 | 77.9 | ||||||||||||
| Intangible assets, net | 175.7 | 164.7 | ||||||||||||
| Goodwill | 375.3 | 253.2 | ||||||||||||
| Non-current deferred tax assets | 54.5 | 64.2 | ||||||||||||
| Non-current portion of restricted cash equivalents | 1.0 | 0.5 | ||||||||||||
| Other assets | 49.3 | 35.0 | ||||||||||||
| Total assets | $ | 1,204.5 | $ | 929.1 | ||||||||||
| Liabilities | ||||||||||||||
| Current liabilities: | ||||||||||||||
| Accounts payable | $ | 21.8 | $ | 20.2 | ||||||||||
| Current portion of customer liabilities | 18.8 | 14.0 | ||||||||||||
| Current portion of customer liabilities - related party | 22.6 | 34.1 | ||||||||||||
| Accrued compensation and benefits | 54.5 | 95.1 | ||||||||||||
| Current portion of operating lease liabilities | 12.9 | 12.8 | ||||||||||||
| Current portion of long-term debt | 29.0 | 16.3 | ||||||||||||
| Other accrued expenses | 55.6 | 40.0 | ||||||||||||
| Liabilities held for sale | 25.3 | — | ||||||||||||
| Total current liabilities | 240.5 | 232.5 | ||||||||||||
| Non-current portion of customer liabilities - related party | 17.2 | 18.6 | ||||||||||||
| Non-current portion of operating lease liabilities | 73.6 | 82.7 | ||||||||||||
| Long-term debt | 529.2 | 337.7 | ||||||||||||
| Other non-current liabilities | 35.8 | 10.4 | ||||||||||||
| Total liabilities | 896.3 | 681.9 | ||||||||||||
| Preferred Stock | 245.7 | 229.1 | ||||||||||||
| Stockholders’ equity: | ||||||||||||||
| Common stock | 1.3 | 1.3 | ||||||||||||
| Additional paid-in capital | 384.0 | 372.7 | ||||||||||||
| Accumulated deficit | (240.1) | (277.8) | ||||||||||||
| Accumulated other comprehensive loss | (7.9) | (4.5) | ||||||||||||
| Treasury stock | (74.8) | (73.6) | ||||||||||||
| Total stockholders’ equity | 62.5 | 18.1 | ||||||||||||
| Total liabilities and stockholders’ equity | $ | 1,204.5 | $ | 929.1 | ||||||||||
| Table 2 | ||||||||||||||||||||||||||
| R1 RCM Inc. | ||||||||||||||||||||||||||
| Consolidated Statements of Operations (Unaudited) | ||||||||||||||||||||||||||
| (In millions, except share and per share data) | ||||||||||||||||||||||||||
| Three Months Ended September 30, | Nine Months Ended September 30, | |||||||||||||||||||||||||
| 2020 | 2019 | 2020 | 2019 | |||||||||||||||||||||||
| Net operating fees | $ | 253.7 | $ | 266.6 | $ | 822.4 | $ | 760.8 | ||||||||||||||||||
| Incentive fees | 25.1 | 12.3 | 43.2 | 41.9 | ||||||||||||||||||||||
| Other | 28.4 | 22.3 | 76.8 | 69.4 | ||||||||||||||||||||||
| Net services revenue | 307.2 | 301.2 | 942.4 | 872.1 | ||||||||||||||||||||||
| Operating expenses: | ||||||||||||||||||||||||||
| Cost of services | 255.2 | 241.9 | 757.4 | 725.2 | ||||||||||||||||||||||
| Selling, general and administrative | 25.7 | 28.3 | 74.5 | 76.6 | ||||||||||||||||||||||
| Other expenses | 15.7 | 7.4 | 42.4 | 26.9 | ||||||||||||||||||||||
| Total operating expenses | 296.6 | 277.6 | 874.3 | 828.7 | ||||||||||||||||||||||
| Income from operations | 10.6 | 23.6 | 68.1 | 43.4 | ||||||||||||||||||||||
| Loss on debt extinguishment | — | — | — | 18.8 | ||||||||||||||||||||||
| Net interest expense | 4.4 | 5.0 | 13.0 | 25.1 | ||||||||||||||||||||||
| Income (loss) before income tax provision (benefit) | 6.2 | 18.6 | 55.1 | (0.5) | ||||||||||||||||||||||
| Income tax provision (benefit) | 1.0 | 9.4 | 16.6 | (4.7) | ||||||||||||||||||||||
| Net income | $ | 5.2 | $ | 9.2 | $ | 38.5 | $ | 4.2 | ||||||||||||||||||
| Net income (loss) per common share: | ||||||||||||||||||||||||||
| Basic | $ | — | $ | 0.02 | $ | 0.10 | $ | (0.10) | ||||||||||||||||||
| Diluted | $ | — | $ | 0.01 | $ | 0.08 | $ | (0.10) | ||||||||||||||||||
| Weighted average shares used in calculating net income (loss) per common share: | ||||||||||||||||||||||||||
| Basic | 115,976,377 | 112,230,439 | 115,164,631 | 111,005,255 | ||||||||||||||||||||||
| Diluted | 115,976,377 | 165,622,407 | 171,178,086 | 111,005,255 | ||||||||||||||||||||||
| Basic: | ||||||||||||||||||||||||||
| Net income | $ | 5.2 | $ | 9.2 | $ | 38.5 | $ | 4.2 | ||||||||||||||||||
| Less dividends on preferred shares | (5.6) | (5.3) | (16.6) | (15.4) | ||||||||||||||||||||||
| Less income allocated to preferred shareholders | — | (1.9) | (10.9) | — | ||||||||||||||||||||||
| Net income (loss) available/allocated to common shareholders - basic | $ | (0.4) | $ | 2.0 | $ | 11.0 | $ | (11.2) | ||||||||||||||||||
| Diluted: | ||||||||||||||||||||||||||
| Net income | $ | 5.2 | $ | 9.2 | $ | 38.5 | $ | 4.2 | ||||||||||||||||||
| Less dividends on preferred shares | (5.6) | (5.3) | (16.6) | (15.4) | ||||||||||||||||||||||
| Less income allocated to preferred shareholders | — | (1.5) | (8.7) | — | ||||||||||||||||||||||
| Net income (loss) available/allocated to common shareholders - diluted | $ | (0.4) | $ | 2.4 | $ | 13.2 | $ | (11.2) | ||||||||||||||||||
| Table 3 | ||||||||||||||
| R1 RCM Inc. | ||||||||||||||
| Consolidated Statements of Cash Flows (Unaudited) | ||||||||||||||
| (In millions) | ||||||||||||||
| Nine Months Ended September 30, | ||||||||||||||
| 2020 | 2019 | |||||||||||||
| Operating activities | ||||||||||||||
| Net income | $ | 38.5 | $ | 4.2 | ||||||||||
| Adjustments to reconcile net income to net cash provided by operations: | ||||||||||||||
| Depreciation and amortization | 50.9 | 39.9 | ||||||||||||
| Amortization of debt issuance costs | 0.8 | 1.4 | ||||||||||||
| Share-based compensation | 15.9 | 12.8 | ||||||||||||
| Loss on disposal and right-of-use asset write-downs | 5.1 | — | ||||||||||||
| Loss on debt extinguishment | — | 18.8 | ||||||||||||
| Provision for credit losses | 1.3 | 2.3 | ||||||||||||
| Deferred income taxes | 16.2 | (9.4) | ||||||||||||
| Non-cash lease expense | 8.7 | 8.5 | ||||||||||||
| Change in value of contingent consideration | 1.6 | — | ||||||||||||
| Changes in operating assets and liabilities: | ||||||||||||||
| Accounts receivable and related party accounts receivable | (47.2) | 9.8 | ||||||||||||
| Prepaid expenses and other assets | (11.8) | (20.1) | ||||||||||||
| Accounts payable | 1.9 | 10.5 | ||||||||||||
| Accrued compensation and benefits | (36.1) | (7.3) | ||||||||||||
| Lease liabilities | (7.8) | (8.9) | ||||||||||||
| Other liabilities | 22.5 | 1.0 | ||||||||||||
| Customer liabilities and customer liabilities - related party | (10.0) | (20.2) | ||||||||||||
| Net cash provided by operating activities | 50.5 | 43.3 | ||||||||||||
| Investing activities | ||||||||||||||
| Purchases of property, equipment, and software | (42.3) | (43.1) | ||||||||||||
| Acquisition of SCI, net of cash acquired and earn-out provision | (189.0) | — | ||||||||||||
| Acquisition of RevWorks, net of contingent consideration | (5.0) | — | ||||||||||||
| Net cash used in investing activities | (236.3) | (43.1) | ||||||||||||
| Financing activities | ||||||||||||||
| Issuance of senior secured debt, net of discount and issuance costs | 190.6 | 321.8 | ||||||||||||
| Borrowings on revolver | 50.0 | 60.0 | ||||||||||||
| Repayment of senior secured debt | (17.0) | (272.7) | ||||||||||||
| Repayment of subordinated notes and prepayment penalty | — | (112.2) | ||||||||||||
| Repayments on revolver | (20.0) | (10.0) | ||||||||||||
| Exercise of vested stock options | 11.0 | 9.5 | ||||||||||||
| Shares withheld for taxes | (7.5) | (4.7) | ||||||||||||
| Finance lease payments | (0.8) | (0.6) | ||||||||||||
| Other | (5.0) | — | ||||||||||||
| Net cash provided by (used in) financing activities | 201.3 | (8.9) | ||||||||||||
| Effect of exchange rate changes in cash, cash equivalents and restricted cash | (0.7) | (0.3) | ||||||||||||
| Net increase (decrease) in cash, cash equivalents and restricted cash | 14.8 | (9.0) | ||||||||||||
| Cash, cash equivalents and restricted cash, at beginning of period | 92.5 | 65.1 | ||||||||||||
| Cash, cash equivalents and restricted cash, at end of period | $ | 107.3 | $ | 56.1 | ||||||||||
| Table 4 | ||||||||||||||||||||||||||||||||||||||||||||||||||
| R1 RCM Inc. | ||||||||||||||||||||||||||||||||||||||||||||||||||
| Reconciliation of GAAP Net Income to Non-GAAP Adjusted EBITDA (Unaudited) | ||||||||||||||||||||||||||||||||||||||||||||||||||
| (In millions) | ||||||||||||||||||||||||||||||||||||||||||||||||||
| Three Months Ended September 30, | 2020 vs. 2019 Change | Nine Months Ended September 30, | 2020 vs. 2019 Change | |||||||||||||||||||||||||||||||||||||||||||||||
| 2020 | 2019 | Amount | % | 2020 | 2019 | Amount | % | |||||||||||||||||||||||||||||||||||||||||||
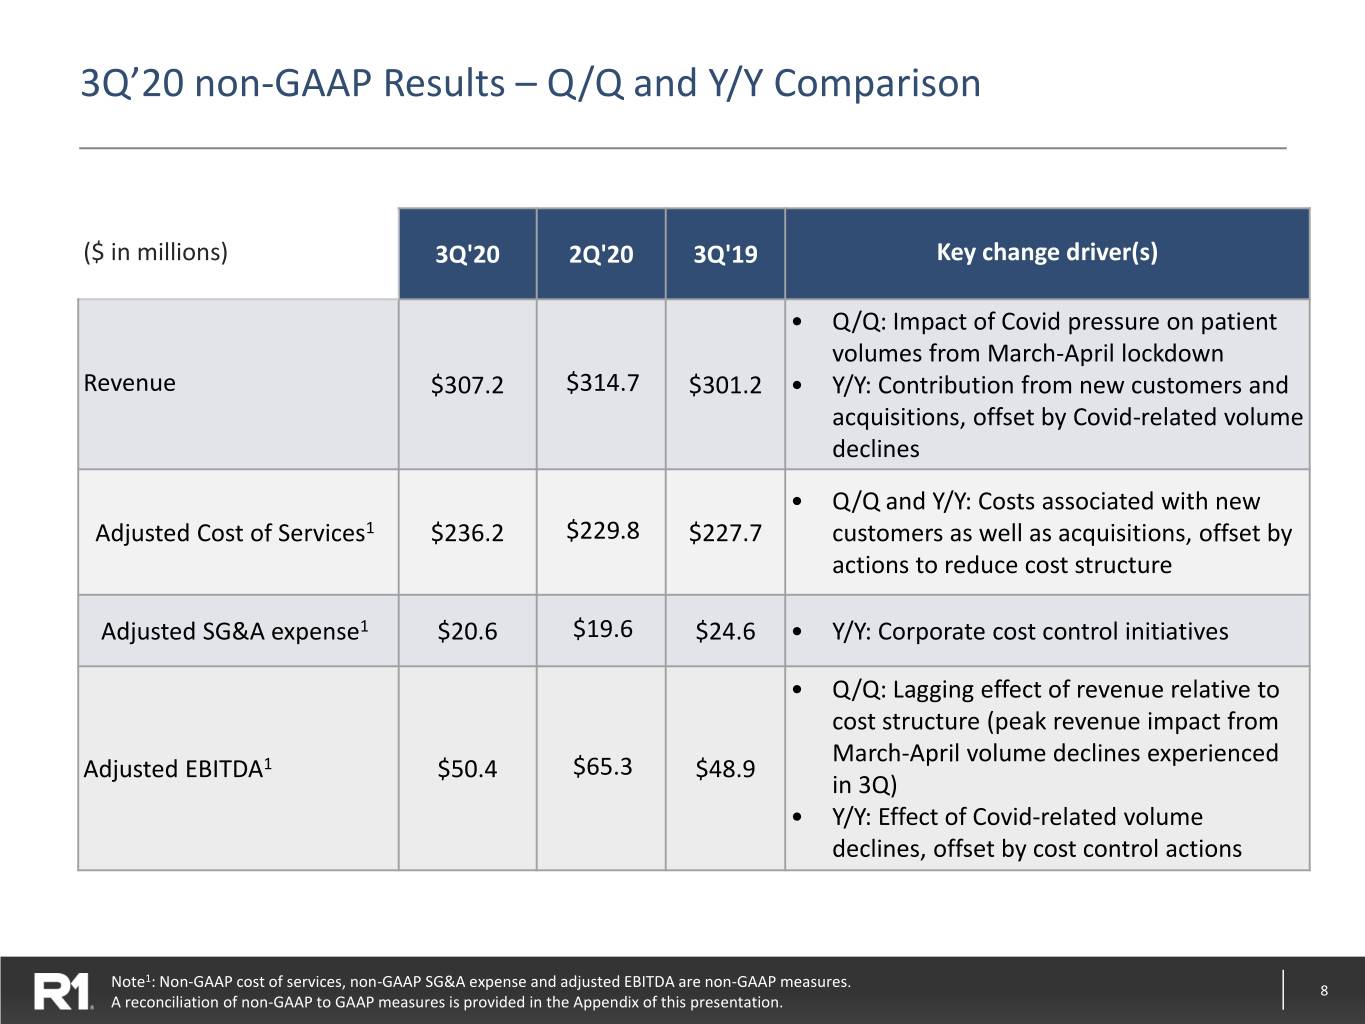
| Net income | $ | 5.2 | $ | 9.2 | $ | (4.0) | (43) | % | $ | 38.5 | $ | 4.2 | $ | 34.3 | 817 | % | ||||||||||||||||||||||||||||||||||
| Net interest expense | 4.4 | 5.0 | (0.6) | (12) | % | 13.0 | 25.1 | (12.1) | (48) | % | ||||||||||||||||||||||||||||||||||||||||
| Income tax provision (benefit) | 1.0 | 9.4 | (8.4) | (89) | % | 16.6 | (4.7) | 21.3 | 453 | % | ||||||||||||||||||||||||||||||||||||||||
| Depreciation and amortization expense | 17.3 | 14.1 | 3.2 | 23 | % | 50.9 | 39.9 | 11.0 | 28 | % | ||||||||||||||||||||||||||||||||||||||||
| Share-based compensation expense | 6.8 | 3.8 | 3.0 | 79 | % | 15.9 | 12.7 | 3.2 | 25 | % | ||||||||||||||||||||||||||||||||||||||||
| Loss on debt extinguishment | — | — | — | — | % | — | 18.8 | (18.8) | (100) | % | ||||||||||||||||||||||||||||||||||||||||
| Other expenses | 15.7 | 7.4 | 8.3 | 112 | % | 42.4 | 26.9 | 15.5 | 58 | % | ||||||||||||||||||||||||||||||||||||||||
| Adjusted EBITDA (non-GAAP) | $ | 50.4 | $ | 48.9 | $ | 1.5 | 3 | % | $ | 177.3 | $ | 122.9 | $ | 54.4 | 44 | % | ||||||||||||||||||||||||||||||||||
| Table 5 | ||||||||||||||||||||||||||
| R1 RCM Inc. | ||||||||||||||||||||||||||
| Reconciliation of GAAP Cost of Services to Non-GAAP Cost of Services (Unaudited) | ||||||||||||||||||||||||||
| (In millions) | ||||||||||||||||||||||||||
| Three Months Ended September 30, | Nine Months Ended September 30, | |||||||||||||||||||||||||
| 2020 | 2019 | 2020 | 2019 | |||||||||||||||||||||||
| Cost of services | $ | 255.2 | $ | 241.9 | $ | 757.4 | $ | 725.2 | ||||||||||||||||||
| Less: | ||||||||||||||||||||||||||
| Share-based compensation expense | 2.7 | 1.5 | 6.1 | 4.3 | ||||||||||||||||||||||
| Depreciation and amortization expense | 16.3 | 12.7 | 47.7 | 37.2 | ||||||||||||||||||||||
| Non-GAAP cost of services | $ | 236.2 | $ | 227.7 | $ | 703.6 | $ | 683.7 | ||||||||||||||||||
| Table 6 | ||||||||||||||||||||||||||
| R1 RCM Inc. | ||||||||||||||||||||||||||
| Reconciliation of GAAP Selling, General and Administrative to Non-GAAP Selling, General and Administrative (Unaudited) | ||||||||||||||||||||||||||
| (In millions) | ||||||||||||||||||||||||||
| Three Months Ended September 30, | Nine Months Ended September 30, | |||||||||||||||||||||||||
| 2020 | 2019 | 2020 | 2019 | |||||||||||||||||||||||
| Selling, general and administrative | $ | 25.7 | $ | 28.3 | $ | 74.5 | $ | 76.6 | ||||||||||||||||||
| Less: | ||||||||||||||||||||||||||
| Share-based compensation expense | 4.1 | 2.3 | 9.8 | 8.4 | ||||||||||||||||||||||
| Depreciation and amortization expense | 1.0 | 1.4 | 3.2 | 2.7 | ||||||||||||||||||||||
| Non-GAAP selling, general and administrative | $ | 20.6 | $ | 24.6 | $ | 61.5 | $ | 65.5 | ||||||||||||||||||
| Table 7 | ||||||||||||||||||||||||||
| R1 RCM Inc. | ||||||||||||||||||||||||||
| Consolidated Non-GAAP Financial Information (Unaudited) | ||||||||||||||||||||||||||
| (In millions) | ||||||||||||||||||||||||||
| Three Months Ended September 30, | Nine Months Ended September 30, | |||||||||||||||||||||||||
| 2020 | 2019 | 2020 | 2019 | |||||||||||||||||||||||
| Net operating fees | $ | 253.7 | $ | 266.6 | $ | 822.4 | $ | 760.8 | ||||||||||||||||||
| Incentive fees | 25.1 | 12.3 | 43.2 | 41.9 | ||||||||||||||||||||||
| Other | 28.4 | 22.3 | 76.8 | 69.4 | ||||||||||||||||||||||
| Net services revenue | 307.2 | 301.2 | 942.4 | 872.1 | ||||||||||||||||||||||
| Operating expenses: | ||||||||||||||||||||||||||
| Cost of services (non-GAAP) | 236.2 | 227.7 | 703.6 | 683.7 | ||||||||||||||||||||||
| Selling, general and administrative (non-GAAP) | 20.6 | 24.6 | 61.5 | 65.5 | ||||||||||||||||||||||
| Sub-total | 256.8 | 252.3 | 765.1 | 749.2 | ||||||||||||||||||||||
| Adjusted EBITDA | $ | 50.4 | $ | 48.9 | $ | 177.3 | $ | 122.9 | ||||||||||||||||||
| Table 8 | |||||
| R1 RCM Inc. | |||||
| Reconciliation of GAAP Operating Income Guidance to Non-GAAP Adjusted EBITDA Guidance (Unaudited) | |||||
| (In millions) | |||||
| 2020 | |||||
| GAAP Operating Income Guidance | $90-110 | ||||
| Plus: | |||||
| Depreciation and amortization expense | $65-75 | ||||
| Share-based compensation expense | $20-25 | ||||
| Strategic initiatives, severance and other costs | $45-50 | ||||
| Adjusted EBITDA Guidance | $230-240 | ||||
| Table 9 | ||||||||||||||
| R1 RCM Inc. | ||||||||||||||
| Reconciliation of Total Debt to Net Debt (Unaudited) | ||||||||||||||
| (In millions) | ||||||||||||||
| September 30, | December 31, | |||||||||||||
| 2020 | 2019 | |||||||||||||
| Senior Revolver | $ | 70.0 | $ | 40.0 | ||||||||||
| Senior Term Loan | 491.0 | 316.9 | ||||||||||||
| 561.0 | 356.9 | |||||||||||||
| Less: | ||||||||||||||
| Cash and cash equivalents | 106.3 | 92.0 | ||||||||||||
| Non-current portion of restricted cash equivalents | 1.0 | 0.5 | ||||||||||||
| Net Debt | $ | 453.7 | $ | 264.4 | ||||||||||
